Exhibit 99-2

Management’s Discussion & Analysis of Financial Results
For the three and nine month periods ended September 30, 2020
Excellon Resources Inc. (the “Company” or “Excellon”) has prepared this Management’s Discussion and Analysis of Financial Results (“MD&A”) for the three and nine months ended September 30, 2020 in accordance with the requirements of National Instrument 51-102 (“NI 51-102”).
This MD&A contains information as at November 13, 2020 and provides information on the operations of the Company for the three and nine month periods ended September 30, 2020 and 2019 and subsequent to the period end, and should be read in conjunction with the unaudited condensed consolidated financial statements for the three and nine month periods ended September 30, 2020 and the audited consolidated financial statements for the year ended December 31, 2019 which have been filed on SEDAR. The audited consolidated financial statements for the year ended December 31, 2019 have been prepared in accordance with International Financial Reporting Standards (“IFRS”).
This MD&A also refers to Production Cost per Tonne, Cash Cost per Silver Ounce Payable, and All-in Sustaining Cost (“AISC”) per Silver Ounce Payable, all of which are Non-IFRS Measures. Please refer to the sections of this MD&A entitled “Production Cost per Tonne”, “Total Cash Cost per Silver Ounce Payable” and “All-in Sustaining Cost per Silver Ounce Payable” for an explanation of these measures and reconciliation to the Company’s reported financial results.
1 | Page |
Management’s Discussion & Analysis of Financial Results
For the three and nine month periods ended September 30, 2020
BUSINESS AND STRATEGIC PRIORITIES
Excellon’s vision is to create wealth by realizing strategic opportunities through discipline and innovation for the benefit of the Company’s employees, communities and shareholders. The Company is advancing a precious metals growth pipeline that includes: Platosa, Mexico’s highest-grade silver mine since production commenced in 2005; Kilgore, a high-quality gold development project in Idaho with strong economics and significant growth and discovery potential; and an option on Silver City, a high-grade epithermal silver district in Saxony, Germany with 750 years of mining history and no modern exploration. The Company also aims to continue capitalizing on current market conditions by acquiring undervalued projects.
The common shares of Excellon (“Common Shares”) trade on the Toronto Stock Exchange and the NYSE American, LLC exchange (the “NYSE American”) under the symbol “EXN” and the Frankfurt Stock Exchange under the symbol “E4X2”.
Listing on the NYSE and Common Share consolidation
In September 2020, the Company completed a consolidation of its Common Shares at a ratio of five pre-consolidation common shares for one post-consolidation common share effective September 10, 2020, and the listing of its common shares on the NYSE American effective September 23, 2020.
As a result of the consolidation, shares issuable pursuant to the Company’s outstanding options, warrants, restricted share units and other convertible securities were proportionally adjusted on the same basis. All common share numbers, numbers of shares issuable under stock options, warrants and restricted share units and related per share amounts in this MD&A have been retrospectively adjusted to reflect the share consolidation.
C$17.91 Million convertible debenture financing
On August 4, 2020, the Company closed a private placement (the “Financing”) of secured convertible debentures (the “Debentures”) for total proceeds of C$17,910,000.
The Debentures have a term of 36-months and are convertible into Common Shares of the Company prior to maturity at a conversion price of C$5.30 per Common Share. The Debentures bear interest at an annual rate of 5.75%, payable in cash semi-annually. Interest on the Debentures may alternatively be paid in Common Shares of the Company at the Company’s option based on the 10-day volume-weighted average price of the Common Shares prior to the payment date and an effective annual rate of 10%. The Debentures are secured against the Company’s assets in Mexico.
On or after July 30, 2022 and prior to maturity, the Company may accelerate the conversion of the entire issuance of Debentures, provided that the 20-day VWAP of the Common Shares on or after such 24-month anniversary is equal to greater than C$12.50.
The purchasers of the Debentures were also issued 1,006,542 Common Share purchase warrants (“Warrants”) with an exercise price of C$5.75 and an expiry date of July 30, 2023. In connection with the Financing, the Company also granted 136,887 Common Share purchase warrants (the “Broker Warrants”), with an exercise price of C$5.75 and an expiry date of July 30, 2023.
2 | Page |
Management’s Discussion & Analysis of Financial Results
For the three and nine month periods ended September 30, 2020
Repayment of $6.0 Million Bridge Loan with Sprott Private Resource Lending II LP (“Sprott Lending”)
On August 4, 2020, the Company repaid the $6.0 million bridge loan from Sprott Lending (the “Sprott Credit Facility”).
Transition to private electricity supplier at Platosa
On October 12, 2020 the Company obtained final regulatory approvals and completed the transition to a private Mexican energy provider for the Platosa Mine. Electricity costs, one of the the Platosa Mine’s largest operating costs, are expected to realize substantial savings going forward.
Updated Mineral Resource Estimate (“MRE”) on the Evolución Project in Zacatecas, Mexico
On July 31, 2020, the Company completed an MRE for the Calvario and Lechuzas Zones on the Evolución Project in Zacatecas, Mexico. The updated MRE incorporates 17,120 metres of additional surface drilling completed in the resource area from June 2018 to December 31,2019. Highlights of the MRE include indicated resource of 6,407,000 tonnes at 170 g/t silver equivalent (“AgEq”) representing 35,091,000 AgEq ounces and inferred resource of 14,960,000 tonnes at 135 g/t AgEq representing 64,813,000 AgEq ounces. Expansion drilling is planned to test the strike extension of the mineralized zones and follow up on parallel structures, where selected samples taken during detailed mapping in early 2020 returned values of up to 2.30 g/t gold, 203 g/t silver and 10.4% lead.
On October 30, 2020 the Company announced the filing of a technical report on the Evolución Project by SRK Consulting (Canada) Inc. (“SRK”) under National Instrument 43-101 (“NI 43-101”), which was filed on SEDAR (www.sedar.com) contemporaneously.
Corporate update
On September 30, 2020, the Company announced the appointment of Paul Keller, P. Eng. as Chief Operating Officer and Alfred Colas, CPA, CA as Chief Financial Officer and the appointment of Anna Ladd-Kruger to the Company’s Board of Directors, as a non-independent director.
Q3 2020 Financial and Operational Highlights (compared to Q3 2019)
| ● | Revenues increased by 56% to $9.7 million during Q3 2020 ($6.2 million in Q3 2019) |
| ● | Gross profit improved to $2.5 million (Q3 2019 – loss of $1.0 million) |
| ● | Production increased 23% to 524,312 silver equivalent (“AgEq”) ozs (Q3 2019 – 427,131 AgEq ozs), while sales increased 31% to 485,841 AgEq ozs (Q3 2019 – 370,376 AgEq ozs) |
| ● | Total cash cost net of by-products per silver ounce payable decreased 31% to $12.60 (Q3 2019 – $18.18) |
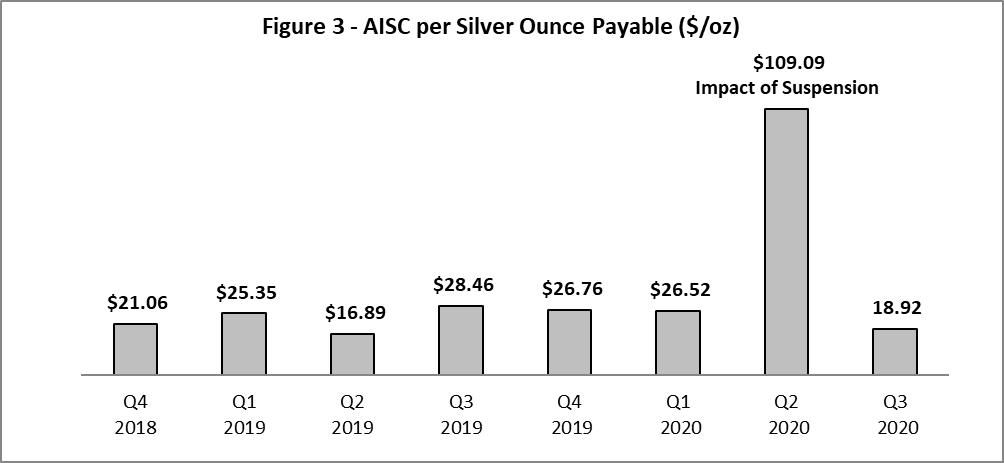
| ● | AISC per silver ounce payable decreased 34% to $18.92 (Q3 2019 – $28.46) |
| ● | Production cost per tonne decreased 33% to $227 per tonne (Q3 2019 – $339 per tonne) |
| ● | Net working capital totaled $10.5 million at September 30, 2020 (December 31, 2019 – $7.6 million) |
| ● | Cash and marketable securities of US$10.1 million as at September 30, 2020, improved liquidity following C$17.91 million convertible debenture issuance and repayment of Sprott Private Resource Lending US$6 million bridge loan |
| ● | Other highlights during the quarter included: |
| o | listed and commenced trading on the NYSE American, LLC exchange |
3 | Page |
Management’s Discussion & Analysis of Financial Results
For the three and nine month periods ended September 30, 2020
| o | released updated Mineral Resource Estimate on the Evolución Project in Zacatecas, Mexico, totaling an indicated resource of 35.1 million AgEq ozs grading 170 g/t AgEq and an inferred resource of 64.8 million AgEq ozs grading 135 g/t AgEq | |
| o | Finalized transition to private electricity supplier at Platosa, with substantial operational cost savings expected going forward |
The results for the nine months ended September 30, 2020 were significantly affected by the suspension of operations in Mexico from April 2, 2020 to June 1, 2020 in response to the outbreak of COVID-19 (the “Suspension”). Metal production and revenues during Q2 2020 were negligible while ongoing labour costs and the costs of care and maintenance were significant. Concentrate deliveries from the mill resumed in early July.
| Q3 | Nine months ended September 30, | |||||||||||||||
| (in thousands of U.S dollars except amounts per share, and unit costs) | 2020 | 2019 | 2020 | 2019 | ||||||||||||
| Revenues | $ | 9,667 | 6,203 | $ | 17,173 | 20,055 | ||||||||||
| Gross profit (loss) | $ | 2,523 | (987 | ) | $ | (25 | ) | (862 | ) | |||||||
| Net Loss | $ | (240 | ) | (2,902 | ) | $ | (10,010 | ) | (8,894 | ) | ||||||
| Loss per share – basic and diluted | $ | (0.01 | ) | (0.14 | ) | $ | (0.36 | ) | (0.44 | ) | ||||||
| Silver ounces produced | 326,909 | 257,497 | 642,109 | 794,746 | ||||||||||||
| Silver ounces payable | 310,295 | 227,350 | 605,101 | 730,322 | ||||||||||||
| Silver-equivalent ounces produced (1) | 524,312 | 427,131 | 1,082,978 | 1,532,330 | ||||||||||||
| Silver-equivalent ounces payable (1) (2) | 485,841 | 370,376 | 1,001,710 | 1,414,106 | ||||||||||||
| Production cost per tonne (3) | $ | 227 | 339 | $ | 324 | 304 | ||||||||||
| Total cash cost per silver ounce payable | $ | 12.60 | 18.18 | $ | 16.80 | 12.58 | ||||||||||
| AISC per silver ounce payable | $ | 18.92 | 28.46 | $ | 29.28 | 22.51 | ||||||||||
| Average realized silver price per ounce sold (4) | $ | 24.82 | 17.65 | $ | 20.18 | 15.78 | ||||||||||
| (1) | AgEq ounces established using average realized metal prices during the period indicated, applied to the recovered metal content of the concentrates to reflect the revenue contribution of base metal sales during the period. | |
| (2) | Payable metal reflects current metals delivered, net of payable deductions under the Company’s offtake arrangements. | |
| (3) | Production cost per tonne includes mining and milling costs, excluding depletion and amortization and inventory adjustments. | |
| (4) | Average realized silver price is calculated on current period sale deliveries and does not include prior period provisional adjustments in the period. |
4 | Page |
Management’s Discussion & Analysis of Financial Results
For the three and nine month periods ended September 30, 2020
COVID-19 Risk – Public Health Crisis due to Epidemic and Pandemic Diseases
The Company’s business could be adversely affected by the implications of a widespread global outbreak of contagious disease, including COVID-19. As at the date hereof, global reactions to the spread of COVID-19 have led to, among other things, significant restrictions on travel and gatherings of individuals, quarantines, temporary business closures and a general reduction in consumer activity. While these effects are expected to be temporary, the duration of the disruptions to business internationally and the related financial impact cannot be estimated with any degree of certainty at this time. In addition, the increasing number of individuals infected with COVID-19 has resulted in a widespread global health crisis that could adversely affect global economies and financial markets, resulting in a protracted economic downturn that could have an adverse effects on the Company’s future prospects.
In particular, the continued spread of COVID-19 globally could materially and adversely impact the Company’s business, including without limitation, employee health, workforce availability and productivity, limitations on travel, supply chain disruptions, increased insurance premiums, the availability of industry experts and personnel, restrictions to the Company’s mining and processing operations, restriction on its exploration and drilling programs and the slowdown or temporary suspension of operations at some or all of the Company’s properties. Any such disruptions or closures could have a material adverse effect on the Company’s business. In addition, parties with whom the Company does business or upon whom the Company is reliant may also be adversely impacted by the COVID-19 crisis, which may in turn cause further disruption to the Company’s business. Any long-term closures or suspensions may also result in a loss of personnel or the workforce in general, as employees seek employment elsewhere. The impact of COVID-19 and government responses thereto may also continue to have a material impact on financial results and could constrain the Company’s ability to obtain equity or debt financing in the future, which may have a material and adverse effect on its business, financial condition and results of operations.
The COVID-19 pandemic has already had a direct impact on the Company’s operations and business as a result of the Suspension. Although the Company has resumed operations, the extent to which the pandemic may impact the Company’s operations in the future is highly uncertain and cannot be predicted with confidence. These uncertainties include, but are not limited to, the duration of the outbreak and the impact of COVID-19 on the Company’s work force, including potential absenteeism and future government response measures to control COVID-19 such as safety protocols or suspensions of operations. These uncertainties and others could have further material adverse effects on the Company’s revenues, financial condition or its ability to meet production guidance.
Mexican Operations
The operation continued to realize improvements from organizational changes implemented at the site prior to the pandemic-driven suspension in Q2 2020. Improvements were realized in lower consumable costs, lower workforce costs, and improved mine efficiency evidenced by higher mine extraction by month and increased equipment reliability. Ongoing focus on business improvements and lower electricity prices from the newly activated power contract at Platosa are expected to continue improving the operation’s economics.
During Q1 2020, the Company completed processing a 25,000 tonne bulk sample on ore from the San Sebastián mine in Durango, owned by Hecla Mining Company (“Hecla”). As reported by Hecla, mining at San Sebastian was completed in the third quarter, and milling is expected to be completed in the fourth quarter of 2020, with exploration and evaluation activities ongoing. The Company continues communications with Hecla in respect of any future restart of underground sulphide mining at San Sebastián.
5 | Page |
Management’s Discussion & Analysis of Financial Results
For the three and nine month periods ended September 30, 2020
Exploration Plans
Exploration plans were delayed due to COVID-19, but 2020 exploration activities resumed in Q3 with an undergound drill rig focused on definition and expansion of existing resources, complemented by surface rigs testing for continued expansion of the known mantos to the south of 623 and regional targets at PDN. An additional rig was deployed at the end of Q3 2020 for drilling at Jaboncillo.
At the Kilgore Project in Idaho, the Company aims to improve understanding of the deposit setting on a local and regional scale through: re-logging core to enhance the underlying structural and lithologic framework, improving characterization of host rocks through lithogeochemistry, and sampling and assaying of silver mineralization to potentially improve project economics. The Company also plans further regional exploration, prospecting and geophysics to generate new targets and is building a dedicated team to advance this project.
Exploration also continues at the Oakley project under the option agreement between Excellon and Centerra Gold Inc. (“Centerra”). During Q3 2020, the Company advanced work to support future drilling, including soil geochemistry, IP and surveys, an airborne regional magnetic survey (LIDAR) and mapping.
Drilling at Silver City in Saxony, Germany began early in Q3 2020 and is ongoing. The current drill program aims to test the anomalies that were identified during soil sampling and prospecting, particularly to follow up on the high grade zones that had been exploited in the region since 1200s, given the complete absence of any modern exploration, such that prospective targets are open in all directions. In addition, following the signing of a research and development agreement with the Helmholtz Institute Freiberg (“HIF”), the institute staff have been performing drill core mapping using hyperspectral analysis, which aims to improve the understanding of the local mineralization and alteration.
6 | Page |
Management’s Discussion & Analysis of Financial Results
For the three and nine month periods ended September 30, 2020
Production
Platosa Mine production statistics for the periods indicated are as follows:
| Q3 | Q3 | Nine months ended September 30, | ||||||||||||||
| 2020(1) | 2019(1) | 2020(1) | 2019(1) | |||||||||||||
| Tonnes Mined from Platosa: | 21,877 | 18,167 | 45,046 | 56,967 | ||||||||||||
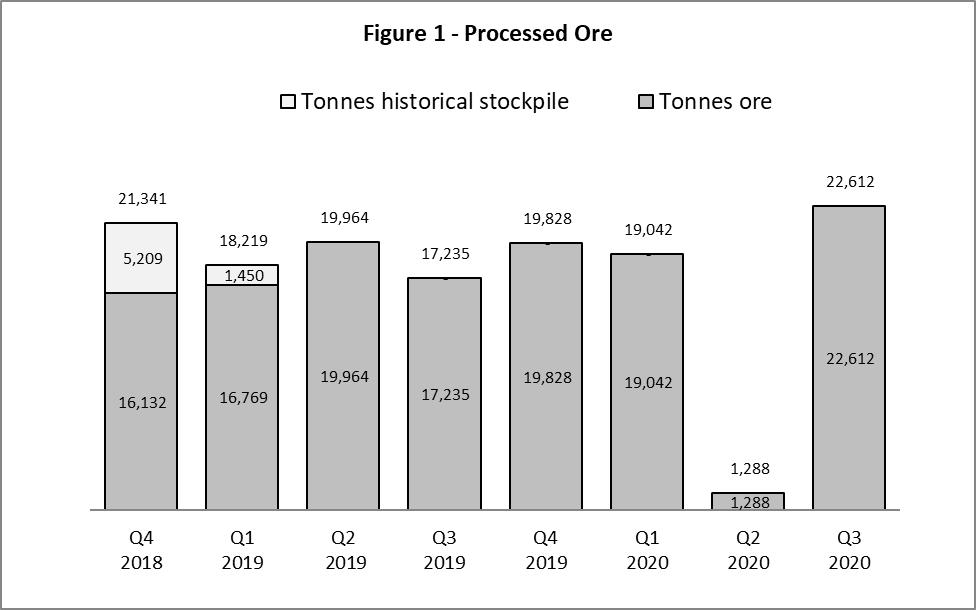
| Ore processed (t): | 22,612 | 17,235 | 42,941 | 53,968 | ||||||||||||
| Historical stockpile processed (t): | - | - | - | 1,450 | ||||||||||||
| Platosa ore processed (t): | 22,612 | 17,235 | 42,941 | 55,418 | ||||||||||||
| Ore grades: | ||||||||||||||||
| Silver (g/t) | 483 | 512 | 510 | 520 | ||||||||||||
| Lead (%) | 5.26 | 4.44 | 5.34 | 4.81 | ||||||||||||
| Zinc (%) | 6.81 | 5.97 | 6.80 | 7.13 | ||||||||||||
| Historical stockpile grades: | ||||||||||||||||
| Silver (g/t) | - | - | - | 123 | ||||||||||||
| Lead (%) | - | - | - | 1.22 | ||||||||||||
| Zinc (%) | - | - | - | 1.44 | ||||||||||||
| Blended head grade: | ||||||||||||||||
| Silver (g/t) | 483 | 512 | 510 | 509 | ||||||||||||
| Lead (%) | 5.26 | 4.44 | 5.34 | 4.72 | ||||||||||||
| Zinc (%) | 6.81 | 5.97 | 6.80 | 6.98 | ||||||||||||
| Recoveries: | ||||||||||||||||
| Silver (%) | 93.0 | 87.2 | 91.4 | 89.2 | ||||||||||||
| Lead (%) | 85.0 | 77.7 | 84.0 | 78.9 | ||||||||||||
| Zinc (%) | 80.9 | 76.5 | 78.3 | 78.1 | ||||||||||||
| Metal Production: | ||||||||||||||||
| Silver – (oz) | 326,909 | 257,497 | 642,109 | 794,746 | ||||||||||||
| Lead – (lb) | 2,227,511 | 1,304,538 | 4,247,172 | 4,444,278 | ||||||||||||
| Zinc – (lb) | 2,746,328 | 1,654,175 | 5,036,098 | 6,363,203 | ||||||||||||
| Silver equivalent (oz) (2) | 524,312 | 427,131 | 1,082,978 | 1,532,330 | ||||||||||||
| Payable: (3) | ||||||||||||||||
| Silver – (oz) | 310,295 | 227,350 | 605,101 | 730,322 | ||||||||||||
| Lead – (lb) | 2,183,574 | 1,182,211 | 4,038,174 | 4,203,295 | ||||||||||||
| Zinc – (lb) | 2,287,459 | 1,322,133 | 4,353,738 | 5,796,157 | ||||||||||||
| Silver equivalent (oz) (2) | 485,841 | 370,376 | 1,001,710 | 1,414,106 | ||||||||||||
| Average realized prices: (4) | ||||||||||||||||
| Silver – ($US/oz) | $ | 24.82 | $ | 17.65 | $ | 20.18 | $ | 15.78 | ||||||||
| Lead – ($US/lb) | $ | 0.84 | $ | 0.94 | $ | 0.80 | $ | 0.88 | ||||||||
| Zinc – ($US/lb) | $ | 1.10 | $ | 1.07 | $ | 0.99 | $ | 1.15 | ||||||||
| Toll milling (3rd party) ore processed (t) | - | - | 4,785 | - | ||||||||||||
7 | Page |
Management’s Discussion & Analysis of Financial Results
For the three and nine month periods ended September 30, 2020
| (1) | Period deliveries remain subject to assay and price adjustments on final settlement with concentrate purchaser(s). Data has been adjusted to reflect final assay and price adjustments for prior period deliveries settled during the period. Tonnes Mined and Ore processed are in DMT. |
| (2) | AgEq ounces established using average realized metal prices during the period indicated applied to the recovered metal content of the concentrates to reflect the revenue contribution of base metal sales during the period. |
| (3) | Payable metal is based on the metals delivered and sold during the period, net of payable deductions under the Company’s offtake arrangements, and will therefore differ to produced ounces. |
| (4) | Average realized price is calculated on current period sale deliveries and does not include the impact of prior period provisional adjustments in the period. |
Operations Commentary
Impact of COVID-19 Measures on the Company’s Operations
During the Suspension, the Company suspended mining activities at its Platosa Mine and processing at its Miguel Auza Mill, while maintaining critical pumping and routine maintenance of critical infrastructure.
The Company leveraged knowledge and expertise from colleagues at the Mining Association of Canada and Mining Safety Round Table to respond to COVID-19 – these interactions proved invaluable in helping craft responses, ensuring the implementation of evolving international best practice.
The Company began ramp up of operations in mid-June, following the implementation of new safety protocols including:
| ● | Routine health checks of all persons entering business units; | |
| ● | Procuring the necessary personal protective equipment and other materials necessary for effective COVID-19 response; | |
| ● | Physical distancing within the workplace; | |
| ● | Prohibiting entry of non-essential visitors and contractors; and | |
| ● | Limiting entry of suppliers to those delivering critical operational materials. |
The Company continues to closely monitor the workforce and employees with risk factors for severe COVID-19 illness are removed from the workplace. COVID-19 management does not have a significant impact on operations at the current time.
The Platosa mine is accessed via ramp (as opposed to a shaft) allowing for the Company’s employees to more easily maintain safe distancing during operations. The rationalization of the work force at Platosa also facilitates the ability to implement social distancing.
As anticipated, production levels from Platosa recovered fully in Q3 2020, achieving record mine outputs while maintaining safe and cost-effective practices.
During this period, the Company realized savings related to the measures implemented during Q2 2020 including:
| ● | reducing the workforce by approximately 35% (20% reduction in labour costs) – labour accounts for approximately 30% of operational expenditures; |
8 | Page |
Management’s Discussion & Analysis of Financial Results
For the three and nine month periods ended September 30, 2020
| ● | improving the terms of treatment charges for zinc, due to improvements in the global market for zinc concentrates; | |
| ● | modifying mining methods to increase efficiency and safety, while reducing costs, among other operational improvements; | |
| ● | modifying shift schedules to improve workforce utilization. |
In addition, in early Q4 2020, the Company finalized the transition to a private electricity supplier, which is expected to realize substantial savings going forward. This cost savings initiative will begin to be realized in Q4 2020.
The previous eight quarters of production at Platosa are summarized below:
9 | Page |
Management’s Discussion & Analysis of Financial Results
For the three and nine month periods ended September 30, 2020

Analysis of the components of mine operating results is as follows:
| Q3 | Nine months ended September 30, | |||||||||||||||
| 2020 | 2019 | 2020 | 2019 | |||||||||||||
| Ore processed | 22,612 | 17,235 | 42,941 | 53,968 | ||||||||||||
Production in Q3 2020 was 22,612 tonnes, a 31% improvement over the same quarter in 2019 as a result of reduced downtime for the mill and more efficient and consistent mine production. The nine-month period was affected by the Suspension.
| Head grade | Ag (g/t) | 483 | 512 | 510 | 509 | |||||||||||||
| Pb (%) | 5.26 | 4.44 | 5.34 | 4.72 | ||||||||||||||
| Zn (%) | 6.81 | 5.97 | 6.80 | 6.98 |
Silver grades in Q3 2020 were 6% below Q3 2019 as a result of stope sequencing and variations in the ore body, which also drove higher lead and zinc grades in Q3, by 18% and 14%, respectively, above the prior-year quarter.
| Recoveries | Ag (%) | 93.0 | 87.2 | 91.4 | 89.2 | |||||||||||||
| Pb (%) | 85.0 | 77.7 | 84.0 | 78.9 | ||||||||||||||
| Zn (%) | 80.9 | 76.5 | 78.3 | 78.1 |
Significant improvements in metal recoveries in Q3 2020 and in the nine months, compared to the prior year mainly reflect modifications and improvements made to the mill flotation circuits early in 2020. Higher metal recoveries in 2020 also reflect better management of the thickening process and reagent use.
| Metal Production | Ag (oz) | 326,909 | 257,497 | 642,109 | 794,746 | |||||||||||||
| Pb (lb) | 2,227,511 | 1,304,538 | 4,247,172 | 4,444,278 | ||||||||||||||
| Zn (lb) | 2,746,328 | 1,654,175 | 5,036,098 | 6,363,203 | ||||||||||||||
| AgEq (oz) | 524,312 | 427,131 | 1,082,978 | 1,532,330 |
AgEq production for Q3 2020 increased by 23% over the prior-year quarter driven by record mined tonnes from Platosa and significant improvements in metal recoveries. Lower AgEq production in the nine months ended September 30, 2020 reflects the impact of the Suspension.
EXPLORATION AND EVALUATION REVIEW
Platosa Property
In H1 2020, the Company conducted limited exploration on the Platosa project. Planning continued for future field work and drilling, particularly at Jaboncillo and PDN. At Jaboncillo, the Company is following up on drilling completed in 2019 that intersected multiple gossanous horizons with pyritic breccias, arsenopyrite and relict base-metal sulphides. Petrographic studies conducted in Q2 2020 confirmed the presence of base-metal sulphide species including sphalerite and galena in samples. These observations confirm the presence of the target system and that the system is productive for base metal sulphides on multiple structures over an approximate strike length of one kilometre. In Q3 drilling resumed in this area targeting an economically significant component to the system.
Follow up drilling is also planned for PDN where intense dolomitization and sanding along structures was intersected in preliminary drill holes, indicating the movement of hydrothermal fluids which are believed to be the expression of a potential skarn system at depth. This potential for a skarn body at PDN has been defined through IP, magnetics and gravity surveys.
10 | Page |
Management’s Discussion & Analysis of Financial Results
For the three and nine month periods ended September 30, 2020
During early Q1 2020, the Company commenced an underground drill program focused on further defining and expanding the Pierna, Rodilla and NE-1 mantos. The program was paused during the Suspension and recommenced in Q3 2020.
Highlights on the Platosa Project for Q3 2020 include:
| ● | Recommenced underground drilling to define and delineate additional ounces near mine; | |
| ● | Mobilized surface diamond drill rigs to commence drilling near Platosa and PDN; and | |
| ● | Completed planning to restart drilling at Jaboncillo in Q4. |
Evolución Project
The Company commenced a proof-of-concept drilling program on Evolución during Q2 2018, targeting four priority targets believed to be indicative of the distal part of a larger epithermal system. The Company increased the drilling program to 6,000 metres based on initial success on the Lechuzas structure. Drilling in Q4 2018 and into Q1 2019 tested strike and dip extensions of the mineralization encountered at Lechuzas with the purpose of tracking higher grades and more robust widths. During Q1 2019, the Company announced results from the Lechuzas structure, which defined a mineralized envelope of 600 metres along strike and 500 metres down dip. This envelope was extended by a further 250 metres along strike through 2019 and into Q1 2020 and remains open in multiple directions. As part of this drilling program, re-assaying of samples from the Calvario vein and re-modelling of the region were undertaken. The Company has incorporated this work into an updated mineral resource estimate and associated technical report.
In Q3 2019, the Company completed the initial drill program on the Laika target with two holes completed for a total of 1,000 metres. A sequence of overburden was intersected in these holes before transitioning into a rhyolite sequence with zones of intense alteration and leaching. The target of this program, the origin of chalcedonic and opaline pyrite bearing quartz in the overburden, was not intersected.
Subsequent to the Laika program, two drill holes were completed at Loma de las Minas for a total of 622 metres, intersecting highly anomalous mineralization near surface in silicified sediments, and one drill hole at Negrillas for a total of 502 metres targeting a large structural intersection.
Exploration activities were limited through Q3 due to COVID-19, however field work was conducted including detailed mapping and prospecting on numerous regional targets throughout the Evolución concession.
Completion of an updated Mineral Mineral Resource Estimate (“MRE”) for the Evolución Project
2020 Evolución MRE highlights:
| ● | Updated MRE incorporates 17,120 metres of additional surface drilling completed in the resource area from June 2018 to December 31, 2019; |
11 | Page |
Management’s Discussion & Analysis of Financial Results
For the three and nine month periods ended September 30, 2020
| ● | Indicated resource of 6,407,000 tonnes at 170 g/t silver equivalent (“AgEq”) representing 35,091,000 AgEq ounces; | |
| ● | Inferred resource of 14,960,000 tonnes at 135 g/t AgEq representing 64,813,000 AgEq ounces; and | |
| ● | Expansion drilling being planned to test the strike extension of the mineralized zones and follow up on parallel structures, where grab samples taken during detailed mapping in 2020 returned values of up to 2.30 g/t gold, 203 g/t silver and 10.4% lead. |
Approximately 12% of the tonnage within the MRE (26% of the indicated tonnage and 6% of the inferred tonnage) is located within the La Antigua concession (part of the Evolución Project), which is the subject of litigation between a subsidiary of Excellon and a plaintiff. The initial decision in respect of this litigation does not affect Excellon’s contractual rights to this concession.
The MRE was prepared in accordance with the Canadian Institute of Mining, Metallurgy and Petroleum’s (CIM) “Mineral Resources and Mineral Reserves Best Practices” guidelines (November 2019) and is classified per the CIM “Definition Standards for Mineral Resources and Mineral Reserves” (May 2014).
Highlights included:
| ● | Preparation of resource statement and associated technical report for Evolución resource; | |
| ● | Mapping, prospecting and sampling of regional targets on Evolución permit including grab sampling of parallel structure to Lechuzas which returned 2.3gpt Au. 203 gpt Ag and 10.4% Pb; and | |
| ● | Compilation of regional stratigraphy and mapping to facilitate targeting for future work. |
Silver City Project
In Q3 2019, the Company entered into an agreement (the “Globex Agreement”) with Globex Mining Enterprises Inc. (“Globex”) for an option to acquire a 100% interest in the Bräunsdorf exploration license for the Silver City Project. The Silver City Project (Bräunsdorf exploration license) is a 164 km2 silver district in Saxony, Germany and encompasses a 36-km long epithermal vein system situated west of the city of Freiberg (30 km southwest of Dresden). The immediate exploration license and surrounding area have a long and rich history of silver mining dating back to the 12th century with numerous historic mine camps, small mines and prospects, many of which have only been explored and/or mined to shallow depths, seldom exceeding 200 metres below surface. Historically reported veins ranged from 0.5 to 10 metres width, with grades of over 3,500 g/t silver and no assaying for either gold or zinc, which were not historically available.
From late 2019 into early 2020 the project continued to advance, with an induced polarization (“IP”) survey completed over two targets on the northern part of the license. Three lines were completed over the Munzig target, an area of historical high-grade production, with records indicating veins from 2 to 10 metres wide grading up to 1,000 g/t Ag. Two lines were completed over the Steinberg target, which followed up on surface sampling that contained anomalous silver, arsenic and lead. High-resistivity and chargeability anomalies were detected at both targets and defined within prospective settings that were included for testing as part of initial drilling which commenced in Q3 2020.
12 | Page |
Management’s Discussion & Analysis of Financial Results
For the three and nine month periods ended September 30, 2020
Fluid inclusion studies completed in 2019 by the University of Freiberg on samples from historical mine workings covered a strike length of approximately 15 km of the main vein system. These studies confirmed systematic vertical mineral zonation within the larger epithermal system and an expected vertical extent of the productive zones between 300-400 metres. Compilation of historical reports, maps and images from the Freiberg archives have allowed the Company to model historically mined areas, providing more detailed information on targets ahead of drilling. In Q1 2020 permitting documentation was submitted to regulators and the drilling permit was received during Q2 2020.
During Q3 2020, activities at Silver City included:
| ● | Commenced drill testing of initial targets and completed 2,000 metres of diamond drilling at five targets; | |
| ● | Engaged community leaders and members and provided presentations on the mining life cycle and updates on the Company’s activities in the area; | |
| ● | Engaged with local land and business owners to secure access to properties for drilling and regional exploration; and | |
| ● | Completed the second option payment on the Project to Globex. |
The Globex Agreement establishes the following obligations for Excellon to exercise the option on, and earn a 100% interest in, the Silver City Project:
| (i) | Pay C$100,000 and issue 226,837 Common Shares to Globex (completed September 23, 2019); | |
| (ii) | Pay C$100,000 and issue Common Shares to Globex equivalent to C$325,000 based on the 5-day volume weighted average price (“VWAP”) on or before September 23, 2020 (completed September 21, 2020); | |
| (iii) | Pay C$100,000 and issue Common Shares to Globex equivalent to C$425,000 based on the 5-day VWAP on or before September 23, 2021; | |
| (iv) | Pay C$200,000 and issue Common Shares to Globex equivalent to C$625,000 based on the 5-day VWAP on or before September 23, 2022; and | |
| (v) | Upon completion of the payments and issuances set out above, grant Globex a gross metals royalty on the exploration or production license on the Silver City Project of 3.0% for precious metals and 2.5% for other metals, which may be reduced to 2% and 1.5%, respectively, upon a payment of US$1,500,000. |
The total value of cash and shares over the three-year term is C$500,000 and C$1.6 million, respectively. The Company may accelerate any of the payments, issuances or the royalty grant at any time during the term of the option. Additionally, the Company may terminate the option at any time provided that the work commitments under the exploration license in respect of the first year of the option have been satisfied.
In addition, the Company has agreed to make: (i) a one-time payment of C$300,000 following the announcement of a maiden resource on the Silver City Project and (ii) a one-time payment of C$700,000 upon the achievement of commercial production from the Silver City Project.
Kilgore Project
The Company aims to improve understanding of the deposit setting on a local and regional scale through: re-logging core to enhance the underlying structural and lithologic framework; improving characterization of host rocks through lithogeochemistry; and sampling and assaying of silver mineralization to potentially improve project economics. The Company also looks forward to continuing regional exploration, prospecting and geophysics to generate new targets and is building a dedicated team to advance this project.
13 | Page |
Management’s Discussion & Analysis of Financial Results
For the three and nine month periods ended September 30, 2020
The Company filed an updated Plan of Operations with the United States Forest Service (“USFS”) in June 2020, and the USFS is now in the process of revising the National Environmental Policy Act Environmental Assessment (“EA”) accordingly. The Company is informed by the USFS that the process to prepare a Revised EA and Decision Notice (“DN”) will be complete by Q2 2021. If the DN is received within that timeframe, the Company could commence drilling by mid-July 2021. Drilling was originally planned to commence in August 2020. Once approved, the new EA may still be challenged by environmental groups which could result in further delays.
Highlights on the project for Q3 2020 include:
| ● | Completion of Aster analysis of the Kilgore project area and regional package; | |
| ● | Regional mapping, prospecting, and stream sediment sampling of regional target areas; | |
| ● | Growing Kilgore project team; | |
| ● | Ongoing environmental and baseline surveys; and | |
| ● | Re-logging and sampling of historical core. |
Oakley Project
In Q1 2020, prior to the closing of the Arrangement, Otis announced that a definitive option agreement (the “Oakley Agreement”) had been executed by Centerra to earn up to a 70% interest in the Oakley Property in exchange for total exploration expenditures of $7,000 and cash payments to Otis of $550 over a six-year period. Following the Arrangement, Otis became a subsidiary of Excellon. Specific terms of the Oakley Agreement include:
| (i) | Centerra can earn a 51% interest in Oakley (the “First Option”) by incurring $4,500,000 in exploration expenditures and by making cash payments of $250,000 over a three-year period as follows: |
| a. | Cash payment of $75,000 (complete) on signing and commitment to spend a minimum of US$500,000 on exploration expenditures in Year One; | |
| b. | Cash payment of $75,000 and $1,500,000 in exploration expenditures in Year Two; and | |
| c. | Cash payment of $100,000 and $2,500,000 in exploration expenditures in Year Three. |
| (ii) | Centerra then has an option to acquire a further 19% of the Oakley Project, for a total of 70% (the “Second Option”), by incurring an additional $3,000,000 in exploration expenditures and making a cash payment of $300,000 over three years. |
During the term of the Oakley Agreement, Centerra will be the operator of the project. Otis will act as project manager and will be paid 10% of the approved exploration expenditures for technical oversight and project management.
Subsequent to either the First Option or the Second Option, at Centerra’s option, the parties shall form a joint venture and fund expenditures going forward on a pro rata basis.
14 | Page |
Management’s Discussion & Analysis of Financial Results
For the three and nine month periods ended September 30, 2020
Should Otis’ interest fall below 10% during the joint venture, that interest will automatically convert to a 2% net smelter return royalty that is not subject to a buyback provision.
Highlights on the project to date include:
| ● | Increased land holdings by approximately 2,500 acres (1,012 hectares) to approximately 7,000 acres (2,833 hectares) through staking of an additional 125 Federal Lode Mining claims on land managed by the BLM at the Cold Creek, Blue Hill Creek and Matrix Creek Prospects; |
| ● | Continued application process for 960 acres (388 hectares) of State of Idaho-managed land as “mineral leases,” adding to the current 320 acres (129.5 hectares) of mineral leases for a total of 1,280 acres (518 hectares); |
| ● | Completed soil sampling across the newly staked ground with 1,347 samples sent for gold and multi-element analysis; |
| ● | Completed 1,330 line-kilometer, airborne magnetic survey across the entire project area including the expanded footprint; |
| ● | Completed detailed geologic mapping program over the Cold Creek Prospect; |
| ● | Completed 20,200 line-meters of ground IP and resistivity survey; and |
| ● | Completed of Lidar (Light Detection and Ranging) survey. |
Beschefer Option to Wallbridge Mining Company Limited
In October 2018, a wholly-owned subsidiary of the Company entered into an option agreement (the “Beschefer Agreement”) in respect of the Beschefer Project in Quebec with Wallbridge Mining Company Ltd. (“Wallbridge”). Wallbridge agreed to incur an aggregate of $4.5 million in exploration expenditures and issue a total of 7,000,000 common shares of Wallbridge (“Wallbridge Shares”) over three years to earn a 100% interest in the property. On September 21, 2019 the parties amended the original option agreement to increase the total number of shares to 8,000,000 and extend the option period by one year.
The Company received 500,000 Wallbridge Shares upon entering the Beschefer Agreement. In January 2020, a review by Wallbridge of the property status on Beschefer revealed that the claims had lapsed in December 2019 resulting in both Wallbridge and Excellon losing rights to the property. Due to the reorganization of the claims in Quebec to eliminate sub-parcels, some of the claims under the Beschefer Agreement were assigned to contiguous properties upon the lapse of the claims. In Q1 2020, in satisfaction of the Beschefer Agreement, the Company’s subsidiary signed a release and quitclaim on the Beschefer Property and agreed to accept an additional 3,000,000 Wallbridge Shares and 500,000 warrants at a price of $1.00 for a period of five years.
Mineral Resources
The Company’s Mineral Resource Estimates have been prepared in accordance with NI-43-101 and the Canadian Institute of Mining, Metallurgy and Petroleum’s (CIM) ‘Mineral Resources and Mineral Reserves Best Practices’ guidelines (November 2003) and classified per the CIM ‘Definition Standards for Mineral Resources and Mineral Reserves’ (May 2014). The associated technical reports for the Platosa, Evolución, Kilgore and Oakley projects can be found at www.sedar.com under the profiles for Excellon (in respect of Platosa and Evolución) and Otis (in respect of Kilgore and Oakley). The technical reports for each of the projects are also available on the Company’s website at www.excellonresources.com.
15 | Page |
Management’s Discussion & Analysis of Financial Results
For the three and nine month periods ended September 30, 2020
The reader should also refer to the Company’s 2019 Annual Information Form (“AIF”) for summary and background on the Company’s Platosa Mineral Resource Estimate and the Company’s other exploration projects.
QUALIFIED PERSONS
Mr. Ben Pullinger, B.Sc., P.Geo., Excellon’s Senior Vice President Geology & Corporate Development and a Qualified Person, as defined in NI 43-101, has reviewed and approved the scientific and technical information relating to geological interpretation and results contained in this MD&A. Paul Keller, P. Eng., Excellon’s Chief Operating Officer and a Qualified Person, as defined in NI 43-101, has reviewed and approved the scientific and technical information relating to production results contained in this MD&A.
CORPORATE RESPONSIBILITY REVIEW
In Q3 2020, the Company maintained its focus on ensuring that its COVID-19 prevention and response measures continued to be followed and to work effectively. Management at business units and exploration projects have done an excellent job implementing our protocols and continue to emphasize the same measures in the communities surrounding our operations. To-date the Company’s operations have not been materially affected by the pandemic.
CR Performance at Platosa and Miguel Auza
Management continues to evaluate and monitor compliance with legal requirements and manage CR risk and the Company’s operations continue to report on the key trailing CR performance indicators and elements of the Visible Felt Leadership process. Trailing safety performance through September 30, 2020, as measured by recordable injury frequency (RIF) and lost time injury frequency (LTIF) improved 31 percent and 21 percent, respectively, from the full year 2019 results. Injury severity has declined by 15 percent so far in 2020 compared to the full-year 2019 results.
There were no significant environmental incidents reported at either Platosa or Miguel Auza during Q3 2020. The Company continued engagement with a range of stakeholders surrounding the Platosa and Miguel Auza business units. There were no community-related grievances reported during Q3 2020.
The Company has initiated discussions with the Comisión Nacional del Agua (CONAGUA), the federal water regulatory agency in Mexico, regarding the management of water that the Company pumps from the Platosa mine. Discussions aim to evaluate how best to manage such water going forward to support Platosa’s operations and deliver a sustainable benefit to the residents of the Mapimí region.
Tailings Management at Miguel Auza
There are two tailings management facilities (TMF) at Miguel Auza. TMF #1 is located immediately northwest of the concentrator and has been decommissioned, rehabilitated with a soil cover and re-vegetated. TMF #2 is located on land owned by Excellon approximately one kilometre north of the Miguel Auza concentrator. Approval for the construction and operation of the facility was received on January 31, 2017.
16 | Page |
Management’s Discussion & Analysis of Financial Results
For the three and nine month periods ended September 30, 2020
Construction of the stage 2 raise for TMF #2 was completed in early Q4 2020.
Corporate, operations and consulting engineers progressed the development of an operations, maintenance and surveillance manual (“OMS Manual”) aligned with the Mining Association of Canada Guidelines. The final version of the OMS Manual was delivered in early Q2 2020 and the Company continues to implement the requirements of the OMS Manual.
Summary of Quarterly Financial Results
Financial statement highlights for the quarter ended September 30, 2020 and the last eight quarters are as follows:
Q3 2020 | Q2 2020 | Q1 2020 | Q4 2019 | Q3 2019 | Q2 2019 | Q1 2019 | Q4 2018 | |||||||||||||||||||||||||
| (in $000’s) | $ | $ | $ | $ | $ | $ | $ | $ | ||||||||||||||||||||||||
| Revenues | 9,667 | 891 | 6,615 | 6,414 | 6,203 | 8,674 | 5,179 | 5,955 | ||||||||||||||||||||||||
| Production costs | (5,875 | ) | (2,641 | ) | (5,479 | ) | (5,757 | ) | (6,050 | ) | (6,797 | ) | (4,612 | ) | (5,213 | ) | ||||||||||||||||
| Depletion and amortization | (1,269 | ) | (666 | ) | (1,269 | ) | (1,250 | ) | (1,140 | ) | (1,149 | ) | (1,169 | ) | (1,004 | ) | ||||||||||||||||
| Cost of sales | (7,144 | ) | (3,307 | ) | (6,748 | ) | (7,007 | ) | (7,190 | ) | (7,946 | ) | (5,781 | ) | (6,217 | ) | ||||||||||||||||
| Gross profit (loss) | 2,523 | (2,416 | ) | (133 | ) | (593 | ) | (987 | ) | 728 | (602 | ) | (262 | ) | ||||||||||||||||||
| Expenses: | ||||||||||||||||||||||||||||||||
| General and administrative | (1,502 | ) | (2,345 | ) | (1,163 | ) | (1,282 | ) | (1,151 | ) | (1,028 | ) | (1,361 | ) | (595 | ) | ||||||||||||||||
| Exploration | (2,001 | ) | (258 | ) | (373 | ) | (1,023 | ) | (858 | ) | (967 | ) | (1,005 | ) | (1,115 | ) | ||||||||||||||||
| Other income (expense) | (744 | ) | 968 | (1,659 | ) | 1,222 | (200 | ) | 34 | (274 | ) | 51 | ||||||||||||||||||||
| Net Finance (expense) income | (292 | ) | 554 | (2,091 | ) | 753 | (71 | ) | (335 | ) | (52 | ) | 203 | |||||||||||||||||||
| Income tax (expense) recovery | 1,776 | 97 | (953 | ) | (256 | ) | 365 | (640 | ) | (491 | ) | (2,432 | ) | |||||||||||||||||||
| Net loss | (240 | ) | (3,400 | ) | (6,372 | ) | (1,179 | ) | (2,902 | ) | (2,208 | ) | (3,785 | ) | (4,150 | ) | ||||||||||||||||
| Loss per share – basic and diluted | (0.01 | ) | (0.02 | ) | (0.06 | ) | (0.01 | ) | (0.03 | ) | (0.02 | ) | (0.04 | ) | (0.04 | ) | ||||||||||||||||
| Cash flow from (used in) operations before changes in working capital | (166 | ) | (4,318 | ) | (1,778 | ) | (1,707 | ) | (1,658 | ) | 208 | (977 | ) | (1,507 | ) | |||||||||||||||||
17 | Page |
Management’s Discussion & Analysis of Financial Results
For the three and nine month periods ended September 30, 2020
Quarter to quarter revenue variances are a function of metal prices, costs and production results. Production results can differ from period to period depending on geology, mining conditions, labour, and equipment availability. These in turn affect mined tonnages, grades and mill recoveries and ultimately the quantity of metal produced and revenues received. The Company currently expenses exploration costs, specifically exploration costs related to Silver City, Kilgore, Evolución and Platosa (unless associated with resource expansion). These exploration costs do not relate to the mining operation and vary from period to period creating volatility in earnings. The following is a discussion of the material variances between Q3 2020 and Q3 2019.
| Q3 | Nine months ended September 30, | |||||||||||||||
| 2020 | 2019 | 2020 | 2019 | |||||||||||||
| Revenue | 9,667 | 6,203 | 17,173 | 20,055 | ||||||||||||
| Net Loss | (240 | ) | (2,902 | ) | (10,010 | ) | (8,894 | ) | ||||||||
Revenues increased by 56% during Q3 2020, driven by a 36% increase in silver ounces payable and a 41% increase in the average realized silver price relative to the comparative period. Also refer to “Provisionally Priced Sales” below.
Net loss in Q3 2020 reflects a $2.7 million improvement over the prior year period based on higher revenues (by $3.5 million) and a $1.8 million non-cash recovery of deferred taxes, partly offset by higher exploration expenses (by $1.1 million), corporate administrative expenses (by $0.3 million), unrealized foreign exchange losses of $0.4 million and higher interest and other expenses of $0.8 million.
| Cost of Sales | (7,144 | ) | (7,190 | ) | (17,198 | ) | (20,917 | ) |
Cost of sales in Q3 2020 are level with the prior-year quarter and include direct mining and milling costs which were 12% lower than the prior-year quarter despite a 20% increase in ore mined in Q3 2020, reflecting lower personnel costs and efficiencies realized following the pandemic-driven suspension in Q2 2020. Cost of sales was flat with the comparative quarter after including the movements in ore and concentrate inventories ($0.8 million) and no toll milling in the current quarter ($0.3 million).
| Exploration | (2,001 | ) | (858 | ) | (2,631 | ) | (2,829 | ) |
Higher exploration expense in Q3 2020, by $1.1 million above the prior-year quarter, primarily reflects increased exploration activity at Silver City ($0.9 million) and work conducted on the Kilgore Project ($0.5 million), partially offset by a delay of exploration activities in Mexico.
| Other expenses | (744 | ) | (200 | ) | (1,435 | ) | (439 | ) |
18 | Page |
Management’s Discussion & Analysis of Financial Results
For the three and nine month periods ended September 30, 2020
Other expenses include realized and unrealized foreign exchange gains and losses, unrealized gains and losses on marketable securities and warrants, interest income and other non-routine income or expenses, if any.
The $0.5 million increase in Q3 2020 over the prior-year quarter reflects $0.3 million in unrealized losses on marketable securities and warrants and $0.4 million in unrealized foreign exchange losses and other items.
| Finance expenses | (292 | ) | (71 | ) | (1,829 | ) | (459 | ) |
Net finance expenses consist primarily of interest on the Convertible Debentures and credit facility, mark-to-market of currency hedges and accretion of the rehabilitation provision for the mine and mill.
During Q3 2020, the market valuation of the USD/MXN currency hedges generated an unrealized gain variance of $0.4 million, which was more than offset by higher interest expense (by $0.6 million) on the Sprott Credit Facility and Convertible Debentures.
Provisionally Priced Sales
Sales are recorded using the metal price received for sales that settle during the reporting period. For sales that have not been settled, an estimate is used, based on the expected month of settlement and the forward price of the metal at the end of the reporting period. The difference between the estimate and the final price received is recognized by adjusting sales in the period in which the sale is settled (i.e. finalization adjustment). The finalization adjustment recorded for these sales depends on the actual price when the sale settles, which occurs either one or two months after shipment under the terms of the current concentrate purchase agreements.
During the three months ended September 30, 2020, the Company recognized a positive adjustment to revenues of $227,000 as net receivables were ultimately settled at higher values than provisionally priced during the second quarter of 2020 (2019: negative adjustment of $31,000).
As at September 30, 2020, provisionally priced sales totalled $6.9 million which are expected to settle at final prices in Q4 2020.
Invoiced revenues are derived from the value of metal content adjusted by treatment and refining charges incurred by the metallurgical complex of the customer. The value of the metal content of the products sold, before treatment and refining charges is as follows (in thousands of US dollars):
| Three months ended | Nine months ended | |||||||||||||||
| September 30 | September 30 | September 30 | September 30 | |||||||||||||
| 2020 | 2019 | 2020 | 2019 | |||||||||||||
| $ | $ | $ | $ | |||||||||||||
| Silver | 7,626 | 3,712 | 12,838 | 11,190 | ||||||||||||
| Lead | 1,926 | 1,246 | 3,658 | 3,795 | ||||||||||||
| Zinc | 2,533 | 1,534 | 4,736 | 7,020 | ||||||||||||
| Value of metal content in products sold | 12,085 | 6,492 | 21,232 | 22,005 | ||||||||||||
| Adjustment for treatment and refining charges (TC/RC) | (2,418 | ) | (719 | ) | (4,555 | ) | (2,458 | ) | ||||||||
| Revenues from concentrate sales | 9,667 | 5,773 | 16,677 | 19,547 | ||||||||||||
| Revenues from toll milling services | - | 430 | 496 | 508 | ||||||||||||
| Total revenues | 9,667 | 6,203 | 17,173 | 20,055 | ||||||||||||
19 | Page |
Management’s Discussion & Analysis of Financial Results
For the three and nine month periods ended September 30, 2020
Alternative Performance (Non-IFRS) Measures
Production Cost Per Tonne, Total Cash Cost Net of By-Product Credits Per Silver Ounce Payable and All-In Sustaining Cost (AISC) Per Silver Ounce Payable are non-IFRS measures that do not have a standardized meaning. The calculation of these measures may differ from that used by other companies in the industry. The Company uses these measures internally to evaluate the underlying operating performance of the Company for the reporting periods presented. These measures should not be considered in isolation or as a substitute for measures of performance prepared in accordance with generally accepted accounting principles and are not necessarily indicative of operating expenses as determined under generally accepted accounting principles. Management believes that these measures are key performance indicators of the Company’s operational efficiency and are increasingly used across the global mining industry and are intended to provide investors with information about the cash generating capabilities of the Company’s operations.
Due to the Suspension, the Company does not consider the Alternative Performance (Non-IFRS) Measures for the nine months ended September 30, 2020 stated below to be representative of the Company’s business and normal operations, as the care-and-maintenance costs associated with the Suspension were unmatched by any material amount of revenue or payable metals, unlike in previous quarters.
| Q3 | Nine months ended September 30, | |||||||||||||||
| 2020 | 2019 | 2020 | 2019 | |||||||||||||
| Production Cost per Tonne | $ | 227 | $ | 339 | $ | 324 | $ | 304 | ||||||||
The Company excludes inventory adjustments from the calculation of Production Cost per Tonne to improve period-over-period comparisons. A reconciliation between production cost per tonne (excluding depletion and amortization and inventory adjustments) and the Company’s cost of sales as reported in the Company’s financial statements is provided below.
| $ 000’s | $ 000’s | $ 000’s | $ 000’s | |||||||||||||
| Cost of Sales | 7,144 | 7,190 | 17,198 | 20,917 | ||||||||||||
| San Sebastián processing cost (Hecla bulk sample) | - | (260 | ) | (234 | ) | (260 | ) | |||||||||
| Depletion and amortization | (1,269 | ) | (1,140 | ) | (3,204 | ) | (3,458 | ) | ||||||||
| Inventory adjustments | (750 | ) | 53 | 145 | (355 | ) | ||||||||||
| Production Costs (excluding inventory adjustments) | 5,125 | 5,843 | 13,905 | 16,864 | ||||||||||||
| Tonnes milled | 22,612 | 17,235 | 42,941 | 55,418 | ||||||||||||
| Production cost per tonne milled ($/tonne) | 227 | 339 | 324 | 304 | ||||||||||||
20 | Page |
Management’s Discussion & Analysis of Financial Results
For the three and nine month periods ended September 30, 2020
The 33% decrease in cost per tonne milled in Q3 2020 versus the prior year reflects lower production costs as described in “Cost of Sales”, above and the volume impact of a 31% increase in tonnes milled relative to the comparative period.
| Q3 | Nine months ended September 30, | |||||||||||||||
| 2020 | 2019 | 2020 | 2019 | |||||||||||||
| Total Cash Cost Per Silver Ounce Payable | $ | 12.60 | $ | 18.18 | $ | 16.80 | $ | 12.58 | ||||||||
The calculation of total cash cost per silver ounce payable reflects the cost of production adjusted for by-product and various non-cash costs included in cost of sales. Changes in inventory have not been adjusted from cost of sales, as these costs are associated with the payable silver ounces sold in the period. The Company expects total cash costs net of by-product revenues to vary from period to period as planned production and underground development access different areas of the mine with varying ore grades and characteristics.
Following is a compilation of total cash cost per silver ounce payable, net of by-product credits:
| Q3 | Nine months ended September 30, | |||||||||||||||
| 2020 | 2019 | 2020 | 2019 | |||||||||||||
| $ 000’s | $ 000’s | $ 000’s | $ 000’s | |||||||||||||
| Cost of sales | 7,144 | 7,190 | 17,198 | 20,917 | ||||||||||||
| Adjustments - increase/(decrease): | ||||||||||||||||
| San Sebastián processing cost (Hecla bulk sample) | - | (260 | ) | (234 | ) | (260 | ) | |||||||||
| Depletion and amortization | (1,269 | ) | (1,140 | ) | (3,204 | ) | (3,458 | ) | ||||||||
| Third party smelting and refining charges (1) | 2,418 | 719 | 4,555 | 2,458 | ||||||||||||
| Royalties (2) | (113 | ) | (23 | ) | (153 | ) | (68 | ) | ||||||||
| By-product credits (3) | (4,271 | ) | (2,353 | ) | (7,998 | ) | (10,398 | ) | ||||||||
| Total cash cost net of by-product credits | 3,909 | 4,133 | 10,164 | 9,191 | ||||||||||||
| Silver ounces payable | 310,295 | 227,350 | 605,101 | 730,322 | ||||||||||||
| Total cash cost per silver ounce payable ($/oz) | 12.60 | 18.18 | 16.80 | 12.58 | ||||||||||||
| (1) | Treatment and refining charges recorded in net revenues as is industry standard and added back here to derive total costs. |
| (2) | Advance royalty payments on the Miguel Auza property unrelated to production from Platosa. |
| (3) | By-product credits comprise revenues from sales of lead and zinc. |
Silver production in Q3 2020 was 36% above the prior-year quarter; however, this improved production generated concentrates that attracted higher treatment and refining charges, which increased by $1.7 million or by 236% in Q3 2020 relative to Q3 2019. The increased TC/RCs were in line with the global zinc and lead concentrate industry charges, which saw a marked increase in TC/RCs in 2019 continue into 2020. Q3 2020 TC/RCs were pursuant to a renegotiated offtake agreement in respect of zinc concentrate, which delivered lower charges, but the operation incurred higher penalties for deleterious elements, particularly antimony, during the period. The Company plans to mitigate these penalties through increased ore blending in the future.
| Q3 | Nine months ended September 30, | |||||||||||||||
| 2020 | 2019 | 2020 | 2019 | |||||||||||||
| AISC Per Silver Ounce Payable (including non-cash items) | $ | 18.92 | $ | 28.46 | $ | 29.28 | $ | 22.51 | ||||||||
21 | Page |
Management’s Discussion & Analysis of Financial Results
For the three and nine month periods ended September 30, 2020
Excellon adopted the AISC measure to provide further transparency on the costs associated with producing silver and to assist stakeholders of the Company in assessing operating performance, its ability to generate free cash flow from current operations and overall value. The AISC measure is a non-IFRS measure based on guidance announced by the World Gold Council in June 2013.
Excellon defines AISC per silver ounce payable as the sum of total cash costs (including treatment charges and net of by-product credits), capital expenditures that are sustaining in nature, corporate general and administrative costs (including non-cash share-based compensation), capitalized and expensed exploration that is sustaining in nature, and environmental reclamation costs (non-cash), all divided by the total payable silver ounces sold during the period to arrive at a per-ounce figure.
Capital expenditures to develop new operations or capital expenditures related to major projects at existing operations where these projects will materially increase production are classified as non-sustaining and are excluded. The definition of sustaining versus non-sustaining is similarly applied to capitalized and expensed exploration costs. Exploration costs to develop new operations or that relate to major projects at existing operations where these projects are expected to materially increase production are classified as non-sustaining and are excluded.
Costs excluded from AISC are non-sustaining capital expenditures and exploration costs (as described above), finance costs, tax expense, and any items that are deducted for the purposes of adjusted earnings, if any.
22 | Page |
Management’s Discussion & Analysis of Financial Results
For the three and nine month periods ended September 30, 2020
The table below presents details of the calculation for AISC per silver ounce payable.
| Q3 | Nine months ended September 30, | |||||||||||||||
| 2020 | 2019 | 2020 | 2019 | |||||||||||||
| $ 000’s | $ 000’s | $ 000’s | $ 000’s | |||||||||||||
| Total cash costs net of by-product credits | 3,909 | 4,133 | 10,164 | 9,191 | ||||||||||||
| General and administrative costs (cash) | 900 | 881 | 2,988 | 2,434 | ||||||||||||
| Share based payments (non-cash) | 296 | 191 | 1,582 | 918 | ||||||||||||
| Accretion and amortization of reclamation costs (non-cash) | 46 | 55 | 113 | 171 | ||||||||||||
| Sustaining exploration (manto resource exploration/drilling) | 50 | 32 | 180 | 176 | ||||||||||||
| Sustaining capital expenditures (1) | 671 | 1,178 | 2,689 | 3,548 | ||||||||||||
| Total sustaining costs | 1,963 | 2,337 | 7,552 | 7,247 | ||||||||||||
| All-in sustaining costs | 5,872 | 6,470 | 17,716 | 16,438 | ||||||||||||
| Silver ounces payable | 310,295 | 227,350 | 605,101 | 730,322 | ||||||||||||
| AISC per silver ounce payable ($/oz) | 18.92 | 28.46 | 29.28 | 22.51 | ||||||||||||
| AISC excluding non-cash items, per silver ounce payable ($/oz) | 17.82 | 27.38 | 26.48 | 21.01 | ||||||||||||
| Realized silver price per ounce sold (2) | 24.82 | 17.65 | 20.18 | 15.78 | ||||||||||||
| (1) | Sustaining capital expenditure includes sustaining property plant and equipment acquisitions and capitalized development costs. | |
| (2) | Average realized silver price is calculated on current period sale deliveries and does not include the impact of prior period provisional adjustments in the period. |
The corporate secretary of the Company is a partner in a firm that provides legal services to the Company. During the three and nine months ended September 30, 2020, the Company incurred legal services from the firm of $42,000 and $62,000 respectively (three and nine months ended September 30, 2019 – $3,000 and $12,000 respectively). As at September 30, 2020, the Company had a $nil outstanding payable balance due to the firm (as at December 31, 2019 – $nil).
COMMON SHARE DATA AS AT NOVEMBER 13, 2020
| Common shares issued and outstanding | 32,079,561 | |||
| Stock options | 901,167 | |||
| DSUs | 469,570 | |||
| RSUs | 516,658 | |||
| Warrants ($7.00) | 1,092,400 | |||
| Warrants ($3.30) | 302,760 | |||
| Warrants ($5.75) | 1,143,428 | |||
| Fully diluted common shares (1) | 36,505,544 |
| (1) | Conversion of all outstanding Convertible Debentures would result in the issuance of an additional 3,379,245 Common Shares of the Company. |
23 | Page |
Management’s Discussion & Analysis of Financial Results
For the three and nine month periods ended September 30, 2020
LIQUIDITY AND CAPITAL RESOURCES
The primary source of funds available to the Company is cash flow generated by the Platosa Mine and equity and debt financings. The Company has raised equity and debt to fund its exploration program and certain capital and operating expenditures at the mine. A continuous review of the Company’s capital expenditure programs ensures the Company’s capital resources are utilized in a responsible and sustainable manner to conserve cash during periods of low commodity prices and economic and market uncertainty.
| September 30, 2020 | December 31, 2019 | |||||||
| Cash and Cash Equivalents | 7,178 | 6,344 | ||||||
The Company’s cash position increased by $0.8 million in the nine months ended September 30, 2020 as a result of:
| (i) | $5.9 million used by operations with a $1.2 million improvement in working capital, for a net total of $4.7 million used by operating activities, which included $2.6 million spent on exploration; |
| (ii) | $7.4 million invested in capital expenditures reflecting $5.5 million in dewatering costs, mine development and mining equipment, and $1.9 million for payables settled on the acquisition of Otis; and |
| (iii) | Net $12.2 million sourced from financing activities, including $13.0 million from Convertible Debentures and $0.3 million from stock option and warrant exercises, partially offset by interest, lease and other payments of $0.9 million. |
| September 30, 2020 | December 31, 2019 | |||||||
| Working Capital | 10,495 | 7,646 | ||||||
Working capital increased by $2.8 million at September 30, 2020 relative to December 31, 2019, reflecting an increase in current assets of $4.2 million primarily reflecting higher market values for marketable securities and warrants of $2.6 million, partially offset by an increase in current liabilities of $1.3 million, primarily reflecting a $0.7 million increase relating to currency hedge liabilities included in trade and other payables.
| Q3 | Nine months ended September 30, | |||||||||||||||
| 2020 | 2019 | 2020 | 2019 | |||||||||||||
| Cash from (used in) operations before changes in working capital ($000’s) | (166 | ) | (1,548 | ) | (5,902 | ) | (2,298 | ) | ||||||||
24 | Page |
Management’s Discussion & Analysis of Financial Results
For the three and nine month periods ended September 30, 2020
The $1.4 million increase in Q3 2020 versus the prior-year quarter for cash flows before changes in working capital principally reflects higher revenues and lower direct mining and milling costs as described in the Revenue and Cost of Sales sections above, partially offset by a $1.1 million increase in exploration expenses in the current quarter. The $3.6 million decrease for the nine-month period ended September 30, 2020 versus the prior year primarily reflects the impact of the Suspension in Q2 2020.
| Q3 | Nine months ended September 30, | |||||||||||||||
| 2020 | 2019 | 2020 | 2019 | |||||||||||||
| Investing Activities ($000’s) | (1,880 | ) | (1,069 | ) | (7,360 | ) | (3,626 | ) | ||||||||
Investing outflows for Q3 2020 include capital expenditures of $0.6 million for the construction of Tailings Management Facility #2 and dewatering sustaining capital. Investing outflows for the nine months ended September 30, 2020 include $2.9 million in dewatering capital, mine development and mining equipment, $1.5 million for the construction of Tailings Management Facility #2 and $1.9 million for payables settled on the acquisition of Otis.
| Financing Activities ($000’s) | 6,909 | 7,906 | 12,167 | 7,678 |
During Q3 2020, $13.0 million was received on the closing of the Debentures, partly offset by the $6.0 million repayment of the Sprott Credit Facility. For the nine months ended September 30, 2020, $12.2 million was sourced from financing activities, including $13.0 million from Debentures and $0.3 million in proceeds from stock option and warrant exercises, partially offset by interest, lease and other payments of $0.9 million.
The Company issued the Debentures in Q3 2020, accessed the capital markets in 2019 and arranged a bridge loan (since repaid) in connection with the acquisition of Otis. The Company is also implementing cost reductions and business improvements at its operations. With recent metal price increases, the Company expects to be able to generate positive cash flows for the remainder of 2020. In the event that cash flows from operations are insufficient, failure to obtain additional financing could result in delay or indefinite postponement of further exploration and development of the Company’s projects and the possible loss of such properties. There can be no assurances that the Company will be able to obtain adequate funding or that the terms of such financing will be favourable. The Company’s ability to generate positive cash flows is also impacted by financial market conditions, most notably metal prices as the Company derives its revenues from the sale of silver, lead and zinc and bears the associated treatment and refining costs. The Company is also exposed to currency exchange risk and accordingly manages this exposure with currency hedges as described below in “Financial Instruments”. In addition, the Company faces continued uncertainty related to the COVID-19 outbreak; please see Business Environment & Risks section below.
Financial Instruments
All financial assets and financial liabilities, other than derivatives, are initially recognized at the fair value of consideration paid or received, net of transaction costs as appropriate, and subsequently carried at fair value or amortized cost. The carrying values of cash and cash equivalents, trade receivables and other liabilities approximate their fair value, unless otherwise noted.
25 | Page |
Management’s Discussion & Analysis of Financial Results
For the three and nine month periods ended September 30, 2020
The Company’s financial performance is sensitive to changes in commodity prices, foreign exchange and interest rates, and the Company may periodically consider hedging such exposure. The Company’s Board of Directors together with executive management has overall responsibility for the establishment and oversight of the Company’s risk management framework. The Company may continue to address its price-related exposure to foreign exchange through the use of options, futures, forwards and derivative contracts.
The Mexican peso (“MXN”) and the Canadian dollar (“C”) are the functional currencies of the Company, with currency exposures arising from transactions and balances in currencies other than the functional currencies.
A significant portion of the Company’s capital expenditures, operating costs, exploration, and administrative expenditures are incurred in MXN, while revenues from the sale of concentrates are denominated in US dollars (“USD”). The fluctuation of the USD in relation to the MXN consequently impacts the reported financial performance of the Company. The Company actively manages its forward contracts in light of current market volatility.
To manage the Company’s exposure to changes in the USD/MXN exchange rate, the Company entered into forward contracts to purchase MXN in exchange for USD at various rates and maturity dates. As at September 30, 2020, forward contracts were outstanding for the purchase of MXN44 million in exchange for $2.2 million at an average rate of 20.18 MXN/USD, at various maturity dates until February 2021.
The mark to market adjustment on forward foreign-currency exchange contracts resulted in an unrealized gain of $346,000 recorded in finance expense during the three months ended September 30, 2020 and an unrealized loss of $673,000 recorded for the nine months ended September 30, 2020 (unrealized losses of $77,000 and $26,000 for the three and nine months ended September 30, 2019, respectively).
Commitments
The following table summarizes the Company’s significant unrecognized commitments as at September 30, 2020 (in thousands of US dollars):
| 2020 | 2021 | 2022 | 2023 | 2024 | Total | |||||||||||||||||||
| $ | $ | $ | $ | $ | $ | |||||||||||||||||||
| Exploration License (Silver City Project) - Cash | - | 75 | 149 | - | - | 224 | ||||||||||||||||||
| Exploration License (Silver City Project) - Shares | - | 317 | 467 | - | - | 784 | ||||||||||||||||||
| Concession holding fees | 205 | 409 | 592 | 592 | 515 | 2,313 | ||||||||||||||||||
| 205 | 801 | 1,208 | 592 | 515 | 3,322 | |||||||||||||||||||
Not included in the table above is a net smelter return royalty (“NSR”) payable semi-annually on the Platosa property of (a) 1.25% in respect of manto mineralization other than skarn mineralization or (b) 0.5% in respect of skarn or “Source” mineralization. Such payments vary period to period based on production results and commodity prices.
26 | Page |
Management’s Discussion & Analysis of Financial Results
For the three and nine month periods ended September 30, 2020
Contingencies
Contingencies can be either possible assets or possible liabilities arising from past events which, by their nature, will only be resolved when one or more future events not within the Company’s control occur or fail to occur. The assessment of such contingencies inherently involves the exercise of significant judgment and estimates of the outcome of future events. In assessing loss contingencies related to legal proceedings that are pending against the Company or unasserted claims that may result in such proceedings or regulatory or government actions that may negatively impact our business or operations, the Company with assistance from its legal counsel evaluates the perceived merits of any legal proceedings or unasserted claims or actions.
Platosa surface rights
A subsidiary of the Company’s appeal against a judgment revoking its 2007 purchase of approximately 295 hectares of surface rights north of the Platosa mine was denied by an appeals court in Mexico during the period. The judgment nullifies the purchase and orders that the land be returned to the plaintiffs and the plaintiffs to repay the original purchase price to the Company’s subsidiary.
The Company does not consider the land material to its mining operation or exploration activities. The decision does not impact Excellon’s mineral rights and the Company does not expect it to have any impact on its operations.
The plaintiffs also alleged at trial, for the first time, that the Platosa mine site was on this land. This assertion was not decided in the litigation, was not supported by admissible evidence, contradicts the cadastral registry, conflicts with the rights of other third party holders and ignores the fact that the Company began its use and occupation of the mine site in 2004 – before the sale in question.
Under Mexican law, Excellon’s access to the mine cannot be impeded. Nevertheless, the Company is considering a variety of legal avenues to redress the ruling, including further appeal.
Miguel Auza Antigua concession agreement
The Company is defending various legal claims including one against a subsidiary of the Company which is party to an action by a claimant in respect of damages under a property agreement regarding a non-material mineral concession within the Evolución Project. The concession is subject to an exploration and exploitation agreement with purchase option (the “Antigua Agreement”) dated December 3, 2006 between San Pedro Resources SA de CV (“San Pedro”, now a subsidiary of Excellon) and the owner (the “Plaintiff”) that provides, among other things, for a minimum payment of $2,500 plus value added tax per month and the payment of a 3% NSR. San Pedro has the right to purchase absolute title to La Antigua including the NSR upon payment of $500,000. San Pedro was under no contractual obligation to put the mine into production and has not done so. The Plaintiff was awarded damages in the court of first instance in Torreón, Coahuila. Both San Pedro and the Plaintiff appealed the decision to the Second District State Court in the Judicial District of Torreón. That Court confirmed the initial decision but, subsequently, pursuant to an order obtained by the Plaintiff, granted the Plaintiff an award of damages multiple times greater than any income the applicable NSR could produce even in the event of commercial production. San Pedro is appealing this decision to the federal courts of Mexico and believes that the decision is without merit and not supported by the evidence, facts or law. The Company expects the decision in respect of damages is remote and will be reversed and rationalized in the federal court system. There is currently no impact to the operation of the business.
Refer to the Company’s most recently filed AIF for further information.
27 | Page |
Management’s Discussion & Analysis of Financial Results
For the three and nine month periods ended September 30, 2020
Off-Balance Sheet Arrangements
The Company does not have any off-balance sheet arrangements.
ACCOUNTING POLICIES AND INTERNAL CONTROLS
Disclosure Controls and Procedures
In the disclosure set out below, references to management include the President and Chief Executive Officer and Chief Financial Officer. Management has designed disclosure controls and procedures (“DC&P”) to provide a reasonable assurance that (i) material information relating to the Company is made known to them by others, particularly during the period in which the annual filings are being prepared and (ii) information required to be disclosed by the Company in its annual filings, interim filings or other reports filed or submitted by it under securities legislation is recorded, processed, summarized and reported within the time periods specified in securities legislation. The Company regularly reviews its DC&P; however, they cannot provide an absolute level of assurance because of the inherent limitations in cost-effective control systems to prevent or detect all misstatements due to fraud or error.
In connection with the preparation and filing of the Company’s audited consolidated financial statements for the year ended December 31, 2019 (the “2019 Financial Statements”), the Company’s management assessed the effectiveness of the Company’s disclosure controls and procedures. In making this assessment, management used the criteria set forth in Internal Control – Integrated Framework (2013) (“COSO 2013”) issued by the Committee of Sponsoring Organizations of the Treadway Commission. Based on this assessment, management concluded that, as of December 31, 2019, the Company’s DC&P were not effective due to material weaknesses described in the MD&A for the year ended December 31, 2019 (the “2019 MD&A”). Although the Company has taken steps to remediate the material weaknesses, management has concluded that the material weaknesses continue to exist as of September 30, 2020.
Internal Control Over Financial Reporting
Management is responsible for establishing, maintaining and assessing the effectiveness of adequate internal control over financial reporting (“ICFR”). The Company’s ICFR is a process designed to provide reasonable assurance regarding the reliability of financial reporting and the preparation of financial statements for external purposes in accordance with IFRS. Management use the criteria set forth in Internal Control – Integrated Framework (2013) issued by the Committee of Sponsoring Organizations of the Treadway Commission (“COSO 2013”) to evaluate the effectiveness of the Company’s ICFR.
28 | Page |
Management’s Discussion & Analysis of Financial Results
For the three and nine month periods ended September 30, 2020
In connection with the preparation and filing of the 2019 Financial Statements, management assessed the effectiveness of the Company’s ICFR. Based on this assessment, management concluded that, as of December 31, 2019, as a result of the material weaknesses identified surrounding its concentrate theft in Q1 2019, the Company’s ICFR was not effective. Although the Company has made significant progress in its review and overhaul of its internal processes and controls around security and control of its metals inventory and revenues, and management has concluded that the material weaknesses in the ICFR continue to exist as of September 30, 2020.
Remediation of Material Weaknesses
Management has taken an active approach to remediating and enhancing controls in the revenues cycle for concentrate deliveries. This approach was set out in the 2018 MD&A and updated as at December 31, 2019. Management’s evaluation of these controls continued in the third quarter of 2020; no significant or material control deficiencies were identified. Despite these results, the material weaknesses cannot be considered remediated until the applicable remedial controls operate for a sufficient period of time and management has concluded through testing that these controls are operating effectively. Independent interim testing by Ernst & Young, LLP commenced in October 2020. No assurance can be provided at this time that the actions and remediation efforts the Company has taken or will implement will effectively remediate the material weaknesses described above or prevent the incidence of other significant deficiencies or material weaknesses in the Company’s ICFR in the future. The Company does not expect that disclosure controls or ICFR will prevent all errors, even as the remediation measures are implemented and further improved to address the material weaknesses. The design of any system of controls is based in part upon certain assumptions about the likelihood of future events, and there can be no assurance that any design will succeed in achieving the Company’s stated goals under all potential future conditions.
Other than the changes described above that were implemented in 2019, and ongoing, there have been no changes in the Company’s ICFR during 2020 that have materially affected, or are reasonably likely to materially affect, the Company’s ICFR.
Accounting policy estimates and judgments
Accounting standards issued but not yet effective
The condensed consolidated financial statements referenced in this MD&A have been prepared in accordance with IAS 34, Interim Financial Reporting, using International Financial Reporting Standards (IFRS) as issued by the International Accounting Standards Board (“IASB”). The significant accounting policies used in the preparation of the condensed consolidated financial statements are consistent with those used in the Company’s audited consolidated financial statements for the year ended December 31, 2019. There have been no new accounting pronouncements issued in 2020 that are expected to impact the Company.
Significant accounting estimates and judgements
The Company’s significant accounting policies are described in Note 3 to the consolidated financial statements for the year ended December 31, 2019. The preparation of the consolidated financial statements require management to make estimates and assumptions that affect the reported amounts of assets and liabilities in the consolidated financial statements and reported amounts of expenses during the reporting period. Such estimates and assumptions affect the carrying value of assets and are based on historical experience and other factors considered relevant. The estimates and underlying assumptions are reviewed on an ongoing basis. Revisions to accounting estimates are recognized in the period in which the estimates are revised. For details of these estimates, assumptions and judgements, please refer to the Company’s consolidated financial statements for the year ended December 31, 2019, and the condensed consolidated financial statements for the three and nine months ended September 30, 2020, which are available on the Company’s website and on SEDAR.
29 | Page |
Management’s Discussion & Analysis of Financial Results
For the three and nine month periods ended September 30, 2020
BUSINESS ENVIRONMENT AND RISKS
Risks and uncertainties
The Company’s business entails exposure to certain risks, including but not limited to: metal price risk since the Company derives its revenues from the sale of silver, lead and zinc; foreign exchange risk since the Company reports in United States dollars but operates in jurisdictions that use other currencies; the inherent risk of uncertainties in estimating Mineral Resources; political risk associated with operating in foreign jurisdictions; environmental risks; surface rights and access; enforcement of legal rights; and risks associated with labour relations issues. The current or future operations of Excellon including ongoing commercial production are or will be governed by and subject to federal, state and municipal laws and regulations regarding mineral taxation, mineral royalties and other governmental charges. Any change to the mineral taxation and royalty regimes in the jurisdictions in which Excellon operates or plans to operate could have an adverse financial impact on the Company’s current and planned operations and the overall financial results of the Company, the extent of which cannot be predicted. Refer to “Outlook”, above, for a discussion of COVID-19 related risks. Further factors affecting the Company are described in the Company’s most recently filed AIF.
ADDITIONAL SOURCES OF INFORMATION
Additional disclosures pertaining to the Company, including its most recent AIF, audited and unaudited interim financial statements, management information circular, material change reports, press releases and other information, are available on the SEDAR website at www.sedar.com or on the Company’s website at www.excellonresources.com.
CAUTIONARY STATEMENT REGARDING FORWARD-LOOKING STATEMENTS AND INFORMATION
This MD&A contains “forward-looking statements” within the meaning of applicable Canadian securities legislation and applicable U.S. securities laws. Except for statements of historical fact relating to the Company, such forward-looking statements include, without limitation, statements regarding the impact of the COVID-19 pandemic on the Company’s operations and results, the future results of operations, performance and achievements of the Company, including potential property acquisitions, the timing, content, cost and results of proposed work programs, the discovery and delineation of mineral deposits/resources/reserves, geological interpretations, the potential of the Company’s properties, proposed production rates, potential mineral recovery processes and rates, business plans and future operating revenues. Forward-looking statements are made based on management’s beliefs, estimates, assumptions and opinions on the date the statements are made. Although the Company believes that such statements are reasonable, it can give no assurance that such expectations will prove to be correct and the Company undertakes no obligation to update forward-looking statements. Forward-looking statements are typically identified by words such as: believes, expects, anticipates, intends, estimates, targets, plans, postulates, and similar expressions, or are those which, by their nature, refer to future events. The Company cautions investors that any forward-looking statements by the Company are not guarantees of future results or performance, and that actual results may differ materially from those in forward-looking statements as a result of various risk factors, including, but not limited to, the ability of the Company to maintain normal operations during the COVID-19 pandemic, variations in the nature, quality and quantity of any mineral deposits that may be located, significant downward variations in the market price of any minerals produced (particularly silver), the Company’s inability to obtain any necessary permits, consents or authorizations required for its activities, to produce minerals from its properties successfully or profitably, to continue its projected growth, to raise the necessary capital or to be fully able to implement its business strategies. A description of the risk factors applicable to the Company can be found in the AIF under “Description of the Business – Risk Factors.” All of the Company’s public disclosure filings may be accessed via www.sedar.com and readers are urged to review these materials, including the technical reports filed with respect to the Company’s mineral properties. This document is not, and is not to be construed in any way as, an offer to buy or sell securities in the United States.
30 | Page |
Management’s Discussion & Analysis of Financial Results
For the three and nine month periods ended September 30, 2020
Cautionary Note to United States Investors Concerning Estimates of Measured, Indicated and Inferred Resources
The terms “Measured,” “Indicated” and “Inferred” Mineral Resources used or referenced in this MD&A are defined in accordance with Canadian National Instrument 43-101 – Standards of Disclosure for Mineral Projects (“NI 43-101”) under the guidelines set out in the Canadian Institute of Mining, Metallurgy and Petroleum (the “CIM”) Standards on Mineral Resources and Mineral Reserves.
In the United States, the Securities and Exchange Commission (the “SEC”) has adopted amendments to its disclosure rules to modernize the mineral property disclosure requirements for issuers whose securities are registered with the SEC under the U.S. Securities Exchange Act of 1934, as amended (the “Exchange Act”). These amendments became effective February 25, 2019 (the “SEC Modernization Rules”) with compliance required for the first fiscal year beginning on or after January 1, 2021. The SEC Modernization Rules replace the historical property disclosure requirements for mining registrants that were included in SEC Industry Guide 7, which will be rescinded from and after the required compliance date of the SEC Modernization Rules. As a result of the adoption of the SEC Modernization Rules, the SEC now recognizes estimates of “measured mineral resources”, “indicated mineral resources” and “inferred mineral resources”. In addition, the SEC has amended its definitions of “proven mineral reserves” and “probable mineral reserves” to be “substantially similar” to the corresponding CIM definitions, as required by NI 43-101.
United States investors are also cautioned that while the SEC will now recognize “measured mineral resources”, “indicated mineral resources” and “inferred mineral resources”, investors should not to assume that any part or all of the mineral deposits in these categories will ever be converted into a higher category of mineral resources or into mineral reserves. These terms have a great amount of uncertainty as to their economic and legal feasibility. Accordingly, investors are cautioned not to assume that any Measured, Indicated or Inferred Mineral Resources that the Company reports are or will be economically or legally mineable. Further, Inferred Mineral Resources have a great amount of uncertainty as to their existence and as to whether they can be mined legally or economically. In accordance with Canadian rules, estimates of Inferred Mineral Resources cannot form the basis of feasibility or other economic studies, except in limited circumstances where permitted under NI 43-101.
Cautionary Note to United States Investors regarding Adjacent or Similar Properties
This MD&A may also contain information with respect to adjacent or similar mineral properties in respect of which the Company has no interest or rights to explore or mine. The Company advises United States investors that the United States Securities and Exchange Commission’s mining guidelines strictly prohibit information of this type in documents filed with the SEC. Readers are cautioned that the Company has no interest in or right to acquire any interest in any such properties, and that mineral deposits on adjacent or similar properties are not indicative of mineral deposits on the company’s properties.
31 | Page |