Exhibit 99.2

Management’s Discussion & Analysis of Financial Results
For the three months ended March 31, 2021
Excellon Resources Inc. (the “Company” or “Excellon”) has prepared this Management’s Discussion and Analysis of Financial Results (“MD&A”) for the three months ended March 31, 2021 in accordance with the requirements of National Instrument 51-102 (“NI 51-102”).
This MD&A contains information as at May 13, 2021 and provides information on the operations of the Company for the three months ended March 31, 2021 and 2020 and subsequent to the period end, and should be read in conjunction with the unaudited condensed consolidated financial statements for the three months ended March 31, 2021 (“Condensed Consolidated Financial Statements”) and the audited consolidated financial statements for the year ended December 31, 2020 which have been filed on SEDAR and EDGAR. The audited consolidated financial statements for the year ended December 31, 2020 have been prepared in accordance with International Financial Reporting Standards (“IFRS”) as issued by the International Accounting Standards Board (“IASB”). All figures in this MD&A are in thousands of United States dollars ($’000) unless otherwise noted.
This MD&A also refers to Production Cost per Tonne, Cash Cost per Silver Ounce Payable, and All-in Sustaining Cost (“AISC”) per Silver Ounce Payable, all of which are Non-IFRS measures. Please refer to the “Non-IFRS measures” section of this MD&A for an explanation of these measures and reconciliation to the Company’s reported financial results.
| 1 | Page |
Management’s Discussion & Analysis of Financial Results
For the three months ended March 31, 2021
BUSINESS AND STRATEGIC PRIORITIES
Excellon’s vision is to create wealth by realizing strategic opportunities through discipline and innovation for the benefit of the Company’s employees, communities and shareholders. The Company is advancing a precious metals growth pipeline that includes: Platosa, Mexico’s highest-grade silver mine since production commenced in 2005; Kilgore, a high-quality gold development project in Idaho with strong economics and significant growth and discovery potential; and an option on Silver City, a high-grade epithermal silver district in Saxony, Germany with 750 years of mining history and no modern exploration. The Company also aims to continue capitalizing on current market conditions by acquiring undervalued projects.
The common shares of Excellon trade on the Toronto Stock Exchange and the NYSE American, LLC exchange (the “NYSE American”) under the symbol “EXN” and on the Frankfurt Stock Exchange under the symbol “E4X2”.
Exploration activities
The Company advanced its exploration programs in USA, Mexico and Germany including:
| ● | 110 km2 of remote sensing on the Kilgore Property in Clark County, Idaho, USA and the staking of 175 claims, increasing the exploration property size by approximately 28%. | |
| ● | Initial diamond drilling results from the first holes drilled for precious metals on the Silver City Project in Saxony, Germany including: | |
| ○ | A new discovery at Grauer Wolf, the fourth target drilled at Silver City with 1,043 g/t silver equivalent (“AgEq”) over 1.3 metres (954 g/t Ag, 0.1 g/t Au, 0.7% Pb and 2.0% Zn), within 194 g/t AgEq over 8.1 metres (173 g/t Ag, 0.1 g/t, Au, 0.4% Pb and 0.3% Zn); | |
| ○ | 1,042 g/t AgEq over 0.45 metres (911 g/t Ag, 0.4 g/t Au, 2.8% Pb and 0.9% Zn), within 231 g/t AgEq over 2.30 metres (183 g/t Ag, 0.4 g/t, Au 0.5% Pb and 0.2% Zn) in initial drilling on the Peter Vein; | |
| ○ | 505 g/t AgEq over 0.71 metres (356 g/t Ag, 2.0 g/t Au), within 191 g/t AgEq (134 g/t Ag and 0.8 g/t Au) in the first hole at Reichenbach (Großvoigtsberg), a new, near-surface discovery in an area with minimal historic mining; and | |
| ○ | 319 g/t AgEq over 0.35 metres (300 g/t Ag, 0.2 g/t Au and 0.2% Zn), within 101 g/t AgEq (87 g/t Ag, 0.2 g/t Au) in the first hole at Bräunsdorf. | |
| ● | Doubling of the ground position at Silver City in March 2021 with the addition of the Frauenstein (5,700 ha), Mohorn (5,700 ha) and Oederon (6,200 ha) exploration licenses following applications to the Sächsisches Oberbergamt (Saxon Mining Authority). Each of these licenses had significant historic silver production dating back to the 11th century. | |
| ● | Updated Mineral Resource Estimate (“MRE”) published for Platosa Deposit outlining mineral resources as at February 28, 2021. | |
| ● | Underground drilling at the Platosa Mine identified multiple significant opportunities to define additional mineralization. | |
| ● | Further definition and expansion of the Guadalupe North, 623, NE-1 and NE-1S mantos at Platosa, with results from underground drilling including: | |
| ○ | 1,293 g/t AgEq over 6.5 metres (618 g/t Ag, 10.1% Pb and 12.0% Zn) in EX21UG565; | |
| 2 | Page |
Management’s Discussion & Analysis of Financial Results
For the three months ended March 31, 2021
| ○ | 1,571 g/t AgEq over 4.6 metres (688 g/t Ag, 14.5% Pb and 14.9% Zn) in EX21UG564; and | |
| ○ | 1,031 g/t AgEq over 4.6 metres (359 g/t Ag, 4.9% Pb and 15.9% Zn) in EX20UG522A, including 1,531 g/t AgEq over 1.3 metres (573 g/t Ag, 8.6% Pb and 21.5% Zn) | |
| ● | Drilling continued to define newly-discovered mineralization in an area of the Platosa deposit that was never effectively drilled from surface – the Gap Zone – with 300 metres of potential mineralized strike connected to the 10-20 Target, where drilling has intersected massive sulphide clasts 250 metres to the south of the Platosa deposit which could indicate potential for an extension of the Platosa mineralized footprint. | |
Natural gas price spike following polar vortex
In mid-February 2021, a polar vortex in the American southwest affected energy infrastructure in south Texas which led to supply shocks and record-high natural gas prices. This event disrupted electricity generation throughout northern Mexico including private energy providers for an 8-day period, after which natural gas supplies and prices returned to normal levels. The Company mitigated the cost impact by shedding electrical loads while maintaining budgeted production levels. The incremental electricity cost incurred during this period was $0.8 million.
Mexican Operations
Operational performance at the Platosa Mine continues to improve as the optimizations made in mid-2020 have been sustained. Improvements were realized in lower consumable costs, lower workforce costs and improved mine efficiency. Performance analysis in the plant beneficiation area will be undertaken to improve recoveries. Upgrades to the plant equipment have been installed, with additional improvements planned for metal recoveries and concentrate quality.
Additions to Platosa’s dewatering infrastructure will continue in 2021. The addition of inline boosters has improved overall system efficiency, reducing electricity draw and reducing costs associated with dewatering. New wells will be added to increase pumping rate as higher-elevation wells go dry. Single booster pumps are being added to increase pumping efficiency.
Exploration Plans
Exploration plans for 2021 include exploration programs at all of Excellon’s projects. Drilling continues at Platosa from surface and underground with multiple rigs. Preparation for drilling in Q2 through H2 is ongoing at the Bräunsdorf license at Silver City, Oakley and Kilgore. Regional exploration programs, including geophysics, mapping, prospecting, soil geochemistry and modeling, are planned for Oakley, Kilgore and the new exploration licenses (Mohorn, Oederan and Frauenstein) at Silver City.
At the Silver City Project, the Company has applied for a 2021 Drilling Operation Plan (“DOP”) to drill on four priority targets where 2020 drilling intersected high-grade mineralization. The program will also test new targets over a strike length of 12-18 kilometres.
At the Kilgore Project, the Company aims to improve the understanding of the deposit setting on a local and regional scale through re-logging core to enhance the underlying structural and lithologic framework and improving characterization of host rocks through lithogeochemistry. Sampling and assaying of previously unsampled or unassayed core is also ongoing. The Company also plans further regional exploration, prospecting and geophysics to generate new targets regionally.
The Company filed an updated Plan of Operations with the United States Forest Service (“USFS”) in Q2 2020, and the USFS is now in the process of revising the National Environmental Policy Act Environmental Assessment (“EA”) accordingly. The USFS has advised that the process to prepare a Revised EA and Decision Notice (“DN”) will be complete around mid-2021. If the DN is received within that timeframe, the Company could commence drilling at Kilgore in Q3 2021.
Exploration also continues at the Oakley Project, subject to the option agreement between Excellon and Centerra Gold Inc. (“Centerra”). During Q1 2021, the Company advanced work to support future drilling, including IP surveying and mapping. Drilling is expected to commence in Q2 2021.
| 3 | Page |
Management’s Discussion & Analysis of Financial Results
For the three months ended March 31, 2021
Platosa Mine production statistics for the periods indicated are as follows:
| Q1 2021(1) | Q1 2020(1) | |||||||||
| Tonnes Mined: | 21,212 | 19,899 | ||||||||
| Tonnes Milled: | 21,764 | 19,042 | ||||||||
| Grades: | ||||||||||
| Silver (g/t) | 524 | 542 | ||||||||
| Lead (%) | 5.35 | 5.44 | ||||||||
| Zinc (%) | 6.73 | 6.78 | ||||||||
| Recoveries: | ||||||||||
| Silver (%) | 89.7 | 89.3 | ||||||||
| Lead (%) | 81.8 | 82.8 | ||||||||
| Zinc (%) | 74.7 | 74.9 | ||||||||
| Metal Production: | ||||||||||
| Silver – (oz) | 328,747 | 296,281 | ||||||||
| Lead – (lb) | 2,099,741 | 1,890,456 | ||||||||
| Zinc – (lb) | 2,412,458 | 2,131,034 | ||||||||
| Silver equivalent (oz) (2) | 516,715 | 523,742 | ||||||||
| Payable: (3) | ||||||||||
| Silver – (oz) | 291,967 | 246,062 | ||||||||
| Lead – (lb) | 1,859,932 | 1,514,285 | ||||||||
| Zinc – (lb) | 1,802,430 | 1,805,672 | ||||||||
| Silver equivalent (oz) (2) | 442,582 | 434,190 | ||||||||
| Average realized prices: (4) | ||||||||||
| Silver – ($US/oz) | 26.32 | 15.04 | ||||||||
| Lead – ($US/lb) | 0.92 | 0.79 | ||||||||
| Zinc – ($US/lb) | 1.25 | 0.90 | ||||||||
| Toll milling (3rd party) ore processed (t) | - | 4,785 | ||||||||
| Production cost per tonne (5) | $ | 297 | $ | 292 | ||||||
| Total cash cost per silver ounce payable | $ | 13.43 | $ | 15.35 | ||||||
| AISC per silver ounce payable (6) | $ | 24.34 | $ | 26.28 | ||||||
| (1) | Period deliveries remain subject to assay and price adjustments on final settlement with concentrate purchaser. Data has been adjusted to reflect final assay and price adjustments for prior period deliveries settled during the period. |
| (2) | AgEq ounces established using average realized metal prices during the period indicated applied to the recovered metal content of the concentrates to reflect the revenue contribution of base metal sales during the period. |
| (3) | Payable metal is based on the metals delivered and sold during the period, net of payable deductions under the Company’s offtake arrangements, and will therefore differ from produced ounces. |
| (4) | Average realized price is calculated on current period sale deliveries and does not include the impact of prior period provisional adjustments in the period. |
| (5) | Production cost per tonne includes mining and milling costs, excluding depletion and amortization and inventory adjustments. |
| (6) | AISC per silver ounce payable excludes general and administrative and share-based payment costs attributable to the Company’s non-producing projects. The comparative has been revised to conform with the current allocation. |
| 4 | Page |
Management’s Discussion & Analysis of Financial Results
For the three months ended March 31, 2021
Operational Highlights
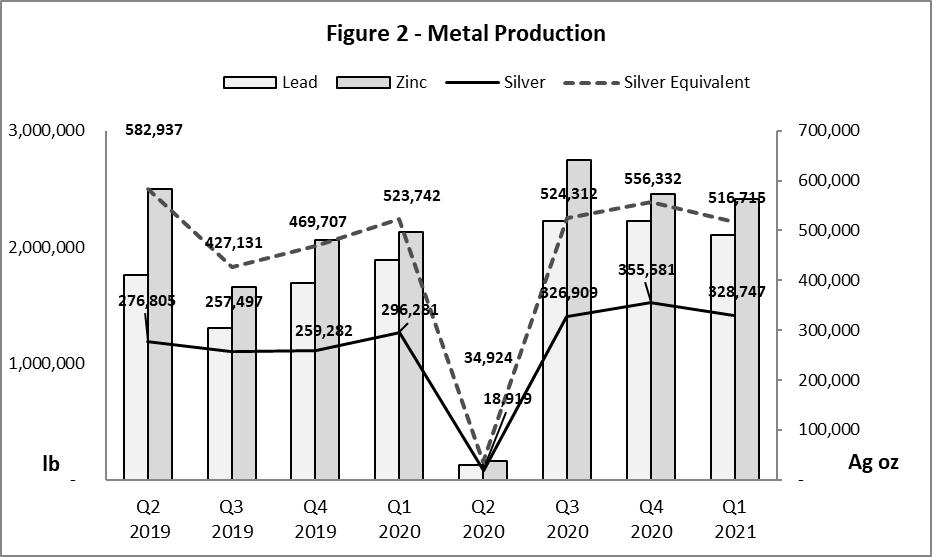
| ● | AgEq production of 516,715 AgEq oz (Q1 2020 – 523,742 AgEq oz) | |
| ○ | Silver production increased by 11% to 328,747 oz (Q1 2020 – 296,281 oz) | |
| ○ | Lead production increased by 11% to 2.1 million lb (Q1 2020 – 1.9 million lb) | |
| ○ | Zinc production increased by 13% to 2.4 million lb (Q1 2020 – 2.1 million lb) | |
| ● | AgEq ounces produced during Q1 2021 were lower than Q1 2020 as silver prices increased significantly more than base metal prices, resulting in base metal production contributing less to silver equivalency | |
| ● | Total cash cost net of by-products per silver ounce payable decreased by 13% to $13.43 (Q1 2020 – $15.35) | |
| ● | AISC per silver ounce payable decreased by 7% to $24.34 (Q1 2020 – $26.28) or $18.67 excluding non-cash items, the cash component of annual compensation grants and additional electricity costs associated with the polar vortex discussed above. | |
| ● | Production cost per tonne increased by 2% to $297 per tonne (Q1 2020 – $292 per tonne) | |
Operations Commentary
The first quarter of 2021 improved over 2020 with strong month-over-month production performance reflecting improvement efforts initiated in 2020 and continuing. Areas of focus included modified shift schedules, a reduction in workforce, a change in mining method and improved water pumping and in-mine infrastructure efficiency. In mid-February 2021, a polar vortex in southwestern U.S. led to supply shocks and record-high natural gas prices. This event disrupted electricity generation throughout northern Mexico including private energy providers for an 8-day period, after which natural gas supplies and prices returned to normal levels.
Head grades were consistent with Q1 2020, though lower than Q3 and Q4 2020, with mine flexibility enabling the mining of multiple mantos of various grades and widths.
Recoveries remained consistent compared to Q1 2020. Oxidized mill feed was successfully blended at the Platosa site before shipping to the processing facility, to maintain recoveries of lead and silver. Improvements at the Miguel Auza processing facility included rebuilding flotation cells, drying filters, shift schedule modifications, training and management of floor operations. Plant stabilization also impacted steady recovery and throughput with increased plant reliability from the focus on improved maintenance practices and equipment rebuild programs.
Metal production outperformed Q1 2020 as a function of higher tonnes mined. COVID-19 protection measures have been successful in maintaining the site productivity with minimal interruption through the quarter.
| 5 | Page |
Management’s Discussion & Analysis of Financial Results
For the three months ended March 31, 2021
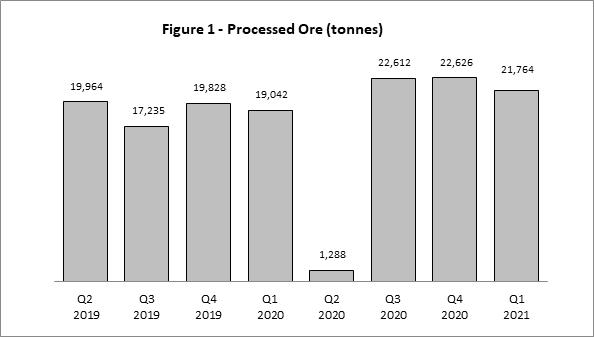
The previous eight quarters of production at Platosa are summarized below:
| 6 | Page |
Management’s Discussion & Analysis of Financial Results
For the three months ended March 31, 2021
Analysis of the components of mine operating results is as follows:
| Q1 | ||||||||
| 2021 | 2020 | |||||||
| Mill feed processed | 21,764 | 19,042 | ||||||
Production in Q1 2021 was 21,764 tonnes, a 14% improvement over the same quarter in 2020 and driven by reduced downtime for the mill and more efficient and consistent mine production.
| Head grades | Ag (g/t) | 524 | 542 | |||||||
| Pb (%) | 5.35 | 5.44 | ||||||||
| Zn (%) | 6.73 | 6.78 |
Silver grades in Q1 2021 were 3% lower than the comparative period due to variability in the production stopes being mined, while lead and zinc grades were consistent with Q1 2020.
| Recoveries | Ag (%) | 89.7 | 89.3 | |||||||
| Pb (%) | 81.8 | 82.8 | ||||||||
| Zn (%) | 74.7 | 74.9 |
Recoveries remained consistent quarter over quarter. Oxidized mill feed was successfully blended at the Platosa site before shipping to the processing facility, to maintain recoveries of lead and silver. Zinc recoveries are expected to improve in the second quarter following the rebuilding of the flotation cells and modifications to reagent schemes.
| Metal Production | Ag (oz) | 328,747 | 296,281 | |||||||
| Pb (lb) | 2,099,741 | 1,890,456 | ||||||||
| Zn (lb) | 2,412,458 | 2,131,034 | ||||||||
| AgEq (oz) | 516,715 | 523,742 |
Silver, lead, and zinc production increased by 11%, 11%, and 13% respectively in Q1 2021 over the prior-year quarter mainly driven by increased tonnes processed in Q1 2021. AgEq production decreased by 1% due to the change in the relative values of lead and zinc included in the AgEq calculation.
| 7 | Page |
Management’s Discussion & Analysis of Financial Results
For the three months ended March 31, 2021
EXPLORATION AND EVALUATION REVIEW
Refer to the Company’s Annual Information Form (“AIF”) for discussion of exploration work completed on the Company’s projects prior to the current period.
Platosa Property
The Platosa Property is located in northeastern Durango, Mexico and includes a high-grade underground silver mine, 74 mining concessions covering a total area of approximately 11,000 hectares and certain surface rights. The Company has mined over 800,000 tonnes from the mine since production commenced in 2005.
In Q1 2021, the Company continued exploration at Platosa, including drilling from underground to define and grow the Platosa resource, and surface exploration at the 10-20 and Jaboncillo targets.
At Jaboncillo, the Company is following up on drilling completed in 2019 that intersected multiple gossanous horizons with pyritic breccias, arsenopyrite and relict base-metal sulphides. Petrographic studies conducted in Q2 2020 confirmed the presence of base-metal sulphide species including sphalerite and galena. These observations confirm that the system is productive for base-metal sulphides on multiple structures over an approximate strike length of one kilometre. In Q3 2020 drilling resumed in this area targeting an economically significant component to the system.
Drilling at PDN continued into Q1 2021 on a skarn target. Drilling targeted areas where intense dolomitization and sanding along structures was intersected in preliminary drill holes, indicating the movement of hydrothermal fluids that are believed to be the expression of a potential skarn system at depth. Drilling in Q4 2020 intersected confirmatory silver grades of 218 g/t Ag over 0.75 meters. This potential for a skarn body at PDN has been defined through IP, magnetics and gravity surveys.
Highlights on the Platosa project during Q1 2021 included:
| ● | Platosa drilling results and updated MRE as summarized above; | |
| ● | Underground drilling to define and delineate additional mineralization near mine infrastructure; | |
| ● | Advancing development to support further drilling of a zone of vertical mineralization – the Gap Zone – in NE-1 and NE-1S mantos which had been inadequately tested with vertical holes drilled from surface; | |
| ● | Drilling near Platosa at the 10-20 target; and | |
| ● | Drilling at the Jaboncillo target on geophysical anomalies related to gossan development intersected in previous drilling. |
Mineral Resource Statement*, Platosa Mine, Mexico, SRK Consulting (Canada) Inc., March 31, 2021
Subsequent to the end of the period, on May 13, 2021, the Company announced an updated Mineral Resource Estimate (“MRE”) for the Platosa Mine, summarized as follows:
| Grade | Contained Metal | ||||||||||||||||||||||||||||
| Category | Quantity | Silver | Lead | Zinc | Silver | Lead | Zinc | ||||||||||||||||||||||
| (‘000 t) | (g/t) | (%) | (%) | (‘000 oz) | (‘000 lbs) | (‘000 lbs) | |||||||||||||||||||||||
| Measured | - | - | - | - | - | - | - | ||||||||||||||||||||||
| Indicated | 317 | 485 | 5.3 | 5.5 | 4,948 | 36,797 | 38,781 | ||||||||||||||||||||||
| Total | 317 | 485 | 5.3 | 5.5 | 4,948 | 36,797 | 38,781 | ||||||||||||||||||||||
| Inferred | 42 | 749 | 4.3 | 5.4 | 1,007 | 4,000 | 5,002 | ||||||||||||||||||||||
* Mineral resources are not mineral reserves and have not demonstrated economic viability. All figures are rounded to reflect the relative accuracy of the estimates. Composites were capped where appropriate. Mineral resources are reported at a silver equivalent cut-off value of 275 grams per tonne, considering metal prices of US$24.00 per ounce of silver, US$0.86 per pound of lead, US$1.10 per pound of zinc, and assuming metal recovery of 91% for silver, 80% for lead and 80% for zinc.
Mineral resources at Platosa are estimated based on drilling up to February 28, 2021. The Company is currently continuing its expansion and infill drilling program from dedicated underground infrastructure with results from this program to be included in subsequent resource updates. This program has been progressing well since Q3 2020 after challenges in 2019 and 2020 due to management changes, accessibility of drilling platforms and COVID-19 (in H1 2020).
| 8 | Page |
Management’s Discussion & Analysis of Financial Results
For the three months ended March 31, 2021
Since the last resource update as at March 31, 2018, 187 exploration holes from surface and underground have been completed totaling approximately 21,400 meters. The mineral resource estimation update included a geological modeling audit, grade estimation, associated sensitivity analyses, and mineral resource classification and was completed by Joycelyn Smith, PGeo (APGO#2963), under the supervision of Mr. Glen Cole, PGeo (APGO#1416), an appropriate independent Qualified Person as this term is defined in National Instrument 43-101. The overall process was reviewed by Dr. Oy Leuangthong, PEng (PEO#90563867). The effective date of the Mineral Resource Statement is March 31, 2021.
The Platosa mineral resource model update will be supported by a technical report prepared by SRK Consulting (Canada) Inc. (“SRK”) under National Instrument 43-101 (“NI 43-101”), which will be available on SEDAR (www.sedar.com) on or before June 27, 2021.
Evolución Project
The Evolución Property covers 45,000 hectares, comprising 22 mineral concessions, and 35 kilometres along strike in one of the world’s premier silver districts. It is an intermediate stage polymetallic silver-zinc-lead-gold exploration project located in northern Zacatecas State on the high plateau of central Mexico.
Exploration activities were limited through Q3 2020 due to COVID-19, but field work resumed in Q4 2020, including detailed mapping and prospecting on numerous regional targets throughout the Evolución concession.
Silver City Project
In Q3 2019, the Company entered into an agreement (the “Globex Agreement”) with Globex Mining Enterprises Inc. (“Globex”) for an option to acquire a 100% interest in the Bräunsdorf exploration license for the Silver City Project. The Silver City Project (Bräunsdorf exploration license) is a 164 km2 silver district in Saxony, Germany and encompasses a 36-km long epithermal vein system situated west of the city of Freiberg (30 km southwest of Dresden). The immediate exploration license and surrounding area have a long and rich history of silver mining dating back to the 11th century with numerous historic mine camps, small mines and prospects, many of which have only been explored and/or mined to shallow depths, seldom exceeding 200 metres below surface. Historically reported veins ranged from 0.5 to 10 metres width, with grades of over 3,500 g/t silver and no assaying for either gold or zinc, which were not historically available.
Refer to the Company’s AIF for further description of the work completed on the Silver City Project by the Company in 2019 and 2020 and for the terms of the Globex Agreement.
Highlights of drilling on the Silver City Project disclosed in Q4 2020 and Q1 2021 are summarized in First Quarter Highlights, above.
In Q1 2021, the Company submitted an application for the DOP for the 2021 drilling program. Additionally, the Company compiled and modelled 2020 drilling results for integration into the 2021 work program. Based on initial drilling results at Silver City, the Company expanded the project’s ground position in Q1 2021 through the application for three additional permits (Frauenstein, Mohorn and Oederan), growing the Silver City Project to 34,150 hectares. These new licenses are 100% owned by Excellon’s subsidiary Saxony Silver Corp.
Kilgore Project
The Kilgore Project is a volcanic-and sediment-hosted epithermal gold property located five miles from Kilgore, Clark County, Idaho. Excellon has a 100% undivided interest in 788 unpatented federal lode claims totaling 6,788 hectares on U.S. Forest Service lands. The property includes historical mine workings dating back to the early 1900s with further drilling in the 1980s that revealed the potential for mineralization well outside of the existing resource area, with limited follow up to date. Kilgore displays similar characteristics to Kinross Gold’s Round Mountain Mine, which has produced over 15 million ounces of gold to date.
In 2019, Otis Gold Corp. (“Otis”) completed a preliminary economic assessment that contemplates a low capital intensity, low operating cost, open-pit, heap-leach mining operation. Multiple opportunities exist to enhance the project, including significant exploration potential.
The Company filed an updated Plan of Operations with the USFS in Q2 2020, and the USFS is now in the process of revising the EA accordingly. The USFS has advised that the process to prepare a Revised EA and DN will be complete by mid-2021. If the DN is received within that timeframe, the Company could commence drilling in Q3 2021. Drilling was originally planned to commence in August 2020. Once approved, the new EA may still be challenged by environmental groups which could result in further delays.
| 9 | Page |
Management’s Discussion & Analysis of Financial Results
For the three months ended March 31, 2021
During Q1 2021, the Company continued relogging of historical core and integrating this data into a stronger geological model with an emphasis placed on timing of emplacement of multiple phases of mineralization and the controls on mineralization. This work will be integrated into 2021 drill targeting.
Oakley Project
On April 22, 2020, the Company acquired 100% ownership of the Oakley Project in Cassia County, Idaho as part of the Otis acquisition. The Oakley Project hosts gold-silver, epithermal hot spring-type mineralization at two targets: Blue Hill Creek and Cold Creek, and detachment-related gold-silver mineralization at Matrix Creek.
The Oakley Project has been optioned to Centerra pursuant to an option agreement (the “Oakley Agreement”) dated February 26, 2020 pursuant to which Centerra can earn up to a 70% interest in exchange for total exploration expenditures of $7 million and cash payments to the Company of $550,000 over a six-year period. During the term of the Oakley Agreement, Excellon is Project Manager and earns 10% of the approved exploration expenditures for technical oversight and project management. Refer to the Company’s AIF for a detailed summary of the Oakley Agreement.
In Q1 2021, the Company completed planning and continued permitting of the 2021 drilling program, as well as work on the ground IP and resistivity survey lines. Drilling at the Oakley Project is anticipated to commence in Q2 2021.
Mineral Resources
The Company’s mineral resource estimates have been prepared in accordance with NI-43-101 and the CIM’s ‘Mineral Resources and Mineral Reserves Best Practices’ guidelines (as applicable) and classified per the CIM ‘Definition Standards for Mineral Resources and Mineral Reserves’ (May 2014). The associated technical reports for the Evolución, Kilgore and Oakley projects can be found at www.sedar.com under the profiles for Excellon (in respect of Evolución) and Otis (in respect of Kilgore and Oakley). The technical reports for each of the projects are also available on the Company’s website at www.excellonresources.com. The updated technical report for the Platosa Project will be filed on SEDAR and the Company’s website on or before June 27, 2021.
Further, for additional discussion of the Company’s mineral resource estimates and the Company’s other exploration projects, the reader should refer to the Company’s AIF for the year ended December 31, 2020, available on the Company’s website www.excellonresources.com and on www.sedar.com.
QUALIFIED PERSONS
Mr. Ben Pullinger, B.Sc., P.Geo., Excellon’s Senior Vice President Geology & Corporate Development and a Qualified Person, as defined in NI 43-101, has reviewed and approved the scientific and technical information relating to geological interpretation and results contained in this MD&A. Paul Keller, P. Eng., Excellon’s Chief Operating Officer and a Qualified Person, as defined in NI 43-101, has reviewed and approved the scientific and technical information relating to production results contained in this MD&A.
| 10 | Page |
Management’s Discussion & Analysis of Financial Results
For the three months ended March 31, 2021
CORPORATE RESPONSIBILITY (“CR”) REVIEW
In Q1 2021, the Company maintained its focus on ensuring that its COVID-19 prevention and response measures continued to be followed and worked effectively. Management at business units and exploration projects have effectively implemented protocols and continue to emphasize the same measures in the communities surrounding the operations. Since the government-mandated suspension of operations in Q2 2020 (the “Suspension”), the Company’s operations have not been materially affected by the pandemic.
CR performance at Platosa and Miguel Auza
Management continues to evaluate and monitor compliance with legal requirements and manage CR risk. The operations continue to report on key trailing indicators of CR performance and elements of the Visible Felt Leadership process. Trailing indicators of safety performance through March 31, 2021, as measured by recordable injury frequency (“RIF”) and lost time injury frequency (“LTIF”), improved by 38 percent and 36 percent, respectively, since 2020. Injury severity declined by 43 percent in 2021 compared to 2020.
Work continues on the Company’s Corporate Responsibility Report, which will cover the 2019 and 2020 periods, following delays due to the Suspension.
There were no significant environmental incidents reported at either Platosa or Miguel Auza during Q1 2020. The Company continued engagement with a range of stakeholders surrounding the Platosa and Miguel Auza business units. There were no community-related grievances reported during Q1 2020.
The Comisión Nacional del Agua (“CONAGUA”), the federal water regulatory agency in Mexico, has commenced an administrative procedure with the Company to review the management of water that the Company pumps from the Platosa mine. The Company is committed to evaluating with CONAGUA how best to manage such water going forward, to support Platosa’s operations and deliver a sustainable benefit to the residents of the surrounding Mapimí region. Water management is critical for the Platosa operation and though the Company does not currently foresee any material changes to water management, such changes could impact mining operations in the future.
Tailings Management at Miguel Auza
There are two tailings management facilities (“TMF”) at Miguel Auza. TMF #1 is located immediately northwest of the concentrator and has been decommissioned, rehabilitated with a soil cover and re-vegetated. TMF #2 is located on land owned by Excellon approximately one kilometre north of the Miguel Auza concentrator. Approval for the construction and operation of the facility was received on January 31, 2017. Construction of the stage-2 raise of the TMF #2 was completed in early Q4 2020.
Corporate, operations and consulting engineers developed an operations, maintenance and surveillance manual (“OMS Manual”) aligned with guidelines of the Mining Association of Canada, which was delivered in Q2 2020. The Company continues to implement the requirements of the OMS Manual. In Q1, 2021, the Company engaged a Canadian-based international engineering firm as the Engineer of Record and to provide tailings management services, including the design of the stage-3 raise of TMF #2.
| 11 | Page |
Management’s Discussion & Analysis of Financial Results
For the three months ended March 31, 2021
Summary of Quarterly Financial Results
Financial statement highlights for the quarter ended March 31, 2021 and the last eight quarters are as follows:
Q1 2021 | Q4 2020 | Q3 2020 | Q2 2020 | Q1 2020 | Q4 2019 | Q3 2019 | Q2 2019 | |||||||||||||||||||||||||
| (in $000’s) | $ | $ | $ | $ | $ | $ | $ | $ | ||||||||||||||||||||||||
| Revenues (1) | 9,781 | 10,097 | 9,857 | 687 | 5,561 | 6,414 | 6,203 | 8,674 | ||||||||||||||||||||||||
| Production costs | (6,153 | ) | (5,986 | ) | (5,875 | ) | (2,641 | ) | (5,479 | ) | (5,757 | ) | (6,050 | ) | (6,797 | ) | ||||||||||||||||
| Depletion and amortization | (1,790 | ) | (1,445 | ) | (1,269 | ) | (666 | ) | (1,269 | ) | (1,250 | ) | (1,140 | ) | (1,149 | ) | ||||||||||||||||
| Cost of sales | (7,943 | ) | (7,431 | ) | (7,144 | ) | (3,307 | ) | (6,748 | ) | (7,007 | ) | (7,190 | ) | (7,946 | ) | ||||||||||||||||
| Gross Profit (Loss) | 1,838 | 2,666 | 2,713 | (2,620 | ) | (1,187 | ) | (593 | ) | (987 | ) | 728 | ||||||||||||||||||||
| Expenses: | ||||||||||||||||||||||||||||||||
| General and administrative | (2,342 | ) | (1,886 | ) | (1,502 | ) | (2,345 | ) | (1,163 | ) | (1,282 | ) | (1,151 | ) | (1,028 | ) | ||||||||||||||||
| Exploration | (1,073 | ) | (1,400 | ) | (2,001 | ) | (258 | ) | (373 | ) | (1,023 | ) | (858 | ) | (967 | ) | ||||||||||||||||
| Other income (expense) (1) | (651 | ) | (6 | ) | (934 | ) | 1,172 | (605 | ) | 1,222 | (200 | ) | 34 | |||||||||||||||||||
| Net finance (expense) income | (725 | ) | (679 | ) | (292 | ) | 554 | (2,091 | ) | 753 | (71 | ) | (335 | ) | ||||||||||||||||||
| Income tax (expense) recovery | 31 | (4,703 | ) | 1,776 | 97 | (953 | ) | (258 | ) | 365 | (640 | ) | ||||||||||||||||||||
| Net loss | (2,922 | ) | (6,008 | ) | (240 | ) | (3,400 | ) | (6,372 | ) | (1,181 | ) | (2,903 | ) | (2,208 | ) | ||||||||||||||||
| Loss per share | (0.09 | ) | (0.19 | ) | (0.01 | ) | (0.12 | ) | (0.28 | ) | (0.05 | ) | (0.14 | ) | (0.11 | ) | ||||||||||||||||
| Net cash from operations before working capital changes | 919 | 2,394 | (166 | ) | (4,112 | ) | (1,849 | ) | (1,707 | ) | (1,658 | ) | 208 | |||||||||||||||||||
| (1) | Refer to Note 18 of the Condensed Consolidated Financial Statements for detail of the revision of the 2020 quarterly financial information related to the reclassification of foreign exchange differences on provisionally priced sales between revenues and other expenses. |
Quarter to quarter revenue variances are a function of metal prices, costs and production results. Production results can differ from period to period depending on geology, mining conditions, labour, and equipment availability. These in turn affect mined tonnages, grades and mill recoveries and, ultimately, the quantity of metal produced and revenues received. The Company currently expenses exploration costs, specifically, exploration costs related to Silver City, Kilgore, Evolución and Platosa (unless associated with resource expansion). These exploration costs do not relate to the mining operation and vary from period to period, creating volatility in earnings. The following is a discussion of the material variances between Q1 2021 and Q1 2020.
| Q1 2021 | Q1 2020 | |||||||
| Revenue | 9,781 | 5,561 | ||||||
| Gross Profit (Loss) | 1,838 | (1,187 | ) | |||||
| Net Loss | (2,922 | ) | (6,372 | ) | ||||
| 12 | Page |
Management’s Discussion & Analysis of Financial Results
For the three months ended March 31, 2021
Revenues increased by 76% during Q1 2021, driven by a 19% increase in silver ounces payable and a 75% increase in the average realized silver price relative to the comparative period.
Gross profit improved by $3.0 million in Q1 2021 driven by increased revenues.
Net loss decreased by $3.5 million between Q1 2021 and Q1 2020 mainly reflecting improved operating profitability.
| Cost of Sales | (7,943 | ) | (6,748 | ) |
Cost of sales in Q1 2021 is $1.2 million higher than Q1 2020, mainly reflecting $0.6 million in incremental energy costs incurred due to increase in natural gas prices following a polar-vortex in the southwestern U.S. ($0.2 million was capitalized to mine development), and the volume impact of 2% higher silver-equivalent ounces sold in Q1 2021.
| Exploration | (1,073 | ) | (373 | ) |
Increased exploration expense in Q1 2021 primarily reflects permitting activity at the Kilgore Project ($0.3 million) and increased drilling at Platosa ($0.3 million).
| Other expenses | (651 | ) | (605 | ) |
Other expenses include realized and unrealized foreign exchange gains and losses, unrealized gains and losses on marketable securities and warrants, interest income and other non-routine income or expenses, if any.
Other expenses are consistent with the prior-year quarter.
| Finance expenses | (725 | ) | (2,091 | ) |
Net finance expenses in Q1 2021 consist primarily of interest on the Convertible Debentures. The $1.4 million decrease from the comparative period mainly reflects a $1.8 million unrealized loss on the mark-to-market of currency hedges in Q1 2020.
Provisionally Priced Sales
Sales are recorded using the metal price received for sales that settle during the reporting period. For sales that have not been settled, an estimate is used, based on the expected month of settlement and the forward price of the metal at the end of the reporting period. The difference between the estimate and the final price received is recognized by adjusting sales in the period in which the sale is settled (i.e. the finalization adjustment). The finalization adjustment recorded for these sales depends on the actual price when the sale settles, which occurs in either the first, second or third month after shipment under the terms of the current concentrate purchase agreements.
| 13 | Page |
Management’s Discussion & Analysis of Financial Results
For the three months ended March 31, 2021
Invoiced revenues are derived from the value of metal content adjusted for treatment and refining charges incurred by the metallurgical complex of the customer. The terms agreed under the zinc and lead concentrate purchase agreements include price participation for settlement at metal prices above specified levels. The value of the metal content of the products sold, before treatment and refining charges, is as follows (in thousands of US dollars):
| Three months ended | ||||||||
| March 31 | March 31 | |||||||
| 2021 | 2020(2) | |||||||
| $ | $ | |||||||
| Silver | 7,572 | 4,051 | ||||||
| Lead | 1,690 | 1,205 | ||||||
| Zinc | 2,278 | 1,593 | ||||||
| Value of metal content in products sold (1) | 11,540 | 6,849 | ||||||
| Adjustment for treatment and refining charges (TC/RC) | (1,759 | ) | (1,784 | ) | ||||
| Revenues from concentrate sales | 9,781 | 5,065 | ||||||
| Revenues from toll milling services | - | 496 | ||||||
| Total revenues | 9,781 | 5,561 | ||||||
| (1) | Value of metal content in products sold is a non-IFRS measure. |
| (2) | Refer to Note 18 of the Condensed Consolidated Financial Statements for detail of the revision of the 2020 quarterly financial information related to the reclassification of foreign exchange differences on provisionally priced sales between revenues and other expenses. |
Production Cost Per Tonne, Total Cash Cost Net of By-Product Credits Per Silver Ounce Payable and All-In Sustaining Cost (AISC) Per Silver Ounce Payable are non-IFRS measures that do not have a standardized meaning. The calculation of these measures may differ from that used by other companies in the industry. The Company uses these measures internally to evaluate the underlying operating performance of the Company for the reporting periods presented. These measures should not be considered in isolation or as a substitute for measures of performance prepared in accordance with generally accepted accounting principles and are not necessarily indicative of operating expenses as determined under generally accepted accounting principles. Management believes that these measures are key performance indicators of the Company’s operational efficiency and are increasingly used across the global mining industry and are intended to provide investors with information about the cash generating capabilities of the Company’s operations.
| Q1 2021 | Q1 2020 | |||||||
| Production cost per Tonne | $ | 297 | $ | 292 | ||||
| 14 | Page |
Management’s Discussion & Analysis of Financial Results
For the three months ended March 31, 2021
The Company excludes inventory adjustments from the calculation of Production Cost per Tonne to improve period-over-period comparisons. A reconciliation between production cost per tonne (excluding depletion and amortization and inventory adjustments) and the Company’s cost of sales as reported in the Company’s financial statements is provided below.
| $ 000’s | $ 000’s | |||||||
| Cost of Sales | 7,943 | 6,748 | ||||||
| Adjustments – increase/(decrease): | ||||||||
| San Sebastián processing cost (Hecla bulk sample) | - | (234 | ) | |||||
| Depletion and amortization | (1,790 | ) | (1,269 | ) | ||||
| Inventory adjustments | 303 | 317 | ||||||
| Production Costs (excluding inventory adjustments) | 6,456 | 5,562 | ||||||
| Tonnes milled | 21,764 | 19,042 | ||||||
| Production cost per tonne milled ($/tonne) | 297 | 292 | ||||||
The 2% increase in cost per tonne milled between Q1 2021 and Q1 2020 mainly reflects the volume impact of a 14% increase in tonnes milled relative to the comparative period, and additional electricity costs of $0.6 million related to the natural-gas price spike.
| Q1 2021 | Q1 2020 | |||||||
| Total cash cost per silver ounce payable | $ | 13.43 | $ | 15.35 | ||||
The calculation of total cash cost per silver ounce payable reflects the cost of production adjusted for by-product credits and various non-cash costs included in cost of sales. Changes in inventory have not been adjusted from cost of sales, as these costs are associated with the payable silver ounces sold in the period. The Company expects total cash costs net of by-product revenues to vary from period to period as planned production and underground development access different areas of the mine with varying grades and characteristics.
The following is a reconciliation of total cash cost per silver ounce payable, net of by-product credits to cost of sales as reported in the Company’s financial statements:
| Q1 2021 | Q1 2020 | |||||||
| $ 000’s | $ 000’s | |||||||
| Cost of sales | 7,943 | 6,748 | ||||||
| Adjustments - increase/(decrease): | ||||||||
| San Sebastián processing cost (Hecla bulk sample) | - | (234 | ) | |||||
| Depletion and amortization | (1,790 | ) | (1,269 | ) | ||||
| Third party smelting and refining charges (1) | 1,759 | 1,784 | ||||||
| Royalties (2) | (23 | ) | (23 | ) | ||||
| By-product credits (3) | (3,967 | ) | (3,228 | ) | ||||
| Total cash cost net of by-product credits | 3,922 | 3,778 | ||||||
| Silver ounces payable | 291,967 | 246,062 | ||||||
| Total cash cost per silver ounce payable ($/oz) | 13.43 | 15.35 | ||||||
| (1) | Treatment and refining charges recorded in net revenues as is industry standard and added back here to derive total costs. |
| (2) | Advance royalty payments on the Miguel Auza property unrelated to production from Platosa. |
| (3) | By-product credits comprise revenues from sales of lead and zinc. |
Total cash cost per silver ounce payable decreased by 13% in Q1 2021 from Q1 2020, driven by a 19% increase in silver ounces payable and a 23% increase in by-product credits, partially offset by additional energy costs of $0.6 million as a result of the natural gas price spike noted above. Treatment and refining charges decreased by 17% on a per-ounce-basis, benefiting from renegotiated offtake agreements for 2021 and lower penalties for deleterious elements through improved mill feed blending.
| 15 | Page |
Management’s Discussion & Analysis of Financial Results
For the three months ended March 31, 2021
| Q1 2021 | Q1 2020 | |||||||
| AISC Per Silver Ounce Payable (including non-cash items) | $ | 24.34 | $ | 26.28 | ||||
Excellon reports the AISC measure to provide further transparency on the costs associated with producing silver and to assist stakeholders of the Company in assessing operating performance, its ability to generate free cash flow from current operations and overall value. The AISC measure is a non-IFRS measure based on guidance announced by the World Gold Council in June 2013.
Excellon defines AISC per silver ounce payable as the sum of total cash costs (including treatment charges and net of by-product credits), capital expenditures that are sustaining in nature, corporate general and administrative costs (including non-cash share-based compensation), capitalized and expensed exploration that is sustaining in nature, and environmental reclamation costs (non-cash), all divided by the total payable silver ounces sold during the period.
Capital expenditures to develop new operations or capital expenditures related to major projects at existing operations where these projects will materially increase production are classified as non-sustaining and are excluded. The definition of sustaining versus non-sustaining is similarly applied to capitalized and expensed exploration costs. Exploration costs to develop new operations or that relate to major projects at existing operations where these projects are expected to materially increase production are classified as non-sustaining and are excluded.
Costs excluded from AISC are non-sustaining capital expenditures and exploration costs (as described above), finance costs, tax expense, and any items that are deducted for the purposes of adjusted earnings, if any. Total sustaining costs exclude general and administrative and share-based payment expenses attributable to the Company’s non-producing projects.
The table below presents details of the calculation for AISC per silver ounce payable.
| Q1 2021 | Q1 2020 | |||||||
| $ 000’s | $ 000’s | |||||||
| Total cash costs net of by-product credits | 3,922 | 3,778 | ||||||
| General and administrative costs (cash) (1) | 1,329 | 896 | ||||||
| Share-based payments (non-cash) (1) | 684 | 127 | ||||||
| Accretion and amortization of reclamation costs (non-cash) | 39 | 45 | ||||||
| Sustaining exploration (manto resource exploration/drilling) | 62 | 70 | ||||||
| Sustaining capital expenditures (2) | 1,072 | 1,551 | ||||||
| Total sustaining costs | 3,186 | 2,689 | ||||||
| All-in sustaining costs | 7,108 | 6,467 | ||||||
| Silver ounces payable | 291,967 | 246,062 | ||||||
| AISC per silver ounce payable ($/oz) | 24.34 | 26.28 | ||||||
| AISC excluding non-cash items, per silver ounce payable ($/oz) | 21.87 | 25.58 | ||||||
| Realized silver price per ounce sold (3) | 26.32 | 15.04 | ||||||
| (1) | Total sustaining costs exclude general and administrative and share-based payment expenses attributable to the Company’s non-producing projects. The comparative has been revised to conform with the current allocation. |
| (2) | Sustaining capital expenditure includes sustaining property plant and equipment acquisitions and capitalized development costs. |
| (3) | Average realized silver price is calculated on current period sale deliveries and does not include the impact of prior-period provisional adjustments in the current period. |
| 16 | Page |
Management’s Discussion & Analysis of Financial Results
For the three months ended March 31, 2021
AISC per silver ounce payable decreased by 7% to $24.34 compared to $26.28 in the comparative period driven by a 19% increase in silver ounces payable and $0.5 million decrease in sustaining capital expenditures, partly offset by a 4% increase in total cash costs net of byproduct credits as discussed above, and a $0.4 million increase in general and administrative expenses mainly reflecting increases in insurance, investor relations costs and the timing of annual compensation expenses, while share-based payment costs increased by $0.6 million as annual grants were made in Q1 2021 versus in Q2 2020. Excluding non-cash items, the cash component of annual compensation grants and additional electricity costs associated with the polar vortex, AISC during the period was $18.67 per silver ounce payable.
COMMON SHARE DATA AS AT MAY 13, 2021
| Common shares issued and outstanding | 32,382,614 | |||
| Stock options | 1,047,437 | |||
| DSUs | 620,026 | |||
| RSUs | 800,593 | |||
| Warrants ($7.00) | 1,092,400 | |||
| Warrants ($3.30) | 302,760 | |||
| Warrants ($5.75) | 1,143,428 | |||
| Fully diluted common shares (1) | 37,389,258 |
| (1) | Conversion of all outstanding Convertible Debentures would result in the issuance of an additional 3,379,245 common shares of the Company. |
LIQUIDITY AND CAPITAL RESOURCES
The primary source of funds available to the Company is cash flow generated by the Platosa Mine and equity and debt financings. The Company has raised equity and debt to fund its exploration program and certain capital and operating expenditures at the mine. A continuous review of the Company’s capital expenditure programs ensures the Company’s capital resources are utilized in a responsible and sustainable manner to conserve cash during periods of low commodity prices and economic and market uncertainty.
| March 31, 2021 | December 31, 2020 | |||||||
| Cash and Cash Equivalents | 6,501 | 8,380 | ||||||
The Company’s cash position decreased by $1.9 million for the three months ended March 31, 2021 as a result of:
| (i) | $0.9 million generated by operations with a $1.7 million outflow on working capital, for a net use of $0.8 million for operating activities, after spending $1.1 million on exploration; |
| 17 | Page |
Management’s Discussion & Analysis of Financial Results
For the three months ended March 31, 2021
| (ii) | $0.9 million invested in capital expenditures, $0.1 million on the acquisition of mineral rights and $0.1 received pursuant to the Oakley Agreement; and | |
| (iii) | Net $0.1 million used in financing activities including interest and lease-related payments, partially offset by proceeds from stock option exercises. |
| March 31, 2021 | December 31, 2020 | |||||||
| Working Capital | 8,684 | 9,801 | ||||||
Working capital decreased by $1.1 million at March 31, 2021 relative to December 31, 2020, reflecting a decrease in current assets of $2.8 million and a decrease in current liabilities of $1.7 million, primarily reflecting a $1.4 million reduction in trade and other accounts payable.
| Q1 2021 | Q1 2020 | |||||||
| Net cash from operations before changes in working capital ($000’s) | 919 | (1,849 | ) | |||||
Net cash from operations, before changes in working capital, increased by $2.8 million in Q1 2021 versus the comparative quarter, principally reflecting higher revenues as described in the Revenue section above, partially offset by a $0.7 million increase in exploration expenses in Q1 2021.
| Q1 2021 | Q1 2020 | |||||||
| Investing Activities ($000’s) | (884 | ) | (3,384 | ) | ||||
Investing outflows in Q1 2021 were $2.5 million less than the comparative quarter, reflecting lower capital expenditures in the current quarter, including lower dewatering and associated capitalized costs due load-shedding shut-downs during the polar vortex and natural-gas price spike in February 2021.
| Financing Activities ($000’s) | (120 | ) | 5,781 |
In the comparative quarter the Company sourced $5.9 million from the Sprott Credit Facility. In Q1 2021, financing activities included interest and lease-related payments, partially offset by proceeds from stock option exercises.
The Company issued the Convertible Debentures in Q3 2020, completed an equity offering of common shares in 2019 and arranged a bridge loan (since repaid) in connection with the acquisition of Otis. The Company has also implemented cost reductions and business improvements at its operations. With continued strong metal prices, the Company expects to be able to generate positive cash flows from the Platosa mining operation through the remainder of 2021, although such cash flow may not be sufficient to fund all of the Company’s exploration activities. In the event that cash flows from operations are insufficient, failure to obtain additional financing could result in delay or indefinite postponement of further exploration and development of the Company’s projects and the possible loss of such properties. There can be no assurances that the Company will be able to obtain adequate funding or that the terms of such financing will be favourable. The Company’s ability to generate positive cash flows is also impacted by financial market conditions, most notably metal prices as the Company derives its revenues from the sale of silver, lead and zinc and bears the associated treatment and refining costs. The Company is also exposed to currency exchange risk and continued uncertainty related to the COVID-19 outbreak; please see “Business Environment & Risks” section below.
| 18 | Page |
Management’s Discussion & Analysis of Financial Results
For the three months ended March 31, 2021
Financial Instruments
All financial assets and financial liabilities, other than derivatives, are initially recognized at the fair value of consideration paid or received, net of transaction costs as appropriate, and subsequently carried at fair value or amortized cost. The carrying values of cash and cash equivalents, trade receivables and other liabilities approximate their fair value, unless otherwise noted.
The Company’s financial performance is sensitive to changes in commodity prices, foreign exchange and interest rates, and the Company may periodically consider hedging such exposure. The Company’s Board of Directors together with executive management has overall responsibility for the establishment and oversight of the Company’s risk management framework. The Company may continue to address its price-related exposure to foreign exchange through the use of options, futures, forwards and derivative contracts.
The Mexican peso (“MXN”) and the Canadian dollar (“C”) are the functional currencies of the Company, with currency exposures arising from transactions and balances in currencies other than the functional currencies.
A significant portion of the Company’s capital expenditures, operating costs, exploration, and administrative expenditures are incurred in MXN, while revenues from the sale of concentrates are denominated in US dollars (“USD”). The fluctuation of the USD in relation to the MXN consequently impacts the reported financial performance of the Company.
Commitments
The following table summarizes the Company’s significant unrecognized commitments as at March 31, 2021 (in thousands of US dollars):
| 2021 | 2022 | 2023 | 2024 | 2025 | Total | |||||||||||||||||||
| $ | $ | $ | $ | $ | $ | |||||||||||||||||||
| Exploration License (Silver City Project) - cash | 79 | 158 | - | - | - | 237 | ||||||||||||||||||
| Exploration License (Silver City Project) - shares | 335 | 492 | - | 827 | ||||||||||||||||||||
| Concession holding fees | 411 | 675 | 618 | 692 | 692 | 3,088 | ||||||||||||||||||
| 825 | 1,325 | 618 | 692 | 692 | 4,152 | |||||||||||||||||||
Not included in the table above is a net smelter return (“NSR”) royalty payable semi-annually on the Platosa property of (a) 1.25% in respect of manto mineralization other than skarn mineralization or (b) 0.5% in respect of skarn or “Source” mineralization. Such payments vary period to period based on production results and commodity prices.
| 19 | Page |
Management’s Discussion & Analysis of Financial Results
For the three months ended March 31, 2021
Contingencies
Contingencies can be either possible assets or possible liabilities arising from past events which, by their nature, will only be resolved when one or more future events not within the Company’s control occur or fail to occur. The assessment of such contingencies inherently involves the exercise of significant judgment and estimates of the outcome of future events. In assessing loss contingencies related to legal proceedings that are pending against the Company or unasserted claims that may result in such proceedings or regulatory or government actions that may negatively impact our business or operations, the Company with assistance from its legal counsel evaluates the perceived merits of any legal proceedings or unasserted claims or actions.
Platosa surface rights
A subsidiary of the Company appealed a 2018 judgment revoking its 2007 purchase of approximately 295 hectares of surface rights north of the Platosa mine, which was denied by an appeals court in Mexico during Q3 2020. The judgment nullifies the purchase and orders that the land be returned to the plaintiffs, and that the plaintiffs repay the original purchase price to the Company’s subsidiary.
The Company does not consider the land material to its mining operation or exploration activities. The decision does not affect Excellon’s mineral rights and the Company does not expect it to have any impact on its operations.
The plaintiffs also alleged at trial, for the first time, that the Platosa mine site was on land that was included in the sale. This assertion was not decided in the litigation, was not supported by admissible evidence, contradicts the cadastral registry, conflicts with the rights of other third-party holders and ignores the fact that the Company began its use and occupation of the mine site in 2004 – before the sale in question.
Under Mexican law, Excellon’s access to the mine cannot be impeded. Nevertheless, the Company is considering a variety of legal avenues to redress the ruling. For additional discussion, the reader should refer to the “Risk Factors – Surface Rights and Access”, “Risk Factors – Legal Proceedings” and “Risk Factors – Enforcement of Legal Rights” sections of the Company’s Annual Information Form for the year ended December 31, 2020.
Miguel Auza Antigua concession agreement
The Company is defending various legal claims including one against a subsidiary of the Company which is party to an action by a claimant in respect of damages under a property agreement regarding a non-material mineral concession within the Evolución Project. The concession is subject to an exploration and exploitation agreement with purchase option (the “Antigua Agreement”) dated December 3, 2006 between San Pedro Resources SA de CV (“San Pedro”, now a subsidiary of Excellon) and the owner (the “Plaintiff”) that provides, among other things, for a minimum payment of $2,500 plus value added tax per month and the payment of a 3% NSR. San Pedro has the right to purchase absolute title to La Antigua including the NSR upon payment of $500,000. San Pedro was under no contractual obligation to put the mine into production and has not done so. The Plaintiff was awarded damages in the court of first instance in Torreón, Coahuila. Both San Pedro and the Plaintiff appealed the decision to the Second District State Court in the Judicial District of Torreón. That Court confirmed the initial decision but, subsequently, pursuant to an order obtained by the Plaintiff, granted the Plaintiff an award of damages multiple times greater than any income the applicable NSR could produce even in the event of commercial production. San Pedro is appealing this decision to the federal courts of Mexico and believes that the decision is without merit and not supported by the evidence, facts or law. The Company expects the decision in respect of damages is remote and will be reversed and rationalized in the federal court system. There is currently no impact to the operation of the business.
Refer to the Company’s AIF for further information.
| 20 | Page |
Management’s Discussion & Analysis of Financial Results
For the three months ended March 31, 2021
Off-Balance Sheet Arrangements
The Company does not have any off-balance sheet arrangements.
ACCOUNTING POLICIES AND INTERNAL CONTROLS
Disclosure Controls & Procedures and Internal Control Over Financial Reporting
Disclosure controls and procedures (“DC&P”) are designed to provide reasonable assurance that all relevant information is gathered and reported to management, including the President & CEO and CFO, on a timely basis so that appropriate decisions can be made regarding public disclosure.
Internal control over financial reporting (“ICFR”) means a process designed by or under the supervision of the President & CEO and CFO, management and other personnel to provide reasonable assurance regarding the reliability of financial reporting and the preparation of financial statements for external purposes in accordance with IFRS.
The internal controls are not expected to prevent and detect all misstatements due to error or fraud.
As at March 31, 2021, the Corporation’s President & CEO and CFO have certified that the DC&P are effective and that during the quarter ended March 31, 2021, the Company did not make any material changes in the ICFR that materially affected or are reasonably likely to materially affect the Company’s ICFR.
Accounting policy, estimates and judgments
Accounting standards issued but not yet effective
The Company has not early adopted any standard, interpretation or amendment that has been issued but is not yet effective.
Significant accounting estimates and judgements
The Company’s significant accounting policies are described in Note 4 to the consolidated financial statements for the year ended December 31, 2020. The preparation of the consolidated financial statements require management to make estimates and assumptions that affect the reported amounts of assets and liabilities in the consolidated financial statements and reported amounts of expenses during the reporting period. Such estimates and assumptions affect the carrying value of assets and are based on historical experience and other factors considered relevant. The estimates and underlying assumptions are reviewed on an ongoing basis. Revisions to accounting estimates are recognized in the period in which the estimates are revised. For details of these estimates, assumptions and judgements, please refer to the Company’s consolidated financial statements for the year ended December 31, 2020, which are available on the Company’s website and on SEDAR.
| 21 | Page |
Management’s Discussion & Analysis of Financial Results
For the three months ended March 31, 2021
BUSINESS ENVIRONMENT AND RISKS
Risks and uncertainties
The Company’s business entails exposure to certain risks, including but not limited to: metal price risk since the Company derives its revenues from the sale of silver, lead and zinc; foreign exchange risk since the Company reports in United States dollars but operates in jurisdictions that use other currencies; the inherent risk of uncertainties in estimating Mineral Resources; political risk associated with operating in foreign jurisdictions; environmental risks; surface rights and access; enforcement of legal rights; and risks associated with labour relations issues. The current or future operations of Excellon including ongoing commercial production are or will be governed by and subject to federal, state and municipal laws and regulations regarding mineral taxation, mineral royalties and other governmental charges. Any change to the mineral taxation and royalty regimes in the jurisdictions in which Excellon operates or plans to operate could have an adverse financial impact on the Company’s current and planned operations and the overall financial results of the Company, the extent of which cannot be predicted. For additional discussion of risk factors (including a discussion of COVID-19 related risks) please refer to the Company’s AIF for the year ended December 31, 2020 which is on the Company’s website www.excellonresources.com and on www.sedar.com.
ADDITIONAL SOURCES OF INFORMATION
Additional disclosures pertaining to the Company, including its most recent Annual Information Form, audited and unaudited interim financial statements, management information circular, material change reports, press releases and other information, are available on the SEDAR website at www.sedar.com or on the Company’s website at www.excellonresources.com.
| 22 | Page |
Management’s Discussion & Analysis of Financial Results
For the three months ended March 31, 2021
CAUTIONARY STATEMENT REGARDING FORWARD-LOOKING STATEMENTS AND INFORMATION
This MD&A contains “forward-looking statements” within the meaning of applicable Canadian securities legislation and applicable U.S. securities laws. Except for statements of historical fact relating to the Company, such forward-looking statements include, without limitation, statements regarding the impact of the COVID-19 pandemic on the Company’s operations and results, the future results of operations, performance and achievements of the Company, including potential property acquisitions, the timing, content, cost and results of proposed work programs, the discovery and delineation of mineral deposits/resources/reserves, geological interpretations, the potential of the Company’s properties, proposed production rates, potential mineral recovery processes and rates, business plans and future operating revenues. Forward-looking statements are made based on management’s beliefs, estimates, assumptions and opinions on the date the statements are made. Although the Company believes that such statements are reasonable, it can give no assurance that such expectations will prove to be correct and the Company undertakes no obligation to update forward-looking statements. Forward-looking statements are typically identified by words such as: believes, expects, anticipates, intends, estimates, targets, plans, postulates, and similar expressions, or are those which, by their nature, refer to future events. The Company cautions investors that any forward-looking statements by the Company are not guarantees of future results or performance, and that actual results may differ materially from those in forward-looking statements as a result of various risk factors, including, but not limited to, the ability of the Company to maintain normal operations during the COVID-19 pandemic, variations in the nature, quality and quantity of any mineral deposits that may be located, significant downward variations in the market price of any minerals produced (particularly silver), the Company’s inability to obtain any necessary permits, consents or authorizations required for its activities, to produce minerals from its properties successfully or profitably, to continue its projected growth, to raise the necessary capital or to be fully able to implement its business strategies. A description of the risk factors applicable to the Company can be found in its AIF under “Description of the Business – Risk Factors.” All of the Company’s public disclosure filings may be accessed via www.sedar.com and readers are urged to review these materials, including the technical reports filed with respect to the Company’s mineral properties. This document is not to be construed in any way as, an offer to buy or sell securities in the United States.
Cautionary Note to United States Investors Concerning Estimates of Measured, Indicated and Inferred Resources
The terms “Measured,” “Indicated” and “Inferred” Mineral Resources used or referenced in this MD&A comply with reporting standards in Canada and are made in accordance with Canadian National Instrument 43-101 – Standards of Disclosure for Mineral Projects (“NI 43-101”) under the guidelines set out in the Canadian Institute of Mining, Metallurgy and Petroleum (the “CIM”) Standards on Mineral Resources and Mineral Reserves. NI 43-101 is a rule developed by the Canadian Securities Administrators that establishes standards for all public disclosure an issuer makes of scientific and technical information concerning mineral projects. These standards differ significantly from the requirements of the United States Securities and Exchange Commission (the “SEC”) applicable to domestic United States reporting companies. Accordingly, information included in this MD&A that describes the Company’s mineral resources estimates may not be comparable with information made public by United States companies subject to the SEC’s reporting and disclosure requirements.
Cautionary Note to United States Investors regarding Adjacent or Similar Properties
This MD&A may also contain information with respect to adjacent or similar mineral properties in respect of which the Company has no interest or rights to explore or mine. The Company advises United States investors that the United States Securities and Exchange Commission’s mining guidelines strictly prohibit information of this type in documents filed with the SEC. Readers are cautioned that the Company has no interest in or right to acquire any interest in any such properties, and that mineral deposits on adjacent or similar properties are not indicative of mineral deposits on the company’s properties.
| 23 | Page |