Exhibit 99.2

Management’s Discussion & Analysis of Financial Results
For the three months ended March 31, 2022
Excellon Resources Inc. (the “Company” or “Excellon”) has prepared this Management’s Discussion and Analysis of Financial Results (“MD&A”) for the three months ended March 31, 2022 in accordance with the requirements of National Instrument 51-102 (“NI 51-102”).
This MD&A contains information as at May 16, 2022 and provides information on the operations of the Company for the three months ended March 31, 2022 and 2021 and subsequent to the period end, and should be read in conjunction with the audited consolidated financial statements for the three months ended March 31, 2022 (“Condensed Consolidated Financial Statements”) and the audited consolidated financial statements for the year ended December 31, 2021 which have been filed on SEDAR and EDGAR. The audited consolidated financial statements for the year ended December 31, 2021 have been prepared in accordance with International Financial Reporting Standards (“IFRS”) as issued by the International Accounting Standards Board (“IASB”). All figures in this MD&A are in thousands of United States dollars ($’000) unless otherwise noted.
This MD&A also refers to Adjusted loss, Adjusted loss per share, Production Cost per Tonne, Cash Cost per Silver Ounce Payable, and All-in Sustaining Cost (“AISC”) per Silver Ounce Payable, all of which are Non-IFRS measures. Refer to the “Financial Review” and “Non-IFRS measures” sections of this MD&A for an explanation of these measures and reconciliation to the Company’s reported financial results.
Management’s Discussion & Analysis of Financial Results
For the three months ended March 31, 2022
1 | Page |
Management’s Discussion & Analysis of Financial Results
For the three months ended March 31, 2022
BUSINESS AND STRATEGIC PRIORITIES
Excellon’s vision is to create wealth by realizing strategic opportunities through discipline and innovation for the benefit of the Company’s employees, communities and shareholders. The Company is advancing a precious metals growth pipeline that includes: Platosa, a high-grade silver mine producing in Mexico since in 2005; Kilgore, an advanced gold exploration project in Idaho with strong economics and significant growth and discovery potential; and an option on Silver City, a high-grade epithermal silver district in Saxony, Germany with 750 years of mining history and no modern exploration. The Company also aims to continue capitalizing on current market conditions by acquiring undervalued projects.
The common shares of Excellon trade on the Toronto Stock Exchange (the “TSX”), the NYSE American, LLC exchange (the “NYSE American”) under the symbol “EXN” and on the Frankfurt Stock Exchange under the symbol “E4X2”.
Exploration Activities
The Company advanced its exploration programs in the United States, Mexico and Germany including:
| ● | Continued drilling of priority targets at Grauer Wolf on the Bräunsdorf claim block with the completion of three additional holes for 1,223 meters and successfully extended the footprint of mineralized structures of the Grauer Wolf target. |
| ● | Reported the results of the 2021 Silver City drilling program which intersected significant silver mineralization at four targets, including: |
| ○ | 1,633 g/t AgEq over 0.35 metres (1,470 g/t Ag, 0.2 g/t Au, 2.9% Pb and 2.1% Zn) within 257 g/t AgEq over 2.90 metres (232 g/t Ag, 0.4% Pb and 0.3% Zn) in SC21GVB020 at Peter Vein | |
| ○ | 1,296 g/t AgEq over 0.35 metres (1,260 g/t Ag, 0.2 g/t Au, 0.6% Pb and 0.3% Zn) within 592 g/t AgEq over 1.05 metres (508 g/t Ag, 0.1 g/t Au, 1.4% Pb and 1.2% Zn) in SC21GWO033 at Grauer Wolf | |
| ○ | 266 g/t AgEq over 0.65 metres (228 g/t Ag, 0.1 g/t Au, 0.7% Pb and 0.5 % Zn) within 169 g/t AgEq over 1.93 metres (137 g/t AgEq, 0.3% Pb and 0.6% Zn) in SC21GWO030 at Grauer Wolf | |
| ○ | 383 g/t AgEq over 0.38 metres (7.0 g/t Ag and 5.0 g/t Au) in SC21REI027 at Reichenbach |
| ● | Additional drilling at Platosa to define and expand mineralization of remnant ore in areas previously considered mined-out including: underground mapping, chip sampling, modelling and underground drilling at Guadalupe, Guadalupe Sur and Rodilla. |
| ● | Completed underground drilling of 36 holes covering 1,747 meters at the Platosa Mine. |
| ● | Performed interpretation of screen metallics assays on historical Kilgore core to assess coarse gold distribution in various lithologies and optimization of assay techniques for the upcoming 2022 drill program. |
| ● | Compiled and reviewed historical geophysical surveys at Kilgore to delineate a 2022 3D Induced Polarity and Magnetotelluric survey. |
Labour Action
On March 7, 2022 the Company reported that the Sindicato Nacional Minero Metalúrgico (the “Platosa Union”) commenced a labour action at the Platosa Mine in Durango, Mexico (the “Labour Action”). Despite an agreement in principle on the terms of the 2022 collective bargaining arrangement following numerous concessions, the agreement was reneged on, and despite additional concessions, a labour action was ordered. As a result, production was negligible, and no ore was processed by the Miguel Azua mill in the month of March. On April 1, 2022 the labour action was resolved and Platosa returned to full operation in April.
2 | Page |
Management’s Discussion & Analysis of Financial Results
For the three months ended March 31, 2022
Mexican Operations
On January 5, 2022, the Company announced that it was assessing the economic viability of mining at Platosa at achievable dewatering rates and with acceptable capital expenditures, beyond mid-2022. The mineral resources remaining beyond mid-2022 steepen significantly, with fewer vertical-tonnes-per-metre than historically encountered.
Intense definition and infill drill programs initiated in 2021 to define the mine life wound down in the first quarter of 2022. The program did not identify sufficient mineralization in the gap zone however minable tonnage was identified in remnant areas of the mine above the water levels. The mine plan has currently been defined into Q3 2022. Continued in-stope analysis is being conducted to assure all profitable tonnage above the water level will be extracted in 2022. The majority of mineable mineralization included in the 2022 plan is from remnant areas, pillar recoveries and remaining stopes in the section lower in the mine. The Company expects to wind down operations at Platosa during Q3 2022.
In Q1 2022, Miguel Auza recoveries for lead and silver were below plan as feed grades were 4% lower than Q1 2021 and a higher lead oxide ratio was encountered due to less stope tonnage deeper in the mine and pillar recovery offering fewer blending opportunities. Zinc recoveries continued to be strong in Q1 2022 compared to Q1 2021, mainly as a result of improvements made to the plant in 2021 and close supervision of grinding and reagent additions.
Provision for litigation
The Company recorded a $22.2 million provision in Q3 2021 as required under IFRS’s International Accounting Standard 37 – Provisions, Contingent Liabilities and Contingent Assets, since receiving the formal written decision regarding the litigation involving the Company’s subsidiary, San Pedro Resources (“San Pedro”), in respect of the La Antigua mineral concession (“La Antigua”) as announced on August 10, 2021 (the “Judgment”). The Company believes the decision is without merit and not supported by the evidence, facts or law. The Judgment is solely against San Pedro and the Company believes that the plaintiff has no recourse against the Company’s other assets in Mexico (including Platosa), Idaho, Saxony or Canada. San Pedro is a wholly-owned, indirect subsidiary of the Company that holds the Miguel Auza processing facility and the original Miguel Auza mineral concessions, including the Evolución mineral resource disclosed in September 2020. The book value of San Pedro’s assets included in the consolidated balance sheet after impairment is $2.5 million, including plant, property and equipment ($0.8 million), VAT recoverable ($1.3 million) and materials, supplies and other ($0.4 million).
3 | Page |
Management’s Discussion & Analysis of Financial Results
For the three months ended March 31, 2022
The Company continues to pursue avenues through its labour, community and government relationships and is investigating remedies under international law. In the interim, San Pedro continues to operate in the ordinary course. San Pedro generates minimal cash flows from milling fees charged to the Platosa Mine for ore processing and holds minimal working capital. The Platosa Mine is owned and operated by an entirely separate subsidiary.
Exploration plans
At Silver City, three holes totaling 1,223 metres were drilled by the end of Q1 2022, this drilling followed-up on mineralization intersected at Grauer Wolf target area. Drilling assay results are expected in Q2 2022 with drilling to resume in Q3 2022. Orientation soil sampling surveys will resume in Q2 2022 testing different sampling techniques and analytical methods.
At Platosa, assessment of remnant mineralization above the water table in areas previously considered mined out is ongoing. The Company aims to define potential near-term mineable volumes of mineralization.
At Kilgore, drilling plans include 5,000 metres of diamond drilling commencing in Q3 2022 as well as a 3D Induced Polarity (IP) and Magnetotelluric (MT) survey. Near-deposit investigation and imaging through combined 3D IP and MT surveying is expected to generate a deposit profile as well as investigate structural features associated with gold emplacement. Geophysical imaging of the near-deposit area will be generative for target identification and sub-surface exploration over high priority areas which have been considered for drilling. Two orientation soil sample profiles are planned over Kilgore deposit and adjacent areas, which will utilize Mobile Metal Ion (MMI), Spatiotemporal Geochemical Hydrocarbons (SGH), and a traditional acidic digestion ICP-MS methods. The orientation line will test the ability of the various soil sampling techniques to detect mineralization overlain by colluvium and/or barren sinter cap.
Regional exploration programs, including geophysics, mapping, prospecting, soil geochemistry and modelling, are planned for Kilgore and the new exploration licences at Silver City (Mohorn, Oederan and Frauenstein), and will be carried out in H1 2022.
Exploration also continues at the Oakley project, subject to the option agreement between Excellon and Centerra Gold Inc. (“Centerra”).
4 | Page |
Management’s Discussion & Analysis of Financial Results
For the three months ended March 31, 2022
OPERATIONAL REVIEW
Production was negligible for the month of March 2022 due to the Labour Action.
Platosa Mine production statistics for the periods indicated are as follows:
| Q1 2022(1) | Q1 2021(1) | |||||||
| Tonnes Mined: | 14,955 | 21,212 | ||||||
| Tonnes Milled: | 14,585 | 21,764 | ||||||
| Grades: | ||||||||
| Silver (g/t) | 504 | 524 | ||||||
| Lead (%) | 5.27 | 5.35 | ||||||
| Zinc (%) | 6.67 | 6.73 | ||||||
| Recoveries: | ||||||||
| Silver (%) | 88.5 | 89.7 | ||||||
| Lead (%) | 72.1 | 81.8 | ||||||
| Zinc (%) | 80.0 | 74.7 | ||||||
| Metal Production: | ||||||||
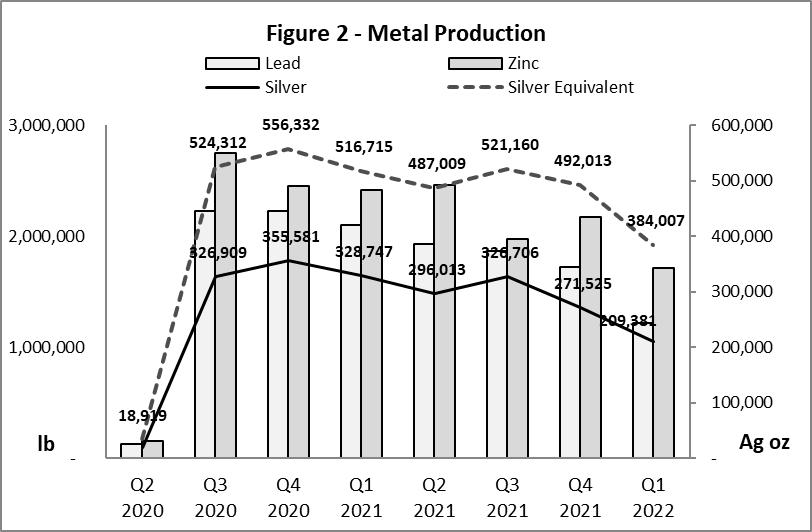
| Silver – (oz) | 209,381 | 328,747 | ||||||
| Lead – (lb) | 1,219,459 | 2,099,741 | ||||||
| Zinc – (lb) | 1,715,519 | 2,412,458 | ||||||
| Silver equivalent (oz) (2) | 384,007 | 516,715 | ||||||
| Payable: (3) | ||||||||
| Silver – (oz) | 186,407 | 291,967 | ||||||
| Lead – (lb) | 1,129,553 | 1,859,932 | ||||||
| Zinc – (lb) | 1,551,092 | 1,802,430 | ||||||
| Silver equivalent (oz) (2) | 345,502 | 442,582 | ||||||
| Average realized prices: (4) | ||||||||
| Silver – ($US/oz) | 23.71 | 26.32 | ||||||
| Lead – ($US/lb) | 1.06 | 0.92 | ||||||
| Zinc – ($US/lb) | 1.66 | 1.25 | ||||||
| Production cost per tonne (5) | $ | 373 | $ | 297 | ||||
| Total cash cost per silver ounce payable | $ | 10.49 | $ | 13.43 | ||||
| AISC per silver ounce payable (6) | $ | 18.92 | $ | 24.67 | ||||
| (1) | Period deliveries remain subject to assay and price adjustments on final settlement with concentrate purchaser. Data has been adjusted to reflect final assay and price adjustments for prior-period deliveries settled during the period. | |
| (2) | AgEq ounces established using average realized metal prices during the respective period applied to the recovered metal content of the concentrates to calculate the revenue contribution of base metal sales during the period. | |
| (3) | Payable metal is based on the metals delivered and sold during the period, net of payable deductions under the Company’s offtake arrangements, and will therefore differ from produced ounces. | |
| (4) | Average realized price is calculated on current period sale deliveries and does not include the impact of prior period provisional adjustments in the period. | |
| (5) | Production cost per tonne includes mining and milling costs, excluding depletion and amortization, and inventory adjustments. | |
| (6) | AISC per silver ounce payable excludes general and administrative and share-based payment costs attributable to the Company’s non-producing projects and includes underground drilling costs. The comparatives have been revised to conform with the current allocation. |
5 | Page |
Management’s Discussion & Analysis of Financial Results
For the three months ended March 31, 2022
Operational highlights
| ● | The Labour Action eliminated production for the month of March 2022 – a third of the quarter |
| ● | AgEq production decreased 26% to 384,007 oz (Q1 2021 – 516,715 AgEq oz) |
| ● | AgEq ounces payable sold decreased 22% to 345,502 AgEq ozs (Q1 2021 – 442,582 AgEq ozs) |
| ● | Production cost per tonne increased 26% to $373 per tonne (Q1 2021 – $297 per tonne) |
| ● | Total cash cost net of by-products per silver ounce payable decreased 22% to $10.49 (Q1 2021 – $13.43) |
| ● | AISC per silver ounce payable decreased 23% to $18.92 (Q1 2021 – $24.67) |
Impact of COVID-19 on the Company’s Business and Operations
The Company’s business and operations were significantly impact by COVID-19 in 2020, including a temporary suspension of mining, milling and exploration activities at its Mexican operations in Q2 2020 (the “Suspension”). In 2021 and Q1 2022, none of the Company’s projects were suspended or significantly restricted due to COVID-19.
The Company has taken action to prevent the spread of COVID-19 at its sites and protect its employees, contractors and the communities in which it operates. The Company’s actions have been successful to date and the pandemic has not had any material impact on production or shipment of concentrate since the Suspension in Q2 2020. The Company is continually modifying its response to the pandemic to align with industry best practices. Government vaccination programs for COVID-19 are available in all regions in which the Company operates. Vaccination programs are progressing well in Mexico, with 100% of the Company’s workforce double-vaccinated and 94% triple-vaccinated.
There remain significant uncertainties with respect to future developments and their impact on the Company related to the COVID-19 pandemic, including the duration, severity and scope of the outbreak and any current or further measures taken by governments, the Company and others in response to the pandemic. The Company continues to monitor the situation and has personnel and operating contingency plans in place to manage daily operations.
Operations commentary
Mine activity in Q1 2022 focused on remnant development and extraction, pillar recovery and continued mining of stopes lower in the mine. The stopes are expected to be fully mined by mid-year with the mine plan continuing into Q3 2022 with the extraction of additional remnants and pillars. Wind down activities will commence in Q2 to minimize the work required in Q3 and Q4 2022.
Mill feed grades were lower in Q1 2022 versus Q1 2021 mainly reflecting grade variations in the mantos mineralized body and the remnant and pillar recovery mining lacking flexibility in the mine planning. The feed to the processing facility was high in lead-to-lead oxide ratio leading to lower lead and silver recoveries in Q1 2022.
Metal production in Q1 2022 was below Q1 2021 mainly due to the Labour Action in March 2022. Ore stockpiles at March 31, 2022 comprised 2,486 tonnes of mineralized material, reflecting unprocessed and unsold production of approximately 46,102 AgEq ounces.
6 | Page |
Management’s Discussion & Analysis of Financial Results
For the three months ended March 31, 2022
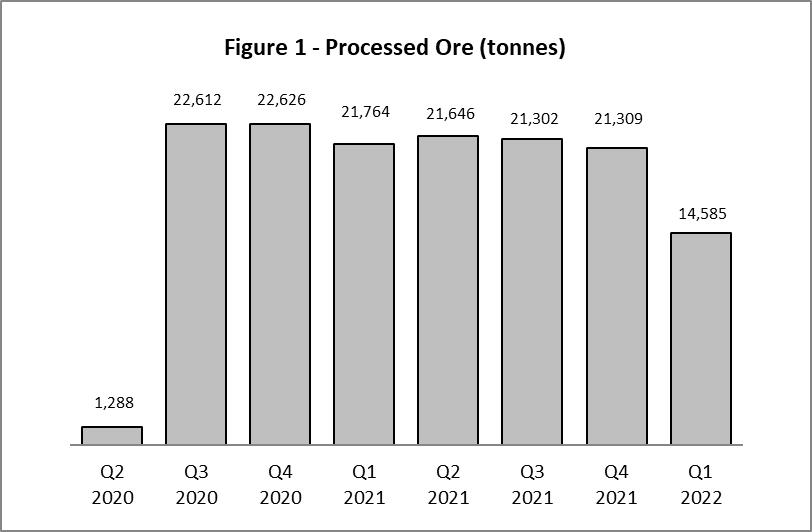
The previous eight quarters of production at Platosa are summarized below:
7 | Page |
Management’s Discussion & Analysis of Financial Results
For the three months ended March 31, 2022
Analysis of the Platosa Mine operating results is as follows:
| Q1 | ||||||||
| 2022 | 2021 | |||||||
| Mill feed processed | 14,585 | 21,764 | ||||||
Production in Q1 2022 was 14,585 tonnes, 29% lower than the same quarter in 2021. January and February 2022 production was consistent with 2021 production at over 7,000 tonnes per month, with no tonnage delivered to Miguel Azua for processing in March 2022 as a result of the Labour Action at the Platosa Mine.
Head grades | Ag (g/t) | 504 | 524 | |||||||
| Pb (%) | 5.27 | 5.35 | ||||||||
| Zn (%) | 6.67 | 6.73 |
Silver grades in Q1 2022 were 4% lower than the comparative period due to the mining of remnant and pillar recoveries and hence less mining of stopes in the current period, as well as variability in the mineralization of stopes mined. Lead and zinc grades were consistent with Q1 2021.
| Recoveries | Ag (%) | 88.5 | 89.7 | |||||||
| Pb (%) | 72.1 | 81.8 | ||||||||
| Zn (%) | 80.0 | 74.7 |
Recoveries of lead and silver were lower than Q1 2021 due to lower feed grades and high lead oxide ratios. Zinc recoveries were higher than Q1 2021 following the rebuild of the flotation cells and modifications to reagent schemes in mid-2021.
| Metal Production | Ag (oz) | 209,381 | 328,747 | |||||||
| Pb (lb) | 1,219,459 | 2,099,741 | ||||||||
| Zn (lb) | 1,715,519 | 2,412,458 | ||||||||
| AgEq (oz) | 384,007 | 516,715 |
Silver, lead, zinc and AgEq production decreased by 36%, 42%, 29% and 26%, respectively, relative to Q1 2021, mainly driven by lower production as a result of the Labour Action, lower silver grades and lead recoveries.
EXPLORATION AND EVALUATION REVIEW
Refer to the Company’s Annual Information Form (“AIF”) for a detailed overview of the Company’s exploration projects, including mineral resource estimates.
Platosa Property
The Platosa Mine is an operating underground polymetallic (silver, lead and zinc) mine, located in northeastern Durango State, Mexico. It is located approximately 5 kilometres north of the town of Bermejillo and 45 kilometres north of the city of Torreón. The deposit consists of a series of high-grade carbonate-replacement deposits (CRD) occurring as mantos. Excellon operates and owns 100% of the Platosa Mine through its wholly owned subsidiary, Minera Excellon de Mexico S.A. de C.V.
8 | Page |
Management’s Discussion & Analysis of Financial Results
For the three months ended March 31, 2022
The Company continued exploration on the Platosa property in 2022. A district-scale sampling for stable carbon and oxygen isotopes was concluded in Q1 2022. The primary objective of this program is to develop vectors to identify proximal domains within the epithermal system. Core and surface samples were collected from the Platosa deposit, Jaboncillo and other targets. A total of 137 samples were collected and sent to the Isotope facility at Queen’s University, in Kingston, Ontario during Q1 2022. The stable isotope studies are expected to define exploration vectors at the Jaboncillo target, approximately 11 kilometres northwest of the Platosa Mine where 39 drill holes were completed from 2019 to 2021 totalling 16,720 meters intersecting multiple gossanous horizons with pyritic breccias, arsenopyrite and relict base-metal sulphides. Petrographic studies conducted in Q2 2020 confirmed the presence of base-metal sulphide species, including sphalerite and galena. These observations confirm that the system is productive for base-metal sulphides on multiple structures over an approximate strike length of one kilometre. Stable isotopes ratios could point exploration efforts to core of the Jaboncillo hydrothermal system which has the potential to contain economic silver base metals mineralization.
Drilling on a skarn target at PDN, approximately two kilometres north of the Platosa Mine, was undertaken in Q1 2021 with one drillhole totaling 600 metres. Drilling targeted areas where intense dolomitization and sanding along structures was intersected in preliminary drill holes, indicating the movement of hydrothermal fluids that are believed to be the expression of a potential skarn system at depth. Drilling in Q4 2020 intersected silver grades of 218 g/t Ag over 0.75 meters. This potential for a skarn body at PDN has been defined through induced polarization, magnetics and gravity surveys.
During Q1 2022 the Company incurred costs of $282 on the Platosa project including exploration work of $231 and concession holding costs of $51.
Evolución Project
The Evolución Project is an exploration-stage project comprising 22 mineral concessions totaling 45,000 hectares, and 35 kilometres of strike in one of the world’s premier silver districts. It is an intermediate stage polymetallic silver-zinc-lead-gold exploration project on the border of northern Zacatecas and southern Durango, on the high plateau of central Mexico.
The Company’s overall goals on the project are to (i) discover Fresnillo-style epithermal mineralization and subsequently define mineral resources thereon; and (ii) continue growing the existing Evolución mineral resource in advance of an economic study of the deposit in due course. In 2021, the Company completed detailed mapping at 1:1000 scale across the entire licence. Data collected in the field relating to the structural setting and associated mineralization in the Evolución licence are being compiled and evaluated by a PhD candidate. This work will contribute to understanding the potential scale and timing of mineralization on the project. During Q1 2022 the Company incurred costs of $125 on the Evolución project including exploration work of $40 and concession holding costs of $85.
Silver City Project
The Silver City Project is an exploration-stage project that comprises the Bräunsdorf, Frauenstein, Mohorn and Oederan exploration licences in Saxony, Germany and totals approximately 340 km2. In Q3 2019, the Company entered into an agreement with Globex Mining Enterprises Inc. to earn into an option to acquire a 100% interest in the Bräunsdorf exploration licence (the “Globex Agreement”). The terms of the Globex Agreement are described in the Company’s AIF. The Bräunsdorf licence is a 164 km2 silver district that encompasses a 36-km long epithermal vein system situated west of the city of Freiberg (30 km southwest of Dresden). The immediate exploration licence and surrounding area have a long and rich history of silver mining dating back to the 11th century with numerous historic mine camps, small mines and prospects, many of which have only been explored and/or mined to shallow depths, seldom exceeding 200 metres below surface. Historically reported veins ranged from 0.5 to 10 metres width, with grades of over 3,500 g/t silver and no assaying for either gold or zinc, which were not historically available.
9 | Page |
Management’s Discussion & Analysis of Financial Results
For the three months ended March 31, 2022
Based on initial drilling results at the Bräunsdorf licence, the Company expanded the Silver City Project ground position in Q1 2021 to 34,150 hectares through the application for three additional permits (Frauenstein, Mohorn and Oederan). The concessions were granted following applications to the Sächsisches Oberbergamt (the “Saxon Mining Authority”) in Freiberg and are held by the Company’s subsidiary, Saxony Silver Corp. As in the case of the Bräunsdorf licences, historical records of these licences document centuries of high-grade silver production to shallow depths, with recent confirmation samples assaying multi-kilo silver and significant gold. The licences are early-stage and initial exploration efforts started in 2021 in preparation for more advanced exploration work and potential drilling in 2022.
The Company’s near-term exploration goals at Silver City are to (i) confirm the strike and plunge of historical mine workings and (ii) identify new mineralized bodies that were not historically discovered and exploited. With initial drilling success, the Company aims to define economic mineral resources on the project and advance them toward permitting and development. At the current stage and with the current information available, the cost and timeframe to do so is not ascertainable.
In Q2 2021, the 2021 Drilling Operation Plan (“DOP”) was approved and the Company was permitted to drill up to 22,000 metres on the Bräunsdorf licence up to March 31, 2022. Drilling commenced in late Q2 2021 with two drill rigs. During 2021 the Company drilled 24 holes totalling 8,360 metres, with the first drill core submitted to the laboratory in early Q3, 2021. An additional three holes totalling 1,223 metres were completed in Q1 2022.
For 2022, individual DOPs for each concession were submitted to the relevant mining authority in March and early April 2022. The Company applied for total 36,400 metres of drilling including the Bräunsdorf (23,000 metres, 66 drillholes), Frauenstein (7,650 metres, 24 drillholes), Mohorn (3,250 metres, 10 drillholes), and Oederan (2,500 metres, 8 drillholes) licenses. The DOP applications are currently being reviewed by the mining authority and the approvals are expected by the end of May 2022.
Drilling in 2021 and 2022 followed up on results from the initial, 16-hole diamond drilling program completed in 2020 totaling 3,687 metres. The 2021 DOP contemplated drilling on four priority follow-up targets identified in the 2020 program including:
| ● | Peter Vein: a historically significant mine where initial drilling encountered 1,042 g/t AgEq over 0.45 metres (911 g/t Ag, 0.4 g/t Au, 2.8% Pb and 0.9% Zn), within 231 g/t AgEq over 2.30 metres (183 g/t Ag, 0.4 g/t Au, 0.5% Pb and 0.2% Zn) |
| ● | Reichenbach (Großvoigtsberg): a new, near-surface discovery in an area with minimal historic mining, where initial drilling encountered 505 g/t AgEq over 0.71 metres (356 g/t Ag, 2.0 g/t Au), within 191 g/t AgEq over 1.90 metres (134 g/t Ag and 0.8 g/t Au) |
| ● | Bräunsdorf: a historically significant mine, where initial drilling encountered 319 g/t AgEq over 0.35 metres (300 g/t Ag, 0.2 g/t Au and 0.2% Zn), within 101 g/t AgEq over 2.05 metres (87 g/t Ag, 0.2 g/t Au) |
| ● | Grauer Wolf: a new high-grade discovery in an area with no historic drilling, where initial drilling encountered 1,043 g/t AgEq over 1.3 metres (954 g/t Ag, 0.1 g/t Au, 0.7% Pb and 2.0% Zn) less than 100 metres from surface, within 194 g/t AgEq over 8.1 metres (173 g/t Ag, 0.1 g/t, Au, 0.4% Pb and 0.3% Zn), and 331 g/t AgEq over 1.2 metres (325 g/t Ag, 0.1 g/t Au, 0.03% Pb and 0.03% Zn) in the hanging wall |
10 | Page |
Management’s Discussion & Analysis of Financial Results
For the three months ended March 31, 2022
The results of the 2021 drill program at Silver City include:
| ● | 1,633 g/t AgEq over 0.35 metres (1,470 g/t Ag, 0.2 g/t Au, 2.9% Pb and 2.1% Zn) within 257 g/t AgEq over 2.90 metres (232 g/t Ag, 0.4% Pb and 0.3% Zn) in SC21GVB020 at Peter Vein |
| ● | 1,296 g/t AgEq over 0.35 metres (1,260 g/t Ag, 0.2 g/t Au, 0.6% Pb and 0.3% Zn) within 592 g/t AgEq over 1.05 metres (508 g/t Ag, 0.1 g/t Au, 1.4% Pb and 1.2% Zn) in SC21GWO033 at Grauer Wolf |
| ● | 266 g/t AgEq over 0.65 metres (228 g/t Ag, 0.1 g/t Au, 0.7% Pb and 0.5 % Zn) within 169 g/t AgEq over 1.93 metres (137 g/t AgEq, 0.3% Pb and 0.6% Zn) in SC21GWO030 at Grauer Wolf |
| ● | 383 g/t AgEq over 0.38 metres (7.0 g/t Ag and 5.0 g/t Au) in SC21REI027 at Reichenbach |
The assay results for the Q1 2022 drilling program are still pending and expected in advance of the 2022 drilling campaign starting in Q3 2022.
A total of 13 soil sampling profiles have been completed over Peter Vein, Grauer Wolf and Hartha target areas. The goal of the program is to test the geochemical response along the strike of the known mineralization and to identify new drill targets. Eight more profiles are planned for Q2 2022 on the Frauenstein, Oederan and Mohorn licences.
During Q1 2022 the Company incurred exploration costs of $478 on the Silver City Project.
Kilgore Project
The Kilgore project is an advanced exploration-stage volcanic and sediment hosted epithermal gold property located five miles from Kilgore, Clark County, Idaho. Excellon has a 100% undivided interest in 788 unpatented federal lode claims totaling 6,788 hectares on USFS (United States Forest Service) lands. The property includes historical mine workings dating back to the early 1900’s with further drilling in the 1980’s that revealed the potential for mineralization well outside of the existing resource area, with limited follow up to date. Kilgore displays similar geological characteristics to Kinross Gold’s Round Mountain Mine, which has produced over 16 million ounces of gold to date.
In 2019, Otis Gold Corp. (“Otis”) completed a preliminary economic assessment that contemplated a low capital intensity, low operating cost, open-pit, heap-leach mining operation. Since acquiring Otis in Q2 2020 and filing a business acquisition report with respect to such transaction on May 29, 2020, the Company has been reassessing all aspects of the Kilgore project and believes that opportunities exist to enhance the project through:
| ● | Geological remodeling of the existing mineral resource, including relogging historical core to better define geological units and lithologies |
| ● | Re-assaying historical drilling with metallic screen assays along with multi-element ICP to compliment historical fire-assayed samples |
| ● | Geophysical surveying to image prospective ground to generate drill targets and constrain structural and lithologic controls of mineralization |
11 | Page |
Management’s Discussion & Analysis of Financial Results
For the three months ended March 31, 2022
| ● | Diamond drilling to infill and expand the mineral resource to follow-up on advances in the geological model and define mineral potential along strike, laterally and at depth |
| ● | Metallurgical drilling in support of further metallurgical studies, particularly in the underlying Aspen formation based on additional petrographic information |
| ● | Engineering review of potential infrastructure locations, processing options and new mining technologies; |
| ● | Continuing environmental studies |
The Company’s contemplated 2022 drilling programs will also target higher-grade mineralization and structures at depth, predominantly in the Aspen formation, seeking to define the potential for gold mineralization that may be amenable to underground mining.
The next phase of advanced exploration on the Kilgore Project was approved by the USFS in Q4 2021. The Company filed an updated Plan of Operations with the USFS in Q2 2020 and the USFS filed the final Environmental Assessment (“EA”) in Q2 2021. The EA contemplates a total of 130 drill stations (with up to three holes per station) and construction of up to 70,977 feet of road to support drilling activities, with the project duration expected to be up to five years. The final EA and the supporting reports and studies are available on the website of the Company’s subsidiary, Excellon Idaho Gold Inc.: www.excellonidaho.com
During Q1 2022, in-depth review of historical geophysics surveys and geochemical data was integrated into 2022 drill targeting. This review has also served as the foundation to plan a 3D Induced Polarity and Magnetotelluric survey for Q3 2022.
During Q4 2021, the USFS completed the EA, initiated in Q3 2020. A Decision Notice finding “No Significant Impact” was issued allowing for ground disturbing activities, including drilling to commence. In Q1 2022, an application was filed by an NGO requesting that the Court reopen the matter with the USFS concerning its approval of the Kilgore 2021 EA.
During Q1 2022 the Company incurred exploration costs of $231 on the Kilgore Project.
Oakley Project
On April 22, 2020, the Company acquired 100% ownership of the exploration-stage Oakley project in Cassia County, Idaho as part of the Otis acquisition. The Oakley Project is an exploration-stage project hosting gold-silver, epithermal hot spring-type mineralization at two targets: Blue Hill Creek and Cold Creek, and detachment-related gold-silver mineralization at Matrix Creek. The Oakley project has been optioned to Centerra pursuant to an option agreement that is summarized in the Company’s AIF (the “Oakley Agreement”).
Drilling concluded at Cold Creek in Q3 2021, with eleven holes totaling 1,582 metres drilled in this program. Permitting for the drilling at Blue Hill Creek is in progress with anticipated start of the drilling in H1 2022. Work is being funded and managed by Centerra pursuant to the terms of the Oakley Agreement. The Cold Creek claims cover approximately 14 km2, including a structurally complex north to south valley with bounding faults that has created at least three prospective geologic zones along the western and eastern margins. The current drill program tested targets within these zones, as follows:
| ● | Eastern Margin: A historically undrilled area of receptive units with gold in soil anomalies above shallow bedrock |
| ● | Bound Block: This area is bound by large structures on the east and west and has demonstrated surface and subsurface gold mineralization. Reverse circulation (“RC”) drilling from the late 1980’s returned anomalous grades that have not been followed up on. More recent work delivered anomalous gold in soil and rock samples, with basin-wide resistivity and chargeability anomalies |
| ● | Western Margin: A historically underexplored area of structural complexity with hydrothermal material at surface. RC drilling from the late 1980’s intersected 18.3 metres grading 0.46 g/t gold from surface. More recent work has identified gold in soil anomalies corresponding with a chargeability anomaly from IP surveying |
12 | Page |
Management’s Discussion & Analysis of Financial Results
For the three months ended March 31, 2022
Highlights include:
| ● | 0.4 g/t Au over 13.6 metres hosted in metasediments, which historically have not been the focus of exploration. |
| ● | 1.4 g/t Au over 5.6 metres near-surface testing the Eastern Margin. |
During Q1 2022, Centerra commissioned geophysical CSAMT surveys within the Matrix Creek claim block; final reports are pending.
Mineral Resources
The Company’s mineral resource estimates have been prepared in accordance with NI 43-101 and the CIM’s ‘Mineral Resources and Mineral Reserves Best Practices’ guidelines (as applicable) and classified per the CIM ‘Definition Standards for Mineral Resources and Mineral Reserves’ (May 2014). The associated technical reports for the Platosa, Kilgore and Oakley projects can be found at www.sedar.com under the profiles for Excellon (in respect of Platosa) and Otis (in respect of Kilgore and Oakley). The technical reports for each of the projects are also available on the Company’s website at www.excellonresources.com.
For additional discussion of the Company’s mineral resource estimates and the Company’s other exploration projects, the reader should refer to the Company’s AIF, available on the Company’s website www.excellonresources.com and on www.sedar.com.
QUALIFIED PERSONS
Mr. Jorge Ortega, M.Sc., P.Geo., Vice President Exploration and a Qualified Person, as defined in NI 43-101, has reviewed and approved the scientific and technical information relating to geological interpretation and results contained in this MD&A. Paul Keller, P. Eng., Chief Operating Officer and a Qualified Person, as defined in NI 43-101, has reviewed and approved the scientific and technical information relating to production results contained in this MD&A.
CORPORATE RESPONSIBILITY (“CR”)
CR Performance at Platosa and Miguel Auza
Management continues to evaluate and monitor compliance with legal requirements and manage CR risk. The operations continue to report on key trailing indicators of CR performance and elements of the Visible Felt Leadership process. Trailing indicators of safety performance improved through March 31, 2022, as measured by recordable injury frequency (“RIF”), which increased by 78% (3 vs 1.7), and lost time injury frequency (“LTIF”), which declined by 37% in Q1 2022 relative to Q1 2021. Injury severity declined by 70% in Q1 2022 relative to Q1 2021.
13 | Page |
Management’s Discussion & Analysis of Financial Results
For the three months ended March 31, 2022
The 2020 Environmental, Social, and Governance Report (ESG report) for our operations in Mexico was completed and published in February 2022. Preparation is underway on the 2019 and 2021 ESG reports, which are expected to be completed in H1 2022.
No significant environmental incidents were reported at either Platosa or Miguel Auza during Q1 2022. The Company continued engagement with a range of stakeholders surrounding the Platosa and Miguel Auza business units. There were no community-related grievances reported during Q1 2022.
The Comisión Nacional del Agua (“CNA”), the federal water regulatory agency in Mexico, has commenced an administrative procedure with the Company to review the management of water that the Company pumps from the Platosa mine. CNA has also initiated informal discussions about water management with local farmers but did not formally communicate with Excellon during Q1 2022.
The Company is committed to evaluating with CNA how best to manage such water going forward, to support Platosa’s operations and deliver a sustainable benefit to the residents of the surrounding Mapimí region. Water management is critical for the Platosa operation, and although the Company does not currently foresee any material changes to water management, such changes could impact mining operations in the future.
Tailings Management at Miguel Auza
There are two tailings management facilities (“TMF”) at Miguel Auza. TMF #1 is located immediately northwest of the concentrator and has been decommissioned, rehabilitated with a soil cover and re-vegetated. TMF #2 is located on land owned by Excellon, approximately one kilometre north of the Miguel Auza concentrator. Approval for the construction and operation of the facility was received in Q1 2017. Construction of the stage-2 raise of the TMF #2 was completed in early Q4 2020 and currently has enough capacity to accommodate processing of Platosa’s 2022 production plan.
During Q4 2021, the Company continued work with Golder consulting engineers to draft a Dam-Breach Analysis on TMF #2 stages 1 to 5, which is aligned with the Safety Guidelines (CDA, 2020) from the Canadian Dam Association. The Operations, Maintenance, and Surveillance (OMS) Manual is being updated to be consistent with the Guide to the Management of Tailings Facilities (MAC 2019) from Mining Association of Canada. The Engineer of Record providing tailings-management services is a Canadian-based international engineering firm that was engaged by the Company in early 2021.
14 | Page |
Management’s Discussion & Analysis of Financial Results
For the three months ended March 31, 2022
Summary of Quarterly Financial Results
Financial statement highlights for the quarter ended March 31, 2022 and the last eight quarters are as follows:
Q1 2022 | Q4 2021 | Q3 2021 | Q2 2021 | Q1 2021 | Q4 2020 | Q3 2020 | Q2 2020 | |||||||||||||||||||||||||
| (in $000’s) | $ | $ | $ | $ | $ | $ | $ | $ | ||||||||||||||||||||||||
| Revenues | 8,496 | 9,306 | 9,151 | 9,717 | 9,781 | 10,097 | 9,857 | 687 | ||||||||||||||||||||||||
| Production costs (1) | (5,635 | ) | (8,673 | ) | (5,567 | ) | (5,814 | ) | (6,153 | ) | (5,986 | ) | (5,875 | ) | (2,641 | ) | ||||||||||||||||
| Depletion and amortization | (2,278 | ) | (1,928 | ) | (1,809 | ) | (1,773 | ) | (1,790 | ) | (1,445 | ) | (1,269 | ) | (666 | ) | ||||||||||||||||
| Cost of sales | (7,913 | ) | (10,601 | ) | (7,376 | ) | (7,587 | ) | (7,943 | ) | (7,431 | ) | (7,144 | ) | (3,307 | ) | ||||||||||||||||
| Gross profit (loss) | 583 | (1,295 | ) | 1,775 | 2,130 | 1,838 | 2,666 | 2,713 | (2,620 | ) | ||||||||||||||||||||||
| Expenses: | ||||||||||||||||||||||||||||||||
| General and administrative | (1,311 | ) | (1,255 | ) | (1,453 | ) | (1,640 | ) | (2,342 | ) | (1,886 | ) | (1,502 | ) | (2,345 | ) | ||||||||||||||||
| Exploration and holding expense | (1,116 | ) | (1,783 | ) | (2,538 | ) | (1,800 | ) | (1,073 | ) | (1,400 | ) | (2,001 | ) | (258 | ) | ||||||||||||||||
| Other income (expense) | 992 | 89 | (6 | ) | (188 | ) | (651 | ) | (6 | ) | (934 | ) | 1,172 | |||||||||||||||||||
| Provision for litigation | - | (5 | ) | (22,277 | ) | - | - | - | - | - | ||||||||||||||||||||||
| Impairment loss | - | (15,788 | ) | (752 | ) | - | - | - | - | - | ||||||||||||||||||||||
| Net finance (expense) income | (915 | ) | (1,242 | ) | (688 | ) | (1,025 | ) | (725 | ) | (679 | ) | (292 | ) | 554 | |||||||||||||||||
| Income tax (expense) recovery | 67 | (167 | ) | (4,921 | ) | (22 | ) | 31 | (4,703 | ) | 1,776 | 97 | ||||||||||||||||||||
| Net loss | (1,700 | ) | (21,446 | ) | (30,860 | ) | (2,545 | ) | (2,922 | ) | (6,008 | ) | (240 | ) | (3,400 | ) | ||||||||||||||||
| Adjusted loss (2) | (1,700 | ) | (4,069 | ) | (4,775 | ) | (2,545 | ) | (2,922 | ) | (6,008 | ) | (240 | ) | (3,400 | ) | ||||||||||||||||
| Loss per share | (0.05 | ) | (0.65 | ) | (0.94 | ) | (0.08 | ) | (0.09 | ) | (0.19 | ) | (0.01 | ) | (0.12 | ) | ||||||||||||||||
| Adjusted loss per share (2) | (0.05 | ) | (0.12 | ) | (0.15 | ) | (0.08 | ) | (0.09 | ) | (0.19 | ) | (0.01 | ) | (0.12 | ) | ||||||||||||||||
| Net cash from operations before working capital changes | 1,911 | (217 | ) | (9 | ) | 959 | 919 | 1,931 | 223 | (4,038 | ) | |||||||||||||||||||||
| (1) | Q4 2021 production costs include $1.6 million related to future mine closure accruals. |
| (2) | Q4 2021 adjusted loss and adjusted loss per share excludes impairment losses of $15.8 million and $1.6 million related to future mine closure accruals (included in Production costs). Q3 2021 adjusted loss and adjusted loss per share excludes $22.3 million related to the Provision for litigation, the related $0.8 million impairment loss and $3.1 million deferred-tax asset derecognition expenses (included in Income tax expense). |
Quarter to quarter revenue variances are a function of metal prices, treatment and refining costs and production results. Production results can differ from period to period depending on geology, mining conditions, labour and equipment availability. These, in turn, affect mined tonnages, grades and mill recoveries and, ultimately, the quantity of metal produced and revenues received. The Company currently expenses exploration costs related to Platosa (unless associated with resource expansion), Silver City, Kilgore and Evolución. These exploration costs do not relate to the mining operation and vary from period to period, creating volatility in earnings. The following is a discussion of the material variances between Q1 2022 and Q1 2021.
15 | Page |
Management’s Discussion & Analysis of Financial Results
For the three months ended March 31, 2022
| Q1 2022 | Q1 2021 | |||||||
| Revenue | 8,496 | 9,781 | ||||||
| Gross profit | 583 | 1,838 | ||||||
| Net loss | (1,700 | ) | (2,922 | ) | ||||
Revenues decreased by $1.3 million or 13% during Q1 2022 compared to Q1 2021, driven primarily by lower production due to the Labour Action which reduced AgEq ounces payable by 26%, partially offset by a 15% and 33% increase in realized lead and zinc prices, respectively.
Gross profit decreased by $1.3 million in Q1 2022 relative to Q1 2021, driven by the $1.3 million decrease in revenue.
Net loss improved by $1.2 million in Q1 2022 over Q1 2021 despite the $1.3 million decrease in gross profit discussed above. This $2.5 million positive variance was primarily driven by a $0.6 million decrease in share-based compensation expense, a $0.4 million reduction in other administrative expenses, and a $1.6 million improvement in other income/expenses including the collection of $0.6 million in insurance proceeds, a $0.6 million improvement in foreign exchange gains and losses and a $0.5 million reduction in fair value losses on marketable securities and warrants compared to the comparative period.
| Q1 2022 | Q1 2021 | |||||||
| Cost of sales | 7,913 | 7,943 | ||||||
The components of cost of sales including production costs and depletion and amortization charges are as follows:
| Labour | 1,490 | 1,394 | ||||||
| Consumables | 836 | 1,022 | ||||||
| Electricity | 1,193 | 1,867 | ||||||
| Transport | 361 | 515 | ||||||
| Other operational | 603 | 680 | ||||||
| Mine and mill administrative | 959 | 978 | ||||||
| Inventory adjustment | 193 | (303 | ) | |||||
| Production costs (including inventory adjustments) | 5,635 | 6,153 | ||||||
| Depletion and amortization | 2,278 | 1,790 | ||||||
| Cost of sales | 7,913 | 7,943 |
Production costs decreased by $0.5 million or 8% during Q1 2022 relative to Q1 2021. Consumables, transport and other operational costs decreased by $0.4 million due to the Labour Action. Electricity costs decreased $0.7 million in Q1 2022, though the comparative period included $0.6 million in incremental energy costs due to the increase in natural gas prices following the February 2021 polar-vortex. The $0.5 million variance in inventory adjustment reflects the net drawdown of ore and concentrate inventories in Q1 2022. Labour costs are consistent with the comparative period as the Company continued to accrue costs throughout the Labour Action.
Depletion and amortization expense was $0.5 million higher in Q1 2022 compared to Q1 2021, driven primarily by the reduction in expected mine life.
16 | Page |
Management’s Discussion & Analysis of Financial Results
For the three months ended March 31, 2022
Overall, cost of sales for Q1 2022 was consistent with the comparative period.
| Q1 2022 | Q1 2021 | |||||||
| Exploration and holding expense | 1,116 | 1,073 | ||||||
Exploration and holding expense in Q1 2022 were consistent with those in Q1 2021. Silver City exploration increased $0.3 million relative to the comparative period driven by Q1 2022 drilling costs, while costs in Mexico and at Kilgore decreased $0.2 million and $0.1 million in Q1 2022, respectively. For detailed breakdown see Note 12 of the Company’s condensed consolidated financial statements for the periods ended March 31, 2022 and 2021.
| General and administrative expense | 1,311 | 2,342 |
General and administrative expense decreased by $1.0 million or 44% in Q1 2022 reflecting primarily lower share-based compensation (by $0.6 million) and salary expense (by $0.3 million), driven by the timing of annual compensation expenses (in Q1 in 2021) and a reduction in personnel since the comparative period.
| Other (income) expense | (992 | ) | 651 |
Other income or expense includes realized and unrealized foreign exchange gains and losses, unrealized gains and losses on marketable securities and warrants, interest income and other non-routine income or expenses.
The $1.6 million improvement in other income or expense in Q1 2022 includes the collection of $0.6 million in insurance proceeds, a $0.6 million improvement in foreign exchange gains and losses and a $0.5 million reduction in fair value losses on marketable securities and warrants compared to the comparative period.
| Finance expense | 915 | 725 |
Net finance expense in Q1 2022 comprises primarily $0.8 million of interest expense on the 5.75% secured convertible debentures (the “Convertible Debentures”) issued in Q3 2020, which are recorded at amortized cost and accreted to the principal amount over the term of the Convertible Debentures (Q1 2021 $0.6 million). This interest expense consists of $0.2 million in coupon interest (Q1 2021 – $0.2 million) and the $0.6 million accretion of the face value of the Convertible Debentures using the effective interest rate method (Q1 2021 – $0.4 million).
Provisionally Priced Sales
Sales are recorded using the metal price received for sales that settle during the reporting period. For sales that have not been settled, an estimate is used, based on the expected month of settlement and the forward price of the metal at the end of the reporting period. The difference between the estimate and the final price received is recognized by adjusting sales in the period in which the sale is settled (i.e. the finalization adjustment). The finalization adjustment recorded for these sales depends on the actual price when the sale settles, which occurs in the first, third or fourth month after shipment under the terms of the current concentrate purchase agreements.
17 | Page |
Management’s Discussion & Analysis of Financial Results
For the three months ended March 31, 2022
Invoiced revenues are derived from the value of payable metal content net of treatment and refining charges (“TC/RCs”) incurred by the metallurgical complex of the customer. TC/RCs are a cost associated with processing of metal concentrates in refined metal products, though such cost is deducted from gross revenues rather than incurred as a cost of sales (as revenue received by the Company is net of TC/RCs). Therefore, as discussed in the calculation of total cash cost per silver ounce payable, below, TC/RCs are added to cost of sales to reflect the total cost of producing a payable silver ounce. Offtake agreements may also include price participation for the offtaker for settlements at metal prices above specified levels. The value of the metal content of the products sold is as follows (in $’000s):
| Three months ended | ||||||||
| March 31 | March 31 | |||||||
| 2022 | 2021 | |||||||
| $ | $ | |||||||
| Silver | 4,833 | 7,572 | ||||||
| Lead | 1,263 | 1,690 | ||||||
| Zinc | 3,008 | 2,278 | ||||||
| Value of metal content in products sold (1) | 9,104 | 11,540 | ||||||
| Adjustment for treatment and refining charges (TC/RC) | (608 | ) | (1,759 | ) | ||||
| Revenues from concentrate sales | 8,496 | 9,781 | ||||||
| Total revenues | 8,496 | 9,781 | ||||||
| (1) | Value of metal content in products sold is a non-IFRS measure. |
Production Cost Per Tonne, Total Cash Cost Net of By-Product Credits Per Silver Ounce Payable, All-In Sustaining Cost (AISC) Per Silver Ounce Payable and Adjusted loss and adjusted loss per share are non-IFRS measures that do not have a standardized meaning. The calculation of these measures may differ from that used by other companies in the industry. The Company uses these measures internally to evaluate the underlying operating performance of the Company for the reporting periods presented. These measures should not be considered in isolation or as a substitute for measures of performance prepared in accordance with generally accepted accounting principles and are not necessarily indicative of operating expenses as determined under generally accepted accounting principles. Management believes that these measures are key performance indicators of the Company’s operational efficiency and are increasingly used across the global mining industry. These measures are intended to provide investors with information about the cash generating capabilities of the Company’s operations.
| Q1 2022 | Q1 2021 | |||||||
| Production cost per Tonne | $ | 373 | $ | 297 | ||||
A reconciliation between production cost per tonne (excluding depletion and amortization and inventory adjustments) and the Company’s cost of sales as reported in the Company’s financial statements is provided below. Changes in inventories of ore and concentrate are excluded from the calculation of Production Cost per Tonne. Changes in inventories reflect the net cost of ore stockpiles and concentrate inventory (i) sold during the current period but produced in a previous period (an addition to direct mining and milling costs) or (ii) produced but not sold in the current period (a deduction from direct mining and milling costs). Excluding changes in inventories aligns cost of sales incurred during the period with the tonnage produced during the period.
18 | Page |
Management’s Discussion & Analysis of Financial Results
For the three months ended March 31, 2022
| Q1 2022 | Q1 2021 | |||||||
| $ 000’s | $ 000’s | |||||||
| Cost of sales | 7,913 | 7,943 | ||||||
| Adjustments – increase/(decrease): | ||||||||
| Depletion and amortization | (2,278 | ) | (1,790 | ) | ||||
| Changes in inventories | (193 | ) | 303 | |||||
| Production costs (excluding inventory adjustments) | 5,442 | 6,456 | ||||||
| Tonnes milled | 14,585 | 21,764 | ||||||
| Production cost per tonne milled ($/tonne) | $ | 373 | $ | 297 | ||||
Production cost per tonne milled increased by 26% in Q1 2022 relative to Q1 2021, driven by a 33% decrease in tonnes milled, partially offset by a 16% reduction in production costs before depletion, amortization and inventory adjustments, as discussed above.
| Q1 2022 | Q1 2021 | |||||||
| Total cash cost per silver ounce payable | $ | 10.49 | $ | 13.43 | ||||
The calculation of total cash cost includes cost of sales adjusted for non-cash depletion and amortization, by-product credits and royalties related to the Miguel Auza property which are unrelated to production from the Platosa Mine. Note that:
| (i) | Change in inventory adjustments are included in cost of sales to align with revenues from payable metals sold in the period (by either allocating the cost of metal produced in prior periods or deferring the cost of metal to be sold in future periods); and |
| (ii) | TC/RCs are added to cost of sales to reflect the total cost of producing a payable silver ounce. As per industry standard, revenues received by the Company are presented net of TC/RCs and hence they are not reported as part of cost of sales in the Company’s financial statements. |
The Company expects total cash costs net of by-product revenues to vary from period to period as planned production and underground development access different areas of the mine with varying grades and characteristics.
The following is a reconciliation of total cash cost per silver ounce payable, net of by-product credits, to cost of sales as reported in the Company’s financial statements:
| Q1 2022 | Q1 2021 | |||||||
| $ 000’s | $ 000’s | |||||||
| Cost of sales | 7,913 | 7,943 | ||||||
| Adjustments – increase/(decrease): | ||||||||
| Depletion and amortization | (2,278 | ) | (1,790 | ) | ||||
| TC/RCs | 608 | 1,759 | ||||||
| Royalties (1) | (15 | ) | (23 | ) | ||||
| By-product credits (2) | (4,272 | ) | (3,967 | ) | ||||
| Total cash cost net of by-product credits | 1,956 | 3,922 | ||||||
| Silver ounces payable | 186,407 | 291,967 | ||||||
| Total cash cost per silver ounce payable ($/oz) | $ | 10.49 | $ | 13.43 | ||||
| (1) | Advance royalty payments on the Miguel Auza property unrelated to production from the Platosa Mine. |
| (2) | By-product credits comprise revenues from the sale of lead and zinc. |
19 | Page |
Management’s Discussion & Analysis of Financial Results
For the three months ended March 31, 2022
Total cash cost per silver ounce payable decreased by 22% for Q1 2022 relative to Q1 2021, despite a 36% decrease in silver ounces payable driven by the Labour Action.
Total cash costs net of by-product credits decreased by $2.0 million or 50% reflecting a $0.5 million decrease in cash production costs as discussed under “Cost of Sales” above, a $0.3 million increase in by-product credits reflecting higher lead and zinc realized prices partially offset by lower production, and a $1.2 million decrease in TC/RCs reflecting renegotiated offtake agreements and lower production.
| Q1 2022 | Q1 2021 | |||||||
| AISC Per Silver Ounce Payable (including non-cash items) | $ | 18.92 | $ | 24.67 | ||||
Excellon reports the AISC measure to provide further transparency on the costs associated with producing silver and to assist stakeholders of the Company in assessing operating performance, its ability to generate free cash flow from current operations and overall value. The AISC measure is a non-IFRS measure and is based on guidance issued by the World Gold Council.
Excellon defines AISC per silver ounce payable as the sum of total cash costs (including TC/RCs and net of by-product credits), capital expenditures that are sustaining in nature, corporate general and administrative costs (including non-cash share-based compensation), capitalized and expensed exploration that is sustaining in nature, and environmental rehabilitation costs (non-cash), all divided by the total payable silver ounces sold during the period.
Capital expenditures to develop new operations or capital expenditures related to major projects at existing operations where these projects will materially increase production are classified as non-sustaining and are excluded from AISC. The definition of sustaining versus non-sustaining is similarly applied to capitalized and expensed exploration costs. Exploration costs to develop new operations or that relate to major projects at existing operations where these projects are expected to materially increase production are classified as non-sustaining and are excluded from AISC.
Costs excluded from AISC are non-sustaining capital expenditures and exploration costs (as described above), finance costs, tax expense, and any items that are deducted for the purposes of adjusted earnings, if any. Total sustaining costs exclude general and administrative and share-based payment expenses attributable to the Company’s non-producing projects.
The table below presents details of the calculation for AISC per silver ounce payable.
| Q1 2022 | Q1 2021 | |||||||
| $ 000’s | $ 000’s | |||||||
| Total cash costs net of by-product credits | 1,956 | 3,922 | ||||||
| Administrative costs (cash) (1) | 965 | 1,329 | ||||||
| Share-based payments (non-cash) (1) | 155 | 684 | ||||||
| Accretion and amortization of reclamation costs (non-cash) | 63 | 57 | ||||||
| Sustaining exploration (manto resource drilling) (2) | 102 | 322 | ||||||
| Sustaining capital expenditures (2) | 285 | 889 | ||||||
| Total sustaining costs | 1,570 | 3,281 | ||||||
| All-in sustaining costs | 3,526 | 7,203 | ||||||
| Silver ounces payable | 186,407 | 291,967 | ||||||
| AISC per silver ounce payable ($/oz) | 18.92 | 24.67 | ||||||
| AISC excluding non-cash items, per silver ounce payable ($/oz) | 17.75 | 22.13 | ||||||
| Realized silver price per ounce sold (3) | 23.71 | 26.32 | ||||||
| (1) | Total sustaining costs exclude general and administrative and share-based payment expenses attributable to the Company’s non-producing projects. |
| (2) | Sustaining capital expenditure includes sustaining property plant and equipment acquisitions and capitalized development costs. Sustaining exploration includes underground drilling costs. The comparatives have been revised to conform with the current allocation. |
| (3) | Average realized silver price is calculated on current period sale deliveries and does not include the impact of prior-period provisional adjustments in the current period. |
20 | Page |
Management’s Discussion & Analysis of Financial Results
For the three months ended March 31, 2022
AISC per silver ounce payable decreased by 23% to $18.92 compared to $24.67 in the comparative period, driven by a 50% reduction in total cash costs net of by-product credits as discussed above, a $0.6 million decrease in sustaining capital expenditures, a $0.5 million decrease in share-based compensation and a $0.4 million decrease in administrative costs driven by the timing of annual compensation expenses (in Q1 in 2021) and a reduction in personnel since the comparative period, partially offset by lower silver ounces payable (by 36%).
COMMON SHARE DATA AS AT MAY 16, 2022
| Common shares issued and outstanding | 33,795,117 | |||
| Stock options | 809,237 | (1) | ||
| DSUs | 538,748 | |||
| RSUs | 636,588 | |||
| Warrants ($5.75) | 1,143,428 | |||
| Fully diluted common shares (2) | 36,923,118 |
| (1) | Includes 99,487 options issued to Otis option holders that are not included under the Company’s option plan. |
| (2) | Conversion of all outstanding Convertible Debentures would result in the issuance of an additional 3,379,245 common shares of the Company. |
LIQUIDITY AND CAPITAL RESOURCES
The condensed consolidated financial statements are prepared on a going concern basis, which assumes that the Company will continue in operation for the foreseeable future and will be able to realize its assets and discharge its liabilities in the normal course of business. Refer to Note 2a of the condensed consolidated financial statements for discussion of the material uncertainties which cast substantial doubt on the Company’s ability to realize its assets and discharge its liabilities in the normal course of business.
The primary source of funds available to the Company is cash flow generated by the Platosa Mine and equity and debt financings. The Company has raised equity and debt to fund its exploration programs and certain capital and operating expenditures at the Platosa Mine. With the planned wind down of operations at Platosa in Q3 2022 and in the absence of the acquisition of another producing mine, the Company’s main source of liquidity will be derived from equity or debt transactions. A continuous review of the Company’s capital expenditure programs ensures the Company’s capital resources are utilized in a responsible and sustainable manner to conserve cash during periods of low commodity prices and economic and market uncertainty. See also the “Commitments,” below, for further detail.
21 | Page |
Management’s Discussion & Analysis of Financial Results
For the three months ended March 31, 2022
| March 31, 2022 | December 31, 2021 | |||||||
| Cash and cash equivalents | 3,350 | 4,071 | ||||||
The primary source of cash for Q1 2022 was the Company’s Mexican operations, which generated net cash flow of $1.6 million (Q1 2021 – $0.9 million) from collected revenue of $8.0 million (Q1 2021 – $10.3 million) net of production costs of $6.4 million (Q1 2021 – $9.4 million). The Company also received proceeds from the sale of marketable securities and insurance proceeds of $0.9 million in Q1 2022 (Q1 2021 – $nil).
The primary uses of cash for Q1 2022 and Q1 2021 were:
| (i) | $1.0 million spent on exploration – $0.6 million in Germany, $0.2 million in Mexico and $0.2 million in the United States (Q1 2021 – $1.8 million, including $0.4 million in Germany, $1.2 million in Mexico and $0.2 million in the United States); |
| (ii) | $1.0 million on general and administrative expenses (Q1 2021 – $1.3 million); and |
| (iii) | $0.9 million invested in capital expenditures including dewatering costs (Q1 2021 – $0.9 million). |
| March 31, 2022 | December 31, 2021 | |||||||
| Working capital | 890 | 254 | ||||||
Working capital, defined as current assets less current liabilities (excluding the Provision for litigation), increased by $0.6 million at March 31, 2022 relative to December 31, 2021, reflecting a decrease in current liabilities of $2.3 million (driven by a $2.1 reduction in trade and other payables) partially offset by a decrease in current assets of $1.6 million (driven by a $1.0 million reduction in cash and marketable securities, a $0.4 million reduction in VAT recoverable and $0.2 million reduction in other assets).
22 | Page |
Management’s Discussion & Analysis of Financial Results
For the three months ended March 31, 2022
The Company’s VAT payables reflect the VAT amounts collected by the Company from the sale of concentrates in Mexico. The Company’s VAT recoverable, predominantly reflecting VAT charged on the Company’s expenditures in Mexico, are offset against VAT payables in Mexico in the applicable period and on a rolling basis. The net VAT position varies from period-to-period depending on timing, quantum and/or value of sales and expenditures. To date the Company has not encountered difficulty in offsetting outstanding VAT recoverable in Mexico.
As at March 31, 2022, the Company had a net VAT recoverable of $0.7 million in Mexico, $0.7 million in Germany and $0.1 million in Canada (March 31, 2021 – net VAT recoverable of $1.5 million in Mexico, $0.3 million in Germany and $0.1 million in Canada).
The Company has reduced its committed tonnes to be delivered under its offtake agreement and has normal provisional pricing payment terms on the sale of its concentrate. The Company expects cash flows from Mexican operations to cover working capital requirements in Mexico including severance costs due on closure. The Company is considering various financing, corporate development opportunities and strategic alternatives that may include acquisitions, divestitures, mergers or spin-offs of the Company’s or third parties’ assets, as applicable. The Convertible Debentures do not include any financial covenants related to working capital or the ongoing operation of the Company’s mining assets.
| Q1 2022 | Q1 2021 | |||||||
| Net cash from operations before changes in working capital ($000’s) | 1,911 | 919 | ||||||
Net cash from operations before changes in working capital increased by $1.0 million in Q1 2022 versus the comparative quarter, primarily reflecting cash inflow from insurance proceeds received ($0.6 million), lower production costs and general and administrative expenses, partly offset by lower revenues as discussed above.
| Investing Activities ($000’s) | (582 | ) | (884 | ) |
The decrease in investing outflows in Q1 2022 mainly reflects a $0.2 million cash inflow from the sale of marketable securities in Q1 2022 (Q1 2021 $Nil).
| Financing Activities ($000’s) | (102 | ) | (120 | ) |
Financing activities in Q1 2022 included interest and lease-related payments and are consistent with Q1 2021.
The Company issued the Convertible Debentures in 2020, completed an equity offering of common shares in 2019 and arranged the Credit Facility in connection with the acquisition of Otis in 2020. The Company also implemented cost reductions and business improvements at its operations in 2020 and 2021. With continued strong metal prices, the Company expects to be able to generate positive cash flows from the Platosa mining operation through to mid-2022, although such cash flow will not be sufficient to fund all of the Company’s exploration programs. Failure to obtain additional financing could result in delay or indefinite postponement of further exploration and development of the Company’s projects and the possible loss of such properties.
The Company’s assets in Mexico, including those held in San Pedro, are security for the Debentures. The Company does not consider the Judgment and actions taken by the Plaintiff to date in connection with enforcing the Judgment to constitute an event of default or default under the trust indenture governing the outstanding Debentures (the “Indenture”). An event of default under the Indenture, if not cured or waived, could result in the acceleration of all the Company’s debt under the Debentures and could materially and adversely affect the Company’s future operations, cash flows, earnings, results of operations, financial condition and the economic viability of its projects. See also “Contingencies and Provision for litigation”, below.
There can be no assurances that the Company will be able to obtain adequate funding or that the terms of such financing will be favourable. The Company’s ability to generate positive cash flows is also impacted by financial market conditions, most notably metal prices as the Company derives its revenues from the sale of silver, lead and zinc and bears the associated TC/RCs. The Company is also exposed to currency exchange risk and continued uncertainty related to the COVID-19 pandemic; see “Business Environment & Risks” section below.
Financial instruments
All financial assets and financial liabilities, other than derivatives, are initially recognized at the fair value of consideration paid or received, net of transaction costs, as appropriate, and subsequently carried at fair value or amortized cost. The carrying values of cash and cash equivalents, trade receivables and other liabilities approximate their fair value, unless otherwise noted.
23 | Page |
Management’s Discussion & Analysis of Financial Results
For the three months ended March 31, 2022
The Company’s financial performance is sensitive to changes in commodity prices, foreign exchange and interest rates, and the Company may periodically consider hedging such exposure. The Company’s Board of Directors together with executive management has overall responsibility for the establishment and oversight of the Company’s risk management framework. The Company may continue to address its price-related exposure to foreign exchange through the use of options, futures, forwards and derivative contracts.
The Mexican peso (“MXN”), Canadian dollar (“C”), Euro (“Euro”) and US dollars (“USD”) are the functional currencies of the Company, with currency exposures arising from transactions and balances in currencies other than the functional currencies.
A significant portion of the Company’s capital expenditures, operating costs, exploration, and administrative expenditures are incurred in MXN or Euros, while revenues from the sale of concentrates are denominated in USD. The fluctuation of the USD in relation to the MXN and the Euro impacts the reported financial performance of the Company.
Contractual obligations
The following table summarizes contractual obligations including payments due for each of the next five years and thereafter:
| $ 000 | ||||||||||||||||||||
| Total | Less than one year | 1 – 3 years | 4 – 5 years | After 5 years | ||||||||||||||||
| Trade payables | 5,978 | 5,978 | - | - | - | |||||||||||||||
| Leases – undiscounted | 602 | 204 | 398 | - | - | |||||||||||||||
| Convertible Debentures(1) – principal | 14,362 | - | 14,362 | - | - | |||||||||||||||
| Convertible Debentures(1) – 5.75% interest | 1,303 | 826 | 477 | - | - | |||||||||||||||
| Post-retirement benefits | 2,039 | 2,039 | - | - | - | |||||||||||||||
| Rehabilitation provision | 1,898 | - | 1,898 | - | - | |||||||||||||||
| Total: | 26,182 | 9,047 | 17,135 | - | - | |||||||||||||||
| (1) | Assumes repayments of interest and principal in cash. |
Not included in the table above is a net smelter return (“NSR”) royalty payable semi-annually on the Platosa property of (a) 1.25% in respect of manto mineralization other than skarn mineralization or (b) 0.5% in respect of skarn or “Source” mineralization. Such payments vary period to period based on production results and commodity prices.
Commitments
Other than the Platosa Mine itself, the Company’s projects are at varying stages of exploration advancement. Generally, the Company budgets exploration expenditures on an annual basis and does not commit to long-term drilling contracts. Budgeted exploration expenditures for each project are summarized in “Exploration and Evaluation Review,” above, insofar as they are applicable or currently ascertainable. Exploration expenditures may be highly variable depending on ongoing results and a host of other factors, including available funds, permitting and changes in local or geopolitical risks. The Company does not currently have any development projects that require committed funding.
24 | Page |
Management’s Discussion & Analysis of Financial Results
For the three months ended March 31, 2022
In Mexico, commitments relate to annual concession fees and required expenditures associated with the Company’s mineral concessions. In Idaho, commitments relate to annual claim fees associated with the Company’s mineral claims. Fees in respect of the Oakley Project are funded by Centerra pursuant and subject to the terms of the Oakley Agreement. In Saxony, commitments relate to the required cash payments and share issuances required to earn the option to acquire 100% of the Bräunsdorf licence pursuant to the Globex Agreement (noting that the Company is under no obligation to fully exercise or complete such payments). Each of the commitments outlined below may vary depending on operational and/or exploration results or geopolitical conditions, which may lead the Company to expand or relinquish all or part of a project. Additionally, the Bräunsdorf exploration licence and Oakley Project are subject to the terms of the Globex Agreement and Oakley Agreement, respectively, and commitments may vary depending on the counterparties’ decisions to exercise options under such agreements.
The following table summarizes the Company’s significant unrecognized commitments as at March 31, 2022 (in thousands of US dollars):
| $ 000 | ||||||||||||||||||||||
| Project | Type | Total | Less than one year | 1 – 3 years | 4 – 5 years | After 5 years(1) | ||||||||||||||||
| Platosa | Fees | 1,050 | 210 | 420 | 420 | - | ||||||||||||||||
| Evolución | Fees | 2,351 | 413 | 821 | 1,117 | - | ||||||||||||||||
| Silver City | ||||||||||||||||||||||
| Bräunsdorf | Option (cash) | 160 | 160 | - | - | - | ||||||||||||||||
| Option (shares) | 501 | 501 | - | - | - | |||||||||||||||||
| Kilgore | Fees | 650 | 130 | 260 | 260 | - | ||||||||||||||||
| Oakley | Fees | 285 | 57 | 114 | 114 | - | ||||||||||||||||
| Total: | 4,997 | 1,471 | 1,615 | 1,911 | - | |||||||||||||||||
| (1) | Concession and claim fees continue until the relinquishment or expiration of the applicable concessions or claims. |
CONTINGENCIES AND PROVISION FOR LITIGATION
Contingencies can be either possible assets or possible liabilities arising from past events which, by their nature, will only be resolved when one or more future events not within the Company’s control occur or fail to occur. The assessment of such contingencies inherently involves the exercise of significant judgment and estimates of the outcome of future events. In assessing loss contingencies related to legal proceedings that are pending against the Company or unasserted claims that may result in such proceedings or regulatory or government actions that may negatively impact our business or operations, the Company with assistance from its legal counsel evaluates the perceived merits of any legal proceedings or unasserted claims or actions.
Provision for litigation
The Company recorded a $22.3 million provision in Q3 2021 as required under IFRS’s International Accounting Standard 37 – Provisions, Contingent Liabilities and Contingent Assets, since receiving the Judgment. The Judgment is solely against San Pedro and the Company believes that the plaintiff has no recourse against the Company’s other assets in Mexico (including Platosa), Idaho, Saxony or Canada. San Pedro is a wholly-owned, indirect subsidiary of the Company that holds the Miguel Auza processing facility and the original Miguel Auza mineral concessions, including the Evolución mineral resource disclosed in September 2020.
La Antigua was included in the Company’s acquisition of Silver Eagle Mines Inc. (“Silver Eagle”) in 2009 and includes a portion of the Evolución mineral resource at Miguel Auza. La Antigua is subject to an exploration and exploitation agreement with a purchase option (the “Antigua Agreement”) between San Pedro Resources SA de CV (now a subsidiary of Excellon) and the owner (the “Plaintiff”) that provides, among other things, for a minimum payment of $2,500 plus value added tax per month and the payment of a 3% NSR royalty. Pursuant to the Antigua Agreement, San Pedro had the right to purchase absolute title to La Antigua including the NSR royalty upon payment of $500,000, a right that was never exercised as there was no economic sense in doing so. San Pedro has accrued the Advance Royalty on an ongoing basis.
25 | Page |
Management’s Discussion & Analysis of Financial Results
For the three months ended March 31, 2022
Though the Miguel Auza Mine never reached commercial production and was put on care-and-maintenance in December 2008 prior to the Company’s acquisition of Silver Eagle, the Plaintiff sued San Pedro for non-compliance with the Antigua Agreement and specifically for not operating the Miguel Auza Mine. The Plaintiff was awarded damages of $700,000 in the court of first instance in Torreón, Coahuila. Both San Pedro and the Plaintiff appealed the decision to the Second District State Court in the Judicial District of Torreón. In December 2019, that Court confirmed the initial decision but, subsequently, pursuant to an order obtained by the Plaintiff, granted the Plaintiff an award of damages of $22.2 million, predominantly in damages for the Miguel Auza Mine not being in operation, which in the view of management is multiple times greater than any income the applicable NSR royalty could produce even in the event of commercial production. San Pedro appealed the Judgment to the federal courts of Mexico; however, its appeal was dismissed on July 1, 2021, despite lack of evidence, facts or law to support this outcome. In August 2021, the Company received the formal written decision on the appeal which upholds the Judgment and is not subject to further legal appeal in Mexico.
The Judgment is solely against San Pedro as defendant and the Company believes that the Plaintiff has no recourse against the Company’s other assets in Mexico (including Platosa), Idaho, Saxony or Canada. San Pedro is a wholly-owned, indirect subsidiary of the Company that holds the Miguel Auza processing facility and the original Miguel Auza mineral concessions, including the Evolución mineral resource. The book value of San Pedro’s assets included in the consolidated balance sheet of the Company is $3.1 million, including plant, property and equipment ($1.4 million), VAT recoverable ($1.3 million) and materials, supplies and other ($0.4 million). The Platosa Mine is owned and operated by an entirely separate subsidiary.
The Company’s assets in Mexico, including those held in San Pedro, are security for the Convertible Debentures. In Q1 2022, the Plaintiff registered the Judgment against the real property owned by San Pedro. The Company is pursuing legal remedies through its counsel in Mexico. This proceeding does not currently impact the Company’s use of the land, plant or mineral concessions. The Company does not consider the Judgment and actions taken by the Plaintiff to date in connection with enforcing the Judgment to constitute an event of default or default under the Indenture. An event of default under the Indenture, if not cured or waived, could result in the acceleration of all the Company’s debt under the Convertible Debentures and could materially and adversely affect the Company’s future operations, cash flows, earnings, results of operations, financial condition and the economic viability of its projects.
The Company continues to pursue avenues through its labour, community and government relationships and is investigating remedies under international law. In the interim, San Pedro continues to operate in the ordinary course (subject to the Labour Action noted above). San Pedro generates minimal cash flows from milling fees charged to the Platosa Mine for ore processing and holds minimal working capital.
Platosa Surface Rights
A subsidiary of the Company appealed a 2018 judgment revoking its 2007 purchase of approximately 295 hectares of surface rights north of the Platosa mine, which was denied by an appeals court in Mexico during Q3 2020. The judgment nullifies the purchase and orders that the land be returned to the plaintiffs, and that the plaintiffs repay the original purchase price to the Company’s subsidiary.
26 | Page |
Management’s Discussion & Analysis of Financial Results
For the three months ended March 31, 2022
The Company does not consider the land material to its mining operation or exploration activities. The decision does not affect Excellon’s mineral rights and the Company does not expect it to have any impact on its operations.
The plaintiffs also alleged at trial, for the first time, that the Platosa mine site was on land that was included in the sale. This assertion was not decided in the litigation, was not supported by admissible evidence, contradicts the cadastral registry, conflicts with the rights of other third-party holders and ignores the fact that the Company began its use and occupation of the mine site in 2004 – before the sale in question.
Under Mexican law, Excellon’s access to the mine cannot be impeded. Nevertheless, the Company is considering a variety of legal avenues to redress the ruling. For additional discussion, the reader should refer to the “Risk Factors – Surface Rights and Access”, “Risk Factors – Legal Proceedings” and “Risk Factors – Enforcement of Legal Rights” sections of the Company’s AIF.
Off-Balance Sheet Arrangements
The Company does not have any off-balance sheet arrangements.
ACCOUNTING POLICIES AND INTERNAL CONTROLS
Internal Control Over Financial Reporting
Internal control over financial reporting (“ICFR”) means a process designed by or under the supervision of the President & CEO and CFO, management and other personnel to provide reasonable assurance regarding the reliability of financial reporting and the preparation of financial statements for external purposes in accordance with IFRS. Management use the criteria set forth in Internal Control – Integrated Framework (2013) (“COSO 2013”) issued by the Committee of Sponsoring Organizations of the Treadway Commission to evaluate the effectiveness of the Company’s ICFR.
The internal controls are not expected to prevent and detect all misstatements due to error or fraud.
Based on management’s evaluation, the Company concluded that ICFR was not effective as of March 31, 2022 due to the identification of a material weakness in ICFR related to Q3 2021 as discussed below.
Material Weakness and Remediation Plan
In connection with the assessment of the effectiveness of our ICFR, management identified a material weakness as of September 30, 2021. The limited level of staffing and technical resources available to manage complex non-routine transactions resulted in significant adjustments to the preliminary financial statements being recorded with respect to the Provision for litigation and related impacts in the condensed consolidated financial statements for the three- and nine-month periods ended September 30, 2021. As a direct result of this complex transaction and limitation on current accounting resources management determined that the Company’s controls over the financial statement close process to analyze, account for and disclose non-routine, unusual or complex transactions were not operating effectively.
The Company is committed to improving its ICFR. As part of this control improvement, management has and will continue to enhance the capacity and capabilities to review and evaluate ongoing and technically complex transactions through selective increased use of external resources and realignment of internal staff. Management will continue to monitor and evaluate the effectiveness of our ICFR on an ongoing basis and are committed to taking further action and implementing additional enhancements or improvements, as necessary and as funds allow. The Company’s plan may take significant time and expense to be fully implemented and may require significant management attention, and management’s efforts may not prove to be successful in remediating the material weakness and do not guarantee that the Company will not suffer additional material weaknesses and/or significant deficiencies in the future.
27 | Page |
Management’s Discussion & Analysis of Financial Results
For the three months ended March 31, 2022
Despite the existence of the material weakness described above, the CEO and CFO, together with management, believe that the condensed consolidated financial statements associated with this Management’s Discussion and Analysis, fairly present the financial position, results of operations and cash flows for the period ended March 31, 2022 and 2021 in all material respects.
Disclosure Controls & Procedures
Disclosure controls and procedures (“DC&P”) are designed to provide reasonable assurance that all relevant information is gathered and reported to management, including the President & CEO and CFO, on a timely basis so that appropriate decisions can be made regarding public disclosure.
As of March 31, 2022, based on management’s evaluation, the President & CEO and CFO concluded that the Company’s DC&P were not effective due to the identification of a material weakness in ICFR in Q3 2020, as discussed above.
Accounting policy, estimates and judgments
Accounting standards issued but not yet effective
The Company has not early adopted any standard, interpretation or amendment that has been issued but is not yet effective.
Significant accounting estimates and judgments
The Company’s significant accounting policies are described in Note 4 to the consolidated financial statements for the year ended December 31, 2021. The preparation of the consolidated financial statements require management to make estimates, assumptions and judgments that may have a significant impact on the consolidated financial statements. These estimates, assumptions and judgments are continuously evaluated and are based on management’s experience and expectations of future events that are believed to be reasonable under the circumstances, however actual outcomes can differ. Revisions to accounting estimates are recognized in the period in which the estimates are revised. For details of these estimates, assumptions and judgements, refer to the Company’s consolidated financial statements for the year ended December 31, 2021, which are available on the Company’s website and on SEDAR.
BUSINESS ENVIRONMENT AND RISKS
Risks and uncertainties
The Company’s business entails exposure to certain risks, including but not limited to: metal price risk since the Company derives its revenues from the sale of silver, lead and zinc; foreign exchange risk since the Company reports in United States dollars but operates in jurisdictions that use other currencies; the inherent risk of uncertainties in estimating Mineral Resources; political risk associated with operating in foreign jurisdictions; environmental risks; surface rights and access; enforcement of legal rights; and risks associated with labour relations issues. The current or future operations of Excellon including ongoing commercial production are or will be governed by and subject to federal, state and municipal laws and regulations regarding mineral taxation, mineral royalties and other governmental charges. Any change to the mineral taxation and royalty regimes in the jurisdictions in which Excellon operates or plans to operate could have an adverse financial impact on the Company’s current and planned operations and the overall financial results of the Company, the extent of which cannot be predicted. For additional discussion of risk factors (including a discussion of COVID-19 related risks) refer to the Company’s AIF which is on the Company’s website www.excellonresources.com and on www.sedar.com.
28 | Page |
Management’s Discussion & Analysis of Financial Results
For the three months ended March 31, 2022
ADDITIONAL SOURCES OF INFORMATION
Additional disclosures pertaining to the Company, including its most recent Annual Information Form, audited and unaudited interim financial statements, management information circular, material change reports, press releases and other information, are available on the SEDAR website at www.sedar.com or on the Company’s website at www.excellonresources.com.
CAUTIONARY STATEMENT REGARDING FORWARD-LOOKING STATEMENTS AND INFORMATION
This MD&A contains “forward-looking statements” within the meaning of applicable Canadian securities legislation and applicable U.S. securities laws. Except for statements of historical fact relating to the Company, such forward-looking statements include, without limitation, statements regarding the impact of the COVID-19 pandemic on the Company’s operations and results, the outcome and impact of the legal action in Mexico (including the dismissal of the appeal by the federal courts of Mexico on July 1, 2021) in respect of the La Antigua mineral concession that is part of the Evolución Property in Zacatecas, mineral resources estimates, the future results of operations, performance and achievements of the Company, including potential property acquisitions, the timing, content, cost and results of proposed work programs, the discovery and delineation of mineral deposits/resources/reserves, geological interpretations, the potential of the Company’s properties, proposed production rates, potential mineral recovery processes and rates, business plans and future operating revenues. Forward-looking statements are made based on management’s beliefs, estimates, assumptions and opinions on the date the statements are made. Although the Company believes that such statements are reasonable, it can give no assurance that such expectations will prove to be correct and the Company undertakes no obligation to update forward-looking statements. Forward-looking statements are typically identified by words such as: believes, expects, anticipates, intends, estimates, targets, plans, postulates, and similar expressions, or are those which, by their nature, refer to future events. The Company cautions investors that any forward-looking statements by the Company are not guarantees of future results or performance, and that actual results may differ materially from those in forward-looking statements as a result of various risk factors, including, but not limited to, the ability of the Company to maintain normal operations during the COVID-19 pandemic, the outcome and impact of the legal action in Mexico (including the dismissal of the appeal by the federal courts of Mexico on July 1, 2021) in respect of the La Antigua mineral concession that is part of the Evolución Property in Zacatecas, variations in the nature, quality and quantity of any mineral deposits that may be located, significant downward variations in the market price of any minerals produced (particularly silver), the Company’s inability to obtain any necessary permits, consents or authorizations required for its activities, to produce minerals from its properties successfully or profitably, to continue its projected growth, to raise the necessary capital or to be fully able to implement its business strategies. A description of the risk factors applicable to the Company can be found in its AIF under “Description of the Business – Risk Factors.” All of the Company’s public disclosure filings may be accessed via www.sedar.com and readers are urged to review these materials, including the technical reports filed with respect to the Company’s mineral properties. This document is not to be construed in any way as, an offer to buy or sell securities in the United States.
Cautionary Note to United States Investors Concerning Estimates of Measured, Indicated and Inferred Resources
The terms “Measured,” “Indicated” and “Inferred” Mineral Resources used or referenced in this MD&A comply with reporting standards in Canada and are made in accordance with Canadian National Instrument 43-101 – Standards of Disclosure for Mineral Projects (“NI 43-101”) under the guidelines set out in the Canadian Institute of Mining, Metallurgy and Petroleum (the “CIM”) Standards on Mineral Resources and Mineral Reserves. NI 43-101 is a rule developed by the Canadian Securities Administrators that establishes standards for all public disclosure an issuer makes of scientific and technical information concerning mineral projects. These standards differ significantly from the requirements of the United States Securities and Exchange Commission (the “SEC”) applicable to domestic United States reporting companies. Accordingly, information included in this MD&A that describes the Company’s mineral resources estimates may not be comparable with information made public by United States companies subject to the SEC’s reporting and disclosure requirements.
Cautionary Note to United States Investors regarding Adjacent or Similar Properties
This MD&A may also contain information with respect to adjacent or similar mineral properties in respect of which the Company has no interest or rights to explore or mine. The Company advises United States investors that the United States Securities and Exchange Commission’s mining guidelines strictly prohibit information of this type in documents filed with the SEC. Readers are cautioned that the Company has no interest in or right to acquire any interest in any such properties, and that mineral deposits on adjacent or similar properties are not indicative of mineral deposits on the company’s properties.
29 | Page |