Exhibit 96.1

S-K 1300 Technical Report Summary
Prepared for
International CuMo Mining Corp.
Prepared by
Geologic Systems Ltd.
November 2022
S-K 1300 Technical Report Summary
November 2022
| | Prepared for | Prepared by |
| | | |
| | International CuMo Mining Corp. | Geologic Systems Ltd. |
| | Suite #2300–550 Burrard Street | 514 East Columbia St |
| | Vancouver, BC V6C 2B5 | New Westminster, BC V3L 3X7 |
| | Canada | Canada |
Tel: +1 604 689 7902
Web: www.cumoco.com
Authored By:
| | Shaun M Dykes, M. Sc. (Eng), P.Geo. | Geologic Systems Ltd.. |
| SMD | Cumo S-k 1300 Technical Report | November 2022 |
Geologic 2CM027.001 CuMoCo. | Page i |
Acronyms and Abbreviations
| Distance | | | NaCN | sodium cyanide |
| µm | micron (micrometre) | | Other | |
| mm | millimetre | | °F | degrees Fahrenheit |
| cm | centimetre | | °C | degrees Celsius |
| m | metre | | cfm | cubic feet per minute |
| km | km | | elev | elevation |
| in | inch | | m AMSL | metres elev. above mean sea level |
| ft | foot | | hp | horsepower |
| Area | | | hr | hour |
| m2 | square metre | | s | second (unit of time) |
| km2 | square km | | kW | kilowatt |
| ac | acre | | kWh | kilowatt hour |
| Ha | hectare | | M | Million or mega |
| Volume | | | mph | miles per hour |
| L | litre | | ppb | parts per billion |
| m3 | cubic metre | | ppm | parts per million |
| ft3 | cubic foot | | s.g. or SG | specific gravity |
| bcm | bank cubic metres | | V | volt |
| Mbcm | million bcm | | W | watt |
| bcy | bank cubic yards | | $k | thousand US dollars |
| Mbcy | million bcy | | $M | million US dollars |
| Mass | | | $Bn | billion US dollars |
| kg | kilogram | | tph or stph | short tons per hour |
| g | gram | | tpd or stpd | short tons per day |
| g/t | g/ metric tonne | | mtpa or mstpa | million short tons per annum |
| t or st | short ton | | Ø | diameter |
| kst | thousand short tons | | Acronyms | |
| Mst | million short tons | | SRK | SRK Consulting (Canada) Inc. |
| Bst | billion short tons | | CIM | Canadian Institute of Mining |
| lb | pounds | | NI 43-101 | National Instrument 43-101 |
| mmlbs | millions of lbs | | ABA | Acid- base accounting |
| oz | troy ounce | | LOM | life of mine |
| wmt | wet metric tonne | | AP | Acid potential |
| dmt | dry metric tonne | | NP | Neutralization potential |
| Pressure | | | ML/ARD | Metal leaching/ acid rock drainage |
| psi | pounds per square inch | | PAG | Potentially acid generating |
| Pa | pascal | | non-PAG | Non-potentially acid generating |
| kPa | kilopascal | | RC | reverse circulation |
| MPa | megapascal | | IP | induced polarization |
| Elements and Compounds | | | COG | cut-off grade |
| Mo | molybdenum | | NSR | net smelter return |
| MoS2 | molybdenite | | NPV | net present value |
| Cu | copper | | | |
| Au | gold | | Conversion Factors | |
| Ag | silver | | 1 ton | 2,000 lb |
| S | sulfur | | 1 tonne | 2,204.62 lb |
| CN | cyanide | | 1 troy oz | 31.10348 g |
| SMD | Cumo S-k 1300 Technical Report | November 2022 |
Geologic 2CM027.001 CuMoCo. | Page ii |
Table of Contents
| 1 | Executive Summary | 1 |
| | 1.1 | Introduction | 1 |
| | 1.2 | Property Description, History, and Ownership | 2 |
| | 1.3 | Exploration | 2 |
| | 1.4 | Geology and Mineralization | 2 |
| | 1.5 | Mineral Resource Estimate | 3 |
| | 1.6 | Project Development and Operations | 6 |
| | 1.7 | Social and Environmental | 7 |
| | 1.8 | Project Costs | 8 |
| | 1.9 | Project Economics | 8 |
| | | 1.9.1 | Cautionary Statements | 8 |
| | | 1.9.2 | Economic Summary | 8 |
| | 1.10 | Project Risks | 11 |
| | | 1.10.1 | Mineral Resource | 11 |
| | | 1.10.2 | Mining | 11 |
| | | 1.10.3 | Mineral Sorting | 11 |
| | | 1.10.4 | Processing | 11 |
| | | 1.10.5 | Project Infrastructure | 12 |
| | | 1.10.6 | Permitting | 12 |
| | | 1.10.7 | Economic Risks | 12 |
| | 1.11 | Project Opportunities | 13 |
| | | 1.11.1 | Mineral Resource | 13 |
| | | 1.11.2 | Mining | 14 |
| | | 1.11.3 | Mineral Sorting | 14 |
| | | 1.11.4 | Processing | 14 |
| | | 1.11.5 | Project Infrastructure | 14 |
| | | 1.11.6 | Economic Opportunities | 15 |
| | 1.12 | Conclusions and Recommendations | 16 |
| | | 1.12.1 | Mineral Resources | 16 |
| | | 1.12.2 | Pit Geotechnical | 16 |
| | | 1.12.3 | Mining | 17 |
| | | 1.12.4 | Mineral Sorting | 17 |
| | | 1.12.5 | Processing | 17 |
| | | 1.12.6 | Tailings Management | 18 |
| | | 1.12.7 | Permitting | 18 |
| SMD | Cumo S-k 1300 Technical Report | November 2022 |
Geologic 2CM027.001 CuMoCo. | Page iii |
| | | 1.12.8 | Plan and Budget for Additional Work | 18 |
| 2 | Introduction and Terms of Reference | 20 |
| | 2.1 | Issuer | 20 |
| | 2.2 | Terms of Reference | 20 |
| | 2.3 | Responsibility | 20 |
| | 2.3 | Sources of Information | 20 |
| | 2.4 | Site Visit | 20 |
| | 2.5 | Previous Reports | 20 |
| 3 | Property Description and Location | 21 |
| | 3.1 | General | 21 |
| | 3.2 | Mineral Tenure | 21 |
| | 3.3 | Ownership Agreements | 21 |
| | 3.4 | Environmental | 26 |
| | | 3.4.1 | Environmental Regulations | 26 |
| | | 3.4.2 | Environmental Liabilities | 26 |
| | | 3.4.3 | Other Significant Factors and Risks | 26 |
| | 3.5 | Permits | 27 |
| 4 | Accessibility, Climate, Local Resources, Infrastructure and Physiography | 29 |
| 5 | History | 30 |
| | 5.1 | Exploration | 30 |
| | 5.2 | Historical Resource Estimate | |
| 6 | Geological Setting and Mineralization | 33 |
| | 6.1 | Regional Geology | 33 |
| | 6.2 | Local Geology | 36 |
| | 6.3 | Property Geology | 38 |
| | 6.4 | Mineralization | 41 |
| | | 6.4.1 | Description of Mineralized Zones | 41 |
| | | 6.4.2 | Property Mineralization | 41 |
| 7 | Exploration And Drilling | 47 |
| | 7.1 | Drilling and Trenching | 48 |
| | 7.2 | Sampling and True Thickness Adjustments | 48 |
| | 7.3 | 2006 Drill Program | 48 |
| | 7.4 | 2007 to 2011 Drill Program | 48 |
| | 7.5 | 2012 Drill Program | 56 |
| | 7.6 | Metal Equivalent Calculations | 58 |
| 8 | Sample Preparation, Analyses, and Security | 60 |
| | 8.1 | General sampling | 60 |
| | 8.2 | Density Determinations | 61 |
| SMD | Cumo S-k 1300 Technical Report | November 2022 |
Geologic 2CM027.001 CuMoCo. | Page iv |
| | 8.3 | Assay Techniques | 62 |
| | 8.4 | Security | 63 |
| | 8.5 | QA/QC Programs | 63 |
| | | 8.5.1 | Historical Checks | 63 |
| | | 8.5.2 | Blanks | 65 |
| | | 8.5.3 | Internal Lab Standards | 66 |
| | | 8.5.4 | Internal Pulp Checks | 66 |
| | | 8.5.5 | CuMoCo Standards | 67 |
| | | 8.5.6 | Coarse Reject Duplicates | 71 |
| | 8.6 | Survey Validation | 71 |
| | 8.7 | Verification of Drilling Data | 71 |
| 9 | Data Verification | 72 |
| 10 | Mineral Processing and Metallurgical Testing | 73 |
| | 10.1 | Metallurgical Testing (2009, 2015) | 73 |
| | | 10.1.1 | Introduction | 73 |
| | | 10.1.2 | Sample Selection | 74 |
| | | 10.1.3 | Test-work Program | 74 |
| | | 10.1.4 | Conceptual Study Flotation Test-work | 75 |
| | | 10.1.5 | Grade and Recovery Predictions | 78 |
| | 10.2 | Mineral Sorting | 80 |
| | | 13.2.1 | Particle Sorting | 80 |
| | | 13.2.2 | Bulk Sorting | 81 |
| 11 | Mineral Resource Estimates | 85 |
| | 11.1 | Introduction | 85 |
| | 11.2 | Data Analysis | 85 |
| | 11.3 | 50-Foot Composites | 90 |
| | 11.4 | Variography | 92 |
| | 11.5 | Block Model and Grade Estimation | 93 |
| | 11.6 | Bulk Density | 96 |
| | 11.7 | Reasonable Prospects of Eventual Economic Extraction | 96 |
| | 11.8 | Resource Classification | 97 |
| | 11.9 | Recovered Value | 99 |
| | 11.10 | Mineral Resource Estimate | 101 |
| 12 | Mineral Reserve Estimates | 102 |
| 13 | Mining Methods | 103 |
| | 13.1 | Mining Approach | 103 |
| | 13.2 | Pit Optimization | 103 |
| | | | |
| | | 13.2.1 | Pit Geotechnical Considerations | 103 |
| SMD | Cumo S-k 1300 Technical Report | November 2022 |
Geologic 2CM027.001 CuMoCo. | Page v |
| | | 13.2.2 | Bulk Sorting | 107 |
| | | 13.2.3 | Particle Sorting | 109 |
| | | 13.2.4 | Pit Optimization Input Parameters | 110 |
| | | 13.2.5 | Optimization Results | 111 |
| | | 13.2.6 | Pit Shell Selection | 113 |
| | 13.3 | Waste Rock Facilities and Stockpile Design | 115 |
| | | 13.3.1 | Charlotte’s Gulch Waste Rock Facility | 117 |
| | 13.4 | Production Schedule | 117 |
| | 13.5 | Equipment Selection and Fleet Requirements | 118 |
| 14 | Recovery Methods | 119 |
| | 14.1 | General | 119 |
| | 14.2 | Bulk Sorting | 119 |
| | 14.3 | Particle Sorting | 121 |
| | 14.4 | Mill Design Criteria Summary | 121 |
| | 14.5 | Plant Design Basis | 124 |
| | 14.6 | Throughput/Mill Feed and Availability | 124 |
| | 14.7 | Processing Strategy | 124 |
| | 14.8 | Flow Sheet Development and Equipment Sizing | 124 |
| | 14.9 | Unit Process Selection | 126 |
| 15 | Project Infrastructure | 128 |
| | 15.1 | General Layout | 128 |
| | 15.2 | Road Access | 128 |
| | 15.3 | Rail Access | 128 |
| | 15.4 | Electrical Power | 129 |
| | 15.5 | Water Supply | 129 |
| | 15.6 | Tailings Storage Facility | 129 |
| | | 15.6.1 | Tailings Embankment | 130 |
| | | 15.6.2 | Tailings Impoundment | 130 |
| 16 | Market Studies and Contracts | 131 |
| | 16.1 | Market Analysis | 131 |
| | | 16.1.1 | Treatment and refining costs | 131 |
| | | 16.1.2 | Metal Prices | 131 |
| 17 | Environmental Studies, Permitting, and Social or Community Impact | 132 |
| | 17.1 | Environmental and Permitting | 132 |
| | | 17.1.1 | Past and Present Permitting for Exploration Project | 132 |
| | 17.2 | Permitting for Mining Operations | 134 |
| | | 17.2.1 | Federal Authorizations and Permits | 134 |
| | | 17.2.2 | Idaho State Authorizations and Permits | 137 |
| SMD | Cumo S-k 1300 Technical Report | November 2022 |
Geologic 2CM027.001 CuMoCo. | Page vi |
| | | 17.2.3 | Boise County Permits | 137 |
| | 17.3 | Monitoring | 137 |
| | 17.4 | Reclamation | 138 |
| | | 17.4.1 | Federal Reclamation Performance Bond | 138 |
| | | 17.4.2 | State Reclamation Performance Bond | 138 |
| | 17.5 | Social and Community Impact | 139 |
| | 17.6 | Potential Issues | 140 |
| | 17.7 | Mine Closure – General Discussion | 141 |
| 18 | Capital and Operating Costs | 143 |
| | 18.1 | Capital Cost Estimate | 143 |
| | | 18.1.1 | Mining Capital Costs | 144 |
| | | 18.1.2 | Processing Capital Costs | 144 |
| | | 18.1.3 | Tailings Storage Facilities Capital Costs | 147 |
| | | 18.1.4 | Capital Cost Estimate Exclusions | 148 |
| | 18.2 | Operating Cost Estimate | 149 |
| | | 18.2.1 | Mine Operating Costs | 149 |
| | | 18.2.2 | Sort Plant Operating Costs | 150 |
| | | 18.2.3 | Mill Operating Costs | 150 |
| | | 18.2.4 | General Site and Administrative Costs | 151 |
| 19 | Economic Analysis | 152 |
| | 19.1 | Cautionary Statements | 152 |
| | | 19.1.1 | Certainty of Preliminary Economic Assessment | 152 |
| | | 19.1.2 | Mineral Resources are Not Reserves | 152 |
| | 19.2 | General | 152 |
| | 19.3 | Summary | 152 |
| | 19.4 | Project Cashflows | 155 |
| | 19.5 | Production Schedule | 155 |
| | 19.6 | Pricing Assumptions | 160 |
| | 19.7 | Processing Recovery Assumptions | 160 |
| | 19.8 | Capital Costs | 160 |
| | 19.9 | Operating Costs | 162 |
| | 19.10 | Royalties | 162 |
| | 19.11 | Taxation | 162 |
| | 19.12 | Off-Site Costs | 162 |
| | 19.13 | Sensitivity Analysis | 163 |
| 20 | Adjacent Properties | 165 |
| 21 | Other Relevant Data and Information | 165 |
| SMD | Cumo S-k 1300 Technical Report | November 2022 |
Geologic 2CM027.001 CuMoCo. | Page vii |
| 22 | Interpretations and Conclusions | 165 |
| | 22.1 | Conclusions | 165 |
| | | 22.1.1 | Mineral Resource | 165 |
| | | 22.1.2 | Mining | 165 |
| | | 22.1.3 | Bulk Sorting | 165 |
| | | 22.1.4 | Particle Sorting | 165 |
| | | 22.1.5 | Project Economics | 166 |
| | 22.2 | Project Risks | 166 |
| | | 22.2.1 | Mineral Resource | 166 |
| | | 22.2.2 | Mining | 166 |
| | | 22.2.3 | Mineral Sorting | 166 |
| | | 22.2.4 | Processing | 166 |
| | | 22.2.5 | Project Infrastructure | 167 |
| | | 22.2.6 | Permitting | 167 |
| | | 22.2.7 | Economic Risks | 167 |
| | 22.3 | Project Opportunities | 168 |
| | | 22.3.1 | Mineral Resource | 168 |
| | | 22.3.2 | Mining | 168 |
| | | 22.3.3 | Mineral Sorting | 169 |
| | | 22.3.4 | Processing | 169 |
| | | 22.3.5 | Project Infrastructure | 169 |
| | | 22.3.6 | Economic Opportunities | 169 |
| 23 | Recommendations | 171 |
| | 23.1 | Mineral Resources | 171 |
| | 23.2 | Pit Geotechnical | 171 |
| | 23.3 | Mining | 172 |
| | 23.4 | Mineral Sorting | 172 |
| | 23.5 | Processing | 172 |
| | 23.6 | Tailings Management | 173 |
| | 23.7 | Permitting | 173 |
| | 23.8 | Plan and Budget for Additional Work | 173 |
| 24 | References | 175 |
| 25 | Reliance on Other Experts | 177 |
| Appendix 1: Claims List | 178 |
| Appendix 2: Re-Splits of Rejects | 184 |
| Appendix 3: Drill Holes used in Resource Estimate | 187 |
| Appendix 4: Semi-variograms | 189 |
| Appendix 5: Scatter Plots showing Results from Historic Data Verification | 214 |
| SMD | Cumo S-k 1300 Technical Report | November 2022 |
Geologic 2CM027.001 CuMoCo. | Page viii |
List of Figures
| Figure 4-1: CuMo property location map | 24 |
| Figure 4-2: Claim location map for the CuMo property | 25 |
| Figure 7-1: Tectonic map of the western United States | 34 |
| Figure 7-2: Distribution of Idaho-Montana porphyry deposits in relation to the great falls tectonic zone | 35 |
| Figure 7-3: Geology of Boise County, Idaho, showing geological setting of CuMo deposit | 37 |
| Figure 7-4: Core photographs of felsic porphyry types recognized in drill core | 40 |
| Figure 7-5: Photographs of mineralized core from the CuMo 2006 program, hole C06-28 | 42 |
| Figure 7-6: Photographs of molybdenite mineralization in 2008 drill core | 43 |
| Figure 7-7: Surface distribution of quartz and epidote veinlets and metal zonation | 44 |
| Figure 7-8: Geochemical distribution of Mo in surface rock chip samples | 45 |
| Figure 7-9: Geochemical distribution of Cu in surface rock chip samples | 46 |
| Figure 10-1: Map showing the location of completed and proposed drill holes | 51 |
| Figure 10-2: CuMo deposit Q-Q cross section | 52 |
| Figure 10-3: CuMo deposit H-H cross section | 53 |
| Figure 11-1: MoS2 in blank samples from CuMoCo drill programs at CuMo | 65 |
| Figure 11-2: Cu in blank samples from 2008 drill program CuMo | 66 |
| Figure 11-3: Scatter plot of Chemex internal duplicates for Mo ppm (Mo metal) | 67 |
| Figure 11-4: Scatter plot of Chemex internal duplicates for Cu ppm | 67 |
| Figure 11-5: Results for Standard S1 | 68 |
| Figure 11-6: Results for Standard S2 | 69 |
| Figure 11-7: Results for Standard S3 | 70 |
| Figure 13-1: Particle sort XRF test results | 81 |
| Figure 13-2: Impact of scale on distribution heterogeneity | 82 |
| Figure 13-3: Impact of scale on “Waste in Ore” ratio | 83 |
| Figure 13-4: CuMo composite-sample relationship | 84 |
| Figure 14-1: Contact plots for oxide-Cu-Ag Zone contact | 87 |
| Figure 14-2: Scatter plot showing Re vs MoS2 in the Cu-Mo Zone | 95 |
| Figure 14-3: Plan views of the measured, indicated and inferred blocks at CuMo | 99 |
| Figure 16-1: Empirical pit wall chart with the Snowden (2012) walls added | 105 |
| Figure 16-2: Particle sort analysis splitting between Mo-rich and Mo-poor samples | 110 |
| Figure 16-3: Pit optimization results | 113 |
| Figure 16-4: CuMo pit phase shell outlines | 114 |
| Figure 16-5: CuMo pit phase shell east-west cross-section A-A’ | 114 |
| Figure 16-6: CuMo pit phase shell north-south cross-section B-B’ | 115 |
| Figure 16-7: CuMo mine layout | 116 |
| Figure 16-8: CuMo LOM production schedule | 118 |
| Figure 17-1: Schematic of three-stage bulk sorting plant with particle sorting | 120 |
| Figure 17-2: Schematic of bulk sorting diversion system | 121 |
| Figure 17-3: CuMo process schematic | 125 |
| Figure 18-1: CuMo Clear Creek TSF and WRF buttress | 130 |
| Figure 18-2: Cross-section A-A’ through Clear Creek TSF and WRF buttress | 130 |
| Figure 22-1: Project cashflow summary chart | 155 |
| Figure 22-2: Metal production schedule graph | 159 |
| Figure 22-3: Metals price sensitivity – net present value | 164 |
| Figure 22-4: Single factor sensitivity – net present value | 164 |
| SMD | Cumo S-k 1300 Technical Report | November 2022 |
Geologic 2CM027.001 CuMoCo. | Page ix |
| List of Tables | |
| | |
| Table 1-1: Metal prices for resource estimation | 4 |
| Table 1-2: CuMo metal recoveries by zone | 4 |
| Table 1-3: Measured resource within pit shell | 5 |
| Table 1-4: Indicated resources | 5 |
| Table 1-5: Measured and indicated resources | 6 |
| Table 1-6: Inferred resources (molybdenum, copper, silver, rhenium and sulfur) | 6 |
| Table 1-7a: Summary of Project Economics with Inferred Resources | 9 |
| Table 1-7b: Summary of Project Economics without Inferred Resources | 10 |
| Table 1-8: Budget for additional work | 19 |
| Table 2-1: QP responsibilities | |
| Table 6-1: Summary of historic drilling | 31 |
| Table 6-2: List of historic drill holes | 32 |
| Table 6-3: CuMo historical results, 1982 Amax block model | |
| Table 7-1: Summary of rock units present at the CuMo property | 38 |
| Table 10-1: Summary of holes drilled by CuMoCo | 48 |
| Table 10-2: Summary of 2006 to 2011 diamond drilling at CuMo | 49 |
| Table 10-3: Significant intersections from CuMo drilling | 54 |
| Table 10-4: Summary of 2012 diamond drilling | 56 |
| Table 10-5: Significant intersections from 2011-2012 CuMo drilling | 57 |
| Table 10-6: Recoverable equivalent grades for significant intersections from 2011-2012 CuMo drilling | 57 |
| Table 10-7: Metal prices used to calculate copper and molybdenum equivalent | 58 |
| Table 10-8: Metallurgical recoveries used to calculate copper and MoS2 equivalent | 58 |
| Table 10-9: Terms used in formulae for equivalent grade calculations | 59 |
| Table 11-1: Certified standards prepared for CuMo project | 61 |
| Table 11-2: Density data example | 62 |
| Table 11-3: Density measurement results summary | 62 |
| Table 13-1: Summary of comminution test-work data | 75 |
| Table 13-2: Baseline flotation results for CuMo composite samples | 76 |
| Table 13-3: Cleaner flotation results for CuMo composite samples | 77 |
| Table 13-4: Locked cycle test results | 78 |
| Table 13-5: Tungsten recovery test results | 78 |
| Table 13-6: Grade/recovery predictions for CuMo | 80 |
| Table 14-1: Summary of MoS2 and Cu contents | 86 |
| Table 14-2: Summary of assay statistics for Cu and MoS2 sorted by zone | 86 |
| Table 14-3: Summary of assay statistics for Ag and W sorted by zone | 88 |
| Table 14-4: Summary of capping levels by mineralized zone | 89 |
| Table 14-5: Summary of capped assay statistics for Cu and MoS2 sorted by zone | 90 |
| Table 14-6: Summary of capped assay statistics for Ag and W sorted by zone | 90 |
| Table 14-7: Summary of 50 ft composite statistics | 91 |
| Table 14-8: Parameters for semi-variogram models at CuMo | 92 |
| Table 14-9: Estimation boundary summary | 93 |
| Table 14-10: Summary of kriging search parameters for each mineralized zone | 94 |
| Table 14-11: Summary of density parameters for each mineralized zone | 96 |
| Table 14-12: Metal prices for resources | 100 |
| Table 14-13: Metal recoveries sorted by mineralized zone | 100 |
| Table 14-14: Measured resources | 101 |
| Table 14-15: Indicated resources | 102 |
| Table 14-16: Measured and indicated resources | 102 |
| Table 14-17: Inferred resources (molybdenum, copper, silver, rhenium and sulfur) | 102 |
| SMD | Cumo S-k 1300 Technical Report | November 2022 |
Geologic 2CM027.001 CuMoCo. | Page x |
| Table 16-1: Summary of the reviewed data types | 104 |
| Table 16-2: Pit slope design details in Snowden (2012) | 104 |
| Table 16-3: Pit optimization input parameters | 112 |
| Table 16-4: CuMo mined quantities | 113 |
| Table 16-5: CuMo primary mine equipment fleet | 118 |
| Table 17-1: Summary of the process plant design criteria (150 ktpd). | 123 |
| Table 20-1: Major permits and authorizations that may be required1 | 135 |
| Table 21-1: Summary of initial capital costs | 143 |
| Table 21-2: Mine primary equipment capital costs | 144 |
| Table 21-3: Summary of plant initial capital cost estimate | 145 |
| Table 21-4: Summary of roaster initial capital cost estimate | 146 |
| Table 21-5: Summary of LOM operating costs | 149 |
| Table 21-6: Estimated plant average operating costs | 150 |
| Table 22-1a: Summary of potential project economics with Inferred resources | 153 |
| Table 22-1b: Summary of potential project economics without inferred resources | 154 |
| Table 22-2: LOM annual project cash flow | 156 |
| Table 22-3: LOM annual project cash flow – continued | 157 |
| Table 22-4: Production schedule summary | 158 |
| Table 22-5: Pricing assumptions for economic analysis | 160 |
| Table 22-6: Processing recovery assumptions used for economic analysis | 160 |
| Table 22-7: Capital cost summary | 161 |
| Table 22-8: Operating costs summary | 162 |
| Table 22-9: Two-factor sensitivity (NPV(8%) in $M) – Capex and Opex | 163 |
| Table 22-10: Two-factor sensitivity (NPV(8%) in $M) – Capex and metal prices | 163 |
| Table 22-11: Two-factor sensitivity (NPV(8%) in $M) – Opex and metal prices | 163 |
| Table 22-12: Sensitivity (NPV(8%) in $M) – Individual metal prices | 163 |
| Table 26-1: Budget for additional work | 174 |
| SMD | Cumo S-k 1300 Technical Report | November 2022 |
Geologic 2CM027.001 CuMoCo. | Page 1 |
The CuMo Project (Project) is designed to develop Cumo, Copper-Molybdenum-Silver- Rhenium deposit, and provide long-term employment and business opportunities for a rural area in Idaho, funded by an economically viable project. It would become one of the largest open pit Copper-Molybdenum mines in the United States and producer of Copper, Molybdenum, Silver and Rhenium , critical and strategic minerals.
This Technical Report Summary (TRS or Report) provides an overview of the Project and includes recommendations for future work. It discloses, at an Initial Assessment level, information about the geology, mineralization, exploration potential, Mineral Resources, mining methods, processing methods, infrastructure, social and economic benefits, environmental protection, cleanup, and repair of historical impacts, permitting, reclamation and closure concepts, capital and operating costs and an economic analysis for the Project. The accuracy level for all operating and capital cost estimates contained in the initial assessment is +/-40% with a contingency level of +/-20%
For readers to fully understand the information in this Report, they should read this Report in its entirety, including all qualifications, assumptions and exclusions that relate to the information set out in this Report that qualifies the technical information contained in the Report. The Report is intended to be read as a whole, and sections should not be read or relied upon out of context. The technical information in the Report is subject to the assumptions and qualifications contained in the Report. The economic and technical analyses included in this Report provide only a summary of the potential Project economics based on the assumptions set out herein. There is no guarantee that the Project economics described herein can be achieved.
This technical report summary (TRS or Report) was commissioned by the registrant, International CuMo Mining Corp. (CuMoCo), for its Copper-Molybdenum-Silver Project (CuMo or Project) In Boise County, Idaho for the purpose of reporting an initial assessment. CuMoCo is an Idaho company exploring options for the development and restoration of the project area.
This Report is the inaugural TRS developed for the CuMo Project in accordance with United States SEC S-K 1300 regulations. The TRS summarizes a 2020 Preliminary Economic Analysis (PEA) Technical Report (SRK, 2020) that was completed under Canadian Securities Administrators National Instrument (NI) 43-101 guidelines and published June , 2020 with the following notable differences:
| ○ | An additional set of summary cash flows were produced that do not include inferred resources |
| ○ | The TRS is classified as an Initial Assessment study whereas the 2020 PEA was classified as a Preliminary Economic Analysis . |
Site visits for the purposes of personal inspections of the CuMo property have been undertaken by Shaun Dykes, Geologic QP, 2005 to 2022;
Note: Throughout this report, all currency is United States dollars and all units are imperial, unless otherwise specifically noted.
| SMD | Cumo S-k 1300 Technical Report | November 2022 |
Geologic 2CM027.001 CuMoCo. | Page 2 |
| 1.2 | Property Description, History, and Ownership |
The CuMo deposit is a molybdenum-copper deposit situated 37 miles, equivalent to 60 kilometers (km), northeast of Boise, Idaho, USA. The project is situated in the southern section of the Boise Mountains which are characterized by north-northwest trending mountain ranges separated by alluvial filled valleys. Topographic elevations on the CuMo claims range from 5,400 feet (1,700 meters) to 7,100 ft (2,400 m) above sea level.
Situated in a historic lode gold camp with a recorded production of 2.8 million ounces, molybdenite (MoS2) mineralization was not discovered in this area until 1963 by Amax Exploration (Amax). After conducting surface sampling in 1964, Amax relinquished rights to the property. It was subsequently explored by Curwood Mining Company, Midwest Oil Corporation (later Amoco Minerals Company), Amax (a second time), and then Climax Molybdenum Company (a subsidiary of Amax Inc.). The Historic Drilling was done between 1969 and 1982 for a total of 10,981 m (36,026 ft) in 23 diamond drill holes and three reverse circulation holes. Note: Reverse circulation holes are not used in the resource calculation.
The property was re-staked in 1998 by CuMo Molybdenum Mining Inc. and optioned to Mosquito Consolidated Gold Mines Ltd., (now CuMoCo) in 2004.
Presently, the CuMo project is held by a wholly owned USA subsidiary of CuMoCo, International CuMo Mining Corporation (CuMoCo).
After CuMoCo had optioned the property in 2004, Kobex Resources Ltd. (Kobex) optioned it from CuMoCo in 2005 and commenced drilling in 2006. Kobex drilled one complete hole and 50% of a second hole 1,087 m (3,565 ft). In late 2006, CuMoCo resumed control and completed the 2006 to 2011 exploration drilling programs, including the incomplete hole by Kobex. CuMoCo completed 20,187 m (66,230 ft) of drilling in 32 diamond drill holes in that program. During 2012, CuMoCo drilled nine additional holes totaling 4,713 m (15,464 ft), aimed at improving the resource categorization and gaining a better understanding of the extent of the deposit.
| 1.4 | Geology and Mineralization |
The CuMo deposit is located at the southwestern end of the Idaho-Montana Porphyry Belt. Igneous complexes in this belt are interpreted to be related to an Eocene, intra-arc rift, and are characterized by alkalic rocks in the northeast, mixed alkalic and calc-alkalic rocks in the middle, and calc-alkaline rocks in the southwest. The CuMo deposit is typical of large, dispersed, low grade molybdenum ± copper porphyry deposits that are associated with hybrid magmas typified by fluorine-poor, differentiated monzogranite igneous complexes. Due to their large size, the total contained economic molybdenum in these types of deposits can be equivalent to or exceed that of high-grade molybdenum deposits.
| SMD | Cumo S-k 1300 Technical Report | November 2022 |
Geologic 2CM027.001 CuMoCo. | Page 3 |
CuMoCo’s work has resulted in the interpretation and modelling of three distinct mineralized zones within the deposit. These zones were previously interpreted by Amax as distinct shells that were produced by separate intrusions. Re-interpretation of down-hole histograms for copper (Cu), silver (Ag) and molybdenite (MoS21) suggests the mineralized zones are part of a single, large, concentrically zoned system with an upper copper-silver zone (named Cu-Ag Zone), underlain by a transitional copper-molybdenum zone (named Cu-Mo Zone), in turn underlain by a lower molybdenum-rich zone (named Mo Zone). Three-dimensional modeling of the above zonation indicates the current area being drilled is located on the north side of a large system extending 4.5 km (15,000 ft) in diameter, of which 1.5 km (3,000 ft) has been drilled.
| 1.5 | Mineral Resource Estimate |
The Mineral Resource estimates for the Project were estimated in conformity with Committee for Mineral Reserves International Reporting Standards (CRIRSCO) “International Reporting Template for the public reporting of Exploration Targets, Exploration Results, Mineral Resources and Mineral Reserves” as adopted by the International Council on Mining & Metals November 2019. The mineral resources are reported in in accordance with §§229.1300 through 229.1305 (subpart 229.1300 of Regulation S-K).
The resource estimate was based on a total of 65 diamond drill holes totaling 36,166 m (118,654 ft). Note that the three reverse circulation holes were not used in the resource estimate. Nine of the 65 diamond drill holes were completed in 2012. As no additional drilling has been completed since the 2015 resource was estimated, it is considered current.
A geological model separating the CuMo Deposit into four mineralize zones with an oxidized layer on top was developed by CuMoCo geologists. In addition, major fault blocks were identified both by assay data and by marker beds. Assays were tagged as one of four mineralized zones: a near surface Cu-Ag Zone, a deeper Cu-Mo Zone and a still deeper Mo Zone and an underlying potassic-silica zone (MSI). Statistical analysis of each variable in each zone led to the capping of assays based on the grade distribution within each zone. Uniform down-hole 50 feet (ft) composites were produced for each zone. For variography, the major post mineral fault blocks were rotated back to their original position using marker beds. Semi-variograms were produced for each variable within each zone based on the samples’ original pre-fault locations. A block model with block dimensions of 50 ft was superimposed on the mineralized zones. Grade was interpolated into blocks by ordinary kriging. A tonnage factor was determined for each zone based on multiple specific gravity determinations. Individual blocks were classified as measured, indicated or inferred resource based on their location relative to drill-hole composites.
To take into account the four primary potentially economic minerals estimated, a form of metal equivalent or recoverable value (RCV) was calculated for each block based on reasonable commodity prices and estimated recoveries in each of five zones; the oxide zone (a combination of altered Cu-Ag and Cu-Mo Zones), Cu-Ag Zone, Cu-Mo Zone, Mo Zone and MSI Zone. The 2015 resource estimate is summarized below for RCV cut-offs.
The metal prices used for resource estimation are provided in Table 1-1 and represent the long er term predictions for future prices combined with the moving average for the past 3 years..
1 The convention for the CuMo project has been to measure percent elemental molybdenum (%Mo) in assays and to calculate %MoS2by multiplying %Mo by 1.6681. Both %Mo and %MoS2 are stored in the project’s database, and the latter, %MoS2, is used in resource estimates and mine planning.
| SMD | Cumo S-k 1300 Technical Report | November 2022 |
Geologic 2CM027.001 CuMoCo. | Page 4 |
Table 1-1: Metal prices for resource estimation
| Metal | Price |
| Copper (Cu) (per lb) | $3.00 |
| Molybdenum oxide (MoO3) (per lb) | $10.00 |
| Molybdenum Metal (Mo) (per lb) | $15.00 |
| Silver (Ag) (per oz) | $12.50 |
The metal recoveries used were a function of mineralized zones as follows in Table 1-2.
Table 1-2: CuMo metal recoveries by zone
| Zone | Cu Recovery (%) | Mo Recovery (%) | Ag Recovery (%) |
| OX | 60 | 80 | 65 |
| Cu-Ag | 68 | 86 | 75 |
| Cu-Mo | 85 | 92 | 78 |
| Mo | 72 | 95 | 55 |
| MSI | 72 | 95 | 55 |
In 2012, Snowden Mining Consultants (Snowden) used Geovia’s WhittleTM pit optimizer to determine a constraining open pit shell for the CuMo deposit. Optimization parameters were from Thompson Creek mine (a comparable open pit molybdenum project located in Idaho). The optimization parameters included mill feed, mining and processing costs of $7.52 per processed ton, overall pit slope angles of 45°, metallurgical recoveries as shown above and appropriate dilution and offsite costs and royalties. The commodity prices used in 2012 by Snowden for restraining the resource were Mo at $25/lb, Cu at $3/lb, Ag at $20/oz and W at $10/lb. This pit constraint is still valid.
Since the infill drill holes completed in 2012 were all within the conceptual pit, this resource update uses the Snowden 2012 optimum pit shell to constrain the estimate.
In the mineral resource estimate tables below (Table 1-3, Table 1-4, Table 1-5, and Table 1-6), the base case $5.00/t RCV cut-off is highlighted and is selected based on operating costs and the results of grade improvement using a mineral sorting process. The $5.00 cut-off is suggested to separate waste from material that is fed into the sorters. From the sorters, only mill feed above an economic cut-off would be sent for immediate processing.
It should be noted that since the convention for the CuMo project has been to work with %MoS2, as calculated from measured %Mo, the %MoS2 values in the resource estimate tables are 1.6681 times greater than %Mo.
| SMD | Cumo S-k 1300 Technical Report | November 2022 |
Geologic 2CM027.001 CuMoCo. | Page 5 |
An estimate for rhenium (Re) and sulfur (S) associated with the MoS2 was completed using linear regression of MoS2 vs. Re and MoS2 vs S to show the average grades of Re and S that would be contained with MoS2 within each block. The Re and S were not used to determine the RCV value of resources shown in Table 1-3, Table 1-4, Table 1-5, and Table 1-6 below.
Note: Regression analysis is not industry standard practice in calculating overall resources. However, the fact that rhenium is entirely and almost all the sulfur are contained within the material containing MoS2, (note; a minor amount of sulfur is contained in pyrite) which has been estimated by kriging, means that regression is a valid method of obtaining a reasonable estimate of the rhenium and sulfur contents at the level of precision of this study. Due to the large number of samples involved in the regression analysis, the confidence of this particular regression estimate is comparable to that obtained by the method of ordinary kriging.
Table 1-3: Measured resource within pit shell
Cut-off RCV ($) | Grade > RCV Cut-off | Contained Metal |
Quantity (Mt) | MoS2 (%) | Cu (%) | Ag (ppm) | RCV ($) | Re (ppm) | S (%) | Mo (mmlbs) | Cu (mmlbs) | Ag (Moz) |
| 2.5 | 308.4 | 0.079 | 0.074 | 2.09 | 17.32 | 0.029 | 0.233 | 292.1 | 456.5 | 18.8 |
| 5.0 | 297.2 | 0.081 | 0.076 | 2.09 | 17.83 | 0.03 | 0.229 | 288.6 | 451.7 | 18.1 |
| 7.5 | 282 | 0.085 | 0.076 | 2.06 | 18.48 | 0.031 | 0.223 | 287.4 | 428.7 | 16.9 |
| 12.5 | 227.9 | 0.097 | 0.075 | 2 | 20.50 | 0.036 | 0.217 | 265 | 341.8 | 13.3 |
| 15.0 | 195.4 | 0.105 | 0.072 | 1.9 | 21.71 | 0.039 | 0.212 | 246 | 281.3 | 10.8 |
| 17.5 | 159.7 | 0.115 | 0.067 | 1.8 | 23.04 | 0.043 | 0.207 | 220.1 | 213.9 | 8.4 |
| 20.0 | 122.9 | 0.125 | 0.063 | 1.7 | 24.50 | 0.047 | 0.202 | 184.1 | 154.8 | 6.1 |
Source: Giroux et al, 2015, modified 2019
Table 1-4: Indicated resources
Cut-off RCV ($) | Grade > RCV Cut-off | Contained Metal |
Quantity (Mt) | MoS2 (%) | Cu (%) | Ag (ppm) | RCV ($) | Re (ppm) | S (%) | Mo (mmlbs) | Cu (mmlbs) | Ag (Moz) |
| 2.5 | 2216.1 | 0.049 | 0.079 | 2.48 | 12.32 | 0.018 | 0.277 | 1301.9 | 3501.4 | 160.3 |
| 5.0 | 1972.3 | 0.053 | 0.085 | 2.57 | 13.40 | 0.019 | 0.269 | 1253.3 | 3352.9 | 147.8 |
| 7.5 | 1708.3 | 0.059 | 0.088 | 2.59 | 14.55 | 0.021 | 0.258 | 1208.4 | 3006.5 | 129 |
| 12.5 | 1050.6 | 0.076 | 0.09 | 2.55 | 17.67 | 0.027 | 0.235 | 957.4 | 1891.1 | 78.1 |
| 15.0 | 798.5 | 0.083 | 0.09 | 2.56 | 19.06 | 0.03 | 0.231 | 794.6 | 1437.2 | 59.6 |
| 17.5 | 541.6 | 0.093 | 0.088 | 2.49 | 20.60 | 0.034 | 0.226 | 603.9 | 953.2 | 39.3 |
| 20.0 | 301.3 | 0.106 | 0.082 | 2.36 | 22.49 | 0.039 | 0.219 | 383 | 494.2 | 20.7 |
Source: Giroux et al, 2015, modified 2019
| SMD | Cumo S-k 1300 Technical Report | November 2022 |
Geologic 2CM027.001 CuMoCo. | Page 6 |
Table 1-5: Measured and indicated resources
Cut-off RCV ($) | Grade > RCV Cut-off | Contained Metal |
Quantity (Mt) | MoS2 (%) | Cu (%) | Ag (ppm) | RCV ($) | Re (ppm) | S (%) | Mo (mmlbs) | Cu (mmlbs) | Ag (Moz) |
| 2.5 | 2524.6 | 0.053 | 0.079 | 2.43 | 12.93 | 0.019 | 0.272 | 1604.3 | 3988.9 | 178.9 |
| 5.0 | 2269.6 | 0.057 | 0.084 | 2.5 | 13.98 | 0.021 | 0.264 | 1551.1 | 3812.9 | 165.5 |
| 7.5 | 1990.4 | 0.063 | 0.086 | 2.51 | 15.10 | 0.022 | 0.253 | 1503.5 | 3423.5 | 145.7 |
| 12.5 | 1278.6 | 0.079 | 0.087 | 2.46 | 18.17 | 0.029 | 0.232 | 1211.1 | 2224.8 | 91.7 |
| 15.0 | 993.9 | 0.088 | 0.087 | 2.43 | 19.58 | 0.032 | 0.227 | 1048.7 | 1729.5 | 70.4 |
| 17.5 | 701.4 | 0.098 | 0.083 | 2.33 | 21.16 | 0.036 | 0.221 | 824.1 | 1164.2 | 47.7 |
| 20.0 | 424.3 | 0.112 | 0.077 | 2.17 | 23.07 | 0.041 | 0.214 | 569.8 | 653.4 | 26.9 |
Source: Giroux et al, 2015, modified 2019
Table 1-6: Inferred resources (molybdenum, copper, silver, rhenium and sulfur)
Cut-off RCV ($) | Grade > RCV Cut-off | Contained Metal |
Quantity (Mt) | MoS2 (%) | Cu (%) | Ag (ppm) | RCV ($) | Re (ppm) | S (%) | Mo (mmlbs) | Cu (mmlbs) | Ag (Moz) |
| 2.5 | 3373.6 | 0.04 | 0.057 | 1.93 | 9.55 | 0.014 | 0.304 | 1617.9 | 3845.9 | 189.9 |
| 5.0 | 2556.6 | 0.048 | 0.067 | 2.13 | 11.48 | 0.017 | 0.282 | 1471.4 | 3425.9 | 158.8 |
| 7.5 | 1996 | 0.056 | 0.07 | 2.23 | 13.07 | 0.02 | 0.261 | 1340.1 | 2794.4 | 129.8 |
| 12.5 | 996.4 | 0.078 | 0.064 | 1.98 | 16.74 | 0.028 | 0.231 | 931.8 | 1275.4 | 57.5 |
| 15.0 | 637 | 0.086 | 0.074 | 2.16 | 18.63 | 0.03 | 0.244 | 656.8 | 942.7 | 40.1 |
| 17.5 | 384.8 | 0.094 | 0.084 | 2.34 | 20.49 | 0.032 | 0.259 | 433.7 | 646.4 | 26.3 |
| 20.0 | 190.2 | 0.109 | 0.078 | 2.37 | 22.80 | 0.037 | 0.262 | 248.6 | 296.8 | 13.1 |
The Initial assessment described herein is preliminary in nature and is partly based on inferred mineral resources that are considered too speculative geologically to have the economic considerations applied to them that would enable them to be categorized as mineral reserves, and there is no certainty that the initial assessment based on these mineral resources will be realized.
| 1.6 | Project Development and Operations |
CuMo is to be developed as an open pit mining operation, mining waste and providing feed to a primary crusher which then supplies crushed material to a mineral sorting plant. The sorting plant consists of both bulk and particle sorting and produces feed for a mill and flotation plant. The project plan includes an off-site roaster to convert molybdenum concentrate (as MoS2) to saleable MoO3. Major by-products are copper and silver, and minor by-products are rhenium and sulfuric acid. Potential for the production of tungsten as a minor by-product may also exist.
| SMD | Cumo S-k 1300 Technical Report | November 2022 |
Geologic 2CM027.001 CuMoCo. | Page 7 |
The proposed operation is for a 150,000 short tons per day (stpd) feed rate to the mill. This requires a sort feed rate averaging about 200,000 stpd, with a maximum of about 265,000 stpd. Mining rates to achieve this feed average about 400,00 stpd, reaching a maximum mining rate of 500,000 stpd.
The overall process is for material to be mined at the mining rate, and a grade control cut-off is applied to that material to determine what material is sent to the sort plant (sorter feed); the remaining material is sent to waste dumps. The sort plant consists of an initial three-stage bulk sort process, where for each stage, a pair of cut-offs is applied to produce mill feed, waste, and middlings streams. The middlings stream for each sort stage becomes the feed for the next sort stage. After the third sort, the middlings are sent to a stockpile which is the feed source for a particle sorting process. The product from the particle sort process is combined with the mill feed product of the bulk sort process in a coarse material stockpile for feed to the mill.
The mill is a conventional semi-autogenous grinding circuit and flotation circuit creating an interim copper-molybdenum concentrate which is then further processed in a molybdenum flotation circuit to separate copper and molybdenum concentrates. Molybdenum concentrate is transported to the project roaster for production of MoO3. Copper concentrate is shipped to market.
The tailings storage facility (TSF) will be located at the headwaters of the Clear Creek watershed, in a natural basin formed by the surrounding ridgeline. The TSF will have capacity to store the 1,582M tons (~900M m3) of tailings produced over the 28 year mine life, with an ultimate crest elevation of 6,950 ft. Tailings containment will be provided by the natural topography on the valley sides and an engineered dam that will be buttressed by the Clear Creek waste rock facility (WRF) constructed immediately downstream of the TSF. A starter dam will be constructed to elevation 6300 ft to facilitate early mine production, followed by an additional five raises spread out over the life of the mine.
| 1.7 | Social and Environmental |
At this time, no issues were identified that would materially impact the ability to eventually extract mineral resources at the project.
The proposed mine will be located on public land administered by the United States Forest Service (USFS) and private land owned and controlled by ICMC. The permitting path will involve multiple state and federal agencies. Permits likely to be required for the project are presented in Table 20-1. An environmental impact statement will be required at the level of NEPA analysis for mine development, operations, and closure. Reclamation bonds will be required by both federal and state agencies. The reclamation liability for the proposed mine will have to be determined based on third-party costs, and the bond amount will have to be posted using an approved financial instrument
ICMC has initiated consultation with various stakeholders namely: government officials at all levels and local communities in regard to the potential social and community impacts or improvements that may occur as the project progresses. All groups are provided regular updates as the project is proceeding. Local communities and officials have come out in strong support of the project and are actively working with the project on both the Grimes Creek project and future planning (Hilscher et al, 2018).
| SMD | Cumo S-k 1300 Technical Report | November 2022 |
Geologic 2CM027.001 CuMoCo. | Page 8 |
The mine will be located in an area used for weekend summer dispersed recreation and fall big-game hunting and is well-known in the Boise area. Organized environmental groups such as the Idaho Conservation League and Sierra Club are keeping their constituents informed so as to coordinate opposition to the project. As such, well-funded, organized opposition to mining activities should be anticipated.
At the current time the United States Forest Service (USFS) is working on a Supplemental Red Line Environmental Assessment that will allow the Company to proceed to the next round of drilling and road access construction on the property. The authorization is expected in 2020, and no surface disturbing activities can proceed on the property until the authorization is received. This is the only ongoing permitting activity.
Operating costs were derived from the mining operation based on comparison to similar size operations and the authors’ experience. Modifications were made to account for varying haul profiles that are expected during the mine life. General and administrative costs were similarly based on similar size operations and the authors’ experience.
Processing costs were based on prior work by Ausenco (Ausenco, 2009) and compare well with more recent studies and so continue to apply.
Capital costs for mining were based on evaluation of mining equipment fleet requirements and application of unit equipment prices used in recent studies. Pre-production mining (pre-stripping) was also capitalized for the purpose of economic analysis. Capital costs for the sorting plant were estimated based on its material handling focus (conveyors).
The capital costs for infrastructure and mineral processing from the earlier Ausenco work (Ausenco, 2009) were reviewed and were deemed reasonable in comparison to more recent studies of large porphyry projects though some cost escalation was applied.
| 1.9.1 | Cautionary Statements |
Certainty of Initial Assessment
The Initial Assessment is preliminary in nature, that it includes inferred mineral resources that are considered too speculative geologically to have the economic considerations applied to them that would enable them to be categorized as mineral reserves, and there is no certainty that initial assessment will be realized.
The project as presented and under the current assumptions has the potential to be economic. The after-tax NPV is positive and is robust across a range of sensitivities with respect to capital costs, operating costs and revenue (price). A summary of the project economics is shown in Table 1-7a and b. Two tables are presented one with the inferred resource included one without. Due to the ore sorting and central location of the pit a large portion of the inferred component of the resource is located on the outer edges in the waste blocks. What inferred that is located within the mineable resource has been converted to waste. A total of 12.4% of the resources included in the economic analysis is inferred.
Metal prices assumptions are described in TRS Table 1-1: Metal prices for resource estimation. In addition, TRS Table 22-5: Pricing assumptions for economic analysis sets forth the metals prices assumptions used for the life of mine economic evaluation.
Cut-off grades for resources used in the economic analysis are contained in TRS Tables 1-1 to 1-6, and are described in terms of Recoverable Metal Value (RCV), which is the total value of the metals contained in the resources at various cut-offs. The base case economic analysis used an RCV cut-off of $5 per ton.
Costs utilized for the economic analysis are found in Table 22-7 (Capital costs) and Table 22-8 (Operating costs), all contained within Article 19--Economic Analysis.
| SMD | Cumo S-k 1300 Technical Report | November 2022 |
Geologic 2CM027.001 CuMoCo. | Page 9 |
Table 1-7a: Summary of Project Economics with Inferred Resources
| Project Metric | Units | Value |
| Pre-Tax NPV @ 5% | $M | 2,470 |
| Pre-Tax NPV @ 8% | $M | 800 |
| Pre-Tax NPV @ 10% | $M | 113 |
| Pre-Tax IRR | % | 10% |
| After-Tax NPV @ 5% | $M | 1,709 |
| After-Tax NPV @ 8% | $M | 356 |
| After-Tax NPV @ 10% | $M | -205 |
| After-Tax IRR | % | 9% |
| Undiscounted After-Tax Cash Flow (LOM) | $M | 7,032 |
| Payback Period from Start of Processing | years | 8.0 |
| Initial Capital Expenditure | $M | 3,071 |
| LOM Sustaining Capital Expenditure | $M | 972 |
| Closure | $M | 150 |
| LOM C-1 Cash Costs After By-product Credits | $/lb Mo | 4.67 |
| Nominal Flotation Process Capacity | stpd | 150,000 |
| Mine Life (years @ > 90% of full production) | years | 28 |
| LOM Flotation Mill Feed | kst | 1,582,526 |
| LOM Grades |
| Molybdenite (MoS2) | % | 0.074% |
| Molybdenum (elemental Mo) | % | 0.044% |
| Copper | % | 0.105% |
| Silver | grams per tonne | 3.00 |
| LOM Waste Volume | kst | 2,425,101 |
| LOM Strip Ratio (Waste:Sort Feed) | ratio | 1.11 |
| Mass Pull to Mill from Sort Feed | % | 72% |
| LOM Strip Ratio (Waste:Mill Feed) | ratio | 1.53 |
| First Five Years Average Annual Metal Production |
| Molybdenum (Mo) | klbs/yr | 34,976 |
| Copper | klbs/yr | 93,394 |
| Silver | kounces/yr | 3,940 |
| LOM Average Annual Metal Production |
| Molybdenum (Mo) | klbs/yr | 43,072 |
| Copper | klbs/yr | 84,229 |
| Silver | kounces/yr | 3,575 |
| LOM Average Mill Process Recovery |
| Molybdenum (Mo) | % contained metal | 91.87% |
| Copper | % contained metal | 76.33% |
| Silver | % contained metal | 70.42% |
| SMD | Cumo S-k 1300 Technical Report | November 2022 |
Geologic 2CM027.001 CuMoCo. | Page 10 |
Table 1-7b: Summary of Project Economics without Inferred Resources
| Project Metric | Units | Value |
| Pre-Tax NPV @ 5% | $M | 2,328 |
| Pre-Tax NPV @ 8% | $M | 771 |
| Pre-Tax NPV @ 10% | $M | 102 |
| Pre-Tax IRR | % | 10% |
| After-Tax NPV @ 5% | $M | 1,674 |
| After-Tax NPV @ 8% | $M | 356 |
| After-Tax NPV @ 10% | $M | -225 |
| After-Tax IRR | % | 9% |
| Undiscounted After-Tax Cash Flow (LOM) | $M | 6,575 |
| Payback Period from Start of Processing | years | 8.0 |
| Initial Capital Expenditure | $M | 3,071 |
| LOM Sustaining Capital Expenditure | $M | 972 |
| Closure | $M | 150 |
| LOM C-1 Cash Costs After By-product Credits | $/lb Mo | 4.67 |
| Nominal Flotation Process Capacity | stpd | 150,000 |
| Mine Life (years @ > 90% of full production) | years | 28 |
| LOM Flotation Mill Feed | kst | 1,582,526 |
| LOM Grades |
| Molybdenite (MoS2) | % | 0.076% |
| Molybdenum (elemental Mo) | % | 0.045% |
| Copper | % | 0.108% |
| Silver | grams per tonne | 3.10 |
| LOM Waste Volume | kst | 2,55,706 |
| LOM Strip Ratio (Waste:Sort Feed) | ratio | 1.11 |
| Mass Pull to Mill from Sort Feed | % | 72% |
| LOM Strip Ratio (Waste:Mill Feed) | ratio | 1.53 |
| First Five Years Average Annual Metal Production |
| Molybdenum (Mo) | klbs/yr | 37,640 |
| Copper | klbs/yr | 90,756 |
| Silver | kounces/yr | 3,731 |
| LOM Average Annual Metal Production |
| Molybdenum (Mo) | klbs/yr | 34,980 |
| Copper | klbs/yr | 84,233 |
| Silver | kounces/yr | 3,375 |
| LOM Average Mill Process Recovery |
| Molybdenum (Mo) | % contained metal | 91.87% |
| Copper | % contained metal | 76.33% |
| Silver | % contained metal | 70.42% |
| SMD | Cumo S-k 1300 Technical Report | November 2022 |
Geologic 2CM027.001 CuMoCo. | Page 11 |
This Technical Report Summary is preliminary in nature and includes mineral resources. Mineral resources that are not mineral reserves do not have demonstrated economic viability. There is increased risk and uncertainty to commencing and conducting production without established mineral reserves which may result in economic and technical failure and may adversely impact future profitability.
The mineral resource is supported by exploration results, test-work and modelling. As with any mineral resource estimate there is uncertainty inherent in the estimation process. There is a risk that the grades and metallurgical recoveries may be lower than currently modelled. There is also a risk that the interpretation of the results is inaccurate and that less mineralized material is present than is currently modelled. The estimate of Mineral Reserves may be materially affected by metal prices, environmental, permitting, legal, title, taxation, socio-political, marketing, infrastructure development, or other relevant issues
Additional exploration and test-work will potentially reduce this risk as the project is advanced.
The QP considers the scale and quality of the mineral resources at the Project to indicate favorable conditions for future extraction and any uncertainties should be resolved through additional work.
The mining concepts for CuMo are largely proven. The adoption of autonomous equipment does possess some risk in that federal and local regulators may require extensive efforts by proponents to ensure the safety of their operations.
The CuMo open pit is envisioned to be a large, deep pit (up to 3500 ft deep). With this comes the potential geotechnical risk for wall failures. While the author has assumed a relatively flat overall wall angle for the study (37°), there may be risks associated with yet unknown rock mass or structural geology conditions that may require consideration of even flatter slopes in places.
The technology envisioned in this study for bulk sorting, prompt gamma neutron activation analysis (PGNAA), has had limited application to molybdenum-copper deposits. While demonstrated for some low-grade copper deposits, testing is required to verify that molybdenum is measurable at the specific grades envisioned for CuMo.
As with bulk sorting technology, additional testing is required to better estimate the final results expected from particle sorting.
There is a risk that achieved recoveries could be lower than estimated, that throughputs will not be achieved and that costs may be higher than modelled. The process recovery, throughput and cost estimates will be refined as part of the pre-feasibility study.
| SMD | Cumo S-k 1300 Technical Report | November 2022 |
Geologic 2CM027.001 CuMoCo. | Page 12 |
| 1.10.5 | Project Infrastructure |
The planned mine will be a green-fields site and requires construction of mine and process-related infrastructure including the TSF. Access roads in and around the project site will be required. There is a risk that the designs, costs and implementation timelines for the provision of this infrastructure may not be as anticipated, increasing costs and schedule.
At this time, no issues were identified that would materially impact the ability to eventually extract mineral resources at the project. Previous environmental analyses have identified the presence of a rare plant Sacajawea’s bitterroot (Lewisia sacajawa), and potential habitat for Endangered Species Act wildlife, and USFS sensitive species. These potential issues will need to be analyzed and disclosed in NEPA documents and potentially mitigated.
The mine will be located in an area used for weekend summer dispersed recreation and fall big-game hunting and is well-known in the Boise area. Organized environmental groups such as the Idaho Conservation League and Sierra Club are keeping their constituents informed citing issues of potential pollution of the Boise river which supplies drinking water to the city of Boise. As such, well-funded, organized opposition to mining activities should be anticipated.
Under the 1872 Mining Law as amended, ICMC has the legal right to develop the mineral resources on their mining claims. The USFS has a requirement to manage ICMC’s activities in accordance with its mining regulations at 36 CFR 228A and must ensure compliance with the requirements of the National Environmental Policy Act. As defined in law and regulations, the USFS is limited in that it may not deny ICMC’s mining plan of operations provided that the activities proposed are reasonably incident to mining, not needlessly destructive, and comply with applicable federal, state, and local laws and regulations. The USFS does not have the authority to impose unreasonable requirements that would have the effect of denying the statutory right to explore and develop the mineral resource, provided the mining plan of operations otherwise meets the intent of applicable laws and regulations (USFS 2018).
There is a risk that the mining plan of operations would identify and characterize issues that may lengthen the timeline and increase the costs of the permitting the project. Note that the STUDY described in this report does not quantify the timeline and costs for the pre-construction and permitting activities.
Table 20-1 in Section 20.2 summarizes the federal, state, and local authorizations and permits that will be required for mining. No applications for mining authorizations and permits have been filed with federal, state, and local agencies. Reclamation bonds will have to be posted with the state of Idaho and the USFS.
Project Strategy Risk
Overall, the author considers that the likelihood of a major revision to project strategy emerging from the pre-feasibility study to be moderate. Mineral sorting as contemplated in this study is not a mature technology, and there is a risk that the assumptions used may not prove accurate. Elimination of the mineral sorting pre-process from the strategy has the potential to materially reduce the economic proposition of the project.
| SMD | Cumo S-k 1300 Technical Report | November 2022 |
Geologic 2CM027.001 CuMoCo. | Page 13 |
Commodity Price Risk
There is a risk that commodity prices may not be consistent with assumptions made in this study. In particular, molybdenum, which contributes to the majority of the project value is historically subject to significant price volatility.
Capital Cost Risk
There is a risk that the capital required to build and operate the project may be higher than that forecast in this study. The author recommends that the precision of the estimates be refined at the pre-feasibility study and feasibility study before commitment to project construction is made.
Operating Cost Risk
There is a risk that the operating costs incurred to operate the project may be higher than that forecast in this study. The author notes that variability in the operating cost drivers (productivity, input costs and labor costs) over time is expected. The analysis assumes constant conditions but is best thought of as reflecting an expectation of average costs. The author recommends that the precision of the estimates be refined in the pre-feasibility and feasibility studies before commitment to project construction is made.
Schedule Risk
There is a risk that the schedule to build the project may vary from that assumed in the study. This is an asymmetrical risk, with significantly more downside scope than upside. This risk is exacerbated by the seasonality of the location, with somewhat difficult construction conditions occurring in some winter months. Small delays have the potential to be more significant than, might otherwise be the case, if they push critical path activities into winter months, thereby incurring a much longer delay.
Process Recovery Risk
There is a risk that achieved recoveries could be lower than estimated, reducing the revenue and economic returns of the project. The process recovery estimates will be refined as part of the feasibility study.
Permitting and Pre-construction Schedule Risk
This was not explicitly considered for the purposes of this study in the economic analysis as the analysis is conducted only from the commencement of construction. Nevertheless, the risk of longer-than-anticipated permitting timeline will reduce the project value is considered from “today” forward.
| 1.11 | Project Opportunities |
The exploration drilling and thus mineral resource model for CuMo is constrained on the western extents of the deposit. There is potentially an opportunity with increased exploration to expand the resource to the west, thus offering either more process feed within the current envisioned open pit or increasing the size of the open pit to the west.
| SMD | Cumo S-k 1300 Technical Report | November 2022 |
Geologic 2CM027.001 CuMoCo. | Page 14 |
With increased knowledge of the rock mass and structural geology, through additional geotechnical field programs and investigation, there is potential to steepen the wall angles for CuMo, potentially reducing and/or deferring some mining costs.
Further consideration of high angle conveying solutions in combination with semi-mobile crushing and conveying (IPCC) concepts could highlight opportunities for cost savings at CuMo. Applying IPCC to sort feed, which needs to be crushed either way and is up to 50% of the mined material, poses the greatest opportunity.
The bulk sorting analysis was conducted on drill core that was sampled on a standard 10 ft interval. Thus, heterogeneity could only be assessed down to this scale. With multiple stage sorting and splitting, smaller size packets of material could be measured. As heterogeneity increases with reduced scale, there is potential that better segregation of waste, mill feed and middlings is possible. The opportunity would be for increased waste rejection and ultimately reduced middlings fractions to improve the economics of the project.
Ultimately, the potential for exploitation of the heterogeneity of the deposit may not be firmly quantified by way of studies conducted on exploration-level data. Much higher-resolution sampling and sorting may be possible at an operational scale. This has the potential to enhance project economics, but the quantum of that improvement is difficult to quantify.
The field of mineral-sorting is the subject of significant research and development. There exists an opportunity for this project to exploit improvements in this technology.
Additional metallurgical work to determine optimum grind size (the current assessment is based on the finest grind tested to date), analyze recoveries of the various metals in the proposed unit operations, and analyze the effects of the higher grade coming from the mineral sorters on metal recoveries. This has the potential to improve project economics.
Optimization of reagents to reduce costs and improve metallurgical recoveries has the potential to improve recoveries.
There may be opportunity to economically recover tungsten from the mineralized material.
| 1.11.5 | Project Infrastructure |
Further studies may allow for optimization of infrastructure design, costing and schedule. Whilst optimization is worth pursuing, the author views modification to the infrastructure concepts to be unlikely to materially affect the economic proposition at a strategic level for the project.
| SMD | Cumo S-k 1300 Technical Report | November 2022 |
Geologic 2CM027.001 CuMoCo. | Page 15 |
| 1.11.6 | Economic Opportunities |
Real Option Value
In the case of a large, long-life open-pit mine such as is contemplated for the CuMo project, there exists significant optionality that can be leveraged to improve project cashflows and values. The simple sensitivity analysis conducted in Section 22.12 assumes a constant operating strategy, even as assumptions are varied. In practice, management has the option to alter strategy in response to those variations. Downsides can be mitigated, and upsides can be leveraged for greater returns.
It is also expected that the mine would run using a dynamic cut-off policy where sorting strategies and cut-offs, mill-feed cut-offs, stockpiling strategies and mining rates will all be varied in real time to maximize returns as prices and costs vary. The benefits of this strategy are not reflected in the central estimate approach to valuation summarized in this report.
Project Strategy Opportunity
While the probability of a major revision to project strategy can be considered moderate, careful consideration and revision of the strategic decisions should be a feature of studies going forward. In particular, effort should be made to enhance the optionality of the project, particularly where this is a low-cost investment.
Commodity Price Opportunity
There is a risk that commodity prices may not be consistent with assumptions made in this study. Higher prices, both realized and forecast, would lead to re-optimization of the mine and processing plans with a potential to create additional value beyond that shown by the sensitivity analysis summarized in Section 22.11.
Capital Cost Opportunity
Opportunities to reduce or defer capital expenditure may be realized in future studies. Care should be taken when considering the relationship between lower capital opportunities and technical risk to the project.
Operating Cost Opportunity
Operating costs may be lower than forecast for the purposes of this study. Lower costs should feed into both strategic and short-term mine planning, to allow optimization of stockpiling, sorting and mill feed strategies.
Schedule Opportunity
This risk is highly asymmetric. The author considers that the opportunity to execute a significantly shorter construction program is low. The author cautions that optimized schedules with multiple critical or near-critical path activities will contain additional embedded risks.
| SMD | Cumo S-k 1300 Technical Report | November 2022 |
Geologic 2CM027.001 CuMoCo. | Page 16 |
Process Recovery Opportunity
Further metallurgical test-work will allow for optimization of the process flow sheet and plant design in the pre-feasibility and feasibility studies. Better than planned recoveries are possible.
Pit Slope Angle Opportunity
This is not considered to be a significant opportunity from an economic perspective. Strip ratios are relatively low, and incremental change in waste-movement volumes do not impact the overall project economics significantly.
| 1.12 | Conclusions and Recommendations |
Exploration work consisting mainly of drilling is required to reach feasibility. It is estimated that a total of 33 additional holes for 71,000 ft plus an additional five geotechnical holes for 12,000 ft on the deposit plus additional 74,800 ft allocated to condemnation drilling of waste dump, mill site and tailings pond areas, making a total of 157,8000 ft of drilling budgeted. This drilling is broken into the following categories:
| ● | Orientated geotechnical drilling – requires orientated core recovery system, |
| ● | Drilling for metallurgical sample – large diameter hole (PQ size) recommended, and |
| ● | Condemnation drilling waste dump, mill and tailings site. |
The shortest time to complete this work will be two seasons using four drill rigs each season.
The author provides these recommendations for the next steps of geotechnical assessment:
| ● | Geotechnical database for quality assurance and quality check assessment (to address the inconsistencies and potentially poor data observed in the existing data set) |
| – | Select a sub-set (~10%) of resource drill holes that give good spatial coverage of the proposed pit walls, and from multiple drilling campaigns |
| – | Undertake quantitative basic geotechnical logging using the full core photographs of these drill holes (total core recovery (TCR), solid core recovery (SCR), rock quality designation (RQD) and fracture frequency - FF/m) |
| – | FF/m vs RQD plots for both data-sets |
| – | Comparison of the values in the database with the photo-logged values |
| SMD | Cumo S-k 1300 Technical Report | November 2022 |
Geologic 2CM027.001 CuMoCo. | Page 17 |
| – | Assessment of differences in order to determine whether variance is systematic or random, and consequently decide on the respective approach to address (e.g. apply correction factor, re-logging more of the drill holes) |
| – | Qualitative assessment of the rock susceptibility to deterioration by comparing core in the photos (fresh), to the current condition of the stored core (aged) |
| ● | Major structures assessment |
| – | Log the photos of the core for major structures |
| – | Develop conceptual integrated litho-structural 3-D model |
| ● | Geotechnical-specific diamond-cored drill holes targeted to provide coverage of the proposed interim and ultimate pit walls, and compatible with the pit depth |
| – | Geotechnical logging to RMRB89 system (historical logging to RMRL90 which is typically for underground mine applications) |
| – | Field (empirical and point load) and laboratory (uniaxial and triaxial compressive strength and direct shear) testing of fresh core to determine intact rock strength |
| – | Calculate RMR values and conduct comparison with lithology, alteration and mineralogy zones of the 3-D geology model to establish broad geotechnical domains |
| – | Establish pit sectors and domain-representative sections to conduct pit slope stability analyses and select pit design angles |
The author recommends further study of the application of high angle conveying of sort feed at CuMo.
The author further recommends the continued consideration of autonomous haulage for CuMo, with commensurate refinement of performance parameters and costs.
The author recommends that CuMoCo engage with bulk sorting technology providers to advance testing of penetrative technologies (e.g. PGNAA) for the measurement of molybdenum in lower grade applications.
Additional scanning of the existing core to examine heterogeneity at a finer level than the 10 ft intervals used in the current study is recommended. Further testing of existing particle sorting technologies/machines to look for improvements in throughput is recommended.
Metallurgical aspects to be studied were highlighted in the preliminary metallurgical analysis, some of which require larger samples to finalize the detailed flow sheet and determine how many cleaning stages will be required.
| SMD | Cumo S-k 1300 Technical Report | November 2022 |
Geologic 2CM027.001 CuMoCo. | Page 18 |
A critical part of the analysis is a grinding-versus-recoverability study, since in the previous study, only two grinding sizes were studied: coarse and fine. The fine grind promised to be more economically favorable despite the increase in costs. Further study with multiple grinding size options is required to determine an optimum grinding system. An intermediate grind for example in the range between 71 to 106 microns P80, would allow single stage SAG milling to be evaluated for reduced comminution energy cost, lower operating and maintenance labor in comminution and dewatering, and easier discard of a coarser tailing product when compared to the present grind P80 of 63 microns. The single stage SAG milling concept also allows for low cost future expansion of the initial lines provided by simply adding a ball mill to each SAG mill line to create about double the tonnage capability, without adding feed bins or conveyors. SAG mills with diameter/length aspect ratios over two are needed to make this work.
Work will consist of collecting and analyzing sufficient large bulk samples to determine the optimum flow sheet for the deposit. This work is expected to be further supported by a variability study to analyze variations within the deposit. Typically, a total of 100 to 150 twenty-kilogram samples will be used for the variability study.
| 1.12.6 | Tailings Management |
Engineering studies, including TSF design and potential water management and treatment design, including:
| ● | Updating the TSF and Clear Creek Waste Facility designs based on field investigation results |
| ● | Developing tailings deposition plan and waste placement sequence to match pit development and mill output |
| ● | Detailed analysis of the water and load balance to predict the accumulation of mill reagents in the process water circuit from the tailings |
At this time, no issues were identified that would materially impact the ability to eventually extract mineral resources at the project. A mining plan of operations and reclamation cost estimate must be prepared to identify locations of the mine, waste rock dumps, roads (haul and access), power and water line corridors from the source to the point of use, mill, tailings storage facility, and other support facilities. Operating plans must be developed in conjunction with the mining plan of operations. ICMC should develop robust reclamation and closure plans for the facilities. ICMC should also begin acquiring any necessary water rights. Stakeholder outreach should continue.
Once the facility locations have been determined, ICMC should coordinate with state and federal agencies to identify the baseline studies that will need to be completed to support the development of an environmental impact statement and initiate those studies.
Previous environmental analyses have identified the presence of a rare plant Sacajawea’s bitterroot (Lewisia sacajawa), and potential habitat for Endangered Species Act wildlife, and USFS sensitive species. These potential issues will need to be analyzed and disclosed in NEPA documents and potentially mitigated.
Organized environmental groups such as the Idaho Conservation League and Sierra Club are keeping their constituents informed so as to coordinate opposition to the project. As such, well-funded, organized opposition to mining activities should be anticipated.
| 1.12.8 | Plan and Budget for Additional Work |
Table 1-8 sets out a summary of work expected to be completed prior to a commitment to construction. The estimated time frame for this work program is three years.
| SMD | Cumo S-k 1300 Technical Report | November 2022 |
Geologic 2CM027.001 CuMoCo. | Page 19 |
Table 1-8: Budget for additional work
| Item | Additional Information | Budget (000s $) |
| Diamond Drilling | | |
| Delineation, infill, metallurgy | 48,097 m (157,800 ft) @ $100/ft | 15,780 |
| | | |
| Road Construction | 2 km @ $50,000/km | 100 |
| | | |
| Sample Preparation and Analysis | 8,800 @ $60 each | 528 |
| Metallurgical Testing | Sample Collection, etc. | 125 |
| | Batch Round of Testing | 1,000 |
| | Variability Test-work | 1,200 |
| Land Acquisition and Staking Costs | | 8,000 |
| Environmental Studies | Environmental Assessment | 713 |
| | Baseline Studies Startup | 12,500 |
| | Environmental Plan of Operations | 800 |
| | Environmental Impact Statement | 23,500 |
| | Permitting | 3,000 |
| Engineering Studies Scoping | Mill Site, Tailings Site Analysis | 550 |
| | Intergoverment Task Force Creation | 500 |
| | Mining Plan of Operations | 1,200 |
| | Pre-feasibility Study | 5,500 |
| Mobilization-Demobilization | | 427 |
| Road Maintenance | | 325 |
| Supervision and Project Management | Supervision | 225 |
| | Corporate Manager | 360 |
| | Project Manager | 240 |
| | Assistant Geologist(2) | 364 |
| | Technicians (12) | 1,174 |
| Vehicles | 5 Vehicles | 150 |
| Accommodation and Food | 30 Personnel | 760 |
| Travel | | 42 |
| Project Office and Warehouse | | 1,225 |
| Land Filing Fees | Current BLM: $155/claim/year | 87 |
| Land Filing Fees | Projected Additional Filing Fees | 256 |
| | | |
| Consultants | (Mining, Metallurgical and Marketing) | 575 |
| Resource Modeling | | 1,650 |
| Public Relations and Project | Public Relations and Legal, etc. | 2,550 |
| Presentation | Liaison County and State Officials | 1,250 |
| Subtotal | | 86,655 |
| Contingency | | 13,345 |
| Total | | 100,000 |
| SMD | Cumo S-k 1300 Technical Report | November 2022 |
Geologic 2CM027.001 CuMoCo. | Page 20 |
| 2 | Introduction and Terms of Reference |
The CuMo project is an early-stage molybdenum-copper exploration project, located approximately 37 miles northeast of Boise, Idaho, USA. CuMoCo holds its interest in the CuMo project through its direct ownership of patented and unpatented mining claims.
This technical report summary (TRS or Report) was commissioned by the registrant, International CuMo Mining Corp. (CuMoCo), for its Copper-Molybdenum-Silver Project (CuMo or Project) In Boise County, Idaho for the purpose of reporting an initial assessment. ICMC is an Idaho company exploring options for the development and restoration of the project area.
This Report is the inaugural TRS developed for the CuMo Project in accordance with United States SEC S-K 1300 regulations. The TRS summarizes a 2020 Preliminary Economic Analysis (PEA) Technical Report (SRK, 2020) that was completed under Canadian Securities Administrators National Instrument (NI) 43-101 guidelines and published June , 2020 with the following notable differences:
| ○ | An additional set of summary cash flows were produced that do not include inferred resources |
| ○ | The TRS is classified as a Initial Assessment study whereas the 2020 PEA was classified as a Preliminary Economic Analysis . |
The Mineral Resource estimates for the Project were examined by the author and determined to be in conformity with Committee for Mineral Reserves International Reporting Standards (CRIRSCO) “International Reporting Template for the public reporting of Exploration Targets, Exploration Results, Mineral Resources and Mineral Reserves” as adopted by the International Council on Mining & Metals November 2019. The mineral resources are reported in in accordance with §§229.1300 through 229.1305 (subpart 229.1300 of Regulation S-K).
The Author, Shaun Dykes is responsible for the preparation and all aspects of this Technical summary, which is based on the work contained in an orginal Canadian 43-101 report
2.3 Sources of Information
This report is based on information collected by the author during his work on the project from 2005 to present, numerous site visits and on additional information provided by CuMoCo throughout the course of the study.
The authors have no reason to doubt the reliability of the information provided by CuMoCo. The authors have not performed verification studies with respect to information provided by CuMoCo other than as described explicitly in this report.
Note: Throughout this report, United States Dollars unless otherwise specifically noted.
| 2.5 | Shaun Dykes has been a regular on the project since inception in 2005 and has visited the site on a regular basisPrevious Reports |
This Report is the initial TRS completed for ICMC to maintain compliance with SEC regulations. The report is being completed at an initial assessment level. The resources reported herein are current as of the end of November 2022. The information in the TRS is based upon the “Preliminary Economic Assessment & NI 43 101 Technical Report for the CuMo Project, USA” effective June 4, 2020, and Independent report prepared in compliance with the Canadian National Instrument (NI) 43-101 – Standards for Disclosure of Mineral Projects within Canada. Multi Metals Development Ltd, formerly American Cumo Mining Copr., is listed on the Toronto Venture Stock Exchange (TSXV:MLY)..
| SMD | Cumo S-k 1300 Technical Report | November 2022 |
Geologic 2CM027.001 CuMoCo. | Page 21 |
| 3 | Property Description and Location |
The CuMo property is located approximately 37 air miles northeast of the city of Boise, Idaho, USA (Figure 4-1). It is situated in the northern portion of the Grimes Pass area on the USGS 1:62,500 Placerville Quadrangle (15’ Series) within T7N and T8N, R5E and R6E, in Boise County, Idaho (Figure 4-2). The Latitude at the approximate center of CuMo property is 44 degrees, 2’N and the Longitude is 115 degrees 47’ 30” W or UTM coordinates of 597,500E, 4,876,000N (NAD 27 CONUS).
The property consists of 126 unpatented and un-surveyed contiguous mining lode claims covering an area of approximately 3,260 acres and 41 fully patented claims covering an area of 739 acres. Most of the claims consist of full-sized, 600 ft by 1500 ft claims (20.66 acres each). However, the total includes 27 fractional claims where the new claims were staked over existing claims. The claims are shown in Figure 4-2 and the claim information is listed in Appendix 1. Unpatented claims have the mineral rights with the surface owned by the federal government. Patented claims are private property and cover both the surface and mineral rights.
In Idaho, staked claims expire annually on September 1. An annual fee of $155/claim must be paid to the BLM prior to Aug 31, 2019 or all claims will expire on Sept 1, 2019. At $155/claim, CuMoCo must make annual payments to the BLM of $28,675 to keep all claims in good standing.
For patented claims, since they are owned outright, taxes are assessed by the county on a yearly basis. Currently the yearly tax bill for the patented claims is approximately $450. It varies as it is dependent upon assessed value and the county tax rate which changes from year to year.
On October 13, 2004, CuMoCo completed an “Option to Purchase Agreement” with CuMo Molybdenum Mining Inc. to purchase eight unpatented mineral claims located in Boise County, Idaho, USA known as “CuMo Molybdenum Property”. As part of the original CuMo and CuMoCo agreement, all claims acquired within five miles of the CuMo 1-8 claims became part of the option deal. Therefore, all the new claims referred to in this report as part of the CuMo Molybdenum Property are automatically subject to the terms outlined in that agreement.
Terms of the agreement are:
| 1. | Advance royalty payments: |
| ● | $10,000 upon signing (completed) |
| ● | $10,000 after 60 days (completed) |
| ● | $5,000 after 6 months (completed) |
| ● | $20,000 1st year anniversary (completed) |
| ● | $20,000 2nd year anniversary (completed) |
| SMD | Cumo S-k 1300 Technical Report | November 2022 |
Geologic 2CM027.001 CuMoCo. | Page 22 |
| ● | $15,000 3rd year anniversary (completed) |
| ● | $15,000 every 6 months thereafter (up-to-date) |
These payments are to be credited against a 1.5% net smelter return (NSR) which reduces to 0.5% NSR after cumulative payments of $3,000,000.
| ● | $25,000 during the first year (completed) |
| ● | At least $50,000 each year thereafter (up-to-date) |
| ● | On January 21, 2005, CuMoCo entered into an option agreement with Kobex Resources Ltd. (Kobex), whereby Kobex could acquire a 100% interest in the CuMo Molybdenum Property and another property in Australia. Under the terms of the Agreement, Kobex would earn a 100% undivided interest in these properties in consideration of cash payment of $5,000,000, 12,500,000 treasury shares and $10,000,000 of work expenditure commitment. |
On October 6, 2006, Kobex surrendered all rights and interests in the CuMo property to CuMoCo.
CuMoCo has completed all payments since 2006 and the property is in good standing.
February 14, 2017 CuMoCo announced it has purchased 20 claims in the area around the CuMo project from a group of local prospectors. The 20 unpatented mining claims cover an area of approximately 400 acres. The purchase price of 100% ownership the claims was one $250,000 silver unit plus one million shares of CuMoCo.
Note: A silver unit is a seven-year exchange approved debenture that can be converted into the right to buy silver for $5 per ounce from any future production at CuMo. The debenture pays 8.75% interest per annum.
In April 25, 2017, CuMoCo announced that its wholly-owned subsidiary, ICMC, has completed an option to purchase agreement for 36 patented mining claims, covering an area of approximately 640 acres adjacent to the CuMo project. Patented claims contain the surface rights as well as the mineral rights. The consideration payable for the claims is as follows:
| ● | Upon closing date of the agreement, the sum of $320,000 in cash, two (2) Silver Units in the aggregate principal amount of $500,000 and such number of CuMoCo shares having a value of $322,500 (with the CuMoCo shares being issued at a price equal to the 10-day weighted average trading price of the CuMoCo shares on the TSXV as of the last business day prior to the Closing Date) |
| ● | Upon the first anniversary of the Closing Date, $320,000 in cash, one (1) Silver Unit in the aggregate principal amount of $250,000 and such number of CuMoCo shares having a value of $322,500 (with the CuMoCo shares being issued at a price equal to the 10-day weighted average trading price of the CuMoCo shares on the TSXV as of the last business day prior to the first anniversary of the Closing Date) |
| SMD | Cumo S-k 1300 Technical Report | November 2022 |
Geologic 2CM027.001 CuMoCo. | Page 23 |
| ● | Upon the second anniversary of the Closing Date, $320,000 in cash, one (1) Silver Unit in the aggregate principal amount of $250,000 and such number of CuMoCo shares having a value of $322,500 (with the CuMoCo shares being issued at a price equal to the 10-day weighted average trading price of the CuMoCo shares on the TSXV as of the last business day prior to the second anniversary of the Closing Date) |
| ● | Upon the third anniversary of the Closing Date, $320,000 in cash, one (1) Silver Unit in the aggregate principal amount of $250,000 and such number of CuMoCo shares having a value of $322,500 (with the CuMoCo shares being issued at a price equal to the 10-day weighted average trading price of the CuMoCo shares on the TSXV as of the last business day prior to the third anniversary of the Closing Date) |
Payment of the Option Payments (except for the issuance of the American CuMo shares) may be accelerated at CuMo’s option.
In July 17, 2017, CuMoCo announced that it had signed a mining claims purchase agreement effective as of July 6, 2017 (the “Purchase Agreement”) between CuMoCo and its wholly-owned subsidiary, ICMC, and CuMo Molybdenum Mining Inc., Western Geoscience Inc. and Thomas Evans (collectively, the “Parties”). CuMoCo is to acquire from the Parties a 100% interest, including any Net Smelter Royalties owned by the parties, in the CuMo project which is currently under option, pursuant to an option agreement between CuMoCo and CuMo Molybdenum Mining Inc. dated October 13, 2004 and amended on January 14, 2005 (the “Option Agreement”).
As of the effective date of this report all agreements remain in place as described above.
| SMD | Cumo S-k 1300 Technical Report | November 2022 |
Geologic 2CM027.001 CuMoCo. | Page 24 |
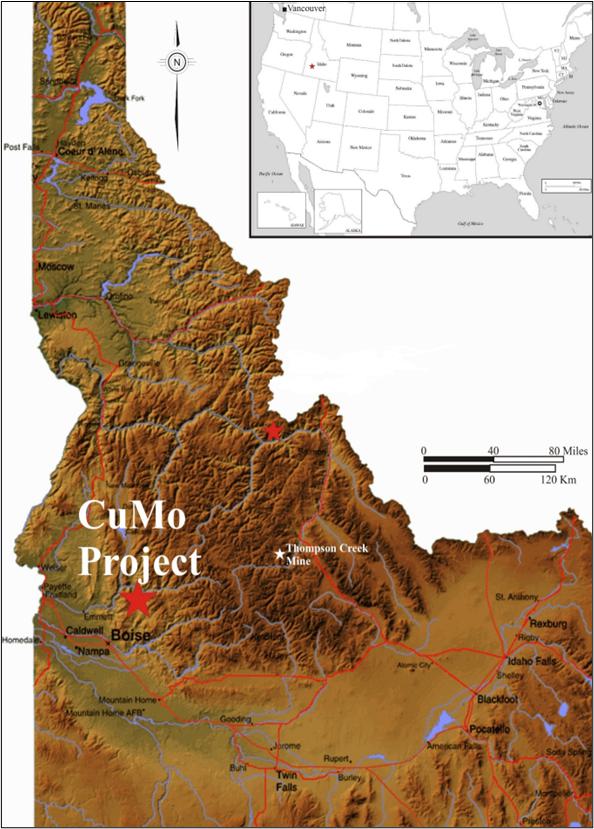
Source: Giroux et al, 2015
Figure 4-1: CuMo property location map
| SMD | Cumo S-k 1300 Technical Report | November 2022 |
Geologic 2CM027.001 CuMoCo. | Page 25 |
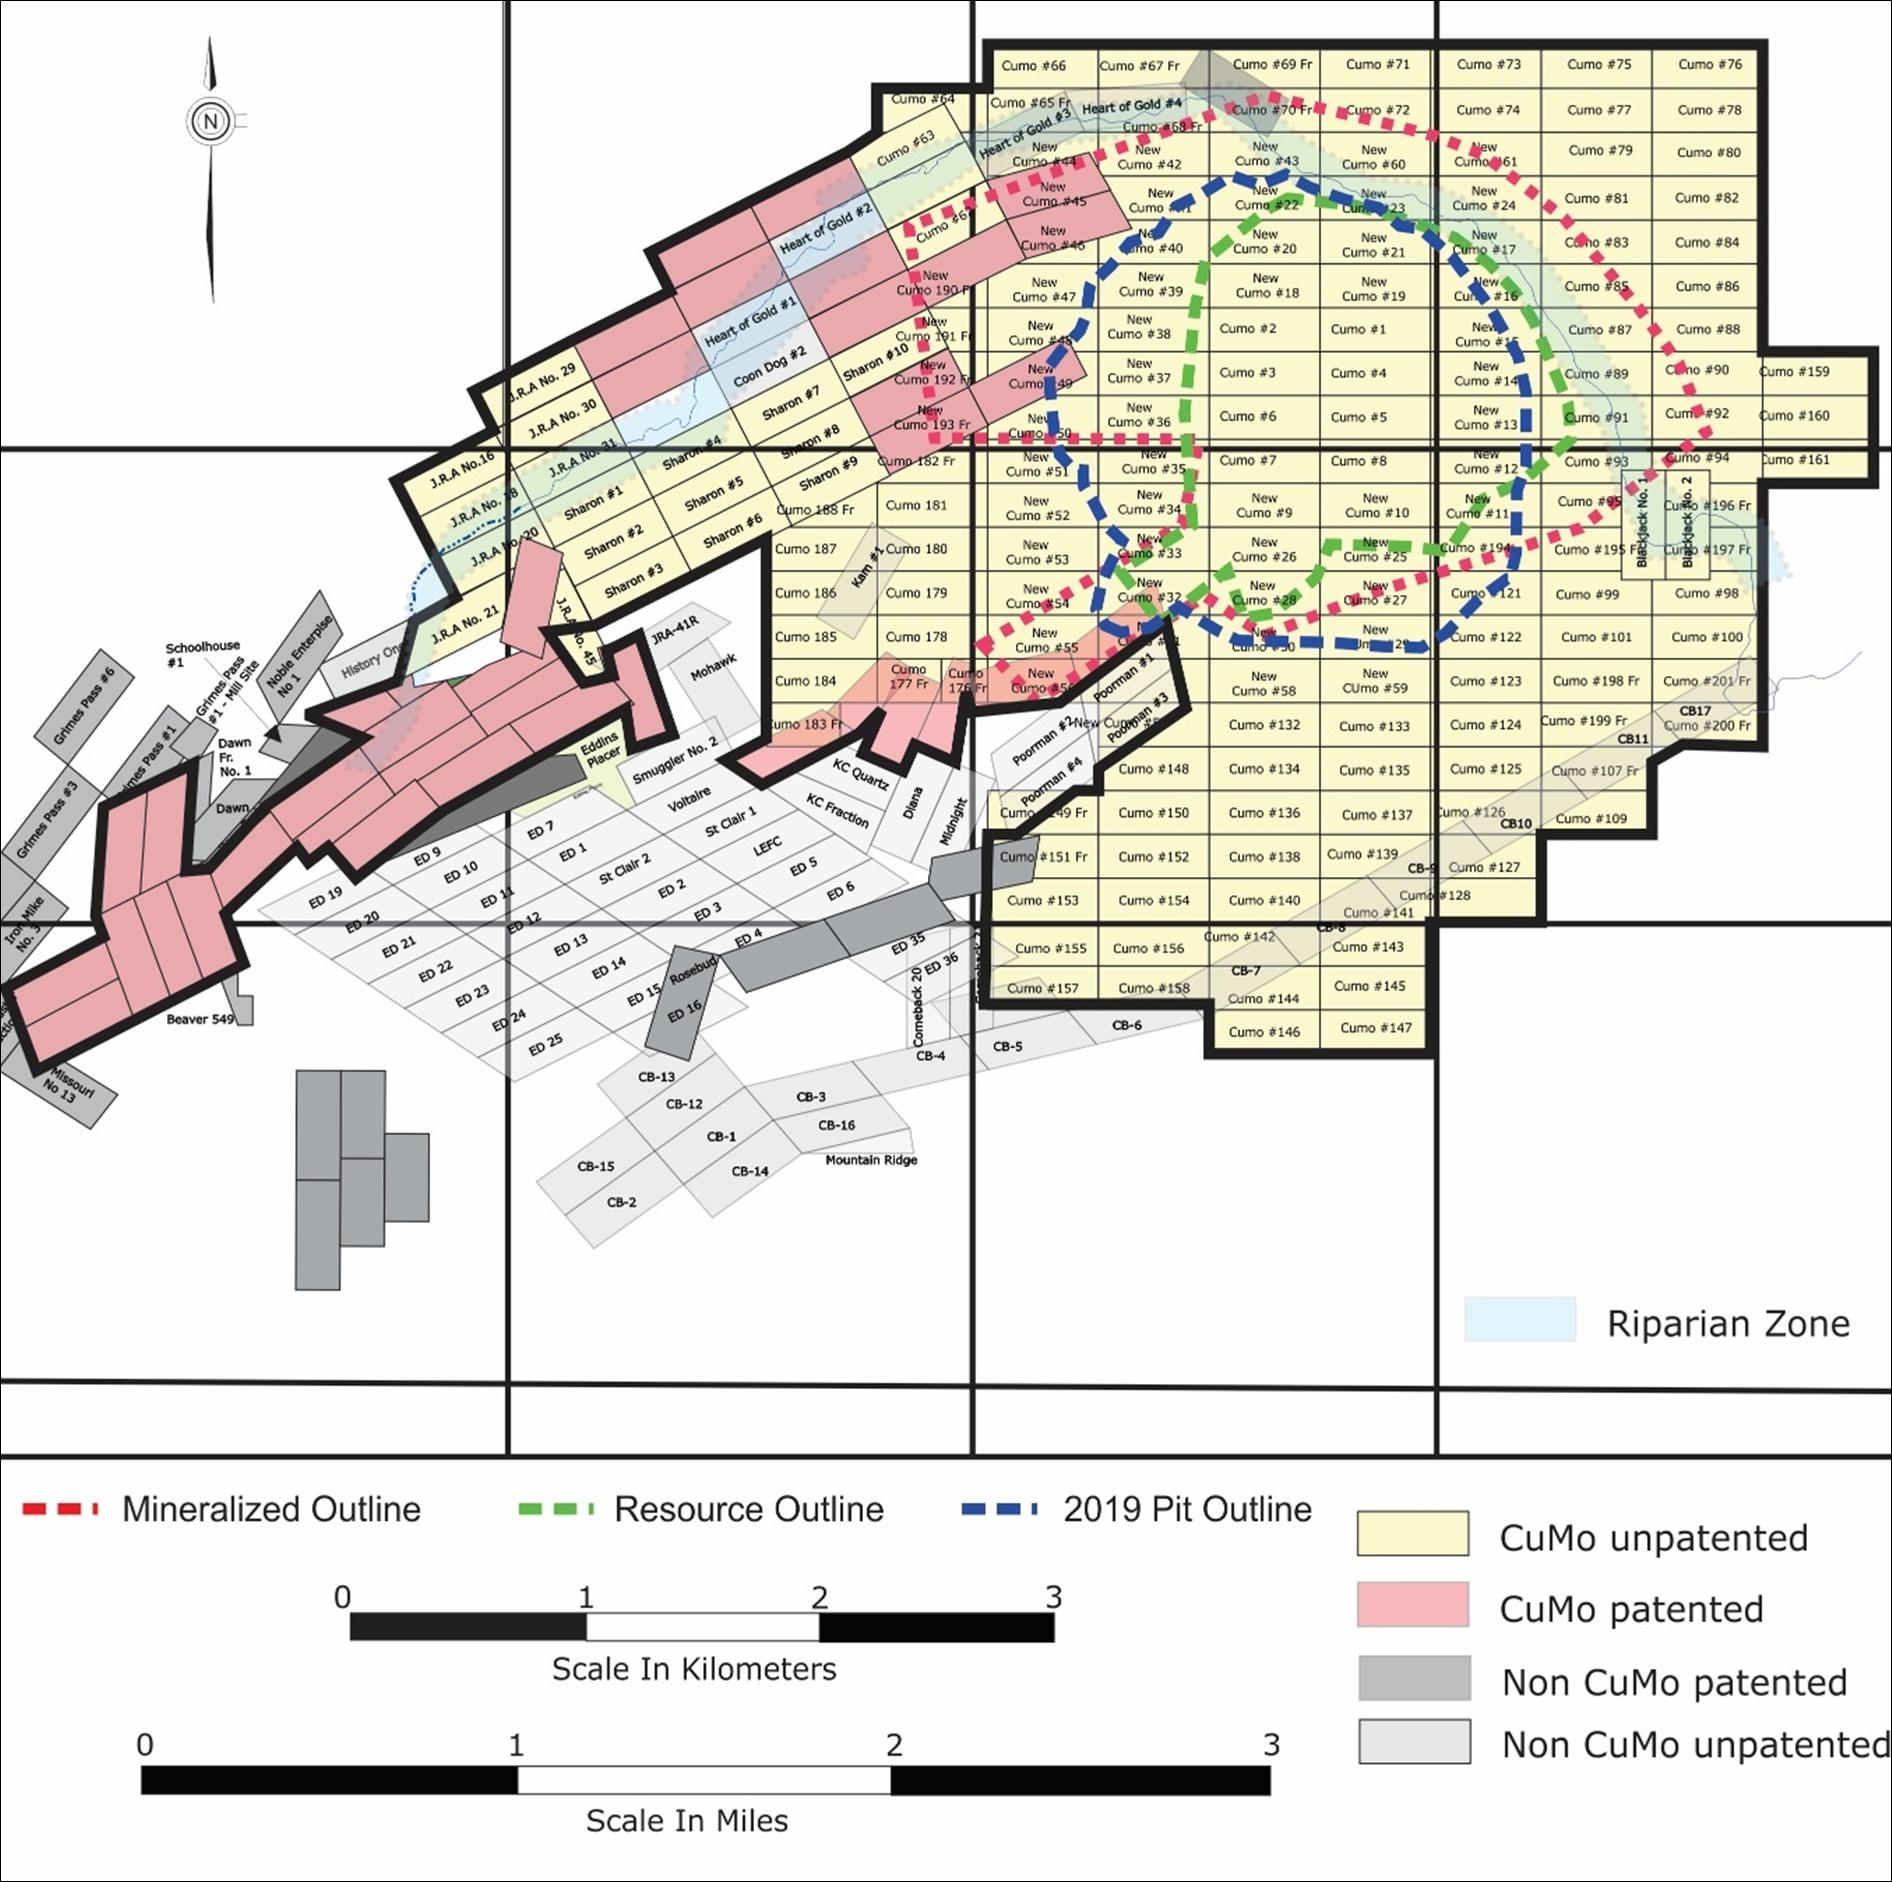
Source: Giroux et al, 2015 modified 2019
Note: The mineralized outline of the deposit in this figure is the outline of the geologically-defined potentially mineralized zone2. For clarity, it is not the outline of the current resource, nor of the resource constraining pit (resource outline) which are inside the mineralized outline of the deposit. It is also not the outline of the pit design (2019 pit outline) used in this initial assessment report.
Figure 4-2: Claim location map for the CuMo property
The change since the 2015 report in the outline of the deposit is a result of reconnaissance work performed in 2017 by CuMo field geologists on the recently acquired claims.
2 Defined according to geology, lithology and/or mineralogy without explicit consideration of grades or economic potential
| SMD | Cumo S-k 1300 Technical Report | November 2022 |
Geologic 2CM027.001 CuMoCo. | Page 26 |
| 3.4.1 | Environmental Regulations |
The CuMo project will be subject to federal, state of Idaho, and local regulations. Key regulations to which the project will be subject governing exploration and mining design, operations, and reclamation include:
| ● | General Mining Act of 1872, 30 U.S.C. §§ 22-42 |
| ● | Mining and Minerals Policy Act of 1979 |
| ● | 36 Code of Federal Regulations Part 228 administered by the USFS |
| ● | Idaho Administrative Procedures Act (IDAPA) 20.03.02 Rules Governing Exploration, Surface Mining, and Closure of Cyanidation Facilities administered by the Idaho Department of Environmental Quality |
| ● | IDPA 16.01.02, Water Quality Standards and Wastewater Treatment Requirements |
| ● | IDPA 20.03.02, Rules Governing Exploration and Surface Mining Operations in Idaho |
| ● | IDAPA 58.01.01 Rules for the Control of Air Pollution, administered by the Idaho Department of Environmental Quality |
| ● | IDAPA 58.01.02 Water Quality Standards, Anti-Degradation, administered by the Idaho Department of Environmental Quality |
| ● | IDAPA 58.01.11 Ground Water Quality Rule, administered by the Idaho Department of Environmental Quality |
| 3.4.2 | Environmental Liabilities |
There are currently no known environmental liabilities on the property. The company has a $300,000 reclamation bond on deposit once the permits are re-issued.
It is possible, that with the development of a detailed mining plan of operations and the more detailed investigation of aspects of the property that are associated with that plan, that as-yet unknown environmental liabilities and/or issues may be identified.
| 3.4.3 | Other Significant Factors and Risks |
At this time, no specific issues have yet been identified that would materially impact the ability to eventually extract mineral resources at the project. That is, any other significant factors and risks that may affect access, title, or the right or ability to perform work on the property are not yet known.
However, ICMC should be prepared to address potential issues associated with but not limited to the following aspects:
| ● | Water including supply, water rights, and delivery system and potential impacts |
| ● | Water management (stormwater, contact/non-contact water, water quality) |
| SMD | Cumo S-k 1300 Technical Report | November 2022 |
Geologic 2CM027.001 CuMoCo. | Page 27 |
| ● | Geochemistry of ore, waste rock, tailings solids and solution, and post-mining pit lake |
| ● | Threatened, endangered, and special status plant and animal species |
| ● | Transportation and access |
Exploration on federal lands requires an authorization to conduct exploration except for sampling of rocks and soils by hand and other activities that create no land disturbance. There are three levels of permits reflecting increasing disturbance:
| ● | The lowest level of authorization is a Categorical Exclusion. This is the least intense disturbance and requires some public notification. The authors understand that track mounted auger/rotary drilling with no new road clearing would fit in this category according to USFS personnel. |
| ● | Environmental Assessment requires an in-depth study with 30 days for public comment, plus additional time for appeal. The authors understand that drilling with a reverse circulation (RC) rig using water, new road construction, etc., would require this level of permit. USFS personnel suggest that one year may be required to receive an authorization. Spot studies on archaeology and sensitive plant species would be required prior to disturbance. |
| ● | Environmental Impact Statement (EIS) is the highest permit level and would be required for mine development. |
Approval for a diamond drilling program has been obtained from the USFS, to be carried out from the existing network of drill access roads and was permitted under a Categorical Exclusion, issued in 2008. An application for a Water Use Permit for diamond drilling purposes was originally filed with the Idaho Department of Water Resources in 2008, that permit is renewed annually.
In January 2007, an exploration plan of operations was submitted for an expanded exploration program involving construction of new roads for drill access, and the USFS gave notice that an Environmental Assessment is required for that program. Note: This exploration plan of operations was filed while the Categorical Exclusion was active and that no mining plan of operations has been prepared.
On June 14, 2010, the Environmental Assessment was completed and submitted for public review and hearing during a mandated 90-day period. On February 14, 2011, A Finding of No Significant Impact was delivered by the USFS. During the mandated 45-day appeal period, one environmental group (Idaho Conservation League) submitted an appeal of the USFS decision.
On May 17, 2011, the USFS denied the appeal allowing CuMoCo to begin work under the new exploration permit following a mandatory 15-day stay period which ended on June 7, 2011. The permit covers all exploration work required to produce the information necessary to produce a feasibility study and lasts for up to five years.
| SMD | Cumo S-k 1300 Technical Report | November 2022 |
Geologic 2CM027.001 CuMoCo. | Page 28 |
The Idaho Conservation League et al, filed a challenge in the “United States District Court for the District of Idaho” on December 15, 2011: “Plaintiffs Idaho Conservation League, Idaho Rivers United, and Golden Eagle Audubon Society seek summary judgment reversing and remanding the USFS’s February 2011 approval of the CuMo Mine Exploration Project, in the upper Grimes Creek watershed of the Boise National Forest.” The USFS was named as defendant while CuMoCo was named as Intervener Defendant. CuMoCo has worked through the litigation process and filed a response brief and reply brief. The USFS has also filed response and reply briefs. The Idaho Conservation League also filed a reply brief.
On August 29, 2012, the judge in the case dismissed four of the five claims by the opponents but remanded the section on groundwater over for further study. As a result, on February 7, 2013 the USFS initiated a Supplemental Environmental Assessment in order to address the judge’s concerns. This worked culminated on April 13, 2015 with the re-issuance of a draft Finding of No Significant Impact.
In January 2016, the Idaho Conservation League and others filed a challenge in the United States District Court for the District of Idaho of the new April 15 decision.
On July 13, 2016, the judge in the case accepted the work on the groundwater but remanded the decision to give USFS time to study the effects of the 2014 Grimes Creek fire on a sensitive plant species. As a result, on August 7, 2016, the USFS initiated a Supplemental Environmental Assessment in order to address the judge’s concerns. Note: In 2018 this was renamed by the USFS to the Supplemental Redline Environmental Assessment. In 2016, another fire effected the property area and additional studies were required. The USFS is currently in process of preparing the updated report, which is expected to lead to a final decision in early 2020.
As of the effective date of this report all agreements remain in place as described in this Section 4.
At the current time there are no active permits as ICMC is waiting on the Supplemental Redline Environmental Assessment report and the final decision notice and finding of no significant impact.
| SMD | Cumo S-k 1300 Technical Report | November 2022 |
Geologic 2CM027.001 CuMoCo. | Page 29 |
| 4 | Accessibility, Climate, Local Resources, Infrastructure and Physiography |
International air travel is available from Boise, Idaho. The property is accessed by road from Boise by taking US State Highway 55 northerly for approximately 40 miles (65 km) to the town of Banks, Idaho, and then east on the Banks Lowman Road towards the town of Garden Valley for approximately 10 miles (16 km). One mile east of Garden Valley is a secondary road heading south across the Payette River. Following this secondary road, the western most edge of the CuMo claim block is approximately 10 miles (16 km) from Garden Valley.
Alternatively, access can be gained by traveling northeast from Boise along Highway 21 past the towns of Idaho City and Centerville, along Grimes Creek, and then over the Grimes Pass.
The project is situated in the southern section of the Salmon River Mountains which lie immediately west of the Rocky Mountains and are characterized by north-northwest trending mountain ranges separated by alluvial filled valleys. Topographic elevations on the CuMo claims range from 5,100 ft (1700 m) to 7,200 ft (2,400 m) above sea level.
The climate is defined by summer temperatures to a maximum of 100° F (38°C) and cold, windy winters with lows to -10° F (-23°C). Precipitation is moderately light with an average rainfall of 30 inches (<1 meter) and an average snowfall of approximately 140 inches (3.6 m). Vegetation in the project area consists of cedar, lodgepole pine, mountain mahogany, and juniper.
The area is serviced by the Idaho Power Company which supplies electricity to residents of Garden Valley, Lowman and Pioneerville. The nearest rail line is the Idaho Northern & Pacific line formerly operated by Union Pacific that runs through the town of Banks, approximately 20 road miles (32 km) to the west of the property.
Equipment, supplies, and services for exploration and mining development projects are available at Boise. There is also a trained mining-industrial workforce available in Boise.
Exploration and mining at the property can be conducted year-round, due to the established road system and its proximity to other infrastructure. The property is large enough to accommodate the current CuMo deposit exploration or mining operations including facilities. Potential waste disposal and tailings storage areas, currently outside the property, will require permits from federal and state agencies as discussed in Section 20 of this report.
The project will be located on patented claims owned or optioned by ICMC and public land administered by the USFS. The extent of public land used for mining purposes will be identified in the mining plan of operations. In the USA, with the exception of the patented claims owned or optioned by ICMC, all surface rights in the area of the current design are administered by the USFS and are not available for purchase but for lease. The NEPA process will disclose the potential impacts from construction, mining, closure, and reclamation activities and identify mitigation to avoid or ameliorate impacts prior to authorization of the mining plan of operations. These surface rights are granted at the time of a record of decision to place the mine into commercial production and they form part of the permitting process.
| SMD | Cumo S-k 1300 Technical Report | November 2022 |
Geologic 2CM027.001 CuMoCo. | Page 30 |
The Boise Basin was first explored following the discovery of placer gold deposits in 1862. Several lode gold deposits were discovered and developed immediately following the initial alluvial gold rush, with significant production occurring in the late 1800’s and early 1900’s. There are a number of lode prospects within approximately two miles of the CuMo property, some of which have recorded minor past production of base and precious metals. No production has occurred on CuMo itself.
The first interest in the CuMo property was shown during aerial reconnaissance by Amax Exploration in 1963. Follow-up geochemical rock and soil sampling indicated anomalous molybdenum and copper values. Forty claims were then staked, and three previously existing claims were optioned. A 2.5 mile (4 km) rough access road was constructed in 1964 to facilitate collection of rock samples and geological mapping. The property was subsequently relinquished due to the combination of contemporary economic conditions and initial sample grades.
In 1968, Curwood Mining Company staked 12 claims and undertook detailed mapping and geochemical rock sampling. This work indicated roughly coincident anomalies in copper, molybdenum and silver. Several trenches were excavated, and one line of dipole-dipole array IP geophysical survey was conducted.
In 1969, Midwest Oil Corp. optioned the property and conducted exploration drilling through 1972 (four short rotary holes (less than 100 ft) initially, which were later depended using diamond drilling, followed by six cored holes). Midwest also performed an IP survey in 1971 and an airborne magnetic survey in 1973. The IP survey indicated a pyrite halo on the north side of the deposit, although an alternative interpretation concluded “the combined IP data may indicate a halo effect but more probably shows an east-west trend to the rock types and mineralization” (Baker, 1983). The CuMo deposit did not have a strong magnetic signature, being somewhat of a plateau with surrounding highs.
In 1973, Midwest formed a joint venture with Amax and then subsequently Midwest was merged with AMOCO resulting in an Amax-AMOCO joint venture (JV) with AMOCO as operator. During the period 1973 to 1981, the Amax-AMOCO JV completed 30,822 ft of drilling (summarized in Table 6-1), surface geological mapping, re-logging of the core, road construction, an aerial topographic survey, and age dating. In 1980, Amax Exploration Inc. transferred its interest to Climax Molybdenum Company (Climax), also a subsidiary of Amax Inc. In 1982, Climax collected more than 300 soil geochemical samples from three different grids.
| SMD | Cumo S-k 1300 Technical Report | November 2022 |
Geologic 2CM027.001 CuMoCo. | Page 31 |
Table 6-1: Summary of historic drilling
| Year | Company | Holes | Footage | Meters | Comments |
| 1969 | Midwest | 4 | 378 | 115 | Rotary holes shallow due to water included in core |
| 1970 | Midwest | 0 | 653 | 199 | 2 rotary holes deepened with core to 400’ depth |
| 1971 | Midwest | 1 | 2,251 | 686 | One core hole deepened further to 1,884 ft |
| 1972 | Midwest | 3 | 1,892 | 577 | One core hole deepened from 810-1,416 ft |
| 1974 | Amax | 1 | 805 | 245 | Hole 9-9A |
| 1975 | Amax | 1 | 2,382 | 726 | Hole 10 |
| 1976 | Amax | 2 | 4,343 | 1,324 | One vertical, other 1,340 ft @ -45 |
| 1977 | Amax | 3 | 5,861 | 1,786 | 3 vertical DDH 1,804-2,124 ft deep |
| 1978 | Amax | 3 | 6,774 | 2,065 | 3 vertical DDH 2,132-2,361 ft deep |
| 1979 | Amax | 2 | 4,823 | 1,470 | Vertical DDH to 2,543 ft depth |
| 1980 | Amax | 3 | 2,630 | 802 | RC holes |
| 1981 | Amax | 3 | 3,204 | 977 | Vertical DDH 1,000 to 1,193 ft depths |
| Total | | 26 | 35,996 | 10,971 | |
A total 23 diamond holes and three RC holes were drilled on the property (Table 6-2). Most RC holes were pre-collars to diamond drill holes with only the diamond drill component of the holes being used for resource modelling and sampling. The historic holes were sampled mostly at a 20 ft sample interval.
A Skelton core representation of the historic drill holes (one four-inch piece of core for each 10-foot interval), and all the sample rejects were delivered directly from Climax’s secure facility in Colorado and are stored in the project secure warehouse facility for use by the project.
| SMD | Cumo S-k 1300 Technical Report | November 2022 |
Geologic 2CM027.001 CuMoCo. | Page 32 |
Table 6-2: List of historic drill holes
| Hole | Northing | Easting | Elevation | Dip | Azimuth | Length (ft) |
| 71-01 | 120,990 | 219,904 | 6026 | -90 | 0 | 1,884 completed |
| 71-02 | 120,575 | 219,820 | 6,060 | -70 | 0 | 405 completed |
| 71-03 | 120,250 | 219,905 | 6,165 | -90 | 0 | 70 completed |
| C71-04 | 120,785 | 219,940 | 6,045 | -90 | 0 | 113 completed |
| C72-05 | 120,525 | 220,570 | 6,202 | -90 | 0 | 1,416 completed |
| C72-06 | 121,749 | 219,919 | 5,902 | -90 | 0 | 663 completed |
| C72-07 | 121,491 | 219,823 | 5,962 | -90 | 0 | 275 completed |
| C72-08 | 118,890 | 220,025 | 6,467 | -90 | 0 | 379 completed |
| C74-09 | 121,438 | 220,687 | 5,890 | -60 | 168 | 804.6 completed |
| C75-10 | 119,756 | 221,220 | 6,341 | -90 | 0 | 2,381 completed |
| C76-11 | 120,456 | 221,250 | 5,996 | -90 | 0 | 3,003 completed |
| C76-12 | 120,955 | 221,432 | 5,742 | -43 | 190 | 1,340 completed |
| C77-13 | 119,472 | 219,903 | 6,426 | -90 | 0 | 1,804 completed |
| C77-14 | 119,085 | 221,271 | 6,613 | -90 | 0 | 2,123.8 completed |
| C77-15 | 119,772 | 221,951 | 6,339 | -90 | 0 | 1,933.2 completed |
| C78-16 | 119,210 | 219,148 | 6,248 | -90 | 0 | 2,131.7 completed |
| C78-17 | 118,712 | 219,887 | 6,544 | -90 | 0 | 2,281.5 completed |
| C78-18 | 119,823 | 222,649 | 6,168 | -90 | 0 | 2,361 completed |
| C79-19 | 120,178 | 219,887 | 6,170 | -90 | 0 | 2,280 completed |
| C79-20 | 120,878 | 220,787 | 6,105 | -90 | 0 | 2,543 completed |
| RC80-21 | 120,511 | 220,541 | 6,202 | -90 | 0 | 1,000 completed |
| RC80-22 | 119,913 | 220,412 | 6,239 | -90 | 0 | 670 completed |
| RC80-23 | 120,695 | 219,420 | 5,827 | -90 | 0 | 960 completed |
| C81-24 | 120,671 | 222,009 | 6,070 | -90 | 0 | 1,000 completed |
| C81-25 | 119,890 | 219,290 | 6,019 | -90 | 0 | 1,011 completed |
| C81-26 | 121,338 | 221,433 | 5,768 | -90 | 0 | 1,193 completed |
| Notes: | C holes are diamond and RC are reverse circulation.
Holes contained in the above list represent individual holes that may have been drilled across more than one year, while table 6-1 shows the actual footage drilled in each year according the records. |
In 1983, Climax transferred its interest in the property to Amax Exploration Inc. and no further work appears to have been done on the property.
| SMD | Cumo S-k 1300 Technical Report | November 2022 |
Geologic 2CM027.001 CuMoCo. | Page 33 |
| 6 | Geological Setting and Mineralization |
The regional tectonic setting consists of a basement of amalgamated Archean and Paleoproterozoic crystalline terrains that were joined during the Paleoproterozoic Trans-Montana orogeny, and are overlain discontinuously by sedimentary rocks of Mesoproterozoic, Neoproterozoic, and Paleozoic ages; and volcanic and sedimentary rocks of Eocene and Miocene ages. Voluminous tonalite to granite bodies of the Idaho batholith and later granitic plutons of Eocene age intrude the older rocks. Major deformational episodes superimposed on the Precambrian basement include the Cretaceous Sevier orogeny, which mainly involved east-vergent “thin-skinned” thrusting; Eocene extensional deformation, which resulted in development of metamorphic core complexes; and basin and range-type faulting (Sims et al, 2005), as opposed to the Laramide orogeny’s “basement cored” uplifts which partially overlapped the Sevier orogeny in time and space.
The regional geology has been compiled at 1:1,000,000 to form the digital map of Idaho (Johnson and Raines, 1996). The CuMo deposit is situated within the Idaho batholith and is part of a regional scale belt of porphyry and related deposits identified as the Idaho-Montana Porphyry Belt (Rostad, 1978). This belt is part of a magmatic arc that formed on the northeast margin of the North American Craton (Figure 7-1) during Laramide time (Late Cretaceous-Early Tertiary). The Idaho-Montana Porphyry Belt lies within the much longer, 1,500 km, Great Falls tectonic zone (Figure 7-2), which was distinguished by brittle structures and intrusions of Phanerozoic age that are interpreted to have been controlled by the reactivation of basement structures. (O’Neill and Lopez, 1985). Two sets of basement structures, in particular, provided zones of weakness that were repeatedly rejuvenated (Sims et al, 2005):
| (1) | Northeast-trending ductile shear zones developed on the northwest margin of the Archean Wyoming province during the Paleoproterozoic Trans-Montana orogeny; and |
| (2) | Northwest-trending intra-continental faults of the Mesoproterozoic Trans-Rocky Mountain strike slip fault system. |
The Trans-Montana orogeny comprises a deformed, north-facing, passive continental margin and subsequent fore-deep assemblages overlying an Archean basement that is juxtaposed with accreted conjoined terrains. The juncture is the linear deformed belt between the Great Falls and Dillon shear zones. The fold-and-thrust belt of the Trans-Montana orogeny coincides in part with the Great Falls tectonic zone.
The Trans-Rocky Mountain fault system is a major, deep-seated, northwest trending, intracontinental strike-slip fault system of Mesoproterozoic age. It consists principally of west northwest-striking strike-slip faults (principal displacement zones), branching and en-echelon northwest-trending faults, and widely spaced, more local north-trending faults.
| SMD | Cumo S-k 1300 Technical Report | November 2022 |
Geologic 2CM027.001 CuMoCo. | Page 34 |
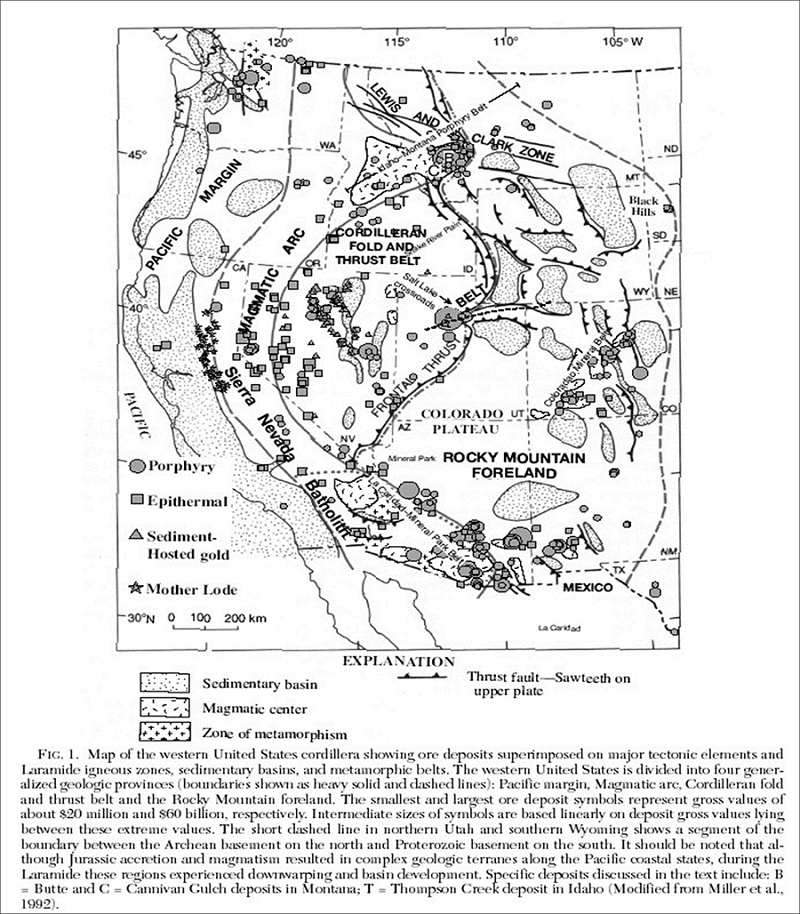
Source: Hildenbrand et al, 2000
Figure 7-1: Tectonic map of the western United States
| SMD | Cumo S-k 1300 Technical Report | November 2022 |
Geologic 2CM027.001 CuMoCo. | Page 35 |
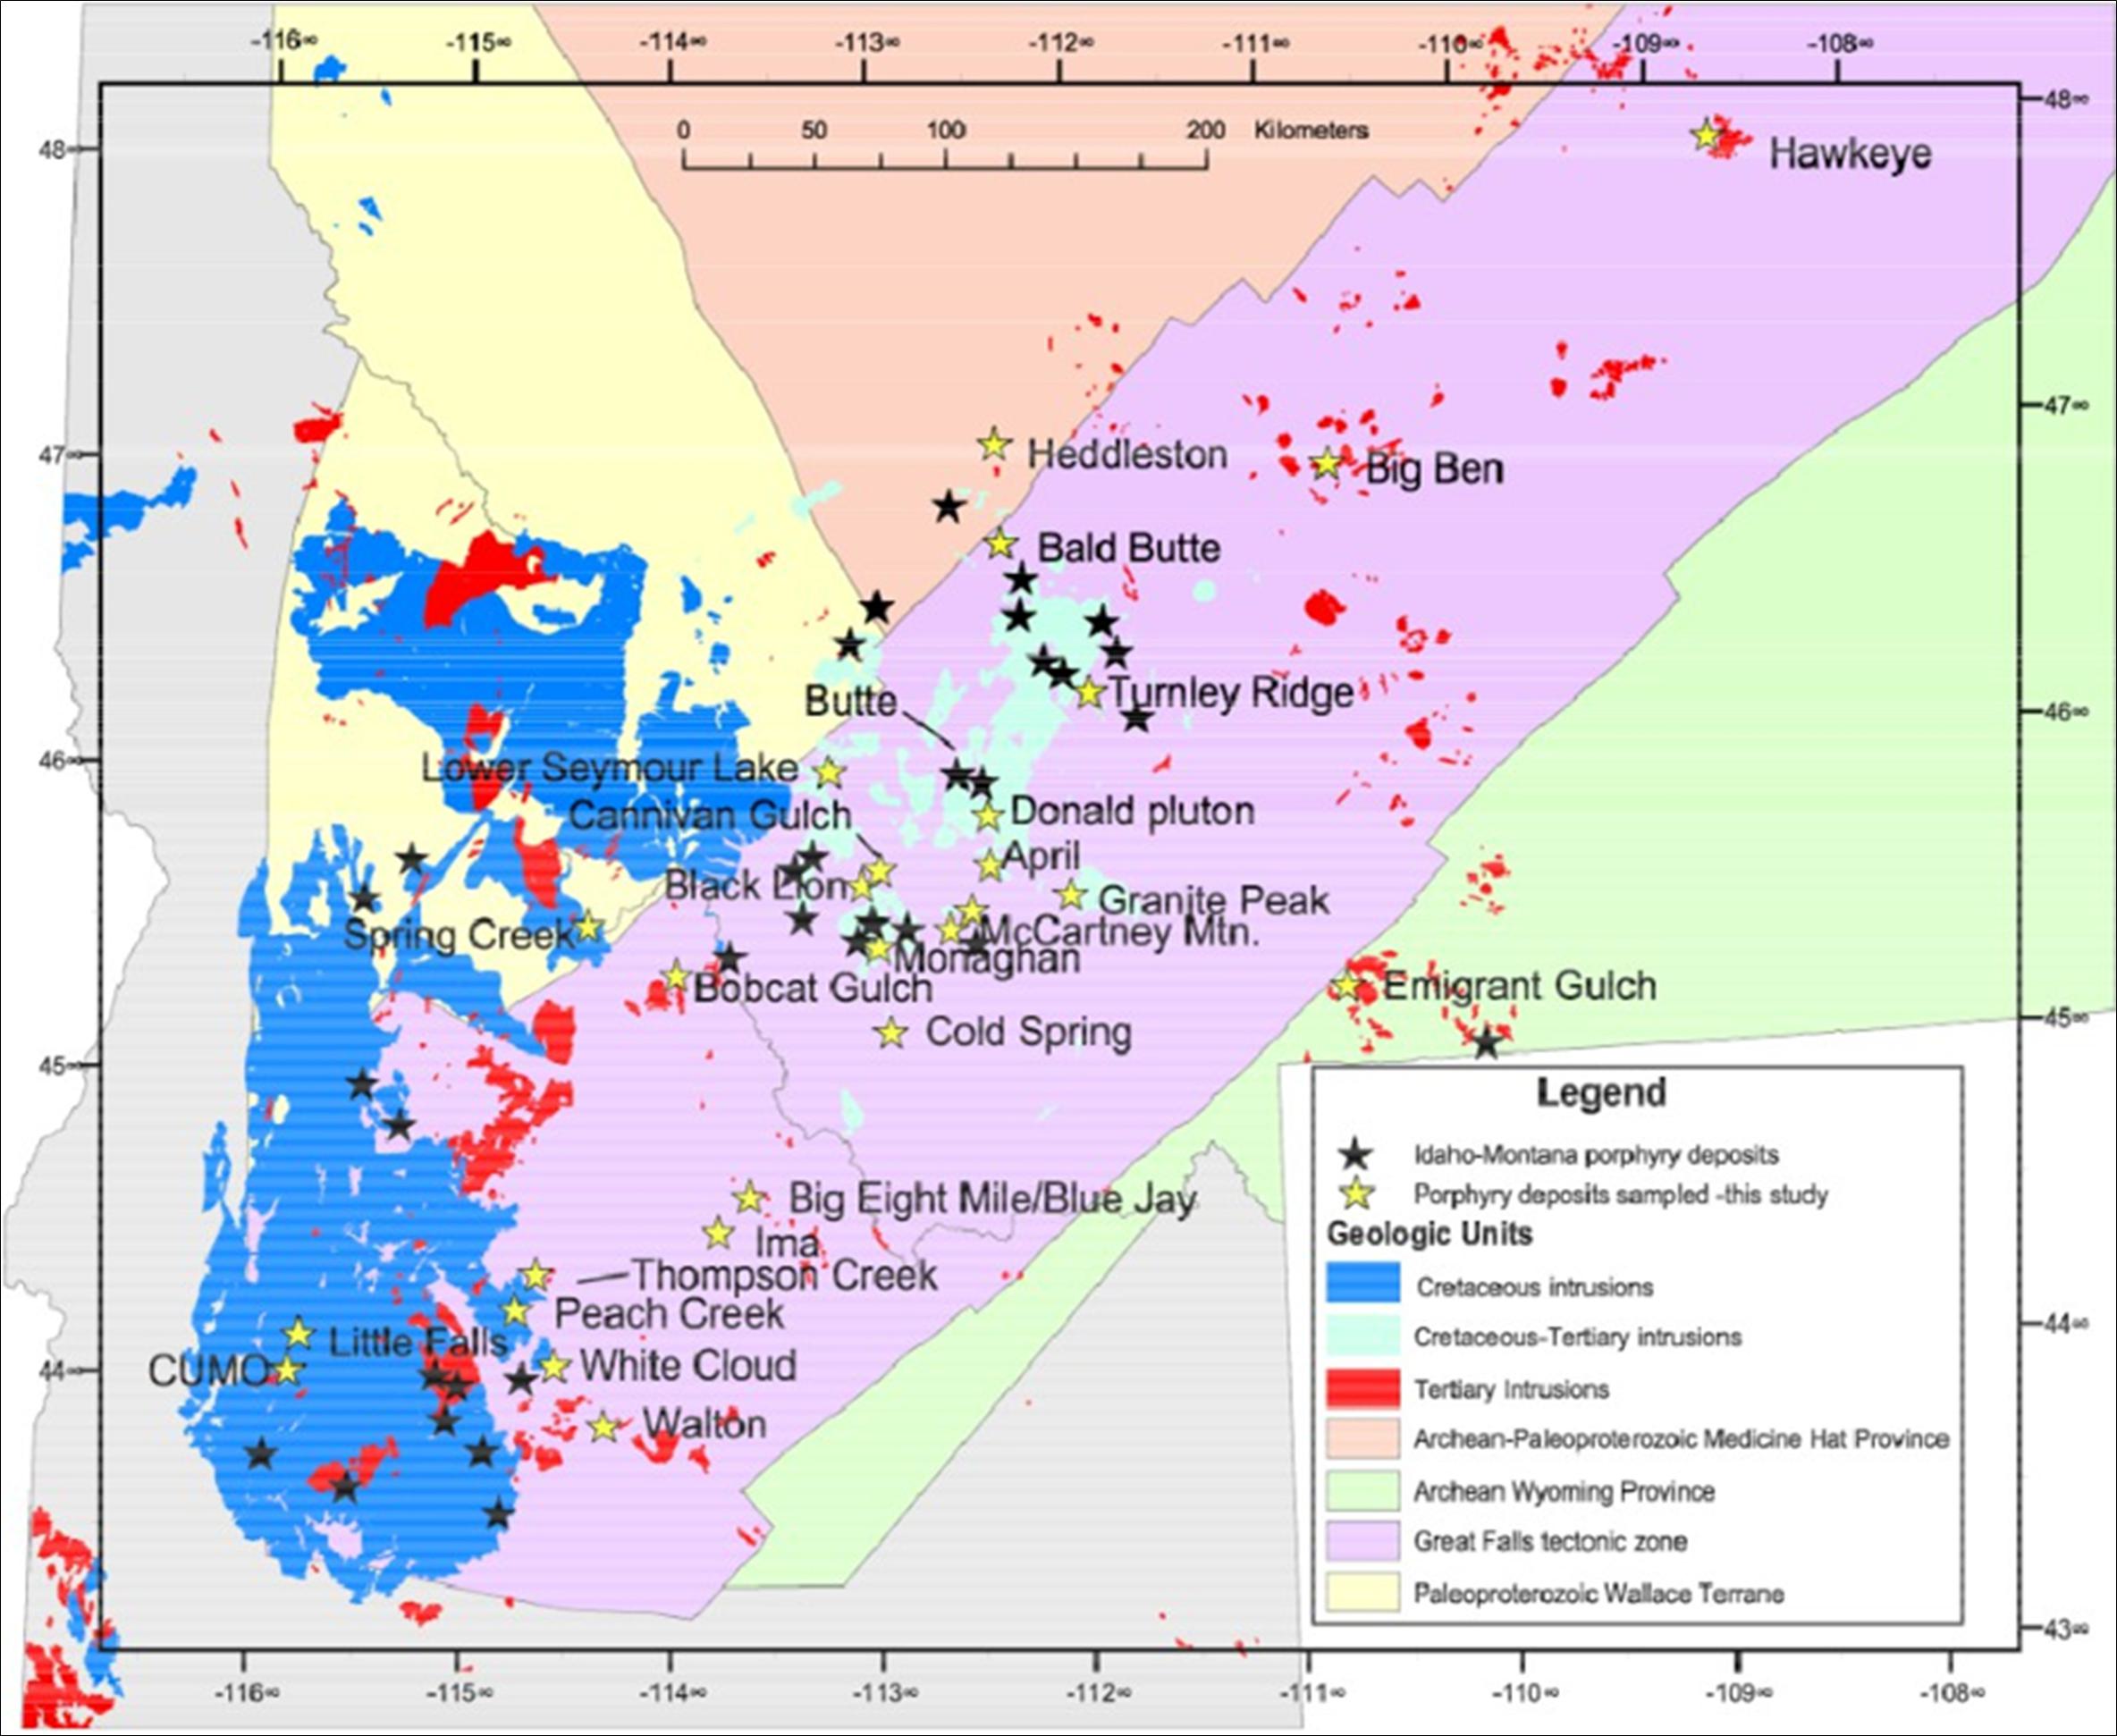
Source: Lund et al, 2005
Figure 7-2: Distribution of Idaho-Montana porphyry deposits in relation to the great falls tectonic zone
Mineral deposits in the Idaho-Montana Porphyry Belt (also called the Transverse Porphyry Belt of Idaho-Montana by Carten et al, 1993) are related to Eocene granitic intrusions. The distribution of deposits along this belt from northeast to southwest follows a progression from alkalic rocks (intra-arc rift-related), to mixed alkalic and calc-alkalic, and finally calc-alkalic intrusive rocks, a pattern that is similar to the distribution of igneous rocks from south to north along the proto Rio Grande rift (Carten et al, 1993). The CuMo deposit is located at the southwestern end of this belt and is associated with a calc-alkalic monzogranite, reported as 45-52Ma age (Carten et al, 1993) that intrudes Cretaceous equigranular intrusive rocks of the Atlanta Lobe of the Idaho Batholith.
The Idaho batholith is a composite mass of granitic plutons covering approximately 15,400 square miles. The northern part is called the “Bitterroot” lobe and the southern part the “Atlanta” lobe. Most of the southern lobe was emplaced 75 to 100 million years ago (Late Cretaceous); whereas the northern lobe was emplaced 70 to 80 million years ago. Older plutons of Jurassic age occur on the northwest side of the Bitterroot lobe and many Eocene plutons have intruded the eastern side of the Atlanta lobe of the batholith. Although radiometric dates and field relationships restrict the age of the Idaho Batholith to between 180 and 45 million years, the dominant interval of emplacement was early to Middle Cretaceous. There is a general west-to-east decrease in age for plutons of the batholith.
| SMD | Cumo S-k 1300 Technical Report | November 2022 |
Geologic 2CM027.001 CuMoCo. | Page 36 |
On the west side of the batholith the rocks are tonalites or quartz diorites, whereas on the east side they range from granodiorites to granites. The boundary between the two composition types also coincides with the 0.704 Sr87/Sr 86 boundary and also the boundary between the Mesozoic and Paleozoic eugeoclinal accreted rocks on the west with the continental Precambrian rocks on the east side (Digital Atlas of Idaho: http://imnh.isu.edu/digitalatlas/geo/bathlith/bathdex.htm).
The CuMo deposit is situated within the Atlanta Lobe of the Idaho batholith. The western margin of the Atlanta lobe is strongly folded and metamorphosed into gneissic rocks, which are well exposed near McCall. The western side is composed of tonalite, 95 to 85 million years old. The batholith core is biotite granodiorite; and the eastern side lobe is muscovite-biotite granite approximately 76 to 72 million years old1F3.
The geology of the area around the CuMo deposit was mapped and originally compiled at 1:24,000 scale by Anderson (1947). This mapping has been incorporated into the 1:100,000 scale Deadwood River 30 x 60 quadrangle map (Kilsgaard et al, 2006), and adjoining Idaho City 30 x 60 quadrangle map (Kilsgaard et al, 2001), and compiled into the Boise County map of the digital Atlas of Idaho (Figure 7-3).
The CuMo area is underlain by biotite granodiorite, the most common rock type of the Atlanta lobe of the Idaho batholith (Unit Kgd) (Killsgaard et al, 1985). This unit was mapped by Anderson (1947) as quartz monzonite: (Unit Kqm) – in part porphyritic and including granodiorite. The rock is light grey, medium to coarse-grained and equigranular to porphyritic. Biotite averages about 5% and sericite alteration of feldspar is common. Killsgaard et al (1985) report the age of this unit at 82-69Ma based on potassium-argon dating.
Tertiary plutonic rocks intruded into the batholith in the area of CuMo include Eocene diorite and hornblende biotite granite forming the Boise Basin and Long Gulch Stocks and associated dikes (Unit Tgdd) (Killsgaard et al, 2005). These units were identified as diorite and quartz monzonite porphyry, respectively, by Anderson (1947). The Eocene granites are generally characterized by pink color due to potassium feldspar as a major component, miarolitic cavities that may be lined with smoky quartz, high radioactivity relative to the Idaho batholith, the presence of perthitic feldspar, myrmekite and granophyric texture indicating high temperature crystallization complicated by quenching, and a high content of large cation elements including molybdenum, high fluorine content, and high-iron biotite (Killsgaard et al, 1985).
3 Digital Atlas of Idaho: http://imnh.isu.edu/digitalatlas/geo/bathlith/bathdex.htm.
| SMD | Cumo S-k 1300 Technical Report | November 2022 |
Geologic 2CM027.001 CuMoCo. | Page 37 |
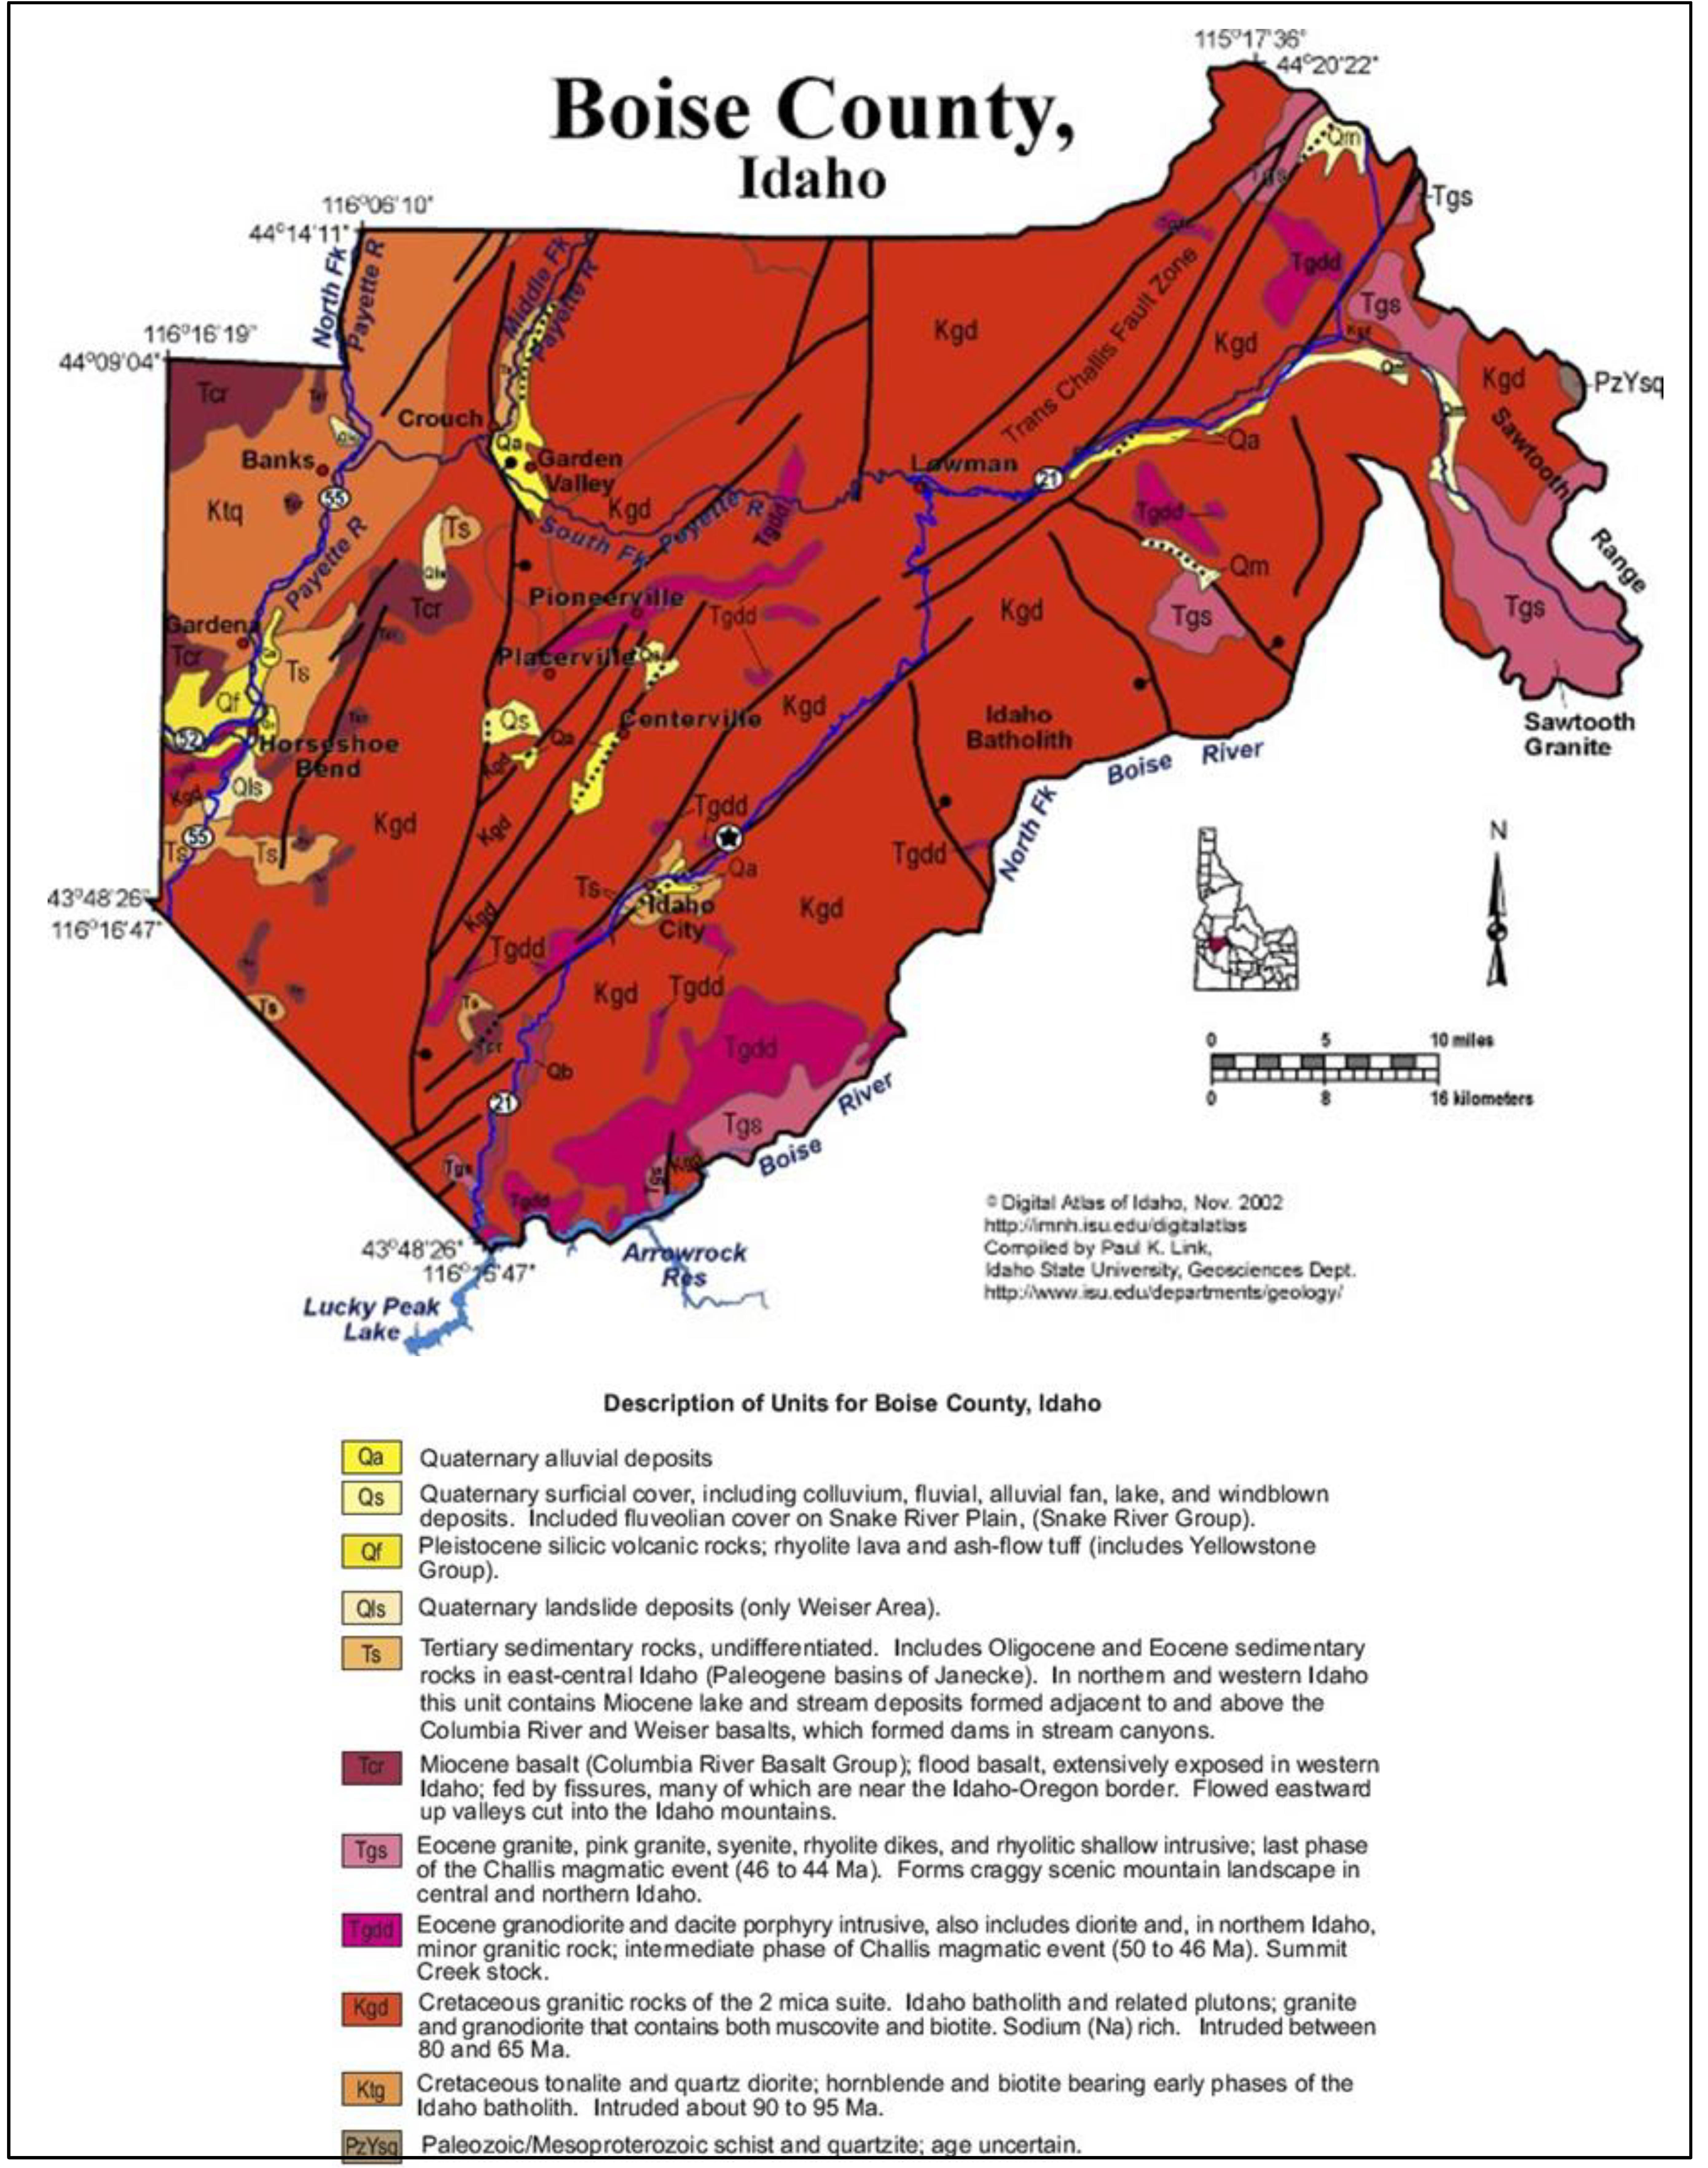
Source: Modified from: http://imnh.isu.edu/digitalatlas/counties/boise/geomap.htm
Figure 7-3: Geology of Boise County, Idaho, showing geological setting of CuMo deposit
Hypabyssal equivalents of the granites include numerous rhyolite dikes that are concentrated along the trans-Challis fault system (Killsgaard et al, 1985). Rhyolite dikes are generally less than 25 ft thick and may exhibit flow banding, whereas rhyolite porphyry dikes can reach 200 ft in thickness and have prominent quartz phenocrysts (Anderson, 1947).
| SMD | Cumo S-k 1300 Technical Report | November 2022 |
Geologic 2CM027.001 CuMoCo. | Page 38 |
Extensive placer gold workings and lode deposits in the area are situated along the northeast trending trans-Challis fault system (Killsgaard et al, 1989; Bennett, 1986). As shown in Figure 7-3, a north-trending Basin and Range fault, down on the east, bounds the system of northeast-striking trans-Challis faults to the west of CuMo (Link, 2002).
Amax completed detailed bedrock mapping on the CuMo property between 1964 and 1981. Earlier periods of mapping outlined five general rock types, including quartz monzonite of the Idaho Batholith, rhyolite porphyry, lamprophyre, dacite and diabase dykes. Subsequent mapping through to1982 resulted in subdivision of those five units into 17 (Table 7-1).
Table 7-1: Summary of rock units present at the CuMo property
| Unit | Age | Rock Type | Texture | Grain Size |
| Tl | Tertiary | Lamprophyre | Porphyritic | Fine |
| Td | Tertiary | Diabase | Massive, amygdaloidal | Aphanitic |
| Tr | Tertiary | Rhyolite | Massive to flow-banded | Aphanitic to fine |
| TpE | Tertiary | Biotite quartz monzonite porphyry | Porphyritic | Fine |
| Tbx | Tertiary | Intrusion to intrusive breccia | Breccia | Aphanitic to fine |
| Trp | Tertiary | Biotite quartz monzonite porphyry | Porphyritic | Aphanitic to fine |
| TpF | Tertiary | Biotite quartz latite to rhyolite porphyry | Porphyritic | Aphanitic |
| TpB | Tertiary | Biotite quartz latite to rhyolite porphyry | Porphyritic | Aphanitic |
| TpA | Tertiary | Biotite quartz latite to quartz monzonite porphyry | Porphyritic | Aphanitic to fine |
| TpD | Tertiary | Biotite quartz monzonite to quartz latite porphyry | Porphyritic | Aphanitic to fine |
| TpC | Tertiary | Biotite quartz latite to quartz monzonite porphyry | Porphyritic | Aphanitic to fine |
| Tbhqmp | Tertiary | Biotite hornblende quartz monzonite porphyry | Porphyritic | Fine |
| Tbdp | Tertiary | Biotite dacite porphyry | Porphyritic | Aphanitic |
| Tgd | Tertiary | Granodiorite | Equigranular | Fine-medium |
| Ta | Tertiary | Andesite | Porphyritic | Aphanitic |
| Kg | Cretaceous | Gabbro | Equigranular – diabasic | Fine |
| Kqm | Cretaceous | Biotite-quartz monzonite | Equigranular to porphyritic | Coarse-medium |
Baker (1983) noted that the “ranges of textures in the various dike types (TpA-TpF) overlap, but show a general trend from early, phenocryst-rich porphyries with large phenocrysts, to young, phenocryst-poor porphyries with small phenocrysts”.
| SMD | Cumo S-k 1300 Technical Report | November 2022 |
Geologic 2CM027.001 CuMoCo. | Page 39 |
Three main intrusive types were observed in the holes drilled to date, including equigranular quartz monzonite, quartz monzonite porphyry, and intrusive breccia. Mafic dikes were also intersected locally. The equigranular quartz monzonite is considered to be the Idaho batholith (Unit Kqm) and locally contains K-feldspar megacrysts. The intrusive breccia is comprised of fragments of porphyry and equigranular quartz monzonite. All of the felsic intrusive phases contain molybdenite (MoS2) mineralization. Examples of the main rock types are shown in Figure 7-4. The quartz monzonite porphyry (Unit Tbqmp) varies considerably in proportion and size of phenocrysts, with at least four varieties recognized (Figure 7-4). The first and possibly earliest phase (Unit Tbqmp Type I) is dark to medium grey, with 10-15%, <7 mm feldspar phenocrysts, 1-2% fine-grained biotite, and <5% quartz set in a fine-grained groundmass. The second phase (Unit Tbqmp Type II) is medium to light grey, with 30% feldspar phenocrysts and minor biotite set in a medium-grained groundmass. The third phase (Unit Tbqmp Type III) is similar to Type II but contains K-feldspar megacrysts. The fourth phase and possibly most recent is a crowded porphyry variant of Type III containing >30% feldspar phenocrysts set in a medium-grained groundmass. Type I through IV phases may correlate with Amax units TpD, TpB, TpA and TpC, respectively, and appear to follow a general pattern of early, phenocryst poor phases intruded by later phenocryst-rich phases, which is opposite to the general progression observed by previous workers.
Structure may be an important factor on the distribution of mineralization at the CuMo property. A strong northeast to east-northeast structural trend, characteristic of the trans-Challis fault system, is evident in the area of the property. The Tertiary dyke system trends in this same orientation with steep to moderate dips to the south. Faults and mineralized structures identified to date dominantly trend to the northeast as well. These include numerous small base and precious metal occurrences that occur in the area and surrounding the CuMo deposit with most of the major lodes striking east-northeast (N70E) whereas subordinate lodes are oriented northeasterly (N35E, N10-20E and N30-60E). Several fault zones, marked by sections of broken core, were logged in the drilling, which appear to offset the interpreted mineral zones. The full significance of these fault structures to the deposit geometry remains to be determined.
| SMD | Cumo S-k 1300 Technical Report | November 2022 |
Geologic 2CM027.001 CuMoCo. | Page 40 |
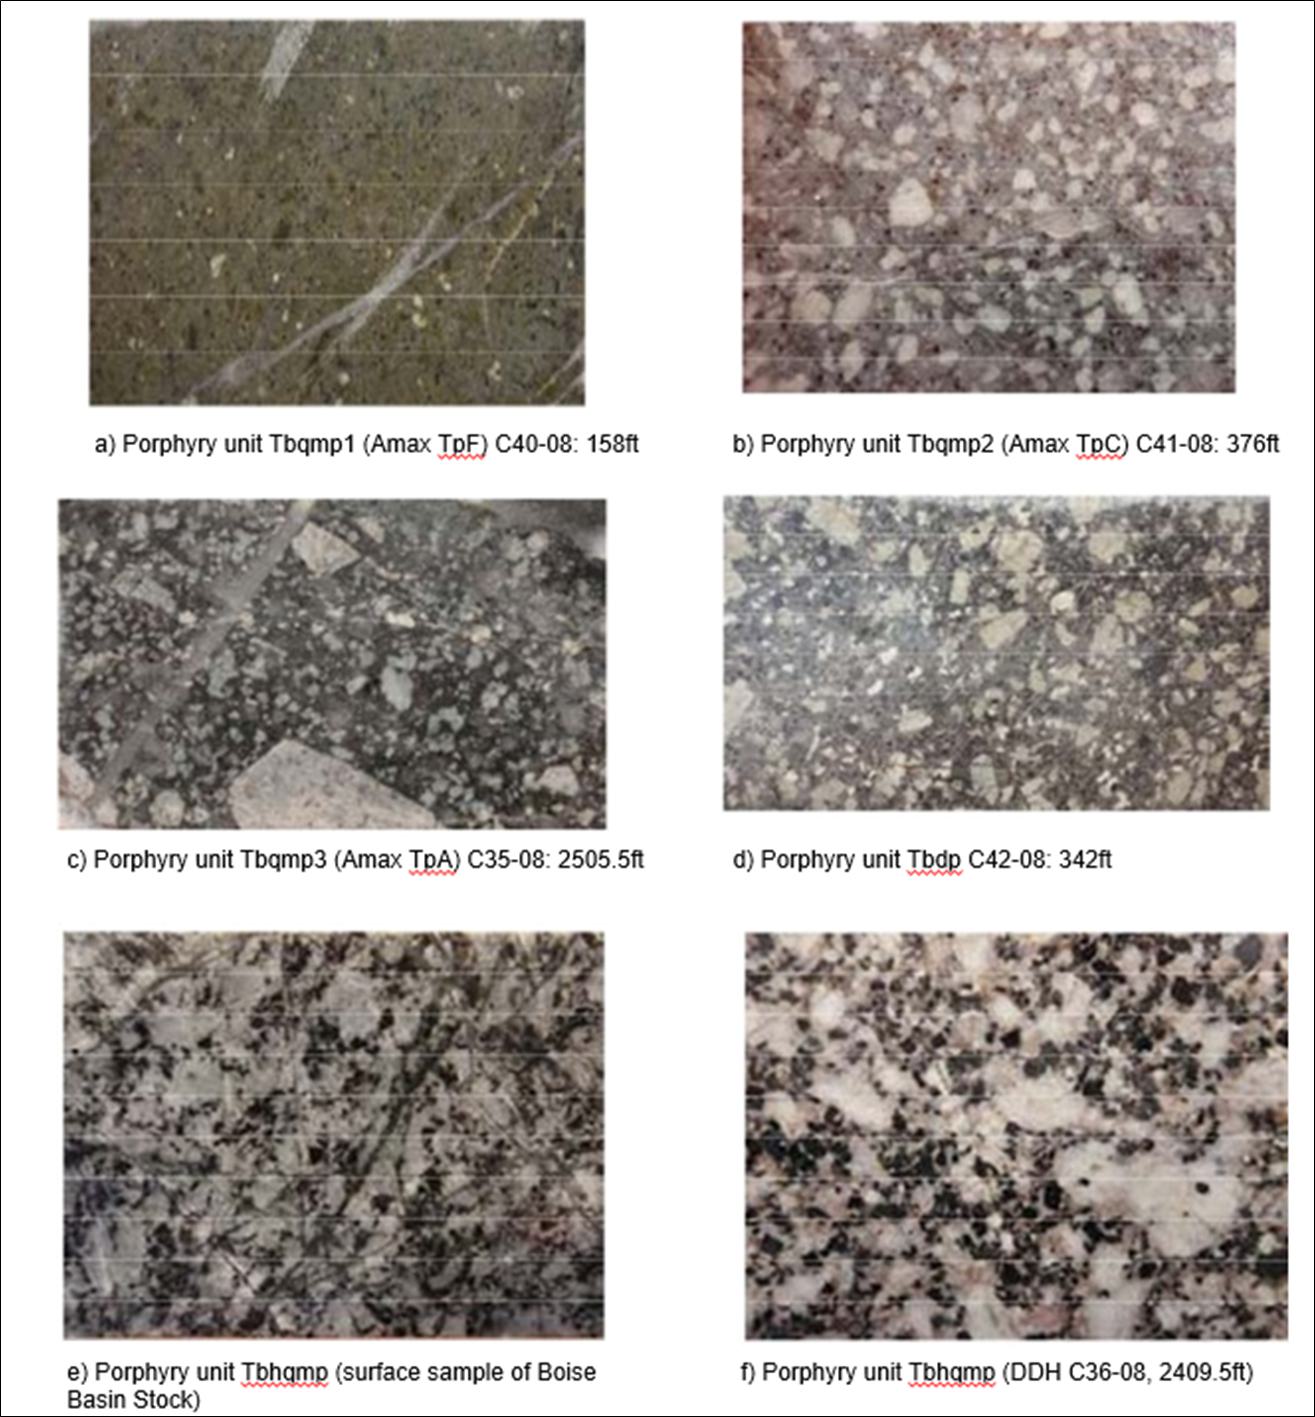
Source: Giroux et al, 2015
Note: All core pieces are 2.4 inches in width
Figure 7-4: Core photographs of felsic porphyry types recognized in drill core
| SMD | Cumo S-k 1300 Technical Report | November 2022 |
Geologic 2CM027.001 CuMoCo. | Page 41 |
| 6.4.1 | Description of Mineralized Zones |
The CuMo deposit is located in an historic gold mining camp. Gold was discovered in the Boise Basin in 1862 and lode mining began within a year. As of 1940, total gold production amounted 2.8 million ounces of which 74% was from placer operations (Anderson, 1947). More gold has been produced from the Boise Basin than any other mining locality in Idaho (Killsgaard et al, 1989). Although they are primarily gold deposits, considerable silver and minor copper, lead and zinc were produced as by-products from the lodes.
Anderson (1947) recognized two separate mineralizing events that he referred to as early Tertiary and early Miocene. The first event consists of gold-quartz veins containing minor sulfide minerals that occur within the Idaho batholith and are associated with weak wall rock alteration. Associated sulfide minerals include pyrite, arsenopyrite, sphalerite, tetrahedrite, chalcopyrite, galena and stibnite. The second mineralizing event occurs within porphyry dikes and stocks as well as in the batholith, and is characterized by relatively abundant sulfide mineralization, subordinate quartz and widespread wall rock alteration. Base metal mineralization consists of pyrite, sphalerite, galena, tetrahedrite, chalcopyrite, minor quartz and siderite with local occurrences of pyrrhotite and enargite. The gold-quartz veins generally occur relatively distal to the CuMo deposit (within 4 to 6 miles/6 to 10 km), whereas the base-metal-gold lodes occur in a belt that follows the “porphyry belt” from Quartzburg through Grimes Creek, proximal to and coincident with the CuMo deposit. This “porphyry belt” is what the CuMoCo refers to as the older copper-gold porphyry system which is characterized by the chalcopyrite-silver-gold bearing veins.
| 6.4.2 | Property Mineralization |
Molybdenum mineralization was discovered at CuMo in 1963. The only other molybdenum showing in Boise County is the Little Falls molybdenum prospect, which is situated just to the northeast of CuMo.
Mineralization on the property occurs in veins and veinlets developed within various intrusive bodies. Molybdenite (MoS2) occurs within quartz veins, veinlets and vein stockworks. Individual veinlets vary in size from tiny fractures to veinlets five centimeters in width, with an overall thickness averaging 0.3-0.4 cm. Pyrite and/or chalcopyrite are commonly associated with molybdenite although molybdenite can occur alone without other metallic mineralization.
Chalcopyrite occurs in quartz-pyrite + molybdenite veinlets, in magnetite + pyrite as well as in pyrite-biotite + quartz + magnetite veins with secondary biotite halos. Scheelite is common on the property and closely parallels the distribution of molybdenite (Baker, 1983).
Figure 7-5 and Figure 7-6 show examples of mineralization at CuMo from the previous drill holes.
| SMD | Cumo S-k 1300 Technical Report | November 2022 |
Geologic 2CM027.001 CuMoCo. | Page 42 |
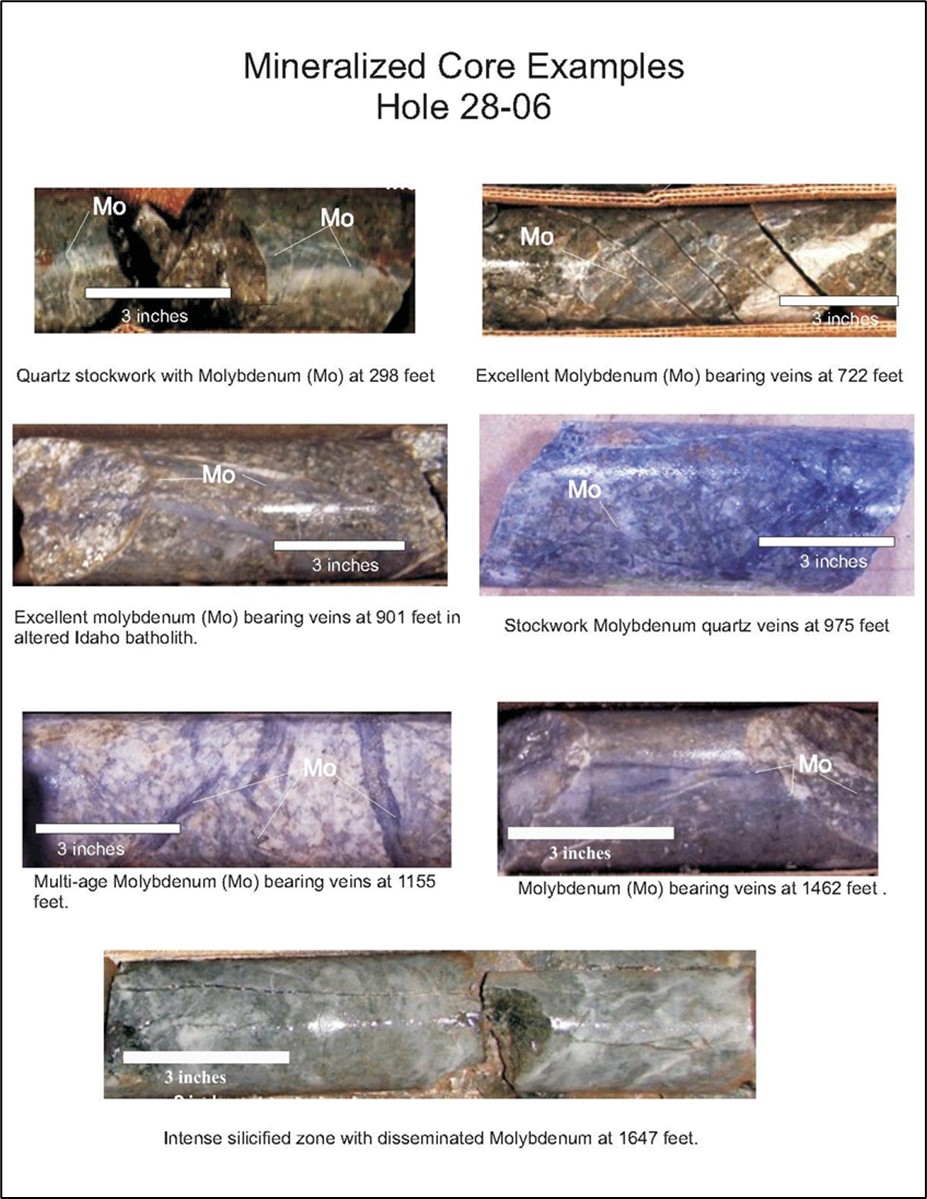
Source: Giroux et al, 2015
Note: in this older figure, “Molybdenum” is referring to molybdenite mineralization.
Figure 7-5: Photographs of mineralized core from the CuMo 2006 program, hole C06-28
| SMD | Cumo S-k 1300 Technical Report | November 2022 |
Geologic 2CM027.001 CuMoCo. | Page 43 |
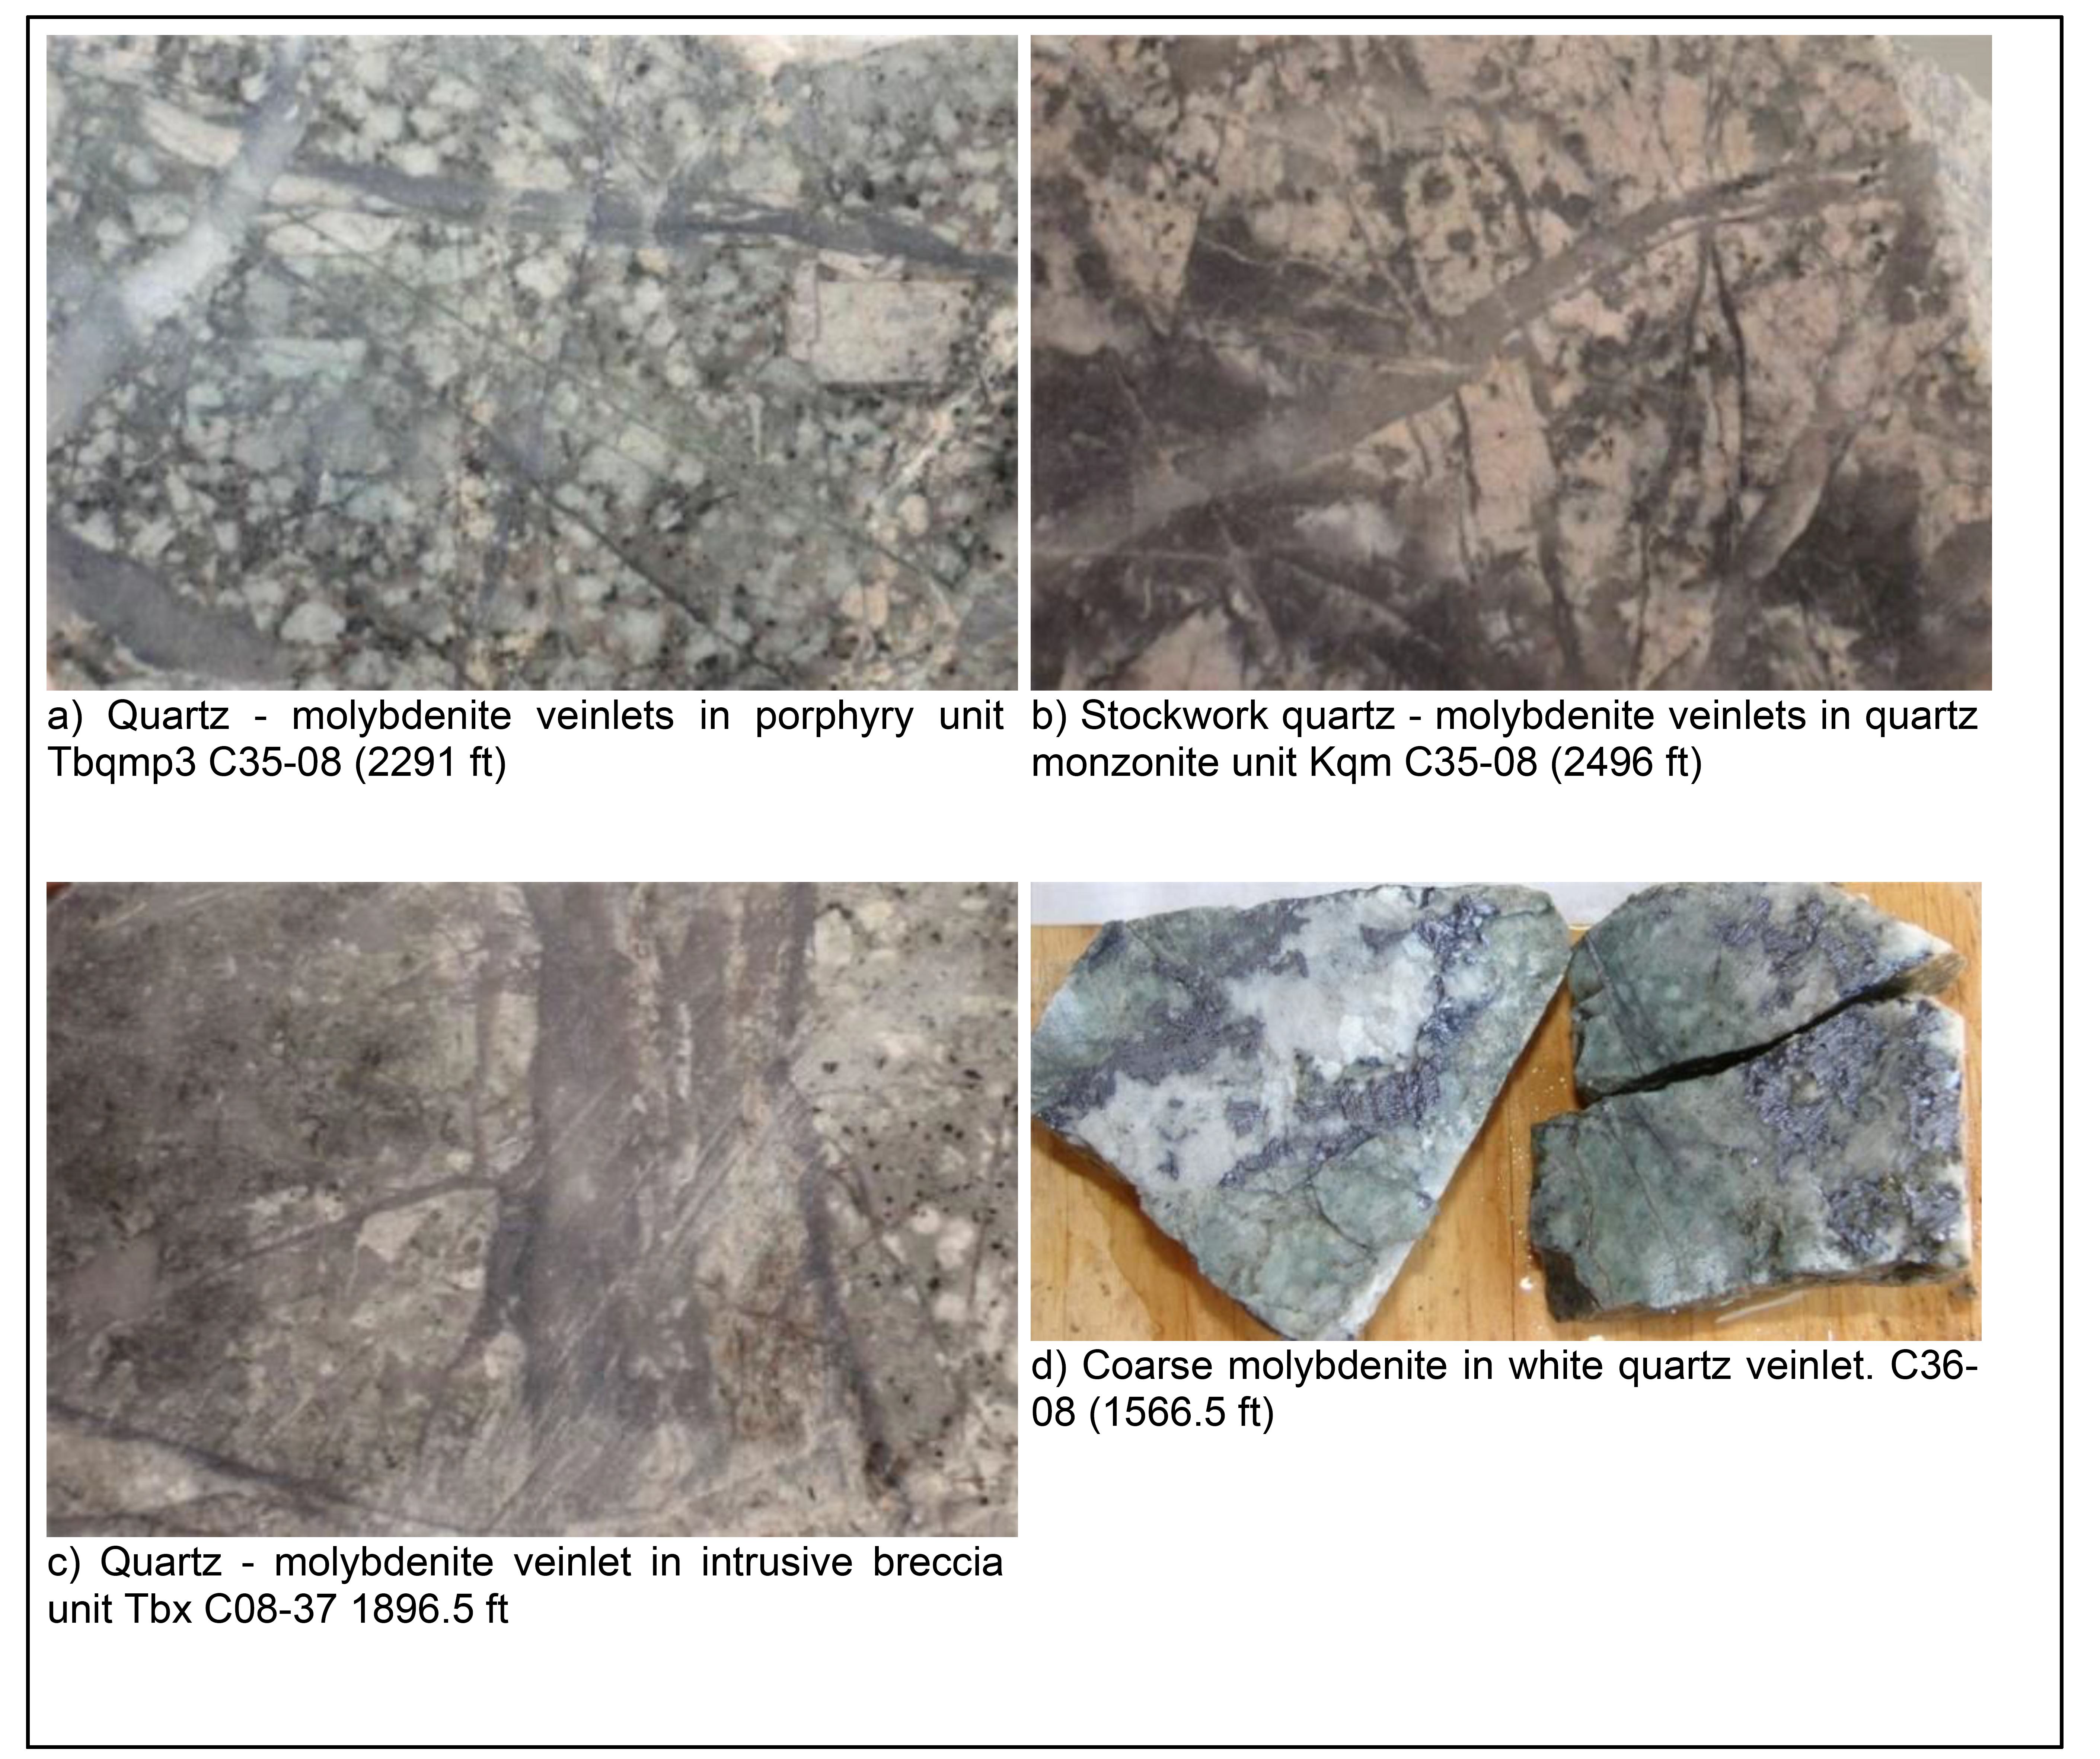
Source: Giroux et al, 2015
Note: All core pieces are 2.4 inches in width
Figure 7-6: Photographs of molybdenite mineralization in 2008 drill core
Compilation of Amax data on the frequency of veins mapped on surface as well as their mineral constituents was presented by Giroux et al (2005) and is shown graphically in Figure 7-7.
A concentric pattern is clearly evident, which is also shown by the distribution of anomalous Mo and Cu rock geochemical results – Figure 7-8 and Figure 7-9. The area drilled to date occupies only a portion of the central area; Amax had identified prospective target areas to the southeast and east of the area drilled.
| SMD | Cumo S-k 1300 Technical Report | November 2022 |
Geologic 2CM027.001 CuMoCo. | Page 44 |
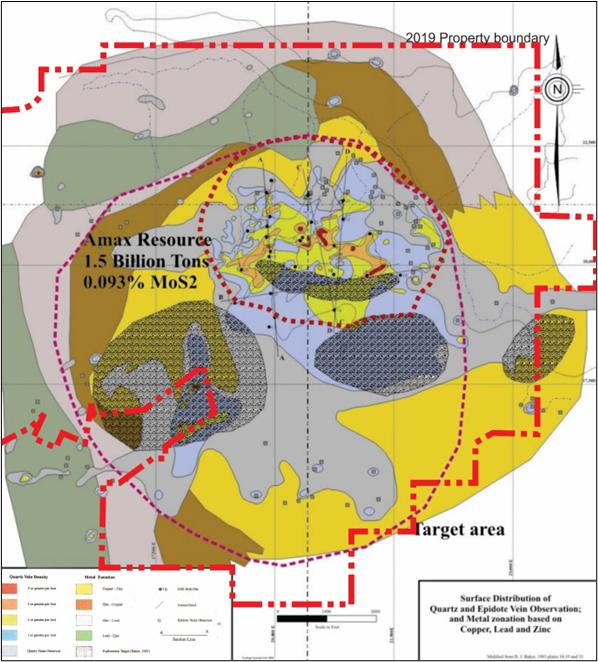
Source: Giroux et al, 2015 modified 2019
Note: The “Amax Resource” indicated on the figure is considered an historical estimate, and not a “Resource” in accordance with S-K 1300. A technical report on the property was never filed. A qualified person has not done sufficient work to classify the historical estimate as a current mineral resource. The Company does not consider the Amax resource as current.
Figure 7-7: Surface distribution of quartz and epidote veinlets and metal zonation
| SMD | Cumo S-k 1300 Technical Report | November 2022 |
Geologic 2CM027.001 CuMoCo. | Page 45 |
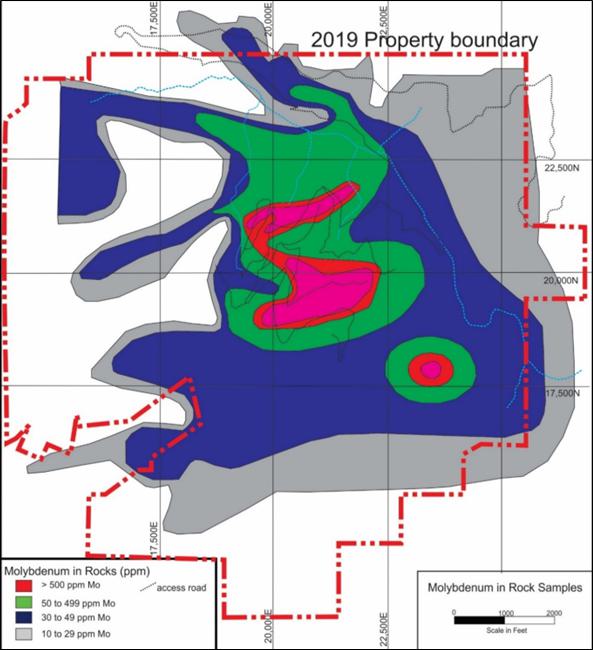
Source: Giroux et al, 2015 modified 2019
Figure 7-8: Geochemical distribution of Mo in surface rock chip samples
| SMD | Cumo S-k 1300 Technical Report | November 2022 |
Geologic 2CM027.001 CuMoCo. | Page 46 |
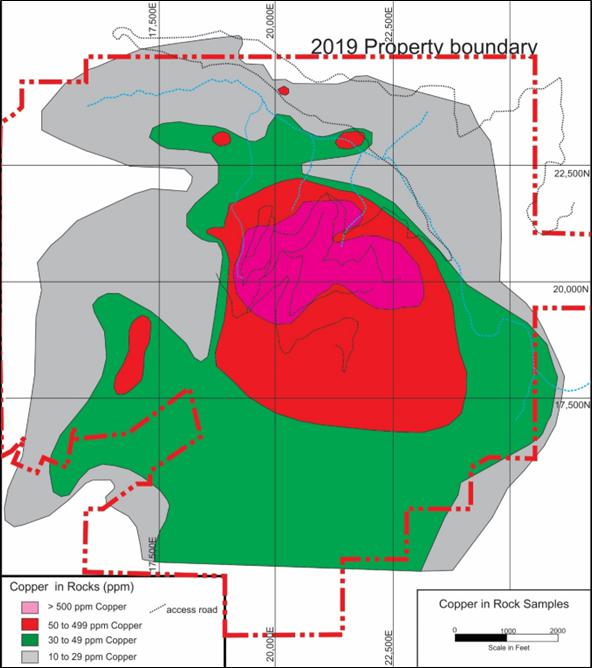
Source Giroux et al, 2015 modified 2019
Figure 7-9: Geochemical distribution of Cu in surface rock chip samples
Amax interpreted two shells of molybdenite mineralization, with the upper shell being richer in copper and silver, but of lower molybdenite (MoS2) grade, and the lower shell being molybdenite (MoS2)-rich and depleted in copper and silver (Baker, 1983). Amax interpreted this pattern of metal zoning to have formed above and peripheral to two or more source intrusions (of which only one was recognized physically).
| SMD | Cumo S-k 1300 Technical Report | November 2022 |
Geologic 2CM027.001 CuMoCo. | Page 47 |
| 7 | Exploration And Drilling |
Since obtaining the property in 2005, work has been solely focused on drilling on the CuMo property.
Only reportable exploration conducted by CuMoCo outside of drilling on the CuMo property was a dump sample taken during reconnaissance work undertaken by the project geologists in 2017. The dump is located approximately 1,731 m west of the western most drill hole to date, hole 10-47, The sample although taken to represent the material occurring on the dump (Coon Dog, located in Figure 10-1) which was estimated to contain 15 tons of material, the sample is considered a grab and not representative of any sort of size, width or extent of material. The sample which was assayed by ALS Chemex using ICP-M61 technique assayed 3.12% Cu, 783 ppm Ag, and 0.986 ppm Au.
Note: The reader is cautioned that grab sample assays represent prospecting samples and may not be representative of the grade or width of the mineralization. There is presently insufficient data with respect to the size and extend of the mineralization represented by the sample to determine its significance. Future drilling is designed to determine that significance, if any.
Note: Sample was taken by collecting approximately 10 kg of random broken rocks pieces from the area of the dump
The reconnaissance worked involved two geologists examining surface exposures looking for additional indications of mineralization. Several indications were identified including the Coon Dog Dump. The work resulted in an increase to the extent of mineralization (deposit outline) as can be seen in Figure 4-2. A drill program for the area has been proposed for the 2020 field season.
The reader will encounter several outlines of various aspects of the CuMo project that are explained in the pertinent section, but for clarity are summarized here.
The first outline is the deposit or mineralized outline, this is shown in Figure 4-2 (Mineralized outline) and represents the extent of the CuMo deposit based on the geology, alteration and mineralization. It is the largest and most extensive boundary.
The next outline encountered is the conceptual pit or 2015 block model boundary, this is the outline of the location of all blocks that are placed around the drill holes that are within a conceptual pit design. As drilling proceeds, more and more of these blocks are converted into resources.
The next outline is the 2015 resource boundary (resource outline in figure 4-2) , this outlines the area of blocks that were actually calculated in the current 2015 resource; it amounts to 60% of the previous block model boundary. Reader should note that not all blocks within the block boundary have been actually calculated.
The final boundary is the actual 30-year pit boundary (2019 pit outline in figure 4-2) that contains the blocks within the 2015 resource that are proposed to be mined during the 30 years.
| SMD | Cumo S-k 1300 Technical Report | November 2022 |
Geologic 2CM027.001 CuMoCo. | Page 48 |
| 7.1 | Drilling and Trenching |
Summary of Programs by Year
Between 2006 and 2012, CuMoCo has drilled a total of 25,486.82 m in 42 holes (Table 10-1).
Table 10-1: Summary of holes drilled by CuMoCo
| Year | No Holes | Length (m) |
| 2006 | 1 | 1,085.1 |
| 2007 | 7 | 3,872.5 |
| 2008 | 11 | 8,159.7 |
| 2009 | 9 | 5,687.8 |
| 2010 | 3 | 1,312.8 |
| 2011 | 2 | 1,156.7 |
| 2012 | 9 | 4,213.3 |
| Total | 42 | 25,487.9 |
| 7.2 | Sampling and True Thickness Adjustments |
All drill holes completed by CuMoCo were sampled at 10 ft intervals for the entire hole. The deposit is a stockwork type. No preferred orientation of veins has been identified. No systemic adjustment of sampling intervals or intercept lengths to reflect “true thickness” has been applied, nor is it considered warranted.
In 2006, diamond drilling was done by Kettle Drilling Inc. of Coeur d’Alene on behalf of Kobex Resources Ltd. and CuMoCo Resources Corp. Kobex commenced drilling in August 2006 and completed one hole. On October 6, 2006, Kobex delivered a notice of termination in respect of the CuMo property. The option on the project was terminated when the second hole was at a depth of 600 ft, and the action was taken before any assays were received. ICMC (wholly owned US subsidiary of CuMoCo.) assumed control of the project on October 10, 2006 and completed this hole to a depth of 1,710 ft before the program was halted due to the onset of winter conditions.
| 7.4 | 2007 to 2011 Drill Program |
Between 2007 and 2011, diamond drilling was done by Kirkness Drilling (Kirkness) of Carson City, Nevada. Kirkness drilled 33 diamond drill holes. Table 10-2 provides details of the drilling undertaken from 2006 to 2011.
| SMD | Cumo S-k 1300 Technical Report | November 2022 |
Geologic 2CM027.001 CuMoCo. | Page 49 |
Table 10-2: Summary of 2006 to 2011 diamond drilling at CuMo
| Hole | Northing | Easting | Elevation | Dip | Azimuth | Length (ft) |
| 27-06 | 120,032 | 220,208 | 6,351 | -90 | 0 | 1,849 completed |
| 28-06 | 119,540 | 220,817 | 6,321 | -90 | 0 | 1,716 completed |
| 29-07 | 119,779 | 221,247 | 6,344 | -70 | 140 | 2,281.7 completed |
| 30-07 | 119,732 | 219,617 | 6,213 | -90 | 0 | 2,411.5 completed |
| 31-07 | 119,792 | 221,243 | 6,342 | -70 | 45 | 2,104 completed |
| 32-07 | 119,558 | 220,823 | 6,324 | -70 | 190 | 2,044 completed |
| 33-07 | 118,477 | 221,227 | 6,797 | -90 | 0 | 2,095 stopped |
| 34-07 | 118,658 | 220,487 | 6,534 | -70 | 95 | 1,769 stopped |
| 35-08 | 118,655 | 220,480 | 6,533 | -90 | 0 | 2,817 completed |
| 36-08 | 119,335 | 219,449 | 6,275 | -90 | 0 | 2,488 completed |
| 37-08 | 119,780 | 221,247 | 6,341 | -70 | 335 | 2,195 completed |
| 38-08 | 118,655 | 220,480 | 6,533 | -70 | 180 | 2,441 completed |
| 39-08 | 118,918 | 220,813 | 6,575 | -90 | 0 | 2,688 completed |
| 40-08 | 119,530 | 220,791 | 6,321 | -70 | 225 | 2,252 completed |
| 41-08 | 119,630 | 218,962 | 6,220 | -90 | 0 | 3,018 completed |
| 42-08 | 118,749 | 219,911 | 6,549 | -70 | 270 | 2,707 stopped (winter) |
| 43-08 | 120,613 | 220,053 | 6,174 | -80 | 40 | 1,308 stopped by fault |
| 44-08 | 118,085 | 221,516 | 6,739 | -65 | 75 | 3,047 completed |
| 45-08 | 119,802 | 218,821 | 6,184 | -80 | 330 | 1,796 stopped (winter) |
| 46-09 | 118,914 | 220,811 | 6,575 | -75 | 110 | 959 stopped |
| 47-09 | 120,687 | 219,422 | 5,833 | -90 | 0 | 2,530 completed |
| 48-09 | 120,690 | 219,425 | 5,826 | -70 | 305 | 2,576 completed |
| 49-09 | 119,095 | 221,746 | 6,645 | -90 | 0 | 2,847 completed |
| 50-09 | 121,548 | 219,844 | 5,833 | -75 | 270 | 1,826 completed |
| 51-09 | 121,535 | 219,860 | 5,829 | -90 | 0 | 1,593.5 completed |
| 52-09 | 118,500 | 221,251 | 6,791 | -75 | 20 | 2,772 completed |
| 53-09 | 119,804 | 218,831 | 6,183 | -75 | 15 | 2,461 completed |
| 54-09 | 119,535 | 219,005 | 6,196 | -75 | 15 | 1,096 completed |
| 55-10 | 117,560 | 218,422 | 6,724 | -65 | 0 | 2,479 completed |
| 56-10 | 117,560 | 218,422 | 6,724 | -65 | 305 | 1,294 completed |
| 57-10 | 117,559 | 218,422 | 6,724 | -90 | 0 | 534 stopped (winter) |
| 58-11 | 119,143 | 219,970 | 6,451 | -90 | 0 | 1,885 completed |
| 59-11 | 119,096 | 221,746 | 6,645 | -75 | 0 | 1,910 completed |
Note: Hole 27-06 was started in 2006 and completed in 2007. With footage recorded in Table 10-1 in both 2006 and 2007.
| SMD | Cumo S-k 1300 Technical Report | November 2022 |
Geologic 2CM027.001 CuMoCo. | Page 50 |
All CuMoCo drilling programs were directly supervised by onsite geology staff located in Garden Valley, Idaho. Drilling consisted of both HQ and NQ diameter core with holes being started with HQ diameter and then reducing at a major fault intersection or at 1000 feet which ever was less. Core recoveries were monitored and were excellent (90%+)
All CuMoCo holes were surveyed down-the-hole at regular intervals (100 feet) using a Reflex survey instrument.
All core was collected at the drill site by the diamond drillers under supervision of onsite geology staff and delivered to the secure warehouse facility in Garden Valley where they were logged, analyzed and samples collected. All drill sites were surveyed using a total field station in order to accurately locate the holes. Section 11.1 gives more details on the sampling procedures and core box handling methods employed.
Figure 10-1 shows the locations of all holes drilled to date in the deposit, as well as the future locations of the 33 drill-holes proposed in the recommendations in Section 26 of this report. Figure 10-2 and Figure 10-3 show typical sections through the deposit.
A summary of significant intersections for all the CuMo drilling undertaken by CuMoCo is given in Table 10-3.
| SMD | Cumo S-k 1300 Technical Report | November 2022 |
Geologic 2CM027.001 CuMoCo. | Page 51 |

Source: Giroux et al, 2015 modified 2019
Figure 10-1: Map showing the location of completed and proposed drill holes
| SMD | Cumo S-k 1300 Technical Report | November 2022 |
Geologic 2CM027.001 CuMoCo. | Page 52 |
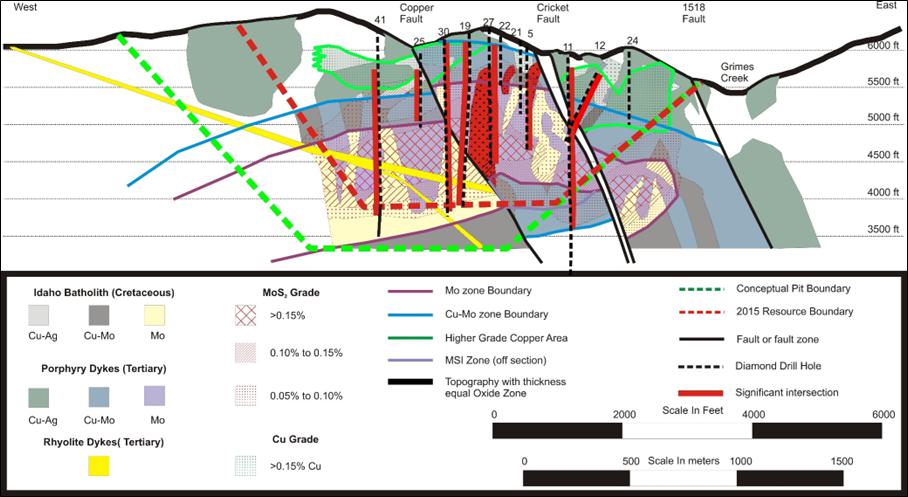
Source: Giroux et al, 2015 modified 2019
Figure 10-2: CuMo deposit Q-Q cross section
| SMD | Cumo S-k 1300 Technical Report | November 2022 |
Geologic 2CM027.001 CuMoCo. | Page 53 |
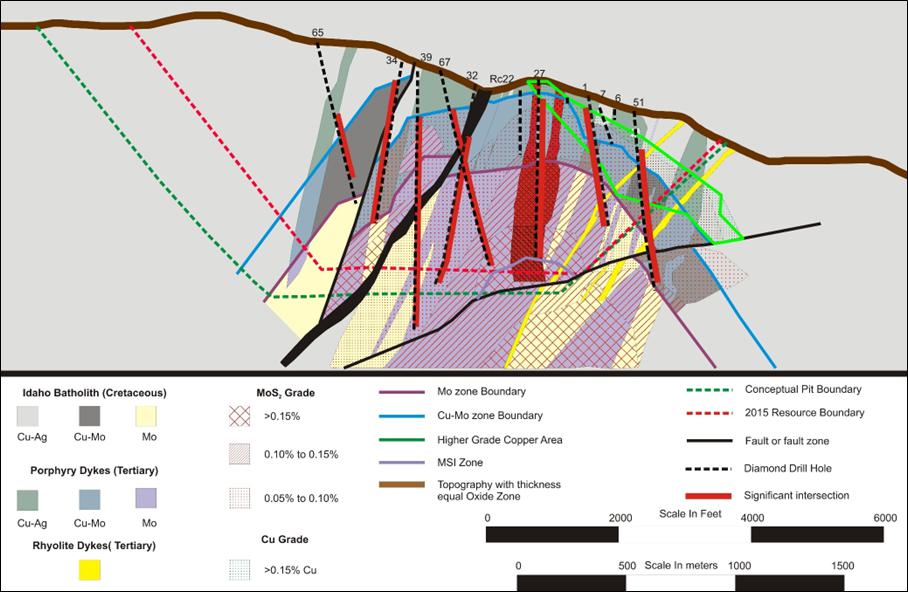
Source: Giroux et al, 2015 modified 2019
Figure 10-3: CuMo deposit H-H cross section
| SMD | Cumo S-k 1300 Technical Report | November 2022 |
Geologic 2CM027.001 CuMoCo. | Page 54 |
Table 10-3: Significant intersections from CuMo drilling
Hole (Name) | From (meters) | To (meters) | Length (meters) | Zone | Cu equiv. % | MoS2 equiv. % | MoS2 (%) | Cu (%) | Ag (ppm) | Re (ppm) | W (ppm) |
| C71-01 | 70.4 | 574.2 | 503.8 | main | 0.38 | 0.088 | 0.059 | 0.12 | 2.59 | 0.00 | 46 |
| C71-01 | 118.9 | 143.3 | 24.4 | Incl. | 0.53 | 0.122 | 0.099 | 0.14 | 2.56 | 0.00 | 44 |
| C71-01 | 518.2 | 574.2 | 56.1 | Incl. | 0.49 | 0.114 | 0.100 | 0.08 | 1.21 | 0.00 | 54 |
| C72-05 | 137.2 | 431.6 | 294.4 | main | 0.43 | 0.099 | 0.060 | 0.13 | 4.46 | 0.00 | 75 |
| C74-09 | 140.2 | 245.2 | 105.0 | main | 0.54 | 0.126 | 0.077 | 0.12 | 7.16 | 0.00 | 71 |
| C75-10 | 67.1 | 658.4 | 591.3 | main | 0.47 | 0.109 | 0.099 | 0.05 | 1.43 | 0.00 | 48 |
| C76-11 | 42.7 | 740.1 | 697.5 | main | 0.36 | 0.084 | 0.074 | 0.05 | 1.55 | 0.00 | 36 |
| C76-11 | 396.2 | 597.4 | 201.2 | Incl. | 0.55 | 0.128 | 0.127 | 0.03 | 0.77 | 0.00 | 58 |
| C76-12 | 29.9 | 435.9 | 405.9 | main | 0.25 | 0.058 | 0.041 | 0.06 | 1.66 | 0.00 | 45 |
| C77-13 | 207.3 | 549.9 | 342.6 | main | 0.51 | 0.119 | 0.111 | 0.05 | 1.98 | 0.00 | 49 |
| C77-14 | 237.7 | 647.3 | 409.6 | main | 0.53 | 0.124 | 0.114 | 0.06 | 1.84 | 0.00 | 65 |
| C77-14 | 365.8 | 597.4 | 231.6 | Incl. | 0.68 | 0.158 | 0.151 | 0.06 | 1.91 | 0.00 | 74 |
| C77-15 | 182.9 | 589.2 | 406.4 | main | 0.53 | 0.123 | 0.113 | 0.06 | 1.73 | 0.00 | 57 |
| C77-15 | 384.0 | 573.0 | 189.0 | Incl. | 0.64 | 0.150 | 0.153 | 0.02 | 0.75 | 0.00 | 69 |
| C78-16 | 304.8 | 649.7 | 344.9 | main | 0.44 | 0.102 | 0.093 | 0.04 | 1.86 | 0.00 | 32 |
| C78-17 | 353.6 | 695.4 | 341.8 | main | 0.37 | 0.086 | 0.064 | 0.08 | 2.55 | 0.00 | 40 |
| C78-18 | 426.7 | 719.6 | 292.9 | main | 0.62 | 0.144 | 0.129 | 0.08 | 2.71 | 0.00 | 41 |
| C79-19 | 36.6 | 694.9 | 658.4 | main | 0.51 | 0.118 | 0.101 | 0.08 | 2.27 | 0.00 | 49 |
| C79-20 | 50.3 | 548.6 | 498.3 | main | 0.43 | 0.099 | 0.069 | 0.11 | 3.83 | 0.00 | 52 |
| C81-25 | 57.9 | 308.2 | 250.2 | main | 0.43 | 0.101 | 0.070 | 0.13 | 2.42 | 0.00 | 58 |
| C81-25 | 225.6 | 308.2 | 82.6 | Incl. | 0.53 | 0.124 | 0.090 | 0.14 | 2.98 | 0.00 | 84 |
| C81-26 | 9.1 | 228.6 | 219.5 | main | 0.41 | 0.094 | 0.034 | 0.18 | 7.58 | 0.00 | 28 |
| C06-27 | 36.6 | 563.6 | 527.0 | main | 0.42 | 0.097 | 0.084 | 0.06 | 1.60 | 0.02 | 49 |
| C06-27 | 329.2 | 563.6 | 234.4 | Incl. | 0.58 | 0.136 | 0.133 | 0.04 | 0.99 | 0.04 | 59 |
| C06-28 | 15.2 | 515.1 | 499.9 | main | 0.47 | 0.110 | 0.097 | 0.07 | 1.92 | 0.05 | 54 |
| C06-28 | 256.0 | 378.0 | 121.9 | Incl. | 0.70 | 0.162 | 0.162 | 0.03 | 0.98 | 0.09 | 68 |
| C07-29 | 57.9 | 679.7 | 621.8 | main | 0.52 | 0.121 | 0.103 | 0.08 | 2.13 | 0.05 | 53 |
| C07-29 | 359.7 | 545.6 | 185.9 | Incl. | 0.74 | 0.171 | 0.169 | 0.04 | 1.2 | 0.08 | 37 |
| C07-30 | 12.2 | 727.3 | 715.1 | main | 0.52 | 0.122 | 0.108 | 0.06 | 2.05 | 0.04 | 41 |
| C07-30 | 359.7 | 605.9 | 246.3 | Incl. | 0.80 | 0.187 | 0.185 | 0.04 | 1.46 | 0.07 | 37 |
| C07-31 | 6.7 | 641.3 | 634.6 | main | 0.34 | 0.079 | 0.064 | 0.07 | 1.76 | 0.02 | 43 |
| C07-31 | 237.7 | 469.4 | 231.6 | Incl. | 0.40 | 0.092 | 0.081 | 0.05 | 1.45 | 0.03 | 45 |
| C07-32 | 6.7 | 641.3 | 634.6 | main | 0.55 | 0.129 | 0.109 | 0.09 | 2.26 | 0.04 | 61 |
| C07-32 | 237.7 | 469.4 | 231.6 | Incl. | 0.65 | 0.151 | 0.129 | 0.10 | 2.62 | 0.05 | 77 |
| C07-33 | 220.0 | 638.3 | 418.2 | main | 0.20 | 0.048 | 0.026 | 0.07 | 2.01 | 0.01 | 48 |
| C07-33 | 603.5 | 638.3 | 34.7 | Incl. | 0.48 | 0.111 | 0.084 | 0.10 | 2.68 | 0.03 | 67 |
| C07-34 | 42.7 | 539.2 | 496.5 | main | 0.25 | 0.058 | 0.034 | 0.08 | 2.30 | 0.01 | 53 |
| C07-34 | 472.4 | 539.2 | 66.8 | Incl. | 0.41 | 0.096 | 0.074 | 0.09 | 2.36 | 0.02 | 67 |
| C08-35 | 36.6 | 804.7 | 768.1 | main | 0.31 | 0.072 | 0.057 | 0.06 | 1.73 | 0.02 | 37 |
| C08-35 | 128.0 | 804.7 | 676.7 | Incl. | 0.33 | 0.077 | 0.062 | 0.07 | 1.69 | 0.02 | 39 |
| SMD | Cumo S-k 1300 Technical Report | November 2022 |
Geologic 2CM027.001 CuMoCo. | Page 55 |
Hole (Name) | From (meters) | To (meters) | Length (meters) | Zone | Cu equiv. % | MoS2 equiv. % | MoS2 (%) | Cu (%) | Ag (ppm) | Re (ppm) | W (ppm) |
| C08-35 | 527.3 | 804.7 | 277.4 | Incl. | 0.43 | 0.100 | 0.089 | 0.05 | 1.37 | 0.03 | 35 |
| C08-36 | 170.7 | 758.3 | 587.7 | main | 0.43 | 0.100 | 0.088 | 0.05 | 1.42 | 0.03 | 34 |
| C08-36 | 280.4 | 758.3 | 477.9 | Incl. | 0.39 | 0.090 | 0.103 | 0.04 | 1.04 | 0.03 | 33 |
| C08-37 | 18.3 | 669.0 | 650.7 | main | 0.43 | 0.100 | 0.084 | 0.05 | 1.67 | 0.03 | 42 |
| C08-37 | 237.7 | 649.2 | 411.5 | Incl. | 0.40 | 0.094 | 0.104 | 0.02 | 1.17 | 0.04 | 41 |
| C08-38 | 51.8 | 744.0 | 692.2 | main | 0.46 | 0.106 | 0.029 | 0.06 | 4.40 | 0.00 | 32 |
| C08-39 | 94.5 | 819.3 | 724.8 | main | 0.24 | 0.056 | 0.099 | 0.06 | 1.38 | 0.03 | 52 |
| C08-39 | 274.3 | 728.5 | 454.2 | Incl. | 0.47 | 0.109 | 0.122 | 0.04 | 1.09 | 0.04 | 57 |
| C08-40 | 18.3 | 686.4 | 668.1 | main | 0.54 | 0.127 | 0.115 | 0.06 | 3.79 | 0.04 | 46 |
| C08-40 | 118.9 | 634.0 | 515.1 | Incl. | 0.57 | 0.133 | 0.129 | 0.06 | 4.27 | 0.05 | 45 |
| C08-40 | 338.3 | 554.7 | 216.4 | Incl. | 0.64 | 0.150 | 0.142 | 0.04 | 7.78 | 0.06 | 45 |
| C08-41 | 259.1 | 862.6 | 603.5 | main | 0.75 | 0.173 | 0.067 | 0.08 | 2.23 | 0.02 | 43 |
| C08-41 | 454.2 | 618.7 | 164.6 | Incl. | 0.38 | 0.088 | 0.107 | 0.08 | 2.99 | 0.03 | 38 |
| C08-41 | 759.0 | 862.6 | 103.6 | Incl. | 0.56 | 0.129 | 0.077 | 0.06 | 1.53 | 0.03 | 34 |
| C08-42 | 167.6 | 825.1 | 657.5 | main | 0.38 | 0.089 | 0.044 | 0.06 | 5.81 | 0.01 | 25 |
| C08-42 | 289.6 | 825.1 | 535.5 | Incl. | 0.33 | 0.077 | 0.047 | 0.07 | 6.78 | 0.01 | 27 |
| C08-42 | 600.5 | 825.1 | 224.6 | Incl. | 0.36 | 0.084 | 0.063 | 0.05 | 1.61 | 0.01 | 21 |
| C08-43 | 50.3 | 397.2 | 346.9 | main | 0.32 | 0.075 | 0.044 | 0.09 | 4.23 | 0.02 | 52 |
| C08-43 | 201.2 | 249.9 | 48.8 | Incl. | 0.48 | 0.053 | 0.07 | 0.11 | 3.14 | 0.03 | 45 |
| C08-44 | 342.9 | 865.6 | 522.7 | main | 0.71 | 0.078 | 0.03 | 0.02 | 0.89 | 0.01 | 29 |
| C08-44 | 780.3 | 819.9 | 39.6 | Incl. | 0.15 | 0.035 | 0.06 | 0.02 | 1.47 | 0.01 | 20 |
| C08-45 | 51.8 | 547.4 | 495.6 | main | 0.27 | 0.062 | 0.02 | 0.15 | 3.08 | 0.00 | 42 |
| C08-45 | 307.8 | 547.4 | 239.6 | Incl. | 0.27 | 0.062 | 0.03 | 0.18 | 3.05 | 0.00 | 40 |
| C09-46 | 91.4 | 292.3 | 200.9 | main | 0.33 | 0.077 | 0.03 | 0.09 | 2.61 | 0.01 | 55 |
| C09-47 | 88.4 | 529.3 | 440.9 | main | 0.27 | 0.062 | 0.07 | 0.18 | 4.29 | 0.02 | 20 |
| C09-47 | 292.6 | 865.6 | 573.0 | main | 0.42 | 0.097 | 0.05 | 0.18 | 5.03 | 0.02 | 20 |
| C09-48 | 463.3 | 737.6 | 274.3 | Incl. | 0.40 | 0.094 | 0.08 | 0.05 | 1.70 | 0.03 | 17 |
| C09-49 | 246.9 | 464.7 | 217.8 | main | 0.38 | 0.087 | 0.11 | 0.06 | 1.91 | 0.04 | 17 |
| C09-49 | 158.5 | 478.5 | 320.0 | main | 0.48 | 0.112 | 0.03 | 0.15 | 5.29 | 0.01 | 20 |
| C09-50 | 271.3 | 823.0 | 551.7 | main | 0.31 | 0.072 | 0.04 | 0.15 | 4.86 | 0.02 | 19 |
| C09-51 | 545.6 | 804.7 | 259.1 | Incl. | 0.34 | 0.080 | 0.09 | 0.07 | 1.69 | 0.03 | 18 |
| C09-52 | 243.8 | 753.2 | 509.3 | main | 0.43 | 0.100 | 0.14 | 0.05 | 1.29 | 0.06 | 17 |
| C09-52 | 460.2 | 753.2 | 292.9 | Incl. | 0.63 | 0.147 | 0.09 | 0.19 | 4.07 | 0.02 | 18 |
| C09-53 | 179.5 | 334.1 | 154.5 | main | 0.42 | 0.098 | 0.12 | 0.15 | 3.68 | 0.03 | 19 |
| C09-53 | 70.1 | 128.0 | 57.9 | main | 0.49 | 0.113 | 0.11 | 0.05 | 1.69 | 0.03 | 17 |
| C09-54 | 362.7 | 365.8 | 3.0 | Incl. | 0.20 | 0.045 | 0.03 | 0.07 | 35.44 | 0.00 | 21 |
| C10-55 | 67.1 | 152.4 | 85.3 | main | 0.25 | 0.057 | 0.04 | 0.01 | 0.42 | 0.01 | 21 |
| C10-55 | 91.4 | 149.4 | 57.9 | main | 0.49 | 0.071 | 0.07 | 0.02 | 3.80 | 0.02 | 21 |
| C10-56 | 67.1 | 152.4 | 85.3 | main | 0.15 | 0.035 | 0.03 | 0.01 | 0.01 | 0.01 | 25 |
| C10-57 | 91.4 | 149.4 | 57.9 | main | 0.35 | 0.082 | 0.07 | 0.02 | 0.02 | 0.02 | 18 |
| SMD | Cumo S-k 1300 Technical Report | November 2022 |
Geologic 2CM027.001 CuMoCo. | Page 56 |
Note: description of how the equivalent values are calculated is provided in Section 10.6 below
The 2006-2011 results confirmed the extent and grade of mineralization on the property as indicated by previous drilling and demonstrated continuity of mineralization between the original wide-spaced holes.
The 2006-2011 drilling data supports the presence of three distinct mineralized zones within the deposit. Amax previously interpreted these zones as distinct shells that were produced by separate intrusions. Re-interpretation of the geology, alteration and down-hole histograms for Cu, Ag and Mo have confirmed the mineralized zones are a part of a single, large, concentrically zoned system with an upper Cu-Ag Zone, underlain by a transitional Cu-Mo Zone, in turn underlain by a lower molybdenum-rich Mo Zone (Figure 10-2).
In 2012, a total of 4,213.3 m (15,463 ft) in nine holes were completed (Table 10-4). The holes were located to infill gaps in the existing drilling coverage and were drilled along existing tracks and roads. All holes were surveyed down-the-hole at regular intervals using a Reflex survey instrument. Co-ordinates, elevations and lengths are in feet.
Table 10-4: Summary of 2012 diamond drilling
| Hole | Year | Easting | Northing | Elevation | Dip | Azimuth | Length | Comment |
| 12-60 | 2012 | 218,422 | 117,560 | 6,724 | -50 | 180 | 1455 | Completed |
| 12-61 | 2012 | 219,911 | 118,749 | 6,549 | -75 | 335 | 1318 | Stopped |
| 12-62 | 2012 | 218,041 | 116,866 | 6,629 | -50 | 135 | 1484 | Completed |
| 12-63 | 2012 | 218,042 | 116,867 | 6,629 | -60 | 330 | 807 | Completed |
| 12-64 | 2012 | 220,811 | 118,914 | 6,575 | -75 | 25 | 2139 | Completed |
| 12-65 | 2012 | 221,118 | 118,149 | 6,786 | -80 | 315 | 1908 | Completed |
| 12-66 | 2012 | 221,688 | 118,674 | 6,690 | -90 | 0 | 2241 | Completed |
| 12-67 | 2012 | 220,811 | 118,914 | 6,575 | -70 | 340 | 1978 | Completed |
| 12-68 | 2012 | 221,746 | 119,096 | 6,645 | -70 | 310 | 2134 | Completed |
A summary of significant intersections for all the CuMo drilling undertaken by CuMoCo is given in Table 10-5 and Table 10-7.
| SMD | Cumo S-k 1300 Technical Report | November 2022 |
Geologic 2CM027.001 CuMoCo. | Page 57 |
Table 10-5: Significant intersections from 2011-2012 CuMo drilling
| Hole Name | From (metres) | To (metres) | Length (metres) | Zone | MoS2 (%) | Cu (%) | Ag (ppm) | Re (ppm) | W (ppm) |
| C11-58 | 213.4 | 574.5 | 361.2 | main | 0.08 | 0.07 | 0.07 | 0.03 | 41 |
| C11-59 | 152.4 | 582.2 | 429.8 | main | 0.07 | 0.13 | 0.13 | 0.02 | 109 |
| C12-60 | 70.1 | 118.9 | 48.8 | main | 0.05 | 0.02 | 0.02 | 0 | 7 |
| C12-61 | 121.9 | 401.4 | 279.5 | main | 0.03 | 0.11 | 0.11 | 0.01 | 28 |
| C12-62 | No significant intersections: hole drilled away from deposit |
| C12-63 | 184.4 | 189 | 4.6 | main | 0 | 0.21 | 130.6 | 0 | 7 |
| C12-64 | 91.4 | 667.5 | 576.1 | main | 0.08 | 0.07 | 1.77 | 0.03 | 47 |
| C12-64 | 301.8 | 573 | 271.3 | Incl. | 0.12 | 0.07 | 1.6 | 0.04 | 59 |
| C12-65 | 167.6 | 478.5 | 310.9 | main | 0.02 | 0.05 | 1.23 | 0.01 | 44 |
| C12-66 | 121.9 | 401.4 | 279.5 | main | 0.02 | 0.06 | 1.58 | 0 | 40 |
| C12-66 | 163.1 | 401.4 | 238.4 | Incl. | 0.02 | 0.07 | 1.69 | 0 | 45 |
| C12-67 | 173.7 | 600.5 | 426.7 | main | 0.1 | 0.09 | 2.11 | 0.04 | 56 |
| C12-67 | 277.4 | 600.5 | 323.1 | Incl. | 0.12 | 0.08 | 1.66 | 0.05 | 61 |
| C12-68 | 277.4 | 548.6 | 271.3 | main | 0.1 | 0.08 | 1.85 | 0.04 | 73 |
| C12-68 | 402.3 | 548.6 | 146.3 | Incl. | 0.13 | 0.07 | 1.77 | 0.06 | 65 |
Note: The convention for the CuMo project has been to measure percent elemental molybdenum (%Mo) in assays and to calculate %MoS2 by multiplying %Mo by 1.6681.
Table 10-6: Recoverable equivalent grades for significant intersections from 2011-2012 CuMo drilling
| Hole Name | Length (metres) | | RecG* MoS2 equiv. (%) | RecG* Cu equiv. (%) |
| C11-58 | 361.2 | | 0.100 | 0.43 |
| C11-59 | 429.8 | | 0.125 | 0.54 |
| C12-60 | 48.8 | | 0.068 | 0.29 |
| C12-61 | 279.5 | | 0.061 | 0.27 |
| C12-62 | No significant intersections: hole drilled away from deposit |
| C12-63 | 4.6 | | 0.556 | 2.39 |
| C12-64 | 576.1 | | 0.097 | 0.41 |
| C12-64 | 271.3 | | 0.130 | 0.56 |
| C12-65 | 310.9 | | 0.031 | 0.14 |
| C12-66 | 279.5 | | 0.031 | 0.14 |
| C12-66 | 238.4 | | 0.034 | 0.15 |
| C12-67 | 426.7 | | 0.119 | 0.51 |
| C12-67 | 323.1 | | 0.130 | 0.56 |
| C12-68 | 271.3 | | 0.112 | 0.48 |
| C12-68 | 146.3 | | 0.143 | 0.61 |
* - RecG = Recoverable grades expressed as recoverable equivalent-metal grades (Section 10.6).
Notes: These values are NOT additive and are simply different ways of expressing the poly-metallic material in terms of recoverable equivalent grade. Each value reflects all relevant metal grades in the intersections.
The convention for the CuMo project has been to measure percent elemental molybdenum (%Mo) in assays and to calculate %MoS2 by multiplying %Mo by 1.6681.
| SMD | Cumo S-k 1300 Technical Report | November 2022 |
Geologic 2CM027.001 CuMoCo. | Page 58 |
| 7.6 | Metal Equivalent Calculations |
Because of the multi-element nature of the mineralization and mineral zoning, it was decided to calculate both a copper and molybdenum equivalent for the intercepts. The following outlines the calculations involved:
Metal equivalents for mineral equivalent calculations were based on metal prices outlined in Table 10-7.
Table 10-7: Metal prices used to calculate copper and molybdenum equivalent. and represent the longer term predictions for future prices combined with the moving average for the past 3 years
| Metal | Price ($US) | Unit |
| Copper | 2.50 | lb |
| Molybdenum trioxide | 10.00 | lb |
| Silver | 0.35 | ppm |
Estimated metallurgical recoveries used in the calculations are outlined in Table 10-8.
Table 10-8: Metallurgical recoveries used to calculate copper and MoS2 equivalent
| Mineral Zone | Mo% | Cu% | Ag % |
| OX | 80 | 60 | 70 |
| Cu-Ag | 85 | 68 | 73 |
| Cu-Mo | 92 | 87 | 78 |
| Mo | 95 | 80 | 55 |
| MSI | 95 | 80 | 55 |
Recovery (Rec) is taken from the above table for each assay in a particular mineral zone and applied in the following formula to derive the equivalents:
%Cu Equiv. = (%Cu x 20 x $(Cu) x Rec(Cu) + %MoS2 x 20 x $(MoO3) x (1.5/1.6681) x Rec(Mo) + Ag x $(Ag) x Rec(Ag)) / ($(Cu) x Rec(Cu) x 20)
%MoS2Equiv. = (%Cu x 20 x $(Cu) x Rec(Cu) + %MoS2 x 20 x $(MoO3) x (1.5/1.6681) x Rec(Mo) + Ag x $(Ag) x Rec(Ag)) / ($(MoO3) x Rec(Mo) x 20 x 1.5/1.6681)
Note that since the convention on the CuMo project has been to work with %MoS2 for resource estimation, in the foregoing equivalency formulae, %MoS2 is converted back to %Mo by dividing by 1.6681. %Mo is then converted to %MoO3 by multiplying by 1.5. Also, the %MoS2 Equiv values would be 1.6681 times greater than %Mo Equiv.
| SMD | Cumo S-k 1300 Technical Report | November 2022 |
Geologic 2CM027.001 CuMoCo. | Page 59 |
Table 10-9: Terms used in formulae for equivalent grade calculations
| Term | Definition |
| %Cu | Copper grade in % |
| $(Cu) | Copper price per pound |
| Rec(Cu) | Copper recovery |
| %MoS2 | Molybdenum disulfide (molybdenite) grade in % |
| $(MoO3) | Molybdenum oxide price per pound |
| Rec(Mo) | Molybdenum recovery |
| Ag | Silver grade in ppm |
| $(Ag) | Silver price per gram |
| Rec(Ag) | Silver Recovery |
| %Cu. Equiv. | Copper equivalent in-situ grade |
| %MoS2 Equiv. | Molybdenite equivalent in-situ grade |
Note: Only molybdenum (as grade of MoS2 and conventional pricing of MoO3), copper and silver are used in the equivalent calculations.
| SMD | Cumo S-k 1300 Technical Report | November 2022 |
Geologic 2CM027.001 CuMoCo. | Page 60 |
| 8 | Sample Preparation, Analyses, and Security |
The QP has reviewed the procedures followed by CuMoCo and by third parties on behalf of CuMoCo, and believes these procedures are consistent with industry best practices and acceptable for use in geological and resource modelling.
Sampling was restricted during 2006 to 2012 to diamond drill hole (DDH) core and metallurgical sampling of previously drilled DDH core. Standard core sampling methods were employed for both drill core and metallurgical samples.
At the time of drilling, each core box was clearly labeled by the driller’s helper with the DDH hole number, core box number, and “to” and “from” drill core footages. Wooden core boxes were used at all times, and full core boxes were sealed with a lid. The driller(s) and/or geologist(s) then delivered the core boxes to the secure core storage warehouse located in Garden Valley, Idaho. The core boxes were laid out in sequence upon long tables specifically made for core logging purposes. A geologist then logged the core for lithology, structure, alteration and mineralization. Geotechnical measurements for RQD were recorded. Each core box was additionally labelled using a metal Dymo® labelling tool for long-term preservation of identification. The core was photographed, two boxes at a time, using a mounted Nikon digital camera. It was then delivered to the core-cutting technician. The photographs were downloaded onto computer files specific to each drill hole.
A core technician using a standard rock saw sampled the core using typical procedures. Half-core was collected at regular 10 ft intervals for analysis. Sample lengths were adjusted to lithological contacts in cases where barren dikes were intersected.
Half core sample intervals were placed in ether cloth or heavy plastic sample bags with the sample number placed on the outside of the bag in black permanent marker. Individual sample interval tags were included in each sample bag. The bag was then secured with a wire tie and placed within a plastic transport crate for shipping.
MoS2loss from soft fracture fillings being washed away when the core was sawed in half have been noted at CuMo. Although there is no physical way to eliminate this problem at present, other than schooling the technicians on the extra care needed when sawing a soft fracture zone, geologists at CuMo have addressed possible inadvertent contamination of other core from MoS2 enriched water from the rock saw’s water recirculation tank. The cut core was given a second clear water bath prior to being bagged or stored and the recirculation tank was voided and refilled based upon clarity.
The half core was sent for analysis, and the other half was retained and stored at the core storage warehouse in Garden Valley, Idaho. The retained core was replaced in their original core boxes which were sealed with a plywood cover and stacked upon a standard pallet. Each plywood cover was clearly labelled with the core’s information. The pallet was then strapped with a metal banding tool and stored within the archive section of the core storage warehouse in Garden Valley, Idaho.
Blanks and standards were inserted into the sample stream at a frequency of one every 20 samples. The core-cutting technician selected the exact intervals and noted them on the sample logs. The core technician inserted the blanks whereas the standards were selected and inserted by the geologist-in-charge.
| SMD | Cumo S-k 1300 Technical Report | November 2022 |
Geologic 2CM027.001 CuMoCo. | Page 61 |
Standards were selected from three bulk standards (low, medium and high grade) that were prepared from historic CuMo drill core samples. Standards were selected on the basis of appropriate grade to match the estimated grade of the core adjacent to each standard sample interval.
The standards were prepared and packaged by CDN Resource Laboratories Ltd. (CDN Labs) of Surrey, British Columbia. Each bulk sample was pulverized in a large rod mill, screened through 200 mesh using an electric sieve, and homogenized in a large rotating mixer. Each standard was sealed in plastic to prevent gravity separation and oxidation. The standards were certified by Smee & Associates Consulting Ltd. of North Vancouver, British Columbia, based on round-robin analysis at five laboratories using a four-acid digestion and ICP-ES finish (Table 11-1). Note that the Mo ppm values reflect measured Mo metal (not MoS2).
Table 11-1: Certified standards prepared for CuMo project
| Standard | Element | Certified Mean | Standard Deviation (between lab) |
| Standard 1 | Total Cu | 1138 ppm | 65 ppm |
| Total Mo | 367 ppm | 19 ppm |
| Standard 2 | Total Cu | 151 ppm | 8 ppm |
| Total Mo | 995 ppm | 41 ppm |
| Standard 3 | Total Cu | 840 ppm | 35 ppm |
| Total Mo | 54.0 ppm | 3.7 ppm |
The bagged core samples were string or wire tied and then stored temporarily in holding pallets at the core storage warehouse in Garden Valley. When enough samples were accumulated, the samples were delivered by CuMoCo personnel to ALS-Chemistry (ALS Chemex) in Elko, Nevada for preparation and analysis.
| 8.2 | Density Determinations |
Historical specific gravity determinations were made by Amax for CuMo for each mineralized zone. The measurements were made using the weight in air/weight in water procedure by Skyline Laboratories of Colorado. CuMoCo, prior to 2012, had occasional density measurements at ALS-Chemex’s lab.
In 2012, CuMoCo initiated a regular density measurement program where 4 to 6-inch skeletons of half-cores from each sample interval that are representative of the 10 ft interval are analyzed. The following equipment was used in the analysis which has been added to the regular core processing routine: 4000 grams (g) Sartorius Extend Series Digital Scale, with hook attachment, stand for scale, bucket distilled water, bricks, computer with MS EXCEL®, 2000 g calibration weight.
| SMD | Cumo S-k 1300 Technical Report | November 2022 |
Geologic 2CM027.001 CuMoCo. | Page 62 |
The density calculations are as follows:
Weight in air / (Weight in air – Weight in water)
The following data were recorded on the EXCEL® spreadsheet in accordance with the example structure shown in Table 11-2.
Table 11-2: Density data example
| Hole | Sample | Dl | Mg | Ml | Ds | Diameter | Scanner Max | Scanner Avg | Code |
| C08-41 | 95.5 | 1 | 396.53 | 240.82 | 2.55 | 16 | 0.101 | 0.048 | Cu-Ag |
The hole number is listed along with the depth of the sample. Dl is the density of the distilled water, Mg is the mass of the sample in air, Ml is the mass of the sample in water, and Ds is the density of the solid. A zone code is also added to identify the mineralized zone of the sample.
A total of 4,339 density measurements were completed on holes C08-41 to C12-68.
An additional density measurement of the bulk sample delivered to SGS was done as part of the metallurgical study, the density obtained by SGS confirmed the earlier density measurements done by Amax.
Table 11-3 outlines the density values for each of the different mineralized zones plus dykes.
Table 11-3: Density measurement results summary
| Grade Domain Code | Density (tonnes per m3) | Sample Count |
| OX | 2.50 | 578 |
| Cu-Ag | 2.58 | 1496 |
| Cu-Mo | 2.58 | 1458 |
| Mo | 2.57 | 638 |
| MSI | 2.57 | 91 |
| DYKE | 2.52 | 78 |
Samples submitted by Kobex were routinely analyzed by the ALS-Chemex ME-ICP61 procedure code for 39 elements using a four-acid digestion with analysis by Plasma Emission Spectroscopy (ICP-AES).
Samples submitted by CuMoCo were routinely analyzed by ALS-Chemex , an independent ISO 9002 certified laboratory, ME-MS ICP61 procedure code for 47 elements using a four-acid digestion with analysis by Inductively Coupled Plasma Mass Spectrometry (ICP-MS).
Samples submitted by CuMoCo for inter-laboratory check analysis were analyzed by SGS, an independent ISO 9002 and ISO 17025 accredited laboratory, by the SGS ICM40B for 50 elements using a four-acid digestion/ICP-AES and ICP-MS.
| SMD | Cumo S-k 1300 Technical Report | November 2022 |
Geologic 2CM027.001 CuMoCo. | Page 63 |
The assay methods report the main element results as follows:
| | ● | Molybdenum as ppm Mo, which is stored as both ppm Mo metal and molybdenum disulphide (MoS2%) in the database to reflect the actual natural material. |
| | | |
| | ● | Copper in ppm Cu, which is stored in the database as both ppm and percent copper (Cu%). |
| | | |
| | ● | Silver in ppm Ag and stored as ppm, grams/tonne and ounces/ton in the database. |
| | | |
| | ● | W in ppm and stored in the database as ppm. |
| | | |
| | ● | Rhenium is reported in ppm and stored in the database as ppm. |
A contemporary, well-kept, large steel building was used to warehouse CuMoCo’s core, samples, sampling equipment and field office at the CuMo project headquarters in Garden Valley, Idaho. The building is well-lit and insulated with heavy metal doors that have security locks.
The building is located on the property of a nearby landowner and is on a state highway, which local law enforcement regularly patrols. Additionally, a geologist lives on the property for most of the year in an apartment that adjoins the metal building. Core is stored on pallets that are stacked two high and bound by metal strapping. Bagged samples waiting to be shipped are kept in high-walled pallets in a central location within the building.
The area where the samples are kept is well-lit, well ventilated and easy to observe by staff. The floor is reinforced concrete and the walls are steel. There are few windows. CuMoCo personnel are present on a nearly 24-hour basis in season. Off-season, a local watchman lives adjacent to the property and provides security for the building and its contents.
In 2017, all core, rejects and information was moved from Garden Valley to a larger secure warehouse in nearby Horseshoe Bend, which has the same level of security as the one in Garden Valley with the exception that the geologist, as of the date of the current report, no longer lives at the property.
In a June 2005 report (Giroux et. al, 2005), there were six data sets available to verify the original Skyline MoS2 assay data base (pre-CuMoCo involvement in project). The original Skyline assays were re-assayed by Skyline at three stages of the sampling procedure; from core duplicate samples, from splits of rejects and from splits from pulps. Three inter lab sets of duplicates are also available to compare with the Skyline original assays; a pulp sent to Amax Lab in Climax from diamond drill hole assays, a second split at the drill of reverse circulation drill cuttings and a selected set of samples sent to Hazen Laboratory. The results from all comparisons are presented as scatter plots in Appendix 5 and discussed below.
It should be noted that the convention for the CuMo project has been to measure percent elemental molybdenum (%Mo) in assays and to calculate %MoS2 by multiplying %Mo by 1.6681. Both %Mo and %MoS2 are stored in the project’s database, and the latter, %MoS2, is used in resource estimates and mine planning. Consequently, in the following descriptions, where %MoS2 grades are compared, these are the calculated MoS2 grades based on the underlying %Mo assays.
| SMD | Cumo S-k 1300 Technical Report | November 2022 |
Geologic 2CM027.001 CuMoCo. | Page 64 |
The first set compares 64 original MoS2 values with duplicate core samples both run at Skyline Laboratory. Figure A5.1 shows a very slight proportional bias indicated with the best fit regression line pulled below the equal value line, but more than likely this is simply a function of the wide random scatter in the data. The correlation coefficient is only 0.7061 indicating the amount of scatter about the best fit regression line seen in Figure A5.1. The average precision of ±78% again points to a high sampling variability between core samples.
A second subset of checks consisted of 25 original Skyline assays compared to re-splits of rejects also run by Skyline. This data set shows a very slight fixed bias with the best fit regression line, seen in Figure A5.2, a constant 0.0011 % MoS2 below the equal value line. The coefficient of correlation is a very good 0.9666. The average precision of this test is ±20%. This indicates good reproducibility between samples after initial crushing.
A third test was on a total of 408 samples that were reanalyzed by Skyline by taking a second assay from the pulp. This comparison is shown in Figure A5.3. The best fit regression line through the data mirrors the equal value line, indicating no bias. The correlation coefficient is 0.9891. The precision on the estimate is very good at ±23%.
The fourth check on the historic data consisted of a total of 303 sample pulps from diamond drill holes that were analyzed for MoS2by both Skyline and Amax. The results are shown in Figure A5.4. There is no bias indicated with the best fit regression line pulled slightly below the equal value line by a single high valued outlier. There appears to be an equal number of samples falling on either side of the equal value line. The correlation coefficient was excellent at 0.9671. The precision which is a measure of the reproducibility of a result by repeated attempts was ±56.5%.
A fifth set of duplicates compared original MoS2 results to an Amax second split of cuttings in a total of 57 samples from reverse circulation drill holes (see Figure A5.5). This subset shows no apparent bias, with the best fit regression line and equal value line being very close. The correlation coefficient of 0.5989 is lower than previous comparisons and the data shows much more scatter. The average precision is a much higher ±101%. This is a very poor comparison between two laboratories with a large degree of random scatter that is probably more the result of the two splits from the RC cuttings than a comparison of the laboratories.
A final test on Skyline original samples was a set of 10 samples sent to Hazen Research. While this is hardly a representative sample, the results shown in Figure A5.6 show a pronounced proportional bias with the best fit regression line pulled below the equal value line. On average, the original Skyline assays for MoS2 were 0.70 of the value indicated by Hazen. A total of 8 out of 10 samples returned higher values at Hazen. The correlation coefficient was poor at 0.7281 and the average precision was ±55%.
In general, the results from the first three tests at Skyline showed increasing precision and lower sampling variability from splits of core to splits from rejects to splits from pulps as would be expected. The inter-lab test from diamond drill pulps between Skyline and Amax showed good agreement and no bias. A similar check between Skyline and Amax on two splits from RC cuttings again showed no bias but higher sampling variability. The final limited test of 10 samples comparing original Skyline results with Hazen checks showed a strong bias with Hazen overestimating MoS2 relative to Skyline.
| SMD | Cumo S-k 1300 Technical Report | November 2022 |
Geologic 2CM027.001 CuMoCo. | Page 65 |
The sample preparations and analyses done historically were made by a large, professional international mining company, Amax, who ostensibly used professional sampling and assaying laboratories for their samples taken in the project area. There is no reason to suspect any irregularities or question the results of the historic sampling.
During CuMoCo’s diamond drill programs blank samples were inserted in the sample stream at or about a 1 in 20 frequency. A total of 431 were analyzed for Mo, Cu, Ag, Re, Ga, W, Fe and S. The results were very good with no anomalies produced. The graphs for MoS2 (calculated) and Cu are shown in Figure 11-1.

Source: Giroux et al, 2015
Note: MoS2 grade is on the y-axis and sample number on x axis
Figure 11-1: MoS2 in blank samples from CuMoCo drill programs at CuMo
| SMD | Cumo S-k 1300 Technical Report | November 2022 |
Geologic 2CM027.001 CuMoCo. | Page 66 |
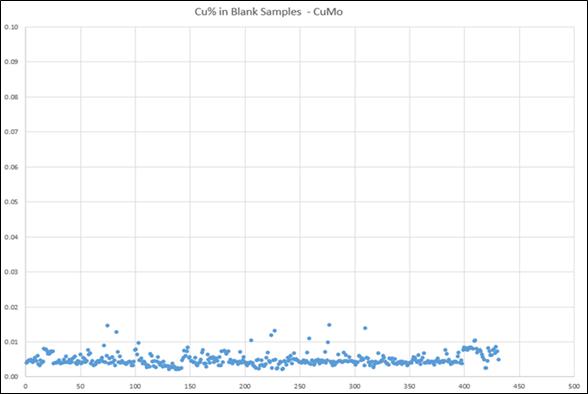
Source: Giroux et al, 2015
Note: Cu grade is on the y-axis and sample number on x axis
Figure 11-2: Cu in blank samples from 2008 drill program CuMo
| 8.5.3 | Internal Lab Standards |
The primary laboratory, ALS Chemex, inserted a blank and standard with every batch run during 2008. The policy was that unless the correlation results were excellent the batch was redone. A total of 180 blanks and 346 standard results were provided with the analysis.
| 8.5.4 | Internal Pulp Checks |
ALS Chemex also routinely ran duplicate checks on sample pulps. Over the 2007-2012 drill program a total of 143 check samples were run for Mo. Figure 11-3 and Figure 11-4 shows the results are excellent with all but a few samples falling on an equal value line. The best fit regression line mirrors the equal value line.
| SMD | Cumo S-k 1300 Technical Report | November 2022 |
Geologic 2CM027.001 CuMoCo. | Page 67 |

Source: Giroux et al, 2015
Figure 11-3: Scatter plot of Chemex internal duplicates for Mo ppm (Mo metal)
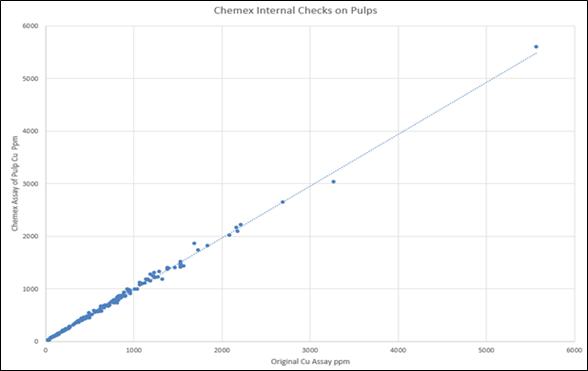
Source: Giroux et al, 2015
Figure 11-4: Scatter plot of Chemex internal duplicates for Cu ppm
As explained in Section 11.1, CDN Labs prepared a set of standards using drill core from the CuMo property. Results for Standard 1 (see Figure 11-5), the medium grade standard for MoS2 (calculated) and highest grade for Cu, show results are reasonable with most falling between the mean ± 2.5 standard deviations.
| SMD | Cumo S-k 1300 Technical Report | November 2022 |
Geologic 2CM027.001 CuMoCo. | Page 68 |
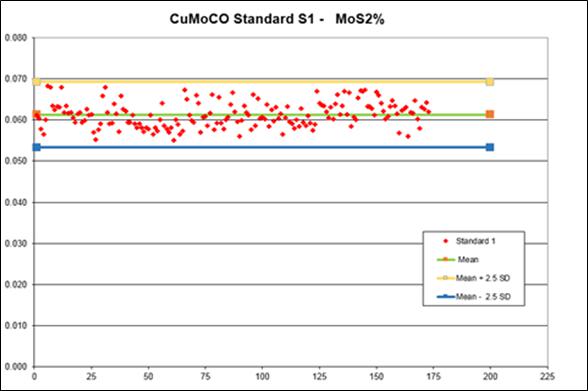

Source: Giroux et al, 2015
Figure 11-5: Results for Standard S1
| SMD | Cumo S-k 1300 Technical Report | November 2022 |
Geologic 2CM027.001 CuMoCo. | Page 69 |
Results for Standard S2, a higher grade MoS2 and low grade Cu standard, show reasonable results for Cu and MoS2 assays (see Figure 11-6) with all falling between the mean ± 2.5 standard deviations.

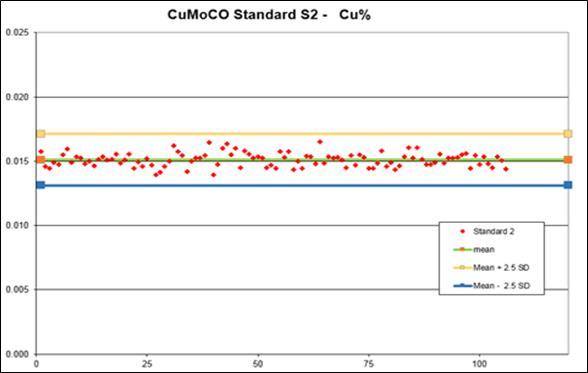
Source: Giroux et al, 2015
Figure 11-6: Results for Standard S2
| SMD | Cumo S-k 1300 Technical Report | November 2022 |
Geologic 2CM027.001 CuMoCo. | Page 70 |
The results for Standard S3 are also reasonable with more noise in the analysis, due to the low grade values encountered, but no large variations are observed. See Figure 11-7.
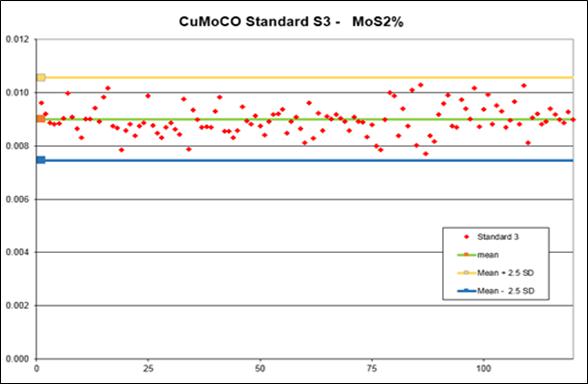
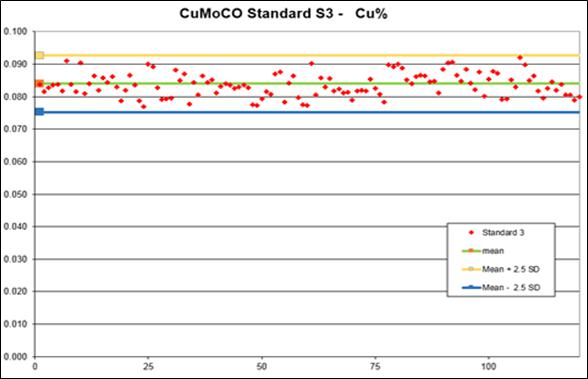
Source: Giroux et al, 2015
Figure 11-7: Results for Standard S3
| SMD | Cumo S-k 1300 Technical Report | November 2022 |
Geologic 2CM027.001 CuMoCo. | Page 71 |
| 8.5.6 | Coarse Reject Duplicates |
Coarse reject duplicate samples are duplicate samples that are taken after first crushing. At the ALS Chemex Laboratory in Elko, where the diamond drill hole core samples were crushed in the first step in the preparation stage, two duplicate samples were taken for roughly every 20th sample being analyzed by splitting the crushed half core. CuMoCo have been taking coarse reject duplicates since 2006. Coarse reject duplicates were submitted to measure the precision of the sample preparation and analysis process. The first duplicate underwent the same analytical procedure as the original sample (ICP-MS61), while the second duplicate was analyzed for molybdenum and copper using x-ray fluorescence (XRF) technique. Doing this confirmed not only the sample variability but variability in analytical techniques.
708 duplicate samples were submitted in between 2008 and 2012, for a submission frequency rate of 1 in 20 samples. The results are presented as a series of scatter plots with all variables reported in ppm and are shown in Appendix 2.
Overall, the results of the CuMoCo coarse crushed duplicates from drill core samples show good precision and no evidence of sampling bias. Silver duplicate analyses tend to show some scatter but are within acceptable tolerance limits. Precision plots yield good results, with an average of 80% of the data plotting within 20% of their respective duplicate samples, whilst an average of 55% of the data plot is within 10%. The results of the field duplicate samples are shown in Appendix 2.
In 2007, CuMoCo established a survey control network completed by Geoterra Integrated Resource System Ltd. which included 24 control points surveyed by a licensed legal land surveyor, Shelby H. Griggs of Boise, Idaho. The survey was established using NAD83(1999)(HARN) UTM Zone 11 coordinates and NAVD88 elevations. Points included several drill holes completed before Hole 30. Monument control points were permanently marked with aluminum land survey pins. Future drill holes sites were surveyed using a total GPS station tying into the original survey points. In 2012, Sacré-Davey conducted a re-survey of previous holes and also surveyed 2012 holes and found no discernible difference in older hole locations.
All CuMoCo drill holes (i.e. 2008 and later) were surveyed down-the-hole using a Reflex survey instrument. Holes prior to 2008 were surveyed by either Troparia and/or single shot Sperry Sun survey tools.
The QP examined the survey database, survey reports and data base to confirm data was valid and visited and checked some of the drill sites during a site visit.
| 8.7 | Verification of Drilling Data |
Data prior to 2008 was verified and validated by Ausenco who compared and checked the data for errors in the compiled data from the header, survey, assay, geology and geotechnical tables are validated for missing, overlapping or duplicated intervals or sample numbers, and for matching drill hole lengths in each table. Drill hole collars and traces were viewed on plan view and in section as a visual check on the validity of the collar and survey information.
In 2012, Snowden repeated the same process on all data prior to 2012.
| SMD | Cumo S-k 1300 Technical Report | November 2022 |
Geologic 2CM027.001 CuMoCo. | Page 72 |
The section discusses the procedures completed by the author to verify the data. The qualified person has reviewed the procedures used by CuMoCo and produced a description and an analysis of the results as contained in Section 8. These are standard data verifications with no limitations.
All assay results used in the verification process by the qualified person were obtained from fully certified analytical laboratories with signed assay certificates.
The QP has reviewed the data collection and verification procedures followed by CuMoCo and by third parties on behalf of CuMoCo, and believes these procedures are consistent with industry best practices and acceptable for use in geological and resource modelling.
Sections 8.5 through 8.7 describe data verification done by previous qualified persons as well as the current author. These have been subsequently reviewed by the author and determined to be valid in order to demonstrate the validity of the data.
In 2015, the author completed the survey validation steps described in Section 8.7 on the 2012 drilling data and assays and also analyzed the original data set supplied directly from Snowden. The author found no errors in the pre-2012 data and a few minor discrepancies which were corrected in the 2012 data.
| SMD | Cumo S-k 1300 Technical Report | November 2022 |
Geologic 2CM027.001 CuMoCo. | Page 73 |
| 10 | Mineral Processing and Metallurgical Testing |
Unless otherwise stated, the sub-sections in this section were previously provided in the report, “Summary Report on the CUMO Molybdenum Property, Boise County, Idaho” (Giroux, Dykes, Place, 2015). The primary QP for this section, The author has reviewed the underlying data, analytical work, and technical reports and takes responsibility for this summary. Also, The author re-interpreted comminution test results in terms of kW/t to assess grinding requirements.
The author has added content and has rewritten those parts that require confirmation after the addition of ore sorting to the process.
| 10.1 | Metallurgical Testing (2009, 2015) |
This sub-section includes some new content for this current PEA.
The test-work undertaken to date is limited, with three composite samples tested for comminution characteristics and preliminary flotation testing to produce bulk copper/molybdenum concentrates. Despite limitations, the existing test-work data are considered suitable for a conceptual study and the comminution data are considered adequate for a preliminary engineering assessment of the grinding circuit design. No copper/molybdenum separation or ferric chloride leaching of molybdenum concentrates has been undertaken to allow determination of final concentrate grades and recoveries achievable into saleable concentrates. Where no test-work data are available, reasonable assumptions, based on typical industry values or data from other similar projects (e.g. Sierrita, and Thompson Creek) have been used to develop the process design criteria used in plant design.
Thompson Creek is a primary molybdenum mine of similar mill feed grade to CuMo, and thus has similar recovery processes. Sierrita is a copper-molybdenum processing operation that produces separate copper and molybdenum concentrates from a bulk concentrate. Both are directly applicable to CuMo. As mentioned, these cover the basis for assumptions for copper/molybdenum separation by flotation, and production of saleable concentrates using more flotation cleaning stages beyond those tested here, that the other operations have in place, and ferric chloride leaching of molybdenite (MoS2) flotation concentrate, which follows flotation. This use of typical industry values for copper/molybdenum separation is recommended by The author as a reasonable approach for this PEA.
The CuMo mineralized material is of moderate hardness and is amenable to grinding in a conventional SAG/ball milling circuit with or without pebble crushing. The mineralogy is fine grained and test-work done indicates the requirement for a fine target grind size to achieve adequate liberation for flotation.
Acid Based Accounting testing indicates that the tailings are potentially acid neutralizing (PAN) due to the presence of carbonate and low pyrite content. SGS concludes that “the tailings tested were not acid generating”. Further studies are required, but if confirmed, this will lead to significant cost savings in the tailings handling circuit and a major reduction in the environmental impact of the project.
| SMD | Cumo S-k 1300 Technical Report | November 2022 |
Geologic 2CM027.001 CuMoCo. | Page 74 |
The three composite samples which were tested are labelled for the mineralized zones: Cu-Ag, Cu-Mo and Mo. The Cu-Ag and Cu-Mo labelled composites comprise both the oxide and sulfide parts of the system; oxide is not separated. The Mo composite consists of both Mo and MSI Zones. To arrive at the recoveries for the oxide and MSI Zone from the mixed samples, polished sections were examined, and factors were calculated to reduce the recoveries obtained for the Cu-Ag sample. This is a conservative approach as the inclusion of the lower recovery oxide within the Cu-Ag and Cu-Mo Zones effectively reduces the overall recovery below what could otherwise be expected.
CuMoCo began collecting metallurgical samples for grinding and flotation testing in December 2007. One fourth of the core (quarter core) was used from continuous samples of the mineralized zones (an upper copper-silver zone, underlain by a transitional copper-molybdenum zone, in turn underlain by a lower molybdenum-rich zone) from drill holes CO6-27, CO6-28 and CO6-29 and collected as individual 10 ft samples of quarter core selected as representative of the three mineralized zones. Technicians supervised by geological staff collected the samples and prepared them for shipment. A bonded carrier took the samples from Garden Valley, Idaho to Vancouver, British Columbia. The samples were taken to SGS Canada, Kent Corporate Center, Kent Avenue N., Vancouver, British Columbia, for the metallurgical study. The test-work results are detailed in an independent private report entitled “An Investigation into the recovery of molybdenum, copper and silver from CuMo samples prepared for Mosquito Consolidated Gold Mines Ltd. Project 50004-001”.
The flotation and grinding metallurgical test-work program used as the basis for this report consisted of comminution and flotation test-work on three separate metallurgical composites; copper/silver, copper/molybdenum and molybdenum, that were assembled to represent the three known mineralized types in the CuMo deposit at the time of testing. The test-work results are reported in “An Investigation into the recovery of molybdenum, copper and silver from CuMo samples prepared for Mosquito Consolidated Gold Mines Ltd Project 50004-001” (SGS, 2009).
Two main phases of flotation and grinding metallurgical testing were undertaken on the CuMo samples:
| | ● | Bench scale comminution testing, consisting of SAG Performance Index (SPI®) and Bond ball mill work index testing |
| | | |
| | ● | Bench scale flotation testing consisting of rougher kinetic flotation, cleaner flotation and locked-cycle tests, supplemented with mineralogical examination |
Comminution Test-work Suite
The current comminution dataset consists of three SPI® and Bond ball mill work index tests, one on each of the composites. Table 13-1 summarizes the outcomes of the comminution laboratory test-work undertaken for this study, the table also shows the selected design case, which typically corresponds to copper/silver. To date, no samples have had SAGDesign Testing, Drop Weight Index Testing (either by the JK Drop Weight Test or SAG Media Competency Test), Bond Crushing Index, Bond Rod Mill Index or Abrasion Index testing. Values for these metrics have been estimated from the available data or from typical values for similar mineralization.
| SMD | Cumo S-k 1300 Technical Report | November 2022 |
Geologic 2CM027.001 CuMoCo. | Page 75 |
Table 13-1: Summary of comminution test-work data
| Comminution Characteristics | | Cu-Ag | Cu-Mo | Mo | Design |
| Specific Gravity | g/cm³ | 2.64 | 2.60 | 2.60 | 2.64 |
| SPI® | min | 84.5 | 73.0 | 70.8 | 84.5 |
| SMC DWI | kW/m³ | n/a | n/a | n/a | 7.4 |
| Crushing work Index | kWh/mt | n/a | n/a | n/a | 15.8 |
| Bond rod mill work index | kWh/mt | n/a | n/a | n/a | 15.8 |
| Bond ball mill work index (closing screen 106 pm) | kWh/mt | 15.8 | 15.7 | 12.6 | 15.8 |
| Bond Abrasion index | | n/a | n/a | n/a | 0.25 |
Due to the preliminary status of the test-work and the composite nature of the samples tested, the most competent sample results have been used as the basis for design. It has been assumed that this will provide a similar design point as the 80th percentile competency and ensure a robust design. This premise will need to be confirmed through additional testing using SPI tests on geometallurgical samples, and confirmed by SAG Design testing of composite samples, in the next phase of study as more detailed mine schedule information and material comminution characteristics become available.
Flotation Test-work Results
Flotation test-work was completed prior to the commencement of the present study, commencing with rougher kinetic flotation testing and culminating with locked cycle testing of the major material types. Only bulk sulfide flotation with multistage cleaning has been undertaken to produce a copper/molybdenum concentrate. No copper/molybdenum separation has been undertaken to date. Analysis of the test-work has been used to develop the plant process design criteria and estimates of concentrate grade, copper, molybdenum and silver recovery.
| 10.1.4 | Conceptual Study Flotation Test-work |
The flotation test-work program was divided into three phases: rougher flotation; open circuit cleaner flotation; and locked cycle flotation.
Rougher Flotation
Initially, a series of rougher flotation tests were conducted to determine the sensitivity of the material types to grind size and reagent scheme. These tests were supplemented with mineralogical examination by QEM*SCAN (Quantitative Mineralogy by Scanning Electron Microscopy) to determine fundamental mineral liberation and mineral speciation. These tests indicated the following:
| | ● | Copper mineralogy in the Cu-Ag Zone is fine grained and exhibited sensitivity to primary grind size, with highest recovery at a grind size of 80% passing 63 μm. Molybdenum and silver content exhibit little sensitivity to grind size. |
| | | |
| | ● | Target elements showed little sensitivity to grind size for the Cu-Mo Zone, with only a slight change in recovery between a grind size of 80% passing 106 and 63 μm for copper, molybdenum and silver. |
| SMD | Cumo S-k 1300 Technical Report | November 2022 |
Geologic 2CM027.001 CuMoCo. | Page 76 |
| | ● | The copper and silver minerals in the Mo Zone exhibited significant sensitivity to grind size. Although the sensitivity of molybdenum was lower, the finer grind resulted in an increase in molybdenum recovery. |
| | | |
| | ● | Sulfur assays on the concentrates from the Cu-Ag Zone and Cu-Mo Zone indicate the presence of a floatable sulfide gangue mineral; most likely pyrite (no sulfur assays were available for the Mo Zone). |
The results of these tests are summarized in Table 13-2.
Table 13-2: Baseline flotation results for CuMo composite samples
| Mineral Zone | Test No. | Feed | Concentrate grade | Concentrate Recovery |
| % Cu | ppm Mo | % Cu | % Mo | ppm Ag | % Cu | % Mo | % Ag |
| Cu-Ag | VF1-1 | 0.16 | 213 | 1.22 | 0.18 | 39 | 76.5 | 87.7 | 78 |
| | VF1-2 | 0.16 | 179 | 1.71 | 0.27 | 53 | 58.7 | 81.6 | 70.3 |
| Cu-Mo | VF2-1 | 0.12 | 435 | 2.11 | 0.79 | 42 | 89.7 | 92.4 | 74 |
| | VF2-2 | 0.11 | 398 | 1.54 | 0.61 | 36 | 89.3 | 92.9 | 74.5 |
| Mo | VF3-1 | 0.03 | 1135 | 0.47 | 1.99 | 13 | 77 | 94.4 | 64.4 |
| | VF3-2 | 0.03 | 1135 | 0.44 | 1.75 | 12 | 83.1 | 96.9 | 71.8 |
Note: to be clear, the grades in this table referring to Mo are all elemental Mo (not MoS2).
The tests indicate that the mineralization is amenable to flotation, resulting in good recovery of target mineral species into a low mass concentrate stream. The sensitivity of the mineralization to primary grind size indicates that a fine grind for all the types will be required to ensure good recovery. Additional grind sensitivity test-work should be included in subsequent testing to optimize the mineral recovery with grind size.
Open Circuit Flotation
Cleaner flotation was conducted at the finer target primary grind size of 80% passing 63 μm and incorporated a rougher concentrate regrind stage to increase mineral liberation. Varying regrind times and reagent dosages were trialed to determine optimum flotation conditions.
The cleaner flotation reagent scheme was changed from that trialed in the rougher tests; a molybdenum specific activator (Moly Oil) and a copper molybdenum specific collector (Aero 3302). Despite the presence of pyrite, reporting to final concentrate, a non-specific sulfide collector (SIBX) was used for the cleaner flotation testing.
The fine grain structure of the mineralization identified by the QEM*SCAN testing and the increase in rougher grade and recovery indicated that regrinding of rougher concentrates would be required to achieve adequate concentrate grades. Concentrate regrinding was therefore incorporated in all subsequent cleaner and locked cycle testing. The target regrind size was arbitrarily selected at 90-95% passing 20 μm and achieved by grinding for a set time per test. Multiple stages of cleaning were incorporated to target high concentrate grades, typically with an elevated pH level in the final stage of cleaning. The results from selected optimization tests are summarized in Table 13-3.
| SMD | Cumo S-k 1300 Technical Report | November 2022 |
Geologic 2CM027.001 CuMoCo. | Page 77 |
Table 13-3: Cleaner flotation results for CuMo composite samples
| Mineral Zone | Test No. | Feed | Concentrate grade | Concentrate Recovery |
| % Cu | ppm Mo | % Cu | % Mo | ppm Ag | % Cu | % Mo | % Ag |
| Cu-Ag | VF1-3 | 0.14 | 176 | 19.8 | 3.32 | 596 | 49.6 | 68.2 | 49 |
| | VF1-4 | 0.16 | 185 | 15.3 | 2.3 | 462 | 64 | 81.3 | 64.9 |
| | VF1-5 | 0.15 | 175 | 16.4 | 2.68 | 539 | 55.6 | 79 | 41.2 |
| Cu-Mo | VF2-3 | 0.12 | 392 | 18 | 6.31 | 344 | 85.5 | 93.7 | 76.8 |
| | VF2-4 | 0.12 | 416 | 17.3 | 6.53 | 354 | 81.8 | 92.6 | 74.8 |
| | VF2-5 | 0.11 | 315 | 16.6 | 4.88 | 365 | 85.4 | 90.4 | 70.3 |
| Mo | VF3-3 | 0.03 | 1048 | 5.9 | 24.4 | 151 | 79.6 | 95.9 | 52.2 |
| | VF3-4 | 0.03 | 1025 | 6.1 | 24.8 | 150 | 79.8 | 95.8 | 50.7 |
| | VF3-5 | 0.03 | 958 | 5.7 | 21.3 | 168 | 79.8 | 95.3 | 56.2 |
Note: to be clear, the grades in this table referring to Mo are all elemental Mo (not MoS2).
The concentrate grades achieved in the majority of these tests indicate the presence of significant levels of diluents in the final concentrate. The absence of mineralogy or sulfur assays on the final concentrates makes determination of the nature of these diluents difficult to determine. However, the most likely explanation for this is the presence of floatable pyrite in the mineralization that has not been depressed in the flotation circuit and is reporting to final concentrate. This issue will require further evaluation and testing during subsequent studies.
Following the completion of the open circuit cleaner flotation test-work phase, a locked cycle test was conducted on each of the major types. This phase was aimed at testing the best flow sheet conditions in a locked cycle test to determine the closed-circuit grade recovery performance of each of the types for project evaluation.
Locked Cycle Test-work at Design Conditions
Flotation results from the optimization test-work highlighted the benefit of fine regrinding and multiple stages of concentrate cleaning on improving concentrate grade. A flow sheet incorporating rougher concentrate regrinding and multiple stages of cleaning, similar to that from the open circuit cleaner testing was selected for the conceptual study. To test the flow sheet performance on all types, a series of locked cycle tests was conducted.
Locked cycle tests are used to determine the effects of recycling intermediate streams, like scavenger concentrates, on the overall grade recovery performance of the type. By retaining these streams and combining them with concentrates from a subsequent flotation test, an assessment can be made of the overall performance from a full-scale plant operation.
Locked cycle tests were undertaken for the main mineralized zones and the results are summarized in Table 13-4.
| SMD | Cumo S-k 1300 Technical Report | November 2022 |
Geologic 2CM027.001 CuMoCo. | Page 78 |
Table 13-4: Locked cycle test results
| Mineralized Zone | Test No. | Feed | Concentrate grade | Concentrate Recovery |
| % Cu | ppm Mo | % Cu | % Mo | ppm Ag | % Cu | % Mo | % Ag |
| Cu-Ag | VF1-LCT1 | 0.16 | 190 | 13 | 2 | 357 | 62.5 | 82 | 71.7 |
| Cu-Mo | VF2-LCT1 | 0.12 | 401 | 16.4 | 5.66 | 324 | 90.7 | 93.8 | 80 |
| Mo | VF3-LCT1 | 0.04 | 1065 | 5.1 | 21.6 | 122 | 71.6 | 99.6 | 59.3 |
Note: to be clear, the grades in this table referring to Mo are all elemental Mo (not MoS2).
Analysis of these results indicate that recoveries of target minerals are acceptable and are generally in line with those achieved in the open circuit cleaner testing. However, the final concentrate grades are again lower than required to produce saleable concentrates after copper/molybdenum separation. Additional test-work will be required to determine the nature of the concentrate diluents and ways to maximize their rejection whilst maintaining target recoveries.
Tungsten Recovery
This sub-section was added for this current PEA.
SGS 2009 conducted a preliminary tungsten separation test on rougher tailing of the lock cycle test of Composite 3. The test consisted of feeding the rougher tailings to a Falcon Concentrator whose concentrate was upgraded on a Mozley table. The results of the test are as shown in Table 13-5.
Table 13-5: Tungsten recovery test results
| Stream | Wt% | WO3 - % |
| Assay | Distribution |
| Mozley Concentrate | 0.04 | 4.61 | 26.34 |
| Falcon Concentrate | 2.85 | 0.093 | 40.55 |
| Calculated Feed | 100 | 0.003 | 100.00 |
Source: SGS 2009
The sample used in the test, Composite 3, is from the Mo Zone which has the lowest grade of tungsten compared to the other zones. The average grade of tungsten for the Mo Zone is 21 ppm, while the Cu-Ag Zone has an average of 34 ppm, and the Cu-Mo Zone has an average of 41 ppm.
However, the SGS report states that as before (for the other two composites), the tungsten grades were too low for reliable assaying (of the tungsten values).
Based on the SGS report, the possibility to recover tungsten in an economic process has not yet been established.
| 10.1.5 | Grade and Recovery Predictions |
This sub-section includes some new content for this current PEA.
| SMD | Cumo S-k 1300 Technical Report | November 2022 |
Geologic 2CM027.001 CuMoCo. | Page 79 |
Analysis of the locked cycle tests has been undertaken to determine flotation performance predictions. The design recoveries of the target metals are generally in line with or slightly lower than those achieved in the locked cycle tests suggesting a degree of conservatism in the selected recoveries. The numbers were selected as generally being lower than the actual test-work values with the exception of the Cu-Ag Zone, as this sample consisted of both oxidized and non-oxidized material.
Analysis of the locked cycle tests has been undertaken to determine flotation performance predictions. The design recoveries of the target metals are generally in line with or slightly lower than those achieved in the locked cycle tests suggesting a degree of conservatism in the selected recoveries. The numbers were selected as generally being lower than the actual test-work values with the exception of the Cu-Ag Zone, as this sample consisted of both oxidized and non-oxidized material.
A review of the specified recoveries indicates that they are reasonable for a bulk concentrate from the CuMo mineralized zones. However, the concentrate grades achieved directly from the current tests do not reflect those required to achieve saleable concentrates and have been adjusted for the plant design and preliminary economic evaluation on the assumption that additional test-work will confirm and further optimize flotation metallurgy, allowing higher concentrate grades to be achieved with minimal impact on recovery.
It should be noted that the SGS (2009) report concludes the following in regard to saleable concentrates from the tests:
In the case of the Cu-Ag Zone sample: “However, the upgrading ratios indicate that a saleable grade of Cu concentrate can be made from this composite.” (page 6)
In the case of the Cu-Mo Zone sample: “The upgrading ratios assured that saleable Cu and Mo concentrates can be made by added cleaning stages.” (page 7)
And finally in the case of the Mo Zone sample: “The upgrading ratios indicate that Cu and Mo concentrates of saleable grades can be made by added cleaning stages.” (page 8)
These assertions support the general assumptions with respect to concentrate grades and process design details and will be required when advanced level studies are done on the project in the future.
In order to derive a process design and capital and operating cost estimate, it has been assumed that a selective molybdenum flotation phase with copper depression, followed by a ferric chloride leach on the molybdenum concentrate to remove residual copper, is required. The design and grade recovery performance of these process units have been estimated from operating and test-work data from other similar studies and operating plants. These include Las Pelambres, Andina, Collahuasi, Gibraltar and Sierrita to developing projects (2009) such as Pebble, Prosperity and Mirador. All these have or have examined copper-molybdenum separation circuits.
The recoveries of target metals into their respective concentrates have been reduced to reflect metal misreporting during the separation stages. The final concentrator recoveries that have been assumed for the PEA of CuMo are shown in Table 13-5. These figures include bulk concentrate recovery, copper/molybdenum flotation separation and ferric chloride leach recovery.
| SMD | Cumo S-k 1300 Technical Report | November 2022 |
Geologic 2CM027.001 CuMoCo. | Page 80 |
Table 13-6: Grade/recovery predictions for CuMo
| Material Type | Concentrate | Concentrate Grade | Concentrate Recovery |
| % Cu | % Mo | % Cu | % Mo | % Ag |
| Cu-Ag | Molybdenum | 0.1 | 52 | 0.02 | 83 | |
| | Copper | 19 | 0.1 | 64 | 2.4 | 70 |
| Cu-Mo | Molybdenum | 0.1 | 51 | 0.04 | 92 | |
| | Copper | 22 | 0.1 | 85 | 0.7 | 78 |
| Mo | Molybdenum | 0.02 | 49 | 0.1 | 95 | |
| | Copper | 20 | 0.8 | 72 | 1 | 55 |
Note that the recovery predictions shown in Table 13-6 for Cu-Ag Zone material were based on samples that also contained oxide material. Segregation of this oxide material results in the adjusted and slightly higher recovery predictions for non-oxide material referenced elsewhere in this report (Table 14-13).
In addition to the primary elements listed, the study also analyzed the final concentrate from the lock cycle tests for gallium, osmium and rhenium, while the rougher tails were analyzed for Gallium. Rhenium was the only metal present in quantities above detection limit returning values of 0.9 ppm, 2.9 ppm and 15 ppm respectively in the molybdenum concentrates from the three material types.
No test work was completed to determine the actual recovery of rhenium and Sulphuric acid during the roasting process, though there are no indications that it cannot be achieved based on current technology and existing roasters. This test work is recommended for the next stage of development for this project.
The following sections provide original text for the current PEA
The opportunity for preconcentration using sensor-based sorting was evaluated in 2015 where Sacré-Davey conducted a preliminary investigation with 100 rock samples from the deposit. The purpose of this test was to get an indication of the sample response to various sensors. Since this test showed a potential for preconcentration, a second set of testing was done with an XRF device using 400 samples. The initial study was completed in November 2016.
Samples from quarter core were used from continuous samples of the four mineralized zones; The samples assembled were selected to represent the four known non oxide mineralized zones in the CuMo deposit, namely: Cu-Ag, Cu-Mo, Mo and MSI. A total of 400 random samples of 1-5” size were sent and tested at the Coal and Mineral Processing Laboratory at the University of British Columbia. The samples were cleaned with high-pressure air and then scanned on the XRF device, followed by the EM device. Testing was initially conducted under the supervision of Brent Hilscher from Sacré-Davey. Following that, the samples were sent to MetSolve Laboratories Inc. for Cu and Mo assays.
| SMD | Cumo S-k 1300 Technical Report | November 2022 |
Geologic 2CM027.001 CuMoCo. | Page 81 |
Heterogeneity assessments of the Cu and Mo grade analysis were conducted based on the assay results to confirm initial confidence in the potential application of mineral sorting. Next, correlation studies between the assay result and sensor-based result were carried out upon observation of the provided rock samples. The outcome of the studies was then used in building several economic models to demonstrate the benefit for mineral sorting. Finally, The author examined the assays, scanning records and previous reports to confirm that there was a basis for what is stated herein.
The purpose of the particle sorting study was to understand the deposit’s amenability to mineral sorting. The study conducted was a scoping level preliminary evaluation to understand the possible opportunity. Detailed bulk sample test-work would be necessary to accurately measure the impact on the potential project economics.
The study demonstrated that there is significant variability in the deposit providing an opportunity to reject the low-grade rocks and upgrade the accepted mass. The sensors also showed positive response for upgrading the mill feed; however, due to the low concentration of Cu and Mo, further testing and validation is necessary.
The interpreted results are presented in Figure 13-1. This shows the recovery of Mo and Cu as a function of sorting mass pull. The sorting mass pull is the cumulative RCV percent of test samples from highest RCV to lowest, based on the XRF measurements of Cu and Mo.
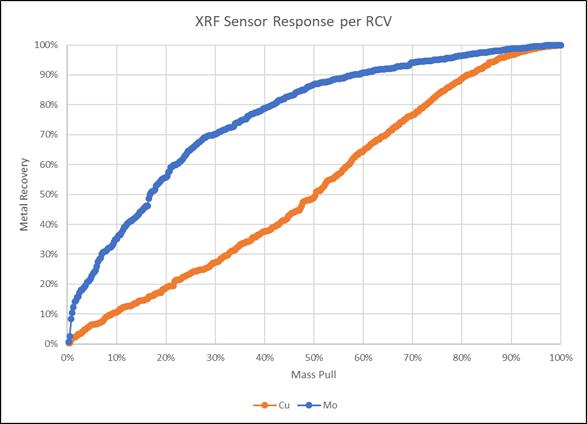
Source: SRK, 2019
Figure 13-1: Particle sort XRF test results
Further testing and studies will be required at the pre-feasibility and feasibility stages to capture representative samples and the impact of the sorter on individual mineralized zones. The particle sort study was conducted to understand the deposit’s heterogeneity on a rock-by-rock basis. Due to the large production rates of the project, a combination of bulk and particle sorting may be more suitable.
Mineral sorting products have not yet been tested for changes in the work index or flotation recovery. After sorting, most base metals operations experience an improvement in both the grinding specific energy and flotation recovery. These changes will be quantified as part of future studies.
The success of the particle sorting test program, combined with recognition that currently available particle sorting technology on its own would not be able to handle the processing rates envisioned for CuMo, prompted further investigation into the viability of bulk sorting.
SRK undertook a heterogeneity study of the CuMo deposit by analyzing exploration drill hole data. Two approaches were undertaken:
| | ● | Observing the effect of measurement scale on different heterogeneity parameters |
| | | |
| | ● | Assessing the relationship between bench composite grades and sample grades that make up those composites |
| SMD | Cumo S-k 1300 Technical Report | November 2022 |
Geologic 2CM027.001 CuMoCo. | Page 82 |
The following sections discuss the results of these assessments.
Heterogeneity and Scale
SRK developed an approach to assess how mineral deposit heterogeneity is influenced by observation or sampling scale. It involves the analysis of exploration drill core data, to see the impact of varying aggregation lengths on key parameters, including most notably assay grades. In polymetallic deposits, NSR or equivalent is used (RCV in the case of CuMo).
For CuMo, SRK assessed the main mineralized zones – oxide, Cu-Ag, Cu-Mo, and Mo. The drill holes were de-surveyed and sample intervals were assessed in the vertical direction – a proxy for mining bench height. Intervals were combined over increasing aggregation lengths, up to a maximum of 100 ft. Statistics and comparative analyses were run on the resulting aggregations. Select results are presented in Figure 13-2 and Figure 13-3.
One way to look at the impact of scale on heterogeneity is to calculate the distribution heterogeneity for different aggregation lengths. Distribution heterogeneity for a dimensionless lot (Pitard, 1993) was used here. It is a unitless parameter relating mass and grade (or NSR) of a group (aggregation) to the overall population or lot. It is apparent in Figure 13-2 that for all mineralized zones at CuMo, there is a decrease in heterogeneity with increasing scale. The OX zone was the most affected, and the Mo Zone was the least impacted by increases in scale.

Source: SRK, 2019
Figure 13-2: Impact of scale on distribution heterogeneity
| SMD | Cumo S-k 1300 Technical Report | November 2022 |
Geologic 2CM027.001 CuMoCo. | Page 83 |
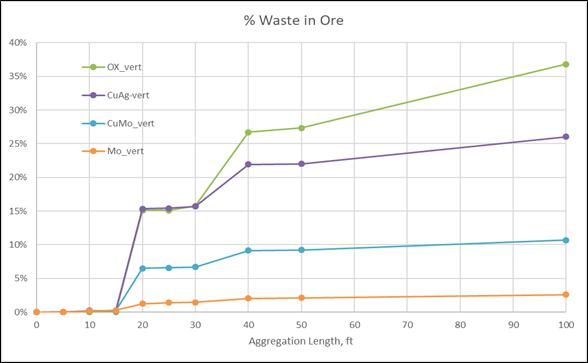
Source: SRK, 2019
Figure 13-3: Impact of scale on “Waste in Ore” ratio
Figure 13-3 provides another measure of heterogeneity that the author finds very informative. It is “Waste in Ore4”, which compares sample intervals that are below a cut-off but are still within aggregations whose average grades are above the cut-off. Figure 13-3 shows that increasing aggregation length results in increasing % waste in above cut-off material and that such increases happen quickly. They happen within the mining scale (e.g. 50 ft benches), but then largely flatten off for longer aggregation lengths. This suggests there may be benefits to selectively mining or processing material at smaller scales in order to reject waste that is inherent in a mineral deposit.
The main findings of this analysis for CuMo are that heterogeneity diminishes with increasing scale (or conversely, it increases with decreasing scale) and that the different mineralized zones at CuMo exhibit differing heterogeneity characteristics. Whilst this is generally accepted for all such analysis, notably in this case, significant change in heterogeneity for several zones occurred at around the scale of the mining bench dimensions and potentially smaller selective mining unit dimensions, raising the possibility of benefits from more selective in-pit pre-selection or bulk mineral sorting.
Composite-Sample Relationship
The other technique for assessing heterogeneity from drill holes interrogates the composite-sample relationship inherent in drill hole data. For this, the author developed bench composites of all the drill holes, based on an expected 50 ft bench height. Then, the RCV of the composites were calculated from the samples falling within the composites. For CuMo, RCV is determined as the product of the price and the mill recovery for the metal of interest. It is calculated for each of the mineralized zones in the deposit (see Section 14.9).
4 “Ore” is used here in the generic sense and does not imply that the mineralized material at CuMo is “ore” under CIM Definition Standard, nor that the material constitutes a mineral reserve which can be synonymous with the use of the word “ore”. The material does not have demonstrated economic viability. The CuMo property has no mineral reserves.
| SMD | Cumo S-k 1300 Technical Report | November 2022 |
Geologic 2CM027.001 CuMoCo. | Page 84 |
The resulting relationship can be plotted as the number of samples versus the sample interval grade (RCV) for each of multiple bench composite RCV ranges. This relationship is referred to as the “composite-sample relationship”.
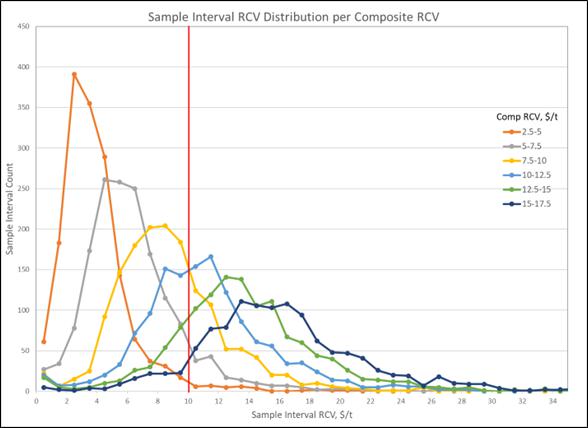
Source: SRK, 2019
Figure 13-4: CuMo composite-sample relationship
Figure 13-4 shows the composite-sample relationship for select composite RCV ranges. These ranges are set with $2.50/t increments and within each range the sample interval RCVs are counted in $1.00/t bins.
A red vertical line has been drawn at the $10/t RCV point, approximating the cut-off NSR for CuMo. Only six of the composite RCV ranges are shown – three on either side of $10/t RCV.
There are two important observations of the composite-sample relationship for CuMo:
| | ● | Composite RCV ranges below the $10 cut-off ($2.50-5.00; $5.00-7.00; $7.50-10.00), which should all be waste, have sample intervals within them that are above the $10 cut-off. This is more pronounced for composite ranges nearer the cut-off. |
| | | |
| | ● | Composite RCV ranges above the $10 cut-off ($10.00-12.50; $12.50-$15.00; $15.00-17.50), which should all be selected as above cut-off mill feed, have sample intervals within them that are below the $10 cut-off. Again, this is more pronounced for composite ranges nearer the cut-off. There tends to be more “waste in above-cut-off material” than “above cut-off material in waste” in general and as one moves away from the cut-off. |
These observations effectively point to the opportunity for mineral sorting, if one can segregate material at the sample interval scale (or smaller, per the conclusion of the heterogeneity and scale analysis), one can remove waste from the mill feed and recover valued mineralized material from what would be otherwise waste.
SRK used these composite-sample relationships to test the impact of using different cut-offs to segregate different fractions of potential mill feed in a bulk sorting context. This is discussed further in Section 16.2.2.
| SMD | Cumo S-k 1300 Technical Report | November 2022 |
Geologic 2CM027.001 CuMoCo. | Page 85 |
| 11 | Mineral Resource Estimates |
In 2015 at the request of CuMoCo, Giroux Consultants Ltd. was retained to produce a resource estimate on the CuMo project in Southern Idaho. A total of 68 drill holes covering the various mineralized zones were provided. While the Cu-Mo-Ag-W resource was estimated in April 2015, the effective date for this estimate is August 30, 2018, when estimates for Re and S were completed.
The resource is reproduced below originally reported in “Summary Report on the CUMO Molybdenum Property, Boise County, Idaho” (Giroux, Dykes, Place, 2015) with the author taking current responsibility for the work.
This 2015 CuMo resource estimate represents an update of the 2012 estimate by Snowden Mining Industry Consultants (Jones, et al) and the 2009 resource estimate (Holmgren and Giroux), based on an additional 11 new diamond drill holes completed in 2011-2012.
The mineral resources estimated may ultimately be affected by a broad range of environmental, permitting, socio-economic (as discussed in Section 17), legal, title (as discussed in Section 3), marketing and political factors (as discussed in Section 22). At this time the authors are unaware of any of these factors that could materially affect the mineral resource estimate. Of course, going forward, relevant factors that could influence the resource estimate include changes to the geological, geotechnical or geometallurgical models, infill drilling to convert mineral resources to a higher classification, drilling to test for extensions to known resources, collection of additional bulk density data and significant changes to commodity prices. It should be noted that all these factors pose potential risk and opportunities to the current mineral resource.
A total of 65 DDHs and three RC drill holes, over a combined total of 121,280 ft, were provided with 1,001 downhole surveys and 10,456 assays for Mo and Cu. For this resource estimation, the three RC holes were not used (see Appendix 3 for a list of drill holes used in the estimate), leaving only the 65 diamond drill holes as being used. For the 65 diamond drill holes used, the total length was 36,165.7 m (118,654 ft)
The provided data was checked for sample overlaps, gaps in sample intervals and assays within allowable intervals. No errors were found.
The basic assay statistics for DDHs are presented below in Table 14-1
| SMD | Cumo S-k 1300 Technical Report | November 2022 |
Geologic 2CM027.001 CuMoCo. | Page 86 |
Table 14-1: Summary of MoS2 and Cu contents
| | MoS2 (%) | Cu (%) |
| Number | 10,456 | 10,456 |
| Mean | 0.053 | 0.077 |
| Standard Deviation | 0.058 | 0.069 |
| Minimum | 0.0005 | 0.001 |
| Maximum | 1.09 | 0.920 |
| Coefficient of Variation | 1.09 | 0.89 |
Note: MoS2 here is calculated from the assays for Mo by multiplying by 1.6681.
The molybdenum and copper mineralization at CuMo lies in four distinct mineral zones with an oxidized layer on top. More or less from top to bottom there occurs in most drill holes an oxide zone, a Cu-Ag Zone, a Cu-Mo Zone and a Mo Zone. Within one fault block, the Cu-Ag Zone is missing, and the oxide sits on top of the Cu-Mo Zone. These zones are underlain by a potassic-silica zone with lower grade copper and molybdenum material called the MSI Zone. While the oxide zone has been modeled for metallurgical reasons, it has been combined with the Cu-Ag Zone or in a few cases the Cu-Mo Zone for estimation purposes. While no test-work has been completed on the oxide zone at this time, experience with other such deposits indicates that metal recoveries tend to be lower in oxidized zones as compared to primary zones and as a result it was modelled separately, and a lower recovery was applied. This is a conservative approach and will be useful for future work.
Contact plots for each variable in Figure 14-1 show there is no difference in average grade across the oxide – Cu-Ag Zone contact. There are also several post mineral dykes that are large enough and continuous enough to be modeled. The Cu and MoS2 grade statistics are shown in Table 14-2, sorted by zone. Silver and tungsten assays are shown in Table 14-3 for the same mineral zones. Values for MoS2and Cu reported as 0.000 were assigned values of 0.0005% and 0.001%, respectively. Silver values reported as 0.000 were set to 0.01 ppm while tungsten values reported as 0.000 were set to 0.1 ppm.
Table 14-2: Summary of assay statistics for Cu and MoS2 sorted by zone
| Item | Cu–Ag Zone | Cu-Mo Zone | Mo Zone | MSI Zone | Dykes |
MoS2 (%) | Cu (%) | MoS2 (%) | Cu (%) | MoS2 (%) | Cu (%) | MoS2 (%) | Cu (%) | MoS2 (%) | Cu (%) |
| Number | 3,813 | 3,813 | 3,509 | 3,509 | 2,677 | 2,677 | 330 | 330 | 128 | 128 |
| Mean | 0.017 | 0.076 | 0.049 | 0.103 | 0.113 | 0.053 | 0.057 | 0.028 | 0.005 | 0.016 |
| Standard Deviation | 0.019 | 0.074 | 0.045 | 0.072 | 0.066 | 0.042 | 0.029 | 0.038 | 0.014 | 0.038 |
| Minimum | 0.0005 | 0.001 | 0.0005 | 0.001 | 0.0005 | 0.001 | 0.0010 | 0.001 | 0.0005 | 0.001 |
| Maximum | 0.315 | 0.77 | 1.09 | 0.92 | 0.99 | 0.59 | 0.17 | 0.20 | 0.13 | 0.18 |
| Coefficient of Variation | 1.15 | 0.97 | 0.92 | 0.70 | 0.58 | 0.80 | 0.51 | 1.34 | 2.62 | 2.36 |
Note: MoS2 here is calculated from the assays for Mo by multiplying by 1.6681.
| SMD | Cumo S-k 1300 Technical Report | November 2022 |
Geologic 2CM027.001 CuMoCo. | Page 87 |
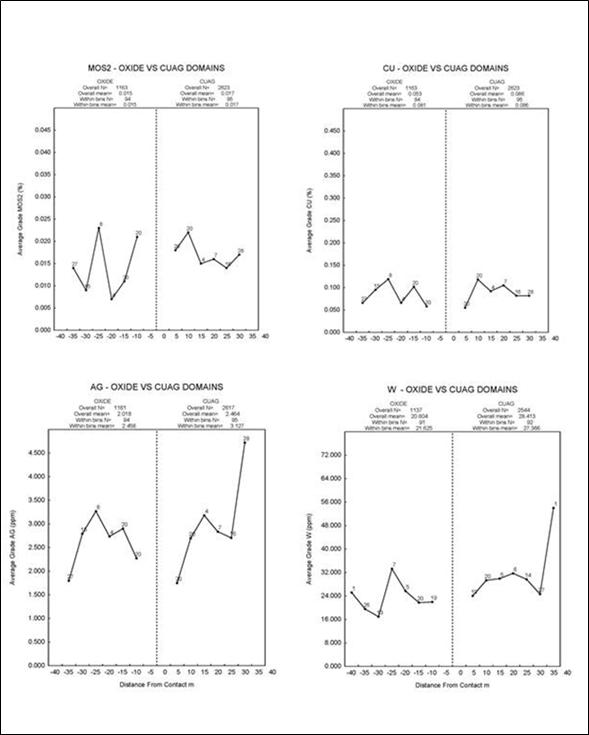
Source: CuMoCo 2015
Figure 14-1: Contact plots for oxide-Cu-Ag Zone contact
| SMD | Cumo S-k 1300 Technical Report | November 2022 |
Geologic 2CM027.001 CuMoCo. | Page 88 |
Table 14-3: Summary of assay statistics for Ag and W sorted by zone
| Item | Cu–Ag Zone | Cu-Mo Zone | Mo Zone | MSI Zone | Dykes |
Ag (ppm) | W (ppm) | Ag (ppm) | W (ppm) | Ag (ppm) | W (ppm) | Ag (ppm) | W (ppm) | Ag (ppm) | W (ppm) |
| Number | 3,806 | 3,791 | 3,492 | 3,497 | 2,653 | 2,654 | 327 | 330 | 128 | 121 |
| Mean | 2.88 | 32.3 | 3.07 | 46.7 | 1.78 | 45.9 | 1.65 | 37.1 | 0.62 | 9.8 |
| Standard Deviation | 16.28 | 108.9 | 13.35 | 33.8 | 9.81 | 38.3 | 10.39 | 109.3 | 1.23 | 11.9 |
| Minimum | 0.01 | 0.1 | 0.01 | 0.1 | 0.01 | 0.1 | 0.01 | 3.3 | 0.01 | 0.1 |
| Maximum | 838.0 | 5400 | 744.0 | 470.0 | 494.0 | 890.0 | 182.0 | 1980 | 8.6 | 65.0 |
| Coefficient of Variation | 5.65 | 3.37 | 4.35 | 0.72 | 5.51 | 0.83 | 6.28 | 2.95 | 1.99 | 1.21 |
To determine if capping was required and if so, at what level, the distribution of grades for each variable within each mineralized zone was examined using lognormal cumulative frequency plots. In all cases, multiple overlapping lognormal populations were present. Cap levels were set to minimize the effects of a small number of erratic outliers.
A similar strategy was applied to Cu, Ag and W. The capping levels for each variable are shown in Table 14-4, Table 14-5, and Table 14-6.
| SMD | Cumo S-k 1300 Technical Report | November 2022 |
Geologic 2CM027.001 CuMoCo. | Page 89 |
Table 14-4: Summary of capping levels by mineralized zone
| Domain | Variable | Cap Level | Number Capped |
| Cu-Ag Zone | MoS2 | 0.16 % | 4 |
| Cu-Mo Zone | MoS2 | 0.40 % | 2 |
| Mo Zone | MoS2 | 0.48 % | 7 |
| MSI Zone | MoS2 | | 0 |
| Dykes | MoS2 | 0.05 % | 1 |
| Cu-Ag Zone | Cu | 0.83 % | 0 |
| Cu-Mo Zone | Cu | 0.62 % | 4 |
| Mo Zones | Cu | 0.27 % | 6 |
| MSI Zones | Cu | | 0 |
| Dykes | Cu | 0.15 % | 3 |
| Cu-Ag Zone | Ag | 115 ppm | 6 |
| Cu-Mo Zone | Ag | 102 ppm | 4 |
| Mo Zone | Ag | 24 ppm | 4 |
| MSI Zone | Ag | 8 ppm | 3 |
| Dykes | Ag | 4.0 ppm | 3 |
| Cu-Ag Zone | W | 452 ppm | 5 |
| Cu-Mo Zone | W | 277 ppm | 6 |
| Mo Zone | W | 275 ppm | 6 |
| MSI Zone | W | 118 ppm | 3 |
| Dykes | W | | 0 |
The results from capping are tabulated below with some significant reductions in the coefficient of variation for some variables.
| SMD | Cumo S-k 1300 Technical Report | November 2022 |
Geologic 2CM027.001 CuMoCo. | Page 90 |
Table 14-5: Summary of capped assay statistics for Cu and MoS2 sorted by zone
| Item | Cu–Ag Zone | Cu-Mo Zone | Mo Zone | MSI Zone | Dykes |
MoS2 (%) | Cu (%) | MoS2 (%) | Cu (%) | MoS2 (%) | Cu (%) | MoS2 (%) | Cu (%) | MoS2 (%) | Cu (%) |
| Number | 3,813 | 3,813 | 3,509 | 3,509 | 2,677 | 2,677 | 330 | 330 | 128 | 128 |
| Mean | 0.017 | 0.076 | 0.049 | 0.103 | 0.112 | 0.053 | 0.057 | 0.028 | 0.005 | 0.016 |
| Standard Deviation | 0.018 | 0.074 | 0.040 | 0.070 | 0.063 | 0.041 | 0.029 | 0.038 | 0.009 | 0.036 |
| Minimum | 0.0005 | 0.001 | 0.0005 | 0.001 | 0.0005 | 0.001 | 0.0010 | 0.001 | 0.0005 | 0.001 |
| Maximum | 0.16 | 0.77 | 0.40 | 0.62 | 0.48 | 0.27 | 0.17 | 0.20 | 0.05 | 0.15 |
| Coefficient of Variation | 1.10 | 0.97 | 0.83 | 0.68 | 0.56 | 0.78 | 0.51 | 1.34 | 2.04 | 2.31 |
Note: MoS2 here is calculated from the assays for Mo by multiplying by 1.6681.
Table 14-6: Summary of capped assay statistics for Ag and W sorted by zone
| Item | Cu–Ag Zone | Cu-Mo Zone | Mo Zone | MSI Zone | Dykes |
Ag (ppm) | W (ppm) | Ag (ppm) | W (ppm) | Ag (ppm) | W (ppm) | Ag (ppm) | W (ppm) | Ag (ppm) | W (ppm) |
| Number | 3,806 | 3,791 | 3,492 | 3,497 | 2,653 | 2,654 | 327 | 330 | 128 | 121 |
| Mean | 2.56 | 29.8 | 2.88 | 46.4 | 1.58 | 45.5 | 0.99 | 31.3 | 0.57 | 9.8 |
| Standard Deviation | 5.82 | 32.4 | 4.63 | 31.7 | 1.78 | 32.8 | 1.28 | 20.7 | 1.00 | 11.9 |
| Minimum | 0.01 | 0.1 | 0.01 | 0.1 | 0.01 | 0.1 | 0.01 | 3.3 | 0.01 | 0.1 |
| Maximum | 115.0 | 452.0 | 102.0 | 277.0 | 24.0 | 275.0 | 8.0 | 118.0 | 4.00 | 65.0 |
| Coefficient of Variation | 2.27 | 1.09 | 1.61 | 0.68 | 1.13 | 0.72 | 1.29 | 0.66 | 1.75 | 1.21 |
The bulk of the historic drill holes (1969 to 1982) were assayed on 10 or 20 ft intervals while those assayed by CuMoCo (2006-2012) were assayed on 10 ft intervals. A 50 ft composite length was chosen to match a reasonable mining bench for this scale of deposit. This differs from the 2012 resource estimate where a 20 ft composite was used. The statistics for 50 ft composites are shown in Table 14-7 Samples coded as oxide were combined with Cu-Ag composites for estimation purposes.
| SMD | Cumo S-k 1300 Technical Report | November 2022 |
Geologic 2CM027.001 CuMoCo. | Page 91 |
Table 14-7: Summary of 50 ft composite statistics
| | MoS2 (%) | Cu (%) | Ag (ppm) | W (ppm) |
| Cu-Ag Zone |
| Number | 810 | 810 | 810 | 807 |
| Mean | 0.016 | 0.076 | 2.68 | 29.8 |
| Standard Deviation | 0.013 | 0.062 | 4.77 | 28.1 |
| Minimum | 0.001 | 0.001 | 0.01 | 0.1 |
| Maximum | 0.101 | 0.432 | 92.39 | 365.1 |
| Coefficient of Variation | 0.80 | 0.82 | 1.78 | 0.94 |
| Cu-Mo Zone |
| Number | 813 | 813 | 808 | 810 |
| Mean | 0.048 | 0.103 | 2.88 | 45.8 |
| Standard Deviation | 0.027 | 0.057 | 2.81 | 23.4 |
| Minimum | 0.003 | 0.003 | 0.22 | 5.4 |
| Maximum | 0.226 | 0.366 | 42.50 | 190.6 |
| Coefficient of Variation | 0.56 | 0.55 | 0.98 | 0.51 |
| Mo Zone |
| Number | 639 | 639 | 631 | 631 |
| Mean | 0.112 | 0.053 | 1.64 | 46.7 |
| Standard Deviation | 0.046 | 0.037 | 1.27 | 24.1 |
| Minimum | 0.016 | 0.003 | 0.09 | 10.0 |
| Maximum | 0.302 | 0.218 | 10.68 | 160.0 |
| Coefficient of Variation | 0.41 | 0.69 | 0.77 | 0.52 |
| MSI Zone |
| Number | 81 | 81 | 80 | 81 |
| Mean | 0.056 | 0.027 | 1.04 | 31.8 |
| Standard Deviation | 0.023 | 0.037 | 1.08 | 16.7 |
| Minimum | 0.003 | 0.002 | 0.05 | 6.4 |
| Maximum | 0.104 | 0.150 | 5.00 | 101.7 |
| Coefficient of Variation | 0.42 | 1.35 | 1.04 | 0.53 |
| Dykes |
| Number | 37 | 37 | 37 | 35 |
| Mean | 0.004 | 0.014 | 0.55 | 10.5 |
| Standard Deviation | 0.005 | 0.026 | 0.80 | 12.1 |
| Minimum | 0.001 | 0.001 | 0.01 | 1.5 |
| Maximum | 0.019 | 0.082 | 3.00 | 60.0 |
| Coefficient of Variation | 1.40 | 1.90 | 1.46 | 1.16 |
Note: %MoS2 statistics here are derived from assay grades calculated by multiplying %Mo by 1.6681.
| SMD | Cumo S-k 1300 Technical Report | November 2022 |
Geologic 2CM027.001 CuMoCo. | Page 92 |
For variogram analysis, the composite data was adjusted to accommodate post mineral faulting. Fault blocks were moved back to pre-fault locations based on marker beds displaced across fault boundaries. Semi-variograms were produced using these pre-fault locations. For estimation, the original locations of composites were used.
Pairwise, relative semi-variograms were used to determine grade continuity for MoS2, Cu, Ag and W in 50 ft composites. Nested spherical models were fit to all directions with the model parameters tabulated below and the models shown in Appendix 4.
Table 14-8: Parameters for semi-variogram models at CuMo
| Variable | Domains | Direction | C0 | C1 | C2 | Short Range (ft) | Long Range (ft) |
| MoS2 | Cu-Mo and Mo Zone | Az 60 Dip 0 | 0.06 | 0.12 | 0.12 | 200 | 1800 |
| Az 330 Dip -35 | 400 | 500 |
| Az 150 Dip -55 | 300 | 1300 |
| Cu-Ag Zone | Az 0 Dip 0 | 0.16 | 0.16 | 0.20 | 200 | 1200 |
| Az 270 Dip 0 | 200 | 400 |
| Az 0 Dip -90 | 400 | 800 |
| Cu | Cu-Ag and Cu-Mo Zone | Az 60 Dip 0 | 0.08 | 0.08 | 0.10 | 250 | 1600 |
| Az 330 Dip -35 | 500 | 700 |
| Az 150 Dip -55 | 300 | 1600 |
| Mo Zone | Az 60 Dip 0 | 0.05 | 0.15 | 0.15 | 400 | 1200 |
| Az 330 Dip 0 | 300 | 400 |
| Az 0 Dip -90 | 300 | 500 |
| Ag | Cu-Ag and Cu-Mo Zone | Az 70 Dip 0 | 0.12 | 0.05 | 0.09 | 200 | 1000 |
| Az 340 Dip 0 | 50 | 200 |
| Az 0 Dip -90 | 120 | 500 |
| Mo Zone | Az 60 Dip 0 | 0.06 | 0.15 | 0.14 | 300 | 1200 |
| Az 330 Dip 0 | 300 | 500 |
| Az 0 Dip -90 | 450 | 700 |
| W | Cu-Mo and Mo Zone | Az 0 Dip 0 | .06 | .02 | 0.15 | 150 | 1000 |
| Az 270 Dip 0 | 50 | 500 |
| Az 0 Dip -90 | 100 | 800 |
| Cu-Ag Zone | Az 30 Dip 0 | 0.08 | 0.11 | 0.17 | 160 | 1100 |
| Az 300 Dip 0 | 200 | 1200 |
| Az 0 Dip -90 | 300 | 400 |
There were insufficient composites within the MSI Zone to model so the models for the Mo Zone were applied to estimate this zone.
| SMD | Cumo S-k 1300 Technical Report | November 2022 |
Geologic 2CM027.001 CuMoCo. | Page 93 |
| 11.5 | Block Model and Grade Estimation |
A block model with blocks 50 x 50 x 50 ft in dimension was superimposed over the mineralized zones with the proportion of each block below surface topography and within the various mineralized solids recorded. The block model origin was as follows:
Lower Left Corner
| | ● | 214,600 E Column Size – 50 ft 207 Columns |
| | ● | 114,250 N Row Size – 50 ft 179 Rows |
Top of Model
| | ● | 7075 Elevation Level Size – 50 ft 76 Levels |
The grades for the four variables namely: MoS2, Cu, Ag and W were interpolated into each block containing some proportion of mineralized solid by ordinary kriging. Kriging was completed for each variable separately within two mineralized zones. A combination of soft and hard boundaries was used to estimate MoS2, Cu, Ag and W to reflect the metal zonation present at the CuMo deposit.
Table 14-9: Estimation boundary summary
| Mineral/Metal | Estimation Boundary Information |
| MoS2 | Estimated for Cu-Ag Zone using only composites from Cu-Ag and oxide zones |
| Estimated for Cu-Mo and Mo Zones using only composites from Cu-Mo and Mo Zones |
| Cu | Estimated for Mo Zone using only composites from Mo Zone |
| Estimated for Cu-Ag and Cu-Mo Zones using only composites from Cu-Ag, Cu-Mo and oxide Zones |
| Ag | Estimated for Mo Zone using only composites from Mo Zone |
| Estimated for Cu-Ag and Cu-Mo Zone using only composites from Cu-Ag, Cu-Mo and Oxide Zone |
| W | Estimated for Cu-Ag Zone using only composites from Cu-Ag and Oxide Zones |
| Estimated for Cu-Mo and Mo Zones using only composites from Cu-Mo and Mo Zones |
Each kriging run was composed of four passes. The dimensions for the search ellipse, within each pass, were a function of the semi-variogram ranges. Pass 1 required a minimum of four composites within a search ellipsoid with dimensions equal to one quarter of the semi-variogram range for each direction. For blocks not estimated, the search ellipse was expanded to half the semi-variogram range in Pass 2 and again a minimum of four composites were required to estimate the block. Pass 3 expanded the search ellipse to the entire range, and a final fourth pass used double the range. In all cases, the maximum number of composites from a single hole was set to three to ensure that a minimum of two drill holes were used in each estimate. The maximum number of composites used was set to 16, and if more than 16 composites were found, the closest 16 were used. The search parameters for each run are listed below in Table 14-10. Pass 4 for Ag and W used larger search ellipses to produce a value for all blocks estimated for MoS2 and Cu. This was due to the under-sampling of Ag and W relative to Mo and Cu.
A grade for each of the four variables was estimated in a total of 734,490 blocks.
| SMD | Cumo S-k 1300 Technical Report | November 2022 |
Geologic 2CM027.001 CuMoCo. | Page 94 |
Table 14-10: Summary of kriging search parameters for each mineralized zone
| Domain | Variable | Pass | Number Of Blocks Estimated | Az/Dip | Dist. (ft) | Az/Dip | Dist. (ft) | Az/Dip | Dist. (ft) |
| Cu-Ag | MoS2 | 1 | 4,614 | 0 /0 | 300 | 270 / 0 | 100 | 0 / -90 | 200 |
| 2 | 26,207 | 600 | 200 | 400 |
| 3 | 83,342 | 1,200 | 400 | 800 |
| 4 | 252,646 | 2,400 | 800 | 1,600 |
| Cu-Mo & Mo | MoS2 | 1 | 35,447 | 60 / 0 | 450 | 150 / -55 | 325 | 330 / -35 | 125 |
| 2 | 110,887 | 900 | 650 | 250 |
| 3 | 121,147 | 1,800 | 1,300 | 500 |
| 4 | 59,784 | 3,600 | 2,600 | 1,000 |
| Cu-Ag & Cu-Mo | Cu | 1 | 50,852 | 60 / 0 | 400 | 150 / -55 | 175 | 330 / -35 | 400 |
| 2 | 128,958 | 800 | 350 | 800 |
| 3 | 235,739 | 1,600 | 700 | 1,600 |
| 4 | 139,891 | 3,200 | 1,400 | 3,200 |
| Mo | Cu | 1 | 1,789 | | 300 | | 100 | | 125 |
| 2 | 22,307 | 60 / 0 | 600 | 330 / 0 | 200 | 0 / -90 | 250 |
| 3 | 58,857 | | 1,200 | | 400 | | 500 |
| 4 | 80,068 | | 2,400 | | 800 | | 1,000 |
| Cu-Ag & Cu-Mo | Ag | 1 | 1,859 | | 250 | | 50 | | 125 |
| 2 | 18,305 | 70 / 0 | 500 | 340 / 0 | 100 | 0 / -90 | 250 |
| 3 | 94,108 | | 1,000 | | 200 | | 500 |
| 4 | 441,174 | | 2000 | | 400 | | 1,000 |
| Mo | Ag | 1 | 3,067 | | 300 | | 125 | | 175 |
| 2 | 31,146 | | 600 | | 250 | | 350 |
| 3 | 63,317 | 60 / 0 | 1,200 | 330 / 0 | 500 | 0 / -90 | 700 |
| 4 | 65,491 | | 2,400 | | 1,000 | | 1,400 |
| Cu-Ag | W | 1 | 14,288 | | 275 | | 300 | | 100 |
| 2 | 51,953 | 30 / 0 | 550 | 300 / 0 | 600 | 0 / -90 | 200 |
| 3 | 122,565 | | 1,100 | | 1,200 | | 400 |
| 4 | 179,224 | | 2,200 | | 2,400 | | 800 |
| Cu-Mo & Mo | W | 1 | 4,799 | | 250 | | 125 | | 200 |
| 2 | 59,057 | 0 / 0 | 500 | 270 / 0 | 250 | 0 / -90 | 400 |
| 3 | 130,570 | | 1,000 | | 500 | | 800 |
| 4 | 144,312 | | 2000 | | 1,000 | | 1,600 |
Note: Distances shown in the table represent one quarter (Pass 1), one half (Pass 2), full (Pass 3) and twice (Pass 4) the semi-variogram range in the three principal directions.
Rhenium and sulfuric acid are credits received by the project during the roasting process at a roaster controlled by the project. A roaster and sulfur recovery plant have been built into the capital cost section of this report. Rhenium and sulfuric acid are contained solely within the molybdenite (MoS2) – rhenium as an impurity within the molybdenite (MoS2) structure, and sulfuric acid is produced from sulfur when the MoS2 is converted to MoO3. Due to the irregular nature of impurities and the sulfur content within the molybdenum, these cannot be estimated in blocks by kriging. Instead statistical linear regressions were applied to 7,485 analyses related to rhenium content in the molybdenite (MoS2) within the various geological domains (mineralized zones) to determine the actual amount of these products produced. The results of the statistical linear regression are lower and more conservative than the rhenium recovery reported by SGS (2009).
| SMD | Cumo S-k 1300 Technical Report | November 2022 |
Geologic 2CM027.001 CuMoCo. | Page 95 |
Scatter plots were produced for each mineralized zone, plotting Re and S against MoS2, and from these, a linear regression equation was used to estimate the amount of Re (ppm) and S (%) present on a block by block basis (see Figure 14-2 for an example plot showing Re vs MoS2 in Cu-Mo Zone).
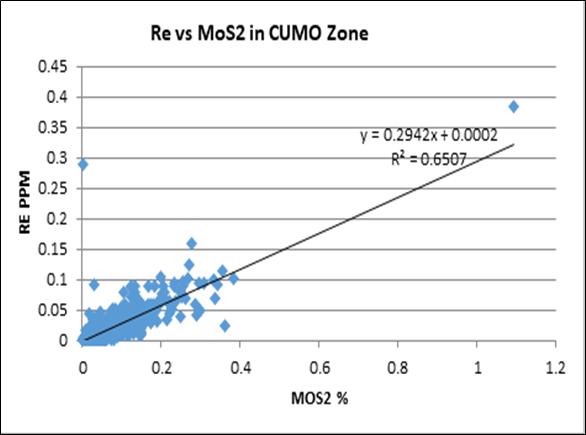
Source: Giroux et al , 2015
Figure 14-2: Scatter plot showing Re vs MoS2 in the Cu-Mo Zone
For blocks containing more than one mineralized zone, a weighted average was produced. The two commodities are considered not as by-products of a producing mine but as smelter/processing credits from the concentrates. Smelter credits and penalties are common within the mining industry and in many cases, the credit or penalty element is not contained in the current resources or reserves of a project. The author has included the commodities to provide full disclosure as circuits to recover and produce these products are built into capital and operating costs. Re and S values have not been used to determine the RCV of blocks. The contribution of these commodities to the overall economic analyses is small and well within the accuracy of the this type of study, with rhenium contributing 0.37% of the overall revenue and sulfuric acid 0.49%. Rhenium is of special interest to the development of the property as it is now on a list of minerals that are critical to the USA.
| SMD | Cumo S-k 1300 Technical Report | November 2022 |
Geologic 2CM027.001 CuMoCo. | Page 96 |
Note: Regression analysis is not industry standard practice in calculating overall resources. However, the fact that rhenium and sulfur are contained almost entirely within the material containing MoS2, which has been estimated by kriging, means that regression is a valid method of obtaining a reasonable estimate of the rhenium and sulfur contents at the level of precision of this study. Due to the large number of samples involved in the regression analysis, the confidence of this particular regression estimate is comparable to that obtained by the method of ordinary kriging.
A total of 4,539 specific gravity determinations were made for CuMo in all mineralized zones. This total includes 4,339 determinations made during the 2011 drill program. The measurements were made using the weight in air/weight in water procedure. The results are summarized in Table 14-11.
Table 14-11: Summary of density parameters for each mineralized zone
| Zone | Number of SG Determinations | SG Minimum | SG Maximum | Average SG (gm/cc) | Average TF (cu.ft/ton) |
| Ox | 578 | 2.08 | 2.74 | 2.50 | 12.80 |
| Cu-Ag | 1,505 | 2.28 | 3.70 | 2.58 | 12.42 |
| Cu-Mo | 1,524 | 2.25 | 2.85 | 2.58 | 12.40 |
| Mo | 763 | 2.30 | 2.75 | 2.57 | 12.45 |
| Msi | 91 | 2.40 | 2.73 | 2.57 | 12.48 |
| Dyke | 78 | 2.19 | 2.75 | 2.52 | 12.71 |
| Total | 4,539 | 2.08 | 3.70 | 2.57 | |
The tonnage factor for each block was a weighted average based on the mineralized zone’s tonnage factor and the amount of that zone within the block.
| 11.7 | Reasonable Prospects of Eventual Economic Extraction |
Reasonable prospects of eventual economic extraction have been established by constraining the resource estimate to within a conceptual open pit design using reasonable parameters from an analogous nearby molybdenum deposit. An RCV in non-oxide material of $5.00/t has been highlighted as a possible open pit cut-off based on similar size mines at a feasibility or production stage. In the mineral resource tables at the end of this section, the $5.00 cut-off for the assumed price is highlighted and is selected based on operating costs. The $5.00 cut-off is suggested to separate waste from material that is fed to the sorters. From the sorters, only mill feed above an economic cut-off would be sent for immediate processing.
In 2012, Snowden used Geovia’s WhittleTM pit optimizer to determine a constraining open pit for the CuMo deposit. Optimization parameters were from the Thompson Creek mine (a comparable open pit molybdenum project located in Idaho). The optimization parameters included mill feed mining and processing costs of $7.52 per processed ton, overall pit slope angles of 45°, metallurgical recoveries as shown in Table 14-12 and appropriate dilution and offsite costs and royalties. The metal prices used in 2012 by Snowden for pit optimization were Mo at $25/lb, Cu at $3/lb, Ag at $20/oz and W at $10/lb.
| SMD | Cumo S-k 1300 Technical Report | November 2022 |
Geologic 2CM027.001 CuMoCo. | Page 97 |
Since the infill drill holes completed in 2011-12 were all within this conceptual pit this resource update uses the Snowden 2012 optimum pit shell to both constrain the estimate and demonstrate reasonable prospects of eventual economic extraction.
| 11.8 | Resource Classification |
At CuMo, geological continuity has been established through diamond drilling. The concentric zonation and faults have been used to constrain the mineralization in a series of mineralized zones. Grade continuity within the mineralized zones has been determined by semi-variograms for each variable.
Semi-variograms are an aspect of data analysis that assist in defining the correlation and range of influence of a grade variable in various directions in three dimensions. Semi-variograms are a graphical geostatistical tool used to determine the direction and range over which samples show continuity. The semi-variogram plots the mean squared difference between samples as an increasing function of distance between samples, and as the distance between samples increases, it reaches a point (the range) where samples are no longer correlated.
In this case, the semi-variogram analysis was completed after moving major fault blocks back to pre-fault positions. The kriging procedure was completed on fault blocks in their current positions; thus by using the range in each of the major directions, the grade continuity can be quantified. This in turn can be used to establish classification levels.
The resource is classified in accordance with the S-K 1300 Standards.
Measured
“Measured mineral resource is that part of a mineral resource for which quantity and grade
or quality are estimated on the basis of conclusive geological evidence and sampling. The
level of geological certainty associated with a measured mineral resource is sufficient to
allow a qualified person to apply modifying factors, as defined in this section, in sufficient
detail to support detailed mine planning and final evaluation of the economic viability of
the deposit. Because a measured mineral resource has a higher level of confidence than
the level of confidence of either an indicated mineral resource or an inferred mineral
resource, a measured mineral resource may be converted to a proven mineral reserve or
to a probable mineral reserve.
| SMD | Cumo S-k 1300 Technical Report | November 2022 |
Geologic 2CM027.001 CuMoCo. | Page 98 |
Contiguous blocks within the Cu-Ag and Cu-Mo Zones estimated in Pass 1 (using one quarter of the semi-variogram range) for both MoS2 and Cu were classified as measured. For the Mo and MSI Zones where Cu, Ag and W provide little of the economic benefit contiguous blocks estimated in Pass 1 for MoS2were classified as measured.
Indicated
Indicated mineral resource is that part of a mineral resource for which quantity and grade or quality are estimated on the basis of adequate geological evidence and sampling. The level of geological certainty associated with an indicated mineral resource is sufficient to allow a qualified person to apply modifying factors in sufficient detail to support mine planning and evaluation of the economic viability of the deposit. Because an indicated mineral resource has a lower level of confidence than the level of confidence of a measured mineral resource, an indicated mineral resource may only be converted to a probable mineral reserve. Indicated blocks were established from unclassified blocks estimated for Cu or MoS2 in Pass 1 or 2 using search ellipses up to a maximum of one half the semi-variogram range.
Inferred
Inferred mineral resource is that part of a mineral resource for which quantity and grade or quality are estimated on the basis of limited geological evidence and sampling. The level of geological uncertainty associated with an inferred mineral resource is too high to apply relevant technical and economic factors likely to influence the prospects of economic extraction in a manner useful for evaluation of economic viability. Because an inferred mineral resource has the lowest level of geological confidence of all mineral resources, which prevents the application of the modifying factors in a manner useful for evaluation of economic viability, an inferred mineral resource may not be considered when assessing the economic viability of a mining project, and may not be converted to a mineral reserve. The author in classifying the mineral resource into the three different categories has examined the characteristics of the mineralization and associated reports and preliminary data and information concerning mining, metallurgy, economics and social and environmental sensitivity and has determined that the classification meets the requirement of reasonable prospects of eventual economic extraction in regard to this Initial assesment study.
Specifically, it must be noted that metallurgical tests to separate a combined Cu-Mo concentrate into separate saleable concentrates have yet to be completed. However, SGS 2009, as outlined in section 13.1.5, indicates that there is no reason that separate saleable copper and molybdenum concentrates cannot be produced. In addition, based on similar operations at Las Pelambres, Andina, Collahuasi, Gibraltar and Sierrita, there is no reason to indicate that this concentrate separation cannot be produced with additional metallurgical testing prior to a pre-feasibility study. Given this information, the author is confident that the metallurgical work would allow the application of modifying factors to support future detailed mine planning and the final evaluation of the economic viability of the deposit.
Figure 14-3 shows indicative plan views of the measured, indicated and inferred blocks at CuMo.
| SMD | Cumo S-k 1300 Technical Report | November 2022 |
Geologic 2CM027.001 CuMoCo. | Page 99 |
Note: As with the 2015 resource estimate, the current resource is constrained within the 2012 Snowden pit. Figure 10-1, Figure 10-2 and Figure 10-3 show the outline of the 2012 Snowden constraining pit, and a projection of categorized blocks.
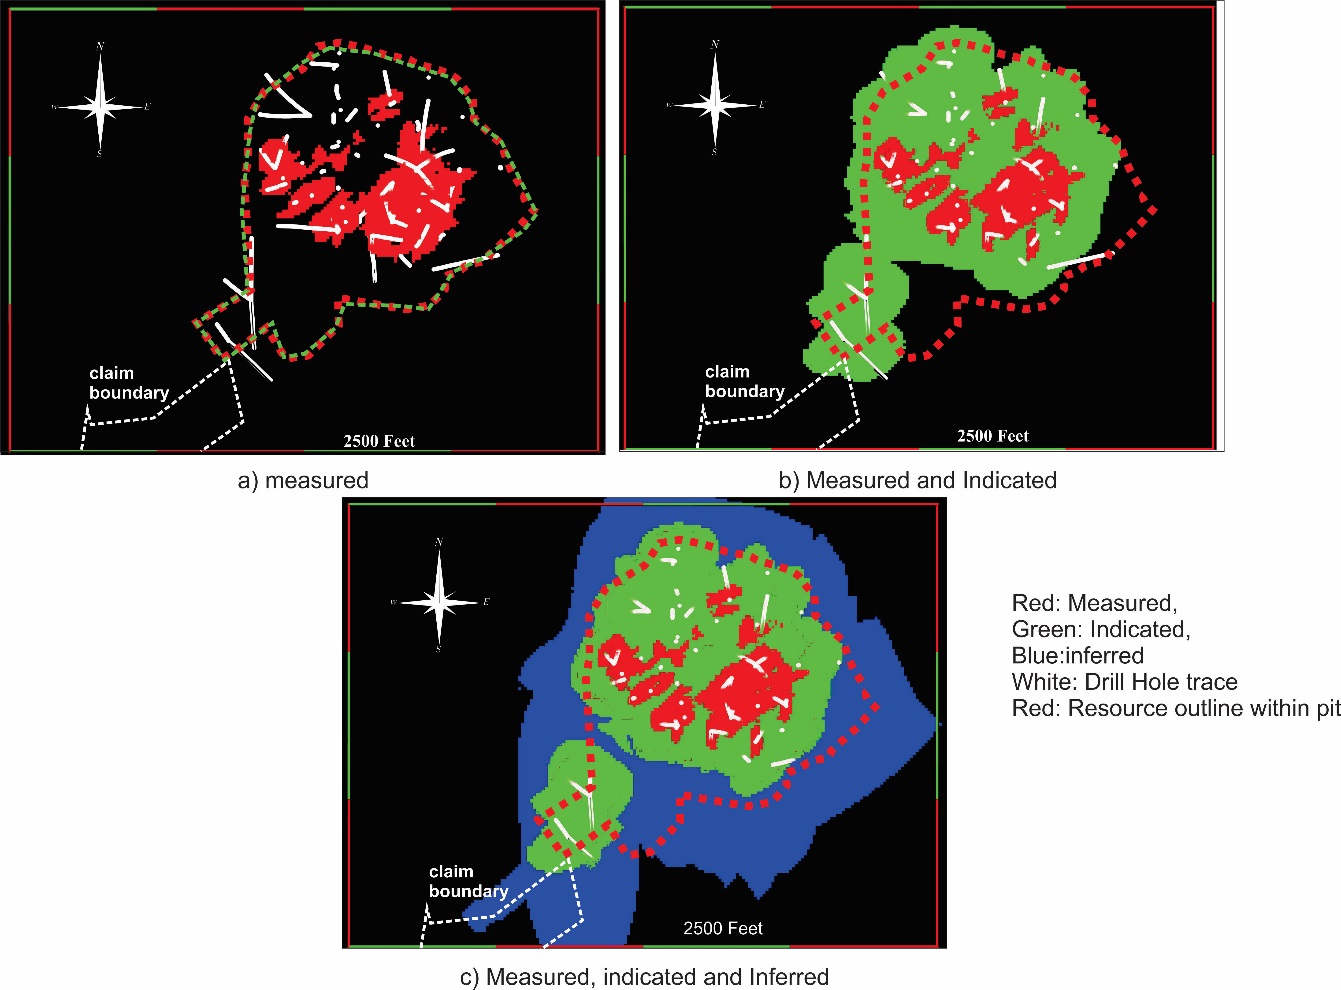
Source: Giroux et al , 2015, modified 2019
Note: The above shows all blocks estimated. The outline of the 2012 Snowden constraining pit has been added. The blocks within this constraining pit are summarized in the various tables.
Figure 14-3: Plan views of the measured, indicated and inferred blocks at CuMo
To properly evaluate the CuMo deposit with four metals occurring in different zones, A factor named recovered value, or RCV, was used. This calculation used metal prices in US dollars and metal recoveries.
The RCV calculations were based on the set of prices defined in Table 14-13.
| SMD | Cumo S-k 1300 Technical Report | November 2022 |
Geologic 2CM027.001 CuMoCo. | Page 100 |
Table 14-12: Metal prices for resources and represent the long er term predictions for future prices combined with the moving average for the past 3 years.
| Metal | Price |
| Copper (Cu), $/lb | 3.00 |
| Molybdenum trioxide (MoO3), $/lb | 10.00 |
| Molybdenum Metal (Mo), $/lb | 15.00 |
| Silver (Ag), $/ounce | 12.50 |
Molybdenum is sold as molybdenum trioxide (MoO3) which has higher Mo content. The price used in this study for MoO3 is $10/lb. MoO3is calculated from MoS2 by the following:
| ● | Pounds Mo = MoS2* 20 / 1.6681 |
| ● | Pounds MoO3= Pounds Mo * 1.5 |
The metal recoveries used to calculate RCV were a function of mineralized zones as follows:
Table 14-13: Metal recoveries sorted by mineralized zone
| Metal | %Recoveries in Oxides | %Recoveries in Cu-Ag Zone | %Recoveries in Cu-Mo Zone | %Recoveries in Mo & MSI Zones |
| Cu | 60.0 | 68.0 | 85.0 | 72.0 |
| Mo | 80.0 | 86.0 | 92.0 | 95.0 |
| Ag | 65.0 | 75.0 | 78.0 | 55.0 |
Note: The recoveries for all metals in the MSI Zone were similar to the Mo Zone
Factors to use in RCV equation were as follows:
| MoS2Factor ($/ton) = | | MoS2% * Mo Recovery % * 2000 lbs/ton * $/lb MoO3 * 1.5/1.6881 |
| | | |
| | | |
| Cu Factor ($/ton) = | | Cu % * Cu Recovery % * 2000 lbs/ton * $/lb Cu |
| | | |
| | | |
| Ag Factor ($/ton) = | | Ag ppm * Ag Recovery % * $/oz Ag |
| | | 31.1035 g/oz * 1.1023 tons/tonne |
The equations to calculated RCV for each mineralized zone were as follows:
RCV (oxides) = (Cu% * 36.0) + (Ag(ppm) * 0.24) + (MoS2% * 143.88)
RCV (Cu-Ag) = (Cu% * 40.8) + (Ag(ppm) * 0.27) + (MoS2% * 154.67)
RCV (Cu-Mo) = (Cu% * 51.0) + (Ag(ppm) * 0.28) + (MoS2% * 165.46)
RCV (Mo) = (Cu% * 43.2) + (Ag(ppm) * 0.20) + + (MoS2% * 170.85)
RCV (MSI) = (Cu% * 43.2) + (Ag(ppm) * 0.20) + + (MoS2% * 170.85)
| SMD | Cumo S-k 1300 Technical Report | November 2022 |
Geologic 2CM027.001 CuMoCo. | Page 101 |
For blocks overlapping the mineralized zone boundaries, a weighted average RCV was produced.
A complete series of tables for each zone (5), each classification (4) and for each price regime (3) plus an overall set were produced (a total of 72 tables). For the purposes of this summary report, the mineral resource estimate described next was for all zones.
| 11.10 | Mineral Resource Estimate |
Table 14-14. Table 14-15, Table 14-16, and Table 14-17 report the overall mineral resource estimated within the Snowden 2012 open pit shell at a variety of RCV cut-offs. The $5.00/t cut-off is highlighted as an appropriate RCV cut-off based on grade improvements using mineral sorting processes. The base case $5.00 cut-off is suggested to separate waste from material that is fed to the sorters. The actual cut-off used in economic analysis and mine design will vary depending on numerous conditions at the time of the calculation: including metal prices, recoveries and operating costs. Metal prices selected represent the longer term predictions for future prices combined with the moving average for the past 3 years
It should be noted that since the convention for the CuMo project has been to work with %MoS2, as calculated from measured %Mo, the %MoS2 values in the resource estimate tables are 1.6681 times greater than %Mo.
Table 14-14: Measured resources
Cut-off RCV ($) | Grade > RCV Cut-off | Contained Metal |
Quantity (Mt) | MoS2 (%) | Cu (%) | Ag (ppm) | RCV ($) | Re (ppm) | S (%) | Mo (mmlbs) | Cu (mmlbs) | Ag (Moz) |
| 2.5 | 308.4 | 0.079 | 0.074 | 2.09 | 17.32 | 0.029 | 0.233 | 292.1 | 456.5 | 18.8 |
| 5.0 | 297.2 | 0.081 | 0.076 | 2.09 | 17.83 | 0.03 | 0.229 | 288.6 | 451.7 | 18.1 |
| 7.5 | 282 | 0.085 | 0.076 | 2.06 | 18.48 | 0.031 | 0.223 | 287.4 | 428.7 | 16.9 |
| 12.5 | 227.9 | 0.097 | 0.075 | 2 | 20.50 | 0.036 | 0.217 | 265 | 341.8 | 13.3 |
| 15.0 | 195.4 | 0.105 | 0.072 | 1.9 | 21.71 | 0.039 | 0.212 | 246 | 281.3 | 10.8 |
| 17.5 | 159.7 | 0.115 | 0.067 | 1.8 | 23.04 | 0.043 | 0.207 | 220.1 | 213.9 | 8.4 |
| 20.0 | 122.9 | 0.125 | 0.063 | 1.7 | 24.50 | 0.047 | 0.202 | 184.1 | 154.8 | 6.1 |
Source: Giroux et al, 2015, modified 2019
| SMD | Cumo S-k 1300 Technical Report | November 2022 |
Geologic 2CM027.001 CuMoCo. | Page 102 |
Table 14-15: Indicated resources
Cut-off RCV ($) | Grade > RCV Cut-off | Contained Metal |
Quantity (Mt) | MoS2 (%) | Cu (%) | Ag (ppm) | RCV ($) | Re (ppm) | S (%) | Mo (mmlbs) | Cu (mmlbs) | Ag (Moz) |
| 2.5 | 2216.1 | 0.049 | 0.079 | 2.48 | 12.32 | 0.018 | 0.277 | 1301.9 | 3501.4 | 160.3 |
| 5.0 | 1972.3 | 0.053 | 0.085 | 2.57 | 13.40 | 0.019 | 0.269 | 1253.3 | 3352.9 | 147.8 |
| 7.5 | 1708.3 | 0.059 | 0.088 | 2.59 | 14.55 | 0.021 | 0.258 | 1208.4 | 3006.5 | 129 |
| 12.5 | 1050.6 | 0.076 | 0.09 | 2.55 | 17.67 | 0.027 | 0.235 | 957.4 | 1891.1 | 78.1 |
| 15.0 | 798.5 | 0.083 | 0.09 | 2.56 | 19.06 | 0.03 | 0.231 | 794.6 | 1437.2 | 59.6 |
| 17.5 | 541.6 | 0.093 | 0.088 | 2.49 | 20.60 | 0.034 | 0.226 | 603.9 | 953.2 | 39.3 |
| 20.0 | 301.3 | 0.106 | 0.082 | 2.36 | 22.49 | 0.039 | 0.219 | 383 | 494.2 | 20.7 |
Source: Giroux et al, 2015, modified 2019
Table 14-16: Measured and indicated resources
Cut-off RCV ($) | Grade > RCV Cut-off | Contained Metal |
Quantity (Mt) | MoS2 (%) | Cu (%) | Ag (ppm) | RCV ($) | Re (ppm) | S (%) | Mo (mmlbs) | Cu (mmlbs) | Ag (Moz) |
| 2.5 | 2524.6 | 0.053 | 0.079 | 2.43 | 12.93 | 0.019 | 0.272 | 1604.3 | 3988.9 | 178.9 |
| 5.0 | 2269.6 | 0.057 | 0.084 | 2.5 | 13.98 | 0.021 | 0.264 | 1551.1 | 3812.9 | 165.5 |
| 7.5 | 1990.4 | 0.063 | 0.086 | 2.51 | 15.10 | 0.022 | 0.253 | 1503.5 | 3423.5 | 145.7 |
| 12.5 | 1278.6 | 0.079 | 0.087 | 2.46 | 18.17 | 0.029 | 0.232 | 1211.1 | 2224.8 | 91.7 |
| 15.0 | 993.9 | 0.088 | 0.087 | 2.43 | 19.58 | 0.032 | 0.227 | 1048.7 | 1729.5 | 70.4 |
| 17.5 | 701.4 | 0.098 | 0.083 | 2.33 | 21.16 | 0.036 | 0.221 | 824.1 | 1164.2 | 47.7 |
| 20.0 | 424.3 | 0.112 | 0.077 | 2.17 | 23.07 | 0.041 | 0.214 | 569.8 | 653.4 | 26.9 |
Source: Giroux et al, 2015, modified 2019
Table 14-17: Inferred resources (molybdenum, copper, silver, rhenium and sulfur)
Cut-off RCV ($) | Grade > RCV Cut-off | Contained Metal |
Quantity (Mt) | MoS2 (%) | Cu (%) | Ag (ppm) | RCV ($) | Re (ppm) | S (%) | Mo (mmlbs) | Cu (mmlbs) | Ag (Moz) |
| 2.5 | 3373.6 | 0.04 | 0.057 | 1.93 | 9.55 | 0.014 | 0.304 | 1617.9 | 3845.9 | 189.9 |
| 5.0 | 2556.6 | 0.048 | 0.067 | 2.13 | 11.48 | 0.017 | 0.282 | 1471.4 | 3425.9 | 158.8 |
| 7.5 | 1996 | 0.056 | 0.07 | 2.23 | 13.07 | 0.02 | 0.261 | 1340.1 | 2794.4 | 129.8 |
| 12.5 | 996.4 | 0.078 | 0.064 | 1.98 | 16.74 | 0.028 | 0.231 | 931.8 | 1275.4 | 57.5 |
| 15.0 | 637 | 0.086 | 0.074 | 2.16 | 18.63 | 0.03 | 0.244 | 656.8 | 942.7 | 40.1 |
| 17.5 | 384.8 | 0.094 | 0.084 | 2.34 | 20.49 | 0.032 | 0.259 | 433.7 | 646.4 | 26.3 |
| 20.0 | 190.2 | 0.109 | 0.078 | 2.37 | 22.80 | 0.037 | 0.262 | 248.6 | 296.8 | 13.1 |
Source: Giroux et al, 2015, modified 2019
Note: Mineral resources that are not mineral reserves do not have demonstrated economic viability.
| 12 | Mineral Reserve Estimates |
No mineral reserve estimates, as defined by CIM Definition Standards, currently exist for the CuMo project.
| SMD | Cumo S-k 1300 Technical Report | November 2022 |
Geologic 2CM027.001 CuMoCo. | Page 103 |
The CuMo project is envisaged to be developed using open pit mining techniques. The scale of the deposit is such that ultra-class mining equipment (e.g. 400-ton trucks) has been considered for the purposes of this Initial assesment. As well, to improve the head grade of the flotation mill feed, the author has considered the implementation of mineral sorting for the project. Specifically, the author envisions a multi-stage bulk sorting process accompanied by a final particle-sorting stage to upgrade the mil feed. These are described further in Section 17.2 and 17.3. The result of the mineral sorting strategies is a reduction of waste fed to the mill, thereby improving feed head grade. There is however added cost, but this is all taken into consideration in determining the potential mineable resource for the project.
Under supervision of the author, SRK applied Lerchs Grossman pit optimization techniques using Geovia’s WhittleTM software to generate potential pit shells for mining. The inputs and outcomes of this process are described herein.
| 13.2.1 | Pit Geotechnical Considerations |
The author conducted a basic, Initial assesment level, geotechnical assessment to define pit wall slope inputs for the pit design. The assessment comprised:
| ● | A review of the existing geotechnical data sources |
| | | |
| ● | A site visit to view the proposed pit footprint and evaluate the historical core |
| | | |
| ● | An assessment of the extents and confidence level of with the data |
| | | |
| ● | Processing of the data for rock mass characterization and classification |
| | | |
| ● | Formulation of pit wall recommendations |
Data Sources
A summary of the reviewed data types provided by CuMoCo pertinent to this geotechnical assessment is presented in Table 16-1.
| SMD | Cumo S-k 1300 Technical Report | November 2022 |
Geologic 2CM027.001 CuMoCo. | Page 104 |
Table 16-1: Summary of the reviewed data types
| Data Type | Details |
| Technical Report | NI 43-101 Resource Estimate Update (Snowden), dated 12 June 2012 |
| Geology Model | 2-D schematic map and sections illustrating the deposit major geology, alteration, mineralization structural regime |
| Drill hole Database | Drill hole database comprising; · exploration drill holes from the 2006 to 2012 drilling campaigns, including; lithology, alteration, mineralized zone and RQD. Included three · three geotechnical drill holes from the 2010 drilling campaign with detailed properties logged to RMRL(90). |
| Core Photographs | Core photographs from geotechnical drill hole C10-55 |
| Topography | Site topographic surface |
| Pit Shell | Snowden resource pit shell |
On 30 October 2018, a senior geotechnical engineer from SRK (the “author” of this sub-section) visited the CuMo project site, the area of the proposed pit footprint and the project core facility. Observations were made of the site setting, rock exposures and the core from geotechnical drill hole C10-55 was viewed. These observations were considered for the analysis and design herein.
Snowden Report
Snowden conducted a resource estimate update and technical report in 2012 (Snowden, 2012). There was no geotechnical assessment undertaken as part of the study. Pit wall slopes used in the Initial assesment were given for ground elevation intervals and became shallower with pit depth i.e. the upper interval was 45°, the next 40°, and the north south and west walls had a lower interval of 35°. The resultant overall slope angles (OSA) calculated using this configuration are shown in Table 16-2.
The pit-shell used to constrain the resource estimation is not the same pit-shell as used to derive the mine plan used for this Initial assesment. The design parameters for the Initial assesment mine plan and resulting pits are discussed in Sections 16.2.3 16.2.4 and 16.2.5.
Table 16-2: Pit slope design details in Snowden (2012)
| Pit Sector | Snowden Resource Pit Shell Depth (m) | Bench Height (m) | Calculated OSA (°) |
| North wall | 670 | 15 | 42 |
| East wall | 590 | 15 | 43 |
| South wall | 850 | 15 | 42 |
| West wall | 670 | 15 | 42 |
These wall heights and design slope angles were plotted on an industry-recognized empirical chart showing various operations around the world Figure 16-1. Also plotted on the chart are separately-derived ‘trend lines of nominal factor of safety’ (after Hoek and Bray, 1981). Note that pit slope stability depends on a variety of site-specific factors which makes it difficult to directly compare with other sites, but the chart is still useful for benchmarking at early project design stage.
| SMD | Cumo S-k 1300 Technical Report | November 2022 |
Geologic 2CM027.001 CuMoCo. | Page 105 |
At an ultimate depth of over 600 m, the conceptual design walls are significantly higher than most operating mines in North America. The precedent for cases is very limited but the pits that are of those heights have all encountered slope stability problems in some areas of the mine. The plot suggests that these proposed OSAs fall around FoS of equity and may not be achievable.
As a result, the author proceeded to investigate and study further the wall heights and slope angles.
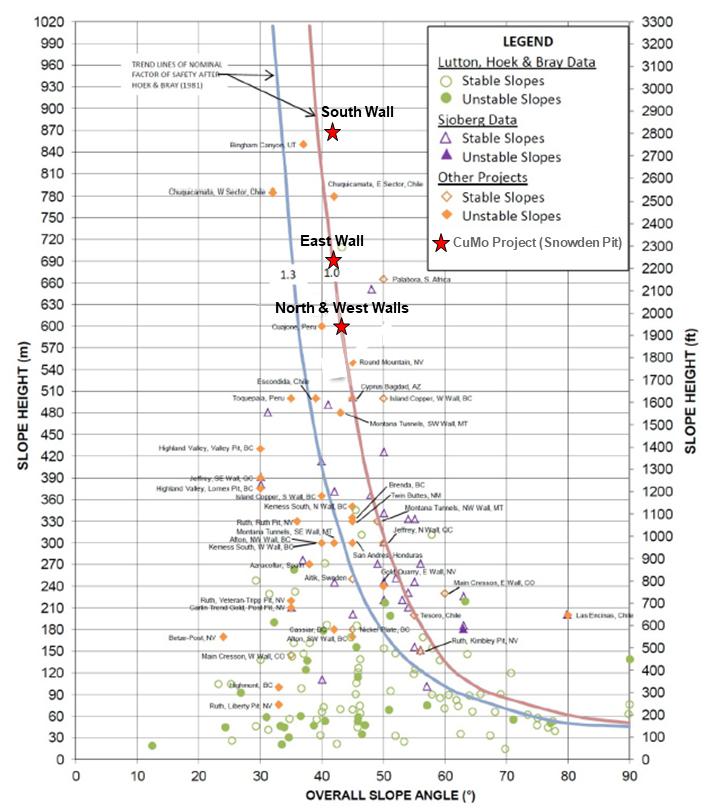
Source: SRK, 2019
Figure 16-1: Empirical pit wall chart with the Snowden (2012) walls added
| SMD | Cumo S-k 1300 Technical Report | November 2022 |
Geologic 2CM027.001 CuMoCo. | Page 106 |
Data Processing
The author undertook these tasks with the project data:
| ● | Viewed the project drill hole traces relative to the Snowden (2012) ultimate pit shell |
| | | |
| ● | Modelled the project RQD data to produce wireframes of binned values broadly equating to; very poor (<20), poor (21-40), fair (41-60), good (61-80), very good (81-100) |
| | | |
| ● | Processed the detailed geotechnical data for RMRL90 rock mass rating and viewed the colour-coded values over the full depth of the hole |
| | | |
| ● | QA/AC check of the core photos against the calculated RMRL90 values |
| | | |
| ● | Basic statistical analysis of the RQD and RMRL90 data |
Key Observations and Findings
The author makes these observations and findings from the data review and processing:
| ● | The three geotechnical drill holes are clustered together in the south western area of the deposit, hence spatial (and depth) coverage is very limited. |
| | | |
| ● | The primary geotechnical drill hole (C10-55) is aligned roughly parallel with the pit wall, hence geotechnically-important structures aligned this way will be invisible or under-represented. |
| | | |
| ● | The core from drill hole C10-55 showed a deep weathering profile, was generally highly fractured largely due to medium to high micro-defect intensity, and included damage zones, gauge, breccia and rubble probably associated with large-scale brittle structures e.g. faults, shear zones. |
| | | |
| ● | The model of the project RQD data shows that most of the core was logged as ‘poor’ to ‘very poor’ RQD, with small core zones which are ‘fair’. The mean RQD value for the data set was 18. |
| | | |
| ● | The RMRL90 values in drill hole C10-55 showed a large spread over the range of 25 to 70, with a mean value of 46. The colour-coded plot showed no obvious zonation or increase in values with depth. |
| | | |
| ● | The QA/QC check found that there were sections of core that had similar RMRL90 values and yet had distinctly different rock quality in the core photos. This points to possible errors, or inconsistencies, in the logging practices and the project geotechnical data set. |
Based on these observations and findings, the author concludes that pit slope stability of the deposit will likely be controlled by rock mass strength and major structures.
Pit Slope Evaluation
These tasks were conducted to reach an evaluation of the possible achievable pit slopes:
| ● | Using professional judgement and experience, the author selected and applied mining adjustment factors for; structures orientation, induced stresses, blasting and weathering, to get Mining RMR (MRMR) ratings for drill hole C10-55. |
| SMD | Cumo S-k 1300 Technical Report | November 2022 |
Geologic 2CM027.001 CuMoCo. | Page 107 |
| ● | Selected a pit design acceptance criterion of FoS=1.3 which is common for inter-ramp slopes (although in more advance design stages a higher factor of safety may be used locally around critical pit infrastructure such as ramps). |
| | | |
| ● | Using the well-known and industry-recognized Haynes and Terbrugge (1990) chart and considering an inter-ramp stack height of around 350 ft, the MRMR values were plotted to find pit slope angles. Reflective of the small data set and low confidence in the values, the lower half of the calculated MRMR range was plotted and used for the assessment. |
Pit Slope Recommendations
For the Initial assesment pit design, the author recommends the following pit wall design criteria:
| ● | maximum bench height of 50 ft |
| | | |
| ● | bench width of 26 ft |
| | | |
| ● | inter-ramp wall angles of 42° |
| | | |
| ● | geotechnical berm of 65 ft every seven benches |
To allow for geotechnical berms and a spiral ramp to reach the pit bottom, derived an overall slope angle to be used in pit shell definition of 37°.
Note these major limitations of the geotechnical assessment:
| ● | It was largely based on data from one geotechnical drill hole in one area of the deposit only. It does not provide coverage of the geology, alteration, mineralization units and regimes present over the site, nor of the open pit depth extent. |
| | | |
| ● | The site groundwater regime, or phreatic surface/s, were not considered. Porewater pressures can have a significant strength reduction and destabilizing effect on slopes. |
| | | |
| ● | The potential presence of lower-angle major fault structures could impact the overall slopes and may require specific design recommendations and/or mitigation strategies including flattening of the slopes. |
Sort Analysis of Drill Hole Data
As mentioned, mineral sorting is being considered for the CuMo project to improve the grade of the mill feed. The description here is for the adoption of bulk sorting at CuMo.
In preparing the drill hole data for a sort analysis, the author applied factors to account for expected sorting conditions or inefficiencies. In particular, two factors were considered – dilution zone thickness at sample interval contacts and minimum thickness of sample interval. The first represents possible mixing that can occur during blasting or in material handling. The grades in this zone are the average of adjacent sample intervals. The second factor typically considers thin intersections of sample intervals after bench compositing. Considered values for dilution and minimum thicknesses at CuMo ranged from zero to two feet. In the end, a 2-ft dilution zone per interval was used, with no consideration of minimum sample interval thickness.
| SMD | Cumo S-k 1300 Technical Report | November 2022 |
Geologic 2CM027.001 CuMoCo. | Page 108 |
The bulk sort analysis starts with considering grade control in the mine, whereby the author selected a sort feed cut-off to determine what goes to the sort plant versus what goes to waste. Then, using the composite-sample relationships discussed in Section 13.2.2, the author ran several scenarios examining the impact of multiple cut-off RCVs. In addition to the grade control cut-off, the author considered two RCV cut-offs for a given stage of sorting. Material below the lower RCV cut-off would be rejected as waste in the sort process, and material above the upper RCV cut-off would represent feed to the mill. Material between the cut-offs is referred to as “middlings”.
It was possible with these simulations of sorting, conducted directly on the drill hole data, to assess which combinations of cut-off grades produced the best results in terms of improved metal grades of the mill feed fraction and increased waste rejection. A final sort analysis however needed to be applied to the resource blocks to be able to assess preliminary economics that balance metal recoveries and waste rejection. The drill hole analysis results however provided a good starting point.
Sort Analysis of Resource Block Model
The composite-sample analysis discussed in Section 13.2.2 provides relationships between bench composite RCV and sample interval RCV. However, for sort analysis of blocks, selecting drill hole composite-sample relationships based on matching RCV grades is not possible due to the volume-variance effect. Block models generally have lower grades than the underlying drill hole data. To overcome this, the drill hole composite-sample relationships were re-expressed on a percentile RCV basis. Ranges or “bins” of percentile RCV (in 10% intervals) were thus set up for the drill hole composites and the corresponding composite-sample relationships were re-estimated for the drill hole data.
Then, using the 3-D mineral resource block model described in Section 14, the author performed a sort analysis for blocks contained within the pit shell used by Snowden (Snowden, 2012) to constrain the mineral resource. The percentile RCV of a block is compared to the percentile RCV ranges for the drill hole composites to select the applicable composite-sample relationship for sorting. Again, by applying a cut-off RCV for waste and another for mill feed, the block could be segregated into three products, waste, mill feed, and middlings, according to the composite-sample relationship.
To maximize the benefit of bulk sorting, and to take advantage of increased heterogeneity at smaller scales, multiple stages of bulk sorting were considered. The middlings portion became the feed for the subsequent sorting stages. As well, the middlings product streams were split in two to further reduce the volume of batches for sorting and thus increase the heterogeneity (per conclusions of Section 13.2.2).
To determine the composite-sample relationships that would apply to subsequent stages of sorting, the RCV of the middlings was re-calculated from the reported Cu, Mo, and Ag grades. This RCV value was compared to the drill hole composite analysis to derive the corresponding composite percentile RCV range. The composite-sample relationship for this range was then used to predict the results of bulk sort.
Using the original composite-sample relationship at each sort stage is seen to be conservative. As was observed for CuMo (Section 13.2.2), the smaller the scale observed, such as at a later stage bulk sort, the greater is the heterogeneity, thus improving discrimination around cut-off grades. The limitation for the CuMo project is the drill hole sample length (10-ft) which precludes shorter interval heterogeneity analysis.
| SMD | Cumo S-k 1300 Technical Report | November 2022 |
Geologic 2CM027.001 CuMoCo. | Page 109 |
Final Bulk Sort Parameters
For this Initial assesment, three stages of bulk sorting were run on the block model. The grouping of cut-offs which appear to produce the best economic results are as follows:
| | ● | Grade control cut-off RCV = $7.50/t |
| | | |
| | ● | Stage 1 Bulk Sort – Lower cut-off = $7.50/t; upper cut-off = $20.00/t |
| | | |
| | ● | Stage 2 Bulk Sort – Lower cut-off = $7.50/t; upper cut-off = $17.50/t |
| | | |
| | ● | Stage 3 Bulk Sort – Lower cut-off = $7.50/t; upper cut-off = $15.00/t |
Re-use of the same cut-offs (e.g. the lower cut-off segregating waste from middlings) is allowed as it is recognized that any bulk sort is not precise and that sort products will continue to contain a mix of material across the full range of sample grades.
The outcome of the block sorting analysis are blocks coded with tonnages of waste, mill feed, and middlings. Grades were calculated for each of these fractions in each block. As well, sorting costs were determined by applying $0.10/t for each bulk sort stage as well as an initial primary crushing cost of $0.20/t, which applies to all material fed to the sorting plant. This version of the block model was then used for mine planning.
A review of the particle sorting test work (Section 13.2.1) highlighted that the recovery of copper is not as good as molybdenum when RCV alone is the primary measure for sorting. Consequently, the author undertook a limited bivariate analysis of the test results, whereby the test samples were segregated into Mo-rich and Mo-poor samples. This would allow sorting based on Mo XRF grade for the Mo-rich samples and on Cu XRF grade for the Mo-poor samples.
In addition, as it was recognized that particle sorting was to come after bulk sorting, it was appropriate to cap the value of samples to be used in the analysis. A review of the samples showed that an RCV cap of $60/t was appropriate for the feed to particle sorting. Lastly, the particle sort analysis was weighted by the portions of the mineralized zones contained within the eventual Initial assesment pit (Note that to reduce complexity, the benefit of particle sorting was not applied in pit optimization, but rather prior to economics. This is a more conservative but acceptable approach.)
Multiple Mo grades were tested as cut points to segregate the samples into Mo-rich and Mo-poor populations. It was found that a 100 ppm Mo cut point had the best outcomes, which are provided in Figure 16-2. For this figure, the Mo-rich samples are ranked (sorted) based on Mo grade, while the Mo-poor samples are ranked by Cu grade. As can be seen, the Cu response is considerably improved (vs Figure 13-1), while the Mo response is somewhat muted. This is fine as it was found that through the bulk sorting analysis, most of the higher Mo grade material was pulled to mill feed, leaving Cu with greater potential for particle sorting.
| SMD | Cumo S-k 1300 Technical Report | November 2022 |
Geologic 2CM027.001 CuMoCo. | Page 110 |
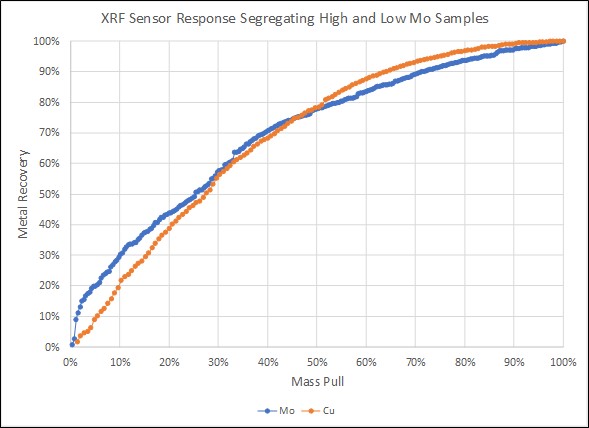
Source: SRK, 2019
Figure 16-2: Particle sort analysis splitting between Mo-rich and Mo-poor samples
A variety of different cut points and mass pulls were subsequently tested in the project economics, with the most promising being the 100 ppm Mo cut point and a mass pull of around 40%. The specific sort parameters are provided below:
| | ● | Mass pull - 40.8% |
| | | |
| | ● | Mo recovery – 56.9% |
| | | |
| | ● | Cu recovery – 52.6% |
Again, these parameters were only used in project economics, not pit optimization, which is discussed further below.
| 13.2.4 | Pit Optimization Input Parameters |
The 3-D resource block model was imported to MineSightTM mine design software in order to populate the blocks with the results of the sorting analysis. The new updated model was transferred to WhittleTM optimization software to carry out the pit optimization work in order to generate conceptual mining and processing schedules for this initial assessment. contained in this report. The pit shells that resulted are new, and are contained within, but are not be confused with, the 2012 Snowdon resource-constraining shell used for resource estimation.
| SMD | Cumo S-k 1300 Technical Report | November 2022 |
Geologic 2CM027.001 CuMoCo. | Page 111 |
In consultation with CuMoCo, assumptions were made for metal pricing (Mo, Cu, Ag) and offsite costs. Open pit mining costs were estimated to reflect expected haul destinations for waste and mill feed, taking advantage reduced haulage expected in early years. As well, to model the impact of a potential pre-strip period, which would be capitalized in the economic analysis, material above a selected elevation (6,100 ft) was assigned zero cost. Processing costs were based on a prior Ausenco trade-off study for plant throughput (Ausenco, 2009). A mill feed of 150,000 stpd was considered. Another assumption is that the project will build a roaster to treat the molybdenite (MoS2) concentrate.
A summary of the input parameters used is presented in Table 16-3.
Whittle™ open pit optimization software was then used to generate new pit shells for mine planning, using the resource block model updated with sorting results. The economically defined pit shell limits included measured, indicated and inferred mineral resources.
An inferred mineral resource is that part of a mineral resource for which quantity and grade or quality are estimated on the basis of limited geological evidence and sampling. Geological evidence is sufficient to imply but not verify geological and grade or quality continuity. An inferred mineral resource has a lower level of confidence than that applying to an indicated mineral resource and must not be converted to a mineral reserve. It is reasonably expected that the majority of inferred mineral resources could be upgraded to indicated mineral resources with continued exploration.
Inferred mineral resources must be excluded from estimates forming the basis of feasibility or other economic studies.
| 13.2.5 | Optimization Results |
A series of optimized pit shells were generated for the CuMo deposit based on varying revenue factors (base metal price multiples). The results of the pit optimization evaluation on the deposit for varying revenue factors values are presented in Figure 16-4. Note the NPV in this optimization summary does not take into account capital costs and is used only as a guide in shell selection and determination of the mining shapes. The actual NPV of the project is summarized in the economics section of this report (Section 22).
Whittle™ produces both “best case” (i.e., mine out shell 1, the smallest shell, and then mine out each subsequent shell from the top down, before starting the next shell) and “worst case” (mine each bench completely to final limits before starting next bench) scenarios. These two scenarios provide a bracket for the range of possible outcomes. The shells were produced based on varying revenue factors (0.3 through to 1.3 of base case) to produce the series of nested shells with the NPV results shown.
Note that in the pit optimization analysis undertaken, no value was assigned to the middlings from the third and final stage of bulk sorting. However, the decision was taken later in the project to feed the middlings to particle sorters. This has been reflected in the overall initial assessment of the deposit, but not in the selection of pit shells for mineable resources.
| SMD | Cumo S-k 1300 Technical Report | November 2022 |
Geologic 2CM027.001 CuMoCo. | Page 112 |
Table 16-3: Pit optimization input parameters
| Item | Unit | Value |
| Revenue | | |
| Mo Price | $/lb | 14.00 |
| Cu Price | $/lb | 3.00 |
| Ag Price | $/oz | 17.50 |
| Metal Recoveries | % | Varies; see Table 13-5 |
| Technical Constraints | | |
| Pit slope angles | Overall degrees | 37 |
| Mining dilution | % | 3% |
| Mining recovery | % | 98% |
| Processing rate | tpd | 150,000 |
| Offsite Costs / Inputs | | |
| Molybdenum | | |
| Concentrate grade | %Mo in MoS2 conc | 52% |
| Concentrate moisture | % | 0 |
| Transport to roaster | $/t | 5 |
| Roasting Cost | $/lb concentrate | 0.50 |
| Roaster recovery | % | 99% |
| Transport to market | $/t MoO3 | 0 |
| Copper | | |
| Concentrate grade | % Cu | 23 |
| Concentrate moisture | % | 10% |
| Payable Cu | % | 96.5% |
| Transport to smelter | $/t concentrate | 39.00 |
| Smelter cost | $/t concentrate (dry) | 75.00 |
| Refining cost | $/lb | 0.08 |
| Silver | | |
| Payable Ag | % | 90% |
| Ag refining cost | $/oz | 0.40 |
| Other offsite costs35 | % | 1.0 |
| Costs | | |
| Mining cost | $/t mined | Modeled by bench |
| Processing cost | $/t milled | 4.45 |
| G&A Cost | $/t milled | 0.50 |
| Sustaining capital costs | $/t | $1.14 |
5 loss, insurance, commission
| SMD | Cumo S-k 1300 Technical Report | November 2022 |
Geologic 2CM027.001 CuMoCo. | Page 113 |
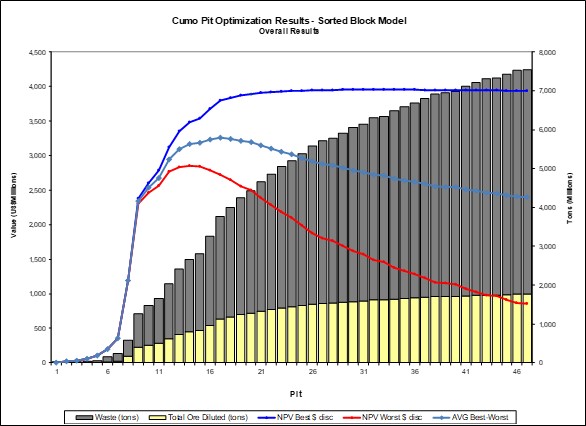
Source: SRK, 2019
Figure 16-3: Pit optimization results
| 13.2.6 | Pit Shell Selection |
The author reviewed the pit optimization results and with consideration of the pit shell NPVs as well as their shapes and quantities, selected the appropriate pit shells for the development of conceptual production schedules. No specific mine designs were created, nor were fully detailed schedules developed. The author considers this appropriate for schedules in a Initial assesment. The estimates of mined quantities for the phases representing the increment between pit shells are provided in Table 16-4. Mill feed after mineral sorting is also shown. This includes not only the mill feed product from bulk sorting, but also the same from particle sorting, using a mass pull on the bulk sort middlings of 40.8%.
Table 16-4: CuMo mined quantities
| Phase | Shell | Total | Waste | Sort Feed | Strip Ratio | Mill Feed |
| Mt | Mt | Mt | Mt | %MoS2 | %Cu | ppm Ag |
| 1 | 8 | 575 | 307 | 268 | 1.14 | 194 | 0.07 | 0.11 | 3.07 |
| 2 | 9 | 673 | 306 | 367 | 0.83 | 272 | 0.08 | 0.11 | 3.09 |
| 3 | 13 | 1,144 | 603 | 541 | 1.11 | 391 | 0.08 | 0.10 | 2.80 |
| 4 | 18 | 1,339 | 673 | 666 | 1.01 | 475 | 0.07 | 0.11 | 3.29 |
| 5 (final) | 23 | 883 | 536 | 347 | 2.07 | 250 | 0.08 | 0.09 | 2.61 |
| Total | | 4,615 | 2,425 | 2,190 | 1.12 | 1,582 | 0.07 | 0.10 | 3.00 |
| SMD | Cumo S-k 1300 Technical Report | November 2022 |
Geologic 2CM027.001 CuMoCo. | Page 114 |
The pit shells representing the five phases are illustrated in Figure 16-3 to Figure 16-6.

Source: SRK, 2019
Figure 16-4: CuMo pit phase shell outlines
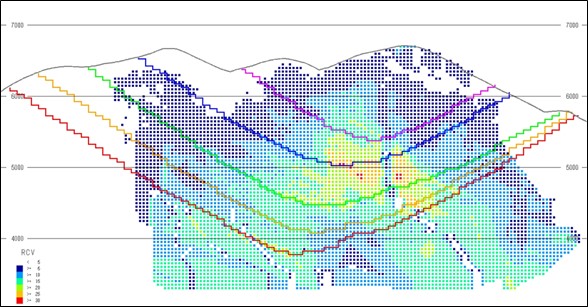
Source: SRK, 2019
Figure 16-5: CuMo pit phase shell east-west cross-section A-A’
| SMD | Cumo S-k 1300 Technical Report | November 2022 |
Geologic 2CM027.001 CuMoCo. | Page 115 |
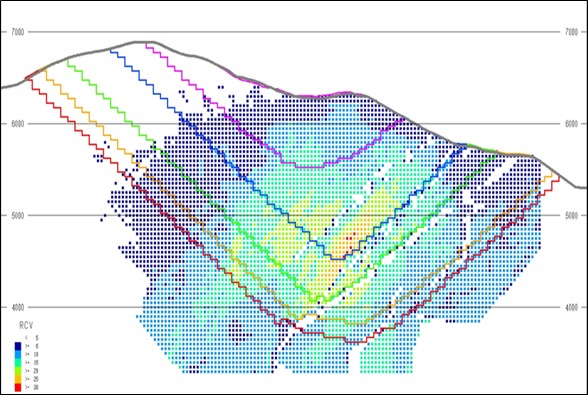
Source: SRK, 2019
Figure 16-6: CuMo pit phase shell north-south cross-section B-B’
The pit shells are mathematical derivations. During the pit design at later stages in the project, it is envisioned that some pit shells will be combined in certain sectors of the pit to ensure adequate mining widths. For CuMo, the northeast sector, constrained by Grimes Creek, would be such an instance.
| 13.3 | Waste Rock Facilities and Stockpile Design |
Waste rock is produced from two sources, run of mine waste and sort waste. Sort waste is generated during the mineral sorting process, both bulk and particle sorting, and will be used in construction of the TSF embankment, discussed in Section 18.6. Run of mine waste is transported from the pit to WRF in Charlotte Gulch and Clear Creek and is also used as construction material in the TSF embankment (refer to Figure 16-7).
WRFs are designed to ensure physical stability throughout the mine life and into perpetuity. Benching, drainage, geotechnical stability, operational efficiency, and closure are all factors considered during design of waste rock facilities. At the time of the Initial assesment, there was limited information available for geotechnical or geochemical assessments, but these are recommended for future study work.
| SMD | Cumo S-k 1300 Technical Report | November 2022 |
Geologic 2CM027.001 CuMoCo. | Page 116 |
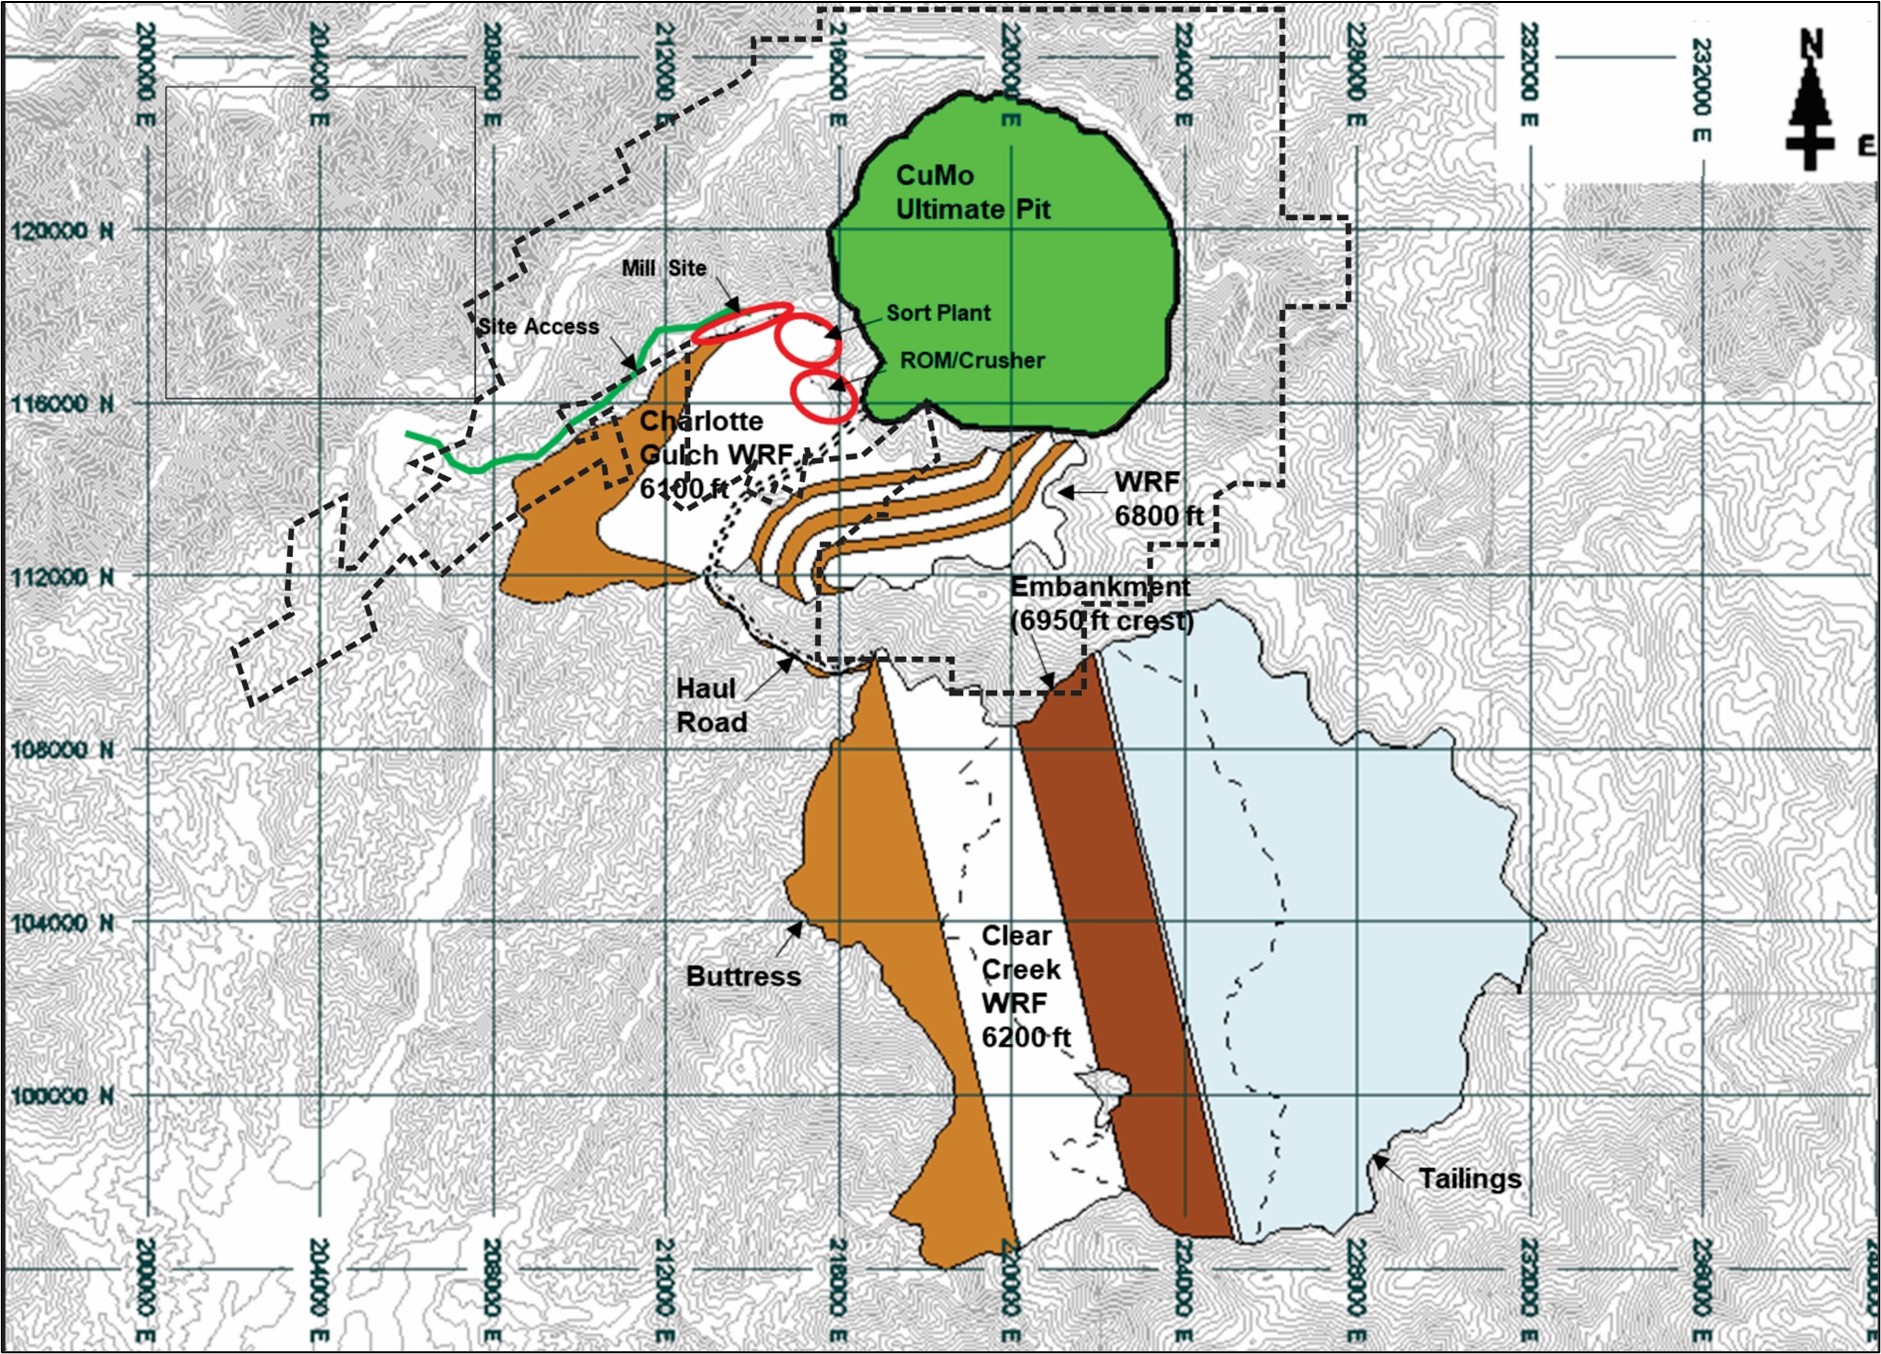
Source: SRK, 2019
Figure 16-7: CuMo mine layout
| SMD | Cumo S-k 1300 Technical Report | November 2022 |
Geologic 2CM027.001 CuMoCo. | Page 117 |
| 13.3.1 | Charlotte’s Gulch Waste Rock Facility |
The WRF in Charlotte Gulch, immediately to the south of the CuMo pit, is constructed by two methods. Upper bench waste from the initial phases of mining are placed in platforms following the east and south walls of Charlotte Gulch. The initial platform is at an elevation of 6,800 ft, followed by two wraparound platforms at elevations of 6,600 ft and 6,300 ft respectively.
The bulk of the waste rock in Charlotte Gulch is to be placed as a single platform at 6,100 ft elevation which is the approximate elevation of pit access. Toward the central and south portions of the WRF, the platform will increase to 6,200 ft in elevation to clear a height of land.
Clear Creek Waste Rock Facility
Run of mine waste rock will be hauled from the pit to the Clear Creek WRF which is buttressed against the tailings embankment also in Clear Creek. The buttress is designed to 6,200 ft elevation with a 3V:1H downstream slope. The WRF is intended to both provide additional waste storage capacity and to facilitate tailings embankment geotechnical stability and drainage.
The author developed a life-of-mine (LOM) production schedule based on satisfying a mill feed, after sorting of 150,000 stpd. After an initial build-up of 2.7 million tons, the mine plan maintained a stockpile inventory ahead of the sort plant of 0.2-0.8 Mt. Note that wherever possible, mill feed inventory should be maximized at the face in the pit to ensure heterogeneity is maintained. Another scheduling criterion was balancing haul truck hours, ensuring no spikes in required trucks.
The resulting mine production schedule is provided in Figure 16-8.
| SMD | Cumo S-k 1300 Technical Report | November 2022 |
Geologic 2CM027.001 CuMoCo. | Page 118 |
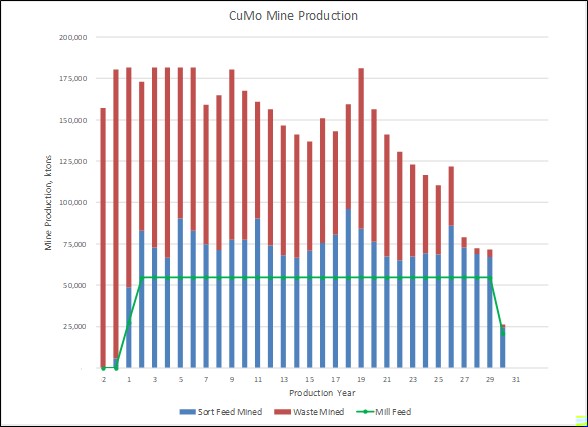
Source: SRK, 2019
Figure 16-8: CuMo LOM production schedule
The production schedule shows two years of pre-stripping, followed by a ramp-up year in mill feed (27.4 Mt). Steady stated production of 54.7 Mt or 150,000 stpd is achieved in year 2. Full production lasts 28 years, with a tail-off in year 30 of production.
| 13.5 | Equipment Selection and Fleet Requirements |
Owing to the magnitude of mine production, ultra-class mine equipment is to be considered at CuMo. As part of this, and in keeping with current trends in mine haulage, the author has considered the deployment of an autonomous haulage fleet. While extra costs are incurred for hardware on the trucks, a central control system, and associated licensing and technical support, the benefits of labor savings, increased utilization, and improved tire life and maintenance costs were applied. Additionally, the author considered the use of semi-autonomous drills, wherein one operator can operate three drills drilling autonomously.
The envisioned fleet of primary mining equipment at steady state production is provided in Table 16-5.
Table 16-5: CuMo primary mine equipment fleet
| Equipment Type | Size | Basis | Fleet Size |
| Rotary Blast Hole Drill | 15 in | Hole Diameter | 5 |
| Electric Cable Shovel | 100 t | Bucket Size | 4 |
| Autonomous Trucks | 400 t | Payload | 25-27 |
| Track Dozer | 21 ft | Blade Width | 6 |
| Rubber Tire Dozer | 21 ft | Blade Width | 3 |
| Grader | 24 ft | Blade Width | 4 |
| Water Truck | 45,000 gal | Water Tank | 3 |
| Backhoe | 5.0 yd3 | Bucket Size | 2 |
In addition to this primary mine equipment, ancillary equipment consisting of utility (small) earthmoving equipment, mobile equipment maintenance vehicles, light vehicles, dewatering pumps, and portable lighting are to be included for the project. But at this level of study, their costs will be factored from the primary equipment.
| SMD | Cumo S-k 1300 Technical Report | November 2022 |
Geologic 2CM027.001 CuMoCo. | Page 119 |
Unless otherwise stated, the sub-sections in this section were previously provided in the report, “Summary Report on the CUMO Molybdenum Property, Boise County, Idaho” (Giroux, Dykes, Place, 2015). The author have reviewed the underlying data, analytical work, and technical reports and have taken responsibility for this summary making edits as necessary. As well, The author has re-interpreted comminution test results in terms of kW/t to simulate grinding mill sizes.
The CuMo processing facilities and associated service facilities will process ROM (run-of-mine) feed delivered to the primary crusher, to produce separate copper and molybdenum concentrates, waste rocks, and tailings. The proposed process encompasses crushing the ROM feed, bulk sorting, particle sorting, grinding, bulk rougher and cleaner flotation, regrinding, molybdenum separation and dewatering of copper and molybdenum sulfide concentrates. Molybdenum concentrates will be further processed downstream in a roaster to produce a saleable molybdenum trioxide product. The roaster would comprise of a standard multiple hearth gas fired roasting furnace heating the concentrate to approximately 600 degrees centigrade. In order to protect air quality, the flue gases and dust from the roasting are processed to produce sulfuric acid, and rhenium if it is economic to do so. In the case of sulfuric acid, it is recovered through water with the use of absorption towers. In the case of rhenium it would be recovered through solvent extraction to produce ammonium perrhenate. The copper concentrate will be trucked from site for downstream processing at another facility outside the scope of this report. The flotation tailings will be thickened before placement in the TSF.
The present design incorporates three 50,000 stpd grinding lines with the ability to expand flotation and further downstream processes as needed. The process after mining comprises two stages: stage 1 includes a gyratory crusher, bulk sort conveyor diversion system, stockpile feed conveyor, and bulk sorted stockpiles, particle sort system, and another stockpile conveyor; stage 2 includes the sorted product stockpile, SAG and ball mill grinding circuit, bulk flotation circuit including regrind and cleaner flotation, copper and molybdenum separation flotation circuit, copper concentrate dewatering and load-out; molybdenum concentrate thickening, ferric chloride leach circuit, (molybdenum) filtration, drying, bagging and load-out, and tailings thickening and pumping facilities. Bagged molybdenum concentrate is roasted in a separate off-site roasting plant for conversion to molybdenum trioxide.
The concentrator will use a conventional grinding and flotation flow sheet and industry standard equipment. Plant operation will be monitored using a control system from a centrally located control room. Sampling and stream assay monitoring will be via an automated system linked to the control system.
The bulk sorting plant, located downstream of the primary crushers, would consist of a series of stages of splitting of streams, measuring their metal content, and then sorting. The schematic in Figure 17-1 shows the elements of a three-stage bulk sort plant.
| SMD | Cumo S-k 1300 Technical Report | November 2022 |
Geologic 2CM027.001 CuMoCo. | Page 120 |
However, prior to the sorting plant, there would be a diversion mechanism that would allow the crushed material to bypass the sorting plant. This would be for emergencies, to not disrupt the flow of material to the mill. A future improvement may be to place an analyzer on the conveyor belt after the primary crusher to determine whether crushed material needs to go to the sorting plant or not.
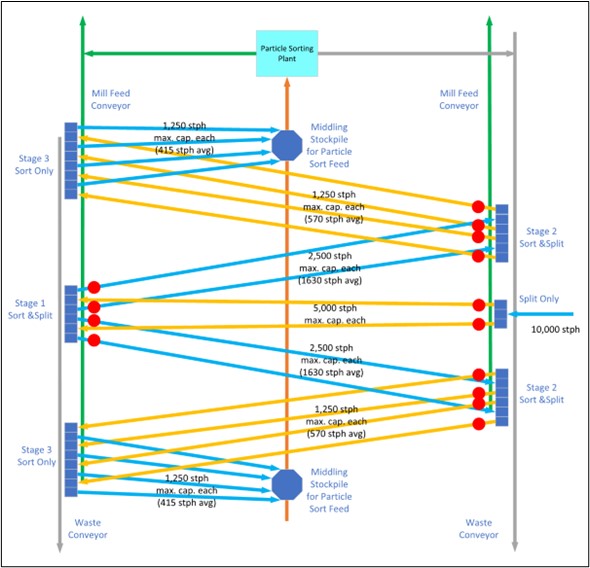
Source: Modified from CWA Engineers Inc., 2019
Figure 17-1: Schematic of three-stage bulk sorting plant with particle sorting
Material feeding the plant (nominally 10,000 tph) is immediately split in two, and two penetrative elemental analyzers, such as a prompt gamma neutron activation analysis analyzer, measure the stream. To make a measurement, such analyzers require a batch of material on the belt to average readings over. For instance, in the case of Scantech’s Geoscan analyzers, this is 30 seconds of belt travel time. The length of conveyor from this first analyzer position to the sorting point is dictated by this 30 second interval and the travel speed of the belt. So, a belt traveling at 12 ft per second would require a conveyor length of at least 360 ft between analyzer and sort point. Alternate technologies are being developed to shorten the required measurement interval.
| SMD | Cumo S-k 1300 Technical Report | November 2022 |
Geologic 2CM027.001 CuMoCo. | Page 121 |
At the sorting point, a signal is received from the analyzer to indicate what the approaching material consists of (mill feed, waste, or middlings). The rapid diversion mechanism then diverts the stream to receiving chutes and conveyors accordingly. Figure 17-2 illustrates a viable diversion system to facilitate the re-direction of a stream. As the intellectual property is not presently protected, details of the rapid diversion mechanism are omitted.

Source: Modified from CWA Engineers Inc., 2019
Figure 17-2: Schematic of bulk sorting diversion system
The CuMo sorting plant would consist of three stages of sorting. Each stage will produce mill feed, waste, and middlings products. The mill feed from each stage will be sent directly to the coarse mill feed stockpile in front of the mill, while the waste will be conveyed to a truck load out bin for delivery by haul truck to the TSF or WRF in Clear Creek.
The middlings portions become feed for subsequent sorting. To take advantage of the increased heterogeneity that comes with smaller scale (Section 13.2.2), the middling streams of the first and second sort are split in two to reduce the 30 second batch size (Figure 17-2). The third stage however will not have the middlings stream as this will next become feed for particle sorting.
| SMD | Cumo S-k 1300 Technical Report | November 2022 |
Geologic 2CM027.001 CuMoCo. | Page 122 |
In order to ensure maximum mill feed recovery, particle sorting using XRF based sorting machines would be done taking feed from stockpiles or bins containing the middlings from the third stage of the bulk sort (Figure 17-1). Values so recovered would be added to the mill feed conveyors shown.
Up to eight lines would feed 350 to 400 short tons per hour into particle sorting modules. Based on current XRF particle sorting technology, each module would consist of multiple sorters to handle different size fractions. These sorters are available from a number of vendors, and capacity per unit, per size fraction, ranges from about 50 to 200 short tons per hour depending on the particle size fed.
This study assumes four 100 short ton per hour units are required per line based on the current technological limitations on throughput. The sizing and selection of these units need to be confirmed later as part of a more advanced level of study.
| 14.4 | Mill Design Criteria Summary |
The remaining sub-sections were modified from the report, “Summary Report on the CUMO Molybdenum Property, Boise County, Idaho” (Giroux, Dykes, Place, 2015).
The overall approach was to design a robust process plant that could be scaled up and deliver good value for capital. The key project and specific criteria for the plant design and operating costs are provided in Table 17-1.
| SMD | Cumo S-k 1300 Technical Report | November 2022 |
Geologic 2CM027.001 CuMoCo. | Page 123 |
Table 17-1: Summary of the process plant design criteria (150 ktpd).
| Criteria | Units | Value |
| Sort Feed Capacity | | ktpd (short tons) | 250 |
| | | Mt/y (short tons) | 90 |
| Primary Crusher Availability | | % | 65% |
| Primary Crusher Throughput/ Feed | | t/h (short tons) | 16,000 |
| Primary Crusher Selection | Size | | 60 x 110 |
| | No. | | 3 |
| Mill Throughput/feed | | Mt/y (short tons) | 54.75 |
| Mill/Grinding and Flotation Availability | | % | 92% |
| Mill Throughput/feed | | t/h (short tons) | 6,793 |
| Total Power requirement | | MW | 186 |
| Physical Characteristics | BWI | kWh/t (tonne) | 15.8 |
| | SPI® | Mins | 84.5 |
| Grind Size | P80 | microns | 63 |
| Head Grade (Design) | | %Cu | 0.1 |
| | | %MoS2 | 0.11 |
| | | ppm Ag | 2.87 |
| Flotation Recovery (Cu-Ag Zone) | Copper | % | 64% |
| | Silver | % | 70% |
| | Molybdenum | % | 83% |
| Flotation Recovery (Cu-Mo Zone) | Copper | % | 85% |
| | Silver | % | 78% |
| | Molybdenum | % | 92% |
| Flotation Recovery (Mo Zone) | Copper | % | 72% |
| | Silver | % | 55% |
| | Molybdenum | % | 95% |
| Cu Circuit Residence Time | Roughers | Mins | 27.5 |
| | Cleaner 1 | Mins | 10 |
| | Cleaner Scav. | Mins | 2.5 |
| | Cleaner 2 | Mins | 10 |
| | Cleaner 3 | Mins | 5 |
| Mo Circuit Residence Time | Roughers | Mins | 35 |
| | Cleaner 1 | Mins | 25 |
| | Cleaner Scav. | Mins | 25 |
| | Cleaner 2 | Mins | 25 |
| | Cleaner 3 | Mins | 25 |
| Cu Concentrate Filtration Rate | | kg/m2/h | 262 |
| Concentrates Thickening Flux | | t/m2/h | 0.1 |
| Mo Concentrate Filtration Rate | | kg/m2/h | 356 |
| Tailings Thickening Flux | | kg/m2/h | 800 |
| Tailings Thickener Underflow Density | | % w/w | 65 |
| Collector Consumption (SIBX) | | g/t (short ton) | 66 |
| Collector Consumption (Aero 3302) | | g/t (short ton) | 59 |
| Activator Consumption (Moly Oil) | | g/t (short ton) | 51 |
| Frother Consumption (X-133) | | g/t (short ton) | 67 |
| Lime Consumption | | kg/t (short ton) | 0.18 |
| Flocculant Consumption | | g/t (short ton) | 15 |
| SAG Mill Media Consumption | | kg/t (short ton) | 0.25 |
| Ball Mill Media Consumption | | kg/t (short ton) | 0.55 |
| Regrind Mill Media Consumption | | kg/t (short ton) | 0.04 |
| SMD | Cumo S-k 1300 Technical Report | November 2022 |
Geologic 2CM027.001 CuMoCo. | Page 124 |
Detailed process design criteria incorporating the process mass balance, engineering design criteria and key sizing criteria, derived from the results of the metallurgical test-work program were determined and are summarized below.
The key criteria selected for the plant design are:
| | ● | Treatment of 150,000 stpd or 136,000 metric tonnes/day |
| | | |
| | ● | Design availability of 92% (at full capacity), being 8,059 operating hours per year, with standby equipment in critical areas, such as cyclone feed pumps and tailing pumps. |
| | | |
| | ● | Sufficient plant design flexibility for treatment of all mineralized zones at design tonnage |
| | | |
| | ● | The selection of these parameters is discussed in detail below |
| 14.6 | Throughput/Mill Feed and Availability |
One main throughput/mill feed scenario was nominated by CuMoCo to evaluate different corporate investment hurdles. The authors have nominated overall plant availability at 92% or 8,059 hours per year. This is an industry standard for a large, multi-train, SAG mill grinding and flotation plant with moderately abrasive mineralized material operating in a well serviced geographic region. Benchmarking indicates that similar plants have consistently achieved this level.
The overall processing strategy is to mine at high tonnage and send all mined material through a multi-stage sensor-based mineral sorting plant (including crushing, screening equipment, bulk and particle sorting). The sorting plant recovers the high-grade high profit rock and rejects marginal and waste rock. This allows the mill and tailings facilities to be significantly smaller while still producing high quantities of concentrate or similarly, can allow a mill of equal size to produce more total concentrate.
The mill process design is based on treating the different mineral types tested individually at the nominated design throughput/mill feed rates. Typically, the range in variability of material parameters such as SAG mill grinding hardness and head grade during process design are considered. However, due to the preliminary nature of the mining schedule, and the grinding and metallurgical test-work, the most competent and hardest of the three mineral types, identified by CuMoCo to date, have been used as the process design criteria.
| 14.8 | Flow Sheet Development and Equipment Sizing |
The process plant flow sheet design for the CuMo circuit was conceptually based on those of comparable large flotation plants. Figure 17-3 shows a process schematic for the CuMo plant. Details of the flow sheet design and selection of major equipment for the process are discussed in the sections below.
| SMD | Cumo S-k 1300 Technical Report | November 2022 |
Geologic 2CM027.001 CuMoCo. | Page 125 |
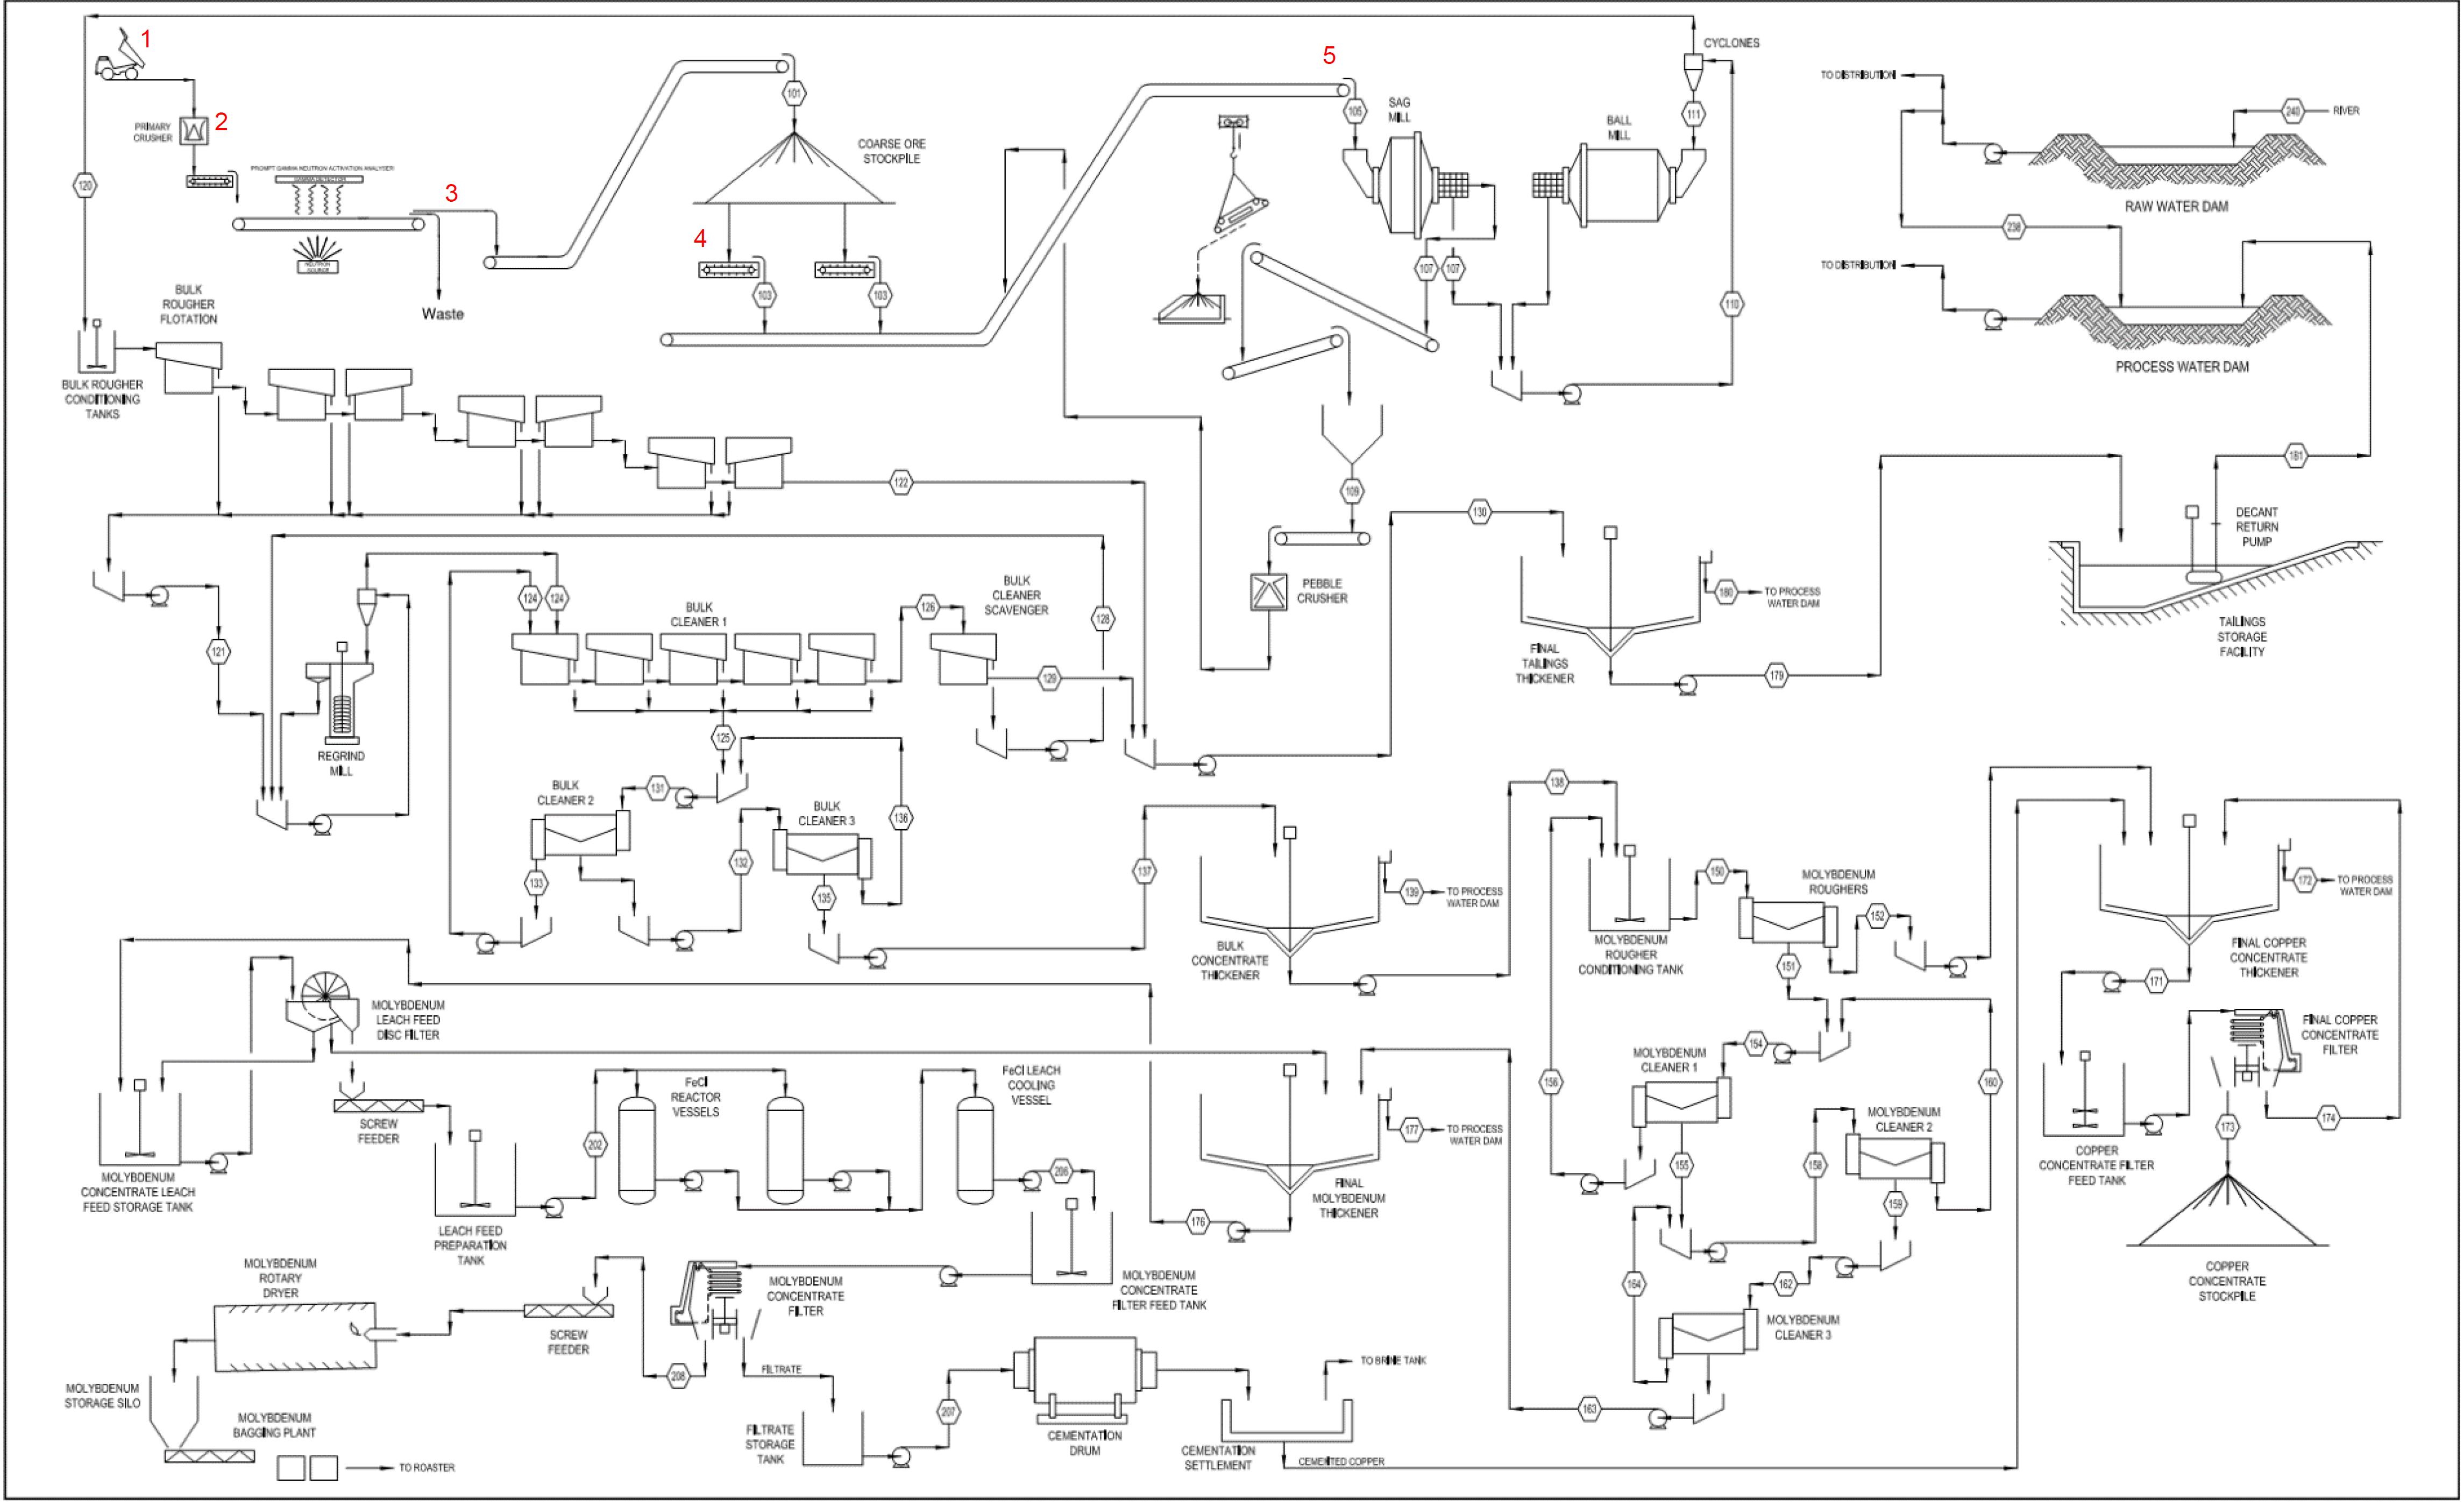
Source: Ausenco 2009 and modified by Sacré Davey 2018
Figure 17-3: CuMo process schematic
| SMD | Cumo S-k 1300 Technical Report | November 2022 |
Geologic 2CM027.001 CuMoCo. | Page 126 |
The flowsheet shown in Figure 17-3 was originally authored by Ausenco 2009 and modified by Sacré Davey to add a sorting system (upper left). The section to the left of the coarse material stockpile (4) is compressed, showing a single stage sorting plant instead of two stages, with storage between the bulk and particle sorting stages.
The schematic shows the process starting at the upper left corner with mining trucks (1) delivering the 250,000 stpd (thousand tons per day) sorting feed to a primary gyratory crusher (2) at the edge of pit, the output is then delivered to the bulk sorting plant which generates both a mill feed product that is conveyed to a coarse material stockpile and a middling product for particle sorting. The product from particle sorting combines with the bulk sort mill feed product in the coarse material stockpile. . The SAG mill feed from the coarse material stockpile (4) is conveyed into the SAG mills (5).
| 14.9 | Unit Process Selection |
The process plant design is based on a flow sheet with unit operations that are well proven in the sulfide flotation industry, incorporating the following unit process operations. Where considered practical, unit operations are sized to maximize the economies of scale possible with large equipment. The sorting system consists of the following unit processes. Mine sort feed (250,000 stpd) from the open pit is crushed using a primary gyratory crusher to a crushed product size of nominally 80% passing (P80) 120 mm and fed onto the bulk sort feed conveyor. A bulk sorting plant with PGNAA sensors divides the material into mill feed, middlings and waste piles. The middlings are further particle sorted, producing a waste stream and a mill feed stream which combines with the bulk sort mill feed in a course material stockpile. Waste from both sorting processes is loaded into trucks for disposal in the mine. The mill feed (150,000 stpd) is conveyed from the coarse material stockpile to the mill.
The general mill design consists of three 50,000 stpd modules. Each module typically consists of the following unit processes:
| | ● | Conical stockpile of crushed mill feed with a live capacity of 18 hours, with two apron feeders per grinding train, each capable of feeding 120% of the full mill throughput/mill feed |
| | | |
| | ● | A 22 MW SAG mill, 11.58 m (38 ft.) diameter with 7.60 m (25 ft.) EGL, in closed circuit with pebble crushing |
| | | |
| | ● | Pebble crushing will be comprised of two MP800s per grinding train, crushing to a product size of nominally 80% passing (P80) 12 mm |
| | | |
| | ● | Three 13 MW ball mills per grinding train, 7.32 m (24 ft.) diameter with 12.19 m (40 ft.) EGL, in closed circuit with hydrocyclones, grinding to a product size of about 80% passing (P80) 63 μm |
| | | |
| | ● | Bulk rougher flotation consisting of 200 m3 forced air tank flotation cells to provide a total of 28 minutes of retention time |
| | | |
| | ● | Rougher concentrate regrinding in three 1.0 MW vertical stirred mills per grinding train to a P80 of 10 μm |
| | | |
| | ● | Bulk cleaner 1 and cleaner scavenger flotation consisting of 20 m3 forced air tank flotation cells to provide a total of 13 minutes of retention time |
| SMD | Cumo S-k 1300 Technical Report | November 2022 |
Geologic 2CM027.001 CuMoCo. | Page 127 |
| | ● | Bulk cleaner 2 flotation cells consisting of 8 m3 trough shaped flotation cells to provide a total of 10 minutes of retention time |
| | | |
| | ● | Bulk cleaner 3 flotation cells consisting of 8 m3 trough shaped flotation cells to provide a total of five minutes retention time |
| | | |
| | ● | Bulk concentrate thickening in 11 m diameter high rate thickeners |
| | | |
| | ● | Molybdenum rougher flotation consisting of 8 m3 trough shaped flotation cells to provide a total of 35 minutes of retention time |
| | | |
| | ● | Molybdenum cleaner 1 consisting of 1.5 m3 trough shaped flotation cells to provide a total of 25 minutes of retention time |
| | | |
| | ● | Molybdenum cleaner 2 flotation cells consisting of 1.5 m3 trough shaped flotation cells to provide a total of 25 minutes of retention time |
| | | |
| | ● | Molybdenum cleaner 3 flotation cells consisting of 1.5 m3 trough shaped flotation cells to provide a total of 25 minutes retention time |
| | | |
| | ● | Copper concentrate thickening in a high rate thickener and filtration in a horizontal plate and frame pressure filter |
| | | |
| | ● | Molybdenum concentrate thickening in a high rate thickener |
| | | |
| | ● | Molybdenum ferric chloride leach in 4,000 U.S. gallon, glass lined steel leach reactors followed by drying and storage in bulk one-ton bags |
| | | |
| | ● | Tailings thickening in a high rate thickener to an underflow density of 65% solids |
| | | |
| | ● | TSF for process tailings in a conventional dam |
| | | |
| | ● | Raw process plant water supply from site water storage facility reticulated throughout the plant as required. (Harvesting and storage of raw water sufficient to allow continued water supply throughout the year is excluded from the study scope) |
| | | |
| | ● | Total water requirement estimated at an initial 190 acre-feet then 10% replacement rate per year due to losses in evaporation and concentrate etc. |
| | | |
| | ● | Process water dam and distribution system for reticulation of process water throughout the plant as required. Process water is supplied from water reclaimed from the TSF, from process operations and site run-off with raw water used as make-up water as required |
| | | |
| | ● | Potable water is generated by treatment of raw water in a reverse osmosis (RO) unit at the process plant. Potable water is distributed to the plant, and for miscellaneous purposes around the site |
| | | |
| | ● | Plant, instrument and flotation air services and associated infrastructure. |
| SMD | Cumo S-k 1300 Technical Report | November 2022 |
Geologic 2CM027.001 CuMoCo. | Page 128 |
| 15 | Project Infrastructure |
| | |
| 15.1 | General Layout |
Refer to the conceptual mine layout presented in Figure 16-8.
Two options for road access routing exist.
| | ● | Option 1 is to upgrade the existing gravel roads that come from Highway 55 near Horseshoe Bend via Placerville and Centreville. These roads are currently serviceable paved and gravel roads suitable for light-duty travel. An upgrade is required if concentrate haulage is to be undertaken. An extension to this route would have to be constructed to access the proposed plant site (Figure 16-8). The extension to the road would have to rise in elevation from RL 4,900 ft to RL 6,100 ft. At a maximum grade of 10%, this road is estimated to be approximately four miles long. No specific route has been identified, although the terrain through which the road would travel is rugged, and switchbacks are likely to be required in areas. |
| | | |
| | – | A subset of this option is to use the existing road from Idaho city to Centreville, but this does not appear to offer any significant benefits over the base assumption. |
| | | |
| | ● | Option 2 is to travel via Highway 55 and the Bank-Lowman road that is to the north of the project site. An existing bridge approximately 1.4 miles southeast of Garden Valley would be used to cross the Payette River and gain access to the South Fork Road. This road then follows the river to the east for approximately 6 miles. It is relatively level, generally sloping up to the east at 2% to 3%, following the river valley. Upgrades to this road are likely to be straightforward and relatively low cost. From there, the existing Grimes Pass Road leads south from the South Fork road (~four miles) to a location near the plant site. This road has consistent, but reasonably steep gradients of approximately 10%. Whilst not ideal, the gradients are potentially manageable for mine traffic including concentrate trucking with upgrades such as safety berms and run-away ramps. A similar extension of new road of four miles would have to be constructed as per Option 1. This route has the advantage over Option 1 of requiring much shorter haulage on non-sealed roads. A significant disadvantage of this route is that the haulage on sealed roads would both be visible to, and potentially affect recreational traffic on these roads. |
Regarding Option 2, socio-political opposition to industrial use of these roads is likely. Until this can be further studied, this option is not preferred, leaving Option 1 as the access for the purpose of this Initial assesment.
A rail line connecting to ports in Oregon runs north-south in the valley along-side Highway 55. Sidings are available at various locations.
The most suitable location for a concentrate loading facility for Option 1 is likely to be in or around the town of Horseshoe Bend. However, Horseshoe Bend is a residential town and community opposition may limit options with respect to the existing small rail yard in the town center, necessitating construction of a new siding and facility.
In the case of road access Option 2, building a loading concentrate loading facility near the junction of Highway 55 and Bank-Lowman road may be possible. An existing siding may be available for use. It is understood from discussions with CuMoCo that this area is heavily used for tourist activities including rafting.
| SMD | Cumo S-k 1300 Technical Report | November 2022 |
Geologic 2CM027.001 CuMoCo. | Page 129 |
For a single project using a concentrate loading facility, bulk concentrate handling may not be optimal. The use of “Rotainers” (sealed containers specifically designed for transport of concentrate) for truck, storage and rail transport may be an effective solution, particularly in terms of managing environmental effects. The author recommends that this option be included as an option in a PFS-level logistics study.
The overall availability of sufficient generating capacity is unlikely to be an issue as the project is proximate to significant power reticulation capacity. The project area is serviced by Idaho Power. No suitable power lines currently run near to the project, but Idaho Power have indicated an intention to install transmission lines to the vicinity of Placerville to the Southwest (ten miles), and to the vicinity of Garden Valley to the Northeast (nine miles). Consideration should be given to the provision of back-up power for critical systems. For example, back-up generation to allow the clearing of pipelines, flotation cells, thickeners and tailings management systems to prevent costly blockages and delays is generally able to be justified.
Water is likely to be available (subject to licenses) from the Payette River two miles north of the project. The intervening terrain is rugged, and the pipeline route is likely to be significantly longer than the direct distance. An assumption of five miles of supply pipeline was made for the purposes of costing. The river can potentially supply water year-round, and accordingly a surge tank, rather than extensive water storage has been assumed at the project site. A water supply trade-off study is assumed to be undertaken as part of the PFS.
| 15.6 | Tailings Storage Facility |
The tailings storage facility will be located at the headwaters of the Clear Creek watershed, in a natural basin formed by the surrounding ridgeline. The TSF will have capacity to store the 1,582 Mt (~900M m3) of tailings produced, over the 30-year mine life, with an ultimate crest height of 6,950 ft. A starter dam will be constructed to elevation 6,300 ft to facilitate early mine production, followed by an additional five raises spread out over the life of the mine.
Tailings will be piped to the TSF and deposited as conventional slurry from the dam crest. The settled tailings density is assumed to be 1.6 tonnes/m3 and beach slope angles are assumed to be 1-2% for sub-aerially deposited tailings. The water reclaim pond will form against the natural terrain upstream of the dam. The tailings have not tested positive for potential acid generation; however, there is potential for metal leaching.
| SMD | Cumo S-k 1300 Technical Report | November 2022 |
Geologic 2CM027.001 CuMoCo. | Page 130 |
| 15.6.1 | Tailings Embankment |
The embankment is designed as downstream construction for geotechnical stability, with the starter dam placed on bedrock. Slopes will be 2.5H:1V on the upstream and 3H:1V on the downstream. The crest of the embankment will be 170 ft wide to accommodate vehicles and equipment. Sort waste and run of mine waste constitute the construction material, transported by haul truck, and then compacted in three-foot lifts
A starter dam is designed to a crest height of 6,300 ft to facilitate the first two years of tailings. The foundation for the started dam will be cleared and overburden stripped to bedrock. The overburden will be stockpiled for use in future reclamation of the waste facilities. Five additional lifts will be constructed to an ultimate crest height of 6,950 ft. A freeboard of 25 ft will be maintained throughout the mine life.
A waste storage facility will buttress the downstream of the embankment up to 6,200 ft elevation providing additional geotechnical stability.
Figure 18-1 and Figure 18-2 show the TSF and WRF concepts.
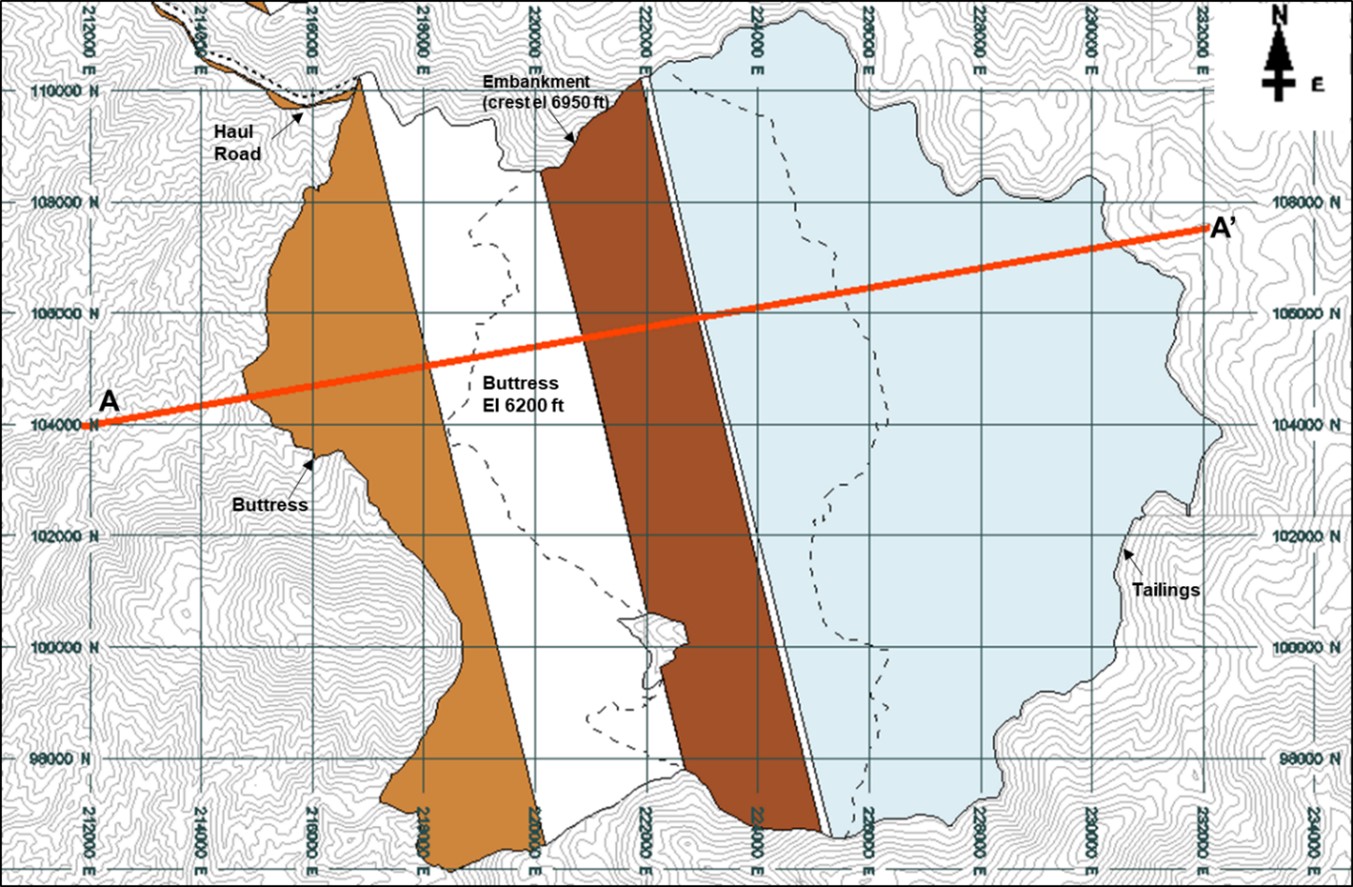
Source: SRK, 2019
Note: Tailings site, which is located on federal land, is shown in Figure 16-7 relative to property boundary
Figure 18-1: CuMo Clear Creek TSF and WRF buttress

Source: SRK, 2019
Figure 18-2: Cross-section A-A’ through Clear Creek TSF and WRF buttress
| 15.6.2 | Tailings Impoundment |
The tailings impoundment will facilitate an ultimate capacity of 950M m3 (900M m3 required for LoM) of tailings assuming a density of 1.6 tonnes/m3. Construction of the impoundment area will include the removing of topsoil and vegetation and compacting the exposed fine-grained soils. Tailings will be discharged from the crest of the dam, limiting seepage through the dam. Due to the tailings deposition plan and overall configuration of the TSF it is not expected that a synthetic geomembrane will be required for containment of tailings.
| SMD | Cumo S-k 1300 Technical Report | November 2022 |
Geologic 2CM027.001 CuMoCo. | Page 131 |
| 16 | Market Studies and Contracts |
| | |
| 16.1 | Market Analysis |
For the purpose of this study, it has been assumed that two concentrates (copper and molybdenum) will be produced with the copper concentrate grading >23% copper sold and shipped to a smelter within the Pacific region, Japan, China, Korea or India for example. The molybdenum concentrate (grading >50% Mo) will be shipped to a roaster controlled by the project where additional credits may be achieved through the production of rhenium and sulfuric acid. Readers should note that no penalty elements have been identified to date. At the current time, no contracts exist for delivery of final product so the report assumes that products will be sold on the open market.
| 16.1.1 | Treatment and refining costs |
Treatment and refining charges, metal payability and settlement terms are assumed based on recent published values from current contracts with Asian smelters for the copper concentrate (Freeport-McMoran, First Quantum), while the costs associated with molybdenum are based on published toll milling charges which are higher than for the project’s own roaster and therefore considered conservative. Details of these charges were previously reported in Table 16-3.
Prices used are based on historical averages and reasonable future price projections published. Copper and silver are openly traded on a daily basis on terminal markets. Molybdenum pricing requires additional research and analysis, as the often-quoted London Metal exchange pricing does not reflect current pricing accurately. Roskill’s and Platts show the trading price of molybdenum. The authors have identified that London Metals Exchange pricing can be many months out of date as metal buyers and sellers of molybdenum tend to avoid this relatively new market and associated fees.
CPM Group Molybdenum Market Outlook 2017 and 2018 shows the price of molybdenum is controlled by the largest producer which is China and their average cost to produce is between $12 and $13 per pound molybdenum. Their professional estimate of the price of molybdenum moving forward in the next five years is in the range of $12 to $20 per pound. The author, for the purposes of this Initial assesment, have assumed pricing of $15 per pound of molybdenum metal for project economics.
A significant proportion of world-wide molybdenum is produced as a byproduct of base-metals production. This can lead to a “disconnect” of supply and demand in the market, thus causing significant price volatility.
| SMD | Cumo S-k 1300 Technical Report | November 2022 |
Geologic 2CM027.001 CuMoCo. | Page 132 |
| 17 | Environmental Studies, Permitting, and Social or Community Impact |
| | |
| 17.1 | Environmental and Permitting |
| | |
| 17.1.1 | Past and Present Permitting for Exploration Project |
ICMC’s predecessors submitted an exploration plan of operations in 2007 to the USFS for exploration activities resulting in about 20 miles of drill road of which 4.7 miles were existing unauthorized drill roads from previous operators and 13.3 miles of new temporary roads. An environmental assessment was prepared by the USFS. ICMC was initially issued the Decision Notice /Finding of No Significant Impact (2011 DN/FONSI) by the USFS in February 2011. A lawsuit was filed against the project by the Idaho Conservation League in July 2011. On August 29, 2012, the United States District Court of the District of Idaho (Court) ordered, “that the Defendant Forest Service’s decisions regarding groundwater made in the 2011 Environmental Assessment [be] vacated and the matter …remanded to the Forest Service for further proceedings consistent with this opinion…” (USFS 2018). The USFS moved forward with the preparation of a Supplemental Environmental Assessment to undertake further analysis of groundwater and, as needed, address new information/changed circumstances since the 2011 DN/FONSI was issued (e.g., change in status of the wolverine from a regional sensitive species to an Endangered Species Act proposed listed species) (USFS 2018).
The supplemental DN/FONSI (SDN/FONSI) addressing the 2011 Court order and other changes summarized above was signed on September 30, 2015. Plaintiffs from the 2011 lawsuit again filed a lawsuit challenging the 2015 supplemental decision in January 2016. The lawsuit challenged the analysis of potential effects of exploration activities to groundwater and Sacajawea’s bitterroot, a sensitive plant species. The Court issued the memorandum decision and order in this lawsuit on July 11, 2016. The Court upheld the SDN/FONSI as to the NEPA challenges related to groundwater, so no further analysis was required. The Court found that the Forest Service’s analysis and conclusions concerning Sacajawea’s bitterroot to be arbitrary and capricious because it failed to re-examine the baseline Sacajawea’s bitterroot population6 in the project area following the 2014 Grimes Fire and subsequent 2016 Pioneer Fire (USFS 2018).
As occurred in response to the 2014 Grimes Fire, each resource area addressed in the 2015 CuMo Exploratory Project Supplemental Environmental Assessment were affected differently. Similar to the updates made in response to the 2014 Grimes Fire, updates were made in the 2018 Supplemental Redline Environmental Assessment CuMo Exploration Project (Supplemental Redline Environmental Assessment) to address the change in baseline conditions caused by the 2016 Pioneer Fire. The Supplemental Redline Environmental Assessment focused on the re-evaluation of the Sacajawea’s bitterroot baseline, as well as other resources addressed in the 2015 Supplemental Environmental Assessment that were affected by the 2016 Pioneer Fire, to determine whether effects conclusions reached in the 2015 SEA that supported the 2015 SDN/FONSI were different or changed. The Supplemental Redline Environmental Assessment focused only on these topics because the Court determined that other concerns raised during the 2012 and 2015 lawsuits were properly addressed and the evidence and analysis in the 2015 Supplemental Environmental Assessment and supporting project record supported the determination that no significant impacts would occur to other resources from proposed management activities (USFS 2018).
6 The 2017 Sacajawea’s bitterroot survey was occurred within a ten-mile radius and located previously unknown populations totaling about 17,000 plants in six locations (USFS 2018).
| SMD | Cumo S-k 1300 Technical Report | November 2022 |
Geologic 2CM027.001 CuMoCo. | Page 133 |
A number of environmental studies were undertaken for the 2011 Environmental Assessment CuMo Exploration Project and subsequently revised in 2015 and 2018. The Supplemental Redline Environmental Assessment incorporated habitat changes and resulting impacts related to the 2014 Grimes Fire and the 2016 Pioneer Fire. The following reports supported the preparation of the 2018 EA. Some of these updated reports and some earlier reports can be accessed on https://www.fs.usda.gov/project/?project=52875:
Stantec. Pollinator Habitat Assessment Report CuMo Exploration Project. February 2018
______, Pollinator Habitat Assessment Report CuMo Exploration Project. October 2018
______. Tetra Tech. Sacajawea’s Bitterroot and Other Sensitive Plant Survey Report. Prepared for Forsgren Associates Inc on Behalf of American CuMo Mining Corporation in support of the CuMo Exploration Project. July 2015
______. Sacajawea’s Bitterroot Baseline Survey Report. Prepared for Idaho CuMo Mining Corporation in support of the CuMo Exploration Project. July 2016
______. Sacajawea’s Bitterroot Baseline Survey Report. Prepared for Idaho CuMo Mining Corporation in support of the CuMo Exploration Project. September 2017
______. Sacajawea’s Bitterroot Known Occurrence Survey Report. Prepared for Boise National Forest in support of the CuMo Exploration Project. September 2017
USFS. Grimes Creek and Mohawk Gulch surface water sampling results, October 2017
______. CuMo Exploration Project 2015 Supplemental EA and Decision Notice/FONSI Supplemental Information Report. Prepared by the USDA FS, November 15, 2017
______. Geologic Hazards, Soils, and Water Resources Technical Report for the CuMo Project. February 2011, revised November 2018
______. Fisheries Survey Specialist Report for the CuMo Exploration Project. April 2011, revised November 2014 and September 2018
______. Wildlife Specialist Report and Biological Evaluation for Threatened, Endangered, and Sensitive Terrestrial and Avian Species for the CuMo Exploration Project. February 2011, revised February 2015 and September 2018
______. Wolverine Addendum to the Wildlife Specialist Report and Biological Evaluation for Threatened, Endangered, and Sensitive Terrestrial and Avian Species for the CuMo Exploration Project. August 2013, revised February 2015 and September 2018
U.S. Fish and Wildlife Service. CuMo Exploration Project, Updated list of threatened and endangered species, Consultation Code: 01EIFW00-2015-SLI-0236. January 28, 2015, updated March 21, 2018, and updated November 9, 2018.
| SMD | Cumo S-k 1300 Technical Report | November 2022 |
Geologic 2CM027.001 CuMoCo. | Page 134 |
Vizgirdas, E.R. 016. CuMo Site Visit – 10/27/16: Pioneer Fire Effects in Lewisia acajaweana (LESA) Plant Conservation Area (PCA). Field notes prepared for and available through the Boise National Forest Supervisor’s Office.
The USFS is currently in process of preparing the final decision which is expected in early 2020.
In June of 2017, the Boise National Forest issued ICMC a Road Use Permit to perform road maintenance on National Forest Service roads 382C, 397, and 397B using best management practices. The road maintenance work was completed in June and July of 2017 (USFS 2018).
| 17.2 | Permitting for Mining Operations |
Environmental permitting for mines in Idaho is predicated on land status. Because the mine will be located on public land administered by the U.S. Department of Agriculture – Forest Service, Boise National Forest, Idaho City Ranger District and patented claims (private land owned and controlled by ICMC), the permitting path will involve multiple state and federal agencies as shown in Table 20-1. A more complete list can only be prepared after the mining plan of operations is complete.
| 17.2.1 | Federal Authorizations and Permits |
Exploration and mining on lands administered by a federal agency, in this case the USFS, requires authorization to conduct surface-disturbing activities. Mining for locatable minerals on lands administered by the USFS are guided by 36 Code of Federal Regulations Part 228. These regulations require that a mining plan of operations (Plan) be prepared for any operation likely to cause significant disturbance of surface resources. The Plan must provide a detailed description of construction, operations, closure, and reclamation of the proposed mining operation as well as a reclamation cost estimate. Detailed technical documents to support the Plan can include but not be limited to engineering designs for the open pits, processing plants, waste rock dumps, tailings storage facilities, access roads, power supplies, and water supplies.
The “complete” Plan has to provide sufficient detail in order to identify and disclose potential environmental impacts during the mandatory NEPA review process, under which the potential impacts associated with project development are analyzed. The most likely level of NEPA analysis for this project will be an EIS which is a public disclosure document, not a permit or approval document. An EIS is intended to disclose any environmental impacts that may occur from the project and guide the decisions of the public land managers. The USFS will most likely require that an EIS be prepared for the project due to:
| | ● | Size of the operation |
| | | |
| | ● | If the proposed project is expected to have significant impacts to a critical elements or resources |
| | | |
| | ● | If a large potential for use of or impacts to surface water and/or groundwater exists |
| | | |
| | ● | If non-governmental organizations or public opposition is expected to be significant |
| SMD | Cumo S-k 1300 Technical Report | November 2022 |
Geologic 2CM027.001 CuMoCo. | Page 135 |
Table 20-1: Major permits and authorizations that may be required1
| Name | Authorizing Agency |
| Federal Permits and Authorizations |
| Mining Plan of Operations | USFS |
| EIS Review and Approval | USFS, U.S. Environmental Protection Agency, and U.S. Army Corps of Engineers |
| Approved Mining Plan of Operations/Record of Decision | USFS |
| Rights-of-Way for water/power/access corridors outside of Mining Plan of Operations boundary | USFS and/or other federal and state agencies |
| Clean Water Act Section 404 Wetland Permit | U.S. Army Corps of Engineers |
| Threatened and Endangered Species Consultation and Compliance with the Endangered Species Act | U. S. Fish and Wildlife Service |
| Compliance with the Bald Eagle Protection Act | U. S. Fish and Wildlife Service |
| Permit for Purchasing Explosives | Department of Homeland Security |
| Mine Safety | Mine Safety and Health Administration |
| Idaho State Permits and Authorizations |
| Stream Channel Alteration Permit | Idaho Department of Water Resources |
| Water Right Appropriation |
| Dam Safety Permit |
| Reclamation Plan Approval | Idaho Department of Lands |
| Title V Operating Permit | Idaho Department of Environmental Quality – Air Quality Division |
| Approval of Plans for a New Sewage Treatment Facility | Idaho Department of Environmental Quality – Water Quality Division |
| Compliance with the Safe Drinking Water Act |
| Clean Water Act 401 Certification |
| Idaho Point Discharge Elimination Permit |
| Solid Waste Management | Idaho Department of Environmental Quality – Waste Management & Remediation Division |
| Transportation and Storage of Hazardous Materials, Chemicals and Fuel Permits | Idaho Department of Transportation |
| Consultation with State Historic Preservation Officer | Idaho State Historic Preservation Office |
| Local |
| Building Permits | Boise County |
| Road Maintenance Agreement |
| Conditional Use Permit |
1 No permit applications in relation to mining have been filed to date.
| SMD | Cumo S-k 1300 Technical Report | November 2022 |
Geologic 2CM027.001 CuMoCo. | Page 136 |
An EIS must consider possible impacts to the following critical elements and resources:
| | ● | Critical elements – Air quality, aquatics, floodplains, cultural resources, environmental justice, migratory birds, Native American religious concerns, non-native invasive species, threatened and endangered species, solid and hazardous wastes, hydrology including geochemistry, wetlands, and wilderness. |
| | | |
| | ● | Resources – Soils, geohazards, roadless areas, vegetation, forestry, geology/mineralogy, paleontology, hazardous materials, lands and access, livestock/grazing, recreation, scenic values and noise, socioeconomics, and transportation. |
The USFS will require that baseline environmental surveys be conducted which will likely be above and beyond those conducted for the exploration activities. On-the-ground surveys will typically include: cultural resources; vegetation and animal biological resources including threatened, endangered, and sensitive species and migratory birds; soils resources; noxious and invasive species; jurisdictional waters; and hydrology, including geochemistry. These surveys, prepared in accordance with federal and state protocols, will identify the presence or absence of a particular resource and be used as the baseline to assess potential impacts. The same level of study will be required for any rights-of-way for new/improved access roads and water/power line corridors outside of the Plan boundary.
Other resources that will likely have to be addressed via desktop studies and stakeholder consultation include but are not limited to: Native American religious concerns, environmental justice, paleontology, livestock grazing, recreation, wilderness, and lands with wilderness characteristics.
The requirements of the Plan document are fairly well-defined. However, virtually all of the baseline data collection necessary for the impact assessment phase of the project will need to be collected, analyzed and interpreted in conjunction with the USFS in order to ensure that the information collected meet the data quality objectives of the program. A listing of the types of studies that should be undertaken during the mine planning phase and in advance of the NEPA process and in support of the acquisition of various other permits, could include:
| | ● | Biological resources |
| | | |
| | ● | Cultural resources of all areas proposed for disturbance unless the area has been surveyed within the past ten years |
| | | |
| | ● | Hydrogeological assessment (may include impact modeling including potential for pit lakes) |
| | | |
| | ● | Jurisdictional waters and wetlands |
| | | |
| | ● | Geochemical characterization of mill feed, waste rock, spent mill feed) |
| | | |
| | ● | Air quality/meteorological parameters |
| | | |
| | ● | Traffic study |
| | | |
| | ● | Environmental justice/socioeconomics |
The length of time to prepare an EIS varies with the complexity of the project. The USFS is in the process of revising its NEPA procedures to reduce the time and cost of project analysis and decision making, increasing the scale of analysis, accomplishing more work on the ground, and creatively designing new ways to care for the land. The project proponent is also expected to enter into a cost recovery agreement with the USFS for the development of the EIS for specialist time as well as pay a third-party contractor to prepare the EIS.
| SMD | Cumo S-k 1300 Technical Report | November 2022 |
Geologic 2CM027.001 CuMoCo. | Page 137 |
ICMC will have to provide adequate operational and baseline environmental information for the USFS to analyze potential environmental impacts as required by the NEPA and to determine if the mining plan of operations will prevent significant impacts to the environment. Insufficient baseline data will slow down the EIS process. The same types of baseline information and level of detail collected for the proposed mine will also have to be collected for the alternatives analyzed in the EIS. Baseline information will also have to be developed for rights-of-way for power and water line corridors, and access roads where applicable.
During the EIS process, applicant-committed environmental protection measures and mitigation measures will be identified for the various resources and become part of the mining plan of operations and record of decision. These measures will be used to monitor and mitigate potential impacts.
Other federal agencies, namely the U.S. Army Corps of Engineers, Environmental Protection Agency, and the U. S. Fish and Wildlife Service, may be involved in the EIS process as cooperating agencies; state agencies can also be cooperating agencies. The U.S. Army Corps of Engineers may require permitting under Section 404 of the Clean Water Act if jurisdictional waterways are affected by the mine development. The U.S. Fish and Wildlife Service will become involved if the mine has the potential to affect threatened and endangered species.
| 17.2.2 | Idaho State Authorizations and Permits |
As shown in Table 20-1, a number of Idaho state authorizations and permits will also be required from at least five different Idaho state departments and divisions. Much of the information developed for the federal permitting process can be used to obtain the state permits. Idaho agencies typically process complete applications within the EIS process time frame.
| 17.2.3 | Boise County Permits |
The Boise County Zone and Development Ordinance is applicable, and a Conditional Use Permit is required for mining activities on federal land located in Boise County.
Environmental resources within the project area will be monitored prior to mine construction to develop baseline conditions, and during mining operations, reclamation, closure, and post-closure. Resources typically monitored include: climate and air quality; surface and ground water quality and quantity; geochemistry and management of ore, waste rock, and tailings; fisheries, wildlife, noxious weeds and invasive species; effectiveness of stormwater controls, and reclamation success.
During the federal and state permitting processes, ICMC will develop specific monitoring plans that incorporate state and federal monitoring requirements. The monitoring plans must meet the following objectives:
| | ● | Demonstrate compliance with the approved plan of operations and other federal or state environmental laws and regulations. |
| | | |
| | ● | Provide early detection of potential problems, and to supply information that will assist in directing corrective actions should they become necessary. |
| | | |
| | ● | Provide details on type and location of monitoring devices, sampling parameters and frequency, analytical methods, reporting procedures, and procedures to respond to adverse monitoring results. |
| SMD | Cumo S-k 1300 Technical Report | November 2022 |
Geologic 2CM027.001 CuMoCo. | Page 138 |
The TSF will typically be monitored during construction, operation, closure, and post-closure to verify compliance with design specifications, operating conditions, water management, water quality, and reclamation success as required by Idaho regulations and USFS authorizations. Geochemical characterization of waste rock, ore, and tailings will also be undertaken prior to and during mining to guide dump and stockpile designs, stormwater controls, and monitoring. Post-closure monitoring of the waste rock dumps and TSF will be performed in compliance with federal and state permits.
Mine tailings impoundment structure designs in Idaho are regulated under IDAPA 37.03.05 by the Idaho Department of Water Resources. ICMC will have to post a bond to provide a means by which the TSF can be placed in a safe maintenance-free condition if abandoned by the owner without conforming to the approved abandonment.
| 17.4 | Reclamation |
| | |
| 17.4.1 | Federal Reclamation Performance Bond |
The USFS will require a reclamation performance bond under 36 Code of Federal Regulations 228A that calculates costs based on the assumption that the operator defaults, and the USFS must complete reclamation activities. Idaho has a memorandum of understanding which allows the state to recognize valid bonds held by the USFS as long as such bonds are in an amount as great as or greater than the required state bond. The USFS will accept the following bond instruments: negotiable Treasury bills and notes which are unconditionally guaranteed as to both principle and interest in an amount equal at their par value to the penal sum of the bond; or certified or cashier’s check, bank draft, post office money order, cash, assigned certificate of deposit, assigned savings account, blanket bond, or an irrevocable letter of credit equal to the penal sum of the bond. The bond will have to be posted prior to surface disturbance occurring.
| 17.4.2 | State Reclamation Performance Bond |
A reclamation plan and reclamation cost estimate will also have to be prepared for the project in accordance with Idaho Administrative Procedures Act 20.03.02. Prior to beginning any surface mining on a mine panel covered by a Plan, an operator must submit to the director, on a surface mining reclamation bond form, a performance bond meeting the requirements of this rule. The amount must be the amount necessary to pay the estimated reasonable costs of reclamation required under the reclamation plan for each acre of land to be affected during the first year of operation, plus ten percent. The actual cost of reclamation must not exceed $15,000 per acre of land to be affected. The reclamation bond may be in the following forms: corporate surety bond, collateral bond, or a letter of credit. The bond will have to be posted prior to surface disturbance occurring.
If ponds or lakes are created during the mining process and will remain after reclamation is completed, the Idaho Department of Water Resources requires the operator or landowner to obtain a water right. If a water right cannot be obtained prior to a plan being submitted, then the reclamation plan must include backfilling to an elevation above the local ground water table. Bond calculations must include those backfilling costs.
| SMD | Cumo S-k 1300 Technical Report | November 2022 |
Geologic 2CM027.001 CuMoCo. | Page 139 |
| 17.5 | Social and Community Impact |
ICMC has initiated consultation with various stakeholders namely: government officials at all levels and local communities in regard to the potential social and community impacts or improvements that may occur as the project progresses. All groups are provided regular updates as the project is proceeding (Hilscher et al, 2018).
The project is active in all local communities and for example has been in discussion and committed, subject to proceeding to mine development, to the restoration and reclamation work of the contaminated placer gold dredge tailing that currently are present in the Grimes Creek. Local communities and officials have come out in strong support of the project and are actively working with the project on both the Grimes Creek project and future planning (Hilscher et al, 2018). The contaminated dredge tailings are not located on the CuMo property that is the subject of this technical report. There are no negotiations or agreements with the local communities at this time.
Federal and state planning and permitting processes mandate that the public have an opportunity to provide input. ICMC, in coordination with federal and state agencies, will engage with the public during these mandated public scoping and comment periods. Furthermore, ICMC will have the opportunity to engage with stakeholders and local communities outside of the permitting processes in order to define potential infrastructure and community support needs. Until ICMC presents an actual mining plan of operations for community feedback, there is no additional reasonably available information to disclose.
Typically, small communities have competing social concerns when a mine is planned in the vicinity, i.e., the need for jobs versus changes to the fabric of the community resulting from an influx mining and contractor employees. Potential social issues that could arise from the CuMo project could generally include:
| | ● | A shortage of temporary and permanent housing |
| | | |
| | ● | Insufficient of capacity of schools, health care, law enforcement, solid waste disposal, and municipal infrastructure |
| | | |
| | ● | Insufficient road network capacity leading to traffic slowdowns and degradation of road surfaces |
| | | |
| | ● | Increases in crime, drug abuse, and alcoholism |
The public will have multiple opportunities to provide comments during the federal and state scoping and comments periods. In the past, ICMC has engaged with the nearby communities concerning the exploration project. This practice is expected to continue during mine development which will allow ICMC and the communities to identify salient issues and work towards resolution.
| SMD | Cumo S-k 1300 Technical Report | November 2022 |
Geologic 2CM027.001 CuMoCo. | Page 140 |
The 2011 Environmental Assessment, 2015 Supplement Environmental Assessment, and the 2018 Supplemental Redline Environmental Assessment identified resource values that occurred or had the potential to occur in the CuMo project area that may affect mine permitting by changing the habitat and/or affecting individuals. These resource values included:
| | ● | The presence of Sacajawea’s bitterroot, a sensitive plant species. Just over two dozen populations of Sacajawea’s bitterroot are known to exist, roughly three-fourths of them on the Boise National Forest (USFS 2019). |
| | | |
| | ● | The potential for a number of rare plant habitat for other sensitive and watch plant species exists. |
| | | |
| | ● | The Canada lynx (Lynx canadensis) is listed under the Endangered Species Act with potential habitat in the project area. |
| | | |
| | ● | The wolverine (Gulo gulo) was proposed for listing as a threatened species under the Endangered Species Act in 2016 with potential habitat in the project area. |
| | | |
| | ● | Other USFS sensitive species have potential habitat within the project area: boreal owl (Aegolius funereus), flammulated owl (Psiloscops flammeolus), great gray owl (Strix nebulosi), mountain quail (Oreortyx pictus), northern goshawk (Accipiter gentilis), white-headed woodpecker (Picoides albolarvatus), grey wolf (Canis lupus), bull trout (Salvelinus confluentus), and wolverine. |
Fresh water supply from surface or ground water will likely be one of the most difficult hurdles to overcome. An estimated 30,000 gpm of fresh water could be required. All water in Idaho is owned by the public; holding a water right does not give the water user ownership of the water. A water right simply gives the user the right to divert water. All water rights in Idaho exist for beneficial uses. The project will be located in Basin 65 which includes the entire Boise River Drainage (IDWR, 2018).
At this time and based on the undertaken studies, no issues could be identified that would materially impact the ability to eventually extract mineral resources at the project; however, ICMC should be prepared to address potential issues associated with but not limited to:
| | ● | Water including supply, water rights, and delivery system and potential impacts |
| | | |
| | ● | Water management (stormwater, contact/non-contact water, water quality) |
| | | |
| | ● | Geochemistry of ore, waste rock, tailings solids and solution, and post-mining pit lake |
| | | |
| | ● | Management of ore stockpiles, waste rock dumps, and tailings during operations, closure, and post-closure |
| | | |
| | ● | Threatened, endangered, and special status plant and animal species |
| | | |
| | ● | Jurisdictional waters |
| | | |
| | ● | Transportation and access |
| | | |
| | ● | Reclamation and closure |
Any issues identified during the permitting process will have to be analyzed, disclosed, and potentially mitigated.
| SMD | Cumo S-k 1300 Technical Report | November 2022 |
Geologic 2CM027.001 CuMoCo. | Page 141 |
The mine would be located in an area used for weekend summer dispersed recreation and fall big-game hunting and is well-known in the Boise area. A majority of the previous public scoping comments to the environmental assessments were against mining activities (although the commenters were directed to address the proposed action, which was the exploration project). Organized environmental groups such as the Idaho Conservation League and Sierra Club are keeping their constituents informed citing issues of potential pollution of the Boise river which supplies drinking water to the city of Boise. As such, well-funded, organized opposition to mining activities should be anticipated.
However, under the 1872 Mining Law as amended, ICMC has the legal right to develop the mineral resources on their mining claims. The USFS has a requirement to manage ICMC’s activities in accordance with its mining regulations at 36 CFR 228A and must ensure compliance with the requirements of the National Environmental Policy Act (. As defined in law and regulations, the USFS is limited in that it may not deny ICMC’s mining plan of operations provided that the activities proposed are reasonably incident to mining, not needlessly destructive, and comply with applicable federal, state, and local laws and regulations. The USFS does not have the authority to impose unreasonable requirements that would have the effect of denying the statutory right to explore and develop the mineral resource, provided the mining plan of operations otherwise meets the intent of applicable laws and regulations (USFS 2018).
At this time, a detailed discussion on mine closure and reclamation cannot be completed. However, ICMC will be required to post reclamation bonds to cover direct and indirect costs related to site stabilization, water treatment as needed, post-reclamation and post-mining monitoring, and public safety.
| 17.7 | Mine Closure – General Discussion |
There are comprehensive Idaho and USFS closure and reclamation requirements that the project proponent plan for closure and reclamation of mining disturbances on all affected land. Regulatory authorities will require that a surety or bond be posted sufficient to cover third-party costs to physically and chemically stabilize the site prior to the onset of mining. A reclamation cost estimate will have to be prepared that will be approved by state and federal agencies prior to any mining surface disturbance; the bond amount will have to be posted using an approved financial instrument. The financing costs associated with such a surety have not been modelled. The initial submissions will require a detailed discussion on how the mining disturbance will be physically and chemically stabilized and the duration of the closure process as reclamation and closure will be analyzed in the EIS.
The plans for final closure must address the long-term potential for surface and ground water contamination from the closed facility as well as stabilization of slopes, soils, and vegetation on mining disturbances. Typically, the closure permitting process involves a decommissioning plan or a permanent capping plan along with a post-closure monitoring commitment. Permit applicants should consider ways of closing a facility which will eliminate the possibility of future surface and ground water contamination and thereby eliminate the need for long-term water treatment and monitoring.
| SMD | Cumo S-k 1300 Technical Report | November 2022 |
Geologic 2CM027.001 CuMoCo. | Page 142 |
After mining operations cease, all buildings, infrastructure, and facilities from the CuMo Mine that have not been identified for a specific post-mining use, must be removed from the site during the reclamation, salvage, and site demolition phase. These activities will generally include, but not be limited to the:
| | ● | Regrading to a stable configuration, placement of growth media, and seeding of all disturbed surfaces without a postmining use |
| | | |
| | ● | Removal of surface pipelines and power lines, and the secure and stable abandonment of underground pipelines (including removal if required) |
| | | |
| | ● | Demolition of process facilities and salvage/removal of equipment and residual reagents for proper disposal |
| | | |
| | ● | Managing the drain-down solution to reduce the volume which may include the construction and operation of an evapotranspiration cell. Depending on site conditions, a water treatment plant and discharge of treated water may be necessary to prevent unauthorized discharges of mine water not meeting water quality standards |
| | | |
| | ● | Ongoing monitoring of closure compliance for surface and ground water quality, soil stabilization, and revegetation success |
| | | |
| | ● | Maintaining public safety features such as warning signs, pit berms, and other barriers |
To the extent practicable, reclamation and closure activities will be conducted concurrently with mining and disturbance to: reduce the overall final reclamation and closure costs, minimize environmental liabilities, and limit exposure to surety or bonding costs. At the current phase of the CuMo project, a site-specific closure cost estimate has not yet been developed. An approximate closure cost of $150M has been assumed for the initial assessment.
| SMD | Cumo S-k 1300 Technical Report | November 2022 |
Geologic 2CM027.001 CuMoCo. | Page 143 |
| 18 | Capital and Operating Costs |
| | |
| 18.1 | Capital Cost Estimate |
A summary of initial capital costs is provided in Table 21-1.
Table 21-1: Summary of initial capital costs
| Capital Costs | ($M) |
| Mine - Equipment, etc. | 344 |
| Capitalized Mine Operating Costs | 330 |
| Sort Plants | 160 |
| Mill | 1,293 |
| Roaster | 208 |
| Tailings | 22 |
| Infrastructure | 76 |
| Total Initial Capital Directs | 2,433 |
| | |
| Contingency on Initial Capital Directs (excl Mining) | 176 |
| | |
| Indirects | |
| Mine | 15 |
| Plant (incl. Sort) | 354 |
| Roaster | 81 |
| Infrastructure | 14 |
| Total Initial Capital Indirects | 464 |
| | |
| Sustaining Capital | |
| Mine | 428 |
| Sort Plants | 42 |
| Mill | 349 |
| Roaster | 56 |
| Tailings | 84 |
| Infrastructure | 10 |
| Total Sustaining Capital | 970 |
| | |
| Closure and Reclamation | 150 |
| | |
| Total Capital Costs | 4,193 |
| | |
| Initial Capex | 3,071 |
| Sustaining and Expansion Capex | 972 |
| Closure | 150 |
| SMD | Cumo S-k 1300 Technical Report | November 2022 |
Geologic 2CM027.001 CuMoCo. | Page 144 |
| 18.1.1 | Mining Capital Costs |
The author developed the LOM schedule for the CuMo project, and based on this, derived equipment fleet requirements (Table 16-5). A breakdown of capital costs by equipment type of the primary mine equipment is provided in Table 21-2. These are presented here exclusive of contingency for clarity.
In addition to the primary mine equipment, ancillary equipment costs (light vehicles, maintenance vehicles, etc.) are factored at 5% of the primary equipment cost. This totaled $16.8M. Other capital costs for haul roads, earthworks, and technical equipment totaled $21.5M. Note all costs here are before contingency.
Table 21-2: Mine primary equipment capital costs
| Equipment Type | Units | Initial Capital Cost |
| Rotary Blast Hole Drill | $M | 28.6 |
| Electric Cable Shovel | $M | 97.7 |
| Autonomous Trucks | $M | 114.4 |
| Track Dozer | $M | 11.0 |
| Rubber Tire Dozer | $M | 5.8 |
| Grader | $M | 6.5 |
| Water Truck | $M | 8.7 |
| Backhoe | $M | 2.2 |
| Total | $M | 274.9 |
The total initial mine equipment direct capital cost including the above costs and contingency is estimated at $345M as shown in Table 21-1.
Mine indirects were estimated at $15M.
The mining capitalized pre-production pre-stripping costs of $329M are incurred in the two years of mining activity prior to processing facility commissioning.
| 18.1.2 | Processing Capital Costs |
A summary of the estimated capital cost for the processing and on-site ancillary facilities is provided in Table 21-3 and for the roaster in Table 21-4.
The CuMo circuit capital cost estimate for the process plant, roaster and related ancillary infrastructures was derived by factoring the mechanical equipment costs, which are defined in the concept study mechanical equipment list (Ausenco, 2009). Equipment costs were based on recent equipment quotations, or from previous projects. The cost estimates for all other disciplines were factored from the mechanical equipment list.
| SMD | Cumo S-k 1300 Technical Report | November 2022 |
Geologic 2CM027.001 CuMoCo. | Page 145 |
Indirect costs, including project contingency have been provided for in the capital cost estimates. Indirect costs have been estimated based on a factor of the total direct costs established from previous projects.
Table 21-3: Summary of plant initial capital cost estimate
| Category | Units | 150 ktpd |
| Direct Costs |
| Site Development | $M | 29 |
| Sorting Plant | $M | 160 |
| Concentrator | $M | 1005 |
| Concentrator Services | $M | 50 |
| Concentrator Infrastructure | $M | 87 |
| Molybdenum Plant | $M | 62 |
| Tailings Line | $M | 21 |
| Spares and First Fill | $M | 38 |
| Total Direct Costs | $M | 1,453 |
| Indirect Costs |
| Temporary Construction Facilities | $M | 30 |
| EPCM | $M | 222 |
| Pre-production Owner’s Costs | $M | 60 |
| Project Fee | $M | 42 |
| Contingency | $M | 139 |
| Total Indirect Costs | $M | 492 |
| Total | $M | 1,944 |
| SMD | Cumo S-k 1300 Technical Report | November 2022 |
Geologic 2CM027.001 CuMoCo. | Page 146 |
Table 21-4: Summary of roaster initial capital cost estimate
| Category | Units | 150 kt/d |
| Direct Costs |
| Site Works | $M | 13 |
| Concentrate Feed Handling | $M | 21 |
| Molybdenum Roaster | $M | 75 |
| Rhenium Recovery | $M | 52 |
| Acid Plant | $M | 46 |
| Gas Scrubbing | $M | - |
| Total Direct Costs | $M | 208 |
| Indirect Costs |
| Temporary Construction Facilities | $M | 21 |
| EPCM | $M | 42 |
| Pre-production Owner’s Costs | $M | 12 |
| Project Fee | $M | 6 |
| Contingency | $M | 21 |
| Total Indirect Costs | $M | 102 |
| Total | $M | 309 |
Assumptions
Geotechnical
| ● | A detailed geotechnical and drainage assessment of the proposed site is not yet available. For the purpose of the study, no allowance for special ground preparation has been made. |
Base Date and Exchange Rates
| ● | The authors have reviewed, verified and confirmed all information is valid at the date of the report that cost estimate is current. The estimate and all costs are expressed in 2019 United States dollars. In the verification process, comparative quotes were solicited from appropriate vendors for updated equipment costs from the initial 2009 estimate produced by Ausenco. These were adjusted by exchange factors of 1.25 CAD to 1 USD or 1.10 CAD to 1 Euro when necessary. |
Electricity Supply
| ● | It is assumed that power is available to satisfy demand requirements for the proposed plant. Costs associated with power distribution to the site have been included within this estimate as detailed below. All other costs of power supply, including reticulation to the assumed take-off point on Highway 21, all land access, and licensing and permitting are excluded. It should be noted Idaho Power is currently in the final stages permitting a brand new power line extension from Horseshoe Bend to Garden Valley. This power line comes within 10 miles of the property and should reduce the costs associated with power. |
| ● | High and medium voltage switch gear and distribution within the battery limits have been included in the estimate. Individual drive switchgear and cabling have been included as part of the area factors. |
| SMD | Cumo S-k 1300 Technical Report | November 2022 |
Geologic 2CM027.001 CuMoCo. | Page 147 |
Water Supply
| ● | A water supply capable of supplying the required demand of the processing plant is assumed to be available. For this reason, costs associated with any increase in water supply have not been included within this estimate. The costs associated with water (and air) reticulation within the scope have been estimated based on the area piping factors. |
Contingency
The estimate currently includes an amount of 10% of the total cost of the fixed plant as an estimate recommended for contingency.
Owner’s Costs
Owner’s costs have been excluded from this estimate.
Project Fee
A project fee of 3% of the direct costs has been included.
Escalation
Escalation provision for currency inflation past Q1 2020 has not been included in the estimate.
| 18.1.3 | Tailings Storage Facilities Capital Costs |
The capital cost estimate for the TSF makes provision for constructing the initial starter dam of the TSF to an elevation of 6,300 ft, which is sufficient to store the first two years of tailings production. The tailings dam would be constructed using run of mine waste and sort waste and compacted in one-meter lifts. As the waste is already being delivered to the footprint for disposal, the only cost included for placement in the estimate is to cover the incremental compaction costs. No allowance was provided for spreading the material as it is assumed that the dozers already on the waste disposal area will handle that activity. The cost estimates are for an unlined TSF and it is estimated that lining the TSF would cost an additional 20 to 30 percent of the unlined construction cost.
An allowance has also been made for excavating the overburden encountered beneath the starter dam footprint to ensure a good foundation for the dam. The presence of unsuitable foundation soils and the soils areal extent and depth will be evaluated in future studies by geotechnical site investigations. The cost estimates will be adjusted based on the results of the investigations. This material would be stockpiled for use in reclamation activities later on in the mine life. Costs were also estimated for the general foundation clearing within the footprint of the tailings impoundment in advance of waste placement.
| SMD | Cumo S-k 1300 Technical Report | November 2022 |
Geologic 2CM027.001 CuMoCo. | Page 148 |
The storage capacity of the TSF will be increased through five additional raises of the dam in years 2, 5, 10, 15 and 20 to an ultimate elevation of 6,950 ft. Sustaining capital has been estimated for each of these raises to accommodate compaction of the waste rock in the compacted dam zone as foundation preparation in years 2 and 5 when the footprint is undergoing expansion to the south.
| 18.1.4 | Capital Cost Estimate Exclusions |
No specific allowance or estimate was made for items such as foreign currency fluctuations, escalation, etc., which will be reviewed in greater detail in the pre-feasibility study and subsequent feasibility study. The following items are excluded from this study:
| ● | Power generation (power is assumed to be purchased) |
| ● | Project acquisition costs |
| ● | Pre-feasibility study costs |
| ● | Exploration, geotechnical and sterilization costs |
| ● | Bore field or raw water dam |
| ● | Plant or infrastructure outside of the battery limits |
| ● | All Owner payable taxes, government and other charges (operating cost not capital) |
| ● | License and royalty fees |
| ● | No allowances are made for special incentives (schedule, safety or others) |
| ● | Sustaining or deferred capital costs (operating cost not capital) |
| ● | Cost changes due to currency fluctuation |
| ● | Owners cost prior to project approval |
| ● | Project interest / financing costs |
| ● | Permits / cost of permits |
| ● | Mine / plant closure and rehabilitation costs (included in financial model) |
| ● | Training of operations personnel |
| SMD | Cumo S-k 1300 Technical Report | November 2022 |
Geologic 2CM027.001 CuMoCo. | Page 149 |
| ● | Environmental consultants, studies, permitting and mitigation |
| ● | Any operational insurance such as business interruption insurance & machinery breakdown, etc |
| ● | Costs for community relations and services |
| ● | Any bridges or tunnels, permanent or temporary |
| ● | Maintenance of all roads and bridges and facilities mentioned above |
| ● | Provision of hardstand for the construction site area |
| 18.2 | Operating Cost Estimate |
The total LOM operating costs for the CuMo project are summarized in Table 21-5.
Table 21-5: Summary of LOM operating costs
| Operating Costs | LOM ($M) | Unit Rates ($/t) | Unit Rates ($/lb Mo.Eq.) |
| Mining | 5,797 | $3.66 | $2.99 |
| Bulk Sort | 778 | $0.49 | $0.40 |
| Middling Sort | 192 | $0.12 | $0.10 |
| Processing | 7,042 | $4.45 | $3.63 |
| Sort Waste Delivery | 395 | $0.25 | $0.20 |
| G&A | 805 | $0.51 | $0.42 |
| Less Capitalized Operating Costs | -329 | -$0.21 | -$0.17 |
| Total Operating Costs | 14,680 | $9.28 | $7.57 |
The estimate was prepared with a base date of July 2019 to an accuracy level of ±40%. Various parties contributed to the estimates as detailed below. These estimates exclude sustaining capital expenditure requirements but include realization costs associated with sale of final products.
| 18.2.1 | Mine Operating Costs |
The author estimated the mine operating costs based on comparison to similar projects. Site-specific haulage profiles were considered to ensure that short haul options into Charlotte Gulch in early years are reflected as well as the longer hauls to Clear Creek for TSF construction and WRF disposal.
The non-haulage operating costs are estimated at approximately $0.70/t. Adding haulage gives an average mine operating cost of $1.28/t, ranging from $0.91 to $1.87/t of material moved. Mine operating costs per ton of material processed is $3.66. The total LOM operating cost is estimated at $5,797M. Note that $329M of these mine operating costs in the pre-production period were capitalized.
| SMD | Cumo S-k 1300 Technical Report | November 2022 |
Geologic 2CM027.001 CuMoCo. | Page 150 |
| 18.2.2 | Sort Plant Operating Costs |
For the bulk sorting system, a unit cost of $0.10/t was assumed for each stage of sorting. To this is added $0.20/t for primary crushing, giving a LOM total operating cost of $778.1M.
For the particle sorting system, a unit cost of $0.30/t of material fed was assumed, giving a LOM operating cost of $192.1M.
| 18.2.3 | Mill Operating Costs |
The total process operating costs have been developed on an annual basis throughout the life of the mine. Cost estimates were generated the selected throughput/mill feed scenario based on the metallurgical samples tested by SGS Canada Inc. These have been combined, using the CuMo mine plan to produce LOM and annual operating estimates. A summary of the average operating costs per ton of mill feed treated for the project is outlined in Table 21-6. The costs have been divided into the key cost centers.
Table 21-6: Estimated plant average operating costs
| Category | Units | 150 kt/d |
| Labor | $/ton | 0.19 |
| Power | $/ton | 1.84 |
| Maintenance Materials and Services | $/ton | 0.68 |
| Reagents and Consumables | $/ton | 1.74 |
| Total | $/ton | 4.45 |
Site labor costs from the overall workforce schedule of personnel numbers, positions, salaries and overhead costs based on projects of similar size and location. Total employee costs have been developed by applying on-cost factors to base salaries. The on-costs include the cost of travel, overtime and shift premiums, leave pay, bonuses, pension and superannuation benefits, insurance coverage, educational assistance and supply of uniforms and personal protective equipment.
Power is to be supplied to the mine site from the local power grid, provided by Idaho Power. Unit power cost rates have been supplied by CuMoCo at $0.063/kWh, based on information from the Thompson Creek Mine (Thompson Creek Mine Model, MineCost (2009)). This has been confirmed by the authors with large scale commercial rates (2018) in Idaho being as low as $0.055/kWh. Thus using $0.063/kWh can be considered reasonable.
| SMD | Cumo S-k 1300 Technical Report | November 2022 |
Geologic 2CM027.001 CuMoCo. | Page 151 |
| c) | Maintenance Consumables and Services |
Maintenance consumable costs were estimated as a percentage of the direct installed capital cost (percent factor). The factor is based on actual data from similar projects and takes into consideration an assumed bond abrasion index of 0.25.
| d) | Reagents and Consumables |
Reagent consumptions have been estimated from metallurgical test-work or comparable operations. Although reagent consumptions will vary according to metallurgical and production parameters, the average predicted consumptions, by material type, have been used for this exercise.
Budget quoted costs have been used for major plant reagents. Unit costs include an allowance for delivery to site but do not include duties, brokerage, handling charges or applicable taxes.
| 18.2.4 | General Site and Administrative Costs |
The author has assumed a general site and administrative (G&A) cost of $0.50/t mill feed based on comparison to similar size operations. At the modelled throughputs, this amounts to approximately $27.5M per year at full production.
| SMD | Cumo S-k 1300 Technical Report | November 2022 |
Geologic 2CM027.001 CuMoCo. | Page 152 |
| 19.1 | Cautionary Statements |
| 19.1.1 | Certainty of Initial Assessment |
The initial assessment is preliminary in nature, that it includes inferred mineral resources that are considered too speculative geologically to have the economic considerations applied to them that would enable them to be categorized as mineral reserves, and there is no certainty that the initial assessment will be realized. A total of 12.4% of the resource used in the economic analysis is in the inferred category.
| 19.1.2 | Mineral Resources are Not Reserves |
Mineral resources are not mineral reserves and do not have demonstrated economic viability.
Economic analysis was undertaken using a discounted cashflow model that was constructed in MS EXCEL®. The model used constant (real) 2019 United States dollars and modelled the project cashflows in annual periods.
The model assumes a 36-month physical construction period.
The model does not place the project within an estimated calendar timeline and is intended only as an indication of the economic potential of the project to assist in investment decisions. Between the date of this report and the commencement of construction, a period of time sufficient for the pre-feasibility and feasibility study work programs to be executed must be allowed.
Important Note: The economic model considered only cashflows from the beginning of actual construction forward. Schedule and expenditure for the pre-feasibility study, including technical and economic studies, engineering studies, cost estimating, resource delineation and infill drilling, pit slope geotechnical characterization, metallurgical sampling and test-work, associated exploration, strategic optimization, mine, plant and infrastructure design, permitting and other pre-construction activities were NOT modelled.
Attention is drawn to Section 26 where the work plan and costs for the pre-feasibility study period of the project are summarized.
Table 22-1 shows a summary of key project parameters and project economics. LOM project annual cash flow is shown graphically in Figure 22-1.
The summary of CuMo project economics is provided in Table 22-1a and b. Due to the ore sorting and central location of the pit a large portion of the inferred component of the resource is located on the outer edges in the waste blocks. What inferred that is located within the mineable resource has been converted to waste.
| SMD | Cumo S-k 1300 Technical Report | November 2022 |
Geologic 2CM027.001 CuMoCo. | Page 153 |
Table 22-1a: Summary of potential project economics with Inferred resources
| Project Metric | Units | Value |
| Pre-Tax NPV @ 5% | $M | 2,470 |
| Pre-Tax NPV @ 8% | $M | 800 |
| Pre-Tax NPV @ 10% | $M | 113 |
| Pre-Tax IRR | % | 10% |
| After-Tax NPV @ 5% | $M | 1,709 |
| After-Tax NPV @ 8% | $M | 356 |
| After-Tax NPV @ 10% | $M | -205 |
| After-Tax IRR | % | 9% |
| Undiscounted After-Tax Cash Flow (LOM) (no capital) | $M | 11,092 |
| Undiscounted After-Tax Cash Flow (LOM) (capital) | $M | 7,032 |
| Payback Period from Start of Processing | years | 8.0 |
| Initial Capital Expenditure | $M | 3,071 |
| LOM Sustaining Capital Expenditure | $M | 972 |
| Closure | $M | 150 |
| LOM C-1 Cash Costs After By-product Credits | $/lb Mo | 4.67 |
| Nominal Flotation Process Capacity | stpd | 150,000 |
| Mine Life (years @ > 90% of full production) | years | 28 |
| LOM Flotation Mill Feed | kst | 1,386,050 |
| LOM Grades |
| Molybdenite (MoS2) | % | 0.074% |
| Molybdenum (elemental Mo) | % | 0.044% |
| Copper | % | 0.105% |
| Silver | grams per tonne | 3.00 |
| LOM Waste Volume | kst | 2,621,577 |
| LOM Strip Ratio (Waste:Sort Feed) | ratio | 1.11 |
| Mass Pull to Mill from Sort Feed | % | 72% |
| LOM Strip Ratio (Waste:Mill Feed) | ratio | 1.53 |
| First Five Years Average Annual Metal Production |
| Molybdenum | klbs/yr | 34,976 |
| Copper | klbs/yr | 93,394 |
| Silver | kounces/yr | 3,940 |
| LOM Average Annual Metal Production |
| Molybdenum (Mo Metal) | klbs/yr | 43,072 |
| Copper | klbs/yr | 84,229 |
| Silver | kounces/yr | 3,575 |
| LOM Average Mill Process Recovery |
| Molybdenum (Mo Metal) | % contained metal | 91.87% |
| Copper | % contained metal | 76.33% |
| Silver | % contained metal | 70.42% |
| SMD | Cumo S-k 1300 Technical Report | November 2022 |
Geologic 2CM027.001 CuMoCo. | Page 154 |
Table 22-1b: Summary of potential project economics without inferred resources
| Project Metric | Units | Value |
| Pre-Tax NPV @ 5% | $M | 2,328 |
| Pre-Tax NPV @ 8% | $M | 771 |
| Pre-Tax NPV @ 10% | $M | 102 |
| Pre-Tax IRR | % | 10% |
| After-Tax NPV @ 5% | $M | 1,674 |
| After-Tax NPV @ 8% | $M | 356 |
| After-Tax NPV @ 10% | $M | -225 |
| After-Tax IRR | % | 9% |
| Undiscounted After-Tax Cash Flow (LOM) | $M | 6,575 |
| Payback Period from Start of Processing | years | 8.0 |
| Initial Capital Expenditure | $M | 3,071 |
| LOM Sustaining Capital Expenditure | $M | 972 |
| Closure | $M | 150 |
| LOM C-1 Cash Costs After By-product Credits | $/lb Mo | 4.67 |
| Nominal Flotation Process Capacity | stpd | 150,000 |
| Mine Life (years @ > 90% of full production) | years | 28 |
| LOM Flotation Mill Feed | kst | 1,582,526 |
| LOM Grades |
| Molybdenite (MoS2) | % | 0.076% |
| Molybdenum (elemental Mo) | % | 0.045% |
| Copper | % | 0.108% |
| Silver | grams per tonne | 3.10 |
| LOM Waste Volume | kst | 2,55,706 |
| LOM Strip Ratio (Waste:Sort Feed) | ratio | 1.11 |
| Mass Pull to Mill from Sort Feed | % | 72% |
| LOM Strip Ratio (Waste:Mill Feed) | ratio | 1.53 |
| First Five Years Average Annual Metal Production |
| Molybdenum (Mo) | klbs/yr | 37,640 |
| Copper | klbs/yr | 90,756 |
| Silver | kounces/yr | 3,731 |
| LOM Average Annual Metal Production |
| Molybdenum (Mo) | klbs/yr | 34,980 |
| Copper | klbs/yr | 84,233 |
| Silver | kounces/yr | 3,375 |
| LOM Average Mill Process Recovery |
| Molybdenum (Mo) | % contained metal | 91.87% |
| Copper | % contained metal | 76.33% |
| Silver | % contained metal | 70.42% |
| SMD | Cumo S-k 1300 Technical Report | November 2022 |
Geologic 2CM027.001 CuMoCo. | Page 155 |
The project as presented, and under the current assumptions, has the potential to be economic. The after-tax NPV is positive and has been tested across a range of sensitivities with respect to capital costs, operating costs and revenue (price).
Attention is drawn to the cautionary statements in Section 22.1 and the risks and opportunities discussed in Sections 25.2.7 and 25.3.6 respectively.
Project cashflows are summarized in Table 22-2 & Table 22-3, and shown graphically in Figure 22-1. Cumulative cashflows at discount rates (non-escalated) of 0%, 5%, 8% and 10% are also shown.
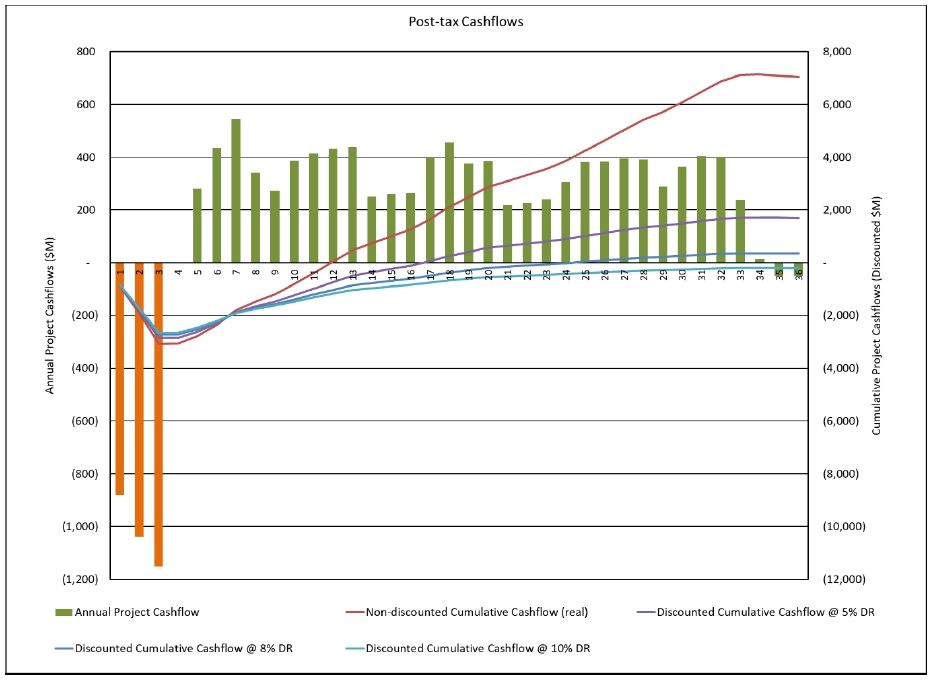
Source: SRK, 2019
Figure 22-1: Project cashflow summary chart
The production schedule evaluated is summarized in Table 22-4. Metal production quantities and mine physicals are shown graphically in Figure 22-1.
| SMD | Cumo S-k 1300 Technical Report | November 2022 |
Geologic 2CM027.001 CuMoCo. | Page 156 |
Table 22-2: LOM annual project cash flow
| PREFINANCE SUMMARY CASH FLOW | Units | LOM Total | Year -3 | Year -2 | Year -1 | Year 1 | Year 2 | Year 3 | Year 4 | Year 5 | Year 6 | Year 7 | Year 8 | Year 9 | Year 10 | Year 11 | Year 12 | Year 13 | Year 14 |
| Payable Revenue | | | | | | | | | | | | | | | | | | | |
| Payable Revenue from Molybdenum | $M | 19,383 | 0 | 0 | 0 | 244 | 450 | 585 | 789 | 555 | 444 | 564 | 737 | 825 | 863 | 416 | 524 | 701 | 882 |
| Payable Revenue from Copper | $M | 7,581 | 0 | 0 | 0 | 117 | 359 | 341 | 263 | 321 | 358 | 334 | 258 | 241 | 207 | 373 | 326 | 276 | 212 |
| Payable Revenue from Silver | $M | 1,877 | 0 | 0 | 0 | 41 | 82 | 79 | 56 | 86 | 95 | 79 | 61 | 58 | 52 | 94 | 77 | 62 | 45 |
| By-product Revenue | $M | 266 | 0 | 0 | 0 | 3 | 6 | 8 | 11 | 8 | 6 | 8 | 10 | 11 | 12 | 6 | 7 | 10 | 12 |
| Total Revenue from Payable Metal | $M | 29,106 | 0 | 0 | 0 | 406 | 897 | 1,013 | 1,119 | 969 | 902 | 985 | 1,066 | 1,135 | 1,134 | 888 | 934 | 1,048 | 1,151 |
| Moly Equivalent (MoEq) Payable Pounds | mmlbs | 1,908 | 0.0 | 0.0 | 0.0 | 26.6 | 58.8 | 66.4 | 73.4 | 63.6 | 59.2 | 64.6 | 69.9 | 74.4 | 74.3 | 58.2 | 61.3 | 68.7 | 75.5 |
| Total TCRC Freight & Royalty | $M | 1,253 | 0 | 0 | 0 | 19 | 47 | 48 | 46 | 47 | 48 | 47 | 44 | 45 | 43 | 48 | 45 | 45 | 43 |
| Total Minesite Revenue | $M | 27,853 | 0 | 0 | 0 | 387 | 851 | 965 | 1,073 | 923 | 855 | 938 | 1,021 | 1,090 | 1,091 | 841 | 889 | 1,004 | 1,108 |
| | | | | | | | | | | | | | | | | | | | |
| OPERATING COSTS | | | | | | | | | | | | | | | | | | | |
| Mining | $M | 5,797 | 0 | 142 | 173 | 181 | 191 | 187 | 196 | 197 | 211 | 191 | 202 | 214 | 205 | 201 | 199 | 190 | 188 |
| Bulk Sort | $M | 778 | 0 | 0 | 0 | 20 | 30 | 26 | 22 | 33 | 30 | 27 | 24 | 27 | 27 | 33 | 27 | 24 | 23 |
| Middling Sort | $M | 192 | 0 | 0 | 0 | 8 | 9 | 6 | 3 | 11 | 9 | 6 | 5 | 7 | 7 | 11 | 7 | 5 | 4 |
| Processing | $M | 7,042 | 0 | 0 | 0 | 122 | 244 | 244 | 244 | 244 | 244 | 244 | 244 | 244 | 244 | 244 | 244 | 244 | 244 |
| Sort Waste Delivery | $M | 395 | 0 | 0 | 0 | 17 | 18 | 12 | 7 | 23 | 18 | 13 | 10 | 15 | 15 | 23 | 13 | 8 | 8 |
| G&A | $M | 805 | 0 | 5 | 9 | 14 | 27 | 27 | 27 | 27 | 27 | 27 | 27 | 27 | 27 | 27 | 27 | 27 | 27 |
| Less Capitalized Operating Costs | | -329 | 0 | -147 | -182 | 0 | 0 | 0 | 0 | 0 | 0 | 0 | 0 | 0 | 0 | 0 | 0 | 0 | 0 |
| Total Operating Costs | $M | 14,680 | 0 | 0 | 0 | 362 | 520 | 503 | 500 | 535 | 539 | 509 | 513 | 533 | 524 | 538 | 516 | 498 | 494 |
| | | | | | | | | | | | | | | | | | | | |
| Operating Cashflow | $M | 13,173 | 0 | 0 | 0 | 25 | 331 | 461 | 574 | 388 | 316 | 429 | 508 | 556 | 567 | 302 | 373 | 506 | 614 |
| | | | | | | | | | | | | | | | | | | | |
| Summary Capex by Project Phase | | | | | | | | | | | | | | | | | | | |
| Construction Costs | $M | 3,071 | 882 | 1,038 | 1,151 | 0 | 0 | 0 | 0 | 0 | 0 | 0 | 0 | 0 | 0 | 0 | 0 | 0 | 0 |
| Sustaining Capital Costs | $M | 972 | 0 | 0 | 0 | 31 | 6 | 15 | 17 | 62 | 51 | 30 | 23 | 19 | 17 | 29 | 30 | 130 | 79 |
| Closure Costs | $M | 150 | 0 | 0 | 0 | 0 | 0 | 0 | 0 | 0 | 0 | 0 | 0 | 0 | 0 | 0 | 0 | 0 | 0 |
| Grand Total Capex (Including Closure) | $M | 4,193 | 882 | 1,038 | 1,151 | 31 | 6 | 15 | 17 | 62 | 51 | 30 | 23 | 19 | 17 | 29 | 30 | 130 | 79 |
| Working Capital | $M | -133 | 0 | 0 | 0 | -9 | 44 | 12 | 12 | -16 | -7 | 11 | 11 | 9 | 1 | -33 | 8 | 18 | 17 |
| Pretax Cash Flow | $M | 9,113 | -882 | -1,038 | -1,151 | 3 | 281 | 434 | 544 | 342 | 272 | 387 | 475 | 528 | 549 | 306 | 335 | 358 | 519 |
| Total Tax | $M | 2,081 | 0 | 0 | 0 | 0 | 0 | 0 | 0 | 0 | 0 | 0 | 60 | 95 | 109 | 56 | 73 | 93 | 117 |
| After-tax Net Cash Flow (Undiscounted) | $M | 7,032 | -882 | -1,038 | -1,151 | 3 | 281 | 434 | 544 | 342 | 272 | 387 | 415 | 433 | 439 | 251 | 262 | 265 | 401 |
| After-tax Net Cash Flow (at 5% DR) | $M | 1,709 | -861 | -965 | -1,019 | 2 | 226 | 332 | 396 | 237 | 180 | 244 | 249 | 247 | 239 | 130 | 129 | 124 | 179 |
| After-tax Net Cash Flow (at 8% DR) | $M | 356 | -848 | -925 | -950 | 2 | 199 | 284 | 330 | 192 | 142 | 186 | 185 | 179 | 168 | 89 | 86 | 80 | 113 |
| After-tax Net Cash Flow (at 10% DR) | $M | -205 | -841 | -900 | -907 | 2 | 183 | 257 | 293 | 167 | 121 | 157 | 153 | 145 | 134 | 69 | 66 | 60 | 83 |
| | Note: | MoEq lbs = (Revenue from recovered, payable metal plus by-products before deduction of Royalty TCRC and freight)/(Price of Mo per lb) |
| SMD | Cumo S-k 1300 Technical Report | November 2022 |
Geologic 2CM027.001 CuMoCo. | Page 157 |
Table 22-3: LOM annual project cash flow – continued
| PREFINANCE SUMMARY CASH FLOW | Units | LOM Total | Year 15 | Year 16 | Year 17 | Year 18 | Year 19 | Year 20 | Year 21 | Year 22 | Year 23 | Year 24 | Year 25 | Year 26 | Year 27 | Year 28 | Year 29 | Year 30 | Closure |
| Payable Revenue | | | | | | | | | | | | | | | | | | | |
| Payable Revenue from Molybdenum | $M | 19,383 | 932 | 892 | 839 | 372 | 471 | 518 | 639 | 758 | 753 | 806 | 800 | 573 | 679 | 756 | 784 | 233 | |
| Payable Revenue from Copper | $M | 7,581 | 157 | 156 | 181 | 369 | 345 | 328 | 297 | 249 | 212 | 201 | 180 | 258 | 250 | 192 | 163 | 57 | |
| Payable Revenue from Silver | $M | 1,877 | 36 | 39 | 50 | 100 | 98 | 86 | 73 | 61 | 49 | 45 | 46 | 65 | 60 | 48 | 40 | 12 | |
| By-product Revenue | $M | 266 | 13 | 12 | 12 | 5 | 6 | 7 | 9 | 10 | 10 | 11 | 11 | 8 | 9 | 10 | 11 | 3 | |
| Total Revenue from Payable Metal | $M | 29,106 | 1,139 | 1,100 | 1,082 | 846 | 920 | 939 | 1,017 | 1,078 | 1,024 | 1,063 | 1,037 | 904 | 998 | 1,006 | 998 | 305 | |
| Moly Equivalent (MoEq) Payable Pounds | mmlbs | 1,908 | 74.7 | 72.1 | 70.9 | 55.5 | 60.3 | 61.5 | 66.7 | 70.7 | 67.2 | 69.7 | 68.0 | 59.3 | 65.4 | 66.0 | 65.5 | 20.0 | |
| Total TCRC Freight & Royalty | $M | 1,253 | 39 | 39 | 40 | 47 | 48 | 46 | 46 | 44 | 40 | 40 | 39 | 41 | 42 | 39 | 36 | 11 | |
| Total Minesite Revenue | $M | 27,853 | 1,099 | 1,061 | 1,041 | 799 | 872 | 892 | 971 | 1,034 | 984 | 1,023 | 998 | 863 | 956 | 967 | 962 | 294 | |
| | | | | | | | | | | | | | | | | | | | |
| OPERATING COSTS | | | | | | | | | | | | | | | | | | | |
| Mining | $M | 5,797 | 186 | 198 | 197 | 208 | 219 | 206 | 196 | 188 | 183 | 179 | 175 | 183 | 119 | 116 | 125 | 50 | |
| Bulk Sort | $M | 778 | 24 | 26 | 28 | 35 | 31 | 28 | 24 | 22 | 23 | 24 | 24 | 32 | 26 | 24 | 24 | 9 | |
| Middling Sort | $M | 192 | 5 | 6 | 8 | 13 | 10 | 7 | 5 | 3 | 4 | 5 | 4 | 10 | 6 | 5 | 4 | 2 | |
| Processing | $M | 7,042 | 244 | 244 | 244 | 244 | 244 | 244 | 244 | 244 | 244 | 244 | 244 | 244 | 244 | 244 | 244 | 94 | |
| Sort Waste Delivery | $M | 395 | 10 | 13 | 17 | 26 | 19 | 14 | 9 | 6 | 8 | 9 | 9 | 20 | 11 | 9 | 8 | 3 | |
| G&A | $M | 805 | 27 | 27 | 27 | 27 | 27 | 27 | 27 | 27 | 27 | 27 | 27 | 27 | 27 | 27 | 27 | 11 | |
| Less Capitalized Operating Costs | | -329 | 0 | 0 | 0 | 0 | 0 | 0 | 0 | 0 | 0 | 0 | 0 | 0 | 0 | 0 | 0 | 0 | |
| Total Operating Costs | $M | 14,680 | 497 | 514 | 521 | 553 | 552 | 526 | 504 | 491 | 490 | 488 | 484 | 516 | 435 | 425 | 432 | 168 | |
| | | | | | | | | | | | | | | | | | | | |
| Operating Cashflow | $M | 13,173 | 602 | 547 | 520 | 246 | 320 | 367 | 467 | 543 | 494 | 535 | 515 | 348 | 521 | 542 | 530 | 126 | |
| | | | | | | | | | | | | | | | | | | | |
| Summary Capex by Project Phase | | | | | | | | | | | | | | | | | | | |
| Construction Costs | $M | 3,071 | 0 | 0 | 0 | 0 | 0 | 0 | 0 | 0 | 0 | 0 | 0 | 0 | 0 | 0 | 0 | 0 | |
| Sustaining Capital Costs | $M | 972 | 25 | 70 | 32 | 23 | 17 | 48 | 48 | 35 | 17 | 17 | 17 | 17 | 17 | 17 | 17 | 17 | |
| Closure Costs | $M | 150 | 0 | 0 | 0 | 0 | 0 | 0 | 0 | 0 | 0 | 0 | 0 | 0 | 0 | 0 | 0 | 0 | 150 |
| Grand Total Capex (Including Closure) | $M | 4,193 | 25 | 70 | 32 | 23 | 17 | 48 | 48 | 35 | 17 | 17 | 17 | 17 | 17 | 17 | 17 | 17 | 150 |
| Working Capital | $M | -133 | 0 | -5 | -2 | -42 | 13 | 6 | 17 | 15 | -9 | 10 | -4 | -31 | 30 | 5 | 0 | -151 | -64 |
| Pretax Cash Flow | $M | 9,113 | 577 | 483 | 491 | 265 | 290 | 312 | 401 | 494 | 486 | 508 | 501 | 361 | 475 | 520 | 513 | 260 | -86 |
| Total Tax | $M | 2,081 | 121 | 107 | 104 | 47 | 65 | 73 | 93 | 111 | 103 | 113 | 109 | 73 | 111 | 115 | 111 | 22 | 0 |
| After-tax Net Cash Flow (Undiscounted) | $M | 7,032 | 456 | 376 | 386 | 218 | 225 | 240 | 308 | 383 | 383 | 395 | 392 | 289 | 364 | 404 | 402 | 238 | -86 |
| After-tax Net Cash Flow (at 5% DR) | $M | 1,709 | 194 | 152 | 149 | 80 | 79 | 80 | 98 | 116 | 110 | 108 | 103 | 72 | 86 | 91 | 86 | 49 | -15 |
| After-tax Net Cash Flow (at 8% DR) | $M | 356 | 119 | 90 | 86 | 45 | 43 | 42 | 50 | 58 | 54 | 51 | 47 | 32 | 38 | 39 | 36 | 20 | -6 |
| After-tax Net Cash Flow (at 10% DR) | $M | -205 | 86 | 64 | 60 | 31 | 29 | 28 | 33 | 37 | 34 | 32 | 29 | 19 | 22 | 22 | 20 | 11 | -3 |
| | Notes: | MoEq lbs = (Revenue from recovered, payable metal plus by-products before deduction of Royalty TCRC and freight)/(Price of Mo per lb) |
| | | Closure is costed over 3 years but summarized into a single year in this table for brevity |
| SMD | Cumo S-k 1300 Technical Report | November 2022 |
Geologic 2CM027.001 CuMoCo. | Page 158 |
Table 22-4: Production schedule summary
| Item | Units | LOM Totals | Year -2 | Year -1 | Year 1 | Year 2 | Year 3 | Year 4 | Year 5 | Year 6 | Year 7 | Year 8 | Year 9 | Year 10 | Year 11 | Year 12 | Year 13 | Year 14 |
| Mill Feed | kst | 1,582,526 | 0 | 0 | 27,375 | 54,750 | 54,900 | 54,750 | 54,750 | 54,750 | 54,900 | 54,750 | 54,750 | 54,750 | 54,900 | 54,750 | 54,750 | 54,750 |
| MoS2 | % | 0.074% | 0.000% | 0.000% | 0.058% | 0.053% | 0.063% | 0.088% | 0.060% | 0.052% | 0.062% | 0.082% | 0.087% | 0.096% | 0.047% | 0.063% | 0.076% | 0.093% |
| Cu | % | 0.105% | 0.000% | 0.000% | 0.093% | 0.138% | 0.128% | 0.101% | 0.133% | 0.139% | 0.131% | 0.108% | 0.106% | 0.089% | 0.150% | 0.125% | 0.109% | 0.088% |
| Ag | gpt (metric) | 3.00 | 0.00 | 0.00 | 3.63 | 3.51 | 3.36 | 2.64 | 3.83 | 4.06 | 3.56 | 3.04 | 2.90 | 2.46 | 4.03 | 3.39 | 2.95 | 2.32 |
| Waste | kst | 2,425,101 | 156,915 | 174,639 | 132,521 | 90,212 | 108,661 | 114,796 | 91,153 | 98,714 | 84,230 | 93,481 | 102,999 | 89,800 | 71,062 | 82,589 | 78,547 | 74,561 |
| Strip Ratio (waste:sort feed) | ratio | 1.11 | 0.00 | 30.20 | 2.73 | 1.09 | 1.49 | 1.73 | 1.00 | 1.19 | 1.13 | 1.32 | 1.33 | 1.16 | 0.79 | 1.11 | 1.16 | 1.12 |
| Head Grade (% MoS2 Eq. recoverable) | % | 0.123% | 0.000% | 0.000% | 0.099% | 0.109% | 0.123% | 0.136% | 0.118% | 0.110% | 0.120% | 0.130% | 0.138% | 0.138% | 0.108% | 0.114% | 0.128% | 0.140% |
| Recovered Mo | kst | 646 | 0 | 0 | 8 | 15 | 19 | 26 | 19 | 15 | 19 | 25 | 27 | 29 | 14 | 17 | 23 | 29 |
| Recovered Cu | kst | 1,263 | 0 | 0 | 20 | 60 | 57 | 44 | 53 | 60 | 56 | 43 | 40 | 34 | 62 | 54 | 46 | 35 |
| Recovered Ag | koz | 107,239 | 0 | 0 | 2,367 | 4,710 | 4,535 | 3,190 | 4,898 | 5,400 | 4,529 | 3,485 | 3,340 | 2,982 | 5,379 | 4,378 | 3,545 | 2,581 |
| MoEq lbs | mmlbs | 1,908.2 | 0.0 | 0.0 | 26.6 | 58.8 | 66.4 | 73.4 | 63.6 | 59.2 | 64.6 | 69.9 | 74.4 | 74.3 | 58.2 | 61.3 | 68.7 | 75.5 |
| | | | | | | | | | | | | | | | | | | |
| | | | | | | | | | | | | | | | | | | |
| Item | Units | LOM Totals | Year 15 | Year 16 | Year 17 | Year 18 | Year 19 | Year 20 | Year 21 | Year 22 | Year 23 | Year 24 | Year 25 | Year 26 | Year 27 | Year 28 | Year 29 | Year 30 |
| Mill Feed | kst | 1,582,526 | 54,900 | 54,750 | 54,750 | 54,750 | 54,900 | 54,750 | 54,750 | 54,750 | 54,900 | 54,750 | 54,750 | 54,750 | 54,900 | 54,750 | 54,750 | 21,101 |
| MoS2 | % | 0.074% | 0.101% | 0.098% | 0.093% | 0.042% | 0.050% | 0.058% | 0.071% | 0.083% | 0.086% | 0.086% | 0.090% | 0.064% | 0.074% | 0.083% | 0.086% | 0.065% |
| Cu | % | 0.105% | 0.069% | 0.068% | 0.080% | 0.152% | 0.139% | 0.127% | 0.110% | 0.096% | 0.080% | 0.076% | 0.076% | 0.102% | 0.094% | 0.076% | 0.067% | 0.059% |
| Ag | gpt (metric) | 3.00 | 1.93 | 2.00 | 2.38 | 4.32 | 4.24 | 3.78 | 3.34 | 2.85 | 2.34 | 2.27 | 2.40 | 3.00 | 2.79 | 2.32 | 2.11 | 1.64 |
| Waste | kst | 2,425,101 | 65,818 | 75,310 | 62,410 | 62,934 | 97,313 | 79,768 | 73,603 | 65,620 | 55,778 | 47,465 | 41,473 | 36,454 | 6,318 | 3,744 | 4,553 | 1,662 |
| Strip Ratio (waste:sort feed) | ratio | 1.11 | 0.93 | 1.00 | 0.77 | 0.66 | 1.15 | 1.05 | 1.08 | 1.02 | 0.83 | 0.68 | 0.60 | 0.42 | 0.09 | 0.05 | 0.07 | 0.07 |
| Head Grade (% MoS2 Eq. recoverable) | % | 0.123% | 0.138% | 0.134% | 0.132% | 0.103% | 0.112% | 0.114% | 0.124% | 0.131% | 0.124% | 0.129% | 0.126% | 0.110% | 0.121% | 0.122% | 0.122% | 0.096% |
| Recovered Mo | kst | 646 | 31 | 30 | 28 | 12 | 16 | 17 | 21 | 25 | 25 | 27 | 27 | 19 | 23 | 25 | 26 | 8 |
| Recovered Cu | kst | 1,263 | 26 | 26 | 30 | 62 | 57 | 55 | 49 | 41 | 35 | 34 | 30 | 43 | 42 | 32 | 27 | 9 |
| Recovered Ag | koz | 107,239 | 2,074 | 2,247 | 2,872 | 5,698 | 5,587 | 4,889 | 4,166 | 3,482 | 2,818 | 2,560 | 2,608 | 3,728 | 3,416 | 2,761 | 2,303 | 712 |
| MoEq lbs | mmlbs | 1,908.2 | 74.7 | 72.1 | 70.9 | 55.5 | 60.3 | 61.5 | 66.7 | 70.7 | 67.2 | 69.7 | 68.0 | 59.3 | 65.4 | 66.0 | 65.5 | 20.0 |
| | Notes: | By-product production of rhenium and sulfuric acid is not shown here, but is included in economic analysis |
| | | MoEq lbs = (Revenue from recovered, payable metal plus by-products before deduction of Royalty TCRC and freight)/(Price of Mo per lb) |
| SMD | Cumo S-k 1300 Technical Report | November 2022 |
Geologic 2CM027.001 CuMoCo. | Page 159 |
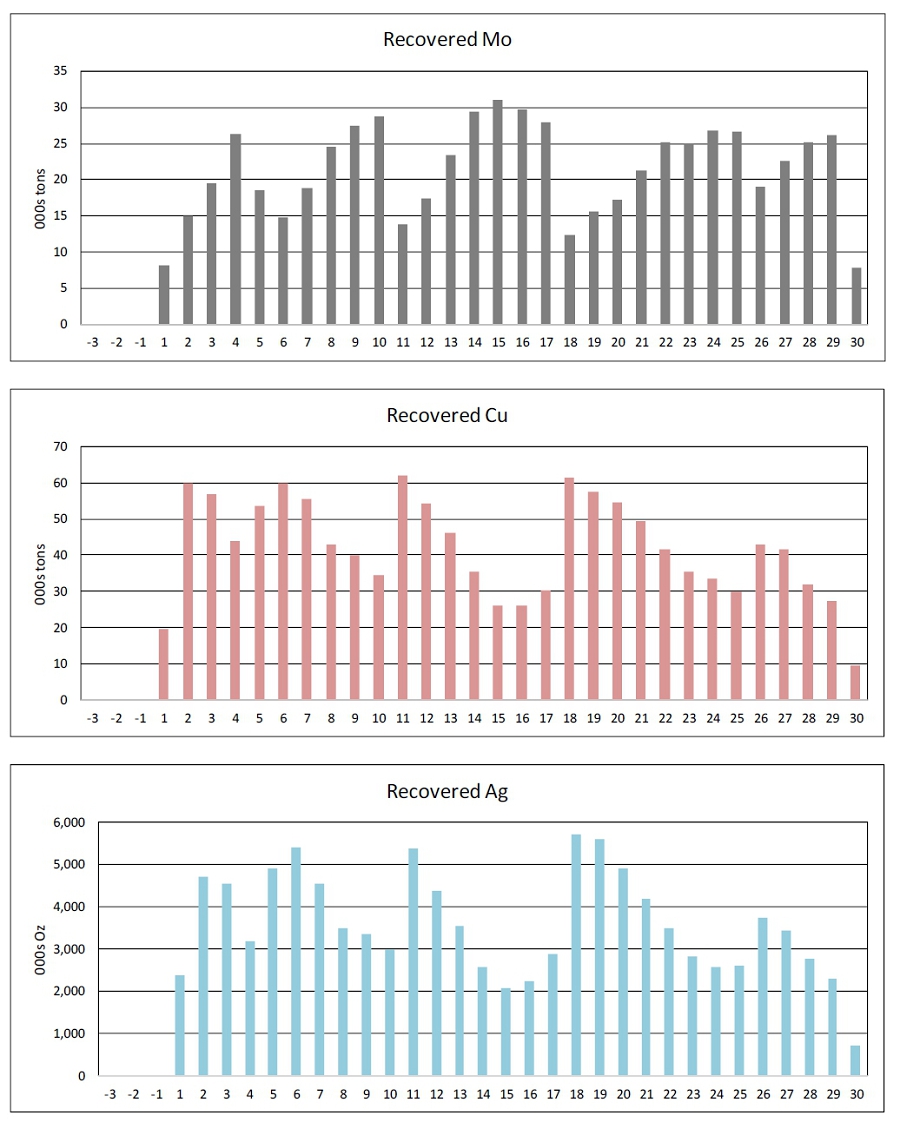
Source: SRK, 2019
Figure 22-2: Metal production schedule graph
Note that by-products rhenium and sulfuric acid are included in revenue calculations but physicals are not reported in this graph-set.
| SMD | Cumo S-k 1300 Technical Report | November 2022 |
Geologic 2CM027.001 CuMoCo. | Page 160 |
Flat non-escalated prices were assumed for the life of the project. Table 22-5 shows the price assumptions used.
Table 22-5: Pricing assumptions for economic analysis
| Commodity | Units | Price |
| Molybdenum metal | $/lb | $15.00 |
| Copper | $/lb | $3.00 |
| Silver | $/oz | $17.50 |
| Rhenium | $/lb | $1,750.00 |
| Sulfuric Acid | $/t | $50.00 |
| 19.7 | Processing Recovery Assumptions |
The estimated processing recoveries were applied to the grades of material delivered to the mill from the different mineralized zones (per Table 14-13). Note that the material has already been upgraded by mineral sorting and particle recovery at this stage and these numbers reflect only recovery of upgraded material.
Table 22-6: Processing recovery assumptions used for economic analysis
Molybdenum Recovery | Copper Recovery | Silver Recovery | Rhenium Recovery | Sulfuric Acid Recovery |
| 91.6% | 76.1% | 70.7% | 90% | 95% |
Note: Rhenium and sulfuric acid recoveries are based on existing plant operation data at Molymet in Chile and Mexico, Jiangxi Copper in China and Sino Platinum Metals in China – all with actual recoveries higher than those used in the report.
Capital costs used for the evaluation are summarized in Table 22-7. Additional detail regarding the estimation of the capital costs is contained in Section 21. Note that the capital costs presented do not include any costs prior to construction commencement. Please refer to Section 26 for an estimate of the pre-feasibility study work program and costs.
| SMD | Cumo S-k 1300 Technical Report | November 2022 |
Geologic 2CM027.001 CuMoCo. | Page 161 |
Table 22-7: Capital cost summary
| Capital Costs | ($M) |
| Mine – Equipment, etc. | 344 |
| Capitalized Mine Operating Costs | 330 |
| Sort Plants | 160 |
| Mill | 1,293 |
| Roaster | 208 |
| Tailings | 22 |
| Infrastructure | 76 |
| Total Initial Capital Directs | 2,433 |
| | |
| Contingency on Initial Capital Directs (excl Mining) | 176 |
| | |
| Indirects | |
| Mine | 15 |
| Plant (incl. Sort) | 354 |
| Roaster | 81 |
| Infrastructure | 14 |
| Total Initial Capital Indirects | 464 |
| | |
| Sustaining Capital | |
| Mine | 428 |
| Sort Plants | 42 |
| Mill | 349 |
| Roaster | 56 |
| Tailings | 84 |
| Infrastructure | 10 |
| Total Sustaining Capital | 970 |
| | |
| Closure and Reclamation | 150 |
| | |
| Total Capital Costs | 4,193 |
| | |
| Initial Capex | 3,071 |
| Sustaining and Expansion Capex | 972 |
| Closure | 150 |
| SMD | Cumo S-k 1300 Technical Report | November 2022 |
Geologic 2CM027.001 CuMoCo. | Page 162 |
Operating costs (Opex) are summarized in Table 22-8. The capitalized Opex is pre-stripping, which has been re-allocated and included in the mining capital costs shown in Table 22-8. The unit costs are expressed as total operating costs (before re-allocation) divided by total tonnage.
Table 22-8: Operating costs summary
| Operating Costs | LOM ($M) | Unit Rates ($/t) | Unit Rates
($/lb Mo.Eq.) |
| Mining | 5,797 | $3.66 | $2.99 |
| Bulk Sort | 778 | $0.49 | $0.40 |
| Middling Sort | 192 | $0.12 | $0.10 |
| Processing | 7,042 | $4.45 | $3.63 |
| Sort Waste Delivery | 395 | $0.25 | $0.20 |
| G&A | 805 | $0.51 | $0.42 |
| Less Capitalized Operating Costs | -329 | -$0.21 | -$0.17 |
| Total Operating Costs | 14,680 | $9.28 | $7.57 |
Note: MoEq lbs = (Revenue from recovered, payable metal plus by-products before deduction of Royalty TCRC and freight)/(Price of Mo per lb)
The operating cost net of by-product credits (i.e. net revenue from by-products deducted from total opex) is estimated at $4.67 per pound of molybdenum produced, based on the price assumptions for by-products shown in Table 22-5.
No royalties were applied to project for economic analysis.
Corporate taxation in the United States is extremely complex. For this study, the taxation was modeled in a highly simplified manner, as is appropriate for a Initial assesment level of study. Depreciation was also modeled in a simplified fashion, suitable for a Initial assesment evaluation. The project valuation is relatively insensitive to variations in depreciation treatment. A total tax rate of approximately 22% was modeled.
Off-site costs (concentrate freight, port handling, treatment charges and refining charges) were deducted from payable revenue. The basis for the charges is summarized in Section 19.
| SMD | Cumo S-k 1300 Technical Report | November 2022 |
Geologic 2CM027.001 CuMoCo. | Page 163 |
| 19.13 | Sensitivity Analysis |
The project as currently characterized returns a positive NPV at an 8% discount rate. This indicated the potential of the deposit to support an economic project (note cautionary statements in Section 22.1).
Table 22-9 to Table 22-12 summarize the sensitivity of the project NPV ($B at 8% discount rate) to variations in key input assumptions across a change of +/-20%.
Mineral resources are not reserves and do not have demonstrated economic viability.
Table 22-9: Two-factor sensitivity (NPV(8%) in $M) – Capex and Opex
| Post Tax NPV | Opex | | | | | | |
| -30% | -20% | -10% | 0% | 10% | 20% | 30% |
| Capital | -30% | $2,646.6 | $2,287.5 | $1,926.6 | $1,565.2 | $1,204.5 | $844.3 | $478.2 |
| -15% | $2,254.1 | $1,892.8 | $1,531.4 | $1,169.2 | $804.0 | $436.8 | $67.5 |
| 0% | $1,858.9 | $1,497.1 | $1,132.7 | $764.6 | $395.4 | $25.4 | ($346.7) |
| 15% | $1,461.1 | $1,095.1 | $726.1 | $355.8 | ($16.7) | ($389.1) | ($764.6) |
| 30% | $1,057.6 | $687.7 | $316.9 | ($56.5) | ($431.4) | ($806.4) | ($1,187.8) |
| 45% | $649.2 | $278.0 | ($95.4) | ($471.4) | ($848.6) | ($1,228.1) | ($1,615.8) |
| 60% | $239.1 | ($134.3) | ($510.3) | ($888.2) | ($1,269.0) | ($1,654.8) | ($2,045.8) |
Table 22-10: Two-factor sensitivity (NPV(8%) in $M) – Capex and metal prices
| Post Tax NPV | Price (all metals) |
| -30% | -20% | -10% | 0% | 10% | 20% | 30% |
| Capital | -30% | ($506.3) | $195.9 | $885.6 | $1,565.2 | $2,245.7 | $2,923.3 | $3,601.5 |
| -15% | ($933.7) | ($217.5) | $479.0 | $1,169.2 | $1,850.5 | $2,531.8 | $3,211.5 |
| 0% | ($1,365.2) | ($634.8) | $68.1 | $764.6 | $1,454.6 | $2,136.6 | $2,818.7 |
| 15% | ($1,803.9) | ($1,058.4) | ($346.1) | $355.8 | $1,051.9 | $1,740.7 | $2,423.5 |
| 30% | ($2,247.3) | ($1,486.9) | ($763.2) | ($56.5) | $643.6 | $1,338.9 | $2,027.7 |
| 45% | ($2,693.1) | ($1,917.8) | ($1,184.3) | ($471.4) | $233.3 | $932.1 | $1,626.7 |
| 60% | ($3,141.5) | ($2,352.4) | ($1,610.5) | ($888.2) | ($179.1) | $523.5 | $1,221.4 |
Table 22-11: Two-factor sensitivity (NPV(8%) in $M) – Opex and metal prices
| Post Tax NPV | Price (all metals) |
| -30% | -20% | -10% | 0% | 10% | 20% | 30% |
| Opex | -30% | ($630.4) | $74.4 | $771.0 | $1,461.1 | $2,144.2 | $2,825.4 | $3,507.6 |
| -20% | ($1,012.4) | ($300.4) | $401.0 | $1,095.1 | $1,782.5 | $2,464.1 | $3,146.2 |
| -10% | ($1,402.0) | ($676.9) | $27.9 | $726.1 | $1,418.5 | $2,102.7 | $2,784.9 |
| 0% | ($1,803.9) | ($1,058.4) | ($346.1) | $355.8 | $1,051.9 | $1,740.7 | $2,423.5 |
| 10% | ($2,223.5) | ($1,448.8) | ($721.0) | ($16.7) | $682.1 | $1,376.5 | $2,062.1 |
| 20% | ($2,649.3) | ($1,851.4) | ($1,103.6) | ($389.1) | $311.7 | $1,009.0 | $1,699.8 |
| 30% | ($3,062.8) | ($2,267.6) | ($1,494.6) | ($764.6) | ($58.5) | $639.2 | $1,334.9 |
Table 22-12: Sensitivity (NPV(8%) in $M) – Individual metal prices
| Post Tax NPV | Metal Prices |
| -30% | -20% | -10% | 0% | 10% | 20% | 30% |
| Molybdenum Price | $10.50 | $12.00 | $13.50 | $15.00 | $16.50 | $18.00 | $19.50 |
| Post-tax NPV ($M) | -$1,008 | -$548 | -$96 | $356 | $804 | $1,251 | $1,694 |
| Copper Price | $2.10 | $2.40 | $2.70 | $3.00 | $3.30 | $3.60 | $3.90 |
| Post-tax NPV ($M) | -$228 | -$33 | $161 | $356 | $549 | $741 | $933 |
| Silver Price | $12.25 | $14.00 | $15.75 | $17.50 | $19.25 | $21.00 | $22.75 |
| Post-tax NPV ($M) | $220 | $265 | $311 | $356 | $401 | $446 | $490 |
| SMD | Cumo S-k 1300 Technical Report | November 2022 |
Geologic 2CM027.001 CuMoCo. | Page 164 |
Figure 22-4 shows how the project NPV varies as individual commodity prices are varied across a range of +/-30%. Molybdenum, being the main source of revenue, demonstrates greater sensitivity.
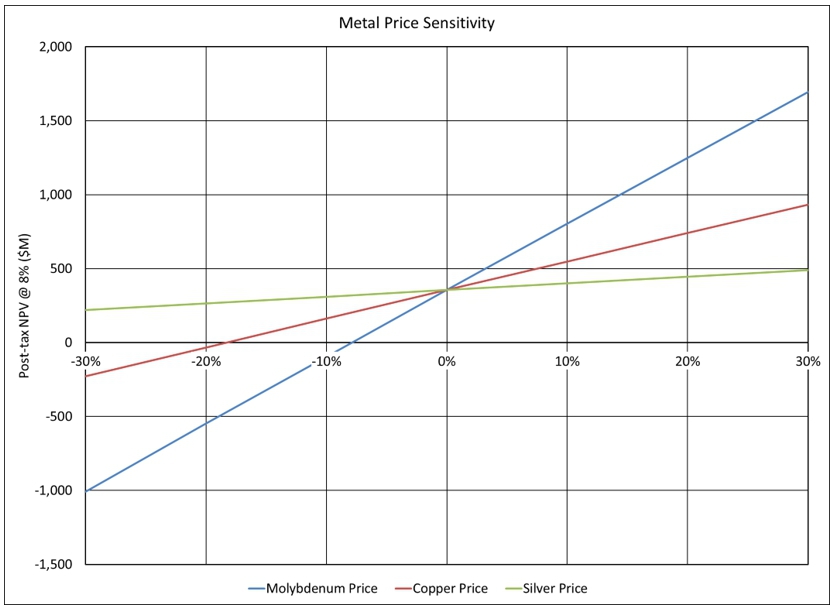
Source: SRK, 2019
Figure 22-3: Metals price sensitivity – net present value
Figure 22-4 shows how the project NPV varies as price and operating costs are varied across a range of +/-30%. Capital costs are varied across a range of -20% to 40%. As is common to all minerals industry projects, commodity price is a highly significant driver of value.
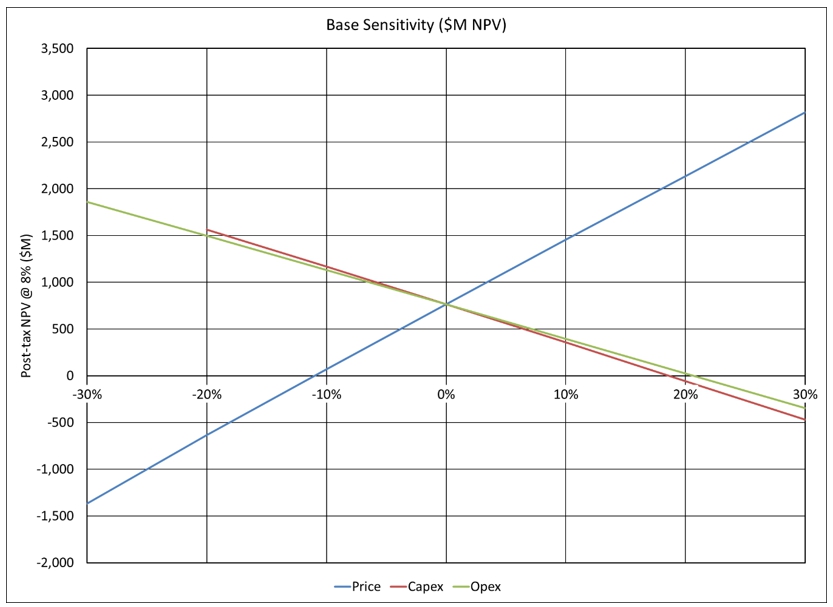
Source: SRK 2019
Figure 22-4: Single factor sensitivity – net present value
| SMD | Cumo S-k 1300 Technical Report | November 2022 |
Geologic 2CM027.001 CuMoCo. | Page 165 |
There are no adjacent properties applicable to the CuMo project for disclosure in this report
| 21 | Other Relevant Data and Information |
There is no other relevant data available about the CuMo project.
| 22 | Interpretations and Conclusions |
The CuMo project hosts a measured mineral resource, at a $5.00/t RCV cut-off of 0.3 billion tons at grades of 0.081% MoS2, 0.076% Cu, 2.09 ppm Ag, and 0.030 ppm Re.
The CuMo project also hosts an indicated mineral resource, at a $5.00/t RCV cut-off of 1.97 billion tons at grades of 0.053% MoS2, 0.085% Cu, 2.57 ppm Ag, and 0.019 ppm Re.
There is a further inferred resource of 2.56 billion tons at grades of 0.048% MoS2, 0.067% Cu, 2.13 ppm Ag, 0.017 ppm Re.
It is noted that the convention for the CuMo project is to assay for elemental molybdenum to report %Mo, but then this is multiplied by 1.6681 to calculate %MoS2 in resource estimation and mine planning. Thus, the molybdenum grades for %MoS2 are 1.6681 times that for %Mo.
Mineral resources that are not mineral reserves do not have demonstrated economic viability.
The CuMo project is to be developed as a large-scale open pit operation, leveraging economies of scale in large mining equipment and optimization of truck hauls to reduce operating costs. It should take full advantage of emerging autonomous machine operation to further improve costs. In this Initial assesment, the author has assumed autonomous operation of both the truck and drill fleets.
The author conducted limited investigation into mass material movement out of the pit (such as Doppelmayr RailCon and Dos Santos sandwich-belt high-angle conveyors). While promising, trade-off studies and further evaluations are required for inclusion in the project development strategy.
The author investigated the application of bulk sorting to the CuMo project and found it an appropriate technology for the mineralization at CuMo. There is sufficient heterogeneity at sub-bench scale (i.e. at the 10 ft interval of exploration hole sampling) to warrant the consideration of bulk sorting.
Current bulk sorting requires consideration of batches of conveyed material, up to 30 seconds, for discretization. To improve sorting at smaller scales, a multi-stage bulk sorting plant has been conceptualized, which provides for three stages of splitting and sorting of the sort feed to achieve adequate segregation of waste, mill feed and middlings material.
The author reviewed particle sorting analysis on 400 quarter-core samples across the different CuMo mineralized zones. This demonstrated heterogeneity which would make particle sorting attractive, but not at the scale envisioned for the CuMo project. However, with bulk sorting providing reduced volumes for particle sort feed (i.e. the middlings stream), particle sorting becomes more viable.
| SMD | Cumo S-k 1300 Technical Report | November 2022 |
Geologic 2CM027.001 CuMoCo. | Page 166 |
The project as currently characterized returns a positive NPV at an 8% discount rate. This indicated the potential of the deposit to support an economic project.
The Initial assessment described herein is preliminary in nature and is partly based on inferred mineral resources that are considered too speculative geologically to have the economic considerations applied to them that would enable them to be categorized as mineral reserves, and there is no certainty that the initial assessment based on these mineral resources will be realized.
The mineral resource is supported by exploration results, test-work and modelling. As with any mineral resource estimate there is uncertainty inherent in the estimation process. There is a risk that the grades and metallurgical recoveries may be lower than currently modelled. There is also a risk that the interpretation of the results is inaccurate and that less mineralized material is present than is currently modelled.
Additional exploration and test-work will reduce this risk as the project is advanced.
The mining concepts for CuMo are largely proven. The adoption of autonomous equipment does possess some risk in that federal and local regulators may require extensive efforts by proponents to ensure the safety of their operations.
The CuMo open pit is envisioned to be a large, deep pit (up to 3,500 ft deep). With this comes the potential geotechnical risk for wall failures. While the author has assumed a relatively flat overall wall angle for the Initial assesment (37°), there may be risks associated with yet unknown rock mass or structural geology conditions that may require consideration of even flatter slopes in places.
The technology envisioned in this Initial assesment for bulk sorting, PGNAA, has had limited application to molybdenum-copper deposits. While demonstrated for some low-grade copper-molybdenum deposits, testing is required to verify that molybdenum is measurable at the specific grades envisioned for CuMo.
Additional testing is required to obtain the final results expected from both bulk and particle sorting.
There is a risk that achieved recoveries could be lower than estimated, that throughputs will not be achieved and that costs may be higher than modelled. The process recovery, throughput and cost estimates will be refined as part of the pre-feasibility study.
This project also includes the installation of a large quantity of particle sorting machines which, to the knowledge of the author, is beyond the scale of any currently operating concentrators.
| SMD | Cumo S-k 1300 Technical Report | November 2022 |
Geologic 2CM027.001 CuMoCo. | Page 167 |
| 22.2.5 | Project Infrastructure |
The planned mine will be a green-fields site and requires construction of mine and process-related infrastructure including the TSF. Access roads in and around the project site will be required. There is a risk that the designs, costs and implementation timelines for the provision of this infrastructure may not be as anticipated, increasing costs and schedule.
At this time, no issues were identified that would materially impact the ability to eventually extract mineral resources at the project. There is a risk that the mining plan of operations would identify and characterize issues that may lengthen the timeline and increase the costs of permitting the project. Note that the Initial assesment described in this report does not quantify the timeline and costs for the pre-construction and permitting activities.
Previous environmental analyses have identified the presence of a rare plant Sacajawea’s bitterroot , and potential habitat for Endangered Species Act wildlife, and USFS sensitive species. These potential issues will need to be analyzed and disclosed in NEPA documents and potentially mitigated.
The mine will be located in an area used for weekend summer dispersed recreation and fall big-game hunting and is well-known in the Boise area. Organized environmental groups such as the Idaho Conservation League and Sierra Club are keeping their constituents informed so as to coordinate opposition to the project. As such, well-funded, organized opposition to mining activities should be anticipated.
Project Strategy Risk
Overall, the author considers that the likelihood of a major revision to project strategy emerging from the pre-feasibility study to be moderate. Mineral sorting as contemplated in this study is not a mature technology, and there is a risk that the assumptions used may not prove accurate. Elimination of the mineral sorting pre-process from the strategy has the potential to reduce the economic proposition of the project.
Commodity Price Risk
There is a risk that commodity prices may not be consistent with assumptions made in this study. In particular, molybdenum, which contributes the majority of project value is historically subject to significant price volatility.
Capital Cost Risk
There is a risk that the capital required to build and operate the project may be higher than that forecast in this study. The author recommends that the precision of the estimates be refined at pre-feasibility study and feasibility study before commitment to project construction is made.
| SMD | Cumo S-k 1300 Technical Report | November 2022 |
Geologic 2CM027.001 CuMoCo. | Page 168 |
Operating Cost Risk
There is a risk that the operating costs incurred to operate the project may be higher than that forecast in this study. The author notes that variability in the operating cost drivers (productivity, input costs and labor costs) over time is expected. The analysis assumes constant conditions but is best thought of as reflecting an expectation of average costs. The authors recommend that the precision of the estimates be refined at pre-feasibility and feasibility study stages prior to commitment to project construction.
Schedule Risk
There is a risk that the schedule to build the project may vary from that assumed in the study. This is an asymmetrical risk, with significantly more downside scope than upside. This risk is exacerbated by the seasonality of the location, with somewhat difficult construction conditions occurring in some winter months. Smalls delays have the potential to be more significant than might otherwise be the case if they push critical path activities into winter months, thereby incurring a much longer delay.
Process Recovery Risk
There is a risk that achieved recoveries could be lower than estimated, reducing the revenue and economic returns of the project. The process recovery estimates will be refined as part of the pre-feasibility study and feasibility study.
Permitting and Pre-construction Schedule Risk
This was not explicitly considered for the purposes of this study in the economic analysis as the analysis is conducted only from the commencement of construction. Nevertheless, the risk of longer-than-anticipated permitting timeline will reduce the project value is considered from “today” forward.
| 22.3 | Project Opportunities |
The exploration drilling and thus mineral resource model for CuMo is constrained on the western extents of the deposit. There is opportunity with increased exploration to expand the resource to the west, thus offering either more process feed within the current envisioned open pit or increasing the size of the open pit to the west. This expansion can be done with only minimal effects on the location of the mill, sort plant or crusher.
With increased knowledge of the rock mass and structural geology, through additional geotechnical field programs and investigation, there is potential to steepen the wall angles for CuMo.
Further consideration of high angle conveying solutions in combination with semi-mobile crushing and conveying (IPCC) concepts could highlight opportunities for cost savings at CuMo. Applying IPCC to sort feed, which needs to be crushed either way and is up to 50% of the mined material, poses the greatest opportunity.
| SMD | Cumo S-k 1300 Technical Report | November 2022 |
Geologic 2CM027.001 CuMoCo. | Page 169 |
The bulk sorting analysis was conducted on drill core that was sampled on a standard 10 ft interval. Thus, heterogeneity could only be assessed down to this scale. With multiple stage sorting and splitting, smaller size packets of material could be measured. As heterogeneity increases with reduced scale, there is potential that better segregation of waste, mill feed and middlings is possible. The opportunity would be for increased waste rejection and ultimately reduced middlings fractions to improve the economics of the project.
Ultimately, the potential for exploitation of the heterogeneity of the deposit may not be firmly quantified by way of studies conducted on exploration-level data. Much higher-resolution sampling and sorting may be possible at an operational scale. This has the potential to enhance project economics, but the quantum of that improvement is difficult to quantify.
The field of mineral-sorting is the subject of significant research and development. There exists an opportunity for this project to exploit improvements in technology.
Additional metallurgical work to determine optimum grind size (the current assessment is based on the finest grind tested to date), analyze recoveries of the various metals, and analyze the effects of the higher grade coming from the mineral sorters on metal recoveries. This has the potential to improve project economics.
Optimization of reagents to reduce costs and improve metallurgical recoveries has the potential to improve recoveries.
There may be opportunity to economically recover tungsten from the mineralized material.
| 22.3.5 | Project Infrastructure |
Further studies may allow for optimization of infrastructure design, costing and schedule. Whilst optimization is worth pursuing, the author views modification to the infrastructure concepts to be unlikely to materially affect the economic proposition at a strategic level for the project.
| 22.3.6 | Economic Opportunities |
Real Option Value
In the case of a large, long-life open-pit mine such as is contemplated for the CuMo project, there exists significant optionality that can be leveraged to improve project cashflows and values. The simple sensitivity analysis conducted in Section 22.13 assumes a constant operating strategy, even as assumptions are varied. In practice, management has the option to alter strategy in response to those variations. Downsides can be mitigated, and upsides can be leveraged for greater returns.
It is also expected that the mine would be run using a dynamic cut-off policy where sorting strategies and cut-offs, mill-feed cut-offs, stockpiling strategies and mining rates will all be varied in real time to maximize returns as prices and costs vary. The benefits of this strategy are not reflected in the central estimate approach to valuation summarized in this report.
| SMD | Cumo S-k 1300 Technical Report | November 2022 |
Geologic 2CM027.001 CuMoCo. | Page 170 |
Project Strategy Opportunity
While the probability of a major revision to project strategy can be considered moderate, careful consideration and revision of the strategic decisions should be a feature of studies going forward. In particular, effort should be made to enhance the optionality of the project, particularly where this is low cost.
Commodity Price Opportunity
There is a risk that commodity prices may not be consistent with assumptions made in this study. Higher prices, both realized and forecast would lead to re-optimization of the mine and processing plans with a potential to create additional value beyond that shown by the sensitivity analysis summarized in Section 22.11.
Capital Cost Opportunity
Opportunities to reduce or defer capital expenditure may be realized in future studies. Care should be taken when considering the relationship between lower capital opportunities and technical risk to the project.
Operating Cost Opportunity
Operating costs may be lower than forecast for the purposes of this study. Lower costs should feed into both strategic and short-term mine planning, to allow optimization of stockpiling, sorting and mill feed strategies.
Schedule Opportunity
This risk is highly asymmetric. The authors consider that the opportunity to execute a significantly shorter construction program is low. The authors caution that optimized schedules with multiple critical or near-critical path activities will contain additional embedded risks.
Process Recovery Opportunity
Further metallurgical test-work will allow for optimization of the process flow sheet and plant design in the pre-feasibility and feasibility studies. Better than planned recoveries are possible.
Pit Slope Angle Opportunity
This is not considered to be a significant opportunity from an economic perspective. Strip ratios are relatively low, and incremental change in waste-movement volumes do not impact the overall project economics significantly.
| SMD | Cumo S-k 1300 Technical Report | November 2022 |
Geologic 2CM027.001 CuMoCo. | Page 171 |
Exploration work consisting mainly of drilling is required to reach pre-feasibility. It is estimated that a total of 33 additional holes for 71,000 ft plus an additional five geotechnical holes for 12,000 ft on the deposit plus additional 74,800 ft allocated to condemnation drilling of waste dump, mill site and tailings pond areas, making a total of 157,800 ft of drilling budgeted. This drilling is broken into the following categories.
| ● | Orientated geotechnical drilling – requires oriented core recovery system |
| ● | Drilling for metallurgical sample – large diameter hole (PQ size) recommended |
| | | |
| ● | Condemnation drilling waste dump, mill and tailings site |
The shortest time to complete this work will be two seasons using four drill rigs each season.
The author provides these recommendations for the next steps of geotechnical assessment:
| ● | Geotechnical database QA/QC assessment (to address the inconsistencies and potentially poor data observed in the existing data set) |
| – | Select a sub-set (~10%) of resource drill holes that give good spatial coverage of the proposed pit walls, and from multiple drilling campaigns |
| | | |
| – | Undertake quantitative basic geotechnical logging using the full core photographs of these drill holes (TCR, SCR, RQD and FF/m) |
| | | |
| – | FF/m vs RQD plots for both data-sets |
| | | |
| – | Comparison of the values in the database with the photo-logged values |
| | | |
| – | Assessment of differences in order to determine whether variance is systematic or random, and consequently decide on the respective approach to address e.g. apply correction factor, re-logging more of the drill holes |
| | | |
| – | Qualitative assessment of the rock susceptibility to deterioration by comparing core in the photos (fresh), to the current condition of the stored core (aged) |
| ● | Major structures assessment |
| – | Log the photos of the core for major structures |
| | | |
| – | Develop conceptual integrated litho-structural 3-D model |
| SMD | Cumo S-k 1300 Technical Report | November 2022 |
Geologic 2CM027.001 CuMoCo. | Page 172 |
| | ● | Geotechnical-specific diamond-cored drill holes targeted to provide coverage of the proposed interim and ultimate pit walls, and compatible with the pit depth |
| | – | Geotechnical logging to RMRB89 system (historical logging to RMRL90 which is typically for underground mine applications) |
| | | |
| | – | Field (empirical and point load) and laboratory (uniaxial and triaxial compressive strength and direct shear) testing of fresh core to determine intact rock strength |
| | | |
| | – | Calculate RMR values and conduct comparison with lithology, alteration and mineralogy zones of the 3-D geology model to establish broad geotechnical domains |
| | | |
| | – | Establish pit sectors and domain-representative sections to conduct pit slope stability analyses and select pit design angles |
The author recommends further study of the application of high angle conveying of sort feed at CuMo.
The author further recommends the continued consideration of autonomous haulage for CuMo, with commensurate refinement of performance parameters and costs.
The author recommends that CuMoCo engage with bulk and particle sorting technology providers to advance testing of penetrative technologies (e.g. PGNAA) and other mineral sensing techniques for the measurement of molybdenum in lower grade applications.
Metallurgical aspects to be studied were highlighted in the preliminary metallurgical analysis, some of which require larger samples to finalize the detailed flow sheet and determine how many cleaning stages will be required for flotation, as well as to confirm the total number and configuration of particle sorting units required. One important part of the analysis is a grinding versus recoverability study, as in the previous study only two grinding sizes were studied: coarse and fine. The fine grind proved to be more profitable despite the increase in costs. Further study with multiple grinding size options is required to determine an optimum grinding system.
Work will consist of collecting and analyzing a large, 2+ ton bulk sample to determine the optimum flow sheet for the deposit; and a variability study to analyze variations within the deposit. A total of 100 to 150 twenty-
kilogram samples will be used for the variability study.
It is recommended that single stage SAG milling to 71 microns be evaluated as a possible way to reduce capital costs of the multiple grinding circuits. If a slightly coarser primary grind can be shown to be feasible, this will allow smaller grinding line modules to be selected. Production from a single line SAG plant can then be doubled with the addition of a ball mill, without changing the feed end storage or feed conveying equipment. This would lead to starting up the plant at much lower tonnage and create options to increase production as needed.
| SMD | Cumo S-k 1300 Technical Report | November 2022 |
Geologic 2CM027.001 CuMoCo. | Page 173 |
It is also recommended that the potential recovery of tungsten as an economic mineral be considered in future test-work planning.
Engineering studies, including TSF design and potential water management and treatment design, including:
| | ● | Updating the TSF and Clear Creek waste facility designs based on field investigation results |
| | | |
| | ● | Developing tailings deposition plan and waste placement sequence to match pit development and mill output |
| | | |
| | ● | Detailed analysis of the water and load balance to predict the accumulation of mill reagents in the process water circuit from the tailings |
A mining plan of operations and reclamation cost estimate must be prepared to identify locations of the mine, waste rock dumps, roads (haul and access), power and water line corridors from the source to the point of use, mill, tailings storage facility, and other support facilities. Operating plans must be developed in conjunction with the mining plan of operations. ICMC should develop robust reclamation and closure plans for the facilities. ICMC should also begin acquiring any necessary water rights. Stakeholder outreach should continue.
Once the facility locations have been determined, ICMC should coordinate with state and federal agencies to identify the baseline studies that will need to be completed to support the development of an environmental impact statement and initiate those studies.
| 23.8 | Plan and Budget for Additional Work |
Table 26-1 sets out a summary of work expected to be completed prior to final permitting being completed. The estimated time frame for this work program is three years.
| SMD | Cumo S-k 1300 Technical Report | November 2022 |
Geologic 2CM027.001 CuMoCo. | Page 174 |
Table 26-1: Budget for additional work
| Item | Additional Information | Budget (000s $) |
| Diamond Drilling | | |
| Delineation, infill, metallurgy | 48,097 m (157,800 ft) @ $100/ft | 15,780 |
| | | |
| Road Construction | 2 km @ $50,000/km | 100 |
| | | |
| Sample Preparation and Analysis | 8,800 @ $60 each | 528 |
| Metallurgical Testing | Sample Collection, etc. | 125 |
| | Batch Round of Testing | 1,000 |
| | Variability Test-work | 1,200 |
| Land Acquisition and Staking Costs | | 8,000 |
| Environmental Studies | Environmental Assessment | 713 |
| | Baseline Studies Startup | 12,500 |
| | Environmental Plan of Operations | 800 |
| | Environmental Impact Statement | 23,500 |
| | Permitting | 3,000 |
| Engineering Studies Scoping | Mill Site, Tailings Site Analysis | 550 |
| | Intergoverment Task Force Creation | 500 |
| | Mining Plan of Operations | 1,200 |
| | Pre-feasibility Study | 5,500 |
| Mobilization-Demobilization | | 427 |
| Road Maintenance | | 325 |
| Supervision and Project Management | Supervision | 225 |
| | Corporate Manager | 360 |
| | Project Manager | 240 |
| | Assistant Geologist(2) | 364 |
| | Technicians (12) | 1,174 |
| Vehicles | 5 Vehicles | 150 |
| Accommodation and Food | 30 Personnel | 760 |
| Travel | | 42 |
| Project Office and Warehouse | | 1,225 |
| Land Filing Fees | Current BLM: $155/claim/year | 87 |
| Land Filing Fees | Projected Additional Filing Fees | 256 |
| | | |
| Consultants | (Mining, Metallurgical and Marketing) | 575 |
| Resource Modeling | | 1,650 |
| Public Relations and Project | Public Relations and Legal, etc. | 2,550 |
| Presentation | Liaison County and State Officials | 1,250 |
| Subtotal | | 86,655 |
| Contingency | | 13,345 |
| Total | | 100,000 |
| SMD | Cumo S-k 1300 Technical Report | November 2022 |
Geologic 2CM027.001 CuMoCo. | Page 175 |
Anderson, A.L., 1947, Geology and Ore Deposits of the Boise Basin, Idaho, USGS Bull 944C.
Armstrong, R.L., Taubeneck, W.H., Hales, P.O., 1977. Rb–Sr and K–Ar geochronometry of Mesozoic granitic rocks and their Sr isotopic composition, Oregon, Washington, and Idaho. Geological Society of America Bulletin 88, 397–411.
Arseneau, G., McCarthy, R., Thomas, A., Boese, C., Winkelmann, N., Sawyer, V., Giroux, G., Starkey, J., Preliminary Economic Assessment & NI 43-101 Technical Report for the CuMo Project, USA. Interim technical report, November 2019.
Ausenco Canada Inc., 2009, CUMO Project – Throughput Scoping Study Report, November 27, 2009.
Baker, D.J., 1985, Geology of the CUMO Molybdenum-Copper System, Boise County, Idaho, Geological Society of America, Abstracts with Programs 1985, Rocky Mountain Section, No. 70043, p 205.
Baker, D.J., 1983, The CUMO Molybdenite System, Boise, Idaho, A Comprehensive Summary”, Climax Molybdenum Company, April 1983, unpublished.
Bennett, E.H., 1986, Relationship of the trans-Challis fault system in central Idaho to Eocene and Basin and Range extensions, Geology, v. 14, p. 481-484.
Braun, R.M., Holmgren, J,A,, Giroux, G.H., Kehmeier, R., Khoury, C., 2009, CUMO Property Preliminary Economic Assessment, Boise County, Idaho, for Mosquito Consolidatd Gold Mines Ltd., an Ausenco National Instrument 43-101 report dated November 18, 2009.
Carten, R.B., White, W.H. and Stein, H.J., 1993, High-Grade Granite-Related Molybdenite Systems: Classification and Origin, in Kirkham, R.V., Sinclair, W.D., Thorpe, R.I. and Duke, J.M., eds., Mineral Deposit Modeling; Geological Association of Canada, Special Paper 40, p. 521-544.
CPM Group Molybdenum Market Outlook reports 2017 and 2018, CPM Group, New York, private reports available by subscription only.
Giroux, G. Cavey, G. and Gunning, D., 2005, Summary Report on the CUMO Molybdenum Property, Boise County, Idaho, for Kobex Resources LTD., unpublished.
Giroux, G. Dykes, S. and Place, J.H. 2015, Summary Report on the CUMO Molybdenum Property, Boise County, Idaho. A national instrument 43-101 Report for American CuMo Mining Corp.
Hildenbrand, T.G., Berger, B. and Jachens, R.C., 2000, Regional Crustal Structures and Their Relationship to the Distribution of Ore Deposits in the Western United States, Based on Magnetic and Gravity Data, Econ. Geol. v.95, p. 1583-1603.
Holmgren, J. and Giroux, G. 2008. Summary Report on the CUMO Property, Boise County, Idaho. NI 43-101 Technical Report for Mosquito Consolidated Gold Mines Ltd., posted at www.sedar.com
Idaho Department of Water Resources. 2018. Water District Descriptions, https://idwr.idaho.gov/ExternalReports/WaterDistrictDescriptionReport.pdf, accessed November 20, 2018.
Johnson, B. R. and Raines G. L., 1996, Digital representation of the Idaho state geologic map: a contribution to the Interior Columbia River Basin Ecosystem Management Project; USGS Open File Report 95-690.
Killsgaard, T.H, Stanford, L.R. and Lewis, R.S., 2006, Geologic Map of the Deadwood River 30 x 60 Minute Quadrangle, Idaho; Idaho Geological Survey, Geologic Map 45.
Killsgaard, T.H, Stanford, L.R. and Lewis, R.S., 2001, Geologic Map of the Idaho City 30 x 60 Minute Quadrangle, Idaho; Idaho Geological Survey, Geologic Map 29.
Killsgaard, T.H, Fisher, F.S. and Bennet, E.H., 1989, Gold-Silver Deposits Associated with the Trans-Challis Fault System, Idaho; USGS Bull 1857-B, p. B22-B44
Killsgaard, T.H, and Lewis, R.S., 1985, Plutonic Rocks of Cretaceous Age and Faults in the Atlanta Lobe of the Idaho Batholith, Challis Quadrangle; USGS Bull 1658 A-S, p. 29-42.
Klein, T.L., 2004, Mineral deposit data for epigenetic base-and precious-metal and uranium-thorium deposits in south-central and southwestern Montana and southern and central Idaho, USGS Open File Report 2004-1005.
| SMD | Cumo S-k 1300 Technical Report | November 2022 |
Geologic 2CM027.001 CuMoCo. | Page 176 |
Link, P.K., 2002, Geological Map of Boise County, Idaho; in Digital Atlas of Idaho, website: http://imnh.isu.edu/digitalatlas/counties/geomaps/geomap.htm
Lipsett, J. and Simpson Jr, 1973, Analysis of the response by wheat to the application of molybdenum in relation to nitrogen status, Australian Journal of Experimental Agriculture and Animal Husbandry
Lowell, J.D. and Guilbert, J.M. (1970) Lateral and Vertical Alteration-Mineralization Zoning in Porphyry Ore Deposits. Economic Geology, 65, 373-408.
Lund, K., Klein, T.L, O’Neill and J.M., Sims, P.K., 2005, Influence of structure and composition of basement on mineral deposits across Montana and Idaho; EarthScope in the Northern Rockies
Workshop, Program, Session III; website: Mutchler, F.E., Ludington, S. and Bookstrom, A.A., 1999, Giant porphyry-related metal camps of the world — a database, USGS Open File Report 99-556.
O’Neill, J.M., and Lopez, D.A., 1985, Character and regional significance of the Great Falls tectonic zone, east-central Idaho and west-central Montana: American Association of Petroleum Geologists Bulletin, v. 69, p. 437–477.
Panteleyev, A., 1995, Porphyry Cu+/-Mo+/-Au, in “Selected British Columbia Mineral Deposit Profiles, Volume 1 - Metallics and Coal”, Lefebvre, D.V. and Ray, G.E., Editors, British Columbia Ministry of Energy of Employment and Investment, Open File 1995-20, pages 87-92.
Rostad, O.H., 1978, K-Ar dates for mineralization in the White Cloud-Cannivan porphyry molybdenum belt of Idaho-Montana: A discussion: Econ. Geol. v. 73, p. 1366–1367.
Sims, P.K. Lund, K. and Anderson, E., 2005, Precambrian Crystalline Basement Map of Idaho – An Interpretation of Aeromagnetic Anomalies; USGS, Scientific Investigations Map 2884.
Singer, D.A, Berger, V.I., and Moring, B.C., 2005, Porphyry Copper Deposits of the World: Database, Map, and Grade and Tonnage Models, USGS Open File Report 2005-1060.
Spanski, G.T., 2004, Inventory of Significant Mineral Deposit Occurrences in the Headwaters Project Area in Idaho, Western Montana, and Extreme Eastern Oregon and Washington, USGS Open File Report 2004-1038.
SGS, 2009, An Investigation into the Recovery of Molybdenum, Copper and Silver from CUMO samples prepared for Mosquito Consolidated Gold Mines Ltd Project 50004-001
Snowden Mining Industry Consultants (2012), Jones, I., Scott K., Kehmeier, R., and Khoury, C., Resource Estimate Update June 2011, updated June 2012 posted at www.sedar.com
United States Department of Agriculture, Forest Service, 2018. Supplemental Redline Environmental Assessment CuMo Exploration Project, December 2018.
United States Department of Agriculture, Forest Service, 2015. CuMo Exploratory Project Supplemental Environmental Assessment, March 2015.
United States Department of Agriculture, Forest Service, 2011.Environmental Assessment CuMo Project, February 2011.
| SMD | Cumo S-k 1300 Technical Report | November 2022 |
Geologic 2CM027.001 CuMoCo. | Page 177 |
| 25 | Reliance on Other Experts |
In relation to the information contained in Section 4.2 and Section 4.3, The author has performed an independent legal review and verification of land title and tenure information. The author did verify the legality of the underlying agreement(s) that may exist concerning the permits or other agreement(s) between third parties. The authors have relied upon information collated by CuMoCo with regard to legal matters relevant to this report. This reliance is on information as to claim ownership and mineral rights as provided by the United States Bureau of Land Management.
The authors have relied on the USFS and NEPA to examine procedures and status for Sections 4.4 and 20, and various accounting firms have been contacted to confirm the current US Mine tax system used in Sections 21 and 22.
With respect to Section 4.5 The author was informed by CuMoCo that there are no known litigations potentially affecting the CuMo project.
The author has no reason to believe that any of the information as provided by CuMoCo and outlined above is inaccurate or misleading.
| SMD | Cumo S-k 1300 Technical Report | November 2022 |
Geologic 2CM027.001 CuMoCo. | Page 178 |
Appendix 1: Claims List
| Unpatented CuMo Claim List 2018 |
| Item | Claim Name/Number | BLM Serial No. | County Instrument Number | Loc Dt |
| 1 | CUMO #1 | 188031 | 201255 | Mar-05 |
| 2 | CUMO #2 | 188032 | 201256 | Mar-05 |
| 3 | CUMO #3 | 188033 | 201257 | Mar-05 |
| 4 | CUMO #4 | 188034 | 201258 | Mar-05 |
| 5 | CUMO #5 | 188035 | 201259 | Mar-05 |
| 6 | CUMO #6 | 188036 | 201260 | Mar-05 |
| 7 | CUMO #7 | 188037 | 201261 | Mar-05 |
| 8 | CUMO #8 | 188038 | 201262 | Mar-05 |
| 9 | NEW CUMO #9 | 187938 | 199561 | Nov-04 |
| 10 | NEW CUMO #10 | 187939 | 199562 | Nov-04 |
| 11 | NEW CUMO #11 | 187940 | 199563 | Nov-04 |
| 12 | NEW CUMO #12 | 187941 | 199564 | Nov-04 |
| 13 | NEW CUMO #13 | 187942 | 199565 | Oct-04 |
| 14 | NEW CUMO #14 | 187943 | 199566 | Oct-04 |
| 15 | NEW CUMO #15 | 187944 | 199567 | Oct-04 |
| 16 | NEW CUMO #16 | 187945 | 199568 | Oct-04 |
| 17 | NEW CUMO #17 | 187946 | 199569 | Oct-04 |
| 18 | NEW CUMO #18 | 187947 | 199570 | Oct-04 |
| 19 | NEW CUMO #19 | 187948 | 199571 | Oct-04 |
| 20 | NEW CUMO #20 | 187949 | 199572 | Oct-04 |
| 21 | NEW CUMO #21 | 187950 | 199573 | Oct-04 |
| 22 | NEW CUMO #22 | 187951 | 199574 | Nov-04 |
| 23 | NEW CUMO #23 | 187952 | 199774 | Nov-04 |
| 24 | NEW CUMO #24 | 187953 | 199775 | Nov-04 |
| 25 | NEW CUMO #25 | 187954 | 199575 | Nov-04 |
| 26 | NEW CUMO #26 | 187955 | 199576 | Nov-04 |
| 27 | NEW CUMO #27 | 187956 | 199577 | Nov-04 |
| 28 | NEW CUMO #28 | 187957 | 199578 | Nov-04 |
| 29 | NEW CUMO #29 | 187958 | 199579 | Nov-04 |
| 30 | NEW CUMO #30 | 187959 | 199580 | Nov-04 |
| 31 | NEW CUMO #31 | 187960 | 199581 | Nov-04 |
| 32 | NEW CUMO #32 | 187961 | 199582 | Nov-04 |
| 33 | NEW CUMO #33 | 187962 | 199583 | Nov-04 |
| 34 | NEW CUMO #34 | 187963 | 199584 | Nov-04 |
| 35 | NEW CUMO #35 | 187964 | 199585 | Nov-04 |
| 36 | NEW CUMO #36 | 187965 | 199586 | Nov-04 |
| 37 | NEW CUMO #37 | 187966 | 199587 | Nov-04 |
| 38 | NEW CUMO #38 | 187967 | 199588 | Nov-04 |
| 39 | NEW CUMO #39 | 187968 | 199589 | Nov-04 |
| 40 | NEW CUMO #40 | 187969 | 199590 | Nov-04 |
| 41 | NEW CUMO #41 | 187970 | 199591 | Nov-04 |
| 42 | NEW CUMO #42 | 187971 | 199592 | Nov-04 |
| 43 | NEW CUMO #43 | 187972 | 199593 | Nov-04 |
| 44 | NEW CUMO #44 | 187973 | 199594 | Nov-04 |
| 45 | NEW CUMO #45 | 187974 | 199595 | Nov-04 |
| SMD | Cumo S-k 1300 Technical Report | November 2022 |
Geologic 2CM027.001 CuMoCo. | Page 179 |
| Unpatented Cumo Claim List 2018 - Page 2 |
| Item | Claim Name/Number | BLM Serial No. | County Instrument Number | Loc Dt |
| 46 | NEW CUMO #46 | 187975 | 199596 | Nov-04 |
| 47 | NEW CUMO #47 | 187976 | 199597 | Nov-04 |
| 48 | NEW CUMO #48 | 187977 | 199598 | Nov-04 |
| 49 | NEW CUMO #49 | 187978 | 199599 | Nov-04 |
| 50 | NEW CUMO #50 | 187979 | 199600 | Nov-04 |
| 51 | NEW CUMO #51 | 187980 | 199601 | Nov-04 |
| 52 | NEW CUMO #52 | 187981 | 199602 | Nov-04 |
| 53 | NEW CUMO #53 | 187982 | 199603 | Nov-04 |
| 54 | NEW CUMO #54 | 187983 | 199604 | Nov-04 |
| 55 | NEW CUMO #55 | 187984 | 199605 | Nov-04 |
| 56 | NEW CUMO #56 | 187985 | 199606 | Nov-04 |
| 57 | NEW CUMO #57 | 187986 | 199607 | Nov-04 |
| 58 | NEW CUMO #58 | 187987 | 199608 | Nov-04 |
| 59 | NEW CUMO #59 | 187988 | 199609 | Nov-04 |
| 60 | NEW CUMO #60 | 187989 | 199776 | Nov-04 |
| 61 | NEW CUMO #61 | 187990 | 199777 | Nov-04 |
| 62 | CUMO #62 | 188205 | 202147 | May-05 |
| 63 | CUMO #63 | 188206 | 202148 | May-05 |
| 64 | CUMO #64 | 188207 | 202149 | May-05 |
| 65 | CUMO #65 FRACT. | 188208 | 202150 | May-05 |
| 66 | CUMO #66 | 188209 | 202151 | May-05 |
| 67 | CUMO #67 FRACTION | 188210 | 202152 | May-05 |
| 68 | CUMO #68 FRACT. | 188211 | 202153 | May-05 |
| 69 | CUMO #69 FR. | 188212 | 202154 | May-05 |
| 70 | CUMO #70 FRACT. | 188213 | 202155 | May-05 |
| 71 | CUMO #71 | 188214 | 202156 | May-05 |
| 72 | CUMO #72 | 188215 | 202157 | May-05 |
| 73 | CUMO #73 | 188216 | 202158 | May-05 |
| 74 | CUMO #74 | 188217 | 202159 | May-05 |
| 75 | CUMO #75 | 188218 | 202160 | May-05 |
| 76 | CUMO #76 | 188219 | 202161 | May-05 |
| 77 | CUMO #77 | 188220 | 202162 | May-05 |
| 78 | CUMO #78 | 188221 | 202163 | May-05 |
| 79 | CUMO #79 | 188222 | 202164 | May-05 |
| 80 | CUMO #80 | 188223 | 202165 | May-05 |
| 81 | CUMO #81 | 188224 | 202166 | May-05 |
| 82 | CUMO #82 | 188225 | 202167 | May-05 |
| 83 | CUMO #83 | 188226 | 202168 | May-05 |
| 84 | CUMO #84 | 188227 | 202169 | May-05 |
| 85 | CUMO #85 | 188228 | 202271 | May-05 |
| 86 | CUMO #86 | 188229 | 202272 | May-05 |
| 87 | CUMO #87 | 188230 | 202273 | May-05 |
| 88 | CUMO #88 | 188231 | 202274 | May-05 |
| 89 | CUMO #89 | 188232 | 202275 | May-05 |
| 90 | CUMO #90 | 188233 | 202276 | May-05 |
| SMD | Cumo S-k 1300 Technical Report | November 2022 |
Geologic 2CM027.001 CuMoCo. | Page 180 |
| Unpatented Cumo Claim List 2018 - Page 3 |
| Item | Claim Name/Number | BLM Serial No. | County Instrument Number | Loc Dt |
| 91 | CUMO #91 | 188234 | 202277 | May-05 |
| 92 | CUMO #92 | 188235 | 202278 | May-05 |
| 93 | CUMO #93 | 188236 | 202279 | May-05 |
| 94 | CUMO #94 | 188237 | 202281 | May-05 |
| 95 | CUMO #95 | 188238 | 202282 | May-05 |
| 96 | CUMO #98 | 188239 | 202366 | May-05 |
| 97 | CUMO #99 | 188240 | 202367 | May-05 |
| 98 | CUMO #100 | 188241 | 202368 | May-05 |
| 99 | CUMO #101 | 188242 | 202369 | May-05 |
| 100 | CUMO #107 FRACTION | 188244 | 202371 | May-05 |
| 101 | CUMO #109 | 188246 | 202373 | May-05 |
| 102 | CUMO #121 | 188258 | 202283 | May-05 |
| 103 | CUMO #122 | 188259 | 202284 | May-05 |
| 104 | CUMO #123 | 188260 | 202285 | May-05 |
| 105 | CUMO #124 | 188283 | 202286 | May-05 |
| 106 | CUMO #125 | 188261 | 202287 | May-05 |
| 107 | CUMO #126 | 188262 | 202288 | May-05 |
| 108 | CUMO #127 | 188263 | 202289 | May-05 |
| 109 | CUMO #128 | 188264 | 202290 | May-05 |
| 110 | CUMO #132 | 188268 | 202294 | May-05 |
| 111 | CUMO #133 | 188269 | 202295 | May-05 |
| 112 | CUMO #134 | 188270 | 202296 | May-05 |
| 113 | CUMO #135 | 188271 | 202297 | May-05 |
| 114 | CUMO #136 | 188272 | 202298 | May-05 |
| 115 | CUMO #137 | 188273 | 202299 | May-05 |
| 116 | CUMO #138 | 188274 | 202300 | May-05 |
| 117 | CUMO #139 | 188275 | 202301 | May-05 |
| 118 | CUMO #140 | 188276 | 202302 | May-05 |
| 119 | CUMO #141 | 188277 | 202303 | May-05 |
| 120 | CUMO #142 | 188278 | 202304 | May-05 |
| 121 | CUMO #143 | 188279 | 202305 | May-05 |
| 122 | CUMO #144 | 188280 | 202306 | May-05 |
| 123 | CUMO #145 | 188281 | 202307 | May-05 |
| 124 | CUMO #146 | 188282 | 202308 | May-05 |
| 125 | CUMO #147 | 188284 | 202309 | May-05 |
| 126 | CUMO #148 | 188285 | 202310 | May-05 |
| 127 | CUMO #149 FRACT. | 188286 | 202311 | May-05 |
| 128 | CUMO #150 | 188257 | 202312 | May-05 |
| 129 | CUMO #151 FRACT. | 188287 | 202313 | May-05 |
| 130 | CUMO #152 | 188288 | 202314 | May-05 |
| 131 | CUMO #153 | 188289 | 202315 | May-05 |
| 132 | CUMO #154 | 188290 | 202316 | May-05 |
| 133 | CUMO #155 | 188291 | 202317 | May-05 |
| 134 | CUMO #156 | 188292 | 202318 | May-05 |
| 135 | CUMO #157 | 188293 | 202319 | May-05 |
| SMD | Cumo S-k 1300 Technical Report | November 2022 |
Geologic 2CM027.001 CuMoCo. | Page 181 |
Unpatented Cumo Claim List 2018 - Page 4 |
| Item | Claim Name/Number | BLM Serial No. | County Instrument Number | Loc Dt |
| 136 | CUMO #158 | 188294 | 202320 | May-05 |
| 137 | CUMO #159 | 188295 | 202323 | May-05 |
| 138 | CUMO #160 | 188486 | 202321 | May-05 |
| 139 | CUMO #161 | 188491 | 202322 | May-05 |
| 140 | CUMO #176 FRACT. | 188306 | 202324 | May-05 |
| 141 | CUMO #177 FRACT. | 188307 | 202325 | May-05 |
| 142 | CUMO #178 | 188308 | 202326 | May-05 |
| 143 | CUMO #179 | 188309 | 202327 | May-05 |
| 144 | CUMO #180 | 188310 | 202328 | May-05 |
| 145 | CUMO #181 | 188311 | 202329 | May-05 |
| 146 | CUMO #182 FRACT. | 188312 | 202330 | May-05 |
| 147 | CUMO #183 FRACT. | 188313 | 202331 | May-05 |
| 148 | CUMO #184 | 188314 | 202332 | May-05 |
| 149 | CUMO #185 | 188315 | 202333 | May-05 |
| 150 | CUMO #186 | 188316 | 202334 | May-05 |
| 151 | CUMO #187 | 188317 | 202335 | May-05 |
| 152 | CUMO #188 FRACT. | 188318 | 202336 | May-05 |
| 153 | New Cumo 190 Fraction | 203192 | 230231 | Oct-10 |
| 154 | New Cumo 191 Fraction | 203193 | 230232 | Oct-10 |
| 155 | New Cumo 192 Fraction | 203194 | 230233 | Oct-10 |
| 156 | New Cumo 193 Fraction | 203195 | 230234 | Oct-10 |
| 157 | Cumo 194 | 203196 | 230229 | Oct-10 |
| 158 | Cumo 195 Fraction | 203197 | 230230 | Oct-10 |
| 159 | Cumo 196 Fraction | 203198 | 230228 | Oct-10 |
| 160 | Cumo 197 Fraction | 203199 | 230235 | Oct-10 |
| 161 | Cumo 198 Fraction | 203200 | 230236 | Oct-10 |
| 162 | Cumo 199 Fraction | 203201 | 230237 | Oct-10 |
| 163 | Cumo 200 Fraction | 203202 | 230238 | Oct-10 |
| 164 | Cumo 201 Fraction | 203203 | 230239 | Oct-10 |
| 165 | Sharon #1 | 177221 | 159054 | Oct-94 |
| 166 | Sharon #2 | 177222 | 159055 | Oct-94 |
| 167 | Sharon #3 | 177223 | 159056 | Oct-94 |
| 168 | Sharon#4 | 177224 | 159057 | Oct-94 |
| 169 | Sharon#5 | 177225 | 159058 | Oct-94 |
| 170 | Sharon#6 | 177226 | 159059 | Oct-94 |
| 171 | Sharon#7 | 177227 | 159060 | Oct-94 |
| 172 | Sharon#8 | 177228 | 159061 | Oct-94 |
| SMD | Cumo S-k 1300 Technical Report | November 2022 |
Geologic 2CM027.001 CuMoCo. | Page 182 |
| Unpatented CuMo Claim List 2018 - Page 5 |
| Item | Claim Name/Number | BLM Serial No. | County Instrument Number | Loc Dt |
| 173 | Sharon#8 | 177228 | 159061 | Oct-94 |
| 174 | Sharon#9 | 177229 | 159062 | Oct-94 |
| 175 | Sharon#10 | 177230 | 159063 | Oct-94 |
| 176 | BlackJack#1 | 177236 | 159064 | Oct-94 |
| 177 | BlackJack#2 | 177237 | 159065 | Oct-94 |
| 178 | JRA No. 16 | 106515 | 76851 | Sep-82 |
| 179 | JRA No. 18 | 106517 | 76853 | Sep-82 |
| 180 | JRA No. 20 | 106519 | 76855 | Sep-82 |
| 181 | JRA No. 20 | 106520 | 76856 | Sep-82 |
| 182 | JRA No. 29 | 106528 | 76864 | Sep-82 |
| 183 | JRA No. 30 | 106529 | 76865 | Sep-82 |
| 184 | JRA No. 31 | 106530 | 76866 | Sep-82 |
| 185 | JRA No. 45 | 106544 | 76880 | Sep-82 |
| SMD | Cumo S-k 1300 Technical Report | November 2022 |
Geologic 2CM027.001 CuMoCo. | Page 183 |
| Patented Cumo Claim List 2018 - Page 1 | | |
| Item | Claim Name/Number | Patent Number | Year Granted | Survey Number |
| 1 | Blackbird | 11830026 | 1902+1983 | 3636 |
| 2 | Red Flag | 11830026 | 1902+1983 | 3636 |
| 3 | Enterprise | 39183 | 1902 | 1706 |
| 4 | Enterprise Fraction | 39183 | 1902 | 1706 |
| 5 | Commonwealth | 39183 | 1902 | 1706 |
| 6 | Baby Mine | 39183 | 1902 | 1706 |
| 7 | Duane #6 | 39183 | 1945 | 3455 |
| 8 | German American | 1155808 | 1945 | 3455 |
| 9 | Homestake #6 | 1155808 | 1945 | 3455 |
| 10 | Coon Dog #1 | 1155808 | 1945 | 3455 |
| 11 | Coon Dog #3 | 1155808 | 1945 | 3455 |
| 12 | Coon Dog #4 | 1155808 | 1945 | 3455 |
| 13 | Coon Dog #5 | 1155808 | 1945 | 3455 |
| 14 | Coon Dog #10 | 1155808 | 1945 | 3455 |
| 15 | Grey Eagle #2 | 1155808 | 1945 | 3455 |
| 16 | Grey Eagle #3 | 1155808 | 1945 | 3455 |
| 17 | Missing Link #1 | 1155808 | 1945 | 3455 |
| 18 | Missing Link #4 | 1155808 | 1945 | 3455 |
| 19 | Ida | 1155808 | 1945 | 3455 |
| 20 | Daily | 1155808 | 1945 | 3455 |
| 21 | Jumbo | 645180 | 1918 | 2830 |
| 22 | Jumbo #2 | 645180 | 1918 | 2830 |
| 23 | Snowstorm | 645180 | 1918 | 2830 |
| 24 | Sunset #1 | 119757 | 1909 | 2269 |
| 25 | Last Dollar | 119757 | 1909 | 2269 |
| 26 | Sunset #2 | 119757 | 1909 | 2269 |
| 27 | Gold Dollar #1 | 119757 | 1909 | 2269 |
| 28 | Gold Dollar #2 | 119757 | 1909 | 2269 |
| 29 | Gold Dollar #3 | 119757 | 1909 | 2269 |
| 30 | Pheasant Lode | 564946 | 1917 | 2679 |
| 31 | Golden Age Placer | 535188 | 1916 | 2680 |
| 32 | Wills Placer | 951698 | 1925 | 3052 |
| 33 | Gerdo | 645179 | 1918 | 2831 |
| 34 | Harper #1 | 1144749 | 1944 | 3456 |
| 35 | Harper #2 | 1144749 | 1944 | 3456 |
| 36 | Florence | 546017 | 1916 | 2681 |
| 37 | Charlotte | 546017 | 1916 | 2681 |
| 38 | Francis | 546017 | 1916 | 2681 |
| 39 | Theron Fraction | 546017 | 1916 | 2681 |
| 40 | Theron | 546017 | 1916 | 2681 |
| 41 | Idaho | 546017 | 1916 | 2681 |
| SMD | Cumo S-k 1300 Technical Report | November 2022 |
Geologic 2CM027.001 CuMoCo. | Page 184 |
Appendix 2: Re-Splits of Rejects
Results for Mo - Chemex - original vs. ICP check
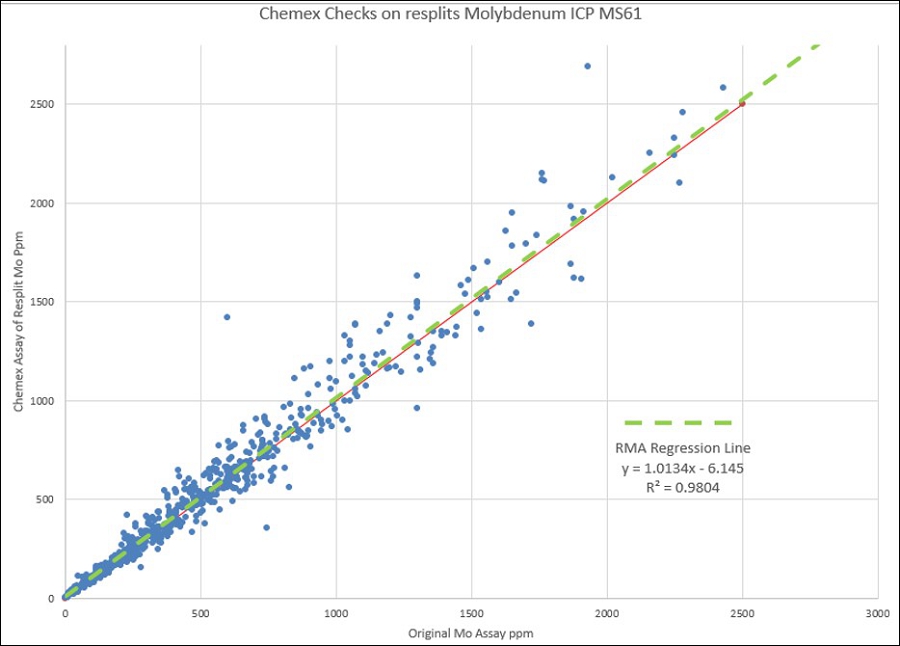
| SMD | Cumo S-k 1300 Technical Report | November 2022 |
Geologic 2CM027.001 CuMoCo. | Page 185 |
Results for Mo - Chemex - original vs. XRF check
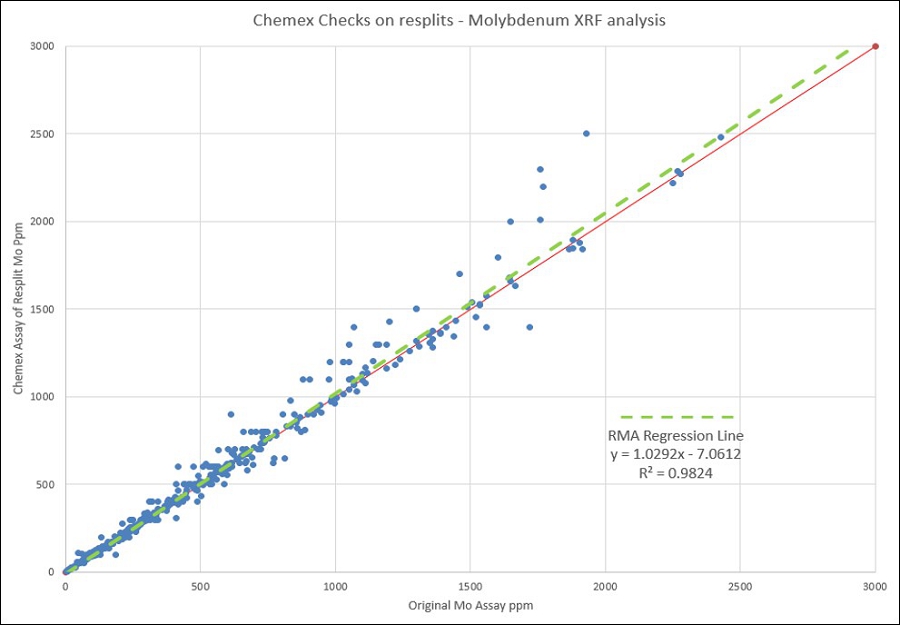
Results for Cu - Chemex - original vs. ICP check
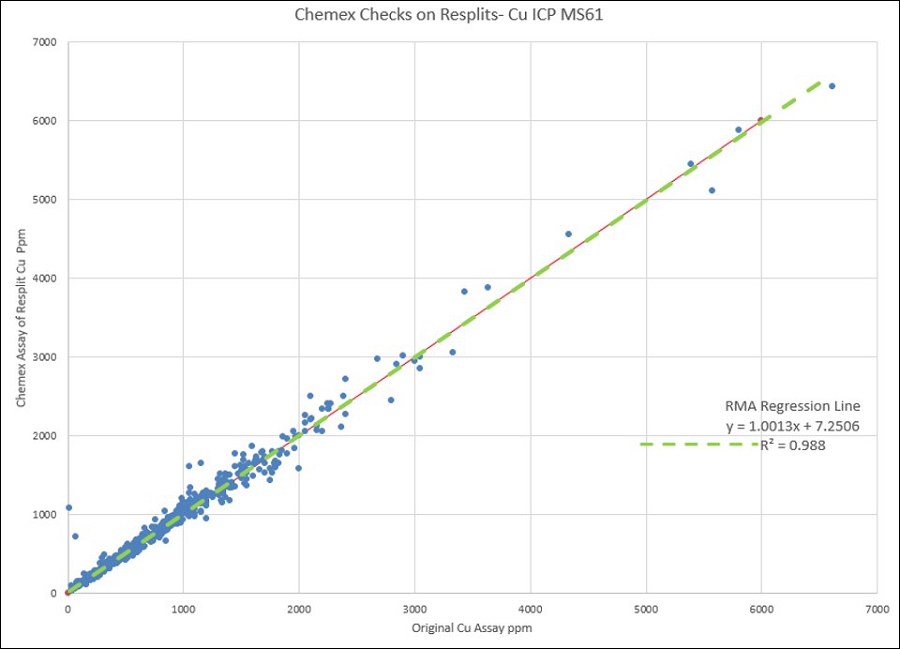
| SMD | Cumo S-k 1300 Technical Report | November 2022 |
Geologic 2CM027.001 CuMoCo. | Page 186 |
Results for Cu - Chemex - original vs. XRF check
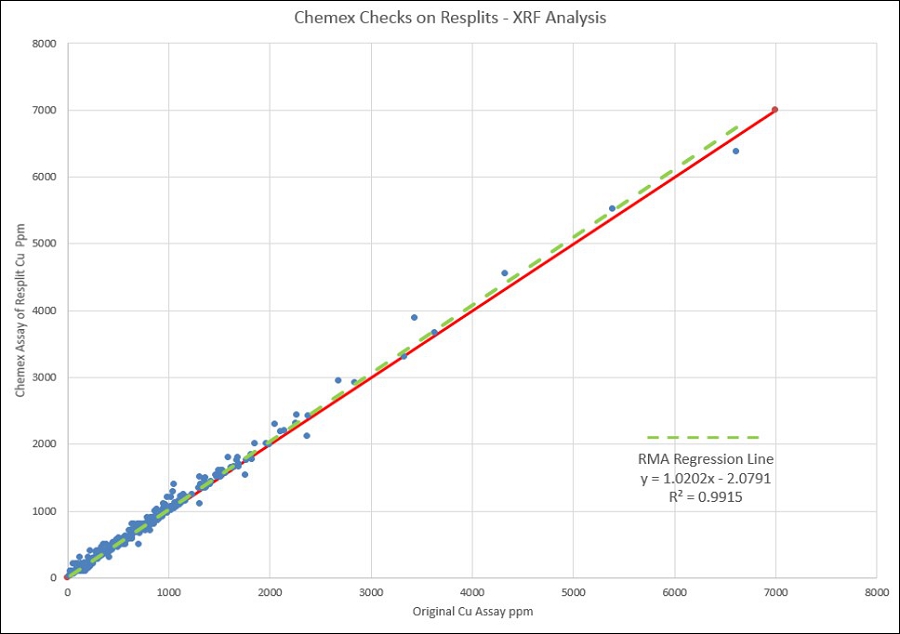
Results for Ag - Chemex original vs. ICP check
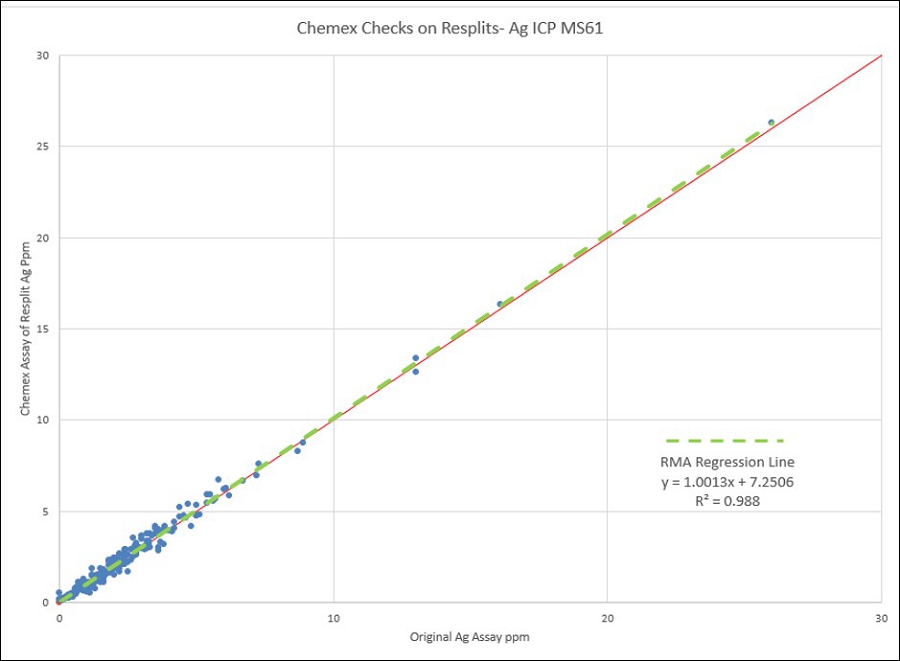
| SMD | Cumo S-k 1300 Technical Report | November 2022 |
Geologic 2CM027.001 CuMoCo. | Page 187 |
Appendix 3: Drill Holes used in Resource Estimate
| Hole | Northing | Easting | Elevation | Dip | Azimuth | Length (feet) |
| 71-01 | 120989.9 | 219904.5 | 6026.5 | -90 | 0 | 1884 |
| 71-02 | 120575.0 | 219820.0 | 6060.0 | -70 | 0 | 405 |
| 71-03 | 120250.0 | 219905.0 | 6165.0 | -90 | 0 | 70 |
| C71-04 | 120785.0 | 219940.0 | 6045.0 | -90 | 0 | 113 |
| C72-05 | 120524.8 | 220569.9 | 6201.7 | -90 | 0 | 1416 |
| C72-06 | 121749.0 | 219919.0 | 5902.0 | -90 | 0 | 663 |
| C72-07 | 121491.0 | 219823.0 | 5962.0 | -90 | 0 | 275 |
| C72-08 | 118890.0 | 220025.0 | 6467.0 | -90 | 0 | 379 |
| C74-09 | 121438.0 | 220687.0 | 5890.0 | -60 | 168 | 804.6 |
| C75-10 | 119755.7 | 221220.4 | 6341.0 | -90 | 0 | 2381 |
| C76-11 | 120455.8 | 221250.2 | 5996.0 | -90 | 0 | 3003 |
| C76-12 | 120955.0 | 221432.0 | 5742.0 | -43 | 190 | 1340 |
| C77-13 | 119471.9 | 219902.9 | 6426.3 | -90 | 0 | 1804 |
| C77-14 | 119085.4 | 221271.3 | 6613.3 | -90 | 0 | 2123.8 |
| C77-15 | 119772.1 | 221950.9 | 6339.0 | -90 | 0 | 1933.2 |
| C78-16 | 119209.7 | 219147.5 | 6247.9 | -90 | 0 | 2131.7 |
| C78-17 | 118711.9 | 219886.6 | 6544.3 | -90 | 0 | 2281.5 |
| C78-18 | 119823.5 | 222649.1 | 6168.3 | -90 | 0 | 2361 |
| C79-19 | 120178.0 | 219887.0 | 6170.0 | -90 | 0 | 2280 |
| C79-20 | 120878.0 | 220787.0 | 6105.0 | -90 | 0 | 2543 |
| C81-24 | 120671.1 | 222009.5 | 6069.8 | -90 | 0 | 1000 |
| C81-25 | 119890.0 | 219289.7 | 6019.0 | -90 | 0 | 1011 |
| C81-26 | 121338.1 | 221432.9 | 5767.5 | -90 | 0 | 1193 |
| SMD | Cumo S-k 1300 Technical Report | November 2022 |
Geologic 2CM027.001 CuMoCo. | Page 188 |
| Hole | Northing | Easting | Elevation | Dip | Azimuth | Length (feet) |
| 27-06 | 120031.9 | 220207.9 | 6351.4 | -90 | 0 | 1849 |
| 28-06 | 119539.8 | 220816.8 | 6321.1 | -90 | 0 | 1711 |
| 29-07 | 119778.9 | 221246.7 | 6343.7 | -70 | 140 | 2281.7 |
| 30-07 | 119732.2 | 219616.8 | 6213.1 | -90 | 0 | 2416.5 |
| 31-07 | 119792.5 | 221243.3 | 6342.3 | -70 | 45 | 2104 |
| 32-07 | 119558.4 | 220822.6 | 6323.6 | -70 | 190 | 2044 |
| 33-07 | 118476.7 | 221227.0 | 6796.8 | -90 | 0 | 2095 |
| 34-07 | 118658.3 | 220487.4 | 6534.2 | -70 | 95 | 1769 |
| 35-08 | 118655.2 | 220480.4 | 6533.2 | -90 | 0 | 2817 |
| 36-08 | 119335.3 | 219448.7 | 6274.6 | -90 | 0 | 2488 |
| 37-08 | 119780.4 | 221246.8 | 6341.5 | -70 | 335 | 2195 |
| 38-08 | 118655.2 | 220480.4 | 6533.2 | -70 | 180 | 2441 |
| 39-08 | 118917.9 | 220813.2 | 6575.1 | -90 | 0 | 2688 |
| 40-08 | 119530.1 | 220791.4 | 6321.4 | -70 | 225 | 2252 |
| 41-08 | 119630.2 | 218962.5 | 6219.9 | -90 | 0 | 3018 |
| 42-08 | 118748.9 | 219911.0 | 6549.2 | -70 | 270 | 2707 |
| 43-08 | 120612.8 | 220052.8 | 6173.8 | -80 | 40 | 1313 |
| 44-08 | 118085.1 | 221515.9 | 6739.4 | -65 | 75 | 3047 |
| 45-08 | 119802.3 | 218821.4 | 6183.7 | -80 | 330 | 1796 |
| 46-09 | 118913.9 | 220811.3 | 6575.1 | -75 | 110 | 959 |
| 47-09 | 120686.7 | 219421.7 | 5832.6 | -90 | 0 | 2530 |
| 48-09 | 120690.0 | 219425.0 | 5825.5 | -70 | 305 | 2576 |
| 49-09 | 119094.6 | 221745.7 | 6645.3 | -90 | 0 | 2847 |
| 50-09 | 121548.0 | 219843.5 | 5832.6 | -75 | 270 | 1826 |
| 51-09 | 121534.9 | 219859.8 | 5828.5 | -90 | 0 | 1593.5 |
| 52-09 | 118499.5 | 221251.3 | 6791.2 | -75 | 20 | 2772 |
| 53-09 | 119803.9 | 218830.5 | 6183.4 | -75 | 15 | 2461 |
| 54-09 | 119534.9 | 219005.1 | 6195.9 | -75 | 15 | 1096 |
| 55-10 | 117559.6 | 218422.5 | 6724.2 | -65 | 0 | 2479 |
| 56-10 | 117559.9 | 218421.9 | 6724.2 | -65 | 305 | 1294 |
| 57-10 | 117559.3 | 218422.2 | 6724.2 | -90 | 0 | 534 |
| 58-11 | 119142.8 | 219970.3 | 6451.3 | -90 | 0 | 1885 |
| 59-11 | 119095.6 | 221745.9 | 6645.3 | -75 | 0 | 1910 |
| 60-12 | 117559.9 | 218421.9 | 6724.2 | -50 | 180 | 1455 |
| 61-12 | 118748.9 | 219911.0 | 6549.2 | -75 | 335 | 1318 |
| 62-12 | 116866.1 | 218040.5 | 6628.7 | -50 | 135 | 1484 |
| 63-12 | 116866.8 | 218041.5 | 6628.7 | -60 | 330 | 807 |
| 64-12 | 118913.9 | 220811.3 | 6575.1 | -75 | 25 | 2139 |
| 65-12 | 118148.8 | 221117.5 | 6785.7 | -80 | 315 | 1908 |
| 66-12 | 118674.0 | 221687.8 | 6689.7 | -90 | 0 | 2241 |
| 67-12 | 118913.9 | 220811.3 | 6575.1 | -70 | 340 | 1978 |
| 68-12 | 119095.6 | 221745.9 | 6645.3 | -70 | 310 | 2133.5 |
| SMD | Cumo S-k 1300 Technical Report | November 2022 |
Geologic 2CM027.001 CuMoCo. | Page 189 |
Appendix 4: Semi-variograms
A4.1-MoS2 in Cu-Mo and Mo Zones
A4.2-MoS2in Cu-Ag Zone
A4.3-Cu in Cu-Ag and Cu-Mo Zones
A4.4-Cu in Mo Zone
A4.5-Ag in Cu-Ag and Cu-Mo Zones
A4.6-Ag in Mo Zone
A4.7-W in Cu-Ag Zone
A4.8-W in Cu-Mo and Mo Zones
*Tungsten is included for reference only, as it was not used in resource estimation
| SMD | Cumo S-k 1300 Technical Report | November 2022 |
Geologic 2CM027.001 CuMoCo. | Page 190 |
A4.1 – MoS2 in CuMo and Mo Zones

| SMD | Cumo S-k 1300 Technical Report | November 2022 |
Geologic 2CM027.001 CuMoCo. | Page 191 |
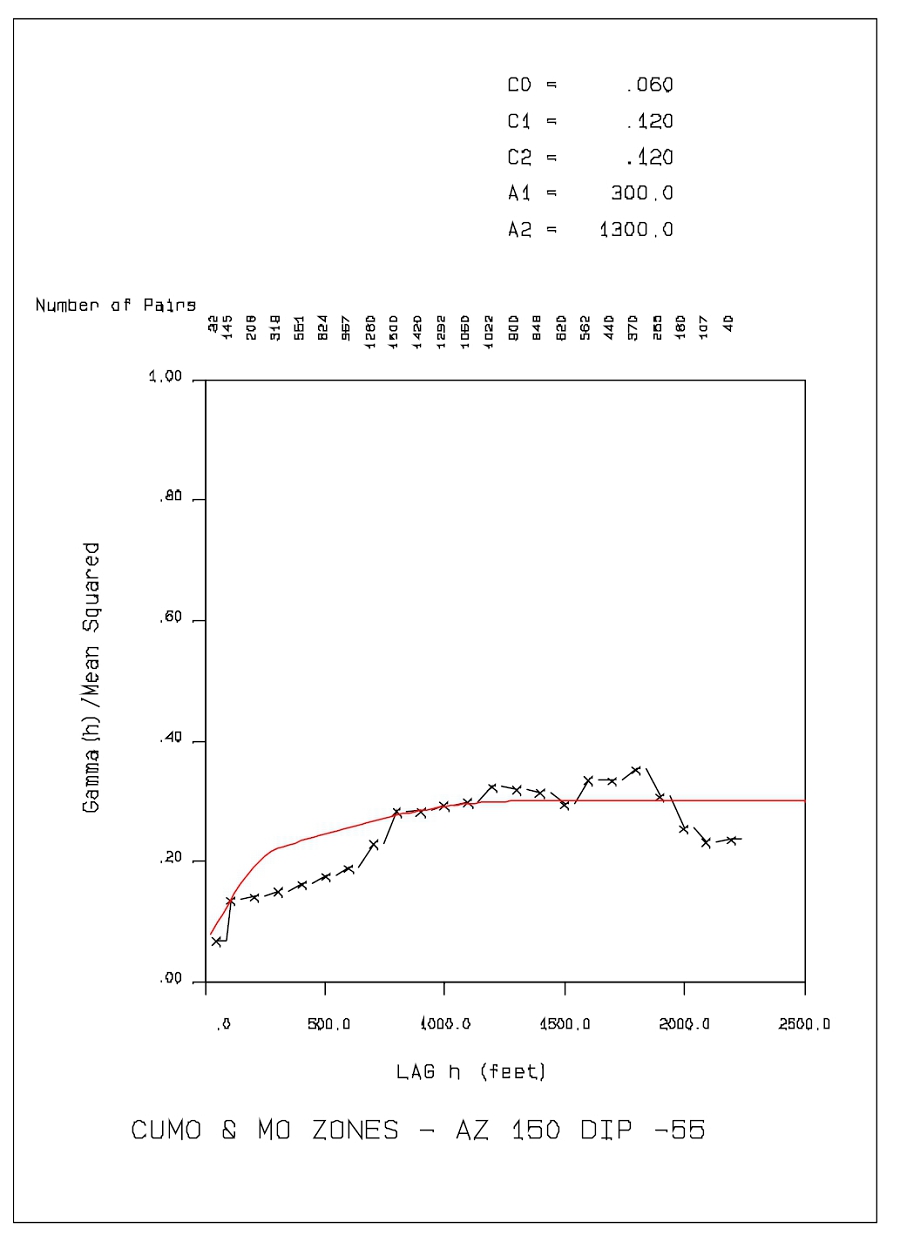
| SMD | Cumo S-k 1300 Technical Report | November 2022 |
Geologic 2CM027.001 CuMoCo. | Page 192 |

| SMD | Cumo S-k 1300 Technical Report | November 2022 |
Geologic 2CM027.001 CuMoCo. | Page 193 |
A4.2 – MoS2 in Cu-Ag Zone:
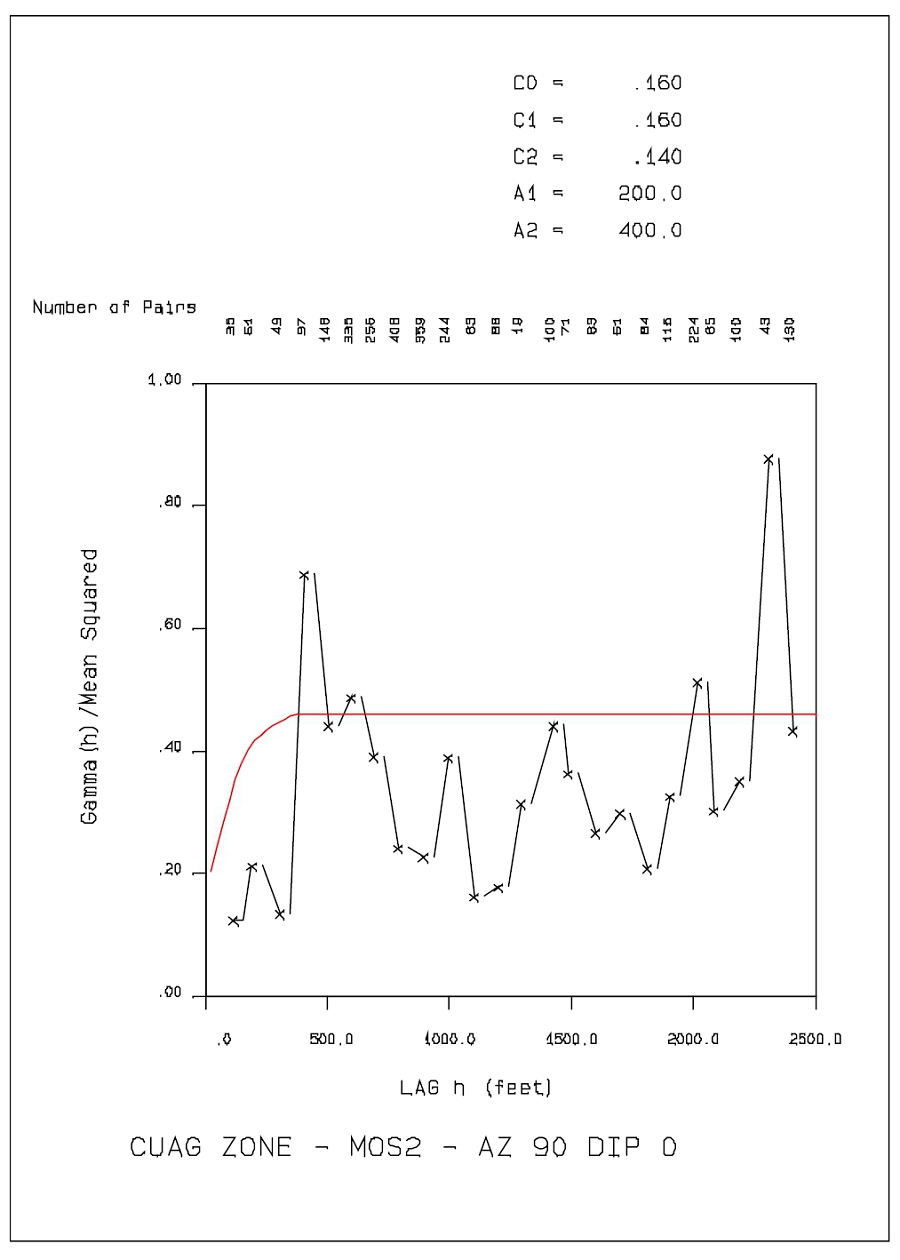
| SMD | Cumo S-k 1300 Technical Report | November 2022 |
Geologic 2CM027.001 CuMoCo. | Page 194 |
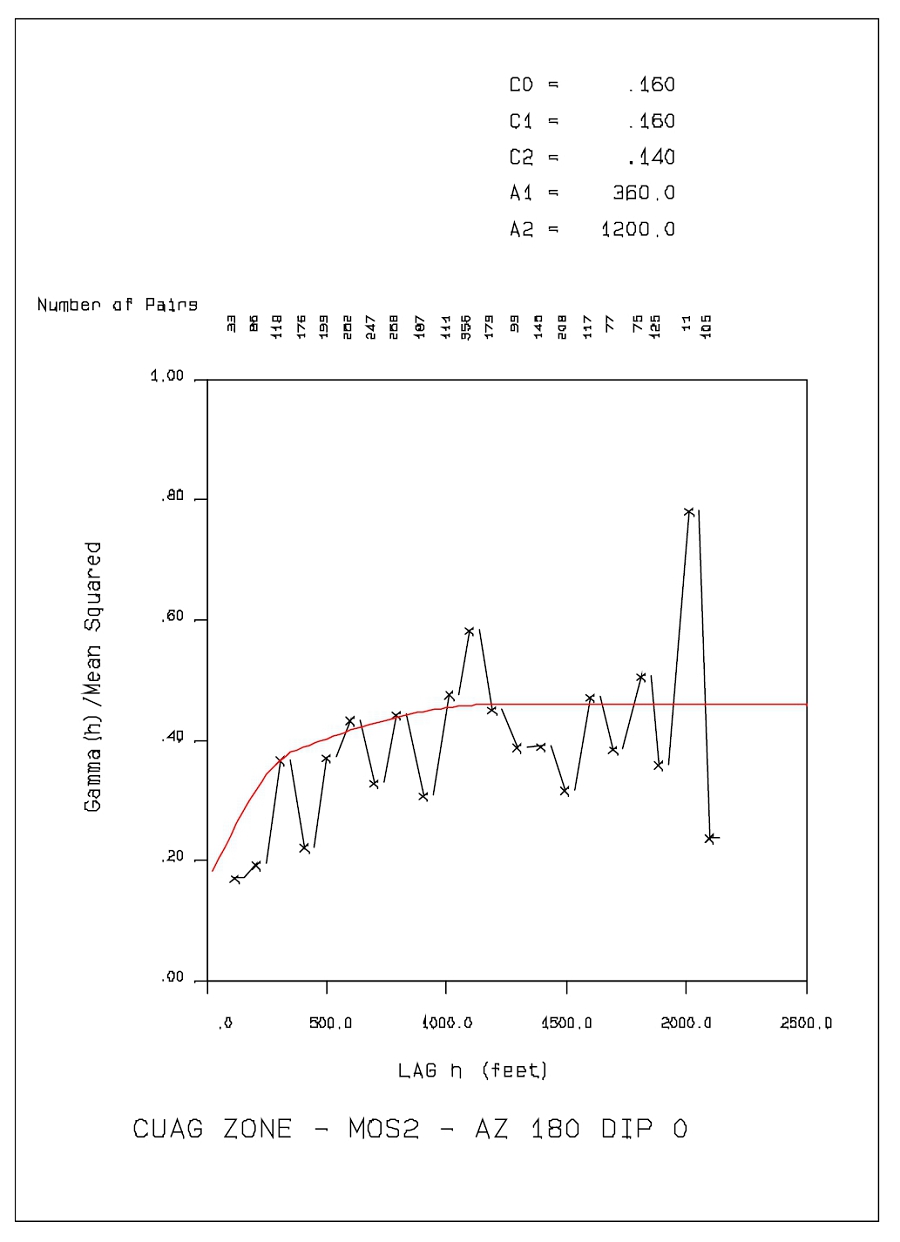
| SMD | Cumo S-k 1300 Technical Report | November 2022 |
Geologic 2CM027.001 CuMoCo. | Page 195 |
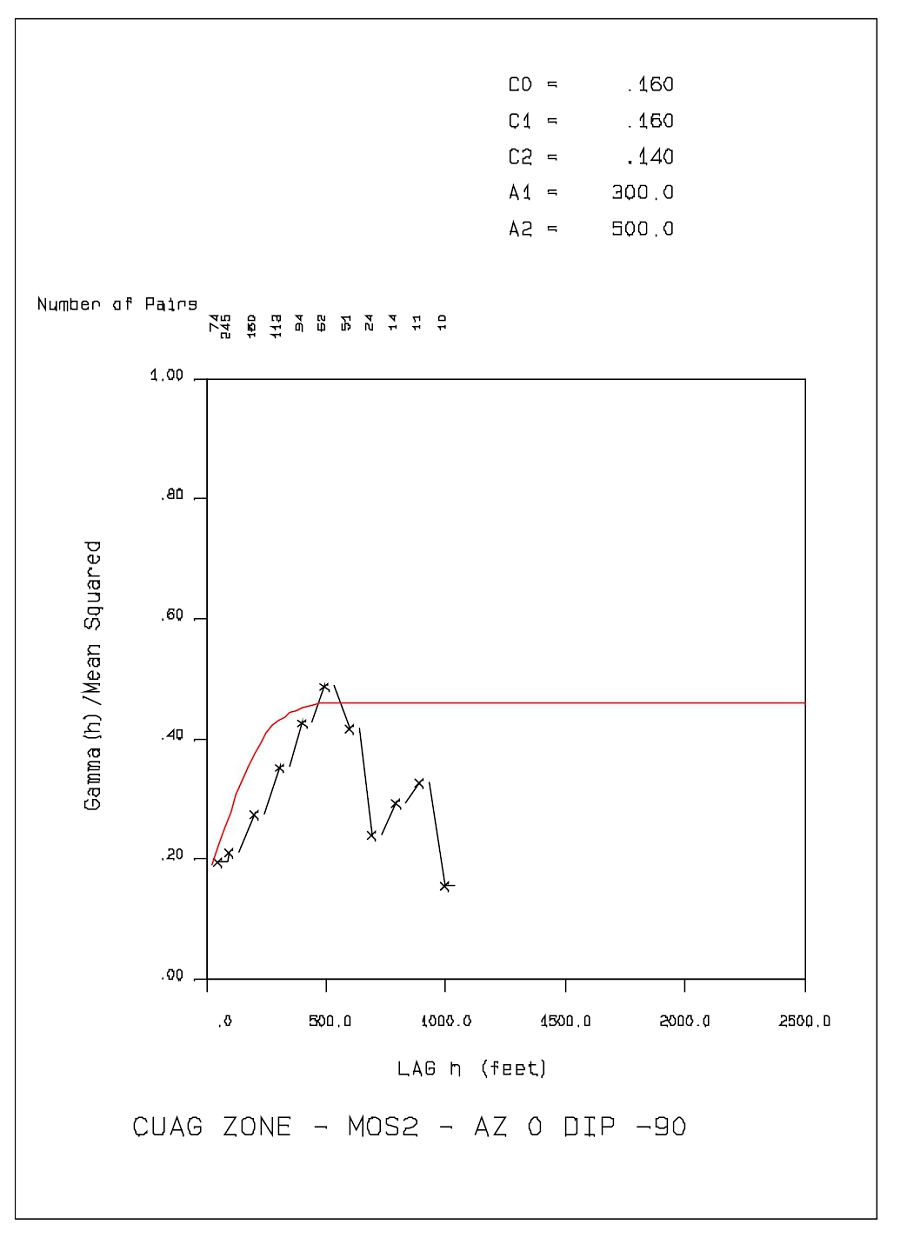
| SMD | Cumo S-k 1300 Technical Report | November 2022 |
Geologic 2CM027.001 CuMoCo. | Page 196 |
A4.3 – Cu in Cu-Ag and Cu-Mo Zones:
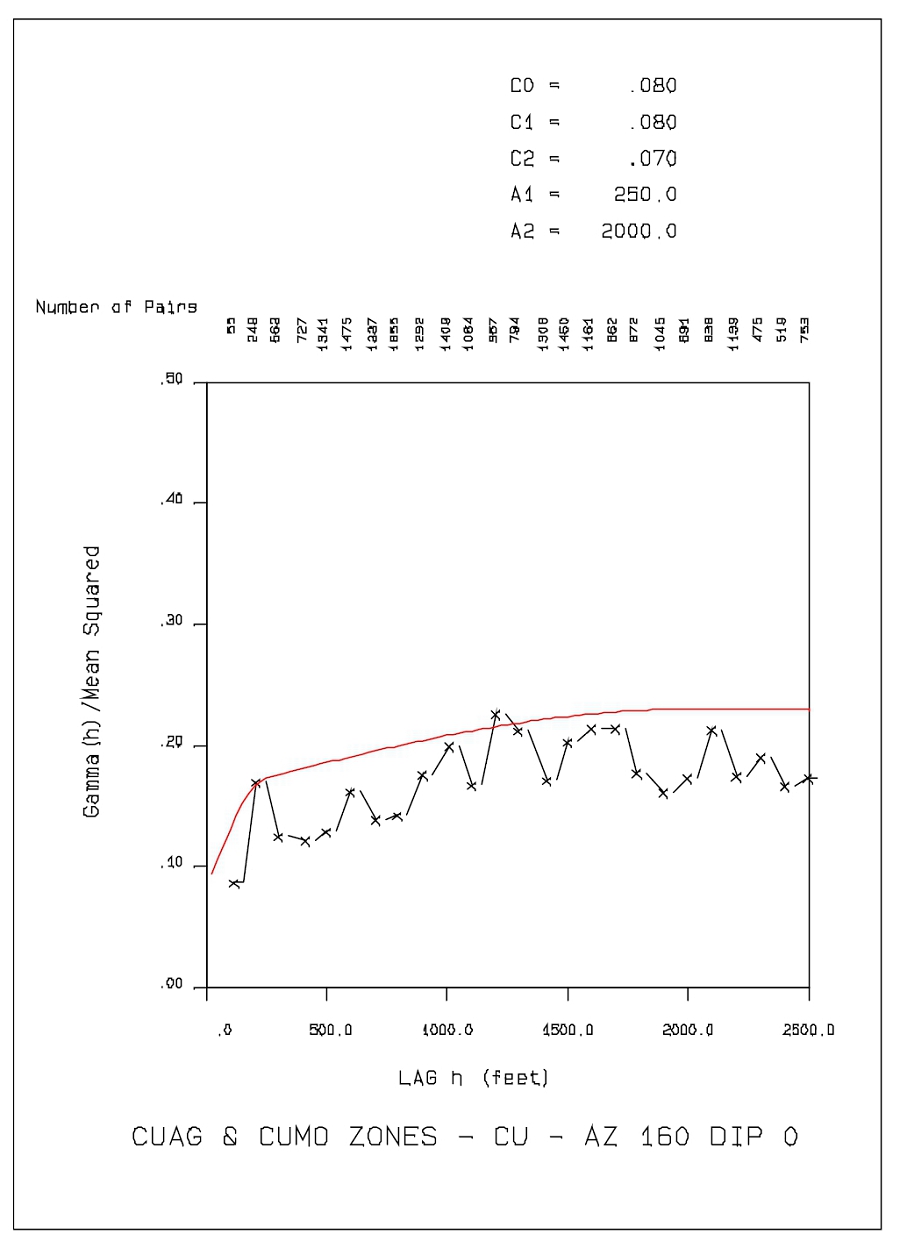
| SMD | Cumo S-k 1300 Technical Report | November 2022 |
Geologic 2CM027.001 CuMoCo. | Page 197 |
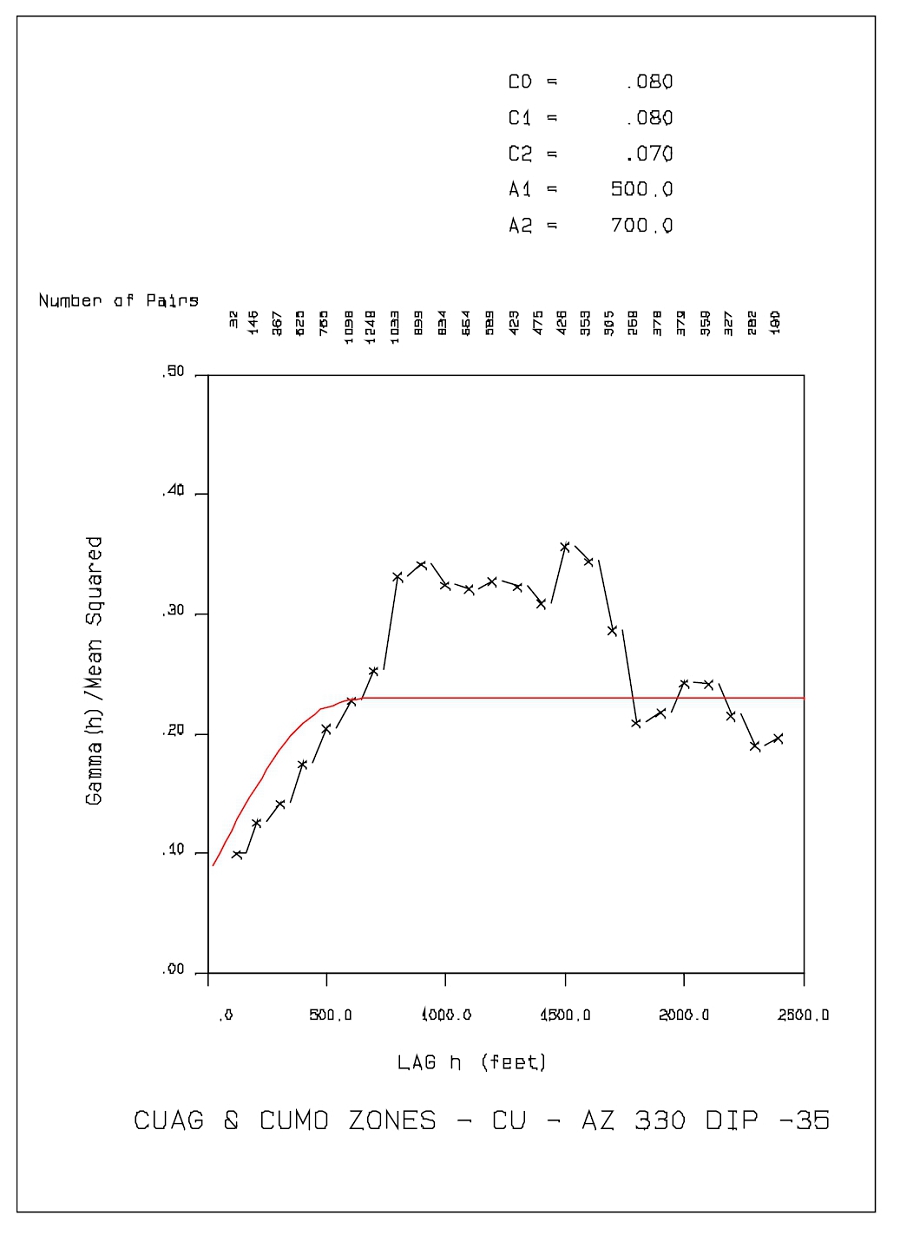
| SMD | Cumo S-k 1300 Technical Report | November 2022 |
Geologic 2CM027.001 CuMoCo. | Page 198 |
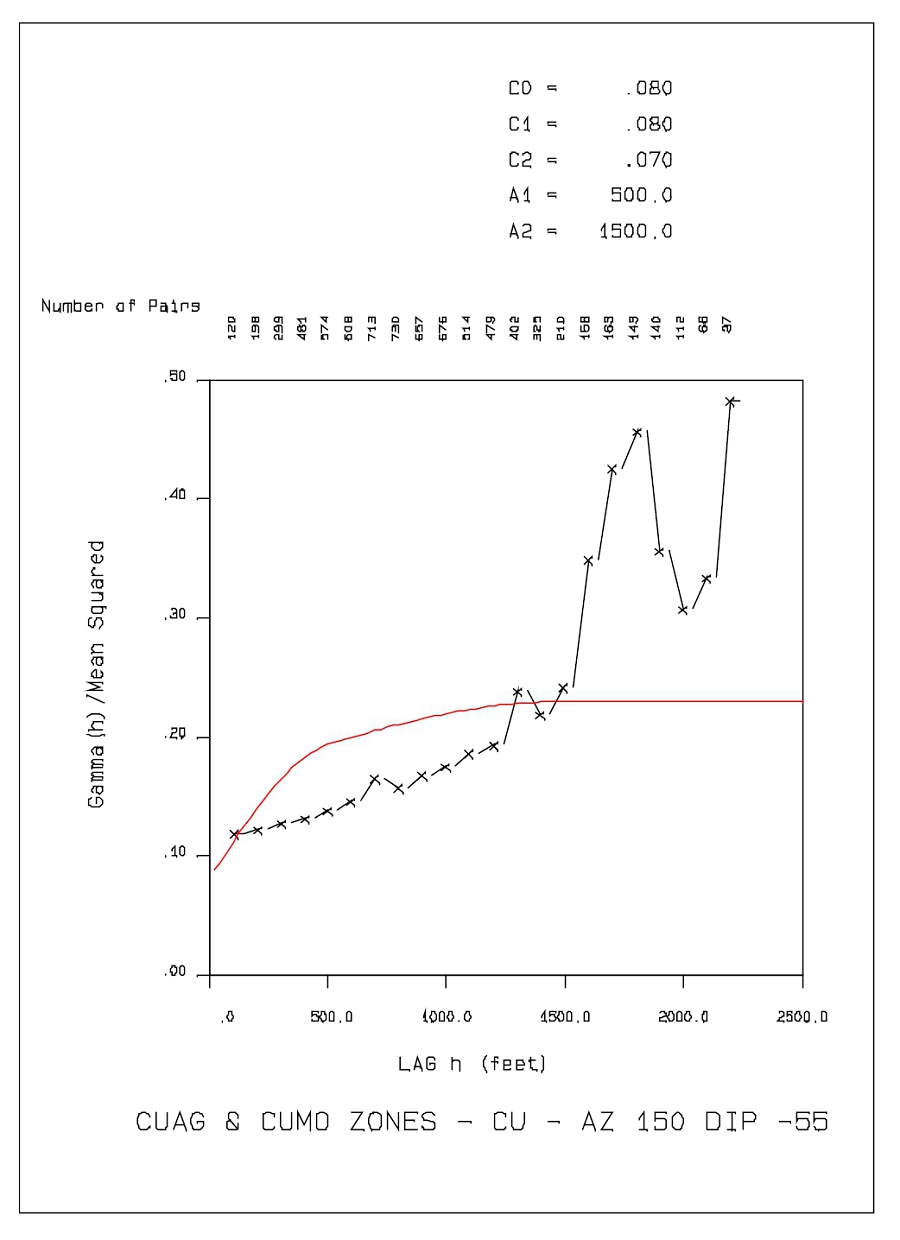
| SMD | Cumo S-k 1300 Technical Report | November 2022 |
Geologic 2CM027.001 CuMoCo. | Page 199 |
A4.4 – Cu in Mo Zone:
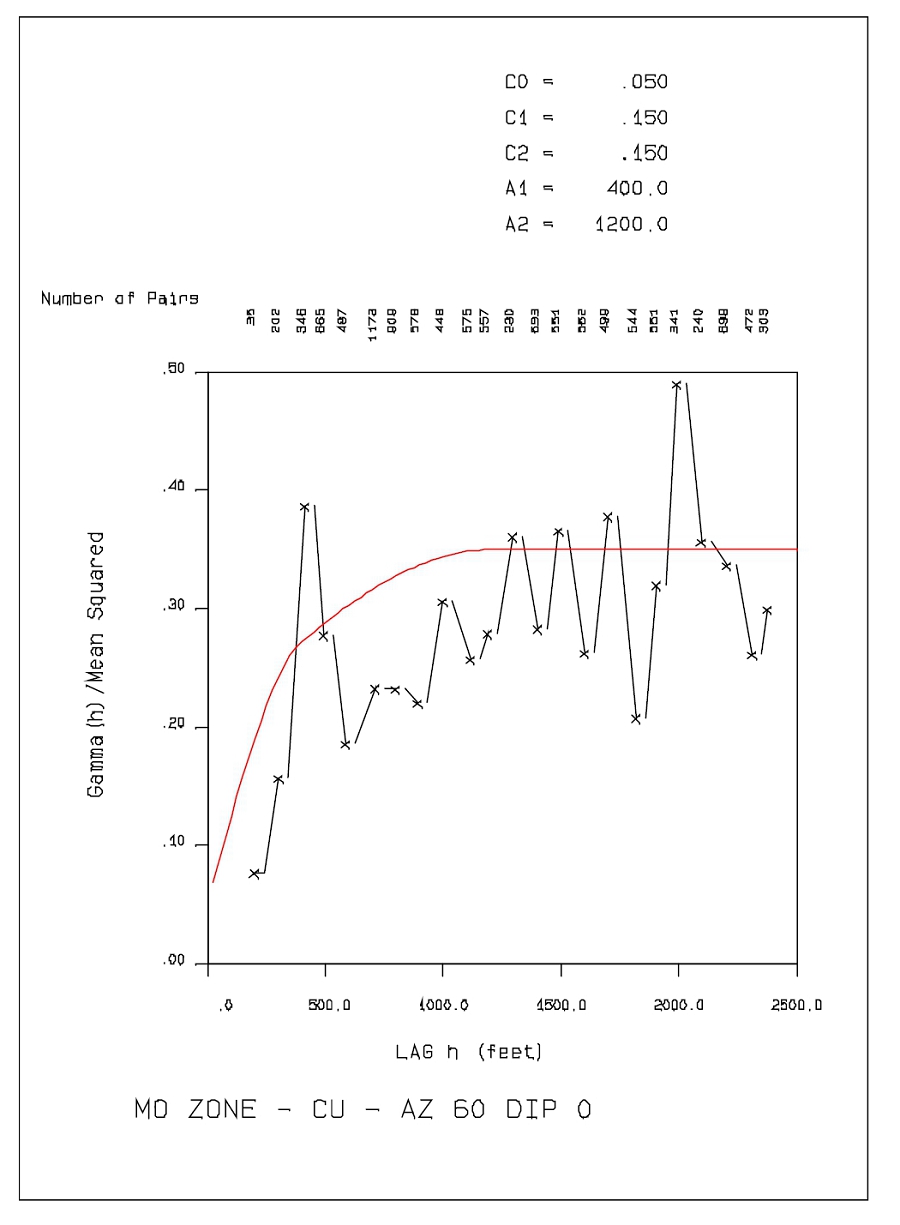
| SMD | Cumo S-k 1300 Technical Report | November 2022 |
Geologic 2CM027.001 CuMoCo. | Page 200 |
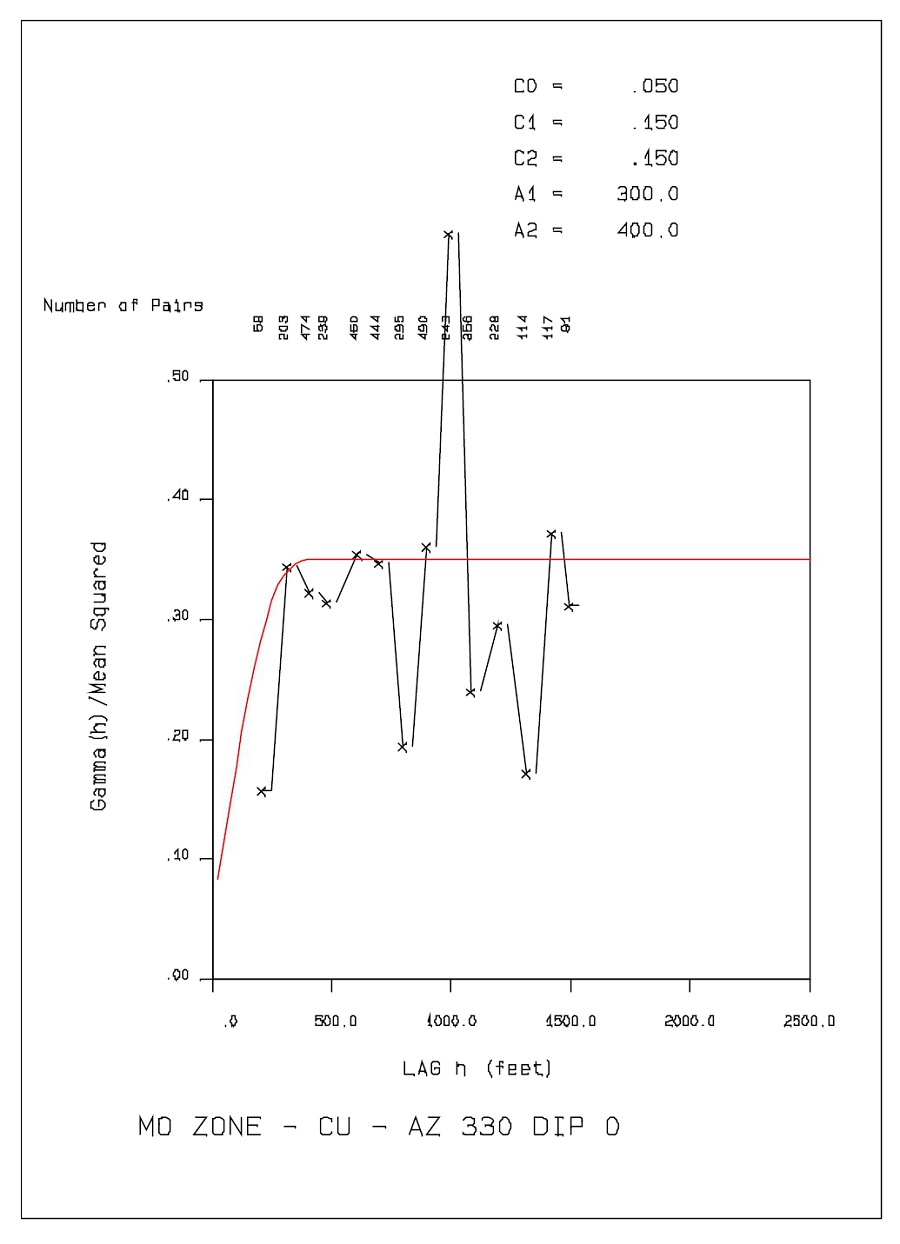
| SMD | Cumo S-k 1300 Technical Report | November 2022 |
Geologic 2CM027.001 CuMoCo. | Page 201 |
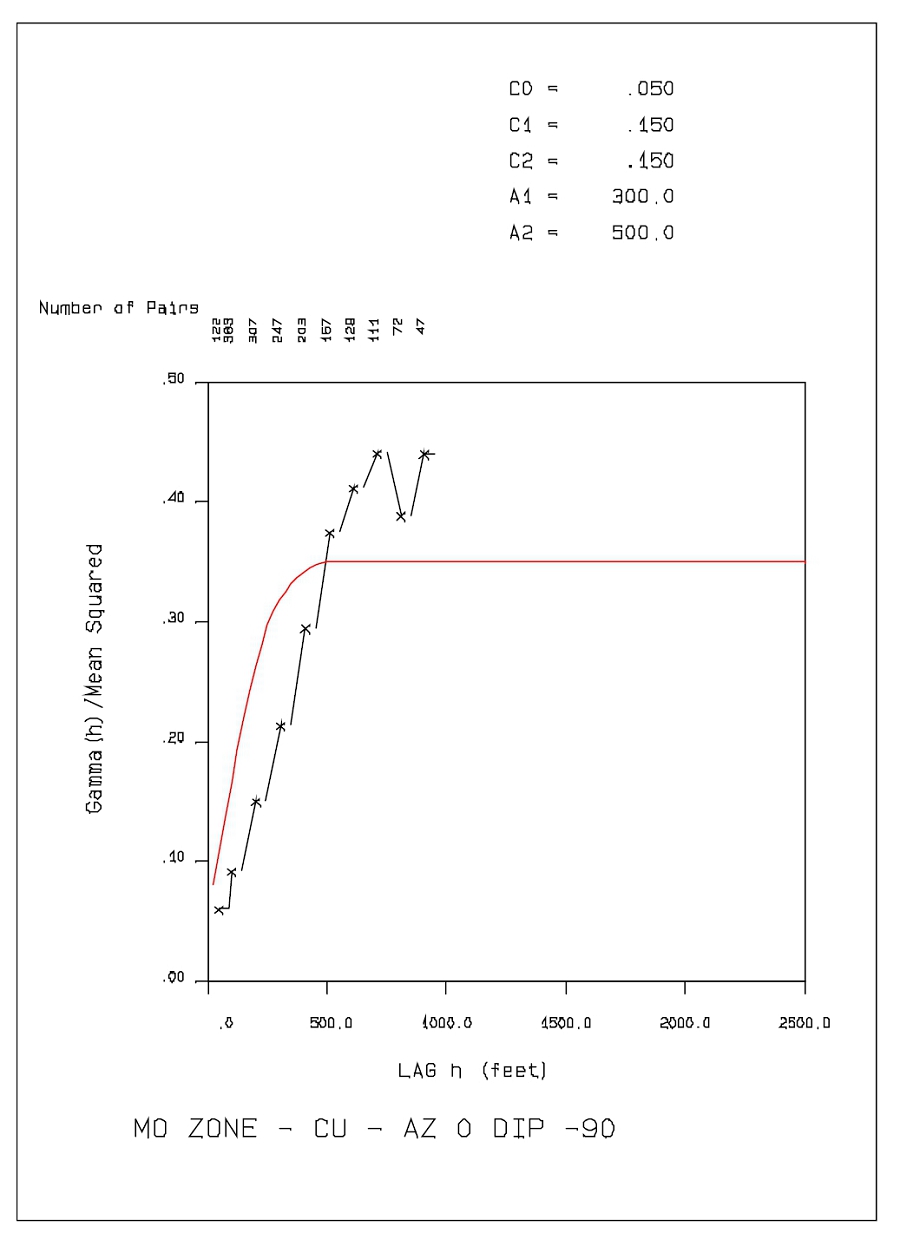
| SMD | Cumo S-k 1300 Technical Report | November 2022 |
Geologic 2CM027.001 CuMoCo. | Page 202 |
A4.5 – Ag in Cu-Ag and Cu-Mo Zones:
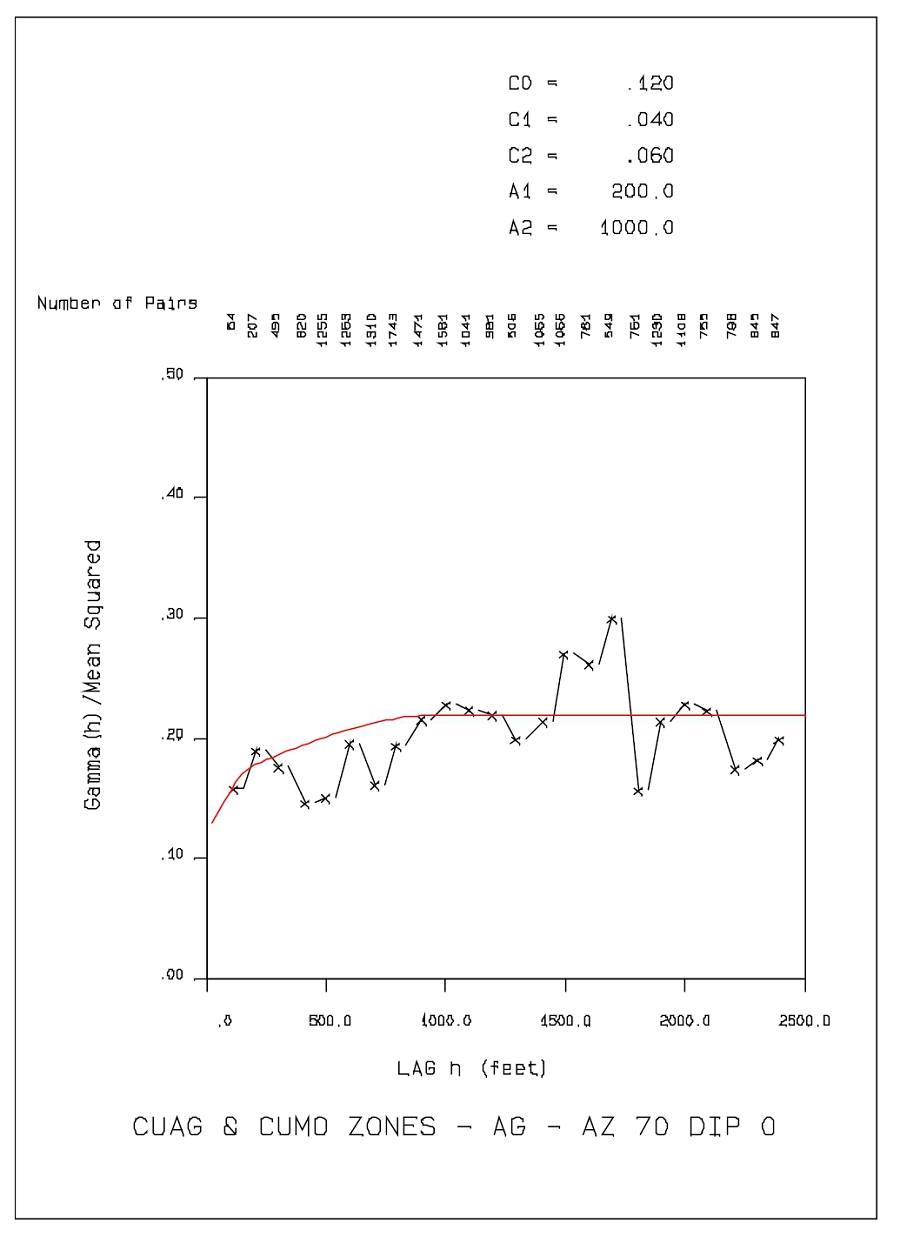
| SMD | Cumo S-k 1300 Technical Report | November 2022 |
Geologic 2CM027.001 CuMoCo. | Page 203 |
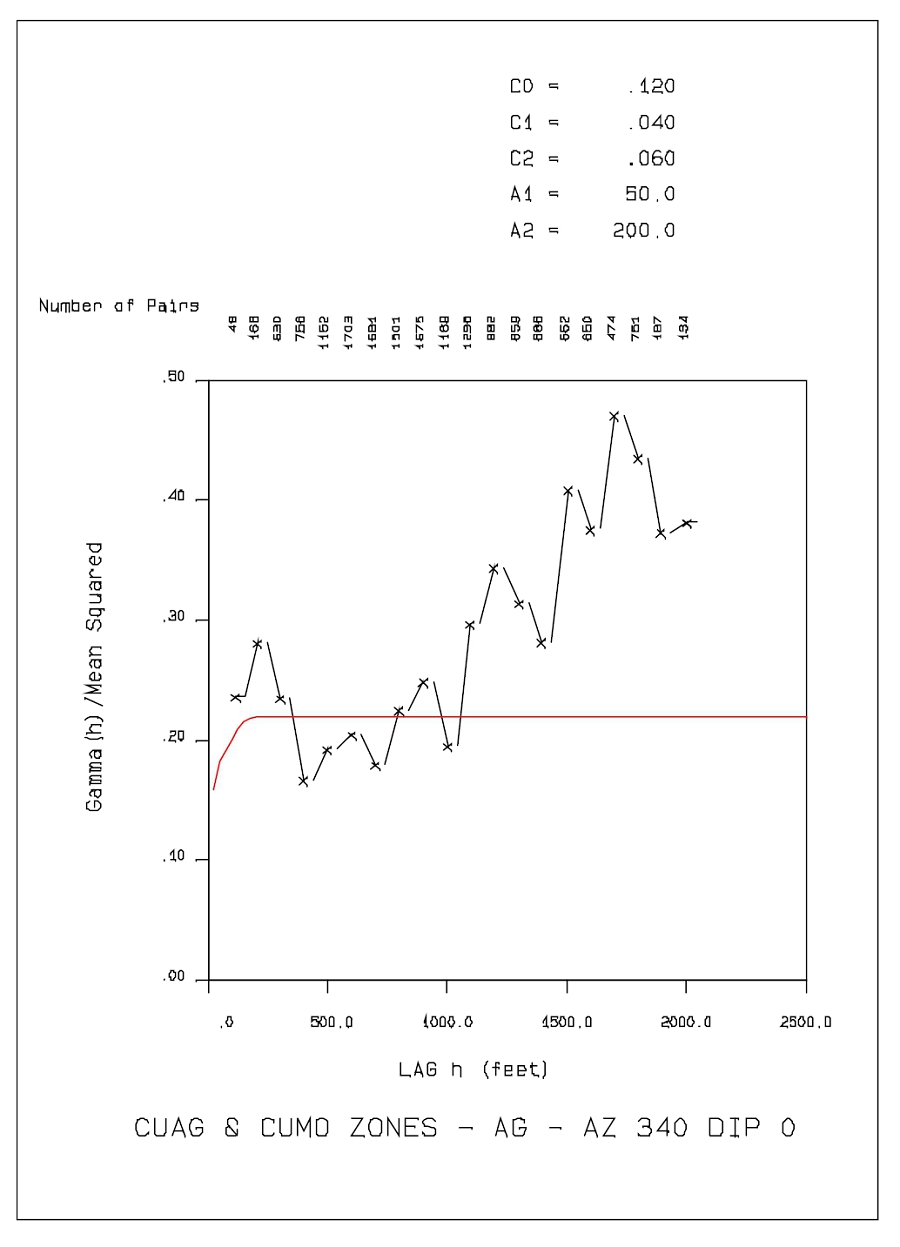
| SMD | Cumo S-k 1300 Technical Report | November 2022 |
Geologic 2CM027.001 CuMoCo. | Page 204 |
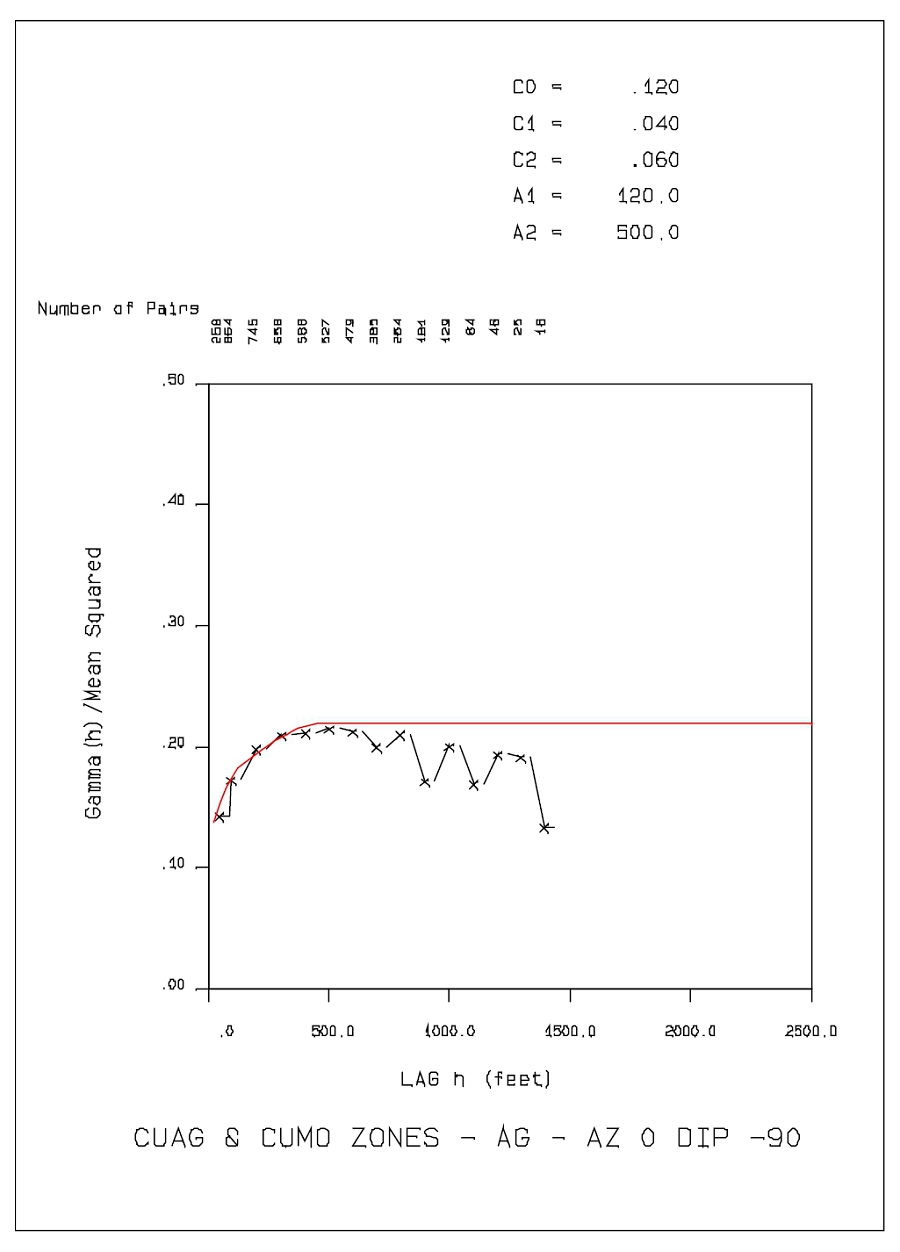
| SMD | Cumo S-k 1300 Technical Report | November 2022 |
Geologic 2CM027.001 CuMoCo. | Page 205 |
A4.6 – Ag in Mo Zone:
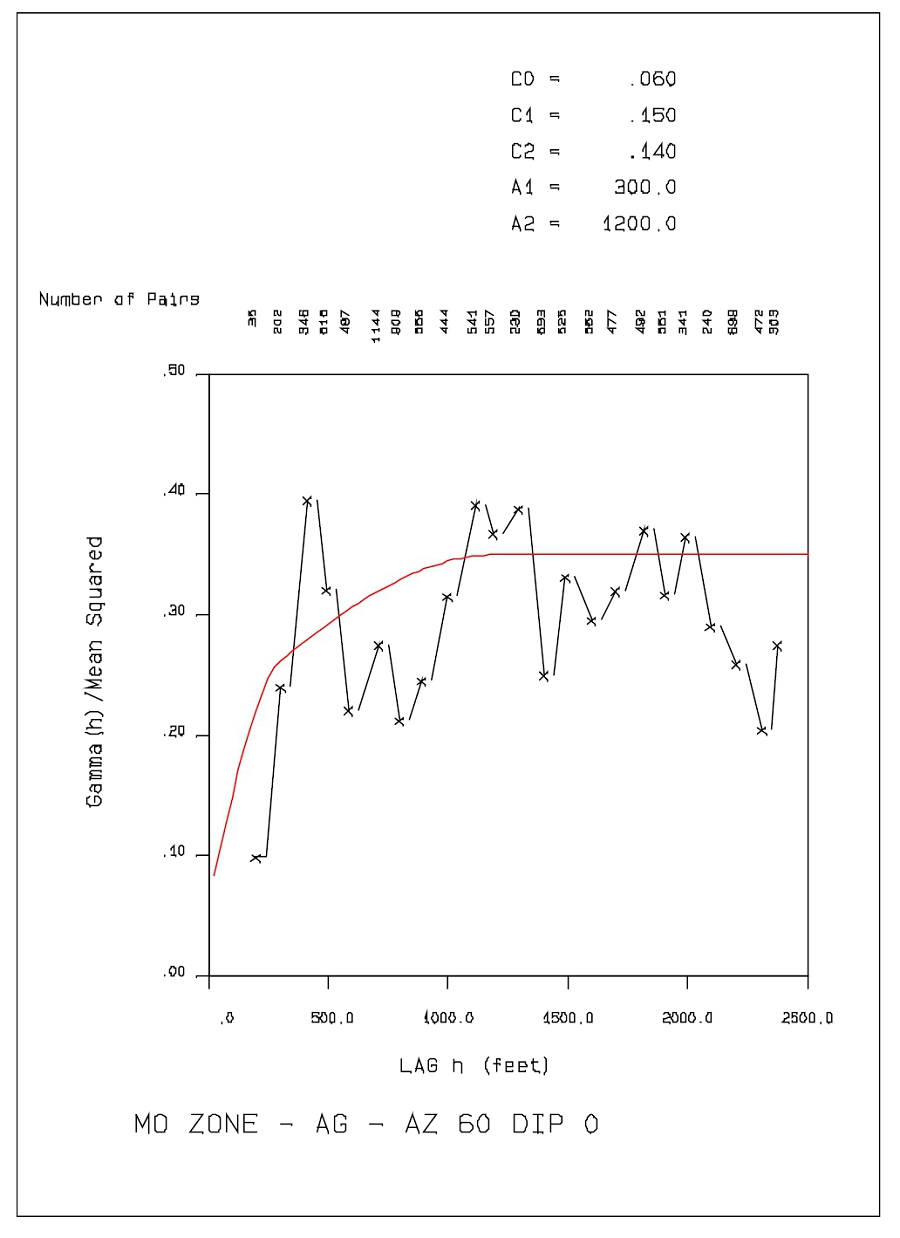
| SMD | Cumo S-k 1300 Technical Report | November 2022 |
Geologic 2CM027.001 CuMoCo. | Page 206 |
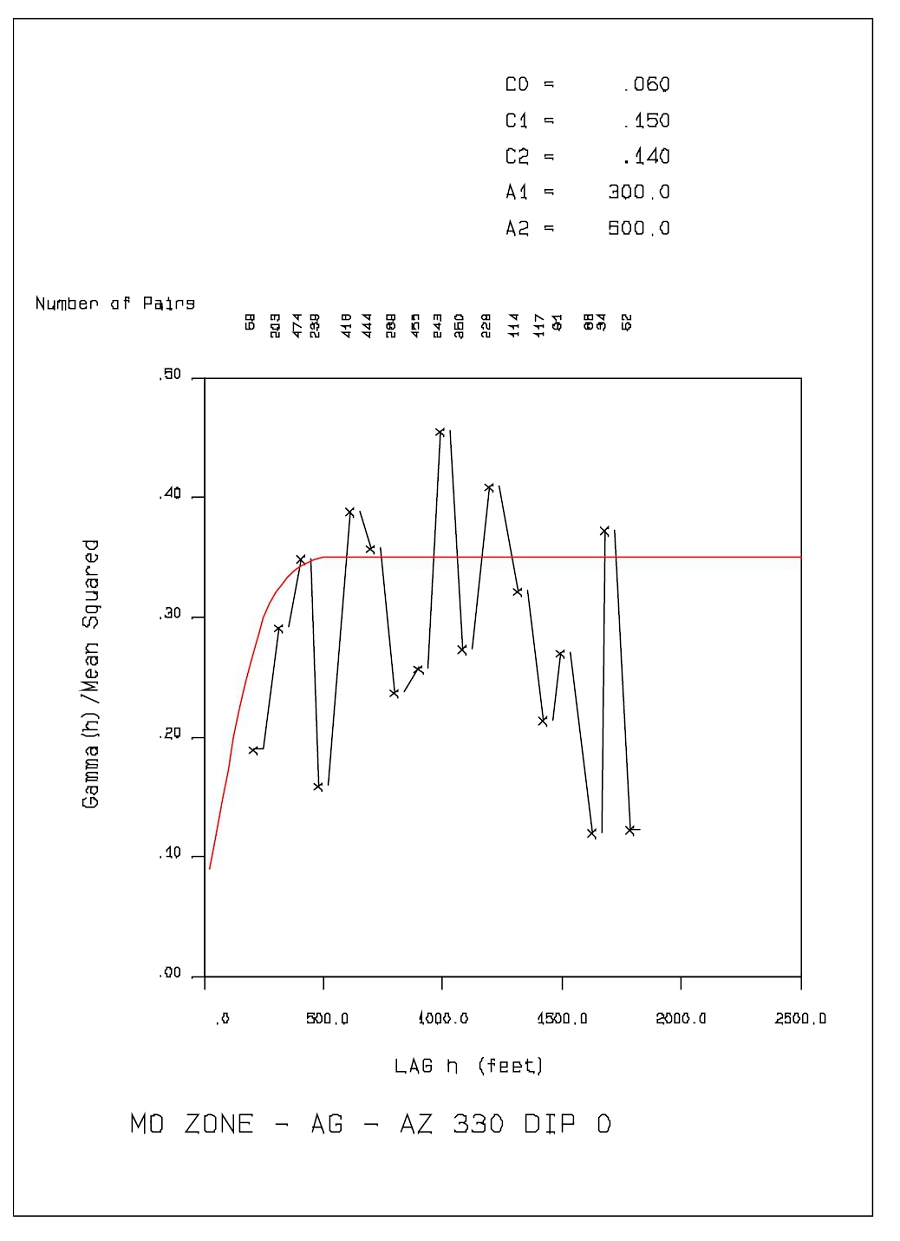
| SMD | Cumo S-k 1300 Technical Report | November 2022 |
Geologic 2CM027.001 CuMoCo. | Page 207 |
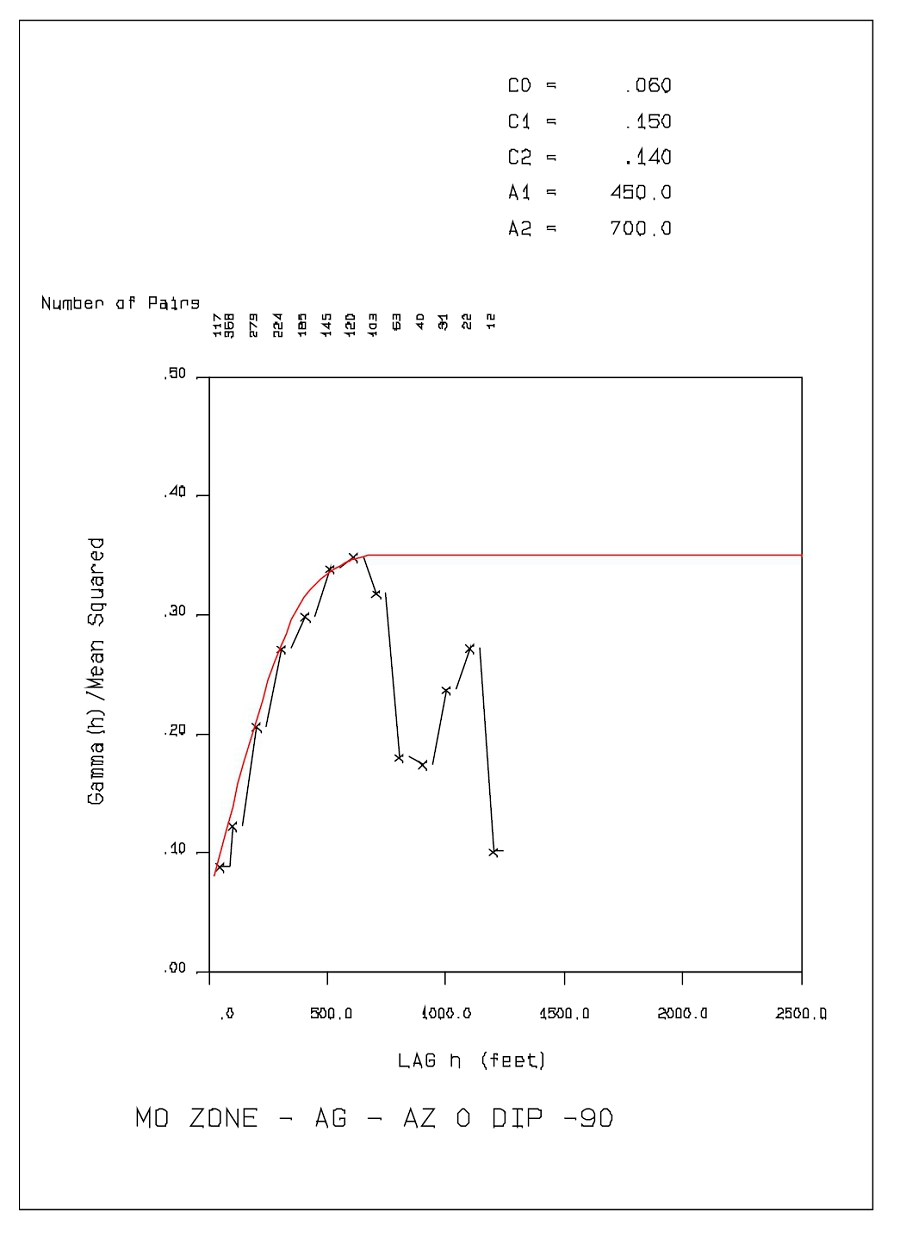
| SMD | Cumo S-k 1300 Technical Report | November 2022 |
Geologic 2CM027.001 CuMoCo. | Page 208 |
A4.7 – W in Cu-Ag Zone:
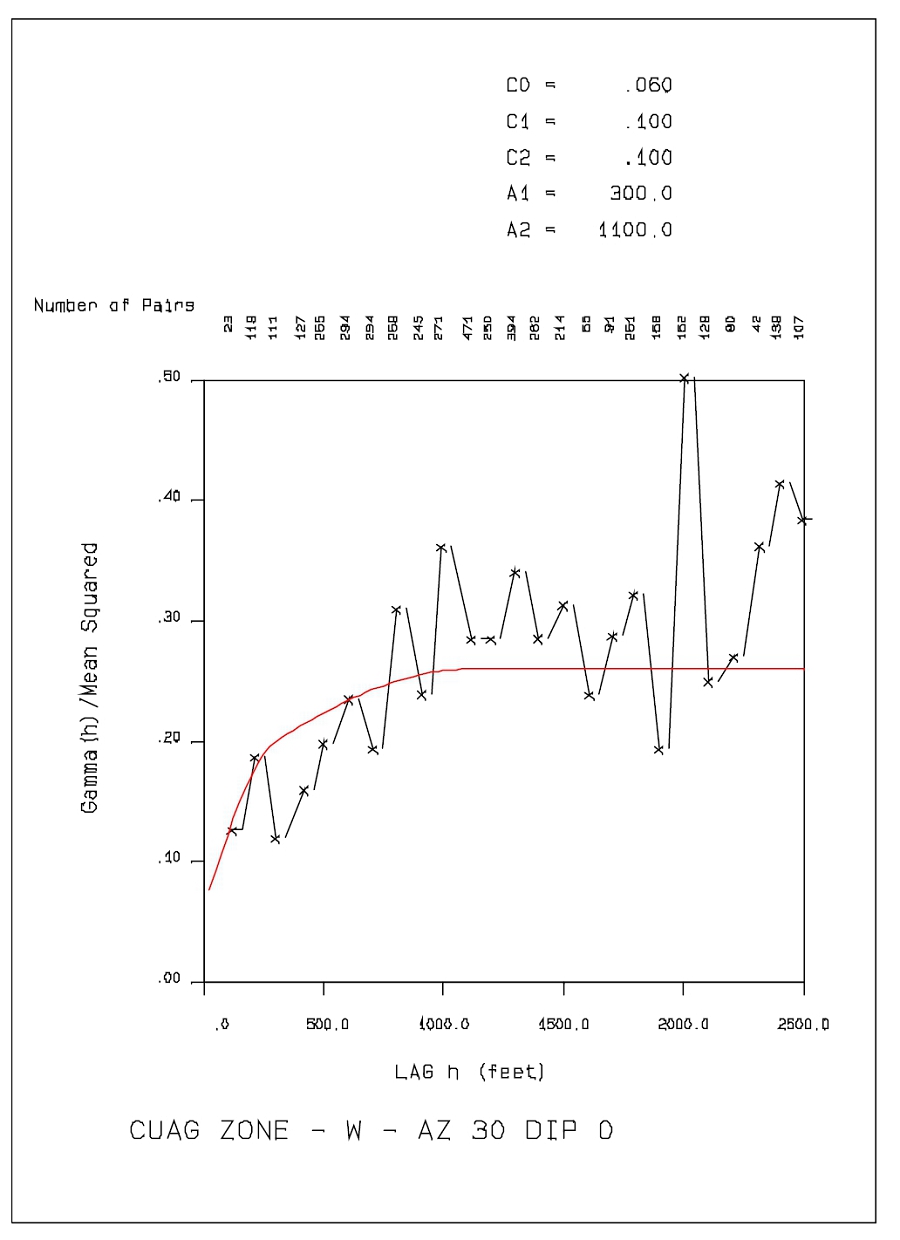
| SMD | Cumo S-k 1300 Technical Report | November 2022 |
Geologic 2CM027.001 CuMoCo. | Page 209 |
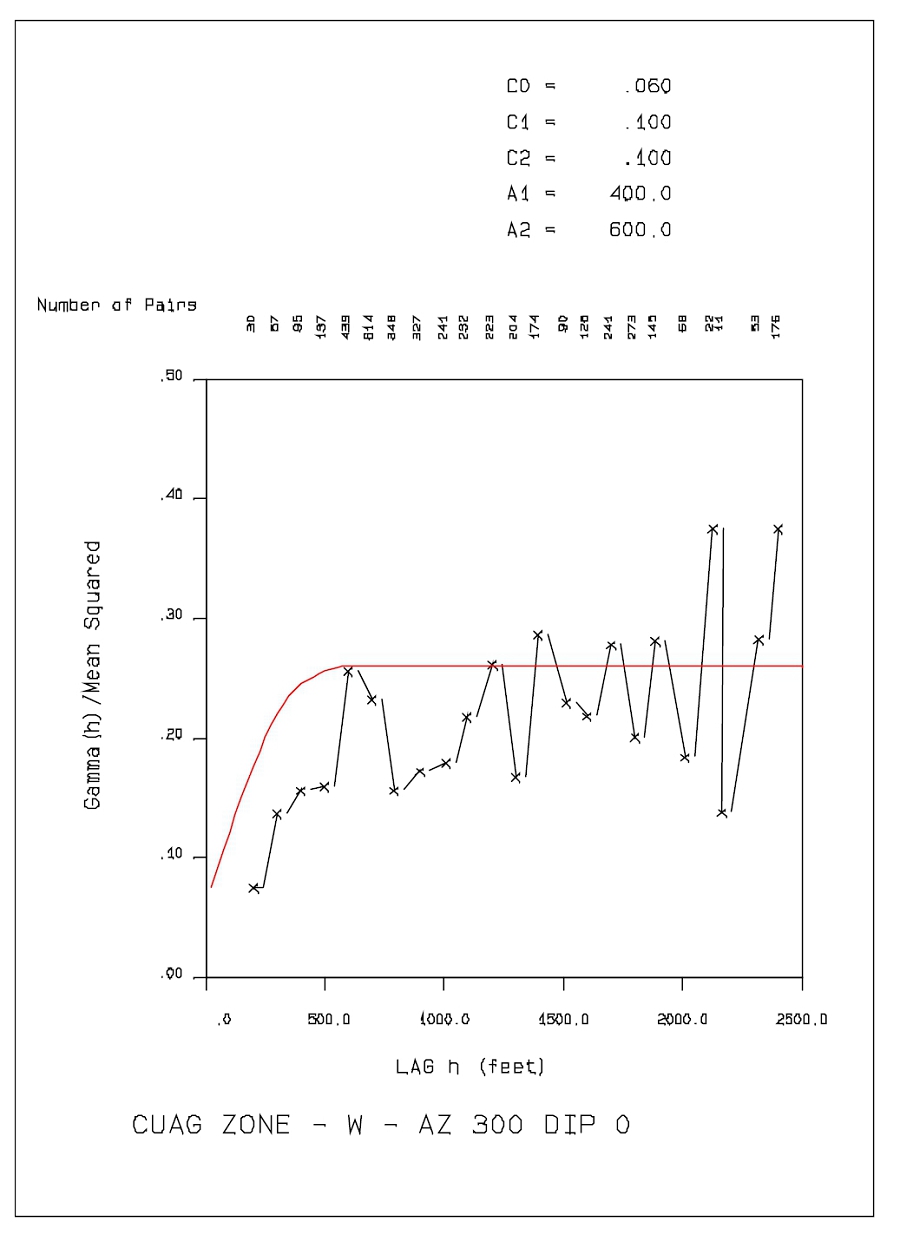
| SMD | Cumo S-k 1300 Technical Report | November 2022 |
Geologic 2CM027.001 CuMoCo. | Page 210 |
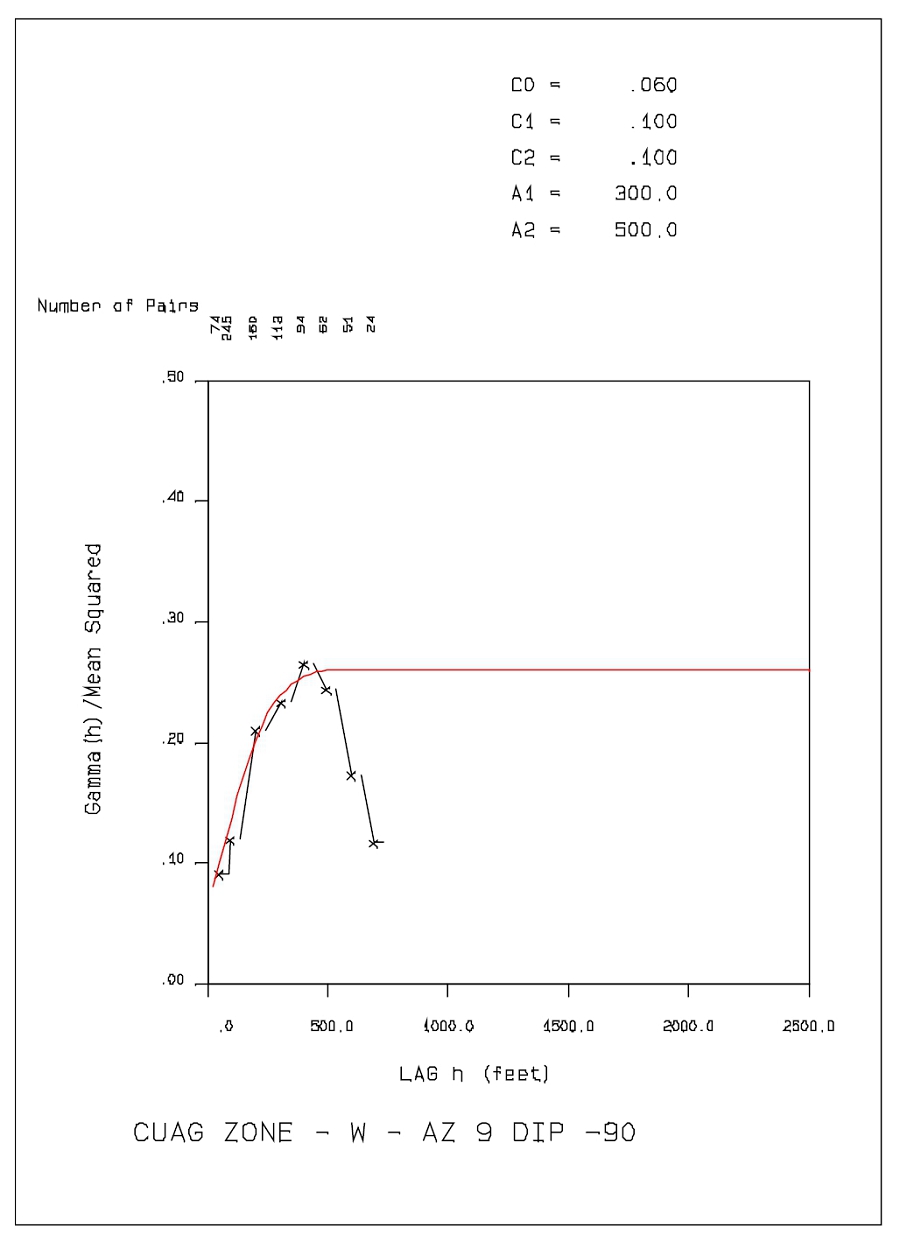
| SMD | Cumo S-k 1300 Technical Report | November 2022 |
Geologic 2CM027.001 CuMoCo. | Page 211 |
A4.8 – W in CuMo and Mo Zones:

| SMD | Cumo S-k 1300 Technical Report | November 2022 |
Geologic 2CM027.001 CuMoCo. | Page 212 |
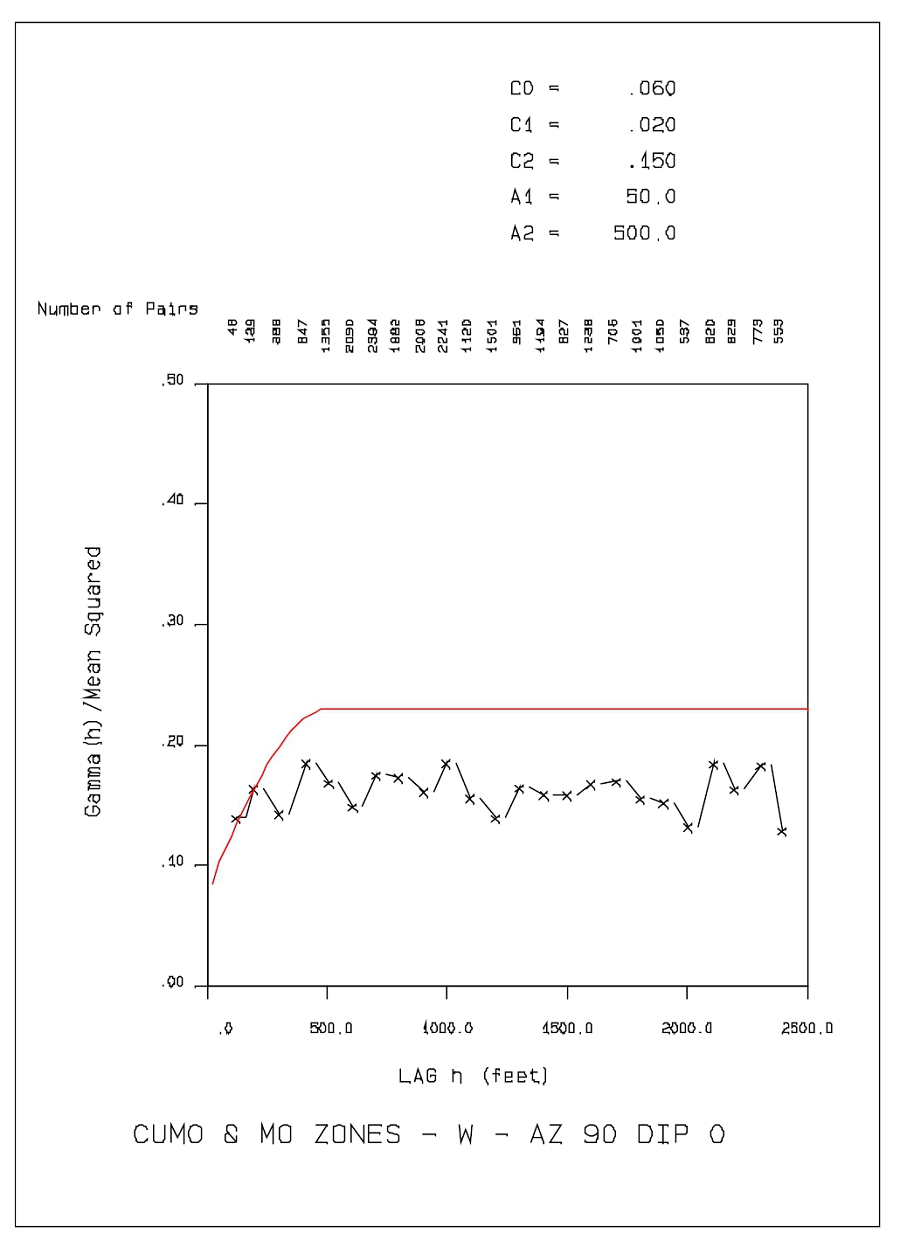
| SMD | Cumo S-k 1300 Technical Report | November 2022 |
Geologic 2CM027.001 CuMoCo. | Page 213 |
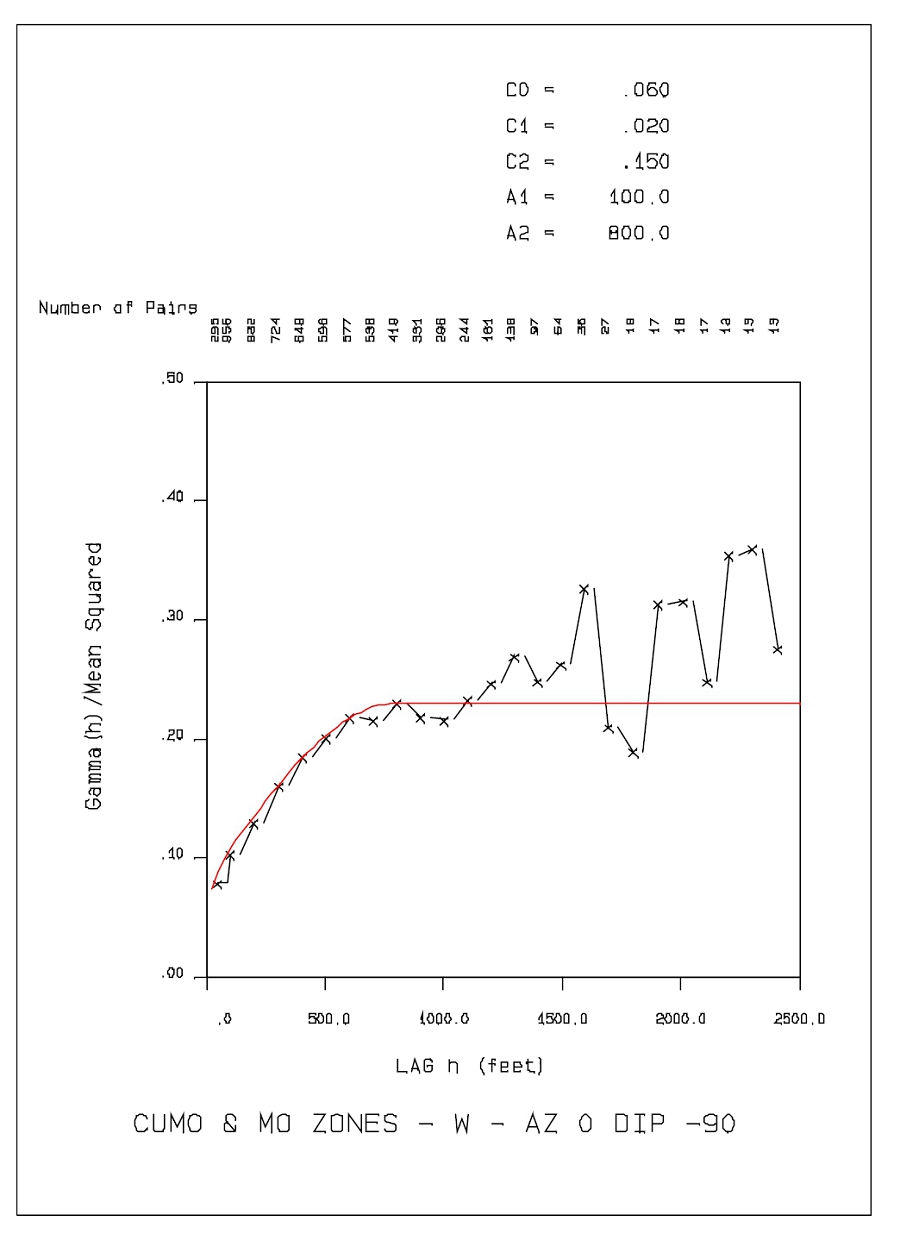
| SMD | Cumo S-k 1300 Technical Report | November 2022 |
Geologic 2CM027.001 CuMoCo. | Page 214 |
Appendix 5: Scatter Plots showing Results from Historic Data Verification
A5.1 – Skyline original MoS2 versus Skyline duplicate MoS2 from duplicate drill core
A5.2 – Skyline original MoS2 versus Skyline duplicate MoS2 from rejects
A5.3 – Skyline original MoS2 versus Skyline duplicate MoS2 from pulps
A5.4 – Skyline original MoS2 versus Amax check MoS2 on pulps from drill core
A5.5 – Skyline original MoS2 versus Amax check MoS2 on RC cuttings
A5.6 – Skyline original MoS2 versus Hazen check MoS2 on pulps
| SMD | Cumo S-k 1300 Technical Report | November 2022 |
Geologic 2CM027.001 CuMoCo. | Page 215 |
A5.1 – Skyline Original MoS2 versus Skyline Duplicate MoS2 from duplicate drill core
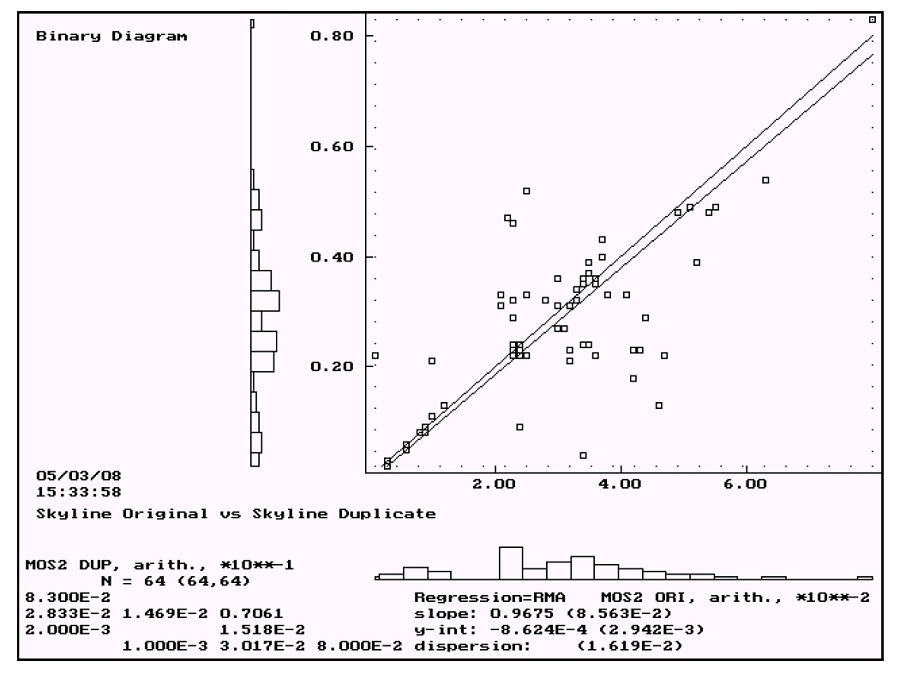
| SMD | Cumo S-k 1300 Technical Report | November 2022 |
Geologic 2CM027.001 CuMoCo. | Page 216 |
A5.2 – Skyline Original MoS2 versus Skyline Duplicate MoS2 from rejects
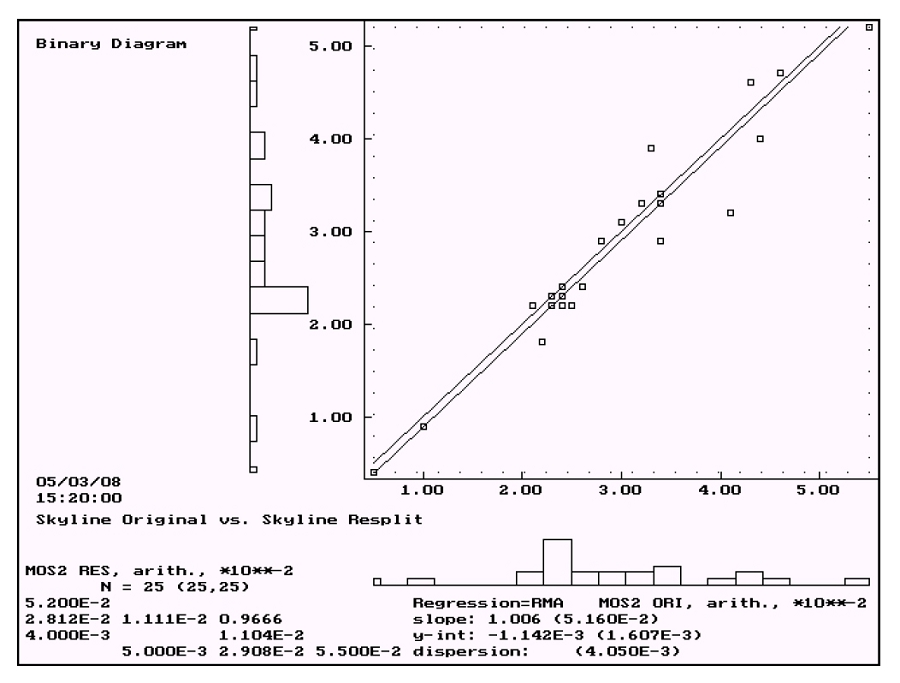
| SMD | Cumo S-k 1300 Technical Report | November 2022 |
Geologic 2CM027.001 CuMoCo. | Page 217 |
A5.3 – Skyline Original MoS2 versus Skyline Duplicate MoS2 from pulps
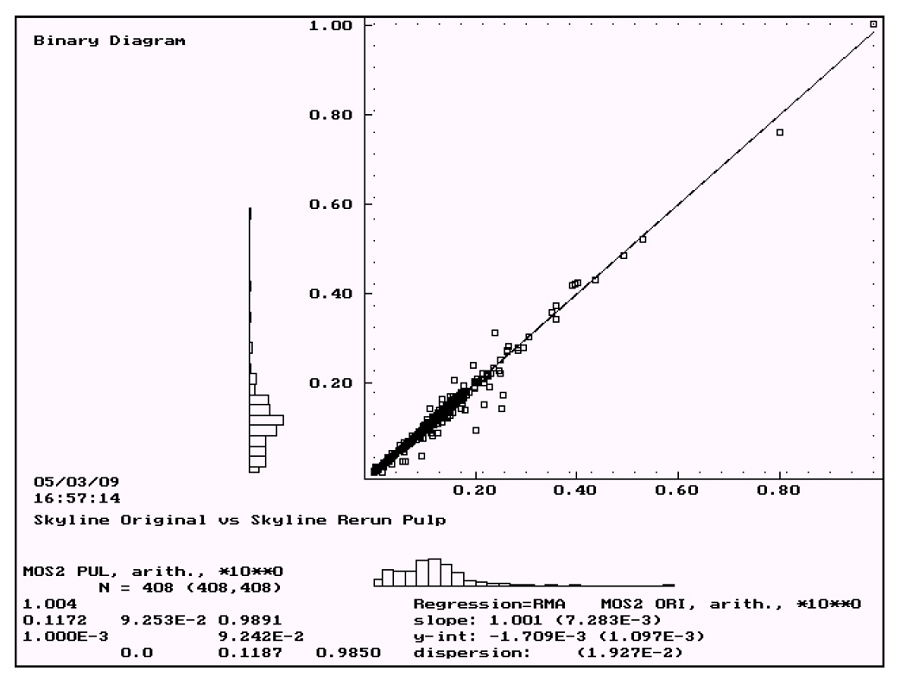
| SMD | Cumo S-k 1300 Technical Report | November 2022 |
Geologic 2CM027.001 CuMoCo. | Page 218 |
A5.4 – Skyline Original MoS2 versus Amax Check MoS2on pulps from drill core
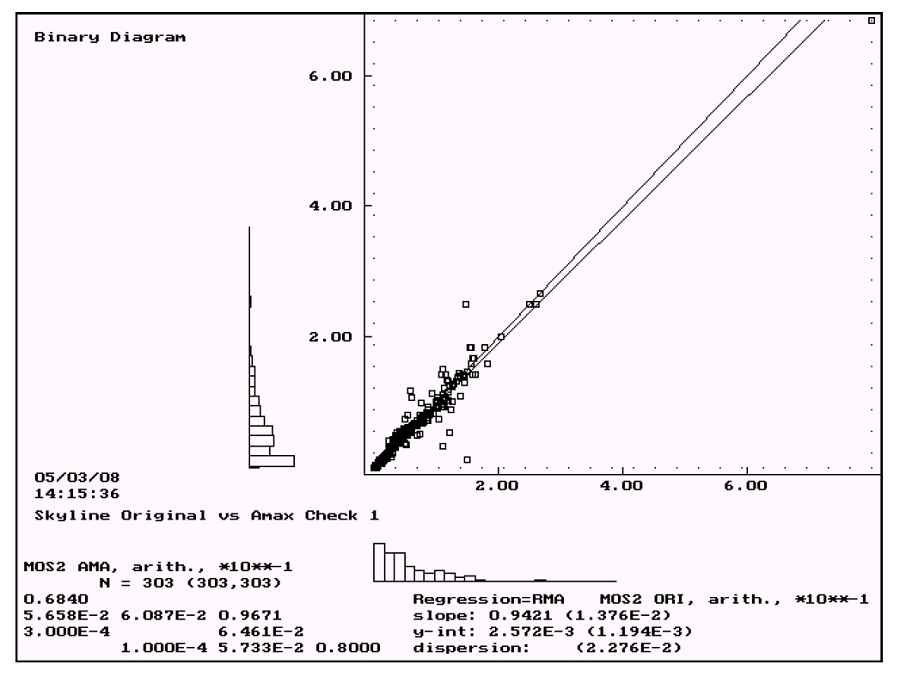
| SMD | Cumo S-k 1300 Technical Report | November 2022 |
Geologic 2CM027.001 CuMoCo. | Page 219 |
A5.5 – Skyline Original MoS2 versus Amax Check MoS2on RC Cuttings
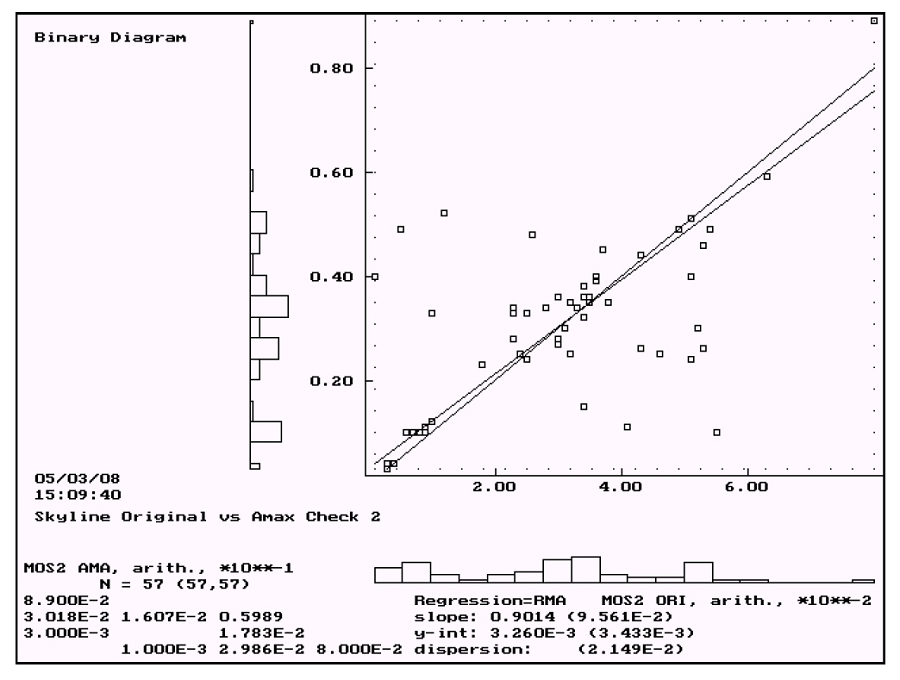
| SMD | Cumo S-k 1300 Technical Report | November 2022 |
Geologic 2CM027.001 CuMoCo. | Page 220 |
A5.6 – Skyline Original MoS2 versus Hazen Check MoS2on pulps
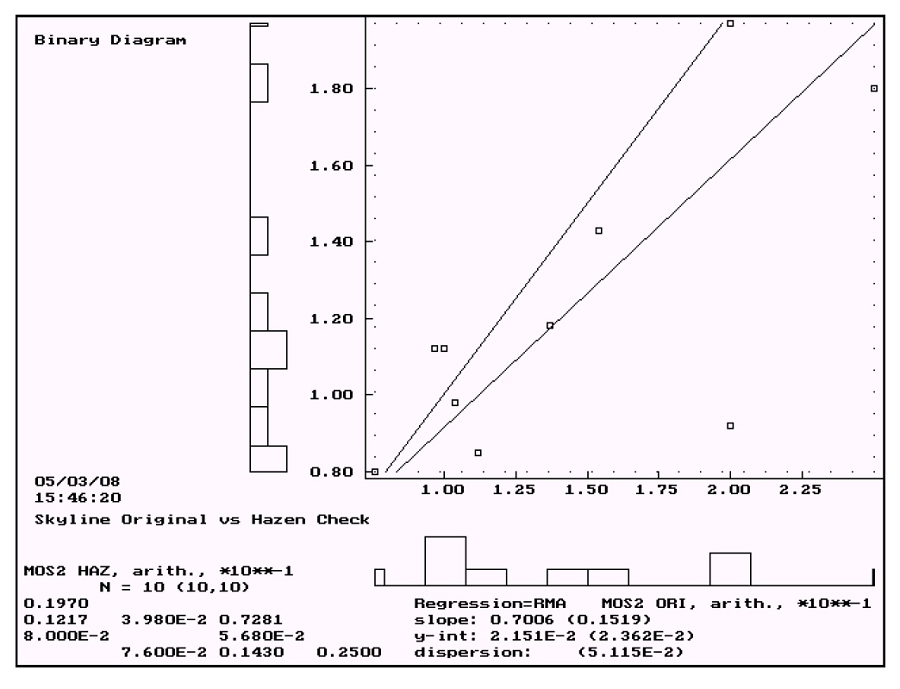
| SMD | Cumo S-k 1300 Technical Report | November 2022 |