Exhibit 99.2

MANAGEMENT’S DISCUSSION AND ANALYSIS OF
OPERATIONS AND FINANCIAL CONDITION
FOR THE YEARS ENDED DECEMBER 31, 2011 AND 2010
TABLE OF CONTENTS
1: | | Core Business | 1 |
2: | | Highlights | 1 |
3: | | Outlook and Strategy | 4 |
4: | | Summary of Financial and Operating Statistics | 7 |
| | 4.1: | Three-Year Annual Financial Statistics | 7 |
| | 4.2: | Three-Year Annual Operating Statistics | 8 |
| | 4.3: | Quarterly Financial Statistics | 9 |
| | 4.4: | Quarterly Operating Statistics | 10 |
5: | | Overview of Annual Results | 12 |
| | 5.1: | Overview of Annual Financial Results | 12 |
| | 5.2: | Overview of Annual Operating Results | 15 |
6: | | Overview of Quarterly Results | 16 |
| | 6.1: | Overview of Quarterly Financial Results | 16 |
| | 6.2: | Overview of Quarterly Operating Results | 18 |
7: | | Operating Mines | 19 |
8: | | Construction, Development and Exploration | 29 |
9: | | Mineral Reserve and Mineral Resource Estimates | 31 |
10: | | Liquidity, Capital Resources and Contractual Commitments | 35 |
11: | | Income Taxes | 39 |
12: | | Economic Trends, Risks and Uncertainties | 40 |
13: | | Contingencies | 45 |
14: | | Critical Accounting Policies and Estimates | 45 |
15: | | Non-GAAP Measures | 48 |
16: | | Selected Quarterly Financial and Operating Summary | 53 |
17: | | Disclosures Controls and Procedures | 55 |
MANAGEMENT’S DISCUSSION AND ANALYSIS OF OPERATIONS AND FINANCIAL CONDITION
(All figures are in United States Dollars unless otherwise specified and are in accordance with International Financial Reporting Standards (“IFRS”) as issued by the International Accounting Standards Board (“IASB”))
Cautionary notes regarding forward-looking statements, including estimates of Measured, Indicated and Inferred Mineral Resources and regarding Mineral Reserves and Mineral Resources follow this Management’s Discussion and Analysis of Operations and Financial Condition
1. CORE BUSINESS
Yamana Gold Inc. (the “Company” or “Yamana”) is a Canadian-based gold producer engaged in gold mining and related activities including exploration, extraction, processing and reclamation. The Company has significant properties involved in gold and other precious metal production, development, exploration and land positions throughout the Americas including Brazil, Argentina, Chile, Mexico and Colombia.
The Company plans to continue to build on its current production base through existing operating mine expansions, throughput increases, development of new mines, advancement of its exploration properties and by targeting other gold consolidation opportunities with a primary focus in the Americas. Note 34(a) “Related Parties” to the accompanying consolidated financial statements lists Yamana’s significant subsidiaries with 100% equity interest. Yamana does not have any material off-balance sheet arrangements.
Yamana is listed on the Toronto Stock Exchange (Symbol: YRI), The New York Stock Exchange (Symbol: AUY) and The London Stock Exchange (Symbol: YAU).
2. HIGHLIGHTS
Financial
Twelve months ended December 31, 2011
· Record-setting results for most financial metrics including:
· Revenues of $2.2 billion, an increase of 29% over 2010.
· Net earnings of $548.3 million representing an increase of 18% over 2010 after deducting an after-tax unrealized loss on the write-down of its investment securities portfolio of $81.0 million.
· Adjusted earnings* of $712.9 million an increase of 59% over 2010, representing basic and diluted adjusted earnings per share* of $0.96 compared to $0.61 per share in 2010.
· Mine operating earnings of $1.1 billion, a 46% increase from 2010.
· Cash flows from operating activities after changes in non-cash working capital of $1.2 billion, representing an increase of 80%, compared with 2010.
· Cash flows generated from operations before changes in non-cash working capital of $1.3 billion, representing an increase of 48%, compared with 2010.
· Cash and cash equivalents at December 31, 2011 were $550.4 million, a $219.9 million increase from the beginning of the year, after debt repayments during the year totaling $55.0 million and total dividend payments of $100.1 million, more than double the dividends paid in 2010.
· Increase in the Company’s annual dividend rate to $0.20 per share or $0.05 per share per quarter.
Three months ended December 31, 2011
· Revenues of $568.8 million, an increase of 6% over the same quarter of 2010.
· Net earnings of $89.6 million or $0.12 basic and diluted earnings per share were lower than the comparative quarter in 2010 after deducting an after-tax unrealized loss on the write-down of its investment securities portfolio of $81.0 million.
· Adjusted earnings of $184.2 million or $0.25 basic and diluted adjusted earnings per share, representing an increase of 8% over the same quarter of 2010.
· Record mine operating earnings of $296.8 million, a 9% increase over the same quarter of 2010.
· Cash flows from operations after changes in non-cash working capital of $338.9 million, representing an increase of 35%, compared with the same quarter of 2010.
· Cash flows generated from operating activities before changes in non-cash working capital of $320.4 million, representing an increase of 12%, compared with the same quarter of 2010.
*A non-GAAP measure — Refer to Section 15
1
Operational
Twelve months ended December 31, 2011
· Record total production of 1,102,296 gold equivalent ounces (“GEO”) from continuing operations was 5% higher than 2010.
· Record commercial production of 1,093,858 GEO which was 4% higher than production from continuing operations in 2010.
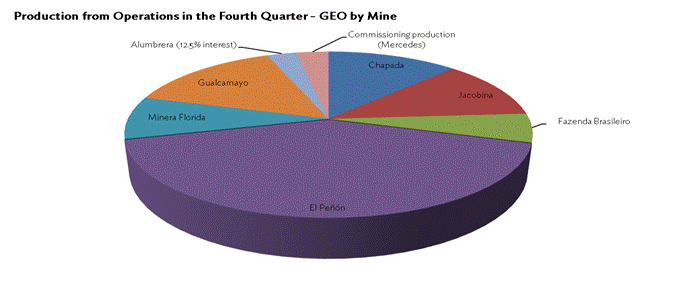
· Attributable production of operating mines is summarized as follows:
| | For the years ended December 31, | |
(In GEO) | | 2011 | | 2010 | |
Chapada | | 135,347 | | 135,613 | |
El Peñón | | 475,586 | | 427,934 | |
Gualcamayo | | 158,847 | | 135,140 | |
Jacobina | | 121,675 | | 122,160 | |
Minera Florida | | 102,738 | | 105,604 | |
Fazenda Brasileiro | | 55,163 | | 70,084 | |
Alumbrera (12.5%) | | 44,502 | | 50,656 | |
Mercedes (commissioning production) | | 8,438 | | — | |
· Production of 9.3 million silver ounces which, for presentation purposes only, is treated as GEO (assuming a gold equivalent ratio of 50:1).
· Year-over-year increase in GEO production from the Company’s largest gold mines: Gualcamayo and El Peñón of 18% and 11%, respectively, compared with 2010.
· By-product cash costs of $50 per GEO*.
· Co-product cash costs of $463 per GEO*.
· Production of 166.1 million pounds of copper contained in concentrate from Chapada, which was 11% higher than 2010 with co-product cash costs per pound of copper* of $1.29.
Three months ended December 31, 2011
· Total production of 276,918 GEO for the quarter including Mercedes.
· Commercial production of 268,480 GEO.
· Attributable production from operating mines is summarized as follows:
| | For the three months ended December 31, | |
(In GEO) | | 2011 | | 2010 | |
Chapada | | 34,313 | | 36,965 | |
El Peñón | | 115,043 | | 113,800 | |
Gualcamayo | | 40,676 | | 36,239 | |
Jacobina | | 31,983 | | 33,718 | |
Minera Florida | | 23,151 | | 32,048 | |
Fazenda Brasileiro | | 15,568 | | 19,852 | |
Alumbrera (12.5%) | | 7,746 | | 14,061 | |
Mercedes (commissioning production) | | 8,438 | | — | |
· Production of 2.3 million silver ounces which, for presentation purposes only, is treated as GEO (assuming a gold equivalent ratio of 50:1).
· Quarter-over-quarter increase in GEO production from the Company’s largest gold mines: Gualcamayo and El Peñón of 12% and 1% respectively, compared with the same quarter of 2010.
· By-product cash costs of $174 per GEO*.
· Co-product cash costs of $486 per GEO*.
· Production of 45.4 million pounds of copper contained in concentrate from Chapada, representing an increase of 14% over the same quarter of 2010 with co-product cash costs per pound of copper* of $1.20.
· Mercedes, Mexico — Subsequent to the year end, Mercedes reached commercial production as of February 1, 2012 upon achieving sustainable levels of operations based on qualitative and quantitative factors.
*A non-GAAP measure — Refer to Section 15
2
Construction, Development and Exploration
· Construction Projects - Construction is progressing to planned start-up of operations with C1 Santa Luz and Ernesto/Pau-a-Pique scheduled for the end of 2012 with current physical advancement of approximately 60% and 75% complete, respectively and at Pilar for mid-2013 with current physical advancement of approximately 25%.
· Jacobina, Brazil - Successful infill drilling at Canavieiras and Morro do Vento resulted in measured and indicated mineral resource increases of approximately 392,000 ounces of gold in 2.2 million tonnes at 3.83 g/t and 81,000 gold ounces in 814,584 tonnes at 3.09 g/t, respectively representing potential additional mine life of more than three years. The gold grade at Canavieiras averaged approximately 3.83 g/t which improved the average grade of global mineral resources and mineral reserves.
· El Peñón, Chile — Total gold equivalent mineral reserves increased by 20% to 3.5 million GEO supporting an increased mine life and a higher sustainable production level of 440,000 GEO per year. Infill drilling upgraded the previously defined mineral resources to mineral reserves and identified higher grade areas. The 2012 exploration program at El Peñón will focus on the extension of Pampa Augusta Victoria and areas within the North Block as well as more recent discoveries. This effort is expected to result in continued increases in mineral resources in 2012.
· Chapada, Brazil — Feasibility Study of Suruca oxide ore, a satellite deposit, was completed in December 2011, which supports average annual production of 49,000 gold ounces for five years beginning in 2013. Corpo Sul is a new discovery made during 2011. It is expected that further work at Corpo Sul will significantly contribute to 2012 growth of mineral reserves. The strategic plan of the Company is to ensure sustainable production at Chapada of 150,000 gold ounces and 135 million pounds of copper for 2013 and onwards for at least five years from the main Chapada pit, Suruca and Corpo Sul.
· The Company’s total mineral reserves on a GEO basis increased by 11% over the previous year; total measured and indicated mineral resources modestly declined primarily from the conversion of mineral resources to mineral reserves and inferred mineral resources increased by 39% over 2010.
3
3. OUTLOOK AND STRATEGY
The Company is focused on operational predictability and reliability with a concentrated effort in increasing cash flows, containing costs and expanding margins to maximize shareholder value. The Company continues on a steady path of organic growth through expanding current, near-term and in-development production plans, developing new projects and advancing its exploration properties.
Production in 2012 is expected to be in the range of 1.2 to 1.3 million gold equivalent ounces (“GEO”). This will represent an increase from 2011 production of approximately 13%, most of which will come from Mercedes as its production ramps up, as well as the Minera Florida expansion which will add to production starting in March 2012. C1 Santa Luz and Ernesto/Pau-a-Pique are also expected to start production by the end of 2012.
Production in 2013 is expected to increase by 43% from 2011 levels, to a range of 1.5 to 1.7 million GEO, most of which will come from a full year of production from C1 Santa Luz and Ernesto/Pau-a-Pique, the start-up of Pilar and the Gualcamayo expansion.

A summary of the Company’s development stage projects is provided below:
| | Expected Average Annual Contribution | | Expected Start-date | |
C1 Santa Luz (i) | | 100,000 gold ounces | | Late-2012 | |
Ernesto/Pau-a-Pique (i) | | 100,000 gold ounces | | Late-2012 | |
Pilar | | 140,000-150,000 gold ounces | | Mid-2013 | |
(i) In the first two full years of production at C1 Santa Luz, average annual production is expected to exceed 130,000 ounces of gold and at Ernesto/Pau-a-Pique average annual production in the first two years is expected to be approximately 120,000 ounces of gold which would accelerate pay-back.
4
Estimated production on a mine-by-mine basis for 2012 and 2013 is detailed below:
Estimated Production (GEO) | | 2012E | | 2013E | |
Chapada | | 110,000 - 120,000 | | 140,000 - 160,000 | |
El Peñón (i) | | 430,000 - 455,000 | | 435,000 - 455,000 | |
Gualcamayo | | 155,000 - 180,000 | | 180,000 - 190,000 | |
Jacobina | | 130,000 - 145,000 | | 130,000 - 140,000 | |
Minera Florida (i) | | 135,000 - 150,000 | | 140,000 - 155,000 | |
Mercedes (i) | | 105,000 - 120,000 | | 125,000 - 135,000 | |
Fazenda Brasileiro | | 50,000 - 60,000 | | 50,000 - 60,000 | |
Alumbrera (12.5%) | | 40,000 - 50,000 | | 40,000 - 50,000 | |
Development Projects | | 20,000 - 30,000 | | 240,000 - 315,000 | |
Total GEO | | 1,175,000 - 1,310,000 | | 1,480,000 - 1,660,000 | |
Total Copper (M lbs, Chapada) | | 140 - 155 | | 120 - 135 | |
(i) Silver production is reported as GEO at a ratio of 50:1.
Silver production is expected to be consistent at between eight to nine million ounces in each of 2012 and 2013. Silver production is reported as a gold equivalent.
Copper production is expected to be in the range of 140 to 155 million pounds in 2012 and 120 to 135 million pounds in 2013. These estimates reflect the production from Chapada and do not include the attributable production from the Company’s 12.5% interest in Alumbrera.
By 2014, production is targeted to be at a sustainable level of approximately 1.75 million GEO. This includes production from the existing mines and development projects for which construction decisions have been made. Planned sustainable production of over 1.75 million GEO in 2014 and thereafter will be permitted in part due to the following opportunities:
· Development plan for Chapada to incorporate Corpo Sul which is expected to primarily sustain current production grades and levels for both copper and gold.
· Production at El Peñón increasing to a sustainable 440,000 GEO per year as development work is completed at newly discovered ore bodies.
· Full ramp up of Gualcamayo’s expansions to be completed mid-2013, which should increase sustainable production to over 200,000 gold ounces per year beginning in 2014.
· Evaluation of milling higher grade ore at Gualcamayo subject to mineral resource increases into 2012 and 2013, in relation to which a scoping study is expected to be completed in mid-2012.
· Development of higher grade areas at Jacobina increasing production to above 140,000 gold ounces per year beginning in 2014.
· Increasing Mercedes production to a sustainable level of 140,000 GEO beginning in 2014 resulting mostly from a throughput increase to up to 1,800 tonnes per day.
· Increasing Pilar production to 140,000-150,000 gold ounces beginning in 2014 mostly due to an increase in plant capacity and processing ore from nearby Caiamar which is higher grade.
Current exploration and early development projects will potentially add to this production level and will be included once construction decisions have been made. These projects include: Jeronimo, Agua Rica and Suyai.
Cash costs (a non-GAAP measure — see Section 15) for 2012 are forecasted to be below $250 per GEO. Cash costs are calculated after base metal by-product credits. The Company believes that by-product cash costs are a better representation of the Company’s cost structure as any erosion in costs due to mining inflation and the appreciation of the Chilean peso will be off-set by additional cash flow from increases in the copper price. Cash costs are reported annually and are expected to vary from quarter to quarter. Cash costs are also impacted by inflation year-over-year.
5
Cash costs were estimated using the following copper price and exchange rates:
| | 2012 | | 2013 | | 2014 | |
Copper - $/pound | | 4.00 | | 4.00 | | 4.00 | |
Brazil - Reais/$ | | 1.80 | | 1.80 | | 1.80 | |
Argentina – Pesos/$ | | 4.50 | | 4.75 | | 4.75 | |
Chile – Pesos/$ | | 500.00 | | 500.00 | | 500.00 | |
Development capital to be spent in 2012, including $65 million carried forward from 2011 and excluding capitalized exploration, is expected to be $665 million. This includes amounts for new projects for which capital was not committed in 2011. Development capital will decline into 2013 and the following years as the Company’s development projects are completed.
For 2012, sustaining capital is expected to be $340 million across all operations and is expected to decline after current sustaining development projects are completed in 2014.
The Company is also contemplating certain initiatives that will result in improved recoveries, reduced costs and/or mine life extension at various operations. These projects are currently being evaluated with final decisions still pending. The most significant impact projects are at El Peñón, Chapada and Pilar.
The Company expects to spend approximately $125 million on exploration in 2012, a continuation of the successful 2011 program. Yamana’s 2012 exploration program will continue to focus on increasing mineral reserves and mineral resources with its near-mine and regional exploration programs, as well as continuing to explore greenfield targets. The Company remains committed to the development of a pool of talented geoscientists in sustaining its exploration performance.
In addition to $1.1 billion of available cash and undrawn credit available at the end of 2011, the expected robust cash flows from operations under the current and intermediate-term pricing conditions for gold will enable the Company to fully fund its growth, reward shareholders through dividends and accelerate capital spending to enhance the Company’s production growth profile.
6
4. SUMMARY OF FINANCIAL AND OPERATING STATISTICS
4.1 THREE-YEAR ANNUAL FINANCIAL STATISTICS
| | Twelve months ended December 31, | |
(in thousands of United States Dollars; unless otherwise noted) | | 2011 | | 2010 | | 2009(vi) | |
Revenues (i) | | $ | 2,173,325 | | $ | 1,686,811 | | $ | 1,183,314 | |
Cost of sales excluding depletion, depreciation and amortization | | (716,692 | ) | (631,063 | ) | (479,847 | ) |
Gross margin | | 1,456,633 | | 1,055,748 | | 703,467 | |
Depletion, depreciation and amortization | | (356,759 | ) | (301,912 | ) | (233,687 | ) |
Mine operating earnings | | 1,099,874 | | 753,836 | | 469,780 | |
Equity earnings, expenses and income tax expense | | (458,980 | ) | (298,678 | ) | (258,009 | ) |
Impairment of investment in available-for-sale securities | | (92,600 | ) | — | | — | |
Earnings from continuing operations | | 548,294 | | 455,158 | | 211,771 | |
Earnings from discontinued operations (ii) | | — | | 11,329 | | (19,140 | ) |
Net earnings | | $ | 548,294 | | $ | 466,487 | | $ | 192,631 | |
Adjusted earnings (iii) | | $ | 712,896 | | $ | 448,203 | | $ | 346,131 | |
Earnings per share - basic and diluted | | $ | 0.74 | | $ | 0.63 | | $ | 0.26 | |
Adjusted earnings per share (iii) - basic and diluted | | $ | 0.96 | | $ | 0.61 | | $ | 0.47 | |
Cash flows from operating activities of continuing operations | | $ | 1,225,782 | | $ | 681,331 | | $ | 528,026 | |
Cash flows generated from operations before changes in non-cash working capital items | | $ | 1,266,373 | | $ | 856,827 | | $ | 495,619 | |
Cash flows to investing activities of continuing operations | | $ | (846,075 | ) | $ | (460,640 | ) | $ | (469,916 | ) |
Cash flows to financing activities of continuing operations | | $ | (142,678 | ) | $ | (68,870 | ) | $ | (64,957 | ) |
Capital expenditures | | $ | 822,223 | | $ | 531,081 | | $ | 498,757 | |
Working capital | | $ | 608,021 | | $ | 518,081 | | $ | 260,337 | |
Dividends declared per share | | $ | 0.15 | | $ | 0.08 | | $ | 0.04 | |
Weighted average number of common shares outstanding | | $ | 744,600 | | $ | 739,938 | | $ | 733,093 | |
Cash and cash equivalents | | $ | 550,438 | | $ | 330,498 | | $ | 170,070 | |
Total assets | | $ | 10,769,940 | | $ | 10,319,092 | | $ | 9,707,260 | |
Total long-term liabilities | | $ | 2,783,786 | | $ | 2,838,324 | | $ | 2,589,460 | |
Total equity | | $ | 7,491,523 | | $ | 7,086,271 | | $ | 6,571,534 | |
Average realized gold price per ounce (iv) | | $ | 1,567 | | $ | 1,237 | | $ | 980 | |
Average realized copper price per pound (excluding derivative contracts) (iv) | | $ | 3.93 | | $ | 3.37 | | $ | 2.44 | |
Average realized silver price per ounce (iv) | | $ | 35.19 | | $ | 20.70 | | $ | 14.89 | |
Average market gold price per ounce (v) | | $ | 1,573 | | $ | 1,225 | | $ | 974 | |
Average market copper price per pound (v) | | $ | 4.00 | | $ | 3.42 | | $ | 2.34 | |
Average market silver price per ounce (v) | | $ | 35.32 | | $ | 20.24 | | $ | 14.7 | |
(i) | | Revenues consist of sales net of sales taxes. |
(ii) | | Results of San Andrés, São Vicente and São Francisco mines have been reclassified as discontinued operations (in accordance with IFRS) with restatement of prior period comparatives. |
(iii) | | A cautionary note regarding non-GAAP measures and their respective reconciliations are included in Section 15 including a discussion and definition of Adjusted Earnings and Adjusted Earnings per Share. |
(iv) | | Realized prices based on gross sales compared to market prices for metals may vary due to infrequent shipments and depending on timing of the sales. Realized prices reflect continuing operations only for the comparative periods. |
(v) | | Source of information: Bloomberg. |
(vi) | | The financial results for periods ending prior to January 1, 2010 have not been restated in accordance with IFRS. |
7
4.2 THREE-YEAR ANNUAL OPERATING STATISTICS
| | Twelve months ended December 31, | |
| | 2011 | | 2010 | | 2009 | |
Total Gold Equivalent Ounces (GEO) (i) | | | | | | | |
BRAZIL | | | | | | | |
Chapada | | 135,347 | | 135,613 | | 156,251 | |
Jacobina | | 121,675 | | 122,160 | | 110,515 | |
Fazenda Brasileiro | | 55,163 | | 70,084 | | 76,413 | |
CHILE | | | | | | | |
El Peñón (ii) | | 475,586 | | 427,934 | | 394,400 | |
Minera Florida (ii) | | 102,738 | | 105,604 | | 91,877 | |
ARGENTINA | | | | | | | |
Gualcamayo | | 158,847 | | 135,140 | | 98,641 | |
Alumbrera (iii) | | 44,502 | | 50,656 | | 52,750 | |
Commercial GEO - continuing operations (i) | | 1,093,858 | | 1,047,191 | | 980,847 | |
Commissioning GEO produced (i) (iv) | | 8,438 | | — | | 44,830 | |
GEO - discontinued operations (i) (v) | | — | | 43,287 | | 175,338 | |
Total GEO produced (i) | | 1,102,296 | | 1,090,478 | | 1,201,015 | |
By-product Cash Costs per GEO (i) (vi) | | | | | | | |
BRAZIL | | | | | | | |
Chapada | | $ | (2,454 | ) | $ | (2,073 | ) | $ | (848 | ) |
Jacobina | | 643 | | 535 | | 476 | |
Fazenda Brasileiro | | 937 | | 628 | | 453 | |
CHILE | | | | | | | |
El Peñón (ii) | | 400 | | 428 | | 353 | |
Minera Florida (ii) | | 591 | | 416 | | 373 | |
ARGENTINA | | | | | | | |
Gualcamayo | | 441 | | 506 | | 301 | |
Alumbrera (iii) | | (1,448 | ) | (1,404 | ) | (703 | ) |
By-product cash costs per GEO produced (i) (vi) | | $ | 50 | | $ | 50 | | $ | 123 | |
Co-product cash costs per GEO produced (i) (vi) | | $ | 463 | | $ | 442 | | $ | 357 | |
Concentrate Production | | | | | | | |
Chapada concentrate production (tonnes) | | 297,294 | | 264,195 | | 248,940 | |
Chapada copper contained in concentrate production (millions of lbs) | | 166.1 | | 149.4 | | 144.0 | |
Chapada co-product cash costs per lb of copper (vi) | | $ | 1.29 | | $ | 1.17 | | $ | 0.99 | |
Alumbrera concentrate production (tonnes) (iii) | | 55,840 | | 68,351 | | 68,868 | |
Alumbrera attributable copper contained in concentrate production (millions of lbs) (iii) | | 32.2 | | 38.7 | | 39.4 | |
Alumbrera co-product cash costs per lb of copper (iii) (vi) | | $ | 1.82 | | $ | 1.29 | | $ | 1.49 | |
Gold Equivalent Ounces Breakdown - Continuing Operations | | | | | | | |
Total gold ounces produced | | 916,284 | | 864,768 | | 835,265 | |
Commercial gold ounces produced | | 908,632 | | 864,768 | | 790,435 | |
Commercial silver ounces produced (millions of ounces) | | 9.3 | | 10.0 | | 10.5 | |
Sales | | | | | | | |
Commercial gold sales - continuing operations (ounces) | | 906,985 | | 862,053 | | 769,636 | |
Commissioning gold sales (ounces) (iv) | | — | | — | | 41,298 | |
Gold sales - discontinued operations (ounces) (v) | | — | | 47,932 | | 164,651 | |
Total gold sales (ounces) | | 906,985 | | 909,985 | | 975,585 | |
Chapada concentrate sales (tonnes) | | 293,092 | | 264,825 | | 261,841 | |
Chapada payable copper contained in concentrate sales (millions of lbs) | | 153.6 | | 143.8 | | 137.4 | |
Silver sales (millions of ounces) | | 9.1 | | 10.1 | | 10.5 | |
8
(i) | | Gold equivalent ounce calculations are based on an assumed gold to silver ratio of 50:1; for presentation purposes only. The assumed gold to silver ratio was 55:1 for 2010 and prior periods. |
(ii) | | 2011 gold production: El Peñón — 306,184 ounces; Minera Florida — 86,914 ounces, and silver production: El Peñón — 8.5 million ounces; Mineral Florida — 0.8 million ounces. Silver production is treated as a gold equivalent. |
(iii) | | Alumbrera represents a 12.5% interest. |
(iv) | | Including commissioning gold ounces from Mercedes for 2011 and Gualcamayo for 2009 produced and sold. |
(v) | | Results of San Andrés, São Vicente and São Francisco mines have been reclassified as discontinued operations (in accordance with IFRS) with restatement of prior period comparatives. |
(vi) | | A cautionary note regarding non-GAAP measures and their respective reconciliations are included in Section 15 including a discussion and definition of Adjusted Earnings and Adjusted Earnings per Share. |
4.3 QUARTERLY FINANCIAL STATISTICS
| | Three months ended December 31, | |
(in thousands of United States Dollars; unless otherwise noted) | | 2011 | | 2010 | |
Revenues (i) | | $ | 568,754 | | $ | 535,130 | |
Cost of sales excluding depletion, depreciation and amortization | | (178,384 | ) | (178,341 | ) |
Gross margin | | 390,370 | | 356,789 | |
Depletion, depreciation and amortization | | (93,611 | ) | (83,657 | ) |
Mine operating earnings | | 296,759 | | 273,132 | |
Equity earnings, expenses and income tax expense | | (114,560 | ) | (147,563 | ) |
Impairment of investments in available-for-sale securities | | (92,600 | ) | — | |
Net earnings | | $ | 89,599 | | $ | 125,569 | |
Adjusted earnings (ii) | | $ | 184,242 | | $ | 170,979 | |
Earnings per share - basic and diluted | | $ | 0.12 | | $ | 0.17 | |
Adjusted earnings per share (ii) - basic and diluted | | $ | 0.25 | | $ | 0.23 | |
Cash flows from operating activities of continuing operations | | $ | 338,850 | | $ | 250,506 | |
Cash flows generated from operations before changes in non-cash working capital items | | $ | 320,434 | | $ | 287,222 | |
Cash flows to investing activities of continuing operations | | $ | (315,505 | ) | $ | (147,192 | ) |
Cash flows to financing activities of continuing operations | | $ | (38,415 | ) | $ | (54,199 | ) |
Working capital | | $ | 608,021 | | $ | 518,081 | |
Dividends declared per share | | $ | 0.05 | | $ | 0.04 | |
Weighted average number of common shares outstanding | | $ | 745,669 | | $ | 741,207 | |
Cash and cash equivalents | | $ | 550,438 | | $ | 330,498 | |
Total assets | | $ | 10,769,940 | | $ | 10,319,092 | |
Total long-term liabilities | | $ | 2,783,786 | | $ | 2,838,324 | |
Total equity | | $ | 7,491,523 | | $ | 7,086,271 | |
Average realized gold price per ounce (iii) | | $ | 1,670 | | $ | 1,374 | |
Average realized copper price per pound (excluding derivative contracts) (iii) | | $ | 3.36 | | $ | 3.81 | |
Average realized silver price per ounce (iii) | | $ | 31.29 | | $ | 28.20 | |
Average market gold price per ounce (iv) | | $ | 1,683 | | $ | 1,367 | |
Average market copper price per pound (iv) | | $ | 3.41 | | $ | 3.92 | |
Average market silver price per ounce (iv) | | $ | 31.84 | | $ | 26.50 | |
(i) | | Revenues consist of sales net of sales taxes. |
(ii) | | A cautionary note regarding non-GAAP measures and their respective reconciliations are included in Section 15 including a discussion and definition of Adjusted Earnings and Adjusted Earnings per Share. |
(iii) | | Realized prices based on gross sales compared to market prices for metals may vary due to infrequent shipments and depending on timing of the sales. |
(iv) | | Source of information: Bloomberg. |
9
4.4 QUARTERLY OPERATING STATISTICS
| | Three months ended December 31, | |
| | 2011 | | 2010 | |
Gold Equivalent Ounces (GEO) (i) | | | | | |
BRAZIL | | | | | |
Chapada | | 34,313 | | 36,965 | |
Jacobina | | 31,983 | | 33,718 | |
Fazenda Brasileiro | | 15,568 | | 19,852 | |
CHILE | | | | | |
El Peñón (ii) | | 115,043 | | 113,800 | |
Minera Florida (ii) | | 23,151 | | 32,048 | |
ARGENTINA | | | | | |
Gualcamayo | | 40,676 | | 36,239 | |
Alumbrera (iii) | | 7,746 | | 14,061 | |
Total commercial GEO production (i) | | 268,480 | | 286,683 | |
Commissioning GEO - Mercedes (i) | | 8,438 | | — | |
Total GEO production (i) | | 276,918 | | 286,683 | |
By-product Cash Costs per GEO (i) (iv) | | | | | |
BRAZIL | | | | | |
Chapada | | $ | (1,715 | ) | $ | (2,863 | ) |
Jacobina | | 646 | | 495 | |
Fazenda Brasileiro | | 915 | | 705 | |
CHILE | | | | | |
El Peñón (ii) | | 413 | | 421 | |
Minera Florida (ii) | | 706 | | 479 | |
ARGENTINA | | | | | |
Gualcamayo | | 424 | | 662 | |
Alumbrera (iii) | | (1,351 | ) | (1,556 | ) |
By-product cash costs per GEO produced (i) (iv) | | $ | 174 | | $ | (34 | ) |
Co-product cash costs per GEO produced (i) (iv) | | $ | 486 | | $ | 465 | |
Concentrate Production | | | | | |
Chapada concentrate production (tonnes) | | 81,396 | | 69,869 | |
Chapada copper contained in concentrate production (millions of lbs) | | 45.4 | | 39.9 | |
Chapada co-product cash costs per pound of copper (iv) | | $ | 1.20 | | $ | 1.20 | |
Alumbrera concentrate production (tonnes) (iii) | | 10,691 | | 16,422 | |
Alumbrera attributable copper contained in concentrate production (millions of lbs) (iii) | | 6.2 | | 9.3 | |
Alumbrera co-product cash costs per lb of copper (iii) (iv) | | $ | 2.59 | | $ | 1.37 | |
Gold Equivalent Ounces Breakdown | | | | | |
Total gold ounces produced | | 231,670 | | 243,407 | |
Silver ounces produced (millions of ounces) | | 2.3 | | 2.4 | |
Sales | | | | | |
Total gold sales (ounces) | | 228,539 | | 234,708 | |
Chapada concentrate sales (tonnes) | | 81,436 | | 74,009 | |
Chapada payable copper contained in concentrate sales (millions of lbs) | | 43.6 | | 39.6 | |
Silver sales (millions of ounces) | | 2.2 | | 2.4 | |
(i) | | Silver production is treated as a gold equivalent. Gold equivalent ounce calculations are based on an average historical gold to silver ratio (50:1) which is used and presented solely for quarter-over-quarter comparative purposes only. The assumed gold to silver ratio was 55:1 for 2010 and prior periods. |
10
(ii) | | 2011 fourth quarter gold production: El Peñón — 75,407 ounces; Minera Florida — 18,326 ounces, and silver production: El Peñón — 2.0 million ounces; Mineral Florida — 0.2 million ounces. Silver production is treated as a gold equivalent. |
(iii) | | Alumbrera represents a 12.5% interest. |
(iv) | | A cautionary note regarding non-GAAP measures and their respective reconciliations are included in Section 15 including a discussion and definition of Adjusted Earnings and Adjusted Earnings per Share. |
11
5. OVERVIEW OF ANNUAL RESULTS
5.1 OVERVIEW OF ANNUAL FINANCIAL RESULTS
| | Years ended December 31, | |
(in thousands of United States Dollars; unless otherwise noted) | | 2011 | | 2010 | | 2009 (v) | |
Revenues (i) | | $ | 2,173,325 | | $ | 1,686,811 | | $ | 1,183,314 | |
Cost of sales excluding depletion, depreciation and amortization | | (716,692 | ) | (631,063 | ) | (479,847 | ) |
Gross margin | | 1,456,633 | | 1,055,748 | | 703,467 | |
Depletion, depreciation and amortization | | (356,759 | ) | (301,912 | ) | (233,687 | ) |
Mine operating earnings | | 1,099,874 | | 753,836 | | 469,780 | |
Other expenses (iv) | | (228,109 | ) | (219,616 | ) | (152,523 | ) |
Equity earnings from associate | | 39,019 | | 49,264 | | 31,073 | |
Impairment of investment in available-for-sale securities | | (92,600 | ) | — | | — | |
Earnings from continuing operations before income taxes | | 818,184 | | 583,484 | | 348,330 | |
Income tax expense | | (269,890 | ) | (128,326 | ) | (136,559 | ) |
Earnings from continuing operations | | 548,294 | | 455,158 | | 211,771 | |
Earnings from discontinued operations (ii) | | — | | 11,329 | | (19,140 | ) |
Net earnings | | $ | 548,294 | | $ | 466,487 | | $ | 192,631 | |
Earnings adjustments (iii): | | | | | | | |
Non-cash unrealized foreign exchange losses (gains) | | 58,284 | | (46,539 | ) | (36,672 | ) |
Non-cash unrealized gains on derivatives | | (1,125 | ) | (1,948 | ) | 112,519 | |
Share-based payments and other compensation | | 20,554 | | 12,053 | | 23,275 | |
Deferred income tax (recovery) expense on translation of intercompany debt | | (6,256 | ) | 3,680 | | 51,578 | |
Non-recurring deferred income tax adjustments | | — | | — | | 35,826 | |
Impairment of investment in available-for-sale securities | | 92,600 | | — | | — | |
Other non-recurring losses | | 18,118 | | 16,602 | | 8,301 | |
Adjusted earnings before income tax effect | | 730,469 | | 450,335 | | 387,458 | |
Income tax effect of adjustments | | (17,573 | ) | (2,132 | ) | (41,327 | ) |
Adjusted earnings (iii) | | $ | 712,896 | | $ | 448,203 | | $ | 346,131 | |
Earnings per share - basic and diluted | | $ | 0.74 | | $ | 0.63 | | $ | 0.26 | |
Adjusted earnings per share (iii) - basic and diluted | | $ | 0.96 | | $ | 0.61 | | $ | 0.47 | |
(i) | | Revenues consist of sales net of sales taxes. |
(ii) | | Results of San Andrés, São Vicente and São Francisco mines have been reclassified as discontinued operations (in accordance with IFRS) with restatement of prior period comparatives. |
(iii) | | A cautionary note regarding non-GAAP measures and their respective reconciliations are included in Section 15 including a discussion and definition of Adjusted Earnings and Adjusted Earnings per Share. |
(iv) | | Other expenses include general and administrative, exploration, other operating expenses and net finance expense. |
(v) | | The financial results for periods ending prior to January 1, 2010 have not been restated in accordance with IFRS. |
Precious metal prices continued to climb during 2011 with gold prices increasing to new record highs amidst continued risk aversion by investors seeking gold as a safe haven. The average market prices for gold and silver in 2011 were up by 28% and 75%, respectively, compared with 2010. Additionally, demand for copper continued a steady climb for most of 2011 increasing prices by 17% from 2010. Record metal prices in combination with record production for the year contributed to record-setting financial results for the Company despite an unrealized non-cash loss on the Company’s investment portfolio of $81.0 million on an after-tax basis.
Record adjusted earnings of $712.9 million or $0.96 per share for the year, a 59% increase compared with adjusted earnings of $448.2 million or $0.61 per share for 2010. Higher adjusted earnings were mainly due to increased revenues as a result of more favourable realized prices for gold, copper and silver, and increased production from continuing operations offset by higher other expenses and higher income tax expense compared to 2011.
12
Net earnings for the year were $548.3 million compared with net earnings of $466.5 million in 2010 despite an unrealized non-cash loss on the Company’s investment portfolio of $81.0 million on an after-tax basis ($92.6 million on a pre-tax basis). Basic earnings per share were $0.74 compared with $0.63 per share for 2010. Higher net earnings were mainly due the same contributing factors as adjusted earnings and negatively impacted by an unrealized non-cash impairment loss on investment in available-for-sale securities and higher unrealized foreign exchange losses.
Mine operating earnings of $1.1 billion for the year, compared with $753.8 million in 2010, represents a 46% increase from 2010. Year-over-year, revenues increased by 29% while cost of sales excluding depletion, depreciation and amortization only increased by 14%, evident by the gross margin increase, as the Company reaps from the benefits of higher metal prices, higher volume of sales and cost-containment initiatives implemented during the year despite an environment of rising mining industry inflationary pressures and strengthening of Brazilian Reais, Chilean and Mexican pesos. The combination of these favourable outcomes contributed to record mine operating earnings for the year.
Revenues for the year were $2,173.3 million compared to $1,686.8 million; an increase of 29% and are comprised of the following:
| | Quantity | | Realized | | Years ended December 31, | |
(in thousands of United States Dollars; unless otherwise noted) | | Sold | | Price | | 2011 | | 2010 | |
Gold (i) | | 862,321 | | oz | | $ | 1,567 | | $ | 1,351,428 | | $ | 1,005,956 | |
Silver | | 9,141,302 | | oz | | $ | 35.19 | | 321,666 | | 209,766 | |
Total precious metals | | 1,045,147 | | GEO | | | | 1,673,094 | | 1,215,722 | |
Copper (i) | | 153,627,653 | | lbs | | $ | 3.93 | | 603,423 | | 482,016 | |
Gross revenues | | | | | | | | $ | 2,276,517 | | $ | 1,697,738 | |
(Deduct) Add : | | | | | | | | | | | |
- Treatment and refining charges of gold and copper concentrate | | | | | | | | $ | (31,122 | ) | $ | (31,707 | ) |
- Sales taxes and royalties | | | | | | | | (40,480 | ) | (24,334 | ) |
- Metal price adjustments related to concentrate revenues | | | | | | | | (38,974 | ) | 41,206 | |
- Other adjustments | | | | | | | | 7,384 | | 3,908 | |
Revenues | | | | | | | | $ | 2,173,325 | | $ | 1,686,811 | |
(i) Includes payable copper and gold contained in concentrate.
Cost of sales excluding depletion, depreciation and amortization for the year was $716.7 million compared with $631.1 million in 2010. The following table provides a reconciliation of the co-product cash costs to the cost of sales excluding depletion, depreciation and amortization for the year:
| | Gold Ounces or | | | | | | | |
| | Pounds of | | Co-product | | | | | |
| | Copper | | Cash Cost | | Years ended December 31, | |
(in thousands of United States Dollars; unless otherwise noted) | | Produced | | per Unit | | 2011 | | 2010 | |
Chapada — Gold | | 135,347 | oz | | $ | 319 | | $ | 43,218 | | $ | 44,356 | |
Chapada — Copper | | 166,098,966 | lbs | | 1.29 | | 215,010 | | 175,194 | |
El Peñón (GEO) (i) | | 475,586 | oz | | 400 | | 190,072 | | 183,201 | |
Jacobina | | 121,675 | oz | | 643 | | 78,270 | | 65,367 | |
Gualcamayo | | 158,847 | oz | | 441 | | 70,030 | | 68,368 | |
Minera Florida (GEO) (i) | | 102,738 | oz | | 591 | | 60,711 | | 43,950 | |
Fazenda Brasileiro | | 55,163 | oz | | 937 | | 51,682 | | 44,042 | |
Co-product cash cost of sales (ii) | | | | | | | $ | 708,993 | | $ | 624,478 | |
(Deduct) Add: | | | | | | | | | | |
- Inventory and other non-cash adjustments | | | | | | | 7,057 | | 11,781 | |
- Chapada concentrate treatment and refining charges | | | | | | | (31,122 | ) | (31,707 | ) |
- Other commercial costs | | | | | | | 21,778 | | 12,204 | |
- Overseas freight for Chapada concentrate | | | | | | | 9,986 | | 14,307 | |
Cost of sales excluding depletion, depreciation and amortization | | | | | | | $ | 716,692 | | $ | 631,063 | |
| | | | | | | | | | | | | |
(i) Silver ounces reported are gold equivalent ounces for El Peñón and Minera Florida.
13
(ii) A cautionary note regarding non-GAAP measures is included in Section 15 of this Management’s Discussion and Analysis of Operations and Financial Condition.
Depletion, depreciation and amortization and (“DDA”) expense for the quarter was $356.8 million, an increase from $301.9 million in 2010. DDA is highly impacted by fixed asset acquisitions supporting expansionary projects and by the relative portion of fixed assets depreciating on a time basis versus a unit of production basis.
Other expenses for the year were $228.1 increasing from $219.6 in 2010 mainly due to higher general and administrative expenses and other operating expenses from the impact of the Company’s growing operations partially being offset by lower exploration costs and net finance expense. Net finance expense of $34.2 million decreased compared with net finance expense of $48.0 million in 2010 mainly due to lower financing costs and lower interest expense from continued repayment of long-term debt offset by foreign exchange losses. The Company has also capitalized higher interest expense in the current year compared with 2010 as construction and development projects ramped up.
Equity earnings from associate of $39.0 million for the year decreased compared with $49.3 million in 2010 due to lower earnings attributable to the Company from its 12.5% interest in Minera Alumbrera Limited mainly due to lower sales, higher operating costs from lower gold and copper grades and an unfavourable concentrate pricing adjustments recorded in the fourth quarter resulting from the downward trend of the copper price from the third quarter of the year.
Income tax expense for the year was $269.9 increasing from $128.3 in 2010 mainly due to higher net earnings for the year and the impact of foreign exchange on non-monetary assets in Brazil and Argentina.
14
5.2 OVERVIEW OF ANNUAL OPERATING RESULTS
In 2011, production of gold equivalent ounces (“GEO”) totaled 1,102,296 GEO compared with 1,047,191 GEO in 2010, representing a year-to-year increase of 5% including the commissioning GEO from Mercedes.
Copper production of 166.1 million pounds from the Chapada Mine for the year increased by 11% over production of 149.4 million pounds in 2010. Tonnage of copper concentrate production at Chapada also increased by 13% over the prior year. Additionally, 32.2 million pounds of copper produced from Alumbrera were attributable to the Company in 2011, compared to 38.7 million pounds in 2010.

By-product cash costs (a non-GAAP measure, see Section 15) of continuing operations on commercial production of 1,093,858 GEO were $50 per GEO comparable with $50 per GEO in 2010 (2009: $123 per GEO). By-product cash costs per GEO were consistent to last year reflecting continuing effective cost constraint and consistent by-product credits on higher sale volume of copper.
Average co-product cash costs (a non-GAAP measure, see Section 15) of continuing operations on commercial production of 1,093,858 GEO for the year were $463 per GEO. This compares to co-product cash costs of continuing operations of $442 per GEO for the year ended December 31, 2010 (2009: $357 per GEO).
Co-product cash costs per pound of copper (a non-GAAP measure, see Section 15) were $1.29 for the year from Chapada, compared with $1.17 for the year ended December 31, 2010 (2009: $0.99 per pound). Co-product cash costs for the year, including the Company’s interest in the Alumbrera Mine, were $1.38 per pound, compared with $1.20 for 2010 (2009: $1.10 per pound).
The Company’s proven and probable mineral reserves were 18.6 million GEO (contained gold — 17.0 million ounces; contained silver 82.9 million ounces) as at December 31, 2011, which represents an 11% increase over the comparative year. Most of the Company’s mines showed an increase in mineral reserves after depletion of mined GEO with most notable increases at Mercedes, El Peñón, Jacobina, Chapada, Minera Florida, Fazenda Brasileiro, C1 Santa Luz, Ernesto/Pau-a-Pique and Jeronimo. Measured and Indicated mineral resources modestly decreased by 3% to 13.6 million GEO from 2010 mainly due to conversion to mineral reserves. Total inferred mineral resources increased to 10.3 million GEO, which represents an increase of 39% over 2010 as a result of new discoveries at Chapada, Gualcamayo, Fazenda Brasileiro, C1 Santa Luz and significant extensions to known deposits at Pilar, El Peñón and Mercedes. Refer to Section 9 — “Mineral Reserve and Mineral Resource Estimates” for a detailed discussion on the Company’s mineral reserve and mineral resource estimates and metal price assumptions. Complete information relating to mineral reserves and mineral resources is also contained in a mineral reserve and mineral resource table which indicates complete information on tonnage and grade. This mineral reserve and mineral resource table accompanies the 2011 annual report and is also available on the Company’s website, www.yamana.com.
15
6. OVERVIEW OF QUARTERLY RESULTS
6.1 OVERVIEW OF QUARTERLY FINANCIAL RESULTS
| | Three months ended December 31, | |
(in thousands of United States Dollars; unless otherwise noted) | | 2011 | | 2010 | |
Revenues (i) | | $ | 568,754 | | $ | 535,130 | |
Cost of sales excluding depletion, depreciation and amortization | | (178,384 | ) | (178,341 | ) |
Gross margin | | 390,370 | | 356,789 | |
Depletion, depreciation and amortization | | (93,611 | ) | (83,657 | ) |
Mine operating earnings | | 296,759 | | 273,132 | |
Other expenses (iii) | | (52,264 | ) | (67,037 | ) |
Equity earnings from associate | | 1,269 | | 19,124 | |
Impairment of investment in available-for-sale securities | | (92,600 | ) | — | |
Earnings from operations before income taxes | | 153,164 | | 225,219 | |
Income tax expense | | (63,565 | ) | (99,650 | ) |
Net earnings | | $ | 89,599 | | $ | 125,569 | |
Earnings adjustments (ii): | | | | | |
Non-cash unrealized foreign exchange losses | | 1,694 | | 37,274 | |
Non-cash unrealized (gains) losses on derivatives | | (449 | ) | 506 | |
Share-based payments | | 6,656 | | 2,810 | |
Deferred income tax expense on translation of intercompany debt | | 26 | | 1,751 | |
Impairment of investment in available-for-sale securities | | 92,600 | | — | |
Other non-recurring losses (gains) | | 7,140 | | 4,044 | |
Adjusted earnings before income tax effect | | 197,266 | | 171,954 | |
Income tax effect of adjustments | | (13,024 | ) | (975 | ) |
Adjusted earnings (ii) | | $ | 184,242 | | $ | 170,979 | |
Earnings per share - basic and diluted | | $ | 0.12 | | $ | 0.17 | |
Adjusted earnings per share (ii) - basic and diluted | | $ | 0.25 | | $ | 0.23 | |
(i) Revenues consist of sales net of sales taxes.
(ii) A cautionary note regarding non-GAAP measures and their respective reconciliations are included in Section 15 including a discussion and definition of Adjusted Earnings and Adjusted Earnings per Share.
(iii) Other expenses include general and administrative, exploration, other operating expenses and net finance expense.
Higher demand for precious metals continued during the quarter with double-digit price gains relative to the comparative quarter as the average price of gold and silver increased by 23% and 20%, respectively. Average copper prices were $3.41 per pound which is 13% lower compared to the same quarter of 2010.
Adjusted earnings were $184.2 million or $0.25 per share in the fourth quarter of 2011 compared with $171.0 million or $0.23 per share in the same quarter of 2010 representing an increase of 8%. Higher adjusted earnings were mainly due to record-high mine operating earnings as a result of more favourable gold and silver realized prices as well as higher concentrate sales volume, partly offset by lower equity earnings from associate.
Net earnings for the quarter were $89.6 million or $0.12 per share on a basic and diluted basis compared with net earnings of $125.6 million or basic and diluted earnings per share of $0.17 for the fourth quarter of 2010. Despite contribution from record-high mine operating earnings, net earnings were lower as a result of an after-tax $81.0 million unrealized non-cash impairment loss on investments in available-for-sale securities recorded in the quarter. The accumulated loss was previously recorded in other comprehensive income (“OCI”) and has been reclassified to the Consolidated Statement of Operations for the quarter. This loss is unrealized and non-recurring, and does not impact or relate to the Company’s ability to generate operating cash flows or profit from its operations. As such, the unrealized loss has been excluded from the calculation of adjusted earnings and adjusted earnings per share. The Company will recognize a gain on any value of these investments above the level at which they have been written down upon disposition.
16
Revenues of $568.8 million in the fourth quarter were 6% higher compared with $535.1 million in the same quarter of 2010 mainly due to higher realized prices for gold and silver and increased sales of copper pounds. Higher revenues also contributed to record mine operating earnings of $296.8 million in the quarter, compared with $273.1 million in the fourth quarter of 2010.
Revenues for the quarter are comprised of the following:
| | | | | | Realized | | Three months ended December 31, | |
(in thousands of United States Dollars; unless otherwise noted) | | Quantity Sold | | Price | | 2011 | | 2010 | |
Gold (i) | | 218,831 | | oz | | $ | 1,670 | | $ | 365,374 | | $ | 304,713 | |
Silver | | 2,197,580 | | oz | | $ | 31.29 | | 68,756 | | 67,603 | |
Total Precious Metals | | 262,782 | | GEO | | | | 434,130 | | 372,316 | |
Copper (i) | | 43,635,304 | | lbs | | $ | 3.36 | | 146,817 | | 150,964 | |
Gross Revenues | | | | | | | | $ | 580,947 | | $ | 523,280 | |
Add (deduct): | | | | | | | | | | | |
- Treatment and refining charges of gold and copper concentrate | | | | | | | | $ | (8,776 | ) | $ | (9,495 | ) |
- Sales taxes | | | | | | | | (9,327 | ) | (7,196 | ) |
- Metal price adjustments related to concentrate revenues | | | | | | | | 4,702 | | 27,033 | |
- Other adjustments | | | | | | | | 1,208 | | 1,508 | |
Revenues | | | | | | | | $ | 568,754 | | $ | 535,130 | |
(i) Includes payable copper and gold contained in concentrate.
Cost of sales excluding depletion, depreciation and amortization for the quarter was $178.4 million compared with $178.3 million in the fourth quarter of 2010. The following table provides a reconciliation of the co-product cash costs to the cost of sales excluding depletion, depreciation and amortization for the quarter:
| | Gold Ounces or
Pounds of
Copper | | Co-product
Cash Cost | | Three months ended December 31, | |
(in thousands of United States Dollars; unless otherwise noted) | | Produced | | per unit | | 2011 | | 2010 | |
Chapada — Gold | | 34,313 | | oz | | $ | 320 | | $ | 10,990 | | $ | 11,922 | |
Chapada — Copper | | 45,457,664 | | lbs | | 1.20 | | 54,732 | | 47,793 | |
El Peñón (GEO) (i) | | 115,043 | | oz | | 413 | | 47,499 | | 47,959 | |
Jacobina | | 31,983 | | oz | | 646 | | 20,652 | | 16,693 | |
Gualcamayo | | 40,676 | | oz | | 424 | | 17,227 | | 23,982 | |
Minera Florida (GEO) (i) | | 23,151 | | oz | | 706 | | 16,345 | | 15,355 | |
Fazenda Brasileiro | | 15,568 | | oz | | 915 | | 14,239 | | 14,003 | |
Co-product cash cost of sales (ii) | | | | | | | | $ | 181,684 | | $ | 177,707 | |
Add (deduct): | | | | | | | | | | | |
- Inventory and other non-cash adjustments | | | | | | | | (2,506 | ) | 2,659 | |
- Chapada concentrate treatment and refining charges | | | | | | | | (8,776 | ) | (9,495 | ) |
- Other commercial costs | | | | | | | | 7,244 | | 3,413 | |
- Overseas freight for Chapada concentrate | | | | | | | | 738 | | 4,057 | |
Cost of sales excluding depletion, depreciation and amortization | | | | | | | | $ | 178,384 | | $ | 178,341 | |
| | | | | | | | | | | | | | |
(i) Silver ounces reported are gold equivalent ounces for El Peñón and Minera Florida.
(ii) A cautionary note regarding non-GAAP measures is included in Section 15 of this Management’s Discussion and Analysis of Operations and Financial Condition.
Depletion, depreciation and amortization and (“DDA”) expense for the quarter was $93.6 million, an increase from $83.7 million in the fourth quarter of 2010. DDA per quarter is highly impacted by fixed asset acquisitions.
Other expenses for the year were $52.3 decreasing from $67.0 in 2010 mainly due to lower exploration expenses, lower other operating expenses as a result of reduction in provisions and lower net finance expense partially offset by higher general and administrative expenses. Net finance expense of $2.1 million decreased compared with net finance expense of $13.3 million in 2010 from higher capitalized interest and lower realized losses on derivatives.
17
Equity earnings from associates were $1.3 million for the quarter compared with $19.1 million in the fourth quarter of 2010. This was due to lower earnings attributable to the Company from its 12.5% interest in Minera Alumbrera Limited as a result of lower sales and higher operating costs relative to the comparative quarter of 2010.
Income tax expense for the quarter was $63.6 million decreasing from $99.7 million in 2010 mainly due to a smaller foreign exchange loss in comparison to the fourth quarter of 2010 and a reversal of a tax contingency during the quarter with no comparable prior period balance.
6.2 OVERVIEW OF QUARTERLY OPERATING RESULTS
Total production from operations was 276,918 GEO for the quarter, including the commissioning production from Mercedes and the Company’s proportionate interest in production from the Alumbrera Mine, compared with production of 286,683 GEO for the comparative quarter ended December 31, 2010.
Copper production for the quarter ended December 31, 2011 was 45.4 million pounds from the Chapada Mine, compared with 39.9 million pounds for the fourth quarter 2010. Additionally, 6.2 million pounds of copper were produced from Alumbrera attributable to the Company, compared with 9.3 million pounds for the quarter ended December 31, 2010. Total copper production for the fourth quarter was 51.6 million pounds.
By-product cash costs (a non-GAAP measure, see Section 15) were positive $174 per GEO on commercial production of 268,480 GEO, compared with negative $34 per GEO in the fourth quarter of 2010. Co-product cash costs (a non-GAAP measure, see Section 15) from continuing operations were $486 per GEO on commercial production of 268,480 GEO for the quarter compared with $465 per GEO for the fourth quarter of 2010.
Co-product cash costs per pound of copper (a non-GAAP measure, see Section 15) were $1.20 for the quarter from the Chapada Mine, unchanged from the fourth quarter in 2010. Co-product cash costs per pound of copper for the quarter including the Company’s interest in the Alumbrera Mine were $1.37 per pound versus $1.23 per pound for the quarter ended December 31, 2010.
18
7. OPERATING MINES
CHAPADA MINE
| | Three months ended | | Years ended | |
| | December 31, | | December 31, | | December 31, | | December 31, | | December 31, | |
Operating Statistics | | 2011 | | 2010 | | 2011 | | 2010 | | 2009 | |
Production | | | | | | | | | | | |
Concentrate (tonnes) | | 81,396 | | 69,869 | | 297,294 | | 264,195 | | 248,940 | |
Gold contained in concentrate production (ounces) | | 34,313 | | 36,965 | | 135,347 | | 135,613 | | 156,251 | |
Copper contained in concentrate (millions of pounds) | | 45.4 | | 39.9 | | 166.1 | | 149.4 | | 144.0 | |
By-product cash costs per oz of gold produced (i) | | $ | (1,715 | ) | $ | (2,863 | ) | $ | (2,454 | ) | $ | (2,073 | ) | $ | (848 | ) |
Co-product cash costs per oz of gold produced (i) | | $ | 320 | | $ | 323 | | $ | 319 | | $ | 327 | | $ | 258 | |
Co-product cash costs per lb of copper produced (i) | | $ | 1.20 | | $ | 1.20 | | $ | 1.29 | | $ | 1.17 | | $ | 0.99 | |
Ore mined (tonnes) | | 6,210,285 | | 5,228,059 | | 22,084,779 | | 21,482,527 | | 16,998,887 | |
Ore processed (tonnes) | | 5,559,778 | | 4,757,679 | | 20,581,385 | | 19,195,578 | | 17,307,429 | |
Gold ore grade (g/t) | | 0.32 | | 0.37 | | 0.32 | | 0.35 | | 0.41 | |
Copper ore grade (%) | | 0.43 | | 0.44 | | 0.42 | | 0.41 | | 0.43 | |
Concentrate grade - gold (g/t) | | 13.11 | | 16.46 | | 14.16 | | 15.97 | | 19.63 | |
Concentrate grade - copper (%) | | 25.33 | | 25.92 | | 25.34 | | 25.65 | | 26.24 | |
Gold recovery rate (%) | | 60.5 | | 64.9 | | 63.8 | | 62.3 | | 69.0 | |
Copper recovery rate (%) | | 86.7 | | 86.2 | | 87.4 | | 86.5 | | 88.0 | |
Sales (ii) | | | | | | | | | | | |
Concentrate (tonnes) | | 81,436 | | 74,009 | | 293,092 | | 264,825 | | 261,841 | |
Payable gold contained in concentrate (ounces) | | 33,146 | | 31,421 | | 129,419 | | 127,450 | | 143,939 | |
Payable copper contained in concentrate (millions of pounds) | | 43.6 | | 39.6 | | 153.6 | | 143.8 | | 137.4 | |
Depletion, depreciation and amortization per gold ounce sold | | $ | 68 | | $ | 75 | | $ | 63 | | $ | 67 | | $ | 54 | |
Depletion, depreciation and amortization per copper pound sold | | $ | 0.21 | | $ | 0.18 | | $ | 0.21 | | $ | 0.18 | | $ | 0.13 | |
(i) A cautionary note regarding non-GAAP measures is included in Section 15 of this Management’s Discussion and Analysis.
(ii) Quantities sold include quantity adjustment on provisional and final invoice settlements.
Chapada produced a total of 135,347 ounces of gold contained in concentrate in 2011 compared with 135,613 ounces of gold in concentrate in 2010. Chapada copper production of 166.1 million pounds in the year was 11% higher than the production of 149.4 million pounds of copper contained in concentrate in 2010.
By-product cash costs for the year were negative $2,454 compared with negative $2,073 per GEO for 2010. Increased sales of copper and higher copper prices were the main contributing factors to the increase in by-product credit.
Co-product cash costs for gold were $319 per ounce in 2011 compared with $327 per ounce in 2010. Lower co-product cash costs were primarily due to higher tonnage throughput positively impacting unit costs and improved recoveries partly offset by lower grades. Co-product cash costs for copper were $1.29 per pound in 2011 versus $1.17 per pound in 2010.
Chapada produced a total of 34,313 ounces of gold contained in concentrate in the fourth quarter compared with 36,965 ounces of gold in concentrate in the fourth quarter of 2010. Chapada copper production of 45.4 million pounds in the fourth quarter was 14% higher than the production of 39.9 million pounds of copper contained in concentrate during the comparable period in 2010. Lower production of gold in the quarter compared with the fourth quarter of 2010 was mainly due to lower feed grade and recovery, partly offset by increased tonnage of ore mined and processed as a result of the plant optimization initiatives undertaken since the end of 2010. Decrease in gold grade is in line with the life of mine plan.
19
By-product cash costs for the fourth quarter were negative $1,715 per ounce, compared with negative $2,863 per GEO for the same quarter of 2010. Lower credit to by-product cash costs reflects lower copper prices partly offset by higher copper sale volume compared to prior year, resulting in higher by-product cash costs.
Co-product cash costs for the quarter were $320 per gold ounce and $1.20 per pound of copper compared to $323 per gold ounce and $1.20 per pound of copper for the same quarter of 2010. Co-product cash costs per ounce of gold and per pound of copper remain largely unchanged in spite of lower feed grade and recovery for gold, reflecting effective cost control practices by the operation.
Chapada revenues for the quarter net of sales taxes and treatment and refining costs were $196.4 million (2010 — $209.3 million). Revenues included mark-to-market adjustments and final and provisional pricing settlements in the quarter of positive $4.7 million (2010 — positive $18.8 million).
In December 2011, the Company completed the feasibility study and basic engineering on the oxides at Suruca Project. Suruca is six kilometres northeast of Chapada mine. The deposit will support an additional average production of 49,000 gold ounces per year to Chapada’s operations over an initial five years beginning in 2013.
The Company continues to evaluate the gold and copper production contribution to Chapada from Corpo Sul which is a recently discovered gold and copper mineralization at the southwest end of the orebody. A total of 30 drill holes were completed traced along a strike length of almost 7 kilometers during the fourth quarter of 2011. The mineral resource has higher average grade cores especially near the current Chapada pit which could provide opportunity for near-term higher than average mineral reserve grades.
Planned production from Chapada will decline in 2012 over 2011 levels, although will increase in terms of gold production in 2013 and in the years to follow, mostly as a result of the start-up of the oxide gold operation at Suruca and gold and copper production from Corpo Sul beginning in 2014. The Company’s strategic plan is to ensure sustainable production from Chapada of 150,000 gold ounces and 135.0 million pounds of copper from 2013 and onwards for at least five years.
Total gold mineral reserves for Chapada increased by 6% compared to 2010 with consecutive increases in mineral reserves over the last two years.
20
EL PEÑÓN
| | Three months ended | | Years ended | |
| | December 31, | | December 31, | | December 31, | | December 31, | | December 31, | |
Operating Statistics | | 2011 | | 2010 | | 2011 | | 2010 | | 2009 | |
Production | | | | | | | | | | | |
Gold equivalent (ounces) | | 115,043 | | 113,800 | | 475,586 | | 427,934 | | 394,400 | |
Gold production (ounces) | | 75,407 | | 74,785 | | 306,184 | | 256,530 | | 215,846 | |
Silver production (ounces) | | 1,981,806 | | 2,145,809 | | 8,470,112 | | 9,427,208 | | 9,820,475 | |
Cash costs per gold equivalent ounce produced (i) | | $ | 413 | | $ | 421 | | $ | 400 | | $ | 428 | | $ | 353 | |
Ore mined (tonnes) | | 326,915 | | 333,243 | | 1,307,351 | | 1,301,877 | | 1,314,759 | |
Ore processed (tonnes) | | 363,796 | | 366,424 | | 1,452,090 | | 1,522,366 | | 1,271,594 | |
Gold ore grade (g/t) | | 6.91 | | 6.94 | | 7.05 | | 5.74 | | 5.78 | |
Silver ore grade (g/t) | | 200.2 | | 229.2 | | 215.9 | | 228.5 | | 276.3 | |
Gold recovery rate (%) | | 93.1 | | 91.3 | | 93.0 | | 91.2 | | 91.2 | |
Silver recovery rate (%) | | 83.9 | | 79.5 | | 84.0 | | 84.1 | | 86.9 | |
Sales | | | | | | | | | | | |
Gold sales (ounces) | | 75,886 | | 75,219 | | 304,530 | | 258,301 | | 219,764 | |
Silver sales (ounces) | | 2,014,420 | | 2,155,113 | | 8,453,857 | | 9,535,012 | | 10,034,160 | |
| | | | | | | | | | | | | | | | |
Depletion, depreciation and amortization per gold equivalent ounce sold | | $ | 344 | | $ | 334 | | $ | 321 | | $ | 318 | | $ | 277 | |
(i) A cautionary note regarding non-GAAP measures is included in Section 15 of this Management’s Discussion and Analysis.
Annual production at El Peñón was 475,586 GEO in 2011, representing a year-over-year increase of 11% in GEO compared with production of 2010, which was the transition year to owner-mining. Since conversion to owner-mining in early 2010, operational dilution has decreased and feed grade has improved. This, combined with increased capacity, has led to increased GEO production. Production for the year of 475,586 GEO consisted of 306,184 ounces of gold and 8.5 million ounces of silver, compared with 427,934 GEO, which consisted of 256,530 ounces of gold and 9.4 million ounces of silver produced in 2010. Production of gold has increased consecutively year over year since 2009.
Cash costs were $400 per GEO compared with $428 per GEO in 2010. Improvement of operational reliability and cost management was the main contributing factor to more than offset the negative effect of a higher exchange rate for the Chilean Peso resulting in lower cash costs in 2011.
El Peñón produced 115,043 GEO during the fourth quarter of 2011. Production for the quarter consisted of 75,407 ounces of gold and 2.0 million ounces of silver, compared with 113,800 GEO, which consisted of 74,785 ounces of gold and 2.1 million ounces of silver produced in the fourth quarter of 2010, primarily due to higher recoveries.
Cash costs were $413 per GEO in the quarter ended December 31, 2011, representing a 2% improvement, compared with $421 per GEO in the fourth quarter in 2010. Favourable exchange rate of the United States Dollar versus the Chilean Peso, operational reliability and cost management improvements allowed mine management to mitigate the adverse impact of mining inflation.
El Peñón has a long track record of replacement of ounces of mineral resource expansion. During the fourth quarter of 2011, 251 drill holes were completed totaling over 66 kilometres with the majority in areas of the North Block to extend and define the Al Este, Abundancia and Esmeralda targets, the Fortuna area where infill drilling extended the deposit to depth and at Pampa Augusta Victoria to better define the Victoria vein to depth and parallel structures to the east. Infill drilling upgraded the previously defined mineral resources to mineral reserves and identified higher grade areas. Total mineral reserves on a GEO basis for El Peñón increased by 20% compared to 2010 with consecutive increases in mineral reserves on a GEO basis over the last two years.
Continuous exploration effort on high grade at El Peñón is expected to return significant near surface gold and silver values, improve production, provide mining flexibility for a sustainable production level of at least 440,000 GEO per year and ultimately increase mine life.
21
GUALCAMAYO
| | Three months ended | | Years Ended | |
| | December 31, | | December 31, | | December 31, | | December 31, | | December 31, | |
Operating Statistics | | 2011 | | 2010 | | 2011 | | 2010 | | 2009 | |
Production | | | | | | | | | | | |
Total Gold production (ounces) | | 40,676 | | 36,239 | | 158,847 | | 135,140 | | 143,471 | |
Commercial Gold production (ounces) | | 40,676 | | 36,239 | | 158,847 | | 135,140 | | 98,641 | |
Commissioning gold production (ounces) | | — | | — | | — | | — | | 44,830 | |
Cash costs per ounce produced (i) | | $ | 424 | | $ | 662 | | $ | 441 | | $ | 506 | | $ | 301 | |
Ore mined (tonnes) | | 1,883,622 | | 2,283,577 | | 7,580,950 | | 8,845,992 | | 3,294,175 | |
Ore processed (tonnes) | | 1,955,094 | | 1,818,571 | | 7,578,156 | | 7,528,690 | | 3,370,057 | |
Gold Grade (g/t) | | 0.99 | | 0.89 | | 0.97 | | 0.82 | | 1.19 | |
Gold Recovery rate (%) | | 65.4 | | 69.5 | | 68.4 | | 67.8 | | 76.6 | |
Sales | | | | | | | | | | | |
Gold sales (ounces) | | 40,908 | | 36,649 | | 160,326 | | 141,734 | | 88,555 | |
| | | | | | | | | | | | | | | | |
Depletion, depreciation and amortization per gold ounce sold | | $ | 389 | | $ | 314 | | $ | 370 | | $ | 277 | | $ | 228 | |
(i) A cautionary note regarding non-GAAP measures is included in Section 15 of this Management’s Discussion and Analysis.
Gualcamayo produced 158,847 ounces of gold in 2011 compared with 135,140 ounces produced in 2010, representing an 18% year-over-year increase. Production increased primarily as a result of mining higher grade benches.
Cash costs for the year were $441 compared with $506 per ounce in 2010.
Gold production of 40,676 ounces in the fourth quarter compared with 36,239 ounces produced in the fourth quarter of 2010, represents a 12% quarter-over-quarter improvement. Production increased mainly due to higher grade and higher tonnage processed partly offset by lower recovery. Management continues to work on recovery improvement.
Cash costs were $424 per ounce in the quarter ended December 31, 2011, representing a 36% improvement, compared with $662 per ounce in the fourth quarter of 2010, which was adversely affected by the necessary stoppage of conveyor belts and the plant for the expansion of capacity; as a result, ore was transported by truck while the conveyor belts were down and that contributed to higher cash costs in the fourth quarter of 2010.
Development of QDD Lower West advanced to 33% of the overall physical progress, with tunnel advance and equipment and material procurement Project completion remains on schedule. Brownfield exploration for the fourth quarter of 2011 was focused on increasing mineral resources in the QDD Lower area, which will continue to be the main target in the first half of 2012. Exploration efforts during 2011 at Gualcamayo began late in the year due to limited access to the orebody during the first half of the year. Gualcamayo is expected to contribute more meaningfully to Company mineral reserve and mineral resource growth going forward.
Full ramp-up of Gualcamayo’s expansions to be completed by mid-2013 are expected to increase sustainable production to over 200,000 gold ounces per year beginning in 2014.
22
JACOBINA
| | Three months ended | | Years ended | |
| | December 31, | | December 31, | | December 31, | | December 31, | | December 31, | |
Operating Statistics | | 2011 | | 2010 | | 2011 | | 2010 | | 2009 | |
Production | | | | | | | | | | | |
Gold production (ounces) | | 31,983 | | 33,718 | | 121,675 | | 122,160 | | 110,515 | |
Cash costs per ounce produced (i) | | $ | 646 | | $ | 495 | | $ | 643 | | $ | 535 | | $ | 476 | |
Ore mined (tonnes) | | 529,452 | | 542,055 | | 2,148,473 | | 2,158,097 | | 2,004,936 | |
Ore processed (tonnes) | | 527,537 | | 542,055 | | 2,148,275 | | 2,158,096 | | 1,996,989 | |
Gold Grade (g/t) | | 2.03 | | 2.06 | | 1.89 | | 1.89 | | 1.88 | |
Gold Recovery rate (%) | | 93.4 | | 94.1 | | 93.3 | | 93.2 | | 91.7 | |
Sales | | | | | | | | | | | |
Gold sales (ounces) | | 32,904 | | 33,530 | | 123,323 | | 121,405 | | 111,906 | |
| | | | | | | | | | | | | | | | |
Depletion, depreciation and amortization per gold ounce sold | | $ | 394 | | $ | 343 | | $ | 390 | | $ | 338 | | $ | 316 | |
(i) A cautionary note regarding non-GAAP measures is included in Section 15 of this Management’s Discussion and Analysis.
Jacobina produced 121,675 ounces of gold in 2011, compared with production of 122,160 ounces of gold in 2010. The decrease in production was mainly due to lower tonnage of ore processed.
Cash costs were $643 per ounce in 2011 compared with $535 per ounce in 2010.
Gold production at Jacobina was 31,983 ounces in the fourth quarter, compared with 33,718 ounces in the fourth quarter of 2010. The decrease in production was primarily a result of lower tonnage of ore processed and lower feed grade and recovery. Increased mine gallery reinforcement work also negatively affected production.
Cash costs were $646 per ounce of gold for the fourth quarter compared with $495 per ounce of gold in the fourth quarter of 2010 mainly due to mining inflation pressure, increase in hauling distance and increased secondary development. Additionally, more effort was undertaken on mine development during the quarter resulting in lower production and higher cash costs in the short term. Costs are expected to decrease in 2012.
The Company continues to focus on upgrading the current mineral resources to mineral reserves at Canavieiras and Morro do Vento and improving overall mineral reserve grade for the mine. Additional drilling during the fourth quarter was completed to upgrade inferred mineral resources to measured and indicated mineral reserves at both Canavieiras and Morro Do Vento. Successful infill drilling at Canavieiras and Morro do Vento resulted in measured and indicated mineral resource increases of approximately 392,000 ounces of gold in 2.2 million tonnes at 3.83 g/t and 81,000 gold ounces in 814,584 tonnes at 3.09 g/t, respectively representing potential additional mine life of more than three years. The gold grade at Canavieiras averaged approximately 3.83 g/t which improved the average grade of global mineral resources and mineral reserves. Mining of higher grade areas could increase average annual production at Jacobina to 140,000 gold ounces beginning in 2014. Production increases from higher grade and new gold ounces from new areas will utilize the existing processing capacity and hence should result in significant cash cost per ounce improvements.
Total gold mineral reserves for Jacobina increased by 20% compared to 2010 with consecutive increases in mineral reserves since acquisition of 69%. Measured and Indicated gold mineral resources have also increased since 2010 by 44%.
23
MINERA FLORIDA
| | Three months ended | | Years ended | |
| | December 31, | | December 31, | | December 31, | | December 31, | | December 31, | |
Operating Statistics | | 2011 | | 2010 | | 2011 | | 2010 | | 2009 | |
Production | | | | | | | | | | | |
Gold equivalent (ounces) | | 23,151 | | 32,048 | | 102,738 | | 105,604 | | 91,877 | |
Gold production (ounces) | | 18,326 | | 27,787 | | 86,914 | | 94,585 | | 80,019 | |
Silver production (ounces) | | 241,208 | | 234,339 | | 791,173 | | 606,071 | | 652,192 | |
Cash costs per gold equivalent ounce produced (i) | | $ | 706 | | $ | 479 | | $ | 591 | | $ | 416 | | $ | 373 | |
Ore mined (tonnes) | | 191,206 | | 200,106 | | 848,373 | | 761,386 | | 718,603 | |
Ore processed (tonnes) | | 207,147 | | 214,859 | | 920,388 | | 779,836 | | 723,061 | |
Gold grade (g/t) | | 3.37 | | 4.68 | | 3.50 | | 4.41 | | 4.21 | |
Silver ore grade (g/t) | | 50.3 | | 45.1 | | 38.4 | | 33.4 | | 40.9 | |
Gold recovery rate (%) | | 83.5 | | 84.7 | | 84.0 | | 83.7 | | 82.3 | |
Silver recovery rate (%) | | 68.9 | | 70.6 | | 68.3 | | 67.8 | | 68.9 | |
Sales | | | | | | | | | | | |
Gold sales (ounces) | | 19,556 | | 26,116 | | 87,816 | | 91,907 | | 75,396 | |
Silver sales (ounces) | | 183,160 | | 242,468 | | 687,445 | | 600,156 | | 461,567 | |
| | | | | | | | | | | | | | | | |
Depletion, depreciation and amortization per gold equivalent ounce sold | | $ | 447 | | $ | 332 | | $ | 430 | | $ | 365 | | $ | 344 | |
(i) A cautionary note regarding non-GAAP measures is included in Section 13 of this Management’s Discussion and Analysis.
Annual production at Minera Florida totaled 102,738 GEO in 2011 compared with 105,604 GEO in 2010. Tonnes of ore processed increased by 18% in 2011 from 2010 levels. The combined impact of higher tonnage and higher silver feed grade resulted in an increase in silver production of 31%. Gold production decreased year over year as a result of lower gold feed grade.
Cash costs were $591 per GEO in 2011 compared with $416 per GEO in 2010.
Production of zinc, which is accounted for as a by-product, was 6,958 tonnes in 2011 versus 6,289 tonnes in 2010.
Minera Florida produced a total of 23,151 GEO in the quarter, representing a decrease of 28%, compared with 32,048 GEO in the fourth quarter of 2010, mainly as a result of a strike-related work stoppage at the mine. Operations returned to normal by year-end and a two-year collective bargaining agreement was signed.
Gold grade for the quarter was 3.37 g/t which was lower than the 4.68 g/t for the fourth quarter of 2010. In 2012 and years to follow, mine grade is expected to be consistent with mineral reserve grade and process efficiency will be augmented by low-cost historical tailings material. In 2012 production is expected to be in excess of 135,000 GEO with the start of production from the tailings re-treatment project.
In addition, the mine produced 1,586 tonnes of zinc in the three-month period ended December 31, 2011 compared with 1,519 tonnes of zinc produced in the fourth quarter of 2010. Zinc is accounted for as a by-product credit to cash costs.
Cash costs for the fourth quarter were $706 per GEO compared with $479 per GEO in the same quarter in 2010 primarily as a result of the work stoppage and to a lesser extent, mining inflation, higher energy costs and lower gold feed grades. In 2012, cash costs are expected to return to historical levels.
The Company’s expansion project at Minera Florida is designed to increase annual production by approximately 40,000 GEO per year for five years through the re-treatment of tailings. The construction of the project continues to advance and is expected to be completed in March with first production expected in April. Overall costs are expected to improve with the addition of tailings production given the lack of mining costs associated with the tailings products.
Near-mine exploration at Minera Florida focused on the Portezuelo, El Roble and Tribuna sectors to delineate the extension of the orebodies. Total GEO mineral reserves for Minera Florida increased by 28% compared to 2010 with
24
consecutive increases in mineral reserves over the last 2 years. Mine development has advanced as planned in areas such as Tribuna, Maqui Clavo I, which is expected to maintain and ensure future production levels.
25
MERCEDES
The Mercedes mine, located in Sonora, Mexico, is Yamana’s newest mine and represents the first of four new mines to begin production during 2012 and 2013.
With mine development and plant commissioning well advanced and a sufficient stockpile having been created during the mine development period, a first gold pour occurred in mid-November 2011, marking the formal start-up of commissioning production at the mine, which was originally planned for the middle of 2012.
Commissioning period production was 8,438 gold equivalent ounces (“GEO”) since the first gold pour in the fourth quarter. Mining is at a rate consistent with the original plan and the plant is ramping up to the rate of 1,500 tonnes per day as contemplated in the feasibility study. At the end of the quarter, approximately 100,000 tonnes of ore were stockpiled, inventories in circuit and in process were approximately 2,900 GEO. Commissioning activities continue to advance as planned; production for the month of January 2012 was 8,959 GEO, representing the second consecutive monthly production in excess of 8,000 GEO. Subsequent to the year end, Mercedes reached commercial production as of February 1, 2012 upon achieving sustainable levels of operations based on qualitative and quantitative factors. In its assessment, management reviewed achievement of milestones at a sustainable level including but not limited to a significant portion of planned capacity, production levels, grades and recovery rates, achievement of mechanical completion and operating effectiveness, obtaining necessary permits and production inputs and positive and sustainable cash flows.
Production is initially planned at 120,000 GEO per year although the Company is evaluating the potential to increase throughput to 1,800 tonnes per day through modest plant modifications and optimizations. With increased plant capacity along with the additional ore from Barrancas, and as accelerated underground development work advances during 2012, the Company expects production to increase to over 130,000 GEO in 2013.
To date, there have been over 11,000 metres of underground development completed, including the start of development of the Barrancas zone with the higher grade Lagunas Norte vein, one of the newest discoveries at the mine. Development of the vein structure in the Barrancas zone was not included in the original mine plan and represents a significant opportunity to increase production.
A total of 24 holes covering over 5 kilometres were completed in the fourth quarter of 2011. Drilling was focused on the area between the Diluvio and Lupita deposits and as infill on the outcropping Rey de Oro deposit located to the east of Diluvio. The Rey de Oro zone has now been delineated along a strike length of 350 metres, a dip length of 130 metres (starting at the surface) and a width of between 20 to 70 metres.
The updated mineral reserve and mineral resource estimates for Mercedes of 1.0 million GEO of proven and probable mineral reserves and 204,000 GEO of measured and indicated mineral resources in 1.9 million tonnes at 3.36 g/t and inferred mineral resources of 561,000 GEO in 7.3 million tonnes at 2.38 g/t, include the new ounces from the additional vein structure in the Barrancas zone, and the more recently discovered Diluvio zone of the Lupita vein structure.
26
OTHER MINES
The following table presents key operating data for the other continuing mining operations and investment in associate:
| | Three months ended | | Years ended | |
| | December 31, | | December 31, | | December 31, | | December 31, | | December 31, | |
| | 2011 | | 2010 | | 2011 | | 2010 | | 2009 | |
FAZENDA BRASILEIRO | | | | | | | | | | | |
Production | | | | | | | | | | | |
Gold production (ounces) | | 15,568 | | 19,852 | | 55,163 | | 70,084 | | 76,413 | |
Cash costs per ounce produced (i) | | $ | 915 | | $ | 705 | | $ | 937 | | $ | 628 | | $ | 453 | |
Ore mined (tonnes) | | 265,108 | | 259,832 | | 983,848 | | 1,105,340 | | 1,155,247 | |
Ore processed (tonnes) | | 234,767 | | 275,184 | | 936,459 | | 1,110,204 | | 1,179,595 | |
Gold Grade (g/t) | | 2.33 | | 2.53 | | 2.07 | | 2.22 | | 2.21 | |
Gold recovery rate (%) | | 88.1 | | 89.4 | | 88.4 | | 88.6 | | 91.0 | |
Sales | | | | | | | | | | | |
Gold sales (ounces) | | 16,430 | | 18,822 | | 56,907 | | 72,316 | | 77,458 | |
| | | | | | | | | | | |
Depletion, depreciation and amortization per gold ounce sold | | $ | 189 | | $ | 145 | | $ | 231 | | $ | 167 | | $ | 155 | |
| | | | | | | | | | | |
ALUMBRERA (12.5% interest) | | | | | | | | | | | |
Production | | | | | | | | | | | |
Concentrate (tonnes) | | 10,691 | | 16,422 | | 55,840 | | 68,351 | | 68,868 | |
Gold production (ounces) | | 634 | | 1,312 | | 3,516 | | 5,617 | | 6,954 | |
Gold production in concentrate (ounces) | | 7,112 | | 12,749 | | 40,986 | | 45,039 | | 45,796 | |
Total gold produced | | 7,746 | | 14,061 | | 44,502 | | 50,656 | | 52,750 | |
Copper contained in concentrate (millions of pounds) | | 6.2 | | 9.3 | | 32.2 | | 38.7 | | 39.4 | |
By-product cash costs per ounce produced (i) | | $ | (1,351 | ) | $ | (1,556 | ) | $ | (1,448 | ) | $ | (1,404 | ) | $ | (703 | ) |
Co-product cash costs per ounce of gold produced (i) | | $ | 450 | | $ | 244 | | $ | 283 | | $ | 257 | | $ | 372 | |
Co-product cash costs per pound of copper produced (i) | | $ | 2.59 | | $ | 1.37 | | $ | 1.82 | | $ | 1.29 | | $ | 1.49 | |
Ore mined (tonnes) | | 1,007,916 | | 646,736 | | 2,778,430 | | 3,127,873 | | 3,662,997 | |
Ore processed (tonnes) | | 1,176,148 | | 1,160,601 | | 4,775,130 | | 4,509,332 | | 4,691,705 | |
Gold ore grade (g/t) | | 0.30 | | 0.50 | | 0.42 | | 0.46 | | 0.49 | |
Copper ore grade (%) | | 0.30 | | 0.40 | | 0.40 | | 0.50 | | 0.46 | |
Concentrate grade - gold (g/t) | | 20.65 | | 24.18 | | 22.78 | | 20.66 | | 20.88 | |
Concentrate grade - copper (%) | | 26.25 | | 25.60 | | 26.11 | | 25.60 | | 25.90 | |
Gold recovery rate (%) | | 68.3 | | 76.0 | | 69.4 | | 73.0 | | 70.4 | |
Copper recovery rate (%) | | 78.9 | | 81.0 | | 77.2 | | 82.0 | | 82.7 | |
Sales | | | | | | | | | | | |
Concentrate (tonnes) | | 13,762 | | 16,971 | | 56,913 | | 68,056 | | 59,949 | |
Gold sales (ounces) | | 9,010 | | 11,805 | | 40,996 | | 43,314 | | 45,363 | |
Gold doré sales (ounces) | | 699 | | 1,146 | | 3,668 | | 5,626 | | 7,255 | |
Total gold sales (ounces) | | 9,709 | | 12,951 | | 44,664 | | 48,940 | | 52,618 | |
| | | | | | | | | | | |
Payable copper contained in concentrate (millions of pounds) | | 7.7 | | 9.0 | | 31.5 | | 37.0 | | 38.2 | |
(i) A cautionary note regarding non-GAAP measures is included in Section 15 of this Management’s Discussion and Analysis.
27
FAZENDA BRASILEIRO
The Fazenda Brasileiro Mine produced 55,163 ounces of gold in 2011 compared to 70,084 ounces of gold in 2010.
Production at Fazenda Brasileiro was 15,568 ounces of gold in the quarter ended December 31, 2011. This compares to 19,852 ounces of gold in the fourth quarter of 2010. Cash costs for the fourth quarter were $915 per ounce compared with $705 per ounce for the same period in 2010. Grade for the quarter was 2.33 g/t compared to 2.53 g/t for the comparative quarter last year, representing an expected decline in grade of 8%, which impacted cash costs.
The Fazenda Brasileiro mine was acquired in 2003 with 2.5 years of mine life remaining based on known mineral reserves. The Company has since been mining at Fazenda Brasileiro for eight years. The mine continues to further outline exploration potential and mineral resource additions are expected in 2012.
The two new mineralization zones, CLX2 and Lagoa do Gato, both discovered in 2009, are identified as having significant potential for high-grade sources of ore for the mill. Both infill and extension drilling confirm the continuity of mineralization in both areas. In 2011, the Company continued to develop the high-grade mineral reserves at CLX2, improve mine fleet costs using road trucks and with a focus on increasing mineral reserves and mineral resources. The Company is evaluating the possible extension of mine life. Total gold mineral reserves for Fazenda Brasileiro increased by 104% compared to 2010.
ALUMBRERA
The Company’s interest in the Alumbrera Mine is accounted for as an equity investment. The Company recorded earnings from its 12.5% interest in Alumbrera Mine of $1.3 million and $39.0 million for the three-month and year ended December 31, 2011, compared with $19.1 million and $49.3 million reported for the respective periods of 2010. Lower earnings for the year ended December 31, 2011 was due to lower production and higher operating costs. Both production and unit costs were impacted by lower grades for gold and copper. Additionally, earnings for the quarter were impacted by unfavourable concentrate pricing adjustments resulting from the downward trend of the copper price from the third quarter to the year end. The Company received cash distributions of $44.1 million during the three-months and $71.5 million for the year ended December 31, 2011, compared with $24.1 million and $61.5 million for the comparative periods in 2010, respectively.
Attributable production from Alumbrera was 7,746 ounces of gold and 6.2 million pounds of copper for the quarter. This compares with attributable production of 14,061 ounces of gold and 9.3 million pounds of copper for the fourth quarter of 2010. Lower gold and copper production was mainly due to lower head grades from the ore mined and stockpile and lower recoveries partially offset by higher tonnage throughput.
In the first quarter of 2011, the Company announced an agreement with Xstrata Queensland Limited (“Xstrata”) and Goldcorp Inc. (“Goldcorp”) that facilitates the integration of Agua Rica, which is currently 100% owned by Yamana, into Minera Alumbrera (“MAA”).
On September 1, 2011, Xstrata, Goldcorp and the Company announced that they reached a definitive agreement providing MAA the exclusive option to acquire Yamana’s 100% interest in the Agua Rica project. Under the terms of the agreement, MAA holds an exclusive four-year option to acquire Yamana’s interest in the Agua Rica project for cumulative payments by Xstrata and Goldcorp of $110 million, of which $30 million has been received by the Company. During the option period, MAA will manage the Agua Rica project and fund a feasibility study and all development costs. MAA can elect to exercise the option at any time during the four-year period. Upon approval to proceed, Yamana would receive $150 million and a further $50 million on commencement of commercial production. The Company would also retain the right to a deferred payment related to 65% of the payable gold production from Agua Rica to a maximum of 2.3 million ounces.
The respective ownership interests in MAA, i.e. Xstrata (50%), Goldcorp (37.5%) and Yamana (12.5%), would remain unchanged and include the Agua Rica project. The integration of Agua Rica with Alumbrera provides the greatest value potential for the Company and the best opportunity for the development of Agua Rica in the Catamarca province of Argentina.
28
8. CONSTRUCTION, DEVELOPMENT AND EXPLORATION
CONSTRUCTION AND DEVELOPMENT
All construction projects are on schedule. All permits have been received. Detailed engineering has or is currently advancing and long-lead time equipment has been ordered for the various projects. Mine development is also advancing on schedule with accelerated development of newly discovered higher grade areas at Mercedes.
The following summary highlights key updates from the construction and development projects at the Company.
BRAZIL
Ernesto/Pau-a-Pique
Construction progress is on schedule with commissioning and start-up of production expected by the end of 2012 and commercial production by mid-2013. As of December 31, 2011, physical advancement continued and was approximately 75% complete. During the fourth quarter, mine development, civil works and electromechanical works continued as expected and detailed engineering was completed. Annual production is expected to be approximately 100,000 gold ounces with average annual production during the first two full years expected to be approximately 120,000 gold ounces.
C1 Santa Luz
Construction progress is on schedule with commissioning and start-up of production expected by the end of 2012 and commercial production by mid-2013. As of December 31, 2011, physical advancement of the project was approximately 60% complete. During the fourth quarter, earthworks were completed and civil works and erection works continued as planned. Annual production is expected to be approximately 100,000 gold ounces with average annual production during the first two full years to exceed 130,000 gold ounces.
Pilar
Construction progress is on schedule with commissioning and start-up of production expected by mid-2013 with commercial production expected by the end of 2013. As of December 31, 2011, detailed engineering and earthworks were approximately 85% complete, advancing physical progress to approximately 25%. Annual production from the mine is estimated to be 120,000 ounces of gold. The project is being built with 30% additional capacity to that contemplated in the feasibility study in anticipation of significant mineral resource growth. Development of Caiamar, a high-grade satellite deposit located 38 kilometres west of Pilar, is expected to contribute to production and utilization of this excess capacity at Pilar thereby increasing production to a minimum of 140,000 gold ounces per year once in full production, as early as 2014.
Mineral resource development and work on a feasibility study continued at Caiamar throughout the year. The ore from this deposit can be processed at Pilar with the higher grades offsetting the additional transportation costs.
ARGENTINA
Agua Rica
On September 1, Xstrata, Goldcorp and the Company announced that they reached a definitive agreement providing Minera Alumbrera (“MAA”) the exclusive option to acquire the Company’s 100% interest in the Agua Rica project, which represents a significant step toward advancing the plan to integrate Agua Rica into MAA. Under the direction of Xstrata, operator of MAA, MAA has initiated an update to the feasibility study with respect to the integration of its operations and those of Minera Agua Rica.
Suyai
Development of various studies relating to Suyai will be launched during 2012. The studies are expected to lead to the evaluation of Suyai as a high grade, low cost underground mine with off-site processing, tailings and waste facilities. The Company has been invited to present this new concept for Suyai to local officials and community leaders.
CHILE
Jeronimo
Following the delivery of the first mineral reserve estimate at Jeronimo in early 2011, a pre-feasibility study of Jeronimo was completed by the end of the year.
29
The pre-feasibility study estimated that cash costs will be approximately $600 per gold ounce and that pre-production capital will be approximately $310 million. The initial results indicated increased production and recovery levels reaching approximately 85% under a base case scenario when utilizing a combined flotation and pressure oxidation process. Additional studies were undertaken, which have since been completed and form the basis of the feasibility study now being completed. The studies were designed to provide greater certainty through extensively testing metallurgical results, opportunities for improving recoveries beyond 85% and scaling the plant to requirements through pilot testing. These results and advanced engineering work will be detailed within the feasibility study expected before mid-2012. With the increase in certainty from pilot testing and metallurgy, a 17% increase in gold mineral reserves, potential by-product credits and other optimizations, the Company expects a positive impact on the economics of the project.
The Company anticipates making a construction decision in 2012 and is advancing the construction of Jeronimo whether or not it consolidates its 57% stake in the project. Jeronimo’s annual gold production is expected to be approximately 150,000 ounces per year, with production in the early years of approximately 190,000 ounces.
EXPLORATION
The Company’s 2011 exploration program focused on increasing mineral reserves and mineral resources within its near-mine and regional brownfield exploration programs as well as continuing to explore greenfield targets elsewhere in the Americas. The Company is largely focused on developing its future based on its exploration successes and organic growth.
Yamana expects to spend approximately $125 million on exploration in 2012 continuing to build on its successful record of replacing and increasing mineral reserves and mineral resources. The exploration program will focus on increasing the Company’s mineral reserves and mineral resources, accelerating the development of new discoveries such as Jordino and Maria Lazarus at Pilar, the extension of Pampa Augusta Victoria and definition of a new discovery at El Peñón, the expansion of high grade mineral resources at Jacobina and the development of several greenfield projects.
The following is a summary of the exploration expenditures for the current year and comparative years:
| | Years ended December 31, | |
(in millions of United States Dollars) | | 2011 | | 2010 | | 2009 | |
Exploration capitalized (i) | | $ | 89.6 | | $ | 58.6 | | $ | 45.2 | |
Exploration expensed (ii) | | 32.4 | | 39.2 | | 20.4 | |
Total exploration | | $ | 122.0 | | $ | 97.8 | | $ | 65.6 | |
(i) Capitalized exploration costs are reflected in the Consolidated Balance Sheet, property, plant and equipment as part of the additions to depletable producing property for near-mine exploration, assets under construction and tangible exploration and evaluation assets.
(ii) Expensed exploration costs are reported in the Consolidated Statements of Operations.
As of the end of 2011, a total of 16 projects have been explored with comprehensive drill programs and a total of approximately 422,000 metres of drilling was completed. Included in the individual mine operation descriptions are the exploration results for the fourth quarter of 2011 for each respective mine.
30
9. MINERAL RESERVE AND MINERAL RESOURCE ESTIMATES
The figures for mineral reserves and mineral resources are determined in accordance with National Instrument 43-101, issued by the Canadian Securities Administrators. This National Instrument lays out the standards of disclosure for mineral projects including rules relating to the determination of mineral reserves and mineral resources. This includes a requirement that a “qualified person” (as defined under the NI 43-101) supervise the preparation of the mineral reserves and mineral resources reports. The Company’s mineral reserve reports are reviewed by Evandro Cintra, Senior Vice President Technical Services, who is a qualified person. The Company’s mineral resources reports are reviewed by Darcy Marud, Senior Vice President Exploration who is a qualified person.
Complete information relating to mineral reserves and mineral resources indicating tonnage, grade and the date of each NI 43-101 Report for the various mines and projects is contained in a complete mineral resource and mineral reserve table accompanying the 2011 annual report.
On a gold equivalent basis, the Company’s proven and probable mineral reserves were 18.6 million gold equivalent ounces (“GEO”) for the year ending December 31, 2011, an increase of 11% from 2010 (2010 — 16.8 million GEO) after having mined approximately 1.4 million contained GEO (production before recoveries). This is comprised of 17.0 million ounces of proven and probable gold mineral reserves and 82.9 million ounces of proven and probable silver mineral reserves. The Company’s total gold proven and probable mineral reserves increased to 17.0 million ounces from 15.6 million ounces, which represents a 10% increase over the previous year. Average gold grade increased by 9% with notable contributions from Chapada, Jacobina and Gualcamayo. Proven and probable copper mineral reserves were 2.6 billion pounds of copper at an average grade of 0.30% including Alumbrera.
Measured and Indicated mineral resources on a gold equivalent basis were 13.6 million GEO (contained gold — 13.2 million ounces; contained silver — 23.4 million ounces) as at December 31, 2011, compared with Measured and Indicated mineral resources of 14.1 million GEO (contained gold — 13.6 million ounces; contained silver — 27.8 million ounces) in 2010. Measured and Indicated mineral resources modestly decreased by 3% from 2010 mainly due to the conversion to mineral reserves. Total inferred mineral resources increased to 10.3 million GEO (contained gold — 9.1 million ounces; contained silver — 63.4 million ounces), which represents an increase of 39% over 2010 as a result of new discoveries at Chapada, Gualcamayo, Fazenda Brasileiro, C1 Santa Luz and significant extensions to known deposits at Pilar, El Peñón and Mercedes.
Mineral reserves and mineral resources were calculated for most projects based on a gold price of $950 per ounce (2010 - $900 per ounce, 2009 - $825 per ounce), a silver price of $20 per ounce (2010 - $15 per ounce, 2009 - $14 per ounce), and a copper price of $2.50 per pound (2010 - $2.5 per pound, 2009 - $2.25 per pound). Please refer to the mineral reserve and mineral resource table contained in the Company’s 2011 annual report and the Company’s website for a complete listing of metal-price assumptions used in the calculation of mineral reserves and mineral resources by project.
The most notable changes are detailed below:
El Peñón, Chile
Total gold equivalent mineral reserves increased by 20% to 3.5 million GEO supporting an increased mine life and a higher sustainable production level of 440,000 GEO per year. The Company has increased GEO mineral reserves for two consecutive years since 2009. In 2011, gold equivalent mineral reserve tonnage increased by 33% at an average grade of 9.7 g/t. This increase includes a portion of the Pampa Augusta Victoria (“PAV”) vein system which is ‘open pittable’ as it is near surface and easily accessible. The 2012 exploration program at El Peñón will focus on the extension of PAV and areas within the North Block as well as more recent discoveries. This effort is expected to result in continued increases in mineral resources in 2012.
Chapada, Brazil
Total gold mineral reserves increased by 6% to 3.3 million ounces at an average grade of 0.25 g/t, a 9% increase from 2010. The increases are largely attributed to the inclusion of portions of the Suruca and Corpo Sul mineral resources upgrading to mineral reserves. Measured and indicated mineral resources declined slightly but with a modest increase in grade. This was expected given the exploration focus in 2011 was to upgrade mineral resources to mineral reserves and further exploration of Corpo Sul. Gold mineral reserves have increased cumulatively by 54% since 2009. Inferred mineral resources increased by 193% to 1.2 million GEO in 359.0 million tonnes of mineral resources at 0.10 g/t.
31
A feasibility study was completed for Suruca in late 2011 which outlines average annual gold production of 49,000 ounces over an initial five years beginning in 2013. Corpo Sul is a new discovery made during 2011. It is expected that further work at Corpo Sul will significantly contribute to 2012 growth of mineral reserves.
Jacobina, Brazil
Total proven and probable gold mineral reserves increased by 20% to 2.0 million ounces. Since acquisition of the mine, the Company has increased gold mineral reserves cumulatively by 64% representing a five-year consecutive increase. As at December 2011 mineral reserve grade increased by 10% to 2.74 g/t as the higher grade Canavieiras and Morro do Vento deposits were upgraded to mineral reserves. Since 2009, mineral reserve grade has increased by 28% from 2.14 g/t to 2.74 g/t. Measured and indicated mineral resources increased by 44% to 2.4 million ounces in 27.6 million tonnes of mineral resources at 2.70 g/t. These results warrant the Company’s continuing evaluation of higher production levels at Jacobina related to the higher grade mineral reserves. This is the third year of consecutive quality improvements and increases in mineral reserves and mineral resources at Jacobina.
Gualcamayo, Argentina
Total mineral reserves were depleted by 9%. Measured and indicated mineral resources increased by 20% to 1.1 million ounces in 33.6 million tonnes of mineral resources at 1.04 g/t. Inferred mineral resources increased by 444% to 626,000 ounces in 10.3 million tonnes of mineral resources at 1.9 g/t. The mineral resource increases are a result of exploration south west of the QDD Lower West (QDDLW) deposit which intersected two large bodies of sulphide breccia similar to QDDLW. These are potentially an extension of QDDLW, sub-parallel bodies or feeders to the QDDLW. This mineralization remains open to the south west and down dip. Exploration in 2012 will focus on expanding these new discoveries and linking them with QDDLW.
Minera Florida, Chile
Total proven and probable gold equivalent mineral reserves increased by 28% to 968,000 GEO from 2010 and increased by 38% over the last two consecutive years. The 2011 increase includes the historic tailings that were upgraded to mineral reserves as a result of the impending start-up of the Minera Florida expansion in which the tailings will be processed. The tailings represent 5.7 million tonnes of mineral reserves averaging 1.35 gold equivalent g/t for 245,000 GEO. This expansion will produce approximately 40,000 GEO’s per year with first production expected in April, 2012. Measured and indicated mineral resources increased by 46% to 584,000 GEO at an average gold equivalent grade of 6.5 g/t which includes new mineral resources within the main core.
Fazenda Brasileiro, Brazil
Total mineral reserves increased by 104% to 359,000 ounces at an average grade of 2.4 g/t as some mineral resources were upgraded to mineral reserves, primarily from CLX2 and Canto in addition to the remodelling of some existing mineral reserves. Measured and indicated mineral resources modestly declined as mineral resources were converted to mineral reserves through infill drilling and inferred mineral resources increased by 160% to 525,000 ounces in 4.7 million tonnes of mineral resources at 3.45 g/t. The Company has been mining at Fazenda Brasileiro for seven years after acquiring the mine in 2003 with only 2.5 years of mine life remaining based on known mineral reserves.
Mercedes, Mexico
Total proven and probable mineral reserves increased by 22% to 1.0 million GEO as a result of the increase in GEO mineral reserves, primarily from the Barrancas, Lagunas Norte and Diluvio vein structures.
C1 Santa Luz, Brazil
Total mineral reserves increased by 24% to 1.5 million ounces as a result of exploration success down dip of the existing mineral resource in addition to the increase in the gold price assumption that had not been changed since the completion of the feasibility study. Measured and indicated mineral resources modestly declined due to the conversion of most of the mineral resources to mineral reserves. Inferred mineral resources increased by 107% to 476,000 ounces in 5.9 million tonnes of mineral resources, most of the increase was grade driven as gold grades improved by 77% to 2.53 g/t.
Ernesto/Pau-a-Pique, Brazil
Total mineral reserves increased by 11% to 791,000 ounces. Measured and indicated mineral resources increased by 14% on 2.3 million tonnes of mineral resources at 1.92 g/t to 141,000 ounces and inferred mineral resources also increased by 14% in 4.9 million tonnes of mineral resources at 1.87 g/t to 293,000 ounces. These increases can be attributed to the upgrade of mineral resources at the Lavrinha deposit to mineral reserves and the slight increase in the gold price assumptions.
32
Pilar, Brazil
Inferred mineral resources increased by over 200% to 1.1 million ounces in 8.2 million tonnes of mineral resources at 4.06 g/t which reflects a significant increase in grade. These mineral resource increases are attributed to exploration success down dip at Jordino and along strike to the north. The mineral reserve was unchanged from 2010 year end as the focus of the 2011 exploration program was the expansion of the total mineral resource base and discovery of new mineralized zones to support higher production levels at Pilar.
Jeronimo, Chile
Total attributable mineral reserves increased by 17% to 1.1 million gold ounces from the initial mineral reserve declared in 2010. On a 100% basis, the project has 1.9 million gold ounces in mineral reserves and 246,000 gold ounces of measured and indicated mineral resources.
During 2011, the Company completed a pre-feasibility study. The final feasibility study is expected to be delivered before mid-year 2012. The Company is completing some additional metallurgical testing and advanced engineering that are expected to increase certainty of feasibility results and have potential to increase production and recovery levels. The Company anticipates making a construction decision on Jeronimo in 2012.
The Company’s mineral reserves and mineral resources as at December 31, 2011 are summarized in the following table. Complete information relating to mineral reserves and mineral resources indicating tonnage, grade and the date of each NI 43-101 Report for the various mines and projects is contained in a complete mineral resource and mineral reserve table accompanying the 2011 annual report are also available on the Company’s website, www.yamana.com.
33
| | Gold | | Silver | | GEO | | Copper | |
| | (in 000’s ounces) | | (in 000’s ounces) | | (in 000’s GEO) | | (in million
pounds) | |
Mine/Project | | 2011 | | 2010 | | 2011 | | 2010 | | 2011 | | 2010 | | 2011 | | 2010 | |
| | | | | | | | | | | | | | | | | |
Proven & Probable Mineral Reserves | | | | | | | | | | | | | | | | | |
Chapada | | 3,317 | | 3,134 | | — | | — | | 3,317 | | 3,134 | | 2,310 | | 2,149 | |
El Peñón | | 2,202 | | 2,003 | | 66,511 | | 51,863 | | 3,532 | | 2,946 | | — | | — | |
Jacobina | | 2,005 | | 1,672 | | — | | — | | 2,005 | | 1,672 | | — | | — | |
Gualcamayo | | 2,194 | | 2,416 | | — | | — | | 2,194 | | 2,416 | | — | | — | |
Minera Florida | | 842 | | 668 | | 6,330 | | 4,774 | | 969 | | 755 | | — | | — | |
Fazenda Brasileiro | | 359 | | 176 | | — | | — | | 359 | | 176 | | — | | — | |
Mercedes | | 964 | | 794 | | 10,099 | | 8,386 | | 1,036 | | 854 | | — | | — | |
Ernesto/Pau-a-Pique | | 791 | | 710 | | — | | — | | 791 | | 710 | | — | | — | |
C1 Santa Luz | | 1,465 | | 1,184 | | — | | — | | 1,465 | | 1,184 | | — | | — | |
Pilar | | 1,440 | | 1,439 | | — | | — | | 1,440 | | 1,439 | | — | | — | |
Jeronimo | | 1,082 | | 928 | | — | | — | | 1,082 | | 928 | | — | | — | |
Alumbrera (12.5%) | | 376 | | 442 | | — | | — | | 376 | | 442 | | 259 | | 304 | |
Total Proven & Probable Mineral Reserves | | 17,038 | | 15,565 | | 82,940 | | 65,023 | | 18,566 | | 16,656 | | 2,569 | | 2,453 | |
| | | | | | | | | | | | | | | | | |
Measured & Indicated Mineral Resources | | | | | | | | | | | | | | | | | |
Chapada | | 2,190 | | 2,523 | | 3,775 | | — | | 2,266 | | 2,523 | | 986 | | 1,385 | |
El Peñón | | 447 | | 758 | | 11,384 | | 20,266 | | 675 | | 1,126 | | — | | — | |
Jacobina | | 2,391 | | 1,663 | | — | | — | | 2,391 | | 1,663 | | — | | — | |
Gualcamayo | | 1,119 | | 931 | | — | | — | | 1,119 | | 931 | | — | | — | |
Minera Florida | | 529 | | 372 | | 2,763 | | 1,610 | | 584 | | 401 | | — | | — | |
Fazenda Brasileiro | | 153 | | 472 | | — | | — | | 153 | | 472 | | — | | — | |
Mercedes | | 188 | | 188 | | 1,939 | | 2,363 | | 202 | | 205 | | — | | — | |
Ernesto/Pau-a-Pique | | 141 | | 124 | | — | | — | | 141 | | 124 | | — | | — | |
C1 Santa Luz | | 582 | | 1,213 | | — | | — | | 582 | | 1,213 | | — | | — | |
Pilar | | 267 | | 224 | | — | | — | | 267 | | 224 | | — | | — | |
Jeronimo | | 139 | | 94 | | — | | — | | 139 | | 94 | | — | | — | |
La Pepa | | 2,760 | | 2,760 | | — | | — | | 2,760 | | 2,760 | | — | | — | |
Suyai | | 2,286 | | 2,286 | | 3,523 | | 3,523 | | 2,356 | | 2,350 | | — | | — | |
Total Measured & Indicated Mineral Resources | | 13,192 | | 13,608 | | 23,384 | | 27,762 | | 13,635 | | 14,086 | | 986 | | 1,385 | |
| | | | | | | | | | | | | | | | | |
Inferred Mineral Resources | | | | | | | | | | | | | | | | | |
Chapada | | 1,182 | | 404 | | 982 | | — | | 1,202 | | 404 | | 1,218 | | 392 | |
El Peñón | | 1,107 | | 1,161 | | 46,458 | | 36,911 | | 2,036 | | 1,832 | | — | | — | |
Jacobina | | 1,362 | | 1,293 | | — | | — | | 1,362 | | 1,293 | | — | | — | |
Gualcamayo | | 626 | | 115 | | — | | — | | 626 | | 115 | | — | | — | |
Minera Florida | | 591 | | 534 | | 4,884 | | 5,329 | | 689 | | 631 | | — | | — | |
Fazenda Brasileiro | | 525 | | 202 | | — | | — | | 525 | | 202 | | — | | — | |
Mercedes | | 509 | | 468 | | 7,257 | | 3,554 | | 561 | | 493 | | — | | — | |
Ernesto/Pau-a-Pique | | 293 | | 257 | | — | | — | | 293 | | 257 | | — | | — | |
C1 Santa Luz | | 476 | | 230 | | — | | — | | 476 | | 230 | | — | | — | |
Pilar | | 1,065 | | 448 | | — | | — | | 1,065 | | 448 | | — | | — | |
Jeronimo | | 161 | | 219 | | — | | — | | 161 | | 219 | | — | | — | |
La Pepa | | 620 | | 620 | | — | | — | | 620 | | 620 | | — | | — | |
Suyai | | 274 | | 274 | | 575 | | 575 | | 286 | | 284 | | — | | — | |
Amancaya | | 351 | | 351 | | 3,270 | | 3,270 | | 416 | | 410 | | — | | — | |
Total Inferred Mineral Resources | | 9,142 | | 6,576 | | 63,426 | | 49,639 | | 10,318 | | 7,438 | | 1,218 | | 392 | |
34
10. LIQUIDITY, CAPITAL RESOURCES AND CONTRACTUAL COMMITMENTS
LIQUIDITY
Consistent with the Company’s overall capital management strategy, the Company continues to have sufficient liquidity and capital resources to pursue its growth strategies, meet its ongoing obligations and future contractual commitments while creating shareholder value. Factors that could impact the Company’s liquidity are monitored regularly and include but are not limited to the market prices of gold, copper and silver, production levels, operating cash costs, capital costs, exchange rates of currencies of countries where the Company operates, exploration and discretionary expenditures.
In the near term, the Company expects its liquidity to remain strong as it maintains low levels of debt-to-equity and expected cash flow from operations is positively impacted by higher forecast production levels and stable metal prices. As at December 31, 2011, the Company has met all of the externally imposed capital requirements. (Refer to Note 27 “Capital Management” to the accompanying consolidated financial statements.)
The following is a summary of liquidity and capital resources balances:
| | As at December 31, | |
(in thousands of United States Dollars) | | 2011 | | 2010 | |
Cash | | $ | 550,438 | | $ | 330,498 | |
Trade and other receivables | | $ | 206,101 | | $ | 212,945 | |
Long-term debt | | $ | (431,769 | ) | $ | (486,550 | ) |
Working capital (i) | | $ | 608,021 | | $ | 518,081 | |
(i) Working capital is defined as the excess of current assets over current liabilities
Cash and cash equivalents as at December 31, 2011 increased by 67% to $550.4 million compared to $330.5 million as at December 31, 2010. Cash and cash equivalents comprise cash at bank and bank term deposits mainly generated from operating cash inflows.
The Company has $391.5 million of cash and short-term investments overseas as of December 31, 2011. The funds are not restricted from transfer to the corporate office but the Company does not intend to repatriate those funds in the foreseeable future. The Company will accrue and pay taxes as required if the funds are repatriated. The presidential decree announced by the government of Argentina in 2011 requires repatriation of all export revenues to Argentina but states that there is no restriction on the use or transfer of funds subsequent to the repatriation. The Company has concluded that the decree will have only a modest impact on Yamana’s movement of funds in and out of the country mostly relating to an increase in immaterial transaction fees.
Trade and other receivables at the end of the year were $206.1 million decreasing from $212.9 million as at December 31, 2010. Gold sales are made at spot prices and receivables are settled in less than a month. Copper concentrate sales are made in accordance with certain smelter off-take agreements whereby provisional payments of approximately 90% are received within 1 to 4 weeks after shipping. Final assays and payment related to these sales are received approximately 2 to 3 months thereafter.
Long-term debt at the end of the year was $431.8 million compared with $486.6 million as at December 31, 2010 representing an 11% decrease. Debt repayments during the year totaled $55.0 million.
Working capital was $608.0 million as at December 31, 2011, compared to $518.1 million as at December 31, 2010. The 17% increase in working capital was mainly attributable to a high cash balance as a result of higher prices for metals and increased volume of sales.
| | For the years ended December 31, | |
(in thousands of United States Dollars) | | 2011 | | 2010 | |
Cash flows from operating activities of continuing operations | | $ | 1,225,782 | | $ | 681,331 | |
Cash flows generated from operations of continuing operations before changes in non-cash working capital items | | $ | 1,266,373 | | $ | 856,827 | |
Cash flows from financing activities of continuing operations | | $ | (142,678 | ) | $ | (68,870 | ) |
Cash flows to investing activities of continuing operations | | $ | (846,075 | ) | $ | (460,640 | ) |
35
OPERATING CASH FLOWS OF CONTINUING OPERATIONS
Cash flows from operations after taking into effect changes in working capital items for the year ended December 31, 2011 were $1.2 billion, compared to inflows of $681.3 million for the same period ended December 31, 2010 from continuing operations.
Cash flows generated from operations before changes in non-cash working capital items for the year ended December 31, 2011 were $1.3 billion compared to $856.8 million for the same period ended December 31, 2010 from continuing operations. The increase of 48% is mainly attributed to increases in revenues.
Changes in non-cash working capital items for the year ended December 31, 2011 period were cash outflows of $40.6 million compared to outflows of $175.7 million for 2010, the 77% decrease was mainly due to the favourable effect of the change of trade and other receivables and trade and other payables.
FINANCING ACTIVITIES OF CONTINUING OPERATIONS
Cash outflows to financing activities for the year ended December 31, 2011 were $142.7 million compared to cash outflows of $68.9 million for 2010 from continuing operations due to the following:
· increase of dividends paid by $51.8 million;
· increase of net long-term debt repayment of $10.0 million for a total debt repayment of $55.0 million in 2011 compared to $45.0 million in 2010;
· net decrease of $40.5 million received from the exercise of options and warrants; and
· net decrease of $28.5 million paid for financing and other charges.
INVESTING ACTIVITIES OF CONTINUING OPERATIONS
Cash outflows to investing activities were $846.1 million (December 31, 2010 - $460.6 million) for the year ended December 31, 2011 of which approximately $822.2 million relates to expenditures on property, plant and equipment, increasing by 71% compared with $482.0 million spent in 2010. Higher outflows on acquisition of property, plant and equipment reflected increased expenditures on the construction of new mines and expansion of existing assets.
The following is a summary of capital expenditures by mine:
| | Three months ended
December 31, | | For the years ended December 31, | |
(in thousands of United States Dollars) | | 2011 | | 2011 | | 2010 | | 2009 | |
BRAZIL | | | | | | | | | |
Chapada | | $ | 24,659 | | $ | 65,946 | | $ | 64,549 | | $ | 112,501 | |
Jacobina | | 19,242 | | 64,212 | | 53,298 | | 51,661 | |
Fazenda Brasileiro | | 11,172 | | 34,679 | | 22,536 | | 15,463 | |
Ernesto/Pau-a-Pique (i) | | 25,385 | | 70,206 | | 10,715 | | 437 | |
C1 Santa Luz (i) | | 17,379 | | 59,682 | | 15,920 | | 1,303 | |
Pilar (i) | | 37,246 | | 78,444 | | 27,059 | | 25,454 | |
| | | | | | | | | |
CHILE | | | | | | | | | |
El Peñón (ii) | | 32,539 | | 117,181 | | 145,176 | | 105,942 | |
Minera Florida | | 38,510 | | 99,307 | | 67,512 | | 40,442 | |
Jeronimo | | 3,626 | | 9,670 | | 2,567 | | — | |
| | | | | | | | | |
ARGENTINA | | | | | | | | | |
Gualcamayo | | 31,426 | | 66,644 | | 40,787 | | 121,996 | |
Agua Rica | | 220 | | 8,444 | | 8,047 | | 3,932 | |
Suyai | | 942 | | 14,062 | | — | | — | |
| | | | | | | | | |
MEXICO AND OTHER | | | | | | | | | |
Mercedes (i) | | 30,983 | | 119,736 | | 65,835 | | 16,333 | |
Other | | 8,062 | | 14,010 | | 7,080 | | 3,293 | |
Total capital expenditures (i) | | $ | 281,391 | | $ | 822,223 | | $ | 531,081 | | $ | 498,757 | |
(i) Net of movement in accounts payable.
36
(ii) Capital expenditures for 2010 included the purchase cost of Constructora Gardilcic Ltda. and Constructora TCG Ltda. of $49.1 million to convert El Peñón into an owner-mining operation.
CAPITAL RESOURCES
In order to maintain or adjust its capital structure, the Company, upon approval from its Board of Directors, may issue shares, pay dividends, or undertake other activities as deemed appropriate under the specific circumstances.
The Company is authorized to issue an unlimited number of common shares at no par value and a maximum of eight million first preference shares. There are no first preference shares issued or outstanding. As of February 21, 2012, the total number of shares outstanding were 745.8 million, the total number of stock options outstanding were 1.5 million, the total number of DSUs outstanding were 1.6 million and the total number of RSUs outstanding were 1.9 million.
During the year, the Company increased its annual dividend to $0.20 per share or $0.05 per share per quarter. Total dividend payments of $100.1 million, were more than double the dividends paid of $48.3 million in 2010.
The following table summarizes the common shares and options outstanding as at December 31, 2011:
| | Actual | | Weighted average (i) | |
(in thousands) | | Outstanding
as at
December 31,
2011 | | Twelve
months ended,
December 31,
2011 | | Three
months ended,
December��31,
2011 | |
Common shares | | 745,774 | | 744,600 | | 745,669 | |
Options | | 1,532 | | 756 | | 650 | |
| | 747,306 | | 745,356 | | 746,319 | |
(i) The weighted average number of shares excludes anti-dilutive options.
CONTRACTUAL COMMITMENTS
Day-to-day mining, expansionary and sustaining capital expenditures as well as administrative operations give rise to contracts requiring agreed upon future minimum payments. Management is of the view that such commitments will be sufficiently funded by current working capital, future operating cash flows and available credit facilities which provide access to additional funds.
As at December 31, 2011, the Company is contractually committed to the following:
(in thousands of United States Dollars) | | Within 1 year | | Between 1 to 3
years | | Between 3 to 5
years | | After 5 years | | Total | |
Mine operating/construction and service contracts and other | | $ | 321,706 | | $ | 230,267 | | $ | 14,208 | | $ | 8,167 | | $ | 574,348 | |
Long-term debt principal repayments (i) | | — | | 182,632 | | 73,500 | | 181,500 | | 437,632 | |
Decommissioning, Restoration and Similar Liabilities (ii) | | 10,926 | | 18,209 | | 29,936 | | 211,698 | | 270,769 | |
| | | | | | | | | | | |
| | $ | 332,632 | | $ | 431,108 | | $ | 117,644 | | $ | 401,365 | | $ | 1,282,749 | |
(i) Excludes interest expense.
(ii) The decommissioning, restoration and similar liabilities (hereinafter referred to as decommissioning liabilities) relate to reclamation and closure costs relating to the Company’s mine operations and projects under development. The Company accrues decommissioning liabilities at their fair value determined as the discounted future cash expenditures. Significant management judgements and estimates are made when estimating reclamation and closure costs which are based on the Company’s interpretation of current regulatory requirements and are amortized over the life of each mine on a unit-of-production basis. Decommissioning liabilities of the mines and projects are incurred in Brazilian Reais, Chilean Pesos, Argentine Pesos, Mexican Pesos and United States Dollars. Decommissioning liabilities other than United-States-Dollar denominated are subject to translation gains and losses from one reporting period to the next in accordance with the Company’s accounting policy for foreign
37
currency translation of monetary items. Refer to Note 19, Decommissioning, restoration and similar liabilities to the Consolidated Financial Statements.
38
11. INCOME TAXES
The Company recorded an income tax expense of $269.9 million for the year ($128.3 million for 2010). The income tax provision reflects a current income tax expense of $266.0 million ($136.5 million for 2010) and a deferred income tax expense of $3.8 million (recovery of $8.2 million for 2010). The effective tax rate for the year was 32.9% (22.0% 2010). The expense reflects the taxes incurred in the Company’s Brazilian, Chilean and Argentinean mines.
The effective tax rate excluding equity earnings, write-down on available for sale securities, foreign exchange on non-monetary assets and revaluations is 27.2% for the year (30.7% for 2010). These items are adjusted to normalize the effects of IFRS on the tax provision.
The consolidated balance sheet reflects recoverable tax installments in the amount of $5.4 million ($31.5 million for 2010) and an income tax liability of $129.5 million ($81.8 million for 2010). Additionally, the balance sheet reflects a deferred tax asset of $156.8 million ($183.1 million for 2010) and a deferred tax liability of $2.0 billion ($2.0 billion for 2010).
The income tax provision is subject to a number of factors including the allocation of income between different countries, different tax rates in the various jurisdictions, the non-recognition of tax assets, foreign currency exchange rate movements, changes in tax laws and the impact of specific transactions and assessments. Due to the number of factors that can potentially impact the effective tax rate and the sensitivity of the tax provision to these factors, as discussed above, it is expected that the Company’s effective tax rate will fluctuate in future periods.
The Company has elected, under IFRS, to record foreign exchange and interest and penalties in the income tax expense, therefore, due to foreign exchange differences, the tax rate will fluctuate during the year with the change in the Brazilian Real and Argentinean Peso. Refer to Note 29 to the consolidated financial statements for a breakdown of the foreign exchange and interest and penalties charged to the income tax expense.
The Company has approximately $220.6 million of tax losses available for carry forward in Brazil. Approximately 5% of these losses have been recognized as a tax asset. The Company expects to use these losses against future income from operating mines in Brazil.
The majority of the deferred tax liability arises on the allocation of the purchase price of acquisitions to the underlying assets as the tax basis of these assets did not increase. Deferred tax liabilities relating to the operating mines will reverse as the assets are depreciated or depleted. The deferred tax liabilities relating to exploration potential will not reverse until the property becomes a mine, is written off, or is sold. The largest components of the deferred tax liabilities relate to:
| | (in thousands of United States Dollars) | |
Gualcamayo | | $ | 363,675 | |
Agua Rica | | $ | 428,381 | |
El Peñón | | $ | 138,200 | |
Exploration Potential | | $ | 855,023 | |
The income tax rate will vary from period to period based on the mix of taxable income earned in each jurisdiction where we operate. The income tax expense will also vary depending on the foreign currency exchange rate in effect in the period.
The Company’s combined Canadian federal and provincial statutory tax rate was 28.3% (2010 - 31.0%). There are a number of factors that affect the Company’s effective tax rate including the rate differential and proportion of income earned in each jurisdiction, tax benefits that are not recognized, foreign currency gains and losses and changes in tax rates. As a result, the Company’s effective tax rate may fluctuate from period to period. A reconciliation of the Company’s statutory rate to the effective tax rate is provided in Note 29 to the consolidated financial statements.
39
12. ECONOMIC TRENDS, RISKS AND UNCERTAINTIES
Exploration, development and mining of precious metals involve numerous inherent risks as a result of the nature of the business, global economic trends as well as local social, political, environmental and economic conditions in the various geographical areas of operation. As such, the Company is subject to several financial and operational risks that could have a significant impact on its profitability and levels of operating cash flows.
The Company assesses and minimizes these risks by adhering to its internal risk management protocols which include the application of high operating standards empowering individuals and establishing processes to be able to identify, assess, report and monitor risk at all levels of the organization. Through careful management and planning of its facilities, hiring qualified personnel and developing a skilled workforce through training and development programs, the Company is able to generate shareholder value in a safe, resilient and responsible manner.
Below is a summary of the principal risks and related uncertainties facing the Company. Readers are also encouraged to read and consider the risk factors more particularly described in the Company’s Annual Information Form for the period ended December 31, 2011. Such risk factors could materially affect the future operating results of the Company and could cause actual events to differ materially from those described in forward-looking statements relating to the Company.
Commodity Risk
The mining industry is highly dependent on commodity prices which are the result of the economic interplay of supply and demand. The profitability of the Company is directly related to the market prices of gold and copper and to a lesser extent, silver. A decline in the market prices for these precious metals could negatively impact the Company’s future operations. As at December 31, 2011, the Company’s exposure to commodity price is limited to the accounts receivable associated with provisional pricing of metal concentrate sales particularly copper. A 10% change in the price of copper has an $18.5 million before tax effect on profit or loss.
Gold Price Three-Year Trend (Bloomberg: USD per ounce of Gold)
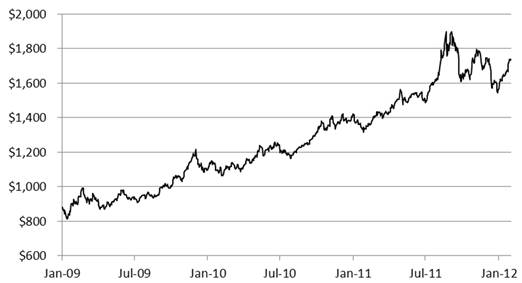
For the year ended December 31, 2011, spot gold prices averaged $1,573 per ounce, or 28% higher, compared with $1,225 per ounce from the comparative period of 2010.
Most notably in 2011 was the strong growth in physical bar and coin demand. This offset a decrease in investment demand from exchange traded funds (“ETFs”) in 2011. However, ETF demand is expected to remain supportive of gold prices in 2012 due to global macroeconomic concerns. China and India were the dominant purchasers of gold in 2011 and are expected to remain so prospectively.
Gold prices continue to be driven by positive market fundamentals. An uncertain global environment paired with low-growth economic recovery continues to make gold a safe investment relative to stocks and fluctuating currencies. Constrained long-term mine supply and a steady investment demand from ETFs are supportive of gold prices. Furthermore, central bank purchases are also underpinning higher prices. In light of these factors, the Company expects gold prices to remain well supported in the near to mid-term, although with a high degree of market volatility.
The Company has not hedged any of its gold sales.
40
Copper Price Three-Year Trend (Bloomberg: USD per ounce of Gold)
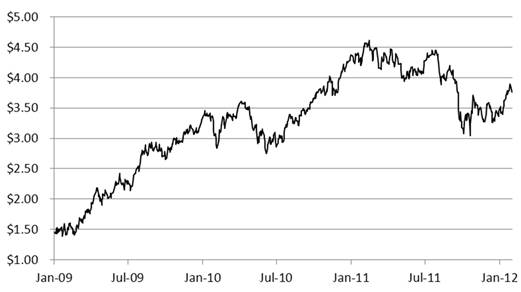
For the year ended December 31, 2011, spot copper prices averaged $4.00 per pound, representing an increase of 17% compared with $3.42 per pound from the same period in 2010.
Strong copper prices are primarily being driven by positive supply demand fundamentals as flat supply growth is unbalanced with demand from emerging markets, mainly China. Towards the end of the year, copper prices softened due to global growth uncertainties and concerns over the European debt crisis. Copper prices rebounded subsequent to the year-end on the heels of the US Federal Reserve announcement that it will likely keep interest rates low until 2014 in an effort to jump-start economic growth. Based on positive fundamentals, the Company expects copper prices to remain above historical levels in the near to mid-term.
The Company has forward contracts to economically hedge against the risk of declining copper prices for a portion of its forecast copper concentrate sales.
Currency Risk
Conducting exploration, development and production operations in Latin America exposes the Company to currency risk. The Company’s revenues are denominated in United States Dollars (“USD”). However, the Company’s operating expenses are incurred in United States Dollars, Brazilian Reais (“BRL”), Chilean Pesos (“CLP”), Argentine Pesos (“ARG”) and to a lesser extent in Canadian Dollars (“CAD”) and Mexican Pesos (“MXN”). Accordingly, fluctuations in the exchange rates can significantly impact the results of operations. As at December 31, 2011 on a 10% change in the price of BRL, CLP and ARG denominated monetary items has a $15.9 million, $5.9 million, $3.8 million pre-tax effect on profit or loss, respectively.
41
The following summarizes the movement in key currencies vis-à-vis the United States Dollar:
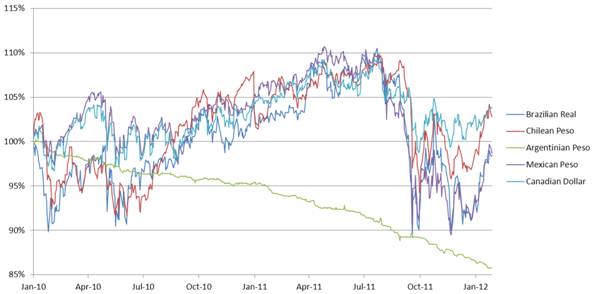
Three months ended December 31, | | 2011 | | 2010 | | | |
Average Exchange Rate | | | | | | | |
USD-CAD | | 1.0196 | | 1.0136 | | 0.6 | % |
USD-BRL | | 1.7993 | | 1.7021 | | 5.7 | % |
USD-ARG | | 4.2442 | | 3.9715 | | 6.9 | % |
USD-CLP | | 506.8475 | | 485.8691 | | 4.3 | % |
USD-MXN | | 13.5150 | | 12.4303 | | 8.7 | % |
Twelve months ended December 31, | | 2011 | | 2010 | | | |
Average Exchange Rate | | | | | | | |
USD-CAD | | 0.9882 | | 1.0308 | | -4.1 | % |
USD-BRL | | 1.6742 | | 1.7675 | | -5.3 | % |
USD-ARG | | 4.1170 | | 3.9205 | | 5.0 | % |
USD-CLP | | 481.7631 | | 519.3067 | | -7.2 | % |
USD-MXN | | 12.3727 | | 12.6251 | | -2.0 | % |
| | 2011 | | 2010 | | | | 2009 | | | |
Period-end Exchange Rate | | | | | | | | | | | |
USD-CAD | | 1.0213 | | 0.9999 | | 2.1 | % | 1.0491 | | -2.7 | % |
USD-BRL | | 1.8758 | | 1.6660 | | 12.6 | % | 1.7343 | | 7.5 | % |
USD-ARG | | 4.3000 | | 3.9713 | | 8.3 | % | 3.8142 | | 11.3 | % |
USD-CLP | | 519.5500 | | 461.9820 | | 12.5 | % | 499.7680 | | 3.8 | % |
USD-MXN | | 13.9357 | | 12.3401 | | 12.9 | % | 13.0914 | | 6.1 | % |
The Company entered into forward contracts to economically hedge against the risk of an increase in the value of the Brazilian Real versus the United States Dollar. Currency contracts totaling 924.3million Reais at an average rate of 2.06 Real to the United States Dollar have been designated against forecast Reais denominated expenditures as a hedge against the variability of the United States dollar amount of those expenditures caused by changes in the currency exchange rates for 2011 through to 2014.
The Company also entered into forward contracts to economically hedge against the risk of an increase in the value of the Mexican Pesos versus the United States Dollar. Currency contracts totaling 464.5 million Pesos at an average rate of 13.32 Pesos to the United States Dollar have been designated against forecast Pesos denominated expenditures as a hedge against the variability of the United States dollar amount of those expenditures caused by changes in the currency exchange rates for 2011 through to 2015.
42
The currency hedge has been accounted for as a cash flow hedge with the effective portion taken to other comprehensive income and the ineffective portion taken to income.
The following table summarizes the details of the currency hedging program as at December 31, 2011:
(Quantities in thousands)
| | Brazilian Real | | Mexican Peso | |
Year of Settlement | | Brazilian
Real
Notional
Amount | | Weighted
Average
Contract
Rate | | Market
rate as at
December
31, 2011 | | Year of
Settlement | | Mexican
Peso
Notional
Amount | | Contract
Fixed
Rate | | Market
rate as at
December
31, 2011 | |
2012 | | 309,344 | | 2.1917 | | 1.8758 | | 2012 | | 87,500 | | 13.3200 | | 13.9357 | |
2013 | | 292,032 | | 2.0260 | | 1.8758 | | 2013 | | 156,000 | | 13.3200 | | 13.9357 | |
2014 | | 322,800 | | 1.9877 | | 1.8758 | | 2014 | | 156,000 | | 13.3200 | | 13.9357 | |
2015 | | — | | — | | — | | 2015 | | 65,000 | | 13.3200 | | 13.9357 | |
| | 924,176 | | 2.0643 | | 1.8758 | | | | 464,500 | | 13.3200 | | 13.9357 | |
Interest Rate Risk
The Company is exposed to interest rate risk on its variable rate debt. Monetary policy by central banks in the countries in which the Company operates have maintained interest rates relatively low to avoid a relapse of the credit crisis and incentivize economic growth.
As at December 31, 2011, the Company has a total of $63.2 million in interest rate swap agreements to convert floating rate financing to fixed rate financing effective until 2012. These contracts fix the rate of interest on the Company’s long-term debt at 4.36%. The interest rate hedge has been accounted for as cash flow hedge with the effective portion of changes in the fair value of the interest rate swaps being recorded in Other Comprehensive Income until the forecast interest expense impacts earnings. The ineffective portion of changes in the fair value of the interest rate swaps has been recorded in current earnings.
At December 31, 2011, the Company’s long-term debt was carried at fixed rates, hence there is no market risk arising from fluctuations in floating interest rate.
Credit Risk
Credit risk is the risk that a third party might fail to fulfill its performance obligations under the terms of a financial instrument. For cash, cash equivalents and accounts receivable, credit risk is represented by the carrying amount on the balance sheet. For derivatives, the Company assumes no credit risk when the fair value of the instruments is negative. When the fair value of the instruments is positive, this is a reasonable measure of credit risk. The Company limits credit risk by entering into business arrangements with high credit-quality counterparties, limiting the amount of exposure to each counterparty and monitoring the financial condition of counterparties.
Liquidity Risk
Liquidity risk is the risk that an entity will encounter difficulty in meeting obligations associated with financial liabilities that are settled by delivering cash or another financial asset. Under the terms of our trading agreements, counterparties cannot require the Company to immediately settle outstanding derivatives except upon the occurrence of customary events of default. The Company mitigates liquidity risk through the implementation of its Capital Management Policy by spreading the maturity dates of derivatives over time, managing its capital expenditures and operation cash flows, and by maintaining adequate lines of credit.
Investment Risk
Investment risk is the risk that a financial instrument’s value will deviate from the expected returns as a result of changes in market conditions, whether those changes are caused by factors specific to the individual investment or factors affecting all investments traded in the market. Although the factors that affect investment risk are outside the Company’s control, the Company mitigates investment risk by limiting its investment exposure in terms of total funds to be invested and by being selective of high quality investments.
43
Foreign Operations and Political Risk
The Company holds mining and exploration properties in Brazil, Argentina, Chile, Mexico and Colombia exposing it to the socioeconomic conditions as well as the laws governing the mining industry in those countries. Inherent risks with conducting foreign operations include, but are not limited to, high rates of inflation; military repression; war or civil war; social and labour unrest; organized crime and hostage taking which cannot be timely predicted and could have a material adverse effect on the Company’s operations and profitability. The governments in those countries are currently generally supportive of the mining industry but changes in government laws and regulations including taxation, royalties, the repatriation of profits, restrictions on production, export controls, changes in taxation policies, environmental and ecological compliance, expropriation of property and shifts in the political stability of the country could adversely affect the Company’s exploration, development and production initiatives in these countries.
Consistent with its risk management protocol, to mitigate land title risks, the Company makes no commitments and does not undertake exploration without first determining that necessary property rights are in good standing. However, despite the Company’s best efforts, land title may still be affected by undetected defects.
Health, Safety and Environmental Risk
Mining, like many other extractive natural resource industries, is subject to potential risks and liabilities due to accidents that could result in serious injury or death and or material damage to the environment and Company assets. The impact of such accidents could affect the profitability of the operations, cause an interruption to operations, lead to a loss of licenses, affect the reputation of the company and its ability to obtain further licenses, damage community relations and reduce the perceived appeal of the Company as an employer. Yamana has rigorous procedures in place to manage health and safety protocols in order to reduce the risk of occurrence and the severity of any accident and is continually investing time and resources to enhance health and safety at all operations.
The Company’s operations are subject to various laws and regulations governing the protection of the environment, exploration, development, production, exports, taxes, labour standards, occupational health, waste disposal, toxic substances, mine safety, and other matters. Permits from various governmental authorities are necessary in order to engage in mining operations in all jurisdictions in which the Company operates. Such permits relate to many aspects of mining operations, including maintenance of air, water and soil quality standards. In most jurisdictions, the requisite permits cannot be obtained prior to completion of an environmental impact statement and, in some cases, public consultation. Further, the Company may be required to submit for government approval a reclamation plan, to post financial assurance for the reclamation costs of the mine site, and to pay for the reclamation of the mine site upon the completion of mining activities. The Company mitigates this risk by performing certain reclamation activities concurrent with production.
Environmental liability may result from mining activities conducted by others prior to the Company’s ownership of a property. To the extent Yamana is subject to uninsured environmental liabilities, the payment of such liabilities would reduce funds otherwise available for business activities and could have a material adverse effect on the Company. Should the Company be unable to fully fund the cost of remedying an environmental problem, the Company might be required to suspend operations or enter into interim compliance measures pending completion of the required remedy, which may have a material adverse effect. The Company mitigates the likelihood and potential severity of these environmental risks it encounters in its day-to-day operations through the application of its high operating standards as dictated by the Yamana Management System.
The Company has insurance policies in place to cover accidents and business interruption and regularly monitors the adequacy of such policies.
Energy Risk
The Company consumes energy in mining activities, primarily in the form of diesel fuel, electricity and natural gas. As many of the Company’s mines are in remote locations and energy is generally a limited resource, the Company faces the risk that there may not be sufficient energy available to carry out mining activities efficiently or that certain sources of energy may not be available. The Company manages this risk by means of long-term electricity agreements with local power authorities and inventory control process on consumables including fuel. Many of the mines have on-site generator sets as back-up to mitigate the anticipated and unanticipated interruptions from the energy providers. Furthermore, the Company’s operations are continually improved to reduce input costs and maximize output.
44
13. CONTINGENCIES
Due to the size, complexity and nature of the Company’s operations, various legal and tax matters arise in the ordinary course of business. The Company accrues for such items when a liability is both probable and the amount can be reasonably estimated. In the opinion of management, these matters will not have a material effect on the consolidated financial statements of the Company.
In 2004, a former director of Northern Orion commenced proceedings in Argentina against Northern Orion claiming damages in the amount of $177.0 million for alleged breaches of agreements entered into by the plaintiff. The plaintiff alleged that the agreements entitled him to a pre-emption right to participate in acquisitions by Northern Orion in Argentina and claimed damages in connection with the acquisition by Northern Orion of its 12.5% equity interest in the Alumbrera project. On August 22, 2008, the National Commercial Court No. 8 of the City of Buenos Aires issued a first-instance judgement rejecting the claim. The plaintiff appealed this judgement and a decision of the appellate court is pending. While the Company continues to consider that the plaintiff’s allegations are unfounded and has been advised by its Argentine counsel that the appeal is unlikely to be successful; the outcome is not certain. There is no assurance that the Company will be wholly successful in confirming the first-instance judgement at appellate courts. There have not been any significant developments on this matter during the current year.
14. CRITICAL ACCOUNTING POLICIES AND ESTIMATES
The Company’s consolidated financial statements for the current year represent the first annual financial statements prepared in accordance with International Financial Reporting Standards (“IFRS”) as issued by the International Accounting Standards Board (“IASB”). The Company adopted IFRS in accordance with IFRS 1, “First-time Adoption of International Financial Reporting Standards” (“IFRS 1”) as discussed in Note 35, Transition to IFRS to the consolidated financial statements. The significant accounting policies applied and recent accounting pronouncements are described in Note 4 and Note 5 to the Company’s annual consolidated financial statements, respectively.
In preparing the consolidated financial statements in accordance with the IFRS, management is required to make estimates and assumptions that affect the reported amounts of assets, liabilities, revenues and expenses for the period end. Critical accounting estimates represent estimates that are uncertain and for which changes in those estimates could materially impact on the Company’s consolidated financial statements. Management reviews its estimates and assumptions on an ongoing basis using the most current information available.
a) Critical Judgements in the Application of Accounting Policies
Information about critical judgements and estimates in applying accounting policies that have most significant effect on the amounts recognized in the consolidated financial statements are as follows:
· Assets’ carrying values and impairment charges
In the determination of carrying values and impairment charges, management looks at the higher of recoverable amount or fair value less costs to sell in the case of assets and at objective evidence, significant or prolonged decline of fair value on financial assets indicating impairment. These determinations and their individual assumptions require that management make a decision based on the best available information at each reporting period. During the fourth quarter, the Company recognized an unrealized, non-cash impairment loss on certain equity investments in the amount of $81.0 million on an after-tax basis ($92.6 million on a pre-tax basis).
· Capitalization of exploration and evaluation costs
Management has determined that exploration and evaluation costs incurred during the year for the respective operating mines, Pilar and other exploration interests have future economic benefits and are economically recoverable. In making this judgement, management has assessed various sources of information including but not limited to the geologic and metallurgic information, history of conversion of mineral deposits to proven and probable mineral reserves, scoping and feasibility studies, proximity of operating facilities, operating management expertise and existing permits. During the year, the Company capitalized a total of $89.6 million (2010 - $58.6 million) of exploration expenditures.
· Determination of economic viability of a project
Management has determined that costs associated with projects under construction or developments including C1 Santa Luz, Ernesto/Pau-a-Pique, Pilar and Mercedes have future economic benefits and are economically
45
recoverable. In making this judgement, management has assessed various sources of information including but not limited to the geologic and metallurgic information, history of conversion of mineral deposits to proven and probable mineral reserves, scoping and feasibility studies, proximity of operating facilities, operating management expertise, existing permits and life of mine plans.
· Commencement of commercial/operating level production
During the determination of whether a mine has reached an operating level that is consistent with the use intended by management, costs incurred are capitalized as property, plant and equipment and any consideration from commissioning sales are offset against costs capitalized. The Company defines commencement of commercial production as the date that a mine has achieved a sustainable level of production that provides a basis for a reasonable expectation of profitability along with various qualitative factors including but not limited to the achievement of mechanical completion, whether production levels are sufficient to be at least capable of generating sustainable positive cash flow, the working effectiveness of the site refinery, whether a refining contract for the product is in place and whether the product is of sufficient quantity to be sold, whether there is a sustainable level of production input available including power, water, diesel, etc., whether the necessary permits are in place to allow continuous operations.
· Deferral of stripping costs
In determining whether stripping costs incurred during the production phase of a mining property relate to mineral reserves and mineral resources that will be mined in a future period and therefore should be capitalized, the Company determines whether it is probable that future economic benefit associated with the stripping activity will flow to the Company. As at December 31, 2011, a cumulative total of $94.2 million (2010 - $51.6 million) of stripping costs have been capitalized.
· Determination of significant influence
Management determines its ability to exercise significant influence over an investment in shares of other companies by looking at its percentage interest and other qualitative factors including but not limited to its voting rights, operating involvement, etc.
b) Key Sources of Estimation Uncertainty in the Application of Accounting Policies
Information about assumptions and estimation uncertainties that have a significant risk of resulting in a material adjustment are included in the following notes:
· Revenue recognition
Revenue from the sale of concentrate to independent smelters are recorded at the time the rights and rewards of ownership pass to the buyer using forward market prices on the expected date that final sales prices will be fixed. Variations between the prices set under the smelting contracts may be caused by changes in market prices and result in an embedded derivative in the accounts receivable. The embedded derivative is recorded at fair value each period until final settlement occurs, with changes in the fair value classified in revenue. In a period of high price volatility, as experienced under current economic conditions, the effect of mark-to-market price adjustments related to the quantity of metal which remains to be settled with independent smelters could be significant. For changes in metal quantities upon receipt of new information and assay, the provisional sales quantities are adjusted as well.
· Mineral reserve estimates
The figures for mineral reserves and mineral resources are determined in accordance with National Instrument 43-101, “Standards of Disclosure for Mineral Projects”, issued by the Canadian Securities Administrators. There are numerous uncertainties inherent in estimating mineral reserves and mineral resources, including many factors beyond the Company’s control. Such estimation is a subjective process, and the accuracy of any mineral reserve or mineral resource estimate is a function of the quantity and quality of available data and of the assumptions made and judgements used in engineering and geological interpretation. Differences between management’s assumptions including economic assumptions such as metal prices and market conditions could have a material effect in the future on the Company’s financial position and results of operation.
· Impairment of mining interests and goodwill
While assessing whether any indications of impairment exist for mining interests and goodwill, consideration is given to both external and internal sources of information. Information the Company considers include changes in the market, economic and legal environment in which the Company operates that are not within its control and affect the recoverable amount of mining interests and goodwill. Internal sources of information include the manner
46
in which property and plant and equipment are being used or are expected to be used and indications of economic performance of the assets. Estimates include but are not limited to estimates of the discounted future after-tax cash flows expected to be derived from the Company’s mining properties, costs to sell the mining properties and the appropriate discount rate. Reductions in metal price forecasts, increases in estimated future costs of production, increases in estimated future capital costs, reductions in the amount of recoverable mineral reserves and mineral resources and/or adverse current economics can result in a write-down of the carrying amounts of the Company’s mining interests and/or goodwill.
· Asset lives, depletion/depreciation rates for property, plant and equipment and mineral interests
Depreciation, depletion and amortization expenses are allocated based on assumed asset lives and depletion/depreciation/amortization rates. Should the asset life or depletion/depreciation rate differ from the initial estimate, an adjustment would be made in the statement of operations.
· Estimation of decommissioning and restoration costs and the timing of expenditure
The cost estimates are updated annually during the life of a mine to reflect known developments, (e.g. revisions to cost estimates and to the estimated lives of operations), and are subject to review at regular intervals. Decommissioning, restoration and similar liabilities are estimated based on the Company’s interpretation of current regulatory requirements, constructive obligations and are measured at fair value. Fair value is determined based on the net present value of estimated future cash expenditures for the settlement of decommissioning, restoration or similar liabilities that may occur upon decommissioning of the mine. Such estimates are subject to change based on changes in laws and regulations and negotiations with regulatory authorities.
· Income taxes and recoverability of potential deferred tax assets
In assessing the probability of realizing income tax assets recognized, management makes estimates related to expectations of future taxable income, applicable tax planning opportunities, expected timing of reversals of existing temporary differences and the likelihood that tax positions taken will be sustained upon examination by applicable tax authorities. In making its assessments, management gives additional weight to positive and negative evidence that can be objectively verified. Estimates of future taxable income are based on forecasted cash flows from operations and the application of existing tax laws in each jurisdiction. The Company considers relevant tax planning opportunities that are within the Company’s control, are feasible and within management’s ability to implement. Examination by applicable tax authorities is supported based on individual facts and circumstances of the relevant tax position examined in light of all available evidence. Where applicable tax laws and regulations are either unclear or subject to ongoing varying interpretations, it is reasonably possible that changes in these estimates can occur that materially affect the amounts of income tax assets recognized. Also, future changes in tax laws could limit the Company from realizing the tax benefits from the deferred tax assets. The Company reassesses unrecognized income tax assets at each reporting period.
· Inventory valuation
Finished goods, work-in-process, heap leach ore and stockpile ore are valued at the lower of the average production costs or net realizable value. The assumptions used in the valuation of work-in process inventories include estimates of gold contained in the ore stacked on leach pads, assumptions of the amount of gold stacked that is expected to be recovered from the leach pads, the amount of gold in the mill circuits and assumption of the gold price expected to be realized when the gold is recovered. If these estimates or assumptions prove to be inaccurate, the Company could be required to write-down the recorded value of its work-in-process inventories, which would reduce the Company’s earnings and working capital.
· Accounting for acquisitions
The fair value of assets acquired and liabilities assumed and the resulting goodwill, if any, requires that management make estimates based on the information provided by the acquiree. Changes to the provisional values of assets acquired and liabilities assumed, deferred income taxes and resulting goodwill, if any, will be retrospectively adjusted when the final measurements are determined (within one year of acquisition date).
· Contingencies
Refer to Note 33, Contingencies to the Consolidated Financial Statements.
47
15. NON-GAAP MEASURES
The Company has included certain non-GAAP measures including “Co-product cash costs per gold equivalent ounce”, “Co-product cash costs per pound of copper”, “By-product cash costs per gold equivalent ounce”, “Adjusted Earnings or Loss and Adjusted Earnings or Loss per share” to supplement its financial statements, which are presented in accordance with International Financial Reporting Standards (“IFRS”). The term IFRS and generally accepted accounting principles (“GAAP”) are used interchangeably throughout this MD&A, except that 2009 financial data is presented in accordance with previous Canadian GAAP.
The Company believes that these measures, together with measures determined in accordance with IFRS, provide investors with an improved ability to evaluate the underlying performance of the Company. Non-GAAP measures do not have any standardized meaning prescribed under IFRS, and therefore they may not be comparable to similar measures employed by other companies. The data is intended to provide additional information and should not be considered in isolation or as a substitute for measures of performance prepared in accordance with IFRS.
CO-PRODUCT AND BY-PRODUCT CASH COSTS
The Company has included cash costs per GEO and cash costs per pound of copper information because it understands that certain investors use this information to determine the Company’s ability to generate earnings and cash flows for use in investing and other activities. The Company believes that conventional measures of performance prepared in accordance with IFRS do not fully illustrate the ability of its operating mines to generate cash flows. The measures are not necessarily indicative of operating profit or cash flows from operations as determined under IFRS.
Cash costs per GEO are determined in accordance with the Gold Institute’s Production Cost Standard and are calculated on a co-product and by-product basis applying zinc and copper net revenue as a credit to the cost of gold production and as such the by-product gold equivalent ounce cash costs are impacted by realized zinc and copper prices. The GEO is determined by converting silver production to its gold equivalent using relative gold/silver metal prices of 50:1 and adding the converted silver production expressed in gold ounces to the ounces of gold production.
Cash costs on a co-product basis are computed by allocating operating cash costs separately to metals (gold and copper) based on an estimated or assumed ratio. Cash costs on a by-product basis are computed by deducting copper by-product revenues from the calculation of cash costs of production per GEO. Cash costs per GEO and per pound of copper are calculated on a weighted average basis.
Per Gold Equivalent Ounce (“GEO”)
The following tables provide a reconciliation of cost of sales per the financial statements to (i) Co-product cash costs per GEO, (ii) Co-product cash costs per pound of copper and (iii) By-product cash costs per GEO:
Reconciliation of Cost of Sales per the Financial Statements to Co-product Cash Costs per GEO
GEO | | In thousands of
United States Dollars | | United States Dollars
per gold equivalent ounce | |
For the years ended December 31, | | 2011 | | 2010 | | 2009 (iv) | | 2011 | | 2010 | | 2009 (iv) | |
Cost of sales (i) (iii) | | $ | 716,692 | | $ | 631,063 | | $ | 479,847 | | $ | 683 | | $ | 633 | | $ | 517 | |
| | | | | | | | | | | | | |
Adjustments: | | | | | | | | | | | | | |
Copper contained in concentrate related cash costs (excluding related TCRC’s) (ii) | | (188,570 | ) | (149,070 | ) | (118,322 | ) | (179 | ) | (150 | ) | (127 | ) |
Treatment and refining costs (“TCRC”) related to Chapada gold | | 4,682 | | 5,583 | | 5,862 | | 4 | | 6 | | 6 | |
Inventory movements and adjustments | | (7,056 | ) | (11,781 | ) | (18,277 | ) | (7 | ) | (11 | ) | (20 | ) |
Commercial selling costs | | (31,764 | ) | (26,511 | ) | (18,816 | ) | (30 | ) | (27 | ) | (20 | ) |
Total GEO co-product cash costs (excluding Alumbrera) | | $ | 493,984 | | $ | 449,284 | | $ | 330,294 | | $ | 471 | | $ | 451 | | $ | 356 | |
Minera Alumbrera (12.5% interest) GEO cash costs | | 12,587 | | 13,043 | | 19,667 | | 283 | | 257 | | 372 | |
Total GEO co-product cash costs (iii) | | $ | 506,571 | | $ | 462,327 | | $ | 349,961 | | $ | 463 | | $ | 442 | | $ | 357 | |
Commercial GEO produced excluding Alumbrera | | 1,049,356 | | 996,535 | | 928,097 | | | | | | | |
Commercial GEO produced including Alumbrera | | 1,093,858 | | 1,047,191 | | 980,847 | | | | | | | |
48
GEO | | In thousands of
United States Dollars | | United States Dollars
per gold equivalent
ounce | |
For the three months ended December 31, | | 2011 | | 2010 | | 2011 | | 2010 | |
Cost of sales (i) (iii) | | $ | 178,384 | | $ | 178,341 | | $ | 684 | | $ | 654 | |
| | | | | | | | | |
Adjustments: | | | | | | | | | |
Copper contained in concentrate related cash costs (excluding related TCRC’s) (ii) | | (47,214 | ) | (39,979 | ) | (181 | ) | (147 | ) |
Treatment and refining costs (“TCRC”) related to Chapada gold | | 1,259 | | 1,681 | | 5 | | 6 | |
Inventory movements and adjustments | | 2,506 | | (2,659 | ) | 10 | | (10 | ) |
Commercial selling costs | | (7,982 | ) | (7,470 | ) | (31 | ) | (27 | ) |
Total GEO co-product cash costs (excluding Alumbrera) | | $ | 126,953 | | $ | 129,914 | | $ | 487 | | $ | 476 | |
Minera Alumbrera (12.5% interest) GEO cash costs | | 3,482 | | 3,431 | | 450 | | 244 | |
Total GEO co-product cash costs (iii) | | $ | 130,435 | | $ | 133,345 | | $ | 486 | | $ | 465 | |
Commercial GEO produced excluding Alumbrera | | 260,734 | | 272,621 | | | | | |
Commercial GEO produced including Alumbrera | | 268,480 | | 286,683 | | | | | |
(i) | Cost of sales includes non-cash items including the impact of the movement in inventory. |
(ii) | Costs directly attributed to a specific metal are allocated to that metal. Costs not directly attributed to a specific metal are allocated based on relative value. As a rule of thumb, the relative value has been 80/75% copper and 20/25% gold. TCRC’s are defined as treatment and refining charges. |
(iii) | Depletion, depreciation and amortization is excluded from both total cash costs and cost of sales from continuing operations for the comparative period. |
(iv) | The financial results for periods ending prior to January 1, 2010 have not been restated in accordance with IFRS. |
49
Reconciliation of Cost of Sales per the Financial Statements to Co-product Cash Costs per Pound of Copper
Copper | | In thousands of
United States Dollars | | United States Dollars
per pound of copper | |
For the years ended December 31, | | 2011 | | 2010 | | 2009 (iv) | | 2011 | | 2010 | | 2009 (iv) | |
Cost of sales (i) (iii) | | $ | 716,692 | | $ | 631,063 | | $ | 479,847 | | $ | 4.31 | | $ | 4.23 | | $ | 3.33 | |
| | | | | | | | | | | | | |
Adjustments: | | | | | | | | | | | | | |
GEO related cash costs (excluding related TCRC’s) (ii) | | (489,302 | ) | (443,702 | ) | (324,433 | ) | (2.95 | ) | (2.97 | ) | (2.25 | ) |
Treatment and refining costs (“TCRC”) related to Chapada copper | | 26,440 | | 26,124 | | 24,555 | | 0.16 | | 0.17 | | 0.17 | |
Inventory movements and adjustments | | (7,057 | ) | (11,781 | ) | (18,277 | ) | (0.04 | ) | (0.08 | ) | (0.13 | ) |
Commercial selling costs | | (31,764 | ) | (26,511 | ) | (18,816 | ) | (0.19 | ) | (0.18 | ) | (0.13 | ) |
Total copper co-product cash costs (excluding Alumbrera) | | $ | 215,009 | | $ | 175,193 | | $ | 142,876 | | $ | 1.29 | | $ | 1.17 | | $ | 0.99 | |
Minera Alumbrera (12.5% interest) copper cash costs | | 58,534 | | 50,017 | | 59,308 | | 1.82 | | 1.29 | | 1.50 | |
Total copper co-product cash costs (iii) | | $ | 273,543 | | $ | 225,210 | | $ | 202,184 | | $ | 1.38 | | $ | 1.20 | | $ | 1.10 | |
Copper produced excluding Alumbrera (millions of lbs) | | 166.1 | | 149.4 | | 144.0 | | | | | | | |
Copper produced including Alumbrera (millions of lbs) | | 198.3 | | 188.1 | | 183.4 | | | | | | | |
Copper | | In thousands of
United States Dollars | | United States Dollars
per pound of copper | |
For the three months ended December 31, | | 2011 | | 2010 | | 2011 | | 2010 | |
Cost of sales (i) (iii) | | $ | 178,384 | | $ | 178,341 | | $ | 3.92 | | $ | 4.47 | |
| | | | | | | | | |
Adjustments: | | | | | | | | | |
GEO related cash costs (excluding related TCRC’s) (ii) | | (125,694 | ) | (128,232 | ) | (2.77 | ) | (3.21 | ) |
Treatment and refining costs (“TCRC”) related to Chapada copper | | 7,517 | | 7,814 | | 0.17 | | 0.20 | |
Inventory movements and adjustments | | 2,506 | | (2,659 | ) | 0.06 | | (0.07 | ) |
Commercial selling costs | | (7,982 | ) | (7,470 | ) | (0.18 | ) | (0.19 | ) |
Total copper co-product cash costs (excluding Alumbrera) | | $ | 54,731 | | $ | 47,794 | | $ | 1.20 | | $ | 1.20 | |
Minera Alumbrera (12.5% interest) copper cash costs | | 15,984 | | 12,654 | | 2.59 | | 1.37 | |
Total copper co-product cash costs (iii) | | $ | 70,715 | | $ | 60,448 | | $ | 1.37 | | $ | 1.23 | |
Copper produced excluding Alumbrera (millions of lbs) | | 45.4 | | 39.9 | | | | | |
Copper produced including Alumbrera (millions of lbs) | | 51.6 | | 49.2 | | | | | |
(i) | Cost of sales includes non-cash items including the impact of the movement in inventory. |
(ii) | Costs directly attributed to a specific metal are allocated to that metal. Costs not directly attributed to a specific metal are allocated based on relative value. As a rule of thumb, the relative value has been 80/75% copper and 20/25% gold. TCRC’s are defined as treatment and refining charges. |
(iii) | Depletion, depreciation and amortization is excluded from both total cash costs and cost of sales from continuing operations for the comparative period. |
(iv) | The financial results for periods ending prior to January 1, 2010 have not been restated in accordance with IFRS. |
50
Reconciliation of Cost of Sales per the Financial Statements to By-product Cash Costs per GEO
GEO | | In thousands of
United States Dollars | | United States Dollars
per gold equivalent ounce | |
For the years ended December 31, | | 2011 | | 2010 | | 2009 (ii) | | 2011 | | 2010 | | 2009 (ii) | |
Cost of sales (i) | | $ | 716,692 | | $ | 631,063 | | $ | 479,847 | | $ | 683 | | $ | 633 | | $ | 517 | |
| | | | | | | | | | | | | |
Adjustments: | | | | | | | | | | | | | |
Chapada treatment and refining costs related to gold and copper | | 31,122 | | 31,707 | | 30,417 | | 30 | | 32 | | 33 | |
Inventory movements and adjustments | | (7,057 | ) | (11,781 | ) | (18,277 | ) | (7 | ) | (12 | ) | (20 | ) |
Commercial selling costs | | (31,764 | ) | (26,511 | ) | (18,816 | ) | (30 | ) | (27 | ) | (20 | ) |
Chapada copper revenue including copper pricing adjustment | | (590,354 | ) | (500,728 | ) | (315,324 | ) | (563 | ) | (502 | ) | (340 | ) |
Total GEO by-product cash costs (excluding Alumbrera) | | $ | 118,639 | | $ | 123,750 | | $ | 157,847 | | $ | 113 | | $ | 124 | | $ | 170 | |
Minera Alumbrera (12.5% interest) by-product cash costs | | (64,434 | ) | (71,105 | ) | (37,070 | ) | (1,448 | ) | (1,404 | ) | (703 | ) |
Total GEO by-product cash costs (i) | | $ | 54,205 | | $ | 52,645 | | $ | 120,777 | | $ | 50 | | $ | 50 | | $ | 123 | |
Commercial GEO produced excluding Alumbrera | | 1,049,356 | | 996,535 | | 928,097 | | | | | | | |
Commercial GEO produced including Alumbrera | | 1,093,858 | | 1,047,191 | | 980,847 | | | | | | | |
GEO | | In thousands of
United States Dollars | | United States Dollars
per gold equivalent
ounce | |
For the three months ended December 31, | | 2011 | | 2010 | | 2011 | | 2010 | |
Cost of sales (i) | | $ | 178,384 | | $ | 178,341 | | $ | 684 | | $ | 654 | |
| | | | | | | | | |
Adjustments: | | | | | | | | | |
Chapada treatment and refining costs related to gold and copper | | 8,776 | | 9,495 | | 34 | | 35 | |
Inventory movements and adjustments | | 2,506 | | (2,659 | ) | 10 | | (10 | ) |
Commercial selling costs | | (7,982 | ) | (7,470 | ) | (30 | ) | (27 | ) |
Chapada copper revenue including copper pricing adjustment | | (124,560 | ) | (165,556 | ) | (479 | ) | (607 | ) |
Total GEO by-product cash costs (excluding Alumbrera) | | $ | 57,124 | | $ | 12,151 | | $ | 219 | | $ | 45 | |
Minera Alumbrera (12.5% interest) by-product cash costs | | (10,466 | ) | (21,881 | ) | (1,351 | ) | (1,556 | ) |
Total GEO by-product cash costs (i) | | $ | 46,658 | | $ | (9,730 | ) | $ | 174 | | $ | (34 | ) |
Commercial GEO produced excluding Alumbrera | | 260,734 | | 272,621 | | | | | |
Commercial GEO produced including Alumbrera | | 268,480 | | 286,683 | | | | | |
(i) | Depletion, depreciation and amortization is excluded from both total cash costs and cost of sales from continuing operations for the comparative period. |
(ii) | The financial results for periods ending prior to January 1, 2010 have not been restated in accordance with IFRS. |
51
ADJUSTED EARNINGS OR LOSS AND ADJUSTED EARNINGS OR LOSS PER SHARE
The Company uses the financial measures “Adjusted Earnings or Loss” and “Adjusted Earnings or Loss per share” to supplement information in its consolidated financial statements. The Company believes that in addition to conventional measures prepared in accordance with IFRS, the Company and certain investors and analysts use this information to evaluate the Company’s performance. The presentation of adjusted measures are not meant to be a substitute for net earnings or loss or net earnings or loss per share presented in accordance with IFRS, but rather should be evaluated in conjunction with such IFRS measures. Adjusted Earnings or Loss and Adjusted Earnings or Loss per share are calculated as net earnings excluding (a) share-based payments and other compensation, (b) unrealized foreign exchange (gains) losses related to revaluation of deferred income tax asset and liability on non-monetary items, (c) unrealized foreign exchange (gains) losses related to other items, (d) unrealized (gains) losses on commodity derivatives, (e) impairment losses and reversals, (f) deferred income tax expense (recovery) on the translation of foreign currency inter-corporate debt, (g) mark-to-market (gains) losses on share-purchase warrants, (h) write-down of investments and other assets and any other non-recurring adjustments. Non-recurring adjustments from unusual events or circumstances are reviewed from time to time based on materiality and the nature of the event or circumstance. Earnings adjustments for the comparative period reflect both continuing and discontinued operations.
The terms “Adjusted Earnings (Loss)” and “Adjusted Earnings (Loss) per share” do not have a standardized meaning prescribed by IFRS, and therefore the Company’s definitions are unlikely to be comparable to similar measures presented by other companies. Management believes that the presentation of Adjusted Earnings or Loss and Adjusted Earnings or Loss per share provide useful information to investors because they exclude non-cash and other charges and are a better indication of the Company’s profitability from operations. The items excluded from the computation of Adjusted Earnings or Loss and Adjusted Earnings or Loss per share, which are otherwise included in the determination of net earnings or loss and net earnings or loss per share prepared in accordance with IFRS, are items that the Company does not consider to be meaningful in evaluating the Company’s past financial performance or the future prospects and may hinder a comparison of its period-to-period profitability. Reconciliations of Adjusted Earnings to net earnings are provided in Section 5 “Overview of Annual Results” and Section 6 “Overview of Quarterly Results” for both the yearly and quarterly reconciliations, respectively.
ADDITIONAL GAAP MEASURES
The Company uses other financial measures the presentation of which is not meant to be a substitute for other subtotals or totals presented in accordance with IFRS, but rather should be evaluated in conjunction with such IFRS measures. The following other financial measures are used:
· Gross margin - represents the amount of revenues in excess of cost of sales excluding depletion, depreciation and amortization.
· Mine operating earnings - represents the amount of revenues in excess of cost of sales excluding depletion, depreciation and amortization and depletion, depreciation and amortization.
· Operating earnings - represents the amount of earnings before net finance income/expense and income tax expense.
· Cash flows generated from operations before changes in non-cash working capital - excludes the non-cash movement from period-to-period in working capital items including accounts receivable, advances and deposits, inventory, accounts payable and accrued liabilities.
The terms described above do not have a standardized meaning prescribed by IFRS, and therefore the Company’s definitions are unlikely to be comparable to similar measures presented by other companies. The Company’s management believes that their presentation provides useful information to investors because gross margin excludes the non-cash operating cost item (i.e. depreciation, depletion and amortization), Cash flows generated from operations before changes in non-cash working capital excludes the non-cash movement in working capital items, mine operating earnings excludes expenses not directly associate with commercial production and operating earnings excludes finance and tax related expenses and income/recoveries. These, in management’s view, provide useful information of the Company’s cash flows from operations and are considered to be meaningful in evaluating the Company’s past financial performance or the future prospects.
52
16. SELECTED QUARTERLY FINANCIAL AND OPERATING SUMMARY
| | December
31, | | September
30, | | June 30, | | March 31, | |
(in thousands of United States Dollars, unless otherwise noted) | | 2011 | | 2011 | | 2011 | | 2011 | |
Financial results (i) | | | | | | | | | |
Revenues (ii) | | $ | 568,754 | | $ | 555,211 | | $ | 573,283 | | $ | 476,077 | |
Mine operating earnings | | $ | 296,759 | | $ | 272,163 | | $ | 292,488 | | $ | 238,464 | |
Net earnings | | $ | 89,599 | | $ | 115,766 | | $ | 194,681 | | $ | 148,248 | |
Adjusted earnings (iii) | | $ | 184,242 | | $ | 190,265 | | $ | 186,181 | | $ | 152,208 | |
Cash flows from operating activities of continuing operations | | $ | 338,850 | | $ | 342,268 | | $ | 315,766 | | $ | 228,898 | |
Cash flows generated from operations before changes in non-cash working capital items (iii) | | $ | 320,434 | | $ | 330,522 | | $ | 331,038 | | $ | 284,379 | |
Cash flows to investing activities of continuing operations | | $ | (315,505 | ) | $ | (213,409 | ) | $ | (207,716 | ) | $ | (109,445 | ) |
Cash flows (to) from financing activities of continuing operations | | $ | (38,415 | ) | $ | (57,848 | ) | $ | (53,528 | ) | $ | 7,113 | |
| | | | | | | | | |
Per share financial results | | | | | | | | | |
Earnings per share | | | | | | | | | |
Basic | | $ | 0.12 | | $ | 0.16 | | $ | 0.26 | | $ | 0.20 | |
Diluted | | $ | 0.12 | | $ | 0.16 | | $ | 0.26 | | $ | 0.20 | |
| | | | | | | | | |
Adjusted earnings per share (iii) | | | | | | | | | |
Basic | | $ | 0.25 | | $ | 0.26 | | $ | 0.25 | | $ | 0.21 | |
Diluted | | $ | 0.25 | | $ | 0.26 | | $ | 0.25 | | $ | 0.21 | |
| | | | | | | | | |
Financial Position | | | | | | | | | |
Cash and cash equivalents | | $ | 550,438 | | $ | 570,489 | | $ | 520,863 | | $ | 460,430 | |
Total assets | | $ | 10,769,940 | | $ | 10,552,031 | | $ | 10,588,801 | | $ | 10,419,977 | |
Total long-term liabilities | | $ | 2,783,786 | | $ | 2,794,993 | | $ | 2,835,027 | | $ | 2,854,474 | |
| | | | | | | | | |
Production | | | | | | | | | |
Commercial GEO - continuing operations (iv) | | 268,480 | | 279,274 | | 278,737 | | 267,368 | |
Commissioning GEO produced - continuing operations (iv)(v) | | 8,438 | | — | | — | | — | |
Total GEO produced (iv) | | 276,918 | | 279,274 | | 278,737 | | 267,368 | |
| | | | | | | | | |
By-product cash costs per GEO produced - continuing operations, including 12.5% equity interest in Alumbrera (iii)(iv) | | $ | 174 | | $ | 94 | | $ | (80 | ) | $ | 14 | |
Co-product cash costs per GEO produced - continuing operations, including 12.5% equity interest in Alumbrera (iii)(iv) | | $ | 486 | | $ | 468 | | $ | 451 | | $ | 449 | |
| | | | | | | | | |
Chapada concentrate production (tonnes) | | 81,396 | | 74,312 | | 72,350 | | 69,236 | |
Chapada copper contained in concentrate production (millions of lbs) | | 45.4 | | 41.4 | | 40.8 | | 38.5 | |
Chapada co-product cash costs per pound of copper | | $ | 1.20 | | $ | 1.45 | | $ | 1.32 | | $ | 1.21 | |
| | | | | | | | | |
Alumbrera (12.5% interest) concentrate production (tonnes) | | 10,691 | | 16,337 | | 16,123 | | 12,690 | |
Alumbrera (12.5% interest) attributable copper contained in concentrate production (millions of lbs) | | 6.2 | | 9.5 | | 9.3 | | 7.1 | |
Alumbrera co-product cash costs per lb of copper (iii) | | 2.59 | | 1.58 | | 1.54 | | 1.85 | |
| | | | | | | | | |
Gold Equivalent Ounces Breakdown - Continuing Operations | | | | | | | | | |
Total gold ounces produced | | 231,670 | | 230,986 | | 232,138 | | 221,489 | |
Silver ounces produced (millions of ounces) | | 2.3 | | 2.4 | | 2.3 | | 2.3 | |
| | | | | | | | | |
Sales | | | | | | | | | |
Total gold sales (ounces) | | 228,539 | | 226,157 | | 232,743 | | 219,547 | |
| | | | | | | | | |
Chapada concentrate sales (tonnes) | | 81,436 | | 73,417 | | 80,330 | | 57,909 | |
Chapada payable copper contained in concentrate sales (millions of lbs) | | 43.6 | | 38.7 | | 41.6 | | 29.7 | |
Silver sales (millions of ounces) | | 2.2 | | 2.6 | | 2.1 | | 2.3 | |
Average realized gold price per ounce (ii) | | $ | 1,670 | | $ | 1,697 | | $ | 1,509 | | $ | 1,387 | |
Average realized copper price per pound (excluding derivative contracts) (ii) | | $ | 3.36 | | $ | 3.98 | | $ | 4.22 | | $ | 4.28 | |
Average realized silver price per ounce (ii) | | $ | 31.29 | | $ | 37.52 | | $ | 37.76 | | $ | 33.99 | |
53
| | December 31, | | September
30, | | June 30, | | March 31, | |
(in thousands of United States Dollars) | | 2010 | | 2010 | | 2010 | | 2010 | |
Financial results | | | | | | | | | |
Revenues (ii) | | $ | 535,130 | | $ | 453,965 | | $ | 351,375 | | $ | 346,341 | |
Mine operating earnings | | $ | 273,132 | | $ | 202,567 | | $ | 146,988 | | $ | 131,149 | |
Earnings from continuing operations | | $ | 125,569 | | $ | 141,740 | | $ | 63,665 | | $ | 124,184 | |
Net earnings | | $ | 125,569 | | $ | 139,244 | | $ | 70,138 | | $ | 131,536 | |
Adjusted earnings (iii) | | $ | 170,979 | | $ | 117,253 | | $ | 84,047 | | $ | 75,924 | |
Cash flows from operating activities of continuing operations | | $ | 250,506 | | $ | 162,281 | | $ | 127,188 | | $ | 141,356 | |
Cash flows generated from operations before changes in non-cash working capital items (iii) | | $ | 287,222 | | $ | 210,852 | | $ | 194,282 | | $ | 164,471 | |
Cash flows to investing activities of continuing operations | | $ | (147,192 | ) | $ | (133,181 | ) | $ | (56,933 | ) | $ | (123,334 | ) |
Cash flows (to) from financing activities of continuing operations | | $ | (54,199 | ) | $ | (19,532 | ) | $ | (27,362 | ) | $ | 32,223 | |
| | | | | | | | | |
Per share financial results | | | | | | | | | |
Earnings per share from continuing operations | | | | | | | | | |
Basic | | $ | 0.17 | | $ | 0.19 | | $ | 0.09 | | $ | 0.17 | |
Diluted | | $ | 0.17 | | $ | 0.19 | | $ | 0.09 | | $ | 0.17 | |
| | | | | | | | | |
Earnings per share | | | | | | | | | |
Basic | | $ | 0.17 | | $ | 0.19 | | $ | 0.09 | | $ | 0.18 | |
Diluted | | $ | 0.17 | | $ | 0.19 | | $ | 0.09 | | $ | 0.18 | |
| | | | | | | | | |
Adjusted earnings per share (iii) | | | | | | | | | |
Basic | | $ | 0.23 | | $ | 0.16 | | $ | 0.12 | | $ | 0.10 | |
Diluted | | $ | 0.23 | | $ | 0.16 | | $ | 0.12 | | $ | 0.10 | |
| | | | | | | | | |
Financial Position | | | | | | | | | |
Cash and cash equivalents | | $ | 330,498 | | $ | 279,691 | | $ | 262,223 | | $ | 221,983 | |
Total assets | | $ | 10,319,082 | | $ | 10,083,956 | | $ | 9,867,620 | | $ | 9,785,771 | |
Total long-term liabilities | | $ | 2,838,324 | | $ | 2,811,820 | | $ | 2,743,497 | | $ | 2,747,153 | |
| | | | | | | | | |
Production | | | | | | | | | |
Commercial GEO - continuing operations (iv) | | 286,682 | | 267,409 | | 253,264 | | 239,836 | |
GEO - discontinued operations (i) (iv) | | — | | — | | 10,052 | | 33,236 | |
Total GEO produced (iv) | | 286,682 | | 267,409 | | 263,316 | | 273,072 | |
| | | | | | | | | |
By-product cash costs per GEO produced - continuing operations, including 12.5% equity interest in Alumbrera (iii)(iv) | | $ | (34 | ) | $ | 58 | | $ | 103 | | $ | 86 | |
Co-product cash costs per GEO produced - continuing operations, including 12.5% equity interest in Alumbrera (iii)(iv) | | $ | 465 | | $ | 439 | | $ | 434 | | $ | 423 | |
| | | | | | | | | |
Chapada concentrate production (tonnes) | | 69,869 | | 76,808 | | 65,859 | | 51,659 | |
Chapada copper contained in concentrate production (millions of lbs) | | 39.9 | | 42.8 | | 37.0 | | 29.7 | |
Chapada co-product cash costs per pound of copper | | $ | 1.20 | | $ | 1.14 | | $ | 1.13 | | $ | 1.24 | |
| | | | | | | | | |
Alumbrera (12.5% interest) concentrate production (tonnes) | | 16,422 | | 15,487 | | 16,480 | | 19,961 | |
Alumbrera (12.5% interest) attributable copper contained in concentrate production (millions of lbs) | | 9.3 | | 8.3 | | 9.3 | | 11.8 | |
Alumbrera co-product cash costs per lb of copper (iii) | | 1.37 | | 1.53 | | 1.52 | | 0.89 | |
| | | | | | | | | |
Gold Equivalent Ounces Breakdown - Continuing Operations | | | | | | | | | |
Total gold ounces produced | | 243,407 | | 222,299 | | 208,399 | | 190,663 | |
Silver ounces produced (millions of ounces) | | 2.4 | | 2.5 | | 2.5 | | 2.7 | |
| | | | | | | | | |
Sales | | | | | | | | | |
Commercial gold sales - continuing operations (ounces) | | 234,708 | | 227,189 | | 202,559 | | 197,597 | |
Gold sales - discontinued operations (ounces) | | — | | — | | 11,268 | | 36,664 | |
Total gold sales (ounces) | | 234,708 | | 227,189 | | 213,827 | | 234,261 | |
| | | | | | | | | |
Chapada concentrate sales (tonnes) | | 74,009 | | 81,127 | | 57,895 | | 51,795 | |
Chapada payable copper contained in concentrate sales (millions of lbs) | | 39.6 | | 43.5 | | 31.6 | | 29.1 | |
Silver sales (millions of ounces) | | 2.4 | | 2.5 | | 2.6 | | 2.7 | |
Average realized gold price per ounce (ii) | | $ | 1,374 | | $ | 1,235 | | $ | 1,201 | | $ | 1,114 | |
Average realized copper price per pound (excluding derivative contracts) (ii) | | $ | 3.81 | | $ | 3.27 | | $ | 3.07 | | $ | 3.25 | |
Average realized silver price per ounce (ii) | | $ | 28.20 | | $ | 19.73 | | $ | 18.45 | | $ | 17.07 | |
54
(i) | Results of São Vicente and São Francisco mines have been reclassified as discontinued operations (in accordance with IFRS) with restatement of prior period comparatives. |
(ii) | Revenues consist of sales net of sales taxes. Revenue per ounce data is calculated based on gross sales. Realized prices reflect continuing operations. |
(iii) | A cautionary note regarding non-GAAP measures is included in Section 15 of this Management’s Discussion and Analysis of Operations and Financial Condition. |
(iv) | Silver production is treated as a gold equivalent. Gold equivalent ounce calculations are based on an assumed gold to silver ratio of 50:1, for presentation purposes only. The assumed gold to silver ratio was 55:1 for 2010 and prior periods. |
(v) | Including commissioning gold ounces from Mercedes for 2011. |
17. DISCLOSURE CONTROLS AND PROCEDURES
Disclosure controls and procedures are designed to provide reasonable assurance that all relevant information is gathered and reported to senior management, including the Company’s Chairman and Chief Executive Officer and Executive Vice President, Finance and Chief Financial Officer, on a timely basis so that appropriate decisions can be made regarding public disclosure. The Company’s system of disclosure controls and procedures includes, but is not limited to, our Timely Disclosure and Confidentiality Policy, our Code of Business Conduct and Ethics, our Insider Trading Policy and Share Dealing Code, our Whistleblower Policy, our Fraud Policy, the effective functioning of our Audit Committee and procedures in place to systematically identify matters warranting consideration of disclosure by the Audit Committee.
As at the end of the period covered by this Management’s Discussion and Analysis, management of the Company, with the participation of the Chairman and Chief Executive Officer and the Executive Vice President, Finance and Chief
55
Financial Officer, evaluated the effectiveness of the Company’s disclosure controls and procedures as required by applicable rules of the SEC and the Canadian Securities Administrators (or Canadian securities regulatory authorities). The evaluation included documentation review, enquiries and other procedures considered by management to be appropriate in the circumstances. Based on that evaluation, the Chairman and Chief Executive Officer and the Executive Vice President, Finance and Chief Financial Officer have concluded that, as of the end of the period covered by this management’s discussion and analysis, the disclosure controls and procedures (as defined in Rule 13a-15(e) under the Securities Exchange Act of 1934) were effective to provide reasonable assurance that information required to be disclosed in the Company’s annual filings and interim filings and other reports filed or submitted under applicable securities laws, is recorded, processed, summarized and reported within time periods specified by those laws and that material information is accumulated and communicated to management of the Company, including the Chairman and Chief Executive Officer and the Executive Vice President, Finance and Chief Financial Officer, as appropriate to allow timely decisions regarding required disclosure.
MANAGEMENT’S REPORT ON INTERNAL CONTROL OVER FINANCIAL REPORTING
Management of the Company is responsible for establishing and maintaining effective internal control over financial reporting as such term is defined in the rules of the United States Securities and Exchange Commission and the Canadian Securities Administrators. The Company’s internal control over financial reporting is designed to provide reasonable assurance regarding the reliability of the Company’s financial reporting for external purposes in accordance with IFRS as issued by the IASB. The Company’s internal control over financial reporting includes:
· maintaining records, that in reasonable detail, accurately and fairly reflect our transactions and dispositions of the assets of the Company;
· providing reasonable assurance that transactions are recorded as necessary for preparation of our financial statements in accordance with generally accepted accounting principles;
· providing reasonable assurance that receipts and expenditures are made in accordance with authorizations of management and the directors of the Company; and
· providing reasonable assurance that unauthorized acquisition, use or disposition of company assets that could have a material effect on the Company’s financial statements would be prevented or detected on a timely basis.
The Company’s internal control over financial reporting may not prevent or detect all misstatements because of inherent limitations. Additionally, projections of any evaluation of effectiveness to future periods are subject to the risk that controls may become inadequate because changes in conditions or deterioration in the degree of compliance with the Company’s policies and procedures.
Management assessed the effectiveness of the Company’s internal control over financial reporting as of December 31, 2011 based on the criteria set forth in Internal Control — Integrated Framework issued by the Committee of Sponsoring Organizations of the Treadway Commission (COSO). Based on this assessment, management has concluded that, as of December 31, 2011, the Company’s internal control over financial reporting is effective and no material weaknesses were identified. The Company has certified the above in its annual filings with both the U.S. Securities and Exchange Commission on Form 40-F as required by the United States Sarbanes-Oxley Act and with Canadian securities regulatory authorities.
Deloitte & Touche LLP, the Company’s Independent Registered Chartered Accountants, have audited the consolidated financial statements of the Company for the year ended December 31, 2011, and have also issued a report on the internal controls over financial reporting based on the criteria established in the Internal Control – Integrated Framework issued by the Committee of Sponsoring Organizations of the Treadway Commission.
CHANGES IN INTERNAL CONTROLS
During the period ended December 31, 2011, there has been no change in the Company’s internal control over financial reporting that has materially affected, or is reasonably likely to materially affect, the Company’s internal control over financial reporting.
LIMITATIONS OF CONTROLS AND PROCEDURES
The Company’s management, including the Chairman and Chief Executive Officer and the Executive Vice President, Finance and Chief Financial Officer, believe that any disclosure controls and procedures or internal controls over financial reporting, no matter how well conceived and operated, can provide only reasonable, not absolute, assurance that the objectives of the control system are met. Further, the design of a control system must reflect the fact that there are
56
resource constraints, and the benefits of controls must be considered relative to their costs. Because of the inherent limitations in all control systems, they cannot provide absolute assurance that all control issues and instances of fraud, if any, within the Company have been prevented or detected. These inherent limitations include the realities that judgements in decision-making can be faulty, and that breakdowns can occur because of simple error or mistake. Additionally, controls can be circumvented by the individual acts of some persons, by collusion of two or more people, or by unauthorized override of the control. The design of any systems of controls also is based in part upon certain assumptions about the likelihood of future events, and there can be no assurance that any design will succeed in achieving its stated goals under all potential future conditions. Accordingly, because of the inherent limitations in a cost effective control system, misstatements due to error or fraud may occur and not be detected.
This report provides a discussion and analysis of the financial condition and results of operations (“Management’s Discussion and Analysis”) to enable a reader to assess material changes in financial condition between December 31, 2011 and December 31, 2010 and results of operations for the periods ended December 31, 2011 and December 31, 2010.
This Management’s Discussion and Analysis has been prepared as of February 22, 2012. The audited consolidated financial statements prepared in accordance with IFRS as issued by the IASB follow this Management’s Discussion and Analysis. This Management’s Discussion and Analysis is intended to supplement and complement the audited consolidated financial statements and notes thereto as at and for the year ended December 31, 2010 (collectively the “Financial Statements”). You are encouraged to review the Financial Statements in conjunction with your review of this Management’s Discussion and Analysis. This Management’s Discussion and Analysis should be read in conjunction with both the annual audited consolidated financial statements for the year ended December 31, 2011 and the most recent Annual Information Form for the year ended December 31, 2011 on file with the Securities Commissions of all of the provinces in Canada and the 2011 Annual Report on Form 40-F on file with the United States Securities and Exchange Commission. Certain notes to the Financial Statements are specifically referred to in this Management’s Discussion and Analysis and such notes are incorporated by reference herein. All Dollar amounts in the Management’s Discussion and Analysis are in United States Dollars, unless otherwise specified.
CAUTIONARY NOTE REGARDING FORWARD-LOOKING STATEMENTS
This Management’s Discussion and Analysis contains or incorporates by reference “forward-looking statements” within the meaning of the United States Private Securities Litigation Reform Act of 1995 and “forward-looking information” under applicable Canadian securities legislation. Except for statements of historical fact relating to the Company, information contained herein constitutes forward-looking statements, including any information as to the Company’s strategy, plans or future financial or operating performance. Forward-looking statements are characterized by words such as “plan,” “expect”, “budget”, “target”, “project”, “intend”, “believe”, “anticipate”, “estimate” and other similar words, or statements that certain events or conditions “may” or “will” occur. Forward-looking statements are based on the opinions, assumptions and estimates of management considered reasonable at the date the statements are made, and are inherently subject to a variety of risks and uncertainties and other known and unknown factors that could cause actual events or results to differ materially from those projected in the forward-looking statements. These factors include the Company’s expectations in connection with the projects and exploration programs discussed herein being met, the impact of general business and economic conditions, global liquidity and credit availability on the timing of cash flows and the values of assets and liabilities based on projected future conditions, fluctuating metal prices (such as gold, copper, silver and zinc), currency exchange rates (such as the Brazilian Real, the Chilean Peso, the Argentine Peso and the Mexican Peso versus the United States Dollar), possible variations in ore grade or recovery rates, changes in the Company’s hedging program, changes in accounting policies, changes in the Company’s corporate mineral resources, risks related to non-core mine disposition, changes in project parameters as plans continue to be refined, changes in project development, construction production and commissioning time frames, risk related to joint venture operations, the possibility of project cost overruns or unanticipated costs and expenses, higher prices for fuel, steel, power, labour and other consumables contributing to higher costs and general risks of the mining industry, failure of plant, equipment or processes to operate as anticipated, unexpected changes in mine life, final pricing for concentrate sales, unanticipated results of future studies, seasonality and unanticipated weather changes, costs and timing of the development of new deposits, success of exploration activities, permitting time lines, government regulation of mining operations, environmental risks, unanticipated reclamation expenses, title disputes or claims, limitations on insurance coverage and timing and possible outcome of pending litigation and labour disputes, as well as those risk factors discussed or referred to in the Company’s annual Management’s Discussion and Analysis and Annual Information Form for the year ended December 31, 2011 filed with the securities regulatory authorities in all provinces of Canada and available at www.sedar.com, and the Company’s
57
Annual Report on Form 40-F filed with the United States Securities and Exchange Commission. Although the Company has attempted to identify important factors that could cause actual actions, events or results to differ materially from those described in forward-looking statements, there may be other factors that cause actions, events or results not to be anticipated, estimated or intended. There can be no assurance that forward-looking statements will prove to be accurate, as actual results and future events could differ materially from those anticipated in such statements. The Company undertakes no obligation to update forward-looking statements if circumstances or management’s estimates, assumptions or opinions should change, except as required by applicable law. The reader is cautioned not to place undue reliance on forward-looking statements. The forward-looking information contained herein is presented for the purpose of assisting investors in understanding the Company’s expected financial and operational performance and results as at and for the periods ended on the dates presented in the Company’s plans and objectives and may not be appropriate for other purposes.
CAUTIONARY NOTE TO UNITED STATES INVESTORS CONCERNING ESTIMATES OF MEASURED, INDICATED AND INFERRED MINERAL RESOURCES
This Management’s Discussion and Analysis uses the terms “Measured”, “Indicated” and “Inferred” Mineral Resources. United States investors are advised that while such terms are recognized and required by Canadian regulations, the United States Securities and Exchange Commission does not recognize them. “Inferred Mineral Resources” have a great amount of uncertainty as to their existence, and as to their economic and legal feasibility. It cannot be assumed that all or any part of an Inferred Mineral Resource will ever be upgraded to a higher category. Under Canadian rules, estimates of Inferred Mineral Resources may not form the basis of feasibility or other economic studies. United States investors are cautioned not to assume that all or any part of Measured or Indicated Mineral Resources will ever be converted into Mineral Reserves. United States investors are also cautioned not to assume that all or any part of an Inferred Mineral Resource exists, or is economically or legally mineable.
CAUTIONARY NOTE REGARDING MINERAL RESERVES AND MINERAL RESOURCES
Readers should refer to the Annual Information Form of the Company for the year ended December 31, 2011 and other continuous disclosure documents filed by the Company since January 1, 2012 available at www.sedar.com, for further information on mineral reserves and mineral resources, which is subject to the qualifications and notes set forth therein.
*************
58