Exhibit 99.1

MANAGEMENT’S DISCUSSION AND ANALYSIS OF
OPERATIONS AND FINANCIAL CONDITION
FOR THE THREE AND SIX MONTHS ENDED JUNE 30, 2012
TABLE OF CONTENTS
1: | Core Business | 1 | |
2: | Highlights | 1 | |
3: | Outlook and Strategy | 3 | |
4: | Summary of Financial and Operating Statistics | 6 | |
| 4.1: | Financial Statistics | 6 |
| 4.2: | Operating Statistics | 7 |
5: | Overview of Results | 8 | |
| 5.1: | Overview of Financial Results | 8 |
| 5.2: | Overview of Operating Results | 14 |
6: | Operating Mines | 16 | |
7: | Construction, Development and Exploration | 25 | |
8: | Liquidity, Capital Resources and Contractual Commitments | 29 | |
9: | Income Taxes | 32 | |
10: | Economic Trends, Risks and Uncertainties | 33 | |
11: | Contingencies | 38 | |
12: | Critical Accounting Policies and Estimates | 38 | |
13: | Non-GAAP Measures | 39 | |
14: | Selected Quarterly Financial and Operating Summary | 44 | |
15: | Disclosures Controls and Procedures | 46 | |
MANAGEMENT’S DISCUSSION AND ANALYSIS OF OPERATIONS AND FINANCIAL CONDITION
(All figures are in United States Dollars unless otherwise specified and are in accordance with International Financial Reporting Standards (“IFRS”) as issued by the International Accounting Standards Board (“IASB”))
Cautionary notes regarding forward-looking statements, including estimates of Measured, Indicated and Inferred Mineral Resources and regarding Mineral Reserves and Mineral Resources follow this Management’s Discussion and Analysis of Operations and Financial Condition
1. CORE BUSINESS
Yamana Gold Inc. (the “Company” or “Yamana”) is a Canadian-based gold producer engaged in gold mining and related activities including exploration, extraction, processing and reclamation. The Company has significant properties involved in gold and other precious metal production, development, exploration and land positions throughout the Americas including Brazil, Argentina, Chile, Mexico and Colombia.
The Company plans to continue to build on its current production base through existing operating mine expansions, throughput increases, development of new mines, advancement of its exploration properties and by targeting other gold consolidation opportunities with a primary focus in the Americas.
Note 34(a) Related Parties to the most recently audited Consolidated Annual Financial Statements lists Yamana’s significant subsidiaries with 100% equity interest. Yamana does not have any material off-balance sheet arrangements.
Yamana is listed on the Toronto Stock Exchange (Symbol: YRI), The New York Stock Exchange (Symbol: AUY) and The London Stock Exchange (Symbol: YAU).
2. HIGHLIGHTS
Financial
Three months ended June 30, 2012
· Revenues of $535.7 million.
· Net earnings of $42.9 million or $0.06 basic and diluted earnings per share.
· Adjusted earnings* of $134.9 million or $0.18 basic and diluted adjusted earnings per share*.
· Mine operating earnings of $239.9 million.
· Cash flows from operations after changes in non-cash working capital of $139.2 million.
· Cash flows generated from operations before changes in non-cash working capital* of $240.8 million.
· Over $1.4 billion in available funds, including cash balance of $698.9 million and unused credit facilities.
· Declared a quarterly dividend of $0.065 per share, representing an 18% increase over the second quarter dividend rate.
Six months ended June 30, 2012
· Revenues of $1.1 billion.
· Net earnings of $212.9 million or $0.29 basic and $0.28 diluted earnings per share.
· Adjusted earnings* of $319.2 million or $0.43 basic and diluted adjusted earnings per share*.
· Mine operating earnings of $520.0 million.
· Cash flows from operations after changes in non-cash working capital of $427.1 million
· Cash flows generated from operations before changes in non-cash working capital of $461.2million.
*A non-GAAP measure — Refer to Section 13
Operational
Three months ended June 30, 2012
· Total production of 288,700 gold equivalent ounces (“GEO”) for the quarter representing a 4% increase compared with the same quarter of 2011 and in line with plan for the quarter. (Note: GEO assumes gold plus the gold equivalent of silver using a ratio of 50:1)
· Attributable production from operating mines is summarized as follows:
|
| For the three months ended June 30, |
| ||
(In GEO) |
| 2012 |
| 2011 |
|
Chapada |
| 35,697 |
| 31,566 |
|
El Peñón |
| 105,245 |
| 124,118 |
|
Gualcamayo |
| 38,297 |
| 43,194 |
|
Jacobina |
| 28,005 |
| 27,806 |
|
Minera Florida |
| 23,978 |
| 25,376 |
|
Fazenda Brasileiro |
| 16,219 |
| 14,007 |
|
Mercedes |
| 28,900 |
| — |
|
Alumbrera (12.5%) |
| 12,359 |
| 12,670 |
|
Total |
| 288,700 |
| 278,737 |
|
· Production of 2.3 million silver ounces which, for presentation purposes only, is treated as GEO.
· Copper production from Chapada of 40.4 million pounds.
· Quarter-over-quarter increase in GEO production from Frazenda Brasileiro and Chapada of 16% and 13% respectively, compared with the same quarter of 2011.
· By-product cash costs of $244 per GEO*.
· Co-product cash costs of $536 per GEO*.
· Co-product cash costs of $1.34 per pound of copper* from Chapada.
· Mercedes, Mexico — production continues to ramp up after completion of commissioning in February; production in second quarter exceeded total production in the first quarter by 21%.
· Minera Florida, Chile — The tailings re-treatment plant was completed in May and ramp-up to design capacity continues. The re-treatment of tailings is designed to increase production by approximately 40,000 GEO per year for five years commencing in 2013.
Six months ended June 30, 2012
· Production of 567,530 GEO.
· Attributable production from operating mines is summarized as follows:
|
| For the six months ended June 30, |
| ||
(In GEO) |
| 2012 |
| 2011 |
|
Chapada |
| 62,063 |
| 64,958 |
|
El Peñón |
| 215,920 |
| 239,916 |
|
Jacobina |
| 58,498 |
| 58,125 |
|
Gualcamayo |
| 77,559 |
| 80,791 |
|
Minera Florida |
| 48,682 |
| 53,011 |
|
Fazenda Brasileiro |
| 30,278 |
| 25,259 |
|
Mercedes (including commissioning production) |
| 52,854 |
| — |
|
Alumbrera (12.5%) |
| 21,676 |
| 24,045 |
|
Total |
| 567,530 |
| 546,105 |
|
· Production of 4.5 million silver ounces which, for presentation purposes only, is treated as GEO.
· Copper production from Chapada of 70.7 million pounds.
· By-product cash costs of $265 per GEO.
· Co-product cash costs of $528 per GEO*.
· Co-product cash costs of $1.41 per pound of copper* from Chapada.
*A non-GAAP measure — Refer to Section 13
Construction, Development and Exploration
· Construction Projects - Construction is progressing to planned start-up of operations with C1 Santa Luz and Ernesto/Pau-a-Pique scheduled for completion by the end of 2012. Physical advancement for the projects is approximately 89% and 92% complete, respectively. Physical advancement of Pilar is approximately 53% complete with planned start-up for mid-2013.
· Jeronimo, Chile — Results from the feasibility study indicate production of approximately 175,000 ounces per year for the first four years and a mine life of 11 years. Discussions have begun with joint venture partner, Codelco (43% owner of the project), on the feasibility study, possible optimizations and advancing the project toward a construction decision.
· El Peñón, Chile — A new vein has been discovered approximately 300 metres east of Fortuna and a new zone of significant mineralization has been identified south of the main Dorada vein and to the west between Dorada and Providencia. Drilling has delineated a new high grade deposit at the Elizabeth vein located 400 metres east of Victoria within Pampa Augusta Victoria. This will significantly extend mine life and further enhance production at, or above, a 440,000 ounce sustainable production level.
· Chapada, Brazil — Mineralization has now been identified along a strike length of almost 16 kilometres with the discovery of significant gold and copper mineralization encountered approximately 2,500 metres south of Corpo Sul. This will potentially enhance throughput through the blending of these higher grade ores and allow further development in size and scale to result in an entirely new mine. Additional concessions along strike to the south were acquired providing further regional upside potential.
· Mercedes, Mexico — New discovery at Barrancas where drilling has intersected mineralization approximately 600 metres north of Lagunas Norte. Infill drilling at Lupita is confirming the width and grades of mineralization and continuing growth of measured and indicated mineral resources. These are expected to enhance the mineral resource base, extend mine life and facilitate higher throughput and sustainable production levels.
· Pilar, Brazil — Maria Lazarus, located 10 kilometres west of Jordino, has returned drill results similar to Jordino in both grade and width. Drilling two kilometres south east of Jordino intersected coarse visible gold, indicating that the system is open in that direction. These discoveries continue to confirm a cluster of mineralized zones and represent possible ore sources for production at Pilar.
· Business Development - During the quarter ended June 30, 2012, the Company announced the proposed acquisition of Extorre Gold Mines Limited, owner of the Cerro Moro property in Argentina, and completed the acquisitions of other mining properties, including the Picacho property in Mexico near the Mercedes Mine as well as additional mining rights near the Chapada Mine in Brazil.
3. OUTLOOK AND STRATEGY
The Company is focused on operational predictability and reliability with a concentrated effort in increasing cash flows, containing costs and expanding margins to maximize shareholder value. The Company continues on a steady path of organic growth through expanding current, near-term and in-development production plans, developing new projects and advancing its exploration properties. The Company sometimes complements its growth strategy by adding properties and projects with high development potential and economic upside through strategic acquisitions.
Production in 2012 is expected to be in the range of 1.2 to 1.3 million GEO. This will represent an increase from 2011 production of approximately 13%, most of which will come from Mercedes as production ramps up having completed commissioning. C1 Santa Luz and Ernesto/Pau-a-Pique are also expected to start production by the end of 2012.
Production in 2013 is expected, to be in the range of 1.5 to 1.7 million GEO, most of which will come from a full year of production from C1 Santa Luz and Ernesto/Pau-a-Pique, the start-up of Pilar, the processing of tailings at Minera Florida and the expansion of Gualcamayo.
A summary of the Company’s development stage projects is provided below:
|
| Expected Average Annual Contribution |
| Expected Start-date |
|
C1 Santa Luz (i) |
| 100,000 gold ounces |
| Late-2012 |
|
Ernesto/Pau-a-Pique (i) |
| 100,000 gold ounces |
| Late-2012 |
|
Pilar |
| 140,000-150,000 gold ounces |
| Mid-2013 |
|
(i) In the first two full years of production at C1 Santa Luz, average annual production is expected to exceed 130,000 ounces of gold and at Ernesto/Pau-a-Pique average annual production in the first two years is expected to be approximately 120,000 ounces of gold which would accelerate pay-back.
Silver production is expected to be consistent at between 8 to 9 million ounces in each of 2012 and 2013. Silver production is reported as a gold equivalent using a ratio of 50:1.
Copper production is expected to be in the range of 140 to 155 million pounds in 2012 and 120 to 135 million pounds in 2013. These estimates reflect the production from Chapada and do not include the attributable production from the Company’s 12.5% interest in Alumbrera.
By 2014, production is targeted to be at a sustainable level of approximately 1.75 million GEO. This includes production from the existing mines and development projects for which construction decisions have been made. Planned sustainable production of over 1.75 million GEO in 2014 and thereafter will be achievable in part due to the following opportunities:
· Development plan for Chapada to incorporate Corpo Sul and Suruca which is expected to primarily sustain current production grades and levels for both copper and gold.
· Production at El Peñón at a sustainable 440,000 GEO per year level as development work is completed at newly discovered ore bodies.
· Full ramp up of Gualcamayo’s expansions to be completed mid-2013, which should increase sustainable production to over 200,000 gold ounces per year beginning in 2014.
· Possibility of milling higher grade ore at Gualcamayo subject to mineral resource increases into 2012 and 2013, in relation to which a scoping study is expected to be completed in 2012.
· Development of higher grade areas at Jacobina increasing production to above 140,000 gold ounces per year beginning in 2014.
· Increasing Mercedes production to a sustainable level of 140,000 GEO beginning in 2014 resulting mostly from a throughput increase to up to 1,800 tonnes per day.
· Increasing Pilar production to 140,000-150,000 gold ounces beginning in 2014 mostly due to an increase in plant capacity and processing higher grade ore from nearby Caiamar.
Current exploration and early development projects will potentially add to this production level and will be included once construction decisions have been made. These projects include: Jeronimo, Agua Rica and Suyai.
Adding to the pipeline of exploration and development projects, the Company has announced the proposed acquisition of Extorre Gold Mines Limited (“Extorre”), owner of the Cerro Moro project located in the Deseado Department, Santa Cruz Province, Argentina. The acquisition of Extorre is expected to close in August 2012.
In the second quarter of 2012, the Company also acquired the Picacho property, located 65 kilometres northeast of the Company’s Mercedes Mine in Sonora, Mexico, and additional mining rights near the Chapada Mine in Brazil.
The Company is contemplating certain initiatives that will result in improved recoveries, reduced costs and/or mine life extension at various operations. These projects are currently being evaluated with final decisions pending. The most significant impact projects are at El Peñón, Chapada and Pilar.
Cash costs are expected to remain below $250 per GEO for 2012. Cash costs are calculated after only base metal by-product credits.
Development capital expected to be spent in 2012 remains to be $665 million as planned. This will decline in 2013 and the following years as the Company’s development projects are completed. Sustainment capital expenditures are expected to be $340 million in 2012 and decline on a per GEO basis after the current sustaining development projects are completed in 2014. The Company expects to spend approximately $125 million on exploration in 2012 with a continued focus on increasing mineral reserves and mineral resources with its near-mine and regional exploration programs, and exploration of greenfield targets.
In addition to over $1.4 billion of available cash and undrawn credit available at June 30, 2012, the Company expects robust cash flows from operations under the current and intermediate-term pricing conditions for gold will enable the Company to fully fund its growth, reward shareholders through dividends and accelerate capital spending to enhance the Company’s production growth profile.
4. SUMMARY OF FINANCIAL AND OPERATING STATISTICS
4.1 FINANCIAL STATISTICS
|
| Three months ended |
| Six months ended |
| ||||||||
|
| June 30, |
| June 30, |
| June 30, |
| June 30, |
| ||||
(in thousands of United States Dollars; unless otherwise noted) |
| 2012 |
| 2011 |
| 2012 |
| 2011 |
| ||||
Revenues |
| $ | 535,705 |
| $ | 573,283 |
| $ | 1,095,450 |
| $ | 1,049,360 |
|
Cost of sales excluding depletion, depreciation and amortization |
| (201,024 | ) | (191,777 | ) | (392,866 | ) | (348,879 | ) | ||||
Gross margin |
| 334,681 |
| 381,506 |
| 702,584 |
| 700,481 |
| ||||
Depletion, depreciation and amortization |
| (94,785 | ) | (89,018 | ) | (182,554 | ) | (169,529 | ) | ||||
Mine operating earnings |
| 239,896 |
| 292,488 |
| 520,030 |
| 530,952 |
| ||||
Operating earnings |
| 142,822 |
| 254,672 |
| 378,660 |
| 467,340 |
| ||||
Net finance (expense) income |
| (19,949 | ) | 5,724 |
| (31,594 | ) | (469 | ) | ||||
Earnings from operations before income taxes |
| 122,873 |
| 260,396 |
| 347,066 |
| 466,871 |
| ||||
Income tax expense |
| (79,960 | ) | (65,715 | ) | (134,128 | ) | (123,942 | ) | ||||
Net earnings |
| $ | 42,913 |
| $ | 194,681 |
| $ | 212,938 |
| $ | 342,929 |
|
Adjusted earnings (i) |
| $ | 134,887 |
| $ | 186,181 |
| $ | 319,192 |
| $ | 338,388 |
|
Earnings per share - basic |
| $ | 0.06 |
| $ | 0.26 |
| $ | 0.29 |
| $ | 0.46 |
|
Earnings per share - diluted |
| $ | 0.06 |
| $ | 0.26 |
| $ | 0.28 |
| $ | 0.46 |
|
Adjusted earnings per share (i) - basic and diluted |
| $ | 0.18 |
| $ | 0.25 |
| $ | 0.43 |
| $ | 0.46 |
|
|
|
|
|
|
|
|
|
| |||||
Cash flows from operating activities |
| $ | 139,213 |
| $ | 315,766 |
| $ | 427,114 |
| $ | 544,664 |
|
Cash flows generated from operations before changes in non-cash working capital items (i) |
| $ | 240,767 |
| $ | 331,038 |
| $ | 461,183 |
| $ | 615,417 |
|
Cash flows to investing activities |
| $ | (247,177 | ) | $ | (204,408 | ) | $ | (503,350 | ) | $ | (312,191 | ) |
Cash flows from financing activities |
| $ | (48,636 | ) | $ | (56,836 | ) | $ | 233,546 |
| $ | (51,385 | ) |
Dividends declared per share |
| $ | 0.055 |
| $ | 0.030 |
| $ | 0.110 |
| $ | 0.060 |
|
Weighted average number of common shares outstanding |
| 746,136 |
| 745,016 |
| 746,014 |
| 743,552 |
| ||||
Diluted weighted average number of common shares outstanding |
| 747,438 |
| 745,982 |
| 747,397 |
| 744,796 |
| ||||
Average realized gold price per ounce (ii) |
| $ | 1,605 |
| $ | 1,509 |
| $ | 1,651 |
| $ | 1,450 |
|
Average realized copper price per pound (ii) |
| $ | 3.60 |
| $ | 4.22 |
| $ | 3.66 |
| $ | 4.25 |
|
Average realized silver price per ounce (ii) |
| $ | 26.93 |
| $ | 37.76 |
| $ | 29.85 |
| $ | 35.78 |
|
Average market gold price per ounce (iii) |
| $ | 1,611 |
| $ | 1,509 |
| $ | 1,651 |
| $ | 1,444 |
|
Average market copper price per pound (iii) |
| $ | 3.57 |
| $ | 4.15 |
| $ | 3.67 |
| $ | 4.26 |
|
Average market silver price per ounce (iii) |
| $ | 29.42 |
| $ | 38.50 |
| $ | 31.02 |
| $ | 34.92 |
|
|
| As at |
| ||||
|
| June 30, |
| June 30, |
| ||
(in thousands of United States Dollars; unless otherwise noted) |
| 2012 |
| 2011 |
| ||
Total assets |
| $ | 11,190,392 |
| $ | 10,588,801 |
|
Total long-term liabilities |
| $ | 3,150,730 |
| $ | 2,835,027 |
|
Total equity |
| $ | 7,622,471 |
| $ | 7,362,903 |
|
Working capital |
| $ | 789,880 |
| $ | 683,274 |
|
(i) A cautionary note regarding non-GAAP measures and their respective reconciliations are included in Section 13 including a discussion and definition of Adjusted Earnings and Adjusted Earnings per Share.
(ii) Realized prices based on gross sales compared to market prices for metals may vary due to infrequent shipments and depending on timing of the sales.
(iii) Source of information: Bloomberg.
4.2 OPERATING STATISTICS
|
| Three months ended |
| Six months ended |
| ||||||||
|
| June 30, |
| June 30, |
| June 30, |
| June 30, |
| ||||
|
| 2012 |
| 2011 |
| 2012 |
| 2011 |
| ||||
Gold Equivalent Ounces (GEO) (i) |
|
|
|
|
|
|
|
|
| ||||
BRAZIL |
|
|
|
|
|
|
|
|
| ||||
Chapada (ii) |
| 35,697 |
| 31,566 |
| 62,063 |
| 64,958 |
| ||||
Jacobina |
| 28,005 |
| 27,806 |
| 58,498 |
| 58,125 |
| ||||
Fazenda Brasileiro |
| 16,219 |
| 14,007 |
| 30,278 |
| 25,259 |
| ||||
CHILE |
|
|
|
|
|
|
|
|
| ||||
El Peñón (ii) |
| 105,245 |
| 124,118 |
| 215,920 |
| 239,916 |
| ||||
Minera Florida (ii) |
| 23,978 |
| 25,376 |
| 48,682 |
| 53,011 |
| ||||
ARGENTINA |
|
|
|
|
|
|
|
|
| ||||
Gualcamayo |
| 38,297 |
| 43,194 |
| 77,559 |
| 80,791 |
| ||||
Alumbrera (iii) |
| 12,359 |
| 12,670 |
| 21,676 |
| 24,045 |
| ||||
MEXICO |
|
|
|
|
|
|
|
|
| ||||
Mercedes (ii)(v) |
| 28,900 |
| n/a |
| 43,895 |
| n/a |
| ||||
Total commercial GEO production (i) |
| 288,700 |
| 278,737 |
| 558,571 |
| 546,105 |
| ||||
Commissioning GEO - Mercedes (i)(v) |
| — |
| — |
| 8,959 |
| — |
| ||||
Total GEO production (i) |
| 288,700 |
| 278,737 |
| 567,530 |
| 546,105 |
| ||||
By-product Cash Costs per GEO (i) (iv) |
|
|
|
|
|
|
|
|
| ||||
BRAZIL |
|
|
|
|
|
|
|
|
| ||||
Chapada |
| $ | (2,207 | ) | $ | (3,555 | ) | $ | (1,895 | ) | $ | (3,071 | ) |
Jacobina |
| 735 |
| 663 |
| 699 |
| 636 |
| ||||
Fazenda Brasileiro |
| 827 |
| 934 |
| 925 |
| 949 |
| ||||
CHILE |
|
|
|
|
|
|
|
|
| ||||
El Peñón (ii) |
| 491 |
| 382 |
| 466 |
| 389 |
| ||||
Minera Florida (ii) |
| 811 |
| 614 |
| 779 |
| 542 |
| ||||
ARGENTINA |
|
|
|
|
|
|
|
|
| ||||
Gualcamayo |
| 547 |
| 399 |
| 491 |
| 449 |
| ||||
Alumbrera (iii) |
| 711 |
| (1,736 | ) | (140 | ) | (1,602 | ) | ||||
MEXICO |
|
|
|
|
|
|
|
|
| ||||
Mercedes |
| 499 |
| n/a |
| 515 |
| n/a |
| ||||
By-product cash costs per GEO produced (i) (iv) |
| $ | 244 |
| $ | (80 | ) | $ | 265 |
| $ | (34 | ) |
Co-product cash costs per GEO produced (i) (iv) |
| $ | 536 |
| $ | 451 |
| $ | 528 |
| $ | 450 |
|
Co-product cash costs per pound of copper produced (iv) |
| $ | 1.35 |
| $ | 1.36 |
| $ | 1.45 |
| $ | 1.33 |
|
Concentrate Production |
|
|
|
|
|
|
|
|
| ||||
Chapada concentrate production (tonnes) |
| 71,801 |
| 72,350 |
| 125,465 |
| 141,586 |
| ||||
Chapada copper contained in concentrate production (millions of lbs) |
| 40.4 |
| 40.8 |
| 70.7 |
| 79.2 |
| ||||
Chapada co-product cash costs per pound of copper (iv) |
| $ | 1.34 |
| $ | 1.32 |
| $ | 1.41 |
| $ | 1.26 |
|
Alumbrera attributable concentrate production (tonnes) (iii) |
| 18,492 |
| 16,123 |
| 32,641 |
| 28,813 |
| ||||
Alumbrera attributable copper contained in concentrate production (millions of lbs) (iii) |
| 10.5 |
| 9.3 |
| 18.5 |
| 16.4 |
| ||||
Alumbrera co-product cash costs per lb of copper (iii) (iv) |
| $ | 1.41 |
| $ | 1.54 |
| $ | 1.60 |
| $ | 1.67 |
|
Gold Equivalent Ounces Breakdown |
|
|
|
|
|
|
|
|
| ||||
Total gold ounces produced |
| 242,692 |
| 232,138 |
| 477,223 |
| 453,627 |
| ||||
Silver ounces produced (millions of ounces) |
| 2.3 |
| 2.3 |
| 4.5 |
| 4.6 |
| ||||
Sales |
|
|
|
|
|
|
|
|
| ||||
Total gold sales (ounces) |
| 226,521 |
| 232,743 |
| 463,512 |
| 452,290 |
| ||||
Chapada concentrate sales (tonnes) |
| 71,656 |
| 80,330 |
| 124,421 |
| 138,239 |
| ||||
Chapada payable copper contained in concentrate sales (millions of lbs) |
| 37.4 |
| 41.6 |
| 64.7 |
| 71.3 |
| ||||
Silver sales (millions of ounces) |
| 2.3 |
| 2.1 |
| 4.5 |
| 4.4 |
| ||||
(i) Silver production is treated as a gold equivalent. Gold equivalent ounce calculations are based on an average historical silver to gold ratio (50:1) which is used and presented solely for quarter-over-quarter comparative purposes only.
(ii) 2012 second quarter gold production: El Peñón — 68,275 ounces; Minera Florida — 19,179 ounces, Chapada — 33,712 ounces and Mercedes — 26,646 ounces; and silver production: El Peñón — 1.8 million ounces; Mineral Florida — 0.2 million ounces, Chapada — 0.1 million ounces and Mercedes — 0.1 million ounces.
2012 six-month gold production: El Peñón — 141,018 ounces; Minera Florida — 41,280 ounces, Chapada — 58,253 ounces and Mercedes — 40,460 ounces; and silver production: El Peñón — 3.7 million ounces; Mineral Florida — 0.4 million ounces, Chapada — 0.2 million ounces and Mercedes — 0.2 million ounces.
(iii) Alumbrera represents a 12.5% interest.
(iv) A cautionary note regarding non-GAAP measures and their respective reconciliations are included in Section 13 including a discussion and definition of Adjusted Earnings and Adjusted Earnings per Share.
(v) Commissioning was completed at Mercedes achieving commercial production effective February 1, 2012.
5. OVERVIEW OF RESULTS
5.1 OVERVIEW OF FINANCIAL RESULTS
|
| Three months ended |
| Six months ended |
| ||||||||
|
| June 30, |
| June 30, |
| June 30, |
| June 30, |
| ||||
(in thousands of United States Dollars; unless otherwise noted) |
| 2012 |
| 2011 |
| 2012 |
| 2011 |
| ||||
Revenues |
| $ | 535,705 |
| $ | 573,283 |
| $ | 1,095,450 |
| $ | 1,049,360 |
|
Cost of sales excluding depletion, depreciation and amortization |
| (201,024 | ) | (191,777 | ) | (392,866 | ) | (348,879 | ) | ||||
Gross margin |
| 334,681 |
| 381,506 |
| 702,584 |
| 700,481 |
| ||||
Depletion, depreciation and amortization |
| (94,785 | ) | (89,018 | ) | (182,554 | ) | (169,529 | ) | ||||
Mine operating earnings |
| 239,896 |
| 292,488 |
| 520,030 |
| 530,952 |
| ||||
Other expenses (i) |
| (117,931 | ) | (48,684 | ) | (184,816 | ) | (92,405 | ) | ||||
Equity earnings from associate |
| 908 |
| 16,592 |
| 11,852 |
| 28,324 |
| ||||
Earnings from operations before income taxes |
| 122,873 |
| 260,396 |
| 347,066 |
| 466,871 |
| ||||
Income tax expense |
| (79,960 | ) | (65,715 | ) | (134,128 | ) | (123,942 | ) | ||||
Net earnings |
| $ | 42,913 |
| $ | 194,681 |
| $ | 212,938 |
| $ | 342,929 |
|
Earnings adjustments (ii): |
|
|
|
|
|
|
|
|
| ||||
Non-cash unrealized foreign exchange losses (gains) on income taxes |
| 37,535 |
| (7,652 | ) | 25,593 |
| (9,145 | ) | ||||
Other non-cash unrealized foreign exchange losses |
| 11,156 |
| (10,955 | ) | 17,123 |
| (10,696 | ) | ||||
Non-cash unrealized losses (gains) on derivatives |
| (416 | ) | (27 | ) | (134 | ) | (59 | ) | ||||
Share-based payments |
| 6,494 |
| 4,427 |
| 12,328 |
| 7,270 |
| ||||
Deferred income tax expense on translation of intercompany debt |
| (4,459 | ) | 4,647 |
| (2,736 | ) | 6,898 |
| ||||
Impairment of investment in available-for-sale securities and other assets |
| 42,605 |
| — |
| 56,081 |
| — |
| ||||
Share-purchase warrant mark-to-market gain and other non-recurring losses |
| — |
| 1,389 |
| — |
| 1,512 |
| ||||
Adjusted earnings before income tax effect |
| 135,827 |
| 186,510 |
| 321,193 |
| 338,709 |
| ||||
Income tax effect of adjustments |
| (941 | ) | (329 | ) | (2,001 | ) | (321 | ) | ||||
Adjusted earnings (ii) |
| $ | 134,887 |
| $ | 186,181 |
| $ | 319,192 |
| $ | 338,388 |
|
Earnings per share - basic |
| $ | 0.06 |
| $ | 0.26 |
| $ | 0.29 |
| $ | 0.46 |
|
Earnings per share - diluted |
| $ | 0.06 |
| $ | 0.26 |
| $ | 0.28 |
| $ | 0.46 |
|
Adjusted earnings per share (ii) - basic and diluted |
| $ | 0.18 |
| $ | 0.25 |
| $ | 0.43 |
| $ | 0.46 |
|
(i) Other Expenses is the aggregate of the following expenses: general and administrative of $36.6 million for 3 months and $69.6 for 6 months (2011-$34.1 million and $61.6 million), exploration of $14.4 million for 3 months and $27.6 for 6 months (2011-$9.1 million and $15.6 million), other operating expenses of $47.0 million for 3 months and $56.0 for 6 months (2011-$11.2 million and $14.8 million) and net finance expense of $19.9 million for 3 months and $31.6 for 6 months (2011-income $5.7 million and expense $0.5 million).
(ii) A cautionary note regarding non-GAAP measures and their respective reconciliations are included in Section 13 including a discussion and definition of Adjusted Earnings and Adjusted Earnings per Share.
For the three months ended June 30, 2012
Net earnings for the quarter were $42.9 million or $0.06 per share on a basic and diluted basis, compared with net earnings of $194.7 million or basic and diluted earnings per share of $0.26 for the second quarter of 2011. In addition to the items impacting adjusted earnings discussed below, net earnings were impacted by non-cash impairment losses on available-for-sale investments and net unrealized foreign exchange losses recorded in the quarter.
Adjusted earnings were $134.9 million or $0.18 basic and diluted earnings per share in the second quarter of 2012, compared with $186.2 million or $0.25 per share in the same quarter of 2011. Lower adjusted earnings is attributed to lower metal prices, lower volumes of copper and concentrate sold and lower equity earnings from the Company’s investment in Alumbrera which although having produced 10.5 million pounds of copper attributable to Yamana during the second quarter, suspended export sales due to a new resolution in respect of repatriation of net proceeds from export sales in Argentina resulting in only 2.3 million pounds of copper sold attributable to Yamana. Subsequent to the quarter end, export sales resumed and the backlog of shipments and sales are expected to be realized during the second half of 2012.
Revenues were $535.7 million in the second quarter compared with $573.3 million in the same quarter of 2011. Mine operating earnings were $239.9 million in the quarter, compared with $292.5 million in the second quarter of 2011. Lower revenues and mine operating earnings were mainly due to lower metal prices and lower volume of copper concentrate sales, modestly offset by increased sales of gold ounces contributed by the Mercedes mine, which was under construction during the comparative period. Revenues for the quarter were generated from the sale of 268,441 GEO and 37.4 million pounds of copper, excluding Alumbrera which is accounted for as an equity investment. This compares to production excluding Alumbrera of 276,341 GEO ounces and 40.4 million pounds of copper representing a variance of almost 8,000 GEO and 3 million pounds of copper production for the quarter relative to sales. The variance is attributable to 6,000 ounces of unsold gold production that is accounted for in inventory and the remainder is non-payable gold produced in concentrate. Revenues during the quarter are highly impacted by the timing of shipments. As at June 30, 2012, the Company had a build-up of finished goods inventory of approximately 32,000 GEO and 3.9 million pounds of copper.
Market fundamentals remain firm for gold albeit the effect of a stronger US dollar negatively affected gold prices during the quarter. Average realized price of gold increased modestly, by 6%, from the second quarter of 2011, consistent with market prices. Average realized copper price was $3.60 per pound compared to the average of $4.22 per pound in the second quarter of 2011. Average realized prices for silver were $26.93 per ounce compared to $37.76 per ounce in the second quarter of 2011. Lower average realized prices for silver and copper reflect the weakening demand for these metals due to the global economic condition.
Revenues for the quarter are comprised of the following:
|
| 2012 |
| 2011 |
| ||||||||
Three months ended June 30, |
| Quantity Sold |
| Realized |
| Revenues |
| Revenues |
| ||||
Gold (i) |
| 223,279 | oz | $ | 1,605 |
| $ | 358,383 |
| $ | 332,527 |
| |
Silver |
| 2,258,101 | oz | $ | 26.93 |
| 60,820 |
| 78,456 |
| |||
Total precious metals |
| 268,441 | GEO |
|
| 419,203 |
| 410,983 |
| ||||
Copper (i) |
| 37,370,165 | lbs | $ | 3.60 |
| 134,702 |
| 175,533 |
| |||
Gross Revenues |
|
|
|
|
| $ | 553,905 |
| $ | 586,516 |
| ||
Add (deduct): |
|
|
|
|
|
|
|
|
| ||||
- | Treatment and refining charges of gold and copper concentrate |
|
|
|
|
| $ | (7,970 | ) | $ | (6,765 | ) | |
- | Sales taxes |
|
|
|
|
| (8,706 | ) | (11,502 | ) | |||
- | Metal price adjustments related to concentrate revenues |
|
|
|
|
| (2,224 | ) | 2,635 |
| |||
- | Other adjustments |
|
|
|
|
| 699 |
| 2,399 |
| |||
Revenues |
|
|
|
|
| $ | 535,705 |
| $ | 573,283 |
| ||
(i) Includes payable copper and gold contained in concentrate.
Cost of sales excluding depletion, depreciation and amortization for the quarter was $201.0 million compared with $191.8 million in the second quarter of 2011 due to higher cash costs per GEO. The following table provides a reconciliation of the co-product cash costs to the cost of sales excluding depletion, depreciation and amortization for the quarter:
|
| 2012 |
| 2011 |
| ||||||||
Three months ended June 30, |
| GEO or Pounds |
| Co-product |
| Total |
| Total |
| ||||
Chapada — (GEO) (i) |
| 35,697 | oz | $ | 302 |
| $ | 10,798 |
| $ | 10,789 |
| |
Chapada — Copper |
| 40,415,025 | lbs | 1.34 |
| 54,021 |
| 53,620 |
| ||||
El Peñón (GEO) (i) |
| 105,245 | oz | 491 |
| 51,636 |
| 47,453 |
| ||||
Jacobina |
| 28,005 | oz | 735 |
| 20,571 |
| 18,448 |
| ||||
Gualcamayo |
| 38,297 | oz | 547 |
| 20,953 |
| 17,219 |
| ||||
Minera Florida (GEO) (i) |
| 23,978 | oz | 811 |
| 19,445 |
| 15,592 |
| ||||
Fazenda Brasileiro |
| 16,219 | oz | 827 |
| 13,408 |
| 13,080 |
| ||||
Mercedes (GEO) (i) |
| 28,900 | oz | 499 |
| 14,432 |
| — |
| ||||
Co-product cash cost of sales (ii) |
|
|
|
|
| $ | 205,263 |
| $ | 176,201 |
| ||
Add (deduct): |
|
|
|
|
|
|
|
|
| ||||
- | Inventory and other non-cash adjustments |
|
|
|
|
| 1,078 |
| 14,121 |
| |||
- | Chapada concentrate treatment and refining charges |
|
|
|
|
| (7,970 | ) | (6,765 | ) | |||
- | Other commercial costs |
|
|
|
|
| 1,051 |
| 3,690 |
| |||
- | Overseas freight for Chapada concentrate |
|
|
|
|
| 4,589 |
| 4,530 |
| |||
- | Other |
|
|
|
|
| (2,987 | ) | — |
| |||
Cost of sales excluding depletion, depreciation and amortization |
|
|
|
|
| $ | 201,024 |
| $ | 191,777 |
| ||
(i) Silver ounces reported are gold equivalent ounces for El Peñón, Minera Florida, Chapada and Mercedes.
(ii) A cautionary note regarding non-GAAP measures is included in Section 13 of this Management’s Discussion and Analysis of Operations and Financial Condition.
Depletion, depreciation and amortization (“DDA”) expense for the quarter was $94.8 million, an increase from $89.0 million in the second quarter of 2011. The impact in DDA is mainly due to additional DDA from the Mercedes mine which was under construction during the comparative period and higher depreciation at the Minera Florida mine.
Other expenses as an aggregate of general and administrative, exploration, other operating and net finance expenses were $117.9 million in the three months ended June 30, 2012, compared to $48.7 million in the second quarter of 2011.
General and Administrative expenses were $36.6 million compared to $34.1 million in 2011. The increase in administrative expenses was due to the expanded administration of the Company’s growing operations including the addition of the Mercedes Mine.
Consistent with the Company’s exploration plans to pursue organic growth while continuing to build on its successful record of replacing and increasing mineral reserves and mineral resources, exploration expenses increased to $14.4 from $9.1 million incurred the comparative quarter in 2011.
Other operating expenses were $47.0 million compared to $11.2 million in the comparative quarter of 2011 due to non-cash impairment losses recognized during the period, in particular the impairment losses on available-for-sale investment accounted for $39.0 million.
Net finance expense was $19.9 million for the second quarter compared with net finance income of $5.7 million in 2011. Higher net finance expense, compared to the second quarter of 2011, was mainly due to a net unrealized foreign exchange loss of $11.2 million in the second quarter of 2012 compared to a net foreign exchange gain of $11.0 million in the comparative period. Additionally, interest expense on higher debt level and lower capitalization of borrowing cost as Mercedes completed commissioning in February also contributed to higher net finance expenses.
Equity earnings from associate were $0.9 million for the quarter compared with $16.6 million in the second quarter of 2011. Cash distributions from the Company’s equity investment in Alumbrera during the quarter were nil compared to $6.6 million in the second quarter of 2011. Export sales were suspended by Alumbrera during the quarter due to a
new resolution in respect to export revenue repatriation in Argentina. Export sales resumed in July under standard sales terms with the backlog expected to be sold in the second half of 2012 following an amendment to the original resolution extending the period for the repatriation of net export sales proceeds.
The Company recorded an income tax expense of $80.0 million for the quarter (2011: tax expense of $65.7 million). The current quarter income tax provision reflects a current income tax expense of $55.1 million (2011: tax expense $74.5 million) and a deferred income tax expense of $24.9 million (2011: deferred tax recovery $8.7). The adjusted tax rate for the second quarter of 2012 is 26.4% compared with an adjusted tax rate of 27.1% for the second quarter of 2011. The lower adjusted tax rate is a result of a lower tax rate in Chile.
Cash and cash equivalents as at June 30, 2012 were $698.9 million compared to $550.4 million as at December 31, 2011.
Cash flows generated from operations before changes in non-cash working capital items (a non-GAAP measure, see Section 13) for the quarter ended June 30, 2012 were $240.8 million compared to $331.0 million for the same period ended June 30, 2011. The decrease was due to lower earnings in the second quarter of 2012. Additionally, the Company did not receive any cash dividends from Minera Alumbrera in the second quarter of 2012 compared to $6.6 million received in the second quarter of 2011. Cash flows from operations after taking into effect changes in working capital items for the period ended June 30, 2012 were $139.2 million, compared to inflows of $315.8 million for the same period ended June 30, 2011. The decrease was mainly attributed to the increase of trade receivables related to Chapada concentrate sales and decrease of payables due to timing of payments.
The Company has over $1.4 billion in available funds to continue to invest in future growth.
For the six months ended June 30, 2012
Net earnings for the first six months were $212.9 million or $0.29 basic and $0.28 diluted earnings per share, compared with net earnings of $342.9 million or basic and diluted earnings per share of $0.46 for the same period of 2011. In addition to the items impacting adjusted earnings discussed below, net earnings were impacted by non-cash impairment losses on available-for-sale investments and net unrealized foreign exchange losses.
Adjusted earnings were $319.2 million or $0.43 basic and diluted earnings per share in the first six months of 2012, compared with $338.4 million or $0.46 per share in the same period of 2011. Lower adjusted earnings is mainly attributed to lower prices for copper and silver, lower volumes of copper and concentrate sold, partly offset by higher average realized gold prices and gold ounces sold during the period. Lower equity earnings from the Company’s investment in Alumbrera also affected net earnings for the period.
Average realized price of gold was $1,651 per ounce, consistent with market prices, compared with $1,450 per ounce for the same period in 2011. Average realized copper price was $3.66 per pound versus the average of $4.25 per pound, and average realized price for silver was $29.85 per ounce compared to $35.78 per ounce in the first half of 2011.
Revenues were $1.1 billion in the first six months compared with $1.0 billion in the same period of 2011 mainly due to an increase of realized prices for gold and increased sales of gold and silver ounces partly offset by lower sales volume of copper concentrate and lower prices for copper and silver. Mine operating earnings were $520.0 million, compared with $531.0 million in the first half of 2011.
Revenues for the six months ended June 30 are comprised of the following:
|
| 2012 |
| 2011 |
| ||||||||
Six months ended June 30, |
| Quantity |
| Realized |
| Revenues |
| Revenues |
| ||||
Gold (i) |
| 452,042 | oz | $ | 1,651 |
| $ | 746,146 |
| $ | 621,302 |
| |
Silver |
| 4,494,650 | oz | $ | 29.85 |
| 134,146 |
| 156,546 |
| |||
Total precious metals |
| 541,935 | GEO |
|
| 880,293 |
| 777,848 |
| ||||
Copper (i) |
| 64,700,238 | lbs | $ | 3.66 |
| 236,648 |
| 302,610 |
| |||
Gross Revenues |
|
|
|
|
| $ | 1,116,941 |
| $ | 1,080,458 |
| ||
Add (deduct): |
|
|
|
|
|
|
|
|
| ||||
- | Treatment and refining charges of gold and copper concentrate |
|
|
|
|
| $ | (12,755 | ) | $ | (11,950 | ) | |
- | Sales taxes |
|
|
|
|
| (18,303 | ) | (20,632 | ) | |||
- | Metal price adjustments related to concentrate revenues |
|
|
|
|
| 12,115 |
| (1,996 | ) | |||
- | Other adjustments |
|
|
|
|
| (2,548 | ) | 3,480 |
| |||
Revenues |
|
|
|
|
| $ | 1,095,450 |
| $ | 1,049,360 |
| ||
(i) Includes payable copper and gold contained in concentrate.
Cost of sales excluding depletion, depreciation and amortization for the six months was $392.9 million compared with $348.9 million in the first half of 2011 due to higher cash costs per GEO and per pound of copper. The following table provides a reconciliation of the co-product cash costs to the cost of sales excluding depletion, depreciation and amortization for the six-month period:
|
| 2012 |
| 2011 |
| ||||||||
Six months ended June 30, |
| GEO or Pounds of |
| Co-product |
| Total |
| Total |
| ||||
Chapada — (GEO) (i) |
| 62,063 | oz | $ | 322 |
| $ | 19,965 |
| $ | 20,341 |
| |
Chapada — Copper |
| 70,710,584 | lbs | 1.41 |
| 99,789 |
| 100,081 |
| ||||
El Peñón (GEO) (i) |
| 215,920 | oz | 466 |
| 100,547 |
| 93,439 |
| ||||
Jacobina |
| 58,498 | oz | 699 |
| 40,880 |
| 36,984 |
| ||||
Gualcamayo |
| 77,559 | oz | 491 |
| 38,081 |
| 36,292 |
| ||||
Minera Florida (GEO) (i) |
| 48,682 | oz | 779 |
| 37,914 |
| 28,735 |
| ||||
Fazenda Brasileiro |
| 30,278 | oz | 925 |
| 27,993 |
| 23,969 |
| ||||
Mercedes (GEO) (i) (ii) |
| 52,854 | oz | 515 |
| 27,227 |
| — |
| ||||
Co-product cash cost of sales (iii) |
|
|
|
|
| $ | 392,396 |
| $ | 339,841 |
| ||
Add (deduct): |
|
|
|
|
|
|
|
|
| ||||
- | Inventory and other non-cash adjustments |
|
|
|
|
| 3,390 |
| 5,753 |
| |||
- | Chapada concentrate treatment and refining charges |
|
|
|
|
| (12,755 | ) | (11,950 | ) | |||
- | Other commercial costs |
|
|
|
|
| 5,311 |
| 7,578 |
| |||
- | Overseas freight for Chapada concentrate |
|
|
|
|
| 7,509 |
| 7,657 |
| |||
- | Other |
|
|
|
|
| (2,985 | ) | — |
| |||
Cost of sales excluding depletion, depreciation and amortization |
|
|
|
|
| $ | 392,866 |
| $ | 348,879 |
| ||
(i) Silver ounces reported are gold equivalent ounces for El Peñón, Minera Florida, Chapada and Mercedes.
(ii) Mercedes cost of sales excluding depletion, depreciation relates to the period sales post the completion of commissioning effective February 1, 2012.
(iii) A cautionary note regarding non-GAAP measures is included in Section 13 of this Management’s Discussion and Analysis of Operations and Financial Condition.
Depletion, depreciation and amortization (“DDA”) expense for the first six months was $182.6 million, an increase from $169.5 million in the same half of 2011. The impact in DDA is mainly due to additional DDA from the Mercedes mine which was under construction during the comparative period and due to higher depreciation at the Minera Florida mine.
Other Expenses as an aggregate of general and administrative, exploration, other operating and net finance expenses were $184.8 million in the six months ended June 30, 2012, compared to $92.4 million in the first half of 2011.
General and Administrative expenses were $69.6 million compared to $61.6 million in 2011. The increase in administrative expenses was due to the expanded administration of the Company’s growing operations.
Consistent with the Company’s exploration plans to pursue organic growth while continuing to build on its successful record of replacing and increasing mineral reserves and mineral resources, exploration expenses increased to $27.6 from $15.6 million in the first half of 2011.
Other operating expenses were $56.0 compared to $14.8 million in the comparative quarter of 2011 mainly due to non-cash impairment losses recognized during the period, in particular the impairment losses on available-for-sale investment accounted for $47.4 million in the first six months of 2012.
Net finance expense was $31.6 million for the first six months compared with net finance expense of $0.5 million in 2011. Higher net finance expense, compared to the first half of 2011, was mainly due interest expense on higher debt level and lower capitalization of borrowing cost as Mercedes completed commissioning in February 2012.
Equity earnings from associate were $11.9 million for the first six months compared with $28.3 million in the same period in 2011. Cash distributions from the Company’s equity investment in Alumbrera during the period were nil compared to $27.0 million in the first half of 2011. Export sales were suspended by Alumbrera during the second quarter of 2012 due to the new resolution in respect to revenue repatriation in Argentina, however in July the resolution was refined, resulting in the resumption of export sales in July with the backlog expected to be sold in the second half of 2012.
The Company recorded an income tax expense of $134.1 million for the first six months (2011: tax expense of $123.9 million). The current period income tax provision reflected a current income tax expense of $114.8 million (2011: tax expense $128.3 million) and a deferred income tax expense of $19.3 million (2011: deferred tax recovery of $4.4). The adjusted tax rate for the first six months was 26.2% compared with an adjusted tax rate of 27.2% for the first six months of 2011. The lower tax rate was a result of a lower tax rate in Chile.
Cash flows generated from operations before changes in non-cash working capital items (a non-GAAP measure, see Section 13) for the six-month period ended June 30, 2012 were $461.2 million compared to $615.4 million for the same period ended June 30, 2011. Cash flows from operations after taking into effect changes in working capital items for the period ended June 30, 2012 were $427.1 million, compared to inflows of $544.7 million for the same period ended June 30, 2011.
5.2 OVERVIEW OF OPERATING RESULTS
For the three months ended June 30, 2012
Total production from operations was 288,700 GEO for the second quarter, including the Company’s attributable production from the Alumbrera Mine, compared with production of 278,737 GEO for the quarter ended June 30, 2011, representing a 4% quarter-to-quarter increase. The production increase was mainly due to the contribution from the Company’s new mine, Mercedes in Mexico. Production from all mines was in line with plan except for Minera Florida, where the ramp-up of the tailings re-processing plant was delayed in part due to the installation of a zinc recovery plant which is expected to further improve the cost structure through additional zinc by-product credits. Build-up of stockpiles at some of the mines continued to provide greater flexibility in respect to future production.
By-product cash costs (a non-GAAP measure, see Section 13) were $244 per GEO, compared with negative $80 per GEO in the second quarter of 2011. Cash costs were impacted by lower copper sale credits as a result of lower market prices and lower sales volume of copper pounds. The temporary suspension of export shipments at Alumbrera further compounded the issue of low copper sale credits of 39.6 million pounds of copper compared to production of 50.9 million pounds of copper that led to higher by-product cash costs in the second quarter. The average market price for copper was 14% lower than that for the second quarter of 2011. Lower grades and higher input costs during the period, primarily due to higher prices for consumables and mining inflation, have also impacted by-product and co-product cash costs.
Co-product cash costs (a non-GAAP measure, see Section 13) were $536 per GEO compared with $451 per GEO for the second quarter of 2011.
Copper production for the second quarter was 40.4 million pounds from the Chapada Mine, compared with 40.8 million pounds for the second quarter 2011. Chapada copper production was slightly lower primarily as a result of lower copper grade and recovery rate offset by higher throughput compared with the second quarter of 2011. Additionally, 10.5 million pounds of copper were produced from Alumbrera attributable to the Company, compared with 9.3 million pounds for the quarter ended June 30, 2011. Total copper production for the second quarter was 50.9 million pounds, compared with 50.1 million pounds in the same quarter of 2011.
Co-product cash costs per pound of copper (a non-GAAP measure, see Section 13) were $1.34 for the quarter from the Chapada Mine, compared with $1.32 per pound for the second quarter in 2011. Co-product cash costs per pound of copper for the quarter including the Company’s interest in the Alumbrera Mine were $1.35 per pound versus $1.36 per pound for the quarter ended June 30, 2011.
The Company anticipates average by-product cash costs for the year to be lower than $250 per GEO, in line with previous guidance. By-product cash costs are highly dependent on copper price assumptions. A downward trend in co-product cash costs is expected to result from the ramp-up of production at Mercedes, additional lower-cost production from the tailings at Minera Florida and the expected grade improvement during the year at El Peñón and at Jacobina beginning in the fourth quarter.
By-product cash-costs are also expected to improve upon the resumption of export sales and copper sale credits from Alumbrera during the second half of the year.
For the six months ended June 30, 2012
Total production from operations exceeded plan and was 567,530 GEO for the first half of the year, including production during commissioning from Mercedes and the Company’s attributable production from the Alumbrera Mine. Commercial production was 558,571 GEO, compared with commercial production of 546,105 GEO for the comparative quarter ended June 30, 2011, representing a 2% year-to-year increase. The production increase was mainly due to the contribution from the Company’s new mine, Mercedes in Mexico.
By-product cash costs (a non-GAAP measure, see Section 13) were $265 per GEO on commercial production of 558,571 GEO, compared with negative $34 per GEO in the second quarter of 2011. Cash costs for the 6-month period were impacted by lower copper sale credits as a result of lower market prices and lower sales volume of copper pounds. The average market price for copper was 14% lower than that for the first half of 2011. Lower average grades
and lower average recovery rates, higher input costs during the period primarily due to higher prices for consumables and mining inflation have also impacted by-product and co-product cash costs.
Co-product cash costs (a non-GAAP measure, see Section 13) were $528 per GEO compared with $450 per GEO for the first half of 2011.
Copper production for the first six months was 70.7 million pounds from the Chapada Mine, compared with 79.2 million pounds for the same period of 2011. Chapada copper production was lower primarily as a result of lower copper grade and recovery rate compared with the first half of 2011 and an interruption due to the ball mill overhaul in the first quarter of 2012. Copper production for the six months compared to the same period of 2011 is in line with the mine plan as a result of lower grade expected this year relative to 2011. Additionally, 18.5 million pounds of copper were produced from Alumbrera attributable to the Company, compared with 16.4 million pounds for the six months ended June 30, 2011. Total copper production for the first half was 89.2 million pounds, compared with 95.6 million pounds in the same period of 2011.
Co-product cash costs per pound of copper (a non-GAAP measure, see Section 13) were $1.41 for the first half of 2012 from the Chapada Mine, compared with $1.26 per pound for the first six months in 2011. Co-product cash costs per pound of copper for the quarter including the Company’s interest in the Alumbrera Mine were $1.45 per pound versus $1.33 per pound for the six months ended June 30, 2011.
6. OPERATING MINES
CHAPADA, BRAZIL
|
| Three months ended |
| Six months ended |
| ||||||||
|
| June 30, |
| June 30, |
| June 30, |
| June 30, |
| ||||
Operating Statistics |
| 2012 |
| 2011 |
| 2012 |
| 2011 |
| ||||
Production |
|
|
|
|
|
|
|
|
| ||||
Concentrate (tonnes) |
| 71,801 |
| 72,350 |
| 125,465 |
| 141,586 |
| ||||
GEO contained in concentrate production (ounces) (i) |
| 35,697 |
| 31,566 |
| 62,063 |
| 64,958 |
| ||||
Copper contained in concentrate (millions of pounds) |
| 40.4 |
| 40.8 |
| 70.7 |
| 79.2 |
| ||||
By-product cash costs per oz of gold produced (ii) |
| $ | (2,207 | ) | $ | (3,555 | ) | $ | (1,895 | ) | $ | (3,071 | ) |
Co-product cash costs per oz of gold produced (ii) |
| $ | 302 |
| $ | 342 |
| $ | 322 |
| $ | 313 |
|
Co-product cash costs per lb of copper produced (ii) |
| $ | 1.34 |
| $ | 1.32 |
| $ | 1.41 |
| $ | 1.26 |
|
Ore mined (tonnes) |
| 5,988,329 |
| 5,379,933 |
| 10,176,451 |
| 10,142,566 |
| ||||
Ore processed (tonnes) |
| 5,802,649 |
| 4,857,313 |
| 10,290,146 |
| 9,946,051 |
| ||||
Gold feed grade (g/t) |
| 0.30 |
| 0.32 |
| 0.29 |
| 0.32 |
| ||||
Copper feed grade (%) |
| 0.38 |
| 0.43 |
| 0.37 |
| 0.41 |
| ||||
Concentrate grade - gold (g/t) |
| 14.60 |
| 13.57 |
| 14.44 |
| 14.27 |
| ||||
Concentrate grade - copper (%) |
| 25.53 |
| 25.56 |
| 25.56 |
| 25.40 |
| ||||
Gold recovery rate (%) |
| 59.8 |
| 64.3 |
| 59.7 |
| 64.5 |
| ||||
Copper recovery rate (%) |
| 83.3 |
| 88.4 |
| 83.6 |
| 87.8 |
| ||||
Sales (iii) |
|
|
|
|
|
|
|
|
| ||||
Concentrate (tonnes) |
| 71,656 |
| 80,330 |
| 124,421 |
| 138,240 |
| ||||
Payable gold contained in concentrate (ounces) |
| 34,352 |
| 34,260 |
| 59,549 |
| 67,655 |
| ||||
Payable silver contained in concentrate (ounces) |
| 74,751 |
| 63,356 |
| 113,383 |
| 104,754 |
| ||||
Payable copper contained in concentrate (millions of pounds) |
| 37.4 |
| 41.6 |
| 64.7 |
| 71.3 |
| ||||
Depletion, depreciation and amortization per gold equivalent ounce sold |
| $ | 61 |
| $ | 66 |
| $ | 66 |
| $ | 57 |
|
Depletion, depreciation and amortization per copper pound sold |
| $ | 0.23 |
| $ | 0.22 |
| $ | 0.25 |
| $ | 0.22 |
|
(i) Silver is a marginal metal produced by the Chapada mine. It was treated as a by-product and excluded from production GEO prior to 2012. Effective January 1, 2012, silver is treated as a gold equivalent. The Company produced 99,228 ounces and 190,500 ounces of silver in the second quarter and 6-month period of 2012, respectively (second quarter of 2011: 99,467 ounces, 6 months of 2011: 195,595 ounces).
(ii) A cautionary note regarding non-GAAP measures is included in Section 13 of this Management’s Discussion and Analysis.
(iii) Quantities sold include quantity adjustment on provisional and final invoice settlements.
Chapada produced a total of 35,697 GEO contained in concentrate in the second quarter of 2012 compared with 31,566 GEO contained in concentrate in the same quarter of 2011, representing an increase of 13%. Chapada copper production was 40.4 million pounds in the quarter compared with production of 40.8 million pounds of copper in the second quarter of 2011. Gold production is expected to increase in 2013 and in the years to follow, mostly as a result of the start-up of the oxide gold operation at Suruca and the expected gold and copper production from Corpo Sul beginning in 2014.
By-product cash costs for the quarter were negative $2,207 per GEO compared with negative $3,555 per GEO for the same quarter in 2011. Lower by-product cash cost credits were due to lower copper sale credits as a result of lower market prices and lower sales volume of copper pounds. The favourable effects of higher tonnage mined and tonnage processed on by-product and co-product cash costs per GEO were partly offset by lower feed grades and lower recovery rates during the quarter compared to that of the second quarter of 2011.
Co-product cash costs were $302 per GEO in the second quarter compared with $342 per gold ounce in the same quarter of 2011. Co-product cash costs for copper were $1.34 per pound in the second quarter versus $1.32 per pound in the same quarter of 2011.
During the second quarter, production of gold, copper and concentrate increased from the first quarter of 2011, and has led to improvement in cash costs, both on a by-product and co-product basis.
Chapada revenues for the quarter net of sales taxes and treatment and refining costs were $177.7 million (2011 — $218.9 million). Revenues included mark-to-market adjustments and final and provisional pricing settlements in the quarter of negative $2.2 million (2011 — positive $2.6 million).
In December 2011, the Company completed the feasibility study and basic engineering on the oxides at Suruca. The deposit will support an additional average production of 49,000 gold ounces per year to Chapada’s operations over an initial five years beginning in 2013. Corpo Sul, a recently discovered gold and copper deposit at the southwest end of the orebody of Chapada with mineral resource of higher average grade cores especially near the current Chapada pit, is expected to enhance throughput through the blending of these higher grades ores and increase in production levels for both gold and copper in the near-term, and possibly allow further development in size and scale to potentially result in an entirely new mine, drilling results continue to support this. The mineral grades of Corpo Sul are similar to the grades of the Chapada orebody.
Production for the quarter was consistent with the mine plan, which indicated lower grades for 2012 relative to 2011. Planned production from Chapada will decline in 2012 over the 2011 levels, however, gold production is expected to increase in 2013 and in the years to follow.
The Company’s strategic plan is to ensure sustainable production from Chapada of 150,000 gold ounces and 135.0 million pounds of copper from 2013 and onwards for at least five years.
EL PEÑÓN, CHILE
|
| Three months ended |
| Six months ended |
| ||||||||
|
| June 30, |
| June 30, |
| June 30, |
| June 30, |
| ||||
Operating Statistics |
| 2012 |
| 2011 |
| 2012 |
| 2011 |
| ||||
Production |
|
|
|
|
|
|
|
|
| ||||
GEO production (ounces) |
| 105,245 |
| 124,118 |
| 215,920 |
| 239,916 |
| ||||
Gold production (ounces) |
| 68,275 |
| 80,861 |
| 141,018 |
| 154,429 |
| ||||
Silver production (ounces) |
| 1,848,501 |
| 2,162,850 |
| 3,745,105 |
| 4,274,332 |
| ||||
Cash costs per gold equivalent ounce produced (i) |
| $ | 491 |
| $ | 382 |
| $ | 466 |
| $ | 389 |
|
Ore mined (tonnes) |
| 352,273 |
| 328,545 |
| 693,335 |
| 653,403 |
| ||||
Ore processed (tonnes) |
| 355,132 |
| 362,778 |
| 690,874 |
| 720,791 |
| ||||
Gold feed grade (g/t) |
| 6.32 |
| 7.64 |
| 6.74 |
| 7.28 |
| ||||
Silver feed grade (g/t) |
| 194.34 |
| 220.24 |
| 202.9 |
| 224.0 |
| ||||
Gold recovery rate (%) |
| 94.1 |
| 93.4 |
| 93.8 |
| 92.7 |
| ||||
Silver recovery rate (%) |
| 82.5 |
| 85.1 |
| 82.7 |
| 82.5 |
| ||||
Sales |
|
|
|
|
|
|
|
|
| ||||
Gold sales (ounces) |
| 68,162 |
| 75,480 |
| 139,093 |
| 148,389 |
| ||||
Silver sales (ounces) |
| 1,835,548 |
| 2,077,499 |
| 3,689,523 |
| 4,172,197 |
| ||||
Depletion, depreciation and amortization per gold equivalent ounce sold |
| $ | 316 |
| $ | 316 |
| $ | 311 |
| $ | 312 |
|
(i) A cautionary note regarding non-GAAP measures is included in Section 13 of this Management’s Discussion and Analysis.
El Peñón produced 105,245 GEO during the second quarter of 2012 compared to 124,118 GEO in the same quarter of 2011. Production for the quarter consisted of 68,275 ounces of gold and 1.8 million ounces of silver, compared with 80,861 ounces of gold and 2.2 million ounces of silver produced in the second quarter of 2011.
Production of both gold and silver were impacted by lower feed grades, lower tonnage processed and lower silver recovery rates. The lower tonnage processed was planned in order to optimize the metallurgical recovery. Current production in the lower grade areas will allow access to higher grade areas which is expected to increase production and lower cash costs over the remainder of the year.
Cash costs were $491 per GEO in the second quarter, compared with $382 per GEO in the second quarter in 2011. Higher maintenance costs, increases in power costs, diesel and other consumables in addition to other mining inflation compared to that of the second quarter of 2011, contributed to higher per unit cash costs, which are expected to decrease as improved feed grades are planned for the balance of 2012.
Exploration has been ongoing for 20 years at El Peñón, which has a long track record of replacement of ounces mined. Exploration at Pampa Augusta Victoria is being fast tracked as part of the Company’s continuous exploration effort on high-grade areas at El Peñón. This is expected to return significant near surface gold and silver values, improve production and provide mining flexibility for a sustainable production level of about 440,000 GEO per year and ultimately increase mine life.
GUALCAMAYO, ARGENTINA
|
| Three months ended |
| Six months ended |
| ||||||||
|
| June 30, |
| June 30, |
| June 30, |
| June 30, |
| ||||
Operating Statistics |
| 2012 |
| 2011 |
| 2012 |
| 2011 |
| ||||
Production |
|
|
|
|
|
|
|
|
| ||||
Total gold production (ounces) |
| 38,297 |
| 43,194 |
| 77,559 |
| 80,791 |
| ||||
Cash costs per ounce produced (i) |
| $ | 547 |
| $ | 399 |
| $ | 491 |
| $ | 449 |
|
Ore mined (tonnes) |
| 2,431,294 |
| 1,910,723 |
| 4,501,390 |
| 3,848,072 |
| ||||
Ore processed (tonnes) |
| 1,977,398 |
| 1,882,237 |
| 4,075,402 |
| 3,778,770 |
| ||||
Gold feed Grade (g/t) |
| 0.90 |
| 1.02 |
| 0.88 |
| 0.98 |
| ||||
Gold recovery rate (%) |
| 71.6 |
| 74.4 |
| 69.8 |
| 70.4 |
| ||||
Sales |
|
|
|
|
|
|
|
|
| ||||
Gold sales (ounces) |
| 33,832 |
| 46,399 |
| 73,709 |
| 81,064 |
| ||||
Depletion, depreciation and amortization per gold ounce sold |
| $ | 383 |
| $ | 372 |
| $ | 359 |
| $ | 362 |
|
(i) A cautionary note regarding non-GAAP measures is included in Section 13 of this Management’s Discussion and Analysis.
Gualcamayo produced 38,297 ounces of gold in the second quarter compared with 43,194 ounces produced in the second quarter of 2011. Lower production was mainly due to lower feed grade and recovery rates despite increased tonnage mined and processed, hampered by the higher cells at the southern leach pad that impacted the recovery time of the materials stacked.
Cash costs were $547 per ounce in the quarter ended June 30, 2012 compared with $399 per ounce in the second quarter of 2011. Inflationary pressures on labour and consumable costs, lower grade and recovery along with increased maintenance to improve availability of equipment resulted in higher cash costs.
Subsequent to the quarter end, Gualcamayo started to place materials on the heap leach pad in Valle Norte as part of the planned expansion which is expected to improve recoveries and production in the fourth quarter. Production from Valle Norte is scheduled to start in August. Underground development of QDD Lower West continues to advance and project completion remains on schedule. Full ramp-up of Gualcamayo’s expansions to be completed by mid-2013 are expected to increase sustainable production to over 200,000 gold ounces per year beginning in 2014.
A scoping study on the evaluation of milling higher grade ore at Gualcamayo, subject to mineral resource increases into 2012 and 2013, has commenced and is expected to be completed in the first half of 2013.
JACOBINA, BRAZIL
|
| Three months ended |
| Years ended |
| ||||||||
|
| June 30, |
| June 30, |
| June 30, |
| June 30, |
| ||||
Operating Statistics |
| 2012 |
| 2011 |
| 2012 |
| 2011 |
| ||||
Production |
|
|
|
|
|
|
|
|
| ||||
Gold production (ounces) |
| 28,005 |
| 27,806 |
| 58,498 |
| 58,125 |
| ||||
Cash costs per ounce produced (i) |
| $ | 735 |
| $ | 663 |
| $ | 699 |
| $ | 636 |
|
Ore mined (tonnes) |
| 528,969 |
| 548,262 |
| 1,053,507 |
| 1,077,297 |
| ||||
Ore processed (tonnes) |
| 523,603 |
| 532,496 |
| 1,050,368 |
| 1,061,531 |
| ||||
Gold feed grade (g/t) |
| 1.75 |
| 1.74 |
| 1.84 |
| 1.82 |
| ||||
Gold recovery rate (%) |
| 95.1 |
| 93.4 |
| 94.1 |
| 93.4 |
| ||||
Sales |
|
|
|
|
|
|
|
|
| ||||
Gold sales (ounces) |
| 27,852 |
| 28,354 |
| 57,558 |
| 59,891 |
| ||||
Depletion, depreciation and amortization per gold ounce sold |
| $ | 437 |
| $ | 389 |
| $ | 401 |
| $ | 381 |
|
(i) A cautionary note regarding non-GAAP measures is included in Section 13 of this Management’s Discussion and Analysis.
Gold production at Jacobina was 28,005 ounces in the second quarter, in line with 27,806 ounces produced in the second quarter of 2011. The increase in production in the second quarter compared to that of 2011, resulted from a 2% increase in recoveries despite a decline in tonnage processed. The average ore grade for the third quarter is expected to be similar to the second quarter. However, continued development of access to higher grade areas is expected to improve average ore grade beginning in the fourth quarter.
Cash costs were $735 per ounce for the second quarter compared with $663 per ounce in the second quarter of 2011. Cash costs were impacted by higher labour inflation and maintenance costs in addition to roof support improvements made during the second quarter. Roof support improvement is a standard practice in underground mining and the intensity of such activity is dependent on the depth and rock-stress condition of the area being mined. Maintenance expenses are expected to decrease with the arrival of new equipment expected in August. The long-term cost structure is expected to be in line with the first quarter of 2012.
The Company continues to focus on upgrading the current mineral resources at Canavieiras and Morro do Vento and improving overall mineral reserve grade for the mine. Development of these high-grade areas is expected to lead to production increasing to above 140,000 gold ounces per year beginning in 2014.
MINERA FLORIDA, CHILE
|
| Three months ended |
| Six months ended |
| ||||||||
|
| June 30, |
| June 30, |
| June 30, |
| June 30, |
| ||||
Operating Statistics |
| 2012 |
| 2011 |
| 2012 |
| 2011 |
| ||||
Production |
|
|
|
|
|
|
|
|
| ||||
GEO production (ounces) |
| 23,978 |
| 25,376 |
| 48,682 |
| 53,011 |
| ||||
Gold production (ounces) |
| 19,179 |
| 22,034 |
| 41,280 |
| 46,020 |
| ||||
Silver production (ounces) |
| 239,931 |
| 167,114 |
| 370,123 |
| 349,567 |
| ||||
Cash costs per gold equivalent ounce produced (i) |
| $ | 811 |
| $ | 614 |
| $ | 779 |
| $ | 542 |
|
Ore mined (tonnes) |
| 210,154 |
| 215,164 |
| 444,936 |
| 423,556 |
| ||||
Ore processed (tonnes) |
| 224,107 |
| 238,287 |
| 453,101 |
| 470,571 |
| ||||
Gold feed grade (g/t) |
| 3.15 |
| 3.43 |
| 3.43 |
| 3.60 |
| ||||
Silver feed grade (g/t) |
| 43.31 |
| 31.77 |
| 34.17 |
| 33.44 |
| ||||
Gold recovery rate (%) |
| 80.8 |
| 83.9 |
| 81.1 |
| 84.3 |
| ||||
Silver recovery rate (%) |
| 69.6 |
| 68.0 |
| 66.0 |
| 68.4 |
| ||||
Sales |
|
|
|
|
|
|
|
|
| ||||
Gold sales (ounces) |
| 18,617 |
| 22,831 |
| 40,546 |
| 45,569 |
| ||||
Silver sales (ounces) |
| 230,613 |
| — |
| 451,863 |
| 202,985 |
| ||||
Depletion, depreciation and amortization per gold equivalent ounce sold |
| $ | 610 |
| $ | 421 |
| $ | 585 |
| $ | 397 |
|
(i) A cautionary note regarding non-GAAP measures is included in Section 13 of this Management’s Discussion and Analysis.
Minera Florida produced a total of 23,978 GEO in the quarter, compared with 25,376 GEO in the second quarter of 2011. The expected lower production was mainly a result of lower gold feed grade and recovery, and lower tonnage mined and processed.
In addition, the mine produced 1,125 tonnes of zinc in the second quarter, compared with 1,863 tonnes of zinc produced in the second quarter of 2011. Zinc is accounted for as a by-product credit to cash costs.
Cash costs for the second quarter were $811 per GEO compared with $614 per GEO in the same quarter in 2011 primarily as a result of higher cost for power, increased cost in temporary mine services and labour inflation, and lower credit from sales of zinc as a result of lower production and lower prices for zinc.
The Company’s expansion project at Minera Florida is expected to increase annual production by approximately 40,000 GEO per year for five years through the re-treatment of tailings. The tailings re-treatment plant was completed in May and ramp-up to design capacity was delayed in part due to the installation of a zinc recovery plant that was not initially contemplated. The zinc recovery plant is expected to further improve costs through the application of additional zinc by-product credits. Production from tailings re-treatment for 2012 is expected to be in the range of 12,000 to 16,000 GEO and ramp up to 40,000 GEO per year in 2013. Overall costs are expected to improve with the addition of tailings production given the lack of mining costs associated. In 2012 and years to follow, mine grade is expected to be consistent with mineral reserve grade and process efficiency will be augmented by low-cost historical tailings material.
The Company has strengthened the leadership team at the senior management level in Chile by appointing a Vice-President, Operations, in addition to a Vice-President, Country Manager, to focus on the operations in Chile and Mexico with the expansion at Minera Florida as their first priority.
Near-mine exploration at Minera Florida continues to focus on the Portezuelo, El Roble and Tribuna sectors to delineate the extension of the orebodies. Mine development has advanced as planned in areas such as Tribuna, Maqui Clavo I, which is expected to maintain and ensure future production levels.
MERCEDES, MEXICO
|
| Three months ended |
| Six months ended |
| ||||||||
|
| June 30, |
| June 30, |
| June 30, |
| June 30, |
| ||||
Operating Statistics |
| 2012 |
| 2011 (i) |
| 2012 |
| 2011 |
| ||||
Production |
|
|
|
|
|
|
|
|
| ||||
Commercial GEO production |
| 28,900 |
| — |
| 43,895 |
| — |
| ||||
Commissioning GEO production |
| — |
| — |
| 8,959 |
| — |
| ||||
Total GEO production |
| 28,900 |
| — |
| 52,854 |
| — |
| ||||
Commercial gold production (ounces) |
| 26,646 |
| — |
| 40,460 |
| — |
| ||||
Commissioning gold production (ounces) |
| — |
| — |
| 8,201 |
| — |
| ||||
Total gold production (ounces) |
| 26,646 |
| — |
| 48,661 |
| — |
| ||||
Commercial silver production (ounces) |
| 112,729 |
| — |
| 171,704 |
| — |
| ||||
Commissioning silver production (ounces) |
| — |
| — |
| 37,912 |
| — |
| ||||
Total silver production (ounces) |
| 112,729 |
| — |
| 209,616 |
| — |
| ||||
Cash costs per GEO produced (i) |
| $ | 499 |
| $ | — |
| $ | 515 |
| $ | — |
|
Ore mined (tonnes) |
| 138,577 |
| — |
| 238,771 |
| — |
| ||||
Ore processed (tonnes) |
| 151,425 |
| — |
| 287,488 |
| — |
| ||||
Gold feed grade (g/t) |
| 5.53 |
| — |
| 5.70 |
| — |
| ||||
Silver feed grade (g/t) |
| 70.63 |
| — |
| 76.78 |
| — |
| ||||
Gold recovery rate (%) |
| 94.9 |
| — |
| 94.4 |
| — |
| ||||
Silver recovery rate (%) |
| 30.8 |
| — |
| 29.7 |
| — |
| ||||
Sales |
|
|
|
|
|
|
|
|
| ||||
Gold sales (ounces) |
| 26,416 |
| — |
| 53,003 |
| — |
| ||||
Silver sales (ounces) |
| 117,189 |
| — |
| 239,881 |
| — |
| ||||
Depletion, depreciation and amortization per gold ounce sold |
| $ | 405 |
| $ | — |
| $ | 253 |
| $ | — |
|
(i) Mercedes was under construction during 2011. Commissioning of the mine started in November 2011 and completed February 1, 2012.
Mercedes produced 28,900 GEO in the second quarter, consisting of 26,646 ounces of gold and 0.1 million ounces of silver, representing increases over the first quarter production of gold by 21% and silver by 16%.
Cash costs per GEO were $499 for the second quarter, 16% lower than the cash costs in the first quarter. Cash costs are expected to trend down as production continues to ramp up, averaging approximately $475 - $500 per GEO for the year.
Development continues at the Barrancas zone with the higher grade Lagunas Norte vein, one of the newest discoveries at the mine. Development of the vein structure in the Barrancas zone was not included in the original mine plan and represents a significant opportunity to increase production. Infill drilling at Lupita is confirming the width and grades of mineralization and is expected to continue growth of the measured and indicated mineral resources that will extend mine life, maintain higher throughput and sustainable production levels.
Production is initially planned at 120,000 GEO per year although increased throughput along with the additional ore from Barrancas, and as accelerated underground development work advances during 2012, the Company expects production to increase to 125,000 — 135,000 GEO in 2013 and to a sustainable level of 140,000 GEO beginning in 2014.
OTHER MINES
The following table presents key operating data for the other continuing mining operations and investment in associate:
|
| Three months ended |
| Six months ended |
| ||||||||
|
| June 30, |
| June 30, |
| June 30, |
| June 30, |
| ||||
|
| 2012 |
| 2011 |
| 2012 |
| 2011 |
| ||||
FAZENDA BRASILEIRO, BRAZIL |
|
|
|
|
|
|
|
|
| ||||
Production |
|
|
|
|
|
|
|
|
| ||||
Gold production (ounces) |
| 16,219 |
| 14,007 |
| 30,278 |
| 25,259 |
| ||||
Cash costs per ounce produced (i) |
| $ | 827 |
| $ | 934 |
| $ | 925 |
| $ | 949 |
|
Ore mined (tonnes) |
| 256,831 |
| 247,859 |
| 505,723 |
| 463,571 |
| ||||
Ore processed (tonnes) |
| 251,430 |
| 246,551 |
| 521,722 |
| 451,940 |
| ||||
Gold feed grade (g/t) |
| 2.27 |
| 2.02 |
| 2.04 |
| 1.98 |
| ||||
Gold recovery rate (%) |
| 88.4 |
| 87.5 |
| 88.2 |
| 87.8 |
| ||||
Sales |
|
|
|
|
|
|
|
|
| ||||
Gold sales (ounces) |
| 14,048 |
| 13,052 |
| 28,585 |
| 25,943 |
| ||||
Depletion, depreciation and amortization per gold ounce sold |
| $ | 212 |
| $ | 223 |
| $ | 199 |
| $ | 238 |
|
ALUMBRERA (12.5% interest), ARGENTINA |
|
|
|
|
|
|
|
|
| ||||
Production |
|
|
|
|
|
|
|
|
| ||||
Concentrate (tonnes) |
| 18,492 |
| 16,123 |
| 32,641 |
| 28,813 |
| ||||
Gold production (ounces) |
| 877 |
| 913 |
| 1,680 |
| 1,797 |
| ||||
Gold production in concentrate (ounces) |
| 11,482 |
| 11,757 |
| 19,996 |
| 22,251 |
| ||||
Total gold produced |
| 12,359 |
| 12,670 |
| 21,676 |
| 24,045 |
| ||||
Copper contained in concentrate (millions of pounds) |
| 10.5 |
| 9.3 |
| 18.5 |
| 16.4 |
| ||||
By-product cash costs per ounce produced (i) |
| $ | 711 |
| $ | (1,736 | ) | $ | (140 | ) | $ | (1,602 | ) |
Co-product cash costs per ounce of gold produced (i) |
| $ | 284 |
| $ | 239 |
| $ | 306 |
| $ | 242 |
|
Co-product cash costs per pound of copper produced (i) |
| $ | 1.41 |
| $ | 1.54 |
| $ | 1.60 |
| $ | 1.67 |
|
Ore mined (tonnes) |
| 1,090,111 |
| 666,814 |
| 1,860,685 |
| 996,883 |
| ||||
Ore processed (tonnes) |
| 1,218,825 |
| 1,227,348 |
| 2,385,455 |
| 2,359,343 |
| ||||
Gold feed grade (g/t) |
| 0.44 |
| 0.47 |
| 0.40 |
| 0.46 |
| ||||
Copper feed grade (%) |
| 0.45 |
| 0.45 |
| 0.43 |
| 0.42 |
| ||||
Concentrate grade - gold (g/t) |
| 19.26 |
| 22.68 |
| 18.99 |
| 24.16 |
| ||||
Concentrate grade - copper (%) |
| 25.76 |
| 26.20 |
| 25.76 |
| 25.85 |
| ||||
Gold recovery rate (%) |
| 71.2 |
| 68.2 |
| 69.4 |
| 68.7 |
| ||||
Copper recovery rate (%) |
| 85.9 |
| 77.2 |
| 82.7 |
| 75.2 |
| ||||
Sales |
|
|
|
|
|
|
|
|
| ||||
Concentrate (tonnes) |
| 4,224 |
| 15,657 |
| 17,423 |
| 28,791 |
| ||||
Payable gold contained in concentrate (ounces) |
| 2,379 |
| 11,293 |
| 10,217 |
| 21,989 |
| ||||
Gold doré sales (ounces) |
| 863 |
| 1,074 |
| 1,252 |
| 1,790 |
| ||||
Total gold sales (ounces) |
| 3,242 |
| 12,367 |
| 11,469 |
| 23,779 |
| ||||
Payable copper contained in concentrate sales (millions of pounds) |
| 2.3 |
| 8.8 |
| 9.5 |
| 15.9 |
| ||||
(i) A cautionary note regarding non-GAAP measures is included in Section 13 of this Management’s Discussion and Analysis.
FAZENDA BRASILEIRO, BRAZIL
Production at Fazenda Brasileiro was 16,219 ounces of gold in the second quarter compared to 14,007 ounces of gold in the second quarter of 2011, representing a 16% quarter-over-quarter increase. The increased production was mainly due to higher gold grade and increased tonnage mined and tonnage processed.
Cash costs for the second quarter were $827 per ounce, 11% lower than $934 per ounce for the same period in 2011. Increases in tonnage mined and tonnage processed positively impacted cash costs and more than offset the effect of mining inflation.
The Fazenda Brasileiro mine was acquired in 2003 with two and a half years of mine life remaining based on known mineral reserves. The Company has since been mining at Fazenda Brasileiro for nearly nine years. The mine continues to further outline exploration potential and mineral resource additions are expected in 2012.
Two new mineralization zones, CLX2 and Lagoa do Gato were discovered in 2009. The CLX2 zone is identified as having significant potential for high-grade sources of ore for the mill. Both infill and extension drilling confirm the continuity of mineralization in both areas. The Company continues to develop the high-grade mineral reserves at CLX2 with a focus on increasing mineral reserves and mineral resources. The Company is evaluating the possible extension of mine life.
ALUMBRERA, ARGENTINA
The Company’s interest in the Alumbrera Mine is accounted for as an equity investment. The Company recorded earnings from its 12.5% interest in Alumbrera Mine of $0.9 million for the second quarter, compared with $16.6 million reported for the same quarter of 2011. Lower earnings were due to the suspension of export sales by Alumbrera during the quarter to comply with a new resolution in respect of repatriation of net proceeds from export sales set forth by the Argentine Government. Subsequent to the quarter end, the Argentine Government amended its resolution enabling Alumbrera to resume exports. Export sales of concentrate have resumed in July and the backlog of sales is expected to be realized during the second half of 2012. The Company did not receive a cash distribution during the six months ended June 30, 2012, compared with cash distributions of $6.6 million during the three months and $27.0 million for the six-month period ended June 30, 2011.
Attributable production from Alumbrera was 12,359 ounces of gold and 10.5 million pounds of copper for the quarter. This compares with attributable production of 12,670 ounces of gold and 9.3 million pounds of copper for the second quarter of 2011. Gold production was slightly lower mainly due to lower feed grades from the ore mined and stockpiled ore. Copper production increased by 13% primarily due to higher recovery rates.
By-product cash costs per ounce of gold were impacted by significantly lower copper sale credits.
7. CONSTRUCTION, DEVELOPMENT AND EXPLORATION
CONSTRUCTION AND DEVELOPMENT
During the second quarter of 2012, all construction projects and all intermediate stage development projects were advancing to planned start-up. The following summary highlights key updates from the construction and development projects at the Company since the end of the first quarter of 2012.
BRAZIL
Ernesto/Pau-a-Pique
Construction progress is on schedule with commissioning and start-up of production expected by the end of 2012 and commercial production by mid-2013. As of June 30, 2012, physical advancement continued and was approximately 92% complete. Mine development and electromechanical works continued as expected. Underground development at Pau-a-Pique continued to progress and reached a total length of more than 3,400 metres. Annual production is expected to be approximately 100,000 gold ounces with average annual production during the first two full years expected to be approximately 120,000 gold ounces.
C1 Santa Luz
Construction progress is on schedule with commissioning and start-up of production expected by the end of 2012 and commercial production by mid-2013. As of June 30, 2012, physical advancement of the project was approximately 89% complete. Civil works, power line construction and electromechanical assembly continued as planned. Annual production is expected to be approximately 100,000 gold ounces with average annual production during the first two full years to exceed 130,000 gold ounces.
Pilar
Construction progress is on schedule with commissioning and start-up of production expected by mid-2013 with commercial production expected by the end of 2013. As of June 30, 2012, physical progress advanced to approximately 53%. Civil works and electromechanical assembly continued as planned. Underground development at Pilar continued to progress and reached a total length of more than 6,400 metres and underground development at Caiamar has been initiated.
Annual production from the mine was originally estimated to be 120,000 ounces of gold. The project is being built with 30% additional capacity to that contemplated in the feasibility study in anticipation of significant mineral resource growth. Development of Caiamar, a high-grade satellite deposit located 38 kilometres west of Pilar, is expected to contribute to production and utilization of this excess capacity at Pilar thereby increasing production to a minimum of 140,000 gold ounces per year expected to begin as early as 2014. Mineral resource development and work on a feasibility study continued at Caiamar during the quarter and earth works were initiated. The ore from this deposit can be processed at Pilar with the higher grades offsetting the additional transportation costs.
CHILE
Jeronimo
At Jeronimo, the various components of the feasibility study have been completed.
Results of the studies indicate:
· Initial capital: $425 million (including a contingency of approximately $50 million)
· Operating costs: $650/oz
· Average annual production: 150,000 ounces per year with production of approximately 175,000 ounces in the first 4 years
· Mining method: Combination of Room & Pillar, Long Hole Stoping and Sub Level Stoping
· Processing method: flotation and pressure oxidation, followed by CIL
· Throughput: 1.5 million tonnes of ore per year
· Gold recovery: 86%
· Expected Mine Life: 11 years based on current mineral reserves of 1.9 million gold ounces contained in 15.2 million tonnes at a grade of 3.88 g/t
The Company has begun discussions with Codelco (43% owner of the project) on the components of the feasibility study. As these discussions advance, the Company will be pursuing several optimization studies and undertake advanced engineering that would normally follow a positive construction decision, to further
enhance the project economics and to create greater certainty with costs and specifics of processing. One study on the use of reverse osmosis to reduce sulfuric acid consumption is ongoing and the Company is now evaluating the impact of the related recovery of manganese as a secondary metal that would decrease operating costs. Other optimizations being studied include a tailings dam cost savings related to thickening improvements, the decrease of flotation concentrate mass and the use of existing infrastructure, power lines and roads, all of which could reduce capital and operating costs.
The Company will continue discussions with its partner, Coldelco, continue to pursue optimizations of the current feasibility study, and complete the advanced engineering studies toward an objective of evaluating a construction decision on Jeronimo.
EXPLORATION
The Company is committed to developing its future based on its exploration successes and organic growth with programs targeting mineral reserve growth and mineral resource discovery in addition to development projects and discoveries at existing operations.
The 2012 exploration program of $125 million will continue to focus on increasing the Company’s mineral reserves and mineral resources, accelerating the development of new discoveries such as Jordino and Maria Lazarus at Pilar, the extension of Pampa Augusta Victoria and definition of a new discovery at El Peñón, the expansion of high grade mineral resources at Jacobina and the development of several greenfield projects with the potential to be brought into the Company’s project pipeline, enhancing present and future asset values.
The following is a summary of the exploration expenditures for the current and comparative period:
|
| Three months ended |
| Six months ended |
| ||||||||
|
| June 30, |
| June 30, |
| June 30, |
| June 30, |
| ||||
(in millions of Dollars) |
| 2012 |
| 2011 |
| 2012 |
| 2011 |
| ||||
Exploration capitalized (i) |
| $ | 37.1 |
| $ | 23.3 |
| $ | 47.8 |
| $ | 35.9 |
|
Exploration expensed (ii) |
| 14.4 |
| 9.1 |
| 27.6 |
| 15.6 |
| ||||
Total exploration |
| $ | 51.5 |
| $ | 32.4 |
| $ | 75.4 |
| $ | 51.5 |
|
(i) Capitalized exploration costs are reflected in the Condensed Consolidated Interim Balance Sheet, property, plant and equipment as part of the additions to depletable producing property for near-mine exploration, assets under construction and tangible exploration and evaluation assets.
(ii) Expensed exploration costs are reported in the Condensed Consolidated Interim Statements of Operations.
The following summary highlights key updates from the exploration and development program at the Company since the end of the first quarter of 2012.
ARGENTINA
Cerro Moro
On June 18, 2012, the Company announced that it had entered into a definitive agreement with Extorre Gold Mines Limited to acquire all of its issued and outstanding common shares. Extorre is a mining company with exploration and development stage precious metals projects, the most advanced of which is the Cerro Moro project, a high-grade gold and silver deposit with approximately 1.36 million ounces of gold equivalent indicated mineral resources and 1.05 million ounces of gold equivalent inferred mineral resources, located in the province of Santa Cruz in Argentina. Pending the close of the transaction, the Company will be evaluating a plan for production beginning in 2015 that targets 200,000 GEO and by year end will provide an update on exploration and development plans. The closing of the transaction is expected in August 2012.
Gualcamayo
During the second quarter, drilling totaled 7,300 metres in 39 holes. The drilling is focused on extending the Rodado breccias to the north. In addition, the development of a new underground access was commenced to the southwest extension of both the Rodado and QDDLW breccias, which remains open down dip with 450,000 ounces of new inferred resources identified.
Suyai
Recently the Governor of Chubut introduced the framework for a new mining law which is expected to be passed by the provinces’ legislature in due course. This law allows for mining throughout the province of Chubut, which is a very positive development for the jurisdiction. Given the depth of historic work completed on the project and the ongoing desktop work, the Company expects to fast track a feasibility study in anticipation of an acceptable resolution to all the details and the passing of the new mining law. Further information on the project is expected before year end.
BRAZIL
Pilar
The drilling is focused on the expansion of the Jordino resource both down dip, which has been shown to be open for more than two kilometres of dip length, and along strike to the south under younger cover rocks. In addition, exploration drilling will be completed at Maria Lazarus located approximately 10 kilometres west of Jordino and is similar in geology and style of mineralization to Jordino. Year-to-date, 35 drill holes have been completed totaling 13,956 metres and drill results confirm that growth in mineral reserves and mineral resources will continue in 2012. The success of this early stage drilling effort at Maria Lazarus continues to confirm that the area surrounding Pilar is a cluster of mineralized zones which will contribute to Pilar’s ore feed or potentially could be developed as a multiple mine complex. The Company has already increased the capacity of the mill by 30 percent from the feasibility study level and continues to assess potential increases to production and mine life with a strategic plan to fully utilize the increased capacity beginning in 2014.
Chapada
The $7-million 2012 exploration program includes 27,000 metres of diamond drilling that will principally target the southern extension of the Corpo Sul deposit as well as infill parts of the Corpo Sul mineral resource identified in 2011. Early results from current diamond drilling completed south of the Corpo Sul extension have returned very encouraging gold and copper values from sulphide mineralization. Hole CS-70 is the southernmost hole completed to-date and intersected wide zones of alteration and mineralization. The intersection extends Corpo Sul for more than 2.5 kilometres along strike to the southwest. Additional drilling on sections spaced between 200 to 400 metres apart confirmed similar grades to that in CS-70.
The results from Corpo Sul confirm similar metallurgy to the Chapada main pit ores. Based on this and the associated low strip ratio of the existing resource the Company is provided with the flexibility to at least blend ore between the main pit and Corpo Sul to increase production, particularly copper production because of the higher copper grade.
The drilling at Corpo Sul has identified gold and copper mineralization along a minimum strike length of 4.5 kilometres, to a depth of almost 300 metres and mineralization remains open along strike and down dip. With the discovery of Suruca in late 2009, Corpo Sul in 2011 and the continued positive results at Corpo Sul this year, economic copper and gold mineralization has now been identified along a strike length of almost 16 kilometres including the main Chapada deposit. Corpo Sul will provide the opportunity to further evaluate whether it will be more than just a higher grade ore contribution to an ore blend, or as it begins to show sufficient size and continuity to either represent a larger portion of ore contribution or an entirely new mine adjacent to Chapada.
During the remainder of 2012, diamond drilling will continue to focus on the expansion and delineation of mineralization at the Corpo Sul extension and on confirming grade continuity of the Corpo Sul mineral resource through infill drilling
CHILE
El Peñón
The $29-million 2012 exploration program includes 140,000 metres of surface and underground drilling. The objective of the exploration program is to replace mineral reserves and mineral resources and, in particular, outline new high grade ounces that will provide sustainability for long term production goals. During the first five months of 2012 a total of 34,383 metres of drilling have been completed. The drilling has resulted in the discovery of a new mineralized vein structure, Fortuna Este, and the advancement of two new targets, Dorada South and the Elizabeth vein at Pampa Augusta Victoria, that will provide mineral reserve and mineral resource growth for 2012.
Fortuna Este — Exploration drilling completed in the second half of 2011 discovered a massive quartz vein structure 300 metres east of the Fortuna deposit. Since the discovery, seven widely spaced surface reverse circulation and diamond drill holes and three underground diamond drill holes have been completed along a strike length of 800 metres. The best grades and widths of mineralization have been intersected in the northern part of Fortuna Este. Various drill holes at the southern end of east of Fortuna also indicate the presence of high grades, multiple structures and the continuity of a mineralized structure, which bode well for the upside of Fortuna Este. During the remainder of 2012, drilling will focus on expanding the high-grade areas in both the north and south as well as delineating the new structure identified.
Dorada South — Two new mineralized structures, Dorada West 1 and Dorada West 2 have been identified along the southern projection of Dorada. The structures, which are separated by 20 to 30 metres of barren wall rock have been traced along 700 metres of strike length and remain open along strike to the south. Mineralization consists of oxidized hydrothermal breccias and quartz veins with abundant hematite and manganese oxides and is best developed near a sub horizontal contact between rhyolite tuffs and underlying rhyolite flows and intrusive rocks. The mineralization has been traced along a dip length of approximately 150 metres and remains open down dip.
Elizabeth Vein, Pampa Augusta Victoria — Past drilling at Pampa Augusta Victoria had identified several discontinuous vein zones in the hanging wall of the main Victoria vein. These structures, approximately 400 metres east of Victoria, were not included in 2011 in any mineral reserve or mineral resource estimate due to the lack of drill information. Drilling in 2012 is specifically focused on establishing the continuity of these sub parallel structures and a narrow but high grade deposit in the Elizabeth vein has been identified. A total of 32 holes have been completed to date at Elizabeth and have outlined mineralization along a strike length of 300 metres and a dip length of 150 metres and the mineralization remains open along strike and locally down dip. As with Victoria, the mineralization is characterized by extremely high silver values.
Additional drilling in 2012 will focus on extending the mineralization at Elizabeth as well as the other sub parallel structures east of Victoria and establishing a mineral reserve and mineral resource for these areas. Exploration drilling will continue throughout 2012 to further extend mineralization at Victoria, both along strike and down dip, and will also expand and confirm the mineral resource potential of the Victoria Este and Elizabeth veins. Pampa Augusta Victoria is being fast tracked which will contribute to production and, along with the new discoveries, will give the Company the flexibility to consider an increase in annual production above the newly established sustainable level of 440,000 GEO at El Peñón.
MEXICO
Mercedes
The $7-million 2012 exploration program includes approximately 33,000 metres of diamond drilling focused on the expansion of mineral reserves and mineral resources, particularly at the Lagunas Norte extensions within the Barrancas zone and at the Lupita vein zone. Three core rigs are currently on site and a total of 26,604 metres have been drilled in 96 holes year-to-date. Mercedes is a gold-silver vein/stockwork system with mineralization contained in four areas: Mercedes, Barrancas, Klondike and Lupita.
Barrancas Vein, Marianas Zone extension — A total of 14 holes have been completed as part of a widely-spaced drilling program that has tested nearly 1,000 metres of strike length to the northwest of the Lagunas Norte ore body on the Barrancas structural trend. Almost all holes have intersected broad zones of fractured, iron stained and argillized andesite. However, associated quartz-carbonate-adularia stockwork/brecciated vein zones are highly variable in distribution and width. Additional drilling to be completed in 2012 will be focused on establishing the continuity and extensions of this newly discovered “Marianas” zone. This new discovery at Marianas is currently not reflected in Mercedes’ mineral reserves and mineral resources and it is expected that continued exploration success will contribute to mineral resources growth in 2012.
Lupita — Thirty metre in-fill drilling at Lupita continues to demonstrate that the quartz-carbonate vein/stockwork zone at the lower andesite/upper tuff contact is very continuous. Vein width varies from 0.5 to nearly 15.0 metres although the amount of greenish ore stage quartz varies greatly from hole to hole. Forty-five holes have been completed to date and assays returned indicate that most holes within the 2011 inferred grade shell contain at least narrow intervals with grades over 2.0 g/t gold equivalent. The drill program currently being completed at Lupita will increase the confidence in mineral resources from inferred to indicated and enable a mineral reserve analysis to be completed.
The continued exploration success and growing mineral resources at Mercedes will contribute to sustainability of higher throughput levels of 1,800 tonnes per day, higher production level of 140,000 ounces of annual production expected beginning in 2014 and the potential increase extension of mine life.
Picacho
On April 4, 2012, the Company reached an agreement with Adit Resources Corp., a wholly-owned subsidiary of Tara Minerals Corp., to acquire 100% of American Copper Mining S.A. de C.V., holder of the Picacho group of concessions. The Picacho group of concessions consists of 7,060 hectares and is located 65 kilometres northeast of the Company’s Mercedes Mine in Sonora, Mexico. The Company commenced its first drilling campaign at Picacho in July with drilling results expected before the end of 2012.
8. LIQUIDITY, CAPITAL RESOURCES AND CONTRACTUAL COMMITMENTS
LIQUIDITY
During the second quarter of 2012, the Company continued to maintain a robust financial position and it expects its liquidity to remain strong through the availability of unused credit facilities and expected cash flows from operations which are impacted by higher forecast production levels and stable metal prices. As at June 30, 2012, the Company had met all of the externally imposed capital requirements.
The following is a summary of liquidity and capital resources balances:
|
| As at |
| ||||
|
| June 30, |
| December 31, |
| ||
(in thousands of United States Dollars) |
| 2012 |
| 2011 |
| ||
Cash |
| $ | 698,884 |
| $ | 550,438 |
|
Trade and other receivables |
| $ | 205,775 |
| $ | 206,101 |
|
Long-term debt |
| $ | (765,464 | ) | $ | (431,769 | ) |
Working capital (i) |
| $ | 789,880 |
| $ | 608,021 |
|
(i) Working capital is defined as the excess of current assets over current liabilities
Cash and cash equivalents as at June 30, 2012 increased by 27% to $698.9 million compared to $550.4 million as at December 31, 2011. Cash and cash equivalents are comprised of cash at bank and bank term deposits the sources and uses of which, during the period, are explained below.
Trade and other receivables at the end of the period were $205.8 million compared with $206.1 million as at December 31, 2011. Gold sales are made at spot prices and receivables are settled in less than a month. Copper concentrate sales are made in accordance with certain smelter off-take agreements whereby provisional payments of approximately 90% are received within one to four weeks after shipping. Final assays and payment related to these sales are received approximately two to three months thereafter.
Working capital was $789.9 million as at June 30, 2012, compared to $608.0 million as at December 31, 2011. The 27% increase in working capital was mainly attributable to the increase in cash during the first six months of 2012.
|
| Three months ended |
| ||||
|
| June 30, |
| June 30, |
| ||
(in thousands of United States Dollars) |
| 2012 |
| 2011 |
| ||
Cash flows from operating activities |
| $ | 139,213 |
| $ | 315,766 |
|
Cash flows generated from operations before changes in non-cash working capital items |
| $ | 240,767 |
| $ | 331,038 |
|
Cash flows from financing activities |
| $ | (48,636 | ) | $ | (56,836 | ) |
Cash flows to investing activities |
| $ | (247,177 | ) | $ | (204,408 | ) |
CASH FLOWS FROM OPERATING ACTIVITIES
Cash flows from operations after taking into effect changes in working capital items for the period ended June 30, 2012 were $139.2 million, compared to inflows of $315.8 million for the same period ended June 30, 2011. The decrease was mainly attributed to lower earnings.
Changes in non-cash working capital items for the period ended June 30, 2012 period were cash outflows of $101.6 million compared to outflows of $15.3 million for 2011, mainly due to the unfavourable effect of the change of trade and other receivables related to Chapada concentrate receivable and reduced payables due to timing of payments.
Cash flows generated from operations before changes in non-cash working capital items (a non-GAAP measure, see Section 13) were $240.8 million compared to $331.0 million in the same quarter for 2011 mainly due to lower earnings and the absence of cash distributions from the Company’s equity interest in Alumbrera in the quarter, compared with the same period ended June 30, 2011.
CASH FLOWS FROM FINANCING ACTIVITIES
Cash outflows from financing activities for the period ended June 30, 2012 were $48.6 million compared to cash outflows of $56.8 million for 2011. The decrease in cash outflows was mainly due to the repayment of debt of $25.0 in the second quarter of 2011 partly offset by the increase in dividends paid in the second quarter of 2012.
CASH FLOWS TO INVESTING ACTIVITIES
Cash outflows to investing activities were $247.2 million (June 30, 2011 - $204.4 million) for the period ended June 30, 2012 of which substantially all relates to expenditures on property, plant and equipment. Higher outflows on acquisition of property, plant and equipment reflected increased expenditures on the construction of new mines and expansion of existing assets as the Company carries out its objectives of organic growth.
The following is a summary of capital expenditures including sustaining, expansionary and capitalized exploration by mine:
|
| Three months ended |
| Six months ended |
| ||||||||
|
| June 30, |
| June 30, |
| June 30, |
| June 30, |
| ||||
(in thousands of United States Dollars) |
| 2012 |
| 2011 |
| 2012 |
| 2011 |
| ||||
BRAZIL |
|
|
|
|
|
|
|
|
| ||||
Chapada |
| $ | 29,545 |
| $ | 13,423 |
| $ | 59,043 |
| $ | 18,125 |
|
Jacobina |
| 14,336 |
| 13,118 |
| 23,631 |
| 25,577 |
| ||||
Fazenda Brasileiro |
| 3,517 |
| 8,605 |
| 8,991 |
| 13,533 |
| ||||
Ernesto/Pau-a-Pique (i) |
| 27,602 |
| 16,074 |
| 61,325 |
| 24,785 |
| ||||
C1 Santa Luz (i) |
| 27,700 |
| 18,894 |
| 55,057 |
| 22,045 |
| ||||
Pilar (i) |
| 30,474 |
| 19,090 |
| 62,844 |
| 26,812 |
| ||||
CHILE |
|
|
|
|
|
|
|
|
| ||||
El Peñón |
| 28,085 |
| 33,527 |
| 50,815 |
| 53,209 |
| ||||
Minera Florida |
| 46,981 |
| 22,307 |
| 92,501 |
| 34,738 |
| ||||
Jeronimo |
| 1,817 |
| 1,914 |
| 4,131 |
| 3,409 |
| ||||
ARGENTINA |
|
|
|
|
|
|
|
|
| ||||
Gualcamayo |
| 25,237 |
| 10,348 |
| 50,061 |
| 15,431 |
| ||||
MEXICO |
|
|
|
|
|
|
|
|
| ||||
Mercedes |
| 12,921 |
| 31,277 |
| 30,742 |
| 51,820 |
| ||||
CANADA & OTHER |
| 14,353 |
| 16,422 |
| 20,313 |
| 20,090 |
| ||||
Total capital expenditures |
| $ | 262,568 |
| $ | 204,999 |
| $ | 519,454 |
| $ | 309,574 |
|
(i) Net of movement in accounts payable.
CAPITAL RESOURCES
In order to maintain or adjust its capital structure, the Company, upon approval from its Board of Directors, may issue shares, pay dividends, or undertake other activities as deemed appropriate under the specific circumstances.
The Company is authorized to issue an unlimited number of common shares at no par value and a maximum of eight million first preference shares. There are no first preference shares issued or outstanding. As of July 31, 2012, the total number of shares outstanding were 746.5 million, the total number of stock options outstanding were 1.5 million, the total number of DSUs outstanding were 1.8 million and the total number of RSUs outstanding were 1.9 million.
During the quarter, the Company increased its quarterly dividend to $0.065 per share increasing 18% from $0.055 per share for an increased annual dividend rate of $0.26 per share. Total dividend payments of $41.2 million for the quarter and $78.2million for the first six months, increasing by 86.4% and 76.9% respectively, compared to the dividends paid of $22.1 million and $44.2 million in the three-month and six-month periods of 2011.
The following table summarizes the common shares and options outstanding as at June 30, 2012:
(in thousands) |
| Actual |
| Weighted average |
| Weighted average |
|
Common shares |
| 746,492 |
| 746,136 |
| 746,014 |
|
Options |
| 1,452 |
| 507 |
| 562 |
|
RSUs |
| 1,932 |
| 795 |
| 821 |
|
DSUs |
| 1,813 |
| — |
| — |
|
|
|
|
| 747,438 |
| 747,397 |
|
(i) The weighted average number of shares excludes anti-dilutive options and RSUs.
CONTRACTUAL COMMITMENTS
Day-to-day mining, expansionary and sustaining capital expenditures as well as administrative operations give rise to contracts requiring agreed upon future minimum payments. Management is of the view that such commitments will be sufficiently funded by current working capital, future operating cash flows and available credit facilities which provide access to additional funds.
As at June 30, 2012, the Company is contractually committed to the following:
(in thousands of United States Dollars) |
| Within 1 year |
| Between |
| Between |
| After 5 years |
| Total |
| |||||
Mine operating/construction and service contracts and other |
| $ | 369,756 |
| $ | 289,540 |
| $ | 57,967 |
| $ | 25,646 |
| $ | 742,909 |
|
Long-term debt principal repayments (i) |
| — |
| 15,000 |
| 73,500 |
| 681,500 |
| 770,000 |
| |||||
Decommissioning, Restoration and Similar Liabilities (undiscounted) |
| 10,926 |
| 18,209 |
| 29,936 |
| 211,698 |
| 270,769 |
| |||||
|
| $ | 380,682 |
| $ | 322,749 |
| $ | 161,403 |
| $ | 918,844 |
| $ | 1,783,678 |
|
(i) Excludes interest expense.
9. INCOME TAXES
The Company recorded an income tax expense of $80.0 million for the quarter (tax expense of $65.7 million for the second quarter of 2011). The current quarter income tax provision mainly reflects a current income tax expense of $55.1 million ($74.5 million for the second quarter of 2011) and a deferred income tax expense of $24.9 million (deferred tax recovery of $8.7 million for the second quarter of 2011).
The Condensed Consolidated Interim Balance Sheet reflects recoverable tax installments in the amount of $5.1 million and an income tax liability of $51.2 million. Additionally, the balance sheet reflects a deferred tax asset of $153.1 million and a deferred tax liability of $2.0 billion.
The Company has elected, under IFRS, to record foreign exchange and interest and penalties in the income tax expense, therefore, due to foreign exchange differences, the tax rate will fluctuate during the year with the change in the Brazilian Real, Argentinean Peso and Mexican Peso. See Note 21 to the Condensed Consolidated Interim Financial Statements for a breakdown of the foreign exchange and interest and penalties charged to the income tax expense.
The adjusted tax rate for the second quarter of 2012 is 26.4% compared with an adjusted tax rate of 27.1% for the second quarter of 2011. The lower tax rate is a result of a lower tax rate in Chile.
The income tax provision is subject to a number of factors including the allocation of income between different countries, different tax rates in the various jurisdictions, the non-recognition of tax assets, foreign currency exchange movements, changes in tax laws and the impact of specific transaction and assessments. Due to the number of factors that can potentially impact the effective tax rate, it is expected that the Company’s effective tax rate will fluctuate in future periods.
During the quarter, the Chilean government introduced significant changes to the Chilean taxation system. In 2010, the first category tax rate was temporarily increased because of the earthquake to 20% in 2011, reducing to 18.5% in 2012 and returning to 17% in 2013. The new tax reform proposes to increase the tax rate to 20% beginning in 2012. If the new rates are enacted as proposed, the current tax expense would increase by approximately $3.1 million year-to-date and the deferred tax expense would increase by approximately $89.0 million. The adjustment related to prior periods will be added back for the purpose of determining adjusted earnings.
10. ECONOMIC TRENDS, RISKS AND UNCERTAINTIES
Exploration, development and mining of precious metals involve numerous inherent risks as a result of the nature of the business, global economic trends as well as local social, political, environmental and economic conditions in the various geographical areas of operation. As such, the Company is subject to several financial and operational risks that could have a significant impact on its profitability and levels of operating cash flows.
The Company assesses and minimizes these risks by adhering to its internal risk management protocols which include the application of high operating standards empowering individuals and establishing processes to be able to identify, assess, report and monitor risk at all levels of the organization. Through careful management and planning of its facilities, hiring qualified personnel and developing a skilled workforce through training and development programs, the Company is able to generate shareholder value in a safe, resilient and responsible manner.
Below is a summary of the principal risks and related uncertainties facing the Company. Readers are also encouraged to read and consider the risk factors more particularly described in the Company’s Annual Information Form for the period ended December 31, 2011. Such risk factors could materially affect the future operating results of the Company and could cause actual events to differ materially from those described in forward-looking statements relating to the Company.
Commodity Risk
The mining industry is highly dependent on commodity prices which are the result of the economic interplay of supply and demand. The profitability of the Company is directly related to the market prices of gold and copper and to a lesser extent, silver. A decline in the market prices for these precious metals could negatively impact the Company’s future operations.
Gold Price Three-Year Trend (Bloomberg: USD per ounce of gold)
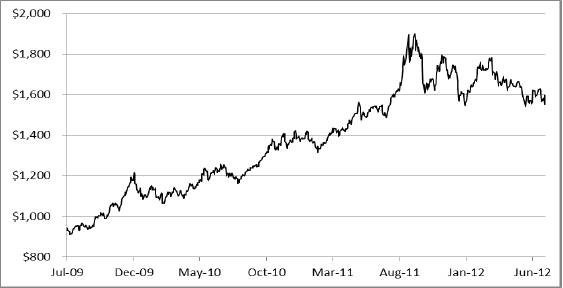
For the period ended June 30, 2012, spot gold prices averaged $1,612 per ounce, or 7% higher, compared with $1,509 per ounce from the comparative period of 2011.
The primary influence of gold prices during 2012 has been the strength of the U.S. dollar. Gold and the U.S. dollar tend to have a negative correlation so the strong U.S. currency has been negative for gold prices. Ongoing potential systemic risks from Europe are driving safe haven demand for the dollar over most currencies and asset classes, including gold. The other major drag on gold has been a decrease in demand from India, which is the largest consumer, because of a weak local currency and import restrictions on gold investment.
However, gold prices continue to be well supported by dollar diversification by central banks, other safe haven buying by investors and growing Asian demand. Additionally, stable demand from exchange traded funds remains supportive of gold prices in 2012. Gold prices are being supported by other positive market fundamentals including continued global economic uncertainty and constrained long-term mine supply.
In light of these factors, the Company expects gold prices to continue to remain well supported in the near to mid-term, although with a high degree of market volatility as seen in early 2012.
The Company has not hedged any of its gold sales.
Copper Price Three-Year Trend (Bloomberg: USD per pound of copper)

For the period ended June 30, 2012, spot copper prices averaged $3.57 per pound, representing a decrease of 14% compared with $4.15 per pound from the same period in 2011.
Copper prices are primarily being driven by constrained supply fundamentals and steady demand from emerging markets, mainly China. Low global inventory levels and the potential for near to mid-term supply disappointments are supporting copper prices. As global economies are forecast to recover later in 2012 and into 2013, the Company expects copper prices to remain above historical levels in the near to mid-term.
The Company has forward contracts to economically hedge against the risk of declining copper prices for a portion of its forecast copper concentrate sales.
Currency Risk
Conducting exploration, development and production operations in Latin America exposes the Company to currency risk. The Company’s revenues are denominated in United States Dollars (USD). However, the Company’s operating expenses are incurred in United States Dollars, Brazilian Reais (BRL), Chilean Pesos (CLP), Argentine Pesos (ARG), Mexican Pesos (MXN) and to a lesser extent in Canadian Dollars (CAD). Accordingly, fluctuations in the exchange rates can significantly impact the results of operations.
The following summarizes the movement in key currencies vis-à-vis the United States Dollar:

Average and Period-end Market Exchange Rates
Three months ended June 30, |
| 2012 |
| 2011 |
| Variance |
|
Average Exchange Rate |
|
|
|
|
|
|
|
USD-CAD |
| 1.0058 |
| 0.9684 |
| 3.9 | % |
USD-BRL |
| 1.9627 |
| 1.5948 |
| 23.1 | % |
USD-ARG |
| 4.4261 |
| 4.0714 |
| 8.7 | % |
USD-CLP |
| 492.5318 |
| 471.3040 |
| 4.5 | % |
USD-MXN |
| 13.4023 |
| 11.7637 |
| 13.9 | % |
Six months ended June 30, |
| 2012 |
| 2011 |
|
|
|
Average Exchange Rate |
|
|
|
|
|
|
|
USD-CAD |
| 1.0063 |
| 0.9790 |
| 2.8 | % |
USD-BRL |
| 1.8649 |
| 1.6307 |
| 14.4 | % |
USD-ARG |
| 4.3775 |
| 4.0372 |
| 8.4 | % |
USD-CLP |
| 493.0544 |
| 476.2099 |
| 3.5 | % |
USD-MXN |
| 13.2655 |
| 11.9331 |
| 11.2 | % |
|
| June 30, |
| December 31, |
|
|
| December 31, |
|
|
|
|
| 2012 |
| 2011 |
| Variance |
| 2010 |
| Variance |
|
Period-end Exchange Rate |
|
|
|
|
|
|
|
|
|
|
|
USD-CAD |
| 1.0166 |
| 1.0213 |
| -0.5 | % | 0.9999 |
| 1.7 | % |
USD-BRL |
| 2.0213 |
| 1.8758 |
| 7.8 | % | 1.6660 |
| 21.3 | % |
USD-ARG |
| 4.5260 |
| 4.3000 |
| 5.3 | % | 3.9713 |
| 14.0 | % |
USD-CLP |
| 501.0070 |
| 519.5500 |
| -3.6 | % | 461.9820 |
| 8.4 | % |
USD-MXN |
| 13.3608 |
| 13.9357 |
| -4.1 | % | 12.3401 |
| 8.3 | % |
The Company entered into forward contracts to economically hedge against the risk of an increase in the value of the Brazilian Real versus the United States Dollar. Currency contracts totaling 938.8 million Reais at an average rate of 2.08 Real to the United States Dollar have been designated against forecast Reais denominated expenditures as a hedge against the variability of the United States dollar amount of those expenditures caused by changes in the currency exchange rates for 2012 through to 2015.
The Company also entered into forward contracts to economically hedge against the risk of an increase in the value of the Mexican Pesos versus the United States Dollar. Currency contracts totaling 452.0 million Pesos at an average rate of 13.32 Pesos to the United States Dollar have been designated against forecast Pesos denominated expenditures as
a hedge against the variability of the United States dollar amount of those expenditures caused by changes in the currency exchange rates for 2012 through to 2015.
The currency hedge has been accounted for as a cash flow hedge with the effective portion taken to other comprehensive income and the ineffective portion taken to income.
The following table summarizes the details of the currency hedging program as at June 30, 2012:
(Quantities in thousands)
|
| Brazilian Real |
| Mexican Peso |
| ||||||||||
Year of Settlement |
| Brazilian |
| Weighted |
| Market rate |
| Year of |
| Mexican |
| Contract |
| Market rate |
|
2012 |
| 154,672 |
| 2.1917 |
| 2.0213 |
| 2012 |
| 75,000 |
| 13.3200 |
| 13.3608 |
|
2013 |
| 332,712 |
| 2.0550 |
| 2.0213 |
| 2013 |
| 156,000 |
| 13.3200 |
| 13.3608 |
|
2014 |
| 372,360 |
| 2.0240 |
| 2.0213 |
| 2014 |
| 156,000 |
| 13.3200 |
| 13.3608 |
|
2015 |
| 79,008 |
| 2.2857 |
| 2.0213 |
| 2015 |
| 65,000 |
| 13.3200 |
| 13.3608 |
|
|
| 938,752 |
| 2.0814 |
| 2.0213 |
|
|
| 452,000 |
| 13.3200 |
| 13.3608 |
|
Interest Rate Risk
The Company is exposed to interest rate risk on its variable rate debt. Monetary policy by central banks in the countries in which the Company operates have maintained interest rates relatively low to avoid a relapse of the credit crisis and incentivize economic growth. At June 30, 2012, the Company’s long-term debt was carried at fixed rates, hence there is limited market risk arising from fluctuations in floating interest rate.
Credit Risk
Credit risk is the risk that a third party might fail to fulfill its performance obligations under the terms of a financial instrument. For cash, cash equivalents and trade and other receivables, credit risk is represented by the carrying amount on the balance sheet. For derivatives, the Company assumes no credit risk when the fair value of the instruments is negative. When the fair value of the instruments is positive, this is a reasonable measure of credit risk. The Company limits credit risk by entering into business arrangements with high credit-quality counterparties, limiting the amount of exposure to each counterparty and monitoring the financial condition of counterparties.
Liquidity Risk
Liquidity risk is the risk that an entity will encounter difficulty in meeting obligations associated with financial liabilities that are settled by delivering cash or another financial asset. Under the terms of our trading agreements, counterparties cannot require the Company to immediately settle outstanding derivatives except upon the occurrence of customary events of default. The Company mitigates liquidity risk through the implementation of its Capital Management Policy by spreading the maturity dates of derivatives over time, managing its capital expenditures and operation cash flows, and by maintaining adequate lines of credit.
Investment Risk
Investment risk is the risk that a financial instrument’s value will deviate from the expected returns as a result of changes in market conditions, whether those changes are caused by factors specific to the individual investment or factors affecting all investments traded in the market. Although the factors that affect investment risk are outside the Company’s control, the Company mitigates investment risk by limiting its investment exposure in terms of total funds to be invested and by being selective of high quality investments.
Foreign Operations and Political Risk
The Company holds mining and exploration properties in Brazil, Argentina, Chile, Mexico and Colombia exposing it to the socioeconomic conditions as well as the laws governing the mining industry in those countries. Inherent risks with conducting foreign operations include, but are not limited to, high rates of inflation; military repression; war or civil war; social and labour unrest; organized crime and hostage taking which cannot be timely predicted and could have a material adverse effect on the Company’s operations and profitability. The governments in those countries are currently generally supportive of the mining industry but changes in government laws and regulations including taxation, royalties, the repatriation of profits, restrictions on production, export controls, changes in taxation policies, environmental and ecological compliance, expropriation of property and shifts in the political stability of the country could adversely affect the Company’s exploration, development and production initiatives in these countries.
In efforts to tighten capital flows and protect foreign exchange reserves, the Government of Argentina issued a new foreign exchange resolution with respect to export revenues that resulted in a temporary suspension of export sales of concentrate at Alumbrera during the second quarter as management evaluated how to comply with the new resolution. The recently announced amendment to the foreign exchange resolution extended the time for exporters to repatriate net proceeds from export sales to 180 days enabling Alumbrera to resume exports in July, subsequent to the quarter end. The Government of Argentina has also introduced certain protocols relating to the importation of goods and services and providing where possible for the substitution of Argentine produced goods and services. The Company continues to monitor developments and policies in all its jurisdictions and the impact thereof to its operations.
Consistent with its risk management protocol, to mitigate land title risks, the Company makes no commitments and does not undertake exploration without first determining that necessary property rights are in good standing. However, despite the Company’s best efforts, land title may still be affected by undetected defects.
Health, Safety and Environmental Risk
Mining, like many other extractive natural resource industries, is subject to potential risks and liabilities due to accidents that could result in serious injury or death and or material damage to the environment and Company assets. The impact of such accidents could affect the profitability of the operations, cause an interruption to operations, lead to a loss of licenses, affect the reputation of the company and its ability to obtain further licenses, damage community relations and reduce the perceived appeal of the Company as an employer. Yamana has rigorous procedures in place to manage health and safety protocols in order to reduce the risk of occurrence and the severity of any accident and is continually investing time and resources to enhance health and safety at all operations.
The Company’s operations are subject to various laws and regulations governing the protection of the environment, exploration, development, production, exports, taxes, labour standards, occupational health, waste disposal, toxic substances, mine safety, and other matters. Permits from various governmental authorities are necessary in order to engage in mining operations in all jurisdictions in which the Company operates. Such permits relate to many aspects of mining operations, including maintenance of air, water and soil quality standards. In most jurisdictions, the requisite permits cannot be obtained prior to completion of an environmental impact statement and, in some cases, public consultation. Further, the Company may be required to submit for government approval a reclamation plan, to post financial assurance for the reclamation costs of the mine site, and to pay for the reclamation of the mine site upon the completion of mining activities. The Company mitigates this risk by performing certain reclamation activities concurrent with production.
Environmental liability may result from mining activities conducted by others prior to the Company’s ownership of a property. To the extent Yamana is subject to uninsured environmental liabilities, the payment of such liabilities would reduce funds otherwise available for business activities and could have a material adverse effect on the Company. Should the Company be unable to fully fund the cost of remedying an environmental problem, the Company might be required to suspend operations or enter into interim compliance measures pending completion of the required remedy, which may have a material adverse effect. The Company mitigates the likelihood and potential severity of these environmental risks it encounters in its day-to-day operations through the application of its high operating standards as dictated by the Yamana Management System.
The Company has insurance policies in place to cover accidents and business interruption and regularly monitors the adequacy of such policies.
Energy Risk
The Company consumes energy in mining activities, primarily in the form of diesel fuel, electricity and natural gas. As many of the Company’s mines are in remote locations and energy is generally a limited resource, the Company faces the risk that there may not be sufficient energy available to carry out mining activities efficiently or that certain sources of energy may not be available. The Company manages this risk by means of long-term electricity agreements with local power authorities and inventory control process on consumables including fuel. Many of the mines have on-site generator sets as back-up to mitigate the anticipated and unanticipated interruptions from the energy providers. Furthermore, the Company’s operations are continually improved to reduce input costs and maximize output.
11. CONTINGENCIES
Due to the size, complexity and nature of the Company’s operations, various legal and tax matters arise in the ordinary course of business. The Company accrues for such items when a liability is both probable and the amount can be reasonably estimated. In the opinion of management, these matters will not have a material effect on the Condensed Consolidated Interim Financial Statements of the Company.
In 2004, a former director of Northern Orion commenced proceedings in Argentina against Northern Orion claiming damages in the amount of $177.0 million for alleged breaches of agreements entered into by the plaintiff. The plaintiff alleged that the agreements entitled him to a pre-emption right to participate in acquisitions by Northern Orion in Argentina and claimed damages in connection with the acquisition by Northern Orion of its 12.5% equity interest in the Alumbrera project. On August 22, 2008, the National Commercial Court No. 8 of the City of Buenos Aires issued a first-instance judgement rejecting the claim. The plaintiff appealed this judgement and a decision of the appellate court is pending. While the Company continues to consider that the plaintiff’s allegations are unfounded and has been advised by its Argentine counsel that the appeal is unlikely to be successful; the outcome is not certain. There is no assurance that the Company will be wholly successful in confirming the first-instance judgement at appellate courts. There have not been any significant developments on this matter during the current quarter.
12. CRITICAL ACCOUNTING POLICIES AND ESTIMATES
In preparing the Condensed Consolidated Interim Financial Statements in accordance with International Accounting Standard 34 Interim Financial Reporting (“IAS 34”) using the accounting policies consistent with International Financial Reporting Standards (“IFRS”) as issued by the International Accounting Standards Board (“IASB”), management is required to make estimates and assumptions that affect the reported amounts of assets, liabilities, revenues and expenses for the period end. Critical accounting estimates represent estimates that are uncertain and for which changes in those estimates could materially impact on the Company’s Condensed Consolidated Interim Financial Statements. Management reviews its estimates and assumptions on an ongoing basis using the most current information available.
There has been no significant change to the Company’s critical accounting policies and estimates since 2011. The Condensed Consolidated Interim Financial Statements of the second quarter of 2012 should be read in conjunction with the Company’s 2011 Annual Financial Statements prepared in accordance with IFRS and in consideration of the significant accounting policies applied and recent accounting pronouncements as described in Note 2 and Note 3, respectively.
13. NON-GAAP MEASURES
The Company has included certain non-GAAP measures including “Co-product cash costs per gold equivalent ounce”, “Co-product cash costs per pound of copper”, “By-product cash costs per gold equivalent ounce”, “Adjusted Earnings or Loss and Adjusted Earnings or Loss per share” to supplement its Condensed Consolidated Interim Financial Statements, which are presented in accordance with International Financial Reporting Standards (“IFRS”). The term IFRS and generally accepted accounting principles (“GAAP”) are used interchangeably throughout this MD&A.
The Company believes that these measures, together with measures determined in accordance with IFRS, provide investors with an improved ability to evaluate the underlying performance of the Company. Non-GAAP measures do not have any standardized meaning prescribed under IFRS, and therefore they may not be comparable to similar measures employed by other companies. The data is intended to provide additional information and should not be considered in isolation or as a substitute for measures of performance prepared in accordance with IFRS.
AVERAGE CASH COSTS
The Company discloses “average cash costs” because it understands that certain investors use this information to determine the Company’s ability to generate earnings and cash flows for use in investing and other activities. The Company believes that conventional measures of performance prepared in accordance with IFRS do not fully illustrate the ability of its operating mines to generate cash flows. The measures, as determined under IFRS, are not necessarily indicative of operating profit or cash flows from operations. Average cash costs figures are calculated in accordance with a standard developed by The Gold Institute, which was a worldwide association of suppliers of gold and gold products and included leading North American gold producers. The Gold Institute ceased operations in 2002, but the standard remains the generally accepted standard of reporting cash costs of production in North America. Adoption of the standard is voluntary and the cost measures presented herein may not be comparable to other similarly titled measures of other companies. Cash costs include mine site operating costs such as mining, processing, administration, royalties and production taxes, but are exclusive of amortization, reclamation, capital, development and exploration costs. Average cash costs are computed both on a co-product and by-product basis.
Cash costs per gold equivalent ounce on a by-product basis is calculated by applying zinc and copper net revenue as a credit to the cost of gold production and as such the by-product gold equivalent ounce cash costs are impacted by realized zinc and copper prices. These costs are then divided by gold equivalent ounces produced. Gold equivalent ounces are determined by converting silver production to its gold equivalent using relative gold/silver metal prices at an assumed ratio and adding the converted silver production expressed in gold ounces to the ounces of gold production.
Cash costs on a co-product basis are computed by allocating operating cash costs to metals, mainly gold and copper, based on an estimated or assumed ratio. These costs are then divided by gold equivalent ounces produced and pounds of copper produced to arrive at the average cash costs of production per gold equivalent ounce and per pound of copper, respectively. Production of zinc is not considered a core business of the Company; therefore, the net revenue of zinc is always treated as a credit to the costs of gold production.
Cash costs per gold equivalent ounce and per pound of copper are calculated on a weighted average basis.
The measure of average cash costs, along with revenue from sales, is considered to be a key indicator of a company’s ability to generate operating earnings and cash flow from its mining operations. This data is furnished to provide additional information and is a non-GAAP measure. It should not be considered in isolation as a substitute for measures of performance prepared in accordance with IFRS and is not necessarily indicative of operating costs, operating profit or cash flows presented under IFRS.
Per Gold Equivalent Ounce (“GEO”)
The following tables provide a reconciliation of cost of sales per the Consolidated Interim Financial Statements to (i) Co-product cash costs per GEO, (ii) Co-product cash costs per pound of copper and (iii) By-product cash costs per GEO:
Reconciliation of Cost of Sales per the Condensed Consolidated Interim Financial Statements to Co-product Cash Costs per GEO
GEO |
| In thousands of |
| United States Dollars |
| ||||||||
For the three months ended June 30, |
| 2012 |
| 2011 |
| 2012 |
| 2011 |
| ||||
Cost of sales (i) (iii) |
| $ | 201,024 |
| $ | 191,777 |
| $ | 727 |
| $ | 721 |
|
Adjustments: |
|
|
|
|
|
|
|
|
| ||||
Copper contained in concentrate related cash costs (excluding related TCRC’s) (ii) |
| (47,326 | ) | (47,904 | ) | (172 | ) | (180 | ) | ||||
Treatment and refining costs (“TCRC”) related to Chapada gold |
| 1,276 |
| 1,049 |
| 5 |
| 4 |
| ||||
Inventory movements and adjustments |
| 1,909 |
| (14,121 | ) | 7 |
| (53 | ) | ||||
Commercial selling costs |
| (5,640 | ) | (8,220 | ) | (20 | ) | (31 | ) | ||||
Total GEO co-product cash costs (excluding Alumbrera) |
| $ | 151,243 |
| $ | 122,581 |
| $ | 547 |
| $ | 461 |
|
Minera Alumbrera (12.5% interest) GEO cash costs |
| 3,505 |
| 3,033 |
| 284 |
| 239 |
| ||||
Total GEO co-product cash costs (iii) |
| $ | 154,748 |
| $ | 125,614 |
| $ | 536 |
| $ | 451 |
|
GEO produced excluding Alumbrera |
| 276,341 |
| 266,067 |
|
|
|
|
| ||||
GEO produced including Alumbrera |
| 288,700 |
| 278,737 |
|
|
|
|
| ||||
GEO |
| In thousands of |
| United States Dollars |
| ||||||||
For the six months ended June 30, |
| 2012 |
| 2011 |
| 2012 |
| 2011 |
| ||||
Cost of sales (i) (iii) |
| $ | 392,866 |
| $ | 348,879 |
| $ | 720 |
| $ | 668 |
|
Adjustments: |
|
|
|
|
|
|
|
|
| ||||
Copper contained in concentrate related cash costs (excluding related TCRC’s) (ii) |
| (89,025 | ) | (90,089 | ) | (163 | ) | (173 | ) | ||||
Treatment and refining costs (“TCRC”) related to Chapada gold |
| 1,992 |
| 1,957 |
| 4 |
| 4 |
| ||||
Inventory movements and adjustments |
| (403 | ) | (5,752 | ) | (1 | ) | (11 | ) | ||||
Commercial selling costs |
| (12,820 | ) | (15,235 | ) | (23 | ) | (29 | ) | ||||
Total GEO co-product cash costs (excluding Alumbrera) |
| $ | 292,610 |
| $ | 239,760 |
| $ | 537 |
| $ | 459 |
|
Minera Alumbrera (12.5% interest) GEO cash costs |
| 6,640 |
| 5,812 |
| 306 |
| 242 |
| ||||
Total GEO co-product cash costs (iii) |
| $ | 299,250 |
| $ | 245,572 |
| $ | 528 |
| $ | 450 |
|
GEO produced excluding Alumbrera |
| 545,854 |
| 522,061 |
|
|
|
|
| ||||
GEO produced including Alumbrera |
| 567,530 |
| 546,105 |
|
|
|
|
| ||||
(i) Cost of sales includes non-cash items including the impact of the movement in inventory.
(ii) Costs directly attributed to a specific metal are allocated to that metal. Costs not directly attributed to a specific metal are allocated based on relative value. As a rule of thumb, the relative value has been 80/75% copper and 20/25% gold. TCRC’s are defined as treatment and refining charges.
(iii) Depletion, depreciation and amortization are excluded from both total cash costs and cost of sales.
Reconciliation of Cost of Sales per the Condensed Consolidated Interim Financial Statements to Co-product Cash Costs per Pound of Copper
Copper |
| In thousands of |
| United States Dollars |
| ||||||||
For the three months ended June 30, |
| 2012 |
| 2011 |
| 2012 |
| 2011 |
| ||||
Cost of sales (i) (iii) |
| $ | 201,024 |
| $ | 191,777 |
| $ | 4.97 |
| $ | 4.70 |
|
Adjustments: |
|
|
|
|
|
|
|
|
| ||||
GEO related cash costs (excluding related TCRC’s) (ii) |
| (149,967 | ) | (121,532 | ) | (3.71 | ) | (2.98 | ) | ||||
Treatment and refining costs (“TCRC”) related to Chapada copper |
| 6,694 |
| 5,716 |
| 0.17 |
| 0.14 |
| ||||
Inventory movements and adjustments |
| 1,909 |
| (14,121 | ) | 0.05 |
| (0.35 | ) | ||||
Commercial selling costs |
| (5,640 | ) | (8,220 | ) | (0.14 | ) | (0.19 | ) | ||||
Total copper co-product cash costs (excluding Alumbrera) |
| $ | 54,020 |
| $ | 53,620 |
| $ | 1.34 |
| $ | 1.32 |
|
Minera Alumbrera (12.5% interest) copper cash costs |
| 14,832 |
| 14,340 |
| 1.41 |
| 1.54 |
| ||||
Total copper co-product cash costs (iii) |
| $ | 68,852 |
| $ | 67,960 |
| $ | 1.35 |
| $ | 1.36 |
|
Copper produced excluding Alumbrera (millions of lbs) |
| 40.4 |
| 40.8 |
|
|
|
|
| ||||
Copper produced including Alumbrera (millions of lbs) |
| 50.9 |
| 50.1 |
|
|
|
|
| ||||
Copper |
| In thousands of |
| United States Dollars |
| ||||||||
For the six months ended June 30, |
| 2012 |
| 2011 |
| 2012 |
| 2011 |
| ||||
Cost of sales (i) (iii) |
| $ | 392,866 |
| $ | 348,879 |
| $ | 5.56 |
| $ | 4.40 |
|
Adjustments: |
|
|
|
|
|
|
|
|
| ||||
GEO related cash costs (excluding related TCRC’s) (ii) |
| (290,618 | ) | (237,803 | ) | (4.11 | ) | (3.00 | ) | ||||
Treatment and refining costs (“TCRC”) related to Chapada copper |
| 10,776 |
| 9,993 |
| 0.15 |
| 0.13 |
| ||||
Inventory movements and adjustments |
| (403 | ) | (5,752 | ) | (0.01 | ) | (0.07 | ) | ||||
Commercial selling costs |
| (12,820 | ) | (15,235 | ) | (0.18 | ) | (0.20 | ) | ||||
Total copper co-product cash costs (excluding Alumbrera) |
| $ | 99,801 |
| $ | 100,082 |
| $ | 1.41 |
| $ | 1.26 |
|
Minera Alumbrera (12.5% interest) copper cash costs |
| 29,680 |
| 27,525 |
| 1.60 |
| 1.67 |
| ||||
Total copper co-product cash costs (iii) |
| $ | 129,481 |
| $ | 127,607 |
| $ | 1.45 |
| $ | 1.33 |
|
Copper produced excluding Alumbrera (millions of lbs) |
| 70.7 |
| 79.2 |
|
|
|
|
| ||||
Copper produced including Alumbrera (millions of lbs) |
| 89.3 |
| 95.7 |
|
|
|
|
| ||||
(i) Cost of sales includes non-cash items including the impact of the movement in inventory.
(ii) Costs directly attributed to a specific metal are allocated to that metal. Costs not directly attributed to a specific metal are allocated based on relative value. As a rule of thumb, the relative value has been 80/75% copper and 20/25% gold. TCRC’s are defined as treatment and refining charges.
(iii) Depletion, depreciation and amortization are excluded from both total cash costs and cost of sales.
Reconciliation of Cost of Sales per the Condensed Consolidated Interim Financial Statements to By-product Cash Costs per GEO
GEO |
| In thousands of |
| United States Dollars |
| ||||||||
For the three months ended June 30, |
| 2012 |
| 2011 |
| 2012 |
| 2011 |
| ||||
Cost of sales (i) |
| $ | 201,024 |
| $ | 191,777 |
| $ | 727 |
| $ | 721 |
|
Adjustments: |
|
|
|
|
|
|
|
|
| ||||
Chapada treatment and refining costs related to gold and copper |
| 7,970 |
| 6,765 |
| 29 |
| 25 |
| ||||
Inventory movements and adjustments |
| 1,909 |
| (14,121 | ) | 7 |
| (53 | ) | ||||
Commercial selling costs |
| (5,640 | ) | (8,220 | ) | (20 | ) | (31 | ) | ||||
Chapada copper revenue including copper pricing adjustment |
| (144,188 | ) | (176,617 | ) | (520 | ) | (664 | ) | ||||
Total GEO by-product cash costs (excluding Alumbrera) |
| $ | 61,075 |
| $ | (416 | ) | $ | 223 |
| $ | (2 | ) |
Minera Alumbrera (12.5% interest) by-product cash costs |
| 8,789 |
| (21,995 | ) | 711 |
| (1,736 | ) | ||||
Total GEO by-product cash costs (i) |
| $ | 69,864 |
| $ | (22,411 | ) | $ | 244 |
| $ | (80 | ) |
GEO produced excluding Alumbrera |
| 276,341 |
| 266,067 |
|
|
|
|
| ||||
GEO produced including Alumbrera |
| 288,700 |
| 278,737 |
|
|
|
|
| ||||
GEO |
| In thousands of |
| United States Dollars |
| ||||||||
For the six months ended June 30, |
| 2012 |
| 2011 |
| 2012 |
| 2011 |
| ||||
Cost of sales (i) |
| $ | 392,866 |
| $ | 348,879 |
| $ | 720 |
| $ | 668 |
|
Adjustments: |
|
|
|
|
|
|
|
|
| ||||
Chapada treatment and refining costs related to gold and copper |
| 12,768 |
| 11,950 |
| 23 |
| 23 |
| ||||
Inventory movements and adjustments |
| (403 | ) | (5,752 | ) | (1 | ) | (11 | ) | ||||
Commercial selling costs |
| (12,820 | ) | (15,235 | ) | (23 | ) | (29 | ) | ||||
Chapada copper revenue including copper pricing adjustment |
| (237,981 | ) | (319,941 | ) | (438 | ) | (613 | ) | ||||
Total GEO by-product cash costs (excluding Alumbrera) |
| $ | 154,430 |
| $ | 19,901 |
| $ | 281 |
| $ | 38 |
|
Minera Alumbrera (12.5% interest) by-product cash costs |
| (3,041 | ) | (38,510 | ) | (140 | ) | (1,602 | ) | ||||
Total GEO by-product cash costs (i) |
| $ | 151,389 |
| $ | (18,609 | ) | $ | 265 |
| $ | (34 | ) |
GEO produced excluding Alumbrera |
| 545,854 |
| 522,061 |
|
|
|
|
| ||||
GEO produced including Alumbrera |
| 567,530 |
| 546,105 |
|
|
|
|
| ||||
(i) Depletion, depreciation and amortization are excluded from both total cash costs and cost of sales.
ADJUSTED EARNINGS OR LOSS AND ADJUSTED EARNINGS OR LOSS PER SHARE
The Company uses the financial measures “Adjusted Earnings or Loss” and “Adjusted Earnings or Loss per share” to supplement information in its Condensed Consolidated Interim Financial Statements. The Company believes that in addition to conventional measures prepared in accordance with IFRS, the Company and certain investors and analysts use this information to evaluate the Company’s performance. The presentation of adjusted measures are not meant to be a substitute for net earnings or loss or net earnings or loss per share presented in accordance with IFRS, but rather should be evaluated in conjunction with such IFRS measures. Adjusted Earnings or Loss and Adjusted Earnings or Loss per share are calculated as net earnings excluding (a) share-based payments and other compensation, (b) unrealized foreign exchange (gains) losses related to revaluation of deferred income tax asset and liability on non-monetary items, (c) unrealized foreign exchange (gains) losses related to other items, (d) unrealized (gains) losses on commodity derivatives, (e) impairment losses and reversals, (f) deferred income tax expense (recovery) on the translation of foreign currency inter-corporate debt, (g) mark-to-market (gains) losses on share-purchase warrants, (h) write-down of investments and other assets and any other non-recurring adjustments. Non-recurring adjustments from unusual events or circumstances are reviewed from time to time based on materiality and the nature of the event or circumstance. Earnings adjustments for the comparative period reflect both continuing and discontinued operations.
The terms “Adjusted Earnings (Loss)” and “Adjusted Earnings (Loss) per share” do not have a standardized meaning prescribed by IFRS, and therefore the Company’s definitions are unlikely to be comparable to similar measures presented by other companies. Management believes that the presentation of Adjusted Earnings or Loss and Adjusted Earnings or Loss per share provide useful information to investors because they exclude non-cash and other charges and are a better indication of the Company’s profitability from operations. The items excluded from the computation of Adjusted Earnings or Loss and Adjusted Earnings or Loss per share, which are otherwise included in the determination of net earnings or loss and net earnings or loss per share prepared in accordance with IFRS, are items that the Company does not consider to be meaningful in evaluating the Company’s past financial performance or the future prospects and may hinder a comparison of its period-to-period profitability. Reconciliations of Adjusted Earnings to net earnings are provided in Section 5, Overview of Annual Results and Section 6, Overview of Quarterly Results for both the yearly and quarterly reconciliations, respectively.
ADDITIONAL MEASURES
The Company uses other financial measures the presentation of which is not meant to be a substitute for other subtotals or totals presented in accordance with IFRS, but rather should be evaluated in conjunction with such IFRS measures. The following other financial measures are used:
· Gross margin - represents the amount of revenues in excess of cost of sales excluding depletion, depreciation and amortization.
· Mine operating earnings - represents the amount of revenues in excess of cost of sales excluding depletion, depreciation and amortization and depletion, depreciation and amortization.
· Operating earnings - represents the amount of earnings before net finance income/expense and income tax expense.
· Cash flows generated from operations before changes in non-cash working capital - excludes the non-cash movement from period-to-period in working capital items including trade and other receivables, other assets, inventories, trade and other payables.
The terms described above do not have a standardized meaning prescribed by IFRS, and therefore the Company’s definitions are unlikely to be comparable to similar measures presented by other companies. The Company’s management believes that their presentation provides useful information to investors because gross margin excludes the non-cash operating cost item (i.e. depreciation, depletion and amortization), Cash flows generated from operations before changes in non-cash working capital excludes the non-cash movement in working capital items, mine operating earnings excludes expenses not directly associate with commercial production and operating earnings excludes finance and tax related expenses and income/recoveries. These, in management’s view, provide useful information of the Company’s cash flows from operations and are considered to be meaningful in evaluating the Company’s past financial performance or the future prospects.
14. SELECTED QUARTERLY FINANCIAL AND OPERATING SUMMARY
|
| June 30, |
| March 31, |
| December 31, |
| September 30, |
| ||||
(in thousands of United States Dollars, unless otherwise noted) |
| 2012 |
| 2012 |
| 2011 |
| 2011 |
| ||||
|
|
|
|
|
|
|
|
|
| ||||
Financial results (i) |
|
|
|
|
|
|
|
|
| ||||
Revenues (ii) |
| $ | 535,705 |
| $ | 559,745 |
| $ | 568,754 |
| $ | 555,211 |
|
Mine operating earnings |
| $ | 239,896 |
| $ | 280,134 |
| $ | 296,759 |
| $ | 272,163 |
|
Net earnings |
| $ | 42,913 |
| $ | 170,025 |
| $ | 89,599 |
| $ | 115,766 |
|
Adjusted earnings (iii) |
| $ | 134,887 |
| $ | 184,306 |
| $ | 184,242 |
| $ | 190,265 |
|
Cash flows from operating activities |
| $ | 139,213 |
| $ | 287,902 |
| $ | 338,850 |
| $ | 342,268 |
|
Cash flows generated from operations before changes in non-cash working capital items (iii) |
| $ | 240,767 |
| $ | 220,417 |
| $ | 320,434 |
| $ | 330,522 |
|
Cash flows to investing activities |
| $ | (247,177 | ) | $ | (256,173 | ) | $ | (314,150 | ) | $ | (210,843 | ) |
Cash flows from (to) financing activities |
| $ | (48,636 | ) | $ | 282,181 |
| $ | (39,770 | ) | $ | (60,414 | ) |
Per share financial results |
|
|
|
|
|
|
|
|
| ||||
Earnings per share |
|
|
|
|
|
|
|
|
| ||||
Basic |
| $ | 0.06 |
| $ | 0.23 |
| $ | 0.12 |
| $ | 0.16 |
|
Diluted |
| $ | 0.06 |
| $ | 0.23 |
| $ | 0.12 |
| $ | 0.16 |
|
Adjusted earnings per share (iii) |
|
|
|
|
|
|
|
|
| ||||
Basic |
| $ | 0.18 |
| $ | 0.25 |
| $ | 0.25 |
| $ | 0.26 |
|
Diluted |
| $ | 0.18 |
| $ | 0.25 |
| $ | 0.25 |
| $ | 0.26 |
|
Financial position |
|
|
|
|
|
|
|
|
| ||||
Cash and cash equivalents |
| $ | 698,884 |
| $ | 867,577 |
| $ | 550,438 |
| $ | 570,489 |
|
Total assets |
| $ | 11,190,392 |
| $ | 11,238,213 |
| $ | 10,769,940 |
| $ | 10,552,031 |
|
Total long-term liabilities |
| $ | 3,150,730 |
| $ | 3,117,393 |
| $ | 2,783,786 |
| $ | 2,794,993 |
|
|
|
|
|
|
|
|
|
|
| ||||
Production |
|
|
|
|
|
|
|
|
| ||||
Commercial GEO (iv) |
| 288,700 |
| 269,873 |
| 268,480 |
| 279,274 |
| ||||
Commissioning GEO produced (iv)(v) |
| — |
| 8,959 |
| 8,438 |
| — |
| ||||
Total GEO produced (iv) |
| 288,700 |
| 278,832 |
| 276,918 |
| 279,274 |
| ||||
By-product cash costs per GEO produced, including 12.5% equity interest in Alumbrera (iii)(iv) |
| $ | 244 |
| $ | 292 |
| $ | 174 |
| $ | 94 |
|
Co-product cash costs per GEO produced, including 12.5% equity interest in Alumbrera (iii)(iv) |
| $ | 536 |
| $ | 518 |
| $ | 486 |
| $ | 468 |
|
Chapada concentrate production (tonnes) |
| 71,801 |
| 53,665 |
| 81,396 |
| 74,312 |
| ||||
Chapada copper contained in concentrate production (millions of lbs) |
| 40.4 |
| 30.3 |
| 45.4 |
| 41.4 |
| ||||
Chapada co-product cash costs per pound of copper |
| $ | 1.34 |
| $ | 1.51 |
| $ | 1.20 |
| $ | 1.45 |
|
Alumbrera (12.5% interest) attributable concentrate production (tonnes) |
| 18,492 |
| 14,149 |
| 10,691 |
| 16,337 |
| ||||
Alumbrera (12.5% interest) attributable copper contained in concentrate production (millions of lbs) |
| 10.5 |
| 8.0 |
| 6.2 |
| 9.5 |
| ||||
Alumbrera co-product cash costs per lb of copper (iii) |
| 1.41 |
| 1.85 |
| 2.59 |
| 1.58 |
| ||||
Gold Equivalent Ounces Breakdown |
|
|
|
|
|
|
|
|
| ||||
Total gold ounces produced |
| 242,692 |
| 234,532 |
| 231,670 |
| 230,986 |
| ||||
Silver ounces produced (millions of ounces) |
| 2.3 |
| 2.2 |
| 2.3 |
| 2.4 |
| ||||
Sales |
|
|
|
|
|
|
|
|
| ||||
Total gold sales (ounces) |
| 226,521 |
| 236,990 |
| 228,539 |
| 226,157 |
| ||||
Total gold sales - continuing operations excluding Alumbrera (ounces) |
| 223,279 |
| 228,763 |
| 218,830 |
| 214,980 |
| ||||
Chapada concentrate sales (tonnes) |
| 71,656 |
| 52,765 |
| 81,436 |
| 73,417 |
| ||||
Chapada payable copper contained in concentrate sales (millions of lbs) |
| 37.4 |
| 27.3 |
| 43.6 |
| 38.7 |
| ||||
Silver sales (millions of ounces) |
| 2.3 |
| 2.2 |
| 2.2 |
| 2.6 |
| ||||
Average realized gold price per ounce (ii) |
| $ | 1,605 |
| $ | 1,696 |
| $ | 1,670 |
| $ | 1,697 |
|
Average realized copper price per pound (ii) |
| $ | 3.60 |
| $ | 3.73 |
| $ | 3.36 |
| $ | 3.98 |
|
Average realized silver price per ounce (ii) |
| $ | 26.93 |
| $ | 32.94 |
| $ | 31.29 |
| $ | 37.52 |
|
|
| June 30, |
| March 31, |
| December 31, |
| September 30, |
| ||||
(in thousands of United States Dollars) |
| 2011 |
| 2011 |
| 2010 |
| 2010 |
| ||||
Financial results |
|
|
|
|
|
|
|
|
| ||||
Revenues (ii) |
| $ | 573,283 |
| $ | 476,077 |
| $ | 535,130 |
| $ | 453,965 |
|
Mine operating earnings |
| $ | 292,488 |
| $ | 238,464 |
| $ | 273,132 |
| $ | 202,567 |
|
Earnings from continuing operations |
| $ | 194,681 |
| $ | 148,248 |
| $ | 125,569 |
| $ | 141,740 |
|
Net earnings |
| $ | 194,681 |
| $ | 148,248 |
| $ | 125,569 |
| $ | 139,244 |
|
Adjusted earnings (iii) |
| $ | 186,181 |
| $ | 152,209 |
| $ | 170,979 |
| $ | 117,253 |
|
Cash flows from operating activities of continuing operations |
| $ | 315,766 |
| $ | 228,898 |
| $ | 250,506 |
| $ | 162,281 |
|
Cash flows generated from operations before changes in non-cash working capital items (iii) |
| $ | 331,038 |
| $ | 284,379 |
| $ | 287,222 |
| $ | 210,852 |
|
Cash flows to investing activities of continuing operations |
| $ | (204,408 | ) | $ | (107,783 | ) | $ | (147,192 | ) | $ | (133,181 | ) |
Cash flows (to) from financing activities of continuing operations |
| $ | (56,836 | ) | $ | 5,451 |
| $ | (54,199 | ) | $ | (19,532 | ) |
Per share financial results |
|
|
|
|
|
|
|
|
| ||||
Earnings per share from continuing operations |
|
|
|
|
|
|
|
|
| ||||
Basic |
| $ | 0.26 |
| $ | 0.20 |
| $ | 0.17 |
| $ | 0.19 |
|
Diluted |
| $ | 0.26 |
| $ | 0.20 |
| $ | 0.17 |
| $ | 0.19 |
|
Earnings per share |
|
|
|
|
|
|
|
|
| ||||
Basic |
| $ | 0.26 |
| $ | 0.20 |
| $ | 0.17 |
| $ | 0.19 |
|
Diluted |
| $ | 0.26 |
| $ | 0.20 |
| $ | 0.17 |
| $ | 0.19 |
|
Adjusted earnings per share (iii) |
|
|
|
|
|
|
|
|
| ||||
Basic |
| $ | 0.25 |
| $ | 0.21 |
| $ | 0.23 |
| $ | 0.16 |
|
Diluted |
| $ | 0.25 |
| $ | 0.21 |
| $ | 0.23 |
| $ | 0.16 |
|
Financial position |
|
|
|
|
|
|
|
|
| ||||
Cash and cash equivalents |
| $ | 520,863 |
| $ | 460,430 |
| $ | 330,498 |
| $ | 279,691 |
|
Total assets |
| $ | 10,588,801 |
| $ | 10,419,977 |
| $ | 10,319,082 |
| $ | 10,083,956 |
|
Total long-term liabilities |
| $ | 2,835,027 |
| $ | 2,854,474 |
| $ | 2,838,324 |
| $ | 2,811,820 |
|
Production |
|
|
|
|
|
|
|
|
| ||||
Commercial GEO - continuing operations (iv) |
| 278,737 |
| 267,368 |
| 286,682 |
| 267,409 |
| ||||
Total GEO produced (iv) |
| 278,737 |
| 267,368 |
| 286,682 |
| 267,409 |
| ||||
By-product cash costs per GEO produced - continuing operations, including 12.5% equity interest in Alumbrera (iii)(iv) |
| $ | (80 | ) | $ | 14 |
| $ | (34 | ) | $ | 58 |
|
Co-product cash costs per GEO produced - continuing operations, including 12.5% equity interest in Alumbrera (iii)(iv) |
| $ | 451 |
| $ | 449 |
| $ | 465 |
| $ | 439 |
|
Chapada concentrate production (tonnes) |
| 72,350 |
| 69,236 |
| 69,869 |
| 76,808 |
| ||||
Chapada copper contained in concentrate production (millions of lbs) |
| 40.8 |
| 38.5 |
| 39.9 |
| 42.8 |
| ||||
Chapada co-product cash costs per pound of copper |
| $ | 1.32 |
| $ | 1.21 |
| $ | 1.20 |
| $ | 1.14 |
|
Alumbrera (12.5% interest) attributable concentrate production (tonnes) |
| 16,123 |
| 12,690 |
| 16,422 |
| 15,487 |
| ||||
Alumbrera (12.5% interest) attributable copper contained in concentrate production (millions of lbs) |
| 9.3 |
| 7.1 |
| 9.3 |
| 8.3 |
| ||||
Alumbrera co-product cash costs per lb of copper (iii) |
| 1.54 |
| 1.85 |
| 1.37 |
| 1.53 |
| ||||
Gold Equivalent Ounces Breakdown — Continuing Operations |
|
|
|
|
|
|
|
|
| ||||
Total gold ounces produced |
| 232,138 |
| 221,489 |
| 243,407 |
| 222,299 |
| ||||
Commercial gold oz produced |
| 2 |
|
|
|
|
|
|
| ||||
Silver ounces produced (millions of ounces) |
| 2.3 |
| 2.3 |
| 2.4 |
| 2.5 |
| ||||
Sales |
|
|
|
|
|
|
|
|
| ||||
Commercial gold sales - continuing operations (ounces) |
| 232,743 |
| 219,547 |
| 234,708 |
| 227,189 |
| ||||
Gold sales - discontinued operations (ounces) |
| — |
| — |
| — |
| — |
| ||||
Total gold sales (ounces) |
| 232,743 |
| 219,547 |
| 234,708 |
| 227,189 |
| ||||
Commercial gold sales - continuing operations excluding Alumbrera (ounces) |
| 220,376 |
|
|
| 221,757 |
| 217,094 |
| ||||
Chapada concentrate sales (tonnes) |
| 80,330 |
| 57,909 |
| 74,009 |
| 81,127 |
| ||||
Chapada payable copper contained in concentrate sales (millions of lbs) |
| 41.6 |
| 29.7 |
| 39.6 |
| 43.5 |
| ||||
Silver sales (millions of ounces) |
| 2.1 |
| 2.3 |
| 2.4 |
| 2.5 |
| ||||
Average realized gold price per ounce (ii) |
| $ | 1,509 |
| $ | 1,387 |
| $ | 1,374 |
| $ | 1,235 |
|
Average realized copper price per pound (ii) |
| $ | 4.22 |
| $ | 4.28 |
| $ | 3.81 |
| $ | 3.27 |
|
Average realized silver price per ounce (ii) |
| $ | 37.76 |
| $ | 33.99 |
| $ | 28.20 |
| $ | 19.73 |
|
(i) Results of São Vicente and São Francisco mines have been reclassified as discontinued operations (in accordance with IFRS) with restatement of prior period comparatives.
(ii) Revenues consist of sales net of sales taxes. Revenue per ounce data is calculated based on gross sales. Realized prices reflect continuing operations.
(iii) A cautionary note regarding non-GAAP measures is included in Section 13 of this Management’s Discussion and Analysis of Operations and Financial Condition.
(iv) Silver production is treated as a gold equivalent. Gold equivalent ounce calculations are based on an assumed silver to gold ratio of 50:1, for presentation purposes only. The assumed silver to gold ratio was 55:1 for 2010 and prior periods.
(v) Including commissioning gold ounces from Mercedes for 2011.
15. DISCLOSURE CONTROLS AND PROCEDURES
Disclosure controls and procedures are designed to provide reasonable assurance that all relevant information is gathered and reported to senior management, including the Company’s Chairman and Chief Executive Officer and Executive Vice President, Finance and Chief Financial Officer, on a timely basis so that appropriate decisions can be made regarding public disclosure. The Company’s system of disclosure controls and procedures includes, but is not limited to, our Timely Disclosure and Confidentiality Policy, our Code of Conduct, our Insider Trading Policy, our Corporate Controls Policy, the effective functioning of our Audit Committee and procedures in place to systematically identify matters warranting consideration of disclosure by the Audit Committee.
As at the end of the period covered by this Management’s Discussion and Analysis, management of the Company, with the participation of the Chairman and Chief Executive Officer and the Executive Vice President, Finance and Chief Financial Officer, evaluated the effectiveness of the Company’s disclosure controls and procedures as required by applicable rules of the Canadian Securities Administrators (or Canadian securities regulatory authorities). The evaluation included documentation review, enquiries and other procedures considered by management to be appropriate in the circumstances. Based on that evaluation, the Chairman and Chief Executive Officer and the Executive Vice President, Finance and Chief Financial Officer have concluded that, as of the end of the period covered by this management’s discussion and analysis, the disclosure controls and procedures (as defined in Rule 13a-15(e) under the Securities Exchange Act of 1934) were effective to provide reasonable assurance that information required to be disclosed in the Company’s annual filings and interim filings and other reports filed or submitted under applicable securities laws, is recorded, processed, summarized and reported within time periods specified by those laws and that material information is accumulated and communicated to management of the Company, including the Chairman and Chief Executive Officer and the Executive Vice President, Finance and Chief Financial Officer, as appropriate to allow timely decisions regarding required disclosure.
MANAGEMENT’S REPORT ON INTERNAL CONTROL OVER FINANCIAL REPORTING
Management of the Company is responsible for establishing and maintaining effective internal control over financial reporting as such term is defined in the rules of the United States Securities and Exchange Commission and the Canadian Securities Administrators. The Company’s internal control over financial reporting is designed to provide reasonable assurance regarding the reliability of the Company’s financial reporting for external purposes in accordance with IFRS as issued by the IASB. The Company’s internal control over financial reporting includes:
· maintaining records, that in reasonable detail, accurately and fairly reflect our transactions and dispositions of the assets of the Company;
· providing reasonable assurance that transactions are recorded as necessary for preparation of our Consolidated Financial Statements in accordance with generally accepted accounting principles;
· providing reasonable assurance that receipts and expenditures are made in accordance with authorizations of management and the directors of the Company; and
· providing reasonable assurance that unauthorized acquisition, use or disposition of company assets that could have a material effect on the Company’s Consolidated Financial Statements would be prevented or detected on a timely basis.
The Company’s internal control over financial reporting may not prevent or detect all misstatements because of inherent limitations. Additionally, projections of any evaluation of effectiveness to future periods are subject to the risk that controls may become inadequate because changes in conditions or deterioration in the degree of compliance with the Company’s policies and procedures.
CHANGES IN INTERNAL CONTROLS
During the period ended June 30, 2012, there has been no change in the Company’s internal control over financial reporting that has materially affected, or is reasonably likely to materially affect, the Company’s internal control over financial reporting.
LIMITATIONS OF CONTROLS AND PROCEDURES
The Company’s management, including the Chairman and Chief Executive Officer and the Executive Vice President, Finance and Chief Financial Officer, believe that any disclosure controls and procedures or internal controls over
financial reporting, no matter how well conceived and operated, can provide only reasonable, not absolute, assurance that the objectives of the control system are met. Further, the design of a control system must reflect the fact that there are resource constraints, and the benefits of controls must be considered relative to their costs. Because of the inherent limitations in all control systems, they cannot provide absolute assurance that all control issues and instances of fraud, if any, within the Company have been prevented or detected. These inherent limitations include the realities that judgements in decision-making can be faulty, and that breakdowns can occur because of simple error or mistake. Additionally, controls can be circumvented by the individual acts of some persons, by collusion of two or more people, or by unauthorized override of the control. The design of any systems of controls also is based in part upon certain assumptions about the likelihood of future events, and there can be no assurance that any design will succeed in achieving its stated goals under all potential future conditions. Accordingly, because of the inherent limitations in a cost effective control system, misstatements due to error or fraud may occur and not be detected.
This report provides a discussion and analysis of the financial condition and results of operations (“Management’s Discussion and Analysis”) to enable a reader to assess material changes in financial condition between June 30, 2012 and December 31, 2011 and results of operations for the periods ended June 30, 2012 and June 30, 2011.
This Management’s Discussion and Analysis has been prepared as of August 8, 2012. The Condensed Consolidated Interim Financial Statements prepared in accordance with IFRS as issued by the IASB follow this Management’s Discussion and Analysis. This Management’s Discussion and Analysis is intended to supplement and complement the Annual Audited Consolidated Financial Statements and notes thereto as at and for the year ended December 31, 2011 (collectively the “Financial Statements”). You are encouraged to review the Financial Statements in conjunction with your review of this Management’s Discussion and Analysis. This Management’s Discussion and Analysis should be read in conjunction with both the Annual Audited Consolidated Financial Statements for the year ended December 31, 2011 and the most recent Annual Information Form for the year ended December 31, 2011 on file with the Securities Commissions of all of the provinces in Canada, which are included in the 2011 Annual Report on Form 40-F on file with the United States Securities and Exchange Commission. Certain notes to the Financial Statements are specifically referred to in this Management’s Discussion and Analysis and such notes are incorporated by reference herein. All Dollar amounts in the Management’s Discussion and Analysis are in United States Dollars, unless otherwise specified.
CAUTIONARY NOTE REGARDING FORWARD-LOOKING STATEMENTS
This Management’s Discussion and Analysis contains or incorporates by reference “forward-looking statements” within the meaning of the United States Private Securities Litigation Reform Act of 1995 and “forward-looking information” under applicable Canadian securities legislation. Except for statements of historical fact relating to the Company, information contained herein constitutes forward-looking statements, including any information as to the Company’s strategy, plans or future financial or operating performance. Forward-looking statements are characterized by words such as “plan,” “expect”, “budget”, “target”, “project”, “intend”, “believe”, “anticipate”, “estimate” and other similar words, or statements that certain events or conditions “may” or “will” occur. Forward-looking statements are based on the opinions, assumptions and estimates of management considered reasonable at the date the statements are made, and are inherently subject to a variety of risks and uncertainties and other known and unknown factors that could cause actual events or results to differ materially from those projected in the forward-looking statements. These factors include the Company’s expectations in connection with the projects and exploration programs discussed herein being met, the impact of general business and economic conditions, global liquidity and credit availability on the timing of cash flows and the values of assets and liabilities based on projected future conditions, fluctuating metal prices (such as gold, copper, silver and zinc), currency exchange rates (such as the Brazilian Real, the Chilean Peso, the Argentine Peso and the Mexican Peso versus the United States Dollar), possible variations in ore grade or recovery rates, changes in the Company’s hedging program, risks related to acquisitions, changes in accounting policies, changes in the Company’s corporate mineral resources, risks related to non-core mine disposition, changes in project parameters as plans continue to be refined, changes in project development, construction production and commissioning time frames, risks related to joint venture operations, the possibility of project cost overruns or unanticipated costs and expenses, higher prices for fuel, steel, power, labour and other consumables contributing to higher costs and general risks of the mining industry, failure of plant, equipment or processes to operate as anticipated, unexpected changes in mine life, final pricing for concentrate sales, unanticipated results of future studies, seasonality and unanticipated weather changes, costs and timing of the development of new deposits, success of exploration activities, permitting time lines, government
regulation and the risk of government expropriation or nationalization of mining operations, environmental risks, unanticipated reclamation expenses, title disputes or claims, limitations on insurance coverage and timing and possible outcome of pending litigation and labour disputes, as well as those risk factors discussed or referred to in the Company’s annual Management’s Discussion and Analysis and Annual Information Form for the year ended December 31, 2011 filed with the securities regulatory authorities in all provinces of Canada and available at www.sedar.com, and the Company’s Annual Report on Form 40-F filed with the United States Securities and Exchange Commission. Although the Company has attempted to identify important factors that could cause actual actions, events or results to differ materially from those described in forward-looking statements, there may be other factors that cause actions, events or results not to be anticipated, estimated or intended. There can be no assurance that forward-looking statements will prove to be accurate, as actual results and future events could differ materially from those anticipated in such statements. The Company undertakes no obligation to update forward-looking statements if circumstances or management’s estimates, assumptions or opinions should change, except as required by applicable law. The reader is cautioned not to place undue reliance on forward-looking statements. The forward-looking information contained herein is presented for the purpose of assisting investors in understanding the Company’s expected financial and operational performance and results as at and for the periods ended on the dates presented in the Company’s plans and objectives and may not be appropriate for other purposes.
CAUTIONARY NOTE REGARDING MINERAL RESERVES AND MINERAL RESOURCES
Readers should refer to the Annual Information Form of the Company for the year ended December 31, 2011 and other continuous disclosure documents filed by the Company since January 1, 2012 available at www.sedar.com, for further information on mineral reserves and mineral resources, which is subject to the qualifications and notes set forth therein.
CAUTIONARY NOTE TO UNITED STATES INVESTORS CONCERNING ESTIMATES OF MINERAL RESERVES AND MINERAL RESOURCES
This Management’s Discussion and Analysis uses the terms “Measured”, “Indicated” and “Inferred” Mineral Resources. United States investors are advised that while such terms are recognized and required by Canadian regulations, the United States Securities and Exchange Commission does not recognize them. “Inferred Mineral Resources” have a great amount of uncertainty as to their existence, and as to their economic and legal feasibility. It cannot be assumed that all or any part of an Inferred Mineral Resource will ever be upgraded to a higher category. Under Canadian rules, estimates of Inferred Mineral Resources may not form the basis of feasibility or other economic studies. United States investors are cautioned not to assume that all or any part of Measured or Indicated Mineral Resources will ever be converted into Mineral Reserves. United States investors are also cautioned not to assume that all or any part of an Inferred Mineral Resource exists, or is economically or legally mineable.
*************