|
|
| Rock solid resources. |
| Proven advice.TM |
YAMANA GOLD INC.
TECHNICAL REPORT ON THE
EL PEÑÓN MINE, ANTOFAGASTA
REGION (II), CHILE
NI 43-101 Report
Qualified Persons:
Holger Krutzelmann, P.Eng.
Normand Lecuyer, P.Eng.
Chester M. Moore, P.Eng.
March 2, 2018
RPA 55 University Ave. Suite 501 | Toronto, ON, Canada M5J 2H7 | T + 1 (416) 947 0907 www.rpacan.com
Report Control Form |
|
|
|
|
|
|
|
|
|
|
|
|
|
Document Title |
| Technical Report on the El Peñón Mine, Antofagasta Region (II), Chile | ||||
|
|
|
|
|
|
|
Client Name & Address |
| Yamana Gold Inc. |
|
|
|
|
|
| Royal Bank Plaza, North Tower |
|
|
|
|
|
| Suite 2200 |
|
|
|
|
|
| Toronto, Ontario |
|
|
|
|
|
| M5J 2J3 |
|
|
|
|
|
|
|
|
|
|
|
Document Reference |
| Project # 2931 |
| Status & Issue No. |
| FINAL Version |
|
|
|
|
|
|
|
Issue Date |
| March 2, 2018 |
|
|
|
|
|
|
|
|
|
|
|
Lead Author |
| Holger Krutzelmann |
| (Signed) |
|
|
|
|
|
|
|
|
|
Peer Reviewer |
| Deborah McCombe |
| (Signed) |
|
|
|
|
|
|
|
|
|
Project Manager Approval |
| Chester Moore |
| (Signed) |
|
|
|
|
|
|
|
|
|
Project Director Approval |
| Deborah McCombe |
| (Signed) |
|
|
|
|
|
|
|
|
|
Report Distribution |
| Name |
| No. of Copies | ||
|
| Client |
|
| ||
|
|
|
|
| ||
|
| RPA Filing |
| 1 (project box) | ||
Roscoe Postle Associates Inc.
55 University Avenue, Suite 501
Toronto, ON M5J 2H7
Canada
Tel: +1 416 947 0907
Fax: +1 416 947 0395
mining@rpacan.com
| PAGE |
1 SUMMARY | 1-1 |
Executive Summary | 1-1 |
Economic Analysis | 1-6 |
Technical Summary | 1-6 |
2 INTRODUCTION | 2-1 |
3 RELIANCE ON OTHER EXPERTS | 3-1 |
4 PROPERTY DESCRIPTION AND LOCATION | 4-1 |
Land Tenure | 4-1 |
5 ACCESSIBILITY, CLIMATE, LOCAL RESOURCES, INFRASTRUCTURE AND PHYSIOGRAPHY | 5-1 |
6 HISTORY | 6-1 |
7 GEOLOGICAL SETTING AND MINERALIZATION | 7-1 |
Regional Geology | 7-1 |
Local Geology | 7-3 |
8 DEPOSIT TYPES | 8-1 |
9 EXPLORATION | 9-1 |
10 DRILLING | 10-1 |
11 SAMPLE PREPARATION, ANALYSES AND SECURITY | 11-1 |
12 DATA VERIFICATION | 12-1 |
13 MINERAL PROCESSING AND METALLURGICAL TESTING | 13-1 |
Metallurgical Testing | 13-1 |
Historical Mill Production | 13-7 |
14 MINERAL RESOURCE ESTIMATE | 14-1 |
Mineral Resource Summary | 14-1 |
Resource Database | 14-6 |
Exploratory Data Analysis | 14-6 |
Bulk Density | 14-10 |
Topographic Surfaces | 14-10 |
Geological Interpretation | 14-11 |
Compositing | 14-12 |
Variography | 14-13 |
Block Models | 14-15 |
Interpolation Strategy | 14-15 |
Declustering | 14-16 |
Boundary Definition | 14-16 |
Capping and Outlier Restriction | 14-16 |
Unfolding | 14-19 |
Validation | 14-19 |
Classification | 14-25 |
Cut-off Grade | 14-26 |
Dilution | 14-26 |
Gold Equivalent Factor | 14-28 |
15 MINERAL RESERVE ESTIMATE | 15-1 |
Summary | 15-1 |
16 MINING METHODS | 16-1 |
Mine Design, Mining Method | 16-1 |
Geomechanics, Ground Support | 16-7 |
Mine Planning | 16-7 |
Mine Development | 16-7 |
Mine Equipment | 16-13 |
17 RECOVERY METHODS | 17-1 |
18 PROJECT INFRASTRUCTURE | 18-1 |
19 MARKET STUDIES AND CONTRACTS | 19-1 |
Markets | 19-1 |
20 ENVIRONMENTAL STUDIES, PERMITTING, AND SOCIAL OR COMMUNITY IMPACT | 20-1 |
21 CAPITAL AND OPERATING COSTS | 21-1 |
Capital Costs | 21-1 |
Operating Costs | 21-1 |
22 ECONOMIC ANALYSIS | 22-1 |
23 ADJACENT PROPERTIES | 23-1 |
24 OTHER RELEVANT DATA AND INFORMATION | 24-1 |
25 INTERPRETATION AND CONCLUSIONS | 25-1 |
26 RECOMMENDATIONS | 26-1 |
27 REFERENCES | 27-1 |
28 DATE AND SIGNATURE PAGE | 28-1 |
29 CERTIFICATE OF QUALIFIED PERSON | 29-1 |
30 APPENDIX 1 | 30-1 |
Land Tenure | 30-1 |
LIST OF TABLES
|
| PAGE |
Table 1-1 | Mineral Resource Estimate — December 31, 2017 | 1-2 |
Table 1-2 | Mineral Reserve Estimate — December 31, 2017 | 1-3 |
Table 6-1 | Historical Production to December 31, 2017 | 6-2 |
Table 10-1 | Drill Summary | 10-1 |
Table 11-1 | CRM Statistics | 11-5 |
Table 11-2 | Blank Statistics | 11-6 |
Table 11-3 | Sterile Sample Statistics | 11-6 |
Table 13-1 | Metallurgical Testwork by Vein | 13-3 |
Table 13-2 | Gold Recoveries by Geometallurgical Unit | 13-4 |
Table 13-3 | Silver Recoveries by Geometallurgical Unit | 13-4 |
Table 13-4 | Average Cyanide Consumption by Geometallurgical Unit | 13-5 |
Table 13-5 | Historical Bond Work Index Testwork | 13-6 |
Table 13-6 | Average Bond Work Index by Geometallurgical Unit | 13-6 |
Table 13-7 | Historical Mill Production | 13-7 |
Table 14-1 | Mineral Resource Estimate — December 31, 2017 | 14-2 |
Table 14-2 | Mineral Resource Estimates by Vein — December 31, 2017 | 14-3 |
Table 14-3 | Sample Lengths in Veins | 14-7 |
Table 14-4 | Bulk Density Assignments by Block Model | 14-10 |
Table 14-5 | Typical Experimental Correlogram Parameters | 14-13 |
Table 14-6 | Common Block Model Attributes | 14-15 |
Table 14-7 | Typical Grade Estimation Search Parameters | 14-16 |
Table 14-8 | Yamana Capping Levels by Vein and Domain | 14-18 |
Table 14-9 | Composite Versus Block Grades | 14-21 |
Table 14-10 | ID3 Versus NN Block Grades | 14-22 |
Table 14-11 | Cut-off Grade Parameters | 14-26 |
Table 14-12 | SMU Design Parameters | 14-27 |
Table 15-1 | Mineral Reserve Estimate — December 31, 2017 | 15-1 |
Table 15-2 | Mineral Reserve Estimates by Vein— December 31, 2017 | 15-2 |
Table 15-3 | SMU Drift Parameters | 15-7 |
Table 15-4 | Economic Parameters | 15-7 |
Table 15-5 | SMU Mining Parameters | 15-9 |
Table 15-6 | Drift and Stope Dilution | 15-11 |
Table 15-7 | Fl Reconciliation of Long Term and Short Term Plans | 15-15 |
Table 15-8 | F2 Reconciliation of Mine Production and Plant | 15-15 |
Table 16-1 | Mine Development Achieved | 16-8 |
Table 16-2 | Mine Development in LOM | 16-8 |
Table 16-3 | Mine Material Moved | 16-9 |
Table 16-4 | Life of Mine Plan | 16-9 |
Table 16-5 | Equipment List | 16-13 |
Table 17-1 | Reagent/Supply Consumptions | 17-9 |
Table 19-1 | Summary of Major Contracts | 19-1 |
Table 20-1 | Environmental Monitoring | 20-2 |
Table 20-2 | Permit Status | 20-4 |
Table 21-1 | Sustaining Capital Costs (US$000) | 21-1 |
Table 21-2 | Mine Operating Costs December 31, 2017 (YTD) | 21-2 |
Table 21-3 | Mine Operating Costs for LOM | 21-2 |
Table 21-4 | Manpower List | 21-3 |
LIST OF FIGURES
|
| PAGE |
Figure 4-1 | Location Map | 4-3 |
Figure 4-2 | Property Map | 4-4 |
Figure 7-1 | Paleocene Volcanic Belt | 7-2 |
Figure 7-2A | Local Geology | 7-4 |
Figure 7-2B | Geological Legend | 7-5 |
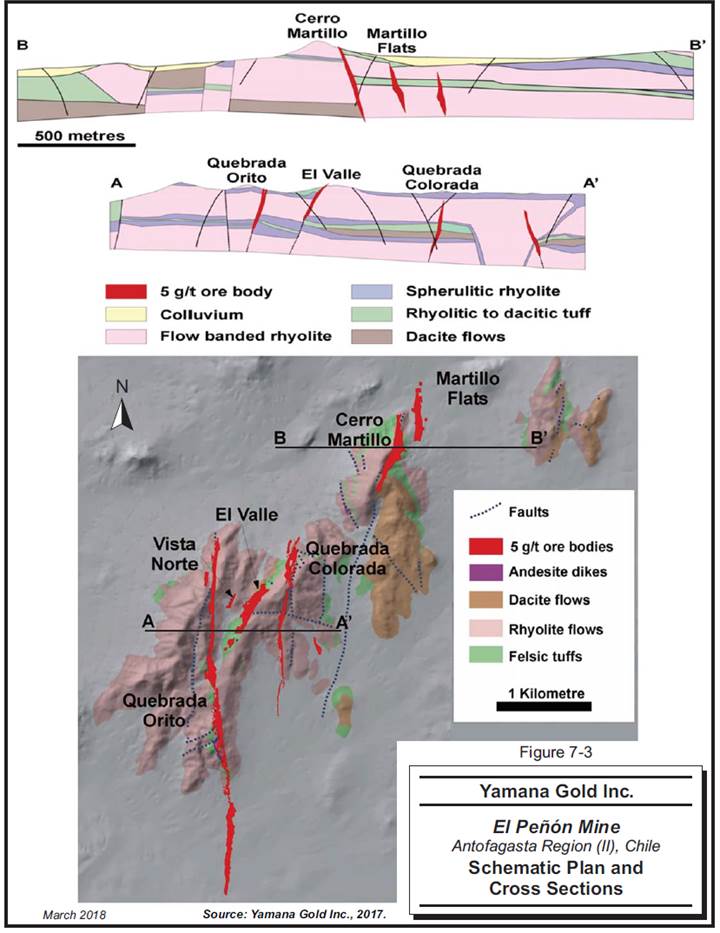
Figure 7-3 | Schematic Plan and Cross Sections | 7-7 |
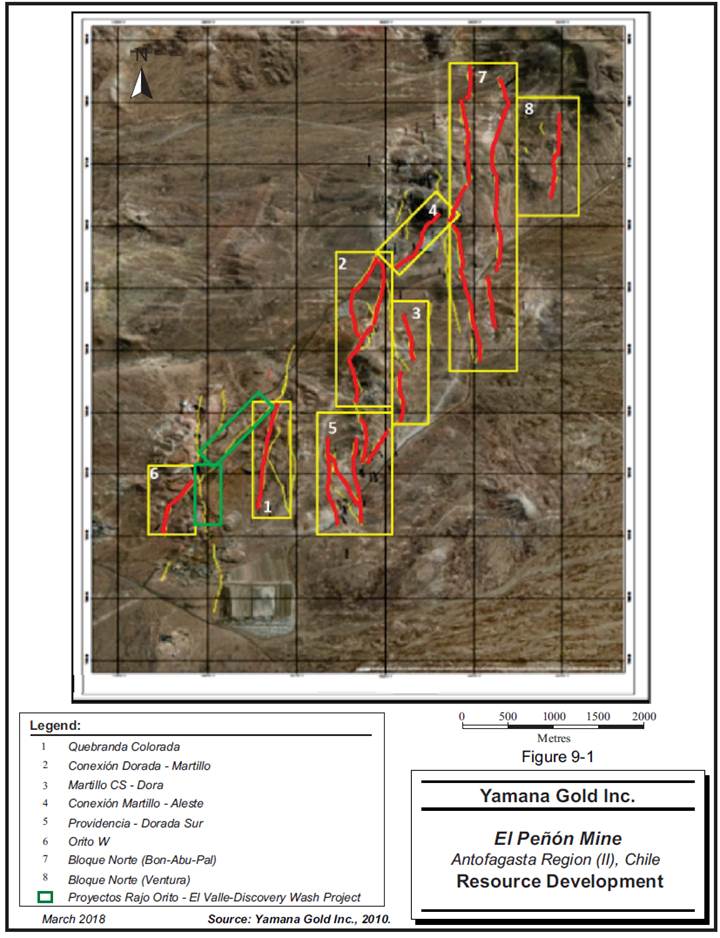
Figure 9-1 | Resource Development | 9-2 |
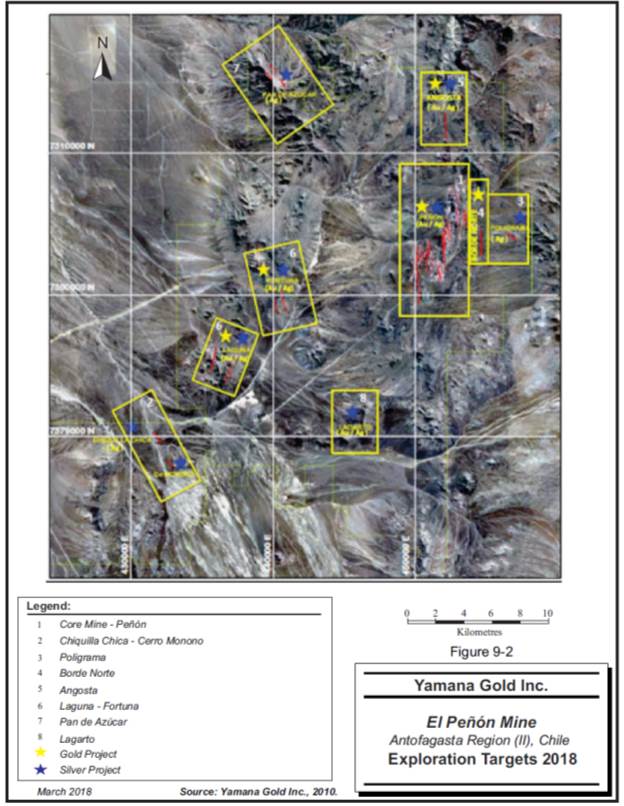
Figure 9-2 | Exploration Targets 2018 | 9-6 |
Figure 10-1 | Drill Plan | 10-2 |
Figure 10-2 | Drill Section, Caseron 505 | 10-3 |
Figure 11-1 | Pulp Duplicate Control Charts | 11-7 |
Figure 11-2 | External Duplicate Control Charts | 11-9 |
Figure 14-1 | Sample Lengths in Veins | 14-8 |
Figure 14-2 | Sample Statistics | 14-9 |
Figure 14-3 | UGGS Wireframe Construction | 14-12 |
Figure 14-4 | Typical Correlograms | 14-14 |
Figure 14-5 | Example Swath Plots and Histogram (Esmeralda — Au) | 14-23 |
Figure 14-6 | Plan View of Blocks, Samples, and Composites (Au g/t, 505) | 14-24 |
Figure 15-1 | Mineral Reserves Process | 15-6 |
Figure 15-2 | ELOS Dilution Graph | 15-12 |
Figure 15-3 | Mined Material | 15-16 |
Figure 16-1 | El Peñón Mine Layout | 16-2 |
Figure 16-2 | Schematic Bench and Fill Mining | 16-4 |
Figure 16-3 | Split Blast Face | 16-5 |
Figure 16-4 | Bench and Fill Stope with Down Holes and Uppers | 16-6 |
Figure 16-5 | Ventilation Schematic | 16-12 |
Figure 17-1 | Process Flowsheet | 17-2 |
Figure 17-2 | Tailings Storage Area | 17-7 |
LIST OF APPENDIX FIGURES & TABLES
|
| PAGE |
Table 30-1 | El Peñón Exploitation Claim List | 30-2 |
Table 30-2 | PAV Exploitation Claim List | 30-11 |
1 SUMMARY
EXECUTIVE SUMMARY
Roscoe Postle Associates Inc. (RPA) was retained by Yamana Gold Inc. (Yamana) to prepare an independent Technical Report on the El Peñón gold-silver deposit, located near Antofagasta in northern Chile. The purpose of this report is to provide Yamana with an independent assessment of the Mineral Reserves and Mineral Resources to support public disclosure of information on a material operation. This Technical Report conforms to NI 43-101 Standards of Disclosure for Mineral Projects (NI 43-101). RPA visited the property from August 7 to 9, 2017.
Yamana is a Canadian reporting issuer listed on the Toronto Stock Exchange (TSX), and the New York Stock Exchange (NYSE). Yamana is involved in the acquisition, exploration, and development of gold properties in North and South America. Yamana operates a portfolio of mines in Brazil, Chile, and Argentina. The company also holds interests in the Alumbrera mine in Argentina and the Canadian Malartic mine in Canada.
In the third quarter of 2007, Yamana acquired and merged with Meridian Gold Inc. (Meridian), a mid-tier gold producer with two mining operations in Chile and development and exploration projects throughout the Americas. The El Peñón Mine, owned by Yamana’s subsidiary Minera Meridian Limitada, was one of Meridian’s gold producers in Chile.
The El Peñón Mine currently comprises the following major assets and facilities:
· The underground mine with production of approximately 3,000 tonnes per day (tpd) from several mineralized structures.
· The physical plant site including the administrative office complex and associated facilities, the mill and associated facilities such as the laboratories, ore stockpiles, waste dumps, coarse ore storage, workshops, warehouses, and the accommodation complex and associated facilities such as cafeterias and recreation facilities.
· Facilities providing basic infrastructure to the mine, including electric power, water treatment and supply, and sewage treatment.
· �� Underground infrastructure including mine ramps, ventilation raises, maintenance shops, and mobile equipment fleet.
· Access by highway and gravel roads to Antofagasta via the national road system.
Scott Wilson RPA, a predecessor company to RPA, carried out a previous audit of the Mineral Resources and Mineral Reserves of the El Peñón deposit with the related Technical Report completed on February 11, 2008. In December 2008, Scott Wilson RPA carried out a subsequent review of the Mineral Resources and Mineral Reserves at the mine. Subsequent audits and Technical Reports were completed on December 7, 2010 and September 12, 2017.
The December 31, 2017 Mineral Resource estimate, exclusive of Mineral Reserves, is listed in Table 1-1.
TABLE 1-1 MINERAL RESOURCE ESTIMATE — DECEMBER 31, 2017
Yamana Gold Inc. - El Peñón Mine
|
| Tonnes |
| Grade |
| Contained Metal |
| ||||
Category |
| (000 t) |
| (g/t Au) |
| (g/t Ag) |
| (000 oz Au) |
| (000 oz Ag) |
|
Measured |
| 311.7 |
| 8.56 |
| 191.0 |
| 85.8 |
| 1,914.1 |
|
Indicated |
| 1,115.9 |
| 6.47 |
| 224.3 |
| 232.0 |
| 8,047.7 |
|
Total Measured + Indicated |
| 1,427.6 |
| 6.92 |
| 217.0 |
| 317.8 |
| 9,961.8 |
|
Total Inferred |
| 17,500 |
| 1.7 |
| 60 |
| 960 |
| 33,500 |
|
Notes:
1. CIM (2014) definitions were followed for Mineral Resources.
2. A cut-off grade of 2.71 g/t AuEq was used for all zones, except for the Pampa Augusta Victoria, Fortuna-Dominador-Chiquilla Chica zones which used 2.82 g/t AuEq, 2.79 g/t AuEq and 2.81 g/t AuEq, respectively. Cut-off grades of 0.50 g/t AuEq and 0.80 g/t AuEq were used for tailings and low grade stocks reporting, respectively.
3. Mineral Resources were estimated considering long-term gold and silver prices of US$1,600/oz and US$24/oz and gold and silver mill recoveries of 95% and 86.5%, respectively. Gold and silver recoveries of 60% and 30% were used for estimating resources contained in tailings whiles recoveries of 75% and 70% were used for estimating resources contained in low-grade stocks.
4. While the results are presented undiluted and in-situ, the reported Mineral Resources consider minimum mining widths and expected dilutions (variable by vein) to determine reasonable prospects of economic extraction for each vein.
5. Bulk densities used vary between 2.36 t/m3 and 2.57 t/m3 for Mineral Resources contained in veins. Bulk densities of 1.60 t/m3 and 1.75 t/m3 were used to estimate Mineral Resources contained in low-grade stocks and tailings respectively.
6. Mineral Resources are reported exclusive of Mineral Reserves.
7. Mineral Resources that are not Mineral Reserves do not have demonstrated economic viability.
8. Numbers may not add due to rounding.
RPA is not aware of any environmental, permitting, legal, title, taxation, socio-economic, marketing, political, or other relevant factors that could materially affect the Mineral Resource estimate.
The December 31, 2017 Mineral Reserve estimate is listed in Table 1-2.
TABLE 1-2 MINERAL RESERVE ESTIMATE — DECEMBER 31, 2017
Yamana Gold Inc. — El Peñón Mine
|
| Tonnage |
| Grade |
| Contained Metal |
| ||||
Category |
| (000 t) |
| (g/t Au) |
| (g/t Ag) |
| (000 oz Au) |
| (000 oz Ag) |
|
Proven |
| 1,061.8 |
| 5.90 |
| 192.4 |
| 201.2 |
| 6,567.4 |
|
Probable |
| 3,331.8 |
| 5.25 |
| 158.8 |
| 562.6 |
| 17,011.0 |
|
Total |
| 4,393.6 |
| 5.41 |
| 166.9 |
| 763.8 |
| 23,578.4 |
|
Notes:
1. CIM (2014) definitions were followed for Mineral Reserves.
2. Mineral Reserves are estimated using processing recoveries from a geometallurgical model, as recoveries are variable by ore type.
3. A cut-off grade of 3.48 g/t AuEq was used in the Mineral Reserve for most veins except as follows: a cut-off grade of 3.62 g/t AuEq used for the Elizabeth and Victoria veins in the Pampa Augusta Victoria Area (for a US$5.24/t additional transportation cost) and a cut-off of 3.59 g/t AuEq used for the Fortuna, Dominador, and Laguna veins in the Fortuna and Laguna Area (for a US$3.86/t additional transportation cost).
4. Mineral Reserves are estimated using an average long-term gold price of US$1,250/oz and a silver price of US$18/oz.
5. A minimum mining width of 0.60 m to 1.0 m was used depending on the vein.
6. Bulk density varies from 2.36 t/m3 to 2.57 t/m3.
7. The Selective Mining Units (SMU) include Inferred Mineral Resources and unclassified material (blocks located outside of the underground geological wireframe + grade shell (UGGS)). These materials were treated as dilution for mine planning and Mineral Reserve estimation purposes. Zero gold and silver grades have been assigned to them.
8. Numbers may not add due to rounding.
RPA is not aware of any mining, metallurgical, infrastructure, permitting, or other relevant factors that could materially affect the Mineral Reserve estimate.
CONCLUSIONS
RPA offers the following conclusions:
RISKS
· The mine has been in production for 18 years and is a mature operation. In RPA’s opinion, there are not any significant risks and uncertainties that could reasonably be expected to affect the reliability or confidence in the exploration information, Mineral Resource or Mineral Reserve estimates, or projected economic outcomes.
GEOLOGY AND MINERAL RESOURCES
· The deposits at El Peñón are low to intermediate epithermal gold-silver deposits, hosted in steeply dipping fault-controlled veins following rhyolite dome emplacement. Gold and silver mineralization comprises disseminations of electrum, native gold and silver, acanthite, silver sulphosalts and halides, plus accessory pyrite occurring with quartz, adularia, carbonates, and clay minerals.
· There are 22 main vein zones and many subsidiary veins in nine vein systems that have supported, support currently, or are planned to support surface and underground mining operations. Vein widths range from decimetre-scale to over 20 m. Individual
mineralized shoots measure from less than one kilometre to four kilometres in strike length, and up to 350 m in the down-dip direction.
· Sampling and assaying are adequately completed and have been generally carried out using industry standard quality assurance/quality control (QA/QC) practices. The sample preparation, analysis, and security procedures at El Peñón are suitable for use in the estimation of Mineral Resources.
· To avoid sample sharing between spatially close structures, each independent splay or parallel vein is considered an independent estimation domain. Spatially disconnected splay wireframes were flagged as separate estimation domains. In RPA’s opinion, this improved interpretation technique will result in better defined resources than previous estimates.
· The Mineral Resource estimate is appropriate for the style of mineralization and the resource models are reasonable and acceptable to support the Mineral Resource estimates.
· For these estimations, Yamana used a stope optimizer to determine potential economic viability of resource blocks. This resulted in a more realistic estimate of resources remaining after reserve estimation.
· The Measured plus Indicated Mineral Resources are estimated to be 1,427,600 t at 6.92 g/t Au and 217.0 g/t Ag containing 317,800 oz of gold and 9,962,000 oz of silver. Inferred Mineral Resources are estimated at 17,469,000 t at 1.7 g/t Au and 60 g/t Ag containing 960,000 oz of gold and 33,506,000 oz of silver. RPA notes that the resources are reasonable, are in accordance with Canadian Institute of Mining, Metallurgy and Petroleum (CIM) definitions, and are disclosed in compliance with NI 43-101.
· Exploration potential exists to infill resources in the mines, to discover extensions of current deposits, and to discover new deposits in the El Peñón district.
MINING AND MINERAL RESERVES
· In RPA’s opinion, the conversion process of Mineral Resources to Mineral Reserves is robust and ensures each Selective Mining Unit (SMU) has positive economic value.
· The Proven plus Probable Mineral Reserves are estimated to be 4,393,600 t at 5.41 g/t Au and 166.9 g/t Ag containing 763,800 oz of gold and 23,578,400 oz of silver. RPA notes that the reserves are reasonable, and are in accordance with CIM Definition Standards for Mineral Resources and Mineral Reserves, dated May 10, 2014.
· Mineral Reserves include small quantities of open pit and low-grade stockpile material.
· The amount of additional material mined from Mineral Resources and also from outside of the block model has been reduced over the last several years as a result of improved planning procedures.
· Reconciliation of the long-term and short-term plans for Mineral Reserves shows that the variances are improving. Yamana is using the SMU approach for mine planning and Mineral Reserve estimation and has improved the block modelling procedures,
which in turn has improved the quality of mine planning and consequently resulted in more accurate overall results. In RPA’s opinion, the reconciliation is within reasonable limits and efforts to track reconciliation should continue on a regular basis.
· In RPA’s opinion, El Peñón’s forecast mine and plant production targets are attainable and reasonable, and the procedures used to forecast the life of mine (LOM) plan are reasonable. Forecast gold production averages 150,000 oz from 2018 to 2021 and declines to 91,000 oz in 2022. Forecast silver production averages 4,307,000 oz from 2018 to 2021 and declines to 2,639,000 oz in 2022.
METALLURGY AND MINERAL PROCESSING
· The plant operation has been operating well, with tonnages being generally consistent over the last few years, declining in 2017 as result of the rightsizing of the operation in late 2016. Changes in recoveries of both gold and silver have been in line with the changes in head grade, and somewhat higher in 2017 due to reduced throughput.
ENVIRONMENTAL CONSIDERATIONS
· All required permits for operation have been granted, or applied for, with reasonable expectation of being granted in due course.
CAPITAL AND OPERATING COSTS
· The total capital expenditures estimated by Yamana for the LOM operations are $194 million in sustaining capital, including mine development (56%), equipment and infrastructure (21%), and reclamation and closure (23%). These costs include mine and plant costs as well as administration capital, but do not include working capital, exploration or any future expansions. RPA is of the opinion that the total estimated capital expenditures for the mine are reasonable based on the calculated Mineral Reserves.
· A total of 177,000 m of drilling is planned for 2018 to 2020 at a budgeted cost of US$36,000,000. Yamana considers allocating additional discretionary exploration funding based on success.
· Operating costs are forecast to average US$147 per tonne over the LOM. RPA is of the opinion that the total estimated operating costs for the mine are reasonable.
RECOMMENDATIONS
RPA offers the following recommendations:
GEOLOGY AND MINERAL RESOURCES
· Yamana geologists have prepared a strategic drill program to infill resources, complete local exploration near the mines, and to continue district exploration. The amount of drilling proposed is based on the past success rate of adding resources at El Peñón. A total of 177,000 m of drilling is planned for 2018 to 2020 at a budgeted cost of US$36,000,000. Yamana considers allocating additional discretionary exploration funding based on results. Considering the ongoing exploration successes at El Peñón
over the years, RPA concurs with this proposed exploration program and recommends that it be carried out as defined.
MINING AND MINERAL RESERVES
· While the drifts are quite close to the planned design, the stopes were 11% larger than planned in 2017, resulting in higher than designed dilution rates. The equivalent of overbreak/slough (ELOS) design of 0.25 m should be monitored going forward to assess whether adjustment of the ELOS is warranted.
· The extraction rate for stopes is set at 100% for the majority (86%) of the stopes, resulting in an average extraction rate of near 98%. Mine staff apply an extraction factor, which averages approximately 95% during the mine planning process, however this should be reflected in the Mineral Reserves statement.
ECONOMIC ANALYSIS
This section is not required as Yamana is a producing issuer, the property is currently in production, and there is no material expansion of current production.
RPA completed an after-tax cash flow projection generated from the LOM production schedule and capital and operating cost estimates to confirm the positive economics of the stated Mineral Reserves in this report. The cash flow was prepared using the stated Mineral Reserves, metal prices, and cut-off grades.
TECHNICAL SUMMARY
PROPERTY DESCRIPTION AND LOCATION
The El Peñón Mine is located in north central Chile, at latitude 24°40’ S and longitude 69°50’ W, approximately 165 km southeast of Antofagasta. The site is in the Atacama Desert, approximately midway between the Pacific coast and the border with Argentina. There is little to no vegetation or wildlife in the area around the mine.
LAND TENURE
The El Peñón property consists of 436 individual mining exploitation claims owned by Meridian, a subsidiary of Yamana. The claims comprise an area of 90,087 ha covering the El Peñón Mine, the Fortuna area, the Laguna area, the Pampa Augusta Victoria (PAV) area, and surrounding exploration lands.
EXISTING INFRASTRUCTURE
Surface infrastructure at El Peñón comprises a physical plant site, including administrative office complex and associated facilities, accommodation complex, open pit and underground mines, the mill and associated facilities such as the laboratories, ore stockpiles, waste dumps, coarse ore storage, backup power plant, workshops, warehouses, and dry facilities.
Underground infrastructure includes portals, access ramps, ventilation raises, maintenance shops, and mobile equipment fleet.
HISTORY
The discovery of El Peñón was the result of successful grassroots exploration carried out by Meridian geologists through the early 1990s. Regional exploration focusing on Early to Mid-Eocene volcanic belts in northern Chile led to the acquisition of the El Peñón property in 1993. Trenching carried out that year, followed by a 13-hole drilling program, discovered significant Au-Ag mineralization. In 1994, the first hole of a follow-up program intersected 100 m grading 10.9 g/t Au and 123.4 g/t Ag in what eventually became the Quebrada Orito deposit.
In July 1998, Meridian made the decision to place the property in production, and construction on a 2,000 tpd mine and mill facility commenced later that same year. Production began in September 1999, ramping up to full capacity by January 2000 and has continued to the present day.
Since September 1999, the operation has run continually, treating both open pit and underground ore. As of December 31, 2017, the mine has produced approximately 18,053,234 tonnes of ore grading 8.94 g/t Au and 234.99 g/t Ag.
GEOLOGY AND MINERALIZATION
The El Peñón Mine is located in the Central Depression of the Atacama Desert. The region is underlain by Late Cretaceous to Early Eocene magmatic arc rocks, known as the Paleocene belt.
The mineralization at El Peñón is hosted by near-horizontal to gently dipping Eocene to Paleocene basaltic to rhyolitic volcanic rocks. The stratigraphic sequence consists of a lower sequence of volcanic breccia and andesitic to basaltic flows, overlain by rhyolitic to dacitic
pyroclastic rocks, dacitic to andesitic flows, and volcanic breccia. Rhyolitic intrusives, domes, and associated flows are intercalated with earlier volcanic units.
The distribution of Cretaceous and Eocene volcanic rocks is controlled by graben structures bounded by north-northeast trending faults. These are steeply dipping regional-scale structures with displacements in the order of hundreds of metres. The principal direction for late dikes and many of the highest grade mineralized faults is parallel to the bounding faults. Mineralized faults dip steeply eastward on the east side of the property and westward on the west side, in a fashion implying a horst/graben extensional structure.
The deposits at El Peñón are epithermal gold-silver deposits, hosted in steeply dipping fault-controlled veins. Gold and silver mineralization comprises disseminations of electrum, native gold and silver, acanthite, silver sulphosalts and halides, plus accessory pyrite occurring with quartz, adularia, carbonates, and clay minerals.
EXPLORATION
Exploration work completed to date has defined 22 main mineralized zones and subsidiary veins, within ten geological trends.
Exploration has been successful in expanding the footprint of mineralization at site through programs of geologic mapping, geochemistry, geophysics, and abundant surface and underground drilling within a northeast trend starting, at the El Peñón area, with Quebrada Orito in the southwest and ending with Angosta in the northeast. Exploration has also been successful at the Fortuna and PAV areas located to the southwest and to the north of El Peñón, respectively. Geophysical anomalies and positive drill intersections remain to be followed up in all areas.
MINERAL RESOURCES
RPA has reviewed the Mineral Resource estimates of the El Peñón Mine, as estimated by Yamana as of December 31, 2017. RPA carried out a number of checks to verify the various procedures and numerical calculations used in the Yamana estimates. This included detailed tracing of the methodology of estimating tonnage and grade of resource blocks. With few exceptions, RPA found that values and compilations of gold grades were accurately recorded and calculated as provided in block models. For these estimations, Yamana introduced the
use of a stope optimizer to determine potential economic viability of resource blocks. This resulted in a lower overall tonnage but a more realistic estimate of resources remaining after reserve estimation.
As part of this audit, RPA carried out an independent estimate of seven veins (Al Este, Caseron 505, Cerro Martillo, Dorada, Esmeralda, Magenta, and Providencia) to allow for better comparison of the Yamana estimates with the RPA estimates, based on the underground drill hole data and wireframes provided. It is RPA’s opinion that the Yamana estimates and the RPA check estimates show acceptable agreement.
The December 31, 2017 El Peñón total Measured and Indicated Mineral Resources, exclusive of Mineral Reserves, estimated by Yamana included 1.43 million tonnes at an average grade of approximately 6.9 g/t Au and 217 g/t Ag. This equates to approximately 317,800 ounces of gold and 9.96 million ounces of silver. The deposits were also estimated to contain approximately 17.5 million tonnes of Inferred Mineral Resources at an average grade of approximately 1.7 g/t Au and 60 g/t Ag, which equates to approximately 960,000 ounces of gold, and 33.5 million ounces of silver. In RPA’s opinion, these resource estimates are prepared in accordance with CIM definitions and are disclosed in compliance with NI 43-101.
MINERAL RESERVES
Mineral Reserves at the El Peñón Mine are estimated using Vulcan software including the MineModeller UG/OP, GeoModeller, Stope Optimizer, and Gantt Scheduler. The process includes mine designs and parameters. Selective Mining Units (SMU) are designed for each vein using metal prices, recoveries and operating costs to determine an economic value of each SMU. SMUs with negative values are excluded from further consideration, except for drift SMUs that are above the marginal cut-off grade.
The economic value of each potential mining outline is calculated using forecast long-term prices of $1,250/oz Au and $18/oz Ag, using diluted tonnes and grades. Net block values are weighted against forecast costs and metallurgical recoveries for each potential mining outline. These combined economic revenue and cost models are part of the SMU models.
As of December 31, 2017, Proven and Probable Mineral Reserves totalled approximately 4.394 million tonnes grading 5.41 g/t Au and 166.9 g/t Ag and contained 763,800 ounces of gold and 23.6 million ounces of silver.
MINING METHOD
The mining method utilized at El Peñón is the Bench and Fill Method, which is a narrow vein longhole stoping method followed by a combination of consolidated and unconsolidated backfill to provide the required support for continued mining. Development of the overcut, or drill drift, and the undercut, or mucking drift, is completed at the required dimensions of four metres in width to permit operating clearances for both the longhole drill rigs and the load-haul-dump (LHD) equipment. These drifts are advanced using a “split-blast” method whereby the vein material is mined first and then the remainder of the drift waste material is slashed out and mucked. This waste material is later used for unconsolidated backfill.
Stoping dimensions are 7.5 m or 15 m in strike length and from 6 m to 16 m in height and widths vary from one metre to six metres. Production holes are drilled with the longhole drill then loaded, blasted, and mucked with six cubic yard scooptrams, dumped into 30 tonne trucks and hauled to the surface stockpile. Waste backfill or cemented rockfill is placed as required.
Underground mine infrastructure includes the required ramps, cross-cuts for access and various lateral development, as well as excavations for power stations, mine sumps, refuge stations, maintenance shops, and other facilities. Ventilation raises are driven as required to provide the air requirement to meet mine regulations for the mine workers and operating underground equipment. Other installations include a shotcrete plant, backfill plant, and communications system. The total mine system extends for approximately ten kilometres on strike and covers a vertical extent of approximately 500 m, from the highest portal collar elevation to the lowest mine workings.
MINERAL PROCESSING
The process plant and associated facilities process run-of-mine (ROM) ore that is delivered to the primary crusher, using the main processes listed below:
· Crushing
· Grinding and pre-leaching thickening
· Leaching
· Counter-current decantation concentrate solution recovery
· Clarification, zinc precipitation and precipitate filtering
· Refining
· Tailings filtering
· Tailings disposal
The El Peñón processing plant has a nominal production capacity of approximately 1.533 million tpa of stockpiled and mined ore. Mill production peaked in 2010 at 1.522 million tpa. From 2010 to 2016 yearly mill production remained generally constant ranging from 1.4 million tpa to 1.5 million tpa. In 2017, throughput dropped to 1.04 million tonnes to match the new defined mine plan.
The metallurgical recovery of gold has slightly increased during the last four years, from 93.31% to 95.13%. Metallurgical recoveries of silver have remained consistent in the last three years and increased considerably since the 2011-2013 period, during which a higher processing rate from reduced high sulphide material from the Bonanza and Al Este veins, negatively affected silver recoveries. Metallurgical recoveries of gold and silver increased slightly during 2017 due to lower throughput and higher residence times.
MARKET STUDIES
The principal commodities produced at El Peñón are gold and silver in the form of doré bars, which are freely traded, at prices that are widely known, so that prospects for sale of any production are virtually assured.
ENVIRONMENTAL, PERMITTING AND SOCIAL CONSIDERATIONS
The El Peñón Mine is located approximately 165 km to the southeast of Antofagasta. There are no populated areas or centres located close to the mine. The area has a desert climate, characterized by extreme aridity, absence of humidity and very low rainfall. Other characteristics of the area are:
· Soil of very limited usefulness (class VIII).
· Total absence of any form of plant life.
· Extremely scarce wildlife, with only eight species recognized in the Environmental Impact Assessment (EIA).
· No permanent water courses at surface.
· Existence of fossil water, with low recharge potential below a water table at approximately 1,600 m above sea level (MASL).
RPA understands that El Peñón is operating within environmental compliance with no outstanding environmental citations. Environmental monitoring is ongoing at the operations and will continue over the LOM. Key monitoring that is currently being carried out includes water, air, noise, soil, impact on wildlife, and heritage and management.
The El Peñón project entered the Environmental Impact Assessment System (SEIA), through an Environmental Impact Assessment (EIA), which was approved by Exempt Resolution No. 043 in 1998. El Peñón has a number of operating permits in place. The Regulatory Organizations that have issued these operating permits are as follows:
· Comision de Monumentos Nacionales (CMN)
· Ministerio Agricultura (MAGR)
· Comision Regional de Medio Ambiente (COREMA)
· Superintendencia de Electricidad y Combustibles (SEC)
· Servicio National de Geologia y Mineria (SERNAGEOMIN)
· Servicio de Salud de Antofagasta (SSA)
· Direccion General Aguas (DGA)
· Ministerio de Defensa Nacional (MDN)
· Ilustre Municipalidad Antofagasta (IMA)
Yamana’s social and community activities in the El Peñón district include the following:
· Excellent community and stakeholder relations
· Open door policy
· Support of medical services in Taltal
· High school and college scholarships
· Donations in infrastructure and services
· Partnerships with local groups to provide economic development
The current closure cost estimate is US$45.4 million, which includes $24.7 million for direct costs, $4.9 million for administration of the closure, $0.9 million for monitoring and control, $7.6 million for a 25% contingency, and $7.3 million for Chilean Sales Tax.
CAPITAL AND OPERATING COST ESTIMATES
The total capital expenditures estimated by Yamana for the LOM operations (2018 to 2023) are $194 million. These costs include mine, plant and administration capital but do not include working capital or future expansions. Exploration drilling is budgeted at $36 million (3 years).
Operating costs are forecast to average $147/t milled including $104/t milled for the mining, $27/t for processing and $16/t milled for general and administration costs.
2 INTRODUCTION
Roscoe Postle Associates Inc. (RPA) was retained by Yamana Gold Inc. (Yamana) to prepare an independent Technical Report on the El Peñón gold-silver deposit, located near Antofagasta in northern Chile. The purpose of this report is to provide Yamana with an independent assessment of the Mineral Reserves and Mineral Resources to support public disclosure of information on a material operation. This Technical Report conforms to NI 43-101-Standards of Disclosure for Mineral Projects (NI-43-101).
Yamana is a Canadian reporting issuer listed on the Toronto Stock Exchange (TSX), and the New York Stock Exchange (NYSE). Yamana is involved in the acquisition, exploration, and development of gold properties in North and South America. Yamana operates a portfolio of mines in Brazil, Chile, and Argentina. The company also holds interests in the Alumbrera mine in Argentina and the Canadian Malartic mine in Canada.
In the third quarter of 2007, Yamana acquired and merged with Meridian Gold Inc. (Meridian), a mid-tier gold producer with two mining operations in Chile and development and exploration projects throughout the Americas. The El Peñón Mine, owned by Yamana’s subsidiary Minera Meridian Limitada, was one of Meridian’s gold producers in Chile.
The El Peñón Mine currently comprises the following major assets and facilities:
· The underground and open pit mines with forecasted production of approximately 3,000 tpd from several mineralized structures.
· The physical plant site including the administrative office complex and associated facilities, the open pit and underground mine workings and associated facilities, the mill and associated facilities such as the laboratories, ore stockpiles, waste dumps, coarse ore storage, workshops, warehouses, and the accommodation complex and associated facilities such as cafeterias and recreation facilities.
· Facilities providing basic infrastructure to the mine, including electric power, water treatment and supply, and sewage treatment.
· Underground infrastructure including mine ramps, ventilation raises, maintenance shops, and mobile equipment fleet.
· Access by highway and gravel roads to Antofagasta via the national road system.
SOURCES OF INFORMATION
Site visits were carried out by Normand Lecuyer, P. Eng., RPA Principal Mining Engineer, and Chester Moore, P.Eng., RPA Principal Geologist, on August 7 to 9, 2017.
Discussions were held with the following personnel from Yamana:
· Mr. Greg Walker, Director, Mineral Resource Estimation, Yamana Gold Inc.
· Mr. Esteban Chacon, Technical Manager, Yamana Gold Inc.
· Mr. Marcos Valencia, Regional Director, Production Geology, Technical Services, Yamana Gold Inc.
· Mr. Jaime Sepúlveda, General Manager, Yamana Gold El Peñón
· Mr. Jorge Camacho, Manager Technical Services, Yamana Gold El Peñón
· Mr. Cristian Perez, Senior Resource Estimation Engineer, Yamana Gold El Peñón
· Mr. Juan Fuentes, Geology and Exploration Superintendent, Yamana Gold El Peñón
· Mr. Javier Ordenes, Senior Geologist, Yamana Gold El Peñón
· Mr. Sergio Castro, Superintendent Planning and Development, Yamana Gold El Peñón
· Mr. Hugo Jorquera, QA/QC Manager, Yamana Gold El Peñón
· Mr. Rodrigo Gutierrez, Plant Superintendent, Yamana Gold El Peñón
· Mr. Alex Milos, Senior Metallurgist, Yamana Gold El Peñón
· Ms. Angeli Flores, Chief of Environment Department, Yamana Gold El Peñón
· Ms. Jaqueline Francois, Regional Tax Manager, Yamana Gold Inc.
· Mr. José Naddaf: HSEC Coordinator and Community Leader, Yamana Gold El Peñón
Mr. Krutzelmann, P. Eng, RPA Associate Principal Metallurgical Engineer, Mr. Lecuyer, and Mr. Moore are Qualified Persons (QP) for this report. The QPs’ responsibilities are listed in Section 29 of this Technical Report.
The documentation reviewed, and other sources of information, are listed at the end of this report in Section 27 References.
LIST OF ABBREVIATIONS
Units of measurement used in this report conform to the metric system. All currency in this report is US dollars (US$) unless otherwise noted.
a | annum | kWh | kilowatt-hour |
A | ampere | L | Litre |
bbl | barrels | Lb | Pound |
btu | British thermal units | L/s | litres per second |
°C | degree Celsius | M | Metre |
C$ | Canadian dollars | M | mega (million); molar |
cal | calorie | m2 | square metre |
cfm | cubic feet per minute | m3 | cubic metre |
cm | centimetre | μ | Micron |
cm2 | square centimetre | MASL | metres above sea level |
d | day | μg | Microgram |
dia | diameter | m3/h | cubic metres per hour |
dmt | dry metric tonne | Mi | Mile |
dwt | dead-weight ton | Min | Minute |
°F | degree Fahrenheit | μm | Micrometre |
ft | foot | Mm | Millimetre |
ft2 | square foot | Mph | miles per hour |
ft3 | cubic foot | MVA | megavolt-amperes |
ft/s | feet per second | MW | Megawatt |
g | gram | MWh | megawatt-hour |
G | giga (billion) | Oz | Troy ounce (31.1035g) |
Gal | Imperial gallon | oz/st, opt | ounces per short ton |
g/L | grams per litre | Ppb | parts per billion |
Gpm | Imperial gallons per minute | Ppm | parts per million |
g/t | grams per tonne | Psia | pounds per square inch absolute |
gr/ft3 | grains per cubic foot | Psig | pounds per square inch gauge |
gr/m3 | grains per cubic metre | RL | relative elevation |
ha | hectare | S | Second |
hp | horsepower | St | short ton |
hr | hour | Stpa | short tons per year |
Hz | hertz | Stpd | short tons per day |
in. | inch | T | metric tonne |
in2 | square inch | Tpa | metric tonnes per year |
J | joule | Tpd | metric tonnes per day |
k | kilo (thousand) | US$ | United States dollar |
kcal | kilocalorie | USg | United States gallon |
kg | kilogram | USgpm | US gallons per minute |
km | kilometre | V | Volt |
km2 | square kilometre | W | Watt |
km/h | kilometres per hour | Wmt | wet metric tonne |
kPa | kilopascal | wt% | weight percent |
kVA | kilovolt-amperes | yd3 | cubic yard |
kW | kilowatt | Yr | Year |
3 RELIANCE ON OTHER EXPERTS
This report has been prepared by RPA for Yamana. The information, conclusions, opinions, and estimates contained herein are based on:
· Information available to RPA at the time of preparation of this report,
· Assumptions, conditions, and qualifications as set forth in this report, and
· Data, reports, and other information supplied by Yamana and other third party sources.
For the purpose of this report, RPA has relied on ownership information provided by Yamana. RPA received property information and a detailed concession listing from Yamana’s office in Santiago, Chile. As well, RPA received a formal legal opinion from Nuñez Muñoz Y Cia. Ltda. Abogados, dated October 2015 confirming Yamana’s ownership of mining exploitation concessions, surface rights, and water rights at El Peñón. RPA has not researched property title or mineral rights for the El Peñón operation and expresses no opinion as to the ownership status of the property.
RPA has relied on Yamana for guidance on applicable taxes, royalties, and other government levies or interests, applicable to revenue or income from the El Peñón operation.
Except for the purposes legislated under provincial securities laws, any use of this report by any third party is at that party’s sole risk.
4 PROPERTY DESCRIPTION AND LOCATION
The El Peñón Mine is located in north central Chile, at latitude 24°40’ S and longitude 69°50’ W, approximately 165 km southeast of Antofagasta (Figure 4-1). The site is in the Atacama Desert, approximately midway between the Pacific coast and the border with Argentina. The property map and location of the mineralized zones are shown in Figure 4-2. The mine workings, process plant, waste and tailings storage areas are all located close to the mineralized zones within the property boundaries.
The mine operates on a year round basis.
LAND TENURE
The El Peñón property consists of 436 individual mining exploitation claims owned by Minera Meridian Limitada, a subsidiary of Yamana. The claims comprise an area of 90,087 ha covering the El Peñón Mine, the Fortuna area, the Laguna area, the Pampa Augusta Victoria (PAV) area, and surrounding exploration lands (Tables 30-1 and 30-2 in Appendix 1). The boundaries of the mining exploitation concessions are legally surveyed and covered by an additional layer of claims for increased legal protection.
Minera Meridian Limitada enjoys tax and royalty stability due to article 11 of Decree Law DL 600 Foreign Investment Statute until 2018. At the present time, the mine is subject to a 5% royalty payment calculated over the annual taxable income in accordance with Law 20.026/2005.
In addition, a 2% Net Smelter Return (NSR) royalty is payable to Maverix Metals Inc. as agreed as part of the purchase of the Nado claims covering the Fortuna area. A 2% NSR is also payable to Soquimich Comercial SA for claims Providencia 1, 2, 3, 4, 5 and claims Dominador 1, 2, 4. These claims are also located in the Fortuna area. No further mining activities are planned in the areas covered by these claims.
RPA is not aware of any environmental liabilities on the property. Yamana has all required permits to conduct work on the property. RPA is not aware of any other significant factors and risks that may affect access, title, or the right or ability to perform the work on the property.
El Peñón has been operating since 1999 and has sufficient surface rights for mining and processing operations. As well, El Peñón has sufficient water, power, and labour supplies and sufficient areas for tailings and waste disposal.
Government regulations require that a full closure plan be submitted when mine life is less than five years. The original closure plan was completed in 2005, updated in 2009, and again in 2014. Subsequent revisions were submitted in 2015 and 2016 and Yamana is awaiting government comments.

5 ACCESSIBILITY, CLIMATE, LOCAL RESOURCES, INFRASTRUCTURE AND PHYSIOGRAPHY
The “Accessibility, Climate, Local Resources, Infrastructure and Physiography” are described in Pearson and Rennie (2008) and Collins, Moore and Scott (2010). Information from both reports is reproduced below.
ACCESSIBILITY
The El Peñón Mine is accessed by a paved road approximately 165 km southeast of Antofagasta. Travel time from Antofagasta is approximately 2.5 hours. Antofagasta is the principal source of supplies for the mine. It is a port city with a population of 380,000 and daily air service to Santiago.
CLIMATE
The climate in the Atacama is renowned as among the most arid in the world with a mean annual precipitation in most areas of virtually zero. Temperatures in the area close to the mine can range from -5°C to +30°C. Climate does not represent a problem for mining operations which can be carried out during the whole year.
LOCAL RESOURCES
There are no significant population centers or infrastructure in the immediate vicinity of the El Peñón Mine. The city of Antofagasta is the main source of supply for the mine. It is a port city with a population of approximately 380,000 inhabitants which hosts a variety of commercial establishments, hotels, restaurants, retailers, service suppliers, high schools, and universities as well as hospitals and health clinics. The city also hosts a large number of manufacturers and suppliers who serve the mining industry.
Skilled personnel can be easily sourced from Antofagasta or other cities of the region and country, where mining is the main economic activity.
INFRASTRUCTURE
Currently, the major assets and facilities associated with the mining operations are:
· The underground and open pit mines with production of approximately 3,000 tpd from several mineralized structures.
· The plant site including administrative offices complex and associated facilities, the open pits, which are currently not in production, and underground mine workings, and associated facilities, the mill and associated facilities such as laboratories, stockpiles, waste dumps, coarse ore storage, workshops, warehouses and dry facilities.
· Camp site to house workers.
· Facilities providing basic infrastructure to the mine, including: access roads, electric power distribution system, water treatment and supply and sewage treatment.
· Underground infrastructure including portals, access ramps, ventilation raises, maintenance shops and mobile fleet equipment.
· Access by highway and gravel roads to the surrounding area including the national road infrastructure.
· Power is supplied to the mine site via the national power grid. Auxiliary or backup power from generators is also available with a current 10 MW of power capacity on site.
PHYSIOGRAPHY
The mine is located in the Atacama Desert region of Chile at an elevation of approximately 1,800 MASL. Relief in the area is modest, with widely dispersed hills and peaks separated by broad open valleys. There is little to no vegetation or wildlife in the area around the mine, and the principal land use is mining.
6 HISTORY
The “History” of El Peñón has been described in Pearson and Rennie (2008) and Collins, Moore and Scott (2010). Information from both reports is reproduced below.
The discovery of El Peñón was the result of successful grassroots exploration carried out by Meridian geologists through the early 1990s. Regional exploration focusing on Early to Mid-Eocene volcanic belts in northern Chile led to the acquisition of the El Peñón property in 1993. Trenching carried out that year, followed by a 13-hole drilling program, discovered significant gold-silver mineralization. The next year, the first hole of a follow-up program intersected 100 m grading 10.9 g/t Au and 123.4 g/t Ag in what eventually became the Quebrada Orito deposit.
In July 1998, Meridian made the decision to place the property in production, and construction on a 2,000 tpd mine and mill facility commenced later that same year. Production began in September 1999, ramping up to full capacity by January 2000 and has continued to the present day.
PAST PRODUCTION
Since September 1999, the operation has run continually at design and increased capacity, treating both open pit and underground ore. As of December 31, 2017, the mine has produced approximately 18,053,200 tonnes of ore grading 8.94 g/t Au and 234.99 g/t Ag, as shown in Table 6-1.
TABLE 6-1 HISTORICAL PRODUCTION TO DECEMBER 31, 2017
Yamana Gold Inc. – El Peñón Property
Year |
| Tonnes |
| Au Grade (g/t) |
| Ag Grade (g/t) |
|
1999 |
| 369,290 |
| 13.96 |
| 215.08 |
|
2000 |
| 640,045 |
| 14.71 |
| 215.43 |
|
2001 |
| 707,199 |
| 18.92 |
| 300.08 |
|
2002 |
| 582,478 |
| 17.89 |
| 270.94 |
|
2003 |
| 542,616 |
| 16.40 |
| 247.50 |
|
2004 |
| 568,170 |
| 13.90 |
| 222.04 |
|
2005 |
| 734,372 |
| 12.35 |
| 236.69 |
|
2006 |
| 861,224 |
| 8.71 |
| 230.00 |
|
2007 |
| 968,159 |
| 8.17 |
| 291.45 |
|
2008 |
| 1,044,176 |
| 6.91 |
| 298.70 |
|
2009 |
| 1,391,486 |
| 5.82 |
| 289.22 |
|
2010 |
| 1,413,459 |
| 6.23 |
| 264.72 |
|
2011 |
| 1,149,472 |
| 8.19 |
| 276.07 |
|
2012 |
| 1,192,495 |
| 7.38 |
| 220.47 |
|
2013 |
| 1,219,542 |
| 9.19 |
| 213.82 |
|
2014 |
| 1,252,689 |
| 7.51 |
| 192.07 |
|
2015 |
| 1,072,009 |
| 6.02 |
| 179.98 |
|
2016 |
| 1,303,154 |
| 5.50 |
| 171.07 |
|
2017 |
| 1,041,199 |
| 5.05 |
| 148.33 |
|
Total |
| 18,053,234 |
| 8.94 |
| 234.99 |
|
7 GEOLOGICAL SETTING AND MINERALIZATION
The “Geological Setting and Mineralization” of El Peñón has been stated in Pearson and Rennie (2008) and Collins, Moore and Scott (2010). Information from both reports is reproduced below.
REGIONAL GEOLOGY
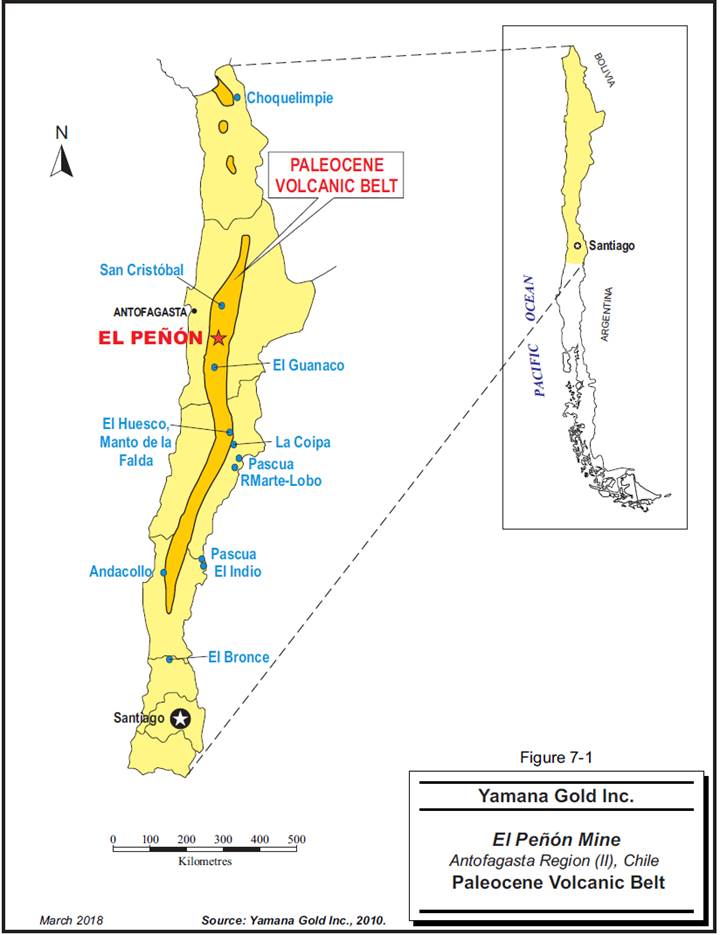
The El Peñón Mine is located in the Central Depression of the Atacama Desert. The region is underlain by Late Cretaceous to Early Eocene magmatic arc rocks, known as the Paleocene belt (Figure 7-1). Rocks in the region consist of basaltic to rhyolitic lavas and tuffs, subvolcanic porphyritic intrusions, and granitoid stocks, which extend from southern Peru to central Chile. This belt is host to many epithermal deposits and subvolcanic porphyry systems.
Late Cretaceous volcanic rocks comprise calc-alkaline magmatic arc rocks deposited in narrow fault-bound extensional basins (84 Ma to 65 Ma). The margins of the basins are intruded by dioritic to monzonitic plutons. Compressive tectonism from 65 Ma to 62 Ma resulted in the inversion of the Late Cretaceous basins, uplift and erosion of Late Cretaceous plutonic rocks to the west of the basin, and syntectonic magmatism along the basin-bounding faults. Volcanic rocks continued to accumulate through the rest of the Cretaceous in new northeast-trending trans-tensional basins partially controlled by reactivation of basin-bounding faults.
Volcanism continued to the middle Eocene. Subvolcanic domes and sills were emplaced and the mineralization at El Peñón occurred. Eocene volcanic rocks consist of rhyolitic dome complexes and mafic andesites and basalts.
Deformation occurred in the mid- to late Eocene with uplift of the Precordillera triggering copper porphyry emplacement to the east. Low angle offset of the El Peñón vein system occurred during this period.
LOCAL GEOLOGY
The main district geological units are described as follows:
· Aeropuerto Formation (Lower Cretaceous)
Fluvial sandstones, breccias with coarse sediments, conglomerates, and volcaniclastic breccias
· Quebrada Mala Formation (Upper Cretaceous)
Fluvial and lacustrine sands and silts, andesitic to basaltic lavas and breccias, rhyolitic to dacitic ignimbrites
· Augusta Victoria Formation (Upper Cretaceous)
Sanidine-biotite rhyolite ignimbrites, fluvial sandstones, and trachytic lavas
· Paleocene to Eocene volcanic and subvolcanic units
Dacite lavas or domes, andesite flows rhyodacitic ignimbrites, volcanoclastic breccias, intercalated fluvial sediments, late rhyolite, dacite domes, feeders and hypabyssal intrusions
· Cretaceous to Eocene intrusives
· Diorite and monzonite stocks
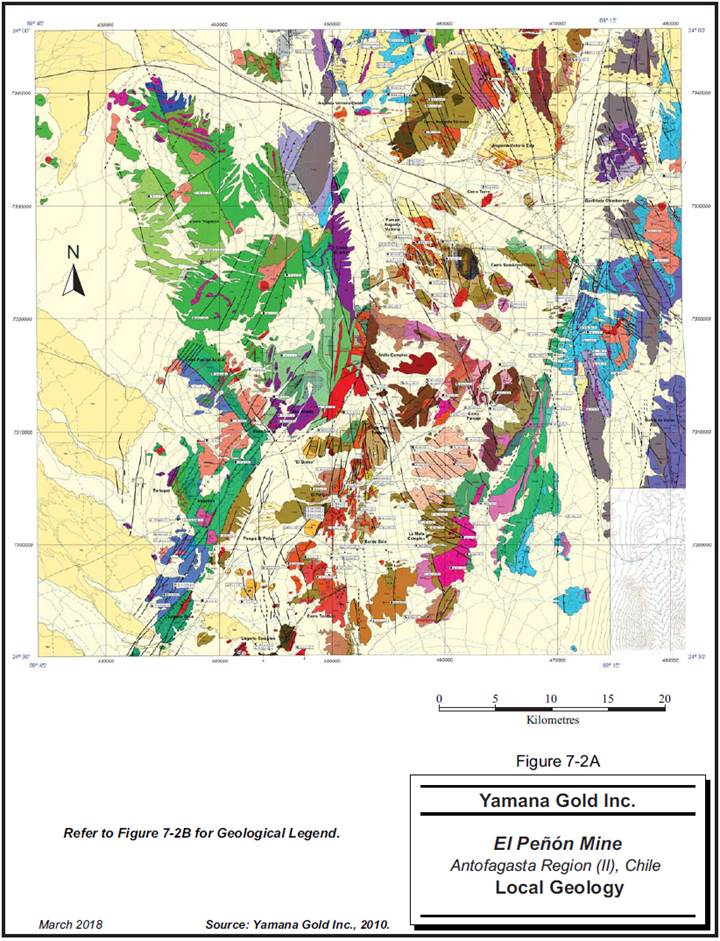
Figure 7-2A illustrates the local geology and the geological legend is shown in Figure 7-2B.
PROPERTY GEOLOGY
Surface exposures at El Peñón are rare, and much of the mapping for the area is based on float. The property is underlain by mostly Late Cretaceous to Early Eocene pyroclastic flows, lavas, volcaniclastic breccias and tuffs of basalt to rhyolite composition. Several thin Early Cretaceous rhyolite tuff and dacite to andesite flow layers occur in the northern part of the property. These rocks are intruded by Late Cretaceous diorite and monzodiorite stocks and dacite domes.
The mineralization at El Peñón is hosted by near-horizontal to gently dipping Eocene to Paleocene basaltic to rhyolitic volcanic rocks. The stratigraphic sequence consists of a lower sequence of volcanic breccia and andesitic to basaltic flows, overlain by rhyolitic to dacitic pyroclastic rocks, dacitic to andesitic flows, and volcanic breccia. Rhyolitic intrusives, domes, and associated flows are intercalated with earlier volcanic units.
STRUCTURE
The distribution of Cretaceous and Eocene volcanic rocks is controlled by graben structures bounded by north-northeast-trending faults. These are steeply dipping regional-scale structures with displacements in the order of hundreds of metres. The principal direction for late dikes and many of the highest grade mineralized faults is parallel to the bounding faults. Mineralized faults dip steeply eastward on the east side of the property and westward on the west side, in a fashion implying a horst/graben extensional structure (Figure 7-3). Most of the mining takes place along north-trending veins (dipping 75° to 85° W or 55° to 80° E). A relatively minor amount of production has also taken place along northeast-striking structures (N45°-50°E/65°W). Flat-lying faults (N40°-50°E/20°SE) displace the veins in places.
MINERALIZATION
The El Peñón deposit comprises many individual tabular, steeply dipping zones or shoots that are amenable to mining by both underground and surface methods. Vein widths range from decimetre-scale to over 20 m. Individual mineralized shoots measure from less than one kilometre to four kilometres in strike length, and up to 350 m in the down-dip direction. Gold grades range up to hundreds of grams per tonne but are more typically less than 30 g/t. Silver grades are in the order of hundreds to thousands of grams per tonne.
There are 22 main vein zones and many subsidiary veins in nine vein systems that have previously supported, support currently, or are planned to support surface and underground mining operations. The veins strike predominantly north-south and dip steeply to the east and west. North-northeast to northeast-striking fault zones are also host to mineralized zones, however, the relative proportion of the overall deposit is small. The principal mineralized veins are Abundancia/Paloma, Angosta, Al Este, Bonanza, Borde Oeste, Cerro Martillo/Dorada, Dominador, El Valle/Discovery Wash, Esmeralda/Esperanza, Fortuna, Laguna, Martillo Flats, PAV, Pampa Campamento, Playa, Providencia, Quebrada Colorada, Quebrada Orito, Sorpresa, Ventura, Veta North-West and Vista Norte.
Gold and silver mineralization consists of disseminated electrum, acanthite, native gold, native silver, silver sulphosalts, and silver halides occurring in a gangue of predominantly quartz, adularia, carbonate, and clay. Electrum is the most common form of precious metals in the deposit and occurs as micron- to millimetre-size subrounded and irregular grains. Two phases of electrum are present: a primary phase, which contains approximately 55% Au to 65% Au, and a secondary phase, which has resulted from supergene processes that have remobilized silver, and which typically consists of over 95% Au.
Sulphide minerals are relatively rare (except at the northeast area of the El Peñón Block). This may be due to oxidation, or to an initial low overall abundance such as would occur in a low sulphidation environment. Fe- and Mn-oxyhydroxides are common with only trace occurrences of relict sulphides. In order of abundance, trace amounts of pyrite, galena, sphalerite, chalcocite and covellite can be present. Gangue minerals comprise fracture and breccia-filling and replacement quartz, adularia, carbonates and clay minerals. Vein textures often display crustiform textures, although the highest grade Au-Ag mineralization is reported to be associated with massive banded quartz-adularia. Gangue minerals occur as open space filling as well as replacements of primary host rock mineral phases.
Age dating of adularia from the veins at El Peñón suggests that mineralization took place at around 52 Ma to 53 Ma (Early Eocene). Two mineralization and alteration events have been defined from fluid inclusion studies. The principal mineralization event resulted from circulation of neutral, reduced fluids. It resulted in replacement of host-rock phenocrysts and groundmass by quartz, adularia, albite, carbonate, clays, calcite and chlorite, as well as quartz-adularia flooding and breccia-filling in the vicinity of the veins. Another, more widespread, alteration process was derived from acidic, oxidized hydrothermal solutions. This event resulted in the formation of lithocaps of quartz-alunite alteration and quartz-alunite breccia-filling, with minor copper and silver, and little or no gold.
8 DEPOSIT TYPES
The “Deposit Types” of El Peñón has been stated in Pearson and Rennie (2008) and Collins, Moore and Scott (2010). Information from both reports is reproduced below.
The deposits at El Peñón are low to intermediate epithermal gold-silver deposits, hosted in steeply dipping fault-controlled veins following rhyolite dome emplacement. Gold and silver mineralization comprises disseminations of electrum, native gold and silver, acanthite, silver sulphosalts and halides, plus accessory pyrite occurring with quartz, adularia, carbonates, and clay minerals. These minerals were deposited from boiling of low salinity fluids circulating in a hydrothermal system driven by the Eocene to Paleocene magmatism. Late stage oxidation has occurred to a depth of 400 m below surface.
9 EXPLORATION
Regional exploration carried out by Meridian, focusing on Early to Mid-Eocene volcanic belts in northern Chile led to the acquisition of the El Peñón property in 1993. Trenching carried out that year, followed by a 13-hole drilling program, discovered significant gold-silver mineralization. The next year, the first hole of a follow-up program intersected 100 m grading 10.9 g/t Au and 123.4 g/t Ag in what eventually became the Quebrada Orito deposit.
Exploration has been successful in expanding the footprint of mineralization at site through programs of geologic mapping, geochemistry, geophysics, and abundant surface and underground drilling within the northeast trend, starting at the El Peñón area, with Quebrada Orito in the southwest and ending with Angosta in the northeast. Exploration has also been successful at the Fortuna and PAV areas located to the southwest and to the north of El Peñón, respectively. Geophysical anomalies and positive drill intersections remain to be followed up in all areas.
Exploration work completed to date has defined 22 main mineralized zones and subsidiary veins, within ten geological trends. The main trends are illustrated in Figure 9-1.
GRIDS AND SURVEYS
All surveying has been completed using the PSAD 1956 19S coordinate system.
PETROLOGY, MINERALOGY AND RESEARCH STUDIES
A number of geologic, petrographic and mineralogical studies have been done during the exploration and operation stages of the project. The main research studies done at El Peñón between 1999 and 2017 are as follows:
· Pérez, M. (1999): Alteración Hidrotermal en el Depósito Epitermal de Au-Ag El Peñón, II Región Antofagasta. Memoria para optar al título de Geólogo. Universidad de Chile, Santiago, Chile, 109 p.
· Robbins, C.H. (2000): Geology of El Peñón gold-silver Deposit, northern Chile: The Great Basin and beyond, geological Society of Nevada, Symposium, Reno 2000, Proceedings, pp. 249-264.
· Warren, I.; Zuluaga, J.; Robbins, C.H.; Wulftange, W. & Simmons, S. (2004): Geology and Geochemistry of Epithermal Au-Ag Mineralization in the El Peñón District, Northern Chile. Society of Economic Geologists, Special Publication 11, pp. 113-139.
· Zuluaga, J.I. (2004): Geología y Mineralización del Distrito El Peñón, Segunda Región de Antofagasta, Chile. Tesis de Magíster en Geología Económica, Universidad Católica del Norte, Antofagasta, Chile, 150 p.
· Warren, I. (2005): Geology, Geochemistry and Ore of the El Peñón Epithermal Au-Ag Deposit, Northern Chile: Characteristics of a bonanza-grade deposit and techniques for exploration. PhD Thesis — Geology, University of Auckland.
· Cornejo, P.; Mpodozis, C.; Rivera, O. & Matthews, S.J. (2006): Carta Exploradora, Regiones de Antofagasta y Atacama. Servicio Nacional de Geología y Minería (SERNAGEOMIN), Santiago, Chile, Carta Geológica de Chile, Serie Geológica Básica, 1:100.000.
· Donoso, F. (2012): Caracterización Mineralógica de las vetas Bonanza-Aleste y sus implicancias geometalúrgicas, Mina El Peñón, Región de Antofagasta, Memoria para optar al título de Geólogo, Universidad Católica del Norte, Antofagasta, Chile.
· Órdenes, J. (2014): Influencia de la Mineralogía de la veta Bonanza en el Procesos Hidrometalúrgico de Lixiviación de Au y Ag, Yacimiento El Peñón, Chile. Tesis para optar al grado de Magíster en Geometalurgia. Universidad Católica del Norte, Antofagasta, Chile, 168 p.
GEOPHYSICS
The geophysical studies completed by different geophysical survey companies in the El Peñón district from 2001 to 2017 are as follows:
· (2001) Transient Electromagnetic (TEM) Surveys.
· (2002) Controlled Source Audio-frequency Magnetotelluric (CSAMT).
· (2003) Gravity survey at the El Peñ��n area.
· (2004) Very Low Frequency Electromagnetics.
· (2005) Aeromagnetic and Radiometric Survey for the El Peñón and Amancaya areas.
· (2007) Gravity survey.
· (2010) Controlled Source Audi-frequency Magnetotelluric (CSAMT).
· (2010) Review of the geophysical surveys of the El Peñón Mine and surrounding projects.
· (2011) Controlled Source Audio-frequency Magnetotelluric (CSAMT) performed in the PAV area.
· (2014) Aeromagnetic and gravity data.
· (2014) Ground magnetics for PAV.
· (2016) Controlled Source Audio-frequency Magnetotelluric (CSAMT) for the southern and central areas of El Peñón.
GEOCHEMISTRY
· (2001) El Peñón soil geochemistry by Minera Meridian Limitada, Luis González.
· (2002) Trace elements distribution by Minera Meridian Limitada, Luis González.
· (2002) El Peñón soil geochemistry by Minera Meridian Limitada, Claudio Lucero.
· (2004) El Peñón surface geochemistry by Minera Meridian Limitada, Guido Rojas.
· (2004) El Peñón surface geochemistry by Minera Meridian Limitada, José Iván Zuluaga.
· (2005) El Peñón surface geochemistry sampling carried out by Ian Warren, University of Auckland.
· (2007) Geology, geochemistry and genesis of the El Peñón epithermal Au-Ag Deposit: Characteristics of a bonanza-grade deposit and techniques for exploration, Ian Warren, University of Auckland.
· (2013) Surface geochemistry and ICP data base analysis, internal report by Chuck Robins, independent consultant.
· (2016) Surface geochemistry and ICP data base analysis by Brian Townley (PhD), Universidad de Chile.
TRENCHING
The construction of trenches at El Peñón has been carried out according to geological criteria, in order to generate future exploration targets. Throughout the history of El Peñón, several
trenches have been sampled to obtain geological information to justify subsequent drilling campaigns.
The main areas where trenching has been done are Quebrada Orito and Quebrada Colorada (in the early stages of the project) and recently El Valle, PAV, Laguna, and Fortuna.
2018 TO 2020 EXPLORATION PROGRAM
Exploration drilling for the next three years is divided into three categories: Infill, Local, and District. Infill drilling is designed to replace production by upgrading and extending known resources with a combined reverse circulation (RC) and diamond drilling methodology (ratio of approximately 70% RC and 30% diamond drilling). Local exploration drilling is targeted at upgrading of Inferred Resources and transformation of geological potential zones to Inferred Resources. District exploration is meant to test extension of known areas of mineralization to discover new primary structures.
The amount of drilling proposed is based on the past success rate of adding resources at El Peñón. Infill targets in 2018 include Bonanza, Dorada, El Valle, Laguna, Providencia, Quebrada Colorada and Quebrada Orito. Local targets proposed for 2018 include Borde Oeste, Fortuna Este, and PAV. District targets proposed for 2018 include Angosta, Augusta Victoria Oeste, Chiquilla Chica, Cucaracha, Lagarto, Laguna-Fortuna, and Poligrama (Figure 9-2).
A total of 177,000 m of drilling is planned for 2018 to 2020 at a budgeted cost of US$36,000,000. Yamana considers allocating additional discretionary exploration funding based on results. Considering the ongoing successes at El Peñón, RPA concurs with this proposed exploration program and recommends that it be carried out as defined.
10 DRILLING
Systematic testing of the gold-bearing zones was started by Meridian in 1993 and continues to the present. To the end of December 2017, approximately 2,998,519 m of drilling has been completed at El Peñón in the Fortuna, El Peñón, and PAV blocks (Table 10-1). This includes 112,115 m completed in 2017 (29,240 m exploration and 82,875 m infill drilling), with intersections at Aleste SS, Dorada FW West, El Valle W, Esmeralda NE, Martillo Centro Sur, Paloma, Pampa Campamento, Ventura, and Victoria. Figures 10-1 and 10-2 illustrate a drill plan and drill section, respectively.
TABLE 10-1 DRILL SUMMARY
Yamana Gold Inc. – El Peñón Mine
Year |
| Exploration (m) |
| Infill (m) |
| Total (m) |
|
1993 |
| 2,507 |
| 0 |
| 2,507 |
|
1994 |
| 16,606 |
| 0 |
| 16,606 |
|
1995 |
| 51,451 |
| 0 |
| 51,451 |
|
1996 |
| 48,370 |
| 0 |
| 48,370 |
|
1997 |
| 85,248 |
| 0 |
| 85,248 |
|
1998 |
| 73,941 |
| 0 |
| 73,941 |
|
1999 |
| 58,561 |
| 48,325 |
| 106,886 |
|
2000 |
| 49,388 |
| 134,994 |
| 184,382 |
|
2001 |
| 101,440 |
| 80,905 |
| 182,345 |
|
2002 |
| 84,753 |
| 56,573 |
| 141,326 |
|
2003 |
| 87,581 |
| 39,072 |
| 126,653 |
|
2004 |
| 99,674 |
| 58,498 |
| 158,172 |
|
2005 |
| 107,443 |
| 52,851 |
| 160,294 |
|
2006 |
| 72,526 |
| 107,887 |
| 180,413 |
|
2007 |
| 113,507 |
| 70,534 |
| 184,041 |
|
2008 |
| 66,917 |
| 65,911 |
| 132,828 |
|
2009 |
| 93,690 |
| 22,592 |
| 116,282 |
|
2010 |
| 69,470 |
| 77,724 |
| 147,194 |
|
2011 |
| 78,746 |
| 49,919 |
| 128,665 |
|
2012 |
| 65,401 |
| 57,937 |
| 123,338 |
|
2013 |
| 70,323 |
| 26,440 |
| 96,763 |
|
2014 |
| 68,582 |
| 57,262 |
| 125,844 |
|
2015 |
| 40,950 |
| 105,807 |
| 146,757 |
|
2016 |
| 95,701 |
| 70,397 |
| 166,098 |
|
2017 |
| 29,240 |
| 82,875 |
| 112,115 |
|
TOTAL |
| 1,732,016 |
| 1,266,503 |
| 2,998,519 |
|
Yamana continually conducts exploration work in order to develop drill targets to replace reserves. Drilling is carried out on a nominal 60 m x 60 m pattern, with infill holes drilled on a 30 m x 30 m pattern. Preliminary Mineral Resource estimates are made using the drill information. Later, the estimates are refined using chip sample assays collected from the underground development. Underground definition drilling is completed on a 30 m x 30 m spacing where required and short test holes are drilled from underground to locate veins and parallel structures and to assist mining and grade control.
Surface drilling is mostly RC, with at least one diamond drill hole per 30 m section. Often, holes are collared with RC equipment until the hole is almost in the zone, and then changed over to diamond core. Some are cored for the entire length. Core size is HQ (63.5 mm core diameter), sometimes reduced to NQ (47.6 mm core diameter). RC holes are drilled with 146 mm diameter equipment, which produces a hole approximately 152 mm in diameter.
The procedures used during drilling programs are as follows:
· The collar locations of all drill holes are surveyed and marked by El Peñón crews.
· A multi-shot instrument is used to provide control information on the directional deviation (both azimuth and inclination) of each hole drilled from underground. A gyro survey instrument is used to provide control information on the directional deviation of each hole drilled from surface.
· Lithologic logging is done on drill core and RC chips and geotechnical observations are made by company geologists and technicians. All information is recorded on digital tablets using commercial software and depicts all downhole data including assay values. This includes recording the following items as appropriate for the drilling method:
· Drill type
· Collar coordinates
· Core diameter
· Downhole inclination
· Percent core recovery record
· Rock Quality Designation (RQD) measurements
· Lithologic contacts
· Descriptive geology
· Core angles
· Intensity of various alteration types
· Structural features, such as foliation, fracture and brecciated zones
· Recording of mineralization, e.g., quartz type, sulphide content
· Maintaining a photographic record of the core with a digital camera
Drill core recoveries are generally good (>95%) but are moderately lower at the Quebrada Orito and El Valle veins (>85%). The lower core recovery in those veins, however, does not have significant impact on the quality of the samples.
Collars of surface drill holes are preserved by a PVC casing. A wooden stake with metal plates, on which the code, azimuth, dip and other relevant information of the drill hole(s) is recorded, is placed close to each collar.
RPA is of the opinion that the logging and recording procedures are comparable to industry standards.
The drill contractor used on the mine property during 2016 and 2017 is AK Drilling International.
11 SAMPLE PREPARATION, ANALYSES AND SECURITY
SAMPLING
Samples are collected by surface and underground drilling and by panel sampling of mine headings. Surface drilling is typically carried out to trace the structures and estimate Mineral Resources. Mine sampling comprises both definition diamond drilling as well as sampling of development headings for grade control. The exploration samples consist of RC cuttings and half-core splits of diamond drill core. The mine samples are drift face panel samples and whole drill core.
Exploration RC samples are taken at two-metre intervals outside and one-metre intervals inside a mineralized zone. The drillers take two samples from every interval splitting the cuttings with a riffle-type sampler. Samples are placed in plastic bags and transported to the sample preparation facility. One sample is kept for reference and the other is prepared for analysis. Specimens are also collected in chip trays for logging.
Surface drill core and RC chips are delivered to the logging and sampling facility located near the mill/office complex. Core and RC chips are logged and marked for sampling by the geologist. Sampling technicians photograph the intact core, split the core samples and RC chip samples, place them in plastic bags, and deliver them to the sample preparation facility.
Mine drill hole samples are collected in the same fashion as exploration holes, except that they are delivered to the mine site laboratory.
Each underground drift face is mapped and sampled by the grade technicians. Samples comprise chips taken from panels measuring approximately one metre high and a maximum of one metre wide. Minimum sample widths are 30 cm in the vein and 50 cm in the waste. Boundaries to the sampled areas are placed at vein contacts and major structures. The sample sizes are constrained to between five kilograms and nine kilograms.
The geological technicians measure the distance and direction from the nearest survey station to the sampled interval. The samples for each face are rendered as linear strings of samples in a fashion similar to drill holes (pseudo-drill holes). The “collar” of the drill hole is the left-
hand end of the sample string. The “azimuth” is approximated as the direction parallel to the drift face. Sample lengths are projected to the face onto a linear trace of the pseudo-drill hole to account for irregularities or curvature of the face.
In RPA’s opinion, the sampling protocols match industry standards and are appropriate for the style of mineralization at El Peñón. Other than minor intermixing of RC material during drilling, there are no sample quality or recovery problems that could materially impact the reliability of the sampling process.
SAMPLE PREPARATION AND ANALYSIS
El Peñón uses Geo Assay Group (Geo Assay), located in Antofagasta, as the primary laboratory and Intertek Minerals (Intertek) located in Copiapó, as secondary laboratory for all assaying of the surface and underground exploration and infill drilling. Both laboratories are independent of Yamana. Pulp samples are sent for analysis in sealed batches by truck/air. The internal laboratory at El Peñón handles all production samples from the mine, and samples taken at the plant. The internal laboratory results are checked and validated with Geo Assay and Intertek (ISO/IEC 17025).
Sample security is considered adequate since all samples are collected and prepared in secure sites and transported by Yamana personnel and/or selected contractors.
Geo Assay, Intertek, and the mine laboratory (ISO/IEC 17025-2005 for doré analysis) use the same preparation protocol, which is summarized below:
· Samples are received and dried two hours at 105°C.
· Jaw crushing to -6 mm (1/4”).
· Boyd crushing and screening; recycling until 80% -2 mm (10#).
· Rotary splitting to 1,000 g.
· LM2 pulverization to 95% -140#.
· Manually split with small scoop to 250 g.
Samples submitted to external laboratories are assayed by fire assay with atomic absorption finish. If gold or silver grades are higher than 5 g/t or 250 g/t respectively, assaying is repeated with a gravity finish. If RC duplicates show large differences, a screen fire assay is made.
At the internal laboratory, standard fire assaying with a gravity finish is used. The charge for fire assaying is 50 g. Silver is parted using nitric acid.
RPA is of the opinion that the sample preparation, sample security, and assay procedures used for the drill samples are in keeping with industry standards.
QUALITY CONTROL AND QUALITY ASSURANCE
Quality assurance (QA) consists of evidence to demonstrate that the assay data has precision and accuracy within generally accepted limits for the sampling and analytical method(s) used in order to have confidence in a resource estimate. Quality control (QC) consists of procedures used to ensure that an adequate level of quality is maintained in the process of collecting, preparing, and assaying the exploration drilling samples. Generally, QA/QC programs are designed to prevent or detect contamination and allow assaying (analytical), precision (repeatability), and accuracy to be quantified. In addition, a QA/QC program can disclose the overall sampling-assaying variability of the sampling method itself.
QA/QC PROTOCOLS
Yamana has designed and implemented a QA/QC program with action items, including re-assaying of entire batches, in the event that blank or Certified Reference Material (CRM) samples returned assay values outside predefined limits of acceptability.
EXPLORATION AND INFILL DRILLING
Exploration samples are controlled by the quality control department, who supervises the traceability of the samples. The controlled stages are:
· Sampling
· Sample shipments, sample preparation and chemical analyses carried out at the external laboratories
· Results validation:
· Reception of results
· Verification of controls
· Information entry to the Fusion Database System
· Final approval and report which is sent to the geology department
Sampling procedures are controlled by inspection at the drills. Control samples for preparation and analysis are inserted by geologists with a frequency which is defined by geological criteria, based on mapping results. The following controls are currently used:
· Gold and silver CRMs to control accuracy.
· Sterile (barren rock) samples to control contamination at the sample preparation stage.
· Blank samples to control contamination at the analysis stage.
· Field, preparation and pulp duplicates, which are inserted every 40 samples to control precision.
· Additionally, 5% of the pulps with grades greater than one gram per tonne gold equivalent (AuEq) are checked by the secondary laboratory.
MINE FACE SAMPLES
Underground channel samples taken at faces are put in plastic bags and sent to the internal laboratory of the mine. Generally, a standard, a blank sample, and a sterile (barren rock) sample are inserted for one sampled face per day (under normal operating conditions 20 to 24 faces are sampled daily). The use of field duplicates for underground face samples has been discontinued. The insertion of these controls is supervised by the production geology department.
MINE LABORATORY
The laboratory of the mine carries out an internal QA/QC program. The samples are ordered at the reception desk in sequence. During this procedure, a check is done to compare and verify if the sample tickets correspond to the report attached with the sampling date and other relevant data to ensure the traceability. The sample codes are read to the Laboratory Information Management System (LIMS) prior to continuing to the preparation stage. The internal controls insertion frequency is programed in the LIMS in order to insert the following controls:
· Granulometric checks (10#) for 5% of the samples.
· Granulometric checks (140#) for 5% of the samples.
· A sterile quartz (2 in. to 3 in. in size) sample is inserted every 20 samples in order to control contamination at the preparation stage.
· A preparation duplicate is inserted every 20 samples.
· An analysis duplicate is carried out every ten samples.
· CRMs are used to validate internal accuracy control.
Fifty pulps per month are sent to Geo Assay and Intertek for additional external checks. As well, the internal laboratory is constantly reviewed by the Yamana corporate QA/QC department through the control of the quality control results and round robins with other Yamana laboratories.
RPA has examined the QA/QC results for 2014, 2015, 2016, and 2017 for the various sample streams at El Peñón. In 2014 and 2015, samples were analyzed at Acme Analytical Laboratories Ltd. (Acme) (ISO 17025:2005) with secondary samples submitted to SGS Laboratories (ISO 9001: 2008). In 2016, samples were analysed at Geo Assay with secondary samples submitted to SGS Laboratories (ISO 9001: 2008). Secondary samples were shipped to Intertek in 2017.
CERTIFIED REFERENCE MATERIALS
All the CRMs were made with El Peñón materials and prepared in qualified commercial laboratories or were purchased in packages from CDN Resource Laboratories (CDN).
In RPA’s opinion, the results of the CRM analyses (Table 11-1) show acceptable performance and analytical control.
TABLE 11-1 CRM STATISTICS
Yamana Gold Inc. — El Peñón Mine
|
|
|
| CRMs |
| 2-3 SD |
| >3SD |
| ||||
Year |
| Metal |
| Inserted |
| N |
| % |
| N |
| % |
|
2014 |
| Gold |
| 1,934 |
| 136 |
| 7.0 |
| 37 |
| 1.9 |
|
|
| Silver |
| 1,934 |
| 83 |
| 4.6 |
| 30 |
| 1.6 |
|
2015 |
| Gold |
| 1,641 |
| 76 |
| 4.6 |
| 30 |
| 1.8 |
|
|
| Silver |
| 1,652 |
| 127 |
| 7.7 |
| 42 |
| 2.5 |
|
2016 |
| Gold |
| 1,485 |
| 47 |
| 3.2 |
| 17 |
| 1.1 |
|
|
| Silver |
| 1,485 |
| 39 |
| 2.6 |
| 34 |
| 2.3 |
|
2017 |
| Gold |
| 823 |
| 19 |
| 2.3 |
| 12 |
| 1.5 |
|
|
| Silver |
| 823 |
| 21 |
| 2.6 |
| 19 |
| 2.3 |
|
BLANKS
In RPA’s opinion, the results of the blank pulp analyses (Table 11-2) show acceptable performance and analytical control.
TABLE 11-2 BLANK STATISTICS
Yamana Gold Inc. — El Peñón Mine
|
|
|
| Blanks |
| Out of Range |
| ||
Year |
| Metal |
| Inserted |
| N |
| % |
|
2014 |
| Gold |
| 941 |
| 4 |
| 0.4 |
|
|
| Silver |
| 941 |
| 0 |
| 0 |
|
2015 |
| Gold |
| 813 |
| 12 |
| 1.5 |
|
|
| Silver |
| 814 |
| 2 |
| 0.2 |
|
2016 |
| Gold |
| 888 |
| 2 |
| 0.2 |
|
|
| Silver |
| 888 |
| 0 |
| 0 |
|
2017 |
| Gold |
| 617 |
| 3 |
| 0.5 |
|
|
| Silver |
| 1,500 |
| 0 |
| 0 |
|
STERILE SAMPLES
In RPA’s opinion, the results of the sterile sample analyses, including unmineralized core and coarse quartz (Table 11-3) show acceptable performance and sample preparation control.
TABLE 11-3 STERILE SAMPLE STATISTICS
Yamana Gold Inc. — El Peñón Mine
|
|
|
| Steriles |
| Out of Range |
| ||
Year |
| Metal |
| Inserted |
| N |
| % |
|
2014 |
| Gold |
| 169 |
| 12 |
| 7.1 |
|
|
| Silver |
| 169 |
| 3 |
| 1.8 |
|
2015 |
| Gold |
| 113 |
| 12 |
| 10.6 |
|
|
| Silver |
| 113 |
| 4 |
| 3.5 |
|
2016 |
| Gold |
| 81 |
| 3 |
| 3.7 |
|
|
| Silver |
| 81 |
| 1 |
| 1.2 |
|
2017 |
| Gold |
| 57 |
| 3 |
| 5.3 |
|
|
| Silver |
| 57 |
| 0 |
| 0 |
|
PULP DUPLICATES
Plots of pulp duplicate results (Figure 11-1) at the primary laboratory were examined and found to show excellent correspondence.
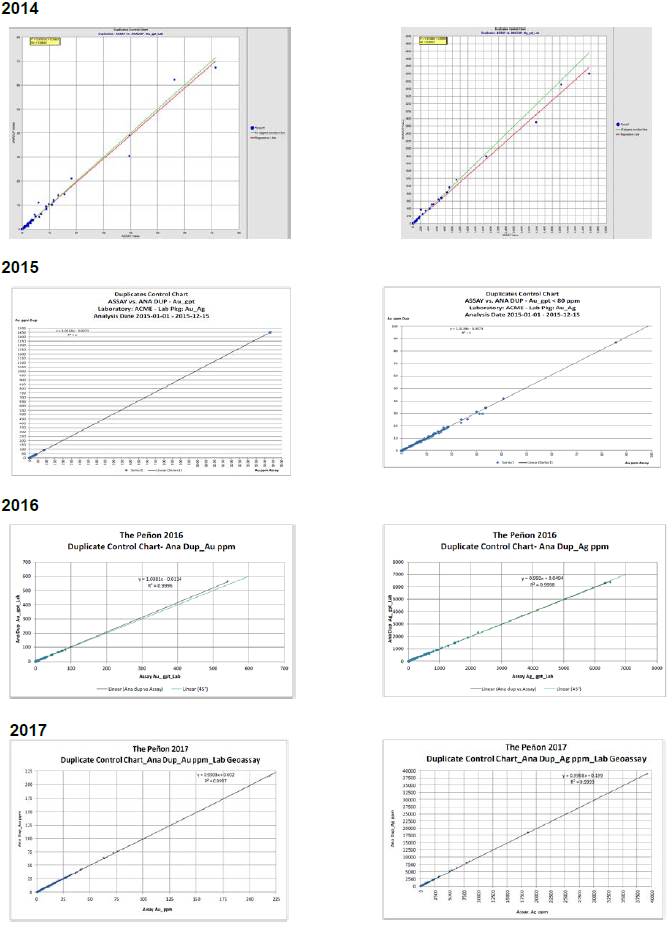
EXTERNAL DUPLICATES
Plots of external duplicate results (Figure 11-2) between the primary and the secondary laboratories were examined and found to show acceptable correspondence.
In RPA’s opinion, the QA/QC program as designed and implemented by Yamana is adequate and the assay results within the database are suitable for use in a Mineral Resource estimate.
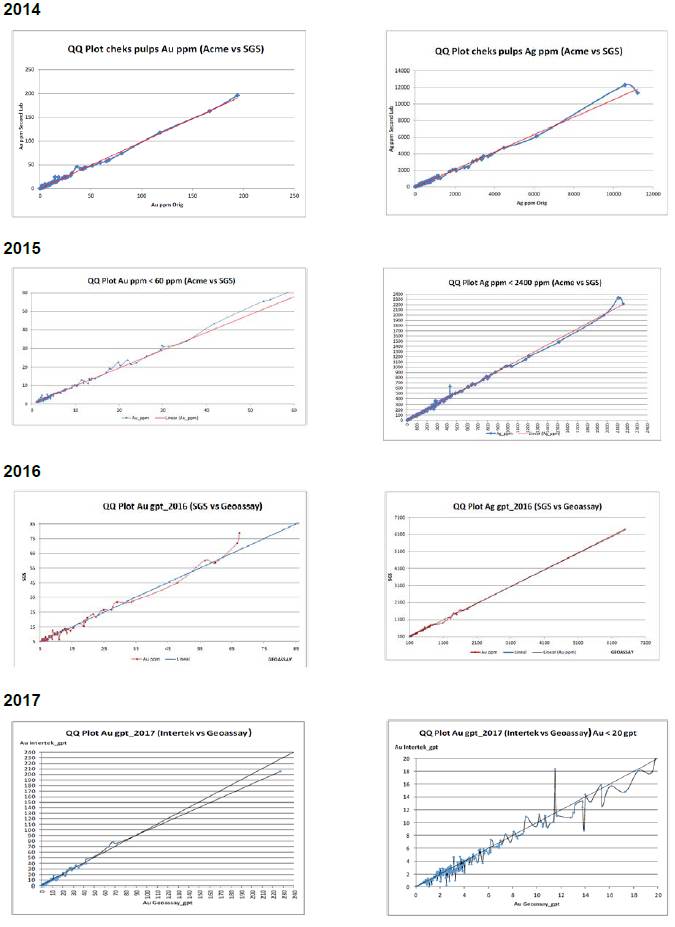
12 DATA VERIFICATION
Part of the resource database and several drill log files were reviewed by RPA for accuracy of assay transcription from the assay certificates. No significant errors were noted. As well, RPA reviewed the results obtained in the QA/QC check assay programs. Compilation of assay QA/QC results is carried out on a continuous basis by a staff geologist in the Exploration Department. The data are collected and plotted on graphs to look for problem areas, and monthly and annual reports are generated. General performance is monitored, including the number of samples collected, the number and type of QA/QC samples, equipment availability, assay return times, etc. The reports also describe the progress and results of special research projects, such as heterogeneity studies, that may be underway at the time. Any problem areas with regard to assay verification are flagged and recommendations for appropriate action are implemented.
In RPA’s opinion, the collection, security, and analysis of assay QA/QC data at El Peñón is quite thorough and meets or exceeds standard industry practice.
Drill logs are verified at the point prior to entry into the database by the Geology Department. RPA is of the opinion that data entry and verification procedures of production data at El Peñón are in keeping with industry standards.
Based on RPA’s review of the database and primary records, plus discussions with the Yamana personnel, RPA is of the opinion that data collection and entry, and database verification procedures for El Peñón comply with industry standards and are adequate for the purposes of Mineral Resource estimation.
Since El Peñón is an operating mine producing significant amounts of gold and silver, RPA did not collect or analyze any independent samples.
13 MINERAL PROCESSING AND METALLURGICAL TESTING
The following is taken from Chacón and Pérez (2017).
The low to intermediate sulphidation epithermal gold-silver mineralization mined initially at El Peñón consisted mainly of electrum, native gold, native silver, silver halides, Fe and Mn oxide minerals, plus minor acanthite, chalcopyrite, and galena. However, in veins discovered recently, a radical change has been observed in the mineralogy of silver and base metals. This change was a result of a new oxidation-reduction (redox) regime at El Peñón, from veins predominantly consisting of oxides in the southwest area to veins mainly consisting of sulphides in the northeast. In the northeast area, silver mineralization consists mainly of silver sulphosalts and silver sulphides, which cause a decrease in the silver recovery. In the primary zone, two types of mineralization can be identified depending on the occurrence of base metal sulphides that accompany the gold and silver mineralization. These mineralization types are defined as high sulphide mineralization and low sulphide mineralization. In the oxidized zone, two types of materials are observed, oxidized material with low clay content and oxidized material with high clay content.
METALLURGICAL TESTING
The metallurgical testing results presented in this report were obtained from drill hole samples and chip samples obtained from mining faces. These samples were considered representative of the various types and styles of mineralization and the mineral deposit. The results of this testwork provided the basis for the development of a straightforward flowsheet for ore treatment and also to support flowsheet changes.
Metallurgical testing carried out at El Peñón has included the following tests:
· Bond Work Index tests.
· Grain size gold and silver distributions.
· Leaching studies to address reagents, pulp density, pH, cyanide and lime consumption and residence time.
· Sedimentation and filtration tests.
· Mineralogical studies.
· Automated mineralogy.
Process and mineralogical testing studies that have been carried out are summarized below:
· Laboratorio Metalurgia El Peñón (2009): Informe Final Muestra Veta Al Este, Minera Meridian Limitada, Antofagasta, Chile.
· Laboratorio Metalurgia El Peñón (2009): Informe Final Muestra Veta Bonanza, Minera Meridian Limitada, Antofagasta, Chile.
· Laboratorio Metalurgia El Peñón (2009): Informe Final Muestra Veta Fortuna, Minera Meridian Limitada, Antofagasta, Chile.
· Laboratorio Metalurgia El Peñón (2009): Informe Muestras Interior Mina Veta Dorada, Minera Meridian Limitada, Antofagasta, Chile.
· Pérez, C. (2011): Análisis Microscópico Mineralógico sobre Muestras de Relaves de Cianuración por Agitación El Peñón. Laboratorio de Minerales de Cabeza C-2013, Guarachi Ingenieros Limitada, Santiago, Chile.
· Pérez, C. (2011): Análisis Microscópico Mineralógico sobre Muestras de Minerales de Cabeza. Laboratorio de Minerales de Cabeza C-2013, Guarachi Ingenieros Limitada, Santiago, Chile.
· Laboratorio ASMIN Industrial (2013-2015): Evaluación Metalúrgica de Muestras de Mineral Provenientes de Mina El Peñón — Etapas 1 — 10.
· Laboratorio ASMIN Industrial (2016-2017): Evaluación Metalúrgica de Muestras de Mineral Provenientes de Mina El Peñón — Etapas 11 — 16.
· Órdenes, J. & Bastias, M. (2013): “Modelamiento Geometalúrgico 2013 — Corto Plazo”, Informe Interno, Minera Meridian Limitada, El Peñón, Chile.
· Menzies, A. (2013): QEMSCANTM Minesite Analysis of Samples from El Peñón, Chile, Universidad Católica de Norte, Antofagasta, Chile.
· Menzies, A. (2013): QEMSCANTM Minesite Analysis of Samples — Mn Mapping Sample UIN0001 from El Peñón, Chile, Universidad Católica del Norte, Antofagasta, Chile.
A summary of the number of metallurgical tests that have been done by vein is provided in Table 13-1.
TABLE 13-1 METALLURGICAL TESTWORK BY VEIN
Yamana Gold Inc. - El Peñón Mine
|
| Oxide Low Clay |
| ||||||||
Geometallurgical Unit |
| Low |
|
|
| High |
| Super High |
| Grand |
|
Vein |
| Grade |
| Special |
| Grade |
| Grade |
| Total |
|
Carmin |
|
|
| 1 |
|
|
|
|
| 1 |
|
Caserón 505 |
| 1 |
|
|
|
|
|
|
| 1 |
|
Caserón 506 |
| 2 |
|
|
|
|
|
|
| 2 |
|
Discovery Wash |
| 4 |
| 2 |
|
|
|
|
| 6 |
|
Dominador |
| 38 |
| 13 |
|
|
|
|
| 51 |
|
Dorada SW |
| 8 |
| 2 |
|
|
|
|
| 10 |
|
El Valle |
| 16 |
| 3 |
| 1 |
| 2 |
| 22 |
|
Pampa Camp. |
| 30 |
| 25 |
| 7 |
| 5 |
| 67 |
|
Providencia |
| 85 |
| 29 |
| 2 |
|
|
| 116 |
|
Púrpura |
| 9 |
| 1 |
| 2 |
| 1 |
| 13 |
|
Sorpresa |
| 16 |
| 13 |
| 2 |
| 4 |
| 35 |
|
Caserón 504 |
| 1 |
|
|
|
|
| 2 |
| 3 |
|
Grand Total |
| 210 |
| 89 |
| 14 |
| 14 |
| 327 |
|
|
| Oxide High Clay |
| ||||||||
Geometallurgical Unit |
| Low |
|
|
| High |
| Super High |
| Grand |
|
Vein |
| Grade |
| Special |
| Grade |
| Grade |
| Total |
|
Elizabeth |
| 31 |
|
|
|
|
|
|
| 31 |
|
Victoria |
| 45 |
|
|
|
|
|
|
| 45 |
|
Grand Total |
| 76 |
|
|
|
|
|
|
| 76 |
|
|
| Reduced High Sulphide |
| ||||||||
Geometallurgical Unit |
| Low |
|
|
| High |
| Super High |
| Grand |
|
Vein |
| Grade |
| Special |
| Grade |
| Grade |
| Total |
|
Aleste |
| 32 |
| 64 |
| 6 |
| 8 |
| 110 |
|
Bonanza |
| 66 |
| 120 |
| 43 |
| 28 |
| 257 |
|
Borde Oeste |
| 12 |
| 3 |
|
|
| 1 |
| 16 |
|
Dorada SW |
|
|
| 7 |
| 1 |
|
|
| 8 |
|
Providencia |
|
|
| 2 |
|
|
|
|
| 2 |
|
Ventura |
| 17 |
| 7 |
| 4 |
| 1 |
| 29 |
|
Grand Total |
| 127 |
| 203 |
| 54 |
| 38 |
| 422 |
|
|
| Reduced Low Sulphide |
| ||||||||
Geometallurgical Unit |
| Low |
|
|
| High |
| Super High |
| Grand |
|
Vein |
| Grade |
| Special |
| Grade |
| Grade |
| Total |
|
Dorada SW |
| 7 |
|
|
|
|
|
|
| 7 |
|
Providencia |
| 4 |
|
|
|
|
|
|
| 4 |
|
Grand Total |
| 11 |
|
|
|
|
|
|
| 11 |
|
CYANIDE TESTWORK
Cyanidation testwork was carried out on the identified geometallurgical units to determine approximate recoveries of gold and silver. A summary of statistical analyses of the gold and silver recoveries is shown in Tables 13-2 and 13-3.
TABLE 13-2 GOLD RECOVERIES BY GEOMETALLURGICAL UNIT
Yamana Gold Inc. - El Peñón Mine
|
| Oxide Low Clay |
|
| Oxide High |
|
| Reduced High Sulphide |
|
| Reduced Low |
|
|
|
| ||||||||
Au |
| Low |
|
|
| High |
|
| Clay |
|
| Low |
|
|
| High |
|
| Sulphide |
|
|
|
|
Recovery |
| Grade |
| Special |
| Grade |
|
| Low Grade |
|
| Grade |
| Special |
| Grade |
|
| Low Grade |
|
| Marginal |
|
Average |
| 93.76 |
| 95.39 |
| 99.32 |
|
| 81.16 |
|
| 88.93 |
| 90.31 |
| 83.61 |
|
| 87.73 |
|
| 85.39 |
|
Median |
| 95.6 |
| 97.27 |
| 98.99 |
|
| 87.30 |
|
| 91.38 |
| 94.50 |
| 92.70 |
|
| 91.50 |
|
| 89.00 |
|
Maximum |
| 99.47 |
| 99.20 |
| 99.77 |
|
| 95.57 |
|
| 99.30 |
| 99.20 |
| 99.41 |
|
| 94.60 |
|
| 98.20 |
|
Minimum |
| 79.67 |
| 82.80 |
| 92.50 |
|
| 59.20 |
|
| 73.00 |
| 69.00 |
| 49.60 |
|
| 83.20 |
|
| 76.50 |
|
Standard Deviation |
| 4.56 |
| 3.71 |
| 1.65 |
|
| 10.10 |
|
| 5.93 |
| 5.51 |
| 11.15 |
|
| 3.89 |
|
| 6.24 |
|
No. Samples |
| 190 |
| 82 |
| 24 |
|
| 67 |
|
| 124 |
| 179 |
| 79 |
|
| 9 |
|
| 57 |
|
TABLE 13-3 SILVER RECOVERIES BY GEOMETALLURGICAL UNIT
Yamana Gold Inc. - El Peñón Mine
|
| Oxide Low Clay |
|
| Oxide High |
|
| Reduced High Sulphide |
|
| Reduced Low |
|
|
|
| ||||||||
Ag |
| Low |
|
|
| High |
|
| Clay |
|
| Low |
|
|
| High |
|
| Sulphide |
|
|
|
|
Recovery |
| Grade |
| Special |
| Grade |
|
| Low Grade |
|
| Grade |
| Special |
| Grade |
|
| Low Grade |
|
| Marginal |
|
Average |
| 89.64 |
| 90.71 |
| 93.50 |
|
| 84.35 |
|
| 77.77 |
| 69.09 |
| 54.06 |
|
| 91.33 |
|
| 72.19 |
|
Median |
| 89.72 |
| 90.86 |
| 92.52 |
|
| 91.00 |
|
| 82.56 |
| 74.02 |
| 59.81 |
|
| 92.60 |
|
| 80.30 |
|
Maximum |
| 99.6 |
| 98.77 |
| 99.61 |
|
| 97.90 |
|
| 97.80 |
| 98.30 |
| 96.20 |
|
| 96.20 |
|
| 93.10 |
|
Minimum |
| 68.42 |
| 78.30 |
| 80.37 |
|
| 69.47 |
|
| 54.20 |
| 38.80 |
| 17.98 |
|
| 86.20 |
|
| 60.71 |
|
Standard Deviation |
| 7.65 |
| 5.61 |
| 5.88 |
|
| 7.80 |
|
| 10.87 |
| 15.85 |
| 23.74 |
|
| 3.52 |
|
| 10.37 |
|
No. Samples |
| 187 |
| 80 |
| 26 |
|
| 61 |
|
| 119 |
| 178 |
| 81 |
|
| 9 |
|
| 57 |
|
CYANIDE CONSUMPTION TESTS
A total of 891 cyanide consumption tests have been completed for different veins in the deposit. The goal has been to determine which zones of the deposit show high or low cyanide consumptions and the influence of some mineralogical species on this parameter, especially silver-bearing and antimony-bearing sulphosalts. Silver sulphosalts are known to have low solubility in cyanide solutions, which subsequently results in low silver recoveries. In contrast, silver sulphides and copper sulphides (e.g., chalcocite, digenite, and covellite) are highly soluble in cyanide solutions, thus increasing cyanide consumption. Furthermore, rhodochrosite (manganese-rich carbonate) is also highly soluble and oxidizes the cyanide to
a cyanate ion, which has no leaching potential. However, unlike copper, cyanate is not recovered. Therefore, the presence of these three groups of minerals, namely silver sulphosalts, rhodochrosite, and especially copper sulphides, is critical in determining cyanide consumption, and controlling the process performance of the various types of minerals in the processing plant.
Cyanide consumption averages by geometallurgical unit are shown in Table 13-4.
TABLE 13-4 AVERAGE CYANIDE CONSUMPTION BY GEOMETALLURGICAL UNIT
Yamana Gold Inc. - El Peñón Mine
Cyanide |
| Oxide Low Clay |
|
| Oxide High |
|
| Reduced High Sulphide |
|
| Reduced Low |
|
|
|
| ||||||||
Consumption |
| Low |
|
|
| High |
|
| Clay |
|
| Low |
|
|
| High |
|
| Sulphide |
|
|
|
|
(kg/tonne) |
| Grade |
| Special |
| Grade |
|
| Low Grade |
|
| Grade |
| Special |
| Grade |
|
| Low Grade |
|
| Marginal |
|
Average |
| 2.73 |
| 3.39 |
| 4.10 |
|
| 3.95 |
|
| 4.71 |
| 4.63 |
| 5.26 |
|
| 4.02 |
|
| 3.43 |
|
Median |
| 2.31 |
| 2.32 |
| 3.23 |
|
| 3.84 |
|
| 4.90 |
| 4.72 |
| 5.25 |
|
| 3.85 |
|
| 3.09 |
|
Maximum |
| 11.14 |
| 11.14 |
| 11.14 |
|
| 8.86 |
|
| 10.92 |
| 11.12 |
| 9.61 |
|
| 7.01 |
|
| 8.70 |
|
Minimum |
| 0.05 |
| 0.31 |
| 0.26 |
|
| 1.12 |
|
| 0.75 |
| 1.05 |
| 1.12 |
|
| 0.75 |
|
| 1.37 |
|
Standard Deviation |
| 1.83 |
| 2.78 |
| 2.92 |
|
| 1.54 |
|
| 1.85 |
| 1.86 |
| 1.94 |
|
| 1.88 |
|
| 1.75 |
|
No. Samples |
| 204 |
| 89 |
| 28 |
|
| 54 |
|
| 126 |
| 199 |
| 90 |
|
| 11 |
|
| 56 |
|
BOND WORK INDEX TESTWORK
The Bond Work Index test is used to estimate the net energy requirements of the secondary milling circuit, where the mill operates in a closed circuit with a classifier (cut mesh). The tests consisted of simulating a closed-loop operation with 250% circulating load using a 12 in. diameter and 12 in. length laboratory mill.
The historical results of this test are summarized in Table 13-5.
TABLE 13-5 HISTORICAL BOND WORK INDEX TESTWORK
Yamana Gold Inc. - El Peñón Mine
|
|
|
|
|
|
|
| Work Index | ||
Year |
| Number |
| Identification |
| kWh/ton |
| kWh/tonne | ||
2004 |
| 1 |
| Baja Ley Martillo |
| A |
| 17.76 |
| 19.57 |
| 2 |
| Baja Ley Q.C. |
| B |
| 13.46 |
| 14.83 | |
| 3 |
| Baja Ley Q.O.Q.C. |
| C |
| 17.74 |
| 19.55 | |
| 4 |
| Fortuna |
| D |
| 15.83 |
| 17.44 | |
| 5 |
| ESP> |
| E |
| 20.52 |
| 22.61 | |
| 6 |
| Inter |
| F |
| 20.32 |
| 22.39 | |
| 7 |
| Combined Sample |
| Compósito |
| 17.94 |
| 19.77 | |
2009 |
| 1 |
| Aleste Baja Ley |
| CP0095542 |
| 19.64 |
| 21.65 |
| 2 |
| Aleste Especial |
| CP0095543 |
| 19.88 |
| 21.91 | |
| 3 |
| Fortuna Baja Ley |
| CP0095544 |
| 15.69 |
| 17.29 | |
| 4 |
| Fortuna Especial |
| CP0095545 |
| 14.47 |
| 15.95 | |
| 5 |
| Peñón Baja Ley |
| CP0095546 |
| 18.37 |
| 20.24 | |
| 6 |
| Peñón Especial |
| CP0095547 |
| 17.78 |
| 19.60 | |
| 7 |
| Bonanza Especial |
| CP0095548 |
| 16.68 |
| 18.38 | |
| 8 |
| Bonanza Especial |
| CP0095549 |
| 16.45 |
| 18.13 | |
2011 |
| 1 |
| PAV |
| COMP 1 |
| 17.73 |
| 18.27 |
2015 |
| 1 |
| Laguna |
| Compósito |
| 15.17 |
| 16.72 |
| 2 |
| Ventura |
| Compósito |
| 17.81 |
| 19.63 | |
2015 |
| 1 |
| San Cristóbal |
| CP0268051 |
| 15.03 |
| 16.57 |
| 2 |
| San Cristóbal |
| CP0268055 |
| 17.84 |
| 19.66 | |
| 3 |
| San Cristóbal |
| CP0268056 |
| 15.18 |
| 16.73 | |
| 4 |
| Chiquilla Chica |
| C001502017 |
| 18.20 |
| 20.06 | |
The average Work Index values by geometallurgical unit are summarized in Table 13-6.
TABLE 13-6 AVERAGE BOND WORK INDEX BY GEOMETALLURGICAL UNIT
Yamana Gold Inc. - El Peñón Mine
Geometallurgical Unit |
| Work Index (kWh/tonne) |
Oxide Low Clay |
| 19.83 |
Oxide High Clay |
| 17.06 |
Reduced Low Sulphide |
| — |
Reduced High Sulphide |
| 19.94 |
HISTORICAL MILL PRODUCTION
A summary of the historical mill productions is shown in Table 13-7. Mill production peaked in 2010 at 1.522 million tpa. From 2010 to 2016 yearly mill production remained generally constant ranging from 1.4 million tpa to 1.5 million tpa. In 2017, throughput dropped to 1.04 million tonnes.
The metallurgical recovery of gold has slightly increased during the last four years, from 93.31% to 95.13%. Metallurgical recoveries of silver have remained consistent in the last three years and increased considerably since the 2011-2013 period, during which a higher processing rate from high sulphide reduced material from the Bonanza and Al Este veins, negatively affected silver recoveries. Metallurgical recoveries of gold and silver increased slightly during 2017 due to lower throughput and higher residence times.
TABLE 13-7 HISTORICAL MILL PRODUCTION
Yamana Gold Inc. - El Peñón Mine
|
| Tonnage |
|
| Head Grade |
|
|
|
|
|
| ||||||||||
|
|
|
| Tonnes/ |
| Tonnes/ |
|
| Au |
| Ag |
|
| Recovery (%) |
|
| Production (oz) | ||||
Year |
| Annual |
| Day |
| Hour |
|
| (ppm) |
| (ppm) |
|
| Au |
| Ag |
|
| Au |
| Ag |
2000 |
| 739,450 |
| 2,202 |
| 93 |
|
| 13.18 |
| 194.40 |
|
| 93.64 |
| 89.05 |
|
| 282,718 |
| 4,018,397 |
2001 |
| 715,413 |
| 1,960 |
| 95 |
|
| 14.87 |
| 234.44 |
|
| 94.46 |
| 89.04 |
|
| 318,012 |
| 4,751,758 |
2002 |
| 688,876 |
| 1,887 |
| 95 |
|
| 15.33 |
| 249.47 |
|
| 95.32 |
| 90.75 |
|
| 328,061 |
| 5,077,188 |
2003 |
| 703,775 |
| 1,928 |
| 85 |
|
| 14.62 |
| 204.54 |
|
| 96.61 |
| 92.44 |
|
| 320,998 |
| 4,283,436 |
2004 |
| 837,111 |
| 2,287 |
| 100 |
|
| 11.96 |
| 192.69 |
|
| 96.46 |
| 92.19 |
|
| 314,080 |
| 4,812,152 |
2005 |
| 880,229 |
| 2,412 |
| 106 |
|
| 11.13 |
| 211.13 |
|
| 96.42 |
| 92.81 |
|
| 303,508 |
| 5,537,589 |
2006 |
| 935,105 |
| 2,562 |
| 114 |
|
| 8.10 |
| 234.58 |
|
| 95.48 |
| 92.82 |
|
| 230,145 |
| 6,428,905 |
2007 |
| 998,252 |
| 2,736 |
| 122 |
|
| 7.64 |
| 274.57 |
|
| 94.19 |
| 91.78 |
|
| 234,598 |
| 8,186,718 |
2008 |
| 1,124,567 |
| 3,073 |
| 142 |
|
| 6.73 |
| 305.38 |
|
| 92.03 |
| 89.16 |
|
| 224,990 |
| 9,864,275 |
2009 |
| 1,271,596 |
| 3,484 |
| 156 |
|
| 5.79 |
| 276.32 |
|
| 91.23 |
| 86.89 |
|
| 215,846 |
| 9,820,474 |
2010 |
| 1,522,366 |
| 4,171 |
| 189 |
|
| 5.74 |
| 228.47 |
|
| 91.13 |
| 84.07 |
|
| 256,530 |
| 9,427,207 |
2011 |
| 1,452,090 |
| 3,978 |
| 178 |
|
| 7.05 |
| 215.87 |
|
| 93.04 |
| 83.95 |
|
| 306,184 |
| 8,470,112 |
2012 |
| 1,415,292 |
| 3,878 |
| 173 |
|
| 7.47 |
| 199.21 |
|
| 93.42 |
| 79.97 |
|
| 317,508 |
| 7,249,430 |
2013 |
| 1,422,055 |
| 3,896 |
| 173 |
|
| 7.94 |
| 187.16 |
|
| 93.02 |
| 75.58 |
|
| 338,231 |
| 6,464,623 |
2014 |
| 1,475,857 |
| 4,043 |
| 184 |
|
| 6.36 |
| 211.96 |
|
| 93.31 |
| 83.88 |
|
| 282,617 |
| 8,475,133 |
2015 |
| 1,418,132 |
| 3,885 |
| 180 |
|
| 5.32 |
| 194.02 |
|
| 93.63 |
| 86.90 |
|
| 227,228 |
| 7,692,811 |
2016 |
| 1,421,243 |
| 3,894 |
| 175 |
|
| 5.11 |
| 153.91 |
|
| 94.30 |
| 85.65 |
|
| 220,209 |
| 6,020,758 |
2017 |
| 1,041,199 |
| 2,853 |
| 119 |
|
| 5.05 |
| 148.33 |
|
| 95.13 |
| 86.40 |
|
| 160,510 |
| 4,282,339 |
14 MINERAL RESOURCE ESTIMATE
MINERAL RESOURCE SUMMARY
For this report, RPA has reviewed the Mineral Resource estimate of the El Peñón Mine, as prepared by Yamana as of December 31, 2017. RPA carried out a number of checks to verify the various procedures and numerical calculations used in the Yamana estimates. This included detailed tracing of the methodology of estimating tonnage and grade of resource and reserve blocks. With few exceptions, RPA found that values and compilations of gold and silver grades were accurately recorded and calculated as provided by Yamana.
As part of this audit, RPA carried out an independent estimate of seven veins (Al Este, Caseron 505, Cerro Martillo, Dorada, Esmeralda, Magenta, and Providencia) to allow for better comparison of the Yamana estimates with the RPA estimates, based on the underground data and wireframes provided.
In RPA’s opinion, the Mineral Resource estimates are reasonable and acceptable for subsequent Mineral Reserve work.
The Mineral Resource estimation was completed using Maptek’s Vulcan software, sometimes coupled with unfolding algorithms from UFO software version 1.0 (software developed by the ALGES laboratory of the University of Chile in collaboration with Yamana) where deemed appropriate to the vein morphology. Wireframes for geology and mineralization were constructed in Vulcan based on geology sections, assay results, lithological information, and structural data. Assays were composited to one metre lengths, then interpolated using capping and a high yield restriction for anomalously high grades. Grade was interpolated into a sub-blocked model with minimum block size of 0.5 m by 0.5 m by 0.5 m with a parent block size of 20 m by 20 m by 20 m. Blocks were interpolated with grade using Inverse Distance Cubed (ID3) and checked using Nearest Neighbour (NN) methods. Block estimates were validated using industry standard validation techniques. Classification of blocks was based on distance based criteria.
RPA notes that the Mineral Resources listed in Tables 14-1 and 14-2 are reasonable, acceptable for Mineral Reserve estimation, and are in accordance with the Mineral Resource
and Mineral Reserve Classification as recommended by the Canadian Institute of Mining, Metallurgy and Petroleum (CIM) Committee on Mineral Resources and Mineral Reserves.
The Mineral Resource estimates for the El Peñón property as of December 31, 2017 are summarized in Table 14-1.
TABLE 14-1 MINERAL RESOURCE ESTIMATE — DECEMBER 31, 2017
Yamana Gold Inc. - El Peñón Mine
|
| Tonnes |
| Grade |
| Contained Metal |
| ||||
Category |
| (000 t) |
| (g/t Au) |
| (g/t Ag) |
| (000 oz Au) |
| (000 oz Ag) |
|
Measured |
| 311.7 |
| 8.56 |
| 191.0 |
| 85.8 |
| 1,914.1 |
|
Indicated |
| 1,115.9 |
| 6.47 |
| 224.3 |
| 232.0 |
| 8,047.7 |
|
Total Measured + Indicated |
| 1,427.6 |
| 6.92 |
| 217.0 |
| 317.8 |
| 9,961.8 |
|
Total Inferred |
| 17,500 |
| 1.7 |
| 60 |
| 960 |
| 33,500 |
|
Notes:
1. CIM (2014) definitions were followed for Mineral Resources.
2. A cut-off grade of 2.71 g/t AuEq was used for all zones, except for the Pampa Augusta Victoria, Fortuna-Dominador-Chiquilla Chica zones which used 2.82 g/t AuEq, 2.79 g/t AuEq and 2.81 g/t AuEq, respectively. Cut-off grades of 0.50 g/t AuEq and 0.80 g/t AuEq were used for tailings and low grade stocks reporting, respectively.
3. Mineral Resources were estimated considering long-term gold and silver prices of US$1,600/oz and US$24/oz and gold and silver mill recoveries of 95% and 86.5%, respectively. Gold and silver recoveries of 60% and 30% were used for estimating resources contained in tailings while recoveries of 75% and 70% were used for estimating resources contained in low-grade stocks.
4. While the results are presented undiluted and in-situ, the reported Mineral Resources consider minimum mining widths and expected dilutions (variable by vein) to determine reasonable prospects of economic extraction for each vein.
5. Bulk densities used vary between 2.36 t/m3 and 2.57 t/m3 for Mineral Resources contained in veins. Bulk densities of 1.60 t/m3 and 1.75 t/m3 were used to estimate Mineral Resources contained in low-grade stocks and tailings respectively.
6. Mineral Resources are reported exclusive of Mineral Reserves.
7. Mineral Resources that are not Mineral Reserves do not have demonstrated economic viability.
8. Numbers may not add due to rounding.
RPA is not aware of any environmental, permitting, legal, title, taxation, socio-economic, marketing, political, or other relevant factors that could materially affect the Mineral Resource estimate.
The tonnage and grade of the reported Inferred Mineral Resources are uncertain in nature. There is insufficient information to define these Mineral Resources as Measured or Indicated. It is reasonably expected that part of the Inferred Mineral Resources could be upgraded to Indicated Mineral Resources with continued exploration and economic evaluation.
A breakdown of the Mineral Resources by vein is listed in Table 14-2.
TABLE 14-2 MINERAL RESOURCE ESTIMATES BY VEIN — DECEMBER 31, 2017
Yamana Gold Inc. - El Peñón Mine
Measured
|
|
|
| Grade |
| Contained Metal |
| ||||
Vein |
| Tonnage (t) |
| Au (g/t) |
| Ag (g/t) |
| Au (oz) |
| Ag (oz) |
|
Abundancia |
| 1,670 |
| 11.3 |
| 189.0 |
| 610 |
| 10,250 |
|
Al Este |
| 17,670 |
| 23.1 |
| 941.9 |
| 13,150 |
| 535,000 |
|
Angelina |
| 3,160 |
| 11.2 |
| 36.5 |
| 1,140 |
| 3,710 |
|
Angosta |
| — |
| — |
| — |
| — |
| — |
|
Bermellón |
| 30 |
| 32.8 |
| 740.6 |
| 30 |
| 740 |
|
Bermuda |
| — |
| — |
| — |
| — |
| — |
|
Bonanza |
| 13,100 |
| 13.6 |
| 144.1 |
| 5,740 |
| 60,710 |
|
Borde Oeste |
| — |
| — |
| — |
| — |
| — |
|
Caracoles |
| — |
| — |
| — |
| — |
| — |
|
Carmín Escarlata |
| 8,800 |
| 15.4 |
| 179.3 |
| 4,340 |
| 50,730 |
|
Caserón 505 |
| 41,120 |
| 6.49 |
| 81.2 |
| 8,580 |
| 107,300 |
|
Caserón 506 |
| 14,800 |
| 5.66 |
| 81.2 |
| 2,690 |
| 38,620 |
|
Cerro Martillo |
| 40,780 |
| 4.82 |
| 157.1 |
| 6,320 |
| 205,990 |
|
Cerro Martillo Central Sur |
| — |
| — |
| — |
| — |
| — |
|
Chiquilla Chica |
| — |
| — |
| — |
| — |
| — |
|
Diablada |
| 11,160 |
| 10.2 |
| 34.2 |
| 3,650 |
| 12,290 |
|
Discovery Wash |
| 1,050 |
| 2.73 |
| 93.7 |
| 92 |
| 3,170 |
|
Dominador |
| 1,830 |
| 5.31 |
| 227.5 |
| 310 |
| 13,420 |
|
Dorada |
| 6,470 |
| 5.69 |
| 333.7 |
| 1,180 |
| 69,420 |
|
Dorada SW |
| 770 |
| 4.51 |
| 392.5 |
| 110 |
| 9,720 |
|
El Valle |
| 11,850 |
| 4.66 |
| 112.9 |
| 1,780 |
| 43,020 |
|
Elizabeth |
| 390 |
| 4.69 |
| 1,100 |
| 60 |
| 13,700 |
|
Esmeralda |
| — |
| — |
| — |
| — |
| — |
|
Esperanza |
| 160 |
| 22.7 |
| 1,255 |
| 120 |
| 6,370 |
|
Fortuna |
| 5,200 |
| 8.60 |
| 399.8 |
| 1,440 |
| 66,860 |
|
Fortuna Este |
| — |
| — |
| — |
| — |
| — |
|
La Paloma |
| 40 |
| 3.85 |
| 307.7 |
| — |
| 350 |
|
Laguna |
| 70 |
| 19.7 |
| 105.8 |
| 40 |
| 230 |
|
Magenta |
| 10,020 |
| 10.1 |
| 191.0 |
| 3,240 |
| 61,570 |
|
Martillo Flats |
| 4,990 |
| 6.45 |
| 412.4 |
| 1,030 |
| 66,200 |
|
Orito Norte |
| 48,120 |
| 9.58 |
| 43.0 |
| 14,830 |
| 66,470 |
|
Orito Sur |
| 31,310 |
| 5.54 |
| 90.6 |
| 5,580 |
| 91,190 |
|
Orito West |
| — |
| — |
| — |
| — |
| — |
|
Pampa Campamento |
| 3,460 |
| 8.51 |
| 252.0 |
| 950 |
| 28,070 |
|
Pampa Providencia |
| — |
| — |
| — |
| — |
| — |
|
Playa |
| 640 |
| 10.5 |
| 157.8 |
| 210 |
| 3,230 |
|
Providencia |
| 10,120 |
| 4.31 |
| 265.1 |
| 1,400 |
| 86,260 |
|
Púrpura |
| 210 |
| 10.8 |
| 133.5 |
| 70 |
| 880 |
|
Rieles |
| — |
| — |
| — |
| — |
| — |
|
Sorpresa |
| 2,490 |
| 8.25 |
| 257.3 |
| 660 |
| 20,600 |
|
Ventura |
| — |
| — |
| — |
| — |
| — |
|
Veta NW |
| 1,270 |
| 8.19 |
| 505.3 |
| 330 |
| 20,610 |
|
Victoria |
| 6,810 |
| 10.7 |
| 313.1 |
| 2,340 |
| 68,510 |
|
Vista Norte |
| 6,270 |
| 10.3 |
| 121.2 |
| 2,080 |
| 24,450 |
|
Total Measured |
| 311,700 |
| 8.56 |
| 191.0 |
| 85,760 |
| 1,914,100 |
|
Indicated
|
|
|
| Grade |
| Contained Metal |
| ||||
Vein |
| Tonnage (t) |
| Au (g/t) |
| Ag (g/t) |
| Ag (oz) |
| Au (oz) |
|
Abundancia |
| 7,040 |
| 8.54 |
| 530.3 |
| 1,930 |
| 119,990 |
|
Al Este |
| 53,490 |
| 8.49 |
| 342.6 |
| 14,600 |
| 589,170 |
|
Angelina |
| 11,870 |
| 9.31 |
| 53.1 |
| 3,550 |
| 20,290 |
|
Angosta |
| 21,600 |
| 9.56 |
| 108.9 |
| 6,640 |
| 75,610 |
|
Bermellón |
| 4,780 |
| 9.61 |
| 419.0 |
| 1,480 |
| 64,360 |
|
Bermuda |
| 8,480 |
| 7.29 |
| 172.0 |
| 1,990 |
| 46,930 |
|
Bonanza |
| 44,100 |
| 10.1 |
| 145.8 |
| 14,330 |
| 206,800 |
|
Borde Oeste |
| 10,830 |
| 11.5 |
| 454.9 |
| 3,990 |
| 158,380 |
|
Caracoles |
| 1,100 |
| 2.83 |
| 354.3 |
| 100 |
| 12,500 |
|
Carmín Escarlata |
| 12,930 |
| 13.8 |
| 137.5 |
| 5,719 |
| 57,180 |
|
Caserón 505 |
| 26,470 |
| 8.32 |
| 87.3 |
| 7,080 |
| 74,270 |
|
Caserón 506 |
| 36,700 |
| 5.08 |
| 44.0 |
| 5,990 |
| 51,900 |
|
Cerro Martillo |
| 93,200 |
| 5.47 |
| 182.5 |
| 16,400 |
| 546,800 |
|
Cerro Martillo Central Sur |
| 8,340 |
| 8.24 |
| 141.8 |
| 2,200 |
| 38,000 |
|
Chiquilla Chica |
| 45,800 |
| 0.49 |
| 372.4 |
| 720 |
| 548,900 |
|
Diablada |
| 17,570 |
| 9.41 |
| 35.4 |
| 5,320 |
| 19,980 |
|
Discovery Wash |
| 43,880 |
| 4.58 |
| 129.6 |
| 6,460 |
| 182,770 |
|
Dominador |
| 21,160 |
| 4.23 |
| 308.7 |
| 2,880 |
| 209,990 |
|
Dorada |
| 50,120 |
| 5.12 |
| 322.3 |
| 8,250 |
| 519,330 |
|
Dorada SW |
| 24,880 |
| 6.52 |
| 405.6 |
| 5,220 |
| 324,440 |
|
El Valle |
| 50,480 |
| 4.89 |
| 83.0 |
| 7,940 |
| 134,720 |
|
Elizabeth |
| 5,250 |
| 5.07 |
| 391.9 |
| 860 |
| 66,130 |
|
Esmeralda |
| 17,470 |
| 8.11 |
| 261.6 |
| 4,550 |
| 146,940 |
|
Esperanza |
| 1,470 |
| 10.1 |
| 148.4 |
| 480 |
| 7,000 |
|
Fortuna |
| 55,600 |
| 4.43 |
| 302.8 |
| 7,910 |
| 541,190 |
|
Fortuna Este |
| 6,180 |
| 4.23 |
| 550.1 |
| 840 |
| 109,320 |
|
La Paloma |
| 22,430 |
| 4.96 |
| 77.9 |
| 3,580 |
| 56,210 |
|
Laguna |
| 19,400 |
| 7.03 |
| 48.8 |
| 4,390 |
| 30,440 |
|
Magenta |
| 15,740 |
| 9.18 |
| 121.2 |
| 4,650 |
| 61,320 |
|
Martillo Flats |
| 48,950 |
| 7.98 |
| 414.1 |
| 12,560 |
| 651,760 |
|
Orito Norte |
| 24,790 |
| 10.05 |
| 63.3 |
| 8,010 |
| 50,430 |
|
Orito Sur |
| 54,610 |
| 6.04 |
| 174.0 |
| 10,600 |
| 305,510 |
|
Orito West |
| 6,060 |
| 4.80 |
| 49.4 |
| 940 |
| 9,640 |
|
Pampa Campamento |
| 18,960 |
| 8.49 |
| 271.9 |
| 5,170 |
| 165,740 |
|
Pampa Providencia |
| — |
| — |
| — |
| — |
| — |
|
Playa |
| 5,340 |
| 5.72 |
| 154.3 |
| 980 |
| 26,470 |
|
Providencia |
| 78,320 |
| 6.17 |
| 249.0 |
| 15,530 |
| 627,030 |
|
Púrpura |
| 13,030 |
| 6.58 |
| 258.3 |
| 2,760 |
| 108,250 |
|
Rieles |
| — |
| — |
| — |
| — |
| — |
|
Sorpresa |
| 9,620 |
| 5.96 |
| 259.4 |
| 1,840 |
| 80,210 |
|
Ventura |
| 20,290 |
| 8.79 |
| 532.7 |
| 5,740 |
| 347,560 |
|
Veta NW |
| 30,980 |
| 5.88 |
| 270.3 |
| 5,860 |
| 269,230 |
|
Victoria |
| 46,590 |
| 4.12 |
| 225.9 |
| 6,180 |
| 338,340 |
|
Vista Norte |
| 20,020 |
| 9.03 |
| 72.4 |
| 5,820 |
| 46,620 |
|
Total Indicated |
| 1,115,940 |
| 6.47 |
| 224.3 |
| 232,010 |
| 8,047,660 |
|
TOTAL Measured + Indicated |
| 1,427,640 |
| 6.92 |
| 217.0 |
| 317,770 |
| 9,961,770 |
|
Inferred
|
|
|
| Grade |
| Contained Metal |
| ||||
Vein |
| Tonnage (t) |
| Au (g/t) |
| Ag (g/t) |
| Ag (oz) |
| Au (oz) |
|
Abundancia |
| 19,700 |
| 9.5 |
| 480 |
| 6,000 |
| 304,600 |
|
Al Este |
| 290,200 |
| 9.5 |
| 330 |
| 88,700 |
| 3,082,900 |
|
Angelina |
| 2,300 |
| 16 |
| 74 |
| 1,200 |
| 5,500 |
|
Angosta |
| 50,200 |
| 5.8 |
| 198 |
| 9,400 |
| 318,800 |
|
Bermellón |
| 31,200 |
| 6.2 |
| 240 |
| 6,200 |
| 240,800 |
|
Bermuda |
| 32,900 |
| 6.7 |
| 166 |
| 7,100 |
| 176,100 |
|
Bonanza |
| 47,600 |
| 8.4 |
| 153 |
| 12,900 |
| 234,600 |
|
Borde Oeste |
| 80,100 |
| 15 |
| 471 |
| 38,500 |
| 1,211,500 |
|
Caracoles |
| 7,900 |
| 5.2 |
| 873 |
| 1,300 |
| 221,700 |
|
Carmín Escarlata |
| 23,900 |
| 18.2 |
| 121.5 |
| 14,017 |
| 93,300 |
|
Caserón 505 |
| 32,900 |
| 14.3 |
| 177 |
| 15,200 |
| 187,000 |
|
Caserón 506 |
| 7,800 |
| 7.6 |
| 65 |
| 1,900 |
| 16,400 |
|
Cerro Martillo |
| 73,900 |
| 5.7 |
| 178 |
| 13,400 |
| 423,800 |
|
Cerro Martillo Central Sur |
| 94,300 |
| 9.3 |
| 379 |
| 28,000 |
| 1,148,900 |
|
Chiquilla Chica |
| 191,600 |
| 0.4 |
| 410 |
| 2,700 |
| 2,524,300 |
|
Diablada |
| 18,900 |
| 14 |
| 48 |
| 8,600 |
| 29,300 |
|
Discovery Wash |
| 29,800 |
| 5.3 |
| 56 |
| 5,000 |
| 56,000 |
|
Dominador |
| 34,700 |
| 4.1 |
| 181 |
| 4,600 |
| 202,300 |
|
Dorada |
| 79,000 |
| 9.3 |
| 661 |
| 23,600 |
| 1,680,000 |
|
Dorada SW |
| 11,900 |
| 8.2 |
| 476 |
| 3,100 |
| 181,300 |
|
El Valle |
| 149,100 |
| 7.1 |
| 139 |
| 33,900 |
| 665,600 |
|
Elizabeth |
| 22,400 |
| 1.6 |
| 737 |
| 1,100 |
| 530,900 |
|
Esmeralda |
| 122,800 |
| 8.8 |
| 396 |
| 34,600 |
| 1,561,100 |
|
Esperanza |
| 27,300 |
| 21 |
| 464 |
| 18,700 |
| 407,000 |
|
Fortuna |
| 45,900 |
| 5.6 |
| 442 |
| 8,300 |
| 652,000 |
|
Fortuna Este |
| 49,700 |
| 9.4 |
| 620 |
| 15,000 |
| 991,300 |
|
La Paloma |
| 24,100 |
| 7.4 |
| 97 |
| 5,800 |
| 75,400 |
|
Laguna |
| 28,400 |
| 14.8 |
| 116 |
| 13,500 |
| 106,400 |
|
Magenta |
| 14,000 |
| 8.8 |
| 317 |
| 4,000 |
| 143,000 |
|
Martillo Flats |
| 94,010 |
| 7.8 |
| 386 |
| 23,600 |
| 1,165,300 |
|
Orito Norte |
| 3,600 |
| 7.5 |
| 42 |
| 900 |
| 4,800 |
|
Orito Sur |
| 7,500 |
| 7.3 |
| 136 |
| 1,800 |
| 33,000 |
|
Orito West |
| 164,000 |
| 8.2 |
| 108 |
| 43,300 |
| 570,100 |
|
Pampa Campamento |
| 118,100 |
| 7.4 |
| 244 |
| 28,100 |
| 925,300 |
|
Pampa Providencia |
| 38,400 |
| 17 |
| 507 |
| 20,800 |
| 625,700 |
|
Playa |
| 12,400 |
| 11 |
| 268 |
| 4,600 |
| 106,500 |
|
Providencia |
| 133,200 |
| 8.0 |
| 227 |
| 34,400 |
| 971,700 |
|
Púrpura |
| 17,700 |
| 9.4 |
| 461 |
| 5,400 |
| 262,000 |
|
Rieles |
| 300 |
| 9.2 |
| 8.2 |
| 100 |
| 100 |
|
Sorpresa |
| 32,400 |
| 7.1 |
| 174 |
| 7,400 |
| 181,500 |
|
Ventura |
| 73,100 |
| 7.8 |
| 493 |
| 18,400 |
| 1,158,300 |
|
Veta NW |
| 68,900 |
| 13.7 |
| 223 |
| 30,300 |
| 493,300 |
|
Victoria |
| 61,500 |
| 5.6 |
| 104 |
| 11,100 |
| 204,800 |
|
Vista Norte |
| 24,700 |
| 12 |
| 111 |
| 9,900 |
| 88,300 |
|
Tailings |
| 13,766,600 |
| 0.6 |
| 19 |
| 244,800 |
| 8,380,500 |
|
Low Grade Stocks |
| 1,207,900 |
| 1.3 |
| 22 |
| 49,100 |
| 862,800 |
|
TOTAL Inferred |
| 17,468,947 |
| 1.71 |
| 59.7 |
| 960,102 |
| 33,506,028 |
|
Notes:
1. CIM (2014) definitions were followed for Mineral Resources.
2. A cut-off grade of 2.71 g/t AuEq was used for all zones, except for the Pampa Augusta Victoria, Fortuna-Dominador-Chiquilla Chica zones which used 2.82 g/t AuEq, 2.79 g/t AuEq and 2.81 g/t AuEq, respectively. Cut-off grades of 0.50 g/t AuEq and 0.80 g/t AuEq were used for tailings and low grade stocks reporting, respectively.
3. Mineral Resources were estimated considering long-term gold and silver prices of US$1,600/oz and US$24/oz and gold and silver mill recoveries of 95% and 86.5%, respectively. Gold and silver recoveries of 60% and 30% were used for estimating resources contained in tailings whiles recoveries of 75% and 70% were used for estimating resources contained in low-grade stocks.
4. While the results are presented undiluted and in-situ, the reported Mineral Resources consider minimum mining widths and expected dilutions (variable by vein) to determine reasonable prospects of economic extraction for each vein.
5. Bulk densities used vary between 2.36 t/m3 and 2.57 t/m3 for Mineral Resources contained in veins. Bulk densities of 1.60 t/m3 and 1.75 t/m3 were used to estimate Mineral Resources contained in low-grade stocks and tailings respectively.
6. Mineral Resources are reported exclusive of Mineral Reserves.
7. Mineral Resources that are not Mineral Reserves do not have demonstrated economic viability.
8. Numbers may not add due to rounding.
RESOURCE DATABASE
RPA received data from Yamana in Vulcan software. Data were amalgamated, parsed as required, and imported by RPA into Maptek Vulcan version 10.1.4 for review.
Chip samples are taken across the face of each development round at approximately 3 m intervals. Yamana’s face sample database contains more than 50,000 face samples taken since the mine’s construction, and is validated by a QA/QC program.
The resource database comprises four drill databases, seven channel sample databases, and three surface sample databases. It contains drilling information and analytical results up to December 10, 2017. Information received after this date was not used in the Mineral Resource estimate.
Section 12, Data Verification, describes the resource database verification steps carried out by RPA and Yamana. RPA is of the opinion that the drill hole database is valid and suitable to estimate Mineral Resources for the El Peñón property.
EXPLORATORY DATA ANALYSIS
For grade estimation, unsampled data were replaced with zero grades to prevent overestimation. RPA observed occasional cases where block grades passed through unsampled chips without decreasing to zero grade. RPA recommends that Yamana double
check the estimation process to ensure that these zero grades are being assigned. RPA compiled all drill data, flagged them by all underground geological wireframe + grade shell (UGGS) vein solids, and found that less than 0.41% of all samples in veins contained null values. It is unlikely that the Mineral Resource estimate could be significantly affected by these few zero grades.
The drill hole database comprises a total of 13,685 drill holes and 90,277 channels (face samples) with 370,546 surveys amounting to 3,151,800 m of drilling. The Mineral Resource database contains the following numbers of samples:
· All samples in veins: 190,374
· Unsampled intervals in veins (gold): 770
· Unsampled intervals in veins (silver): 775
Almost all samples were taken between 25 cm and 1.75 m (Figure 14-1), however, most sample lengths generally ranged from 15 cm to 1.5 m. Length statistics by sample type (Table 14-3) indicate that drill and channel populations show the same mean length.
TABLE 14-3 SAMPLE LENGTHS IN VEINS
Yamana Gold Inc. — El Peñón Mine
Sample Type |
| Count |
| Min |
| Max |
| Mean |
| CV |
|
Drilling |
| 34,860 |
| 0.01 |
| 8.70 |
| 0.76 |
| 0.64 |
|
Channel |
| 154,690 |
| 0.05 |
| 4.60 |
| 0.76 |
| 0.43 |
|
All |
| 189,550 |
| 0.01 |
| 8.70 |
| 0.76 |
| 0.48 |
|
FIGURE 14-1 SAMPLE LENGTHS IN VEINS
Yamana compiled statistics for sample populations inside veins in each zone. Examples for Esmeralda, Magenta and the Caseron 505 vein are shown in Figure 14-2. RPA compiled the Vulcan sample databases and cross checked the results against Yamana’s figures and found them acceptable.
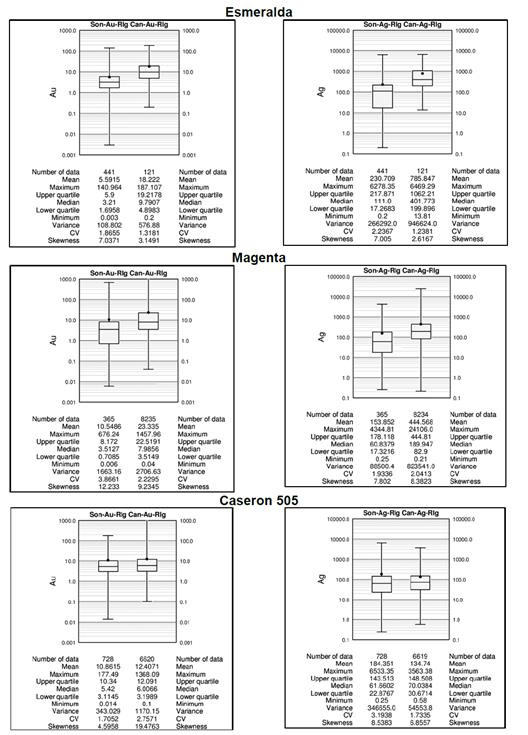
BULK DENSITY
Bulk densities were measured for core samples and underground rock samples using a water immersion method. For El Peñón, 80 samples were examined in September 2011 at the University of Antifogasta, and a further 588 density samples were examined between March 2013 and July 2014 at Antirion, with seven percent of the samples cross-checked at Laboratorio Geoanalítica in Antofagasta. Yamana calculated average bulk densities for each zone and assigned single density values for both ore and waste to each block model. Densities assigned are shown in Table 14-4. RPA is of the opinion that the density measurement results show that block density assignments are reasonable for the Mineral Resource estimation.
TABLE 14-4 BULK DENSITY ASSIGNMENTS BY BLOCK MODEL
Yamana Gold Inc. - El Peñón Mine
Block Model |
| Density |
|
505 506 |
| 2.36 |
|
Abundancia |
| 2.40 |
|
Al Este |
| 2.57 |
|
Angosta |
| 2.40 |
|
Bermellón |
| 2.43 |
|
Bermuda |
| 2.43 |
|
Bonanza |
| 2.57 |
|
Borde Oeste |
| 2.40 |
|
Carmin Escarlata |
| 2.43 |
|
Cerro Martillo |
| 2.40 |
|
Cerro Martillo Central Sur |
| 2.40 |
|
Discovery |
| 2.43 |
|
Dorada |
| 2.40 |
|
Dorada SW |
| 2.40 |
|
El Valle |
| 2.43 |
|
Esmeralda Esperanza |
| 2.40 |
|
Fortuna |
| 2.40 |
|
Magenta |
| 2.43 |
|
Martillo Flats |
| 2.40 |
|
Orito West |
| 2.44 |
|
Orito Norte |
| 2.44 |
|
Orito Sur |
| 2.36 |
|
Paloma |
| 2.40 |
|
Pampa Campamento |
| 2.43 |
|
Pampa Providencia |
| 2.43 |
|
PAV |
| 2.50 |
|
Playa |
| 2.36 |
|
Providencia |
| 2.40 |
|
Purpura |
| 2.43 |
|
Rieles |
| 2.40 |
|
Sorpresa |
| 2.43 |
|
Ventura |
| 2.57 |
|
Vista Norte |
| 2.44 |
|
VNW |
| 2.40 |
|
TOPOGRAPHIC SURFACES
Where appropriate, topographic information was provided as Maptek Vulcan surfaces. Topographic surfaces were not included for many of the zones as they were located in underground workings and were supported by underground drilling and channel sampling.
GEOLOGICAL INTERPRETATION
Mineralized UGGS wireframes define the Mineral Resource estimation domains at El Peñón. The UGGS wireframes were constructed in Vulcan as two types of wireframes supported by drill hole and channel sample information, respectively (Figure 14-3). Both types of wireframes are defined by grade shells, extended in the dip and strike directions of veins, and include samples logged as massive quartz vein (MQV), hydrothermal breccia (HYB) or stockwork (STW), even if the samples are below cut-off.
To avoid sample sharing between spatially close structures, each independent splay or parallel vein is considered an independent estimation domain. Spatially disconnected splay wireframes were flagged as separate estimation domains. In RPA’s opinion, this improved interpretation technique will result in fewer tonnes of resources than previous estimates.
With respect to the wireframes used to support the Mineral Resource estimate, RPA offers the following conclusions:
· The wireframes have been constructed to an acceptable standard with consideration for the style of mineralization, lithology, alteration, structural controls, and interpretation by the on-site geologists.
· RPA is of the opinion that the wireframes are suitable to support Mineral Resource and Mineral Reserve estimation.
FIGURE 14-3 UGGS WIREFRAME CONSTRUCTION
COMPOSITING
Sample coding was carried out for drill hole and channel samples. Due to the width of the mineable shapes of drifts (split blasting) and benches, and the original sample support, it was decided to composite the data with a regular one metre run length split at grade shell boundaries. Composite length corresponds to double the block dimensions inside the veins. Unsampled core intervals were set to zero grade prior to compositing. Composites shorter than 0.10 m were discarded from Mineral Resource estimation. Coordinates, a UGGS code, and a splay code were assigned to each composite according to centroid positions. Yamana also generated full width composites for comparison and validation purposes.
In RPA’s opinion, the composite length is appropriate given the dominant sampling length and is suitable to support Mineral Resource and Mineral Reserve estimation.
VARIOGRAPHY
Variography used at El Peñón for Mineral Resource estimation is based Octal Ingeniería y Desarrollo and Magri Consultores Limitada (2015).
Correlograms were generated for every vein, since they are more stable than traditional semi-variograms in the presence of outliers. Experimental correlograms were calculated in the strike, dip, and pole directions of each vein using combined drill hole and channel data by UGGS, considering data from all the splays of the UGGS as part of a single population. Nugget values were obtained from down hole variograms. Typical experimental correlogram calculation parameters are shown in Table 14-5. Examples of typical correlograms are shown in Figure 14-4.
TABLE 14-5 TYPICAL EXPERIMENTAL CORRELOGRAM PARAMETERS
Yamana Gold Inc. - El Peñón Mine
Color |
| Direction |
| Az. |
| Azimuth |
| Dip |
| Dip Band |
| Lag |
| Lag |
Red |
| Dip |
| 22.5° |
| 15 m |
| 22.5° |
| 30 m |
| Drift level spacing |
| 1/2 Lag |
Green |
| Strike |
| 22.5° |
| 30 m |
| 22.5° |
| 1/2 Drift level spacing |
| Channel sample spacing along strike |
| 1/2 Lag |
Blue |
| Pole |
| 22.5° |
| 10 m |
| 22.5° |
| 1/2 Drift level spacing |
| 1 m |
| 1/2 Lag |
RPA reviewed the variography methodology and performed its own analysis for Dorada and Providencia. Overall, RPA is of the opinion that the variograms are reasonable.
FIGURE 14-4 TYPICAL CORRELOGRAMS
Caseron 505 - Au
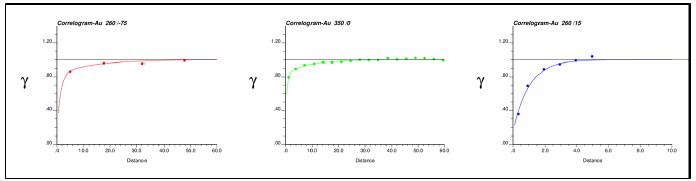
Caseron 505 - Ag
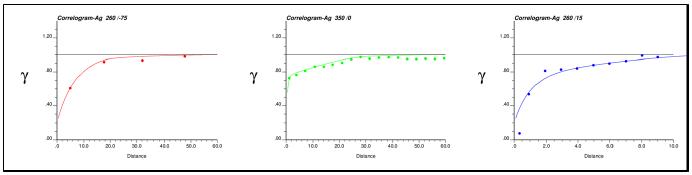
Esmeralda - Au
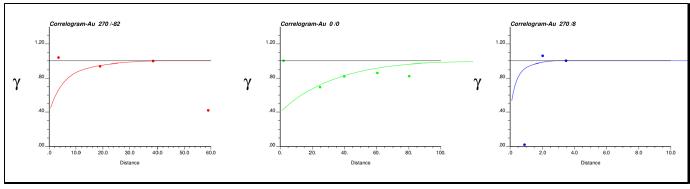
Esmeralda - Ag
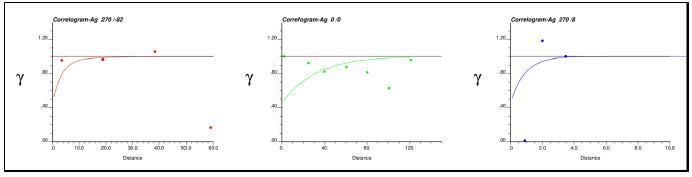
BLOCK MODELS
Yamana constructed 34 independent block models for each of the veins at El Peñón using common parent and sub-block sizes of 20 m by 20 m by 20 m and 0.5 m by 0.5 m by 0.5 m respectively. RPA is of the opinion that the sub-block size is sufficiently small to model the vein boundaries. Using a 0.25 m by 0.25 m by 0.25 m minimum block size would increase resolution on vein boundaries at the cost of a much larger net block model size. A description of the main block model attributes is given in Table 14-6. There are additional flag and distance variables based on individual metals not shown.
TABLE 14-6 COMMON BLOCK MODEL ATTRIBUTES
Yamana Gold Inc. - El Peñón Mine
Variable |
| Format |
| Description |
Density |
| Float (Real * 4) |
| Bulk Density assigned per model. |
Shellug |
| Integer (Integer * 4) |
| Area defined by shell solids (ore & waste) |
au1 |
| Float (Real * 4) |
| Au (g/t) variable 1 |
ag1 |
| Float (Real * 4) |
| Ag (g/t) variable 1 |
aueq1 |
| Float (Real * 4) |
| AuEq (US$/t) variable 1 |
nsamp1 |
| Integer (Integer * 4) |
| number of composites in estimate |
avdist1 |
| Float (Real * 4) |
| average distance of composites in estimate |
estvarau1 |
| Float (Real * 4) |
| estimation block variance au1 |
estvarag1 |
| Float (Real * 4) |
| estimation block variance ag1 |
krigpass1 |
| Integer (Integer * 4) |
| kriging pass |
nholes1 |
| Integer (Integer * 4) |
| Number of Holes in block estimate |
Categ |
| Integer (Integer * 4) |
| 1=measured 2=indicated 3=inferred |
aunn1 |
| Float (Real * 4) |
| Au (g/t) nearest neighbor |
agnn1 |
| Float (Real * 4) |
| Ag (g/t) nearest neighbor |
INTERPOLATION STRATEGY
Grades were interpolated into blocks using ID3, taking into account anisotropic distances for weight calculations. Search ellipsoids were rotated to orient the first axis along the strike direction of the vein, the second axis along the dip direction and the third axis along the pole direction. Anisotropic distance factors were generally set equal to 80% to 100%, the range of the correlogram models. A summary of typical grade estimation search parameters is shown in Table 14-7.
TABLE 14-7 TYPICAL GRADE ESTIMATION SEARCH PARAMETERS
Yamana Gold Inc. - El Peñón Mine
Pass |
| Area |
| Data |
| Search |
| Min. |
| Max. |
| Max. |
1 |
| Channel |
| CH. |
| 5x20x5 |
| 6 |
| 8 |
| 2 |
2 |
| Channel |
| CH. |
| 15x30x10 |
| 4 |
| 8 |
| 2 |
3 |
| Channel |
| CH. |
| 30x30x15 |
| 1 |
| 8 |
| 1 |
1 |
| Drill hole |
| CH. + DH. |
| 15x15x5 |
| 4 |
| 8 |
| 2 |
2 |
| Drill hole |
| DH. |
| 35x35x10 |
| 3 |
| 8 |
| 2 |
3 |
| Drill hole |
| DH. |
| 60x60x15 |
| 1 |
| 8 |
| 1 |
RPA checked several search ellipses in non-rotated subdomains and found them to be in accord with the strike and dip of the vein at the location of the subdomain.
DECLUSTERING
To avoid the effect of high grade clustering on the results of the basic statistics calculations, a cell declustering technique was used. A 30 m x 30 m x 1 m cell size was used in order to mimic the drilling grid used to define Indicated resources.
BOUNDARY DEFINITION
Yamana generated contact-plots of gold and silver grades of composites located inside and outside the UGGS solids to define the type of boundary to be used for grade estimation (hard, firm, or soft boundaries). Yamana determined that all veins showed characteristically abrupt changes in grade, and as a result, used hard boundaries for grade interpolation.
RPA concurs with this assessment. Drill and channel samples in plan and section view show ubiquitous sudden changes from very high grade to very low grade outside the vein structure.
CAPPING AND OUTLIER RESTRICTION
Both grade capping and high-yield restriction (HYR) were used to control the influence of high grade samples in the block model.
CAPPING
Yamana performed capping analysis using a combination of methods. For channel samples, capping values were defined, based on historical criteria, at the 96th to 97th percentile of the cumulative distribution (including declustered weighting). Drill hole data was capped using decile analysis (e.g., Parrish Method) to define capping values. Drill data capping results were generally close to the 99th percentile of the cumulative grade distribution. Yamana capped by sample type as per above, per vein and sometimes for individual subdomains within vein domains. A summary of Yamana capping by zone is shown in Table 14-8.
RPA reviewed the capping methodology and performed its own capping exercises on the Caserόn 505, Caserόn 506, Dorada, Aleste, and Providencia zones, as well as performing a visual validation of the block models in plan and section view. The capping values which RPA chose for each vein in each zone were similar to the values chosen by Yamana. RPA is of the opinion that Yamana’s methodology is thorough and sound and that the overall capping levels are appropriate for the deposit.
TABLE 14-8 YAMANA CAPPING LEVELS BY VEIN AND DOMAIN
Yamana Gold Inc. - El Peñón Mine
|
|
|
| Drill Holes |
| Capping Levels |
| RIP |
| ||||||
Vein |
| Domain |
| g/t Au |
| g/t Ag |
| g/t Au |
| g/t Ag |
| g/t Au |
| g/t Ag |
|
Caserón 505 |
| 5 |
| 101 |
| 2,585.07 |
| 50.25 |
| 596 |
| 28.12 |
| 409.26 |
|
Caserón 506 |
| 6 |
| 50.00 |
| 515.50 |
| 45.07 |
| 467.50 |
|
|
|
|
|
|
| 70 |
| — |
| — |
| — |
| — |
| — |
| — |
|
Abundancia |
| 72 |
| — |
| — |
| — |
| — |
| — |
| — |
|
|
| 74 |
| 60.00 |
| 800.00 |
| 200.00 |
| 1,750.00 |
| — |
| — |
|
|
| 18 |
| 100.00 |
| 2,202.00 |
| 215.00 |
| 4,510.00 |
| — |
| — |
|
Aleste |
| 19 |
| 50.00 |
| 6,000.00 |
| 156.00 |
| 5,051.00 |
| — |
| — |
|
|
| 20 |
| 75.00 |
| 3,000.00 |
| 160.00 |
| 7,900.00 |
| — |
| — |
|
|
| 21 |
| 30.00 |
| 1,569.00 |
| — |
| — |
| — |
| — |
|
Angosta |
| 35 |
| 30.00 |
| 500.00 |
| — |
| — |
| — |
| — |
|
Bermellón |
| 14 |
| 30.00 |
| 800.00 |
| 150.00 |
| 3,320.00 |
| — |
| — |
|
Bermuda |
| 44 |
| 25.00 |
| — |
| — |
| — |
| — |
| — |
|
Caracoles |
| 30 |
| — |
| — |
| — |
| — |
| — |
| — |
|
Fortuna Norte |
| 22 |
| 26.50 |
| 2,000.00 |
| 105.00 |
| 6,200.00 |
| — |
| — |
|
Fortuna Sur |
| 11 |
| 35.00 |
| 3,500.00 |
| 55.00 |
| 3,675.00 |
| — |
| — |
|
Fortuna Este |
| 21 |
| 20.00 |
| 1,400.00 |
| — |
| — |
| — |
| — |
|
Dominador |
| 23 |
| 45.00 |
| 1,540.00 |
| 35.00 |
| 920.00 |
| — |
| — |
|
Laguna |
| 33 |
| 40.00 |
| 400.00 |
| 51.00 |
| 480.00 |
| — |
| — |
|
Bonanza |
| 11 |
| 150.00 |
| 1,100.00 |
| 171.00 |
| 2,000.00 |
| — |
| — |
|
|
| 71 |
| 70.00 |
| 2,000.00 |
| — |
| — |
| — |
| — |
|
Borde Oeste |
| 73 |
| — |
| — |
| — |
| — |
| — |
| — |
|
|
| 75 |
| — |
| — |
| — |
| — |
| — |
| — |
|
Carmin Escarlata |
| 11 |
| 90.00 |
| 900.00 |
| 158.00 |
| 2,055.00 |
| — |
| — |
|
|
| 50 |
| 27.00 |
| 1,460.00 |
| 40.00 |
| 1,410.00 |
| 34.26 |
| 1,103.00 |
|
Cerro Martillo |
| 51 |
| 25.00 |
| 500.00 |
| — |
| — |
| — |
| — |
|
|
| 52 |
| 30.00 |
| 1,000.00 |
| — |
| — |
| — |
| — |
|
Cerro Martillo CS |
| 53 |
| 50.00 |
| 1,500.00 |
| — |
| — |
| — |
| — |
|
Discovery Wash |
| 4 |
| 30.00 |
| 1,000.00 |
| 22.00 |
| 630.00 |
| — |
| — |
|
|
| 50 |
| 46.00 |
| 2,000.00 |
| 47.00 |
| 3,060.00 |
| — |
| — |
|
Dorada |
| 51 |
| 40.00 |
| 2,492.00 |
| 47.00 |
| 3,202.00 |
| — |
| — |
|
|
| 52 |
| 21.00 |
| 2,000.00 |
| 50.81 |
| 2,459.76 |
| — |
| — |
|
|
| 53 |
| 86.00 |
| 5,430.00 |
| — |
| — |
| — |
| — |
|
|
| 50 |
| 46.80 |
| 3,000.00 |
| 28.27 |
| 2,276.47 |
| — |
| — |
|
Dorada SW |
| 51 |
| 30.00 |
| 1,725.00 |
| — |
| — |
| — |
| — |
|
|
| 52 |
| 26.50 |
| 2,010.00 |
| — |
| — |
| — |
| — |
|
El Valle |
| 40 |
| 50.00 |
| 1,000.00 |
| 25.00 |
| 950.00 |
| — |
| — |
|
Esmeralda |
| 13 |
| 38.00 |
| 1,554.00 |
| 183.00 |
| 5,775.00 |
| — |
| — |
|
Esperanza |
| 14 |
| 90.00 |
| 1,660.00 |
| — |
| — |
| — |
| — |
|
Magenta |
| 3 |
| 100.00 |
| 1,230.00 |
| 118.00 |
| 2,275.00 |
| — |
| — |
|
|
| 16 |
| 56.15 |
| 4,883.00 |
| 45.00 |
| 2,770.00 |
| — |
| — |
|
Martillo Flats |
| 17 |
| 20.00 |
| 700.00 |
| 64.00 |
| 4,662.37 |
| — |
| — |
|
|
| 18 |
| 30.00 |
| 2,037.00 |
| 60.00 |
| 3,922.00 |
| — |
| — |
|
Orito Norte |
| 8 |
| 90.00 |
| 445.00 |
| 55.00 |
| 302.00 |
| 131.00 |
| 1,453.00 |
|
Angelina |
| 9 |
| 100.00 |
| 470.00 |
| 93.00 |
| 420.00 |
| 192.00 |
| 540.00 |
|
Diablada |
| 10 |
| 60.00 |
| 300.00 |
| 101.50 |
| 435.00 |
| — |
| — |
|
Orito Sur |
| 7 |
| 28.50 |
| 790.00 |
| 44.15 |
| 797.80 |
| — |
| — |
|
Orito Oeste |
| 69 |
| 35.00 |
| 1,500.00 |
| — |
| — |
| — |
| — |
|
La Paloma |
| 35 |
| 77.20 |
| 815.83 |
| 161.59 |
| 2,077.96 |
| — |
| — |
|
Pampa Campamento |
| 70 |
| 60.00 |
| 1,620.00 |
| 57.00 |
| 1,200.00 |
| — |
| — |
|
Pampa Providencia |
| 66 |
| — |
| — |
| — |
| — |
| — |
| — |
|
Victoria |
| 32 |
| 45.00 |
| 1,500.00 |
| 117.10 |
| 2,573.00 |
| 110.50 |
| 11,000.00 |
|
Elizabeth |
| 8 |
| 20.00 |
| 2,500.00 |
| 78.00 |
| 10,930.00 |
| — |
| — |
|
Playa |
| 12 |
| — |
| 1,000.00 |
| 81.00 |
| 2,360.00 |
| — |
| — |
|
|
| 60 |
| 53.30 |
| 2,071.00 |
| 32.88 |
| 2,002.02 |
| — |
| — |
|
Providencia |
| 61 |
| 42.10 |
| 1,121.00 |
| 14.54 |
| 1,382.81 |
| — |
| — |
|
|
| 62 |
| 39.3 |
| 1,448.00 |
| 38.06 |
| 2,936.75 |
| — |
| — |
|
Purpura |
| 15 |
| 60.00 |
| 3,500.00 |
| 60.00 |
| 1,203.35 |
| — |
| — |
|
Sorpresa |
| 80 |
| 50.00 |
| 1,500.00 |
| 47.15 |
| 1,715.00 |
| — |
| — |
|
Ventura |
| 77 |
| 152.00 |
| 4,172.00 |
| 150.00 |
| 8,925.00 |
| — |
| — |
|
Vista Norte |
| 20 |
| 65.00 |
| 600.00 |
| 95.45 |
| 1,101.48 |
| — |
| — |
|
|
| 63 |
| 60.00 |
| 2,000.00 |
| 23.17 |
| 966.52 |
| — |
| — |
|
VNW |
| 64 |
| 20.00 |
| 1,100.00 |
| 29.46 |
| 2,838.00 |
| — |
| — |
|
|
| 65 |
| 20.00 |
| 800.00 |
| 41.00 |
| 2,800.00 |
| — |
| — |
|
Stockpile - Escarlata |
| 1 |
| 6.00 |
| 120.00 |
| — |
| — |
| — |
| — |
|
|
|
|
|
|
|
|
| Capping Levels |
|
|
|
|
| ||
|
|
|
| Drill Holes |
| Chips |
| RIP |
| ||||||
Vein |
| Domain |
| g/t Au |
| g/t Ag |
| g/t Au |
| g/t Ag |
| g/t Au |
| g/t Ag |
|
Stockpile – Orito |
| 1 |
| 5.00 |
| 45.00 |
| — |
| — |
| — |
| — |
|
Tailings |
| 1 |
| 1.20 |
| — |
| — |
| — |
| — |
| — |
|
HIGH YIELD RESTRICTION
HYR is an interpolation technique where the spatial influence of isolated high grades are limited above a certain threshold. Generally, continuous areas of persistent high grade are sub-domained and estimated separately rather than using HYR in those areas.
Yamana used HYR for every domain in every zone, setting the threshold values equal to the capping threshold and limiting the influence to 5.0 m by 2.5 m by 2.5 m strike, dip, and width respectively.
RPA reviewed the influence of high grades in the model by visually checking the composite grades and block grades in section and plan view, and found the results acceptable.
UNFOLDING
In order to improve the reproduction of the preferential grade continuities, composites and blocks located inside the main splays (generally splays with channel data) were unfolded, through the use of the UFO software version 1.0. Grade estimation was carried out independently for each estimation domain considering vein hanging walls as the reference plane for unfolding.
RPA is of the opinion that the interpolation strategy is thorough and reasonable.
VALIDATION
YAMANA VALIDATION
Block models were validated by means of Global Bias checks (between estimated means and declustered composite means), swath-plots against NN estimates, and graphic analyses of the results. RPA considers these industry standard validation techniques to be adequate for the purpose of Mineral Reserve and Mineral Resource estimation and disclosure.
RPA VALIDATION
RPA performed validation on seven of the 34 block models, which represent approximately more than 40% of the resource estimate. The seven zones and stockpiles were:
· Caserόn 505 and 506
· Aleste
· Cerro Martillo
· Dorada
· Esmerelda
· Magenta
· Providencia
· Stockpile and Tailings – Escarlata, Orito and Tailings
In addition to reviewing Yamana’s validation, RPA performed the following validation steps:
· Comparison between composite and block grades (Table 14-9) and between ID3 and NN block grades (Table 14-10).
· Swath plots of composites versus blocks and NN versus ID3 interpolations (e.g., Figure 14-5). Samples are red, blocks are blue, and NN blocks are silver.
· Visual inspection of the block model and composites provided (e.g., Figure 14-6).
RPA replaced unsampled data and values lower than detection limits with zero grades and performed validation of composites and block model via its own Global Bias checks, swath plots, and visual checks at regular intervals in section and plan view to observe the relationships between block estimates, composite grades, and original sample grades. RPA concludes that grade estimation was generally reasonable and that block grades were closely associated with sample grades. There were intermittent locations where block grades appeared to be smoothed through high or low grade samples, but the overall grade estimation appeared conservative. Block grade means sometimes decreased up to 12% from capped composite grades. This appears to be attributable to the HYR applied during grade estimation.
TABLE 14-9 COMPOSITE VERSUS BLOCK GRADES
Yamana Gold Inc. - El Peñón Mine
Zone |
| Element |
| Domain |
| Composite |
| Block Count |
|
| Composite |
| Block |
|
| Composite |
| Block |
|
| Composite |
| Block |
| Diff Mean |
|
| Composite |
| Block |
|
505 506 |
| Ag (g/t) |
| 5 |
| 10,549 |
| 4,232,571 |
|
| 0.00 |
| 0.25 |
|
| 2,585.07 |
| 6,533.35 |
|
| 143.23 |
| 133.65 |
| -6.69 |
|
| 1.21 |
| 1.71 |
|
505 506 |
| Ag (g/t) |
| 6 |
| 5,438 |
| 2,193,728 |
|
| 0.10 |
| 0.10 |
|
| 515.20 |
| 798.53 |
|
| 99.07 |
| 82.08 |
| -17.15 |
|
| 1.12 |
| 0.90 |
|
505 506 |
| Au (g/t) |
| 5 |
| 10,550 |
| 4,232,596 |
|
| 0.00 |
| 0.01 |
|
| 82.00 |
| 108.84 |
|
| 10.51 |
| 10.06 |
| -4.26 |
|
| 1.17 |
| 0.83 |
|
505 506 |
| Au (g/t) |
| 6 |
| 5,440 |
| 2,193,747 |
|
| 0.00 |
| 0.00 |
|
| 50.00 |
| 59.99 |
|
| 9.00 |
| 7.32 |
| -18.68 |
|
| 1.14 |
| 0.84 |
|
Cerro Martillo |
| Ag (g/t) |
| 50 |
| 13,690 |
| 7,011,928 |
|
| 0.00 |
| 0.25 |
|
| 7,881.75 |
| 1,434.14 |
|
| 290.30 |
| 254.41 |
| -12.36 |
|
| 1.17 |
| 0.84 |
|
Cerro Martillo |
| Ag (g/t) |
| 51 |
| 23 |
| 192,478 |
|
| 15.34 |
| 15.34 |
|
| 338.68 |
| 984.70 |
|
| 129.81 |
| 136.16 |
| 4.90 |
|
| 0.77 |
| 0.64 |
|
Cerro Martillo |
| Ag (g/t) |
| 52 |
| 23 |
| 78,301 |
|
| 2.40 |
| 2.40 |
|
| 334.30 |
| 334.30 |
|
| 133.84 |
| 123.56 |
| -7.68 |
|
| 0.82 |
| 0.71 |
|
Cerro Martillo |
| Ag (g/t) |
| 500 |
| 2,130 |
| 672,664 |
|
| 0.00 |
| 0.62 |
|
| 1,962.06 |
| 1,103.00 |
|
| 189.89 |
| 180.36 |
| -5.02 |
|
| 1.10 |
| 0.81 |
|
Cerro Martillo |
| Au (g/t) |
| 50 |
| 13,690 |
| 7,013,350 |
|
| 0.00 |
| 0.01 |
|
| 270.08 |
| 38.31 |
|
| 8.24 |
| 7.18 |
| -12.83 |
|
| 1.19 |
| 0.77 |
|
Cerro Martillo |
| Au (g/t) |
| 51 |
| 23 |
| 192,478 |
|
| 0.89 |
| 0.89 |
|
| 16.98 |
| 19.92 |
|
| 6.14 |
| 5.80 |
| -5.52 |
|
| 0.70 |
| 0.75 |
|
Cerro Martillo |
| Au (g/t) |
| 52 |
| 23 |
| 78,301 |
|
| 0.26 |
| 0.26 |
|
| 12.18 |
| 11.89 |
|
| 3.46 |
| 3.92 |
| 13.42 |
|
| 0.84 |
| 0.61 |
|
Cerro Martillo |
| Au (g/t) |
| 500 |
| 2,130 |
| 672,664 |
|
| 0.00 |
| 0.10 |
|
| 83.34 |
| 34.26 |
|
| 5.89 |
| 5.62 |
| -4.55 |
|
| 1.01 |
| 0.70 |
|
Dorada |
| Ag (g/t) |
| 50 |
| 13,265 |
| 4,581,595 |
|
| 0.00 |
| 0.64 |
|
| 3,027.03 |
| 3,027.03 |
|
| 611.44 |
| 579.63 |
| -5.20 |
|
| 1.18 |
| 0.85 |
|
Dorada |
| Ag (g/t) |
| 51 |
| 1,184 |
| 1,587,335 |
|
| 0.00 |
| 0.60 |
|
| 3,117.42 |
| 3,116.26 |
|
| 494.30 |
| 289.24 |
| -41.49 |
|
| 1.36 |
| 1.06 |
|
Dorada |
| Ag (g/t) |
| 52 |
| 397 |
| 729,820 |
|
| 0.00 |
| 2.41 |
|
| 2,459.76 |
| 2,459.62 |
|
| 293.90 |
| 267.77 |
| -8.89 |
|
| 1.22 |
| 0.73 |
|
Dorada |
| Au (g/t) |
| 50 |
| 13,265 |
| 4,581,595 |
|
| 0.00 |
| 0.03 |
|
| 46.17 |
| 46.17 |
|
| 9.26 |
| 8.72 |
| -5.88 |
|
| 1.20 |
| 0.83 |
|
Dorada |
| Au (g/t) |
| 51 |
| 1,184 |
| 1,587,335 |
|
| 0.00 |
| 0.00 |
|
| 45.92 |
| 45.90 |
|
| 7.93 |
| 5.62 |
| -29.12 |
|
| 1.30 |
| 0.93 |
|
Dorada |
| Au (g/t) |
| 52 |
| 397 |
| 729,997 |
|
| 0.00 |
| 0.02 |
|
| 50.81 |
| 50.81 |
|
| 6.00 |
| 4.93 |
| -17.81 |
|
| 1.29 |
| 0.72 |
|
Esmeralda |
| Ag (g/t) |
| 13 |
| 560 |
| 2,775,846 |
|
| 0.00 |
| 0.20 |
|
| 3,031.98 |
| 4,994.69 |
|
| 285.48 |
| 240.34 |
| -15.81 |
|
| 1.82 |
| 1.41 |
|
Esmeralda |
| Ag (g/t) |
| 14 |
| 80 |
| 541,889 |
|
| 0.00 |
| 0.25 |
|
| 1,949.00 |
| 3,720.00 |
|
| 299.68 |
| 319.42 |
| 6.59 |
|
| 1.66 |
| 1.90 |
|
Esmeralda |
| Au (g/t) |
| 13 |
| 560 |
| 2,775,846 |
|
| 0.00 |
| 0.00 |
|
| 66.18 |
| 89.90 |
|
| 6.20 |
| 5.62 |
| -9.24 |
|
| 1.65 |
| 1.11 |
|
Esmeralda |
| Au (g/t) |
| 14 |
| 80 |
| 541,889 |
|
| 0.00 |
| 0.00 |
|
| 87.00 |
| 87.00 |
|
| 9.28 |
| 9.21 |
| -0.70 |
|
| 1.91 |
| 1.40 |
|
Magenta |
| Ag (g/t) |
| 3 |
| 9,293 |
| 3,213,095 |
|
| 0.00 |
| 0.25 |
|
| 2,291.05 |
| 2,291.05 |
|
| 472.86 |
| 331.13 |
| -29.97 |
|
| 1.19 |
| 1.12 |
|
Magenta |
| Au (g/t) |
| 3 |
| 9,293 |
| 3,214,080 |
|
| 0.00 |
| 0.01 |
|
| 148.86 |
| 148.85 |
|
| 23.27 |
| 15.93 |
| -31.53 |
|
| 1.31 |
| 1.16 |
|
Providencia |
| Ag (g/t) |
| 60 |
| 14,594 |
| 5,264,754 |
|
| 0.00 |
| 0.25 |
|
| 2,071.00 |
| 2,070.98 |
|
| 405.42 |
| 352.66 |
| -13.01 |
|
| 1.16 |
| 0.86 |
|
Providencia |
| Ag (g/t) |
| 61 |
| 510 |
| 1,277,202 |
|
| 0.00 |
| 0.80 |
|
| 1,382.81 |
| 1,382.70 |
|
| 208.54 |
| 180.57 |
| -13.41 |
|
| 1.17 |
| 0.80 |
|
Providencia |
| Ag (g/t) |
| 62 |
| 574 |
| 1,325,342 |
|
| 0.11 |
| 0.11 |
|
| 2,936.75 |
| 2,936.75 |
|
| 273.13 |
| 242.99 |
| -11.04 |
|
| 1.16 |
| 0.75 |
|
Providencia |
| Au (g/t) |
| 60 |
| 14,594 |
| 5,264,754 |
|
| 0.00 |
| 0.01 |
|
| 53.30 |
| 53.30 |
|
| 6.80 |
| 6.21 |
| -8.63 |
|
| 1.14 |
| 0.78 |
|
Providencia |
| Au (g/t) |
| 61 |
| 510 |
| 1,277,219 |
|
| 0.00 |
| 0.00 |
|
| 42.10 |
| 62.10 |
|
| 4.36 |
| 4.90 |
| 12.45 |
|
| 1.33 |
| 0.88 |
|
Providencia |
| Au (g/t) |
| 62 |
| 574 |
| 1,325,342 |
|
| 0.00 |
| 0.00 |
|
| 39.30 |
| 39.30 |
|
| 4.72 |
| 4.06 |
| -13.87 |
|
| 1.42 |
| 0.80 |
|
TABLE 14-10 ID3 VERSUS NN BLOCK GRADES
Yamana Gold Inc. - El Peñón Mine
|
|
|
| Element |
|
|
|
|
|
|
|
|
|
|
|
|
|
|
|
|
|
|
|
Zone |
| Domain |
| (g/t) |
| Block Count |
| NN Min |
| ID3 Min |
| NN Max |
| ID3 Max |
| NN Mean |
| ID3 Mean |
| NN CV |
| ID3 CV |
|
Magenta |
| 3 |
| Ag |
| 3,213,095 |
| 0.21 |
| 0.25 |
| 2,291.05 |
| 2,291.05 |
| 336.94 |
| 331.13 |
| 1.36 |
| 1.12 |
|
505_506 |
| 5 |
| Ag |
| 4,232,596 |
| 0.25 |
| 0.25 |
| 6,533.35 |
| 6,533.35 |
| 134.21 |
| 133.65 |
| 1.83 |
| 1.71 |
|
505_506 |
| 6 |
| Ag |
| 2,193,747 |
| 0.10 |
| 0.10 |
| 800.00 |
| 798.53 |
| 83.68 |
| 82.08 |
| 1.23 |
| 0.90 |
|
Esmeralda |
| 13 |
| Ag |
| 2,775,846 |
| 0.20 |
| 0.20 |
| 5,000.00 |
| 4,994.69 |
| 224.08 |
| 240.34 |
| 1.76 |
| 1.41 |
|
Esmeralda |
| 14 |
| Ag |
| 541,889 |
| 0.25 |
| 0.25 |
| 3,720.00 |
| 3,720.00 |
| 315.71 |
| 319.42 |
| 2.14 |
| 1.90 |
|
Dorada |
| 50 |
| Ag |
| 7,013,323 |
| 0.25 |
| 0.64 |
| 1,434.14 |
| 3,027.03 |
| 259.65 |
| 579.63 |
| 1.05 |
| 0.85 |
|
Dorada |
| 51 |
| Ag |
| 1,587,335 |
| 0.60 |
| 0.60 |
| 3,117.42 |
| 3,116.26 |
| 286.46 |
| 289.24 |
| 1.32 |
| 1.06 |
|
Dorada |
| 52 |
| Ag |
| 729,820 |
| 2.40 |
| 2.41 |
| 2,459.76 |
| 2,459.62 |
| 267.76 |
| 267.77 |
| 0.88 |
| 0.73 |
|
Providencia |
| 60 |
| Ag |
| 5,264,754 |
| 0.25 |
| 0.25 |
| 2,071.00 |
| 2,070.98 |
| 354.03 |
| 352.66 |
| 1.12 |
| 0.86 |
|
Providencia |
| 61 |
| Ag |
| 1,277,202 |
| 0.80 |
| 0.80 |
| 1,382.81 |
| 1,382.70 |
| 179.14 |
| 180.57 |
| 0.93 |
| 0.80 |
|
Providencia |
| 62 |
| Ag |
| 1,325,342 |
| 0.11 |
| 0.11 |
| 2,936.75 |
| 2,936.75 |
| 238.36 |
| 242.99 |
| 0.92 |
| 0.75 |
|
Cerro_Martillo |
| 500 |
| Ag |
| 672,664 |
| 0.60 |
| 0.62 |
| 1,103.00 |
| 1,103.00 |
| 179.21 |
| 180.36 |
| 1.04 |
| 0.81 |
|
|
|
|
|
|
|
|
|
|
|
|
|
|
|
|
|
|
|
|
|
|
|
|
|
Magenta |
| 3 |
| Au |
| 3,214,080 |
| 0.01 |
| 0.01 |
| 148.86 |
| 148.85 |
| 16.26 |
| 15.93 |
| 1.47 |
| 1.16 |
|
505_506 |
| 5 |
| Au |
| 4,232,596 |
| 0.01 |
| 0.01 |
| 108.84 |
| 108.84 |
| 10.15 |
| 10.06 |
| 1.10 |
| 0.83 |
|
505_506 |
| 6 |
| Au |
| 2,193,747 |
| 0.00 |
| 0.00 |
| 60.00 |
| 59.99 |
| 7.31 |
| 7.32 |
| 1.14 |
| 0.84 |
|
Esmeralda |
| 13 |
| Au |
| 2,775,846 |
| 0.00 |
| 0.00 |
| 90.00 |
| 89.90 |
| 5.49 |
| 5.62 |
| 1.37 |
| 1.11 |
|
Esmeralda |
| 14 |
| Au |
| 541,889 |
| 0.00 |
| 0.00 |
| 87.00 |
| 87.00 |
| 8.48 |
| 9.21 |
| 1.64 |
| 1.40 |
|
Dorada |
| 50 |
| Au |
| 7,013,350 |
| 0.01 |
| 0.03 |
| 38.31 |
| 46.17 |
| 7.27 |
| 8.72 |
| 1.01 |
| 0.83 |
|
Dorada |
| 51 |
| Au |
| 1,587,335 |
| 0.00 |
| 0.00 |
| 45.92 |
| 45.90 |
| 5.60 |
| 5.62 |
| 1.15 |
| 0.93 |
|
Dorada |
| 52 |
| Au |
| 729,997 |
| 0.02 |
| 0.02 |
| 50.81 |
| 50.81 |
| 4.92 |
| 4.93 |
| 0.89 |
| 0.72 |
|
Providencia |
| 60 |
| Au |
| 5,264,754 |
| 0.01 |
| 0.01 |
| 53.30 |
| 53.30 |
| 6.26 |
| 6.21 |
| 1.06 |
| 0.78 |
|
Providencia |
| 61 |
| Au |
| 1,277,219 |
| 0.00 |
| 0.00 |
| 62.10 |
| 62.10 |
| 4.87 |
| 4.90 |
| 1.11 |
| 0.88 |
|
Providencia |
| 62 |
| Au |
| 1,325,342 |
| 0.00 |
| 0.00 |
| 39.30 |
| 39.30 |
| 4.02 |
| 4.06 |
| 1.07 |
| 0.80 |
|
Cerro_Martillo |
| 500 |
| Au |
| 672,664 |
| 0.10 |
| 0.10 |
| 34.26 |
| 34.26 |
| 5.65 |
| 5.62 |
| 0.91 |
| 0.70 |
|
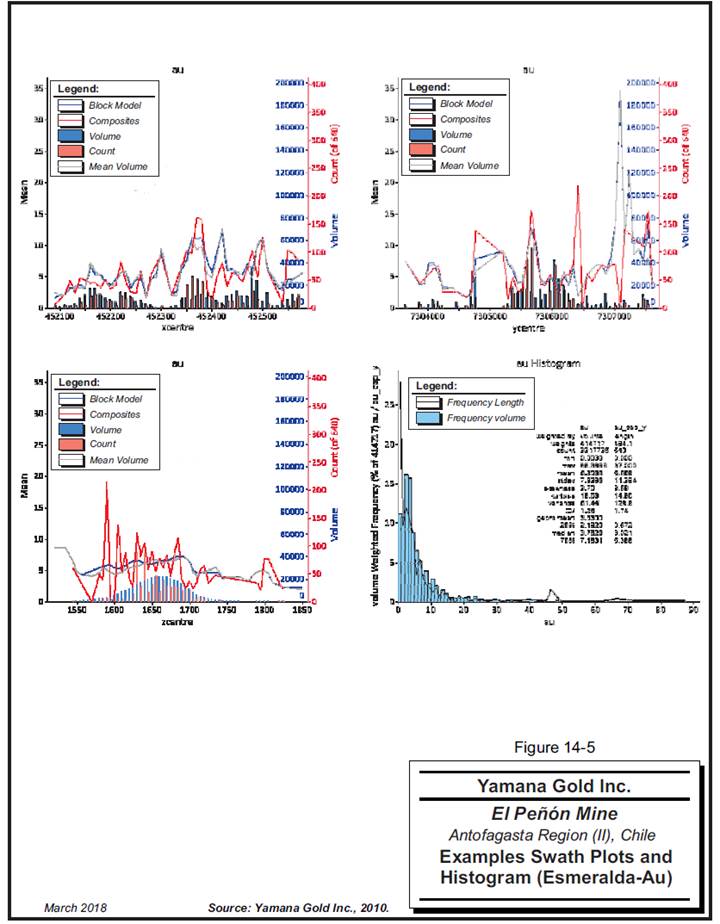
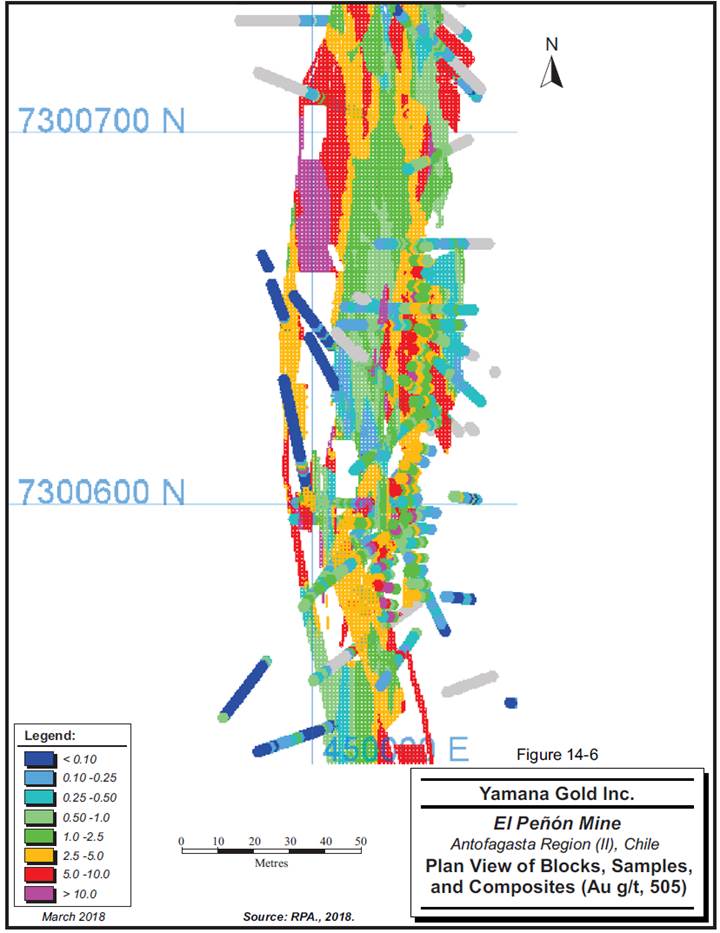
RPA performed advanced reporting in Vulcan software to validate Yamana’s Mineral Resource and Mineral Reserve estimates. RPA was able to closely match Yamana’s numbers using the same criteria. RPA’s validation results suggest that the Yamana estimates are reasonable. The block models are suitable to support Mineral Resource and Mineral Reserve estimation.
CLASSIFICATION
Definitions for Mineral Resource categories used in this report are consistent with those defined by CIM (2014) and adopted by NI 43-101. In the CIM classification, a Mineral Resource is defined as “a concentration or occurrence of solid material of economic interest in or on the Earth’s crust in such form, grade or quality and quantity that there are reasonable prospects for eventual economic extraction”. Mineral Resources are classified into Measured, Indicated, and Inferred categories. A Mineral Reserve is defined as the “economically mineable part of a Measured and/or Indicated Mineral Resource” demonstrated by studies at Pre-Feasibility or Feasibility level as appropriate. Mineral Reserves are classified into Proven and Probable categories.
Mineral Resources at El Peñón are reported exclusive of Mineral Reserves. Currently, an in-house built algorithm is used to perform Mineral Resource classification. The algorithm is as follows:
· Blocks located inside the channel sample area wireframes are classified as Measured Mineral Resources.
· In order to avoid direct transitions from Measured to Inferred categories, blocks located in the drill hole area wireframes and within a 5 m radius from the channel samples, are classified as Indicated Mineral Resources.
· If two different drill hole-intercepts are located at a maximum distance of 37.5 m from each other in the dip and strike direction of the vein, then blocks located in an area of 18.75 m x 18.75 m around each intercept are classified as Indicated Mineral Resources.
· The remainder of the blocks located within the drill hole area wireframe are classified as Inferred Mineral Resources.
· Blocks located outside the UGGS solid are not classified, and are therefore not considered to be part of the Mineral Resources.
RPA reviewed the block model classification and concludes that the overall classification criteria and designation are reasonable and suitable to support Mineral Resource and Mineral Reserve estimation. RPA is of the opinion that the definitions for Mineral Resource categories used in this report are consistent with those defined by CIM (2014) and incorporated by reference in NI 43-101.
The algorithm method used by Yamana for smoothing classification is acceptable.
CUT-OFF GRADE
A cut-off grade of 2.71 g/t AuEq was used for all zones except for the Pampa Augusta Victoria, Fortuna-Dominador-Laguna and Chiquilla Chica zones at 2.82 g/t AuEq, 2.79 g/t AuEq, and 2.81 g/t AuEq, respectively. Parameters used to define these cut-off grades are shown in Table 14-11.
TABLE 14-11 CUT-OFF GRADE PARAMETERS
Yamana Gold Inc. - El Peñón Mine
Parameters |
| Units |
| Value |
|
Gold Price |
| US$/oz |
| 1,600 |
|
Silver Price |
| US$/oz |
| 24 |
|
Gold Recovery |
| % |
| 95.0 |
|
Silver Recovery |
| % |
| 86.5 |
|
Mining Cost |
| US$/t |
| 87.58 |
|
Processing Cost |
| US$/t |
| 27.38 |
|
G&A |
| US$/t |
| 16.31 |
|
Selling Cost |
| % |
| 1.3 |
|
Transport Cost (Fortuna) |
| US$/t |
| 3.86 |
|
Transport Cost (Chiquilla Chica) |
| US$/t |
| 4.69 |
|
Transport Cost (PAV) |
| US$/t |
| 5.24 |
|
AuEq Factor |
|
|
| 75 |
|
DILUTION
The reported Mineral Resources consider minimum mining widths and expected dilutions (variable by vein) to determine reasonable prospects of eventual economic extraction.
After the mined out material and current Mineral Reserves were subtracted from the block models, a weighted average (2/3 to 1/3) of bench, split-blasting minimum mining widths, and
expected dilutions (rounded to the nearest 0.1 m) were used to design the Mineral Resource SMUs. Material lying outside the UGGS is treated as dilution for Mineral Resource estimation and zero gold and silver grades are assigned to this material. Parameters used to design the SMUs are shown in Table 14-12.
TABLE 14-12 SMU DESIGN PARAMETERS
Yamana Gold Inc. - El Peñón Mine
|
| Minimum |
| Maximum |
|
|
|
|
|
|
|
|
| Mining Width |
| Mining Width |
| Height |
| Expected |
| Minimum |
|
Vein |
| (m) |
| (m) |
| (m) |
| Dilution (m) |
| Dip (°) |
|
Abundancia / La Paloma |
| 0.6 |
| 6 |
| 12 |
| 1.0 |
| 60 |
|
Al Este |
| 0.6 |
| 6 |
| 12 |
| 0.4 |
| 60 |
|
Al Este Este |
| 0.6 |
| 6 |
| 12 |
| 0.4 |
| 60 |
|
Angelina |
| 0.6 |
| 6 |
| 12 |
| 0.6 |
| 60 |
|
Angosta |
| 0.6 |
| 6 |
| 12 |
| 0.7 |
| 60 |
|
Bermellón |
| 0.6 |
| 6 |
| 12 |
| 0.7 |
| 60 |
|
Bermuda |
| 0.6 |
| 6 |
| 12 |
| 0.8 |
| 60 |
|
Bonanza |
| 0.6 |
| 6 |
| 12 |
| 0.7 |
| 60 |
|
Borde Oeste |
| 0.6 |
| 6 |
| 12 |
| 0.7 |
| 60 |
|
Caracoles |
| 0.6 |
| 6 |
| 12 |
| 0.7 |
| 60 |
|
Carmín |
| 0.6 |
| 6 |
| 12 |
| 0.7 |
| 60 |
|
Carmín Sur |
| 0.6 |
| 6 |
| 12 |
| 0.7 |
| 60 |
|
Caseron 505 |
| 0.9 |
| 6 |
| 12 |
| 0.9 |
| 60 |
|
Caseron 506 |
| 0.9 |
| 6 |
| 12 |
| 1.0 |
| 60 |
|
Cerro Martillo |
| 0.9 |
| 6 |
| 12 |
| 0.8 |
| 60 |
|
Cerro Martillo Central Sur |
| 0.6 |
| 6 |
| 12 |
| 0.7 |
| 60 |
|
Diablada |
| 0.9 |
| 6 |
| 12 |
| 0.8 |
| 60 |
|
Discovery Wash |
| 0.6 |
| 6 |
| 12 |
| 0.7 |
| 60 |
|
Dominador |
| 0.9 |
| 6 |
| 12 |
| 0.6 |
| 60 |
|
Dorada |
| 0.9 |
| 6 |
| 12 |
| 0.6 |
| 60 |
|
Dorada SW |
| 0.9 |
| 6 |
| 12 |
| 0.6 |
| 60 |
|
El Valle |
| 0.9 |
| 6 |
| 12 |
| 1.0 |
| 60 |
|
Elizabeth |
| 0.6 |
| 6 |
| 12 |
| 0.8 |
| 60 |
|
Escarlata |
| 0.6 |
| 6 |
| 12 |
| 0.7 |
| 60 |
|
Esmeralda |
| 0.6 |
| 6 |
| 12 |
| 0.7 |
| 60 |
|
Esperanza |
| 0.6 |
| 6 |
| 12 |
| 0.7 |
| 60 |
|
Fortuna |
| 0.6 |
| 6 |
| 12 |
| 0.8 |
| 60 |
|
Fortuna Este |
| 0.6 |
| 6 |
| 12 |
| 0.7 |
| 60 |
|
Laguna |
| 0.6 |
| 6 |
| 4 |
| 0.6 |
| — |
|
Magenta |
| 0.6 |
| 6 |
| 12 |
| 0.8 |
| 60 |
|
Magenta Norte |
| 0.6 |
| 6 |
| 12 |
| 0.8 |
| 60 |
|
Martillo Flats |
| 0.6 |
| 6 |
| 12 |
| 0.6 |
| 60 |
|
Orito Norte |
| 0.9 |
| 6 |
| 12 |
| 0.8 |
| 60 |
|
Orito Sur |
| 0.9 |
| 6 |
| 12 |
| 1.0 |
| 60 |
|
Vein |
| Minimum |
| Maximum |
| Height |
| Expected |
| Minimum |
|
Orito West |
| 0.6 |
| 6 |
| 12 |
| 0.7 |
| 60 |
|
Pampa Campamento |
| 0.6 |
| 6 |
| 12 |
| 0.8 |
| 60 |
|
Pampa Providencia |
| 0.8 |
| 6 |
| 12 |
| 0.6 |
| 60 |
|
Playa |
| 0.9 |
| 6 |
| 12 |
| 0.8 |
| 60 |
|
Providencia |
| 0.9 |
| 6 |
| 12 |
| 0.6 |
| 60 |
|
Púrpura |
| 0.6 |
| 6 |
| 12 |
| 0.8 |
| 60 |
|
Rieles |
| 0.6 |
| 6 |
| 12 |
| 0.7 |
| 60 |
|
Sorpresa |
| 0.6 |
| 6 |
| 12 |
| 0.6 |
| 60 |
|
Ventura |
| 0.6 |
| 6 |
| 12 |
| 0.6 |
| 60 |
|
Victoria |
| 0.9 |
| 6 |
| 12 |
| 0.7 |
| 60 |
|
Vista Norte |
| 0.9 |
| 6 |
| 12 |
| 0.8 |
| 60 |
|
VNW |
| 0.9 |
| 6 |
| 12 |
| 0.7 |
| 60 |
|
GOLD EQUIVALENT FACTOR
Gold and silver prices of US$1,250/oz and US$18.00/oz at 95% and 86.5% recovery, for gold and silver respectively, were used to calculate the gold equivalent factor according to the following equation:
![]()
The gold equivalent factor of 75 was chosen for wireframe modelling and UGGS construction purposes.
15 MINERAL RESERVE ESTIMATE
SUMMARY
Mineral Reserves at the El Peñón Mine are estimated using Vulcan software including the MineModeller UG/OP, GeoModeller, Stope Optimizer, and Gantt Scheduler. SMUs are designed for each vein using metal prices, recoveries, and operating costs to determine an economic value of each SMU. SMUs with negative values are excluded from further consideration, except for drift SMUs that are above the marginal cut-off grade.
The December 31, 2017 Mineral Reserve estimate is listed in Table 15-1.
TABLE 15-1 MINERAL RESERVE ESTIMATE — DECEMBER 31, 2017
Yamana Gold Inc. — El Peñón Mine
|
| Tonnage |
| Grade |
| Contained Metal |
| ||||
Category |
| (000 t) |
| (g/t Au) |
| (g/t Ag) |
| (000 oz Au) |
| (000 oz Ag) |
|
Proven |
| 1,061.80 |
| 5.90 |
| 192.4 |
| 201.2 |
| 6,567.4 |
|
Probable |
| 3,331.82 |
| 5.25 |
| 158.8 |
| 562.6 |
| 17,011.0 |
|
Total |
| 4,393.62 |
| 5.41 |
| 166.9 |
| 763.8 |
| 23,578.0 |
|
Notes:
1. CIM (2014) definitions were followed for Mineral Reserves.
2. Mineral Reserves are estimated using processing recoveries from a geometallurgical model, as recoveries are variable by ore type.
3. A cut-off grade of 3.48 g/t AuEq was used in the Mineral Reserve for most veins except as follows: a cut-off grade of 3.62 g/t AuEq used for the Elizabeth and Victoria veins in the Pampa Augusta Victoria Area (for a US$5.24/t additional transportation cost) and a cut-off of 3.59 g/t AuEq used for the Fortuna, Dominador, and Laguna veins in the Fortuna and Laguna Area (for a US$3.86/t additional transportation cost).
4. Mineral Reserves are estimated using an average long-term gold price of US$1,250/oz and a silver price of US$18/oz.
5. A minimum mining width of 0.60 m to 1.0 m was used depending on the vein.
6. Bulk density varies from 2.36 t/m3 to 2.57 t/m3.
7. The SMUs include Inferred Mineral Resources and unclassified material (blocks located outside of the UGGS). These materials were treated as dilution for mine planning and Mineral Reserve estimation purposes. Zero gold and silver grades have been assigned to them.
8. Numbers may not add due to rounding.
RPA is not aware of any mining, metallurgical, infrastructure, permitting, or other relevant factors that could materially affect the Mineral Reserve estimate.
A breakdown of the Mineral Reserves by vein is listed in Table 15-2. The majority of the Mineral Reserves are underground, with small quantities of open pit and low-grade stockpiles included in the totals.
TABLE 15-2 MINERAL RESERVE ESTIMATES BY VEIN — DECEMBER 31, 2017
Yamana Gold Inc. — El Peñón Mine
PROVEN + PROBABLE
|
|
|
| Grade |
| Contained Metal |
| ||||
Vein |
| Tonnage (t) |
| Au (g/t) |
| Ag (g/t) |
| Au (oz) |
| Ag (oz) |
|
Providencia |
| 206,034 |
| 4.55 |
| 215.2 |
| 30,125 |
| 1,425,508 |
|
Sorpresa |
| 80,668 |
| 4.40 |
| 199.5 |
| 11,422 |
| 517,310 |
|
Pampa Campamento |
| 106,013 |
| 4.37 |
| 155.8 |
| 14,885 |
| 530,968 |
|
Discovery Wash |
| 96,835 |
| 4.68 |
| 121.1 |
| 14,577 |
| 376,914 |
|
El Valle |
| 157,002 |
| 4.94 |
| 95.3 |
| 24,946 |
| 481,169 |
|
Al Este |
| 272,898 |
| 5.58 |
| 245.7 |
| 48,943 |
| 2,155,408 |
|
Bonanza |
| 102,421 |
| 7.50 |
| 59.3 |
| 24,684 |
| 195,341 |
|
Vista Norte |
| 104,038 |
| 5.67 |
| 42.1 |
| 18,955 |
| 140,909 |
|
Orito Sur |
| 113,402 |
| 4.72 |
| 72.4 |
| 17,214 |
| 263,780 |
|
Orito Norte |
| 37,041 |
| 5.67 |
| 29.8 |
| 6,751 |
| 35,449 |
|
Púrpura |
| 39,319 |
| 4.98 |
| 399.7 |
| 6,291 |
| 505,318 |
|
Cerro Martillo |
| 193,846 |
| 4.06 |
| 152.3 |
| 25,326 |
| 949,329 |
|
Dorada |
| 345,721 |
| 4.65 |
| 278.2 |
| 51,695 |
| 3,091,643 |
|
Dorada SW |
| 40,806 |
| 3.31 |
| 265.7 |
| 4,339 |
| 348,534 |
|
Magenta |
| 163,166 |
| 7.47 |
| 97.5 |
| 39,176 |
| 511,547 |
|
Magenta Norte |
| 56,286 |
| 5.08 |
| 137.8 |
| 9,185 |
| 249,408 |
|
Carmín |
| 67,296 |
| 9.71 |
| 40.5 |
| 21,004 |
| 87,648 |
|
Carmín Sur |
| 53,766 |
| 8.23 |
| 60.7 |
| 14,231 |
| 104,889 |
|
Escarlata |
| 30,652 |
| 10.69 |
| 34.0 |
| 10,536 |
| 33,517 |
|
Caracoles |
| 1,124 |
| 1.67 |
| 196.5 |
| 60 |
| 7,105 |
|
Martillo Flats |
| 155,497 |
| 4.45 |
| 217.9 |
| 22,257 |
| 1,089,429 |
|
Fortuna |
| 115,619 |
| 3.97 |
| 337.6 |
| 14,772 |
| 1,254,933 |
|
Dominador |
| 11,782 |
| 6.27 |
| 191.6 |
| 2,376 |
| 72,577 |
|
Playa |
| 14,399 |
| 4.97 |
| 122.5 |
| 2,303 |
| 56,690 |
|
Caserón 505 |
| 205,953 |
| 6.44 |
| 66.7 |
| 42,622 |
| 441,563 |
|
Caserón 506 |
| 123,227 |
| 5.27 |
| 46.9 |
| 20,893 |
| 185,651 |
|
Diablada |
| 84,781 |
| 6.89 |
| 41.6 |
| 18,790 |
| 113,483 |
|
Angelina |
| 37,956 |
| 7.12 |
| 58.1 |
| 8,683 |
| 70,918 |
|
Bermellón |
| 19,863 |
| 6.78 |
| 182.0 |
| 4,329 |
| 116,211 |
|
Victoria (PAV) |
| 200,643 |
| 5.83 |
| 114.8 |
| 37,612 |
| 740,831 |
|
Elizabeth (PAV) |
| 85,008 |
| 2.45 |
| 405.0 |
| 6,695 |
| 1,106,925 |
|
Esmeralda |
| 161,025 |
| 4.87 |
| 201.0 |
| 25,211 |
| 1,040,306 |
|
Esperanza |
| 32,519 |
| 10.11 |
| 162.1 |
| 10,570 |
| 169,488 |
|
Borde Oeste |
| 37,699 |
| 5.15 |
| 230.8 |
| 6,244 |
| 279,726 |
|
Veta Norweste |
| 59,689 |
| 4.46 |
| 221.2 |
| 8,566 |
| 424,430 |
|
Ventura |
| 160,614 |
| 4.88 |
| 340.9 |
| 25,175 |
| 1,760,484 |
|
Laguna |
| 135,031 |
| 6.71 |
| 51.5 |
| 29,124 |
| 223,768 |
|
Abundancia |
| 59,182 |
| 10.22 |
| 144.5 |
| 19,446 |
| 274,861 |
|
La Paloma |
| 148,309 |
| 6.08 |
| 135.4 |
| 28,999 |
| 645,749 |
|
Orito West |
| 27,536 |
| 8.10 |
| 148.4 |
| 7,172 |
| 131,413 |
|
|
|
|
| Grade |
| Contained Metal |
| ||||
Vein |
| Tonnage (t) |
| Au (g/t) |
| Ag (g/t) |
| Au (oz) |
| Ag (oz) |
|
Cerro Martillo Central Sur |
| 72,808 |
| 5.23 |
| 145.6 |
| 12,242 |
| 340,984 |
|
Total U.G. |
| 4,217,477 |
| 5.5 |
| 166.3 |
| 748,425 |
| 22,552,112 |
|
|
|
|
|
|
|
|
|
|
|
|
|
Chiquilla Chica |
| 49,226 |
| 0.49 |
| 445.3 |
| 777 |
| 704,786 |
|
505 |
| 15,928 |
| 5.21 |
| 21.3 |
| 2,666 |
| 10,900 |
|
Cerro Martillo |
| 9,719 |
| 3.80 |
| 94.6 |
| 1,186 |
| 29,564 |
|
Discovery Wash |
| 2,813 |
| 1.61 |
| 24.7 |
| 145 |
| 2,233 |
|
El Valle |
| 6,750 |
| 1.94 |
| 33.9 |
| 421 |
| 7,357 |
|
Orito Norte |
| 28,954 |
| 3.51 |
| 30.3 |
| 3,267 |
| 28,172 |
|
Total Open Pit |
| 113,389 |
| 2.3 |
| 214.8 |
| 8,463 |
| 783,012 |
|
|
|
|
|
|
|
|
|
|
|
|
|
Stockpile U.G. |
| 57,826 |
| 3.5 |
| 126.1 |
| 6,513 |
| 234,444 |
|
Stockpile Surface |
| 4,927 |
| 2.4 |
| 53.0 |
| 388 |
| 8,465 |
|
Total Stockpile |
| 62,753 |
| 3.4 |
| 120.4 |
| 6,901 |
| 242,909 |
|
|
|
|
|
|
|
|
|
|
|
|
|
Total Reserves |
| 4,393,620 |
| 5.4 |
| 166.9 |
| 763,789 |
| 23,578,033 |
|
PROVEN
|
|
|
| Grade |
| Contained Metal |
| ||||
Vein |
| Tonnage (t) |
| Au (g/t) |
| Ag (g/t) |
| Au (oz) |
| Ag (oz) |
|
Providencia |
| 41,109 |
| 4.2 |
| 318.0 |
| 5,486 |
| 420,286 |
|
Sorpresa |
| 14,418 |
| 4.7 |
| 170.5 |
| 2,178 |
| 79,052 |
|
Pampa Campamento |
| 17,398 |
| 4.6 |
| 135.2 |
| 2,552 |
| 75,639 |
|
Discovery Wash |
| 15,706 |
| 4.4 |
| 118.2 |
| 2,202 |
| 59,712 |
|
El Valle |
| 7,685 |
| 3.5 |
| 84.5 |
| 874 |
| 20,881 |
|
Al Este |
| 90,027 |
| 7.4 |
| 280.0 |
| 21,309 |
| 810,465 |
|
Bonanza |
| 48,840 |
| 8.9 |
| 69.3 |
| 14,002 |
| 108,762 |
|
Vista Norte |
| 17,986 |
| 5.4 |
| 57.8 |
| 3,105 |
| 33,399 |
|
Orito Sur |
| 30,247 |
| 5.2 |
| 83.7 |
| 5,069 |
| 81,360 |
|
Orito Norte |
| 16,589 |
| 4.7 |
| 29.8 |
| 2,513 |
| 15,887 |
|
Púrpura |
| 3,092 |
| 6.5 |
| 122.4 |
| 642 |
| 12,172 |
|
Cerro Martillo |
| 49,285 |
| 4.5 |
| 177.8 |
| 7,143 |
| 281,772 |
|
Dorada |
| 86,057 |
| 5.0 |
| 315.4 |
| 13,762 |
| 872,785 |
|
Dorada SW |
| 18,403 |
| 3.6 |
| 294.2 |
| 2,107 |
| 174,064 |
|
Magenta |
| 34,867 |
| 9.6 |
| 141.6 |
| 10,717 |
| 158,711 |
|
Magenta Norte |
| 12,356 |
| 4.7 |
| 151.6 |
| 1,862 |
| 60,218 |
|
Carmín |
| 25,397 |
| 7.4 |
| 67.3 |
| 6,080 |
| 54,943 |
|
Carmín Sur |
| 10,610 |
| 7.2 |
| 125.3 |
| 2,470 |
| 42,754 |
|
Escarlata |
| 6,811 |
| 6.1 |
| 60.7 |
| 1,346 |
| 13,285 |
|
Martillo Flats |
| 13,137 |
| 3.9 |
| 190.0 |
| 1,647 |
| 80,226 |
|
Fortuna |
| 17,632 |
| 3.2 |
| 243.4 |
| 1,828 |
| 137,986 |
|
Dominador |
| 579 |
| 4.8 |
| 48.1 |
| 89 |
| 895 |
|
Playa |
| 1,164 |
| 4.2 |
| 94.0 |
| 159 |
| 3,519 |
|
|
|
|
| Grade |
| Contained Metal |
| ||||
Vein |
| Tonnage (t) |
| Au (g/t) |
| Ag (g/t) |
| Au (oz) |
| Ag (oz) |
|
Caserón 505 |
| 75,469 |
| 4.9 |
| 70.7 |
| 11,921 |
| 171,569 |
|
Caserón 506 |
| 30,471 |
| 5.3 |
| 57.4 |
| 5,156 |
| 56,209 |
|
Diablada |
| 11,767 |
| 5.9 |
| 17.0 |
| 2,243 |
| 6,441 |
|
Angelina |
| 13,004 |
| 6.3 |
| 40.4 |
| 2,635 |
| 16,905 |
|
Bermellón |
| 9,996 |
| 9.0 |
| 215.3 |
| 2,881 |
| 69,176 |
|
Victoria (PAV) |
| 61,960 |
| 7.9 |
| 117.5 |
| 15,752 |
| 234,090 |
|
Elizabeth (PAV) |
| 37,924 |
| 3.3 |
| 463.2 |
| 4,066 |
| 564,792 |
|
Esmeralda |
| 13,943 |
| 7.4 |
| 293.3 |
| 3,310 |
| 131,467 |
|
Esperanza |
| 905 |
| 2.6 |
| 150.1 |
| 76 |
| 4,367 |
|
Veta Norweste |
| 25,637 |
| 4.7 |
| 299.4 |
| 3,872 |
| 246,749 |
|
Ventura |
| 66,954 |
| 6.2 |
| 449.4 |
| 13,375 |
| 967,306 |
|
Laguna |
| 10,027 |
| 6.9 |
| 46.6 |
| 2,212 |
| 15,019 |
|
Abundancia |
| 38,590 |
| 12.2 |
| 161.4 |
| 15,190 |
| 200,196 |
|
La Paloma |
| 83 |
| 2.0 |
| 183.8 |
| 5 |
| 492 |
|
Total U.G. |
| 976,126 |
| 6.1 |
| 200.2 |
| 191,837 |
| 6,283,549 |
|
|
|
|
|
|
|
|
|
|
|
|
|
505 |
| 5,694 |
| 3.8 |
| 52.1 |
| 702 |
| 9,539 |
|
Cerro Martillo |
| 6,672 |
| 4.0 |
| 96.6 |
| 862 |
| 20,732 |
|
El Valle |
| 6,750 |
| 1.9 |
| 33.9 |
| 421 |
| 7,357 |
|
Orito Norte |
| 3,804 |
| 4.3 |
| 27.2 |
| 524 |
| 3,323 |
|
Total Open Pit |
| 22,920 |
| 3.4 |
| 55.6 |
| 2,510 |
| 40,951 |
|
|
|
|
|
|
|
|
|
|
|
|
|
Stockpile U.G. |
| 57,826 |
| 3.5 |
| 126.1 |
| 6,513 |
| 234,444 |
|
Stockpile Surface |
| 4,927 |
| 2.4 |
| 53.4 |
| 388 |
| 8,465 |
|
Total Stockpile |
| 62,753 |
| 3.4 |
| 120.4 |
| 6,901 |
| 242,909 |
|
|
|
|
|
|
|
|
|
|
|
|
|
Total Reserves |
| 1,061,799 |
| 5.90 |
| 192.38 |
| 201,247 |
| 6,567,408 |
|
PROBABLE
|
|
|
| Grade |
| Contained Metal |
| ||||
Vein |
| Tonnage (t) |
| Au (g/t) |
| Ag (g/t) |
| Au (oz) |
| Ag (oz) |
|
Providencia |
| 164,925 |
| 4.6 |
| 189.6 |
| 24,640 |
| 1,005,246 |
|
Sorpresa |
| 66,250 |
| 4.3 |
| 205.8 |
| 9,244 |
| 438,267 |
|
Pampa Campamento |
| 88,615 |
| 4.3 |
| 159.8 |
| 12,333 |
| 455,338 |
|
Discovery Wash |
| 81,129 |
| 4.7 |
| 121.6 |
| 12,375 |
| 317,209 |
|
El Valle |
| 149,317 |
| 5.0 |
| 95.9 |
| 24,072 |
| 460,296 |
|
Al Este |
| 182,871 |
| 4.7 |
| 228.8 |
| 27,635 |
| 1,344,978 |
|
Bonanza |
| 53,581 |
| 6.2 |
| 50.3 |
| 10,683 |
| 86,582 |
|
Vista Norte |
| 86,052 |
| 5.7 |
| 38.9 |
| 15,851 |
| 107,512 |
|
Orito Sur |
| 83,155 |
| 4.5 |
| 68.2 |
| 12,145 |
| 182,425 |
|
Orito Norte |
| 20,452 |
| 6.4 |
| 29.8 |
| 4,238 |
| 19,562 |
|
Púrpura |
| 36,226 |
| 4.9 |
| 423.4 |
| 5,650 |
| 493,154 |
|
Cerro Martillo |
| 144,561 |
| 3.9 |
| 143.6 |
| 18,183 |
| 667,573 |
|
Dorada |
| 259,664 |
| 4.5 |
| 265.8 |
| 37,934 |
| 2,218,909 |
|
|
|
|
| Grade |
| Contained Metal |
| ||||
Vein |
| Tonnage (t) |
| Au (g/t) |
| Ag (g/t) |
| Au (oz) |
| Ag (oz) |
|
Dorada SW |
| 22,404 |
| 3.1 |
| 242.2 |
| 2,232 |
| 174,476 |
|
Magenta |
| 128,299 |
| 6.9 |
| 85.5 |
| 28,459 |
| 352,845 |
|
Magenta Norte |
| 43,930 |
| 5.2 |
| 134.0 |
| 7,323 |
| 189,194 |
|
Carmín |
| 41,899 |
| 11.1 |
| 24.3 |
| 14,924 |
| 32,706 |
|
Carmín Sur |
| 43,156 |
| 8.5 |
| 44.8 |
| 11,761 |
| 62,137 |
|
Escarlata |
| 23,841 |
| 12.0 |
| 26.4 |
| 9,190 |
| 20,232 |
|
Caracoles |
| 1,124 |
| 1.7 |
| 196.5 |
| 60 |
| 7,105 |
|
Martillo Flats |
| 142,360 |
| 4.5 |
| 220.5 |
| 20,610 |
| 1,009,221 |
|
Fortuna |
| 97,987 |
| 4.1 |
| 354.6 |
| 12,944 |
| 1,116,968 |
|
Dominador |
| 11,203 |
| 6.4 |
| 199.0 |
| 2,287 |
| 71,683 |
|
Playa |
| 13,236 |
| 5.0 |
| 125.0 |
| 2,144 |
| 53,172 |
|
Caserón 505 |
| 130,484 |
| 7.3 |
| 64.4 |
| 30,702 |
| 270,002 |
|
Caserón 506 |
| 92,756 |
| 5.3 |
| 43.4 |
| 15,738 |
| 129,446 |
|
Diablada |
| 73,014 |
| 7.0 |
| 45.6 |
| 16,547 |
| 107,043 |
|
Angelina |
| 24,952 |
| 7.5 |
| 67.3 |
| 6,048 |
| 54,014 |
|
Bermellón |
| 9,868 |
| 4.6 |
| 148.3 |
| 1,447 |
| 47,036 |
|
Victoria (PAV) |
| 138,683 |
| 4.9 |
| 113.7 |
| 21,861 |
| 506,753 |
|
Elizabeth (PAV) |
| 47,084 |
| 1.7 |
| 358.1 |
| 2,629 |
| 542,151 |
|
Esmeralda |
| 147,082 |
| 4.6 |
| 192.2 |
| 21,902 |
| 908,856 |
|
Esperanza |
| 31,614 |
| 10.3 |
| 162.5 |
| 10,494 |
| 165,124 |
|
Borde Oeste |
| 37,699 |
| 5.2 |
| 230.8 |
| 6,244 |
| 279,731 |
|
Veta Norweste |
| 34,052 |
| 4.3 |
| 162.3 |
| 4,694 |
| 177,688 |
|
Ventura |
| 93,660 |
| 3.9 |
| 263.4 |
| 11,800 |
| 793,208 |
|
Laguna |
| 125,004 |
| 6.7 |
| 51.9 |
| 26,913 |
| 208,753 |
|
Abundancia |
| 20,593 |
| 6.4 |
| 112.8 |
| 4,256 |
| 74,670 |
|
La Paloma |
| 148,226 |
| 6.1 |
| 135.4 |
| 28,995 |
| 645,268 |
|
Orito West |
| 27,536 |
| 8.1 |
| 148.4 |
| 7,172 |
| 131,416 |
|
Cerro Martillo Central Sur |
| 72,808 |
| 5.2 |
| 145.7 |
| 12,242 |
| 340,990 |
|
Total U.G. |
| 3,241,352 |
| 5.34 |
| 156.11 |
| 556,601 |
| 16,268,940 |
|
|
|
|
|
|
|
|
|
|
|
|
|
Chiquilla Chica |
| 49,226 |
| 0.5 |
| 445.3 |
| 777 |
| 704,798 |
|
505 |
| 10,234 |
| 6.0 |
| 4.1 |
| 1,963 |
| 1,362 |
|
Cerro Martillo |
| 3,047 |
| 3.3 |
| 90.2 |
| 324 |
| 8,832 |
|
Discovery Wash |
| 2,813 |
| 1.6 |
| 24.7 |
| 145 |
| 2,233 |
|
El Valle |
| — |
| 0.0 |
| 0.0 |
| — |
| — |
|
Orito Norte |
| 25,150 |
| 3.4 |
| 30.7 |
| 2,743 |
| 24,849 |
|
Total Open Pit |
| 90,469 |
| 2.05 |
| 255.1 |
| 5,954 |
| 742,074 |
|
|
|
|
|
|
|
|
|
|
|
|
|
Total Reserves |
| 3,331,821 |
| 5.25 |
| 158.8 |
| 562,554 |
| 17,011,015 |
|
Notes:
1. CIM (2014) definitions were followed for Mineral Reserves.
2. Mineral Reserves are estimated using processing recoveries from a geometallurgical model, as recoveries are variable by ore type.
3. A cut-off grade of 3.48 g/t AuEq was used in the Mineral Reserve for most veins except as follows: a cut-off grade of 3.62 g/t AuEq used for the Elizabeth and Victoria veins in the Pampa Augusta Victoria Area (for a US$5.24/t additional transportation cost) and a cut-off of 3.59 g/t AuEq used for the Fortuna, Dominador, and Laguna veins in the Fortuna and Laguna Area (for a US$3.86/t additional transportation cost).
4. Mineral Reserves are estimated using an average long-term gold price of US$1,250/oz and a silver price of US$18/oz.
5. A minimum mining width of 0.60 m to 1.0 m was used depending on the vein.
6. Bulk density varies from 2.36 t/m3 to 2.57 t/m3.
7. The SMUs include Inferred Mineral Resources and unclassified material (blocks located outside of the UGGS). These materials were treated as dilution for mine planning and Mineral Reserve estimation purposes. Zero gold and silver grades have been assigned to them.
8. Numbers may not add due to rounding.
MINERAL RESERVE PROCESS
The process of Mineral Reserve estimation is shown in Figure 15-1, outlining the steps included in the estimation process.
FIGURE 15-1 MINERAL RESERVES PROCESS
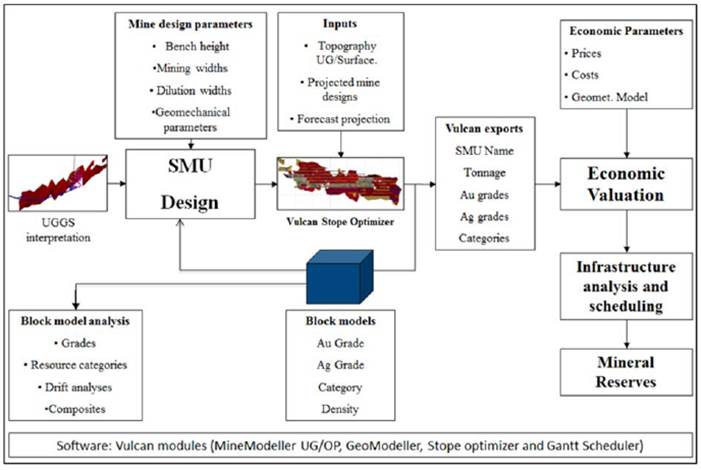
SMU DESIGN
The drift and bench SMUs are automatically designed using Vulcan Stope Optimizer. Drifts are spaced at varying vertical intervals (sublevels between six metres to 16 m) and defined
considering the width, grade and dip of the mineralization as well as geotechnical conditions. The drift parameters for all veins are as listed in Table 15-3.
TABLE 15-3 SMU DRIFT PARAMETERS
Yamana Gold Inc. — El Peñón Mine
|
| Minimum Mining |
| Maximum Mining |
| Drift Height |
| Expected |
|
Vein |
| Width (m) |
| Width (m) |
| (m) |
| Dilution (m) |
|
All |
| 0.6 |
| 6.0 |
| 4.0 |
| 0.5 |
|
The SMUs are 15 m in length and typically mined out in five rounds of three metres. After drifts are completed and ground support is installed, stoping commences with development of a slot raise at the vein extremity to provide the initial void space to continue blasting the production longholes and advancing the stope. Typical stope dimensions are 1.2 m to six metres in width and six metres to 16.0 m in height.
An economic value is determined for each SMU using metal prices, recoveries, and operating costs. SMUs with negative economic values are excluded from any further analysis, except for those drift SMUs above the marginal cut-off grade. Any Inferred Resources contained within an SMU are treated as waste and assigned a zero grade. SMUs with positive economic returns are analyzed for inclusion into the LOM plan. A development cost analysis is carried out before any SMU is included in the LOM plan. Measured Mineral Resources contained in the SMUs included in the LOM plan are converted to Proven Mineral Reserves, while Indicated Mineral Resources contained in the SMU included in the LOM are converted to Probable Mineral Reserves.
The economic parameters used in the Mineral Reserves estimate are shown in Table 15-4.
TABLE 15-4 ECONOMIC PARAMETERS
Yamana Gold Inc. — El Peñón Mine
Parameter |
| Units |
| Value |
|
Gold Price |
| US$/oz |
| 1,250 |
|
Silver Price |
| US$/oz |
| 18 |
|
Gold Recovery |
| % |
| Variable |
|
Silver Recovery |
| % |
| Variable |
|
Mining – Bench & Fill |
| US/t ore |
| 87.58 |
|
Mining - Cut & Fill |
| US/t ore |
| 115.00 |
|
Mining - Open Pit |
| US/t ore |
| 5.00 |
|
Parameter |
| Units |
| Value |
|
Processing Cost |
| US/t ore |
| 27.38 |
|
G & A |
| US/t ore |
| 16.31 |
|
Selling Cost-Gold |
| % |
| 1.3 |
|
Selling Cost-Silver |
| % |
| 1.2 |
|
Infrastructure (Drift) |
| US$/m |
| 2,277 |
|
Access |
| US$/m |
| 2,322 |
|
Lateral (Dev.) |
| US$/m |
| 3,337 |
|
Vertical (Dev.) |
| US$/m |
| 1,404 |
|
Transport Cost (Fortuna) |
| US$/t ore |
| 3.86 |
|
Transport Cost (Chiquilla Chica) |
| US$/t ore |
| 4.69 |
|
Transport Cost (PAV) |
| US$/t ore |
| 5.24 |
|
The economic value of each SMU is determined using the following revenue and cost formulas:
Value: I = Tm*(PAu-CvAu)/31.10348*LAu*RAu*Rm+Tm(PAg-CvAg)/31.10348*LAg*RAg*Rm
Where I = Ingreso or Value US$
Tm= Ore Tonnes (Measured + Indicated with dilution)
LAu, LAg = Mean grades for gold and silver (g/t)
PAu, PAg = Metal prices (US$/oz)
CvAu, CvAg = Cost of sales for gold and silver (US$/oz)
RAu, RAg = metallurgical recovery of gold and silver (%)
Rm = mining recovery.
and
Total Cost C = ((Cp+ G&A+ Cm)*Tm)*Rm
CMina = Mining cost US$
Tm = Ore Tonnes (Measured + Indicated with dilution)
Cp = Processing cost (US$/t feed)
Cr= Backfilling cost (US$/m3) (included in CMina)
G&A = General and Administration cost (US$/tonne feed)
Rm = Mining Recovery (%)
and
Benefit B = I-C for each SMU US$
Modelling of the resource estimation for conversion to reserves does not include a cut-off grade or minimum mining widths. Global resources are estimated in these domains. The information is provided to the engineering department who carry out the following process:
1. Mined out areas are subtracted from the models (grades of these blocks are set to zero).
2. A stope optimization process is done which considers a cut-off of 3.48 g/t AuEq (US$1,250/oz Au and US$18/oz Ag), minimum mining widths, and expected dilution.
3. On the resulting stopes, an infrastructure analysis is done in order to review if the extraction of these stopes pays for the development costs. Stopes that pass the analysis are considered Mineral Reserves.
After the process is completed, the reserve SMUs are returned to the geology department who consider this material also as mined out material in order to report resources exclusive of reserves (grades in reserves SMUs are set to zero).
Finally, another stope optimization process is carried out on the models, in this case at a cut-off of 2.71 g/t AuEq (US$1,600/oz Au and US$24/oz Ag) considering also minimum mining widths and expected dilutions. These are not analyzed for infrastructure. Material in the resulting SMUs is considered Mineral Resources.
RPA is of the opinion that the conversion process of Mineral Resources to Mineral Reserves is robust and ensures that each SMU has positive economic value.
DILUTION
The dilution estimates of the SMUs used for the Mineral Reserves estimates for the various veins at El Peñón are listed in Table 15-5 that follows.
TABLE 15-5 SMU MINING PARAMETERS
Yamana Gold Inc. — El Peñón Mine
Vein |
| Minimum Mining |
| Maximum Mining |
| Height |
| Expected |
| Minimum |
|
Caseron 505 |
| 1.00 |
| 6 |
| 14 |
| 1.10 |
| 60 |
|
Caseron 506 |
| 1.00 |
| 6 |
| 14 or 16 |
| 1.30 to 1.40 |
| 60 |
|
Abundancia |
| 0.60 |
| 6 |
| 8 |
| 1.00 |
| 60 |
|
Al Este |
| 0.60 to 1.00 |
| 6 |
| 8 |
| 0.40 to 1.50 |
| 60 |
|
Angelina |
| 0.60 to 1.00 |
| 6 |
| 8 or 14 |
| 0.60 to 1.30 |
| 60 |
|
Bermellón |
| 0.60 |
| 6 |
| 8 |
| 0.60 to 0.80 |
| 60 |
|
Bonanza |
| 0.60 to 1.00 |
| 6 |
| 12 |
| 0.80 to 1.00 |
| 60 |
|
Borde Oeste |
| 0.60 |
| 6 |
| 8 |
| 0.80 |
| 60 |
|
Carmín |
| 0.60 |
| 6 |
| 8 |
| 0.80 |
| 60 |
|
Carmín Sur |
| 0.60 |
| 6 |
| 8 |
| 0.80 |
| 60 |
|
Cerro Martillo |
| 1.00 |
| 6 |
| 12 |
| 1.00 |
| 60 |
|
Diablada |
| 1.00 |
| 6 |
| 14 |
| 1.00 |
| 60 |
|
Discovery Wash |
| 0.60 |
| 6 |
| 6 or 8 |
| 0.70 to 0.80 |
| 60 |
|
Dominador |
| 1.00 |
| 6 |
| 10 |
| 0.70 |
| 60 |
|
Dorada |
| 1.00 |
| 6 |
| 10 |
| 0.60 to 0.70 |
| 60 |
|
Dorada SW |
| 1.00 |
| 6 |
| 10 |
| 0.70 |
| 60 |
|
El Valle |
| 1.00 |
| 6 |
| 10 |
| 1.20 |
| 60 |
|
Elizabeth |
| 0.60 |
| 6 |
| 8 |
| 1.00 |
| 60 |
|
Escarlata |
| 0.60 |
| 6 |
| 8 |
| 0.90 |
| 60 |
|
Esmeralda |
| 0.60 |
| 6 |
| 8 |
| 0.75 |
| 60 |
|
Esperanza |
| 0.60 |
| 6 |
| 8 |
| 0.80 |
| 60 |
|
Fortuna |
| 0.60 |
| 6 |
| 8 |
| 1.00 |
| 60 |
|
La Paloma |
| 0.60 to 1.00 |
| 6 |
| 8 |
| 0.50 to 1.20 |
| 60 |
|
Magenta |
| 0.60 |
| 6 |
| 8 |
| 1.00 |
| 60 |
|
Magenta Norte |
| 0.60 |
| 6 |
| 8 |
| 1.05 |
| 60 |
|
Martillo Flats |
| 0.60 |
| 6 |
| 8 |
| 0.70 |
| 60 |
|
Orito Norte |
| 1.00 |
| 5 |
| 14 |
| 1.00 to 1.20 |
| 60 |
|
Orito Sur |
| 1.00 |
| 6 |
| 12 |
| 1.20 |
| 60 |
|
Pampa Campamento |
| 0.60 to 1.00 |
| 6 |
| 6 or 10 |
| 0.90 to 1.00 |
| 60 |
|
Playa |
| 1.00 |
| 6 |
| 10 |
| 1.00 |
| 60 |
|
Providencia |
| 1.00 |
| 6 |
| 10 |
| 0.60 |
| 60 |
|
Púrpura |
| 0.60 |
| 6 |
| 8 |
| 0.95 |
| 60 |
|
Sorpresa |
| 0.60 to 1.00 |
| 6 |
| 6 or 8 |
| 0.60 to 0.80 |
| 60 |
|
Ventura |
| 0.60 to 1.00 |
| 6 |
| 8 |
| 0.60 to 1.60 |
| 60 |
|
Victoria |
| 1.00 |
| 6 |
| 12 |
| 0.80 |
| 60 |
|
Vista Norte |
| 1.00 |
| 6 |
| 10 |
| 1.00 |
| 60 |
|
VNW |
| 1.00 |
| 6 |
| 10 |
| 0.80 |
| 60 |
|
The dilution estimates are reconciled with Cavity Monitoring System (CMS) measurements that are used to compare the actual stope outline to the designed stope shapes. The actual dilution results versus the dilution design for 2017 are presented in Table 15-6 for the various mining areas.
TABLE 15-6 DRIFT AND STOPE DILUTION
Yamana Gold Inc. — El Peñón Mine
Split Blasting - Drifts
Mine |
| Vein Width |
| Actual |
| Design |
| Actual |
| Design |
|
PAV |
| 1.53 |
| 0.53 |
| 0.60 |
| 34 |
| 39 |
|
Mina Sur |
| 2.58 |
| 0.64 |
| 0.60 |
| 25 |
| 23 |
|
Mina Norte |
| 1.66 |
| 0.65 |
| 0.60 |
| 39 |
| 36 |
|
Laguna |
| 2.16 |
| 0.58 |
| 0.60 |
| 27 |
| 28 |
|
Bloque Norte |
| 1.47 |
| 0.61 |
| 0.60 |
| 41 |
| 41 |
|
Grand Total |
| 1.87 |
| 0.61 |
| 0.60 |
| 33 |
| 32 |
|
Bench and Fill - Stopes
Mine |
| Vein Width |
| Actual |
| Design |
| Actual |
| Design |
|
Bloque Norte |
| 1.01 |
| 1.10 |
| 0.83 |
| 108 |
| 82 |
|
Mina Norte |
| 1.03 |
| 0.91 |
| 0.81 |
| 88 |
| 79 |
|
Mina Sur |
| 1.52 |
| 1.13 |
| 1.07 |
| 75 |
| 71 |
|
PAV |
| 1.01 |
| 0.97 |
| 0.88 |
| 96 |
| 97 |
|
Grand Total |
| 1.20 |
| 1.04 |
| 0.93 |
| 86 |
| 77 |
|
While drifts are generally quite close to the planned design, the stopes are 11% larger, resulting in higher than designed dilution rates. This indicates that stope dilution is harder to control due to longer drill holes required, vein inclination and greater surface area opened on both the hanging wall and footwall following blasting operations. The speed of the backfilling cycle is important to reduce the period of time the walls are left unsupported.
The expected dilution is estimated using the Mathews Stability graph and estimated equivalent of overbreak/slough (ELOS) as shown in Figure 15-2. RPA recommends monitoring the ELOS value based on the ongoing measurements and results obtained.
FIGURE 15-2 ELOS DILUTION GRAPH
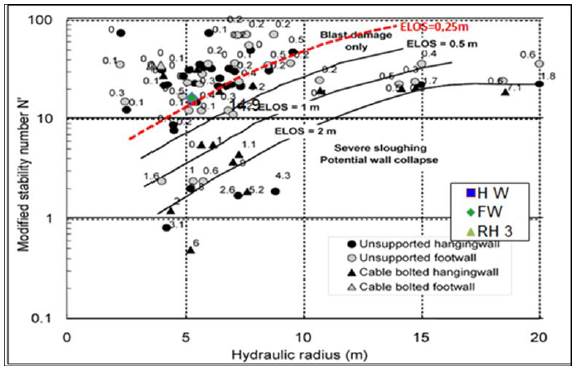
EXTRACTION
The SMUs are 7.5 m or 15 m in length and six metres to 15 m in height. While dilution thicknesses are applied as well, the extraction for 86% of SMUs is considered to be 100%, resulting in an average approximately 2% of ore losses. In RPA’s opinion, there should be consideration for losses during the stoping and mucking operations, in particular as the mining method utilized is a bulk mining method requiring some portion of the mucking operations to use remote operating load-haul-dump (LHD) equipment. Losses can be incurred through poor visibility, material hang ups, and equipment limitations. El Peñón mine staff apply extraction factors in their internal mine planning process, which average approximately 95%, depending on the zone and mining method. In RPA’s opinion, the losses incurred should be reflected in the Mineral Reserves.
Dilution and mining recovery are controlled by the engineering team at El Peñón who perform excavation measurements, using Maptek I-Site, 3D laser scanning system to confirm stope contours, and also the Reflex instrumental tool is used to control deviation of production blast holes.
CUT-OFF GRADE
The cut-off grade was determined using the Mineral Reserve metal prices, metal recoveries, transport, treatment, and refining costs, as well as mine operating cost. At the estimated operating cost of US$131/t processed, the breakeven cut-off grade is 3.48 g/t AuEq using a gold price of US$1,250/oz and silver price of US$18/oz, for most zones. The exceptions include the Elizabeth and Victoria veins in the PAV area, where a cut-off grade of 3.62 g/t AuEq is used due to an additional US$5.24/t transportation cost, and the Fortuna and Laguna areas, where a cut-off grade of 3.59 g/t AuEq is used due to an additional transportation cost of US$3.86/t.
A gold equivalent factor is calculated using the metal prices and recoveries for gold and silver of 95% and 86.5%, respectively. This resulted in a factor of 76.3, however, for wireframe modelling and UGGS construction purposes, a gold factor of 75 was used. The gold factor is only used for wireframe modelling during the resource and reserve estimation process.
Additional notes for the Mineral Reserves estimation are:
· Operating costs used to determine the cut-off grade do not consider the cross-cut cost (only mine cost, processing cost, G&A, and selling cost) because the cost for cross-cuts for each production panel in the mine is not known, as well as the number of SMUs, this cost is to be divided.
· After stope optimization for the reserve estimation, 100% of the cross-cut cost is considered in the infrastructure cost analysis carried out on optimized stopes before including these in the reserves.
Metal prices are considered reasonable and in RPA’s opinion, the cut-off grades have been appropriately derived.
RECONCILIATIONS
The F1 reconciliation of the long term plan based on the Mineral Reserves and the short term plan based on production forecasts is indicated in Table 15-7. As demonstrated in Table 15-7, the long term to short term variance has significantly improved in 2017. Yamana uses the SMU approach for mine planning and Mineral Reserve estimation and have improved the block modelling methodology to prevent the spread of metal into ancillary veins and structures. This in turn, has improved the quality of the mining plan and has consequently provided more accurate overall results.
In gold vein deposits such as El Peñón, mining often occurs in areas that have not been fully drilled and in newly discovered veins and extensions of veins. Figure 15-3 shows that the amount of planned material from reserves has been increasing and that the mining of unplanned material has decreased.
The F2 reconciliation of the mine production based on the short-term model compared to the adjusted process plant results is shown below in Table 15-8. As noted in the table, the plant reconciliation appears to have improved over the last 3.5 years, indicating a closer level of variance. In RPA’s opinion, the reconciliation is within reasonable limits and efforts to track reconciliation should continue on a regular basis.
TABLE 15-7 F1 RECONCILIATION OF LONG TERM AND SHORT TERM PLANS
Yamana Gold Inc. — El Peñón Mine
|
| Long Term Plan |
|
| Short Term Plan |
|
| Variance (%) |
| ||||||||||||||||||||||||
|
| Reserve |
| Grade |
| Metal |
|
| Actual |
| Grade |
| Metal |
|
|
|
| Grade |
| Metal |
| ||||||||||||
Year |
| Tonnes |
| Au |
| Ag |
| (000 oz |
| Au (g/t) |
|
| Tonnes |
| Au |
| Ag |
| (000 oz |
| (000 oz |
|
| Tonnes |
| Au |
| Ag |
| oz Au |
| oz Ag |
|
2014 |
| 1,065 |
| 8.9 |
| 235.8 |
| 306 |
| 8,078 |
|
| 917 |
| 7.6 |
| 195.2 |
| 225 |
| 5,753 |
|
| (14 | ) | (14.4 | ) | (17.2 | ) | (26.4 | ) | (28.8 | ) |
2015 |
| 680 |
| 6.9 |
| 194.3 |
| 150 |
| 4,247 |
|
| 529 |
| 6.7 |
| 208.2 |
| 113 |
| 3,542 |
|
| (22 | ) | (3.3 | ) | 7.2 |
| (24.8 | ) | (16.6 | ) |
2016 |
| 801 |
| 5.8 |
| 170.8 |
| 150 |
| 4,397 |
|
| 679 |
| 5.6 |
| 177.4 |
| 123 |
| 3,870 |
|
| (15 | ) | (2.9 | ) | 3.8 |
| (17.8 | ) | (12.0 | ) |
2017 |
| 567 |
| 5.3 |
| 176.9 |
| 96 |
| 3,224 |
|
| 527 |
| 5.3 |
| 176.0 |
| 90 |
| 2,979 |
|
| (7 | ) | 1.2 |
| (0.5 | ) | (6.0 | ) | (7.6 | ) |
TABLE 15-8 F2 RECONCILIATION OF MINE PRODUCTION AND PLANT
Yamana Gold Inc. - El Peñón Mine
|
| Mine Production |
|
| Plant Results |
|
| Reconciliation |
| ||||||||||||||||
|
| Production |
| Au |
| Ag |
| AuEq |
|
| Processing |
| Au |
| Ag |
| AuEq |
|
| Au |
| Ag |
| AuEq |
|
Year |
| Ton |
| g/t |
| g/t |
| g/t |
|
| Ton |
| g/t |
| g/t |
| g/t |
|
| % |
| % |
| % |
|
2014 |
| 1,474,859 |
| 6.4 |
| 202.9 |
| 10.5 |
|
| 1,474,859 |
| 6.4 |
| 212.0 |
| 10.6 |
|
| 0.5 | % | -4.5 | % | -1.4 | % |
2015 |
| 1,418,128 |
| 5.5 |
| 201.9 |
| 8.2 |
|
| 1,418,129 |
| 5.3 |
| 194.0 |
| 7.9 |
|
| 3.0 | % | 3.9 | % | 3.3 | % |
2016 |
| 1,421,241 |
| 5.2 |
| 162.6 |
| 7.4 |
|
| 1,421,241 |
| 5.1 |
| 153.9 |
| 7.2 |
|
| 2.0 | % | 5.3 | % | 3.0 | % |
2017 |
| 1,041,199 |
| 5.1 |
| 148.3 |
| 7.1 |
|
| 1,041,199 |
| 4.9 |
| 150.6 |
| 7.0 |
|
| -2.1 | % | 1.5 | % | -1.1 | % |
Total |
| 5,355,428 |
| 5.6 |
| 181.3 |
| 8.4 |
|
| 5,355,429 |
| 5.5 |
| 179.9 |
| 8.3 |
|
| 1.8 | % | 0.8 | % | 1.5 | % |
16 MINING METHODS
MINE DESIGN, MINING METHOD
The mine layout depicted in Figure 16-1 shows an isometric view, plan view, and longitudinal view of the mine. The various veins in the El Peñón mine are accessed using ramps, as illustrated in the isometric view, which are a suitable access method given the depth of the mine operations and required flexibility for accessing the veins at the appropriate elevations. The ramps provide flexibility for rapid adjustments for changes in direction and elevation.
Underground mine infrastructure includes the required ramps, cross-cuts for access and various lateral development, as well as excavations for power stations, mine sumps, refuge stations, maintenance shops, and other facilities. Ventilation raises are driven as required to provide the air requirement to meet mine regulations for the mine workers and operating underground equipment. Other installations include a shotcrete plant, backfill plant, and communications system. The total mine system extends for approximately ten kilometres on strike and covers a vertical extent of approximately 500 m, from the highest portal collar elevation to the bottom most mine workings. Main access ramps measure 4.3 m high by 4.5 m wide driven at -15% gradient or as required in certain areas. Stope access drifts and drives on ore are four metres high by four metres wide. Ventilation raises typically measure 2.4 m in diameter.
The mining method utilized at El Peñón is the Bench and Fill Method, which is a narrow vein longhole stoping method followed by a combination of consolidated and unconsolidated backfill to provide the required support for continued mining. The stoping method is shown in Figure 16-2.

As a result of the very narrow vein widths in many areas of the mine, “split-blasting” is utilized to reduce dilution. A typical split-blast face can be seen in Figure 16-3. The minimum width of a split-blast is currently 1.1 m (0.6 m plus 0.5 m dilution). Once the split-blast ore is mucked out, the remaining waste is slashed out and used for unconsolidated backfill. A top access drift is driven for a drill drift and a bottom access drift is driven for extraction of the blasted ore. Typical sublevel intervals are between six metres and 16 m. Drives on ore are typically four metres by four metres, however, can be as wide as six metres. All drifts on ore are grade control sampled either during every drill, blast, load, and haul cycle or at approximately three metre intervals. These samples are used to delimit the economic portion of the bench. This is then drilled using longholes, loaded, blasted, and mucked from the lower sublevel. Typical stope dimensions are 1.2 m to six metres wide, six metres to 16 m high and 7.5 m or 15 m in strike length. Vein widths and geotechnical characteristics will dictate how much dilution will be extracted during the mining of the stope. Backfilling is completed after the established length is reached, starting with a section of consolidated fill followed by unconsolidated waste fill. A typical stope is shown in Figure 16-4. Cut and fill has also been examined as a potential stoping method, however, it would only comprise a small part of the LOM plan.
In RPA’s opinion, the mining methods utilized are appropriate for the type of deposit.
GEOMECHANICS, GROUND SUPPORT
At El Peñón, all drift, cross-cut, and stope designs are reviewed and approved by the geotechnical staff prior to starting any full scale production. The production stopes and development areas are monitored by the geotechnical staff, which recommend the appropriate ground support to be used at each face. The typical ground support recommended includes split-sets, resin bolts, wire mesh, and shotcrete.
MINE PLANNING
The mine planning team at El Peñón is divided into short term, medium term, and long term planning. The deliverables by area are as follows:
SHORT TERM
· Monthly and weekly mine plans
· Operational and dilution control
· Database administration
MEDIUM TERM
· Quarterly plan
· Detailed engineering — projects and mine services
· Surveying
LONG TERM
· Estimation of Mineral Reserves inventory
· 3P (Proven, Probable, and Inferred Categories) Analysis
· Business Plan: Forecasts (12 or 18 months), Budgets (3 years), Projects
MINE DEVELOPMENT
The mine development realized in 2015, 2016, and 2017 is shown in Table 16-1. Over the last two and a half years, El Peñón operators have been able to successfully meet the development targets within acceptable limits. The planned development targets are achieved as a result of the multiple headings for development and an adequate equipment fleet.
TABLE 16-1 MINE DEVELOPMENT ACHIEVED
Yamana Gold Inc. – El Peñón Mine
|
| 2015 |
| 2016 |
| 2017 |
| ||||||||||||
Category |
| Actual |
| Budget |
| Variance |
| Actual |
| Budget |
| Variance |
| Actual |
| Budget |
| Variance |
|
Capital Development (m) |
| 13,508 |
| 14,280 |
| -5.4 | % | 17,234 |
| 16,904 |
| 2.0 | % | 10,899 |
| 9,055 |
| 20.4 | % |
Operating Development (m) |
| 27,435 |
| 27,562 |
| -0.5 | % | 37,455 |
| 29,230 |
| 28.1 | % | 31,659 |
| 25,834 |
| 22.5 | % |
Total |
| 40,943 |
| 41,842 |
| -2.1 | % | 54,689 |
| 46,134 |
| 18.5 | % | 42,558 |
| 34,889 |
| 22.0 | % |
Horizontal Development m/d |
| 112 |
| 115 |
|
|
| 150 |
| 126 |
|
|
| 117 |
| 96 |
|
|
|
The development required over the remaining LOM period is summarized in Table 16-2. In RPA’s opinion, the planned LOM development is reasonable and should be achievable.
TABLE 16-2 MINE DEVELOPMENT IN LOM
Yamana Gold Inc. – El Peñón Mine
Description |
| Units |
| Total |
| 2018 |
| 2019 |
| 2020 |
| 2021 |
| 2022 |
| 2023 |
|
Capital Development |
| m |
| 44,071 |
| 9,820 |
| 13,083 |
| 9,576 |
| 8,492 |
| 2,637 |
| 462 |
|
Operating Development |
| m |
| 113,190 |
| 26,784 |
| 28,595 |
| 24,313 |
| 22,682 |
| 8,392 |
| 2,424 |
|
Horizontal Meters |
| m |
| 157,260 |
| 36,604 |
| 41,678 |
| 33,889 |
| 31,174 |
| 11,029 |
| 2,886 |
|
MINE PRODUCTION
The material moved underground consisting of ore, waste, and capital development material is shown in Table 16-3. The table indicates that the mine operations are capable of moving the planned volumes of ore and waste material.
TABLE 16-3 MINE MATERIAL MOVED
Yamana Gold Inc. – El Peñón Mine
Material Moved |
| 2015 |
| 2016 |
| 2017 |
| ||||||||||||
(000’s tonnes) |
| Actual |
| Budget |
| Variance |
| Actual |
| Budget |
| Variance |
| Actual |
| Budget |
| Variance |
|
Ore Mined |
| 1,178 |
| 1,468 |
| -20 | % | 1,303 |
| 1,544 |
| -16 | % | 999 |
| 970 |
| 3 | % |
Waste + Marginal |
| 1,834 |
| 1,233 |
| 49 | % | 1,372 |
| 805 |
| 71 | % | 1,030 |
| 788 |
| 31 | % |
Total Mined |
| 3,011 |
| 2,701 |
| 12 | % | 2,675 |
| 2,349 |
| 14 | % | 2,029 |
| 1,757 |
| 15 | % |
Capital Waste |
| 680 |
| 692 |
| -2 | % | 815 |
| 795 |
| 3 | % | 502 |
| 365 |
| 38 | % |
Total Moved |
| 3,691 |
| 3,393 |
| 9 | % | 3,490 |
| 3,143 |
| 11 | % | 2,532 |
| 2,122 |
| 19 | % |
PRE-PRODUCTION SCHEDULE
The El Peñón mine has been operating for many years and preparation of new mining areas occurs through the normal planning process.
LIFE OF MINE PLAN
The LOM plan is presented below in Table 16-4.
TABLE 16-4 LIFE OF MINE PLAN
Yamana Gold Inc. – El Peñón Mine
Description |
| Total |
| 2018 |
| 2019 |
| 2020 |
| 2021 |
| 2022 |
| 2023 |
|
Tonnes Milled |
| 4,331 |
| 894 |
| 957 |
| 933 |
| 833 |
| 606 |
| 108 |
|
Grade Au (g/t): |
| 5.4 |
| 5.6 |
| 5.3 |
| 5.4 |
| 5.9 |
| 4.9 |
| 5.0 |
|
Grade Ag (g/t): |
| 167.4 |
| 188.2 |
| 193.0 |
| 158.6 |
| 140.9 |
| 149.1 |
| 150.9 |
|
Au (000 oz) |
| 714 |
| 151 |
| 152 |
| 152 |
| 151 |
| 91 |
| 17 |
|
Ag (000 oz) |
| 20,351 |
| 4,608 |
| 4,999 |
| 4,160 |
| 3,462 |
| 2,639 |
| 483 |
|
Capital Dev. (m) |
| 69,697 |
| 15,739 |
| 20,472 |
| 15,176 |
| 13,227 |
| 4,254 |
| 828 |
|
Operating Dev. (m) |
| 87,564 |
| 20,865 |
| 21,206 |
| 18,713 |
| 17,947 |
| 6,775 |
| 2,058 |
|
Total Lateral Dev. (m) |
| 157,260 |
| 36,604 |
| 41,678 |
| 33,889 |
| 31,174 |
| 11,029 |
| 2,886 |
|
In RPA’s opinion, El Peñón’s forecast production targets are attainable and reasonable, and the procedures used to forecast the LOM Plan are reasonable. From 2018 to 2021, Yamana plans to mine approximately 1.0 million tonnes per year, with gold grades averaging 5.5 g/t Au and silver grades averaging 170 g/t Ag. Forecast gold production averages approximately 150,000 ounces from 2018 to 2021 and declines to 91,000 ounces in 2022 and 17,000 ounces in 2023. Forecast silver production averages 4,307,000 ounces from 2018 to 2021 and declines to 2,639,000 ounces in 2022 and 483,000 in 2023. The objective of the exploration program is to continue extending the mine life with gold production at the level of 150,000 oz per year and over 4,000,000 ounces of silver from 2021 onwards.
INFRASTRUCTURE
See also Section 18, Project Infrastructure
SURFACE INFRASTRUCTURE
The various ore types are stored in surface stockpiles in proximity to the main crusher to allow the loader to feed the required blend of ore to the mill for processing. Tailings are sent to the tailings facility which has been permitted for approximately 45 million tonnes, approximately 19 million tonnes have currently been placed, and therefore, sufficient capacity is available for future storage. The stockpiles consisting of oxides with high clay content, oxides with low clay content, reduced high sulphides, and reduced low sulphide plus marginal ore are placed in close proximity facilitating the required blending by the surface loader operator each shift. Metal recoveries vary on each of these ore types for the low grade, high grade, and special material therefore requiring great attention in the blending process.
Power is fed to the site via the supplier, Gas Atacama, grid and backup power from seven gensets capable of providing approximately 10 MW of energy is available, if required.
ACCESS RAMPS
Access ramps 4.5 m wide by 4.3 m in height are used to access the various zones over the ten kilometre strike length of the mine workings. These ramps are shown in Figure 16-1. The ramps are driven at various gradients with predominately -15% used. Safety bays are placed at required intervals as well as substations and sumps for dewatering.
UNDERGROUND MINE
Mine infrastructure for the underground mine operations include the following:
· Integrated operational control centre at the mine ensuring remote control of main operational indicators.
· Fibre optics and WiFi available in main centers of the mine and surroundings.
· Leaky feeder backup installed throughout the mine allowing clear voice communications at all times.
· Real time monitoring of drill rigs allowing control of main key performance indicators (KPI) and ensuring the operational system (mining cycle) is achieved on a daily basis.
· Thirty-eight surface ventilation fans downcast air into the mines and all ventilation is telemetrically controlled via variable frequency drives (VFD).
MATERIAL HANDLING
Materials are delivered to underground workplaces with mobile equipment capable of handling ground support material, blasting materials, and other construction materials.
VENTILATION
Adequate ventilation for the mine equipment and personnel underground is supplied via main surface ventilation fans that downcast fresh air into the mine workings. Auxiliary fans are used underground for development faces that are being driven and out of the main ventilation stream. An example of the ventilation system is shown in Figure 16-5.
MINE EQUIPMENT
The mine equipment currently on site for El Peñón is shown in Table 16-5.
TABLE 16-5 EQUIPMENT LIST
Yamana Gold Inc. – El Peñón Mine
Type |
| Model |
| No. Units |
Haul Trucks |
| Cat. AD30 |
| 16 |
Scoops 6 yd3 |
| Various |
| 11 |
Scoops 2 yd3 |
| Toro- LH 203 |
| 4 |
Scoops 1 yd3 |
| Toro- LH 210 |
| 1 |
Jumbo Drill |
| Atlas Copco M2C |
| 7 |
Jumbo Drill |
| Atlas Copco Boomer 282 |
| 1 |
Boltec Drill |
| Atlas Copco H235 |
| 1 |
Boltec Drill |
| Atlas Copco H235S |
| 4 |
Simba Drill |
| Atlas Copco H1254 |
| 4 |
Simba Drill |
| Atlas Copco S7D |
| 5 |
Simba Drill |
| Atlas Copco H1257 |
| 1 |
Water Trucks |
| Cat. AD30 |
| 4 |
Mine Scalers |
| Various |
| 9 |
Grader |
| Komatsu GD675 |
| 2 |
Telehandler |
| Manitou MT1030S |
| 13 |
Service Trucks |
| Normet Utililift 1430 |
| 2 |
Mixer |
| Various |
| 7 |
Roboshot |
| Various |
| 6 |
Excavator Hyd. |
| Komatsu PC200 |
| 2 |
Wheel Loaders |
| Various |
| 3 |
Light Towers |
| Various |
| 15 |
Power Units/Gensets |
| Various |
| 9 |
There are also support units including fuel and lubrication trucks, powder trucks, man carriers, and light vehicles used in the mining operation.
17 RECOVERY METHODS
The following is taken from Chacόn and Pérez (2017).
The process plant and associated facilities process run-of-mine (ROM) ore that is delivered to the primary crusher, using the main processes listed below:
· Crushing
· Grinding and pre-leaching thickening
· Leaching
· Counter-current decantation concentrate solution recovery
· Clarification, zinc precipitation and precipitate filtering
· Refining
· Tailings filtering
· Tailings disposal
The process flowsheet is shown in Figure 17-1 and should be referenced in conjunction with the following text describing the process plant.
The El Peñón processing plant has a nominal production capacity of approximately 1.533 million tpa of stockpiled and mined ore. The plant processed 2,853 tonnes per calendar day during 2017.
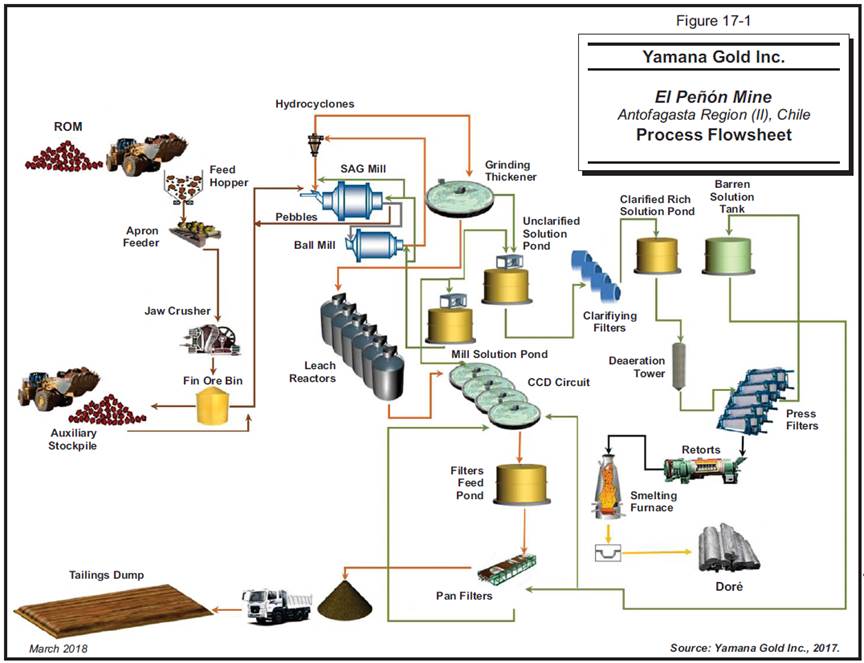
PRIMARY CRUSHING
ROM ore is dumped from a seven cubic metre capacity front-end loader (CAT 988H) through a 600 mm square-grid grizzly into 100 t capacity hopper. A 1,500 mm wide apron feeder is used to transfer ore from the dump hopper to the jaw crusher. Fine material is collected and transported directly to the conveyor belt that carries primary crushed material. Coarse material is fed into a 950 mm x 1,250 mm jaw crusher that produces a product with P80 of 63.5 mm. Crushed material is transported by a conveyor belt into a 1,500 t capacity bin. Additionally, an auxiliary crushing product stockpile is located to the northwest of the bin. The stockpile has a capacity of 10,800 t and covers an area of approximately 40 m x 60 m.
The ore stored in the bin is transported by a variable speed 250 tonnes per hour (tph) capacity mill feed conveyor belt to a transfer chute that discharges onto the belt that feeds the semi-autogenous grinding (SAG) mill.
The ore from the auxiliary stockpile is fed via a front-end loader to an encapsulated hopper with suppressor system to mitigate dust emissions. The hopper discharges onto a belt which transports the ore to the mill feed conveyor belt.
GRINDING/PRE-LEACH THICKENING
The SAG mill is fed by crushed material, and milling solution, to achieve the required pulp concentration inside the mill. Sodium cyanide (NaCN) solution is added as a leaching agent.
The SAG mill operates in series with a ball mill which feeds a battery of hydrocyclones. The underflow of the hydrocyclones returns to the SAG mill. Pebbles formed in the SAG mill are discharged by a trommel into a conveyor belt, which transports the pebbles to return to the mill feed conveyor belt. Alternatively, the pebbles may be mixed with crushed material to be recirculated to the grinding circuit. The concentration of the pulp fed to the hydrocyclones circuit is controlled on-line via density measurements through a nuclear density gauge.
The classification circuit consists of six hydrocyclones with four hydrocyclones operating, and two on stand-by. Overflow of the cyclones consists of a pulp which contains between 38% and 40% solids with a P80 of 150 µm. Particle size is controlled on-line through a PSI 300 particle analyzer. The overflow is fed to the grinding thickener. The underflow is recirculated to the SAG mill.
Flocculant is added to the grinding thickener in order to optimize solids settling. The underflow of the thickener, with a nominal solids concentration of 50% is pumped to the first leach tank. The thickener underflow pumps consist of two variable speed pumps (generally one operating and one stand-by) with flow rate capacity of 250 m3/h and 31 m discharge height. The velocity is controlled based on the density of the pulp, which is measured on-line through a nuclear density gauge. The overflow of the grinding thickener, which is considered a “rich-solution” due to its dissolved gold content, is sent to the unclarified solution pond, having a capacity of 158 m3.
CLARIFICATION
From the unclarified solution pond, the solution is pumped to four clarifying filters that clarify solutions to a maximum turbidity of one nephelometric turbidity unit (NTU). Clarified solutions are transported into the clarified rich solution pond for subsequent zinc precipitation.
LEACHING
Gold and silver leaching starts at the SAG mill, where NaCN is added, resulting in an extraction of approximately 75%.
The grinding thickener underflow is leached in six mechanically agitated reactors, with a capacity of 7,279 m3, in a cyanide rich environment maintained by the addition of cyanide in the grinding and leaching steps. Oxygen is also added to favor the dissolution kinetics. The oxygen is homogenized with the pulp through recirculation pumps that propel the pulp to a Filblast type oxygen mixer. Oxygen is supplied from a liquid oxygen storage tank. Under normal conditions, the discharge of the last reactor is sent to the first thickener of the counter-current decantation (CCD) circuit.
CCD CONCENTRATE SOLUTION RECOVERY
The leached pulp, with a 45% to 55% solids concentration, is transported by gravity to the CCD circuit. The CCD circuit consists of four high capacity counter-current thickeners. The objective of this circuit is to wash the pulp and recover the rich solution. The wash-solution flows counter-current to the solids flow increasing in precious metals concentration. The overflow of the first CCD thickener (CCD0) is transported by gravity to the mill solution pond, while the discharge of the last CCD thickener (CCD3) is pumped to the filtration area.
PREGNANT SOLUTION PRECIPITATION
In normal operating conditions, the Merrill Crowe process consists of the following stages:
· Deaeration of the clarified solution by circulating the fluid through a vacuum tower.
· Gold and silver are precipitated with the addition of zinc to the deaerated solution.
· Filtering of gold, silver, and zinc precipitates.
The rich clarified solution (maximum flow of 275 m3/h) is deaerated before entering the zinc precipitation stage, which is performed in the vacuum tower. The vacuum tower is a 10.4 m3 capacity reactor which achieves a rich deaerated solution with a concentration of less than 1 ppm of O2. The reject solution that exits the tower is fed to the press filters.
The zinc pulp is fed with five peristaltic pumps to the feed line of each of the press filters. The contact of the zinc pulp with the rich deaerated solution occurs in the Merrill Crowe tower and causes the precipitation of gold, silver, and other impurities. The dosage of zinc is controlled by assays of the rich and barren solutions every two hours.
The filtration stage is carried out in five filter presses. Before feeding a filter press with the solution from the precipitation stage, 2 m3 of pulp, containing 37.5 g/L of bentonite clay are recirculated for 45 minutes in order to form an initial layer on the filter surface, to avoid blockage by the very fine undissolved zinc. After the initial layer is formed, the precipitate solution is filtered. The solution that exits the filter is transported to the barren solution tank. To unload a filter press, it is opened and the material is removed using a spatula and sent to the retort furnaces.
REFINING
Precipitates obtained from the filter presses are deposited in trays with a capacity of approximately 50 kg of precipitate with 30% moisture content. Four retort furnaces eliminate the humidity and the mercury contained in the precipitate. Each furnace is loaded with eight trays, kept at a temperature of 538°C for about 20 hours under vacuum conditions. The product (calcine) is fed to the melting furnaces.
A reverberation furnace, which uses liquefied gas and air/oxygen to reach 1,220°C is used for smelting. Calcine is fed to the furnace through a screw feeder. The melt consists of two phases, the upper part of the slag, which is of lower density (2.5 g/L) and melts at 850°C, is formed by silica (flux) and impurities such as copper, iron, zinc and others; and the lower phase of the slag which consists of doré. This lower phase is of higher density (15 g/L), melts at 1,000°C and is mainly composed of silver and gold, with small amounts of impurities. The slag
is poured into 50 kg capacity conical steel containers, while the doré is poured into 165 kg capacity ingot molds. Emissions from the refining furnace are collected by a hood and passes through a high temperature bag filter to recover the precious metal particles contained in the gases. The solidified slag is recirculated to the crushing stage of the plant in order to recover trapped gold and silver. The doré is removed from the ingot mold and loaded with a fork lift to the bar cleaner to remove the attached slag. After this process, the bars are removed and stored, for later weighing and shipping.
TAILS FILTERING
The objective of the filtration area is to obtain dischargeable tailings with an approximate moisture content of about 20%. It is also desirable that the liquid contained in the moisture has minimum concentration of cyanide and dissolved metals.
The pulp is pumped to a filtering system consisting of five dedicated agitated tanks and four 54 m2 pan filters and one 82 m2 pan filter.
TAILS DISPOSAL
The filtered tailings are transported by two conveyor belts equipped with a weightometer, and sampler to two stockpiles, one for each belt. The storage areas consists of a 220 m2 concrete slab and retaining wall (to protect the belts). A floor pump is located in the area to collect solutions and cleaning water which are recycled to the filtration area.
The collected tailings are loaded on trucks by a front-end loader and transported to the tailings storage area (Figure 17-2), located at an approximate distance of two kilometres
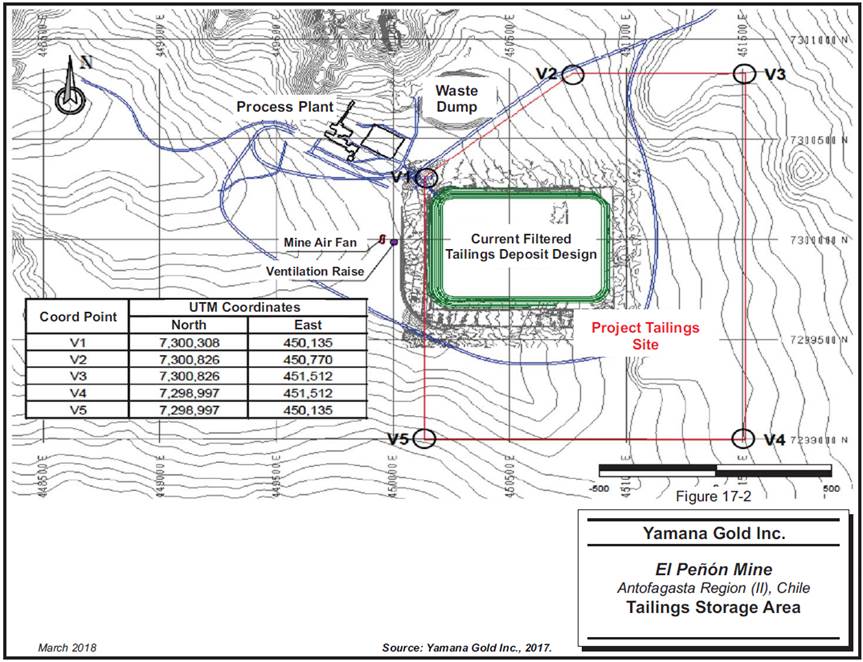
The total storage area is 232.8 ha. Tailings are stored on three 10 m high platforms with five metre wide berms. Considering the current production rate, the filtered tailings storage area has a total useful life of 21 years.
The tailings are first deposited as mounds along the storage area and then spread through the use of a bulldozer and motor grader to form 15 cm to 30 cm thick layers, in order to expose the surface of the cyanide containing tailings to sunshine (UV radiation) and air, and thus favoring its degradation. The tailings are finally moved by a grader and irrigated with process water from the wastewater treatment plant to achieve cyanide concentration reduction in the solids. This aeration and watering process is repeated until the cyanide concentration in the tailings is less than 2 ppm. Once the process is completed, a new layer is deposited and the same operation is repeated.
METALLURGICAL REPORTING
The processed tonnes are based on weightometer readings that are located on the SAG mill feed conveyor belt and at the tailings discharge point. Daily analytical results from samples of plant solutions and tailings discharge are used to calculate plant metallurgical performance. Metal sales and inventory contained in the circuit and refinery are determined at the end of each month and appropriate adjustments are made. The mill reports the back-calculated head grades of the mill feed from this information.
PLANT CONSUMPTIONS
The estimated energy consumption of the plant is between 46 kWh/t and 48 kWh/t.
Plant water consumption is estimated to be approximately 0.25 m3/t.
The tailings disposal operations require 0.13 m3/t, where 0.05 m3/t of wastewater is used.
Reagent/Supply consumptions are shown in Table 17-1.
TABLE 17-1 REAGENT/SUPPLY CONSUMPTIONS
Yamana Gold Inc. - El Peñón Mine
Description |
| Consumption |
| Units |
Reagents |
|
|
|
|
Sodium Cyanide |
| 2.1 |
| kg/t |
Zinc |
| 1.55 |
| kg/kg(Au+Ag) |
Lime |
| 0.52 |
| kg/t |
Diatomaceous Earth |
| 0.3 |
| kg/t |
Celite 545 |
| 0.01 |
| kg/t |
Celite 7F |
| 0.3 |
| g/t |
Flocculant(Grinding) |
| 20 |
| g/t |
Flocculant(CCD) |
| 30 |
| g/t |
Filtering Aid |
| 35 |
| g/t |
Anti-Fouling(CCD) |
| 20 |
| g/t |
Anti-Fouling(Filtering) |
| 10 |
| g/t |
Anti-Fouling(Precipitation) |
| 15 |
| g/t |
Oxygen |
| 7 |
| l/t |
Borax |
| 0.59 |
| kg/kg(Au+Ag) |
Soda Ash |
| 0.29 |
| kg/kg(Au+Ag) |
Gas |
| 0.15 |
| l/kg(Au+Ag) |
|
|
|
|
|
Supplies |
|
|
|
|
Balls(Ball Mill) |
| 1 |
| kg/t |
Balls (SAG Mill) |
| 1.8 |
| kg/t |
Refractories |
| 1.3 |
| t/Month |
Doré Packages |
| 0.007 |
| Boxes/kg(Au+Ag) |
Clarifying Filter Fabric |
| 56 |
| Fabric/Month |
Press Filter Fabric |
| 56 |
| Fabric/Month |
Band Filter Fabric |
| 1 |
| Fabric/28,000t |
18 PROJECT INFRASTRUCTURE
The following is taken from Chacón and Pérez (2017).
The main existing buildings and infrastructure at the site are:
· Underground and open pit mines
· Process plant and refinery
· Waste dumps
· Tailings storage area
· Concrete plant
· Cemented backfill plant
· Facilities for storage and distributions of fuels, oils, and lubricants
· Water ponds
· Service infrastructure
· Explosive storage areas
· Water supply and distribution system
· Campsite, cafeterias, and change rooms
· Sewage treatment system
· Service infrastructure, workshops and sheds
· Telecommunications system
· Materials storage areas
· Main administration building.
· Energy supply and transmission system
· Laboratory
· Mine workshops, maintenance facilities, and warehouses
19 MARKET STUDIES AND CONTRACTS
MARKETS
The principal commodities produced at El Peñón are gold and silver in the form of doré bars, which are freely traded, at prices that are widely known, so that prospects for sale of any production are virtually assured.
CONTRACTS
The El Peñón mine operation has approximately 105 contracts in place that date from 1998 for the mine power supply, for example, and through to 2018 for smaller contracts. The largest of these contracts include the power supply, camp catering services, fuel supply, cyanide supply, ore haulage and tailings transport, underground development, and mine explosive supplies. The list of the 12 most important contracts from a value standpoint are shown in Table 19-1. These 12 contracts account for 86% of the total contract value.
TABLE 19-1 SUMMARY OF MAJOR CONTRACTS
Yamana Gold Inc. - El Peñón Mine
Year |
| Company |
| Service Provided |
| Remaining Life |
1998 |
| Gas Atacama |
| Electrical Power Supply |
| 16.60 |
2010 |
| E.I. Du Pont |
| Cyanide Supplier |
| 23.77 |
2012 |
| Compañia De Transporte Ventrosa Ltda |
| Personnel Transport Services |
| 20.20 |
2012 |
| Flota Hualpen Ltda. |
| Buses Lease |
| 26.80 |
2015 |
| Master Drillings S.A |
| Raise Boring |
| 0.47 |
2015 |
| Sodexho Chile S.A. |
| Catering and Camp Services |
| 29.83 |
2016 |
| Petrobras Chile Distribucion Limitada |
| Fuel Supply Services |
| 38.40 |
2016 |
| Ingenieria Montaje y Serv. Patagonia Ltda |
| Ore, Tailings Loading and Transport Services |
| 22.73 |
2016 |
| Sodexho Chile S.A. |
| Garbage |
| 29.83 |
2017 |
| AK Drilling International Perforaciones LTDA. |
| Diamond and Reverse Circulation Drilling |
| 35.97 |
2017 |
| Orica Chile S.A. |
| Explosives Supplier |
| 28.43 |
2017 |
| Buses Hualpen Ltda. |
| Personnel Transport Services |
| 50.10 |
RPA did not review the contracts but considers the level of contracting to be within industry norms for Chilean operations.
20 ENVIRONMENTAL STUDIES, PERMITTING, AND SOCIAL OR COMMUNITY IMPACT
The El Peñón mine is located approximately 165 km to the southeast of Antofagasta at an altitude that ranges between 1,600 MASL and 1,800 MASL. There are no populated areas or centers located close to the mine. The area has a desert climate, characterized by extreme aridity, absence of humidity and very low rainfall. Temperatures in this area range typically between -5°C and 30°C. Other characteristics of the area are:
· Soil of very limited usefulness (class VIII).
· Total absence of any form of plant life.
· Extremely scarce wildlife, with only eight species recognized in the EIA.
· No permanent water courses at surface.
· Existence of fossil water, with low recharge potential below a water table at approximately 1,600 MASL.
There are seven archaeological sites considered of high relevance, due to their representative nature of the nitrate mining (industrial archeology) in the area.
ENVIRONMENTAL STUDIES
RPA understands that El Peñón is operating within environmental compliance with no outstanding environmental citations. Environmental monitoring is ongoing at the operations and will continue over the life of the mine. Key monitoring that is currently done includes water, air, noise, soil, impact on wildlife, and heritage and management. Monitoring activities and the monitoring frequency are summarized in Table 20-1.
TABLE 20-1 ENVIRONMENTAL MONITORING
Yamana Gold Inc. – El Peñón Mine
Monitoring |
| Frequency |
| Parameter |
| Area/Equipment | ||
|
|
|
| Daily |
| Chlorine, Cyanide, |
| Campsite Cafeteria, |
|
|
|
|
| Turbidity, pH |
| Osmosis Plant | |
|
|
|
| Monthly |
| Drinking Water |
| Osmosis Plant |
|
|
|
|
|
|
|
| Recreation Room |
|
|
|
|
|
|
|
| Campsite cafeteria |
|
| Drinking Water |
|
|
| Cyanide |
| Ex camp |
|
|
|
|
|
|
|
| Refinery |
|
|
|
|
|
|
|
| Process Plant Dry |
|
|
|
|
|
|
|
| Osmosis Plant |
Water |
|
|
| Semi-annually |
| Drinking Water |
| Process Plant Dry |
|
|
|
|
|
|
|
| Campsite Cafeteria |
|
|
|
| Weekly |
| Flow |
|
|
|
| Water Well |
| Monthly |
| Flow/Phreatic Level |
| Laguna Seca Area |
|
|
|
| Semi-annually |
| Water Quality |
|
|
|
|
|
| Weekly |
| Flow |
|
|
|
| Mine Drainage |
| Monthly |
| Flow, pH |
| Mining Levels |
|
|
|
| Semi-annually |
| Water Quality |
|
|
|
| Sewage |
| Monthly |
| Irrigation Water |
| Sewage Treatment Plant |
|
|
|
| Semi-annually |
| Characterization |
| Equipment Washing Area |
|
|
|
|
|
|
|
|
|
|
| Meteorology |
| Daily |
| Various |
| Campsite, PAV |
|
| Air Quality |
|
|
|
|
| Campsite, PAV, |
|
|
|
| Every 3 days |
| MP 10-MP2.5 |
| Laguna Area |
|
|
|
|
|
|
|
| Bloque Norte area |
Air |
| Isokinetics |
|
|
| Inorganics |
| Refinery Furnace |
|
|
|
|
|
| Laboratory Furnace | ||
|
|
|
| Annually |
|
|
| Refinery Furnace |
|
| Emission Statement |
|
|
| DS138 |
| Laboratory Furnace |
|
|
|
|
|
| Electrical Plant | ||
|
|
|
|
|
|
|
| Generators |
|
|
|
|
|
|
|
|
|
Noise |
| Exposure |
| Biannually |
| Maximum levels |
| Campsite |
|
|
|
|
|
|
|
|
|
|
|
|
| Daily |
| Free Cyanide |
|
|
|
|
|
|
|
| Free Cyanide |
| Tailings Storage Area |
Soil |
| Tailings |
| Every 15 days |
| Chemical and Physical Characterization |
| |
|
|
|
| Annual |
| Chemical and Physical Characterization |
| Tailings Storage Area |
|
| Well Monitoring |
| Monthly |
| Humidity |
| Dump, Tailings retention ponds |
|
|
|
|
|
|
|
|
|
Biology |
| Wildlife |
| Semi-annually |
| Inspection |
| Wildlife Protection System Mine area |
|
|
|
|
|
|
|
|
|
Heritage |
| Archaeology |
| Semi-annually |
| Conservation Inspection |
| Archaeology Sites |
|
|
|
|
|
|
|
|
|
Management |
|
|
| Daily
|
| El Peñón |
| Waste Collection |
|
|
|
|
|
| Hazardous Waste |
| Hazardous Waste Area |
|
|
|
|
|
| Scrap Removal |
| Nonhazardous waste area |
|
|
|
|
|
| Sludge Disposal |
| Washing Slab |
|
| Waste |
| Weekly
|
| Ventilation Ducts |
| Nonhazardous waste area |
|
|
|
|
|
| Tires |
| |
|
|
|
|
|
| Battery Removal |
| Hazardous Waste Area |
|
|
|
|
|
| TK Accumulation |
| Used Oil Disposal |
|
|
|
|
|
|
|
| Mine Contractors |
|
| Inspections |
| Monthly |
| SGA Requirements |
| Geology Contractors Meridian Areas |
PROJECT PERMITTING
The El Peñón project entered the Environmental Impact Assessment System (SEIA), through an Environmental Impact Assessment (EIA), which was approved by Exempt Resolution No. 043 in 1998. During the operation, 21 declarations of environmental impact (DIA), associated with transport and handling of hazardous substances, infrastructure for waste management, extensions of mine exploitation areas, process plant optimization, backup power generation, and tailings storage area expansion, have undergone the SEIA.
El Peñón has a number of operating permits in place. The Regulatory Organizations that have issued these operating permits are as follows:
· Comision de Monumentos Nacionales (CMN)
· Ministerio Agricultura (MAGR)
· Comision Regional de Medio Ambiente (COREMA)
· Superintendencia de Electricidad y Combustibles (SEC)
· Servicio National de Geologia y Mineria (SERNAGEOMIN)
· Servicio de Salud de Antofagasta (SSA)
· Direccion General Aguas (DGA)
· Ministerio de Defensa Nacional (MDN)
· Ilustre Municipalidad Antofagasta (IMA)
Some of the main permits are listed in Table 20-2.
TABLE 20-2 PERMIT STATUS
Yamana Gold Inc. – El Peñón Mine
Permit |
| Item |
| Effective Date |
Resolution 043-98 El Peñón Project |
| Health Report |
| 2000 |
| Land Use Change |
| 1998 | |
| Tailings Storage |
| 1998 | |
| Waste Dumps |
| 1999 | |
| Construction Waste Disposal |
| 1998 | |
| Household Waste Disposal |
| 1999 | |
| Sewage Treatment and Disposal |
| 1999 | |
Resolution 086-99 Power Supply to El Peñón |
| Power Supply |
| NA |
Resolution 0179-02 Explosives Handling |
| Explosives |
| NA |
Resolution 050-03 Extension of Underground Mine Exploitation |
| Mine Expansion |
| NA |
Resolution 0163-07 Expansion and Optimization El Peñón Mine |
| Tailings Storage Area Construction |
| NA |
Resolution 0192-07 Exploitation Fortuna Area |
| Waste Dumps |
| 2007 |
| Sewage Treatment and Disposal |
| 2008 | |
| Land Use Change |
| 2007 | |
RCA0106 Extension of Bonanza and Expansion of Transport and Handling of Explosives |
| Waste Dumps |
| 2015 |
| Sewage Treatment and Disposal |
| NA | |
| Household Waste Treatment and Disposal |
| NA | |
| Industrial Qualification |
| 2012 | |
| Land Use Change |
| 2011 | |
Resolution 0270-10 Expansion of Tailings Storage Area |
| Tailings Storage Area Construction |
| 2010 |
RCA0233-12 Open Pit Mine Exploitation Pampa Augusta Victoria |
| Waste Dumps |
| 2013 |
| Construction Waste Disposal |
| 2013 | |
| Mining Waste Disposal |
| 2013 | |
| Sewage Treatment and Disposal |
| 2012 | |
| Household Waste Disposal |
| 2013 | |
| Industrial Qualification |
| 2014 | |
| Land Use Change |
| 2013 | |
| Control of Water Courses |
| 2013 | |
RCA0229-14 Underground Mine Exploitation Pampa Augusta Victoria |
| Waste Dumps |
| 2015 |
| Sewage Treatment and Disposal |
| 2012 | |
| Industrial Qualification |
| 2012 | |
| Land Use Change |
| 2014 |
SOCIAL OR COMMUNITY REQUIREMENTS
Yamana’s social and community activities in the El Peñón district include the following:
· Excellent community and stakeholder relations
· Open door policy
· Support of medical services in Taltal
· High school and college scholarships
· Donations in infrastructure and services
· Partnerships with local groups to provide economic development
MINE CLOSURE REQUIREMENTS
A full closure plan has been submitted but has not been yet accepted by the government (Sernageomin). The process to complete this task is ongoing.
On August 1, 2016, the current “Technical Report on the Remaining Life of Mine”, hereinafter referred to as Remaining Life of Mine Report, was issued to comply with Chilean Law No. 20819, which amends Act No. 20551 on the Closure of Mining Operations and Facilities, specifically in its Article 3 (q) and Article 13 (d) and of Supreme Decree No. 41 which approves Regulation of the Law on Closure of Mining Operations and Facilities, specifically in its Article 7 (d), Article 13 letter g and Article 96.
At the effective date of the Remaining Life of Mine Report, the estimated life of mine was 7.2 years. It is important to note that the previously stated mine life was calculated in compliance with Chilean Law 20551, which requires that, for mining companies whose purpose is the extraction or benefit of one or more mineral deposits, and whose mineral extraction capacity exceeds 10,000 tonnes per month (tpm) and is less than or equal to 500,000 tpm, the life of the mining operation will be calculated according to the available Measured, Indicated and Inferred Mineral Resources certified by a Competent Person as defined in the Chilean “Code for Reporting Exploration Results, Resources and Mineral Reserves”, according with Chilean Law 20235.
Once the full closure plan is approved, financial guarantees must be constituted in order to assure the full and timely fulfillment of the closing obligations. For mining operations with an estimated mine life of less than 20 years, the total of the guarantees must be constituted within two-thirds of that estimated period.
The current closure cost estimate is US$45.4 million, which includes $24.7 million for direct costs, $4.9 million for administration of the closure, $0.9 million for monitoring and control, $7.6 million for a 25% contingency, and $7.3 million for Chilean Sales Tax.
21 CAPITAL AND OPERATING COSTS
CAPITAL COSTS
PRE-PRODUCTION CAPITAL
The El Peñón mine has been in operation for many years, hence there are no pre-production capital costs.
SUSTAINING CAPITAL
The sustaining capital costs to be incurred during the LOM for the El Peñón mine is shown in Table 21-1. In RPA’s opinion, the sustaining capital costs are reasonable.
TABLE 21-1 SUSTAINING CAPITAL COSTS (US$000)
Yamana Gold Inc. – El Peñón Mine
Description |
| Total |
|
Capital Development |
| 107,901 |
|
Equipment, Machinery |
| 32,508 |
|
Infrastructure, Bldgs. |
| 8,408 |
|
Reclamation and Closure |
| 45,375 |
|
Total |
| 194,192 |
|
As noted, the bulk of the sustaining capital costs are for mine development to access production areas on a continuous basis in order to meet production requirements for the Reserves. In addition to the sustaining capital costs presented above, Yamana has planned a total of 177,000 m of drilling from 2018 to 2020, at a budgeted cost of US$36,000,000 to achieve its resources conversion objectives. Yamana considers allocating additional discretionary exploration to this program funding based on results.
OPERATING COSTS
The 2017 operating costs are shown in Table 21-2.
TABLE 21-2 MINE OPERATING COSTS DECEMBER 31, 2017 (YTD)
Yamana Gold Inc. – El Peñón Mine
Cost Item |
| Actual |
| Budget |
| Variance |
|
|
| US$/t |
| US$/t |
| US$/t |
|
Labour |
| 60.13 |
| 51.28 |
| 8.85 |
|
Operational Materials |
| 30.93 |
| 28.56 |
| 2.37 |
|
Maintenance Materials |
| 11.13 |
| 10.05 |
| 1.08 |
|
Other Operating |
| 47.13 |
| 50.07 |
| (2.94 | ) |
G&A Expenses |
| 8.01 |
| 8.44 |
| (0.44 | ) |
Other Expenses |
| (3.11 | ) | (3.17 | ) | 0.06 |
|
Total |
| 154.22 |
| 145.23 |
| 8.99 |
|
Tonnes (000) |
| 1,041 |
| 1,040 |
| 1.5 |
|
As seen on Table 21-2, the 2017 operating costs were 6% above the budget estimates, mainly impacted by differences between FX budget assumptions and actual variations during the year. RPA recommends that the mine continue its programs to reduce costs and meet forecasts.
The projected operating costs for the LOM plan are shown in Table 21-3.
TABLE 21-3 MINE OPERATING COSTS FOR LOM
Yamana Gold Inc. – El Peñón Mine
Area |
| Total |
|
Tonnes Milled (000) |
| 4,331 |
|
Mine |
| 449,820 |
|
Plant |
| 118,596 |
|
G&A |
| 69,187 |
|
Total |
| 637,603 |
|
Unit Cost/t |
| 147.20 |
|
The LOM forecasted costs reflect the current operating cost the mine is experiencing. A portion of the mine development (25%) is included in the sustaining capital budget, which in RPA’s opinion, is reasonable.
MANPOWER
Manpower for the El Peñón mine is shown in Table 21-4.
TABLE 21-4 MANPOWER LIST
Yamana Gold Inc. – El Peñón Mine
Area |
| No. Persons |
Mine (Operations and Maintenance) |
| 871 |
Plant (Operations and Maintenance) |
| 92 |
Administrative (G&A, Overhead, and Exploration) |
| 131 |
Contractors |
| 1,426 |
Total |
| 2,520 |
The scheduled rotations for the mine departments are as follows:
· Administrative: A week Monday to Friday and followed by a second week Monday to Thursday (8 am to 6 pm).
· Mine operations 7 days on, 7 days off (12-hour shifts)
· Plant operations 4 days on, 4 days off (12-hour shifts)
· Contractors: various schedules: typical 4 days on 4 days off; 7 days on 7 days off, and/or 10 days on 10 days off.
Yamana, via subsidiary Meridian, has four collective bargaining agreements in place:
1.) El Sindicato de Trabajadores No. 2 de Empresa Mineral Meridian Ltda. RSV No. 02010730. From February 17, 2017 for duration of 48 months (164 persons).
2.) El Sindicato de Trabajadores No. 1 Meridian El Peñón RSV No. 02010555. From January 11, 2017 for duration of 40 months (87 persons).
3.) El Sindicato de Trabajadores Supervisores Minera Meridian Ltda. From November 9, 2016 for a duration of 42 months (30 persons).
4.) El Sindicato de Trabajadores Minera Meridian El Peñón. From October 13, 2014 for a duration of 48 months (130 plant personnel and 86 mine personnel).
22 ECONOMIC ANALYSIS
This section is not required as Yamana is a producing issuer, the property is currently in production, and there is no material expansion of current production.
RPA completed an after-tax Cash Flow Projection generated from the LOM production schedule and capital and operating cost estimates and confirms the positive economics of the Mineral Reserves in this report. The cash flow was prepared using the stated Mineral Reserves metal prices and cut-off grades.
23 ADJACENT PROPERTIES
El Peñón is the principal mineral property in the area, and RPA is not aware of any other significant exploration properties in the immediate vicinity of the mine.
24 OTHER RELEVANT DATA AND INFORMATION
No additional information or explanation is necessary to make this Technical Report understandable and not misleading.
25 INTERPRETATION AND CONCLUSIONS
RPA offers the following conclusions:
RISKS
· The mine has been in production for 18 years and is a mature operation. In RPA’s opinion, there are not any significant risks and uncertainties that could reasonably be expected to affect the reliability or confidence in the exploration information, Mineral Resource or Mineral Reserve estimates, or projected economic outcomes.
GEOLOGY AND MINERAL RESOURCES
· The deposits at El Peñón are low to intermediate epithermal gold-silver deposits, hosted in steeply dipping fault-controlled veins following rhyolite dome emplacement. Gold and silver mineralization comprises disseminations of electrum, native gold and silver, acanthite, silver sulphosalts and halides, plus accessory pyrite occurring with quartz, adularia, carbonates, and clay minerals.
· There are 22 main vein zones and many subsidiary veins in nine vein systems that have supported, support currently, or are planned to support surface and underground mining operations. Vein widths range from decimetre-scale to over 20 m. Individual mineralized shoots measure from less than one kilometre to four kilometres in strike length, and up to 350 m in the down-dip direction.
· Sampling and assaying are adequately completed and have been generally carried out using industry standard QA/QC practices. The sample preparation, analysis, and security procedures at El Peñón are suitable for use in the estimation of Mineral Resources.
· To avoid sample sharing between spatially close structures, each independent splay or parallel vein is considered an independent estimation domain. Spatially disconnected splay wireframes were flagged as separate estimation domains. In RPA’s opinion, this improved interpretation technique will result in fewer tonnes, but better defined resources than previous estimates.
· The Mineral Resource estimate is appropriate for the style of mineralization and the resource models are reasonable and acceptable to support the Mineral Resource estimates.
· For these estimations, Yamana used a stope optimizer to determine potential economic viability of resource blocks. This resulted in a more realistic estimate of resources remaining after reserve estimation.
· The Measured plus Indicated Mineral Resources are estimated to be 1, 427,600 t at 6.92 g/t Au and 217.0 g/t Ag containing 317,800 oz of gold and 9,962,000 oz of silver. Inferred Mineral Resources are estimated at 17,469,000 t at 1.7 g/t Au and 60 g/t Ag containing 960,000 oz of gold and 33,506,000 oz of silver. RPA notes that the
resources are reasonable, are in accordance with Canadian Institute of Mining, Metallurgy and Petroleum (CIM) definitions, and are disclosed in compliance with NI 43-101.
· Exploration potential exists to infill resources in the mines, to discover extensions of current deposits, and to discover new deposits in the El Peñón district.
MINING AND MINERAL RESERVES
· In RPA’s opinion, the conversion process of Mineral Resources to Mineral Reserves is robust and ensures each SMU has positive economic value.
· The Proven plus Probable Mineral Reserves are estimated to be 4,393,600 t at 5.41 g/t Au and 166.9 g/t Ag containing 763,800 oz of gold and 23,578,400 oz of silver. RPA notes that the reserves are reasonable, and are in accordance with CIM definitions.
· Mineral Reserves include small quantities of open pit and low-grade stockpile material.
· The amount of additional material mined from Mineral Resources and also from outside of the block model has been reduced over the last several years as a result of improved planning procedures.
· Reconciliation of the long term and short-term plans for Mineral Reserves shows that the variances are improving. Yamana is using the SMU approach for mine planning and Mineral Reserve estimation and has improved the block modelling procedures, which in turn has improved the quality of mine planning and consequently more accurate overall results. In RPA’s opinion, the reconciliation is within reasonable limits and efforts to track reconciliation should continue on a regular basis.
· In RPA’s opinion, El Peñón’s forecast mine and plant production targets are attainable and reasonable and the procedures used to forecast the LOM plan are reasonable. Forecast gold production averages 150,000 oz from 2018 to 2021 and declines to 91,000 oz in 2022. Forecast silver production averages 4,307,000 oz from 2018 to 2021 and declines to 2,639,000 oz in 2022.
METALLURGY AND MINERAL PROCESSING
· The plant operation has been operating well, with tonnages being generally consistent over the last few years, declining in 2017, as result of the rightsizing of the operation in late 2016. Changes in recoveries of both gold and silver have been in line with the changes in head grade, and have been somewhat higher in 2017 due to reduced throughput.
ENVIRONMENTAL CONSIDERATIONS
· All required permits for operation have been granted, or applied for, with reasonable expectation of being granted in due course.
CAPITAL AND OPERATING COSTS
· The total capital expenditures estimated by Yamana for the LOM operations are $194 million in sustaining capital, including mine development (56%), equipment and infrastructure (21%), and reclamation and closure (23%). These costs include mine and plant costs as well as administration capital, but do not include working capital, exploration or any future expansions. RPA is of the opinion that the total estimated capital expenditures for the mine are reasonable based on the calculated Mineral Reserves.
· A total of 177,000 m of drilling is planned for 2018 to 2020 at a budgeted cost of US$36,000,000. Yamana considers allocating additional discretionary exploration funding based on success
· Operating costs are forecast to average US$147 per tonne over the LOM. RPA is of the opinion that the total estimated operating costs for the mine are reasonable.
26 RECOMMENDATIONS
RPA offers the following recommendations:
GEOLOGY AND MINERAL RESOURCES
· Yamana geologists have prepared a strategic drill program to infill resources, complete local exploration near the mines, and to continue district exploration. The amount of drilling proposed is based on the past success rate of adding resources at El Peñón. A total of 177,000 m of drilling is planned for 2018 to 2020 at a budgeted cost of US$36,000,000. Yamana provisions for additional discretionary funding to this program based on results. Considering the ongoing exploration successes at El Peñón over the years, RPA concurs with this proposed exploration program and recommends that it be carried out as defined.
MINING AND MINERAL RESERVES
· While the drifts are quite close to the planned design, the stopes were 11% larger than planned in 2017, resulting in higher than designed dilution rates. The equivalent of overbreak/slough (ELOS) design of 0.25 m should be monitored going forward to assess whether adjustment of the ELOS is warranted.
· The extraction rate for stopes is set at 100% for the majority (86%) of the stopes resulting in an average extraction rate of near 98%. Mine staff apply an extraction factor, which averages approximately 95% during the mine planning process, however this should be reflected in the Mineral Reserves statement.
27 REFERENCES
Bottinelli, O. C. A., and Valencia, A. M. E., 2016, Informe Técnico de Vida Útil de la Operación Minera (para Ley N° 20.551 sobre Cierre de Faenas e Instalaciones Mineras); Ley N° 20.819 que modifica Ley N° 20.551; Revisión N° 3, August 1, 2016.
Chacón, M. E., Pérez, S. C. M., 2017, Yamana Gold, El Peñón Mine, Region of Antofagasta, Chile, NI 43-101 Technical Report, 144 pp., May 23, 2017.
Collins, S. E., Moore, C. M., and Scott, K C., 2010, Technical Report on the El Peñón Mine, Northern Chile, prepared for Yamana Gold Inc., 132 pp., December 7, 2010.
Cornejo, P.; Mpodozis, C.; Rivera, O. & Matthews, S.J. (2006): Carta Exploradora, Regiones de Antofagasta y Atacama. Servicio Nacional de Geología y Minería (SERNAGEOMIN), Santiago, Chile, Carta Geológica de Chile, Serie Geológica Básica, 1:100.000.
Donoso, F. (2012): Caracterización Mineralógica de las vetas Bonanza-Aleste y sus implicancias geometalúrgicas, Mina El Peñón, Región de Antofagasta, Memoria para optar al título de Geólogo, Universidad Católica del Norte, Antofagasta, Chile.
Jorquera, H., 2016, QAQC Annual Report 2016, prepared for Minera Meridian Ltda., 36 pp., December 15, 2016.
Minera Meridian Ltda., 2017, various presentations, procedures, and spreadsheets for El Peñón Mine.
Octal Ingeniería y Desarrollo and Magri Consultores Limitada, 2015, Actualización de modelos variográficos — El Peñón, prepared for Yamana Gold Inc., August 5, 2015.
Órdenes, J. (2014): Influencia de la Mineralogía de la veta Bonanza en el Procesos Hidrometalúrgico de Lixiviación de Au y Ag, Yacimiento El Peñón, Chile. Tesis para optar al grado de Magíster en Geometalurgia. Universidad Católica del Norte, Antofagasta, Chile, 168 p.
Pearson, J. L., and Rennie, D. W., 2008, Technical Report on the El Peñón Mine, Chile, Resource Audit, prepared for Yamana Gold Inc., 130 pp., February 11, 2008.
Pérez, M. (1999): Alteración Hidrotermal en el Depósito Epitermal de Au-Ag El Peñón, II Región Antofagasta. Memoria para optar al título de Geólogo. Universidad de Chile, Santiago, Chile, 109 p.
Robbins, C.H. (2000): Geology of El Peñón Gold-silver Deposit, Northern Chile: The Great Basin and beyond, Geological Society of Nevada, Symposium, Reno 2000, Proceedings, pp. 249-264.
Warren, I. (2005): Geology, Geochemistry and Ore of the El Peñón Epithermal Au-Ag Deposit, Northern Chile: Characteristics of a bonanza-grade deposit and techniques for exploration. PhD Thesis – Geology, University of Auckland.
Warren, I., Zuluaga, J. I., Robbins, C. H., Wulftange, W. H., and Simmons, S. F., 2004, Geology and Geochemistry of Epithermal Au-Ag Mineralization in the El Peñón District, Northern Chile; Society of Economic Geologists, Special Publication 11, pp. 113-139.
Vega, A. M., 2015, QAQC Annual Report 2015, prepared for Minera Meridian Ltda., 46 pp., December 15, 2015.
Vega, A. M., 2014, QAQC Annual Report 2014, prepared for Minera Meridian Ltda., 34 pp., November, 2014.
Zuluaga, J.I. (2004): Geología y Mineralización del Distrito El Peñón, Segunda Región de Antofagasta, Chile. Tesis de Magíster en Geología Económica, Universidad Católica del Norte, Antofagasta, Chile, 150 p.
28 DATE AND SIGNATURE PAGE
This report titled “Technical Report on the El Peñón Mine, Antofagasta Region (II), Chile” dated March 2, 2018 was prepared and signed by the following authors:
| (Signed and Sealed) “Holger Krutzelmann” |
|
|
|
|
Dated at Toronto, ON | Holger Krutzelmann |
March 2, 2018 | Principal Metallurgist |
|
|
|
|
| (Signed and Sealed) “Normand Lecuyer” |
|
|
|
|
Dated at Toronto, ON | Normand Lecuyer, P.Eng |
March 2, 2018 | Principal Mining Engineer |
|
|
|
|
| (Signed and Sealed) “Chester M. Moore” |
|
|
|
|
Dated at Toronto, ON | Chester M. Moore, P.Eng. |
March 2, 2018 | Principal Geologist |
29 CERTIFICATE OF QUALIFIED PERSON
HOLGER KRUTZELMANN
I, Holger Krutzelmann, P. Eng., as an author of this report entitled “Technical Report on the El Peñón Mine, Antofagasta Region (II), Chile” prepared for Yamana Gold Inc. and dated of March 2, 2018, do hereby certify that:
1. I am Associate Principal Metallurgist with Roscoe Postle Associates Inc. of Suite 501, 55 University Ave Toronto, ON, M5J 2H7.
2. I am a graduate of Queen’s University, Kingston, Ontario, Canada in 1978 with a B.Sc. degree in Mining Engineering (Mineral Processing).
3. I am registered as a Professional Engineer with Professional Engineers Ontario (Reg. #90455304). I have worked in the mineral processing field, in operating, metallurgical, managerial; and engineering functions, for a total of 38 years since my graduation. My relevant experience for the purpose of the Technical Report is:
· Reviews and reports as a metallurgical consultant on a number of mining operations and projects for due diligence and financial monitoring requirements.
· Senior Metallurgist/Project Manager on numerous gold and base metal studies for a leading Canadian engineering company.
· Management and operational experience at several Canadian and U.S. milling operations treating various metals, including copper, zinc, gold and silver.
4. I have read the definition of “qualified person” set out in National Instrument 43-101 (NI 43-101) and certify that by reason of my education, affiliation with a professional association (as defined in NI 43-101) and past relevant work experience, I fulfill the requirements to be a “qualified person” for the purposes of NI 43-101.
5. I have not visited the Project.
6. I am responsible for Sections 13, 17, and 18 and contributed to Sections 1, 25, 26, and 27 of the Technical Report.
7. I am independent of the Issuer applying the test set out in Section 1.5 of NI 43-101.
8. I have had no prior involvement with the property that is the subject of the Technical Report.
9. I have read NI 43-101, and the Technical Report has been prepared in compliance with NI 43-101 and Form 43-101F1.
10. At the effective date of the Technical Report, to the best of my knowledge, information, and belief, the Sections for which I am responsible in the Technical Report contain all scientific and technical information that is required to be disclosed to make the Technical Report not misleading.
Dated this 2nd day of March, 2018.
(Signed and Sealed) “Holger Krutzelmann”
Holger Krutzelmann, P.Eng.
NORMAND L. LECUYER
I, Normand L. Lecuyer, P.Eng., as an author of this report entitled “Technical Report on the El Peñón Mine, Antofagasta Region (II), Chile” prepared for Yamana Gold Inc. and dated March 2, 2018, do hereby certify that:
1. I am Principal Mining Engineer with Roscoe Postle Associates Inc. of Suite 501, 55 University Ave Toronto, ON, M5J 2H7.
2. I am a graduate of Queen’s University, Kingston, Canada, in 1976 with a B.Sc. (Hons.) degree in Mining Engineering.
3. I am registered as a Professional Engineer in the provinces of Ontario (Reg. #26055251) and Québec (Reg. #34914). I have worked as a mining engineer for approximately 38 years since my graduation. My relevant experience for the purpose of the Technical Report is:
· Review and report as a consultant on numerous exploration and mining projects around the world for due diligence and regulatory requirements.
· Vice-President Operations for a number of mining companies.
· Mine Manager at an underground gold mine in Northern Ontario, Canada.
· Manager of Mining/Technical Services at a number of base-metal mines in Canada and North Africa.
· Vice-President Engineering at two gold operations in the Abitibi area of Quebec, Canada.
4. I have read the definition of “qualified person” set out in National Instrument 43-101 (NI 43-101) and certify that by reason of my education, affiliation with a professional association (as defined in NI 43-101) and past relevant work experience, I fulfill the requirements to be a “qualified person” for the purposes of NI 43-101.
5. I visited El Peñón on August 7 to 9, 2017, and previously visited the operations from November 13 to 16, 2007.
6. I am responsible for Sections 15, 16, 19, and 21 and contributed to Sections 1, 25, 26, and 27 of the Technical Report.
7. I am independent of the Issuer applying the test set out in Section 1.5 of NI 43-101.
8. I have previously prepared a Mineral Reserve audit report on the El Peñón mine that is described in this Technical Report.
9. I have read NI 43-101, and the Technical Report has been prepared in compliance with NI 43-101 and Form 43-101F1.
10. At the effective date of the Technical Report, to the best of my knowledge, information, and belief, the Sections for which I am responsible in the Technical Report contains/contain all scientific and technical information that is required to be disclosed to make the Technical Report not misleading.
Dated this 2nd day of March, 2018.
(Signed and Sealed) “Normand Lecuyer”
Normand L. Lecuyer, P.Eng.
CHESTER M. MOORE
I, Chester M. Moore, P.Eng., as an author of this report entitled “Technical Report on the El Peñón Mine, Antofagasta Region (II), Chile” prepared for Yamana Gold Inc. and dated March 2, 2018, do hereby certify that:
1. I am Principal Geologist with Roscoe Postle Associates Inc. of Suite 501, 55 University Ave Toronto, ON, M5J 2H7.
2. I am a graduate of the University of Toronto, Toronto, Ontario, Canada in 1972 with a Bachelor of Applied Science degree in Geological Engineering.
3. I am registered as a Professional Engineer in the Province of Ontario (Reg. #32455016). I have worked as a geologist for 44 years since my graduation. My relevant experience for the purpose of the Technical Report is:
· Mineral Resource and Reserve estimation, feasibility studies, due diligence, corporate review and audit on exploration projects and mining operations world wide
· Various advanced exploration and mine geology positions at base metal and gold mining operations in Ontario, Manitoba and Saskatchewan
· Director, Mineral Reserve Estimation and Reporting at the corporate offices of a major Canadian base metal producer
4. I have read the definition of “qualified person” set out in National Instrument 43-101 (NI 43-101) and certify that by reason of my education, affiliation with a professional association (as defined in NI 43-101) and past relevant work experience, I fulfill the requirements to be a “qualified person” for the purposes of NI 43-101.
5. I visited El Peñón on August 7 to 9, 2017, and previously visited the operations from December 7 to 9, 2009, and on November 13 to 16, 2007.
6. I am responsible for Sections 2 to 12, 14, 20, 23, and 24 and contributed to Sections 1, 25, 26, and 27 of the Technical Report.
7. I am independent of the Issuer applying the test set out in Section 1.5 of NI 43-101.
8. I have previously prepared Technical Reports on the El Peñón mine that is described in this Technical Report
9. I have read NI 43-101, and the Technical Report has been prepared in compliance with NI 43-101 and Form 43-101F1.
10. At the effective date of the Technical Report, to the best of my knowledge, information, and belief, the Sections for which I am responsible in the Technical Report contain all contains all scientific and technical information that is required to be disclosed to make the Technical Report not misleading.
Dated this 2nd day of March, 2018.
(Signed and Sealed) “Chester M. Moore”
Chester M. Moore, P.Eng.
TABLE 30-1 EL PEÑÓN EXPLOITATION CLAIM LIST
Yamana Gold Inc. – El Peñón Property
|
| Property Name |
| National Roll |
| Area (ha) |
| Validity |
1 |
| AURIA 10 1 AL 60 |
| 02201-5122-0 |
| 60 |
| Indefinite |
2 |
| AURIA 11 1 AL 60 |
| 02201-5123-9 |
| 300 |
| Indefinite |
3 |
| AURIA 4 1 AL 60 |
| 02201-5120-4 |
| 300 |
| Indefinite |
4 |
| AURIA 5 1 AL 60 |
| 02201-5121-2 |
| 300 |
| Indefinite |
5 |
| AZUL 01 1-10 |
| 02201-2619-6 |
| 100 |
| Indefinite |
6 |
| AZUL 02 1-10 |
| 02201-2620-K |
| 100 |
| Indefinite |
7 |
| AZUL 03 1-10 |
| 02201-2621-8 |
| 100 |
| Indefinite |
8 |
| AZUL 04 1-10 |
| 02201-2622-6 |
| 100 |
| Indefinite |
9 |
| AZUL 05 1-10 |
| 02201-2623-4 |
| 100 |
| Indefinite |
10 |
| AZUL 06 1-10 |
| 02201-2624-2 |
| 100 |
| Indefinite |
11 |
| AZUL 07 1-10 |
| 02201-2625-0 |
| 100 |
| Indefinite |
12 |
| AZUL 08 1-10 |
| 02201-2626-9 |
| 100 |
| Indefinite |
13 |
| AZUL 09 1-10 |
| 02201-2627-7 |
| 100 |
| Indefinite |
14 |
| AZUL 10 1-10 |
| 02201-2628-5 |
| 100 |
| Indefinite |
15 |
| AZUL 11 1-10 |
| 02201-2629-3 |
| 100 |
| Indefinite |
16 |
| AZUL 12 1-10 |
| 02201-2630-7 |
| 100 |
| Indefinite |
17 |
| AZUL 13 1-10 |
| 02201-2631-5 |
| 100 |
| Indefinite |
18 |
| AZUL 14 1-10 |
| 02201-2632-3 |
| 100 |
| Indefinite |
19 |
| AZUL 15 1-10 |
| 02201-2633-1 |
| 100 |
| Indefinite |
20 |
| AZUL 16 1-10 |
| 02201-2634-K |
| 100 |
| Indefinite |
21 |
| AZUL 17 1-10 |
| 02201-2635-8 |
| 100 |
| Indefinite |
22 |
| AZUL 18 1-5 |
| 02201-2636-6 |
| 50 |
| Indefinite |
23 |
| AZUL 19 1-10 |
| 02201-2637-4 |
| 100 |
| Indefinite |
24 |
| AZUL 22 1-5 |
| 02201-2640-4 |
| 50 |
| Indefinite |
25 |
| AZUL 23 1-10 |
| 02201-2641-2 |
| 100 |
| Indefinite |
26 |
| AZUL 24 1-10 |
| 02201-2642-0 |
| 100 |
| Indefinite |
27 |
| BLANCA 1, 1 AL 30 |
| 02201-5721-0 |
| 300 |
| Indefinite |
28 |
| BLANCA 1, 1 AL 20 |
| 02201-4370-8 |
| 100 |
| Indefinite |
29 |
| BLANCA 10 1 AL 30 |
| 02201-5727-K |
| 300 |
| Indefinite |
30 |
| BLANCA 11 1 AL 20 |
| 02201-5728-8 |
| 200 |
| Indefinite |
31 |
| BLANCA 12 1 AL 20 |
| 02201-5729-6 |
| 200 |
| Indefinite |
32 |
| BLANCA 13 1 AL 20 |
| 02201-5730-K |
| 200 |
| Indefinite |
33 |
| BLANCA 14 1 AL 30 |
| 02201-5731-8 |
| 300 |
| Indefinite |
34 |
| BLANCA 15 1 AL 30 |
| 02201-5732-6 |
| 300 |
| Indefinite |
35 |
| BLANCA 16 1 AL 30 |
| 02201-5733-4 |
| 300 |
| Indefinite |
36 |
| BLANCA 17 1 AL 30 |
| 02201-5734-2 |
| 300 |
| Indefinite |
37 |
| BLANCA 18 1 AL 30 |
| 02201-5735-0 |
| 300 |
| Indefinite |
38 |
| BLANCA 3 1 AL 30 |
| 02201-5722-9 |
| 300 |
| Indefinite |
39 |
| BLANCA 5 1 AL 20 |
| 02201-5723-7 |
| 200 |
| Indefinite |
40 |
| BLANCA 7 1 AL 30 |
| 02201-5724-5 |
| 300 |
| Indefinite |
41 |
| BLANCA 8 1 AL 30 |
| 02201-5725-3 |
| 300 |
| Indefinite |
42 |
| BLANCA 9 1 AL 30 |
| 02201-5726-1 |
| 300 |
| Indefinite |
|
| Property Name |
| National Roll |
| Area (ha) |
| Validity |
43 |
| BLANCO CHIQUILLA 2 1 AL 30 |
| 02201-6498-5 |
| 300 |
| Indefinite |
44 |
| BLANCO NORTE 110 1 AL 30 |
| 02201-6524 |
| 300 |
| Indefinite |
45 |
| BLANCO NORTE 2B 1 AL 20 |
| 02201-6218-4 |
| 200 |
| Indefinite |
46 |
| BLANCO NORTE 3B 1 AL 20 |
| 02201-6215-K |
| 200 |
| Indefinite |
47 |
| BLANCO NORTE 4B 1 AL 10 |
| 02201-6216-8 |
| 100 |
| Indefinite |
48 |
| BLANCO NORTE 5B 1 AL 10 |
| 02201-6217-6 |
| 100 |
| Indefinite |
49 |
| BLANCO NORTE 8 1 AL 30 |
| 02201-6351-2 |
| 300 |
| Indefinite |
50 |
| BLANCO NORTE 9 1 AL 30 |
| 02201-6352-0 |
| 300 |
| Indefinite |
51 |
| BLANCO SUR 1 1 AL 30 |
| 02201-6499-3 |
| 300 |
| Indefinite |
52 |
| BLANCO SUR 10 1 AL 30 |
| 02201-6508-6 |
| 300 |
| Indefinite |
53 |
| BLANCO SUR 2 1 AL 30 |
| 02201-6500-0 |
| 300 |
| Indefinite |
54 |
| BLANCO SUR 3 1 AL 30 |
| 02201-6501-9 |
| 300 |
| Indefinite |
55 |
| BLANCO SUR 4 1 AL 30 |
| 02201-6502-7 |
| 300 |
| Indefinite |
56 |
| BLANCO SUR 5 1 AL 20 |
| 02201-6503-5 |
| 200 |
| Indefinite |
57 |
| BLANCO SUR 6 1 AL 30 |
| 02201-6504-3 |
| 300 |
| Indefinite |
58 |
| BLANCO SUR 7 1 AL 30 |
| 02201-6505-1 |
| 300 |
| Indefinite |
59 |
| BLANCO SUR 8 1 AL 30 |
| 02201-6506-K |
| 200 |
| Indefinite |
60 |
| BLANCO SUR 9 1 AL 30 |
| 02201-6507-8 |
| 300 |
| Indefinite |
61 |
| CERRO AZUL 01 1-5 |
| 02201-2704-4 |
| 50 |
| Indefinite |
62 |
| CERRO AZUL 02 1-10 |
| 02201-2705-2 |
| 100 |
| Indefinite |
63 |
| CERRO AZUL 03 1-5 |
| 02201-2706-0 |
| 50 |
| Indefinite |
64 |
| CERRO AZUL 04 1-10 |
| 02201-2707-9 |
| 100 |
| Indefinite |
65 |
| CERRO AZUL 05 1-10 |
| 02201-2708-7 |
| 100 |
| Indefinite |
66 |
| CERRO AZUL 06 1-10 |
| 02201-2709-5 |
| 100 |
| Indefinite |
67 |
| CERRO AZUL 07 1-5 |
| 02201-2710-9 |
| 50 |
| Indefinite |
68 |
| CERRO AZUL 08 1-10 |
| 02201-2711-7 |
| 100 |
| Indefinite |
69 |
| CERRO AZUL 09 1-10 |
| 02201-2712-5 |
| 100 |
| Indefinite |
70 |
| CERRO AZUL 10 1-10 |
| 02201-2713-3 |
| 100 |
| Indefinite |
71 |
| CERRO AZUL 11 1-10 |
| 02201-2714-1 |
| 100 |
| Indefinite |
72 |
| CERRO AZUL 12 1-5 |
| 02201-2715-K |
| 50 |
| Indefinite |
73 |
| CERRO AZUL 13 1-5 |
| 02201-2716-8 |
| 50 |
| Indefinite |
74 |
| CERRO AZUL 14 1-10 |
| 02201-2717-6 |
| 100 |
| Indefinite |
75 |
| CERRO AZUL 15 1-10 |
| 02201-2718-4 |
| 100 |
| Indefinite |
76 |
| CERRO AZUL 16 1-5 |
| 02201-2719-2 |
| 50 |
| Indefinite |
77 |
| CERRO AZUL 17 1-10 |
| 02201-2720-6 |
| 100 |
| Indefinite |
78 |
| CERRO AZUL 18 1-5 |
| 02201-2721-4 |
| 50 |
| Indefinite |
79 |
| CERRO AZUL 19 1-10 |
| 02201-2722-2 |
| 100 |
| Indefinite |
80 |
| CERRO AZUL 20 1-10 |
| 02201-2723-0 |
| 100 |
| Indefinite |
81 |
| CERRO AZUL 21 1-10 |
| 02201-2724-9 |
| 100 |
| Indefinite |
82 |
| CERRO AZUL 22 1-10 |
| 02201-2725-7 |
| 100 |
| Indefinite |
83 |
| CERRO AZUL 23 1-5 |
| 02201-2726-5 |
| 50 |
| Indefinite |
84 |
| CERRO AZUL 24 1-10 |
| 02201-2727-3 |
| 100 |
| Indefinite |
85 |
| CERRO AZUL 25 1-10 |
| 02201-2728-1 |
| 100 |
| Indefinite |
86 |
| CERRO AZUL 26 1-10 |
| 02201-2729-K |
| 100 |
| Indefinite |
87 |
| CERRO AZUL 27 1-10 |
| 02201-2730-3 |
| 100 |
| Indefinite |
|
| Property Name |
| National Roll |
| Area (ha) |
| Validity |
88 |
| CERRO AZUL 28 1-10 |
| 02201-2731-1 |
| 100 |
| Indefinite |
89 |
| CERRO AZUL 29 1-5 |
| 02201-2732-K |
| 50 |
| Indefinite |
90 |
| CERRO AZUL 30 1-10 |
| 02201-2733-8 |
| 100 |
| Indefinite |
91 |
| CERRO AZUL 31 1-10 |
| 02201-2734-6 |
| 100 |
| Indefinite |
92 |
| CERRO AZUL 32 1-10 |
| 02201-2735-4 |
| 100 |
| Indefinite |
93 |
| CERRO AZUL 33 1-10 |
| 02201-2736-2 |
| 100 |
| Indefinite |
94 |
| CERRO AZUL 34 1-10 |
| 02201-2737-0 |
| 100 |
| Indefinite |
95 |
| CERRO AZUL 35 1-5 |
| 02201-2738-9 |
| 50 |
| Indefinite |
96 |
| CERRO AZUL 36 1-5 |
| 02201-2739-7 |
| 50 |
| Indefinite |
97 |
| CERRO AZUL 37 1-5 |
| 02201-2740-0 |
| 50 |
| Indefinite |
98 |
| CERRO AZUL 38 1-5 |
| 02201-2741-9 |
| 50 |
| Indefinite |
99 |
| CERRO AZUL 39 1-5 |
| 02201-2742-7 |
| 25 |
| Indefinite |
100 |
| CERRO AZUL A 1-10 |
| 02201-2608-0 |
| 100 |
| Indefinite |
101 |
| CERRO AZUL B 1-5 |
| 02201-2609-9 |
| 50 |
| Indefinite |
102 |
| CERRO AZUL PNTE. A 1-5 |
| 02201-2610-2 |
| 50 |
| Indefinite |
103 |
| CERRO AZUL PNTE. B 1-10 |
| 02201-2611-0 |
| 100 |
| Indefinite |
104 |
| CERRO AZUL PNTE. C 1-10 |
| 02201-2612-9 |
| 100 |
| Indefinite |
105 |
| CERRO AZUL PNTE. D 1-10 |
| 02201-2613-7 |
| 100 |
| Indefinite |
106 |
| CERRO AZUL PNTE. E 1-5 |
| 02201-2614-5 |
| 50 |
| Indefinite |
107 |
| CERRO AZUL PNTE. F 1-5 |
| 02201-2615-3 |
| 50 |
| Indefinite |
108 |
| CERRO AZUL PNTE. G 1-5 |
| 02201-2616-1 |
| 50 |
| Indefinite |
109 |
| CERRO AZUL PNTE. H 1-10 |
| 02201-2617-K |
| 100 |
| Indefinite |
110 |
| CERRO AZUL PNTE. I 1-10 |
| 02201-2618-8 |
| 100 |
| Indefinite |
111 |
| CERRO DOS 1 AL 20 |
| 02201-4312-0 |
| 100 |
| Indefinite |
112 |
| CERRO IMAN 1-30 |
| 02201-1796-0 |
| 300 |
| Indefinite |
113 |
| CERRO IMAN II 1-10 |
| 02201-1845-2 |
| 100 |
| Indefinite |
114 |
| CERRO IMAN III 1-10 |
| 02201-1846-0 |
| 100 |
| Indefinite |
115 |
| CERRO IMAN IV 1-5 |
| 02201-1847-9 |
| 50 |
| Indefinite |
116 |
| CERRO IMAN IX 1-10 |
| 02201-2315-4 |
| 100 |
| Indefinite |
117 |
| CERRO IMAN SUR 1 AL 10 |
| 02201-2369-3 |
| 100 |
| Indefinite |
118 |
| CERRO IMAN SUR 1 AL 5 |
| 02201-4488-7 |
| 50 |
| Indefinite |
119 |
| CERRO IMAN V 1-10 |
| 02201-1848-7 |
| 100 |
| Indefinite |
120 |
| CERRO IMAN VI 1-10 |
| 02201-1849-5 |
| 100 |
| Indefinite |
121 |
| CERRO IMAN VII 1-10 |
| 02201-1850-9 |
| 100 |
| Indefinite |
122 |
| CERRO IMAN VIII 1-10 |
| 02201-2314-6 |
| 100 |
| Indefinite |
123 |
| CERRO IMAN X 1-10 |
| 02201-2316-2 |
| 100 |
| Indefinite |
124 |
| CERRO IMAN XI 1-10 |
| 02201-2317-0 |
| 100 |
| Indefinite |
125 |
| CERRO IMAN XII 1-10 |
| 02201-2318-9 |
| 100 |
| Indefinite |
126 |
| CERRO IMAN XIII 1-10 |
| 02201-2319-7 |
| 100 |
| Indefinite |
127 |
| CERRO IMAN XIV 1 AL 10 |
| 02201-2320-0 |
| 100 |
| Indefinite |
128 |
| CERRO IMAN XV 1 AL 10 |
| 02201-2321-9 |
| 100 |
| Indefinite |
129 |
| CERRO IMAN XVII 1-10 |
| 02201-2450-9 |
| 100 |
| Indefinite |
130 |
| CERRO IMAN XVIII 1-15 |
| 02201-2366-9 |
| 50 |
| Indefinite |
131 |
| CERRO UNO 1 AL 20 |
| 02201-4311-2 |
| 100 |
| Indefinite |
132 |
| CHICA 15, 1 AL 20 |
| 02201-5443-2 |
| 200 |
| Indefinite |
|
| Property Name |
| National Roll |
| Area (ha) |
| Validity |
133 |
| CHICA 28, 1 AL 10 |
| 02201-5444-0 |
| 100 |
| Indefinite |
134 |
| CHICA 29, 1 AL 20 |
| 02201-5445-9 |
| 200 |
| Indefinite |
135 |
| CHICA 30 1 AL 20 |
| 02201-5446-7 |
| 200 |
| Indefinite |
136 |
| CHICA 31 A 1-10 |
| 02201-5447-5 |
| 75 |
| Indefinite |
137 |
| CHICA 31 B 1-10 |
| 02201-5448-3 |
| 100 |
| Indefinite |
138 |
| CHIQUILLA CHICA II 1-30 |
| 02201-4786-K |
| 300 |
| Indefinite |
139 |
| CHIQUILLA CHICA III 1 AL 30 |
| 02201-4787-8 |
| 300 |
| Indefinite |
140 |
| CHIQUILLA CHICA IV 1-30 |
| 02201-4788-6 |
| 300 |
| Indefinite |
141 |
| CHIQUILLA CHICA IX 1-30 |
| 02201-4792-4 |
| 300 |
| Indefinite |
142 |
| CHIQUILLA CHICA VI 1-30 |
| 02201-4790-8 |
| 300 |
| Indefinite |
143 |
| CHIQUILLA CHICA X 1-30 |
| 02201-4830-0 |
| 300 |
| Indefinite |
144 |
| CHIQUILLA CHICA XI 1-30 |
| 02201-4793-2 |
| 300 |
| Indefinite |
145 |
| CHIQUILLA CHICA XIX 1-30 |
| 02201-4798-3 |
| 300 |
| Indefinite |
146 |
| CHIQUILLA CHICA XVI 1-30 |
| 02201-4832-7 |
| 300 |
| Indefinite |
147 |
| CHIQUILLA CHICA XVII 1-30 |
| 02201-4833-5 |
| 300 |
| Indefinite |
148 |
| CHIQUILLA CHICA XVIII 1-30 |
| 02201-4797-5 |
| 300 |
| Indefinite |
149 |
| CHIQUILLA CHICA XX 1-30 |
| 02201-4799-1 |
| 300 |
| Indefinite |
150 |
| CHIQUILLA CHICA XXIII 1-30 |
| 02201-4801-7 |
| 300 |
| Indefinite |
151 |
| CHIQUILLA CHICA XXIX 1-30 |
| 02201-4804-1 |
| 300 |
| Indefinite |
152 |
| CHIQUILLA CHICA XXVI 1-30 |
| 02201-4834-3 |
| 300 |
| Indefinite |
153 |
| CHIQUILLA CHICA XXVIII 1-30 |
| 02201-4803-3 |
| 300 |
| Indefinite |
154 |
| CHIQUILLA CHICA XXX 1-30 |
| 02201-4805-K |
| 300 |
| Indefinite |
155 |
| CHIQUILLA CHICA V 1-30 |
| 02201-4789-4 |
| 300 |
| Indefinite |
156 |
| CHIQUILLA CHICA VII 1-30 |
| 02201-4791-6 |
| 300 |
| Indefinite |
157 |
| CHIQUILLA CHICA VIII 1-30 |
| 02201-4829-7 |
| 300 |
| Indefinite |
158 |
| CHIQUILLA CHICA XXVII 1-30 |
| 02201-4802-5 |
| 300 |
| Indefinite |
159 |
| DOMINADOR 1, DEL 1 AL 5 |
| 02201-2743-5 |
| 50 |
| Indefinite |
160 |
| DOMINADOR 1,1 AL 20 |
| 02201-3109-2 |
| 100 |
| Indefinite |
161 |
| DOMINADOR 2, DEL 1 AL 5 |
| 02201-2744-5 |
| 50 |
| Indefinite |
162 |
| DOMINADOR 2,1 AL 20 |
| 02201-3110-6 |
| 100 |
| Indefinite |
163 |
| DOMINADOR 3,1 AL 20 |
| 02201-3111-4 |
| 100 |
| Indefinite |
164 |
| DOMINADOR 4, DEL 1 AL 3ORED15 |
| 02201-2745-1 |
| 150 |
| Indefinite |
165 |
| DOMINADOR 4,1 AL 10 |
| 02201-3112-2 |
| 50 |
| Indefinite |
166 |
| EL PEÑÓN 10 1 AL 20 |
| 02201-3491-1 |
| 100 |
| Indefinite |
167 |
| EL PEÑÓN 11 1 AL 20 |
| 02201-3491-1 |
| 100 |
| Indefinite |
168 |
| EL PEÑÓN 12 1 AL 20 |
| 02201-3492-K |
| 100 |
| Indefinite |
169 |
| EL PEÑÓN 13 1 AL 30 |
| 02201-3494-6 |
| 150 |
| Indefinite |
170 |
| EL PEÑÓN 14 1 AL 50 |
| 02201-3495-4 |
| 250 |
| Indefinite |
171 |
| EL PEÑÓN 15 1 AL 40 |
| 02201-3496-2 |
| 200 |
| Indefinite |
172 |
| EL PEÑÓN 16 1 AL 40 |
| 02201-3497-0 |
| 200 |
| Indefinite |
173 |
| EL PEÑÓN 17 1 AL 10 |
| 02201-3498-9 |
| 50 |
| Indefinite |
174 |
| EL PEÑÓN 18 1 AL 10 |
| 02201-3650-7 |
| 50 |
| Indefinite |
175 |
| EL PEÑÓN 18 1 AL 50 |
| 02201-3518-7 |
| 250 |
| Indefinite |
176 |
| EL PEÑÓN 19 1 AL 60 |
| 02201-3519-5 |
| 300 |
| Indefinite |
|
| Property Name |
| National Roll |
| Area (ha) |
| Validity |
177 |
| EL PEÑÓN 20 1 AL 60 |
| 02201-3520-9 |
| 300 |
| Indefinite |
178 |
| EL PEÑÓN 21 1 AL 60 |
| 02201-3521-7 |
| 300 |
| Indefinite |
179 |
| EL PEÑÓN 22 1 AL 60 |
| 02201-3522-5 |
| 300 |
| Indefinite |
180 |
| EL PEÑÓN 23 1 AL 60 |
| 02201-3523-3 |
| 300 |
| Indefinite |
181 |
| EL PEÑÓN 24 1 AL 60 |
| 02201-3524-1 |
| 300 |
| Indefinite |
182 |
| EL PEÑÓN 25 1 AL 40 |
| 02201-3525-K |
| 200 |
| Indefinite |
183 |
| EL PEÑÓN 26 1 AL 60 |
| 02201-3526-8 |
| 300 |
| Indefinite |
184 |
| EL PEÑÓN 27 1 AL 60 |
| 02201-3527-6 |
| 300 |
| Indefinite |
185 |
| EL PEÑÓN 28 1 AL 60 |
| 02201-3528-4 |
| 300 |
| Indefinite |
186 |
| EL PEÑÓN 29 1 AL 60 |
| 02201-3529-2 |
| 300 |
| Indefinite |
187 |
| EL PEÑÓN 3 1 AL 20 |
| 02201-3482-2 |
| 100 |
| Indefinite |
188 |
| EL PEÑÓN 30 1 AL 60 |
| 02201-3530-6 |
| 300 |
| Indefinite |
189 |
| EL PEÑÓN 31 1 AL 60 |
| 02201-3531-4 |
| 300 |
| Indefinite |
190 |
| EL PEÑÓN 32 1 AL 40 |
| 02201-3532-2 |
| 200 |
| Indefinite |
191 |
| EL PEÑÓN 33 1 AL 60 |
| 02201-3533-0 |
| 300 |
| Indefinite |
192 |
| EL PEÑÓN 34 1 AL 60 |
| 02201-3534-9 |
| 300 |
| Indefinite |
193 |
| EL PEÑÓN 35 1 AL 60 |
| 02201-3535-7 |
| 300 |
| Indefinite |
194 |
| EL PEÑÓN 36 1 AL 60 |
| 02201-3536-5 |
| 300 |
| Indefinite |
195 |
| EL PEÑÓN 37 1 AL 40 |
| 02201-3535-7 |
| 200 |
| Indefinite |
196 |
| EL PEÑÓN 38 1 AL 40 |
| 02201-3538-1 |
| 200 |
| Indefinite |
197 |
| EL PEÑÓN 39 1 AL 60 |
| 02201-3539-K |
| 300 |
| Indefinite |
198 |
| EL PEÑÓN 4 1 AL 20 |
| 02201-3483-0 |
| 100 |
| Indefinite |
199 |
| EL PEÑÓN 40 1 AL 60 |
| 02201-3540-3 |
| 300 |
| Indefinite |
200 |
| EL PEÑÓN 41 1 AL 60 |
| 02201-3541-1 |
| 300 |
| Indefinite |
201 |
| EL PEÑÓN 42 1 AL 40 |
| 02201-3543-8 |
| 200 |
| Indefinite |
202 |
| EL PEÑÓN 42 1 AL 60 |
| 02201-3542-K |
| 300 |
| Indefinite |
203 |
| EL PEÑÓN 43 1 AL 40 |
| 02201-3544-6 |
| 200 |
| Indefinite |
204 |
| EL PEÑÓN 44 1 AL 60 |
| 02201-3545-4 |
| 300 |
| Indefinite |
205 |
| EL PEÑÓN 45 1 AL 60 |
| 02201-3546-2 |
| 300 |
| Indefinite |
206 |
| EL PEÑÓN 46 1 AL 60 |
| 02201-3547-0 |
| 300 |
| Indefinite |
207 |
| EL PEÑÓN 5 1 AL 10 |
| 02201-3484-9 |
| 50 |
| Indefinite |
208 |
| EL PEÑÓN 6 1 AL 10 |
| 02201-3485-7 |
| 50 |
| Indefinite |
209 |
| EL PEÑÓN 7 1 AL 40 |
| 02201-3488-1 |
| 200 |
| Indefinite |
210 |
| EL PEÑÓN 8 1 AL 60 |
| 02201-3489-K |
| 300 |
| Indefinite |
211 |
| EL PEÑÓN 9 1 AL 50 |
| 02201-3490-3 |
| 250 |
| Indefinite |
212 |
| ENCANTADA 1 1 AL 60 |
| 02201-3964-6 |
| 300 |
| Indefinite |
213 |
| ENCANTADA 12 1 AL 60 |
| 02201-3968-9 |
| 300 |
| Indefinite |
214 |
| ENCANTADA 13 1 AL 60 |
| 02201-3969-7 |
| 300 |
| Indefinite |
215 |
| ENCANTADA 14 1 AL 60 |
| 02201-3970-0 |
| 300 |
| Indefinite |
216 |
| ENCANTADA 15 1 AL 60 |
| 02201-3971-9 |
| 300 |
| Indefinite |
217 |
| ENCANTADA 16 1 AL 60 |
| 02201-3972-7 |
| 300 |
| Indefinite |
218 |
| ENCANTADA 18 1 AL 40 |
| 02201-4110-1 |
| 200 |
| Indefinite |
219 |
| ENCANTADA 2 1 AL 40 |
| 02201-4109-8 |
| 200 |
| Indefinite |
220 |
| ENCANTADA 21 1 AL 60 |
| 02201-3975-1 |
| 300 |
| Indefinite |
221 |
| ENCANTADA 22 1 AL 20 |
| 02201-3976-K |
| 100 |
| Indefinite |
|
| Property Name |
| National Roll |
| Area (ha) |
| Validity |
222 |
| ENCANTADA 3 1 AL 60 |
| 02201-3965-4 |
| 300 |
| Indefinite |
223 |
| ENCANTADA 44 1 AL 17 |
| 02201-4270-1 |
| 85 |
| Indefinite |
224 |
| ENCANTADA 5 1 AL 40 |
| 02201-3967-0 |
| 200 |
| Indefinite |
225 |
| FRANCISCA XIX 1-20 |
| 02201-4780-0 |
| 200 |
| Indefinite |
226 |
| FRANCISCA XXIII 1-30 |
| 02201-4781-9 |
| 300 |
| Indefinite |
227 |
| FRANCISCA XXIV 1-30 |
| 02201-4782-7 |
| 300 |
| Indefinite |
228 |
| LA ENCANTADA 1 AL 10 |
| 02201-2799-0 |
| 0 |
| Indefinite |
229 |
| LA SUERTE 1 AL 20 |
| 02201-4965-K |
| 100 |
| Indefinite |
230 |
| LAGUNA 1 1 AL 60 |
| 02201-4099-7 |
| 300 |
| Indefinite |
231 |
| LAGUNA 2 1 AL 60 |
| 02201-4100-4 |
| 300 |
| Indefinite |
232 |
| LAGUNA 3 1 AL 60 |
| 02201-4101-2 |
| 300 |
| Indefinite |
233 |
| LAGUNA 4 1 AL 60 |
| 02201-4102-0 |
| 300 |
| Indefinite |
234 |
| LAGUNA 5 1 AL 60 |
| 02201-4103-9 |
| 300 |
| Indefinite |
235 |
| LAGUNA 6 1 AL 60 |
| 02201-4104-7 |
| 300 |
| Indefinite |
236 |
| LAGUNA 7 1 AL 60 |
| 02201-4105-5 |
| 300 |
| Indefinite |
237 |
| LAS CONDES CINCO 1 AL 60 |
| 02201-3151-3 |
| 300 |
| Indefinite |
238 |
| LAS CONDES CUATRO 1 AL 60 |
| 02201-3150-5 |
| 300 |
| Indefinite |
239 |
| LAS CONDES DIEZ 1 AL 10 |
| 02201-3156-4 |
| 50 |
| Indefinite |
240 |
| LAS CONDES DOS 1 AL 30 |
| 02201-3148-3 |
| 150 |
| Indefinite |
241 |
| LAS CONDES NUEVE 1 AL 60 |
| 02201-3155-6 |
| 300 |
| Indefinite |
242 |
| LAS CONDES OCHO 1 AL 60 |
| 02201-3154-8 |
| 300 |
| Indefinite |
243 |
| LAS CONDES ONCE 1 AL 10 |
| 02201-3157-2 |
| 50 |
| Indefinite |
244 |
| LAS CONDES SEIS 1 AL 30 |
| 02201-3152-1 |
| 150 |
| Indefinite |
245 |
| LAS CONDES SIETE 1 AL 30 |
| 02201-3153-K |
| 150 |
| Indefinite |
246 |
| LAS CONDES TRES 1 AL 20 |
| 02201-3149-1 |
| 100 |
| Indefinite |
247 |
| LAS CONDES UNO 1 AL 40 |
| 02201-3147-5 |
| 200 |
| Indefinite |
248 |
| LINA 1 1 AL 60 |
| 02201-4451-5 |
| 300 |
| Indefinite |
249 |
| LINA 10 1 AL 10 |
| 02201-4460-4 |
| 50 |
| Indefinite |
250 |
| LINA 11 1 AL 40 |
| 02201-4455-0 |
| 200 |
| Indefinite |
251 |
| LINA 12 1 AL 60 |
| 02201-4456-9 |
| 300 |
| Indefinite |
252 |
| LINA 14 1/10-21/40 |
| 02201-4457-7 |
| 150 |
| Indefinite |
253 |
| LINA 2 1 AL 60 |
| 02201-4252-3 |
| 300 |
| Indefinite |
254 |
| LINA 3 1 AL 20 |
| 02201-4253-1 |
| 100 |
| Indefinite |
255 |
| LINA 4 1 AL 60 |
| 02201-4254-K |
| 300 |
| Indefinite |
256 |
| LINA 5 1 AL 60 |
| 02201-4255-8 |
| 300 |
| Indefinite |
257 |
| LINA 6 1 AL 60 |
| 02201-4256-6 |
| 300 |
| Indefinite |
258 |
| LINA 7 1 AL 20 |
| 02201-4257-4 |
| 100 |
| Indefinite |
259 |
| LINA 8 1 AL 30 |
| 02201-4158-2 |
| 150 |
| Indefinite |
260 |
| LINA 9 1 AL 30 |
| 02201-4159-0 |
| 150 |
| Indefinite |
261 |
| LINEA 1 1 AL 60 |
| 02201-4136-5 |
| 300 |
| Indefinite |
262 |
| LINEA 2 1 AL 60 |
| 02201-4137-3 |
| 300 |
| Indefinite |
263 |
| LINEA 3 1 AL 60 |
| 02201-4138-1 |
| 300 |
| Indefinite |
264 |
| LINEA 4 1 AL 60 |
| 02201-4139-K |
| 300 |
| Indefinite |
265 |
| LOBA 1 1 AL 60 |
| 02201-4061-K |
| 300 |
| Indefinite |
266 |
| LOBA 3 1 AL 60 |
| 02201-4063-6 |
| 300 |
| Indefinite |
|
| Property Name |
| National Roll |
| Area (ha) |
| Validity |
267 |
| LOBA 34 1 AL 60 |
| 02201-4520-4 |
| 300 |
| Indefinite |
268 |
| LOBA 35 1 AL 60 |
| 02201-4519-0 |
| 300 |
| Indefinite |
269 |
| LOBA 4 1 AL 60 |
| 02201-4064-4 |
| 300 |
| Indefinite |
270 |
| LOBA 5 1 AL 60 |
| 02201-4065-2 |
| 300 |
| Indefinite |
271 |
| LOBA 6 1 AL 60 |
| 02201-4066-0 |
| 300 |
| Indefinite |
272 |
| LOBA 7 1 AL 40 |
| 02201-4061-K |
| 200 |
| Indefinite |
273 |
| LOBITA 1 1 AL 40 |
| 02201-4002-4 |
| 200 |
| Indefinite |
274 |
| LOBITA 23 1 AL 40 |
| 02201-4024-5 |
| 200 |
| Indefinite |
275 |
| LOBITA 24 1 AL 60 |
| 02201-4025-3 |
| 300 |
| Indefinite |
276 |
| LOBITA 25 1 AL 60 |
| 02201-4026-1 |
| 300 |
| Indefinite |
277 |
| LOBITA 3 1 AL 60 |
| 02201-4004-0 |
| 300 |
| Indefinite |
278 |
| LOBITA 38 1 AL 60 |
| 02201-4006-3 |
| 300 |
| Indefinite |
279 |
| LOBITA 39 1 AL 60 |
| 02201-4035-0 |
| 300 |
| Indefinite |
280 |
| LOBITA 4 1 AL 60 |
| 02201-4005-9 |
| 300 |
| Indefinite |
281 |
| LOBITA 40 1 AL 60 |
| 02201-4036-9 |
| 300 |
| Indefinite |
282 |
| LOBITA 41 1 AL 60 |
| 02201-4037-7 |
| 300 |
| Indefinite |
283 |
| LOBITA 42 1 AL 60 |
| 02201-4038-5 |
| 300 |
| Indefinite |
284 |
| LOBO 18, 1 AL 30 |
| 02201-6197-8 |
| 300 |
| Indefinite |
285 |
| LOBO 19, 1 AL 30 |
| 022016196-K |
| 300 |
| Indefinite |
286 |
| LOBO 20, 1 AL 30 |
| 022016195-1 |
| 300 |
| Indefinite |
287 |
| MAGICA 1 1 AL 40 |
| 02201-6565-5 |
| 200 |
| Indefinite |
288 |
| MAGICA 2 1 AL 40 |
| 02201-6566-3 |
| 200 |
| Indefinite |
289 |
| MERLIN 40 1 AL60 |
| 02201-6656-2 |
| 300 |
| Indefinite |
290 |
| NADIAN 4A, 1 AL 40 |
| 02201-6169-2 |
| 200 |
| Indefinite |
291 |
| NADIAN 4B, 1 AL 40 |
| 02201-6170-6 |
| 200 |
| Indefinite |
292 |
| NADIAN 7A, 1 AL 60 |
| 02201-6171-4 |
| 300 |
| Indefinite |
293 |
| NADIAN 7B, 1 AL 60 |
| 02201-6172-2 |
| 300 |
| Indefinite |
294 |
| NADIAN 8 B, 1 AL 60 |
| 02201-6174-9 |
| 300 |
| Indefinite |
295 |
| NADIAN 8A, 1 AL 60 |
| 02201-6173-0 |
| 300 |
| Indefinite |
296 |
| NADIAN 9A, 1 AL 40 |
| 02201-6175-7 |
| 200 |
| Indefinite |
297 |
| NADO 1, 1 AL 60 |
| 02201-5529-3 |
| 300 |
| Indefinite |
298 |
| NADO 10, 1 al 60 |
| 02201-5538-2 |
| 300 |
| Indefinite |
299 |
| NADO 11,1 AL 60 |
| 02201-5539-0 |
| 300 |
| Indefinite |
300 |
| NADO 12, 1 AL 60 |
| 02201-5540-4 |
| 300 |
| Indefinite |
301 |
| NADO 13, 1 AL 60 |
| 02201-5541-2 |
| 300 |
| Indefinite |
302 |
| NADO 14, 1 AL 60 |
| 02201-5542-0 |
| 300 |
| Indefinite |
303 |
| NADO 15, 1 AL 60 |
| 02201-5543-9 |
| 300 |
| Indefinite |
304 |
| NADO 16, 1 AL 60 |
| 02201-5544-7 |
| 300 |
| Indefinite |
305 |
| NADO 17, 1 AL 60 |
| 02201-5545-5 |
| 300 |
| Indefinite |
306 |
| NADO 18, 1 AL 60 |
| 02201-5546-3 |
| 300 |
| Indefinite |
307 |
| NADO 19, 1 AL 60 |
| 02201-5547-1 |
| 300 |
| Indefinite |
308 |
| NADO 2, 1 AL 60 |
| 02201-5530-7 |
| 300 |
| Indefinite |
309 |
| NADO 20, 1 AL 60 |
| 02201-5548-K |
| 300 |
| Indefinite |
310 |
| NADO 21, 1 AL 60 |
| 02201-5549-8 |
| 300 |
| Indefinite |
311 |
| NADO 22, 1 AL 60 |
| 02201-5550-1 |
| 300 |
| Indefinite |
|
| Property Name |
| National Roll |
| Area (ha) |
| Validity |
312 |
| NADO 23, 1 AL 20 |
| 02201-5551-K |
| 100 |
| Indefinite |
313 |
| NADO 24, 1 AL 40 |
| 02201-5552-8 |
| 200 |
| Indefinite |
314 |
| NADO 25, 1 AL 60 |
| 02201-5553-6 |
| 300 |
| Indefinite |
315 |
| NADO 26, 1 AL 60 |
| 02201-5554-4 |
| 300 |
| Indefinite |
316 |
| NADO 27, 1 AL 60 |
| 02201-5555-2 |
| 300 |
| Indefinite |
317 |
| NADO 3, 1 AL 60 |
| 02201-5531-5 |
| 300 |
| Indefinite |
318 |
| NADO 4, 1 AL 60 |
| 02201-5532-3 |
| 300 |
| Indefinite |
319 |
| NADO 5, 1 AL 60 |
| 02201-5533-1 |
| 300 |
| Indefinite |
320 |
| NADO 6,1 AL 60 |
| 02201-5534-K |
| 300 |
| Indefinite |
321 |
| NADO 7, 1 AL 60 |
| 02201-5535-8 |
| 300 |
| Indefinite |
322 |
| NADO 8, 1 AL 60 |
| 02201-5536-6 |
| 300 |
| Indefinite |
323 |
| NADO 9, 1 AL 60 |
| 02201-5537-4 |
| 300 |
| Indefinite |
324 |
| NIVA 3 1 AL 60 |
| 02202-5455-0 |
| 300 |
| Indefinite |
325 |
| NIVA 4 1 AL 60 |
| 02202-5456-9 |
| 300 |
| Indefinite |
326 |
| NIVA 7 1 AL 40 |
| 02202-5457-7 |
| 200 |
| Indefinite |
327 |
| PAISAJE 1 1 AL 40 |
| 02201-3651-5 |
| 200 |
| Indefinite |
328 |
| PAISAJE 11 1 AL 60 |
| 02201-3661-2 |
| 300 |
| Indefinite |
329 |
| PAISAJE 12 1 AL 60 |
| 02201-3662-0 |
| 300 |
| Indefinite |
330 |
| PAISAJE 13 1 AL 20 |
| 02201-3663-9 |
| 100 |
| Indefinite |
331 |
| PAISAJE 14 1 AL 20 |
| 02201-3664-7 |
| 100 |
| Indefinite |
332 |
| PAISAJE 18 1 AL 60 |
| 02201-3668-K |
| 300 |
| Indefinite |
333 |
| PAISAJE 19 1 AL 60 |
| 02201-3669-8 |
| 300 |
| Indefinite |
334 |
| PAISAJE 2 1 AL 40 |
| 02201-3652-3 |
| 200 |
| Indefinite |
335 |
| PAISAJE 20 1 AL 40 |
| 02201-3670-1 |
| 200 |
| Indefinite |
336 |
| PAISAJE 21 1 AL 40 |
| 02201-3671-K |
| 200 |
| Indefinite |
337 |
| PAISAJE 22 1 AL 40 |
| 02201-3672-8 |
| 200 |
| Indefinite |
338 |
| PAISAJE 23 1 AL 40 |
| 02201-3962-K |
| 200 |
| Indefinite |
339 |
| PAISAJE 24 1 AL 40 |
| 02201-3963-8 |
| 200 |
| Indefinite |
340 |
| PAISAJE 3 1 AL 40 |
| 02201-3653-1 |
| 200 |
| Indefinite |
341 |
| PAISAJE 4 1 AL 40 |
| 02201-3654-K |
| 200 |
| Indefinite |
342 |
| PAISAJE 5 1 AL 40 |
| 02201-3655-8 |
| 200 |
| Indefinite |
343 |
| PAISAJE 6 1 AL 40 |
| 02201-3656-6 |
| 200 |
| Indefinite |
344 |
| PAISAJE UNO 1 AL 20 |
| 02201-3208-0 |
| 100 |
| Indefinite |
345 |
| PAMPA AUGUSTA I, 1 AL 59 |
| 02201-5271-5 |
| 292 |
| Indefinite |
346 |
| PEÑÓN 50 1 AL 10 |
| 02201-3977-8 |
| 50 |
| Indefinite |
347 |
| PEÑÓN 51 1 AL 20 |
| 02201-3978-6 |
| 100 |
| Indefinite |
348 |
| PEÑÓN 53 1 AL 60 |
| 02201-3980-8 |
| 300 |
| Indefinite |
349 |
| PEÑÓN 54 1 AL 60 |
| 02201-3981-6 |
| 300 |
| Indefinite |
350 |
| PEÑÓN 55 1 AL 60 |
| 02201-3982-4 |
| 300 |
| Indefinite |
351 |
| PEÑÓN 56 1 AL 60 |
| 02201-3983-2 |
| 300 |
| Indefinite |
352 |
| PEÑÓN 57 1 AL 60 |
| 02201-3984-0 |
| 300 |
| Indefinite |
353 |
| PEÑÓN 58 1 AL 60 |
| 02201-3985-9 |
| 300 |
| Indefinite |
354 |
| PEÑÓN 59 1 AL 60 |
| 02201-3986-7 |
| 300 |
| Indefinite |
355 |
| PEÑÓN 60 1 AL 60 |
| 02201-3987-5 |
| 300 |
| Indefinite |
356 |
| PEÑÓN 61 1 AL 40 |
| 02201-3988-3 |
| 200 |
| Indefinite |
|
| Property Name |
| National Roll |
| Area (ha) |
| Validity |
357 |
| PEÑÓN 62 1 AL 40 |
| 02201-3989-1 |
| 200 |
| Indefinite |
358 |
| PEÑÓN 63 1 AL 20 |
| 02201-3990-5 |
| 100 |
| Indefinite |
359 |
| PROVIDENCIA 1 II DEL 1 AL 30 |
| 02201-3556-K |
| 300 |
| Indefinite |
360 |
| PROVIDENCIA 1 II DEL 61 AL 90 |
| 02201-3558-6 |
| 300 |
| Indefinite |
361 |
| PROVIDENCIA 1 II DEL 91 AL 120 |
| 02201-3559-4 |
| 300 |
| Indefinite |
362 |
| PROVIDENCIA 1 II DEL 31 AL 60 |
| 02201-3557-8 |
| 300 |
| Indefinite |
363 |
| PROVIDENCIA 2 II 1/40 |
| 02201-3561-6 |
| 400 |
| Indefinite |
364 |
| PROVIDENCIA 3 II DEL 1 AL 30 |
| 02201-3562-4 |
| 300 |
| Indefinite |
365 |
| PROVIDENCIA 3 II DEL 31 AL 60 |
| 02201-3563-2 |
| 300 |
| Indefinite |
366 |
| PROVIDENCIA 3 II DEL 61 AL 90 |
| 02201-3564-0 |
| 300 |
| Indefinite |
367 |
| PROVIDENCIA 3 II DEL 91 AL 120 |
| 02201-3565-9 |
| 300 |
| Indefinite |
368 |
| PROVIDENCIA 3 II DEL 121 AL 150 |
| 02201-3566-7 |
| 300 |
| Indefinite |
369 |
| PROVIDENCIA 4 II DEL 1 AL 40 |
| 02201-3567-5 |
| 400 |
| Indefinite |
370 |
| PROVIDENCIA 4 II DEL 41 AL 80 |
| 02201-3568-3 |
| 400 |
| Indefinite |
371 |
| PROVIDENCIA CINCO 1-60 |
| 02201-3077-0 |
| 300 |
| Indefinite |
372 |
| PROVIDENCIA CUATRO 1-60 |
| 02201-3076-2 |
| 300 |
| Indefinite |
373 |
| PROVIDENCIA DIEZ 1-10 |
| 02201-3082-7 |
| 50 |
| Indefinite |
374 |
| PROVIDENCIA DOS 1-30 |
| 02201-3074-6 |
| 150 |
| Indefinite |
375 |
| PROVIDENCIA NUEVE 1-60 |
| 02201-3081-9 |
| 300 |
| Indefinite |
376 |
| PROVIDENCIA OCHO 1-60 |
| 02201-3080-0 |
| 300 |
| Indefinite |
377 |
| PROVIDENCIA ONCE 1-10 |
| 02201-3083-5 |
| 50 |
| Indefinite |
378 |
| PROVIDENCIA SEIS 1-30 |
| 02201-3078-9 |
| 150 |
| Indefinite |
379 |
| PROVIDENCIA SIETE 1-30 |
| 02201-3079-7 |
| 150 |
| Indefinite |
380 |
| PROVIDENCIA TRES 1-20 |
| 02201-3075-4 |
| 100 |
| Indefinite |
381 |
| PROVIDENCIA UNO 1-40 |
| 02201-3073-8 |
| 200 |
| Indefinite |
382 |
| PROVIDENCIA 5 II 1 AL 30 RED10 |
| 02201-3569-1 |
| 100 |
| Indefinite |
383 |
| PROVIDENCIA 5 II 31 AL 60 ORE10 |
| 02201-3569-1 |
| 100 |
| Indefinite |
384 |
| PROVIDENCIA 5 II 61 AL 90 ORE10 |
| 02201-3569-1 |
| 100 |
| Indefinite |
385 |
| PUNTA BLANCA 1, 1 AL 30 |
| 02201-5474-2 |
| 300 |
| Indefinite |
386 |
| PUNTA BLANCA 2, 1 AL 30 |
| 02201-5475-0 |
| 300 |
| Indefinite |
387 |
| PUNTA BLANCA 3, 1 AL 30 |
| 02201-5476-9 |
| 300 |
| Indefinite |
388 |
| SERRUCHO 1 1 AL 60 |
| 02201-3591-8 |
| 300 |
| Indefinite |
389 |
| SERRUCHO 2 1 AL 60 |
| 02201-3592-6 |
| 300 |
| Indefinite |
390 |
| SERRUCHO 3 1 AL 60 |
| 02201-3593-4 |
| 300 |
| Indefinite |
391 |
| SERRUCHO 4 1 AL 20 |
| 02201-4600-6 |
| 100 |
| Indefinite |
392 |
| SERRUCHO 5 1 AL 20 |
| 02201-4601-4 |
| 100 |
| Indefinite |
393 |
| TACO 1 1 AL 20 |
| 02201-4154-3 |
| 100 |
| Indefinite |
394 |
| TOSTADO 1 1 AL 60 |
| 02201-3612-4 |
| 300 |
| Indefinite |
395 |
| TOSTADO 1 1 AL 60 |
| 02201-3145-9 |
| 300 |
| Indefinite |
396 |
| TOSTADO 10 1 AL 60 |
| 02201-3621-3 |
| 300 |
| Indefinite |
397 |
| TOSTADO 11 1 AL 20 |
| 02201-3622-1 |
| 100 |
| Indefinite |
398 |
| TOSTADO 12 1 AL 40 |
| 02201-3623-K |
| 200 |
| Indefinite |
399 |
| TOSTADO 13 1 AL 20 |
| 02201-3624-8 |
| 100 |
| Indefinite |
|
| Property Name |
| National Roll |
| Area (ha) |
| Validity |
400 |
| TOSTADO 15 1 AL 40 |
| 02201-3626-4 |
| 200 |
| Indefinite |
401 |
| TOSTADO 16 1 AL 60 |
| 02201-3627-2 |
| 300 |
| Indefinite |
402 |
| TOSTADO 17 1 AL 20 |
| 02201-3628-0 |
| 100 |
| Indefinite |
403 |
| TOSTADO 18 1 AL 40 |
| 02201-3629-9 |
| 200 |
| Indefinite |
404 |
| TOSTADO 19 1 AL 60 |
| 02201-3630-2 |
| 300 |
| Indefinite |
405 |
| TOSTADO 2 1 AL 60 |
| 02201-3613-2 |
| 300 |
| Indefinite |
406 |
| TOSTADO 2,1 AL 20 |
| 02201-3146-7 |
| 100 |
| Indefinite |
407 |
| TOSTADO 20 1 AL 60 |
| 02201-3631-0 |
| 300 |
| Indefinite |
408 |
| TOSTADO 21 1 AL 20 |
| 02201-3632-9 |
| 100 |
| Indefinite |
409 |
| TOSTADO 22 1 AL 60 |
| 02201-3633-7 |
| 300 |
| Indefinite |
410 |
| TOSTADO 23 1 AL 40 |
| 02201-3635-3 |
| 200 |
| Indefinite |
411 |
| TOSTADO 24 1 AL 60 |
| 02201-4186-1 |
| 300 |
| Indefinite |
412 |
| TOSTADO 25 1 AL 40 |
| 02201-4187-K |
| 200 |
| Indefinite |
413 |
| TOSTADO 3,1 AL 60 |
| 02201-3614-0 |
| 300 |
| Indefinite |
414 |
| TOSTADO 4,1 AL 60 |
| 02201-3615-9 |
| 300 |
| Indefinite |
415 |
| TOSTADO 5,1 AL 60 |
| 02201-3616-7 |
| 300 |
| Indefinite |
416 |
| TOSTADO 6,1 AL 60 |
| 02201-3617-5 |
| 300 |
| Indefinite |
417 |
| TOSTADO 7,1 AL 20 |
| 02201-3618-3 |
| 100 |
| Indefinite |
418 |
| TOSTADO 8,1 AL 40 |
| 02201-3619-1 |
| 200 |
| Indefinite |
419 |
| TOSTADO 9,1 AL 60 |
| 02201-3620-5 |
| 300 |
| Indefinite |
420 |
| VERDE 4 6 AL 10 Y 16 AL 20 |
| 02201-4317-1 |
| 50 |
| Indefinite |
TOTAL |
|
|
| 87,387 |
|
| ||
TABLE 30-2 PAV EXPLOITATION CLAIM LIST
Yamana Gold Inc. – El Peñón Mine
|
| Property Name |
| National Roll |
| Area (ha) |
| Validity |
1 |
| LLANO 1 1 AL 20 |
| 02201-4539-5 |
| 100 |
| Indefinite |
2 |
| LLANO 10 1 AL 20 |
| 02201-4548-4 |
| 100 |
| Indefinite |
3 |
| LLANO 2 1 AL 20 |
| 02201-4540-9 |
| 100 |
| Indefinite |
4 |
| LLANO 3 1 AL 20 |
| 02201-4541-7 |
| 100 |
| Indefinite |
5 |
| LLANO 4 1 AL 20 |
| 02201-4542-5 |
| 100 |
| Indefinite |
6 |
| LLANO 5 1 AL 20 |
| 02201-4543-3 |
| 100 |
| Indefinite |
7 |
| LLANO 6 1 AL 20 |
| 02201-4544-1 |
| 100 |
| Indefinite |
8 |
| LLANO 7 1 AL 20 |
| 02201-4545-K |
| 100 |
| Indefinite |
9 |
| LLANO 8 1 AL 20 |
| 02201-4546-8 |
| 100 |
| Indefinite |
10 |
| LLANO 9 1 AL 20 |
| 02201-4547-6 |
| 100 |
| Indefinite |
11 |
| PAMPA 4 1 AL 60 |
| 02201-4730-4 |
| 300 |
| Indefinite |
12 |
| PAMPA 5 1 AL 60 |
| 02201-4731-2 |
| 300 |
| Indefinite |
13 |
| PAMPA 6 1 AL 40 |
| 02201-4732-0 |
| 200 |
| Indefinite |
14 |
| PAMPA 7 1 AL 60 |
| 02201-4733-9 |
| 300 |
| Indefinite |
15 |
| PAMPA 8 1 AL 60 |
| 02201-4734-7 |
| 300 |
| Indefinite |
16 |
| PAMPA 9 1 AL 60 |
| 02201-4735-5 |
| 300 |
| Indefinite |
TOTAL |
|
|
| 2,700 |
|
| ||