YAMANA GOLD INC.
ANNUAL INFORMATION FORM
FOR THE FISCAL YEAR ENDED DECEMBER 31, 2015
March 29, 2016
200 Bay Street, Suite 2200
Royal Bank Plaza, North Tower
Toronto, Ontario M5J 2J3
TABLE OF CONTENTS
|
| | |
| INTRODUCTORY NOTES | 3 |
|
| Cautionary Note Regarding Forward-Looking Statements | 3 |
|
| Cautionary Note to United States Investors Concerning Estimates of Mineral Reserves and Mineral Resources | 5 |
|
| Currency Presentation And Exchange Rate Information | 5 |
|
| | |
|
| CORPORATE STRUCTURE | 6 |
|
| | |
|
| GENERAL DEVELOPMENT OF THE BUSINESS | 8 |
|
| | |
|
| Overview of Business | 8 |
|
| History | 8 |
|
| | |
|
| DESCRIPTION OF THE BUSINESS | 13 |
|
| | |
|
| Principal Products | 13 |
|
| Competitive Conditions | 13 |
|
| Operations | 13 |
|
| Environment and Communities | 14 |
|
| Risks of the Business | 17 |
|
| Technical Information | 33 |
|
| Cautionary Note to United States Investors Concerning Estimates of Measured, Indicated and Inferred Mineral Resources | 35 |
|
| Mineral Projects | 38 |
|
| Summary of Mineral Reserve and Mineral Resource Estimates | 38 |
|
| Material Mineral Properties | 41 |
|
| Chapada Mine | 41 |
|
| El Peñón Mine | 50 |
|
| Canadian Malartic Mine | 58 |
|
| Other Producing Mines | 67 |
|
| Gualcamayo Mine | 67 |
|
| Jacobina Mining Complex | 68 |
|
| Minera Florida Mine | 69 |
|
| Mercedes Mine | 70 |
|
| Fazenda Brasileiro Mine | 72 |
|
| Pilar Project | 72 |
|
| Additional Projects | 73 |
|
| C1 Santa Luz Project | 73 |
|
| Cerro Moro Project | 74 |
|
| Agua Rica Project | 75 |
|
| Suyai Project | 75 |
|
| | |
| | |
|
| | |
| DIVIDENDS | 76 |
|
| | |
|
| DESCRIPTION OF CAPITAL STRUCTURE | 76 |
|
| | |
|
| MARKET FOR SECURITIES | 77 |
|
| | |
|
| DIRECTORS AND OFFICERS | 77 |
|
| | |
|
| PROMOTER | 84 |
|
| | |
|
| LEGAL PROCEEDINGS AND REGULATORY ACTIONS | 84 |
|
| | |
|
| INTEREST OF MANAGEMENT AND OTHERS IN MATERIAL TRANSACTIONS | 85 |
|
| | |
|
| TRANSFER AGENTS AND REGISTRAR | 85 |
|
| | |
| MATERIAL CONTRACTS | 85 |
|
| | |
| AUDIT COMMITTEE | 86 |
|
| | |
| INTERESTS OF EXPERTS | 89 |
|
| | |
| ADDITIONAL INFORMATION | 90 |
|
| | |
| SCHEDULE “A” — CHARTER OF THE AUDIT COMMITTEE | 91 |
|
ITEM 1
INTRODUCTORY NOTES
Cautionary Note Regarding Forward-Looking Statements
This annual information form contains “forward-looking statements” within the meaning of the United States Private Securities Litigation Reform Act of 1995 and “forward-looking information” under applicable Canadian securities legislation. Except for statements of historical fact relating to the Company (as defined herein), information contained herein constitutes forward-looking statements, including, but not limited to, any information as to the Company’s strategy, plans or future financial or operating performance. Forward-looking statements are characterized by words such as “plan”, “expect”, “budget”, “target”, “project”, “intend”, “believe”, “anticipate”, “estimate” and other similar words, or statements that certain events or conditions “may” or “will” occur. In particular, forward looking information included in this annual form includes, without limitation, statements with respect to:
| |
| • | the Company's expectations in connection with the production and exploration, development and expansion plans at the Company's projects discussed herein being met; |
| |
| • | the Company's plans to continue building on its base of significant gold production, gold development stage properties, exploration properties and land positions in Brazil, Chile, Argentina, Mexico and Canada through existing operating mine expansions, throughout increases, development of new mines, advancement of its exploration properties and by targeting other gold consolidation opportunities with a primary focus in the Americas; |
| |
| • | the Company's expectations regarding the timing of construction, development and production at the Cerro Morro Project; |
| |
| • | the Company's intention to hold the Brio Gold assets for the foreseeable future and its plans to revaluate other options related to Brio Gold pending material improvements in market conditions and the ability to realize proper value; |
| |
| • | the impact of proposed optimizations at the Company's projects; |
| |
| • | the effect of government regulations (or changes thereto) with respect to the restrictions on production, export controls, income taxes, expropriation of property, repatriation of profits, environmental legislation, land use, water use, land claims of local people, mine safety and receipt of necessary permits; |
| |
| • | the impact of the proposed new mining law in Brazil, the tax reform bill in Mexico, the amended federal income tax statute in Argentina and the Chilean tax reform package; |
| |
| • | Yamana's expectations relating to the acquisition of the Mega Precious assets and the potential realizable value of such assets; |
| |
| • | Yamana's expectations relating to the performance of the Canadian Malartic Mine; |
| |
| • | the Company's investments and development of infrastructure improvements to enhance community relations in the locations where it operates and the further development of the Company's social responsibility programs; |
| |
| • | the payment of any future dividends; |
| |
| • | the outcome of any current or pending litigation against the Company; and |
| |
| • | the outcome of any current or pending tax assessments involving the Company. |
Forward-looking statements are based on the opinions, assumptions and estimates of management considered reasonable at the date the statements are made, and are inherently subject to a variety of risks and uncertainties and other known and unknown factors that could cause actual events or results to differ materially from those projected in the forward-looking statements. These factors include the impact of general domestic and foreign business, economic and political conditions, global liquidity and credit availability on the timing of cash flows and the values of assets and liabilities based on projected future conditions, fluctuating metal prices (such as gold, copper, silver and zinc), currency exchange rates (such as the Brazilian real, the Chilean peso, the Argentine peso, the Mexican peso and the Canadian dollar versus the United States dollar), interest rates, possible variations in ore grade or recovery rates, changes in the Company’s hedging program, changes in accounting policies, changes in Mineral Resources (as defined herein) and Mineral Reserves (as defined herein), and risks related to acquisitions and/or dispositions, changes in project parameters as plans continue to be refined, changes in project development, construction, production and commissioning time frames, risks related to joint venture operations, the possibility of project cost overruns or unanticipated costs and expenses, potential impairment charges, higher prices for fuel, steel, power, labour and other consumables contributing to higher costs and general risks of the mining industry, including but not limited to, failure of plant, equipment or processes to operate as anticipated, unexpected changes in mine life, final pricing for concentrate sales, unanticipated results of future studies, seasonality and unanticipated weather changes, costs and timing of the development of new deposits, success of exploration activities, permitting timelines, environmental and government regulation and the risk of government expropriation or nationalization of mining operations, risks related to relying on local advisors and consultants in foreign jurisdictions, environmental risks, unanticipated reclamation expenses, title disputes or claims, limitations on insurance coverage and timing and possible outcome of pending and outstanding litigation and labour disputes, risks related to enforcing legal rights in foreign jurisdictions, vulnerability of information systems, as well as those risk factors discussed or referred to herein and in the Company’s annual management’s discussion and analysis filed with the securities regulatory authorities in all provinces of Canada and available under the Company’s SEDAR profile at www.sedar.com. Although the Company has attempted to identify important factors that could cause actual actions, events or results to differ materially from those described in forward-looking statements, there may be other factors that cause actions, events or results not to be anticipated, estimated or intended. There can be no assurance that forward-looking statements will prove to be accurate, as actual results and future events could differ materially from those anticipated in such statements. The Company undertakes no obligation to update forward-looking statements if circumstances or management’s estimates, assumptions or opinions should change, except as required by applicable law. The reader is cautioned not to place undue reliance on forward-looking statements. The forward-looking information contained herein is presented for the purpose of assisting investors in understanding the Company’s expected financial and operational performance and results as at and for the periods ended on the dates presented in the Company’s plans and objectives and may not be appropriate for other purposes.
Cautionary Note to United States Investors Concerning Estimates of Mineral Reserves and Mineral Resources
This annual information form has been prepared in accordance with the requirements of the securities laws in effect in Canada, which differ in certain material respects from the disclosure requirements of United States securities laws. The terms “Mineral Reserve”, “Proven Mineral Reserve” and “Probable Mineral Reserve” are Canadian mining terms as defined in accordance with Canadian National Instrument 43-101 Standards of Disclosure for Mineral Projects (“NI 43-101”) and the Canadian Institute of Mining, Metallurgy and Petroleum (the “CIM”) - CIM Definition Standards on Mineral Resources and Mineral Reserves, adopted by the CIM Council, as amended (the “CIM Standards”). These definitions differ significantly from the definitions in the disclosure requirements promulgated by the Securities and Exchange Commission (the “Commission”) and contained in Industry Guide 7 (“Industry Guide 7”) under the United States Securities Act of 1933, as amended (the “Securities Act”). In particular, under Industry Guide 7 standards, a “final” or “bankable” feasibility study is required to report Mineral Reserves, the three-year historical average price is used in any Mineral Reserve or cash flow analysis to designate Mineral Reserves and the primary environmental analysis or report must be filed with the appropriate governmental authority. In addition, Industry Guide 7 applies different standards in order to classify mineralization as a mineral reserve. As a result, the definitions of Proven Mineral Reserves (as defined herein) and Probable Mineral Reserves (as defined herein) used in NI 43-101 differ from the definitions used in Industry Guide 7. Under Commission standards, mineralization may not be classified as a mineral reserve unless the determination has been made that the mineralization could be economically and legally produced or extracted at the time the mineral reserve determination is made. Among other things, all necessary permits would be required to be in hand or the issuance must be imminent in order to classify mineralized material as mineral reserves under the Commission’s standards. Accordingly, Mineral Reserve estimates contained in this annual information form may not qualify as mineral reserves under Commission standards.
In addition, the terms “Mineral Resource”, “Measured Mineral Resource”, “Indicated Mineral Resource” and “Inferred Mineral Resource” are defined in and required to be disclosed by NI 43-101. However, the Commission does not recognize Mineral Resources and United States companies are generally not permitted to disclose Mineral Resources of any category in documents they file with the Commission. Investors are cautioned not to assume that any part or all of the mineral deposits in these categories will ever be converted into Mineral Reserves as defined in NI 43-101 or Industry Guide 7. Further, Inferred Mineral Resources (as defined herein) have a great amount of uncertainty as to their existence, and great uncertainty as to their economic and legal feasibility. Under Canadian rules, estimates of Inferred Mineral Resources may not form the basis of feasibility or pre-feasibility studies. Investors are cautioned not to assume that all or any part of an Inferred Mineral Resource exists or is economically or legally mineable, or that all or any part of Measured Mineral Resources (as defined herein), Indicated Mineral Resources (as defined herein), or Inferred Mineral Resources will ever be upgraded to a higher category. In addition, disclosure of “contained ounces” in a Mineral Resource is permitted disclosure under Canadian regulations. In contrast, the Commission only permits United States companies to report mineralization that does not constitute Mineral Reserves by Commission standards as in place tonnage and grade, without reference to unit measures. Investors are cautioned that information contained in this annual information form may not be comparable to similar information made public by United States companies subject to the reporting and disclosure requirements under the United States federal securities laws and the rules and regulations of the Commission thereunder.
Currency Presentation And Exchange Rate Information
This annual information form contains references to both United States dollars and Canadian dollars. All dollar amounts referenced, unless otherwise indicated, are expressed in United States dollars and Canadian dollars are referred to as “Canadian dollars” or “Cdn$”.
The closing, high, low and average exchange rates for the United States dollar in terms of Canadian dollars for the years ended December 31, 2015, December 31, 2014, December 31, 2013, and December 31, 2012based on the noon spot rate reported by the Bank of Canada, were as follows:
|
| | | | |
| | Year-Ended December 31 |
| | 2015 | 2014 | 2013 | 2012 |
| Closing | Cdn$1.38 | Cdn$1.16 | Cdn$1.06 | Cdn$0.99 |
| High | 1.40 | 1.16 | 1.07 | 1.04 |
| Low | 1.17 | 1.06 | 0.98 | 0.97 |
Average(1) | 1.28 | 1.10 | 1.03 | 1.00 |
| | | | | |
(1)Calculated as an average of the daily noon rates for each period.
On March 29, 2016, the Bank of Canada noon rate of exchange was $1.00 = Cdn$1.32 or Cdn$1.00 = $0.76.
ITEM 2
CORPORATE STRUCTURE
Yamana Gold Inc. (the “Company” or “Yamana”) was continued under the Canada Business Corporations Act by Articles of Continuance dated February 7, 1995. On February 7, 2001, pursuant to Articles of Amendment, the Company created and authorized the issuance of a maximum of 8,000,000 first preference shares, Series 1. On July 30, 2003, pursuant to Articles of Amendment, the name of the Company was changed from Yamana Resources Inc. to Yamana Gold Inc. On August 12, 2003, the authorized capital of the Company was altered by consolidating all of the then issued and outstanding common shares of the Company on the basis of one new common share for 27.86 existing common shares.
The Company’s head office is located at 200 Bay Street, Royal Bank Plaza, North Tower, Suite 2200, Toronto, Ontario M5J 2J3 and its registered office is located at 2100 Scotia Plaza, 40 King Street West, Toronto, Ontario M5H 3C2.
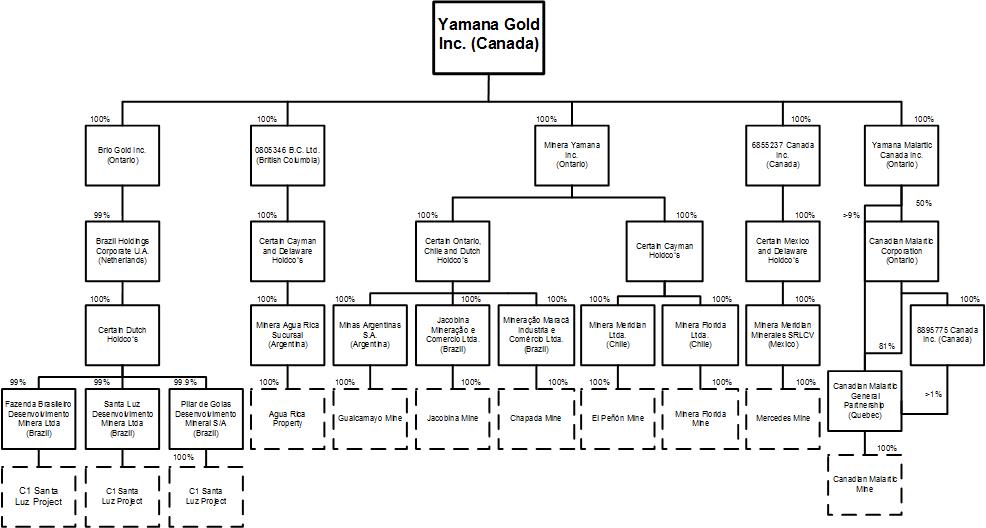
The corporate chart that follows on the next page illustrates the Company’s principal subsidiaries (collectively, the “Subsidiaries”) as of March 29, 2016, together with the jurisdiction of incorporation of each company and the percentage of voting securities beneficially owned, controlled or directed, directly or indirectly, by the Company. As used in this annual information form, except as otherwise required by the context, reference to the “Company” or “Yamana” means Yamana Gold Inc. and the Subsidiaries.
ITEM 3
GENERAL DEVELOPMENT OF THE BUSINESS
Overview of Business
Yamana is a Canadian-based gold producer with significant gold production, gold development stage properties, exploration properties and land positions in Brazil, Chile, Argentina, Mexico and Canada. Yamana plans to continue to build on this base through existing operating mine expansions, throughput increases, development of new mines, advancement of its exploration properties and by targeting other gold consolidation opportunities with a primary focus in the Americas.
The Company’s portfolio includes nine operating gold mines and various advanced and near development stage projects and exploration properties in Brazil, Chile, Argentina, Mexico and Canada. Yamana operates its mines and projects in three distinct, semiautonomous divisions under common corporate oversight: (i) Northern Operations, which includes, among other earlier stage projects, Canadian Malartic (gold/silver) and Mercedes (gold/silver); (ii) Southern Operations, which includes, among other earlier stage projects, Chapada (copper/gold), El Peñón (gold/silver), Gualcamayo (gold), Minera Florida (gold/silver/zinc) and Jacobina (gold); and (iii) Brio Gold Inc. (“Brio Gold”), the Company’s subsidiary which holds Pilar (gold), Fazenda Brasileiro (gold), C1 Santa Luz (gold), and some related exploration concessions. Within this structure, Chapada, El Peñón and Canadian Malartic are the Company’s material producing mines and, as the largest contributors to cash flow, are considered to be “Cornerstone Mines.”
Set out below is a list of Yamana’s main properties and mines:
Material Producing “Cornerstone” Mines
Chapada Mine (Brazil)
El Peñón Mine (Chile)
Canadian Malartic Mine (Canada) - 50% indirect interest
Other Producing Mines
Gualcamayo Mine (Argentina)
Jacobina Mining Complex (Brazil)
Minera Florida Mine (Chile)
Mercedes Mine (Mexico)
Fazenda Brasileiro Mine (Brazil)
Pilar Mine (Brazil)
Additional Projects
C1 Santa Luz Project (Brazil)
Cerro Moro Project (Argentina)
Agua Rica Project (Argentina)
Suyai Project (Argentina)
Monument Bay Project (Canada)
Alumbrera Mine (Argentina) - 12.5% indirect interest
History
Over the three most recently completed financial years, the following events contributed materially to the development of the Company’s business:
Brio Gold
On December 10, 2014, the Company provided an update on strategic initiatives relating to the Fazenda Brasileiro Mine, the Pilar Mine and the C1 Santa Luz Project. The Company subsequently structured its intercorporate holdings to form a new 100%-owned subsidiary company, Brio Gold, to hold these assets as well as some related exploration concessions. A new management team has carried on efforts of operational improvements and optimizations of the Brio Gold assets, with initial working capital in the form of a bridge loan of up to $10 million provided by Yamana. This allows Yamana’s senior
management to focus on the Company’s cornerstone and other mines while providing guidelines and general oversight to the new management of the Brio Gold assets. This approach segregates the Company’s portfolios, better focuses its efforts and allows management, in the fullness of time, to evaluate how to best maximize value of this portfolio of assets. See “Description of the Business - Other Producing Mines”.
On December 21, 2015, the Company announced that it had decided to suspend efforts relating to the monetization of Brio Gold and continue to hold the Brio Gold assets within the Yamana portfolio of assets and manage Brio Gold as a separate division within Yamana until the Company determines the most effective value enhancing strategy for this unit.
On February 17, 2016, Brio Gold entered into an Assignment and Assumption Agreement and a Restructuring Agreement pursuant to which it would acquire all right, title and interests in the Riachos dos Machados gold mine (“RDM”) in Minas Gerais State from Macquarie Bank and Carpathian Gold for approximately $51 million in total consideration, subject to certain adjustments, including expenses. Various external funding alternatives are being considered by the Company with respect to this transaction which would be expected to be completed by March 31, 2016. Previously, on December 21, 2015, the Company had announced that in the context of current market conditions and in consideration of recent positive operational developments at Brio Gold, the Company would suspend efforts relating to the monetization of Brio Gold as the Company concluded that in the short and intermediate term, the division carries more value in the Company. At this time, there are no final decisions made with respect to the monetization of all or any portion of this division. See “Description of the Business - Other Producing Mines”.
2016 Management Update
On February 18, 2016, the Company announced the pending retirement of Charles Main, Executive Vice President, Finance and Chief Financial Officer (“CFO”) effective the end of February 2017. Accordingly, Jason LeBlanc will transition to the role of CFO. Mr. LeBlanc was thus promoted to Senior Vice President, Finance as an interim step. Mr. LeBlanc joined the Company in January 2006 and has over 15 years of research-based and financial experience in the mining industry. During his time at Yamana, Mr. LeBlanc has held increasingly senior positions including most recently the position of Vice President, Finance and Treasurer since 2009. Mr. LeBlanc has a Master of Finance from the University of Toronto, a Bachelor of Commerce from the University of Windsor and holds a Chartered Financial Analyst designation.
Also on February 18, 2016, Mr. Greg McKnight was promoted into the role of Executive Vice President, Business Development. He previously held the role of Senior Vice President, Business Development of the Company. He is currently managing the Company's investor relations in addition to business development.
Dividend Policy
In January 2016, the Company’s board of directors amended the Company’s dividend policy to set the quarterly dividends paid per common share at $0.02 annually, beginning with the declaration and payment of the first quarter 2016 dividend. Payment of any future dividends will be at the discretion of the Company’s board of directors after taking into account many factors, including the Company’s operating results, financial condition, comparability of the dividend yield to peer group gold companies and current and anticipated cash needs.
Copper Hedge Program
As at December 31, 2015, the Company had 42 million pounds of copper forward contracts in place for the first half of 2016 at an average sales price of $2.20 per pound.
Sandstorm Gold Transactions
On October 27, 2015, the Company announced that it had entered into three metal purchase agreements with Sandstorm Gold Ltd. (“Sandstorm”), for which Sandstorm paid the Company total cash payments of $148 million and issued the Company 15 million common share purchase warrants with a five year term and strike price of $3.50. The warrants are exercisable when the Company has incurred an additional $40 million in capital expenditures in respect of the development and construction of the Cerro Moro mine. Sandstorm will also pay the Company an additional cash payment of $4 million in April 2016. The metal purchase agreements include a silver purchase contract related to production from Cerro Moro, Minera Florida and Chapada, a copper purchase transaction related to production from Chapada, and a gold purchase transaction related to production from Agua Rica. All amounts received will be used by the Company to reduce the balance outstanding on its revolving credit facility.
Cerro Moro Construction Decision
The Company announced, in early 2015, the formal decision to proceed with the construction of Cerro Moro and provided updated project parameters with respect to timing and capital investment. During the course of 2015, detailed engineering for the 1,000 tonnes per day processing plant and mine was advanced to approximately 50% completion, in line with the published project execution schedule. Included in the 2015 work program was the upgrading and extension of the site access road, conclusion of the locked-cycle metallurgical test work program, the placement of orders on various long-lead time items such as the tailings thickeners, and the continuation of the first stage of the construction camp.
See “Description of the Business - Additional Projects - Cerro Moro Project”.
Mega Precious - Acquisition
On June 22, 2015, the Company acquired all of the issued and outstanding common shares of Mega Precious Metals Inc. (“Mega Precious”). Mega Precious was a Canadian-based exploration company with a high quality pipeline of projects located in Manitoba, Northwestern Ontario and Nunavut. The most significant and advanced project is the Monument Bay gold/tungsten project located in northeastern Manitoba. The transaction is expected to advance the Company’s strategy to expand its presence in Canada.
Total consideration paid for the acquisition of Mega Precious was $14.5 million which consisted of approximately $0.2 million in cash, $14.0 million in Yamana common shares (4,366,675 shares) and transaction costs. Each Mega Precious shareholder received $0.068 per share comprised of Cdn$0.001 in cash and 0.02092 of a Yamana common share for each Mega common share held. As part of the acquisition and included in the total consideration paid, the Company acquired the convertible notes of Pacific Road Capital II Pty Limited, as trustee for Pacific Road Resources Fund II, and Pacific Road Capital Management GP II Limited, as general partner of Pacific Road Resources Fund II L.P. (collectively, “Pacific Road”) totaling $2.4 million, and issued 744,187 Yamana common shares at $3.21 per share, which concurrently terminated the existing agreement between Pacific Road and Mega Precious.
Dividend Reinvestment Plan
On February 18, 2015, the Company announced the implementation of a dividend reinvestment plan (the “DRIP”), effective for the first quarter dividend of 2015 forward, which provides eligible holders of the Company’s common shares with the option of reinvesting all or a portion of the dividends paid to them as shareholders (less any withholding tax) to purchase additional common shares of the Company. Participation in the DRIP is optional. The common shares acquired on behalf of eligible participants by the DRIP agent, CST Trust Company, will, at the sole option of the Company, be common shares issued from the treasury of the Company or common shares acquired on the open market through the facilities of the Toronto Stock Exchange (the “TSX”), the New York Stock Exchange (the “NYSE”) or any other stock exchange on which the common shares of the Company are then listed (each a “Listed Market”). The purchase price of the common shares purchased under the DRIP shall be the volume weighted average price of the common shares on the applicable Listed Market for the five (5) trading days preceding the dividend payment date.
Public Offering
On February 3, 2015, the Company closed a bought deal offering (the “Public Offering”) of common shares of the Company. A total of 56,465,000 common shares were issued at a price of Cdn$5.30 per share, for aggregate gross proceeds of Cdn$299,264,500 (which included the full exercise by the underwriters of the over-allotment option for 7,365,000 common shares). The common shares of the Company were sold pursuant to an underwriting agreement (the “Underwriting Agreement”) dated January 15, 2015 between the Company and a syndicate of underwriters led by Canaccord Genuity Corp. and National Bank Financial Inc., and including CIBC World Markets Inc., RBC Dominion Securities Inc., Scotia Capital Inc., TD Securities Inc., Merrill Lynch Canada Inc., Credit Suisse Securities (Canada), Inc., Raymond James Ltd., Citigroup Global Markets Canada Inc., Cormark Securities Inc., Macquarie Capital Markets Canada Ltd., Morgan Stanley Canada Limited, and Barclays Capital Canada Inc. The net proceeds of the Public Offering were used to repay amounts under the Company’s $1 billion revolving credit facility, in order to reduce the Company’s debt position and further strengthen its balance sheet. See “Material Contracts”.
Canadian Malartic Mine - Acquisition
On June 16, 2014, the Company and Agnico Eagle Mines Limited (“Agnico Eagle”) jointly acquired 100% of all issued and outstanding common shares (with each company owning 50%) of Osisko (the “Osisko Acquisition”). Osisko
operated the Canadian Malartic Mine in the Abitibi Gold Belt, immediately south of the Town of Malartic located in the province of Québec, Canada. Additionally, Osisko conducted advanced exploration activities at the Kirkland Lake and Hammond Reef properties in Northern Ontario, Canada and additional exploration projects located in the Americas. Total consideration paid by Yamana consisted of approximately $0.5 billion in cash and $1.0 billion in common shares of the Company (based on a share price of $8.18 per share).
On March 19, 2015, the Company and Agnico through Canadian Malartic GP (as defined herein) jointly acquired the remaining 30% interest in the Malartic CHL prospect from Abitibi Royalties Inc. (“Abitibi”) for total consideration of approximately C$57 million in shares and a 3.0% net smelter return royalty on the Malartic CHL prospect. The Company issued a total of 3,549,695 common shares at $3.63 (Cdn$4.63) for its portion of the consideration. Following the completion of the transaction, Canadian Malartic GP holds a 100% interest in the Malartic CHL prospect.
Strategic Initiatives Update
On September 10, 2014, the Company announced that, after careful and extensive review, and having allowed a sufficient period of time for optimization efforts, the optimal plan for its C1 Santa Luz Project would be to temporarily suspend ramp-up activities and put the project on care and maintenance while several identified alternative metallurgical processes are evaluated. During 2015, a modified process flowsheet was identified and a detailed metallurgical testwork program was completed with the results of this work incorporated into a Preliminary Economic assessment. See “Description of the Business - Additional Projects - C1 Santa Luz Project”.
In October 2014, the Company entered into a Memorandum of Understanding (“MOU”) with the provincial Government of Catamarca, Argentina (the “Catamarca Government”), represented by the provincial mining company Catamarca Mineria y Energetica Sociedad del Estado (“CAMYEN”), with respect to the creation of the Catamarca Mining District. The MOU established the groundwork for the Company and the Catamarca Government to work together to consolidate important mining projects and prospective properties in the province, currently consisting of the Agua Rica Project and the Cerro Atajo prospect. On February 27, 2015, a formal agreement was entered into among the parties to the MOU. This agreement forms the basis of a working relationship between the Catamarca Government through CAMYEN, other mining companies and the Company and is expected to help advance the Agua Rica Project and the Cerro Atajo prospect. The formal agreement also establishes a maximum ownership interest of up to 5% for CAMYEN of a combined entity, including the Agua Rica Project and Cerro Atajo prospect, and some exploration and infrastructure spending during the term of the agreement. The formal agreement does not restrict the Company’s ability to continue with Agua Rica, although it provides a framework of cooperation that would see Agua Rica advance to development more efficiently and on an expedited timeline. Presently, the Company is considering the development of Agua Rica in conjunction with other financial and mining industry participants. See “Description of the Business - Additional Projects - Agua Rica Project”.
Board and Management Updates
On September 2, 2014, the Company announced the appointment of two new directors to the board of directors, namely Christiane Bergevin and Jane Sadowsky. The Company also announced additions to its senior management team which reflect an important pivot in the focus of management and supplemented existing management. Daniel Racine was appointed Senior Vice President, Northern Operations, which better aligns the Company’s technical and jurisdictional expertise with its property portfolio that now includes the Canadian Malartic Mine, Kirkland Lake and other Canadian exploration assets. Barry Murphy was appointed as Senior Vice President, Technical Services, which the Company believes increases the technical depth of its management as the Company continues to advance its development projects.
On April 28, 2015, the Company announced the appointment of Ross Gallinger as Senior Vice President, Health, Safety and Sustainable Development. Mr. Gallinger is responsible for the oversight, strategic development, delivery and management of the Company’s health, safety, environment and community policies, programs, and activities to ensure the effectiveness of such programs with the objective to improve the Company’s overall performance.
Note Exchange Offer
On June 30, 2014, the Company issued $500 million aggregate principal amount of 4.95% Senior Notes due 2024 (the “Initial Notes”) in a transaction that was exempt from registration under the Securities Act, and resold to qualified institutional buyers in reliance on Rule 144A and non-U.S. persons outside the United States in reliance on Regulation S. In connection with the issuance of the Initial Notes, the Company entered into a registration rights agreement, dated as of June 30, 2014, with the initial purchasers of the Initial Notes, providing for the issuance of new notes in exchange for a like aggregate principal amount of Initial Notes. Subsequently, in October 2014, the Company commenced an exchange offer
which expired on November 20, 2014, pursuant to which new notes (the “New Notes”) were issued in exchange for an equal aggregate principal amount of outstanding Initial Notes validly tendered and accepted in the exchange offer. The terms of the New Notes are substantially identical to the terms of the Initial Notes, except that, among other things, the New Notes are registered under the Securities Act and do not contain restrictions on transfer.
In connection with the issuance of the Initial Notes, the Company entered into a trust indenture, dated as of June 30, 2014, as supplemented by the first supplemental indenture dated as of June 30, 2014 (collectively, the “Indenture”). Pursuant to the terms of the Indenture, the New Notes are unsecured, unsubordinated obligations of Yamana evidencing the same continuing indebtedness as the Initial Notes and will mature on July 15, 2024. The New Notes bear interest at the rate of 4.95% per annum from and including the most recent interest payment date to which interest has been paid or provided for, or if no interest has been paid or provided for, from June 30, 2014. Interest on the New Notes is payable semi-annually in arrears on January 15 and July 15 of each year, beginning on January 15, 2015, to the persons in whose names the New Notes are registered at the close of business on the preceding January 1 or July 1, as the case may be. See “Material Contracts”.
ITEM 4
DESCRIPTION OF THE BUSINESSDESCRIPTION OF THE BUSINESS
Yamana is a Canadian-based gold producer with significant gold production, gold development stage properties, exploration properties and land positions in Brazil, Chile, Argentina, Mexico and Canada. Yamana plans to continue to build on this base through existing operating mine expansions, throughput increases, development of new mines, advancement of its exploration properties and by targeting other gold consolidation opportunities with a primary focus in the Americas.
Principal Products
The Company’s principal product is gold, with gold production forming a significant part of revenues. There is a global gold market into which Yamana can sell its gold and, as a result, the Company is not dependent on a particular purchaser with regard to the sale of the gold that it produces.
The Company produces gold-copper concentrate at its Chapada Mine, gold and silver doré bars at its El Peñón Mine and Mercedes Mine, gold doré bars at its Jacobina Mining Complex (the “JMC”), Gualcamayo Mine, Pilar Mine and Fazenda Brasileiro Mine, and gold and silver doré bars and zinc concentrate at its Minera Florida Mine. Additionally, the Company has a 50% indirect interest in the Canadian Malartic Mine which produces gold and silver doré bars, and a 12.5% indirect interest in the Alumbrera Mine which produces copper and gold concentrate and gold doré bars. The Company has contracts with a number of smelters, refineries and trading companies to sell gold and silver doré and gold-copper and zinc concentrate.
Competitive Conditions
The precious metal mineral exploration and mining business is a competitive business. The Company competes with numerous other companies and individuals in the search for and the acquisition of attractive precious metal mineral properties. The ability of the Company to acquire precious metal mineral properties in the future will depend not only on its ability to develop its present properties, but also on its ability to select and acquire suitable producing properties or prospects for precious metal development or mineral exploration.
Operations
Employees
As at December 31, 2015, the Company had the following employees and contractors at its operations:
|
| | | |
| Country | Employees | Contractors | Total |
| Canada, Corporate | 117 | 12 | 129 |
| Canada, Canadian Malartic (50% indirect interest) | 740 | 41 | 781 |
| Argentina | 1,054 | 359 | 1,413 |
| Brazil | 2,639 | 2,633 | 5,272 |
| Chile | 1,812 | 2,207 | 4,019 |
| Mexico | 469 | 270 | 739 |
| United States | 14 | 5 | 19 |
Domestic and Foreign Operations
The Company’s mine and mineral projects are located in Brazil, Chile, Argentina, Mexico and Canada. See “General Development of the Business - Overview of Business” for a summary of the Company’s projects. Any changes in regulations or shifts in political attitudes in any of these jurisdictions, or other jurisdictions in which Yamana has projects from time to time, are beyond the control of the Company and may adversely affect its business. Future development and operations may be affected in varying degrees by such factors as government regulations (or changes thereto) with respect to the restrictions on production, export controls, income taxes, expropriation of property, repatriation of profits, environmental legislation, land use, water use, land claims of local people, mine safety and receipt of necessary permits. The effect of these factors cannot be accurately predicted. See “- Risks of the Business”.
Environment and Communities
Protecting the environment and maintaining a social license with the communities where the Company operates is integral to the success of the Company. As required in local legislation and other requirements, Environmental and Social Impact assessments are developed for new operations to identify potentially significant environment and social impacts and to avoid, manage and mitigate impacts as identified.
Yamana’s operating mine sites seek to adopt the best environmental practices programs to manage environmental matters and compliance with local and international legislation. Programs include: promotion of rational water use; solid waste management; control of emissions and fossil fuel consumption; energy conservation; soil and biodiversity protection; archaeological sites identification, preservation and monitoring; environmental education; surface and groundwater monitoring; air monitoring; land reclamation and revegetation; native seedlings production; and native forest conservation.
In common with other natural resources and mineral processing companies, the Company’s operations generate hazardous and non-hazardous waste, effluent and emissions into the atmosphere, water and soil in compliance with local and international regulations and standards. There are numerous environmental laws in Brazil, Chile, Argentina, Mexico, the United States, Canada and elsewhere in the Americas that apply to the Company’s operations, exploration, development projects and land holdings. These laws address such matters as protection of the natural environment, air and water quality, emissions standards and disposal of waste.
Yamana has mapped all environmental risks at its mine sites as part of the “Yamana Management System” (“YMS”). High level risks, including those associated with tailings dam facilities, waste rock dumps, heap leach piles or cyanide usage, have enhanced and specific management measures in order to be better able to mitigate potential failures, spills or slides. These systems are based on the permanent monitoring of the particular structure, using specific tools that assist in monitoring such risks. In addition, reports on tailings dam facilities are prepared by third party consultants on a monthly basis and reviewed periodically by the Company. See “- Risks of the Business”.
To ensure that the identified risks are managed, the mitigation from environmental and social impact assessments are implemented, and that systems for compliance with permits, regulations and commitments are in place, Yamana implements a number of management systems at its wholly owned operations. Sites have ISO 14001 Environmental Management System and OHSAS 18001 Occupational Health and Safety Management System certifications established. Additionally, Yamana has implemented policies and standards incorporating international best practices and standards. The YMS has been maturing since 2006.
The YMS incorporates: corporate policies, standards and procedures; risk assessment; identification of all legal and contractual requirements; definition of Company objectives and targets; and also includes internal auditing systems to ensure that Yamana operates in compliance with its policies and management programs. The implementation of the YMS commenced
in Brazil in 2007 and in Chile in 2008. Yamana has continued to consolidate YMS across existing operations and has extended this consolidation to both exploration and construction areas. In order to verify compliance with the YMS, internal corporate audits have been conducted at each mine site, exploration project and construction project since 2009. Over the last six years the compliance with YMS increased 15.5%, including an increase from 87.8% compliance in 2014 to 100% compliance in 2015. Additionally, there were no significant environmental spills or incidents in 2015.
Geomechanical, geotechnical and geochemical risks are also assessed periodically by third party consultants in order to minimize related risks, such as rock falls, or environmental contamination. These, and other high level risks, are dealt with as part of Yamana’s emergency response plan with emergency simulation tests being conducted during the year to evaluate the plan’s effectiveness. See “- Risks of the Business”.
Wholly owned operations which use cyanide for the extraction of gold are signatories to the International Cyanide Management Code, used to ensure the safe transport and use of cyanide in the production of gold. Conformance with the code is verified by independent audits, with the results posted on the ICMI website (www.cyanidecode.org). Our wholly owned operations currently conform to the cyanide management code. See “- Risks of the Business”.
Each of the Company’s mining operations has established a Health, Safety, Environment and Community committee (collectively, the “HSEC Committees”) which are chaired by the General Manager at each mine. The HSEC Committees meet at least once a month to discuss issues and solutions related to HSEC relations and other operational practices. The goal of each HSEC Committee is to monitor the effectiveness and performance of the Company’s sustainability programs.
The Company has also made several investments in connection with infrastructure improvements to enhance community relations in the locations where it operates. The Company’s social responsibility programs are focused on local development, income generation and improvements in quality of life in the local communities. Through programs such as the Partnership Seminar Program, the Integration Program and the Open Doors Program, Yamana has provided support to local communities in many different areas such as education, culture, health, environment and the generation of employment and income. To further develop these programs, the Company conducts various education projects and cultural activities in each of the communities where the Company operates.
The Sustainability Committee of the Board of Directors reviews the sustainable development, environmental, health and safety policies, principles, practices and processes, and monitor and review regulatory issues related to sustainable development, environment, health and safety.
Yamana was recognized as the Argentinian Mining Company of the Year by an advisory committee of Panorama Minero Magazine in Buenos Aires at the end of November 2015 The award, which was presented at a Gala on the 1st of December 2015, recognized the company for its steady growth at Gualcamayo, continued advancement of Cerro Moro and its extensive and collaborative community relations work around the Suyai project in Esquel.
Other Disclosure Relating to Ontario Securities Commission Requirements for Companies Operating in Emerging Markets
Due to the risks inherent in mineral production and the desire to organize and structure its affairs in a tax efficient manner, the Company holds each of its material properties in a separate corporate entity (through local subsidiary companies in foreign jurisdictions and other holding companies in various jurisdictions).
The risks of the corporate structure of the Company and its subsidiaries are risks that are typical and inherent for Company’s who have material assets and property interests held indirectly through foreign subsidiaries and located in foreign jurisdictions. The Company’s business and operations in emerging markets are exposed to various levels of political, economic and other risks and uncertainties associated with operating in a foreign jurisdiction such as difference in laws, business cultures and practices, banking systems and internal control over financial reporting. See below under “Risks of the Business”.
The Company has implemented a system of corporate governance, internal controls over financial reporting and disclosure controls and procedures that apply at all levels of the Company and its subsidiaries. These systems are overseen by the Company’s board of directors, and implemented by the Company’s senior management. The relevant features of these systems are set out below.
Control over Foreign Subsidiaries
The Company controls its foreign subsidiaries by virtue of corporate oversight and by its ownership of 100% of the shares issued by such entities (exclusive of non-material subsidiaries). The Company’s management has the (i) power to appoint and dismiss, at any time, any and all of the foreign subsidiaries’ officers and directors, (ii) power to instruct the foreign subsidiaries’ officers to pursue business activities in accordance with the Company’s wishes, and (iii) legal right, as a shareholder, to require the officers of each such foreign subsidiaries to comply with their fiduciary obligations. The Company can also enforce its rights by way of various shareholder remedies available to it under local laws. As a result, the management of the Company can effectively align its business objectives with those of the foreign subsidiaries and implement such objectives at the subsidiary level.
Board and Management Expertise
A majority of the Company’s directors have been directors for a period in excess of five years. Likewise, a majority of the Company’s senior officers have at least five years of experience in senior leadership positions with the Company. As a result of their tenure, these officers and directors have gained extensive experience conducting business in the emerging jurisdictions. Please see the biographical information on pages 81 of this AIF for further information on the senior officers’ and directors’ experience.
In addition, the board of directors, through its corporate governance practices, regularly receives management and technical updates and progress reports in connection with the foreign subsidiaries, and in so doing, maintains effective oversight of their business and operations. Further, the Company’s directors and senior officers visit the Company’s operations in foreign jurisdictions on a regular basis in order to ensure effective control and management of the Company’s foreign operations. During these visits they come into contact with local employees, government officials and business persons; such interactions enhance the visiting directors’ and officers’ knowledge of local culture and business practices. Generally, the Company’s directors visit at least one of the Company’s operations in each calendar year, on a rotating basis. Certain senior and non-senior officers visit the Company’s operations quarterly, or more frequently if circumstances require, on a rotating basis.
Internal Control Over Financial Reporting and Funds
The Company maintains internal control over financial reporting with respect to its operations in emerging jurisdictions by taking various measures. Several of the Company’s Vice Presidents have the relevant language proficiency (Spanish and Brazilian Portuguese), local cultural understanding and relevant work experience in each of the Company’s operating jurisdictions which facilitates better understanding and oversight of the Company’s operations in the foreign jurisdictions in the context of internal controls over financial reporting.
Pursuant to the requirements of NI 52-109, the Company assesses the design of its internal controls over financial reporting on an annual basis. Furthermore, key controls for the accounts in scope are tested across the Company on an annual basis and the working papers of these tests performed at all the locations are reviewed at the head office level. Please refer to the Company’s annual audited consolidated financial statements for the year ended December 31, 2015, as filed under the Company’s profile on SEDAR and on the Company’s website.
Differences in banking systems and controls between Canada and the emerging jurisdictions are addressed by having stringent controls over cash in all locations; especially over access to cash, cash disbursements, appropriate authorization levels, performing and reviewing bank reconciliations in the applicable jurisdiction on at least a monthly basis and the segregation of duties.
The difference in cultures and practices between Canada and the emerging jurisdictions is addressed by employing competent staff in Canada and the emerging jurisdictions who are familiar with the local laws, business culture and standard practices, have local language proficiency, are experienced in working in the applicable emerging jurisdiction and in dealing with the respective government authorities; and have experience and knowledge of the local banking systems and treasury requirements.
The foreign subsidiaries’ also have established practices, protocols and routines in place for the distribution of its excess cash to its foreign owners. Furthermore, the opening and closing of bank accounts in the name of a foreign subsidiary is controlled, overseen and approved by the Company’s Executive Vice President, Finance and Chief Financial Officer and/or the Company’s Senior Vice President Finance and the Treasurer.
The Company ensures the flow of funds between Canada and each emerging jurisdiction functions as intended by:
| |
| • | appointing common officers of the Company and the foreign subsidiary; |
| |
| • | involving the Company’s Chief Financial Officer, located in Toronto, in hiring key finance personnel in each of the emerging jurisdictions; and |
| |
| • | closely monitoring the finance departments in each of the emerging jurisdictions, and by regular personal visits by the Chief Financial Officer and other key executives to the emerging jurisdictions. |
Communication
The Company maintains open communication with each of its foreign operations through many senior and non-senior officers who are fluent in either Brazilian Portuguese or Spanish, as applicable. In addition, all management team members in local jurisdictions are fluent in the jurisdiction’s primary language and are proficient in English. The primary language used in management and Board meetings is English and material documents relating to the Company that are provided to the Board are in English. The Company does not currently have a formal communication plan or policy in place and has not to date, experienced any communication-related issues.
Records
All of the minute books and corporate records and documents of the foreign subsidiaries are filed at the relevant entity’s headquarters, and with the relevant governmental or regulatory body in each applicable jurisdiction in which the applicable entity’s headquarters are located. The custodians of such documents report directly to the Company’s head office and senior management team to ensure continued oversight.
Risks of the Business
The operations of the Company are speculative due to the high-risk nature of its business, which is the acquisition, financing, exploration, development and operation of mining properties. These risk factors could materially affect the Company’s future operating results and could cause actual events to differ materially from those described in forward-looking statements relating to the Company.
Gold, Copper and Silver Prices
The Company’s profitability and long-term viability depend, in large part, upon the market prices of metals that may be produced from its properties, primarily gold, copper and silver. Market price fluctuations of these commodities could adversely affect profitability of the Company’s operations and lead to impairments and write downs of mineral properties. Metal prices fluctuate widely and are affected by numerous factors beyond the Company’s control, including:
| |
| • | global and regional supply and demand for industrial products containing metals generally; |
| |
| • | changes in global or regional investment or consumption patterns; |
| |
| • | increased production due to new mine developments and improved mining and production methods; |
| |
| • | decreased production due to mine closures; |
| |
| • | interest rates and interest rate expectation; |
| |
| • | expectations with respect to the rate of inflation or deflation; |
| |
| • | fluctuations in the value of the United States dollar and other currencies; |
| |
| • | availability and costs of metal substitutes; |
| |
| • | global or regional political or economic conditions; and |
| |
| • | sales by central banks, holders, speculators and other producers of metals in response to any of the above factors. |
There can be no assurance that metal prices will remain at current levels or that such prices will improve. A decrease in the market prices could adversely affect the profitability of the Company’s existing mines and projects as well as its ability to finance the exploration and development of additional properties, which would have a material adverse effect on the Company’s results of operations, cash flows and financial position. A decline in metal prices may require the Company to write-down Mineral Reserve and Mineral Resource estimates by removing ores from reserves that would not be economically processed at lower metal prices and revise life-of-mine plans (“LOM Plans”), which could result in material write-downs of investments in mining properties. Any of these factors could result in a material adverse effect on the Company’s results of operations, cash flows and financial position. Further, if revenue from metal sales declines, the Company may experience liquidity difficulties. Its cash flow from mining operations may be insufficient to meet its operating needs, and as a result the Company could be forced to discontinue production and could lose its interest in, or be forced to sell, some or all of its properties.
In addition to adversely affecting Mineral Reserve and Mineral Resource estimates and the Company’s results of operations, cash flows and financial position, declining metal prices can impact operations by requiring a reassessment of the feasibility of a particular project. Even if a project is ultimately determined to be economically viable, the need to conduct such a reassessment may cause substantial delays and/or may interrupt operations until the reassessment can be completed, which may have a material adverse effect on the Company’s results of operations, cash flows and financial position. In addition, lower metal prices may require the Company to reduce funds available for exploration with the result that the depleted reserves may not be replaced.
Exploration, Development and Operating Risks
Mining operations are inherently dangerous and generally involve a high degree of risk. Yamana’s operations are subject to all the hazards and risks normally encountered in the exploration, development and production of gold, copper and silver, including, without limitation, unusual and unexpected geologic formations, seismic activity, rock bursts, cave-ins, flooding, pit wall failure and other conditions involved in the drilling and removal of material, any of which could result in damage to, or destruction of, mines and other producing facilities, personal injury or loss of life, damage to property and environmental damage, all of which may result in possible legal liability. Although the Company expects that adequate precautions to minimize risk will be taken, mining operations are subject to hazards such as fire, rock falls, geomechanical issues, equipment failure or failure of retaining dams around tailings disposal areas which may result in environmental pollution and consequent liability. The occurrence of any of these events could result in a prolonged interruption of the Company’s operations that would have a material adverse effect on its business, financial condition, results of operations and prospects.
The exploration for and development of mineral deposits involves significant risks, which even a combination of careful evaluation, experience and knowledge may not eliminate. While the discovery of an ore body may result in substantial rewards, few properties that are explored are ultimately developed into producing mines. Major expenses may be required to locate and establish Mineral Reserves, to develop metallurgical processes and to construct mining and processing facilities at a particular site. It is impossible to ensure that the exploration or development programs planned by Yamana will result in a profitable commercial mining operation. Whether a mineral deposit will be commercially viable depends on a number of factors, some of which are: the particular attributes of the deposit, such as size, grade and proximity to infrastructure; metal prices that are highly cyclical; and government regulations, including regulations relating to prices, taxes, royalties, land tenure, land use, importing and exporting of minerals and environmental protection. The exact effect of these factors cannot be accurately predicted, but the combination of these factors may result in Yamana not receiving an adequate return on invested capital.
There is no certainty that the expenditures made by Yamana towards the search and evaluation of mineral deposits will result in discoveries or development of commercial quantities of ore.
Health, Safety and Environmental Risks and Hazards
Mining, like many other extractive natural resource industries, is subject to potential risks and liabilities due to accidents that could result in serious injury or death and/or material damage to the environment and Company assets. The impact of such accidents could affect the profitability of the operations, cause an interruption to operations, lead to a loss of licenses, affect the reputation of the Company and its ability to obtain further licenses, damage community relations and reduce the perceived appeal of the Company as an employer.
All phases of the Company’s operations are subject to environmental and safety regulations in the various jurisdictions in which it operates. These regulations mandate, among other things, worker safety, water quality, water management, land reclamation, waste disposal (including the generation, transportation, storage and disposal of hazardous waste), mine development and protection of endangered and other special status species. Failure to comply with applicable health, safety and environmental laws and regulations could result in injunctions, fines, suspension or cancellation of permits and approvals and could include other penalties. Health, safety and environmental legislation is evolving in a manner that will require stricter standards and enforcement, increased fines and penalties for non-compliance, more stringent environmental assessments of proposed projects and a heightened degree of responsibility for companies and their officers, directors and employees. There is no assurance that the Company has been or will at all times be in full compliance with all environmental laws and regulations or hold, and be in full compliance with, all required environmental and health and safety permits. Failure to comply with applicable laws, regulations and permitting requirements may result in enforcement actions, including orders issued by regulatory or judicial authorities causing operations to cease or be curtailed, and may include corrective measures requiring capital expenditures, installation of additional equipment, or remedial actions. Parties engaged in mining operations, including the Company, may be required to compensate those suffering loss or damage by
reason of the mining activities and may have civil or criminal fines or penalties imposed for violations of applicable laws or regulations. The potential costs and delays associated with compliance with such laws, regulations and permits could prevent the Company from proceeding with the development of a project or the operation or further development of a project, and any non-compliance therewith may adversely affect the Company’s business, financial condition and results of operations.
Government environmental approvals and permits are currently, or may in the future be, required in connection with the Company’s operations. To the extent such approvals are required and not obtained, the Company may be curtailed or prohibited from proceeding with planned exploration or development of mineral properties.
The Company may also be held financially responsible for remediation of contamination at current or former sites, or at third party sites. The Company could also be held responsible for exposure to hazardous substances. The costs associated with such instances and liabilities could be significant.
The Company has implemented extensive health and safety initiatives at its sites to protect the health and safety of its employees, contractors and communities local to operations; however, there is no assurance that such measures will eliminate the occurrence of accidents or other incidents which may result in personal injuries or damage to property. Such occurrences, in some situations, may yield regulatory fines and/or civil liability.
In some countries where the Company operates, there is a requirement to have a government approved reclamation plan for a mining operation that establishes the Company’s obligation to reclaim property after minerals have been mined from the site. For some countries, bonds or other forms of financial assurance is required to secure the costs to implement reclamation. The Company may incur costs associated with reclamation activities, which may materially exceed the provisions established by the company for the activities. In addition, possible additional future regulatory requirements may require additional reclamation requirements creating uncertainties related to future reclamation costs. Changes in unit costs and exchange rates of local currencies will affect the cost estimates for reclamation. Additionally, when a previously unrecognized reclamation liability becomes known or a previously estimated cost is increased, the amount of that liability or additional cost is expensed, which may materially reduce net income in that period.
In certain jurisdictions, the Company may be required to submit, for government approval, a reclamation plan for each of its mining/project sites. The reclamation plan establishes the Company’s obligation to reclaim property after minerals have been mined from the sites. In some jurisdictions, bonds or other forms of financial assurances are required as security to ensure performance of the required reclamation activities. The Company may incur significant reclamation costs which may materially exceed the provisions the Company has made for such reclamation. In addition, the potential for additional regulatory requirements relating to reclamation or additional reclamation activities may have a material adverse effect on the Company’s financial condition, liquidity or results of operations. When a previously unrecognized reclamation liability becomes known or a previously estimated cost is increased, the amount of that liability or additional cost may be expensed, which may materially reduce net income in that period.
The extraction process for gold and metals can produce tailings, which are the sand like materials which remain from the extraction process. Tailings are stored in engineered facilities which are designed, constructed, operated and closed in conformance with local requirements and best practices. Should a breach of these facilities occur due to extreme weather, seismic event, or other incident, the Company could suffer a material financial impact on the Company and Operations financial condition.
Production at certain of the Company’s mines involves the use of cyanide which is a toxic material if not handled properly. Should cyanide leak or otherwise be discharged from the containment system, the Company could suffer a material impact on its business, financial condition and results of operations. The Company became a signatory to the ICMI cyanide management code in September 2008. Further information regarding the code can be found at the International Cyanide Management Institute website located at www.cyanidecode.org.
The Company actively engages with local communities to provide timely information about the operations and participates in a variety of activities to contribute to the wellbeing of local communities. Health, Safety, Environment or other incidents, real or perceived, could cause community unrest that manifest into protests, road blockages, or other civil disobedience activities that could disrupt the operations. The company could suffer a material impact on its business, financial condition and results of operations.
The mineral exploration activities of the Company are subject to various laws governing prospecting, development, production, taxes, labour standards and occupational health, mine safety, toxic substances and other matters. Although the Company believes that its exploration activities are currently carried out in accordance with all applicable rules and
regulations, new rules and regulations may be enacted or existing rules and regulations may be applied in a manner that could limit or curtail production or development of the Company’s properties. Amendments to current laws and regulations governing the operations and activities of the Company or more stringent implementation thereof could have a material adverse effect on the Company’s business, financial condition and results of operations. See “- Foreign Operations and Political Risk”.
Nature and Climatic Condition Risk
The Company and the mining industry are facing continued geotechnical challenges, which could adversely impact the Company’s production and profitability. Unanticipated adverse geotechnical and hydrological conditions, such as landslides, droughts, pit wall failures and rock fragility may occur in the future and such events may not be detected in advance. Geotechnical instabilities and adverse climatic conditions can be difficult to predict and are often affected by risks and hazards outside of the Company’s control, such as severe weather and considerable rainfall, which may lead to periodic floods, mudslides, wall instability and seismic activity, which may result in slippage of material.
Geotechnical failures could result in limited or restricted access to mine sites, suspension of operations, government investigations, increased monitoring costs, remediation costs, loss of ore and other impacts, which could cause one or more of the Company’s projects to be less profitable than currently anticipated and could result in a material adverse effect on the Company’s results of operations and financial position.
Counterparty, Credit, Liquidity and Interest Rate Risks and Access to Financing
The Company is exposed to various counterparty risks including, but not limited to: (i) financial institutions that hold the Company’s cash and short term investments; (ii) companies that have payables to the Company, including concentrate and bullion customers; (iii) providers of its risk management services (including hedging arrangements); (iv) shipping service providers that move the Company’s material; (v) the Company’s insurance providers; and (vi) the Company’s lenders. The Company seeks to limit counterparty risk by entering into business arrangements with high credit-quality counterparties, limiting the amount of exposure to each counterparty and monitoring the financial condition of counterparties. For cash, cash equivalents and accounts receivable, credit risk is represented by the carrying amount on the balance sheet. For derivatives, the Company assumes no credit risk when the fair value of the instruments is negative. When the fair value of the instruments is positive, this is a reasonable measure of credit risk. The Company is also exposed to liquidity risks in meeting its operating and capital expenditure requirements in instances where cash positions are unable to be maintained or appropriate financing is unavailable. Under the terms of the Company’s trading agreements, counterparties cannot require the Company to immediately settle outstanding derivatives except upon the occurrence of customary events of default. The Company mitigates liquidity risk through the implementation of its capital management policy by spreading the maturity dates of derivatives over time, managing its capital expenditures and operation cash flows, and by maintaining adequate lines of credit. The Company is exposed to interest rate risk on its variable rate debt and enters into interest rate swap agreements to hedge this risk. These factors may impact the ability of the Company to obtain loans and other credit facilities and refinance existing facilities in the future and, if obtained, on terms favourable to the Company. Such failures to obtain loans and other credit facilities could require the Company to take measures to conserve cash and could adversely affect its access to the liquidity needed for the business in the longer term.
The development of the Company’s projects and the construction of mining facilities and commencement of mining operations may require substantial additional financing. Failure to obtain sufficient financing will result in a delay or indefinite postponement of exploration, development or production on any or all of the Company’s properties or even a loss of a property interest. Additional financing may not be available when needed, or if available, the terms of such financing might not be favorable to the Company. Failure to raise capital when needed would have a material adverse effect on the Company’s business, financial condition and results of operations.
Construction and Start-up of New Mines
The success of construction projects and the start-up of new mines by the Company is subject to a number of factors including the availability and performance of engineering and construction contractors, mining contractors, suppliers and consultants, the receipt of required governmental approvals and permits in connection with the construction of mining facilities and the conduct of mining operations (including environmental permits), the successful completion and operation of ore passes, the adsorption/desorption/recovery plants and conveyors to move ore, among other operational elements. Any delay in the performance of any one or more of the contractors, suppliers, consultants or other persons on which the Company is dependent in connection with its construction activities, a delay in or failure to receive the required governmental approvals and permits in a timely manner or on reasonable terms, or a delay in or failure in connection with the completion and successful
operation of the operational elements in connection with new mines could delay or prevent the construction and start-up of new mines as planned. There can be no assurance that current or future construction and start-up plans implemented by the Company will be successful, that the Company will be able to obtain sufficient funds to finance construction and start-up activities, that personnel and equipment will be available in a timely manner or on reasonable terms to successfully complete construction projects, that the Company will be able to obtain all necessary governmental approvals and permits or that the completion of the construction, the start-up costs and the ongoing operating costs associated with the development of new mines will not be significantly higher than anticipated by the Company. Any of the foregoing factors could adversely impact the operations and financial condition of the Company.
Some of the Company’s projects have no operating history upon which to base estimates of future cash flow. The capital expenditures and time required to develop new mines or other projects are considerable and changes in costs or construction schedules can affect project economics. Thus, it is possible that actual costs may change significantly and economic returns may differ materially from the Company’s estimates.
Commercial viability of a new mine or development project is predicated on many factors. Mineral Reserves and Mineral Resources projected by feasibility studies and technical assessments performed on the projects may not be realized, and the level of future metal prices needed to ensure commercial viability may not materialize. Consequently, there is a risk that start-up of new mine and development projects may be subject to write-down and/or closure as they may not be commercially viable.
Uncertainty in the Estimation of Mineral Reserves and Mineral Resources
To extend the lives of its mines and projects, ensure the continued operation of the business and realize its growth strategy, it is essential that the Company continues to realize its existing identified Mineral Reserves, convert Mineral Resources into Mineral Reserves, increase its Mineral Resource base by adding new Mineral Resources from areas of identified mineralized potential, and/or undertake successful exploration or acquire new Mineral Resources.
No assurance can be given that the anticipated tonnages and grades in respect of Mineral Reserves and Mineral Resources contained in this annual information form will be achieved, that the indicated level of recovery will be realized or that Mineral Reserves will be mined or processed profitably. Actual Mineral Reserves may not conform to geological, metallurgical or other expectations, and the volume and grade of ore recovered may differ from estimated levels. There are numerous uncertainties inherent in estimating Mineral Reserves and Mineral Resources, including many factors beyond the Company’s control. Such estimation is a subjective process, and the accuracy of any Mineral Reserve or Mineral Resource estimate is a function of the quantity and quality of available data and of the assumptions made and judgments used in engineering and geological interpretation. Short-term operating factors relating to the Mineral Reserves, such as the need for orderly development of the ore bodies or the processing of new or different ore grades, may cause the mining operation to be unprofitable in any particular accounting period. In addition, there can be no assurance that gold recoveries in small scale laboratory tests will be duplicated in larger scale tests under on-site conditions or during production. Lower market prices, increased production costs, reduced recovery rates and other factors may result in a revision of its Mineral Reserve estimates from time to time or may render the Company’s Mineral Reserves uneconomic to exploit. Mineral Reserve data is not indicative of future results of operations. If the Company’s actual Mineral Reserves and Mineral Resources are less than current estimates or if the Company fails to develop its Mineral Resource base through the realization of identified mineralized potential, its results of operations or financial condition may be materially and adversely affected. Evaluation of Mineral Reserves and Mineral Resources occurs from time to time and they may change depending on further geological interpretation, drilling results and metal prices. The category of Inferred Mineral Resource is often the least reliable Mineral Resource category and is subject to the most variability. The Company regularly evaluates its Mineral Resources and it often determines the merits of increasing the reliability of its overall Mineral Resources.
Replacement of Depleted Mineral Reserves
Given that mines have limited lives based on Proven Mineral Reserves and Probable Mineral Reserves, the Company must continually replace and expand its Mineral Reserves at its mines. The life-of-mine estimates included in this annual information form may not be correct. The Company’s ability to maintain or increase its annual production will be dependent in part on its ability to bring new mines into production and to expand Mineral Reserves at existing mines.
Uncertainty Relating to Mineral Resources
Mineral Resources that are not Mineral Reserves do not have demonstrated economic viability. Due to the uncertainty which may attach to Inferred Mineral Resources, there is no assurance that Inferred Mineral Resources will be upgraded to Proven Mineral Reserves and Probable Mineral Reserves as a result of continued exploration.
Commodity Prices
The profitability of the Company’s operations will be dependent upon the cost and availability of commodities which are consumed or otherwise used in connection with the Company’s operations and projects, including, but not limited to, diesel, fuel, natural gas, electricity, steel, concrete and cyanide. Commodity prices fluctuate widely and are affected by numerous factors beyond the control of the Company. Further, as many of the Company’s mines are in remote locations and energy is generally a limited resource, the Company faces the risk that there may not be sufficient energy available to carry out mining activities efficiently or that certain sources of energy may not be available.
Joint Ventures
Yamana holds an indirect 12.5% interest in the Alumbrera Mine, the other 37.5% and 50% interests being held by Goldcorp Inc. (“Goldcorp”) and Glencore plc (“Glencore”), respectively. The Company accounts for this investment under the equity method of accounting. The Company’s interest in the Alumbrera Mine is subject to the risks normally associated with the conduct of joint ventures. These risks include, but are not limited to; disagreement with joint venture partners on how to develop and operate mines efficiently; inability of joint venture partners to meet their obligations to the joint venture or third parties; or litigation arising between joint venture partners regarding joint venture matters. The existence or occurrence of one or more of the following circumstances and events, for example, could have a material adverse impact on Company’s profitability, future cash flows, earnings, results of operations and financial condition.
Partnership with Agnico Eagle
The Company has formed a 50/50 partnership with Agnico Eagle in connection with the acquisition of the Canadian Malartic Mine (the “Canadian Malartic GP”). There are a variety of general risks associated with the Canadian Malartic GP, particularly because Yamana is not the sole operator. These risks include, but are not limited to:
| |
| • | disagreement with Agnico Eagle about how to develop, operate or finance a project; |
| |
| • | that Agnico Eagle may at any time have economic or business interests or goals that are, or become, inconsistent with the Company’s business interests or goals; |
| |
| • | that Agnico Eagle may not comply with the Canadian Malartic GP’s partnership agreement; |
| |
| • | the possibility that Agnico Eagle might become bankrupt; |
| |
| • | that Agnico Eagle may be in a position to take action contrary to the Company’s instructions, requests, policies, objectives or interests; |
| |
| • | possible litigation with Agnico Eagle about Canadian Malartic GP matters; and |
| |
| • | the possibility that the Company may not be able to sell its interest in the Canadian Malartic GP if the Company desires to exit the Canadian Malartic GP. |
These risks could result in legal liability or affect the Company’s ability to develop or operate the Canadian Malartic GP project, either of which could have a material adverse effect on Yamana’s future growth, results of operations, cash flows and financial position.
Infrastructure
Mining, processing, development and exploration activities depend, to one degree or another, on adequate infrastructure. Reliable roads, bridges, power sources and water supply are important determinants that affect capital and operating costs. Unusual or infrequent weather phenomena, sabotage, government or other interference in the maintenance or provision of such infrastructure could adversely affect the Company’s operations, financial condition and results of operations.
Permitting
The Company’s operations are subject to receiving and maintaining permits from appropriate governmental authorities. There is no assurance that delays will not occur in connection with obtaining all necessary renewals of permits
for the Company’s existing operations, additional permits for any possible future changes to operations, or additional permits associated with new legislation. Prior to any development on any of its properties, the Company must receive permits from appropriate governmental authorities. There can be no assurance that the Company will continue to hold all permits necessary to develop or continue operating at any particular property. Any of these factors could have a material adverse effect on the Company’s results of operations and financial position.
Insurance and Uninsured Risks
Yamana’s business is subject to a number of risks and hazards generally, including adverse environmental conditions, industrial accidents, labour disputes, unusual or unexpected geological conditions, ground or slope failures, cave-ins, catastrophic equipment failures or unavailability of materials and equipment, changes in the regulatory environment and natural phenomena such as inclement weather conditions, floods and earthquakes. Such occurrences could result in damage to mineral properties or production facilities, personal injury or death, environmental damage to the Company’s properties or the properties of others, delays in mining, monetary losses and possible legal liability.
Yamana’s insurance will not cover all the potential risks associated with the Company’s operations. Even if available, Yamana may also be unable to maintain insurance to cover these risks at economically feasible premiums. Insurance coverage may not continue to be available or may not be adequate to cover any resulting liability. Moreover, insurance against risks such as environmental pollution or other hazards as a result of exploration and production (such as underground coverage) is not generally available to Yamana or to other companies in the mining industry on acceptable terms. Yamana might also become subject to liability for pollution or other hazards that may not be insured against or that Yamana may elect not to insure against because of premium costs or other reasons. Losses from these events could cause Yamana to incur significant costs that could have a material adverse effect upon its financial performance and results of operations. Should the Company be unable to fully fund the cost of remedying an environmental problem, the Company might be required to suspend operations or enter into interim compliance measures pending completion of the required remedy, which may have a material adverse effect. The Company may suffer a material adverse effect on its business, results of operations, cash flows and financial position if it incurs a material loss related to any significant event that is not covered, or adequately covered, by its insurance policies.
Foreign Operations and Political Risk
The Company holds mining and exploration properties in Brazil, Argentina, Chile, Mexico and Canada, exposing it to the socioeconomic conditions as well as the laws governing the mining industry in those countries. Inherent risks with conducting foreign operations include, but are not limited to: high rates of inflation; military repression; war or civil war; social and labour unrest; organized crime; hostage taking; terrorism; violent crime; extreme fluctuations in currency exchange rates; expropriation and nationalization; renegotiation or nullification of existing concessions, licenses, permits and contracts; illegal mining; changes in taxation policies; restrictions on foreign exchange and repatriation; and changing political norms, currency controls and governmental regulations that favour or require the Company to award contracts in, employ citizens of, or purchase supplies from, a particular jurisdiction.
Changes, if any, in mining or investment policies or shifts in political attitude in any of the jurisdictions in which the Company operates may adversely affect the Company’s operations or profitability. Operations may be affected in varying degrees by government regulations with respect to, but not limited to, restrictions on production, price controls, export controls, currency remittance, importation of parts and supplies, income and other taxes, expropriation of property, foreign investment, maintenance of claims, environmental legislation, land use, land claims of local people, water use and mine safety.
Failure to comply strictly with applicable laws, regulations and local practices relating to mineral right applications and tenure could result in loss, reduction or expropriation of entitlements, or the imposition of additional local or foreign parties as joint venture partners with carried or other interests. In addition, changes in government laws and regulations, including taxation, royalties, the repatriation of profits, restrictions on production, export controls, changes in taxation policies, environmental and ecological compliance, expropriation of property and shifts in the political stability of the country, could adversely affect the Company’s exploration, development and production initiatives in these countries.
On December 21, 2015, the Argentinean government eliminated the export duties relating to the export of industrial products, including gold and silver. This change positively impacts the company’s cash flows from the operations in Argentina. On September 23, 2013, Argentina’s federal income tax statute was amended to include a 10% income tax withholding on dividend distributions by Argentine corporations.
On September 26, 2014, the Chilean government enacted a tax reform package. The Chilean reform progressively increases the Company’s cash taxes from 2014 to 2018 and also impacts the Company’s non-cash deferred tax liability.
Brazil is in the process of reviewing the royalty rates for mining companies. Finalization of the royalty rates is subject to change during the review and approval process and therefore the final rates are not determinable at this time. The magnitude of change in royalty rates may affect net earnings and cash flows from the Company’s operations in Brazil.
In Mexico, a tax reform bill was enacted on December 26, 2013 with respect to the reform of the Mining and Fiscal Coordination Laws. The proposals submitted through this bill include a 7.5% compensation payment on earnings before depreciation, interest and taxes generated by mining companies with producing mines. In addition, the bill includes a new royalty of 0.5% on all sales of doré. These amounts are deductible for income tax purposes which would bring the effective rate of the taxes to approximately 5.8%. The bill also doubles the payment of duties by hectare by differentiating nonproductive mining concessions. The magnitude of new royalty rates may affect net earnings and cash flows from the Company’s operations in Mexico.
On November 12, 2013, the Québec government introduced amendments to Québec’s Mining Tax Act under Québec Bill 55. The Bill introduced a new method for computing mining tax, amongst other changes. The new regime was originally scheduled to come into effect in January 1, 2014; however, subsequent to the 2014 Québec general election, the new government re-introduced the Bill in the Québec National Assembly and it became law on December 5, 2014, and the changes were made retroactive to the beginning of 2014. Although the new changes are not expected to have a material impact on the mining taxes over the life of the Canadian Malartic Mine, there is no assurance that this will be the case.
The Company continues to monitor developments and policies in all its jurisdictions and the impact thereof to its operations; however they cannot be accurately predicted and could have an adverse effect on the Company’s operations or profitability.
Increase in Production Costs
Changes in the Company’s production costs could have a major impact on its profitability. Its main production expenses are personnel and contractor costs, materials, and energy. Changes in costs of the Company’s mining and processing operations could occur as a result of unforeseen events, including international and local economic and political events, a change in commodity prices, increased costs (including oil, steel and diesel) and scarcity of labour, and could result in changes in profitability or Mineral Reserve estimates. Many of these factors may be beyond the Company’s control.
The Company relies on third party suppliers for a number of raw input materials. Any material increase in the cost of raw materials, or the inability by the Company to source third party suppliers for the supply of its raw materials, could have a material adverse effect on the Company’s results of operations or financial condition.
The Company prepares estimates of future cash costs and capital costs for its operations and projects. There is no assurance that actual costs will not exceed such estimates. Exceeding cost estimates could have an adverse impact on the Company’s future results of operations or financial condition.
Land Title
The acquisition and maintenance of title to mineral properties is a very detailed and time-consuming process. Title to, and the area of, mineral concessions may be disputed. Title insurance is generally not available for mineral properties and the Company’s ability to ensure that it has obtained secure mine tenure may be severely constrained. There is no guarantee that title to any of its properties will not be challenged or impaired. Third parties may have valid claims underlying portions of the Company’s interests, including prior unregistered liens, agreements, royalty transfers or claims, including native land claims, other encumbrances and title may be affected by, among other things, undetected defects. If these challenges are successful, this could have an adverse effect on the development of the Company’s properties as well as its results of operations, cash flows and financial position. In addition, the Company may be unable to operate its properties as permitted or to enforce its rights with respect to its properties.
Termination of Mining Concessions
The Company’s mining concessions may be terminated in certain circumstances. Under the laws of the jurisdictions where the Company’s operations, development projects and prospects are located, Mineral Resources belong to the state and governmental concessions are required to explore for, and exploit, Mineral Reserves. The Company holds mining, exploration
and other related concessions in each of the jurisdictions where it is operating and where it is carrying on development projects and prospects. The concessions held by the Company in respect of its operations, development projects and prospects may be terminated under certain circumstances, including where minimum production levels are not achieved by the Company (or a corresponding penalty is not paid), if certain fees are not paid or if environmental and safety standards are not met. Termination of any one or more of the Company’s mining, exploration or other concessions could have a material adverse effect on the Company’s financial condition or results of operations.
Competition
The mining industry is intensely competitive in all of its phases and the Company competes with many companies possessing greater financial and technical resources than itself. Competition in the precious metals mining industry is primarily for: mineral rich properties that can be developed and produced economically; the technical expertise to find, develop, and operate such properties; the labour to operate the properties; and the capital for the purpose of funding such properties. Many competitors not only explore for and mine precious metals, but conduct refining and marketing operations on a global basis. Such competition may result in the Company being unable to acquire desired properties, to recruit or retain qualified employees or to acquire the capital necessary to fund its operations and develop its properties. Existing or future competition in the mining industry could materially adversely affect the Company’s prospects for mineral exploration and success in the future.
Indebtedness
The Company’s ability to make scheduled payments on or refinance its debt obligations (if necessary) depends on its financial condition and operating performance, which are subject to prevailing economic and competitive conditions and to certain financial, business, legislative, regulatory and other factors beyond the Company’s control, including the market prices of gold, silver and copper. The Company may be unable to maintain a level of cash flow from operating activities sufficient to permit it to pay the principal, premium, if any, and interest on the Company’s indebtedness, or maintain its debt covenants.
If the Company’s cash flows and capital resources are insufficient to fund its debt service obligations, or there is a contravention of its debt covenants, the Company could face substantial liquidity problems and could be forced to reduce or delay investments and capital expenditures or to dispose of material assets or operations, seek additional debt or equity capital or restructure or refinance its indebtedness. The Company may not be able to effect any such alternative measures, if necessary, on commercially reasonable terms or at all and, even if successful, those alternative actions may not allow it to meet its scheduled debt service obligations.
In addition, the Company conducts a substantial portion of its operations through its subsidiaries, certain of which in the future may not be guarantors of its indebtedness. Accordingly, repayment of its indebtedness is dependent on the generation of cash flow by its subsidiaries and their ability to make such cash available to the Company, by dividend, debt repayment or otherwise. Unless they are guarantors of the Company’s indebtedness, its subsidiaries do not have any obligation to pay amounts due on its indebtedness or to make funds available for that purpose. The Company’s subsidiaries may not be able to, or may not be permitted to, make distributions to enable the Company to make payments in respect of its indebtedness.
Each subsidiary is a distinct legal entity, and, under certain circumstances, legal and contractual restrictions may limit the Company’s ability to obtain cash from the Company’s subsidiaries. While the Indenture governing the Initial Notes and New Notes limits the ability of the Company’s subsidiaries to incur consensual restrictions on their ability to pay dividends or make other intercompany payments to the Company, these limitations are subject to qualifications and exceptions. In the event that the Company does not receive distributions from its subsidiaries, it may be unable to make required principal and interest payments on its indebtedness.
The Company’s inability to generate sufficient cash flows to satisfy its debt obligations, or to refinance its indebtedness on commercially reasonable terms or at all, would materially and adversely affect its financial position and results of operations and its ability to satisfy its obligations.
Additional Capital
The exploration and development of the Company’s properties, including continuing exploration and development projects, and the construction or expansion of mining facilities and commencement or expansion of mining operations, may require substantial additional financing. Failure to obtain sufficient financing will result in a delay or indefinite postponement of exploration, development or production on any or all of the Company’s properties or even a loss of a property interest.
Additional financing may not be available when needed or if available, the terms of such financing might not be favourable to the Company and might involve substantial dilution to existing shareholders. Failure to raise capital when needed could have a material adverse effect on the Company’s business, financial condition and results of operations.
Currency Fluctuations
Currency fluctuations may affect the Company’s capital costs and the costs that the Company incurs at its operations. Gold is sold throughout the world based principally on a United States dollar price, but a portion of the Company’s operating and capital expenses are incurred in Brazilian reals, Argentine pesos, Chilean pesos, Mexican pesos, Canadian dollars and, to a lesser extent, the Euro. The appreciation of foreign currencies, particularly the Brazilian real and the Chilean peso, against the United States dollar would increase the costs of gold production at such mining operations, which could materially and adversely affect the Company’s earnings and financial condition. The Company has hedged only a portion of its Brazilian real risks and Mexican pesos risks, and none of the other currencies in which it functions, and is therefore exposed to currency fluctuation risks.
Additionally, the Mega Precious assets and the Canadian Malartic Mine are located in Canada and the costs associated with such assets are primarily denominated in Canadian dollars. However, revenue generated from the sale of gold and silver from such assets is in United States dollars and some of the costs associated with such assets are denominated in currencies other than the Canadian dollar. Any appreciation of the Canadian dollar vis-à-vis these currencies could have a material adverse effect on the Company’s business, financial condition and results of operation.
Write‑downs and Impairments
Mineral interests are the most significant assets of the Company and represent capitalized expenditures related to the development and construction of mining properties and related property, plant and equipment and the value assigned to exploration potential on acquisition. The costs associated with mining properties are separately allocated to exploration potential, Mineral Reserves and Mineral Resources and include acquired interests in production, development and exploration-stage properties representing the fair value at the time they were acquired. The values of such mineral properties are primarily driven by the nature and amount of material interests believed to be contained or potentially contained in properties to which they relate.
The Company reviews and evaluates its mining interests and any associated or allocated goodwill for impairment at least annually or when events or changes in circumstances indicate that the related carrying amounts may not be recoverable. An impairment is considered to exist if the recoverable value of the asset is less than the carrying amount of the asset. An impairment loss is measured and recorded to the net recoverable value of the asset. The recoverable value of the asset is the higher of: (i) value in use (being the net present value of total expected future cash flows); and (ii) fair value less costs to sell.
The Company assesses at the end of each reporting period whether there is any indication that an impairment loss recognized in prior periods for an asset other than goodwill may no longer exist or may have decreased. If any such indication exists, the Company estimates the recoverable amount and considers the reversal of the impairment loss recognized in prior periods for all assets other than goodwill. An impairment loss recognized for goodwill is not reversed in a subsequent period. The Company undertook a review of assets in 2015, including engaging in a detailed review of its LOM Plans and an evaluation of capital expenditures and expected returns. As a result of this process, in the fourth quarter, certain impairments were recognized on certain assets. The carrying values of assets are highly dependent on several factors including metal prices and the prevailing cost environment, and the carrying values of some properties are more sensitive to metal prices than others. The Company will continue to review at each period end whether there are any indications that a further impairment or reversal is required.
Fair value is the value obtained from an active market or binding sale agreement. Where neither exists, fair value is based on the best information available to reflect the amount the Company could receive for the asset in an arm’s length transaction. This is often estimated using discounted cash flow techniques. For value in use, recent cost levels are considered, together with expected changes in costs that are compatible with the current condition of the business and which meet the requirements of International Accounting Standards 36 in a discounted cash flow model. Where a recoverable amount is assessed using discounted cash flow techniques, the resulting estimates are based on detailed mine and/or production plans. Assumptions underlying fair value estimates are subject to significant risks and uncertainties. Where third-party pricing services are used, the valuation techniques and assumptions used by the pricing services are reviewed by the Company to ensure compliance with the accounting policies and internal control over financial reporting of the Company. Future cash flows are estimated based on expected future production, commodity prices, operating costs and capital costs. There are
numerous uncertainties inherent in estimating Mineral Reserves and Mineral Resources. Differences between management’s assumptions and market conditions could have a material effect in the future on the Company’s financial position and results of operation.
The assumptions used in the valuation of work-in process inventories by the Company include estimates of metal contained in the ore stacked on leach pads, assumptions of the amount of metal stacked that is expected to be recovered from the leach pads, estimates of metal contained in ore stock piles, assumptions of the amount of metal that will be crushed for concentrate, estimates of metal-in-circuit, estimated costs of completion to final product to be incurred and an assumption of the gold, silver and copper price expected to be realized when the gold, silver and copper is recovered. If these estimates or assumptions prove to be inaccurate, the Company could be required to write-down the recorded value of its work-in-process inventories to net realizable value, which would reduce the Company’s earnings and working capital. Net realizable value is determined as the difference between costs to complete production into a saleable form and the estimated future precious metal prices based on prevailing and long-term metal prices. When the circumstances that previously caused inventories to be written down below cost no longer exist or when there is clear evidence of an increase in net realizable value because of changed economic circumstances, the amount of write-down is reversed up to the lower of the new net realizable value or the original cost.
Although management makes its best estimates, it is possible that material changes could occur which may aversely affect management's estimate of the net cash flows expected to be generated from its properties. Any impairment estimates, which are based on applicable key assumptions and sensitivity analysis, are based on management's best knowledge of the amounts, events or actions at such time, and the actual future outcomes may differ from any estimates that are provided by the Company. Any impairment charges on the Company's mineral projects could adversely affect its results of operations.
Litigation Risks
All industries, including the mining industry, are subject to legal claims, with and without merit. The Company is currently involved in litigation and may become involved in legal disputes in the future. Defence and settlement costs can be substantial, even with respect to claims that have no merit. Due to the inherent uncertainty of the litigation process, the resolution of any particular legal proceeding may have a material adverse effect on the Company’s financial position or results of operations.
In 2004, a former director of Northern Orion Resources Inc. (“Northern Orion”, now named 0805346 B.C. Ltd.) commenced proceedings in Argentina against Northern Orion claiming damages in the amount of $177.0 million for alleged breaches of agreements entered into with the plaintiff. The plaintiff alleged that the agreements entitled him to a pre-emptive right to participate in acquisitions by Northern Orion in Argentina and claimed damages in connection with the acquisition by Northern Orion of its 12.5% equity interest in the Alumbrera Mine. On August 22, 2008, the National Commercial Court No. 13 of the City of Buenos Aires issued a first-instance judgment rejecting the claim. The plaintiff appealed this judgment to the National Commercial Appeals Court. On May 22, 2013, the appellate court overturned the first-instance decision. The appellate court determined that the plaintiff was entitled to make 50% of Northern Orion’s investment in the Alumbrera acquisition, although weighted the chance of the plaintiff’s 50% participation at 15%. The matter was remanded to the first-instance court to determine the value. Northern Orion appealed this decision through to the Supreme Court of Argentina, but on October 28, 2014, the Supreme Court denied Northern Orion’s motion for leave to appeal and accordingly the determination of the National Commercial Appeals Court regarding the plaintiff’s entitlement to damages stands. The court appointed valuator subsequently delivered an assessment order of the value of lost opportunity to the plaintiff at $244 million. On November 13, 2015, the National Commercial Court of Appeals rejected the plaintiff’s appeal against the annulment of the award. As no further action before the expiration of the term for any possible appeal on December 18, 2015, the annulment of the $244 million award made by the valuator is definitive. A new court appointed valuator will now be assigned to determine the assessment. The quantum of liability in this case is uncertain, but Northern Orion will continue to vigorously defend its position.
In December 2012, the Company received assessments from the Brazilian federal tax authorities disallowing certain deductions relating to financial instruments used to finance Brazilian operations for the years 2007 to 2010. The Company believes that these financial instruments were issued on commercial terms permitted under applicable laws and is appealing these assessments. As such, the Company does not believe it is probable that any amounts will be paid with respect to these assessments with the Brazilian authorities and the amount and timing of any assessments cannot be reasonably estimated. See “Legal Proceedings and Regulatory Actions”.
Investment Risk
Investment risk is the risk that a financial instrument’s value will deviate from the expected returns as a result of changes in market conditions, whether those changes are caused by factors specific to the individual investment or factors affecting all investments traded in the market. Although the factors that affect investment risk are outside the Company’s control, the Company mitigates investment risk by limiting its investment exposure in terms of total funds to be invested and by being selective of high quality investments.
Available for sale financial assets are reviewed quarterly for possible significant or prolonged decline in fair value requiring impairment and more frequently when economic or market concerns warrant such evaluation. The review includes an analysis of the fact and circumstances of the financial assets, the market price of actively traded securities, as well as the severity of loss, the financial position and near-term prospects of the investment, credit risk of the counterparties, the length of time the fair value has been below costs, both positive and negative evidence that the carrying amount is recoverable within a reasonable period of time, management’s intent and ability to hold the financial assets for a period of time sufficient to allow for any anticipated recovery of fair value and management’s market view and outlook. When a decline in the fair value of an available-for-sale investment has been recognized in Other Comprehensive Income (“OCI”) and there is objective evidence that the asset is impaired after management’s review, any cumulative losses that had been recognized in OCI are reclassified to net income in that period as an impairment loss. The reclassification is calculated as the difference between the acquisition cost and current fair value, less any impairment loss on that financial asset previously recognized, if applicable. Impairment losses recognized in net income for an investment are subject to reversal, except for an equity instrument classified as available-for-sale.
Use of Derivatives
From time to time the Company may use certain derivative products as hedging instruments and to manage the risks associated with changes in gold prices, silver prices, copper prices, interest rates, foreign currency exchange rates and energy prices. The use of derivative instruments involves certain inherent risks including, among other things: (i) credit risk - the risk of default on amounts owing to the Company by the counterparties with which the Company has entered into transactions; (ii) market liquidity risk - risk that the Company has entered into a derivative position that cannot be closed out quickly, by either liquidating such derivative instrument or by establishing an offsetting position; and (iii) unrealized mark-to-market risk - the risk that, in respect of certain derivative products, an adverse change in market prices for commodities, currencies or interest rates will result in the Company incurring an unrealized mark-to-market loss in respect of such derivative products.
Acquisitions and Integration
From time to time, the Company examines opportunities to acquire additional mining assets and businesses. Any acquisition that the Company may choose to complete may be of a significant size, may change the scale of the Company’s business and operations, and may expose the Company to new geographic, political, operating, financial and geological risks. The Company’s success in its acquisition activities depends on its ability to identify suitable acquisition candidates, negotiate acceptable terms for any such acquisition, and integrate the acquired operations successfully with those of the Company. Any acquisitions would be accompanied by risks. For example, there may be a significant change in commodity prices after the Company has committed to complete the transaction and established the purchase price or exchange ratio; a material ore body may prove to be below expectations; the Company may have difficulty integrating and assimilating the operations and personnel of any acquired companies, realizing anticipated synergies and maximizing the financial and strategic position of the combined enterprise, and maintaining uniform standards, policies and controls across the organization; the integration of the acquired business or assets may disrupt the Company’s ongoing business and its relationships with employees, customers, suppliers and contractors; and the acquired business or assets may have unknown liabilities which may be significant. In the event that the Company chooses to raise debt capital to finance any such acquisition, the Company’s leverage will be increased. If the Company chooses to use equity as consideration for such acquisition, existing shareholders may experience dilution. Alternatively, the Company may choose to finance any such acquisition with its existing resources. There can be no assurance that the Company would be successful in overcoming these risks or any other problems encountered in connection with such acquisitions.
Anticipated Benefits of Acquisitions
The Company acquired the Canadian Malartic Mine to gain exposure to a high quality gold asset, to diversify its operations, to strengthen its position as a gold producer and to create the opportunity to realize certain other benefits. Achieving the anticipated benefits of this acquisition depends on a number of factors, some of which will not be in Yamana’s control. The Company may fail to realize any of the anticipated benefits of the acquisition of the Canadian Malartic Mine.
Likewise, the Company acquired exploration assets from Mega Precious. There is no certainty that the assets will realize expected results or become economically viable producing assets.
Amendments to Mining Laws and Regulations
The mineral exploration activities of the Company are subject to various laws governing prospecting, development, production, taxes, labour standards and occupational health, mine safety, toxic substances and other matters. Mining and exploration activities are also subject to various laws and regulations relating to the protection of the environment. Although the Company believes that its exploration activities are currently carried out in accordance with all applicable rules and regulations, no assurance can be given that new rules and regulations will not be enacted or that existing rules and regulations will not be applied in a manner that could limit or curtail production or development of the Company’s properties. Amendments to current laws and regulations governing the operations and activities of the Company or more stringent implementation thereof could have a material adverse effect on the Company’s business, financial condition and results of operations.
Community Relations
The Company’s relationships with the communities in which it operates and other stakeholders are critical to ensure the future success of its existing operations and the construction and development of its projects. There is an increasing level of public concern relating to the perceived effect of mining activities on the environment and on communities impacted by such activities. Publicity adverse to the Company, its operations or extractive industries generally, could have an adverse effect on the Company and may impact relationships with the communities in which Yamana operates and other stakeholders. While the Company is committed to operating in a socially responsible manner, there can be no assurance that its efforts in this respect will mitigate this potential risk.
The Canadian Malartic Mine is located adjacent to the community of Malartic. Commercial open-pit production of the deposit requires not only the collaboration and support of the town council and residents of Malartic, but also the relocation of a portion of Highway 117, for which permits have not yet been obtained. There is no guarantee that the Company will continue to be able to maintain its relationships with these communities during commercial production of the deposit. In addition, Canadian Malartic GP has entered into negotiations with First Nations around the Kirkland Lake project and has also initiated a dialogue with First Nations in the Abitibi region.
The Company’s other projects, including exploration projects, may also be impacted by relations with various community stakeholders, and the Company’s ability to develop related mining assets may still be affected by unforeseen outcomes from such community relations.
Labour and Employment Matters
Production at the Company’s mining operations is dependent upon the efforts of its employees and the Company’s operations would be adversely affected if it fails to maintain satisfactory labour relations. In addition, relations between the Company and its employees may be affected by changes in the scheme of labour relations that may be introduced by the relevant governmental authorities in whose jurisdictions the Company carries on business. Changes in such legislation or in the relationship between the Company and its employees may have a material adverse effect on the Company’s business, results of operations and financial condition.
Foreign Subsidiaries
The Company is a holding company that conducts operations through subsidiaries, including foreign subsidiaries. Accordingly, any limitation on the transfer of cash or other assets between the parent corporation and such entities, or among such entities, could restrict the Company’s ability to fund its operations efficiently. Any such limitations, or the perception that such limitations may exist now or in the future, could have an adverse impact on the Company’s valuation and stock price.
Reliance on Local Advisors and Consultants in Foreign Jurisdictions
The Company holds mining and exploration properties in Brazil, Argentina, Chile and Mexico, in addition to Canada. The legal and regulatory requirements in these countries with respect to conducting mineral exploration and mining activities, banking system and controls, as well as local business culture and practices are different from those in Canada and the United States. The officers and directors of the Company must rely, to a great extent, on the Company’s local legal counsel and
local consultants retained by the Company in order to keep abreast of material legal, regulatory and governmental developments as they pertain to and affect the Company’s business operations, and to assist the Company with its governmental relations. The Company must rely, to some extent, on those members of management and the Company’s board of directors who have previous experience working and conducting business in these countries in order to enhance its understanding of and appreciation for the local business culture and practices. The Company also relies on the advice of local experts and professionals in connection with current and new regulations that develop in respect of banking, financing, labour, litigation and tax matters in these countries. Any developments or changes in such legal, regulatory or governmental requirements or in local business practices are beyond the control of the Company. The impact of any such changes may adversely affect the business of the Company.
Market Price of Common Shares
The common shares are listed on the TSX and the NYSE. The price of the common shares is likely to be significantly affected by short-term changes in gold prices or in the Company’s financial condition or results of operations as reflected in its quarterly earnings reports. Other factors unrelated to the Company’s performance that may have an effect on the price of the common shares include the following: the extent of analytical coverage available to investors concerning the Company’s business may be limited if investment banks with research capabilities do not continue to follow the Company’s securities; the lessening in trading volume and general market interest in the Company’s securities may affect an investor’s ability to trade significant numbers of common shares; and the size of the Company’s public float may limit the ability of some institutions to invest in the Company’s securities.
As a result of any of these factors, the market price of the common shares at any given point in time may not accurately reflect the Company’s long-term value. Securities class action litigation often has been brought against companies following periods of volatility in the market price of their securities. The Company may, in the future, be the target of similar litigation. Securities litigation could result in substantial costs and damages and divert management’s attention and resources.
Credit Rating
There can be no assurance that the credit ratings and outlook assigned to the Company’s debt securities or to Yamana will remain in effect for any given period of time or that any such rating or outlook will not be revised downward or withdrawn entirely by a rating agency. Real or anticipated changes in credit ratings or outlook assigned to the Company’s debt securities will generally affect the market price of its debt securities. In addition, real or anticipated changes in its credit ratings may also affect the cost at which the Company can access the capital markets. If such ratings decline and its cost of accessing capital markets increases, the Company may not be able to fund proposed capital expenditures and other operations in the future.
Dividend Policy
The Company has a dividend policy providing for a dividend yield that is consistent with the yield of comparable companies’ dividend rates and such policy is reviewed on a periodic basis and assessed in relation to the growth of the operating cash flows of the Company. In January 2016, the Company’s board of directors amended the Company’s dividend policy to set the quarterly dividends paid per common share at $0.02 annually, beginning with the declaration and payment of the first quarter 2016 dividend.
Payment of any future dividends will be at the discretion of the Company’s board of directors after taking into account many factors, including the Company’s operating results, financial condition, comparability of the dividend yield to peer gold companies and current and anticipated cash needs. There can be no assurance that dividends will continue to be paid in the future or on the same terms as are currently paid by the Company.
Dilution to Common Shares
During the life of the Company’s options and other rights granted or assumed by the Company, the holders are given an opportunity to profit from a rise in the market price of the common shares with a resulting dilution in the interest of the other shareholders. The Company’s ability to obtain additional financing during the period such rights that are outstanding may be adversely affected and the existence of the rights may have an adverse effect on the price of the common shares. The holders of options and other rights of the Company may exercise such securities at a time when the Company would, in all likelihood, be able to obtain any needed capital by a new offering of securities on terms more favourable than those provided by the outstanding rights.
The increase in the number of common shares in the market and the possibility of sales of such shares may have a depressive effect on the price of the common shares. In addition, as a result of the issuance of additional common shares, the voting power of the Company’s existing shareholders will be diluted.
Future Sales of Common Shares by Existing Shareholders
Sales of a large number of common shares in the public markets, or the potential for such sales, could decrease the trading price of the common shares and could impair the Company’s ability to raise capital through future sales of common shares. Substantially all of the common shares not held by affiliates of the Company can be resold without material restriction either in the United States, Canada or both.
Dependence Upon Key Management Personnel and Executives
The Company is dependent upon a number of key management personnel. The loss of the services of one or more of such key management personnel could have a material adverse effect on the Company. The Company’s ability to manage its operating, development, exploration and financing activities will depend in large part on the efforts of these individuals. The Company faces intense competition for qualified personnel, and there can be no assurance that the Company will be able to attract and retain such personnel. The loss of the services of one or more key employees or the failure to and attract and retain new personnel could have a material adverse effect on the Company’s ability to manage and expand the Company’s business. The Company has entered into employment agreements with certain of its key executives.
Possible Conflicts of Interest of Directors and Officers of the Company
Certain of the directors and officers of the Company also serve as directors and/or officers of other companies involved in natural resource exploration and development and, consequently, there exists the possibility for such directors and officers to be in a position of conflict. There can be no assurance that any decision made by any of such directors and officers involving the Company will be made in accordance with their duties and obligations to deal fairly and in good faith with a view to the best interests of the Company and its shareholders. In the event that the Company’s directors and officers are subject to conflicts of interest, there may be a material adverse effect on its business.
Disclosure and Internal Controls
Internal control over financial reporting is a process designed to provide reasonable assurance regarding the reliability of financial reporting and the preparation of financial statements for external purposes in accordance with International Financial Reporting Standards (“IFRS”). Disclosure controls and procedures are designed to ensure that the information required to be disclosed by the Company in reports filed with securities regulatory agencies is recorded, processed, summarized and reported on a timely basis and is accumulated and communicated to the Company’s management, as appropriate, to allow timely decisions regarding required decisions. The Company has invested resources to document and analyze its system of disclosure controls and its internal control over financial reporting. A control system, no matter how well designed and operated, can provide only reasonable, not absolute, assurance with respect to the reliability of financial reporting and financial statement preparation. The Company’s failure to satisfy the requirements of applicable Canadian securities laws on an ongoing, timely basis could result in the loss of investor confidence in the reliability of its financial statements, which in turn could harm its business and negatively impact the trading price of the common shares. In addition, any failure to implement required new or improved controls, or difficulties encountered in their implementation, could harm the Company’s operating results or cause it to fail to meet its reporting obligations.
Enforcement of Legal Rights
The Company has material subsidiaries organized under the laws of Brazil, Argentina, Chile and Mexico and certain of the Company’s directors, management and personnel are located in foreign jurisdictions. Given that the majority of the Company’s material assets and certain of its directors, management and personnel are located outside of Canada, investors may have difficulty in effecting service of process within Canada and collecting from or enforcing against the Company, or its directors and officers, any judgments issued by the Canadian courts or Canadian securities regulatory authorities and predicated on the civil liability provisions of Canadian securities legislation or other laws of Canada. Similarly, in the event a dispute arises in connection with the Company’s foreign operations, the Company may be subject to the exclusive jurisdiction of foreign courts or may not be successful in subjecting foreign persons to the jurisdiction of courts in Canada.
Failures of Information Systems or Information Security Threats
The Company has entered into agreements with third parties for hardware, software, telecommunications and other information technology (“IT”) services in connection with the Company’s operations. The Company’s operations depend, in part, on how well the Company and its suppliers protect networks, equipment, IT systems and software against damage from a number of threats, including, but not limited to, cable cuts, damage to physical plants, natural disasters, terrorism, fire, power loss, hacking, computer viruses, vandalism and theft. The Company’s operations also depend on the timely maintenance, upgrade and replacement of networks, equipment, IT systems and software, as well as pre-emptive expenses to mitigate the risks of failures. Any of these and other events could result in information system failures, delays and/or increase in capital expenses. The failure of information systems or a component of information systems could, depending on the nature of any such failure, adversely impact the Company’s reputation and results of operations.
Although to date the Company has not experienced any material losses relating to cyber attacks or other information security breaches, there can be no assurance that it will not incur such losses in the future. The Company’s risk and exposure to these matters cannot be fully mitigated because of, among other things, the evolving nature of these threats. As a result, cyber security and the continued development and enhancement of controls, processes and practices designed to protect systems, computers, software, data and networks from attack, damage or unauthorized access remain a priority. As cyber threats continue to evolve, the Company may be required to expend additional resources to continue to modify or enhance protective measures or to investigate and remediate any security vulnerabilities.
Any of these factors could have a material adverse effect on the Company’s results of operations, cash flows and financial position.
Technical Information
Unless otherwise indicated, the estimated Mineral Reserves and Mineral Resources for the Company’s various mines and mineral projects set forth herein, with the exception of the Alumbrera Mine (see “JORC Code Definitions”, below), have been calculated in accordance with the CIM Standards. The following definitions are reproduced from the CIM Standards:
The term “Mineral Resource” means a concentration or occurrence of solid material of economic interest in or on the Earth’s crust in such form, grade or quality and quantity that there are reasonable prospects for eventual economic extraction. The location, quantity, grade or quality, continuity and other geological characteristics of a Mineral Resource are known, estimated or interpreted from specific geological evidence and knowledge, including sampling. Material of economic interest refers to diamonds, natural solid inorganic material, or natural solid fossilized organic material including base and precious metals, coal, and industrial minerals. Mineral Resources are sub-divided, in order of increasing geological confidence, into Inferred, Indicated and Measured categories.
The term “Inferred Mineral Resource” means that part of a Mineral Resource for which quantity and grade or quality are estimated on the basis of limited geological evidence and sampling. Geological evidence is sufficient to imply but not verify geological and grade or quality continuity. An Inferred Mineral Resource is based on limited information and sampling gathered through appropriate sampling techniques from locations such as outcrops, trenches, pits, workings and drill holes.
The term “Indicated Mineral Resource” means that part of a Mineral Resource for which quantity, grade or quality, densities, shape and physical characteristics are estimated with sufficient confidence to allow the application of Modifying Factors (as defined below) in sufficient detail to support mine planning and evaluation of the economic viability of the deposit. Geological evidence is derived from adequately detailed and reliable exploration, sampling and testing and is sufficient to assume geological and grade or quality continuity between points of observation.
The term “Measured Mineral Resource” means that part of a Mineral Resource for which quantity, grade or quality, densities, shape, and physical characteristics are estimated with confidence sufficient to allow the application of Modifying Factors to support detailed mine planning and final evaluation of the economic viability of the deposit. Geological evidence is derived from detailed and reliable exploration, sampling and testing and is sufficient to confirm geological and grade or quality continuity between points of observation.
The term “Mineral Reserve” means the economically mineable part of a Measured and/or Indicated Mineral Resource. It includes diluting materials and allowances for losses, which may occur when the material is mined or extracted and is defined by studies at pre-feasibility or feasibility level as appropriate that include application of Modifying Factors. Such studies demonstrate that, at the time of reporting, extraction could reasonably be justified. Mineral Reserves are sub-divided in order of increasing confidence into Probable Mineral Reserves (as hereinafter defined) and Proven Mineral Reserves
(as hereinafter defined). Mineral Reserves are inclusive of diluting material that will be mined in conjunction with the Mineral Reserves and delivered to the treatment plant or equivalent facility.
The term “Probable Mineral Reserve” means the economically mineable part of an Indicated, and in some circumstances, a Measured Mineral Resource. The confidence in the Modifying Factors applying to a Probable Mineral Reserve is lower than that applying to a Proven Mineral Reserve. Probable Mineral Reserve estimates must be demonstrated to be economic, at the time of reporting, by at least a pre-feasibility study.
The term “Proven Mineral Reserve” means the economically mineable part of a Measured Mineral Resource. A Proven Mineral Reserve implies a high degree of confidence in the Modifying Factors. Proven Mineral Reserve estimates must be demonstrated to be economic, at the time of reporting, by at least a pre-feasibility study.
The term “Modifying Factors” means considerations used to convert Mineral Resources to Mineral Reserves. These include, but are not restricted to, mining, processing, metallurgical, infrastructure, economic, marketing, legal, environmental, social and governmental factors.
JORC Code Definitions
The estimated Ore Reserves and Mineral Resources for the Alumbrera Mine have been calculated in accordance with the current (2012) version of the Australasian Code for Reporting of Mineral Resources and Ore Reserves (the “JORC Code”), the Australian worldwide standards. The JORC Code has been accepted for current disclosure rules in Canada under NI 43-101. The following definitions are reproduced from the JORC Code:
The term “Mineral Resource” means a concentration or occurrence of material of intrinsic economic interest in or on the Earth’s crust in such form and quantity that there are reasonable prospects for eventual economic extraction. The location, quantity, grade, geological characteristics and continuity of a Mineral Resource are known, estimated or interpreted from specific geological evidence and knowledge. Mineral Resources are sub-divided, in order of increasing geological confidence, into Inferred, Indicated and Measured categories.
The term “Inferred Mineral Resource” means that part of a Mineral Resource for which tonnage, grade and mineral content can be estimated with a low level of confidence. It is inferred from geological evidence and assumed but not verified geological and/or grade continuity. It is based on information gathered through appropriate techniques from locations such as outcrops, trenches, pits, workings and drill holes which may be limited or of uncertain quality and reliability.
The term “Indicated Mineral Resource” means that part of a Mineral Resource for which tonnage, densities, shape, physical characteristics, grade and mineral content can be estimated with a reasonable level of confidence. It is based on exploration, sampling and testing information gathered through appropriate techniques from locations such as outcrops, trenches, pits, workings and drill holes. The locations are too widely or inappropriately spaced to confirm geological and/or grade continuity but are spaced closely enough for continuity to be assumed.
The term “Measured Mineral Resource” means that part of a Mineral Resource for which tonnage, densities, shape, physical characteristics, grade and mineral content can be estimated with a high level of confidence. It is based on detailed and reliable exploration, sampling and testing information gathered through appropriate techniques from locations such as outcrops, trenches, pits, workings and drill holes. The locations are spaced closely enough to confirm geological and/or grade continuity.
The term “Ore Reserve” means the economically mineable part of a Measured or Indicated Mineral Resource. It includes diluting materials and allowances for losses which may occur when the material is mined. Appropriate assessments, including a pre-feasibility study or a feasibility study, have been carried out, and include consideration of and modification by realistically assumed mining, metallurgical, economic, marketing, legal, environmental, social and governmental factors. These assessments demonstrate at the time of reporting that extraction could reasonably be justified. Ore Reserves are sub-divided in order of increasing confidence into Probable Ore Reserves and Proved Ore Reserves.
The term “Probable Ore Reserve” means the economically mineable part of an Indicated, and in some circumstances Measured Mineral Resource. It includes diluting materials and allowances for losses which may occur when the material is mined. Appropriate assessments, which may include feasibility studies, have been carried out, and include consideration of and modification by realistically assumed mining, metallurgical, economic, marketing, legal, environmental, social and governmental factors. These assessments demonstrate at the time of reporting that extraction could reasonably be justified.
The term “Proved Ore Reserve” means the economically mineable part of a Measured Mineral Resource. It includes diluting materials and allowances for losses which may occur when the material is mined. Appropriate assessments, which may include feasibility studies, have been carried out, and include consideration of and modification by realistically assumed mining, metallurgical, economic, marketing, legal, environmental, social and governmental factors. These assessments demonstrate at the time of reporting that extraction could reasonably be justified.
The foregoing definitions of Ore Reserves and Mineral Resources as set forth in the JORC Code have been reconciled to the definitions set forth in the CIM Standards. If the Ore Reserves and Mineral Resources for the Alumbrera Mine were estimated in accordance with the definitions in the CIM Standards, there would be no substantive difference in such Ore Reserves and Mineral Resources.
Cautionary Note to United States Investors Concerning Estimates of Measured, Indicated and Inferred Mineral Resources
This section uses the terms “Mineral Resource”, “Measured Mineral Resource”, “Indicated Mineral Resource” and “Inferred Mineral Resource”. United States investors are advised that while such terms are recognized and required by Canadian regulations, the Commission does not recognize them. Inferred Mineral Resources have a great amount of uncertainty as to their existence, and as to their economic and legal feasibility. It cannot be assumed that all or any part of an Inferred Mineral Resource will ever be upgraded to a higher category. Under Canadian rules, estimates of Inferred Mineral Resources may not, except in limited circumstances, form the basis of feasibility or other economic studies. United States investors are cautioned not to assume that all or any part of Measured or Indicated Mineral Resources will ever be converted into Mineral Reserves. United States investors are also cautioned not to assume that all or any part of an Inferred Mineral Resource exists, or is economically or legally mineable. See also “Introductory Notes - Cautionary Note to United States Investors Concerning Estimates of Mineral Reserves and Mineral Resources”.
Cash Costs and All-In Sustaining Costs
The Company discloses “cash costs” because it understands that certain investors use this information to determine the Company’s ability to generate earnings and cash flows for use in investing and other activities. The Company believes that conventional measures of performance prepared in accordance with IFRS do not fully illustrate the ability of its operating mines to generate cash flows. The measures, as determined under IFRS, are not necessarily indicative of operating profit or cash flows from operating activities. Cash costs figures are calculated in accordance with a standard developed by The Gold Institute, which was a worldwide association of suppliers of gold and gold products and included leading North American gold producers. The Gold Institute ceased operations in 2002, but the standard remains the generally accepted standard of reporting cash costs of production in North America. Adoption of the standard is voluntary and the cost measures presented herein may not be comparable to other similarly titled measures of other companies.
The measure of cash costs, along with revenue from sales, is considered to be a key indicator of a company’s ability to generate operating earnings and cash flows from its mining operations. This data is furnished to provide additional information and is a non-GAAP measure. It should not be considered in isolation as a substitute for measures of performance prepared in accordance with IFRS and is not necessarily indicative of operating costs, operating profit or cash flows presented under IFRS.
The Company’s business model is focused on the production and sale of precious metals - gold and silver, which accounts for a significant portion of the Company’s total revenue generated. The emphasis on precious metals therefore entails the necessity to provide investors with cash costs information that is relevant to their evaluation of the Company’s ability to generate earnings and cash flows for use in investing and other activities.
Cash costs
Cash costs include mine site operating costs such as mining, processing, administration, production taxes and royalties which are not based on sales or taxable income calculations, but are exclusive of amortization, reclamation, capital, development and exploration costs. The Company believes that such measure provides useful information about the Company’s underlying cash costs of operations in isolating the impact of precious metal production volumes and the impact of by-product credits on the Company’s cost structure. Cash costs are computed net of by-products or on a co-product basis.
Beginning January 1, 2015, the Company realigned key performance indicators ("KPIs") to support its objective of financial and operating predictability, as such, it no longer discloses a combined precious metal production unit in gold equivalent ounce. Silver production is no longer treated as a gold equivalent. The Company reports production and cost
information for gold, silver and copper separately and in addition, by-product costs for gold and silver, applying copper as the credit based on revenue contribution. There is no change in the calculation of copper cash costs.
With this realignment, the KPIs are as follows:
| |
| • | Cash costs of gold and silver on a by-product basis - shown on a per ounce basis. |
| |
| ◦ | The Attributable Cost for each metal is calculated net of by-products by applying copper and zinc net revenues, which are incidental to the production of precious metals, as a credit to gold and silver ounces produced, thereby allowing the Company’s management and stakeholders to assess net costs of precious metal production. These costs are then divided by gold and silver ounces produced. |
| |
| • | Cash costs of gold and silver on a co-product basis - shown on a per ounce basis. |
| |
| ◦ | Costs directly attributed to gold and silver will be allocated to each metal. Costs not directly attributed to each metal will be allocated based on the relative value of revenues which will be determined annually. |
| |
| ◦ | The Attributable Cost for each metal will then be divided by the production of each metal in calculating cash costs per ounce on a co-product basis for the period. |
| |
| • | Cash costs of copper on a co-product basis - shown on a per pound basis. |
| |
| ◦ | Costs attributable to copper production are divided by commercial copper pounds produced. |
Cash costs per ounce of precious metal and per pound of copper are calculated on a weighted average basis.
All-in Sustaining Costs
All-in sustaining costs per ounce of gold and silver seeks to represent total sustaining expenditures of producing gold and silver from current operations, based on cash costs and co-product costs, including cost components of mine sustaining capital expenditures, corporate general and administrative expense excluding stock-based compensation, and exploration and evaluation expense. All-in sustaining costs do not include capital expenditures attributable to projects or mine expansions, exploration and evaluation costs attributable to growth projects, income tax payments, financing costs and dividend payments. Consequently, this measure is not representative of all of the Company’s cash expenditures. In addition, the calculation of all-in sustaining costs does not include depletion, depreciation and amortization expense as it does not reflect the impact of expenditures incurred in prior periods.
| |
| • | All-in sustaining costs reflect by-product copper revenue credits and 100% of the aforementioned cost components. |
| |
| • | All-in sustaining co-product costs reflect allocations of the aforementioned cost components on the basis that is consistent with the nature of each of the cost component to the gold or copper production activities. |
Cash costs per ounce of gold and silver, co-product cash costs per ounce of gold and silver, all-in sustaining costs per ounce of gold and silver and all-in sustaining co-product costs per ounce of gold and silver are from continuing operations and, as applicable, exclude Ernesto/Pau-a-Pique, a discontinued operation.
The Company believes that these measures, together with measures determined in accordance with IFRS, provide investors with an improved ability to evaluate the underlying performance of the Company. Non-GAAP measures do not have any standardized meaning prescribed under IFRS, and therefore they may not be comparable to similar measures employed by other companies. The data is intended to provide additional information and should not be considered in isolation or as a substitute for measures of performance prepared in accordance with IFRS.
Mineral Projects
Summary of Mineral Reserve and Mineral Resource Estimates
Mineral Reserves (Proven and Probable)
The following table sets forth the Mineral Reserve estimates for the Company’s mineral projects as at December 31, 2015. See “Interests of Experts”.
|
| | | | | | | | | |
| | Proven Mineral Reserves | Probable Mineral Reserves | Total Proven & Probable |
Gold | | | |
| | Tonnes | Grade | Contained | Tonnes | Grade | Contained | Tonnes | Grade | Contained |
| | (000’s) | (g/t) | oz. (000’s) | (000’s) | (g/t) | oz. (000’s) | (000’s) | (g/t) | oz. (000’s) |
| Alumbrera (12.5%) | 3,125 | 0.35 | 35 | 63 | 0.29 | 1 | 3,188 | 0.35 | 36 |
| Canadian Malartic (50%) | 27,446 | 0.97 | 860 | 83,320 | 1.12 | 3,002 | 110,766 | 1.08 | 3,863 |
| Cerro Moro | 0 | 0.00 | 0 | 1,954 | 11.38 | 715 | 1,954 | 11.38 | 715 |
| Chapada | 263,900 | 0.20 | 1,738 | 315,621 | 0.23 | 2,380 | 579,521 | 0.22 | 4,118 |
| El Peñón | 805 | 7.05 | 183 | 8,288 | 4.78 | 1,273 | 9,093 | 4.98 | 1,456 |
| Gualcamayo | 11,284 | 1.32 | 479 | 14,446 | 1.05 | 488 | 25,730 | 1.17 | 967 |
| Jacobina | 2,689 | 2.03 | 176 | 19,042 | 2.97 | 1,819 | 21,731 | 2.86 | 1,995 |
| Jeronimo (57%) | 6,350 | 3.91 | 798 | 2,331 | 3.79 | 284 | 8,681 | 3.87 | 1,082 |
| Mercedes | 415 | 6.07 | 81 | 1,976 | 3.97 | 252 | 2,390 | 4.33 | 333 |
| Minera Florida Ore | 744 | 4.01 | 96 | 3,480 | 3.72 | 416 | 4,224 | 3.77 | 512 |
| Minera Florida Tailings | 2,982 | 0.88 | 84 | 0 | 0.00 | 0 | 2,982 | 0.88 | 84 |
| Total Minera Florida | 3,727 | 1.50 | 180 | 3,480 | 3.72 | 416 | 7,206 | 2.57 | 596 |
| Yamana Gold Mineral Reserves | 319,741 | 0.44 | 4,529 | 450,520 | 0.73 | 10,630 | 770,261 | 0.61 | 15,159 |
| C1 Santa Luz | 0 | 0.00 | 0 | 0 | 0.00 | 0 | 0 | 0.00 | 0 |
| Fazenda Brasileiro | 4,599 | 1.94 | 286 | 1,897 | 1.74 | 106 | 6,496 | 1.88 | 392 |
| Pilar | 390 | 4.09 | 51 | 3,916 | 2.31 | 291 | 4,306 | 2.47 | 342 |
| Brio Gold Mineral Reserves | 4,989 | 2.10 | 337 | 5,813 | 2.12 | 397 | 10,802 | 2.11 | 734 |
| Total Gold Mineral Reserves | 324,730 | 0.47 | 4,866 | 456,333 | 0.75 | 11,027 | 781,063 | 0.63 | 15,893 |
| Agua Rica | 384,871 | 0.25 | 3,080 | 524,055 | 0.21 | 3,479 | 908,926 | 0.22 | 6,559 |
| | | | | | | | | | |
| Silver | | | | | | | | | |
| | Tonnes | Grade | Contained | Tonnes | Grade | Contained | Tonnes | Grade | Contained |
| | (000’s) | (g/t) | oz. (000’s) | (000’s) | (g/t) | oz. (000’s) | (000’s) | (g/t) | oz. (000’s) |
| Cerro Moro | 0 | 0.0 | 0 | 1,954 | 648.3 | 40,723 | 1,954 | 648.3 | 40,723 |
| El Peñón | 805 | 159.1 | 4,117 | 8,288 | 171.3 | 45,647 | 9,093 | 170.2 | 49,765 |
| Mercedes | 415 | 60.2 | 803 | 1,976 | 46.4 | 2,947 | 2,390 | 48.8 | 3,750 |
| Minera Florida Ore | 744 | 27.4 | 655 | 3,480 | 17.7 | 1,984 | 4,224 | 19.4 | 2,638 |
| Minera Florida Tailings | 2,982 | 12.7 | 1,221 | 0 | 0.0 | 0 | 2,982 | 12.7 | 1,221 |
| Total Minera Florida | 3,727 | 15.7 | 1,876 | 3,480 | 17.7 | 1,984 | 7,206 | 16.7 | 3,860 |
| Total Silver Mineral Reserves | 4,946 | 42.7 | 6,796 | 15,697 | 180.9 | 91,301 | 20,644 | 147.8 | 98,098 |
| Agua Rica | 384,871 | 3.7 | 46,176 | 524,055 | 3.3 | 56,070 | 908,926 | 3.5 | 102,246 |
| | | | | | | | | | |
| Copper | | | | | | | | | |
| | Tonnes | Grade | Contained | Tonnes | Grade | Contained | Tonnes | Grade | Contained |
| | (000’s) | (%) | lbs (mm) | (000’s) | (%) | lbs (mm) | (000’s) | (%) | lbs (mm) |
| Alumbrera (12.5%) | 3,125 | 0.37 | 26 | 63 | 0.27 | 0.4 | 3,188 | 0.37 | 26 |
| Chapada | 263,900 | 0.27 | 1,555 | 256,751 | 0.26 | 1,478 | 520,651 | 0.26 | 3,033 |
| Total Copper Mineral Reserves | 267,025 | 0.27 | 1,581 | 256,814 | 0.26 | 1,478 | 523,839 | 0.26 | 3,059 |
| Agua Rica | 384,871 | 0.56 | 4,779 | 524,055 | 0.43 | 5,011 | 908,926 | 0.49 | 9,790 |
| | | | | | | | | | |
| Zinc | | | | | | | | | |
| | Tonnes | Grade | Contained | Tonnes | Grade | Contained | Tonnes | Grade | Contained |
| | (000’s) | (%) | lbs (mm) | (000’s) | (%) | lbs (mm) | (000’s) | (%) | lbs (mm) |
| Minera Florida Ore | 744 | 1.63 | 27 | 3,480 | 1.66 | 127 | 4,224 | 1.65 | 154 |
| Minera Florida Tailings | 2,982 | 0.64 | 42 | 0 | 0.00 | 0 | 2,982 | 0.64 | 42 |
| Total Zinc Mineral Reserves | 3,727 | 0.84 | 69 | 3,480 | 1.66 | 127 | 7,206 | 1.23 | 196 |
| | | | | | | | | | |
| Molybdenum | | | | | | | | | |
| | Tonnes | Grade | Contained | Tonnes | Grade | Contained | Tonnes | Grade | Contained |
| | (000’s) | (%) | lbs (mm) | (000’s) | (%) | lbs (mm) | (000’s) | (%) | lbs (mm) |
| Alumbrera (12.5%) | 3,125 | 0.012 | 0.80 | 63 | 0.012 | 0.02 | 3,188 | 0.012 | 0.82 |
| Total Moly Mineral Reserves | 3,125 | 0.012 | 0.80 | 63 | 0.012 | 0.02 | 3,188 | 0.012 | 0.82 |
| Agua Rica | 384,871 | 0.033 | 279 | 524,055 | 0.030 | 350 | 908,926 | 0.031 | 629 |
Mineral Resources (Measured, Indicated and Inferred)
The following table set forth the Mineral Resource estimates and for the Company’s mineral projects as at December 31, 2015. See “Interests of Experts”.
|
| | | | | | | | | | | | |
| | Measured Mineral Resources | Indicated Mineral Resources | Total Measured & Indicated | Inferred Mineral Resources |
| Gold | | | | |
| | Tonnes | Grade | Contained | Tonnes | Grade | Contained | Tonnes | Grade | Contained | Tonnes | Grade | Contained |
| | (000’s) | (g/t) | oz. (000’s) | (000’s) | (g/t) | oz. (000’s) | (000’s) | (g/t) | oz. (000’s) | (000’s) | (g/t) | oz. (000’s) |
| Alumbrera (12.5%) | 10,250 | 0.30 | 99 | 563 | 0.22 | 4 | 10,8 | 0.30 | 103 | 125 | 0.22 | 1 |
| Amalgamated Kirkland (50%) | 0 | 0.00 | 0 | 634 | 6.51 | 133 | 634 | 6.52 | 133 | 1,187 | 5.32 | 203 |
| Arco Sul | 0 | 0.00 | 0 | 0 | 0.00 | 0 | 0 | 0.00 | 0 | 5,000 | 4.02 | 646 |
| Canadian Malartic (50%) | 1,752 | 1.32 | 74 | 11,079 | 1.55 | 550 | 12,831 | 1.51 | 625 | 4,494 | 1.47 | 213 |
| Cerro Moro | 0 | 0.00 | 0 | 3,321 | 2.23 | 238 | 3,321 | 2.23 | 238 | 4,427 | 1.96 | 279 |
| Chapada | 22,209 | 0.23 | 164 | 225,531 | 0.26 | 1,873 | 247,740 | 0.26 | 2,037 | 133,118 | 0.23 | 972 |
| El Peñón | 858 | 10.55 | 291 | 2,876 | 6.64 | 614 | 3,733 | 7.54 | 905 | 6,729 | 7.02 | 1,519 |
| Gualcamayo | 66,130 | 1.01 | 2,150 | 53,110 | 1.35 | 2,301 | 119,240 | 1.16 | 4,451 | 21,582 | 2.22 | 1,543 |
| Hammond Reef (50%) | 82,831 | 0.70 | 1,862 | 21,377 | 0.57 | 388 | 104,208 | 0.67 | 2,251 | 251 | 0.72 | 6 |
| Jacobina | 13,931 | 2.26 | 1,013 | 19,153 | 2.54 | 1,562 | 33,084 | 2.42 | 2,575 | 15,359 | 3.14 | 1,549 |
| Jeronimo (57%) | 772 | 3.77 | 94 | 385 | 3.69 | 46 | 1,157 | 3.74 | 139 | 1,118 | 4.49 | 161 |
| La Pepa | 15,750 | 0.61 | 308 | 133,682 | 0.57 | 2,452 | 149,432 | 0.57 | 2,760 | 37,900 | 0.50 | 620 |
| Lavra Velha | 0 | 0.00 | 0 | 0 | 0.00 | 0 | 0 | 0.00 | 0 | 3,934 | 4.29 | 543 |
| Mercedes | 583 | 5.53 | 104 | 4,379 | 3.08 | 433 | 4,961 | 3.36 | 537 | 2,157 | 3.45 | 239 |
| Minera Florida | 1,179 | 6.11 | 231 | 3,912 | 5.05 | 636 | 5,091 | 5.30 | 867 | 5,281 | 5.50 | 933 |
| Monument Bay | 0 | 0.00 | 0 | 36,581 | 1.52 | 1,787 | 36,581 | 1.52 | 1,787 | 41,946 | 1.32 | 1,781 |
| Suyai | 0 | 0.00 | 0 | 4,700 | 15.00 | 2,286 | 4,700 | 15.00 | 2,286 | 900 | 9.90 | 274 |
| Upper Beaver (50%) | 0 | 0.00 | 0 | 4,403 | 6.36 | 900 | 4,403 | 6.36 | 900 | 3,450 | 5.93 | 658 |
| Yamana Gold Mineral Resources | 216,244 | 0.92 | 6,390 | 525,687 | 0.96 | 16,204 | 741,931 | 0.95 | 22,593 | 288,958 | 1.31 | 12,141 |
| C1 Santa Luz | 0 | 0.00 | 0 | 31,809 | 1.62 | 1,657 | 31,809 | 1.62 | 1,657 | 12,328 | 2.38 | 943 |
| Fazenda Brasileiro | 1,539 | 3.86 | 191 | 372 | 3.15 | 38 | 1,912 | 3.72 | 229 | 1,573 | 1.81 | 91 |
| Pilar | 266 | 5.07 | 43 | 3,715 | 2.65 | 316 | 3,981 | 2.81 | 360 | 18,668 | 3.40 | 2,041 |
| Brio Gold Mineral Resources | 1,805 | 4.04 | 234 | 35,896 | 1.74 | 2,011 | 37,701 | 1.85 | 2,246 | 32,569 | 2.94 | 3,075 |
| Total Gold Mineral Resources | 218,050 | 0.94 | 6,625 | 561,583 | 1.01 | 18,215 | 779,632 | 0.99 | 24,839 | 321,527 | 1.47 | 15,216 |
| Agua Rica | 27,081 | 0.14 | 120 | 173,917 | 0.14 | 776 | 200,998 | 0.14 | 896 | 642,110 | 0.12 | 2,444 |
| | | | | | | | | | | | | |
| Silver | | | | | | | | | | | | |
| | Tonnes | Grade | Contained | Tonnes | Grade | Contained | Tonnes | Grade | Contained | Tonnes | Grade | Contained |
| | (000’s) | (g/t) | oz. (000’s) | (000’s) | (g/t) | oz. (000’s) | (000’s) | (g/t) | oz. (000’s) | (000’s) | (g/t) | oz. (000’s) |
| Cerro Moro | 0 | 0.0 | 0 | 3,321 | 190.3 | 20,313 | 3,321 | 190.3 | 20,313 | 4,427 | 101.3 | 14,415 |
| Chapada | 0 | 0.0 | 0 | 82,161 | 1.4 | 3,775 | 82,161 | 1.4 | 3,775 | 27,553 | 1.1 | 982 |
| El Peñón | 858 | 287.0 | 7,913 | 2,876 | 206.2 | 19,069 | 3,733 | 224.8 | 26,982 | 6,729 | 268.4 | 58,073 |
| Mercedes | 583 | 65.6 | 1,229 | 4,379 | 32.6 | 4,588 | 4,961 | 36.5 | 5,817 | 2,157 | 28.9 | 2,001 |
| Minera Florida | 1,179 | 45.2 | 1,713 | 3,912 | 25.7 | 3,238 | 5,091 | 30.3 | 4,952 | 5,281 | 29.7 | 5,050 |
| Suyai | 0 | 0.0 | 0 | 4,700 | 23.0 | 3,523 | 4,700 | 23.0 | 3,523 | 900 | 21.0 | 575 |
| Total Silver Mineral Resources | 2,619 | 128.9 | 10,855 | 101,349 | 16.7 | 54,507 | 103,968 | 19.6 | 65,362 | 47,046 | 53.6 | 81,096 |
| Agua Rica | 27,081 | 2.3 | 2,042 | 173,917 | 2.9 | 16,158 | 200,998 | 2.8 | 18,200 | 642,110 | 2.3 | 48,124 |
| | | | | | | | | | | | | |
| Copper | | | | | | | | | | | | |
| | Tonnes | Grade | Contained | Tonnes | Grade | Contained | Tonnes | Grade | Contained | Tonnes | Grade | Contained |
| | (000’s) | (%) | lbs (mm) | (000’s) | (%) | lbs (mm) | (000’s) | (%) | lbs (mm) | (000’s) | (%) | lbs (mm) |
| Alumbrera (12.5%) | 10,250 | 0.31 | 70 | 563 | 0.25 | 3 | 10,813 | 0.31 | 73 | 125 | 0.23 | 1 |
| Chapada | 14,383 | 0.22 | 69 | 143,369 | 0.24 | 769 | 157,752 | 0.24 | 838 | 105,565 | 0.29 | 678 |
| Upper Beaver (50%) | 0 | 0.00 | 0 | 4,403 | 0.36 | 34 | 4,403 | 0.36 | 34 | 3,450 | 0.42 | 32 |
| Total Copper Mineral Resources | 24,633 | 0.26 | 139 | 148,335 | 0.25 | 807 | 172,968 | 0.25 | 946 | 109,140 | 0.30 | 711 |
| Agua Rica | 27,081 | 0.45 | 266 | 173,917 | 0.38 | 1,447 | 200,998 | 0.39 | 1,714 | 642,110 | 0.34 | 4,853 |
| | | | | | | | | | | | | |
| Zinc | | | | | | | | | | | | |
| | Tonnes | Grade | Contained | Tonnes | Grade | Contained | Tonnes | Grade | Contained | Tonnes | Grade | Contained |
| | (000’s) | (%) | lbs (mm) | (000’s) | (%) | lbs (mm) | (000’s) | (%) | lbs (mm) | (000’s) | (%) | lbs (mm) |
| Minera Florida | 1,179 | 2.07 | 54 | 3,912 | 1.60 | 138 | 5,091 | 1.71 | 192 | 5,281 | 1.48 | 173 |
| Total Zinc Mineral Resources | 1,179 | 2.07 | 54 | 3,912 | 1.60 | 138 | 5,091 | 1.71 | 192 | 5,281 | 1.48 | 173 |
| | | | | | | | | | | | | |
| Molybdenum | | | | | | | | | | | | |
| | Tonnes | Grade | Contained | Tonnes | Grade | Contained | Tonnes | Grade | Contained | Tonnes | Grade | Contained |
| | (000’s) | (%) | lbs (mm) | (000’s) | (%) | lbs (mm) | (000’s) | (%) | lbs (mm) | (000’s) | (%) | lbs (mm) |
| Alumbrera (12.5%) | 10,250 | 0.012 | 2.73 | 563 | 0.014 | 0.17 | 10,813 | 0.012 | 2.90 | 125 | 0.014 | 0.04 |
| Total Moly Mineral Resources | 10,250 | 0.012 | 2.73 | 563 | 0.014 | 0.17 | 10,813 | 0.012 | 2.90 | 125 | 0.014 | 0.04 |
| Agua Rica | 27,081 | 0.049 | 29 | 173,917 | 0.037 | 142 | 200,998 | 0.039 | 172 | 642,110 | 0.034 | 480 |
Notes:
|
| | | |
| 1. Metal Price, Cut-off Grade |
| |
| Mine | Mineral Reserves | | Mineral Resources |
| | | | |
| Amalgamated Kirkland (50%) | N/A | | $1,200 Au, cutoff grade at 2.5 g/t Au |
| Alumbrera (12.5%) | $1,095 Au, $2.54 Cu, $5.87 Mo. Open pit cutoff at 0.22% CuEq. Metallurgical recoveries are 83% for Cu and 71% for Au. | | 0.22% Cueq within economic envelope |
| Arco Sul | N/A | | 2.5 g/t Au cutoff |
| Canadian Malartic (50%) | $1,150 Au, Cutoff grades range from 0.345 to 0.351 g/t Au. Metallurgical recoveries for Au range from 82% to 90% dependent on zone. | | $1,150 Au, Cutoff grades range from 0.34 to 0.40 g/t Au inside pits and 1.0 g/t Au below Open pit |
| Cerro Moro | $950 Au and $18.00 Ag, Open pit cut-off at 3.4 g/t Aueq and Underground cut-off at 6.2 g/t Aueq. Metallurgical recoveries are 95% for Au and 93% for Ag. | | 1.0 g/t Aueq cut-off |
| Chapada | $1,150 Au, $3.00 Cu, $18.00 Ag; $5.17 NSR cut-off (Main Pit, Corpo Sul and Cava Norte). $900 Au; 0.2 g/t Au cut-off for oxide ore and 0.3 g/t Au cut-off for sulphide ore in Suruca Gold Project. Metallurgical recoveries for Cu are 83% and Au ranges from 52% to 85% dependent on zone. | | $1,500 Au, $3.50 Cu and $5.17 NSR cut-off out of pit for Chapada Mine (Main Pit, Corpo Sul, Cava Norte and Corpo NE) 0.2 g/t Au cut-off for oxide and 0.3 g/t Au cut-off for sulphide in Suruca Gold Project |
| El Peñón | $1,150 Au, $18.00 Ag, Variable cut-off for Underground and 1.2 g/t Aueq cut-off for Open Pit. Metallurgical recoveries for Au ranges from 82% to 97% and Ag ranges from 56% to 95% dependent on zone. | | 3.9 g/t Aueq cut-off |
| Gualcamayo | $1,150 Au: 1.49 g/t Au Cut-off UG: cut-offs for OP, 0.32 g/t Au for QDD Upper and 0.52 g/t Au for AIM. Metallurgical recoveries for Au open pit ore range from 40% to 63% and 63% for Au underground ore. | | 1.00 g/t Au Cut-off UG: cut-offs for OP, 0.20 g/t Au for QDD Upper and 0.5 g/t Au for AIM |
| Hammond Reef (50%) | N/A | | $1,400 Au, Open pit cutoff 0.32 g/t Au West Pit and 0.34 g/t Au East Pit |
| Jacobina | $950 Au; 1.45 g/t Au cut-off. Metallurgical recovery for Au is 94%. | | 0.5 g/t Au cut-off UG, 1.5 g/t Au cutoff for Pindobacu |
| Jeronimo (57%) | $900 Au, 2.0 g/t Au cut-off. Metallurgical recovery for Au is 86%. | | 2.0 g/t Au cut-off |
| La Pepa | N/A | | $780 Au, 0.30 g/t Au cut-off |
| Lavra Velha | N/A | | $1300 Au, $3.5Cu and 0.2g/t Au, 0.1% Cu cut-offs |
| Mercedes | $1,150 Au, $18.00 Ag, 3.0 g/t Aueq. Metallurgical recoveries are 94% for Au and 33% for Ag. | | 2.0 g/t Aueq cut-off for Mercedes and 0.4 g/t Aueq cut-off for Rey de Oro |
| Minera Florida | $1,150 Au, $18.00 Ag, $1 lb Zn, 2.12 g/t Aueq cut-off and Florida tailings cut-off N/A. Metallurgical recoveries are 85% for Au, 65% for Ag and 70% for Zn. | | 2.22 g/t Aueq cut-off |
| Monument Bay | N/A | | $1,200 Au , 0.4 and 0.7 g/t cutoff for open pit cutoff and 4.0 g/t Au cutoff for underground |
| Suyai | N/A | | 5.0 g/t Au cut-off |
| Upper Beaver (50%) | N/A | | $1,200 Au and $3.00 Cu, Underground cutoff 2.5 g/t Au |
| C1-Santa Luz | N/A | | $1,500 pit with 0.5 g/t Au cutoff for open pit resources. 1.5 g/t Au cutoff for C1 underground high grade ore. |
| Fazenda Brasileiro | $1,150 Au, 1.06 g/t Au UG and 0.4 g/t Au open pit cut-off. Metallurgical recovery for Au is 91%. | | $1,500 pit with 0.5 g/t Au cutoff for open pit and underground; just pillars and stopes that could be economic |
| Pilar | $1,150 Au, 1.17 g/t Au cut-off for Pilar and 1.01 g/t Au for Maria Lazara. Minimum mining width 1.0 m for Pilar and 1.4 m for Maria Lazara. Metallurgical recovery for Au is 95%. | | 2.0 g/t Au cut-off at Pilar |
| Agua Rica | $1,000 Au, $2.25 lb Cu, $17.00 g/t Ag, $12.00 lb Mo. Metallurgical recoveries are 85% for Au and 53% for Ag. | | 0.2% Cu cut-off |
| |
| 2. | All Mineral Reserves and Mineral Resources have been calculated in accordance with the CIM Standards and NI 43-101, other than the estimates for the Alumbrera Mine which have been calculated in accordance with the JORC Code which is accepted under NI 43-101. |
3. All Mineral Resources are reported exclusive of Mineral Reserves.
4. Mineral Resources which are not Mineral Reserves do not have demonstrated economic viability.
5. Mineral Reserves and Mineral Resources are reported as of December 31, 2015.
| |
| 6. | For the qualified persons responsible for the Mineral Reserve and Mineral Resource estimates on the Company’s material producing mines, see the qualified persons chart under the heading “Interests of Experts” in this annual information form. |
Material Producing Mines
Chapada Mine
Unless otherwise stated, the information, tables and figures that follow relating to the Chapada Mine are derived from, and in some instances are extracts from, the technical report entitled “Technical Report on the Chapada Mine, Brazil” dated July 31, 2014 (the “Chapada Report”), prepared by or under the supervision of Wayne W. Valliant, P.Geo. and Robert L. Michaud, P.Eng. (the “Chapada Qualified Persons”), of Roscoe Postle Associates Inc. (“RPA”). The technical information contained in this section of the annual information form, other than the technical information set forth above under the heading “Mineral Projects - Summary of Mineral Reserves and Mineral Resources Estimate” has been reviewed and approved by the Chapada Qualified Persons and William Wulftange, P.Geo, Senior Vice President, Exploration of the Company, each of whom is a “qualified person” for the purpose of NI 43-101. See “Interests of Experts”.
Portions of the following information are based on assumptions, qualifications and procedures which are not fully described herein. Reference should be made to the full text of the Chapada Report, which has been filed with certain Canadian securities regulatory authorities pursuant to NI 43-101 and is available for review on the Company’s SEDAR profile at www.sedar.com.
Property Description, Location and Access
The Chapada Mine is located in northern Goiás State, approximately 320 kilometres north of the state capital of Goiania and 270 kilometres northwest of the national capital of Brasilia. It is situated at latitude 14° 14’ S, longitude 49° 22’ W. Corpo Sul is situated at the southwest extremity of the Chapada deposit. The Suruca deposit is located six kilometres northeast of the Chapada Mine at approximately latitude 14° 11’ S, longitude 49° 20’ W.
Access to the project area from Brasilia is via BR-153 (Belem/Brasilia) to Campinorte (GO) and then via GO-465 (Campinorte/Santa Terezinha) west to Alto Horizonte. The town of Alto Horizonte lies between the Suruca and Chapada deposits. Chapada Airport, suitable for small aircraft with an 800 metres long airstrip, is located close to Alto Horizonte, approximately four kilometres northeast of the Mine.
The Chapada Mine is divided into 16 claims covering 18,921.37 hectares. The claims are held in the name of Mineração Maracá Indústria e Comércio S/A (“Mineração Maracá”), a 100% owned subsidiary of Yamana. See also “- Exploration, Development and Production”.
Yamana (via Mineração Maracá) holds all of the surface rights in the area of the Chapada Mine, which incorporates all of the proposed locations of buildings, fixed installations, waste dumps, and tailing disposal in the current mine plan. Yamana is of the opinion that it can acquire the right to dispose of waste rock and tailings on additional surface property, if and when required. The land ownership is registered with the Registrar of Real Estate in Mara Rosa, Goiás.
Other than statutory royalties which are paid to the Brazilian government based on commercial copper and gold production, RPA is not aware of any rights, agreements or encumbrances to which the Chapada Mine is subject, which would adversely affect the value of the property or Mineração Maracá’s ownership interest. The environmental licensing process for Corpo Sul started in 2013 and the required licences were granted in 2014. No current environmental liabilities have been identified within the mine area. Ongoing items such as waste stockpiles, depleted heap leach piles, and tailings storage facilities will be rehabilitated during the mine life or at the time of mine closure.
History
The Chapada deposit was discovered in 1973 by a Canadian company, INCO Ltda. (“INCO”), which followed up with geochemistry, geophysics, trenching, and initial drilling. There are few outcrops in the mine area due to laterite-saprolite cover. Consequently, deposit definition required extensive diamond drill exploration. Development drilling of the deposit occurred in several campaigns from 1976 through 1996 by INCO, Parsons-Eluma Projetos e Consultoria S/C (“Parsons”), a Brazilian copper company, Eluma - Noranda, Santa Elina, and Santa Elina-Echo Bay (“Echo Bay”). Historical ownership and exploration activities are summarized in Table 1.
|
| | |
| Table 1 |
| Date | Owner | Activity |
| 1973 | INCO | Chapada discovery. |
| 1975-1976 | | 2,000 metres x 500 metres grid drilling program. Parsons acquires a 50% interest in the Chapada project. |
| 1976-1979 | INCO & Parsons | 200 metres x 100 metres drill grid. A 92 metres deep shaft is completed with 255 metres of cross-cuts for exploration and metallurgical sampling. |
| 1979 | | Mining concession No. 2394 covering 3,000 hectares is issued to Mineração Alonte by the Departamento Nacional da Producao Mineral (“DNPM”). |
| 1980-1981 | | Soil drilling completed in the plant, tailing ponds, and potential water dam areas. |
| 1981 | Parsons | Feasibility study completed. |
| 1994-1995 | | A 4,500 metres drilling program re-evaluation of a near surface gold deposit. |
| | | Preliminary feasibility study by Watts, Griffis and McOuat. |
| May 1994 | SERCOR | Mineração Santa Elina Industria e Comercio S/A (“SERCOR”) acquires the Chapada deposit through a subsidiary, Mineração Maracá. |
| July 1994 | SERCOR and Echo Bay | Echo Bay acquires an initial interest in Santa Elina by purchasing 5% of the outstanding shares from SERCOR. |
| Dec 1994 | | Santa Elina completes its initial public offering. |
| Sep 1995 | | Santa Elina and Echo Bay approve the Chapada project joint venture. Santa Elina issues about 3% of the outstanding shares to Echo Bay. Echo Bay receives the option to acquire 50% interest in the project. |
| May 1996 | | Santa Elina is privatized and SERCOR and Echo Bay become equal owners of the company. |
| Dec 1996 | | Santa Elina completes an in-fill drilling program |
| Dec 1997 | | Independent Mining Consultants, Inc. reviews the Echo Bay model and completes a mine feasibility study. |
| Jan 1998 | | Kilborn Holdings Inc., (now SNC-Lavalin Group Inc.), completes the Chapada project bankable feasibility study. |
| Apr 2001 | | Construction licence issued. |
| May 2000 | PINUS | PINUS acquires 100% of Mineração Maracá. |
| 2003 | Yamana | The property is purchased by Yamana. |
| 2004 | | The feasibility study is completed. |
| 2007 | | Commercial production starts. |
In 2008, Yamana started a plant expansion to increase throughput from 16 million tonnes per annum to 22 million tonnes per annum.
From 2007 to the end of 2013, the Chapada Mine has produced 128.4 million tonnes grading 0.36 grams per tonne gold and 0.41% copper.
The Suruca deposit has been explored by various companies since the 1970s, as summarized in Table 2, and was exploited by garimpeiros in the 1980s. Yamana reports that garimpeiros produced approximately 200 kilograms of gold in that period. A historical estimate of resources was identified in the mid-1990s; however, as this estimate is historic in nature, it cannot be relied upon.
Table 2
|
| |
| Date | Ownership |
| 1980 - 1981 | INCO/Eluma |
| 1987 - 1988 | Cominco |
| 1993 - 1994 | WMC |
| 1996 - 1997 | Santa Elina/Echo Bay |
| 2008 to present | Yamana |
Geological Setting, Mineralization and Deposit Types
The Chapada area is located between the Amazonian craton to the northwest and the San Francisco craton to the southeast, within the north-northeast striking metavolcano-sedimentary Mara Rosa Magmatic Arc which is part of a large system of mobile belts that have a complex, multi-phased history of deformation.
The Chapada, Corpo Sul and Suruca deposits are located in the Eastern Belt of the Mara Rosa volcano sedimentary sequence. The Eastern Belt in the vicinity of the Chapada Mine comprises a thick package of amphibolites succeeded by volcanic and volcanoclastic rocks and overlying metasedimentary rocks. The metavolcanic-sedimentary units are intruded by metaplutonic rocks of dioritic to quartz-diorite composition. These intrusions are associated with magmatic fluids responsible for copper-gold and gold mineralization. The volcanics and sediments have been metamorphosed to biotite and amphibolite schist in the Chapada mineralized area.
In the immediate area of the Chapada deposit, the biotite and amphibolite schist units have been folded into a broad anticline with a north-easterly fold axis. The two limbs of the anticlinal structure dip to the northwest and southeast. There is a minor secondary synclinal fold of the major antiform so that the northeast and southwest ends are somewhat higher than the central zone of the structure in the middle of the deposit. This combination of folds gives the deposit a broad “saddle” shape.
The deposit has undergone hydrothermal alteration typical of a copper-gold porphyry system. Alteration styles include biotitization, sericitization, argillitization, and propylitization.
The bedrock schists are overlain by approximately 25 metres of saprolite material with a minor lateritic component near the top of the saprolite zone. Within that laterite component, there is a ferricrete zone at surface.
The Corpo Sul deposit is located immediately on-strike and two kilometres to the southwest of the Chapada open pit. It is interpreted as another intrusive Copper-Gold Porphyry center, less deformed than Chapada Mine, and associated with an intrusion of Quartz Porphyry Diorite/Tonalite (Potassic alteration), enveloped by a Feldspathic Biotite Schist (Potassic alteration) surrounded by sericite schists (Sericitic alteration).
Corpo Sul has largely the same stratigraphic units found in Chapada, however at Corpo Sul the tuffs and lapilli tuffs are less deformed.
The area is covered by a 30 metre lateritic profile. The lateritic profile comprises an immature lateritic terrain that was subdivided from base to the top in: coarse saprolite, saprolite, mottled zone or argillic zone, lateritic duricrust and pisolitic soils (products of alteration of duricrust).
The Suruca deposit, north of the main Chapada pit, has geology that is grouped from base to top as: Amphibolite, Intermediate Metavolcanic rocks and Metasediments. There are several intrusions of quartz diorite porphyry that occur preferentially in the intermediate metavolcanic rocks and metasediments. Hydrothermal alteration overprints the lithologies and is characterized by inner and outer halos. The inner halo occurs in the intermediate rocks, metasediments and diorites with strong and pervasive sericitic alteration and the outer halo is characterized by propylitic alteration that occurs mainly in the amphibolites.
The Sucupira deposit lies immediately northwest of the main Chapada pit, west of the northeast to southwest trending Sucupira fault. The Sucupira deposit was formed within diorite intruded volcanic and sedimentary units prior to metamorphic deformation. The deposit as currently understood is a continuation of ore found within the Cava Norte pit which can be
traced in drill cuttings up to 1.7 kilometers to the southwest. Gold and copper mineralization occurs within a potassic and sericite alteration halo that is elongated northeast to southwest, loosely following an antiform fold nose. The deposit contains both a higher grade core of gold and copper values that are enveloped by a lower grade halo of gold-copper values. Calcsilicate rock units thought to be skarn related host minor amounts of mineralization as well.
The primary copper-gold mineralization at Chapada is epigenetic. Copper is principally present as chalcopyrite with minor amounts of bornite. Fine grained gold is closely associated with the sulphide mineralization and was likely to be contemporaneous with the copper.
Copper mineralization occurs as finely disseminated crystals, elongated pods, lenses along foliation, crosscutting stringers, and coarse clots in occasional late stage quartz veins or pegmatites. The copper mineralization and grade are somewhat better in the central zone of the deposit along the anticline axis than in the surrounding anticlinal limbs; however, copper mineralization is pervasive over a broad area. Gold mineralization is more uneven spatially and may have been remobilized by post mineral low temperature alteration events.
The Corpo Sul mineralization includes oxide and sulphide ores. The oxide ore comprises approximately 7% of the deposit and is associated with the weathering surface. The width varies between 20 metres and 40 metres at an average grade of 0.26 grams per tonne gold and 0.35% copper. The oxide mineralization comprises soil, mottled zone, fine saprolite, and coarse saprolite. The sulphide ore represents the majority of the mineralization with widths from 25 metres to 300 metres at an average grade of 0.24 grams per tonne gold and 0.31% copper.
The gold at Suruca is related to folded quartz vein/veinlets with sericitic and biotite alteration, rather than high sulphide concentrations. The second generation of quartz veins/veinlets with sulphides (sphalerite + galena + pyrite), carbonates and epidote also host gold which is related to zinc.
Mineralization predominately pre-dates deformation hence the gold is associated with epithermal features and not structurally controlled.
Exploration
For exploration work completed prior to Yamana, please see “-History”, above.
Yamana started exploration work in 2007 with diamond drilling mainly to the east of the pit to check for the extension of the mineralization potentially hosted in a synclinal structure.
In early 2008, consultant Richard Sillitoe defined a genetic model of mineralization with a typical porphyry copper-gold system (Cu-Au-Mo association) that underwent intense isoclinal folding and amphibolite facies metamorphism during continental collision at the end of the Neoproterozoic. However, original mineralogy may not have been profoundly changed, due to the stability of minerals like quartz, anhydrite, pyrite, chalcopyrite, magnetite and biotite under amphibolite facies conditions.
Yamana began exploration work at Suruca in 2008 with geological mapping, chip sampling and shallow drilling at Suruca South.
See also “- Exploration, Development and Production”.
Drilling
Yamana commenced drilling the Chapada deposit in 2008. To the end of 2013, Yamana has drilled 344 holes for 73,891 metres (Table 3). Drilling has delineated the main deposit areas at a spacing of 100 metres by 50 metres, with a tighter 50 metres pattern in the central portion of the deposit.
Table 3
|
| | |
| Year | No. Drill Holes | Metres |
| 2008 | 30 | 5,126 |
| 2009 | 7 | 2,352 |
| 2010 | 18 | 4,373 |
| 2011 | 85 | 19,305 |
| 2012 | 131 | 28,568 |
| 2013 | 73 | 14,167 |
| Total | 344 | 73,891 |
The 2008 and 2009 drilling campaigns were concentrated in the region named “Near Mine” and in the south portion of the area. The 2010 and 2011 campaigns targeted the Near Mine and Corpo Sul areas. In 2013, Yamana drilled in the northeast section of Chapada Corpo Principal with the objective of delineating an Inferred Mineral Resource. In Corpo Sul, an infill drilling program was carried out in the southwest portion of the deposit on a 50 metre by 50 metre grid to upgrade Indicated to Measured Mineral Resources and on a 100 metre by 100 metre grid to convert Inferred to Indicated Mineral Resources.
The majority of holes were drilled at an azimuth of 130o and an 85o dip. Drill holes with inclination between 45o and 85o were surveyed every three metres downhole using a Deviflex electronic surveying instrument. No significant deviation issues were found.
To date, Yamana has drilled 186 holes for 37,899.16 metres at Suruca, as summarized in Table 4.
|
| | |
| Table 4 |
| | | |
| Year | No. Drill Holes | Metres |
| 2008 | 7 | 439.5 |
| 2009 | 21 | 6,457.8 |
| 2010* | 103 | 20,476.9 |
| 2011 | 55 | 10,524.96 |
| Total | 186 | 37,899.16 |
*Includes 11 metallurgical holes for 1,014 metres
At Suruca in 2009, Yamana completed successful drilling to test a magnetic anomaly and the area of the garimpeiro workings. The 2010 drilling program focused on delineation of the Suruca deposit at 400 metres by 200 metres spacing followed by infill drilling at 200 metres by 200 metres spacing. An infill program of 100 metres by 100 metres spacing was completed in the north portion of deposit.
The majority of holes were drilled at an azimuth of 130o and a 60o dip; some holes were drilled at an azimuth of 310o. Drill holes with inclination between 45o and 85o were surveyed every three metres downhole using a Reflex Maxibor II or Devicom Deviflex electronic surveying instrument. In sub-vertical holes, a PeeWee or EZ-Shot instrument was used. All holes were surveyed and no significant deviation issues were found.
See also “- Exploration, Development and Production”.
Sampling, Analysis and Data Verification
Yamana’s samples are selected down the entire length of the drill hole core, sawn in half with an electric diamond bladed core saw, and sampled prior to logging. Half core samples are selected by a geology technician or trained sampler. The samples are then placed in a numbered plastic bag along with a paper sample tag, and tied closed with a piece of string. Sample weight is approximately 3.5 kilograms. Six to eight samples are placed in a larger plastic bag, loaded onto a truck owned and driven by a locally based transport company, and driven to the ALS Chemex laboratory sample preparation facility in Goiania, State of Goiás.
After sampling, the geologist completes a graphic log and logs the core in detail for lithology, structure, mineralization and alteration. Codes are assigned for the oxidation state, consistency and alteration including alteration halo, sulphides,
silicification, biotite, sericite, epidote, amphibolite, garnet, carbonate, rhodochrosite, chlorite, and kyanite content. Angles of structures such as foliation and faults are recorded.
Approximately four samples from each alteration halo per drill hole are selected for density testwork by two different methods after sampling and logging. The first method used is the water displacement method, performed in the logging shed. The second method, which is gravimetric, is done in the laboratory using pulverized samples.
Sample preparation involves crushing and pulverization. Upon receipt of the samples, each sample is weighed and dried at 100°C for eight to 12 hours. The entire sample is then crushed to 90% passing <2 millimetres (10 mesh), split to 0.5 kilograms in a riffle splitter, and pulverised to 95% passing 150# (mesh). The samples are then split again to 50 grams using a rotating splitter/spatula. The crusher and pulveriser are cleaned between each sample. Each fraction retained is returned to Yamana.
All Yamana samples are analyzed for precious metals by fire assay (“FA”) with atomic absorption spectrometry (“AAS”) or ICP finish and for copper by AAS by ALS Chemex, Lima, Peru and/or SGS Geosol, Belo Horizonte, Brazil. Yamana is at arm’s length with these laboratories.
Yamana conducts an industry-standard quality assurance/quality control (“QA/QC”) program for its drill campaigns, which follows written protocols. Its QA/QC program consisted of the insertion of blanks and certified reference materials (“CRMs”) into the sample stream and the running of duplicate field (quarter-core) samples. Later, pulp duplicate samples were re-assayed at a secondary facility.
RPA assessed Yamana’s QA/QC program and found it to be industry-standard with a generally acceptable rate of insertion for CRMs and pulp duplicates. The results of the pulp duplicate assays showed good reproducibility with no discernible grade biases. The insertion of CRMs showed that laboratory results from SGS Geosol and ALS Chemex were acceptable with respect to precision and accuracy. The results from the insertion of blanks are also generally acceptable.
In 1996 Echo Bay became actively involved in the drilling and sampling program for the project. Samples taken by Santa Elina in 1996 were subject to a rigorous QA/QC program. IMC Mining (“IMC”) was contracted to review the historical data. IMC’s review included all historical QA/QC control files and historical data compared with re-assayed data from analytical laboratories in the United States. IMC concluded the historical data was appropriate for estimation of Mineral Resources.
IMC did a review of the Chapada assay database. IMC did not do any independent assaying, but did review considerable existing data. It was IMC’s opinion that the database was of sufficient quality for a feasibility level study.
A total of 18 Suruca diamond drill holes from Mineração Alonte were re-analysed following Yamana’s procedures. The new assay results were compatible with the historical results.
Based on RPA’s review, it is of the opinion that sampling, sample preparation, and analysis at Chapada are in keeping with industry standards and the assay results within the database are suitable for use in a Mineral Resource estimate.
Samples are transported from the drill rig to Yamana’s core storage facilities at the Chapada project exploration camp by the drilling contractor, where Yamana geological staff log and sample the core. The samples are transported to the independent sample preparation facility by a locally based transport company, after which the samples are sent for preparation in ALS Chemex in Goiania, Brazil and for analysis in Lima, Peru.
The analytical laboratory stores all pulps and coarse rejects for forty-five days and then transports them back to the Chapada project where all samples are stored in the core storage facility for the life of the project.
Based on RPA’s review, it is of the opinion that sample security procedures at the Chapada Mine are in keeping with industry standards.
The 2015 exploration program consisted of limited infill drilling at the Corpo Sul deposit, defining the newly discovered Sucupira deposit which extends southwest from the Cava Norte pit and exploration target testing of the Chapada property. The combined programs completed 38,929 meters in 143 drill holes with 12,169 meters distributed in 64 infill and delineation holes and 26,760 meters distributed in 79 exploration holes.The infill and definition programs were successful in outlining new inferred gold and copper resources and upgrading exsisting inferred gold and copper reources to indicated
status. The exploration program defined targets for drill testing using soil sampling techniques, interpretation of geophysical data and geologic mapping. Targets drill tested include Sucupira, Interpits, Formiga and Mundinho.
Mineral Processing and Metallurgical Testing
For a discussion of mineral processing and metallurgical testing work completed by Yamana, see “ - Mining Operations”, below.
Mineral Resources and Mineral Reserves
See “- Mineral Projects - Summary of Mineral Reserves and Mineral Resource Estimates”.
The methodology of estimating Mineral Resources by Yamana includes: (a) statistical analysis and variography of gold and copper values in the assay database; (b) construction of a block model using Datamine Studio 3 software; and (c) grade interpolation using a kriging or inverse distance cubed method. The Mineral Resource estimate is based on open pit mining scenarios and Chapada and Corpo Sul Mineral Resources are constrained by Whittle optimized pits which are based on a copper and gold net smelter return.
Validation of the block models by Yamana included: (a) on screen displays of plans and sections showing composite and block grades; (b) swath plots calculated over “slices” of each zone; (c) comparisons between composite and global block statistics cross validation (Chapada only); and (d) cross-validation.
RPA finds the estimation methods and classification criteria adopted by Yamana are reasonable and sufficient to support the Mineral Resources reported.
RPA reviewed the reported resources, production schedules, and factors for conversion from Mineral Resources to Mineral Reserves. Based on this review, it is RPA’s opinion that the Measured and Indicated Mineral Resource within the final pit designs at Chapada can be classified as Proven and Probable Mineral Reserves.
RPA also stated that, to the best of their knowledge, the mineral resources were not materially affected by any known environmental, permitting, legal title, taxation, socio-economic, marketing, political or other relevant issues to the best knowledge of the author.
Mining Operations
The Chapada Mine is a traditional open pit truck/shovel operation that has been in continuous operation since 2007. The Chapada open pit, which is currently being mined, has ultimate design dimensions of approximately 4.5 kilometres along strike, up to 1.2 kilometres wide, and 200 metres deep. Benches are 10 metres high, doubling to 20 metres towards the limit of the pit, except in upper benches, where the benches are 10 metres high in soil. Six operating phases have been designed to support the mine production from initial topography to the final pit geometry. An in-pit primary crusher was installed, allowing a more flexible operation for ore blending to plant and reducing major truck fleet requirements.
The mine plan includes three open pit mining areas to be developed on the property. Current production is from the Chapada Corpo Principal and Corpo Sul open pits. The Corpo Sul open pit began production in 2014.
The processing plant is located at the northwest end of the Chapada Corpo Principal pit rim. The tailings storage facility is located to the northwest of the open pit, with the pond as close as 0.5 kilometres to the pit rim and the tailings dam being up to five kilometres to the northwest. Waste rock dumps are located to the south and southeast of the open pit. Limits of the waste rock dumps start just past the ultimate pit rim in order to minimize waste haulage distances.
The existing Chapada Mine treatment plant is designed to treat sulphide ore at a nominal rate of 60,000 tpd. The process recoveries for copper and gold averaged approximately 80% and 59%, respectively, from June 2013 to May 2014. Run-of-mine (“ROM”) material from the Suruca mineralization will be treated and incorporated into the system through two separate processes. The oxide ore will be processed using conventional heap leaching technology, and sulphide ore will be processed in the existing plant after some modifications.
Sulphide Ore
The first step for sulphide material occurs in the primary grinding circuit in two parallel crushing systems. Both systems perform the primary crushing with a P70 of five inches. The ore processed is then transported by conveyor belt to an intermediate stockpile. A feeder conveyor belt delivers the feed to the grinding circuit.
The grinding circuit is divided into four systems:
| |
| • | Reclaim Ore - Ore taken from the crushed ore stockpile and delivered to the semi-autogenous grinding (“SAG”) mill. |
| |
| • | Primary Grinding and Pre-Classification - SAG mill grinding and pre-classification using cyclones. |
| |
| • | Pebble Crushing - Transportation and crushing coarse pebbles screened from the SAG mill discharge. |
| |
| • | Secondary Grinding and Classification - Ball mill grinding and classification using cyclones. |
The ore is then brought to the flotation process in pulp form with approximately 35% solids. There are two flotation cell lines, rougher and rougher/scavenger. Each cell line produces two concentrates. The tailings from the rougher/scavenger system are sent to the final tailings storage facility. The last step in the process is thickening and filtration. The thickening process reduces the ore concentrate moisture content to an average of 8%. This is discharged in the concentrate storage shed to be loaded and shipped to customers.
Oxide Ore
The crushing circuit consists of two MMD sizers in series and associated equipment. Material is pre-screened ahead of the MMD sizer and crusher product then combines with screen undersize and is conveyed to the crushed product stockpile. Crushed product is then fed to an agglomeration drum. Prior to the drum, cement is added in a controlled fashion and a weak cyanide solution (barren pond solution) is added in the agglomeration drum, and mixed to produce agglomerates which are conveyed and stacked.
The agglomerated material is stacked on pads which are approximately 100 metres wide and 620 metres long. A weak cyanide solution from the barren solution pond is then used to leach the gold from the stacked ore. The solution filters through the agglomerated ore with the gold inherent in the ore leached to produce a gold rich solution. The gold rich solution collects at the base of the pad and is collected in the pregnant solution pond.
Pregnant solution flows through four adsorption columns in series and flows by gravity from one adsorption column to the next. The total residence time in the adsorption columns is in the order of 25 minutes. After acid washing, the loaded carbon is washed and sent to the elution column to remove gold from the loaded carbon. The gold removed from the loaded carbon cools in a flash cell and then reports to the two electrowinning cells in parallel. Gold in solution is removed onto stainless steel cathodes. The stainless steel cathodes are rinsed off with a high pressure washer. The cathode sludge is then filtered, dried in an oven, transferred to the barring furnace and the gold is then poured into molds.
Processing and Recovery Operations
The existing Chapada Mine processing plant is designed to treat sulphide ore at a nominal rate of 60,000 tpd. The process recoveries for copper and gold averaged approximately 80% and 59% respectively from June 2013 to May 2014 inclusive. The processing plant at Chapada currently incorporates a conventional flotation process including the following elements: (i)primary crushing; (ii) semi-autogenous grinding; (iii)secondary grinding (Ball Mill); (iv) flotation; (v) thickening; (vi) filtration; and (vii) tailings disposal
Heap leaching will be introduced to process oxide mineralization from the Suruca deposit, while sulphide ore from Suruca will be processed in the existing plant.
Infrastructure, Permitting and Compliance Activities
The necessary infrastructure is in place to continue the Chapada operation, including: (i) mine and mill infrastructure including office buildings, shops, and equipment; (ii) boytailings storage facility with additional capacity for two years with plans for further expansion; (iii) electric power from the national grid; (iv) haulage roads from the mines to the plant; (iv) stockpile areas; (v) maintenance facilities; (vi) administrative office facilities. Some equipment will require replacement in the future to sustain the operation and equipment replacement is provided for in the LOM plan and budgets.
Yamana has all the environmental permits required to operate the Chapada mine and process plant. Additional permits are occasionally required for expansion or construction projects. Mine closure will include total demobilization and
decommissioning of all equipment and installations. The tailings area, waste storage piles, and other affected areas will require revegetation. The closure plan is revised every three years or if there is a material change in mining activities.
Yamana is very active in engaging the local community with a series of cultural, social, and economic programs.
Capital and Operating Costs
RPA estimated the capital and operating costs in the Chapada Report. LOM capital costs included for capital projects, primarily Suruca, and sustaining capital, which includes closure costs. Capital costs are in first Quarter 2014 US dollars. LOM capital costs for Chapada were approximately $250 million and sustaining costs were approximately $190 million.
Exploration, Development and Production
The Chapada and Corpo Sul deposits are located on claim numbers 808.923/1974,808.931/1994 and 860.273/03 (mining licences) encompassing 3,830 hectares. The Suruca deposit is located on claim numbers 860.708/2009 and 860.595/2009 (exploration licences), totaling 845.75 hectares.
Production at the Chapada Mine in 2015 consisted of 119,059 ounces of gold and 274,533 ounces of silver, contained in concentrate compared to 107,447 ounces of gold and 296,955 ounces of silver contained in concentrate in 2014. Chapada Mine copper production was 131.0 million pounds in 2015 compared to production of 133.5 million pounds of copper in 2014. Annual precious metal production increased compared to 2014 as Corpo Sul contributed to increased gold grades partially offset by reduced throughput.
The 2015 exploration program at Chapada included a 12,000 metre infill program to upgrade and better define inferred and indicated mineral deposits at Corpo Sul and a 22,500 metre near mine program to explore southwest of the Corpo Sul deposit and elsewhere for new deposits and to test for skarn related deposits close to the main Chapada pit. A total of 12,169 metres were completed in 64 infill holes and 26,760 metres were completed in 79 holes in the near mine exploration program.
The infill programs at Corpo Sul were completed on 50 metre by 50 metre and 100 metre by 100 metre grid patterns and were successful in improving the mineral resource and reserve status of the areas drilled. The Near Mine exploration program discovered the Sucupira deposit immediately west and subparallel to the main Chapada Pit. The Sucupira deposit is a cigar shaped mineral body found in metavolcanic and metadiorite lithologies. The mineral body has a broad lower grade halo and a higher grade core which is modelled as an extension of the Cava Norte ore horizons. Preliminary resource estimations will classify a portion of the known mineral body as inferred, and subsequent drilling is planned to improve the resource categorization of mineralization shown to be continuous for 1.7 kilometres along the known strike extent.
El Peñón Mine
Unless otherwise stated, the information, tables and figures that follow relating to the El Peñón Mine are derived from, and in some instances are extracts from, the technical report entitled “Technical Report on the El Peñón Mine, Northern Chile” dated December 7, 2010 (the “El Peñón Report”), prepared by or under the supervision of (the “El Peñón Qualified Persons”) Stuart E. Collins, P.E., and Chester M. Moore, P. Eng., of RPA, and Kevin C. Scott, P. Eng., formerly with RPA. The technical information contained in this section of the annual information form, other than the technical information set forth above under the heading “Mineral Projects - Summary of Mineral Reserves and Mineral Resources Estimate” has been reviewed and approved by the El Peñón Qualified Persons and William Wulftange, P.Geo, Senior Vice President, Exploration of the Company, each of whom is a “qualified person” for the purpose of NI 43-101. See “Interests of Experts”.
Portions of the following information are based on assumptions, qualifications and procedures which are not fully described herein. Reference should be made to the full text of the El Peñón Report, which has been filed with certain Canadian securities regulatory authorities pursuant to NI 43-101 and is available for review on the Company’s SEDAR profile at www.sedar.com.
Property Description, Location and Access
The El Peñón Mine is located in the Atacama Desert in northern Chile, approximately 165 kilometres southeast of Antofagasta. Yamana owns 256 individual mining claims comprising an area of 49,302 hectares covering the El Peñón Mine, the Fortuna area and surrounding exploration lands. The Company became the 100% owner of El Peñón when it completed the final step of the acquisition of Meridian Gold Inc. (“Meridian”) on December 31, 2007. The mine operates on a year
round basis. Antofagasta is the principle source of supply for the mine. It is a port city with a population of 302,000 and daily air service to Santiago. The mine is accessible by a paved road, with travel time from Antofagasta to the mine being approximately 2.5 hours.
The El Peñón Mine is subject to a 4 - 5% royalty payment calculated over annual taxable income. In addition, a 2% net smelter return is payable to Gold Fields Limited as agreed in the purchase of the Nado claims covering the Fortuna area. Approximately $1,000,000 is payable by Minera Meridian Limitada to Gold Fields Limited on a yearly basis.
The El Peñón Mine has been operating since 1999 and has sufficient surface rights for mining and processing operations. As well, the El Peñón Mine has sufficient water, power and labour supplies and sufficient areas for tailings and waste disposal.
At the El Peñón Mine, the Company holds all the necessary environmental licenses and permits to operate the mine.
History
The discovery of El Peñón was the result of successful grassroots exploration carried out by geologists of FMC Gold Company (“FMC Gold”), predecessor to Meridian, through the early 1990s. Drill programs executed from 1993 through 2007 and prior to Yamana’s purchase of Meridian, Meridian and its predecessor FMC Gold completed 962,550 meters of exploration drilling and 616,909 meters of infill drilling. This work outlined approximately 5.5 million GEO of gold and silver resources that contained approximately 3.4 million ounces GEO of gold and silver reserves. In July 1998, Meridian made the decision to place the property in production, and construction on a 2,000 tpd mine and mill facility commenced later that same year. Production began in September 1999, ramping up to full capacity by January 2000 and has continued to the present day. Since September 1999, the operation has run continually at design and increased capacity, treating both open pit and underground ore.
As of December 31, 2009, the mine produced approximately 8,409,000 tonnes of ore grading 11.3 grams per tonne of gold and 264 grams per tonne of silver.
Historical Mine Production to December 31, 2009
|
| | | |
| Year | Tonnes | Au Grade (g/t) | Ag Grade (g/t) |
| 1999 | 369,290 | 13.96 | 215.08 |
| 2000 | 640,045 | 14.71 | 215.43 |
| 2001 | 707,199 | 18.92 | 300.08 |
| 2002 | 582,478 | 17.89 | 270.94 |
| 2003 | 542,616 | 16.40 | 247.50 |
| 2004 | 568,170 | 13.90 | 222.04 |
| 2005 | 734,372 | 12.35 | 236.69 |
| 2006 | 861,224 | 8.71 | 230.00 |
| 2007 | 968,159 | 8.17 | 291.45 |
| 2008 | 1,044,176 | 6.91 | 298.70 |
| 2009 | 1,391,486 | 5.82 | 289.22 |
| Mine Total | 8,409,215 | 11.29 | 263.55 |
The mineralized veins at El Peñón have received significant amount of underground development. In total, approximately 87,600 metres of underground development has been carried out from 1998 to December 2009.
Underground Development, 1998-2009
|
| |
| Year | Mine Development (m) |
| 1998 | 2,901 |
| 1999 | 9,445 |
| 2000 | 4,386 |
| 2001 | 5,262 |
| 2002 | 5,678 |
| 2003 | 5,893 |
| 2004 | 7,493 |
| 2005 | 9,249 |
| 2006 | 8,610 |
| 2007 | 9,547 |
| 2008 | 9,573 |
| 2009 | 9,599 |
| Total | 87,635 |
Geological Setting, Mineralization and Deposit Types
The El Peñón Mine is located in the Central Depression of the Atacama Desert. The region is underlain by Late Cretaceous and Early Eocene magmatic arc rocks, of the Paleocene belt. Rocks in the region consist of basaltic to rhyolitic lavas and tuffs, subvolcanic porphyritic intrusions, and granitoid stocks, which extend from southern Peru to central Chile. This belt hosts many epithermal deposits and subvolcanic porphyry systems.
The mineralization at El Peñón is hosted by near-horizontal to gently dipping Eocene to Paleocene basaltic to rhyolitic volcanic rocks. The stratigraphic sequence consists of a lower sequence of volcanic breccia and andesitic to basaltic flows, overlain by rhyolitic to dacitic pyroclastic rocks, dacitic to andesitic flows, and volcanic breccia. Rhyolitic intrusives, domes, and associated flows are intercalated with earlier volcanic units. The distribution of Cretaceous and Eocene volcanic rocks is controlled by graben structures bounded by north-northeast trending faults. These are steeply dipping regional-scale structures with displacements in the order of hundreds of metres. The principal direction for late dikes and many of the highest grade mineralized faults is parallel to the bounding faults. Mineralized faults dip steeply eastward on the east side of the property and westward on the west side, in a fashion implying a horst/graben extensional structure. Most of the mining takes place along north-trending veins. A relatively minor amount of production has taken place along northeast-striking structures.
The deposits at El Peñón are low to intermediate epithermal gold-silver deposits, hosted in steeply dipping fault-controlled veins. Gold and silver mineralization consists of disseminated electrum, native gold, native silver, silver sulphosalts, and silver halides occurring in a gangue of predominantly quartz, adularia, carbonate, and clay. Electrum is the most common form of precious metals in the deposit and occurs as micron to millimetre-size subrounded and irregular grains. Two phases of electrum are present: a primary phase, which contains approximately 55% to 65% gold, and a secondary phase, which has resulted from supergene processes that have remobilized silver and which typically consist of over 95% gold.
Sulphide minerals are relatively rare, and this may be due to oxidation, or to an initial low overall abundance such as would occur in a low sulphidation environment. Abundant iron and manganese oxyhydroxides are common with only trace occurrences of relict sulphides. In order of abundance, trace amounts of pyrite, galena, sphalerite, chalcocite, and covellite can be present. Gangue minerals comprise fracture and breccia-filling and replacement quartz, adularia, carbonates, and clay minerals. Vein textures often display crustiform textures, although the highest grade gold-silver mineralization is reported to be associated with massive banded quartz-adularia. Gangue minerals occur as open space filling as well as replacements of primary host rock mineral phases.
There are thirteen main vein zones and many subsidiary veins in nine vein systems that have supported, support currently, or are planned to support surface and underground mining operations. The veins strike predominantly north-south
and dip steeply to the east and west. North-northeast to northeast-striking fault zones are also host to mineralized zones, however, the relative proportion of the overall deposit is small. The principal mineralized veins are Al Este, Bonanza, Cerro Martillo/Dorada, Dominador, El Valle/Discovery Wash, Fortuna, Martillo Flats, Pampa Campamento, Playa, Providencia, Quebrada Colorada, Quebrada Orito, and Vista Norte.
The deposit comprises several individual tabular, steeply dipping zones or shoots that are amenable to mining by both underground and surface methods. Vein widths range from decimetre-scale to over 20 metres. Individual mineralized shoots measure from less than one kilometre to four kilometres in strike length, and up to 350 metres in the down-dip direction. Gold grades range up to hundreds of grams per tonne but are more typically less than 30 grams per tonne. Silver grades are in the order of hundreds to thousands of grams per tonne.
This description of the deposit type and mineralization styles remains accrurate through 2015.
Exploration
Regional exploration focusing on Early to Mid-Eocene volcanic belts in northern Chile led to the acquisition of the El Peñón Mine in 1993. Trenching carried out that year, followed by a 13-hole drilling program, discovered significant gold and silver mineralization. The next year, the first hole of a follow-up program intersected 100 metres grading 10.9 grams per tonne of gold and 123.4 grams per tonne of silver in what eventually became the Quebrada Orito deposit.
In 2009, 57,935 metres of exploration drilling and 58,149 metres of infill drilling were completed. This drilling was designed to locate the extensions of known veins and discover new veins in order to replace the Mineral Reserves and Mineral Resources extracted in the mining areas. The 2009 exploration program included Mineral Resource definition and extension drilling in various areas such as Abundancia and Esmeralda, Al Este, Bonanza Norte, and Martillo Flats. New discoveries were made at Martillo Central Sur, and Martillo Flats Hangingwall, and vein extensions were located at Bonanza Norte, Pampa Campamento, and Sorpresa. Mineral Resource infill drilling occurred at Bonanza Norte and Pampa Campamento.
In 2010, to the end of September, a total of 39,905 metres of exploration and 54,820 metres of infill drilling were completed. The 2010 drilling is designed to locate the extensions of known veins and discover new veins in order to replace the Mineral Reserves and Mineral Resources extracted in the mining areas. The 2010 exploration program included Mineral Resource definition drilling at Al Este, Dorada, Providencia, Sorpresa, Pampa Campamento, and Martillo Central Sur. Extension drilling took place in various areas such as Abundancia and Esmeralda, Al Este Norte, Bonanza Norte, Fortuna, and Martillo Flats.
During the period of 2011 through the end of 2015, Yamana has executed exploration, infill and ore delineation programs in all sectors of the current mine extents. This work discovered new veins such as Providencia NW, Aleste Sur, Dorada Sur, Ventura and extended Bonanza to the north ansd south. In 2015, Yamana completed 34,094 metres of regional exploration drilling and a combined 148,661 metres of local infill and in-mine exploration drilling. These programs developed resources at Ventura, Chiquila Chica and Laguna along with other targets within the mine complex.
See also “- Exploration, Development and Production”.
Drilling
Systematic testing of the gold-bearing zones was started by Meridian in 1993 and continues to the present. Exploration work has continued in order to develop drill targets to replace Mineral Reserves. Drilling is carried out on a nominal 60 metres x 60 metres pattern, with infill holes drilled on a 30 metres x 30 metres pattern. Preliminary Mineral Resource estimates are made using the drill information. Later, the estimates are refined using chip sample assays collected from the underground development. Underground definition drilling is completed on a 30 metres x 30 metres spacing where required and some drilling is carried out on a 15 metres x 15 metres pattern if needed for grade control purposes, and to aid in resolving local structural complexities. Short test holes are also used to locate veins to assist mining and grade control.
Surface drilling is mostly reverse circulation (“RC”), with at least one diamond drill hole per 30 metres section. Often, holes are collared with RC equipment, until the hole is almost in the zone, and then changed over to diamond core. Some are cored for the entire length. Core size is HQ (63.5 millimetres core diametre), sometimes reduced to NQ (47.6 millimetres diametre). RC holes are drilled with 146 millimetres diametre equipment, which produces a hole approximately 152 millimetres in diametre.
Exploration has been successful in expanding the footprint of mineralization at site through programs of geologic mapping, geochemistry, geophysics and abundant surface and underground drilling within this northeast trend starting with Quebrada Orito in the southwest and ending with the most recent discovery Bonanza in the northeast. Numerous geophysical anomalies and positive drill intersections remain to be followed up within this corridor.
See also “- Exploration, Development and Production”.
Sampling, Analysis and Data Verification
Samples are taken by surface and underground drilling and by panel sampling of mine headings. Surface drilling typically is carried out to trace the structures and estimate Mineral Resources. Mine sampling comprises both definition diamond drilling as well as sampling of development headings for grade control. The exploration samples consist of RC cuttings and half-core splits of diamond drill core. The mine samples are drift face panel samples and whole drill core.
Exploration RC samples are taken at two-metre intervals outside and one-metre intervals inside a mineralized zone. The drillers take two samples from every interval, splitting the cuttings with a riffle-type sampler. Each sample represents 18.75% of the total sample. Samples are placed in plastic bags and transported to the on-site Acme Analytical Laboratories Ltd. (“Acme”) sample preparation facility. One sample is kept for reference and the other is prepared for analysis. Specimens are also collected in chip trays for logging.
Surface drill core is delivered to the logging and sampling facility located near the mill/office complex. Core is logged and marked for sampling by the geologist. Sampling technicians photograph the intact core, split the core samples, place them in plastic bags, and deliver them to the sample preparation facility. All surface samples are assayed by Acme in La Serena.
Mine drill hole samples are collected in the same fashion as exploration holes, except that they are delivered to the mine site laboratory.
Each underground drift face is mapped and sampled by the grade technicians. Samples comprise chips taken from panels measuring approximately one metre high and a maximum of one metre wide. Minimum sample widths are 30 centimetres in the vein and 50 centimetres in the waste. Boundaries to the sampled areas are placed at vein contacts and major structures. The sample sizes are constrained to between five kilograms and nine kilograms. The geological technicians measure the distance and direction from the nearest survey station to the sampled interval. The samples for each face are rendered as linear strings of samples in a fashion similar to drill holes (pseudo-drill holes). The “collar” of the drill hole is the left-hand end of the sample string. The “azimuth” is approximated as the direction parallel to the drift face. Sample lengths are projected to the face onto a linear trace of the pseudo-drill hole to account for irregularities or curvature of the face.
El Peñón used Acme, an ISO 9001:2000 certified laboratory in Santiago, Chile, and Geoanalitica Ltda. (“Geoanalitica”), an ISO/IEC 17025 certified laboratory in Coquimbo, Chile, for all assaying of the surface and underground exploration plus infill drilling. Pulp samples are sent for analysis in sealed batches by truck/air. The El Peñón laboratory handles all production samples from the mine. Certified standards and duplicates, as well as pulp blanks and sterile sample, were used for quality control purposes. Pulp samples were resubmitted to a second outside laboratory (Andes Analytical Assay Ltda. (“Andes”) ISO 9001:2000 in Santiago, Chile).
In 2010, El Peñón began submitting pulp samples to ALS Chemex in La Serena, Chile, as well as Acme and Geoanalitica. Yamana operates at arm’s length from these laboratories.
The following procedure was used for El Peñón’s sample preparation and assaying:
| |
| • | A submittal form was filled out by a geologist or technician and delivered with the samples to the Acme preparation facility. |
| |
| • | Samples were opened and dried at 60ºC as required. |
| |
| • | The entire samples were crushed to better than 85% -10 mesh. Crushers were cleaned with compressed air between every sample and with barren waste every 5th sample and quartz every 40th sample. Granulometric checks were done every 20 samples. |
| |
| • | A 500-gram subsample was taken and the split was pulverized using a chrome-steel ring mill to better than 85% -150 mesh. Granulometric checks were done every 20 samples. Pulverizers were cleaned with compressed air between every sample and with waste every 5th sample. |
| |
| • | Two 250-gram pulps were separated, one for analysis and one for storage. |
Standard fire assay (“FA”) methods using a 50-gram pulp sample were used to determine total gold content. Samples assaying greater than or equal to 5 parts per million of gold using FA with an AAS finish were reassayed (FA) with a gravimetric finish for accuracy. Assays for silver were completed using an aqua regia digestion of a sample followed by AAS. Samples for which the preliminary assay is greater than 100 grams per tonne of silver but less than 5 grams per tonne of gold (i.e., high silver but low gold) are rerun using a four-acid digestion and AA.
In 2009 (to November 9), Acme prepared 38,896 samples and sieve tests indicate that the preparation of the samples was completely acceptable. A total of 1,599 tests (4.1%) for crushing and 1,561 tests (4.0%) for pulverizing were completed. Only one pulverizing test returned a result under 95% passing 150 mesh and it was 94.72%, which is acceptable.
Between January 1 and November 9, 2009, a total of 41,343 samples were shipped to Acme, Geoanalitica, and Andes for analysis. A total of 15 standards at various gold and silver grades were used. During this period, Acme prepared 34,301 pulps from 201 surface drill holes and inserted 739 control samples in the analytical stream with these samples. Results from 127 sterile samples inserted to monitor sample preparation were 100% satisfactory for both gold and silver. Results from 186 sample blanks inserted to monitor contamination during analysis were 97% acceptable for gold and 100% acceptable for silver. The results for the 305 standard samples inserted into the sample stream were 100% acceptable for gold and 97% for silver. The silver failures were reanalyzed as required.
A total of 732 preparation duplicates and 265 analytical duplicates were analyzed for El Peñón. Only seven preparation duplicates and five analytical duplicates required remedial action. Overall correlation was excellent for both gold and silver.
As well, 28,025 production samples (drill core, channel samples, muck samples) were shipped to the El Peñón laboratory in 2009, which uses similar protocols to Acme.
Sample security is considered adequate since all samples are collected and prepared in secure sites and transported by Yamana personnel and/or selected contractors.
Mineral Processing and Metallurgical Testing
See below under “ - Mining Operations”.
Mineral Resource and Mineral Reserve Estimates
See “- Mineral Projects - Summary of Mineral Reserve and Mineral Resource Estimates”.
The methodology of estimating Mineral Resources includes:
| |
| • | Statistical analysis and variography of gold and silver values in the assay database as well as on sample composites. |
| |
| • | Construction of a block model using Vulcan software. |
| |
| • | Grade interpolation using kriging method, and inverse distance squared (ID2) method for veins which did not have sufficient data to calculate variograms. |
All Mineral Reserves are estimated using modern software programs. Vulcan is the general mine package used in conjunction with Microsoft Excel and AutoCAD.
The economic value of each potential mining outline is calculated using forecast long-term prices per ounce of gold and per ounce of silver, using diluted tonnes and grades, as stated in the “- Mineral Projects - Summary of Mineral Reserve and Mineral Resource Estimates”. Net block values are weighed against forecast costs and metallurgical recoveries for each potential mining outline. These combined economic revenue and cost models are part of the Selective Mining Unit (“SMU”) models.
The procedure for determining the Mineral Reserve blocks for Proven Mineral Reserves and Probable Mineral Reserves is summarized below:
| |
| • | The geological interpretation and Mineral Resource estimation is supplied by the geology staff. |
| |
| • | An SMU is determined based on the mining method employed, geomechanical rock properties, dilution expected, and the block values. |
| |
| • | SMU solids are designed in Vulcan and AutoCAD. |
| |
| • | Additional economic criteria are applied which include metal prices, operating costs, and recoveries. |
| |
| • | Blocks are analyzed for inclusion into the LOM Plan. |
| |
| • | If the value of the mining block is positive, then a development cost analysis is applied to the block before final inclusion in the LOM Plan. |
The authors of the El Peñón Report were not aware of any environmental, permitting, legal, title, taxation, socio-economic, marketing, political, or other relevant issues that would materially affect the Mineral Resource or Mineral Reserves estimate. Mining Operations
Mining Method and Metallurgical Process
The primary mining method is an underground bench and fill method and all access to the veins is by ramps and crosscuts. Veins are separated by a distance of 100 metres to 500 metres. The application of this method will vary between veins, but it is usually applied to sublevels spaced between 10 metres and 18 metres. Vein dips are steep and the bench drifts are built along the strike of the vein. A top access drift is driven for drilling, and a bottom access drift is driven for ore extraction. Depending on the vein width, the access drift dimensions are generally 3.5 metres wide by 4.0 metres high. Both the drill access drift and the lower ore extraction drift are grade-control sampled every drill, blast, load and haul cycle.
For design and operating, the typical parameters for the SMU are for stope dimensions of one metre to six metres width by six metres to 16 metres height by 15 metres length. Vein widths will dictate how much dilution will be realized during the mining of the stope.
Options to reduce the mining dilution are either to use narrower stope widths or employ a resueing mining method. Resue (split blasting) mining consists of mining the ore first in a drift, and then blasting and loading just enough width to allow for mining equipment access. If narrow stope widths are used to reduce dilution, then smaller equipment is needed to work in the narrower underground openings.
Once the drifts are established and the required ground control support is applied, the production stoping of the ore body commences. Backfilling is performed after the stope is mined out.
El Peñón has employed open pit mining in the past. There are no significant open pits planned for the El Peñón veins, but small tonnages of near-surface, lower-grade material may be mined in the future to provide additional mill feed.
All underground mining drift, cross cut, and stope areas are first approved by El Peñón geotechnical staff before any full scale production commences. Monitoring of the production stopes and development areas is also performed by the geotechnical staff. Typical ground support includes, but is not limited to, split-set bolts, resin bolts, wire mesh and shotcrete.
The El Peñón processing plant has been modified with the potential to increase production capacity to approximately 4,350 tpd of stockpiled and mined ore, or 1.59 million tonnes per year. Yamana has accomplished this by steadily increasing throughput through the addition of new equipment to the process plant. In addition, through the latter part of 2007 and early 2008, the product grind size to feed the cyanide leaching circuit was steadily increased from a P80 of 120 ìm to 180 ìm, which allowed more tonnage throughput at the expense of a small reduction in recovery.
In 2016 the plant is scheduled to process an average of 4,136 tpd.
ROM stockpile ore is dumped onto a grizzly and passes through to a 100-tonne live storage bin. From there ore is fed to a 950 millimetres x 1,250 millimetres jaw crusher by an apron feeder. Ore is further crushed in a newly installed secondary cone crusher that produces a crushed product P80 of 30 millimetres.
Crushed ore is stored in a 1,500 tonne capacity bin, from which it is fed to a 4.72 metres x 7.77 metres 2,500 kW SAG mill. A new 4.27 metres x 6.10 metres diameter ball mill was added in series with the SAG mill in 2009 to increase mill capacity. Pebbles from the SAG mill are crushed in a pebble crusher. Cyanide solution and lime are added in the grinding circuit. The grinding mills are in closed circuit with hydrocyclones.
The grinding circuit product, the cyclone overflow at a nominal P80 of 180 ìm, is sent to a thickener where the solution is thickened to 50% solids with the underflow reporting to a cyanide leaching circuit. The thickener overflow is sent to the unclarified solution tank. The leaching circuit product is sent to a counter current decantation (“CCD”) circuit.
The precious metals are recovered in a zinc precipitate Merrill-Crowe process. The overflow solution from the first CCD thickener is sent to the mill solution storage tank or alternatively to the unclarified solution tank. Mill solution is recycled to the SAG mill.
Unclarified solution is sent to the clarification circuit where it is filtered ahead of reporting to the pregnant solution tank. Some additional equipment was added to the clarification circuit in 2009. The solution is then de-aerated in a vacuum tower and zinc dust is added ahead of pressure filters. A pre-coat filter aid is added ahead of the filters as well as the clarification filters. Gold and silver are precipitated on the zinc dust which is collected from the pressure filters and calcined in a mercury retort to remove contained mercury. The calcined precipitate is then smelted in a tilting furnace with slag making additives to make doré bars containing approximately 2.1% gold and 97.9% silver.
The thickened solution from the 4th thickener underflow in the CCD circuit is sent to a surge tank and then the contained water is removed by belt filters. The filtered product at approximately 20% solids is sent to the dry tailings impoundment area.
The mill throughput has steadily increased over the years. The throughput has increased from approximately 2,500 tpd in 2005-2006 to 3,600 tpd in 2009 and eventually to a nominal production rate of 4,350 tpd starting in December 2009 with the mill expansion project. This has allowed gold production to stay reasonably constant despite falling head grades.
The gold head grade has steadily decreased from over 11 grams per tonne of gold in 2005 to close to 5.3 grams per tonne of gold in 2015. In 2015 it averaged 5.3 grams per tonne of gold. Gold recovery has been impacted by the falling of the head grade as well as the increase in grind size, trending down from 96% to 91%. In 2015 it averaged 94%.
Silver is an important by-product of the El Peñón operation. Silver grades have remained more constant than gold grades as the silver to gold ratio has changed from approximately 36:1 to over 24:1 in the last three years. Silver recovery has typically been 7% to 12% less than gold recovery.
The metallurgical recoveries have been relatively consistent,- averaging 91.3% for gold and 86.6% for silver over the last three years with the increase in mill throughput. For 2013 to 2015, the metallurgical recovery for gold has averaged 93.3% while silver has averaged 81.9%. El Peñón expects that the recoveries will increase to 94% for gold and 92% for silver at the base case mill production rate of 3,150 tpd processed
The 2009 mill expansion project, which increased the nominal mill capacity to 4,350 tpd, was reported to have cost $8.9 million, including $2.8 million in equipment costs and $4.1 million in construction costs. These mill modifications have increased capacity or alternatively allow El Peñón the ability to increase the metal recoveries due to longer grinding times which produce finer particles for leaching, and also allow for longer leach times to increase recovery.
The number of processed tonnes are based on weightometer readings that are located on the SAG mill feed conveyor and at the tailings discharge point. Daily analytical results from samples of plant solutions and tailings discharge are used to calculate plant metallurgical performance. Metal sales and inventory contained in the circuit and refinery are determined at the end of each month and appropriate adjustments are made. From this information, the mill reports the back-calculated head grades of the mill feed.
Processing and Recovery Operations
Please see above under “Mining Method and Metallurgical Process”.
Infrastructure, Permitting and Compliance Activities
Surface infrastructure at El Peñón comprises a physical plant site, including administrative office complex and associated facilities, accommodation complex, open pit and underground mines, the mill and associated facilities such as the laboratories, ore stockpiles, waste dumps, coarse ore storage, workshops, warehouses, and dry facilities. Underground infrastructure includes portals, access ramps, ventilation raises, maintenance shops, and mobile equipment fleet.
In 2015, El Peñón received a national safety award which recognized the mine as the top performer (out of 900 Chilean companies) in Health & Safety. The voting committee was comprised of the Ministry of Labor, National Union representatives, Industrial and Construction Associations and Universities, among others.
Capital and Operating Costs
The total capital expenditures estimated by Yamana for the LOM operations are $370 million. These costs include mine and plant costs as well as exploration and administration capital, but do not include working capital or any future expansions. Scott Wilson RPA is of the opinion that the total estimated capital expenditures for the Project are reasonable. Operating costs are forecast to average $129 per tonne milled. The authors of the El Peñón Technical Report were of the opinion that the total estimated operating costs for the Project are reasonable.
Exploration, Development and Production
El Peñón produced 227,288 ounces of gold and 7.7 million ounces of silver in 2015, compared to 282,617 ounces of gold and 8.5 million ounces of silver in 2014.
During 2015, a total of 148,757 metres were completed in 513 drill holes at El Peñón. The exploration program completed 40,950 metres in 110 holes and the infill program completed 105,807 meters in 403 holes. In addition to the mine based programs, the district exploration program completed 34,092 metres in 67 holes testing targets beyond the El Peñón Mine footprint.
The majority of the infill drilling was completed on the Ventura, Dorada Sur, Dorada FW, Aleste Sur and Ventura W structures and other mineral zones. The majority of the exploration programs tested the Abundancia, Borde Oeste, Ventura, Laguna and Aleste structures.
During 2015, the exploration program focused on targets in the north block parallel and adjacent to the Ventura structure. Several subparallel veins were cut by drilling close to the Ventura structure that display good grade over less than 1 metre widths. The exploration program also tested the Abundancia-Borde Oeste structure to the west of Ventura and found mineralized intercepts spaced approximately 200 metres apart that have narrower, weak to nil intercepts between holes. This area will require further consideration in 2016. Exploration efforts during 2015 point to mineral continuity both in the northeast portion of the El Penon mineral trend along with to the south of Dorada and elsewhere on the property which will be developed in 2016.
Infill drilling of the Ventura structure has maintained the original 1,200 metre strike length of the mineral body and reduced the vertical extent to 100 to 200 metres. The core zone measures 400 metres along strike and 100 to 200 metres down dip and is currently being evaluated for reserve potential.
Canadian Malartic Mine
Unless otherwise stated, the information, tables and figures that follow relating to the Canadian Malartic Mine are derived from, and in some instances are extracts from, the technical report entitled “Technical Report on the Mineral Resource and Reserve Estimates for the Canadian Malartic Property” dated August 13, 2014, and effective June 16, 2014 (the “Canadian Malartic Report”). Donald Gervais, P. Geo., of Canadian Malartic General Partnership (“Canadian Malartic GP”) has reviewed and approved the technical information contained in this section of the annual information form, and is a “qualified person” for the purpose of NI 43-101. See “Interests of Experts”.
Portions of the following information are based on assumptions, qualifications and procedures which are not fully described herein. Reference should be made to the full text of the Canadian Malartic Report, which has been filed with certain Canadian securities regulatory authorities pursuant to NI 43-101 and is available for review on the Company’s SEDAR profile at www.sedar.com.
Property Description, Location and Access
The Canadian Malartic Mine is located approximately 25 kilometres west of the City of Val-d’Or and 80 kilometres east of City of Rouyn-Noranda. The mine lies within the town of Malartic. It straddles the townships of Fournière, Malartic and Surimau. At December 31, 2015, the Canadian Malartic Mine was estimated to have Proven and Probable Mineral Reserves containing approximately 7.73 million ounces of gold comprised of 221.5 million tonnes of ore grading 1.08 grams per tonne. See “- Mineral Projects - Summary of Mineral Reserve and Mineral Resource Estimates”.
The Canadian Malartic Mine can be accessed either from the City of Val-d’Or in the east or from Rouyn‑Noranda in the west via Québec provincial highway No. 117. A paved road running north-south from the town of Malartic towards Mourier Lake cuts through the central area of the Canadian Malartic Mine. The Canadian Malartic property is further accessible by a series of logging roads and trails. The Canadian Malartic Mine is also serviced by a rail-line which cuts through the middle of the town of Malartic. The nearest large airport is located in the City of Val-d’Or, about 25 kilometres east of the Canadian Malartic Mine.
The Company acquired its 50% interest in the Canadian Malartic Mine on June 16, 2014 through its joint acquisition of Osisko with Agnico Eagle. See “General Description of the Business - History - Canadian Malartic Mine - Acquisition” for further details of the Company’s acquisition of its 50% interest in the Canadian Malartic Mine.
The Canadian Malartic Mine operates under mining leases obtained from the Ministry of Natural Resources (Québec) and under certificates of approval granted by the Ministry of Sustainable Development, Environment and the Fight Against Climate Change (Québec). The Canadian Malartic Mine is comprised of the East Amphi property, the CHL Malartic prospect and the Canadian Malartic property. The Canadian Malartic Mine consists of a contiguous block comprising one mining concession, five mining leases and 208 mining claims covering an aggregate area of 8,735.9 hectares. The Canadian Malartic Mine is owned by Canadian Malartic GP.
The Canadian Malartic mining claims give Canadian Malartic GP the right to explore for mineral substances on the subject land; the mining leases give Canadian Malartic GP the right to mine mineral substances on the subject land; and the mining concession gives Canadian Malartic GP the right to mine mineral substances and with surface rights limited to those necessary for mining activities on the subject land. Expiration dates for the mining leases on the Canadian Malartic property vary between December 3, 2015 and February 17, 2034, and are automatically renewable for three further ten‑year terms upon payment of a small fee.
Following the joint acquisition of the Canadian Malartic Mine by the Company and Agnico Eagle, most of the mining claims are subject to a 5% net smelter return royalty payable to Osisko Gold Royalties Ltd. (“Osisko Gold Royalties”). The mining claims comprising the CHL Malartic prospect are subject to 3% net smelter return royalties payable to each of Osisko Gold Royalties and Abitibi Royalties Inc. In addition, of the 208 mining claims constituting the Canadian Malartic property, 101 are also subject to other net smelter return royalties that vary between 1% and 2%, payable under varying circumstances. In 2015 Canadian Malartic GP, the operator of the Canadian Malartic mine, paid C$53.01 million in the aggregate with respect to these net smelter return royalties, and expects to pay approximately C$50.8 million in 2016.
As of December 31, 2010, the Canadian Malartic Mine had received all formal government permits required for its construction and related activities, with the exception of the authorization for the mill and mine operations. The official certificate of authorization for the mill and operations was granted on March 31, 2011, at which point the Canadian Malartic Mine was fully permitted.
History
Gold was first discovered in the Malartic area in 1923. Gold production on the Canadian Malartic property began in 1935 and continued uninterrupted until 1965. Following various ownership changes over the ensuing years, Osisko acquired ownership of the Canadian Malartic property in 2004. Based on a feasibility study completed in December 2008, Osisko completed construction of a 55,000 tpd mill complex, tailings impoundment area, 5 million cubic metre polishing pond and road network by February 2011 and the mill was commissioned in March 2011. The Canadian Malartic Mine achieved commercial production on May 19, 2011. From 2011 until December 31, 2015, the Canadian Malartic mine produced 2.17M ounces of gold and 1.90M ounces of silver from 78.4M tonnes of ore grading 0.97 grams of gold per tonne and 1.04 grams of silver per tonne.
During the period from 1935 to 1983, the Canadian Malartic, Barnat/Sladen and East Malartic mines produced a total of 5,545,000 ounces of gold and 1,854,300 ounces of silver, mostly from underground operations. Two small open pits (Buckshot and Mammoth) were excavated at the Barnat and East Malartic mines, to recover mineralization from crown pillars after the backfilling of underground stopes.
Gold production statistics for the Canadian Malartic, Barnat/Sladen and East Malartic mines (from Lavergne, 1985)1
|
| | | | |
| | Canadian Malartic Mine | Barnat/Sladen | East Malartic Mine | Total |
Years of Production Ore milled (metric tonnes) Au Grade (g/t) Ag Grade (g/t) Gold ounces Silver ounces | 1935 - 1965 9,929,000 3.77 2.47 1,203,477 788,485 | 1938 - 1970 8,452,000 4.73 1.17 1,285,321 317,934 | 1938 - 1983 18,316,000 5.19 1.27 3,056,251 747,869 |
36,697,000 4.70 1.57 5,545,050 1,854,288 |
1 Canadian Malartic Report
Before the acquisition by Agnico Eagle and Yamana in June 2014, the Canadian Malartic mine was previously owned by Osisko (2004-2014). Founded in 1998 by Robert Wares, Osisko tagged this area in early 2004 as a probable porphyry gold system that constituted a high priority acquisition target. The acquisition of the initial claim block (2004) led to the acquisition of a large, unpublished paper database from the old Canadian Malartic mining operations. Digitalisation, compilation and analysis of the large database over the following four months, including logs of over 4,500 surface and underground drill holes, allowed Osisko to refine the geological model for the gold deposit and confirm its bulk tonnage potential. This led to immediate drill-testing of the model and in March 2005, Osisko drilled its first hole at the western extremity of the deposit. Subsequent 2005 drilling (total of 7,400 m) successfully tested N-S sections, establishing the 500 to 700 m width of the deposit to a depth of approximately 250 m. The continued drilling success in 2006 led to additional financings for Osisko, paving the way for a major drill program launched in the fall 2007: a 330,000 m definition drill program on a 30 x 30 m grid, covering the entire deposit and designed to convert the deposit to a NI 43-101 compliant Measured and Indicated (M&I) resource. In March 2008, a preliminary economic assessment study of the Canadian Malartic Project was filed on the SEDAR website. By September 2008, Osisko had outlined an in situ M&I resource of 7.69 Moz gold (232.2 Mt @ 1.03 g/t Au; 6.42 M in-pit M&I ounces in a US$775 Whittle pit shell and cut-off grade of 0.36 g/t Au), with an additional 0.72 Moz in the Inferred category (Hennessey et al., 2008). The feasibility study was completed by December 2008, outlining Proven & Probable (P&P) reserves of 6.28 Moz gold (183.3 Mt @ 1.07 g/t Au with a lower cut-off of 0.36 g/t Au at US$775/oz) (Runnels al., 2008c). The study recommended a 55,000 tpd milling operation with strip ratio of 1.78 with a LOM of 10 years for 5.4 M oz recovered (85.9% recovery by whole-ore leach). CAPEX was estimated at US$790 million with OPEX at US$320/oz. The year 2009 focused on definition drilling of the South Barnat deposit, representing in good part the eastern extension of the Canadian Malartic deposit where it is truncated by the Cadillac Fault. Approximately 180,000 m were drilled into the Sladen Extension and the South Barnat deposit. In February 2009, the first resource estimate on South Barnat (Belzile, 2009a) added 2.04 M in-pit ounces in the Measured and Indicated categories (37.1 Mt @ 1.71 g/t Au). A second resource estimate was published on June 2009 stating that Osisko had outlined an in situ M&I in-pit resource of 2.04 Moz in a US$775 Whittle pit shell (cut-off grade of 0.36 g/t Au), with an additional 0.07 Moz in the Inferred category (Belzile, 2009b). By January 2010, this new extension was added to the main Canadian Malartic deposit and a new integrated P&P reserve of 8.97 M oz gold (245.8 Mt @ 1.13 g/t Au) was calculated (Belzile and Gignac, 2010). The new reserve was calculated using a US$825 engineered pit shell at a lower cut-off of 0.34 g/t Au.
Meanwhile, the construction permits for the Canadian Malartic Mill and mine site civil works were obtained in August 2009. By the beginning of 2010, construction was well underway and permitting was obtained for a satellite (starter) pit. Construction of a 60,000 tpd mill complex, tailings impoundment area, 5 M cubic metre polishing pond and road network was completed by February 2011 and the mill was commissioned in March 2011. A new reserve estimate was release in March 2011, outlining a P&P reserve of 10.71 M oz gold (343.7 Mt @ 0.97 g/t Au) (Belzile and Gignac, 2011). The new reserve was calculated using a US$1000 engineered pit shell at 0.30 g/t Au lower cut-off. The mine reached commercial production on May 19, 2011 and produced from 2011 to December 31, 2015 a total of 2,170,979 oz Au.
Gold and silver production from 2011 to December 31, 2015
|
| | | | | |
| Canadian Malartic Mill Gold Production from 2011 to 2015 |
| Year | Tons milled (metric tons) | Feed grade (g/metric ton) | Metal Feed (oz) | Metal Recovered (Oz) | Recovery Factor |
2011 2012 2013 2014 2015 | 8 502 323 14 046 526 18 008 250 18 705 550 19 089 527 | 0.835 0.962 0.924 1.002 1.048 | 228 195 434 399 536 217 602 893 643 376 | 200 137 388 478 475 277 535 470 571 617 | 87.7% 89.4% 88.9% 88.8% 88.8% |
| TOTAL | 78 402 176 | 0.970 | 2 445 080 | 2 170 979 | 88.8% |
|
| | | | | |
| Canadian Malartic Mill Silver Production from 2011 to 2015 |
| Year | Tons milled (metric tons) | Feed grade (g/metric ton) | Metal Feed (oz) | Metal Recovered (Oz) | Recovery Factor |
2011 2012 2013 2014 2015 | 8 502 323 14 046 526 18 008 250 18 705 550 19 089 527 | 0.700 0.760 1.035 1.185 1.272 | 191 283 343 079 599 480 712 614 780 759 | 114 130 230 273 422 619 533 315 600 908 | 59.7% 67.1% 70.5% 74.8% 77.0% |
| TOTAL | 78 352 176 | 1.043 | 2 627 214 | 1 901 245 | 72.4% |
Geological Setting, Mineralization and Deposit Types
The Canadian Malartic property straddles the southern margin of the eastern portion of the Abitibi Subprovince, an Archean greenstone belt situated in the southeastern part of the Superior Province of the Canadian Shield. The Abitibi Subprovince is limited to the north by gneisses and plutons of the Opatica Subprovince, and to the south by metasediments and intrusive rocks of the Pontiac Subprovince. The contact between the Pontiac Subprovince and the rocks of the Abitibi greenstone belt is characterized by a major fault corridor, the east-west trending Larder Lake-Cadillac Fault Zone (“LLCFZ”). This structure runs from Larder Lake, Ontario through Rouyn-Noranda, Cadillac, Malartic, Val-d’Or and Louvicourt, Québec, at which point it is truncated by the Grenville Front.
The regional stratigraphy of the southeastern Abitibi area is divided into groups of alternating volcanic and sedimentary rocks, generally oriented at N280° - N330° and separated by fault zones. The main lithostratigraphic divisions in this region are, from south to north, the Pontiac Group of the Pontiac Subprovince and the Piché, Cadillac, Blake River, Kewagama and Malartic groups of the Abitibi Subprovince. The various lithological groups within the Abitibi Subprovince are metamorphosed to greenschist facies. Metamorphic grade increases toward the southern limit of the Abitibi belt, where rocks of the Piché Group and the northern part of the Pontiac Group have been metamorphosed to upper greenschist facies.
The majority of the Canadian Malartic property is underlain by metasedimentary units of the Pontiac Group, lying immediately south of the LLCFZ. The north-central portion of the property covers an approximately 9.5 kilometre section of the LLCFZ corridor and is underlain by mafic-ultramafic metavolcanic rocks of the Piché Group cut by porphyritic and dioritic intrusions. The Cadillac Group covers the northern part of the property (north of the LLCFZ). It consists of greywacke containing lenses of conglomerate.
Surface drilling by Lac Minerals Ltd. in the 1980s defined several near-surface mineralized zones now included in the Canadian Malartic deposit (the F, P, A, Wolfe and Gilbert zones), all expressions of a larger, continuous mineralized system located at depth around the historical underground workings of the Canadian Malartic and Sladen mines. In addition to these, the Western Porphyry Zone occurs 1 kilometre northeast of the main Canadian Malartic deposit and the Gouldie mineralized zone occurs approximately 1.2 kilometres southeast of the main Canadian Malartic deposit, although the relationship between these zones and the main deposit is presently unknown.
Mineralization in the Canadian Malartic deposit occurs as a continuous shell of 1 to 5% disseminated pyrite associated with fine native gold and traces of chalcopyrite, sphalerite and tellurides. The gold resource is mostly hosted by altered clastic sediments of the Pontiac Group (70%) overlying an epizonal dioritic porphyry intrusion. A portion of the deposit also occurs in the upper portions of the porphyry body (30%).
The South Barnat deposit is located to the north and south of the old South Barnat and East Malartic mine workings, largely along the southern edge of the LLCFZ. The disseminated/stockwork gold mineralization at South Barnat is hosted both in potassic-altered, silicified greywackes of the Pontiac Group (south of the fault contact) and in potassic-altered porphyry dykes and schistose, carbonatized and biotitic ultramafic rocks (north of the fault contact).
Several mineralized zones have been documented within the LLCFZ (South Barnat, Buckshot, East Malartic, Jeffrey, Odyssey, East Amphi, Fourax), all of which are generally spatially associated with stockworks and disseminations within dioritic or felsic porphyritic intrusions.
Exploration
The combined amount of gold in Proven and Probable Mineral Reserves at the Canadian Malartic Mine at the end of 2015 is 7.73 million ounces, which represents a decrease of 10.8% as compared to January , 2015. This Mineral Reserve includes replacement of the 160,000 ounces of gold mined from January 2015 to January 2016. The reduction in Mineral Reserves is principally associated with ore mined during 2015. See “- Mineral Projects - Summary of Mineral Reserve and Mineral Resource Estimates”.
Diamond drilling is used for exploration on the Canadian Malartic property. In 2015, 0 holes (0 metres) were drilled for definition (conversion) drilling and 44 holes (35,870 metres) were for exploration. Expenditures on diamond drilling at the Canadian Malartic Mine during 2015 were approximately Cdn$2.8 million.
The numbers set out above do not include 10 condemnation holes by the mine for 1551m. When considered, total is up to 37,421m in 54 dh. In 2015, no work was conducted on the CHL property prior to the acquisition of the remaining 30% held by Abitibi Royalties inc. Subsequently, this property was considered as part of the Canadian Malartic property and a portion of the exploration work occurred on what was previously the CHL property.
The main focus of the 2015 exploration program was the Porphyry #12 intrusion, host to the Odyssey North and South targets identified in 2014. Several holes extended mineralization on the footwall/north contact (North zone) and the hangingwall/south contact (South zone) of Porphyry #12. Both targets have a strike length of 1500m. Mineralization is also locally found within the intrusion. No work other than drilling was conducted on the property. In 2016, Canadian Malartic GP expects to spend Cdn$7.7 million on 60,000 metres of exploration drilling East ofthe Canadian Malartic Mine on Porphyry #12.
Drilling
Please see above under “- Exploration”.
Sampling, Analysis and Data Verification
Sampling of gold mineralization from the Canadian Malartic Mine has been essentially limited to the collection of samples of diamond drill core. A limited amount of surface sampling on the property was performed by independent consulting geologists during the summers of 2005 and 2007; these samples were submitted for assay using the same general protocol as that employed for core samples.
All samples are analyzed for gold by ALS Minerals in Val-d’Or, Québec, a laboratory which is certified ISO 9001:2000. Yamana and this laboratory are at arm’s length. Samples are analyzed by standard 50 gram FA with atomic absorption finish and any samples yielding greater than 10 grams per tonne gold are reanalyzed with a gravimetric finish.
All aspects of the sampling method and approach were reviewed by Micon International Limited during its site visit for the Canadian Malartic Report and by Belzile Solutions Inc. during its site visits for the Canadian Malartic Report. The QA/QC procedures for ensuring the security of core samples, the integrity of chain-of-custody for samples and the accuracy of laboratory analyses are in line with current industry practice.
Core samples collected at the drill site are stored in closed core boxes sealed with fibre tape or wire and are delivered to the exploration offices at shift change. All core logging, sampling and storage takes place at the regional exploration office located beside the Canadian Malartic Mine complex. The compound is surrounded by chain-link fence and monitored by closed-circuit video cameras. During the night and week-ends, the compound is monitored every hour by the Canadian Malartic Mine’s security guards.
Following the logging and core marking procedures described above, the core passes to the sampling facility. At this point, the core is no longer handled by on-site geologists. Core sampling is performed by qualified technicians and quality control is maintained through regular verification by the core shack supervisor.
Core is broken, as necessary, into manageable lengths. Pieces are removed from the box without disturbing the sample tags, cut in half lengthwise with a diamond saw, and then both halves are carefully repositioned in the box. When a complete hole has been processed in this manner, one half of the core is collected for assay while the other half remains in the core box for future reference.
The technician packs one half of the split core sample intervals into vinyl sample bags that are sequentially numbered to match the serial number sequences in the tag booklets used by the core-logging geologists. The blank portion of the triplicate sample tag is placed in the bag with the sample, while the portion marked with the sample interval is stapled into the bottom of the core box at the point where the sample interval begins.
Sealed sample bags are packed into large weaved nylon shipping bags. When full, shipping bags are sealed with tamper-proof, serially numbered, red plastic security tags. Bags are assigned sequential numbers which are matched against the security tags and loaded on sequentially numbered, plastic-wrapped wood pallets. This information is also forwarded to the core shack supervisor.
Aluminum tags embossed with the hole number, box number and box interval (from/to) are prepared and stapled onto the ends of each core box. Core boxes are then moved to permanent on-site storage in steel core racks. Rejects and pulps from the laboratory are sent back to the Canadian Malartic site and stored in large domed structures with limited access.
The core shack supervisor prepares the sample submission form for the assay laboratory. This form identifies the barrels/shipping bags by number, as well as the sequence of samples packed in each. Couriers from ALS Minerals arrive once per day at the core-processing facility to transport the pallets of sealed bags directly back to the laboratories. Once at the laboratory, a manager checks the shipping bag tag intregrity.
Mineral Processing and Metallurgical Testing
Please see below under “Processing and Recovery Operations”.
Mineral Resource and Mineral Reserve Estimates
See “- Mineral Projects - Summary of Mineral Reserve and Mineral Resource Estimates”.
Reserve numbers could be affected by permitting process where ounces in excess of three million are subject to CM Extension permit allowance.
Mining Operations
Mining at the Canadian Malartic Mine is done by open pit method using excavators and trucks. In order to maximize productivity and limit the number of units operating in the pit, large scale equipment was selected for the mine operation. The primary loading tools are hydraulic excavators, with wheel loaders used as a secondary loading tool. The mine production schedule was developed to feed the mill at a nominal rate of 55,000 tpd.
The throughput at the Canadian Malartic Mine in 2015 averaged 52,300tpd compared with 51,248tpd in 2014. The increase throughput in 2015 was largely due to mill optimization, additional crushed ore from the portable crusher and mill stability.
Mining and Milling Facilities
Surface Plan of the Canadian Malartic Mine (as at December 31, 2015)
The Canadian Malartic Mine is a large open-pit operation comprising the Canadian Malartic, Barnat and Gouldie pits. Canadian Malartic GP continues to work with the Québec Ministry of Transport and the town of Malartic on the deviation of Québec provincial highway No. 117 to gain access to the higher grade Barnat deposit. The final layout and the environmental impact assessment was completed at the end of January 2015. Environmental impact assessment is under review by the Ministry of Sustainable Development, Environment and the Fight Against Climate Change (Quebec). Answers to the first set of questions were submitted to the Ministry in September 2015. Answers to the second set of questions were submitted in January 2016.
Surface Facilities
Surface facilities at the Canadian Malartic Mine include the administration/warehouse building, the mine office/truck shop building, the process plant and the crushing plant. The processing plant has a daily capacity of 55,000 tonnes of ore.
The good geological continuity, the consistence of the mineralization and the tight definition drilling help to define the majority of the resource as indicated and measured. The 6 years experience in mining the deposit shows a high success at upgrading mineral resource to mineral reserves.
Processing and Recovery Operations
Ore is processed via conventional cyanidation. Ore blasted from the pit is first crushed by a gyratory crusher followed by secondary crushing prior to grinding. Ground ore feeds successively into leach and CIP circuits.
A Zadra elution circuit is used to extract the gold from the loaded carbon. Pregnant solution is processing via electrowining and the resulting precipitate is smelted into gold/silver dore bars.
Mill tails are thickened and detoxified, reducing cyanide levels below 20 parts per million. Following the study supporting the change‑over of the existing Combinox (sulfur dioxide - hydrogen peroxide) cyanide detoxifying process into a Caro’s (sulfuric acide - hydrogen peroxide) acid process, the construction was initiated in second half of 2015 and should be completed in the second quarter of 2016. Detoxified slurry is subsequently pumped to a conventional tailings facility.
Infrastructure, Permitting and Compliance Activities
Surface facilities at the Canadian Malartic mine include the administration/warehouse building, the mine office/truck shop building, the process plant and the crushing plant. The processing plant has a daily capacity of 55,000 tonnes of ore.
The existing polishing pond is contained within the current authorized footprint of the tailings management facility. This pond will be used as a cell to store tailings mid-2016. In August 2015, Canadian Malartic GP started the construction of a new polishing pond east of dyke A. This new polishing pond should be operational in April 2016.The existing polishing pond, converted into a tailings cell, will be the 8th cell of the tailings management facility with an estimated capacity of 48 million tonnes adding 2.5 years of operation to the tailings management facility capacity for a total of 148 million tonnes and 7.5 years of operation. The total capacity of the current tailings management facility is estimated at 198 million tonnes.
Since 2010, there have been 67 non‑conformance blast notices, 63 non‑conformance noise notices, 19 non‑conformance notices for air quality, 6 non‑conformance notices for water quality (surface and final effluent) and 18 other non‑conformance notices. In 2015, an action plan was developed and implemented by the Partnership to mitigate noise, vibrations, atmospheric emissions and ancillary issues. Mitigation measures were put in place to improve the process and avoid any non‑conformance. The mine’s team of on‑site environmental experts continuously monitor regulatory compliance in terms of approvals, permits, and observance of directives and requirements.
The original design of the waste rock pile was developed to accommodate approximately 326 million tonnes of mechanically placed waste rock requiring a total storage volume of approximately 161 million cubic metres.
The existing polishing pond is contained within the current authorized footprint of the tailings management facility. This pond will be used as a cell to store tailings beginning in mid-2016. In August 2015, the Partnership started the construction of a new polishing pond east of dyke A. This new polishing pond is expected to be operational in April, 2016. The existing polishing pond, converted into a tailings cell, will be the eighth cell of the tailings management facility with an estimated capacity of 48 million tonnes, adding 2.5 years of operation to the tailings management facility capacity for a total of 148 million tonnes and 7.5 years of operation. The total capacity of the current tailings management facility is estimated at 198 million tonnes. The expansion of the open‑pit, with the production from the Barnat pit, will increase to 342 million tonnes the total amount of tailings to manage, requiring an additional 144 million tonnes in tailings storage capacity. Canadian Malartic GP plans to store tailings in an extended tailings facility and in the Canadian Malartic pit at the end of its operations. According to the mining plan, at the end of mine life, 50 to 100 million tonnes of tailings will be deposited in the pit. The rest of the tailings, a minimum of 59 and a maximum of 109 million tonnes, will be deposited in the extended tailings facility.
Regulatory approval for the proposed tailings deposition in the Canadian Malartic pit and the expansion of the currently authorized tailings area are part of the approval process for the Canadian Malartic pit extension (Barnat deposit) subject to the environmental impact assessment process of the Quebec Environmental Protection Act. The environmental impact assessment has been completed and is under review by the Ministry of Sustainable Development, Environment and the Fight Against Climate Change (Quebec). Golder Associates Ltd. is designing the tailings extension component and is preparing a hydrogeological study to demonstrate that the Canadian Malartic pit would provide a hydraulic trap and contain he tailings with minimum environmental risk. Delay in the expected timing of the permits required for the Canadian Malartic pit extension could have a negative impact on the mining sequence at Canadian Malartic.
An annual hydrological site balance is maintained to provide a yearly estimate of water volumes that must be managed in the different structures of the water management system of the Canadian Malartic mine during an average climatic year (in terms of precipitation). Results of this hydrological balance indicate that excess water from the Southeast Pond will eventually need to be released into the environment. A water treatment plant was commissioned in 2015 to ensure that the water to be released to the environment meets water quality requirements. This water treatment plant is reduces the risks associated with surface water management and adds flexibility to the system.
Reclamation and closure costs have been estimated for rehabilitating the tailings facility and waste dump, vegetating the surrounding area, dismantling the plant and associated infrastructure, and performing environmental inspection and monitoring for a period of ten years. The reclamation and closure cost is estimated at Cdn$65.5 million. Financial assurance has been provided based on the closure plan.
Capital and Operating Costs
Capital expenditures at the Canadian Malartic mine during 2015 were approximately Cdn$115.05 million, which included sustaining capital expenditures and deferred expense, but excluded capitalized drilling.
Exploration, Development and Production
Development activities at the Canadian Malartic mine in 2015 primarily consisted of stripping activities. Development activities in 2016 are expected to include additional stripping activities. Permitting activities are on going and on track for development and production in 2017.
Exploration activities during 2015 concentrated on defining the shape of the Odyssey mineralization along the southeast margin of the claim group. The Odyssey deposit as currently understood consists of two separate mineral shoots labeled as the North and South mineral bodies. Both shoots occur within and along the margins of a quartz feldspar porphyry intrusive where it is in contact with the Pontiac Group metasediments and (South) and the Piche Group mafic volcanics (North). Drilling has established mineral continuity along a 1.5 kilometre strike in both deposits and a depth of mineralization from approximately 300 metres to over 1.4 kilometres form the surface.
Since the June 16, 2014 acquisition of Osisko, Agnico Eagle and Yamana have each held a 50% interest in the Canadian Malartic mine. During 2015, Yamana’s share of the Canadian Malartic mine’s payable production was 285,808 ounces of gold and 300,454 ounces of silver from 9,544,764 tonnes of ore grading 1.048 gram of gold per tonne and 1.27 grams of silver per tonne. The Canadian Malartic processing facility averaged 52,300 tonnes of ore per day and operated 93.6% of available time. Gold and silver recovery averaged 88.8% and 77.0%, respectively. The minesite costs per tonne at Canadian Malartic were Cdn$20.24.
The following table sets out the metal recoveries at the Canadian Malartic mine on a 100% basis in 2015.
|
| | | | |
| | Head Grade | Overall Metal Recovery | Payable Production | |
| Gold | 1.048 g/t | 88.8% | 571,617oz | |
| Silver | 1.272g/t | 77.0% | 600,908oz | |
Other Producing Mines
Gualcamayo Mine
The Gualcamayo Mine is located in northern San Juan Province, Argentina, approximately 270 kilometres north of the provincial capital of San Juan. The main Gualcamayo block consists of one Cateo and 57 Minas and covers 7,128 hectares. A Cateo is an exploration concession which allows the holder the exclusive right to explore the area subject to certain rights of owners of pre-existing mines within the Cateo area. Once an application for a Cateo is submitted, all rights to any mineral discovery on the Cateo belong to the applicant. A Mina is a real property interest which allows the holder the right to explore and exploit manifestations of discovery on a permanent basis after completion of an official survey for as long as the right is diligently utilized and property taxes are paid. Fifty-five (55) of the Minas are contiguous and lie wholly within the Cateo. One Mina (Chani) lies partially outside the Cateo and one Mina (Perico) lies wholly outside the Cateo. Six (6) contiguous Minas, collectively known as the Virgen de Lourdes property, in which the Company does not hold an interest and which cover a 50 hectare area, lie within the main Gualcamayo property block. The project area is easily accessible from the city of San Juan by driving three hours north on paved Highway 40 and then via a 20 kilometre gravel road to the main camp. The site is accessible by driving from the nearby towns of Guandacol, Huaco and Jachal within 40
minutes to 90 minutes. In 2004, Minas Argentinas S.A. (“MASA”) purchased the surface rights to a contiguous land package totaling 26,218 hectares, which partially covers the Gualcamayo Mine and wholly covers access routes to the area of interest from Highway 40. Exploration drilling on the property is subject to the application and acceptance of a water use permit from the Hydrological Department of San Juan, which MASA has received.
The Gualcamayo Mine includes three known deposits, Quebrada del Diablo (“QDD”), Amelia Inés and Magdalena. The use of the term “AIM” herein refers to the latter two deposits. The QDD deposit includes the QDD Upper zone which is being developed using open pit mining, and the QDD Lower West (“QDDLW”) zone. Other targets on the property are at an early prospective stage of exploration.
The Gualcamayo Mine is owned 100% by MASA, a wholly-owned subsidiary of Yamana which it acquired through its purchase of Viceroy Exploration Ltd. Royalties on the property are as follows: (i) a 1% net smelter return royalty on production from the Gualcamayo Mine is payable on certain concessions to Inversiones Mineras Argentinas Inc., who assigned their rights and obligations to Golden Arrow Resource Corporation by assignment agreement dated July 4, 2004; (ii) a 1% net smelter return royalty capped at $200,000 on production from the Patrimonio, Patrimonio I, Patrimonio III, Patrimonio IV and Leticia mining leases is payable to the Lirio Family; (iii) a 1.5% net smelter return royalty, capped at $500,000, is payable to the Lirio Family on production from the Rio Piojos Cateo; and (iv) a 3% provincial royalty is payable on mine production after deduction of direct mining and associated general and administrative costs. This contribution is included in the minesite overhead line of the cash flow, along with the debit and credit tax (1.2% upon the total transactions in the Argentinean banking system).
In terms of regional geology, the Gualcamayo Mine is located along the eastern margin of the Precordillera of west central Argentina. The Precordillera is a narrow N-S trending belt of tectonically deformed clastic and carbonate rocks of lower to mid Paleozoic age, overlain by Carboniferous and Permian marine and continental sediments, Triassic volcanics and continental redbeds and Tertiary continental redbeds. In terms of local and property geology, the Gualcamayo Mine is located primarily within a package of lower Paleozoic stratigraphy characterized by thick carbonate sequences of upper-Cambrian Los Sapitos and Ordovician San Juan Formations, which are overlain by marine clastics of Upper Ordovician Trapiche Formation. The entire stratigraphic section exceeds 1,000 metres in thickness. The immediate project area is intruded by a quartz diorite stock, dated at 16-5.6 MA that produced relatively thin skarn halos and a metasomatic areole that extends hundreds of metres outboard into the surrounding carbonates.
Four distinct mineralization types occur at the Gualcamayo Mine and three of these are of present economic interest. They are: (1) sediment-hosted distal-disseminated gold; (2) sulphide-bearing skarn deposits containing copper, zinc and molybdenum with late stage gold-arsenic mineralization; and (3) porphyry style molybdenum mineralization.
The final product of the Gualcamayo Mine is gold doré in the form of bullion, suitable for direct melting and sampling. Gualcamayo’s bullion contains approximately 80-90% of gold, the balance being base metals. 100% of the bullion production is exported from Argentina, shipped by ground transportation and air freight for final refining overseas. The doré will be shipped in the form of bars weighing 15-30 kilograms from San Juan, by airfreight departing from Mendoza International Airport.
A conceptual closure plan was developed for the Gualcamayo Mine, and was submitted as part of the EIA document. This plan considers both temporary (for example, in the case of depressed gold prices), and definitive closure scenarios. Once operations cease, closure activities, including demolition and dismantling, remediation, and leach pad chemical and physical stabilization are expected to be completed within two years. Environmental and geotechnical monitoring would continue on a reduced schedule for an additional four years until final closure. In the EIA, the Company has committed to refining and updating the closure plan throughout the project life, and to submitting a final closure plan to the mining authority two years prior to the anticipated definitive closure date.
The Gualcamayo Mine produced 180,614 ounces of gold in 2015, compared to 180,412 ounces of gold in 2014. Increased fourth quarter production for 2015 contributed to an overall annual production record at Gualcamayo, exceeding expectations, as it benefited from increased throughput. Cash costs were impacted by local inflationary pressures partly offset by the devaluation of the Argentine Peso.
The 2015 drill programs concentrated on oxide ore exploration and delineation on the east margin of the QDDLW deposit, near mine infill drilling to porphyry and non porphyry ore, infill and exploration extension of the Rodado SW carbonate deposit and exploration testing beneath the surface mineral zones at Las Vacas. All drill programs except for the exploration at Las Vacas intercepted favourable zones mineral zones that will be considered for ore classification. At Las Vacas, only one horizontal hole was completed approximately 500 meters beneath the surface. The hole cut hydrothermal
breccias displaying an orpiment, pyrite and realgar overprint that confirms that a favourable target remains to be tested at Las Vacas. This hole will be followed up in the first half of 2016.
Jacobina Mining Complex
The Jacobina property is located in the state of Bahia in northeastern Brazil approximately 340 kilometres northwest of the city of Salvador. Salvador, the state capital of Bahia, has a population of 2.9 million. The JMC forms a contiguous elongated rectangle extending 155 kilometres in a north-south direction, and varying from 5.0 to 25 kilometres in width. This shape of the claim package is a reflection of the underlying geology with the gold-mineralized host rocks trending along the north-south axis of the property. The property is comprised of 5,996 hectares of mining concessions, a mining claim covering 650 hectares, and 113,546 hectares of exploration permits and claims. The exploration concessions are renewable on a three year basis and have annual fees ranging from $1.00 to $1.55 per hectare. A significant portion of three of the Jacobina mine concessions are located within the boundary of Parque Sete Passagens or the park buffer zone. Mining is not permitted within the park but the JMC has valid mining concessions issued by the DNPM and the JMC is currently negotiating for access into the park with state government and park officials. On April 5, 2006, Yamana acquired the JMC and exploration projects in the Bahia gold belt through its acquisition of all of the outstanding shares of Desert Sun Mining Corp. The project is owned through Yamana’s wholly-owned subsidiary, Jacobina Mineração e Comércio Ltda. Jacobina does not pay royalties (other than a 1.0% royalty on gold revenues and sales payable to the Brazilian government agency, Departamento Nacional de Produção Mineral). Access to the property from Salvador is via paved secondary highway to the town of Jacobina approximately 330 kilometres north-northwest. Well-maintained paved roads from the town provide access to the JMC as well as the Pindobaçu deposit.
In terms of property geology, the Bahia Gold belt occupies most of the Jacobina range, where quartzites, metaconglomerates and schists of the Paleoproterozoic Jacobina group constitute a series of north-south, elongated, mountain ranges that rise up to 1,200 metres above sea-level. The deep and longitudinal valleys, bordering the mountains, correspond to deeply weathered ultramafic sills and dikes. The east-west oriented valleys represent weathered mafic to intermediate dikes. Archean tonalitic, trondhjemitic and granodioritic gneiss-dominated basement and related remnants of supracrustal rocks, grouped as the Mairi complex, are found on both flat to slightly hilly areas east of the Jacobina range. At its eastern border and also in a flat landscape, there are the fine-grained biotite gneisses of the Archean Saúde complex. The transition between the hilly and the scarped domains of the eastern border corresponds to the exposures of the Archean Mundo Novo Greenstone Belt (“MNGB”). The Pindobaçu geology is composed by two main tectonic domains: the MNGB, which is the host envelope; and the Jacobina group. The Archean MNGB is composed, from east to west, by an association of metabasalts, graphite-rich schist with hydrothermal pyrite, banded iron formation, meta-chert and meta-greywacke intercalated with conglomerates. The Jacobina group is represented by the Serra da Paciência formation. This formation is characterized, from east to west, by fine to very coarse, grey to green quartzite; laminated fuchsite-sericite-rich quartzite, pyrite-hematite-fuchsite silicified quartzite with tourmaline; and association between sericite meta-conglomerate and recrystallized fuchsite quartzite.
The Jacobina group hosts four different major types of gold deposits: (i) conglomerate-hosted; (ii) quartzite, andalusite schist and metaconglomerate-hosted; (iii) ultramafic-hosted; and (iv) mafic/intermediate dike hosted.
The Company has all of the necessary environmental permits to operate the JMC. The environmental liabilities include rehabilitation of the old João Belo open pit mine, the old stockpile areas and the tailings facility. Rehabilitation costs are included on an annual basis in the LOM Plan and total approximately $21 million by the time of mine closure. The JMC and associated companies are involved in 18 environmental infractions with the federal and municipal governments. These minor infractions generally involved small tailings spills or leaks, dust and noise complaints from nearby residents, and compliance with environmental standards in the operations. The JMC is actively working to resolve these issues.
Gold production at Jacobina was 96,715 ounces in 2015 compared to 75,650 ounces in 2014. Annual production was approximately 28% higher than 2014 and was the result of improvement initiatives in production and costs.
The operation experienced a fatality related to underground mining activities of a contractor employee. The situation was thoroughly investigated by regulatory agencies, minesite and contractor, and a number of mitigations were implemented to ensure similar circumstances would not occur in the future.
Approximately 31,340 metres of infill drilling were completed in 240 holes at Jacobina during 2015 to upgrade and define ore horizons for LOM planning. The infill program was successful in identifying and upgrading mineral horizons in most areas drilled. This program will continue into 2016.
A three hole, 4,000 metre drill program was designed and approved to test for the deep extensions of the prolific lower Main Reef horizon beneath the Joao Belo, Morro Do Vento and Canavieiras mine complexes. A total of 3,218 metres were completed in 3 exploration holes during 2015. The hole at Joao Belo deviated from the planned direction and was terminated, the hole at Canavieiras became tarpped and was abanboned, both before drilling the target intercept. The hole at Morro Do Vento is on-going at a depth of 1,067 metres at years end. The upper portion of the hole cut the expected middle reef horizons with favourable results. The lower portion of the hole has cut what appears to be the lower Main Reef conglomerate with favourable alteration noted.
Minera Florida Mine
The Minera Florida Mine (also known as the Alhué Mine) is located within the coastal range in the metropolitan region of central Chile, approximately 75 kilometres Southwest of Santiago, near Melipilla City. The property consists of 166 mineral licences, covering a total area of approximately 15,600 hectares. Thirty-six mineral licences cover the mine property including the mine, mill, and other infrastructure. The property is partly owned and partly leased by Yamana, and the Pedro Valencia mine is also located within the property boundaries. Mining licences in and around the Pedro Valencia mine area are contained within a rectangular block (2.5 kilometres x 1.5 kilometres) comprising 33 licences. The property also includes some 133 mineral concessions in a large area around the mining licences. The access to the property is by paved road. The total distance from Santiago is approximately 175 kilometres. Electric power is available from the Chilean grid and mining services and suppliers are available locally and in the region.
The area of the Alhué Mine is underlain by upper cretaceous volcanic and intrusive rocks. The volcanic rocks comprise porphyritic andesite, brecciated andesite, lithic and crystal tuff, and brecciated tuff. The bulk of these rocks are also affected by a sequence of hydrothermal alteration. The intrusive rocks comprise mainly granodiorites and monzodiorites. Gold mineralization in the Alhué Mine area occurs as native gold and electrum associated with sulphide minerals, such as pyrite, chalcopyrite, sphalerite and galena, as well as magnetite. Mineralization is commonly associated with hydrothermal alteration including quartz, adularia, epidote, chlorite, and actinolite. Quartz occurs in four types; as grey siliceous zones, green quartz, translucent quartz, and white quartz. Some veins exhibit metal zoning, with a zinc-rich silver-rich zone in the upper part of the vein, a gold-rich zone in the central part, and a zinc-rich zone in the lower part of the vein. In general, mineralized structures include an inner quartz vein (core) consisting of material exhibiting quartz flooding or massive quartz, surrounded by stockwork of quartz veinlets and/or hydrothermal breccia, both of which are mineralized. Gold mineralization in the Alhué Mine area has been identified in four types of rocks, in places adjacent to each other, as follows: (1) silicified crystal tuff; (2) lithic to crystal tuff; (3) brecciated tuff; and (4) porphyritic andesite. There are at least nineteen mineralized veins discovered and partially developed in the Alhué Mine area. These veins range from 0.8 metres to 30 metres in thickness, and the average grade ranges from 1.5 grams per tonne of gold to 12 grams per tonne of gold, 6 grams per tonne of silver to 100 grams per tonne of silver, and 0.1% Zn to 1.81% Zn. Many of the mineralized veins at the Alhué Mine area do not have a surface expression, but are associated with structures identified by underground diamond drilling.
The Alhué Mine currently operates at a rate of approximately 2,200 tpd (830,000 tonnes per year). The underground workings are developed by adits driven from surface. An internal ramp system provides access to the stopes. Sublevel drill drifts are driven in narrow veins and mining has been advanced from the top down, with sill pillars left at regular intervals. Underground mining operations are mechanized, utilizing: articulated haul trucks; electronic hydraulic development and production jumbos; load-haul dumpers; and a number of ground support and service vehicles. Ore is hauled using 25-tonne trucks from the mine to a transfer point and 50-tonne trucks haul the ore from the transfer point to the process plant. Waste is transported by 25-tonne trucks.
In addition to the ore processing facility, the Alhué Mine has an historic tailings reprocessing facility which operates at a rate of near 2,500 tpd and consists of repulping stations, grinding, leaching, carbon and zinc flotation circuits. This facility contributes approximately to 20% of the production of the property.
For 2015, production at the Minera Florida Mine totaled 112,580 ounces of gold and 660,997 ounces of silver, compared to 100,076 ounces of gold and 975,297 ounces of silver produced in 2014. Gold production increased by 12%, compared to 2014 resulting from higher throughput and grades. Lower silver production was due to lower planned grades following the mine sequencing.
Exploration activities at the Alhue Mine included surface mapping, sampling and drill testing of geologic and geochemical targets on the district scale along with in-mine infill, delineation and exploration programs on the local scale. The 2015 Exploration budget of $5.3M allowed completion of 25,187 metres of drilling distributed in 140 holes to be completed on the local programs, and the District Exploration budget of $1.2M allowed for the completion of 3,307 meters in 5 deep holes to tset above the known mineral horizon’s at the Alhue mine.
Both Local and District Exploration programs showed positive results in testing above the Alhue mine and testing for extensions and new structures beyond the current mine extents.
In December 2015, the Superintendencia del Medio Ambiente (SMA) in Chile informed the mine of 14 non-compliances resulting from their inspection in 2014. The site has developed an action plan to resolve these largely technical non-compliances, which are expected to totally resoved by 2017.
Mercedes Mine
The Mercedes Mine is located in the state of Sonora, northwest Mexico, within the Cucurpe municipality. The Mercedes Mine is located 250 kilometres northeast of Hermosillo, Sonora’s capital city, and 300 kilometres south of Tucson, Arizona. The Mercedes Mine consists of approximately 64,613 hectares of mineral concessions under lease from the government of Mexico. The area is covered by 40 mineral concessions, all of which have been titled as mining concessions, according to Mexican mining law. The titles are valid for 50 years from the date titled. All of the concessions are owned by Minera Meridian Minerales S. de R.L. de C.V., a wholly-owned subsidiary of Yamana, and remain in good standing with mining law obligations through twice-annual tax payments and required assessment work. The Mercedes Mine is not encumbered by any royalties (other than a 0.5% royalty on gold and silver revenues and sales payable to the Mexican tax authority, Servicio de Administración Tributaria), since all of the claims under contract were purchased with no future obligations. The Mercedes Mine is accessed using Highway 54 via Magdalena de Kino located approximately 180 kilometres from both Tucson, Arizona, and Hermosillo, Mexico. From Magdalena de Kino, access is gained to the property using Highway 15 for 67 kilometres, passing through the village of Cucurpe, to the Rancho Los Pinos entrance. The mine can be reached via an improved gravel road approximately 10 kilometres from the ranch entrance. Mercedes is currently mining three deposits and has all required infrastructure and permits necessary for a mining complex.
The geology of the Mercedes area is dominated by two northwest-trending arches, which have exposed older marine sediments and overlying interbedded volcaniclastic sediments and lithic to quartz crystal lithic tuff units. The arches are cut by numerous northwest-trending high angle structures. Some of these faults have been intruded by at least three stages of dikes and small stocks, ranging in composition from andesite to latite and rhyolite. Marginal to the northwest-trending arches, andesitic flows, and flow breccias (with local coeval andesite dikes) have been deposited and preserved in at least three west-northwest thickening basins. This andesite package, locally over 500 metres thick, and the contact zone with the underlying tuff host all known economic epithermal vein deposits in the district.
A total of 16 principal low sulphidation epithermal vein/stockwork/breccia zones, have been identified on the Mercedes property. The majority of the veins are hosted within the andesite package, or locally at the fault contact between andesite and the underlying lithic tuff package. Only the Diluvio Zone at Lupita and the Anita veins contain significant ore grade mineralization hosted completely in the lower tuff package. The mineralized zones display a combination of fissure vein, stockwork, and breccia morphologies that change rapidly on strike and dip. The zones range in width from less than 1.0 metre to composite vein/stockwork/breccia zones up to 15.0 metres wide. In the Diluvio zone, gold-silver-bearing vein/stockwork zones locally attain thicknesses in excess of 100.0 metres. The length of individual veins varies from 100 metres to over 2.0 kilometres. Property-wide, gold-silver-bearing veins occur over a vertical range greater than 700 metres. Mineralogical studies identified opaque minerals, including iron oxides, pyrite, gold, electrum, stibnite, and rare pyrargyrite, within a gangue of substantial chalcedony, quartz, and carbonate. In addition to hematite, manganese oxides are an important component in some ore zones, possibly remnant after dissolution of manganese carbonates. Due to the depth of oxidation, sulphides are rarely observed. Metallurgical studies have identified the presence of very small quantities of native gold, native silver, electrum, pyrargyrite, stibnite, galena, sphalerite, and chalcopyrite in heavy mineral concentrates. Copper minerals such as malachite and chrysocolla are most common as fracture fillings in breccias at Klondike, but rare specks are also seen in the Mercedes and Lupita-Diluvio veins.
The Mercedes operation consists of underground mines, three of which are being developed or in production and one is in the planning stage, plus an open pit mine that is in the planning stage. Production is coming from the Mercedes and Klondike mines, the Barrancas mine is being developed, and the Diluvio and Rey de Oro mines are planned for future production. The underground mines are all designed as ramp access mechanized mines. There are two underground mining methods in use. Where the rock quality is appropriate, the ore is mined by longhole open stoping with cemented paste backfill. This is expected to be applied to 70% of the deposit. For areas with poorer rock conditions, the mining method is mechanized cut and fill stoping. The planned production rate is approximately 2,000 to 2,100 tpd. Ore from underground is hauled by dump truck to stockpiles near the portal. Ore from the Barrancas and Klondike mines is hauled to a common stockpile area near the jaw crusher.
The Company has all of the necessary environmental permits to operate at Mercedes. The tailings are not considered as acid generating. Rehabilitation of the tailings facility and the remainder of the mining areas on site at the end of the mine life is estimated to cost approximately $10.3 million.
For 2015, production at the Mercedes Mine totaled 84,137 ounces of gold and 382,943 ounces of silver, compared to 2014 production of 105,212 ounces of gold and 398,137 ounces of silver. Annual production was impacted by higher dilution resulting in lower than planned gold and silver grades.
During 2015, a total of 41,200 metres in 226 drill holes were completed at the Mercedes Mine. Of that total, 8,679 meters were completed in 69 underground infill holes to upgrade resources in the CDO, Casa Blanca, Klondike, GAP and La Derrama vein. A total of 8,183 meters were completed in 53 surface platform infill holes targeting the Aida, Casa Blanca SE and Casa Blanca deposits. A total of 2,336 meters were completed in 48 underground platform delineation holes completed on the Lagunas, La Derrama and Lagunas veins. The surface based exploration program completed 22,002 metres distributed in 56 holes testing the Diluvio W, Lupita, El Molino, Klondike W, Mariannas and other targets.
Drilling to follow-up low grade and deep intercepts identified along the northwest trending Axis trend returned no significant results. Drill testing 800 meters to the west of the Diluvio W area cut 20 metres of favourable quartz stockwork which contained one intercept of above ore grade gold equilvalent grade. Limited follow-up drilling did not duplicate the intercept and the target is under further review. Underground infill drilling of the La Derrama vein returned 0.5 metre to over 3.0 metres of potential ore grade mineralization that remains open to the southeast.
Fazenda Brasileiro Mine
The Fazenda Brasileiro Mine covers an area totalling approximately 53,000 hectares, including approximately 42,500 hectares of exploration concessions and claims. It is located in east central Brazil in the eastern portion of Bahia state, 180 kilometres north-northwest of the state capital city of Salvador. The property, all of which is within the Rio Itapicuru Greenstone Belt (“RIGB”), can be roughly divided into two parts. One part covers the east-west trending Weber Belt, which hosts the main underground mine, operating open pits and areas of immediate exploration potential. The other part covers large portions of the north-south trending portion of the RIGB and several exploration permits southwest of the mining area. The Weber Belt area is comprised of 15 contiguous tenements at various stages of the Brazilian tenure process, totalling approximately 12,000 hectares. The remaining area is comprised of 148 blocks, many of which are contiguous and all at various stages of the tenure process, totalling approximately 184,500 hectares in area.
The Fazenda Brasileiro Mine began production in 1984 as an open pit, heap leach operation. In 1988, production began from underground operations with processing in the newly constructed CIP plant and has been continuous since such time.
Since 2003, exploration by Yamana has mostly included drilling and sampling which has been carried out from underground drifts with the objective of identifying new resources and converting resources to reserves. The program was designed and implemented to extend the underground mineral resources at depth and to the east.
In 2015, a significantly expanded exploration drilling program was designed to test new targets and fill in “gap zones” in the existing resource model in order to increase the mineral reserves in previously developed areas of the mine, both shallow and at depth. The plan was to test underground mineralization at or near the level of existing mine workings, on ore bodies beneath the existing mine workings and along geological structures with no previous exploration, but with high potential. As a result, a prospective new discovery was made at Fazenda Brasileiro. The new discovery, named E388 East, is at relatively shallow depth (350 metres) and near existing primary infrastructure, immediately adjacent to a main haulage ramp. The exploration results for E388 are similar in thickness and grade to those that were seen in the early years of the mine. Since that initial discovery several other new areas have been discovered using this new resource model and exploration plan.
At the end of 2015, Fazenda Brasileiro achieved the highest level of mineral reserves since acquisition in 2003. Exploration drilling at Fazenda Brasileiro remains focused on extending the mine life, expanding the resource and increasing production.
Production at Fazenda Brasileiro was 60,914 ounces of gold in 2015, compared to 64,188 ounces of gold in 2014. The decreased production was mainly due to lower gold grade and lower recoveries as the process plant was undergoing capital improvements throughout the year.
Pilar Operation
The Pilar Operation comprises approximately 35,000 hectares, including approximately 29,000 hectares of exploration concessions and claims. The Operation is located in Goiás State in central Brazil. The area covers part of Pilar and Guarinos belts which are classical Archean greenstone belts terrains with many gold occurrences (several anomalies never checked with geological mapping or drilling). Gold was first discovered and mined in the region in 1740 by the Portuguese empire. After that, artisanal mining has been continuously present in the area.
The Pilar and Guarinos belts have similar volcano-sedimentary sequences to that of Crixas Greenstone Belt, where the three million ounce Serra Grande mine is located, about 20 kilometres west of Guarinos. The most explored areas are located in the southern portion of the Pilar Greenstone Belt, called Jordino-Ogó-Três Buracos (“JOT”), a continuous gold anomalous northwest trend, extending for almost 8 kilometres. Although the garimpeiros occurrences were less intense in the Guarinos Belt, the gold occurrences are also constant in the whole belt.
On August 4, 2010, Yamana made a formal decision for the construction of the Pilar Operation. Construction was completed in June 2013 and doré was poured in July 2013, initiating a production ramp up through the end of the year. Non-commercial production by the end of 2013 totalled 15,374 ounces of gold. Underground development at Pilar reached a total length of 16,000 metres in 2013. Commercial production was declared at Pilar effective October 1, 2014.
Pilar produced a total of 83,184 ounces of gold in 2015, compared to 60,090 ounces of gold in 2014. Higher production was driven by significantly reduced dilution in the Pilar Mine, which resulted in improved grade, higher recoveries, and increased plant throughput with the contribution of production from the Maria Lazarus satellite mine, which commenced operation in August 2015.
Additional Projects
C1 Santa Luz Project
The C1 Santa Luz Project is located in the state of Bahia in east Central Brazil and is approximately 140 kilometres north and 160 kilometres east of the Company’s Fazenda Brasileiro Mine and Jacobina Mine, respectively. The Project covers an area totalling approximately 61,000 hectares, including approximately 55,000 hectares of exploration permits. C1 Santa Luz is planned as a conventional open pit mine with throughput of 2.5 million tonnes per year or 6,800 tpd. Processing will be done through a conventional CIP flotation circuit.
The C1 Santa Luz Project gold deposits lie within the RIGB, a deformed and metamorphosed greenstone-granite terrain of paleoproterozoic age. The gold deposits are structurally controlled and closely associated with small porphyritic dacite intrusions and extensive zones of breccia hosted in carbonaceous meta-sedimentary rocks, with associated hydrothermal alteration centred on the intrusions. The project contains a number of deposits, including, C1, Antas 2, Antas 3, Mansinha North, Mansinha South and Mari. The largest known deposit, C1, occurs in a continuous mineralised zone associated with a sill-like body of dacite-quartz breccia and carbonaceous-quartz breccia, striking northeast and dipping 35º to 55º northwest. Most of the gold mineralization (approximately 80%) occurs in the quartz-breccia.
Construction of the C1 Santa Luz Project was completed in the second quarter of 2013 and commissioning start up commenced mid-2013. Gold production in 2013 totalled 12,997 ounces. In September 2014, the Company announced that ramp-up activities would be temporarily suspended due to lower than expected recoveries and it would put the project on care and maintenance while several identified alternative metallurgical processes were to be evaluated. In 2014, prior to the suspension of ramp-up activities at the C1 Santa Luz Project, gold production totalled 20,385 ounces.
In 2015, a modified flowsheet was identified and a five month detailed metallurgical testwork program was completed at C1 Santa Luz while it was held within Brio Gold. The results of the work were incorporated into a Preliminary Economic Assessment, which included an updated mine design and production schedule based on a new mineral resource in connection with current operating cost estimates and recovery parameters. The modified process flowsheet allows for the processing of the carbonaceous minerals at C1 Santa Luz and the overall weighted average recoveries is expected to be approximately 84%.
Currently there are six drill rigs in operation at C1 Santa Luz and the Company believes there will be a significant conversion of mineral resources to mineral reserves. A new mineral reserve and resource estimate is expected for C1 Santa Luz by mid-year. Detailed construction engineering is underway. A construction decision is expected to be evaluated in the second quarter of 2016.
Cerro Moro Project
The Cerro Moro Project contains a number of high grade epithermal gold and silver deposits. The Cerro Moro Project covers 177 square kilometres and is located approximately 70 kilometres southwest of the coastal port city of Puerto Deseado in the Santa Cruz province of Argentina.
The Cerro Moro silver-gold low sulfidation deposit is located within the Deseado Massif, a tectonic block comprised of Upper Precambrian metamorphic rock, Jurassic to Cretaceous aerial and sub-aerial volcanic rock and capped by Tertiary marine sediments which is located in the central-portion of the Santa Cruz Province, covering an area of approximately 60,000 square kilometres.
Estellar Resources Ltd. completed a comprehensive preliminary economic assessment of the project before Yamana acquired Extorre and the project in 2012. In February 2013, after a brief pre-feasibility analysis to determine the optimum direction for the project, Yamana commissioned an update to the feasibility study. During 2014, a thorough and complete evaluation of the original feasibility study was completed and the level of engineering and confidence in the plant and mine design advanced.
The Company announced, in early 2015, the formal decision to proceed with the construction of Cerro Moro and provided updated project parameters with respect to timing and capital investment. During the course of 2015, detailed engineering for the 1,000 tonnes per day processing plant and mine was advanced to approximately 50% completion, in line with the published project execution schedule. Included in the 2015 work program was the upgrading and extension of the site access road, conclusion of the locked-cycle metallurgical test work program, the placement of orders on various long-lead time items such as the tailings thickeners, and the continuation of the first stage of the construction camp.
The 2016 work program envisages the prudent ramp-up of site construction activities, the continuation of detailed engineering as well as the advancement of underground mining in order to gain a better understanding of in-situ mining conditions. Project capital expenditures in 2015 amounted to $27 million (excluding exploration and capitalized borrowing costs) and the expenditures for 2016 are expected to be approximately $49 million. The 2016 capital expenditure forecast is lower than previously reported ($56 million) due to the favourable exchange rate variance and continues to reflect the previously reported execution schedule with production expected in the initial months of 2018 with a planned production for the partial year of approximiately 76,000 ounces of gold and 3.3 million ounces of silver. The current execution schedule further allows for a more thorough evaluation of the economic factors in Argentina, including the impact of the currency fluctuations following the ongoing impact of the recent Argentinian regime change. Furthermore, this approach allows for further exploration drilling in order to increase the size of the Cerro Moro mineral resources, in addition to improving the current mineral resource categorization.
As this is a development stage project, the production forecast in the first year can be affected both positively and negatively by grade, ramp-up, recovery and throughput among other matters. The area of greatest confidence is the anticipated plant performance as all the necessary metallurgical test-work and design to give a high level confidence have been completed. Effort is now being undertaken to get the same level of confidence with the mine plan and the underground mine development in 2016 is planned to achieve that objective.
The Cerro Moro project contains a number of high grade epithermal gold and silver deposits, some of which will be mined via open pit and some via underground mining. The feasibility study is based on annual production in the first three years of 150,000 ounces of gold and 7.2 million ounces of silver, with annual production averaging approximately 130,000 ounces of gold and 6.4 million ounces of silver over an initial 6 year mine life at a throughput of 1,000 tonnes per day, based only on current mineral reserves. The concentrator will consist of a standard crushing, grinding and flotation circuit with a counter current decantation and a Merrill Crowe circuit included.
The Company believes that the Cerro Moro project offers significant opportunities for the conversion of mineral resources into mineral reserves and for further discoveries on the property. This will serve to significantly improve the returns and value from this high grade project.
Agua Rica Project
Yamana currently owns 100% of the Agua Rica Project, a large porphyry-style copper-gold-molybdenum-silver deposit located in the northwestern province of Catamarca in Argentina. There is evidence to suggest that the ore body also contains significant amounts of rhenium which could be an important source of by-product credits.
In September 2011, the Company entered into an agreement granting Minera Alumbrera an option to acquire the Agua Rica Project, which included annual and other payments over the life of the agreement. In 2013, Minera Alumbrera requested, and the Company granted, an extension of the option payment due by one additional year. Subsequently, the Company decided not to grant any further extension for 2014 and the option agreement has terminated. Prior to the termination of the option agreement, the Company had received $50 million in option payments, all of which will be retained by the Company in addition to all technical and feasibility level work which has already transitioned back to the Company. The Company is now actively engaged in the consolidation of that information for Agua Rica and has begun working with the Catamarca Government to determine a development plan to establish a mining district within the region with Agua Rica as the cornerstone asset. The Company will consider several options for strategic alliances for the development of Agua Rica in conjunction with the efforts with the Catamarca Government.
In October 2014, the Company entered into an MOU with the Catamarca Government, represented by the provincial mining company CAMYEN, with respect to the creation of the Catamarca Mining District. The MOU established the groundwork for the Company and the Catamarca Government to work together to consolidate important mining projects and prospective properties in the province, currently consisting of the Agua Rica Project and the Cerro Atajo prospect. On February 27, 2015, a formal agreement was entered into among the parties to the MOU. This agreement forms the basis of a working relationship between the Catamarca Government through CAMYEN, other mining companies and the Company and is expected to help advance the Agua Rica Project and the Cerro Atajo prospect. The formal agreement also establishes a maximum ownership interest of up to 5% for CAMYEN of a combined entity, including the Agua Rica Project and Cerro Atajo prospect, and some exploration and infrastructure spending during the term of the agreement. The formal agreement does not restrict the Company’s ability to continue with Agua Rica, although it provides a framework of cooperation that would see Agua Rica advance to development more efficiently and on an expedited timeline. Presently, the Company is considering the development of Agua Rica in conjunction with other financial and mining industry participants.
In December 2014, the Company received a positive independent technical review relating to previous studies on Agua Rica and on the potential development options for Agua Rica. This update provides a basis for the Company to continue to pursue multiple options for this asset, including potential joint ventures with other financial and/or industry participants, the sale of a majority interest in the project or an outright sale.
Suyai Project
The Suyai Project is an advanced stage exploration gold project comprising 141,000 hectares of land located in the Cordon de Esquel , Chabut Province, in southern Argentina. The various properties comprising the Suyai Project are classified as either “permits”, “claims” or “mines” and are either owned outright by Suyai del Sur S.A. (“Suyai del Sur”) or through option contracts between Suyai del Sur and the direct owners.
On July 3, 2002, Meridian completed an unconditional share purchase offer for Brancote Holdings PLC, owner of the Suyai Project. Permitting for the project and a feasibility study began in the third quarter of 2002. In March 2003, with the feasibility study substantially complete, the project was put on hold after local opposition to the mine led to a non-binding referendum wherein a majority of Esquel’s citizens voted against the mine. The Company continues to monitor mining developments in the province of Chubut.
An application for an environmental impact study (an “EIS”) for exploration and development work is continuing which will be followed by permitting for an operational EIS within the current mining and environmental laws of the Chubut Province.
Examination of the Cerro Atajo property by Yamana’s Exploration Division following the signing of the MOU included mapping, sampling anf trenching areas of interest in order to expose and collect rock chip samples. This program generated over 500 samples which were sent for geochemical analysis. A drill program to follow up favourable results is being evaluated for execution in 2016.
Monument Bay
In June 2015, as part of the Mega Precious acquisition, the Company acquired the Monument Bay property, which is located in Manitoba, approximately 570 kilometres northeast of Winnipeg, and consists of 136 contiguous claims totalling 338,000 square kilometres. The fall 2015 drill program and old core assay program returned positive results and support gold and tungsten mineralization at higher grades compared to previous block model. The Monument Bay mineral resource inventory is 1.8 million ounces of gold, contained in 36.6 million tonnes of ore at a grade of 1.52 g/t in indicated mineral resources and 1.8 million ounces of gold, at 41.9 million tonnes of ore at a grade of 1.32 g/t in inferred mineral resources.
ITEM 5
DIVIDENDS
The Company has a dividend policy providing for a dividend yield that is consistent with the yield of comparable companies’ dividend rates and such policy is reviewed on a periodic basis and assessed in relation to the current and expected future operating cash flows of the Company and the conservation and reinvestment of capital.
The following table sets forth the quarterly dividends paid by Yamana on its common shares during each of the three most recently completed financial years:
|
| | | |
| 2016 | 2015 | 2014 | 2013 |
| Q1E - $ 0.005 | Q1 - $0.015 | Q1 - $0.0375 | Q1 - $0.065 |
| | Q2 - $0.015 | Q2 - $0.0375 | Q2 - $0.065 |
| | Q3 - $0.015 | Q3 - $0.0375 | Q3 - $0.065 |
| | Q4 - $0.015 | Q4 - $0.015 | Q4 - $0.065 |
Payment of any future dividends will be at the discretion of the Company’s board of directors after taking into account many factors, including the Company’s operating results, financial condition, comparability of the dividend yield to peer gold companies and current and anticipated cash needs.
ITEM 6
DESCRIPTION OF CAPITAL STRUCTURE
Authorized Capital
The Company is authorized to issue an unlimited number of common shares and 8,000,000 first preference shares, Series 1 (the “Preference Shares”) of which there were 947,227,414 common shares and no Preference Shares issued and outstanding as of March 29, 2016.
Common Shares
Holders of common shares are entitled to receive notice of any meetings of shareholders of the Company, to attend and to cast one vote per common share at all such meetings. Holders of common shares do not have cumulative voting rights with respect to the election of directors and, accordingly, holders of a majority of the common shares entitled to vote in any election of directors may elect all directors standing for election. Holders of common shares are entitled to receive on a pro-rata basis such dividends, if any, as and when declared by the Company’s board of directors at its discretion from funds legally available therefor and upon the liquidation, dissolution or winding up of the Company are entitled to receive on a pro-rata basis the net assets of the Company after payment of debts and other liabilities, in each case subject to the rights, privileges, restrictions and conditions attaching to any other series or class of shares ranking senior in priority to or on a pro-rata basis with the holders of common shares with respect to dividends or liquidation. The common shares do not carry any pre-emptive, subscription, redemption or conversion rights, nor do they contain any sinking or purchase fund provisions.
Preference Shares
Upon a consolidation, merger, or amalgamation of the Company with or into any other corporation, holders of Preference Shares who have not exercised their right of conversion at the date of the consolidation, merger, or amalgamation are entitled to receive upon the exercise of their conversion right, after the effective date of the consolidation, merger, or amalgamation, the aggregate number of shares or securities or property of the Company resulting from the consolidation, merger, or amalgamation, the holder would have been entitled to receive if they had at the effective date of the consolidation, been the registered holder of such number of common shares. Holders of Preference Shares are also entitled to receive, in the event of liquidation, dissolution or winding up of the Company, an amount equal to $0.125 in respect of each of Preference Share held and all unpaid cumulative dividends before any distribution of the assets of the Company among holders of the common shares or any other class of shares.
ITEM 7
MARKET FOR SECURITIESMARKET FOR SECURITIES
Price Range and Trading Volume
The common shares are listed and posted for trading on the TSX under the symbol “YRI” and the NYSE under the symbol “AUY”. In 2013, the common shares were delisted from the London Stock Exchange (“LSE”). The following table sets forth information relating to the monthly trading of the common shares on the TSX for the fiscal year ended December 31, 2015.
|
| | | |
| Period | High (Cdn.$) | Low (Cdn.$) | Volume |
| | | | |
| January 2015 | 5.79 | 4.51 | 140,385,390 |
| February 2015 | 5.63 | 4.76 | 65,489,826 |
| March 2015 | 5.40 | 4.24 | 63,149,431 |
| April 2015 | 5.05 | 4.60 | 49,421,716 |
| May 2015 | 4.88 | 4.42 | 34,277,631 |
| June 2015 | 4.60 | 3.61 | 45,291,832 |
| July 2015 | 3.79 | 2.38 | 65,666,769 |
| August 2015 | 3.21 | 2.23 | 81,490,970 |
| September 2015 | 2.56 | 1.89 | 80,193,217 |
| October 2015 | 3.55 | 2.15 | 98,444,717 |
| November 2015 | 2.92 | 2.25 | 69,295,014 |
| December 2015 | 3.17 | 2.47 | 79,231,288 |
ITEM 8
DIRECTORS AND OFFICERS
The following table sets forth the name, province or state and country of residence, position held with the Company and period(s) during which each director of the Company has served as a director, the principal occupation of each director and executive officer of the Company. All directors of the Company hold office until the next annual meeting of shareholders of the Company or until their successors are elected or appointed.
|
| | | |
| Name and Residence | Position with the Company and Period(s) Served as a Director | | Principal Occupation |
John Begeman(1)(3) South Dakota, United States | Director since May 2, 2007 | | Company Director |
Christiane Bergevin(4) Québec, Canada | Director since September 1, 2014 | | Company Director |
Alexander J. Davidson(2)(3) Ontario, Canada | Director since August 31, 2009 | | Company Director |
Richard Graff(1) Colorado, United States | Director since October 16, 2007 | | Company Director |
Nigel Lees(2) Ontario, Canada | Director since June 16, 2005 | | President and Chief Executive Officer of Sage Gold Inc. |
Peter Marrone Ontario, Canada | Chairman, Chief Executive Officer and a Director (director since July 31, 2003) | | Chairman and Chief Executive Officer of the Company |
Patrick J. Mars(1)(2)(4) Ontario, Canada | Lead Director and a Director since July 31, 2003 | | Company Director |
Carl Renzoni(1)(4) Ontario, Canada | Director since October 16, 2007 | | Company Director |
Jane Sadowsky(1) New York, United States | Director since September 1, 2014 | | Managing Partner of Gardener Advisory LLC |
Dino Titaro(2)(3)(4) Ontario, Canada | Director since August 5, 2005 | | Company Director |
Charles B. Main Ontario, Canada | Executive Vice President, Finance and Chief Financial Officer | | Executive Vice President, Finance and Chief Financial Officer of the Company |
Darcy Marud Nevada, United States | Executive Vice President, Enterprise Strategy | | Executive Vice President, Enterprise Strategy of the Company |
Greg McKnight Ontario, Canada | Executive Vice President, Business Development | | Executive Vice President, Business Development of the Company |
Richard C. Campbell Ontario, Canada | Senior Vice President, Human Resources | | Senior Vice President, Human Resources of the Company |
Gerardo Fernandez Colina, Chile | Senior Vice President, Southern Operations | | Senior Vice President, Southern Operations of the Company |
Ross Gallinger Ontario, Canada | Senior Vice President, Health, Safety and Sustainable Development | | Senior Vice President, Health, Safety and Sustainable Development of the Company |
Jason LeBlanc Ontario Canada | Senior Vice President, Finance | | Senior Vice President, Finance of the Company |
Barry Murphy Ontario, Canada | Senior Vice President, Technical Services | | Senior Vice President, Technical Services of the Company |
Daniel Racine Ontario, Canada | Senior Vice President, Northern Operations | | Senior Vice President, Northern Operations of the Company |
Sofia Tsakos Ontario, Canada | Senior Vice President, General Counsel and Corporate Secretary | | Senior Vice President, General Counsel and Corporate Secretary of the Company |
William Wulftange Nevada, United States | Senior Vice President, Exploration | | Senior Vice President, Exploration of the Company |
| |
| 1. | Member of the Audit Committee. |
| |
| 2. | Member of the Compensation Committee. |
| |
| 3. | Member of the Sustainability Committee. |
| |
| 4. | Member of the Corporate Governance and Nominating Committee. |
The principal occupations, businesses or employments of each of the Company’s directors and executive officers within the past five years are disclosed in the brief biographies set out below.
John Begeman - Director. John Begeman is a Professional Mining Engineer with over 35 years of mining experience. He currently sits on the board of directors of Premier Gold Mines Limited and acts as the Executive Chairman
and was appointed to the board of Aberdeen International Inc. in January 2015. He previously served as the President and Chief Executive Officer of Avion Gold Corporation, as the Chief Operating Officer of Zinifex Canada Inc. and as Vice President, Western Operations of Goldcorp Inc. In his capacity for Goldcorp, he was responsible for its surface gold operations in South Dakota and the Industrial Minerals Division in Saskatchewan. Prior to his employment at Goldcorp, Mr. Begeman held various engineering and management positions with Morrison Knudsen Company in the contract mining operations group throughout the Western United States. Mr. Begeman holds a B.S. in Mining Engineering, an M.S. in Engineering Management and an MBA.
Christiane Bergevin - Director. Christiane Bergevin was Executive Vice-President, Desjardins Group (Canadian financial cooperative institution)between August 2009 and December 2015. She led the mergers and acquisitions, strategic partnerships and business development activities. Prior to that, she was Senior Vice-President and General Manager, Corporate Projects, with SNC-Lavalin Group Inc. (SNC-Lavalin) (engineering and construction firm). For the 18 years prior to that, Ms. Bergevin held executive finance positions with SNC-Lavalin subsidiaries, including as managing executive and subsequently President of SNC-Lavalin Capital Inc., its project finance advisory arm, between 1997 and 2008. Ms Bergevin chairs the audit committee of the board of AGF Group, a leading international steel and scaffolding supplier. She is also a Vice-Chair of the Canadian Chamber of Commerce. Ms. Bergevin holds a Bachelor of Commerce degree (with Distinction) from McGill University and graduated from the Wharton School’s Business Advanced Management Program. In 2013, she was awarded the ICD.D designation by the Institute of Corporate Directors.
Alexander J. Davidson - Director. Alexander Davidson was Barrick Gold Corporation’s Executive Vice President, Exploration and Corporate Development with responsibility for international exploration programs and corporate development activities. Mr. Davidson joined Barrick in October 1993 as Vice President, Exploration with responsibility for the company’s expanding exploration program. He initiated Barrick’s expansion out of North America and into Latin America and beyond. Prior to joining Barrick, Mr. Davidson was Vice President, Exploration for Metall Mining Corporation. Mr. Davidson has over 25 years of experience in designing, implementing and managing gold and base metal exploration and acquisition programs throughout the world. In April 2005, Mr. Davidson was presented the 2005 A.O. Dufresne Award by the Canadian Institute of Mining, Metallurgy and Petroleum to recognize exceptional achievement and distinguished contributions to mining exploration in Canada. In 2003, Mr. Davidson was named the Prospector of the Year by the Prospectors and Developers Association of Canada in recognition for his team’s discovery of the Lagunas Norte Project in the Alto Chicama District, Peru. He received his B.Sc. and his M.Sc. in Economic Geology from McGill University.
Richard Graff - Director. Richard Graff is a retired partner from PricewaterhouseCoopers LLP where he served as the audit leader in the United States for the mining industry. Since his retirement, Mr. Graff has been an advisor to the mining industry and was a member of a Financial Accounting Standards Board task force for establishing accounting and financial reporting guidance in the mining industry. He represents a consortium of international mining companies and has provided recommendations to the International Accounting Standards Board on mining industry issues and to regulators on industry disclosure requirements of securities legislation. He received his undergraduate degree in Economics from Boston College and his post-graduate degree in Accounting from Northeastern University. He serves as the lead director, chairman of the audit committee and a member of the compensation and corporate governance and nominating committees of Alacer Gold Corp. He also serves as chairman of the audit committee and a member of the corporate governance and nominating committee of Dynamic Materials Corporation.
Nigel Lees - Director. Nigel Lees has over 25 years of experience in the investment banking industry. He has served as a member of the Listings Committee of the Toronto Stock Exchange and on the audit committees of boards of several publicly listed companies. He is the founder and director of TVX Gold Inc., which merged with Kinross Gold Corporation in 2003. He is currently the President of C.N. Lees Investments Limited, a private investment and consulting company, and President and Chief Executive Officer of SAGE Gold Inc., a public precious metals exploration and development company.
Peter Marrone - Chairman and Chief Executive Officer. Peter Marrone founded Yamana in July 2003. Mr. Marrone currently serves as Chairman and Chief Executive Officer of Yamana. He has more than 25 years of mining, business and capital markets experience and has been on the boards of a number of public companies and has advised companies with a strong South American presence. Prior to Yamana, Mr. Marrone was the head of investment banking at a major Canadian investment bank and before that, practised law in Toronto with a strong focus on corporate law, securities law and international transactions.
Patrick J. Mars - Lead Director. Patrick Mars is a company director specializing in mine finance and analysis. He benefits from over 30 years of experience in the investment industry and has had extensive involvement in mining research, financing and advisory work. For the majority of his career he was with Alfred Bunting & Co/Bunting Warburg, a Canadian investment dealer and stockbroker where he was President and CEO from 1981 to 1994. During this time he served three-
year terms both as a Governor of the Toronto Stock Exchange (TSX) and Director of the Investment Dealers Association. From 1999 to 2001 he was Chairman and a Director of First Marathon Securities (UK)/NBC Financial (UK) Limited. Presently, Mr. Mars is a director of Aura Minerals Inc. (Chairman) and serves on its audit committee, is a director of Sage Gold Inc. (Chairman) and serves on its audit committee, and is President of P.J. Mars Investments Limited, a private company. Mr. Mars holds a Bachelor of Commerce and a Master of Business Administration. He is also a Chartered Financial Analyst (CFA) charterholder.
Carl Renzoni - Director. Carl Renzoni retired from BMO Nesbitt Burns in 2001, where he was employed since 1969 and most recently served as a Managing Director. He brings over 30 years of experience in the securities business specializing in the mining industry. Mr. Renzoni holds an Honors B.Sc. (Geology) degree from Queen’s University. Mr. Renzoni is currently a director of Copper Mountain Mining Corp. and he previously served on the boards of International Molybdenum Ltd., Peru Copper Inc. and Meridian Gold Inc. Mr. Renzoni also served on the Audit Committee of Meridian Gold Inc.
Jane Sadowsky - Director. Jane Sadowsky retired from Evercore Partners as a Senior Managing Director and Head of the Power & Utility Group in 2011, after more than 22 years as an investment banker. Prior to Evercore Partners, she was a Managing Director and Group Head at Citigroup’s Investment Bank and began her investment banking career at Donaldson, Lufkin & Jenrette. Ms. Sadowsky is an expert in the electricity sector and brings depth of knowledge and experience in mergers and acquisitions, public and private debt and equity, corporate restructurings and cross border transactions. Since retiring, Ms. Sadowsky has served as the Managing Partner for Gardener Advisory LLC, which provides consulting and advisory services predominantly in the electricity power sector to public and private sector clients in the United States and abroad. Ms. Sadowsky earned her MBA from the Wharton School and her BA in Political Science and International Relations from the University of Pennsylvania. Ms. Sadowsky is now a National Association of Corporate Directos (NACD) Governance Fellow.
Dino Titaro - Director. Dino Titaro was the founder of Carpathian Gold Inc., a public mineral exploration company listed on the TSX, and was the President and Chief Executive Officer from January 2003 to January 2014, and a director from January 2003 to August 2014. From 1986 to 2003, Mr. Titaro was the principal owner and President and Chief Executive Officer of A.C.A. Howe International Limited, a geological and mining consulting firm. From 1980 to 1986, Mr. Titaro was employed by Getty Mines Limited, in various supervisory roles as a geologist, working on base and precious metal projects as well as uranium principally in resource definition stages. Mr. Titaro holds a Master of Science degree in Geology from the University of Western Ontario. He is also a qualified person as defined by National Instrument 43-101 and is a registered P.Geo in Ontario. Mr. Titaro currently sits on the board of directors of Thethyan Resource Inc. and Mincor Inc., each being a private mineral resource company, and has been a director and officer of several publicly traded companies in the mining, industrial and health care technology fields.
Charles B. Main - Executive Vice President, Finance and Chief Financial Officer. Mr. Main joined Yamana as Vice President, Finance and Chief Financial Officer in August 2003, with over 25 years of experience in the finance and mining industries. Prior to joining Yamana, Mr. Main held the principal positions of Director of Corporate Development of Newmont Capital Corporation and Vice President of Normandy Mining Limited, Vice President, Finance of TVX Gold Inc., and was with PriceWaterhouseCoopers for 10 years. Mr. Main is a Chartered Accountant and a member of the Ontario and Canadian Institutes of Chartered Accountants. Mr. Main holds a Bachelor of Commerce from McGill University.
Darcy Marud - Executive Vice President, Enterprise Strategy. Darcy Marud joined Yamana as Senior Vice President, Exploration in October 2007 and was appointed to the position of Executive Vice President, Enterprise Strategy in January 2014. Prior to that, he held the position of Vice-President of Exploration for Meridian from 2004 and the position of exploration manager for South America from 1997. Mr. Marud has a combined 27 years of experience as a gold exploration geologist in the Americas with companies such as Homestake Mineral Development Company, FMC Gold and Meridian.
Greg McKnight - Executive Vice President, Business Development. Mr. McKnight joined Yamana as Vice President, Business Development in February 2004. Mr. McKnight has over 20 years of mining focussed investment banking and corporate experience. Prior to joining Yamana, Mr. McKnight was a director in the investment banking division of Canaccord Capital Corporation (“Canaccord”), a position he held since December 2001. Prior to his tenure at Canaccord, he held various mining related positions including senior roles within other Canadian investment banks and being the President of a publicly traded Canadian junior mining company. During the year prior to joining Yamana, Mr. McKnight was instrumental in his capacity as an investment banker in structuring the reverse takeover transaction and raising the equity for Yamana that enabled the Company to re-capitalize and re-position itself as a gold production company. Mr. McKnight holds a Bachelor of Commerce from the University of Toronto and a Master of Business Administration from the Ivey School of Business at the University of Western Ontario.
Richard C. Campbell - Senior Vice President, Human Resources. Mr. Campbell joined Yamana as Senior Vice President, Human Resources in May 2011. Prior to joining Yamana, Mr. Campbell enjoyed progressively senior roles during his 21 years at TD Bank Financial Group. During his tenure at TD, Mr. Campbell worked in executive roles in the business as well as Human Resources, encompassing retail, wealth management, and wholesale/corporate banking. From April 1998 to February 2002, Richard completed international secondments in Hong Kong and London, UK with TD Waterhouse. In his role as SVP Human Resources, TD Canada Trust, Richard led a multi-functional team of HR professionals to develop, implement and execute all aspects of HR services supporting a 36,000 employee workforce across Canada. More recently, Richard’s experience as SVP Human Resources with the Ontario Lottery Group has provided him with valuable and practical executive experience in the public service sector. Mr. Campbell holds an Honours Bachelor of Arts in Geography and Economics, and a Master of Arts in Economic Geography from Wilfrid Laurier University.
Gerardo Fernandez - Senior Vice President, Southern Operations. Mr. Fernandez has been with the Company since 2000, having worked in several positions in mine operations, mine planning and project development. Most recently, Mr. Fernandez played a pivotal role in leading Mercedes into production as its Project Manager/General Manager. Mr. Fernandez holds a Master of Business Administration from Morrison University in Reno, Nevada and a degree in Civil Mining Engineering from the University of Chile.
Ross Gallinger - Senior Vice President, Health, Safety and Sustainable Development. Mr. Gallinger joined Yamana as Senior Vice President, Health, Safety and Sustainable Development in May 2015. Prior to joining Yamana, Mr. Gallinger held the position of Executive Director for Prospectors & Developers Association of Canada from 2011 until 2014. From 2006 until 2011, Mr. Gallinger was Senior Vice President, Health, Safety and Sustainability at IAMGOLD Corporation. Mr. Gallinger has over 25 years of experience in managerial and operational roles in the mining industry in Canada and the Americas with extensive experience in health, safety, environment and community relations portfolios. Mr. Gallinger holds a Bachelor of Science degree in Agriculture from the University of British Columbia, and is a Professional Agrologist.
Jason LeBlanc - Senior Vice President, Finance. Mr. LeBlanc joined the Company in January 2006 and has over 15 years of research-based and financial experience in the mining industry. During his time at Yamana, Mr. LeBlanc has held increasingly senior positions including most recently the position of Vice President, Finance and Treasurer since 2009. Mr. LeBlanc has a Master of Finance from the University of Toronto, a Bachelor of Commerce from the University of Windsor and holds a Chartered Financial Analyst designation.
Barry Murphy - Senior Vice President, Technical Services. Mr. Murphy joined Yamana as Senior Vice President, Technical Services in September 2014. Prior to joining Yamana, Mr. Murphy held the position of Vice President Projects, Copper Division at Anglo American Corporation (“Anglo American”), a position he held since 2010. Mr. Murphy first joined Anglo American in 1987 as a junior engineer and he progressed through increasingly senior positions across various divisions in numerous operational and technical capacities on both open pit and underground mines throughout the organization. From 2000 until 2002, Mr. Murphy held management positions at engineering and construction services firms Hatch and Murray & Roberts - Cementation Limited. Mr. Murphy holds a Bachelor of Science in Mechanical Engineering from the University of Witwatersrand, Johannesburg and a Bachelor of Commerce from the University of South Africa. He is a certified Professional Engineer with the Engineering Council of South Africa and a Project Management Professional with the Project Management Institute.
Daniel Racine - Senior Vice President, Northern Operations. Mr. Racine joined Yamana in May 2014. From August 2012 until March 2014, Mr. Racine was President and Chief Operating Officer of Brigus Gold Corp. (“Brigus”). Prior to joining Brigus, Mr. Racine was Senior Vice President, Mining of Agnico Eagle, where he was responsible for Agnico Eagle’s global mining operations. Mr. Racine joined Agnico Eagle as a junior Mining Engineer in 1988 taking on progressively senior roles throughout his tenure, including LaRonde Mine Manager, Vice-President Operations Manager, and Senior Vice President Operations. Mr. Racine holds a Bachelor of Mining Engineering from Laval University. He is a registered engineer with L’Ordre des Ingenieurs du Québec, a professional engineer with Professional Engineers Ontario and a member of the Ontario Society of Professional Engineers.
Sofia Tsakos - Senior Vice President, General Counsel and Corporate Secretary. Ms. Tsakos joined Yamana as Vice President, Corporate Counsel in December 2007, was appointed Corporate Secretary in November 2009 and Senior Vice President, General Counsel in June 2010. Prior to joining Yamana, Ms. Tsakos was a partner practicing securities law at Cassels Brock & Blackwell LLP. From 2001 to 2006, Ms. Tsakos was an associate at Goodman and Carr LLP. Ms. Tsakos holds an Honours Bachelor of Arts in Economics and Political Science from the University of Toronto, a Master in Business Administration with a focus in Finance from the University of Windsor and a Bachelor of Laws also from the University of Windsor.
William Wulftange - Senior Vice President, Exploration. Mr. Wulftange first joined Yamana through the acquisition of Meridian and has spent over 30 years with Yamana and its predecessor companies. Following a one year appointment as Vice President, Exploration at Andean Resources Limited, Mr. Wulftange rejoined Yamana in January 2011 as Director, Exploration and Business Development. Mr. Wulftange was appointed Vice President, Resources & Reserves and Technical Compliance in July 2013 and assumed the position of Senior Vice President, Exploration in January 2014. Mr. Wulftange has held a number of positions with Yamana and its predecessor companies including Director, Technical Compliance, Chief Geologist and various business development positions. Mr. Wulftange has over 33 years of combined experience in exploration technical compliance and business development with mining companies in the Americas. Mr. Wulftange has a Bachelor of Geology from the University of Colorado and is a founding Registered Member of the Society of Mining Engineers and a Fellow of the Society of Economic Geologists.
Based on the disclosure available on the System for Electronic Disclosure by Insiders (SEDI), as of March 29, 2016, the directors and executive officers of the Company, as a group, beneficially owned, directly or indirectly, or exercised control or direction over approximately 2,018,049 common shares, representing approximately 0.213% of the total number of common shares outstanding.
Corporate Cease Trade Orders, Bankruptcies, Penalties or Sanctions
No director or executive officer of the Company is, as at the date hereof, or has been, within the 10 years before the date hereof, a director, chief executive officer or chief financial officer of any company (including Yamana) that:
| |
| (a) | was subject to a cease trade or similar order, or an order that denied the company access to any exemption under securities legislation, that was issued while the director or executive officer was acting in the capacity as director, chief executive officer or chief financial officer, or |
| |
| (b) | was subject to a cease trade or similar order, or an order that denied the company access to any exemption under securities legislation, that was issued after the director or executive officer ceased to be a director, chief executive officer or chief financial officer and which resulted from an event that occurred while that person was acting in the capacity as a director, chief executive officer or chief financial officer, |
that was in effect for a period of more than 30 consecutive days, other than Mr. Patrick J. Mars and Mr. Dino Titaro. On April 16, 2014, the Ontario Securities Commission (the “OSC”) issued a management cease trade order against the Interim Chief Executive Officer and the Chief Financial Officer of Carpathian Gold Inc. (“Carpathian”) in connection with Carpathian’s failure to file its audited annual financial statements (and related management’s discussion and analysis and certifications) for the period ended December 31, 2013. The management cease trade order was lifted on June 19, 2014 following the filing by Carpathian of the required documents. Mr. Mars and Mr. Titaro are former directors of Carpathian (they did not stand for re-election and were no longer directors on August 12, 2014) but were directors of Carpathian during the period of the management cease trade order. In addition, Mr. Titaro resigned as a director of Cogient Corp. (“Cogient”) effective July 31, 2006. On August 22, 2006, a cease trade order was issued and a receiver was appointed by the court on December 8, 2006. On February 7, 2007, all of the assets of Cogient vested in the Trustee Corporation, as trustee for the debenture holders under a trust indenture dated December 24, 2002. In addition, Mr. Titaro resigned as director of Royal Coal Corp. (“Royal Coal”) on May 9, 2012. On May 17, 2012, Royal Coal announced that it received notice from the TSX Venture Exchange that trading in Royal Coal’s securities was suspended as a result of a cease trade order by the OSC for the failure to file financial statements. This cease trade order remains in effect. No director or executive officer of the Company, or a shareholder holding a sufficient number of securities of the Company to affect materially control of the Company,
| |
| (a) | is as of the date hereof, or has been within the 10 years before the date hereof, a director or executive officer of any company (including Yamana) that, while that person was acting in that capacity, or within a year of that person ceasing to act in that capacity, became bankrupt, made a proposal under any legislation relating to the bankruptcy or insolvency, or became subject to or instituted any proceedings, arrangement or compromise with creditors, or had a receiver, receiver manager or trustee appointed to hold the assets of the director, executive officer or shareholder. |
No director or executive officer of the Company, or a shareholder holding a sufficient number of securities of the Company to affect materially the control of the Company, has been subject to:
| |
| (a) | any penalties or sanctions imposed by a court relating to securities legislation or by a securities regulatory authority or has entered into a settlement agreement with a securities regulatory authority; or |
| |
| (b) | any other penalties or sanctions imposed by a court or regulatory body that would likely be considered important to a reasonable investor in making an investment decision. |
Conflicts of Interest
To the best of the Company’s knowledge, and other than as disclosed herein, there are no known existing or potential conflicts of interest between the Company and any directors or officers of the Company, except that certain of the directors and officers serve as directors, officers, promoters and members of management of other public or private companies and therefore it is possible that a conflict may arise between their duties as a director or officer of the Company and their duties as a director, officer, promoter or member of management of such other companies.
The directors and officers of the Company are aware of the existence of laws governing accountability of directors and officers for corporate opportunity and requiring disclosures by directors of conflicts of interest and the Company will rely upon such laws in respect of any directors’ and officers’ conflicts of interest or in respect of any breaches of duty by any of its directors or officers. All such conflicts will be disclosed by such directors or officers in accordance with the Canada Business Corporations Act and they will govern themselves in respect thereof to the best of their ability in accordance with the obligations imposed upon them by law.
ITEM 9
PROMOTER
No person or company has within the two most recently completed financial years, or is during the current financial year, been a promoter of Yamana or a subsidiary thereof.
ITEM 10
LEGAL PROCEEDINGS AND REGULATORY ACTIONS
Other than as set forth below, the Company was not during fiscal 2015, and is not currently, a party to, nor was/is any of its property the subject of, any legal proceedings, or any known to be contemplated, which involve a material claim for damages within the meaning of applicable securities legislation.
In 2004, a former director of Northern Orion (now named 0805346 B.C. Ltd.) commenced proceedings in Argentina against Northern Orion claiming damages in the amount of $177.0 million for alleged breaches of agreements entered into with the plaintiff. The plaintiff alleged that the agreements entitled him to a pre-emptive right to participate in acquisitions by Northern Orion in Argentina and claimed damages in connection with the acquisition by Northern Orion of its 12.5% equity interest in the Alumbrera Mine. On August 22, 2008, the National Commercial Court No. 13 of the City of Buenos Aires issued a first-instance judgment rejecting the claim. The plaintiff appealed this judgment to the National Commercial Appeals Court. On May 22, 2013, the appellate court overturned the first-instance decision. The appellate court determined that the plaintiff was entitled to make 50% of Northern Orion’s investment in the Alumbrera acquisition, although weighted the chance of the plaintiff’s 50% participation at 15%. The matter was remanded to the first-instance court to determine the value. Northern Orion appealed this decision through to the Supreme Court of Argentina, but on October 28, 2014, the Supreme Court denied Northern Orion’s motion for leave to appeal and accordingly the determination of the National Commercial Appeals Court regarding the plaintiff’s entitlement to damages stands. The court appointed valuator subsequently delivered an assessment order of the value of lost opportunity to the plaintiff at $244 million. On November 13, 2015, the National Commercial Court of Appeals rejected the plaintiff’s appeal against the annulment of the award. As no further action before the expiration of the term for any possible appeal on December 18, 2015, the annulment of the $244 million award made by the valuator is definitive. A new court appointed valuator will now be assigned to determine the assessment. The quantum of liability in this case is uncertain, but Northern Orion will continue to vigorously defend its position.
In December 2012, the Company received assessments from the Brazilian federal tax authorities disallowing certain deductions relating to financial instruments used to finance Brazilian operations for the years 2007 to 2010. The Company believes that these financial instruments were issued on commercial terms permitted under applicable laws and is appealing these assessments. As such, the Company does not believe it is probable that any amounts will be paid with respect to these assessments with the Brazilian authorities and the amount and timing of any assessments cannot be reasonably estimated.
There have been no penalties or sanctions imposed against the Company by a court relating to securities legislation or by a securities regulatory authority during fiscal 2015, or any other time that would likely be considered important to a reasonable investor making an investment decision in the Company, and the Company has not entered into any settlement agreements with a court relating to securities legislation or with a securities regulatory authority during fiscal 2015.
ITEM 11
INTEREST OF MANAGEMENT AND OTHERS IN MATERIAL TRANSACTIONS
Other than as described elsewhere herein, none of the directors, executive officers or persons or companies who beneficially own, or control or direct, directly or indirectly, more than 10 percent of any class of outstanding voting securities of the Company, nor any associate or affiliate of the foregoing persons, has or has had any material interest, direct or indirect, in any transaction within the past three financial years or during the current financial year, that has materially affected or is reasonably expected to have material effect on the Company.
ITEM 12
TRANSFER AGENTS AND REGISTRAR
The transfer agent and registrar for the common shares of the Company is CST Trust Company, at its principal offices in Toronto, Ontario, and the co-transfer agent for the common shares in the United States is American Stock Transfer & Trust Company, LLC, at its principal offices in Brooklyn, New York.
ITEM 13
MATERIAL CONTRACTS
The only material contracts entered into by the Company, other than in the ordinary course of business, within the most recently completed financial year, or prior thereto and are still in effect, are described below. Copies of these material contracts are available under the Company’s SEDAR profile at www.sedar.com.
The Company entered into a note purchase agreement dated December 18, 2009 (the “Note Purchase Agreement”) pursuant to which it issued and sold senior unsecured notes in an aggregate principal amount of $270,000,000 of which $15,000,000 are 5.53% Series A Senior Notes due December 21, 2014 (the “2009 Series A Notes”), $73,500,000 are 6.45% Series B Senior Notes due December 21, 2016 (the “2009 Series B Notes”) and $181,500,000 are 6.97% Series C Senior Notes due December 21, 2019 (together with the 2009 Series A Notes and the 2009 Series B Notes, the “Notes”). The Company may prepay the Notes at any time provided it pays a make whole payment to the holders. The Notes are also guaranteed by the Guarantors. The covenants, including the financial covenants, and events of default under the Note Purchase Agreement and the Notes are similar to the covenants and events of default under the Credit Agreement.
The Company entered into a note purchase agreement dated March 23, 2012 (the “Second Note Purchase Agreement”) pursuant to which it issued and sold senior unsecured notes in an aggregate principal amount of $500,000,000 of which $75,000,000 are 3.89% Series A Senior Notes due March 23, 2018 (the “2012 Series A Notes”), $85,000,000 are 4.36% Series B Senior Notes due March 23, 2020 (the “2012 Series B Notes”), $200,000,000 are 4.76% Series C Senior Notes due March 23, 2022 (the “2012 Series C Notes”) and $140,000,000 are 4.91% Series D Senior Notes due March 23, 2024 (together with the 2012 Series A Notes, the 2012 Series B Notes and the 2012 Series C Notes, the “Second Notes”). The Company may prepay the Second Notes at any time provided it pays a make whole payment to the holders. The Second Notes are also guaranteed by the Guarantors. The covenants, including the financial covenants, and events of default under the Second Note Purchase Agreement and the Second Notes are similar to the covenants and events of default under the Credit Agreement and the Note Purchase Agreement.
The Company entered into a note purchase agreement dated June 10, 2013 (the “Third Note Purchase Agreement”) pursuant to which it issued and sold senior unsecured notes in an aggregate principal amount of $300,000,000 of which $35,000,000 are 3.64% Series A Senior Notes due June 10, 2018 (the “2013 Series A Notes”) and $265,000,000 are 4.78% Series B Senior Notes due June 10, 2023 (together with the 2013 Series A Notes, the “Third Notes”). The Company may prepay the Third Notes at any time provided it pays a make whole payment to the holders. The Third Notes are also guaranteed by the Guarantors. The covenants, including the financial covenants, and events of default under the Third Note Purchase Agreement and the Third Notes are similar to the covenants and events of default under the Credit Agreement, the Note Purchase Agreement and the Second Note Purchase Agreement.
The Company entered into the Indenture in connection with the issuance of the Initial Notes in June 2014, which were subsequently exchanged for the New Notes. See “General Development of the Business - History - Note Exchange Offer”.
The Company entered into the Underwriting Agreement in connection with the Public Offering of common shares of the Company. See “General Development of the Business - History - Public Offering”.
ITEM 14
AUDIT COMMITTEE
The Audit Committee is responsible for monitoring the Company’s systems and procedures for financial reporting and internal control, reviewing certain public disclosure documents and monitoring the performance and independence of the Company’s external auditors. The committee is also responsible for reviewing the Company’s annual audited financial statements, unaudited quarterly financial statements and management’s discussion and analysis of financial results of operations for both annual and interim financial statements and review of related operations prior to their approval by the full board of directors of the Company.
The Audit Committee’s charter sets out its responsibilities and duties, qualifications for membership, procedures for committee member removal and appointment and reporting to the board of directors of the Company. A copy of the charter is attached hereto as Schedule “A”.
During the year ended December 31, 2015, the Audit Committee was comprised of four directors, all of whom were independent directors. As of the date hereof, the current members of the Audit Committee are: Richard Graff (Chair), John Begeman, Patrick J. Mars, Carl Renzoni and Jane Sadowsky. In addition to being independent directors as described above, all members of the Company’s Audit Committee must meet an additional “independence” test under National Instrument 52-110 Audit Committees (“NI 52-110”) in that their directors’ fees are the only compensation they, or their firms, receive from the Company and that they are not affiliated with the Company. Each member of the Audit Committee is financially literate within the meaning of NI 52-110.
The Audit Committee met four times during the most recently completed financial year and all persons who were members of the committee at the time of holding such meetings were in attendance.
Relevant Educational Experience
Set out below is a description of the education and experience of each of the Company’s four current audit committee members, which is relevant to the performance of his responsibilities as an audit committee member.
Richard Graff - Richard Graff is a retired partner from PricewaterhouseCoopers LLP where he served as the audit leader in the United States for the mining industry. Since his retirement, Mr. Graff has been an advisor to the mining industry and was a member of a Financial Accounting Standards Board task force for establishing accounting and financial reporting guidance in the mining industry. He represents a consortium of international mining companies and has provided recommendations to the International Accounting Standards Board on mining industry issues and to regulators on industry disclosure requirements of securities legislation. He received his undergraduate degree in Economics from Boston College and his post-graduate degree in Accounting from Northeastern University. He serves as the lead director, chairman of the audit committee and a member of the compensation and corporate governance and nominating committees of Alacer Gold Corp. He also serves as chairman of the audit committee and a member of the corporate governance and nominating committee of Dynamic Materials Corporation.
John Begeman - John Begeman currently sits on the board of directors of Premier Gold Mines Limited and acts as the Executive Chairman, chairman of its audit committee and a member of its compensation committee, and was appointed to the board of Aberdeen International Inc. in January 2015 and is a member of its audit committee and compensation committee. He previously served as the President and Chief Executive Officer of Avion Gold Corporation, as the Chief Operating Officer of Zinifex Canada Inc. and as Vice President, Western Operations of Goldcorp Inc. Prior to his employment at Goldcorp, Mr. Begeman held various engineering and management positions with Morrison Knudsen Company in the contract mining operations group throughout the Western United States. Mr. Begeman holds a B.S. in Mining Engineering, an M.S. in Engineering Management and an MBA.
Patrick J. Mars - Patrick Mars is a Chartered Financial Analyst (CFA) charterholder and a company director specializing in mine finance and analysis. He benefits from over 30 years of experience in the investment industry and has had extensive involvement in mining research, financing and advisory work. For the majority of his career he was with Alfred Bunting & Co./Bunting Warburg, a Canadian investment dealer and stockbroker where he was President and CEO from 1981 to 1994. During this time he served three-year terms both as a Governor of the Toronto Stock Exchange (TSX) and Director of the Investment Dealers Association. From 1999 to 2001 he was Chairman and a Director of First Marathon Securities (UK)/NBC Financial (UK) Limited. Presently, Mr. Mars is a director of Aura Minerals Inc. (Chairman) and serves on its audit committee, is a director of Sage Gold Inc. (Chairman) and serves on its audit committee, and is President of P.J.
Mars Investments Limited, a private company. Mr. Mars holds a Bachelor of Commerce and a Master of Business Administration.
Carl Renzoni - Carl Renzoni retired from BMO Nesbitt Burns in 2001, where he was employed since 1969 and most recently served as a Managing Director. He brings over 30 years of experience in the securities business specializing in the mining industry. Mr. Renzoni has previously served on the boards of several public mineral exploration companies and also previously served on the Audit Committee of Meridian Gold Inc.
Jane Sadowsky - Jane Sadowsky retired from Evercore Partners as a Senior Managing Director and Head of the Power & Utility Group in 2011, after more than 22 years as an investment banker. Prior to Evercore Partners, she was a Managing Director and Group Head at Citigroup’s Investment Bank and began her investment banking career at Donaldson, Lufkin & Jenrette. Ms. Sadowsky earned her MBA from the Wharton School.
Pre-Approval Policies and Procedures
The Audit Committee’s charter sets out responsibilities regarding the provision of non-audit services by the Company’s external auditors. This policy encourages consideration of whether the provision of services other than audit services is compatible with maintaining the auditor’s independence and requires Audit Committee pre-approval of permitted audit and audit-related services.
External Auditor Service Fees
Audit Fees
The aggregate audit fees billed by the Company’s external auditors for the year ended December 31, 2015 were Cdn$2,630,000 (December 31, 2014 - Cdn$2,845,000). The audit fees relate to the audit of the annual consolidated financial statements of the Company, and certain statutory audits outside of Canada.
Audit-Related Fees
The aggregate audit-related fees billed by the Company’s external auditors for the year ended December 31, 2015 were Cdn$1,433,000 (December 31, 2014 - Cdn$1,363,000).
Tax Fees
The aggregate tax fees billed by the Company’s external auditors for the year ended December 31, 2015 were Cdn$70,000 (December 31, 2014 - Cdn$0).
All Other Fees
The other fees billed by the Company’s external auditors for the year ended December 31, 2015 was Cdn$74,000 (December 31, 2014 - Cdn$23,000), which related primarily to assurance on the Company’s Conflict-Free Gold Report.
ITEM 15
INTERESTS OF EXPERTS
The following are the technical reports prepared in accordance with NI 43-101 from which certain scientific and technical information relating to the Company’s material mineral projects contained in this annual information form has been derived, and in some instances extracted, as well as certain qualified persons involved in preparing such reports, and details of certain technical information relating to the Company’s material mineral projects contained in this annual information form which have been reviewed and approved by qualified persons.
Chapada Mine - “Technical Report on the Chapada Mine, Brazil” dated July 31, 2014, prepared by or under the supervision of Wayne W. Valliant, P.Geo., and Robert L. Michaud, P. Eng., of RPA, who are qualified persons pursuant to NI 43-101. The technical information set forth under the heading “Description of the Business - Material Producing Mines - Chapada Mine has been reviewed and approved by the Chapada Qualified Persons and William Wulftange, P.Geo, Senior Vice President, Exploration of the Company, each of whom is a qualified person pursuant to NI 43-101.
El Peñón Mine - “Technical Report on the El Peñón Mine, Northern Chile” dated December 7, 2010, prepared by or under the supervision of Stuart E. Collins, P.E., and Chester M. Moore, P.Eng., of RPA and Kevin C. Scott, P. Eng., formerly with RPA, who are a qualified persons pursuant to NI 43-101. The technical information set forth under the heading “Description of the Business - Material Producing Mines - El Peñón Mine has been reviewed and approved by the El Peñón Qualified Persons and William Wulftange, P.Geo, Senior Vice President, Exploration of the Company, each of whom is a qualified person pursuant to NI 43-101.
Canadian Malartic Mine - “Technical Report on the Mineral Resource and Mineral Reserve Estimates for the Canadian Malartic Property” dated August 13, 2014 prepared by or under the supervision of Donald Gervais, P.Geo., Christian Roy, Eng., Alain Thibault, Eng., Carl Pednault, Eng. and Daniel Doucet, Eng. The technical information set forth under the heading “Description of the Business - Material Producing Mines - Canadian Malartic Mine” has been reviewed and approved by Donald Gervais, P. Geo., of Canadian Malartic GP, who is a qualified person pursuant to NI 43-101.
Each of the technical reports noted above are available on the Company’s SEDAR profile at www.sedar.com, and a summary of each report is contained in this annual information form under “Description of the Business - Mineral Projects - Material Producing Mines”.
The following are the qualified persons responsible for the Mineral Resource and Mineral Reserve estimates for each of the Company’s material mineral projects set out in this annual information form under “Description of the Business - Mineral Projects - Summary of Mineral Reserve and Mineral Resource Estimates”.
|
| | |
| Property | Qualified Persons for Mineral Reserves | Qualified Persons for Mineral Resources |
| Chapada | Luiz Pignatari, Registered Member of Chilean Mining Commission | Marcos Valencia A., Registered Member of Chilean Mining Commission, Corporate Manager R&R, Andes/Mexico, Yamana Gold Inc. Felipe Machado de Araujo, Registered Member of Chilean Mining Commission, Mineral Resources Coordinator Brazil, Yamana Gold Inc. |
| El Peñón | Carlos Bottinelli Otárola, P. Eng., Registered Member of Chilean Mining Commission, Development Manager, Yamana Gold Inc. | Marcos Valencia A., Registered Member of Chilean Mining Commission, Corporate Manager R&R, Andes/Mexico, Yamana Gold Inc. |
| Canadian Malartic | Donald Gervais, P. Geo., Canadian Malartic General Partnership | Donald Gervais, P. Geo., Canadian Malartic General Partnership |
The aforementioned firms or persons held either less than one percent or no securities of the Company or of any associate or affiliate of the Company when they prepared the reports or the Mineral Reserve estimates or the Mineral Resource estimates referred to, or following the preparation of such reports or data, and either did not receive any or received less than a one percent direct or indirect interest in any securities of the Company or of any associate or affiliate of the Company in connection with the preparation of such reports or data.
None of the aforementioned firms or persons, nor any directors, officers or employees of such firms, are currently, or are expected to be elected, appointed or employed as, a director, officer or employee of the Company or of any associate or affiliate of the Company other than Carlos Bottinelli Otárola, Marcos Valencia A. and Felipe Machado de Araujo, who are employed by Yamana, and Donald Gervais, who is employed by Canadian Malartic GP.
Deloitte LLP is the auditor of Yamana and is independent within the meaning of the Rules of Professional Conduct of the Institute of Chartered Accountants of British Columbia.
ITEM 16
ADDITIONAL INFORMATION
Additional information, including directors’ and officers’ remuneration and indebtedness, principal holders of the Company’s securities and securities authorized for issuance under equity compensation plans, as applicable, will be contained in the Company’s management information circular to be filed in connection with its annual shareholders’ meeting for 2016. Additional financial information is provided in the Company’s financial statements and managements’ discussion and analysis for the fiscal year ended December 31, 2015. Additional financial information relating to the Company may also be found under the Company’s SEDAR profile at www.sedar.com.
SCHEDULE “A”
CHARTER OF THE AUDIT COMMITTEE
OF THE BOARD OF DIRECTORS
RATIFIED FEBRUARY 16, 2016.
The Audit Committee is a committee of the Board of Directors (the “Board”) of Yamana Gold Inc. (the “Company”). The purpose of the Audit Committee is to:
| |
| (a) | assist the Board in its oversight responsibilities with respect to: (i) the integrity of the Company’s financial statements; (ii) the Company’s compliance with legal and regulatory requirements; (iii) the external auditors’ qualifications and independence; and (iv) the performance of the Company’s internal and external audit functions; |
| |
| (b) | serve as an independent and objective party to monitor the Company’s financial reporting processes and internal control systems; |
| |
| (c) | review and appraise the audit activities of the Company’s external auditors; and |
| |
| (d) | prepare Audit Committee report(s) as required by applicable regulators. |
The Audit Committee shall have the authority to delegate to one or more of its members, responsibility for developing recommendations for consideration by the Audit Committee with respect to any of the matters referred to in this Charter.
| |
| 2. | Composition and Meetings |
The Audit Committee shall be comprised of three or more directors as determined by the Board, each of whom shall be an “independent director” in accordance with applicable legal requirements, including the requirements of National Instrument 52-110 Audit Committees (“NI 52-110”) and the Corporate Governance Rules of the New York Stock Exchange, as such rules are revised, updated or replaced from time to time, subject to any waivers or exceptions granted by such stock exchange.
All members shall, to the satisfaction of the Board, be "financially literate", and at least one member shall have accounting or related financial management expertise to qualify as a "financial expert" in accordance with applicable legal requirements, including the requirements of NI 52-110 and the rules adopted by the United States Securities and Exchange Commission (the ‘SEC”), as revised, updated or replaced from time to time.
The members of the Audit Committee and its chairman shall be elected by the Board at the annual organizational meeting of the Board, and shall serve until: the next annual meeting of shareholders; they resign; their successors are duly appointed; or such member is removed from the Audit Committee by the Board. If the Board fails to designate one member as the chairman of the Audit Committee (the “Chairman”), the members of the Audit Committee shall appoint the Chairman from among its members.
The Audit Committee shall meet as frequently as the Audit Committee considers necessary, but not less than once each quarter, to review the financial results of the Company. The Audit Committee shall have the resources and authority appropriate to discharge its duties and responsibilities, including the authority to select, retain, terminate, and approve the fees and other retention terms of special or independent counsel, accountants or other experts or advisors, as it deems necessary or appropriate, without seeking approval of the Board or management.
The Audit Committee shall have the authority to meet with the Chief Executive Officer and the Chief Financial Officer, along with internal auditors and the external auditor, and have such other direct and independent interaction with such persons from time to time as the members of the Audit Committee deem appropriate. The Audit Committee may request the CEO to have such officers or employees of the Company or the Company’s outside counsel or external auditor to attend a meeting of the Audit Committee or to meet with any members of, or consultants to, the Audit Committee.
The external auditors will have direct access and report directly to the Audit Committee at their own initiative.
Quorum for the transaction of business at any meeting of the Audit Committee shall be a majority of the number of members of the Audit Committee or such greater number as the Audit Committee shall by resolution determine.
Meetings of the Audit Committee shall be held from time to time as the Audit Committee or the Chairman shall determine upon notice to each of its members in compliance with the Company’s by-laws. The notice period may be waived by a quorum of the Audit Committee.
| |
| 3. | Responsibilities and Powers |
Responsibilities and powers of the Audit Committee include:
General
| |
| 1. | review and assess the adequacy of this Charter at least annually and, where necessary or desirable, recommend changes to the Board provided that this Charter may be amended and restated from time to time without the approval of the Board to ensure that the composition of the Audit Committee and the responsibilities and powers of the Audit Committee comply with applicable laws and stock exchanges; |
| |
| 2. | evaluate the functioning and effectiveness of the Audit Committee and its members on an annual basis; |
Documents/Reports Review
| |
| 3. | prior to the recommendation to the Board for approval of release of the annual and quarterly financial statements, review and discuss with management and the independent public accountants, upon completion of their audit or review, the financial results for the year or quarter and the results of the audit or review, including (i) the Company's annual or quarterly financial statements and related footnotes; (ii) management’s discussion and analysis of the financial condition and results of operations; (iii) annual and quarterly earnings press releases; (iv) the results of the audit or review, including the nature and amount of unrecorded adjustments resulting from the audit or review; (v) review with the independent public accountants and management the Company's policies and procedures relative to the adequacy of internal accounting and financial reporting controls (including any significant deficiencies and significant changes in internal control over financial reporting), including controls over quarterly and annual financial reporting, computerized information systems and security (vi) the independent public accountants’ management recommendations; (vii) any significant transactions which occurred during the year or quarter; (viii) any significant adjustments; critical accounting policies and practices (ix) management judgments and accounting estimates; (x) new accounting policies; (xi) all alternative treatments of financial information within generally accepted accounting principles, ramifications of the use of alternative disclosures and treatments, and the treatment preferred by the independent public accountants; and (xii) any disagreements between management and the independent public accountants; |
| |
| 4. | ensure that adequate procedures are in place for the review of the issuer's disclosure of financial information extracted or derived from the issuer's financial statements and periodically assess the adequacy of such procedures; |
| |
| 5. | review the effects of regulatory and accounting initiatives, as well as off-balance sheet structures, on the financial statements of the Company; |
| |
| 6. | at least annually, (i) inquire of management and the independent public accountant about the significant business, political, regulatory and internal control issues or exposures to financial risk; (ii) oversee and monitor management’s documentation of the significant financial risks that the Company faces and update as events change and risks shift and (iii) assess the steps that management has taken to control identified financial and internal control risks to the Company; |
Responsibilities of the Audit Committee Chairman
| |
| 7. | the fundamental responsibility of the Audit Committee Chairman is to be responsible for the management and effective performance of the Audit Committee and provide leadership to the Audit Committee in fulfilling its mandate and any other matters delegated to it by the Board. To that end, the Audit Committee Chairman’s responsibilities shall include: |
| |
| a. | working with the Chairman and Chief Executive Officer and the Corporate Secretary to establish the frequency of Audit Committee meetings and the agendas for meetings; |
| |
| b. | providing leadership to the Audit Committee and presiding over Audit Committee meetings; |
| |
| c. | facilitating the flow of information to and from the Audit Committee and fostering an environment in which Audit Committee members may ask questions and express their viewpoints; |
| |
| d. | reporting to the Board with respect to the significant activities of the Audit Committee and any recommendations of the Audit Committee; and |
| |
| e. | leading the Audit Committee in annually reviewing and assessing the adequacy of its mandate and evaluating its effectiveness in fulfilling its mandate; and taking such other steps as are reasonably required to ensure that the Audit Committee carries out its mandate; |
External Auditors
| |
| 8. | recommend external auditors nominations to the Board to be put before the shareholders for appointment and, as necessary, the removal of any external auditor in office from time to time; |
| |
| 9. | approve the fees and other compensation to be paid to the external auditors and the funding for payment of the external auditors’ compensation and any advisors retained by the Audit Committee; |
| |
| 10. | pre-approve all audit services, internal control related services and any permissible non-audit engagements of the external auditors, in accordance with applicable legislation; |
| |
| 11. | meet with external auditors and financial management of the Company to review the scope of the proposed audit of the current year, and the audit procedures to be used; |
| |
| 12. | meet quarterly with external auditors “in camera” to discuss reasonableness of the financial reporting processes, systems of internal control, significant comments and recommendations, and management performance; |
| |
| 13. | advise the external auditors of their ultimate accountability to the Board and the Audit Committee; |
| |
| 14. | oversee the work of the external auditors engaged for the purpose of preparing an audit report or performing other audit, review and attest services for the issuer; |
| |
| 15. | evaluate the qualifications, performance and independence of the external auditors which are to report directly to the Audit Committee, including: (i) reviewing and evaluating the lead partner on the external auditors' engagement with the Company, (ii) considering whether the auditors' quality controls are adequate and the provision of permitted non-audit services is compatible with maintaining the auditors' independence, (iii) determine the rotation of the lead audit partner and the audit firm, and (iv) take into account the opinions of management and the internal audit function in assessing the external auditors’ qualifications, independence and performance; |
| |
| 16. | present the Audit Committee’s conclusions with respect to its evaluation of external auditors to the Board and take such additional action to satisfy itself of the qualifications, performance and independence of external auditors and make further recommendations to the Board as it considers necessary; |
| |
| 17. | obtain and review a report from the external auditors at least annually regarding: (i) the external auditors' internal quality-control procedures; (ii) material issues raised by the most recent internal quality-control review, or peer review, of the firm, or by any inquiry or investigation by governmental or professional authorities within the preceding five years respecting one or more external audits carried out by the firm; (iii) any steps taken to deal with any such issues; and (iv) all relationships between the external auditors and the Company; |
| |
| 18. | discuss with the external auditors any relationships that might affect the external auditors’ objectivity and independence; |
| |
| 19. | recommend to the Board any action required to ensure the independence of the external auditors; |
| |
| 20. | review and approve policies for the Company's hiring of employees or former employees of the present and former external auditors; |
Internal Audit
| |
| 21. | receive reports from the Company's Chief Financial Officer on the scope and material results of its internal SOX audit activities; |
| |
| 22. | establish procedures for: (i) the receipt, retention and treatment of complaints regarding accounting, internal controls or auditing matters; and (ii) the confidential, anonymous submission of concerns regarding questionable accounting, internal control and auditing matters; |
Financial Reporting Process
| |
| 23. | periodically discuss the integrity, completeness and accuracy of the Company’s internal controls and the financial statements with the external auditors in the absence of the Company's management; |
| |
| 24. | in consultation with the external auditors, review the integrity of the Company's financial internal and external reporting processes; |
| |
| 25. | consider the external auditors' assessment of the appropriateness of the Company's auditing standards and accounting principles as applied in its financial reporting; |
| |
| 26. | review and discuss with management and the external auditors at least annually and approve, if appropriate, any material changes to the Company's internal auditing and accounting principles and practices suggested by the external auditors or management; |
| |
| 27. | review disclosures made by the CEO and CFO during their certification process for the annual and interim filings with applicable securities regulatory authorities about any significant deficiencies in the design or operation of internal controls which could adversely affect the Company's ability to record, process, summarize and report financial data or any material weaknesses in the internal controls, and any fraud involving management or other employees who have a significant role in the Company's internal controls; |
| |
| 28. | establish regular and separate systems of reporting to the Audit Committee by management and the external auditors of any significant decision made in management's preparation of the financial statements, including the reporting of the view of management and the external auditors as to the appropriateness of such decisions; |
| |
| 29. | discuss during the annual audit, and review separately with each of management and the external auditors, any significant matters arising from the course of any audit, including any restrictions on the scope of work or access to required information; whether raised by management or the external auditors; |
| |
| 30. | resolve any disagreements between management and the external auditors regarding financial reporting; |
| |
| 31. | review with the external auditors and management the extent to which changes or improvements in financial or accounting practices, as approved by the Audit Committee, have been implemented at an appropriate time subsequent to the implementation of such changes or improvements; |
| |
| 32. | retain and determine the compensation of any independent counsel, accountants or other advisors to assist in its oversight responsibilities (the Audit Committee shall not be required to obtain the approval of the Board for such purposes); |
| |
| 33. | discuss any management or internal control letters or proposals to be issued by the external auditors of the Company; |
Legal Compliance
| |
| 34. | review with the Company's legal counsel any legal matter that the Audit Committee understands could have a significant impact on the Company's financial statements; |
| |
| 35. | conduct or authorize investigations into matters within the Audit Committee's scope of responsibilities; |
| |
| 36. | perform any other activities, in accordance with the Charter, the Company's by-laws and governing laws, that the Audit Committee or the Board deems necessary or appropriate; |
Reporting and Powers
| |
| 37. | record minutes of its meetings and report periodically to the Board on all matters and recommendations made by the Audit Committee and at such other times as the Board may consider appropriate; and |
| |
| 38. | exercise such other powers and perform such other duties and responsibilities as are incidental to the purposes, duties and responsibilities specified herein and as may from time to time be delegated to the Audit Committee by the Board. |
| |
| 4. | Limitation of Responsibility |
While the Audit Committee has the responsibilities and powers provided by this Charter, it is not the duty of the Audit Committee to plan or conduct audits or to determine that the Company's financial statements are complete and accurate and are in accordance with applicable accounting principles and standards. This is the responsibility of management (with respect to whom the Audit Committee performs an oversight function) and the external auditors.