Forward Looking Statements:
Except for historical information, this presentation may include forward looking statements which are subject to certain risk factors that could cause actual results to differ materially from those presented in the forward looking statements. Some of the risk factors that could affect future results are described in our Annual Report on Form 10-K and other filings with the Securities and Exchange Commission.
Basis of Preparation and Non-GAAP Measures:
Definitions and presentation: All financial information contained herein is unaudited by the Company’s independent registered public accounting firm, except for the financial data relating to the year-ended December 31, 2006, to the extent it was derived from the Company’s audited financial statements. Unless otherwise noted, all data is in U.S. dollars thousands, except for per share, percentage and ratio information.
GAAP refers to generally accepted accounting principles in the United States. In presenting the Company’s results, management has included and discussed certain “non-GAAP financial measures”, as such term is defined in Regulation G. Management believes that these non-GAAP measures, which may be defined differently by other companies, better explain the Company’s results of operations in a manner that allows for a more complete understanding of the underlying trends in the Company’s business. However, these measures should not be viewed as a substitute for those determined in accordance with GAAP. The reconciliation of such non-GAAP financial measures to their respective most directly comparable GAAP financial measures in accordance with Regulation G is included in this financial supplement.
Discontinued operations:As a result of the disposal of Environmental Strategies Consulting LLC (“ESC”) on September 15, 2006, the Company’s technical services segment now consists of the Company’s two environmental liability assumption programs. The three months and year ended December 31, 2005 comparatives have been reclassified to conform with the presentation of ESC in discontinued operations for the three months and year ended December 31, 2006.
Operating income (loss) from continuing operations before tax (a non-GAAP financial measure): Operating income (loss) from continuing operations before tax is an internal performance measure used by the Company in the management of its operations and represents continuing income (loss) before tax excluding, as applicable, net realized investment gains or losses and net foreign exchange gains or losses and other items of income and expense not attributable to its operating segments. The Company excludes net realized investment gains or losses and after-tax net foreign exchange gains or losses from its calculation of operating income (loss) before tax because the amount of these gains or losses is heavily influenced by, and fluctuates in part, according to investment and foreign exchange market conditions. The Company believes these amounts are largely independent of its underwriting and technical services decision making process and profitability and including them distorts the analysis of trends in its operations. In addition to presenting net income or loss determined in accordance with GAAP, the Company believes that showing continuing operating income (loss) before tax enables investors, analysts, rating agencies, clients and other users of its financial information to more easily analyze the Company’s results of operations in a manner similar to how management analyzes the Company’s underlying business performance. Continuing operating income (loss) before tax should not be viewed as a substitute for GAAP net income (loss) available to common shareholders.
Underwriting segments income (loss)(a GAAP financial measure): Underwriting income (loss) is a measure of profitability of the Company’s underwriting segments that takes into account net premiums earned and other insurance related income as revenue and net loss and loss expenses, acquisition costs and underwriting related general and administrative expenses as expenses. Underwriting income (loss) is the difference between revenues and expense items.
Technical segments services income (loss)(a GAAP financial measure): Technical services income (loss) is a measure of profitability of the Company’s technical services segment that takes into account technical services income and other technical services-related income as revenue, and technical services general and administrative expenses as expenses. Technical services income (loss) is the difference between revenues and expense items.
Underwriting ratios(a GAAP financial measures): The Company uses underwriting ratios as measures of performance. The loss ratio is calculated by dividing net losses and loss expense by net premiums earned. The acquisition expense ratio is calculated by dividing acquisition expenses by net premiums earned.
Diluted book value per share(a non-GAAP financial measure): The Company has included diluted book value per share because it takes into account the effect of dilutive securities; therefore, the Company believes it is a better measure of calculating shareholder returns than book value per share.
Tangible book value per share and diluted tangible book value per share(non-GAAP financial measures): The Company has included tangible book value per share and diluted tangible book value per share because it believes it provides a clear measure of the value of its tangible shareholders’ equity on a per share basis. Tangible book value excludes goodwill and other intangible assets as itemized in the Company’s consolidated balance sheets. A reconciliation from tangible book value per share to book value per share is provided on page 8 of this supplement.
1
QUANTA CAPITAL HOLDINGS LTD.
Summary statement of operations
Three months and years ended December 31, 2006 and 2005
(in thousands)
The summary statements of operations are presented on a classified basis in order to show the Company’s segment components of operating (loss) income before tax.
| | | For the three months ended December 31, 2006 | | For the three months ended December 31, 2005 | | For the year ended December 31, 2006 | | For the year ended December 31, 2005 | |
UNDERWRITING SEGMENT: | | | | | | | | | |
Underwriting revenues | | | | | | | | | |
| Gross premiums written | | $ | 17,654 | | $ | 96,119 | | $ | 158,729 | | $ | 608,935 | |
| Premiums ceded | | | (4,542 | ) | | (92,284 | ) | | (78,175 | ) | | (218,894 | ) |
| Net premiums written | | | 13,112 | | | 3,835 | | | 80,554 | | | 390,041 | |
| Change in unearned premiums | | | 23,012 | | | 63,199 | | | 144,745 | | | (25,966 | ) |
| Net premiums earned | | | 36,124 | | | 67,034 | | | 225,299 | | | 364,075 | |
| Other income | | | 641 | | | 361 | | | 3,654 | | | 3,174 | |
Underwriting expenses | | | | | | | | | | | | | |
| Net losses and loss expenses | | | (21,943 | ) | | (83,015 | ) | | (156,121 | ) | | (324,249 | ) |
| Acquisition expenses | | | (9,932 | ) | | (6,906 | ) | | (42,540 | ) | | (69,624 | ) |
| General and administrative expenses | | | (3,485 | ) | | (6,052 | ) | | (37,746 | ) | | (40,313 | ) |
| Total underwriting expenses | | | (35,360 | ) | | (95,973 | ) | | (236,407 | ) | | (434,186 | ) |
Underwriting segments income (loss) (1) | | | 1,405 | | | (28,578 | ) | | (7,454 | ) | | (66,937 | ) |
TECHNICAL SERVICES SEGMENT: | | | | | | | | | | | | | |
Technical services income (loss) | | | | | | | | | | | | | |
| Technical services revenues | | | 384 | | | 7,541 | | | 3,331 | | | 19,037 | |
| Other income | | | 321 | | | | | | — | | | | |
| General and administrative expenses | | | (33 | ) | | (8,711 | ) | | (4,283 | ) | | (18,545 | ) |
Technical services segment income (loss) | | | 672 | | | (1,170 | ) | | (952 | ) | | 492 | |
OTHER: | | | | | | | | | | | | | |
Other operating revenue | | | | | | | | | | | | | |
| Net investment income | | | 10,584 | | | 8,778 | | | 45,934 | | | 27,181 | |
| Interest expense | | | (1,422 | ) | | (1,195 | ) | | (5,458 | ) | | (4,165 | ) |
| Total other operating revenue | | | 9,162 | | | 7,583 | | | 40,476 | | | 23,016 | |
OPERATING INCOME (LOSS) FROM CONTINUING OPERATIONS BEFORE TAX (2) | | | 11,239 | | | (22,165 | ) | | 32,070 | | | (43,429 | ) |
| Net foreign exchange (losses) gains | | | (1,839 | ) | | 666 | | | (3,790 | ) | | 331 | |
| Net realized (losses) gains on investments | | | (1,803 | ) | | (12,231 | ) | | (15,945 | ) | | (13,020 | ) |
| Other Income | | | — | | | | | | — | | | 387 | |
| Depreciation of fixed assets and amortization of intangibles | | | (3,016 | ) | | (841 | ) | | (4,999 | ) | | (3,001 | ) |
| Corporate general and administrative expenses (3) | | | (12,440 | ) | | (20,710 | ) | | (57,977 | ) | | (50,749 | ) |
| Other expenses | | | — | | | (547 | ) | | — | | | — | |
NET LOSS FROM CONTINUING OPERATIONS BEFORE TAX | | | (7,859 | ) | | (55,828 | ) | | (50,641 | ) | | (109,481 | ) |
| Income tax (benefit) expense | | | (33 | ) | | (239 | ) | | 14 | | | 232 | |
NET LOSS FROM CONTINUING OPERATIONS | | | (7,826 | ) | | (55,589 | ) | | (50,655 | ) | | (109,713 | ) |
DISCONTINUED OPERATIONS (2): | | | | | | | | | | | | | |
| Income (loss) from operations of discontinued operations | | | — | | | 835 | | | (12,953 | ) | | 3,761 | |
| Income on disposal of discontinued operations | | | — | | | — | | | 704 | | | — | |
NET INCOME (LOSS) FROM DISCONTINUED OPERATIONS | | | — | | | 835 | | | (12,249 | ) | | 3,761 | |
NET LOSS | | | (7,826 | ) | | (54,754 | ) | | (62,904 | ) | | (105,952 | ) |
| Dividends on preferred shares | | | — | | | — | | | 1,916 | | | — | |
NET LOSS TO COMMON SHAREHOLDERS | | $ | (7,826 | ) | $ | (54,754 | ) | $ | (64,820 | ) | $ | (105,952 | ) |
Footnotes:
| 1. | The Company’s underwriting segment comprises, and is an aggregation of, its Specialty Insurance run-off, Specialty Reinsurance run-off and Lloyd’s reportable segments as presented on pages 9 to 12. |
| 2. | As a result of the disposal of ESC, the Company’s Technical services segment now consists of the Company’s two environmental liability assumption programs. The three months and year ended December 31, 2005 comparatives have been reclassified to conform with the presentation of ESC in discontinued operations for the three months and year ended December 31, 2006. |
| 3. | During 2006, the Company ceased allocating corporate general and administrative expenses to its reportable segments. Following its decision to place most of its business into run-off, the Company no longer allocates capital to its reportable segments and, accordingly, corporate general and administrative expenses are no longer allocated to each segment in proportion to each segment’s amount of allocated capital. Prior period financial data has been reclassified to conform to this presentation. |
QUANTA CAPITAL HOLDINGS LTD.
Consolidated Balance Sheets
(in thousands)
| | | As of December 31, 2006 | | As of December 31, 2005 | |
Assets | | | | | |
| Investments at fair market value | | | | | |
| Available for sale investments | | $ | 809,902 | | $ | 699,121 | |
| Trading investments related to deposit liabilities | | | 37,273 | | | 38,316 | |
| Total investments at fair value | | | 847,175 | | | 737,437 | |
| Cash and cash equivalents | | | 32,894 | | | 178,135 | |
| Restricted cash and cash equivalents | | | 68,143 | | | 82,843 | |
| Accrued investment income | | | 6,833 | | | 5,404 | |
| Premiums receivable | | | 34,587 | | | 115,055 | |
| Funds withheld by cedents | | | 25,204 | | | 24,279 | |
| Losses and loss adjustment expenses recoverable | | | 221,228 | | | 190,353 | |
| Other accounts receivable | | | 481 | | | 9,495 | |
| Net receivable for investments sold | | | 134 | | | 3,047 | |
| Deferred acquisition costs, net | | | 12,124 | | | 33,117 | |
| Deferred reinsurance premiums | | | 35,259 | | | 112,096 | |
| Software, property and equipment, net | | | 1,112 | | | 5,034 | |
| Goodwill and other intangtible assets | | | 7,350 | | | 24,877 | |
| Other assets | | | 36,702 | | | 30,919 | |
Total assets | | $ | 1,329,226 | | $ | 1,552,091 | |
Liabilities | | | | | | | |
| Reserve for losses and loss expenses | | $ | 623,618 | | $ | 533,983 | |
| Unearned premiums | | | 119,197 | | | 336,550 | |
| Environmental liabilities assumed | | | 3,346 | | | 5,911 | |
| Reinsurance balances payable | | | 37,070 | | | 57,499 | |
| Accounts payable and accrued expenses | | | 38,511 | | | 39,051 | |
| Deposit liabilities | | | 37,014 | | | 51,509 | |
| Deferred income and other liabilities | | | 5,279 | | | 9,729 | |
| Junior subordinated debentures | | | 61,857 | | | 61,857 | |
Total liabilities | | | 925,892 | | | 1,096,089 | |
Mandatorily redeemable preferred shares | | | 74,998 | | | 71,838 | |
Shareholders’ equity | | | | | | | |
| Common shares | | | 700 | | | 699 | |
| Additional paid-in capital | | | 582,578 | | | 581,929 | |
| Accumulated deficit | | | (263,830 | ) | | (199,010 | ) |
| Accumulated other comprehensive income | | | 8,888 | | | 546 | |
Total shareholders’ equity | | | 328,336 | | | 384,164 | |
Total liabilities, redeemable preferred shares and shareholders’ equity | | $ | 1,329,226 | | $ | 1,552,091 | |
4
QUANTA CAPITAL HOLDINGS LTD.
Total Capitalization
(in thousands)
| | | As of December 31, 2006 | | As of December 31, 2005 | |
Debt outstanding: | | | | | |
| Letters of credit facilities (1) | | $ | — | | $ | — | |
| Junior subordinated debentures | | | 61,857 | | | 61,857 | |
| | | | | | | | |
Redeemable preferred shares: | | | | | | | |
Redeemable preferred shares ($0.01 par value; 25,000,000 shares authorized; 3,130,525 issued and outstanding, at December 31, 2006; 3,000,000 issued and outstanding, at December 31, 2005) | | | 74,998 | | | 71,838 | |
| | | | | | | | |
Shareholders’ equity: | | | | | | | |
Common shares ($0.01 par value; 200,000,000 common shares authorized, 70,008,185 issued and outstanding at December 31, 2006 and 69,946,861 issued and outstanding at December 31, 2005) (2) | | | 700 | | | 699 | |
| Additional paid-in capital | | | 582,578 | | | 581,929 | |
| Accumulated deficit | | | (263,830 | ) | | (199,010 | ) |
| Accumulated other comprehensive income | | | 8,888 | | | 546 | |
Total shareholders’ equity | | $ | 328,336 | | $ | 384,164 | |
Total capitalization | | $ | 465,191 | | $ | 517,859 | |
Total debt to total capital ratio (3) | | | 29 | % | | 26 | % |
Footnotes:
| 1. | As at December 31, 2005, consisted of a $250 million secured letter of credit facility. The total commitment of $250 million was reduced to $240 million during the year ended December 31, 2006. We have elected to reduce the aggregate commitment to $210.0 million, as of February 9, 2007. As of December 31, 2006 and March 5, 2007, we had obligations related to fully secured letters of credit of approximately $235.4 million and $170 million. |
| 2. | This table does not give effect to the 2,542,813 warrants outstanding at December 31, 2006 and December 31, 2005 and outstanding options to purchase common shares of 786,764 and 3,402,194 at December 31, 2006 and December 31, 2005. |
| 3. | The debt to total capital ratio is calculated as the sum of the letter of credit facility, junior subordinated debentures and redeemable preferred shares, or Total Debt, divided by the sum of Total Debt and Total Shareholders’ Equity, or Total Capitalization. |
5
QUANTA CAPITAL HOLDINGS LTD.
Summarized Cash Flow Statement
(in thousands)
| | | Year ended December 31, 2006 | | Year ended December 31, 2005 | |
| Net cash (used in) provided by continuing operating activities | | $ | (50,154 | ) | $ | 155,117 | |
| Net cash provided by discontinued operations | | | 6,989 | | | 701 | |
| Net cash (used in) provided by operating activities | | | (43,165 | ) | | 155,818 | |
| Net cash used in investing activities | | | (103,320 | ) | | (160,104 | ) |
| Net cash provided by financing activities | | | 1,244 | | | 149,646 | |
| (Decrease) increase in cash and cash equivalents: | | | (145,241 | ) | | 145,360 | |
| Cash and cash equivalents at beginning of the period (Unrestricted) | | | 178,135 | | | 32,775 | |
| Cash and cash equivalents at end of the period (Unrestricted) | | $ | 32,894 | | $ | 178,135 | |
6
QUANTA CAPITAL HOLDINGS LTD.
Per Share Data
Three months and years ended December 31, 2006 and 2005
(in thousands, except per share amounts)
| | | (Unaudited) For the three months ended December 31, 2006 | | (Unaudited) For the three months ended December 31, 2005 | | For the year ended December 31, 2006 | | For the year ended December 31, 2005 | |
LOSS PER SHARE | | | | | | | | | |
| Net loss from continuing operations | | $ | (7,826 | ) | $ | (55,589 | ) | $ | (50,655 | ) | $ | (109,713 | ) |
| Discontinued operations: | | | | | | | | | | | | | |
| Income (loss) from operations of discontinued operations | | | — | | | 835 | | | (12,953 | ) | | 3,761 | |
| Income on disposal of discontinued operations | | | — | | | — | | | 704 | | | — | |
| Net income (loss) from discontinued operations | | | — | | | 835 | | | (12,249 | ) | | 3,761 | |
| Net loss | | | (7,826 | ) | | (54,754 | ) | | (62,904 | ) | | (105,952 | ) |
| Dividends on preferred shares | | | — | | | — | | | 1,916 | | | — | |
| Net loss available to common shareholders | | $ | (7,826 | ) | $ | (54,754 | ) | $ | (64,820 | ) | $ | (105,952 | ) |
| Weighted average common share and common share equivalents, outstanding during the period | | | | | | | | | | | | | |
| Basic | | | 70,001,259 | | | 58,397,990 | | | 69,971,646 | | | 57,205,342 | |
| Diluted (1) (3) | | | 70,001,259 | | | 58,397,990 | | | 69,971,646 | | | 57,205,342 | |
| Basic and diluted loss from continuing operations per common share | | $ | (0.11 | ) | $ | (0.95 | ) | $ | (0.75 | ) | $ | (1.92 | ) |
| Basic and diluted income (loss) from discontinued operations per common share | | | — | | | 0.01 | | | (0.19 | ) | | 0.07 | |
| Basic and diluted income from disposal of discontinued operations per common share | | | — | | | — | | | 0.01 | | | — | |
| Basic and diluted loss per common share | | $ | (0.11 | ) | $ | (0.94 | ) | $ | (0.93 | ) | $ | (1.85 | ) |
BOOK VALUE PER SHARE | | | | | | | | | | | | | |
| Total shareholders’ equity | | $ | 328,336 | | $ | 384,164 | | $ | 328,336 | | $ | 384,164 | |
| Common share and common share equivalents outstanding at the end of the period: | | | | | | | | | | | | | |
| Basic | | | 70,008,185 | | | 69,946,861 | | | 70,008,185 | | | 69,946,861 | |
| Diluted (2) (3) | | | 70,008,185 | | | 70,019,048 | | | 70,008,185 | | | 70,019,048 | |
| Basic book value per share | | $ | 4.69 | | $ | 5.49 | | $ | 4.69 | | $ | 5.49 | |
| Diluted book value per share (2) | | $ | 4.69 | | $ | 5.49 | | $ | 4.69 | | $ | 5.49 | |
TANGIBLE BOOK VALUE PER SHARE | | | | | | | | | | | | | |
| Total shareholders’ equity | | $ | 328,336 | | $ | 384,164 | | $ | 328,336 | | $ | 384,164 | |
| Goodwill and other intangible assets | | $ | 7,350 | | $ | 24,877 | | $ | 7,350 | | $ | 24,877 | |
| Total shareholders’ equity adjusted to exclude goodwill and other intangible assets | | $ | 320,986 | | $ | 359,287 | | $ | 320,986 | | $ | 359,287 | |
| Basic tangible book value per share | | $ | 4.58 | | $ | 5.14 | | $ | 4.58 | | $ | 5.14 | |
| Diluted tangible book value per share (2) | | $ | 4.58 | | $ | 5.13 | | $ | 4.58 | | $ | 5.13 | |
Footnote:
| 1. | Due to the net loss for the three months and year ended December 31, 2006 and for the three months and year ended December 31, 2005 the assumed net exercise of options and warrants under the treasury stock method has been excluded, as the effect would have been anti-dilutive. |
| 2. | The assumed net exercise of options and warrants under the treasury stock method has been included in the calculation of diluted book value and diluted tangible book value per share. |
| 3. | As of December 31, 2006 and 2005, all outstanding options had an exercise price above the closing market share price, therefore the outstanding options have not been included in the calculation of the diluted number of shares for the calculation of diluted book value and diluted tangible book value per share. |
7
QUANTA CAPITAL HOLDINGS LTD.
Segment Results
Three months ended December 31, 2006
(in thousands)
(Unaudited)
During the third quarter of 2006, the Company changed the composition of its reportable segments and renamed its specialty insurance segment and specialty reinsurance segment to specialty insurance run-off segment and specialty reinsurance run-off segment. The Company has segregated its Lloyd’s operating segment, which was previously aggregated with its specialty insurance run-off reportable segment, to be a reportable segment, given it was no longer appropriate to aggregate Lloyd’s and specialty insurance run-off operating segments given their different economic characteristics. In addition, during the fourth quarter of 2006, the Company ceased allocating corporate general and administrative expenses to its reportable segments as it no longer allocates capital to its reportable segments. The December 31, 2005 balances have been reclassified to conform with the presentation for the year and quarter ended December 31, 2006.
| | | Specialty Insurance run-off | | Specialty Reinsurance run-off | | Lloyd’s | | Underwriting Total | | Technical Services | | Consolidated | |
| Direct insurance | | $ | (13,504 | ) | | — | | $ | 27,180 | | $ | 13,676 | | | — | | $ | 13,676 | |
| Reinsurance assumed | | | 370 | | | 3,607 | | | — | | | 3,977 | | | — | | | 3,977 | |
| Total gross premiums written | | | (13,134 | ) | | 3,607 | | | 27,180 | | | 17,653 | | | — | | | 17,653 | |
| Premiums ceded | | | 4,857 | | | (1,019 | ) | | (8,427 | ) | | (4,589 | ) | | — | | | (4,589 | ) |
| Net premiums written | | $ | (8,277 | ) | $ | 2,588 | | $ | 18,753 | | $ | 13,064 | | | — | | $ | 13,064 | |
| | | | | | | | | | | | | | | | | | | | |
| Net premiums earned | | $ | 12,528 | | $ | 6,233 | | $ | 17,363 | | $ | 36,124 | | $ | — | | $ | 36,124 | |
| Technical services revenues | | | — | | | — | | | — | | | — | | | 384 | | | 384 | |
| Other income | | | 722 | | | 161 | | | — | | | 883 | | | — | | | 883 | |
| Net losses and loss expenses | | | (1,102 | ) | | (7,655 | ) | | (13,186 | ) | | (21,943 | ) | | — | | | (21,943 | ) |
| Acquisition expenses | | | (3,869 | ) | | (2,916 | ) | | (3,147 | ) | | (9,932 | ) | | — | | | (9,932 | ) |
| General and administrative expenses | | | (1,136 | ) | | (179 | ) | | (3,870 | ) | | (5,185 | ) | | (33 | ) | | (5,218 | ) |
Segment income (loss) | | $ | 7,143 | | $ | (4,356 | ) | $ | (2,840 | ) | $ | (53 | ) | $ | 351 | | $ | 298 | |
| Depreciation of fixed assets and amortization of intangibles | | | | | | | | | | | | | | | | | $ | (3,016 | ) |
| Interest expense | | | | | | | | | | | | | | | | | | (1,422 | ) |
| Net investment income | | | | | | | | | | | | | | | | | | 10,584 | |
| Net realized gains on investments | | | | | | | | | | | | | | | | | | (1,803 | ) |
| Corporate general and administrative expenses | | | | | | | | | | | | | | | | | | (10,740 | ) |
| Other income | | | | | | | | | | | | | | | | | | 79 | |
| Net foreign exchange losses | | | | | | | | | | | | | | | | | | (1,839 | ) |
Net loss from continuing operations before income tax | | | | | | | | | | | | | | | | | $ | (7,859 | ) |
| Loss ratio | | | 8.8 | % | | 122.8 | % | | 75.9 | % | | 60.7 | % | | | | | | |
| Acquisition expense ratio | | | 30.9 | % | | 46.8 | % | | 18.1 | % | | 27.5 | % | | | | | | |
| | | | | | | | | | | | | | | | | | | | |
QUANTA CAPITAL HOLDINGS LTD.
Segment Results
Three months ended December 31, 2005
(in thousands)
(Unaudited)
| | | Specialty Insurance
run-off | | Specialty Reinsurance run-off | | Lloyd’s | | Underwriting Total | | Technical Services | | Consolidated | |
| Direct insurance | | $ | 60,918 | | $ | — | | $ | 27,216 | | $ | 88,134 | | $ | — | | $ | 88,134 | |
| Reinsurance assumed | | | 4,830 | | | 3,155 | | | — | | | 7,985 | | | — | | | 7,985 | |
| Total gross premiums written | | | 65,748 | | | 3,155 | | | 27,216 | | | 96,119 | | | — | | | 96,119 | |
| Premiums ceded | | | (31,928 | ) | | (51,768 | ) | | (7,138 | ) | | (90,834 | ) | | — | | | (90,834 | ) |
| Net premiums written | | $ | 33,820 | | $ | (48,613 | ) | $ | 20,078 | | $ | 5,285 | | $ | — | | $ | 5,285 | |
| Net premiums earned | | $ | 41,231 | | $ | 11,108 | | $ | 14,695 | | $ | 67,034 | | | | | $ | 67,034 | |
| Technical services revenues | | | — | | | — | | | — | | | — | | | 7,541 | | | 7,541 | |
| Other income | | | 413 | | | (445 | ) | | — | | | (32 | ) | | | | | (32 | ) |
| Net losses and loss expenses | | | (41,045 | ) | | (29,853 | ) | | (12,117 | ) | | (83,015 | ) | | | | | (83,015 | ) |
| Acquisition expenses | | | (1,524 | ) | | (3,209 | ) | | (2,173 | ) | | (6,906 | ) | | — | | | (6,906 | ) |
| General and administrative expenses | | | (6,104 | ) | | (2,566 | ) | | (2,000 | ) | | (10,670 | ) | | (2,218 | ) | | (12,888 | ) |
Segment loss | | $ | (7,029 | ) | $ | (24,965 | ) | $ | (1,595 | ) | $ | (33,589 | ) | $ | 5,323 | | $ | (28,266 | ) |
| Depreciation of fixed assets and amortization of intangibles | | | | | | | | | | | | | | | | | $ | (841 | ) |
| Interest expense | | | | | | | | | | | | | | | | | | (1,195 | ) |
| Net investment income | | | | | | | | | | | | | | | | | | 8,778 | |
| Net realized losses on investments | | | | | | | | | | | | | | | | | | (12,231 | ) |
| Corporate general and administrative expenses | | | | | | | | | | | | | | | | | | (22,585 | ) |
| Other expense | | | | | | | | | | | | | | | | | | (154 | ) |
| Net foreign exchange gains | | | | | | | | | | | | | | | | | | 666 | |
Net loss from continuing operations before income tax | | | | | | | | | | | | | | | | | $ | (55,828 | ) |
| Loss ratio | | | 99.5 | % | | 268.8 | % | | 82.5 | % | | 123.8 | % | | | | | | |
| Acquisition expense ratio | | | 3.7 | % | | 28.9 | % | | 14.8 | % | | 10.3 | % | | | | | | |
QUANTA CAPITAL HOLDINGS LTD.
Segment Results
Year ended December 31, 2006
(in thousands)
| | | Specialty Insurance
run-off | | Specialty Reinsurance run-off | | Lloyd’s | | Underwriting Total | | Technical Services | | Consolidated | |
| Direct insurance | | $ | 47,913 | | $ | — | | $ | 91,758 | | $ | 139,671 | | $ | — | | $ | 139,671 | |
| Reinsurance assumed | | | 12,194 | | | 6,864 | | | — | | | 19,058 | | | — | | | 19,058 | |
| Total gross premiums written | | | 60,107 | | | 6,864 | | | 91,758 | | | 158,729 | | | — | | | 158,729 | |
| Premiums ceded | | | (34,126 | ) | | (14,035 | ) | | (30,014 | ) | | (78,175 | ) | | — | | | (78,175 | ) |
| Net premiums written | | $ | 25,981 | | $ | (7,171 | ) | $ | 61,744 | | $ | 80,554 | | | — | | $ | 80,554 | |
| Net premiums earned | | $ | 113,289 | | $ | 46,487 | | $ | 65,523 | | $ | 225,299 | | $ | — | | $ | 225,299 | |
| Technical services revenues | | | — | | | — | | | — | | | — | | | 3,331 | | | 3,331 | |
| Other income | | | 2,873 | | | 781 | | | — | | | 3,654 | | | — | | | 3,654 | |
| Net losses and loss expenses | | | (65,706 | ) | | (40,033 | ) | | (50,382 | ) | | (156,121 | ) | | — | | | (156,121 | ) |
| Acquisition expenses | | | (18,029 | ) | | (12,468 | ) | | (12,043 | ) | | (42,540 | ) | | — | | | (42,540 | ) |
| General and administrative expenses | | | (18,440 | ) | | (6,420 | ) | | (12,886 | ) | | (37,746 | ) | | (4,283 | ) | | (42,029 | ) |
Segment income (loss) | | $ | 13,987 | | $ | (11,653 | ) | $ | (9,788 | ) | $ | (7,454 | ) | $ | (952 | ) | $ | (8,406 | ) |
| Depreciation of fixed assets and amortization of intangibles | | | | | | | | | | | | | | | | | $ | (4,999 | ) |
| Interest expense | | | | | | | | | | | | | | | | | | (5,458 | ) |
| Net investment income | | | | | | | | | | | | | | | | | | 45,934 | |
| Net realized losses on investments | | | | | | | | | | | | | | | | | | (15,945 | ) |
| Corporate general and administrative expenses | | | | | | | | | | | | | | | | | | (57,977 | ) |
| Net foreign exchange losses | | | | | | | | | | | | | | | | | | (3,790 | ) |
Net loss from continuing operations before income tax | | | | | | | | | | | | | | | | | $ | (50,641 | ) |
| Loss ratio | | | 58.0 | % | | 86.1 | % | | 76.9 | % | | 69.3 | % | | | | | | |
| Acquisition expense ratio | | | 15.9 | % | | 26.8 | % | | 18.4 | % | | 18.9 | % | | | | | | |
10
QUANTA CAPITAL HOLDING LTD.
Segment Results
Year ended December 31, 2005
(in thousands)
| | | Specialty Insurance
run-off | | Specialty Reinsurance run-off | | Lloyd’s | | Underwriting Total | | Technical Services | | Consolidated | |
| Direct insurance | | $ | 287,188 | | $ | — | | $ | 80,702 | | $ | 367,890 | | $ | — | | $ | 367,890 | |
| Reinsurance assumed | | | 24,133 | | | 216,912 | | | — | | | 241,045 | | | — | | | 241,045 | |
| Total gross premiums written | | | 311,321 | | | 216,912 | | | 80,702 | | | 608,935 | | | — | | | 608,935 | |
| Premiums ceded | | | (116,404 | ) | | (83,434 | ) | | (19,056 | ) | | (218,894 | ) | | — | | | (218,894 | ) |
| Net premiums written | | $ | 194,917 | | $ | 133,478 | | $ | 61,646 | | $ | 390,041 | | $ | — | | $ | 390,041 | |
| Net premiums earned | | $ | 160,620 | | $ | 166,944 | | $ | 36,511 | | $ | 364,075 | | | — | | $ | 364,075 | |
| Technical services revenues | | | — | | | — | | | — | | | — | | | 19,037 | | | 19,037 | |
| Other income | | | 1,200 | | | 1,974 | | | — | | | 3,174 | | | — | | | 3,174 | |
| Net losses and loss expenses | | | (120,710 | ) | | (178,887 | ) | | (24,652 | ) | | (324,249 | ) | | — | | | (324,249 | ) |
| Acquisition expenses | | | (21,836 | ) | | (42,714 | ) | | (5,074 | ) | | (69,624 | ) | | — | | | (69,624 | ) |
| General and administrative expenses | | | (21,750 | ) | | (9,847 | ) | | (8,716 | ) | | (40,313 | ) | | (18,545 | ) | | (58,858 | ) |
Segment (loss) income | | $ | (2,476 | ) | $ | (62,530 | ) | $ | (1,931 | ) | $ | (66,937 | ) | $ | 492 | | $ | (66,445 | ) |
| Depreciation of fixed assets and amortization of intangibles | | | | | | | | | | | | | | | | | $ | (3,001 | ) |
| Interest expense | | | | | | | | | | | | | | | | | | (4,165 | ) |
| Net investment income | | | | | | | | | | | | | | | | | | 27,181 | |
| Net realized losses on investments | | | | | | | | | | | | | | | | | | (13,020 | ) |
| Corporate general and administrative expenses | | | | | | | | | | | | | | | | | | (50,749 | ) |
| Other income | | | | | | | | | | | | | | | | | | 387 | |
| Net foreign exchange gains | | | | | | | | | | | | | | | | | | 331 | |
Net loss from continuing operations before income tax | | | | | | | | | | | | | | | | | $ | (109,481 | ) |
| Loss ratio | | | 75.2 | % | | 107.2 | % | | 67.5 | % | | 89.1 | % | | | | | | |
| Acquisition expense ratio | | | 13.6 | % | | 25.6 | % | | 13.9 | % | | 19.1 | % | | | | | | |
QUANTA CAPITAL HOLDINGS LTD.
Net Earned Premiums by Product Line
(in thousands)
| | | (Unaudited) Three months ended December 31, 2006 | | (Unaudited) Three months ended December 31, 2005 | | Year ended December 31, 2006 | | Year ended December 31, 2005 | |
Specialty Insurance run-off: | | | | | | | | | |
| Technical risk property - HBW | | $ | 7,710 | | $ | 24,918 | | $ | 69,307 | | $ | 95,800 | |
| Technical risk property - other | | | 1,337 | | | (39 | ) | | 8,576 | | | 2,548 | |
| Professional liability | | | 1,458 | | | 8,390 | | | 18,392 | | | 36,761 | |
| Environmental liability | | | 937 | | | 3,068 | | | 8,224 | | | 9,824 | |
| Surety | | | 799 | | | 2,553 | | | 6,828 | | | 6,353 | |
| Fidelity and crime | | | 7 | | | 1,605 | | | 1,403 | | | 6,757 | |
| Structured insurance | | | — | | | 318 | | | 661 | | | 1,092 | |
| Trade credit and political risk | | | 280 | | | 418 | | | (102 | ) | | 1,485 | |
| Total specialty insurance run-off | | $ | 12,528 | | $ | 41,231 | | $ | 113,289 | | $ | 160,620 | |
Specialty Reinsurance run-off: | | | | | | | | | | | | | |
| Casualty | | $ | 5,799 | | $ | 15,509 | | $ | 36,693 | | $ | 100,809 | |
| Marine, technical risk and aviation | | | 269 | | | 5,973 | | | 9,797 | | | 23,650 | |
| Property | | | 165 | | | (10,374 | ) | | (3 | ) | | 42,485 | |
| Total specialty reinsurance run-off | | $ | 6,233 | | $ | 11,108 | | $ | 46,487 | | $ | 166,944 | |
Lloyd’s: | | | | | | | | | | | | | |
| Professional liability | | $ | 15,672 | | $ | 14,495 | | $ | 61,561 | | $ | 36,311 | |
| Other | | | 1,691 | | | 200 | | | 3,962 | | | 200 | |
| Total Lloyd’s | | $ | 17,363 | | $ | 14,695 | | $ | 65,523 | | $ | 36,511 | |
Total | | $ | 36,124 | | $ | 67,034 | | $ | 225,299 | | $ | 364,075 | |
QUANTA CAPITAL HOLDINGS LTD.
Analysis of Unpaid Losses and Loss Expenses (Unaudited)
(in thousands)
| | | As of December 31, 2006 | | As of December 31, 2005 | |
| | | Gross Loss Reserves | | Ceded Loss Reserves (1) (2) | | Net Loss Reserves | | Gross Loss Reserves | | Ceded Loss Reserves (1) (2) | | Net Loss Reserves | |
Specialty Insurance: | | | | | | | | | | | | | |
| Technical risk property - HBW | | $ | 198,040 | | $ | (74,682 | ) | $ | 123,358 | | $ | 136,124 | | $ | (47,360 | ) | $ | 88,764 | |
| Technical risk property - other | | | 30,725 | | | (26,934 | ) | | 3,791 | | | 46,236 | | | (39,273 | ) | | 6,963 | |
| Professional liability | | | 54,567 | | | (14,215 | ) | | 40,352 | | | 45,177 | | | (9,831 | ) | | 35,346 | |
| Environmental liability | | | 25,026 | | | (10,828 | ) | | 14,198 | | | 21,789 | | | (9,811 | ) | | 11,978 | |
| Fidelity and crime | | | 3,024 | | | (1,336 | ) | | 1,688 | | | 4,912 | | | (1,785 | ) | | 3,127 | |
| Other | | | 330 | | | — | | | 330 | | | 1,512 | | | — | | | 1,512 | |
| Surety | | | 533 | | | — | | | 533 | | | 912 | | | — | | | 912 | |
| Trade credit and political risk | | | 2,225 | | | — | | | 2,225 | | | 610 | | | — | | | 610 | |
| | | $ | 314,470 | | $ | (127,995 | ) | $ | 186,475 | | $ | 257,272 | | $ | (108,060 | ) | $ | 149,212 | |
Specialty Reinsurance: | | | | | | | | | | | | | | | | | | | |
| Marine, technical risk and aviation | | $ | 78,191 | | $ | (39,025 | ) | $ | 39,166 | | $ | 99,087 | | $ | (41,118 | ) | $ | 57,969 | |
| Casualty | | | 82,106 | | | — | | | 82,106 | | | 65,319 | | | — | | | 65,319 | |
| Property | | | 49,287 | | | (30,120 | ) | | 19,167 | | | 79,998 | | | (33,275 | ) | | 46,723 | |
| | | $ | 209,584 | | $ | (69,145 | ) | $ | 140,439 | | $ | 244,404 | | $ | (74,393 | ) | $ | 170,011 | |
Lloyd’s: | | | | | | | | | | | | | | | | | | | |
| Professional liability and other | | $ | 99,564 | | $ | (24,088 | ) | $ | 75,476 | | $ | 32,307 | | $ | (7,900 | ) | $ | 24,407 | |
| | | $ | 99,564 | | $ | (24,088 | ) | $ | 75,476 | | $ | 32,307 | | $ | (7,900 | ) | $ | 24,407 | |
| Total | | $ | 623,618 | | $ | (221,228 | ) | $ | 402,390 | | $ | 533,983 | | $ | (190,353 | ) | $ | 343,630 | |
Specialty Insurance: | | | | | | | | | | | | | | | | | | | |
| Case reserve | | $ | 40,308 | | $ | (28,157 | ) | $ | 12,151 | | $ | 49,851 | | $ | (34,047 | ) | $ | 15,804 | |
| IBNR | | | 274,162 | | | (99,838 | ) | | 174,324 | | | 207,421 | | | (74,013 | ) | | 133,408 | |
| Total | | $ | 314,470 | | $ | (127,995 | ) | $ | 186,475 | | $ | 257,272 | | $ | (108,060 | ) | $ | 149,212 | |
Specialty Reinsurance: | | | | | | | | | | | | | | | | | | | |
| Case reserve | | $ | 99,208 | | $ | (46,828 | ) | $ | 52,380 | | $ | 125,334 | | $ | (55,240 | ) | $ | 70,094 | |
| IBNR | | | 110,376 | | | (22,317 | ) | | 88,059 | | | 119,070 | | | (19,153 | ) | | 99,917 | |
| Total | | $ | 209,584 | | $ | (69,145 | ) | $ | 140,439 | | $ | 244,404 | | $ | (74,393 | ) | $ | 170,011 | |
Lloyd’s: | | | | | | | | | | | | | | | | | | | |
| Case reserve | | $ | 2,981 | | $ | — | | $ | 2,981 | | $ | 808 | | | — | | $ | 808 | |
| IBNR | | | 96,583 | | | (24,088 | ) | | 72,495 | | | 31,499 | | | (7,900 | ) | | 23,599 | |
| Total | | $ | 99,564 | | $ | (24,088 | ) | $ | 75,476 | | $ | 32,307 | | $ | (7,900 | ) | $ | 24,407 | |
Total: | | | | | | | | | | | | | | | | | | | |
| Case reserve | | $ | 142,497 | | $ | (74,985 | ) | $ | 67,512 | | $ | 175,993 | | $ | (89,287 | ) | $ | 86,706 | |
| IBNR | | | 481,121 | | | (146,243 | ) | | 334,878 | | | 357,990 | | | (101,066 | ) | | 256,924 | |
| Total | | $ | 623,618 | | $ | (221,228 | ) | $ | 402,390 | | $ | 533,983 | | $ | (190,353 | ) | $ | 343,630 | |
Footnote:
| 1. | Failure of the Company’s reinsurers to honor their obligations could result in credit losses. |
| 2. | Ceded case reserves include amounts recoverable from re-insurers in relation to paid loss and loss adjustment expenses, that were outstanding as of December 31, 2006 and December 31, 2005. |
13
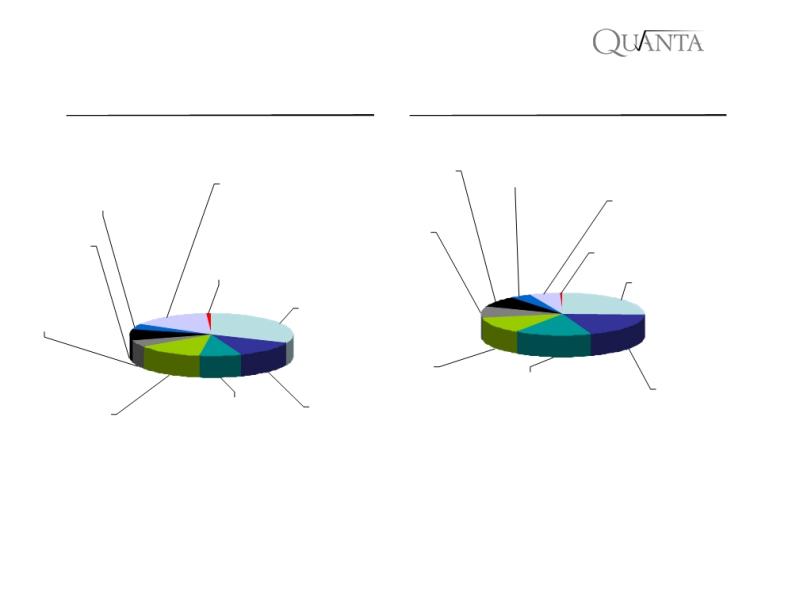
QUANTA CAPITAL HOLDINGS LTD.
Gross loss reserves as of December 31, 2006 and December 31, 2005
(in million)
2006
2005
Environmental
Professional
liability
liability
Environmental
Lloyd’s
4%
9%
liability
16%
Lloyd’s
4%
6%
Technical risk
Professional
property
liability
9%
Other
9%
Other
1%
1%
HBW
25%
Technical risk
HBW
property
32%
5%
Casualty
Reinsurance
12%
Property
Marine, Technical
Risk and Aviation
Reinsurance
Marine, Technical
Casualty
19%
Property
15%
Risk and Aviation
Reinsurance
Reinsurance
13%
12%
8%
Footnotes:
1. “Other” includes Trade Credit, Fidelity, Surety and other Specialty Insurance Run-off product lines.
14
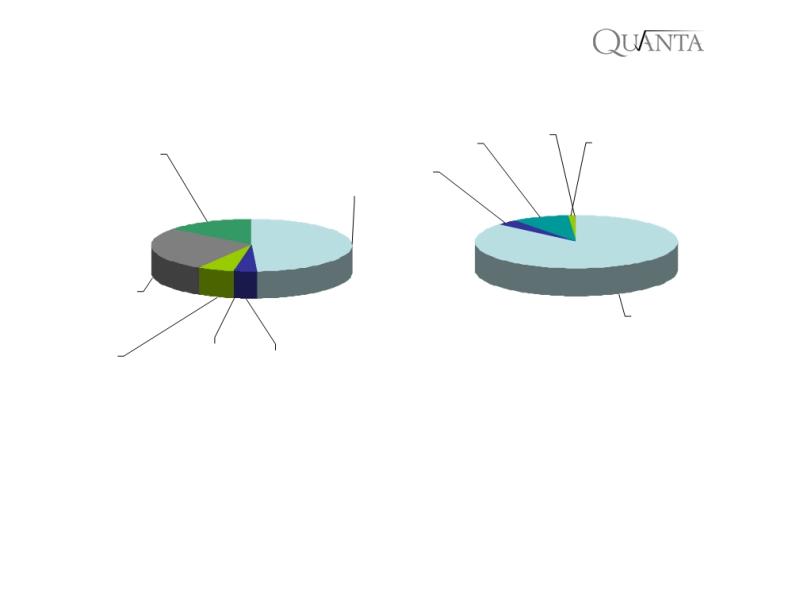
QUANTA CAPITAL HOLDINGS LTD.
Composition of Investments at December 31, 2006
Fixed Maturity Investments
Breakdown as per different ratings
Below BBB
A
BBB
0%
Corporate
9%
1%
US Government and
15%
Government
AA
Agencies
4%
48%
Mortgage-Backed
Securities
27%
AAA
86%
Asset-Backed
Tax-Exempt
Securities
Foreign
Municipal
6%
Government
0%
4%
Footnotes:
Ratings as assigned by Standard & Poor’s Corporation.
15
QUANTA CAPITAL HOLDINGS LTD.
Estimated 2005 Hurricane Catastrophes Losses and Loss Expenses Incurred (cumulative)
(in thousands)
(Unaudited)
| | | Cumulative as of December 31, 2006 | | Cumulative as of December 31, 2005 | |
| | | Gross Losses and Loss Expenses | | Ceded Losses and Loss Expenses | | Net Losses and Loss Expenses | | Gross Losses and Loss Expenses | | Ceded Losses and Loss Expenses | | Net Losses and Loss Expenses | |
Specialty Insurance: | | | | | | | | | | | | | |
| Technical risk property | | $ | 40,845 | | $ | (29,656 | ) | $ | 11,189 | | $ | 52,245 | | $ | (41,029 | ) | $ | 11,216 | |
| Fidelity and crime | | | 450 | | | (225 | ) | | 225 | | | 450 | | | (225 | ) | | 225 | |
| | | | 41,295 | | | (29,881 | ) | | 11,414 | | | 52,695 | | | (41,254 | ) | | 11,441 | |
Specialty Reinsurance: | | | | | | | | | | | | | | | | | | | |
| Marine, technical risk and aviation | | | 71,511 | | | (29,303 | ) | | 42,208 | | | 68,986 | | | (28,861 | ) | | 40,125 | |
| Property | | | 84,789 | | | (50,098 | ) | | 34,691 | | | 77,426 | | | (45,653 | ) | | 31,773 | |
| | | | 156,300 | | | (79,401 | ) | | 76,899 | | | 146,412 | | | (74,514 | ) | | 71,898 | |
Total losses and loss expenses incurred | | $ | 197,595 | | $ | (109,282 | ) | $ | 88,313 | | $ | 199,107 | | $ | (115,768 | ) | $ | 83,339 | |
| | | | | | | | | | | | | | | | | | | | |
Losses and Loss Expenses by Event | | | | | | | | | | | | | | | | | | | |
| Katrina and Rita | | $ | 165,408 | | $ | (87,898 | ) | $ | 77,510 | | $ | 169,803 | | $ | (97,668 | ) | $ | 72,135 | |
| Wilma | | | 32,187 | | | (21,384 | ) | | 10,803 | | | 29,304 | | | (18,100 | ) | | 11,204 | |
| | | | 197,595 | | | (109,282 | ) | | 88,313 | | | 199,107 | | | (115,768 | ) | | 83,339 | |
| Reinstatement premiums | | | | | | | | | | | | | | | | | | | |
| Katrina and Rita | | | (10,239 | ) | | 12,763 | | | 2,524 | | | (8,833 | ) | | 13,367 | | | 4,534 | |
| Wilma | | | (1,207 | ) | | 362 | | | (845 | ) | | (979 | ) | | 502 | | | (477 | ) |
| | | | (11,446 | ) | | 13,125 | | | 1,679 | | | (9,812 | ) | | 13,869 | | | 4,057 | |
Net income impact of 2005 Hurricanes | | $ | 186,149 | | $ | (96,157 | ) | $ | 89,992 | | $ | 189,295 | | $ | (101,899 | ) | $ | 87,396 | |
Footnote:
| 1. | The above analysis includes losses incurred from the 2005 hurricanes Katrina, Rita and Wilma only and does not include development on losses incurred from the 2004 hurricanes Charley, Frances, Ivan and Jeanne. |
| 2. | As at December 31, 2006 and 2005, $ 32.3 million and $ 71.9 million of estimated 2005 hurricane losses and loss expenses were unpaid. |
16