UNITED STATES
SECURITIES AND EXCHANGE COMMISSION
Washington, D.C. 20549
FORM 10-K
ANNUAL REPORT PURSUANT TO SECTION 13 OR 15(d)
OF THE SECURITIES EXCHANGE ACT OF 1934
For the fiscal year ended December 31, 2008 Commission file number 000-50552
Asset Acceptance Capital Corp.
(Exact name of registrant as specified in its charter)
| | |
| Delaware | | 80-0076779 |
(State or other jurisdiction of incorporation or organization) | | (I.R.S. Employer Identification No.) |
28405 Van Dyke Avenue
Warren, Michigan 48093
(Address of principal executive offices)
Registrant’s telephone number, including area code:
(586) 939-9600
Securities registered pursuant to Section 12(b) of the Act:
| | |
Title of each class | | Name of each exchange on which registered |
| Common Stock, $0.01 par value | | The NASDAQ Global Select Market |
Securities registered pursuant to Section 12(g) of the Act: None
Indicate by check mark if the registrant is a well-known seasoned issuer, as defined in Rule 405 of the Securities Act. Yes ¨ No x
Indicate by check mark if the registrant is not required to file reports pursuant to Section 13 or Section 15(d) of the Act. Yes ¨ No x
Indicate by check mark whether the registrant: (1) has filed all reports required to be filed by Section 13 or 15(d) of the Securities Exchange Act of 1934 during the preceding 12 months (or for such shorter period that the registrant was required to file such reports), and (2) has been subject to such filing requirements for the past 90 days. Yes x No ¨
Indicate by check mark if disclosure of delinquent filers pursuant to Item 405 of Regulation S-K (§229.405 of this chapter) is not contained herein, and will not be contained, to the best of registrant’s knowledge, in definitive proxy or information statements incorporated by reference in Part III of this Form 10-K or any amendment to this Form 10-K. ¨
Indicate by check mark whether the registrant is a large accelerated filer, an accelerated filer, a non-accelerated filer, or a smaller reporting company. See the definitions of “large accelerated filer,” “accelerated filer” and “smaller reporting company” in Rule 12b-2 of the Exchange Act.
| | |
Large accelerated filer ¨ | | Accelerated filer x |
Non-accelerated filer ¨ (Do not check if a smaller reporting company) | | Smaller reporting company ¨ |
Indicate by check mark whether the registrant is a shell company (as defined in Rule 12b-2 of the Act). Yes ¨ No x
The aggregate market value of the registrant’s Common Stock held by non-affiliates of the registrant on June 30, 2008 (based on the June 30, 2008 closing sales price of $12.22 of the registrant’s Common Stock, as reported on The NASDAQ Global Select Market on such date) was $182,156,147.
Number of shares outstanding of the registrant’s Common Stock at February 20, 2009:
30,573,031 shares of Common Stock, $0.01 par value.
DOCUMENTS INCORPORATED BY REFERENCE
Portions of the registrant’s definitive Proxy Statement to be filed for its 2009 Annual Meeting of Stockholders to be held on May 14, 2009 are incorporated by reference into Part III of this Report.
ASSET ACCEPTANCE CAPITAL CORP.
Annual Report on Form 10-K
TABLE OF CONTENTS
Annual Report on Form 10-K
We file reports with the Securities and Exchange Commission (“SEC”), which we make available on our website,www.assetacceptance.com, free of charge. These reports include Annual Reports on Form 10-K, Quarterly Reports on Form 10-Q, Current Reports on Form 8-K and amendments to such reports, each of which is provided on our website as soon as reasonably practicable after we electronically file such materials with or furnish them to the SEC. You can also read and copy any materials we file with the SEC at the SEC’s Public Reference Room at 100 F Street, N.E., Washington, DC 20549. You can obtain additional information about the operation of the Public Reference Room by calling the SEC at 1-800-SEC-0330. In addition, the SEC maintains a website (www.sec.gov) that contains reports, proxy and information statements, and other information regarding issuers that file electronically with the SEC, including us.
2
PART I
General
We have been purchasing and collecting defaulted or charged-off accounts receivable portfolios from consumer credit originators since the formation of our predecessor company in 1962. Charged-off receivables are the unpaid obligations of individuals to credit originators, such as credit card issuers, consumer finance companies, healthcare providers, retail merchants, telecommunications and other utility providers. Since these receivables are delinquent or past due, we are able to purchase them at a substantial discount. We purchase and collect charged-off consumer receivable portfolios for our own account as we believe this affords us the best opportunity to use long-term strategies to maximize our profits. From January 1, 1999 through December 31, 2008, we have purchased 1,018 consumer debt portfolios, with an original charged-off face value of $36.5 billion for an aggregate purchase price of $890.2 million, or 2.44% of face value, net of buybacks.
When considering whether to purchase a portfolio, we conduct a quantitative and qualitative analysis of the portfolio to appropriately price the debt. This analysis includes the use of our proprietary pricing and collection probability model and draws upon our extensive experience in the industry. We have developed experience across a wide range of asset types at various stages of delinquency, having made purchases across more than 20 different asset types from over 160 different debt sellers since 2000. We selectively deploy our capital in the fresh, primary, secondary and tertiary delinquency stages. These stages are typically where the accounts are delinquent and have been charged off and immediately sold or have been placed with between one and four collection agencies who have already attempted to collect on the accounts included in the portfolios we acquired.
We have a long-standing history in the industry, relationships with debt sellers and attention to post-sale service. Unlike some third party collection agencies that typically attempt to collect the debt for a period of only six to twelve months, we generally take a long-term approach to the collection effort as we are the owners of the debt. We apply an approach that encourages cooperation with the debtors to make a lump sum settlement payment in full or to formulate a repayment plan. For those debtors who we believe have the ability to repay the debt, we may proceed with legal remedies to obtain our collections. Through our strategy of holding the debt for the long-term, we have established a methodology of converting debtors into paying customers. In addition, our approach allows us to invest in various collection management and analysis tools that may be too costly for short-term oriented collection agencies, as well as to pursue legal collection strategies as appropriate. In many cases, we continue to receive collections on individual portfolios for more than ten years from the date of purchase.
In addition, the Company finances the sales of consumer product retailers through its Consumer Credit, LLC subsidiary.
3
History and Reorganization
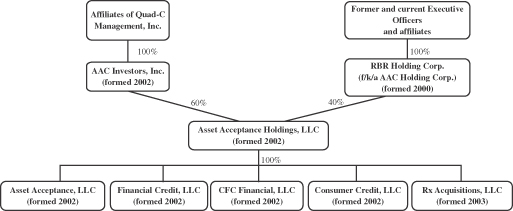
Our business originated with Lee Acceptance Company, which was formed in 1962 for the purpose of purchasing and collecting charged-off consumer receivables. The business of purchasing and collecting charged-off consumer receivables was conducted through several successor companies. Set forth below is a diagram depicting our predecessor corporations in operation for the periods of October 1, 2002 through February 4, 2004, their dates of formation and their ownership:
Reorganization
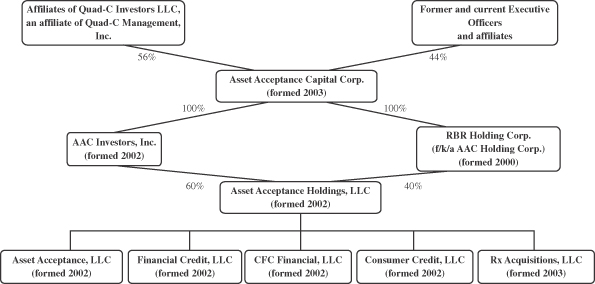
On February 4, 2004, immediately prior to the commencement of our initial public offering, all of the shares of capital stock of AAC Investors, Inc. and RBR Holding Corp., which held 60% and 40%, respectively, of the equity membership interests in Asset Acceptance Holdings, LLC, were contributed to Asset Acceptance Capital Corp. in exchange for shares of common stock of Asset Acceptance Capital Corp. The total number of shares issued to the stockholders of AAC Investors, Inc. and RBR Holding Corp. in such exchange was 28,448,449 with 16,004,017 shares and 12,444,432 shares issued to the stockholders of AAC Investors, Inc. and the stockholders of RBR Holding Corp., respectively. As a result of this reorganization, Asset Acceptance Holdings, LLC and its subsidiaries became indirect wholly-owned subsidiaries of Asset Acceptance Capital Corp. The foregoing is referred to herein as the “Reorganization”.
Set forth below is a diagram depicting our successor entities as of the effective date of the Reorganization, their dates of formation and their ownership:
4
Upon the consummation of our February 2004 initial public offering, our then-current officers, directors and principal stockholders, together with their affiliates, beneficially owned approximately 75.8% of our issued and outstanding common stock.
Subsidiary Mergers
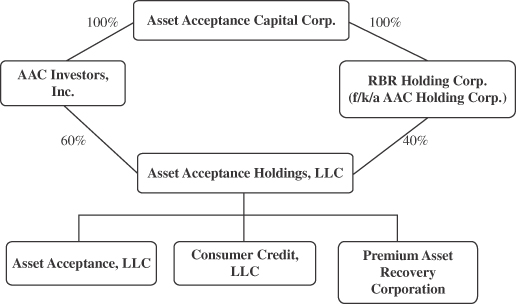
On December 31, 2004, Financial Credit, LLC and CFC Financial, LLC were merged with and into Asset Acceptance, LLC, with the result that, by operation of law, all assets of Financial Credit, LLC and CFC Financial, LLC were vested in Asset Acceptance, LLC and all obligations of Financial Credit, LLC and CFC Financial, LLC were assumed by Asset Acceptance, LLC. On April 15, 2008, Rx Acquisitions, LLC was merged with and into Asset Acceptance, LLC, with the result that, by operation of law, all assets of Rx Acquisitions, LLC were vested in Asset Acceptance, LLC and all obligations of Rx Acquisitions, LLC were assumed by Asset Acceptance, LLC. Subsequent to the merger, all ownership interests in Asset Acceptance, LLC continue to be owned by Asset Acceptance Holdings, LLC.
Current Structure and Acquisition
On April 28, 2006, Asset Acceptance Holdings, LLC completed a stock purchase transaction of Premium Asset Recovery Corporation (“PARC”). Under the terms of the agreement, Asset Acceptance Holdings, LLC acquired 100% of the outstanding shares of PARC.
Currently, Asset Acceptance, LLC purchases and holds portfolios in all asset types except for healthcare. PARC purchases and collects on portfolios primarily in healthcare.
Set forth below is a diagram depicting our current structure:
As used in this Annual Report, all references to us mean:
| | • | | after the Reorganization, Asset Acceptance Capital Corp., a Delaware corporation (referred to in our financial statements as the “Company”); and |
| | • | | from October 1, 2002 to the Reorganization, AAC Investors, Inc., including its subsidiary, Asset Acceptance Holdings, LLC (referred to collectively in our financial statements as the “Company”). |
5
Purchasing
Typically, we purchase our portfolios in response to a request to bid received via e-mail or telephone from a prospective seller. In addition to these requests, we have developed a marketing and acquisitions team that contacts and cultivates relationships with known and prospective sellers of portfolios in our core markets and in markets for new asset types. We have purchased portfolios from over 160 different debt sellers since 2000, including many of the largest consumer lenders in the United States. While we have no policy limiting purchases from a single debt seller, we purchase from a diverse set of debt sellers and our purchasing decisions are based upon constantly changing economic and competitive conditions as opposed to long-term relationships with particular debt sellers. Depending on market conditions and opportunities presented by certain debt sellers, we may enter into forward flow contracts. The forward flow contracts commit a debt seller to sell a steady volume of charged-off receivables to us for a fixed percentage of the face value over a specified time period, which typically ranges between three and twelve months.
We purchase our portfolios through a variety of sources, including consumer credit originators, private brokers and debt resellers. Debt resellers are debt purchasers that sell accounts at some point in time after purchase. Generally, the portfolios are purchased either in competitive bids through a sealed bid or, in some cases, through an on-line process or through privately-negotiated transactions between the credit originator or other holders of consumer debt and us.
Each potential acquisition begins with a quantitative and qualitative analysis of the portfolio. In the initial stages of the due diligence process, we typically review basic data on the portfolio’s accounts. This data typically includes the account number, the consumer’s name, address, social security number, phone numbers, outstanding balance, date of charge-off, last payment and account origination to the extent the debt sellers provide this data. We analyze this information and summarize it based on certain key metrics, such as, but not limited to, state of debtor’s last known residence, type of debt and age of the receivable. In addition, we request the seller to provide answers to a questionnaire designed to help us understand important qualitative factors relating to the portfolio.
As part of our due diligence, we evaluate the portfolio utilizing our proprietary pricing model. This model uses certain characteristics of the portfolio, historical analysis of similar portfolios, potential portfolio recoveries and collection expense estimates to formulate a bid range. In those circumstances where the type or pricing of the portfolio is unusual, we consult with industry experts and our collections management to help ascertain collectibility, potential collection strategies and our ability to integrate the new portfolio into our collection platform.
Once we have compiled and analyzed available data, we consider market conditions and determine an appropriate bid price or bid range. The recommended bid price or bid range, along with a summary of our due diligence, is submitted to our investment committee and, for purchases in excess of a certain dollar threshold, to a designated member of our audit committee or their designee for review and approval. After appropriate approvals and acceptance of our offer by the seller of the portfolio, a purchase agreement is negotiated. Buyback provisions are generally incorporated into the purchase agreement for bankrupt, fraudulent, paid prior or deceased accounts and, typically, the credit originator either agrees to repurchase these accounts or replace them with acceptable replacement accounts within certain time frames, generally within 90 to 240 days. Upon execution of the agreement, the transaction is funded and we receive title to the accounts purchased.
6
The following chart categorizes our purchased receivables portfolios acquired from January 1, 1999 through December 31, 2008 into the major asset types, as of December 31, 2008.
| | | | | | | | | | | |
Asset Type | | Face Value of
Charged-off
Receivables(2) | | % | | | No. of
Accounts | | % | |
| | | (in thousands) | | | | | (in thousands) | | | |
Visa®/MasterCard®/Discover® | | $ | 17,564,998 | | 49.8 | % | | 7,837 | | 25.2 | % |
Private Label Credit Cards | | | 4,958,527 | | 14.0 | | | 6,960 | | 22.4 | |
Telecommunications/Utility/Gas | | | 2,948,917 | | 8.4 | | | 7,684 | | 24.7 | |
Health Club | | | 1,679,147 | | 4.8 | | | 1,417 | | 4.6 | |
Auto Deficiency | | | 1,353,623 | | 3.8 | | | 240 | | 0.8 | |
Other Installment Loans | | | 1,223,503 | | 3.5 | | | 354 | | 1.1 | |
Wireless Telecommunications | | | 719,162 | | 2.0 | | | 1,727 | | 5.5 | |
Other(1) | | | 4,854,217 | | 13.7 | | | 4,901 | | 15.7 | |
| | | | | | | | | | | |
Total | | $ | 35,302,094 | | 100.0 | % | | 31,120 | | 100.0 | % |
| | | | | | | | | | | |
| (1) | “Other” includes charged-off receivables of several debt types, including healthcare, student loan, mobile home deficiency and retail mail order. This excludes the purchase of a single portfolio in June 2002 with a face value of $1.2 billion at a cost of $1.2 million (or 0.1% of face value) consisting of approximately 3.8 million accounts. |
| (2) | Face value of charged-off receivables represents the cumulative amount of purchases net of buybacks. The amount is not adjusted for payments received, settlements or additional accrued interest on any accounts in such portfolios after the date we purchased the applicable portfolio. |
The age of a charged-off consumer receivables portfolio, or the time since an account has been charged-off by the credit originator and the number of times a portfolio has been placed with third parties for collection purposes, are important factors in determining the price at which we will offer to purchase a receivables portfolio. Generally, there is an inverse relationship between the age of a portfolio and the price at which we will purchase it. This relationship is due to the fact that older receivables are typically more difficult to collect. The consumer debt collection industry places receivables into the following categories depending on the number of third parties that have previously attempted to collect on the receivables and age of the receivables:
| | • | | fresh accounts are typically 120 to 270 days past due, have been charged-off by the credit originator and are either being sold prior to any post charged-off collection activity or are placed with a third party collector for the first time. These accounts typically sell for the highest purchase price; |
| | • | | primary accounts are typically 270 to 360 days past due, have been previously placed with one third party collector and typically receive a lower purchase price; and |
| | • | | secondary and tertiary accounts are typically more than 360 days past due, have been placed with two or three third party collectors and receive even lower purchase prices. |
We specialize in the primary, secondary and tertiary delinquency stages, but we will purchase accounts at any point in the delinquency cycle. We deploy our capital within these delinquency stages based upon the relative values of the available debt portfolios.
7
The following chart categorizes our purchased receivables portfolios acquired from January 1, 1999 through December 31, 2008 into the major account types, as of December 31, 2008.
| | | | | | | | | | | |
Account Type | | Face Value of
Charged-off
Receivables(2) | | % | | | No. of
Accounts(2) | | % | |
| | | (in thousands) | | | | | (in thousands) | | | |
Fresh | | $ | 2,347,992 | | 6.7 | % | | 1,355 | | 4.4 | % |
Primary | | | 4,672,893 | | 13.2 | | | 4,547 | | 14.6 | |
Secondary | | | 7,264,085 | | 20.6 | | | 7,101 | | 22.8 | |
Tertiary(1) | | | 16,642,318 | | 47.1 | | | 15,000 | | 48.2 | |
Other | | | 4,374,806 | | 12.4 | | | 3,117 | | 10.0 | |
| | | | | | | | | | | |
Total | | $ | 35,302,094 | | 100.0 | % | | 31,120 | | 100.0 | % |
| | | | | | | | | | | |
| (1) | Excludes the purchase of a single portfolio in June 2002 with a face value of $1.2 billion at a cost of $1.2 million (or 0.1% of face value) and consisting of approximately 3.8 million accounts. |
| (2) | Face value of charged-off receivables represents the cumulative amount of purchases net of buybacks. The amount is not adjusted for payments received, settlements or additional accrued interest on any accounts in such portfolios after the date we purchased the applicable portfolio. |
We also review the geographic distribution of accounts within a portfolio because collection laws differ from state to state. The following chart illustrates our purchased receivables portfolios acquired from January 1, 1999 through December 31, 2008 based on geographic location of debtor, as of December 31, 2008.
| | | | | | | | | | | |
Geographic Location | | Face Value of
Charged-off
Receivables(3)(4) | | % | | | No. of
Accounts(3)(4) | | % | |
| | | (in thousands) | | | | | (in thousands) | | | |
Texas(1) | | $ | 5,181,219 | | 14.7 | % | | 4,911 | | 15.8 | % |
California | | | 4,017,294 | | 11.4 | | | 3,598 | | 11.6 | |
Florida(1) | | | 3,516,245 | | 10.0 | | | 2,279 | | 7.3 | |
New York | | | 2,067,673 | | 5.8 | | | 1,312 | | 4.2 | |
Michigan(1) | | | 2,007,769 | | 5.7 | | | 2,487 | | 8.0 | |
Ohio(1) | | | 1,805,073 | | 5.1 | | | 2,329 | | 7.5 | |
Illinois(1) | | | 1,453,722 | | 4.1 | | | 1,700 | | 5.5 | |
Pennsylvania | | | 1,270,538 | | 3.6 | | | 961 | | 3.1 | |
New Jersey(1) | | | 1,154,976 | | 3.3 | | | 946 | | 3.0 | |
North Carolina | | | 1,031,369 | | 2.9 | | | 703 | | 2.3 | |
Georgia | | | 984,145 | | 2.8 | | | 825 | | 2.6 | |
Other(2) | | | 10,812,071 | | 30.6 | | | 9,069 | | 29.1 | |
| | | | | | | | | | | |
Total | | $ | 35,302,094 | | 100.0 | % | | 31,120 | | 100.0 | % |
| | | | | | | | | | | |
| (1) | Collection site located in this state. |
| (2) | Each state included in “Other” represents less than 2.0% of the face value of total charged-off consumer receivables. |
| (3) | Excludes the purchase of a single portfolio in June 2002 with a face value of $1.2 billion at a cost of $1.2 million (or 0.1% of face value) and consisting of approximately 3.8 million accounts. |
| (4) | Face value of charged-off receivables represents the cumulative amount of purchases net of buybacks. The amount is not adjusted for payments received, settlements or additional accrued interest on any accounts in such portfolios after the date we purchased the applicable portfolio. |
8
Collection Operations
Our collection operations seek to maximize the recovery of our purchased charged-off receivables in a cost-effective manner. We have organized our collection process into a number of specialized departments, which include collection, legal collection and other collection departments.
Generally, our efforts begin in our collection department and, if warranted, move to our legal collection department. If the receivable account involves a bankrupt debtor or a deceased debtor, our bankruptcy or probate recovery departments will review and manage the account. If it is determined that the collection account should be outsourced to a third party collection agency, our agency forwarding department handles the matter. Finally, we utilize a network of data providers to obtain updated data on our purchased charged-off receivables and to assist our account representatives in their ability to collect on these receivables.
Collection Department
Once a portfolio is purchased, we perform a review in order to formulate and apply what we believe to be an effective collection strategy. This review includes a series of data preparation and information acquisition steps to provide the necessary account data to begin collection efforts. Portfolio accounts are assigned, sorted and prioritized based on product type, account status, various internal and external collectibility predictors, account demographics, balance sizes and other attributes.
We train our account representatives to be full service account representatives who handle substantially all collection activity related to their accounts. Such activities include manual and automated dialer outbound calling activity, inbound call management, skip tracing or debtor location efforts and settlement and payment plan negotiation. Our performance-based collection model is driven by a bonus program that allows account representatives to earn bonuses based on their achievement of collection goals. In addition, we monitor our account representatives for compliance with the federal and state debt collection laws.
When an initial telephone contact is made with a debtor, the account representative is trained to go through a series of questions in an effort to obtain accurate location and financial information on the debtor, the reason the debtor may have defaulted on the account, the debtor’s willingness to pay and other relevant information that may be helpful in securing satisfactory settlement or payment arrangements. If full payment is not available, the account representative will attempt to negotiate a settlement. In an effort to maximize recoveries, we maintain settlement guidelines that account representatives, supervisors and managers must follow. Exceptions are handled by management on an account-by-account basis. If the debtor is unable to pay the balance in full or settle within allowed guidelines, monthly installment plans are encouraged in order to have the debtor resume a regular payment habit. Our experience has shown that debtors are more likely to respond to this approach, which can result in settlement in full in the future.
If an account representative is unable to establish contact with a debtor, the account representative undertakes skip tracing procedures to locate, initiate contact with and collect from the debtor. Skip tracing efforts are performed individually at the account representative level and by third party, information providers in a batch process. Each account representative has access to internal and external information databases that interface with our collection system. In addition, we have several information providers from whom we acquire information that is either systematically or manually validated and used in our efforts to locate debtors. Using these methods, we periodically refresh and supply updated account information to our account representatives to increase contact with debtors.
Legal Collection Department
In the event collection has not been obtained through our collection department and the opportunity for legal action is verified, we pursue a legal judgment against the debtor. Once a judgment is obtained, our legal department pursues various collection strategies to secure payment. Our in-house legal collection department is
9
comprised of collection attorneys, non-attorney legal account representatives, support staff and skip tracers, while our legal forwarding department is comprised of account representatives, support staff and associates managing activities with the outside attorneys.
For accounts in states where we have a local presence, and in some cases adjacent states, we prefer to pursue an in-house legal strategy as it provides us with a greater ability to manage the process. We currently have in-house capability in nine states. In each of these states, we have designed our legal policies and procedures to maintain compliance with state and federal laws while pursuing available legal opportunities. We will pursue selective expansion into different geographic regions if analysis indicates it is favorable to do so.
Our legal forwarding department is organized to address the legal recovery function for accounts principally located in states where we do not have a local or adjacent presence to handle excess capacity and for accounts that we believe can be better served by a third party law firm. To that end, we utilize independent law firms throughout the country, who work for us on a contingent fee basis. The legal forwarding department actively manages and monitors our legal collection process handled by third parties.
Other Collection Departments
Although we collect the largest portion of our charged-off receivable portfolios through our internal collection operations, in some cases we believe it can be more effective and cost-efficient to outsource collections. For example, we may consider outsourcing relatively small balance accounts so that our account representatives can focus on larger balance accounts. Recently, we have increased the number of accounts placed with third party collection agencies because we believe we have a surplus of accounts relative to our staffing levels of collection account representatives. However, we desire to gradually increase our in-house staffing of collection account representatives and rely less on third party collection agencies. We have developed a network of third party collection agencies to service accounts when we believe outsourcing is an appropriate strategy.
Our bankruptcy and probate recovery departments handle bankruptcy and estate probate processing and collections. The bankruptcy department files proofs of claims for recoveries on receivables, which are included in consumer bankruptcies filed under Chapter 7 (resulting in liquidation and discharge of a debtor’s debts) and Chapter 13 (resulting in repayment plans based on the financial wherewithal of the debtor) of the U.S. Bankruptcy Code. The probate recovery department and our network of third party law firms submit claims against estates involving deceased debtors having assets that may become available to us through a probate claim.
Seasonality
Refer to Part II. Item 7, under the caption “Management’s Discussion and Analysis of Financial Condition and Results of Operations” for the effect of seasonality of our business.
Competition
The consumer debt collection industry is highly competitive and fragmented. We compete with a wide range of other purchasers of charged-off consumer receivables, third party collection agencies, other financial service companies and credit originators that manage their own consumer receivables. Some of these companies may have substantially greater numbers of associates and financial resources and may experience lower account representative turnover rates than we do. Furthermore, some of our competitors may obtain alternative sources of financing, the proceeds from which may be used to fund expansion and to increase their number of charged-off portfolio purchases. Barriers to entry into the consumer debt collection industry are low. Companies with greater financial resources may elect at a future date to enter the consumer debt collection business. Furthermore, current debt sellers may change strategies and cease selling debt portfolios in the future.
10
Competitive pressures affect the availability and pricing of receivable portfolios, as well as the availability and cost of qualified account representatives. In addition, some of our competitors may have entered into forward flow contracts under which consumer credit originators have agreed to transfer a steady flow of charged-off receivables to them in the future, which may restrict those credit originators from selling receivables to other purchasers and limit the supply of receivables available to us.
We face bidding competition in our acquisition of charged-off consumer receivables. We believe successful bids generally are predominantly awarded based on price, secondarily based on service and relationships with the individual debt sellers and recently, the debt buyer’s ability to fund the deal. In addition, there continues to be a consolidation of issuers of credit cards, which have been a principal source of our receivable purchases. This consolidation has decreased the number of sellers in the market and could eventually give the remaining sellers increasing market strength in the price and terms of the sale of charged-off credit card accounts.
The supply of charged-off consumer receivables remained strong in 2008 and, beginning in the second half of 2007, we believe pricing began to moderate from elevated pricing levels previously exhibited in the debt purchasing markets. According to the Kaulkin Ginsberg Index for the fourth quarter of 2008 (see the January 12, 2009 press release atwww.kaulkin.com), the charge-off rate increased in the fourth quarter of 2008, indicating a favorable supply environment for debt purchasers. However, the unemployment rate and the number of bankruptcy filings also rose in the fourth quarter of 2008, indicating a more challenging collection environment as debtors have fewer resources available to satisfy their debt.
Technology Platform
We believe that information technology is critical to our success. Our key systems have been purchased from outside vendors and, with our input, have been tailored to meet our particular business needs. We maintain a full-time staff of technology professionals who monitor and maintain our information technology and communications structure. We utilize a centralized data center model. This leverages economies of scale in providing distributed computing capabilities.
We license our collection software and complementary products. The collection software in use today enables us to:
| | • | | automate the loading of accounts in order to expedite collecting after purchase; |
| | • | | segment the accounts into dispositions for collection prioritization; |
| | • | | access several approved service partners including third party letter production and mailing vendors, credit reporting services and information service providers; |
| | • | | interface with automated dialers to increase the number of contacts with our debtors; |
| | • | | connect to a document imaging system to allow our associates, with appropriate responsibilities, to view scanned documents on accounts from their workstations while working on an account; |
| | • | | limit an associate’s ability to work outside of company guidelines; |
| | • | | query the appropriate database for any purpose which may be used for collection, reporting or other business matters; and |
| | • | | establish parameters to comply with federal and state laws. |
11
In 2007, we signed an agreement with a software provider and initiated a project to install a new collection platform. The new collection platform will maintain all crucial functionality of the current platform. We are in the process of installing that platform.
In order to minimize the potential impact of a disaster or other interruption of data or telephone communications that are critical to our business, we have:
| | • | | a diesel generator sufficient in size to power our entire Warren, Michigan headquarters, including our centralized systems; |
| | • | | a back-up server sufficient in size to handle our database located in a separate data center from the primary data center; |
| | • | | replication of data from the primary system to a backup system; |
| | • | | an ability to have inbound phone calls rerouted to other offices; |
| | • | | fire suppression systems in our primary and back-up data centers; |
| | • | | redundant data paths to each of our call center offices and data centers; |
| | • | | daily back-up of all of our critical applications with the tapes transported offsite to a secure data storage facility; and |
| | • | | data replication in our primary server to preserve data in the event of a failure of a storage component. |
In addition, we have state-of-the-art dialer systems for incoming and outgoing calls that include call recording technology.
Regulation and Legal Compliance—Collection Activities
Federal and state statutes establish specific guidelines and procedures, which debt collection account representatives must follow when collecting consumer accounts. It is our policy to comply with the provisions of all applicable federal laws and state statutes in all of our recovery activities. As part of this policy, we have established comprehensive procedures to ensure compliance with applicable federal and state collection laws. Failure to comply with these laws could lead to fines that could have a material adverse effect on us. Court rulings in various jurisdictions also impact our ability to collect.
Federal and state consumer protection, privacy and related laws and regulations extensively regulate the relationship between debt collectors and debtors. Significant federal laws and regulations applicable to our business as a debt collection company include the following:
| | • | | Fair Debt Collection Practices Act (“FDCPA”). This act imposes obligations and restrictions on the practices of consumer debt collectors, including specific restrictions regarding communications with debtors, including the time, place and manner of the communications. This act also gives consumers certain rights, including the right to dispute the validity of their obligations; |
| | • | | Fair Credit Reporting Act/ Fair and Accurate Credit Transaction Act of 2003.The Fair Credit Reporting Act and its amendment entitled the Fair and Accurate Credit Transaction Act of 2003 (“FACT Act”) places requirements on credit information providers regarding verification of the accuracy of information provided to credit reporting agencies and requires such information providers to investigate consumer disputes concerning the accuracy of such information. The FACT Act also requires certain conduct in the cases of identity theft or unauthorized use of a credit card and direct disputes to the creditor. We provide information concerning our accounts to the three major credit-reporting agencies, and it is our practice to correctly report this information and to investigate credit-reporting disputes in a timely fashion; |
| | • | | The Financial Privacy Rule. Promulgated under the Gramm-Leach-Bliley Act, this rule requires that financial institutions, including collection agencies, develop policies to protect the privacy of |
12
| | consumers’ private financial information and provide notices to consumers advising them of their privacy policies. It also requires that if private personal information concerning a consumer is shared with another unrelated institution, the consumer must be given an opportunity to opt out of having such information shared. Since we do not share consumer information with non-related entities, except as required by law, or except as allowed in connection with our collection efforts, our consumers are not entitled to any opt-out rights under this act. Both this rule and the Safeguards Rule described below are enforced by the Federal Trade Commission, which has retained exclusive jurisdiction over enforcement of them. Consumers do not have a private cause of action for violations of the Gramm-Leach-Bliley Act; |
| | • | | The Safeguards Rule. Also promulgated under the Gramm-Leach-Bliley Act, this rule specifies that we must safeguard financial information of consumers and have a written security plan setting forth information technology safeguards and the ongoing monitoring of the storage and safeguarding of electronic information; |
| | • | | Electronic Funds Transfer Act. This act regulates the use of the Automated Clearing House (“ACH”) system to make electronic funds transfers. All ACH transactions must comply with Federal Reserve Regulation E and the rules of the National Automated Check Clearing House Association (“NACHA”). This act, Regulation E and the NACHA regulations give the consumer, among other things, certain privacy rights with respect to the transactions, the right to stop payments on a pre-approved fund transfer, and the right to receive certain documentation of the transaction; |
| | • | | Telephone Consumer Protection Act. In the process of collecting accounts, we use automated dialers to place calls to consumers. This act and similar state laws place certain restrictions on telemarketers and users of automated dialing equipment who place telephone calls to consumers; |
| | • | | Health Insurance Portability and Accountability Act (“HIPAA”). This act requires that healthcare institutions provide safeguards to protect the privacy of consumers’ healthcare information. As a debt buyer collecting on healthcare debt, we are considered a business associate to the healthcare institutions and are required to abide by HIPAA. Our dedicated subsidiary, PARC, directly holds and collects all of our healthcare receivables; and |
| | • | | U.S. Bankruptcy Code. In order to prevent any collection activity with bankrupt debtors by creditors and collection agencies, the U.S. Bankruptcy Code provides for an automatic stay, which prohibits certain contacts with consumers after the filing of bankruptcy petitions. |
Additionally, there are state and local statutes and regulations comparable to the above federal laws and other state and local-specific licensing requirements which affect our operations. State laws may also limit interest rates and fees, methods of collections, as well as the time frame in which judicial actions may be initiated to enforce the collection of consumer accounts.
Although we are not generally a credit originator, the following laws, which apply typically to credit originators, may occasionally affect our operations because our receivables were originated through credit transactions:
| | • | | Fair Credit Billing Act; |
| | • | | Equal Credit Opportunity Act; and |
| | • | | Retail Installment Sales Act. |
Federal laws which regulate credit originators require, among other things, that credit card issuers disclose to consumers the interest rates, fees, grace periods and balance calculation methods associated with their credit card accounts. Consumers are entitled under current laws to have payments and credits applied to their accounts promptly, to receive prescribed notices, and to require billing errors to be resolved promptly. Some laws prohibit
13
discriminatory practices in connection with the extension of credit. Federal statutes further provide that, in some cases, consumers cannot be held liable for, or their liability is limited with respect to, charges to the credit card account that were a result of an unauthorized use of the credit card. These laws, among others, may give consumers a legal cause of action against us, or may limit our ability to recover amounts due on an account, whether or not we committed any wrongful act or omission in connection with the account. If the credit originator fails to comply with applicable statutes, rules and regulations, it could create claims and rights for consumers that could reduce or eliminate their obligations to repay the account, and have a possible material adverse effect on us. Accordingly, when we acquire charged-off consumer receivables, we typically require credit originators to indemnify us against certain losses that may result from their failure to comply with applicable statutes, rules and regulations relating to the receivables before they are sold to us.
The U.S. Congress and a number of states have enacted legislation concerning identity theft or unauthorized use of a credit card. Some of these provisions place restrictions on our ability to report information concerning receivables, which may be subject to identity theft or unauthorized use of a credit card, to consumer credit reporting agencies. Additional consumer protection and privacy protection laws may be enacted that would impose additional requirements on the recovery on consumer credit card or installment accounts. Any new laws, rules or regulations that may be adopted, as well as existing consumer protection and privacy protection laws, may adversely affect our ability to collect on our charged-off consumer receivable portfolios. In addition, our failure to comply with these requirements could adversely affect our ability to recover the receivables and increase our costs.
It is possible that some of the receivables were established as a result of identity theft or unauthorized use. In such cases, we would not be able to recover the amount of the charged-off consumer receivables. As a purchaser of charged-off consumer receivables, we may acquire receivables subject to legitimate defenses on the part of the consumer. Most of our account purchase contracts allow us to return to the credit originators (within an agreed upon amount of time) certain charged-off consumer receivables that may not be collectible at the time of purchase, due to these and other circumstances. Upon return, the credit originators or debt sellers are required to replace the receivables with similar receivables or repurchase the receivables. These provisions limit, to some extent, our losses on such accounts.
Associates
As of December 31, 2008, we employed 1,651 total associates, including 1,595 persons on a full-time basis and 56 persons on a part-time basis.
Training
We provide a comprehensive training program for our new account representatives and continuing education for our experienced account representatives. Our training includes several learning approaches, including classroom interactive activities, computer-based training and on-the-job training. We also use our e-mail system and intranet to address on-going training issues.
New account representatives are required to complete an eight-week training program. The program is divided into two four-week modules. The initial four-week module has weekly objectives using various learning activities. The first week includes structured learning of our collection software and information technology tools, federal and state collection laws (with particular emphasis on the FDCPA and the FACT Act), telephone collection techniques and core company policies, procedures and practices. The second week continues the structured learning and is supplemented by supervised telephone collection calls. During weeks three and four, the new hires form a collection team, with a trainer as supervisor. Collection goals are established and collection calls are made and supervised. Instruction and guidance is shared with the new associates to improve productivity. Training includes discussion of challenges faced by associates and debriefing of the activities performed. Interactive activities are used to enhance collection and organization skills.
14
The second four-week training module transitions the collection team to the collection floor, where they are assigned collection goals and work under the direction of a collection supervisor. This team of new hires continues to receive closely monitored collection training. In addition to collection training, these team members also review key elements from the first session and receive instruction in new topics.
New legal account representatives are required to complete a four-week training program. The first week of training is the same for legal account representatives as it is for account representatives. The second week of training focuses on legal processes and procedures and also includes supervised collection calls. Weeks three and four include closely supervised implementation of assigned duties.
Account representatives are tested twice each year on their knowledge of the FDCPA and other applicable federal laws. Account representatives not achieving our minimum standards are required to complete a FDCPA review session and are then retested. In addition, annual supplemental instruction in the FDCPA and collection techniques is provided to our account representatives.
This Report includes forward-looking statements as defined in the Private Securities Litigation Reform Act of 1995. In addition, we may make other written and oral communications from time to time that contain forward-looking statements. All statements regarding our expected financial position, strategies and growth prospects and general economic conditions we expect to exist in the future are forward-looking statements. The words “anticipates,” “believes,” “feels,” “expects,” “estimates,” “seeks,” “strives,” “plans,” “intends,” “outlook,” “forecast,” “position,” “target,” “mission,” “assume,” “achievable,” “potential,” “strategy,” “goal,” “aspiration,” “outcome,” “continue,” “remain,” “maintain,” “trend,” “objective,” and variations of such words and similar expressions, or future or conditional verbs such as “will,” “would,” “should,” “could,” “might,” “can,” “may” or similar expressions, as they relate to us or our management, are intended to identify forward-looking statements.
We caution that forward-looking statements are subject to numerous assumptions, risks and uncertainties, which change over time. Forward-looking statements speak only as of the date the statement is made, and we do not undertake to update forward-looking statements to reflect facts, circumstances, assumptions or events that occur after the date the forward-looking statements are made. Actual results could differ materially from those anticipated in forward-looking statements and future results could differ materially from historical performance.
In addition to factors mentioned elsewhere in this Report or previously disclosed in our SEC reports (accessible on the SEC’s website atwww.sec.gov or on our website atwww.assetacceptance.com), the factors contained below, among others, could cause actual results to differ materially from forward-looking statements, and future results could differ materially from historical performance.
Instability in the financial markets and the current economic recession may affect our access to capital and our ability to purchase and collect receivables. Current high unemployment rates may negatively affect our collections of charged-off consumer debt.
Our success depends on our continued ability to purchase and collect charged-off consumer debt. The unemployment rate in the United States has increased in recent months. In addition, the residential real estate market in the United States has experienced a significant downturn due to declining real estate values, precipitating credit market dislocations and a significant contraction in available liquidity globally. Financial markets have been experiencing extreme disruption in recent months. Individual consumers are experiencing higher delinquency rates on various consumer loans and defaults on indebtedness of all kinds have increased. We have begun to experience the impact of the economy on our collections. Further declines in real estate values, increased levels of unemployment, continued declines in consumer confidence and continuing credit and liquidity concerns could further reduce our ability to collect on our purchased consumer receivable portfolios and would adversely affect their value. In addition, continued or further credit market dislocations or sustained
15
market downturns may reduce the ability of lenders to originate new credit, limiting our ability to purchase consumer receivable portfolios in the future. Financial pressure on the distressed consumer may lead to regulatory restrictions on our collections and increased litigation filed against us. We may be unable to predict the likely duration or severity of the current disruption in financial markets and adverse economic conditions and the effects they may have on our business, financial condition and results of operations.
Our access to capital through our credit agreement is critical to our ability to continue to grow. If our available credit is materially reduced or the credit agreement is terminated and if we are unable to replace it on favorable terms, our revenue growth may slow and our results of operations may be materially and adversely affected.
We believe that our access to capital through our credit agreement has been critical to our ability to grow. We have a five-year $100.0 million revolving line of credit that expires June 5, 2012 and a six-year $150.0 million term loan facility that matures on June 5, 2013. If our available credit is materially reduced or the credit agreement is terminated as a result of noncompliance with a covenant or other event of default and if we are unable to replace it on relatively favorable terms, our revenue growth may slow and our results of operations may be materially and adversely affected.
In addition, our credit agreement contains limitations and restrictions as to our ability to seek additional credit from other lenders.
We may not be able to continue to satisfy the restrictive covenants in our credit agreement.
All of our receivable portfolios are pledged to secure amounts owed to our lenders under our credit agreement. Our credit agreement imposes a number of restrictive covenants on how we operate our business. These include financial covenants. As of December 31, 2008, we had the ability to borrow approximately an additional $28 million, under the most restrictive of these financial covenants. Our ability to meet these financial covenants is predicated on our ability to continue to generate revenues and other financial results at levels sufficient to satisfy the requirements of our credit agreement. Failure to satisfy any one of these covenants could result in all or any of the following consequences, each of which could have a materially adverse effect on our ability to conduct business:
| | • | | acceleration of outstanding indebtedness; |
| | • | | our inability to continue to purchase receivables needed to operate our business; or |
| | • | | our inability to secure alternative financial financing on favorable terms, if at all. |
Negative attention and news regarding the debt collection industry and individual debt collectors may have a negative impact on a debtor’s willingness to pay the debt we acquire.
The following factors may cause consumers to be more reluctant to pay their debts or to pursue legal actions against us:
| | • | | Annually the Federal Trade Commission submits a report to Congress, which summarizes the complaints it has received regarding debt collection practices. The report contains the total number of complaints filed, the percentage of increases or decreases from the previous year in addition to an outline of key types of complaints. |
| | • | | Print and television media, from time to time, may publish stories about the debt collection industry which may cite specific examples of abusive collection practices. These stories are also published on websites, which can lead to the rapid dissemination of the story adding to the level of exposure to negative publicity about us or the industry. |
| | • | | The Internet has websites where consumers list their concerns about the activities of debt collectors and seek guidance from other website posters on how to handle the situation. |
16
| | • | | Advertisements by “anti-collections” attorneys and credit counseling centers are becoming more common and add to the negative attention given to our industry. |
As a result of this negative publicity, debtors may be more reluctant to pay their debts or could pursue legal action against us regardless of whether those actions are warranted. These actions could impact our ability to collect on the receivables we acquire and impact our ability to operate profitably.
Our ability to recover on our charged-off consumer receivables may be limited under federal and state laws.
Federal and state consumer protection, privacy and related laws and regulations extensively regulate the relationship between debt collectors and debtors. Federal and state laws may limit our ability to recover on our charged-off consumer receivables regardless of any act or omission on our part. Some laws and regulations applicable to credit card issuers may preclude us from collecting on charged-off consumer receivables we purchase if the credit card issuer previously failed to comply with applicable law in generating or servicing those receivables. Additional consumer protection and privacy protection laws may be enacted that would impose additional or more stringent requirements on the enforcement of and collection on consumer receivables.
New federal, state or local laws or regulations, or changes in the ways these rules or laws are interpreted or enforced, could limit our activities in the future or significantly increase the cost of regulatory compliance. Any new laws, rules or regulations that may be adopted, as well as existing consumer protection and privacy protection laws, may adversely affect our ability to collect on our charged-off consumer receivable portfolios and may have a material adverse effect on our business and results of operations. In addition, federal and state governmental bodies are considering, and may consider in the future, other legislative proposals that would regulate the collection of consumer receivables. The Federal Trade Commission has proposed amendments to the Fair Debt Collection Practices Act that, if enacted, may adversely affect our business and results of operations. Although we cannot predict if or how any future legislation would impact our business, our failure to comply with any current or future laws or regulations applicable to us could limit our ability to collect on our charged-off consumer receivable portfolios, which could reduce our profitability and harm our business.
In addition to the possibility of new laws being enacted, it is possible that regulators and litigants may attempt to extend debtors’ rights beyond the current interpretations placed on existing statutes. These attempts could cause us to (i) expend significant financial and human resources in either litigating these new interpretations or (ii) alter our existing methods of conducting business to comply with these interpretations, either of which could reduce our profitability and harm our business.
Failure to comply with government regulation could result in the suspension or termination of our ability to conduct business and the imposition of financial penalties.
The collections industry is regulated under various federal and state laws and regulations. Many states and several cities require that we be licensed as a debt collection company. The Federal Trade Commission, state Attorneys General and other regulatory bodies have the ability to investigate consumer complaints against debt collection companies and to recommend enforcement actions and seek monetary penalties. If we fail to comply with applicable laws and regulations, it could result in significant penalties or the suspension or termination of our ability to conduct collection operations, which could materially adversely affect us.
A significant portion of our collections relies upon our success in individual lawsuits brought against consumers and our ability to collect on judgments in our favor.
We generate a significant portion of our revenue by collecting on judgments that are granted by courts in lawsuits filed against debtors. A decrease in the willingness of courts to grant such judgments, a change in the requirements for filing such cases or obtaining such judgments, or a decrease in our ability to collect on such
17
judgments could have a material and adverse effect on our results of operations. As we increase our use of the legal channel for collections, our short-term margins may decrease as a result of an increase in upfront court costs and costs related to counter claims. We may not be able to collect on certain aged accounts because of applicable statues of limitations and we may be subject to adverse effects of regulatory changes that we cannot predict.
We are subject to ongoing risks of litigation, including individual and class actions under consumer credit, collections, and other laws.
We operate in an extremely litigious climate and currently are, and may in the future, be named as defendants in litigation, including individual and class actions under consumer credit, collections, and other laws.
Our operations could suffer from telecommunications or technology downtime or from not responding to changes in technology. We are converting our centralized debt collection platform to a different software system. A failure to convert our debt collection platform successfully could materially impair our ability to conduct our business.
Our success depends in large part on sophisticated telecommunications and computer systems. The temporary or permanent loss of our computer and telecommunications equipment and software systems, through casualty or operating malfunction (including outside influences such as computer viruses), could disrupt our operations. In the normal course of our business, we must record and process significant amounts of data quickly and accurately. Any failure of our information systems or software and their backup systems would interrupt our operations and harm our business. In addition, we rely significantly on a single vendor for the software used in operating our current collections platform. Our business operations would be disrupted and our results of operations may be harmed if they were to cease operations or significantly reduce their support to us. We endeavor to deploy state-of-the-art technology across our infrastructure and, as warranted, will upgrade that technology over time.
We are in the process of converting our centralized debt collection platform to a different software system, supported by a different third party vendor. Failure to execute successfully the conversion to and implementation of that new debt collection platform will exacerbate the risks identified above and could materially impair our ability to collect our receivables and otherwise conduct our business. During times of transition, risk exists in decommissioning existing applications and hardware and the implementation of new applications and hardware. Failure to accurately identify and mitigate that risk could have a significant impact on our operational capabilities.
We are subject to examinations and challenges by tax authorities.
Our industry is relatively new and unique and, as a result, there is not a set of well defined laws, regulations or case law for us to follow that match our particular facts and circumstances for some tax positions. Therefore, certain tax positions we take are based on industry practice, tax advice and drawing similarities of our facts and circumstances to those in case law relating to other industries. These tax positions may relate to tax compliance, sales and use, franchise, gross receipts, payroll, property and income tax issues, including tax base and apportionment. Challenges made by tax authorities to our application of tax rules may result in adjustments to the timing or amount of taxable income or deductions or the allocation of income among tax jurisdictions, as well as, inconsistent positions between different jurisdictions on similar matters. If any such challenges are made and are not resolved in our favor, they could have an adverse effect on our financial condition and result of operations.
18
We are dependent on our management team for the adoption and implementation of our strategies and the loss of their services could have a material adverse effect on our business.
Our future success depends on the continued ability to recruit, hire, retain and motivate highly skilled management. The continued growth and success of our business is particularly dependent upon the continued services of our executive officers, including our Chief Executive Officer, our Chief Acquisitions Officer, and our Chief Financial Officer, each of whom is integral to the development of our business. Our performance also depends on our ability to retain and motivate our other executives. The loss of the services of one or more of our executive officers or other key associates could disrupt our operations and seriously impair our ability to continue to acquire or collect on portfolios of charged-off consumer receivables and to manage and expand our business. We have employment agreements with each of our Chief Executive Officer, Chief Acquisitions Officer and Chief Financial Officer. However, these agreements do not and will not assure the continued services of these officers. We do not maintain key person life insurance policies for our executive officers or key associates.
If we are not able to purchase charged-off consumer receivables at appropriate prices or in sufficient amounts, the resulting decrease in our inventory of purchased portfolios of receivables could adversely affect our ability to generate cash and income.
If we are unable to purchase charged-off consumer receivables from credit originators in sufficient face value amounts at appropriate prices, our business may be harmed. The availability of portfolios of consumer receivables at prices which generate an appropriate return on our investment depends on a number of factors, both within and outside of our control, including:
| | • | | our ability to borrow to fund purchases; |
| | • | | continued growth in the levels of credit being extended by credit originators; |
| | • | | continued growth in the levels of consumer obligations; |
| | • | | continued growth in the number of industries selling charged-off consumer receivable portfolios; |
| | • | | continued sales of charged-off consumer receivable portfolios by credit originators; |
| | • | | Federal government intervention involving financial institutions with troubled assets, which limits our access to charged-off consumer receivables; and |
| | • | | competitive factors affecting potential purchasers and credit originators of charged-off receivables, including the number of firms engaged in the collection business and the capitalization of those firms, as well as new entrants seeking returns, that may cause an increase in the price we are willing to pay for portfolios of charged-off consumer receivables or cause us to overpay for portfolios of charged-off consumer receivables. |
In addition, we believe that credit originators and debt sellers are utilizing more sophisticated collection methodologies that result in lower quality portfolios available for purchase, which may render the portfolios available for sale less collectible.
Because of the length of time involved in collecting charged-off consumer receivables on acquired portfolios and the volatility in the timing of our collections, we may not be able to identify trends and make changes in our purchasing or collection strategies in a timely manner.
19
We generally account for purchased receivable revenues using the interest method of accounting in accordance with U.S. Generally Accepted Accounting Principles, which requires making reasonable estimates of the timing and amount of future cash collections. If the timing is delayed or the actual amount recovered by us is materially different from our estimates, it could cause us to recognize impairments and negatively impact our earnings.
We utilize the interest method of accounting for our purchased receivables because we believe that the purchased receivables are discounted as a result of deterioration of credit quality and that the amounts and timing of cash collections for our purchased receivables can be reasonably estimated. This belief is predicated on our historical results and our knowledge of the industry. The interest method is prescribed by the Accounting Standards Executive Committee Practice Bulletin 6 (“PB 6”), “Amortization of Discounts on Certain Acquired Loans” as well as the Accounting Standards Executive Committee Statement of Position 03-3 (“SOP 03-3”), “Accounting for Certain Loans or Debt Securities Acquired in a Transfer”.
The provisions of SOP 03-3 were adopted by us in January 2005 and apply to purchased receivables acquired after December 31, 2004. The provisions of SOP 03-3 that relate to decreases in expected cash flows amend PB 6 for consistent treatment and apply prospectively to receivables acquired before January 1, 2005. Purchased receivables acquired before January 1, 2005 will continue to be accounted for under PB 6, as amended, for provisions related to decreases in expected cash flows. The cost recovery method prescribed by SOP 03-3 is used when collections on a particular portfolio cannot be reasonably predicted. When appropriate, the cost recovery method may be used for pools that previously had a yield assigned. Under the cost recovery method, no revenue is recognized until we have fully collected the carrying value of the portfolio.
Each static pool of receivables is modeled to determine its projected cash flows based on historical cash collections for pools with similar characteristics. An internal rate of return (“IRR”) is calculated for each static pool of receivables based on the projected cash flows. The IRR is applied to the remaining balance of each static pool of accounts to determine the revenue recognized. Each static pool is analyzed at least quarterly to assess the actual performance compared to the expected performance. To the extent there are differences in actual performance versus expected performance, the IRR may be adjusted prospectively to reflect the revised estimate of cash flows over the remaining life of the static pool. Effective January 2005, under SOP 03-3, if revised cash flow estimates are less than the original estimates, the IRR remains unchanged and an impairment is recognized. If cash flow estimates increase subsequent to recording an impairment, reversal of the previously recognized impairment is made prior to any increases to the IRR.
Application of the interest method of accounting requires the use of estimates, primarily estimated remaining collections, to calculate a projected IRR for each pool. These estimates are primarily based on historical cash collections. If future cash collections are materially different in amount or timing than the remaining collections estimate, earnings could be affected, either positively or negatively. Higher collection amounts or cash collections that occur sooner than projected cash collections will have a favorable impact on reversal of impairments, yields and revenues. Lower collection amounts or cash collections that occur later than projected cash collections will have an unfavorable impact and result in an impairment being recorded. Impairments may cause reduced earnings or volatility in earnings.
We may not be able to collect sufficient amounts on our charged-off consumer receivables, which would adversely affect our results of operations.
Our business consists of acquiring and collecting receivables that consumers have failed to pay and that the credit originator has deemed uncollectible and has charged-off. The credit originators or other debt sellers generally make numerous attempts to recover on their charged-off consumer receivables before we purchase such receivables, often using a combination of in-house recovery and third party collection efforts. Since there generally have been multiple efforts to collect on these portfolios of charged-off consumer receivables before we attempt to collect on them (three or more efforts on more than 50% of the face value of our portfolios), our
20
attempts to collect on these portfolios may not be successful. Therefore, we may not collect a sufficient amount to cover our investment associated with purchasing the charged-off consumer receivable portfolios and the costs of running our business, which would adversely affect our results of operations.
There can be no assurance that our success in generating collections in the past will be indicative of our ability to be successful in generating collections in the future.
We experience high turnover rates for our account representatives. We may not be able to hire and retain enough sufficiently trained account representatives to support our operations.
Our ability to collect on new and existing portfolios and to acquire new portfolios is substantially dependent on our ability to hire and retain qualified associates. The consumer accounts receivables management industry is labor intensive and, similar to other companies in our industry, we experience a high rate of associate turnover. For 2008, our annual turnover rate was 51.4% and our collection department associate turnover rate was 67.5%. Based on our experience, account representatives who have been with us for more than one year are generally more productive than account representatives who have been with us for less than one year. In 2008, our turnover rate for all associates employed by us for at least one year was 28.7% and 32.8% for collection department associates. We compete for qualified associates with companies in our industry and in other industries. Our operations require that we continually hire, train and, in particular, retain account representatives. In addition, we believe the level of training we provide to our associates makes our associates attractive to other collection companies, which may attempt to recruit them. A higher turnover rate among our account representatives will increase our recruiting and training costs, may require us to increase associate compensation levels and will limit the number of experienced collection associates available to service our charged-off consumer receivables. If this were to occur, we would not be able to service our charged-off consumer receivables effectively, which would reduce our ability to operate profitably.
We face intense competition that could impair our ability to grow and achieve our goals.
The consumer debt collection industry is highly competitive and fragmented. We compete with a wide range of other purchasers of charged-off consumer receivables, third party collection agencies, other financial service companies and credit originators and other owners of debt that manage their own charged-off consumer receivables. Some of these companies may have substantially greater numbers of associates and financial resources and may experience lower account representative turnover rates than we do. Furthermore, some of our competitors may obtain alternative sources of financing, the proceeds from which may be used to fund expansion and to increase their number of charged-off portfolio purchases. Barriers to entry into the consumer debt collection industry are low. Companies with greater financial resources than we have may elect at a future date to enter the consumer debt collection business. Competitive pressures affect the availability and pricing of receivable portfolios as well as the availability and cost of qualified debt collection account representatives. In addition, some of our competitors have signed forward flow contracts under which consumer credit originators have agreed to transfer a steady flow of charged-off receivables to them in the future, which could restrict those credit originators from selling receivables to us.
We face bidding competition in our acquisition of charged-off consumer receivable portfolios. We believe successful bids generally are awarded based predominantly on price and to a lesser extent based on service and relationships with the debt sellers. Some of our current competitors, and possible new competitors, may have more effective pricing and collection models, greater adaptability to changing market needs and more established relationships in our industry than we have. Moreover, our competitors may elect to pay prices for portfolios that we determine are not reasonable and, in that event, our volume of portfolio purchases may be diminished. There can be no assurance that our existing or potential sources will continue to sell their charged-off consumer receivables at recent levels or at all, or that we will continue to offer competitive bids for charged-off consumer receivable portfolios. In addition, there continues to be a consolidation of issuers of credit cards, which have been a principal source of our receivable purchases. This consolidation has decreased the number of sellers in the
21
market and, consequently, could over time, give the remaining sellers increasing market strength in the price and terms of the sale of charged-off credit card accounts and could cause us to accept lower returns on our investment in that paper than we have historically achieved.
If we are unable to develop and expand our business or adapt to changing market needs as well as our current or future competitors, we may experience reduced access to portfolios of charged-off consumer receivables in sufficient face-value amounts at appropriate prices. As a result, we may experience reduced profitability which, in turn, may impair our ability to achieve our goals.
Our strategy includes acquiring charged-off receivable portfolios in industries in which we may have little or no experience. If we do not successfully acquire and collect on these portfolios, revenue may decline and our results of operations may be materially and adversely affected.
We may acquire portfolios of charged-off consumer receivables in industries in which we have limited experience. Some of these industries may have specific regulatory restrictions with which we have no experience. Our limited experience in these industries may impair our ability to effectively and efficiently collect on these portfolios. Furthermore, we need to develop appropriate pricing models for these markets, and there is no assurance that we will do so effectively. When pricing charged-off consumer receivables for industries in which we have limited experience, we attempt to adjust our models for expected or known differences from our traditional models. However, our pricing models are primarily based on historical data for industries in which we do have experience. This may cause us to overpay for these portfolios, and consequently, our profitability may suffer as a result of these portfolio acquisitions.
Our operating results and cash collections may vary from quarter to quarter.
Our business depends on the ability to collect on our portfolios of charged-off consumer receivables. Collections within portfolios tend to be seasonally higher in the first and second quarters of the year, due to consumers’ receipt of tax refunds and other factors. Conversely, collections within portfolios tend to be lower in the third and fourth quarters of the year, due to consumers’ spending in connection with summer vacations, the holiday season and other factors. Operating expenses are seasonally higher during the first and second quarters of the year due to expenses necessary to process the increase in cash collections. However, revenue recognized is relatively level due to our application of the interest method for revenue recognition. In addition, our operating results may be affected to a lesser extent by the timing of purchases of portfolios of charged-off consumer receivables due to the initial costs associated with purchasing and integrating these receivables into our system. Consequently, income and margins may fluctuate quarter to quarter.
Our collections may decrease if bankruptcy filings increase or if bankruptcy laws change.
During times of economic recession, the amount of charged-off consumer receivables generally increases, which contributes to an increase in the amount of personal bankruptcy filings. Under certain bankruptcy filings, a debtor’s assets are sold to repay creditors, but since the charged-off consumer receivables we are attempting to collect are generally unsecured or secured on a second or third priority basis, we often would not be able to collect on those receivables. Our collections may decline with an increase in bankruptcy filings or if the bankruptcy laws change in a manner adverse to our business, in which case, our financial condition and results of operations could be materially adversely affected.
Failure to effectively manage our growth could adversely affect our business and operating results.
We have expanded significantly over our history and we intend to grow in the future. However, any future growth will place additional demands on our resources, and we cannot be sure that we will be able to manage our growth effectively. In order to successfully manage our growth, we may need to:
| | • | | expand and enhance our administrative infrastructure; and |
| | • | | enhance our management and our financial and information systems and our controls. |
22
Uncontrolled growth could put additional emphasis on recruiting, training, managing and retaining our associates and place a strain on our management, operations and financial resources. We cannot assure you that our infrastructure, facilities and associates will be adequate to support our future operations or to effectively adapt to future growth. If we cannot manage our growth effectively, our results of operations may be adversely affected.
Our common stock trades at a relatively low average daily volume. Consequently, sales of our common stock by one or more of our larger shareholders could depress the price of our common stock.
The majority of our shares of common stock are held by relatively few shareholders. As of February 20, 2009, our directors, executive officers and beneficial owners of 5% or more of our common stock controlled approximately 75.6% in total of our outstanding shares. Our largest shareholder, AAC Quad-C Investors, LLC (“Quad-C”), which controls 35.8% of our common stock, and our third largest shareholder, Nathaniel F. Bradley IV, our chairman, who controls 12.2% of our common stock, have an agreement with the Company obligating it to register their shares with the SEC for sale. In May 2008, Quad-C exercised that right as to all of its shares and there is currently on file with the SEC an effective shelf registration statement permitting Quad-C to engage in a public sale of its shares. A sale of its shares of the Company’s common stock by Quad-C may have the effect of depressing the price per share of our common stock because of the relatively low trading volume in our shares.
The recognition of impairment charges on goodwill or other intangible assets not subject to amortization would adversely impact our financial position and results of operations.
We are required to perform impairment tests on our goodwill and other intangible assets not subject to amortization annually or at any time when events occur which could affect the fair value of these assets. Our determination of whether an impairment has occurred is based on a comparison of the asset’s fair value with its book value. Several factors are considered when calculating fair value, some of which involve significant management estimates. Significant and unanticipated changes in circumstances, such as adverse changes in business climate, declining expectations of cash flows or operating results, adverse actions by regulators, unanticipated competition, or changes in technology or markets, could require an impairment in a future period that could substantially affect our reported earnings and reduce our consolidated net worth and shareholders’ equity.
We have anti-takeover provisions, any of which may discourage takeover attempts and could reduce the market price of our common stock.
Provisions of our Certificate of Incorporation and Bylaws and Delaware law could have the effect of discouraging takeover attempts which certain shareholders might deem to be in their interest. For example, our board of directors is divided into three classes and each class is elected for a three-year term. This provision could make it more difficult for our shareholders to remove members of our board of directors and may also make it more difficult for a third party to acquire us, even if the acquisition would be beneficial to shareholders.
| Item 1B. | Unresolved Staff Comments |
We do not have any unresolved staff comments.
23
The following table provides information relating to our principal operations facilities as of February 20, 2009.
| | | | | | |
Location | | Approximate
Square Footage | | Lease Expiration Date | | Use |
Phoenix, Arizona | | 71,550 | | April 1, 2010 | | Call center, with collections and legal collections |
| | | |
Deerfield Beach, Florida | | 10,753 | | May 31, 2010 | | Call center, with collections |
| | | |
Riverview, Florida(1) | | 52,280 | | May 31, 2016 | | Call center, with collections and legal collections |
| | | |
Chicago, Illinois | | 20,905 | | November 30, 2012 | | Call center, with collections and legal collections |
| | | |
Towson, Maryland | | 1,200 | | July 31, 2010 | | Legal collections |
| | | |
Warren, Michigan | | 200,000 | | May 31, 2016 | | Principal executive offices and call center, with collections and legal collections |
| | | |
Woodbury, New Jersey | | 288 | | Month-to-Month | | Legal collections |
| | | |
Brooklyn Heights, Ohio | | 30,443 | | October 31, 2011 | | Call center, with collections and legal collections |
| | | |
San Antonio, Texas | | 27,265 | | June 30, 2009 | | Call center, with collections and legal collections |
| | | |
Richmond, Virginia | | 1,374 | | July 31, 2011 | | Legal collections |
| (1) | On December 15, 2008, a second amendment to lease was signed for the Riverview, Florida location. This amendment will reduce the square footage leased to 40,390 square feet from the current 52,280 square feet on June 1, 2009. In addition, the expiration date of the lease was extended to May 31, 2016 from May 31, 2009. |
We believe that our existing facilities are sufficient to meet our current needs and that suitable additional or alternative space will be available on a commercially reasonable basis. Our $250.0 million credit agreement is secured by a first priority lien on all of our assets.
In the ordinary course of our business, we are involved in numerous legal proceedings. We regularly initiate collection lawsuits, using both our in-house attorneys and our network of third party law firms, against consumers and are occasionally countersued by them in such actions. Also, consumers initiate litigation against us, in which they allege that we have violated a federal or state law in the process of collecting on their account. It is not unusual for us to be named in a class action lawsuit relating to these allegations, with these lawsuits routinely settling for immaterial amounts. We do not believe that these ordinary course matters, individually or in the aggregate, are material to our business or financial condition. However, there can be no assurance that a class action lawsuit would not, if decided against us, have a material and adverse effect on our financial condition.
We are not a party to any material legal proceedings. However, we expect to continue to initiate collection lawsuits as a part of the ordinary course of our business (resulting occasionally in countersuits against us) and we may, from time to time, become a party to various other legal proceedings arising in the ordinary course of business.
24
| Item 4. | Submission of Matters to a Vote of Security Holders |
There were no matters submitted to a vote of our shareholders during the fourth quarter of 2008.
| Supplemental | Item. Executive Officers of the Company |
The following table sets forth information regarding our executive officers as of February 25, 2009.
| | | | |
Name | | Age | | Position |
Rion B. Needs | | 46 | | President and Chief Executive Officer |
Deborah L. Everly | | 36 | | Senior Vice President and Chief Acquisitions Officer |
Mark A. Redman | | 47 | | Senior Vice President, Chief Financial Officer, Assistant Secretary and Treasurer |
Phillip L. Allen | | 50 | | Vice President-Collections Operations |
Deanna S. Hatmaker | | 44 | | Vice President-Human Resources |
Edwin L. Herbert | | 58 | | Vice President-General Counsel and Secretary |
Darin B. Herring | | 40 | | Vice President-Legal Collections |
James Christopher Lee | | 40 | | Vice President-Strategy and Analysis |
Ambrish Sundaram | | 43 | | Vice President-Information Services |
Rion B. Needs, President and Chief Executive Officer—Mr. Needs joined our Company in July 2007 as Senior Vice President and Chief Operating Officer. He was promoted to President and Chief Executive Officer effective January 1, 2009. Mr. Needs held various positions at American Express since 1985, most recently as Senior Vice President and General Manager of Purchasing Services. Mr. Needs’ prior positions at American Express also included Senior Vice President of Global Finance Operations and Business Transformation, and Senior Vice President and General Manager of Corporate Travel.
Deborah L. Everly, Senior Vice President and Chief Acquisitions Officer—Ms. Everly has been in the accounts receivable management industry since 1991 and joined our Company in May 1995. Ms. Everly was named our Director of Marketing and Acquisitions in 1996 and promoted to Assistant Vice President in 1997. In 1998 she was promoted to Vice President-Marketing and Acquisitions and in 2007 she was promoted to Senior Vice President and Chief Acquisitions Officer.
Mark A. Redman, Senior Vice President and Chief Financial Officer, Assistant Secretary and Treasurer—Mr. Redman joined our Company in January 1998 as Vice President-Finance, Secretary and Treasurer. Mr. Redman was appointed as our Chief Financial Officer in May 2002. Prior to joining us, Mr. Redman worked in public accounting for 13 years, the last 11 years at BDO Seidman, LLP, Troy, Michigan, serving as a Partner in the firm from July 1996 to December 1997. Mr. Redman is a member of the American Institute of Certified Public Accountants and the Michigan Association of Certified Public Accountants.
Phillip L. Allen, Vice President–Collections Operations—Mr. Allen joined our Company as Vice President-Operations in October 1996. Prior to joining us, Mr. Allen held a variety of positions in the consumer credit industry including Household Finance and Household Retail Services from 1985 to 1991 and Winkelman’s Stores from 1992 to 1996.
Deanna S. Hatmaker, Vice President–Human Resources—Ms. Hatmaker joined our Company in January 2006 as Vice President-Human Resources. Ms. Hatmaker previously served as the Director and Human Resources Officer in the Michigan Administrative Information Services business unit at the University of Michigan, Ann Arbor, Michigan from 2003 to 2005. Ms. Hatmaker also served as Vice President—Human Resources and as a member of the senior management committee with H&R Block Financial Advisors, Detroit, Michigan. Ms. Hatmaker has been in the financial services industry for over 17 years.
25
Edwin L. Herbert, Vice President–General Counsel and Secretary—Mr. Herbert joined our Company in September 2006 as Vice President and General Counsel. Mr. Herbert previously served as an equity partner at Shumaker, Loop & Kendrick, LLP, in Toledo, Ohio, where he practiced law as a member of the firm’s financial institutions practice group from 2004 to 2006. Prior to joining Shumaker, Loop & Kendrick, LLP, Mr. Herbert practiced law with Werner & Blank, LLC, from 1998 to 2004, and was a partner with that firm beginning in January 2000. Mr. Herbert was Executive Vice President and General Counsel of ValliCorp Holdings, Inc., Fresno, California from 1994 to 1997, and Executive Vice President and General Counsel of CFX Corporation, Keene, New Hampshire from 1997 to 1998. Mr. Herbert is a member of the American Bar Association, and a member of the California, Michigan and Ohio bars.
Darin B. Herring, Vice President–Legal Collections—Mr. Herring joined our Company in April 2008 as Vice President-Legal Collections. Mr. Herring previously held various positions at American Express since 1988, most recently as Vice President, Global Commercial Card & Services. Mr. Herring’s prior positions at American Express also included; Vice President and Regional Leader—Global Reengineering/Six Sigma, and Director – Global Reengineering/Six Sigma. His background in other business units at American Express included consumer card operations, finance operations and strategic enablement services.
James Christopher Lee, Vice President–Strategy and Analysis—Mr. Lee joined our Company in January 2006 as Vice President-Strategy and Analysis. Mr. Lee joined us from Capital One where he was a Director with CRS, the former purchased debt division of Capital One. Mr. Lee has held a variety of marketing, product management and operations positions in the financial services industry for the past 15 years with Adhesion Technologies, First Union, Signet Bank and Andersen Consulting.
Ambrish Sundaram, Vice President–Information Services—Mr. Sundaram joined our Company in October 2007 as Vice President—Information Services. Mr. Sundaram joined us from Comerica Bank where he held the position of Vice President—Information Services from 2002 to 2007. His responsibilities included strategic technology planning and information technology services for international affiliates. Mr. Sundaram has over 20 years of experience in information technology management.
26
PART II
| Item 5. | Market for Registrant’s Common Equity, Related Stockholder Matters and Issuer Purchases of Equity Securities |
Our common stock is quoted on The NASDAQ Global Select Market under the symbol “AACC”. Public trading of our common stock commenced on February 5, 2004. The following table sets forth the high and low sales prices for our common stock, as reported by The NASDAQ Global Select Market, for the periods indicated.
| | | | | | | | | | | | |
| | | 2008 | | 2007 |
| | | High | | Low | | High | | Low |
Fourth Quarter | | $ | 11.60 | | $ | 4.27 | | $ | 12.34 | | $ | 9.45 |
Third Quarter | | | 13.38 | | | 8.15 | | | 17.98 | | | 8.49 |
Second Quarter | | | 14.65 | | | 9.80 | | | 19.25 | | | 15.20 |
First Quarter | | | 10.84 | | | 7.31 | | | 17.04 | | | 14.53 |
On February 20, 2009, the last reported sale price of our common stock on The NASDAQ Global Select Market was $3.80 per share. As of February 20, 2009, there were 60 record holders of our common stock.
During the second quarter of 2007, our Board of Directors declared a special one-time cash dividend of $2.45 per share, or $74.9 million in aggregate, which was paid on July 31, 2007, to holders of record on July 19, 2007. We have not paid regular dividends on our common stock. Our Board of Directors will determine whether to pay any dividends in the future. This determination may depend on a variety of factors that our Board of Directors considers relevant, including our financial condition, results of operations, contractual restrictions, capital requirements and business prospects. In addition, after December 31, 2008, our credit agreement limits the amount of dividends and other distributions that we may pay to shareholders to $25,000,000 plus 50% of Consolidated Net Income, as defined in the credit agreement, for the period after June 30, 2007 through the end of the current fiscal quarter, provided that we were able to borrow at least $15,000,000 under the credit agreement before and after the payment.
Company’s Repurchases of Its Common Stock
The following table provides information about the Company’s common stock repurchases during the fourth quarter of 2008.
| | | | | | | | | |
Period | | Total Number
of Shares
Purchased | | Average
Price
Paid per
Share | | Total Number of
Shares Purchased as Part
of Publicly Announced
Plans or Programs | | Maximum Number of
Shares that May Yet
Be Purchased Under
the Plans or Programs |
October 1, 2008 – October 31, 2008 | | — | | $ | — | | — | | — |
November 1, 2008 – November 30, 2008 | | — | | | — | | — | | — |
December 1, 2008 – December 31, 2008(1) | | 19,851 | | | 8.40 | | — | | — |
| | | | | | | | | |
Total | | 19,851 | | $ | 8.40 | | — | | |
| | | | | | | | | |
| (1) | The shares were withheld for tax obligations in connection with the vesting of restricted share units. The shares were withheld at the fair market value on the vesting date of the restricted share units. |
In addition, the information contained in the Equity Compensation table under “Item 12—Security Ownership of Certain Beneficial Owners and Management and Related Stockholder Matters” of this report is incorporated herein by reference.
We did not sell any equity securities during 2008 that were not registered under the Securities Act.
27
| Item 6. | Selected Financial Data |
The following selected consolidated financial data includes the results of operations of the following companies for the indicated periods:
| | • | | From January 1, 2003 to the Reorganization effected on February 4, 2004, AAC Investors, Inc., including its subsidiary, Asset Acceptance Holdings, LLC. |
| | • | | From February 5, 2004 through April 28, 2006, Asset Acceptance Capital Corp., including its wholly-owned subsidiaries, AAC Investors, Inc. and RBR Holding Corp., and its indirect wholly-owned subsidiary, Asset Acceptance Holdings, LLC and its subsidiaries (Asset Acceptance, LLC, Rx Acquisitions, LLC and Consumer Credit, LLC). |
| | • | | From April 29, 2006 through December 31, 2008, Asset Acceptance Capital Corp., including its wholly-owned subsidiaries, AAC Investors, Inc. and RBR Holding Corp., and its indirect wholly-owned subsidiary, Asset Acceptance Holdings, LLC and its subsidiaries (Asset Acceptance, LLC, Consumer Credit, LLC and PARC). |
The following selected consolidated statements of operations data for the years ended December 31, 2004, 2005, 2006, 2007 and 2008 and the related selected consolidated statements of financial position data as of December 31, 2004, 2005, 2006, 2007 and 2008 have been derived from our consolidated financial statements, which have been audited by Ernst & Young LLP (2004-2007) and Grant Thornton, LLP (2008), independent registered public accounting firms. The data should be read in connection with the consolidated financial statements, related notes and other information included herein.
On February 4, 2004, all of the shares of the capital stock of AAC Investors, Inc. and RBR Holding Corp., which held 60% and 40% ownership interests in Asset Acceptance Holdings, LLC, respectively, as of that date, were contributed to Asset Acceptance Capital Corp. in exchange for all of the shares of the common stock of Asset Acceptance Capital Corp. As a result of this Reorganization, Asset Acceptance Holdings, LLC and its subsidiaries became indirect wholly-owned subsidiaries of Asset Acceptance Capital Corp.
On April 28, 2006, the Company purchased 100% of the outstanding shares of PARC. As a result, the consolidated financial statements include the accounts of Asset Acceptance Capital Corp. consisting of direct and indirect subsidiaries AAC Investors, Inc., RBR Holding Corp., Asset Acceptance Holdings, LLC, Asset Acceptance, LLC, Rx Acquisitions, LLC, Consumer Credit, LLC and PARC (since the date of acquisition). For more detailed information about our corporate history and the Reorganization, see “Item 1. Business—History and Reorganization”.
28
| | | | | | | | | | | | | | | | | | | | |
| | | Years Ended December 31, | |
| | | 2008 | | | 2007 | | | 2006 | | | 2005 | | | 2004 | |
| | | (in thousands, except per share data) | |
STATEMENT OF OPERATIONS DATA: | | | | | | | | | | | | | | | | | | | | |
Revenues | | | | | | | | | | | | | | | | | | | | |
Purchased receivable revenues, net | | $ | 232,901 | | | $ | 245,692 | | | $ | 251,693 | | | $ | 252,196 | | | $ | 213,723 | |
Gain (loss) on sale of purchased receivables | | | 165 | | | | 840 | | | | 2,954 | | | | (26 | ) | | | 468 | |
Other revenues, net | | | 1,146 | | | | 1,466 | | | | 226 | | | | 514 | | | | 562 | |
| | | | | | | | | | | | | | | | | | | | |
Total revenues | | | 234,212 | | | | 247,998 | | | | 254,873 | | | | 252,684 | | | | 214,753 | |
| | | | | | | | | | | | | | | | | | | | |
Expenses | | | | | | | | | | | | | | | | | | | | |
Salaries and benefits | | | 82,840 | | | | 82,917 | | | | 82,274 | | | | 76,107 | | | | 111,034 | |
Collections expense | | | 89,967 | | | | 99,387 | | | | 79,367 | | | | 73,975 | | | | 56,949 | |
Occupancy | | | 7,727 | | | | 9,138 | | | | 8,967 | | | | 8,352 | | | | 6,109 | |
Administrative | | | 10,511 | | | | 10,529 | | | | 8,376 | | | | 8,582 | | | | 5,677 | |
Restructuring charges | | | — | | | | 906 | | | | — | | | | — | | | | — | |
Depreciation and amortization | | | 3,955 | | | | 4,275 | | | | 4,179 | | | | 3,339 | | | | 2,881 | |
Impairment of assets | | | 616 | | | | 267 | | | | — | | | | — | | | | — | |
Loss on disposal of equipment and other assets | | | 222 | | | | 137 | | | | 23 | | | | 32 | | | | 98 | |
| | | | | | | | | | | | | | | | | | | | |
Total operating expenses | | | 195,838 | | | | 207,556 | | | | 183,186 | | | | 170,387 | | | | 182,748 | |
| | | | | | | | | | | | | | | | | | | | |
Income from operations | | | 38,374 | | | | 40,442 | | | | 71,687 | | | | 82,297 | | | | 32,005 | |
Other income (expense) | | | | | | | | | | | | | | | | | | | | |
Interest income | | | 32 | | | | 471 | | | | 2,035 | | | | 1,143 | | | | 28 | |
Interest expense | | | (13,024 | ) | | | (8,146 | ) | | | (646 | ) | | | (567 | ) | | | (1,737 | ) |
Other | | | 22 | | | | 151 | | | | (12 | ) | | | 51 | | | | 84 | |
| | | | | | | | | | | | | | | | | | | | |
Income before income taxes | | | 25,404 | | | | 32,918 | | | | 73,064 | | | | 82,924 | | | | 30,380 | |
Income taxes(1) | | | 9,681 | | | | 12,512 | | | | 27,546 | | | | 31,657 | | | | 29,634 | |
| | | | | | | | | | | | | | | | | | | | |
Net income | | $ | 15,723 | | | $ | 20,406 | | | $ | 45,518 | | | $ | 51,267 | | | $ | 746 | (2) |
| | | | | | | | | | | | | | | | | | | | |
Net income per share basic | | $ | 0.51 | | | $ | 0.63 | | | $ | 1.24 | | | $ | 1.38 | | | $ | 0.02 | |
Net income per share diluted | | $ | 0.51 | | | $ | 0.63 | | | $ | 1.24 | | | $ | 1.38 | | | $ | 0.02 | |
Pro forma income taxes(3) | | $ | — | | | $ | — | | | $ | — | | | $ | — | | | $ | 11,301 | |
Pro forma net income(3) | | $ | — | | | $ | — | | | $ | — | | | $ | — | | | $ | 19,079 | |
Pro forma net income per share basic(4) | | $ | — | | | $ | — | | | $ | — | | | $ | — | | | $ | 0.52 | |
Pro forma net income per share diluted(4) | | $ | — | | | $ | — | | | $ | — | | | $ | — | | | $ | 0.52 | |
Weighted-average shares basic | | | 30,566 | | | | 32,517 | | | | 36,589 | | | | 37,225 | | | | 36,386 | |
Weighted-average shares diluted | | | 30,592 | | | | 32,604 | | | | 36,621 | | | | 37,270 | | | | 36,394 | |
Dividends per common share | | $ | — | | | $ | 2.45 | | | $ | — | | | $ | — | | | $ | — | |
| | | | | | | | | | | | | | | |
| | | As of December 31, |
| | | 2008 | | 2007 | | 2006 | | 2005 | | 2004 |
| | | (in thousands) |
FINANCIAL POSITION DATA: | | | | | | | | | | | | | | | |
Cash | | $ | 6,043 | | $ | 10,474 | | $ | 11,307 | | $ | 50,519 | | $ | 14,205 |
Purchased receivables, net | | | 361,809 | | | 346,199 | | | 300,841 | | | 248,991 | | | 216,480 |
Total assets | | | 408,171 | | | 395,409 | | | 350,583 | | | 323,942 | | | 252,506 |
Deferred tax liability, net | | | 64,470 | | | 60,165 | | | 60,632 | | | 58,584 | | | 41,247 |
Total debt, including capital lease obligations | | | 181,550 | | | 191,268 | | | 17,080 | | | 187 | | | 254 |
Total stockholders’ equity | | | 136,628 | | | 122,419 | | | 256,178 | | | 249,460 | | | 197,180 |
29
| | | | | | | | | | | | | | | | | | | | |
| | | Years Ended December 31, | |
| | | 2008 | | | 2007 | | | 2006 | | | 2005 | | | 2004 | |
| | | (in thousands, except percentages) | |
OPERATING AND OTHER FINANCIAL DATA: | | | | | | | | | | | | | | | | | | | | |
Cash collections for period | | $ | 369,578 | | | $ | 371,178 | | | $ | 340,870 | | | $ | 319,910 | | | $ | 267,928 | |
Operating expenses to cash collections | | | 53.0 | % | | | 55.9 | % | | | 53.7 | % | | | 53.3 | % | | | 68.2 | % |
Acquisitions of purchased receivables at cost(4) | | $ | 155,185 | | | $ | 169,547 | | | $ | 142,262 | (5) | | $ | 100,764 | | | $ | 86,543 | |
Acquisitions of purchased receivables at face value | | $ | 3,827,309 | | | $ | 5,202,541 | | | $ | 5,623,088 | (5) | | $ | 4,097,646 | | | $ | 4,328,038 | |
Acquisitions of purchased receivables cost as a percentage of face value | | | 4.05 | % | | | 3.26 | % | | | 2.53 | %(5) | | | 2.46 | % | | | 2.00 | % |
| (1) | Asset Acceptance Capital Corp. included income tax expense on only 60% of pretax income until February 4, 2004, as RBR Holding Corp. (40% owner of Asset Acceptance Holdings, LLC) was taxed as an S corporation under the Internal Revenue Code and, therefore, taxable income was included on the shareholders’ individual tax returns. Income tax expense in 2004 includes a deferred tax charge of $19.3 million resulting from RBR Holding Corp. losing its S corporation tax status after becoming a wholly-owned subsidiary of Asset Acceptance Capital Corp. during the first quarter of 2004. |
| (2) | Our net income for 2004 included the following one-time events: |
| | • | | the negative effect of a deferred tax charge of $19.3 million, or $0.53 per share, resulting from RBR Holding Corp. losing its S corporation status after becoming a wholly-owned subsidiary of Asset Acceptance Capital Corp. during the first quarter of 2004. See discussion in note (1) above; |
| | • | | the negative effect of a $45.7 million compensation and related payroll tax charge ($28.7 million net of taxes, or $0.79 per share) resulting from the vesting of the outstanding share appreciation rights upon our initial public offering during the first quarter of 2004; and |
| | • | | the positive effect related to our incurring income tax on only 60% of pretax income for the period January 1, 2004 through February 4, 2004, as RBR Holding Corp. (40% owner of Asset Acceptance Holdings, LLC) was taxed as an S corporation. Income taxes during the period February 5, 2004 through December 31, 2004 reflected income tax expense on 100% of pretax income as RBR Holding Corp. became a wholly-owned subsidiary of Asset Acceptance Capital Corp. The impact of the lower tax expense was approximately $0.9 million, or $0.03 per share. |
| (3) | For comparison purposes, we have presented pro forma net income, which is net income adjusted for pro forma income taxes assuming all entities had been a C corporation for all periods presented. |
| (4) | Amount of purchased receivables at cost refer to the cash paid to a seller to acquire a portfolio less the purchase price refunded by a seller due to the return of non-compliant accounts (also defined as buybacks) less the purchase price for accounts that were sold at the time of purchase to another debt purchaser. |
| (5) | Includes 62 portfolios from the acquisition of PARC on April 28, 2006 with a face value of $1.1 billion that were allocated a purchase price value of $8.3 million. |
30
| Item 7. | Management’s Discussion and Analysis of Financial Condition and Results of Operations |
You should read the following discussion and analysis in conjunction with our consolidated financial statements and the related notes included elsewhere in this Annual Report. This discussion contains forward-looking statements that involve risks, uncertainties and assumptions, such as statements of our plans, objectives, expectations and intentions. Our actual results may differ materially from those discussed here. Factors that could cause or contribute to the differences include those discussed in “Item 1A. Risk Factors”, as well as those discussed elsewhere in this Annual Report. The references in this Annual Report to the U.S. Federal Reserve Board are to the Federal Reserve Statistical Release, dated February 6, 2009 and the Federal Reserve Consumer Credit Historical Data website(www.federalreserve.gov/releases/g19/hist/). References to the Kaulkin Ginsberg report are to The Future of Receivables Management, dated September 2007. References to the Kaulkin Ginsberg Index for the fourth quarter of 2008 are to the press release dated January 12, 2009 (www.Kaulkin.com).
Company Overview
We have been purchasing and collecting defaulted or charged-off accounts receivable portfolios from consumer credit originators since the formation of our predecessor company in 1962. Charged-off receivables are the unpaid obligations of individuals to credit originators, such as credit card issuers, consumer finance companies, healthcare providers, retail merchants, telecommunications and utility providers. Since these receivables are delinquent or past due, we are able to purchase them at a substantial discount. We purchase and collect charged-off consumer receivable portfolios for our own account as we believe this afford us the best opportunity to use long-term strategies to maximize our profits.
Market prices for charged-off accounts receivable portfolios (“paper”) had steadily increased from 2002 through mid-2007. However, during the latter half of 2007 and continuing through 2008, the market prices for comparable paper declined. We believe macro-economic factors caused by the recent financial crisis have resulted in a reduced expectation of consumers’ ability to repay their current and past due debts. The lower expected liquidation of the paper by collection companies is the primary reason for the decline in market pricing. Macro-economic factors include reduced availability of credit, falling real estate values, higher food and energy prices, increased unemployment and other factors (“macro-economic factors”). In addition, we believe that some competitors’ ability to fund portfolio purchases has been reduced during the recent financial crisis. Finally, we believe that increases in charge-off rates being experienced by major credit grantors is leading to an increase in supply of receivables available for sale. Reduced competition and increased supply may have also contributed to improved pricing.
During the twelve months ended December 31, 2008, we invested $155.2 million (net of buybacks) in paper, with an aggregate face value of $3.8 billion, or 4.05% of face value. In the twelve months ended December 31, 2007, we invested $169.5 million (net of buybacks through December 31, 2008) in paper, with an aggregate face amount of $5.2 billion, or 3.26% of face value. Our debt purchasing metrics (dollars invested, face amount, average purchase price, types of paper and sources of paper) may vary significantly from period to period. The increase in blended rate was the result of the higher quality of paper we purchased during 2008 versus 2007. In 2008, an increasing portion of our investment in purchased receivables was from forward flow contracts. Forward flow contracts commit a debt seller to sell a steady flow of paper to us, and commit us to purchase paper for a fixed percentage of the face value. Due to the macro-economic factors, debt sellers and debt buyers alike believe that there will be continued downward pressure on the prices that are paid for paper. However, we believe debt sellers are attempting to lock in pricing when possible through forward flow contracts. For the twelve months ended December 31, 2008, we acquired $90.8 million (net of buybacks) under forward flow contracts compared to $24.2 million (net of buybacks through December 31, 2008) during the twelve months ended December 31, 2007. Forward flow contracts may be attractive to us because they provide operational advantages from the consistent amount and type of accounts acquired.
Cash collections declined slightly in 2008 when compared to 2007, despite continued investments in purchased receivables. Cash collections decreased by $1.6 million or 0.4% to $369.6 million for the twelve
31
months ended December 31, 2008 compared to $371.2 million for the twelve months ended December 31, 2007. We believe that the reduction in cash collections is primarily a result of two factors. First, a more difficult collection environment attributable to macro-economic factors is leading to reduced liquidation of all vintages and types of paper. We believe liquidation rates (cash collections relative to face amount of paper) declined throughout 2008. We expect this more difficult collections environment to continue and are adapting our collection tactics and operations to the current economic environment. Second, we believe our purchasing activity has outpaced our staffing of account representatives to collect on our inventory of paper, which may be leading to reduced collection results particularly on older vintages of paper. We are addressing what we believe to be a capacity constraint on collections by forwarding more accounts to our agency network for collection on our behalf. Over the long-term, we expect to increase our in-house staffing to better align the number of account representatives with our inventory of paper.
Net income for the twelve months ended December 31, 2008 was $15.7 million, a decline of 23.0% from $20.4 million for the twelve months ended December 31, 2007. Contributing to our decline in net income was higher amortization of purchased receivables (including net impairment charges) in determining purchased receivable revenues and increased interest expense that we incurred subsequent to the recapitalization transaction, which was funded in June 2007. Purchased receivable revenues declined by $12.8 million because of a combination of a $1.6 million decrease in cash collections and increased purchased receivable amortization of $11.2 million in 2008 when compared to 2007. Amortization of purchased receivables, the difference between cash collections and purchased receivable revenues, increased to 37.0% of cash collections for the twelve months ended December 31, 2008 versus 33.8% for the twelve months ended December 31, 2007. Included in amortization of purchased receivables were net impairments of $13.0 million and $24.4 million for the twelve months ended December 31, 2008 and 2007, respectively. The increased purchased receivables amortization rate was primarily a result of lower multiples of purchase price expected to be collected in addition to placing the first quarter of 2005 aggregate and all healthcare portfolios on the cost recovery method. As prices for paper rose through mid-2007, our expected collection multiple of purchase price was reduced from prior levels. Macro-economic factors negatively affecting consumers are also a factor in the lower multiples of purchase price expected to be collected, even as pricing for paper falls. The lower multiple of purchase price expected to be collected generally results in a lower yield to be assigned for revenue recognition purposes. When lower yields are assigned, a larger proportion of our cash collections are treated as purchased receivable amortization instead of purchased receivable revenues. Impairments are generated when currently assigned yields are too high in relation to collection expectations which may have declined because of macro-economic factors affecting the consumers’ ability to repay their obligations or for other reasons.
Average borrowings on our credit facilities were $177.7 million for the twelve months ended December 31, 2008, compared to $93.6 million for the twelve months ended December 31, 2007. The increased average borrowings are primarily the result of $150.0 million borrowed on our term loan, which was outstanding for all of 2008 versus approximately seven months in 2007. The term loan was initially funded in June 2007. Additionally, we have borrowed to fund our purchase of paper since late 2006. As a result of these two factors, interest expense increased by $4.9 million to $13.0 million in the twelve months ended December 31, 2008 compared to $8.1 million in the twelve months ended December 31, 2007.
We reduced our operating expenses both in absolute dollars and in relation to cash collections in 2008 versus 2007. Total operating expenses were $195.8 million for the twelve months ended December 31, 2008, a decrease of $11.8 million from $207.6 million in the twelve months ended December 31, 2007. As a percentage of cash collections, operating expenses were 53.0% and 55.9% for the twelve months ended December 31, 2008 and 2007, respectively. The majority of the decrease in operating expense was a result of reductions in collections expense, occupancy expense and restructuring charges of $9.4 million, $1.4 million and $0.9 million, respectively, as compared to December 31, 2007. Our collections from third party relationships (attorneys and collection agencies) increased to 30.9% of total cash collections for the twelve months ended December 31, 2008 from 26.8% for the twelve months ended December 31, 2007. Total forwarding fees paid on cash collections from these third party relationships increased to $34.9 million in the twelve months ended December 31, 2008
32
from $29.2 million in the twelve months ended December 31, 2007. The remaining expenses included in collections expense declined by $15.1 million in the twelve months ended December 31, 2008 and primarily reflected reduced legal collection costs. The reduction in legal collection costs included a $7.0 million savings in court costs associated with our legal forwarding collections as a result of a new third party relationship that allows us to better match these costs with the associated collections. The savings were partially offset by an increased contingency rate under this relationship, which resulted in an increase in forwarding fees paid of $1.7 million. The remaining savings were realized from a combination of reduced spending on in-house collection efforts, lower data provider costs and better expense management. Occupancy expenses declined by $1.4 million in the twelve months ended December 31, 2008 versus the twelve months ended December 31, 2007 resulting primarily from the consolidation of two call centers during 2007. There were no restructuring charges in 2008.
We adopted Statement of Financial Accounting Standards (“SFAS”) No. 157 as of January 1, 2008 as it applies to financial assets and liabilities. Adoption of SFAS 157 did not have a material impact on our consolidated statements of financial position, operations or cash flows. According to Financial Accounting Standards Board (“FASB”) Staff Position No. FAS 157-2, the application of SFAS 157 to certain non-financial assets and liabilities, including goodwill and other indefinite-lived intangible assets, was deferred to fiscal years beginning after November 15, 2008. Our goodwill and other intangible assets are tested for impairment on a recurring basis and the deferral of SFAS 157 applies to these items. We have chosen not to adopt SFAS No. 159, “Fair Value Option”.
Industry Overview
The accounts receivable management industry is driven by a number of industry and economic trends, including:
| | • | | Increasing levels of consumer debt obligations—According to the U.S. Federal Reserve Board, the consumer credit industry increased from $133.7 billion of consumer debt obligations in 1970 to $2.6 trillion of consumer debt obligations in December 2008, a compound annual growth rate of 8.09%. According to the U.S. Federal Reserve Board, the amount of outstanding revolving and non-revolving consumer credit has increased at a compound annual growth rate of 6.1% from $1.4 trillion in December 1998 to $2.6 trillion in December 2008. |
| | • | | Decreasing Pricing Environment—According to the Kaulkin Ginsberg report for the third quarter of 2007, beginning in the third quarter of 2007, pricing began to moderate from the elevated pricing levels exhibited in the debt purchasing markets in recent years. We believe that pricing has continued to moderate throughout 2008. According to the Kaulkin Ginsberg index for the fourth quarter of 2008, the charge-off rate increased in the fourth quarter of 2008, indicating a favorable supply environment for debt purchasers. |
| | • | | Impact of macro-economic factors—Macro-economic factors also affect consumer’s ability to satisfy outstanding debt. During 2008, financial markets began to experience extreme disruption. The residential real estate market in the United States has experienced a significant downturn due to declining real estate values, substantially reducing mortgage loan originations and securitizations and precipitating a significant contraction in liquidity and credit available to consumers. The unemployment rate and the number of individual bankruptcy filings have also increased in recent months, leaving individual consumers with less resources available to satisfy their debt and indicating a more challenging collection environment. |
Historically, credit originators have sought to limit credit losses either through using internal collection efforts with their own associates or outsourcing collection activities to third party collectors. Credit originators that outsource the collection of charged-off receivables have typically remained committed to third party providers as a result of the perceived economic benefit of outsourcing and the resources required to establish the infrastructure required to support in-house collection efforts. The credit originator can pursue an outsourced
33
solution by either selling its charged-off receivables for immediate cash proceeds or by placing charged-off receivables with a third party collector on a contingent fee basis while retaining ownership of the receivables.
In the event that a credit originator sells receivables to a debt purchaser such as us, the credit originator receives immediate cash proceeds and eliminates the costs and risks associated with internal recovery operations. The purchase price for these charged-off receivables are generally discounted more than 90% from their face values, depending on the amount the purchaser anticipates it can recover and the anticipated effort required to recover that amount. Credit originators, as well as other holders of consumer debt, utilize a variety of processes to sell receivables, including the following:
| | • | | competitive bids for specified portfolios through a sealed bid or, in some cases, an on-line process; |
| | • | | privately-negotiated transactions between the credit originator or other holder of consumer debt and a purchaser; and |
| | • | | forward flow contracts, which commit a debt seller to sell, and a purchaser to acquire, a steady flow of charged-off consumer receivables periodically over a specified period of time, usually no less than three months, for a fixed percentage of the face value of the receivables. |
We have seen prices for charged-off accounts receivable portfolios steadily decline since the second half of 2007. Deteriorating economic conditions, increasing unemployment rates, increasing charged-off volumes, and a decreased access to credit in the market are some of the reasons for the decline in pricing. We have seen bank consolidation, an increased desire by sellers of debt to enter into forward flows and a decrease in competition over the course of the past year. We believe a debt purchaser’s ability to successfully collect payments on charged-off receivables, despite previous collection efforts by the credit originator or third party collection agencies, is driven by several factors, including the purchaser’s ability to:
| | • | | pursue collections over multi-year periods; |
| | • | | tailor repayment plans based on a consumer’s ability to pay; and |
| | • | | utilize experience and resources, including litigation. |
34
Results of Operations
The following table sets forth selected statement of operations data expressed as a percentage of total revenues and as a percentage of cash collections for the periods indicated.
| | | | | | | | | | | | | | | | | | |
| | | Percent of Total Revenues | | | Percent of Cash Collections | |
| | | Years Ended December 31, | | | Years Ended December 31, | |
| | | 2008 | | | 2007 | | | 2006 | | | 2008 | | | 2007 | | | 2006 | |
Revenues | | | | | | | | | | | | | | | | | | |
Purchased receivable revenues | | 99.4 | % | | 99.1 | % | | 98.7 | % | | 63.0 | % | | 66.2 | % | | 73.8 | % |
Gain on sale of purchased receivables | | 0.1 | | | 0.3 | | | 1.2 | | | 0.1 | | | 0.2 | | | 0.9 | |
Other revenues | | 0.5 | | | 0.6 | | | 0.1 | | | 0.3 | | | 0.4 | | | 0.1 | |
| | | | | | | | | | | | | | | | | | |
Total revenues | | 100.0 | | | 100.0 | | | 100.0 | | | 63.4 | | | 66.8 | | | 74.8 | |
| | | | | | | | | | | | | | | | | | |
Expenses | | | | | | | | | | | | | | | | | | |
Salaries and benefits | | 35.4 | | | 33.4 | | | 32.3 | | | 22.4 | | | 22.3 | | | 24.1 | |
Collections expense | | 38.4 | | | 40.1 | | | 31.2 | | | 24.3 | | | 26.8 | | | 23.3 | |
Occupancy | | 3.3 | | | 3.7 | | | 3.5 | | | 2.1 | | | 2.5 | | | 2.6 | |
Administrative | | 4.5 | | | 4.2 | | | 3.3 | | | 2.8 | | | 2.8 | | | 2.5 | |
Restructuring charges | | 0.0 | | | 0.4 | | | 0.0 | | | 0.0 | | | 0.2 | | | 0.0 | |
Depreciation and amortization | | 1.7 | | | 1.7 | | | 1.6 | | | 1.1 | | | 1.2 | | | 1.2 | |
Impairment of assets | | 0.3 | | | 0.1 | | | 0.0 | | | 0.2 | | | 0.1 | | | 0.0 | |
Loss on disposal of equipment | | 0.1 | | | 0.1 | | | 0.0 | | | 0.1 | | | 0.0 | | | 0.0 | |
| | | | | | | | | | | | | | | | | | |
Total operating expense | | 83.7 | | | 83.7 | | | 71.9 | | | 53.0 | | | 55.9 | | | 53.7 | |
| | | | | | | | | | | | | | | | | | |
Income from operations | | 16.3 | | | 16.3 | | | 28.1 | | | 10.4 | | | 10.9 | | | 21.1 | |
Other income (expense) | | | | | | | | | | | | | | | | | | |
Interest income | | 0.0 | | | 0.2 | | | 0.8 | | | 0.0 | | | 0.1 | | | 0.6 | |
Interest expense | | (5.6 | ) | | (3.3 | ) | | (0.2 | ) | | (3.5 | ) | | (2.2 | ) | | (0.2 | ) |
Other | | 0.1 | | | 0.1 | | | (0.0 | ) | | 0.0 | | | 0.1 | | | (0.0 | ) |
| | | | | | | | | | | | | | | | | | |
Income before income taxes | | 10.8 | | | 13.3 | | | 28.7 | | | 6.9 | | | 8.9 | | | 21.5 | |
Income taxes | | 4.1 | | | 5.1 | | | 10.8 | | | 2.6 | | | 3.4 | | | 8.1 | |
| | | | | | | | | | | | | | | | | | |
Net income | | 6.7 | % | | 8.2 | % | | 17.9 | % | | 4.3 | % | | 5.5 | % | | 13.4 | % |
| | | | | | | | | | | | | | | | | | |
Year Ended December 31, 2008 Compared To Year Ended December 31, 2007
Revenue
Total revenues were $234.2 million for the year ended December 31, 2008, a decrease of $13.8 million, or 5.6%, from total revenues of $248.0 million for the year ended December 31, 2007. Purchased receivable revenues were $232.9 million for the year ended December 31, 2008, a decrease of $12.8 million, or 5.2%, from the year ended December 31, 2007 amount of $245.7 million. Purchased receivable revenues reflect an amortization rate, or the difference between cash collections and revenue, of 37.0% for the year ended December 31, 2008, an increase of 3.2 percentage points, from the amortization rate of 33.8% for the year ended December 31, 2007. The increased amortization rate is primarily due to lower average internal rates of return assigned to recent years’ purchases as well as placing the first quarter of 2005 aggregate and all healthcare portfolios on the cost recovery method. Purchased receivable revenues reflect net impairments recognized during the year ended December 31, 2008 and 2007 of $13.0 million and $24.4 million, respectively. Cash collections on charged-off consumer receivables decreased 0.4% to $369.6 million for the year ended December 31, 2008 from $371.2 million for the same period in 2007. Cash collections for the year ended December 31, 2008 and 2007 include collections from fully amortized portfolios of $78.6 million and $82.0 million, respectively, of which 100% were reported as revenue.
During the year ended December 31, 2008, we acquired charged-off consumer receivable portfolios with an aggregate face value of $3.8 billion at a cost of $155.2 million, or 4.05% of face value, net of buybacks. Included
35
in these purchase totals were 124 portfolios with an aggregate face value of $1.7 billion at a cost of $90.8 million, or 5.44% of face value, which were acquired through 14 forward flow contracts. Revenues on portfolios purchased from our top three sellers during vintage years 1997 through 2008 were $62.6 million and $70.1 million during the year ended December 31, 2008 and 2007, respectively. The top three sellers were the same in both of the twelve month periods. During the year ended December 31, 2007, we acquired charged-off consumer receivable portfolios with an aggregate face value of $5.2 billion at a cost of $169.5 million, or 3.26% of face value (adjusted for buybacks through December 31, 2008). Included in these purchase totals were 79 portfolios with an aggregate face value of $451.8 million at a cost of $24.2 million, or 5.36% of face value (adjusted for buybacks through December 31, 2008), which were acquired through nine forward flow contracts. From period to period, we may buy charged-off receivables of varying age, types and cost. As a result, the cost of our purchases, as a percent of face value, may fluctuate from one period to the next. We believe the increase in the blended rate we paid in 2008 of 4.05% versus the blended rate paid in 2007 of 3.26% was the result of purchasing higher quality portfolios of charged-off receivables in the current year. The higher blended rate paid in 2008 relative to 2007 did not reflect overall market prices, which were lower in 2008 than in 2007 for comparable portfolios.
Operating Expenses
Total operating expenses were $195.8 million for the year ended December 31, 2008, a decrease of $11.8 million, or 5.6%, compared to total operating expenses of $207.6 million for the year ended December 31, 2007. Total operating expenses were 53.0% of cash collections for the year ended December 31, 2008, compared with 55.9% for the same period in 2007. The majority of the decrease in operating expense is a result of reductions in collections expense, occupancy expense and restructuring charges of $9.4 million, $1.4 million and $0.9 million, respectively, as compared to December 31, 2007. Operating expenses are traditionally measured in relation to revenues. However, we measure operating expenses in relation to cash collections. We believe this is appropriate because of varying amortization rates, which is the difference between cash collections and revenues recognized, from period to period, due to the seasonality of collections and other factors that can distort the analysis of operating expenses when measured against revenues. Additionally, we believe that the majority of our operating expenses are variable in relation to cash collections.
Salaries and Benefits.Salaries and benefits expense was $82.8 million for the year ended December 31, 2008, a decrease of $0.1 million compared to salaries and benefits expense of $82.9 million for the year ended December 31, 2007. Salaries and benefits expense decreased primarily because of a $0.4 million decrease in compensation expense (other than share-based compensation expense) and a $0.2 million decrease in other associate related expenses. This decrease was partially offset by an increase of $0.5 million in share-based compensation expense. However, the decrease in cash collections was more than the decrease in salaries and benefits expense resulting in salaries and benefits expense of 22.4% of cash collections for the year ended December 31, 2008, compared with 22.3% for the same period in 2007.
Before 2007, we had granted share-based compensation to our non-associate directors and occasionally to certain key associates, generally for recruiting or retention reasons. During 2007, we began a program to issue periodic share-based awards to a broader group of key management associates including our executive officers. A portion of the share-based compensation grants to executive officers included the use of performance conditions for vesting. In 2008, we recognized $0.8 million of compensation expense in salaries and benefits expense, which included a reversal of $0.1 million for 2007 performance-based awards for executive officers not expected to vest. We did not make an annual grant of share-based compensation awards during 2008. In 2007, we recognized $0.3 million of compensation expense in salaries and benefits expense, which included a reversal of $0.1 million for a performance based award, related to the acquisition of PARC in 2006, not expected to vest. As of December 31, 2008, there was $2.8 million of total unrecognized compensation expense related to nonvested awards of which $1.7 million was expected to vest over a weighted average period of 2.46 years.
36
Collections Expense.Collections expense was $90.0 million for the year ended December 31, 2008, a decrease of $9.4 million, or 9.5%, compared to collections expense of $99.4 million for the year ended December 31, 2007. Collections expense was 24.3% of cash collections during the year ended December 31, 2008 compared with 26.8% for the same period in 2007. Collections expense decreased primarily due to a $15.1 million decline in variable costs associated with reduced spending on in-house collection efforts, lower data provider costs and better expense management. In addition, the reduction of variable expense included a $7.0 million savings in court costs associated with our legal forwarding collections as a result of a new third party relationship that allows us to better match these costs with the associated collections. The savings were partially offset by an increased contingency rate under this relationship which resulted in an increase in forwarding fees paid of $1.7 million. The remaining increase in forwarding fees, $4.0 million, is the result of an increase in collections from third party relationships (attorneys and collection agencies). Third party collections increased to 30.9% of total cash collections for the year ended December 31, 2008, from 26.8% for the year ended December 31, 2007.
Occupancy.Occupancy expense was $7.7 million for the year ended December 31, 2008, a decrease of $1.4 million, or 15.4%, compared to occupancy expense of $9.1 million for the year ended December 31, 2007. Occupancy expense was 2.1% of cash collections for the year ended December 31, 2008 compared with 2.5% for the same period in 2007. Occupancy expense decreased primarily due to the consolidation of two call centers during 2007.
Administrative.Administrative expenses were $10.5 million for the years ended December 31, 2008 and December 31, 2007. Administrative expenses remained consistent at 2.8% of cash collections during 2008 and 2007, respectively. Administrative expenses for the year ended December 31, 2008 include increased fees for outside advisors and consultants. Administrative expenses for the year ended December 31, 2007 include $0.5 million in share-based compensation expense for our non-associate directors relating to an amendment to our 2004 stock incentive plan to add an anti-dilution provision.
Restructuring Charges.There were no restructuring charges in 2008. Restructuring charges were $0.9 million for the year ended December 31, 2007 as a result of the sale of our White Marsh, Maryland office and for closing the Wixom, Michigan offices during 2007. Expenses were primarily related to associate one-time termination benefits, contract termination costs for the remaining lease payments on the Wixom, Michigan office and other exit costs, which were partially offset by $0.3 million proceeds received from the sale of the tangible assets located in the White Marsh, Maryland office.
Depreciation and Amortization.Depreciation and amortization expense was $4.0 million for the year ended December 31, 2008, a decrease of $0.3 million or 7.5% compared to depreciation and amortization expense of $4.3 million for the year ended December 31, 2007. Depreciation and amortization expense was 1.1% of cash collections during the year ended December 31, 2008 compared with 1.2% for the same period in 2007.
Impairment of Assets.Impairment of assets was $0.6 million for the year ended December 31, 2008, an increase of $0.3 million compared to impairment of assets of $0.3 million for the year ended December 31, 2007. During the first quarter of 2008, we decided to no longer service the medical receivables on a contingent fee basis. As a result, we recognized an impairment charge of $0.4 million related to the net carrying value of intangible assets for customer contracts and relationships associated with the contingent collection business. In addition, an impairment charge of $0.2 million that had been invested in a new software product was recognized in the fourth quarter of 2008 related to the decision to discontinue the implementation of this product. In 2007, an associate was released from his non-compete and employment agreements, resulting in a $0.3 million impairment charge for the remaining balance of his non-compete agreement.
Interest Income.Interest income was less than $0.1 million for the year ended December 31, 2008, a decrease of $0.4 million compared to $0.5 million for the year ended December 31, 2007. Interest income is expected to be nominal over the next 12 months.
37
Interest Expense.Interest expense was $13.0 million for the year ended December 31, 2008, an increase of $4.9 million compared to interest expense of $8.1 million for the year ended December 31, 2007. Interest expense was 3.5% of cash collections during the year ended December 31, 2008 compared with 2.2% for the same period in 2007. The increase in interest expense was due to increased average borrowings during the year ended December 31, 2008 compared to the same period in 2007. Average borrowings during the year ended December 31, 2008 reflect borrowings under our $150.0 million term loan facility that was funded on June 12, 2007 to finance our modified “Dutch auction” tender offer and special one-time cash dividend. Interest expense also includes the amortization of deferred financing costs of $0.6 million for both of the years ended December 31, 2008 and 2007, respectively.
In September 2007, we entered into an amortizing interest rate swap agreement whereby, on a quarterly basis, we swap variable rates, equal to three-month LIBOR, for fixed rates of approximately 7.5%. The notional amount of the swap was $125 million until September 2008 when the notional amount declined to $100.0 million of the outstanding balance on our term loan. This interest rate swap is designated and qualifies as a cash flow hedge and the effective portion of the gain or loss on such hedge is reported as a component of other comprehensive income in the consolidated financial statements. To the extent that the hedging relationship is not effective, the ineffective portion of the change in fair value of the derivative is recorded in earnings. For the years ended December 31, 2008 and 2007, the ineffective portion of the change in fair value of the derivative recorded in earnings was not material.
Income Taxes. Income tax expense of $9.7 million reflects a federal tax rate of 35.0% and a state tax rate of 3.1% (net of federal tax benefit) for the year ended December 31, 2008. For the year ended December 31, 2007, income tax expense was $12.5 million and reflected a federal tax rate of 35.0% and state tax rate of 3.0% (net of federal tax benefit). Income tax expense decreased $2.8 million, or 22.6% from income tax expense of $12.5 million for the year ended December 31, 2007. The decrease in tax expense was due to a decrease in pre-tax financial statement income, which was $25.4 million for the year ended December 31, 2008, compared to $32.9 million for 2007.
Year Ended December 31, 2007 Compared To Year Ended December 31, 2006
Revenue
Total revenues were $248.0 million for the year ended December 31, 2007, a decrease of $6.9 million, or 2.7%, from total revenues of $254.9 million for the year ended December 31, 2006. Purchased receivable revenues were $245.7 million for the year ended December 31, 2007, a decrease of $6.0 million, or 2.4%, from the year ended December 31, 2006 amount of $251.7 million. Purchased receivable revenues reflect an amortization rate, or the difference between cash collections and revenue, of 33.8% for the year ended December 31, 2007, an increase of 7.6 percentage points, from the amortization rate of 26.2% for the year ended December 31, 2006. The increased amortization rate is partially attributable to net impairments of $24.4 million, an increase of $6.5 million, from net impairments of $17.9 million during the years ended December 31, 2007 and 2006, respectively. The increased amortization rate is also due to lower average internal rates of return assigned to recent years’ purchases. In addition, total revenues reflect a recognized gain on sale of purchased receivables during the year ended December 31, 2007 of $0.8 million compared to a $3.0 million gain during the year ended December 31, 2006. Cash collections on charged-off consumer receivables increased 8.9% to $371.2 million for the year ended December 31, 2007 from $340.9 million for the same period in 2006. Cash collections for the years ended December 31, 2007 and 2006 include collections from fully amortized portfolios of $82.4 million and $66.1 million, respectively, of which 100% were reported as revenue.
During the year ended December 31, 2007, we acquired charged-off consumer receivables portfolios with an aggregate face value of $5.2 billion at a cost of $169.5 million, or 3.26% of face value (adjusted for buybacks through 2008). Included in these purchase totals were 79 portfolios with an aggregate face value of $451.8 million at a cost of $24.2 million, or 5.36% of face value (adjusted for buybacks through December 31, 2008),
38
which were acquired through nine forward flow contracts. Revenues on portfolios purchased from our top three sellers during vintage years 1997 through 2007 were $70.1 million and $63.4 million for the years ended December 31, 2007 and 2006, respectively. During the year ended December 31, 2006, we acquired charged-off consumer receivables portfolios with an aggregate face value of $5.6 billion at a cost of $142.3 million, or 2.53% of face value (adjusted for buybacks through 2008). Additionally, the Company acquired portfolios as a result of the acquisition of PARC on April 28, 2006 that were allocated a purchase price value of $8.3 million. Included in these purchase totals were 28 portfolios with an aggregate face value of $101.6 million at a cost of $3.1 million, or 3.05% of face value (adjusted for buybacks through 2008), which were acquired through four forward contracts. Included in the 2006 totals are portfolios acquired as a result of the acquisition of PARC on April 28, 2006 that were allocated a purchase price value of $8.3 million. From period to period, we may buy paper of varying age, type and cost. As a result, the costs of our purchases, as a percent of face value, may fluctuate from one period to the next.
Operating Expenses
Total operating expenses were $207.6 million for the year ended December 31, 2007, an increase of $24.4 million, or 13.3%, compared to total operating expenses of $183.2 million for the year ended December 31, 2006. Total operating expenses were 55.9% of cash collections for the year ended December 31, 2007, compared with 53.7% for the same period in 2006. The increase as a percent of cash collections was primarily due to an increase in collections expense. Operating expenses are traditionally measured in relation to revenues. However, we measure operating expenses in relation to cash collections. We believe this is appropriate because of varying amortization rates, which is the difference between cash collections and revenues recognized, from period to period, due to seasonality of collections and other factors that can distort the analysis of operating expenses when measured against revenues. Additionally, we believe that the majority of operating expenses are variable in relation to cash collections.
Salaries and Benefits. Salaries and benefits expense was $82.9 million for the year ended December 31, 2007, an increase of $0.6 million, or 0.8%, compared to salaries and benefits expense of $82.3 million for the year ended December 31, 2006. Salaries and benefits expense was 22.3% of cash collections during 2007 compared with 24.1%, for the same period in 2006. Salaries and benefits expense decreased as a percentage of cash collections primarily due to a decrease in average overall associate headcount and increased productivity per full-time equivalent associate, which is partially offset by increased incentive compensation associated with the increased productivity for the twelve months ended December 31, 2007 compared to the same period in 2006.
We adopted FAS 123(R) on January 1, 2006. Adoption did not have a material impact to our consolidated financial statements. Since going public in 2004, we had only granted share-based compensation awards to our non-associate directors and occasionally to certain key associates generally for recruiting or retention reasons. During 2007, we began a program to issue periodic share-based compensation awards to a broader group of key management associates including our executive officers. A portion of the equity grants to executive officers included the use of performance conditions for vesting. We recognized $0.3 million and $0.1 million in salaries and benefits expense for the year ended December 31, 2007 and 2006, respectively, as it related to stock-based compensation awards granted to associates. As of December 31, 2007, there was $4.3 million of total unrecognized compensation expense related to nonvested awards of which $3.0 million was expected to vest over a weighted average period of 3.37 years. As of December 31, 2006, there was $0.7 million total unrecognized compensation expense related to nonvested awards of which $0.3 million was expected to vest over a weighted average period of 4.08 years.
Collections Expense. Collections expense increased to $99.4 million for the year ended December 31, 2007, reflecting an increase of $20.0 million, or 25.2%, over collections expense of $79.4 million for the year ended December 31, 2006. Collections expense was 26.8% of cash collections during 2007 compared with 23.3% for the same period in 2006. Collections expense increased as a percentage of cash collections primarily due to an increase in court costs, contingent fees paid to third parties collecting on our behalf, letter and mailing costs, telephone and information acquisition expenses. An increase of $8.5 million in court costs and third party
39
collection expenses were primarily due to changes in our collection strategies as well as an increase in the number of accounts for which legal and forwarding activities have been initiated. An increase of $4.8 million in contingent fees paid is due to higher contingent collections. An increase of $1.6 million in telephone was primarily due to changes in collection strategies. An increase of $1.8 million in letters and mailing and information acquisition is primarily due to the increased number of accounts as a result of purchasing in late 2006 and during 2007. During 2007, we instituted an expanded and accelerated legal collection strategy. This strategy has placed an increased emphasis on the legal collections channel earlier in the collection process. Court costs have increased as more suits are filed under this strategy.
Occupancy. Occupancy expense was $9.1 million for the year ended December 31, 2007, an increase of $0.1 million, or 1.9%, over occupancy expense of $9.0 million for the year ended December 31, 2006. Occupancy expense was 2.5% of cash collections during 2007 compared with 2.6% for the same period in 2006. During 2007 we closed our White Marsh, MD and Wixom, MI offices.
Administrative. Administrative expenses increased to $10.5 million for the year ended December 31, 2007, from $8.4 million for the year ended December 31, 2006, reflecting a $2.2 million, or 25.7%, increase. Administrative expenses were 2.8% of cash collections during 2007 compared with 2.5% for the same period in 2006. Administrative expenses were a higher percentage of cash collections in 2007 primarily due to the one-time property tax reversal for the year ended December 31, 2006. During 2006, we determined that we would not be paying a previously probable accrual of property taxes for $1.0 million and therefore we reversed the related expense.
Restructuring Charges.Restructuring charges were $0.9 million for the year ended December 31, 2007 as a result of the sale of our White Marsh, Maryland office and for closing the Wixom, Michigan office during 2007. Expenses were primarily related to associate one-time termination benefits, contract termination costs for the remaining lease payments on the Wixom, Michigan office and other exit costs, which were partially offset by $0.3 million proceeds received from the sale of the tangible assets located in the White Marsh, Maryland office.
Depreciation and Amortization.Depreciation and amortization expense was $4.3 million for the year ended December 31, 2007, an increase of $0.1 million or 2.3% over depreciation and amortization expense of $4.2 million for the year ended December 31, 2006. Depreciation and amortization expense was 1.2% of cash collections during 2007 compared with 1.2% for the same period in 2006.
Impairment of assets. Impairment of assets was $0.3 million for the year ended December 31, 2007 as one associate was released from his non-compete and employment agreements during the year. As a result, we recognized an impairment charge for the remaining balance of his non-compete agreement at December 31, 2007. There was no impairment of assets for the year ended December 31, 2006.
Interest Income.Interest income was $0.5 million during 2007, reflecting a decrease of $1.5 million compared to $2.0 million interest income for the year ended December 31, 2006. Interest income was 0.1% as a percentage of cash collections during 2007 compared with 0.6% for the same period in 2006. Interest income decreased as a percentage of cash collections primarily due to lower cash balances compared to the prior year.
Interest Expense. Interest expense during 2007 was $8.1 million reflecting an increase of $7.5 million compared to $0.6 million for the year ended December 31, 2006. The increase in interest expense was due to increased average borrowings during the twelve months ended December 31, 2007 compared to the same period in 2006. Average borrowings for the year ended December 31, 2007 reflect the borrowings under our $150.0 million term loan facility to finance our recapitalization and special one-time cash dividend. Interest expense also includes the amortization of capitalized bank fees of $0.6 million and $0.2 million for the years ended December 31, 2007 and 2006, respectively. Included in the amortization of the capitalized bank fees for the year ended December 31, 2007 is $0.3 million relating to our former credit agreement that was terminated on June 12, 2007, which includes $0.2 million to write-off of deferred financing fees associated with the extinguished former credit agreement.
40
In September 2007, we entered into an amortizing interest rate swap agreement whereby, on a quarterly basis, we swap variable rates, equal to three-month LIBOR, for fixed rates, on the notional amount of $125 million outstanding on our term loan facility. This interest rate swap is designated and qualifies as a cash flow hedge and the effective portion of the gain or loss on such hedge is reported as a component of other comprehensive income in the consolidated financial statements. To the extent that the hedging relationship is not effective, the ineffective portion of the change in fair value of the derivative is recorded in earnings. For the year ended December 31, 2007, the ineffective portion of the change in fair value of the derivative recorded in earnings was not material. We had no derivative instruments as of December 31, 2006.
Income Taxes. Income taxes of $12.5 million reflect a federal tax rate of 35.0% and a state tax rate of 3.0% (net of federal tax benefit) for the year ended December 31, 2007. For the year ended December 31, 2006, the federal tax rate was 35.3% and the state tax rate was 2.4% (net of federal tax benefit). The 0.6% increase in the state rate was due to changes in state laws. Income tax expense decreased $15.0 million, or 54.6% from income tax expense of $27.5 million for the year ended December 31, 2006. The decrease in income tax expense was due to a decrease in pre-tax financial statement income, which was $32.9 million for the year ended December 31, 2007 compared to $73.1 million for the same period in 2006.
41
Supplemental Performance Data
Portfolio Performance
The following table summarizes our historical portfolio purchase price and cash collections on an annual vintage basis from January 1, 2003 through December 31, 2008.
| | | | | | | | | | | | | | | | | |
Purchase Period | | Number of
Portfolios(4) | | Purchase
Price(1,4) | | Cash Collections | | Estimated
Remaining
Collections(2,3) | | Total
Estimated
Collections | | Total Estimated
Collections as a
Percentage of
Purchase Price | |
| | | (dollars in thousands) | |
2003 | | 76 | | $ | 87,150 | | $ | 401,055 | | $ | 37,824 | | $ | 438,879 | | 504 | % |
2004 | | 106 | | | 86,543 | | | 234,761 | | | 54,684 | | | 289,445 | | 334 | |
2005 | | 104 | | | 100,764 | | | 170,188 | | | 60,080 | | | 230,268 | | 229 | |
2006 | | 154 | | | 142,262 | | | 214,233 | | | 181,920 | | | 396,153 | | 278 | |
2007 | | 158 | | | 169,547 | | | 129,452 | | | 244,842 | | | 374,294 | | 221 | |
2008 | | 164 | | | 155,185 | | | 41,957 | | | 317,444 | | | 359,401 | | 232 | |
| | | | | | | | | | | | | | | | | |
Total | | 762 | | $ | 741,451 | | $ | 1,191,646 | | $ | 896,794 | | $ | 2,088,440 | | 282 | % |
| | | | | | | | | | | | | | | | | |
| (1) | Purchase price refers to the cash paid to a seller to acquire a portfolio less the purchase price refunded by a seller due to the return of non-compliant accounts (also defined as buybacks) less the purchase price for accounts that were sold at the time of purchase to another debt purchaser. |
| (2) | Estimated remaining collections are based on historical cash collections. Please refer to forward-looking statements within Item 1A. Risk Factors on page 15 and Critical Accounting policies on page 49 for further information regarding these estimates. |
| (3) | Estimated remaining collections refers to the sum of all future projected cash collections on our owned portfolios using up to an 84 month collection forecast from the date of purchase. Estimated remaining collections for pools on a cost recovery method for revenue recognition purposes are equal to the carrying value. There are no estimated remaining collections for pools on a cost recovery method that are fully amortized. |
| (4) | Includes 62 portfolios from the acquisition of PARC on April 28, 2006 that were allocated a purchase price value of $8.3 million. |
The following table summarizes the remaining unamortized balances of our purchased receivables portfolios by year of purchase as of December 31, 2008.
| | | | | | | | | | | | |
Purchase Period | | Unamortized
Balance as of
December 31, 2008 | | Purchase
Price(1) | | Unamortized
Balance as a
Percentage of
Purchase Price | | | Unamortized
Balance as a
Percentage of
Total | |
| | | (dollars in thousands) | |
2003 | | $ | 6,433 | | $ | 87,150 | | 7.4 | % | | 1.8 | % |
2004 | | | 21,990 | | | 86,543 | | 25.4 | | | 6.1 | |
2005 | | | 29,741 | | | 100,764 | | 29.5 | | | 8.2 | |
2006(2) | | | 66,838 | | | 142,262 | | 47.0 | | | 18.4 | |
2007 | | | 103,026 | | | 169,547 | | 60.8 | | | 28.5 | |
2008 | | | 133,781 | | | 155,185 | | 86.2 | | | 37.0 | |
| | | | | | | | | | | | |
Total | | $ | 361,809 | | $ | 741,451 | | 48.8 | % | | 100.0 | % |
| | | | | | | | | | | | |
| (1) | Purchase price refers to the cash paid to a seller to acquire a portfolio less the buybacks less the purchase price for accounts that were sold at the time of purchase to another debt purchaser. |
| (2) | Includes portfolios acquired from the acquisition of PARC on April 28, 2006 for $8.3 million. |
42
The following table summarizes the purchased receivable revenues and amortization rates by year of purchase for the twelve months ended December 31, 2008, 2007 and 2006, respectively.
| | | | | | | | | | | | | | | | | | | |
| | | Twelve months ended December 31, 2008 |
Year of Purchase | | Collections | | Revenue | | Amortization
Rate(1) | | | Monthly
Yield(2) | | | Net
Impairments | | | Zero Basis
Collections |
2003 and prior | | $ | 86,570,398 | | $ | 80,343,561 | | N/M | % | | N/M | % | | $ | (1,575,800 | ) | | $ | 66,525,760 |
2004 | | | 32,275,692 | | | 22,173,829 | | 31.3 | | | 6.93 | | | | 4,582,964 | | | | 3,707,110 |
2005 | | | 35,638,117 | | | 14,871,669 | | 58.3 | | | 3.13 | | | | 4,698,986 | | | | 80,738 |
2006 | | | 79,953,394 | | | 50,894,934 | | 36.3 | | | 5.30 | | | | 4,627,497 | | | | 7,493,922 |
2007 | | | 93,183,368 | | | 44,063,847 | | 52.7 | | | 2.88 | | | | 688,813 | | | | 715,897 |
2008 | | | 41,957,161 | | | 20,552,942 | | 51.0 | | | 2.68 | | | | 18,276 | | | | 101,294 |
| | | | | | | | | | | | | | | | | | | |
Totals | | $ | 369,578,130 | | $ | 232,900,782 | | 37.0 | | | 5.60 | | | $ | 13,040,736 | | | $ | 78,624,721 |
| | | | | | | | | | | | | | | | | | | |
| | | | | | | | | | | | | | | | | | |
| | | Twelve months ended December 31, 2007 |
Year of Purchase | | Collections | | Revenue | | Amortization
Rate(1) | | | Monthly
Yield(2) | | | Net
Impairments | | Zero Basis
Collections |
2002 and prior | | $ | 76,116,507 | | $ | 66,025,915 | | N/M | % | | N/M | % | | $ | 162,500 | | $ | 58,044,676 |
2003 | | | 58,359,295 | | | 40,038,019 | | 31.4 | | | 16.78 | | | | 1,535,000 | | | 14,016,641 |
2004 | | | 48,093,005 | | | 29,760,455 | | 38.1 | | | 6.09 | | | | 8,259,700 | | | 3,179,675 |
2005 | | | 50,811,376 | | | 23,481,703 | | 53.8 | | | 3.00 | | | | 13,803,000 | | | 68,282 |
2006 | | | 101,529,155 | | | 67,517,073 | | 33.5 | | | 4.95 | | | | 633,300 | | | 6,726,167 |
2007 | | | 36,269,125 | | | 18,868,574 | | 48.0 | | | 2.43 | | | | — | | | — |
| | | | | | | | | | | | | | | | | | |
Totals | | $ | 371,178,463 | | $ | 245,691,739 | | 33.8 | | | 6.60 | | | $ | 24,393,500 | | $ | 82,035,441 |
| | | | | | | | | | | | | | | | | | |
| | | | | | | | | | | | | | | | | | |
| | | Twelve months ended December 31, 2006 |
Year of Purchase | | Collections | | Revenue | | Amortization
Rate(1) | | | Monthly
Yield(2) | | | Net
Impairments | | Zero Basis
Collections |
2001 and prior | | $ | 50,369,055 | | $ | 45,192,983 | | N/M | % | | N/M | % | | $ | 343,109 | | $ | 41,527,877 |
2002 | | | 55,373,282 | | | 39,264,992 | | 29.1 | | | 16.17 | | | | 1,686,300 | | | 11,750,797 |
2003 | | | 79,422,730 | | | 56,551,448 | | 28.8 | | | 11.67 | | | | 6,507,800 | | | 10,294,884 |
2004 | | | 62,673,029 | | | 46,406,190 | | 26.0 | | | 6.62 | | | | 2,258,900 | | | 2,410,837 |
2005 | | | 60,280,372 | | | 43,653,705 | | 27.6 | | | 4.22 | | | | 6,431,700 | | | 79,648 |
2006 | | | 32,751,278 | | | 20,623,895 | | 37.0 | | | 3.79 | | | | 664,000 | | | — |
| | | | | | | | | | | | | | | | | | |
Totals | | $ | 340,869,746 | | $ | 251,693,213 | | 26.2 | | | 8.30 | | | $ | 17,891,809 | | $ | 66,064,043 |
| | | | | | | | | | | | | | | | | | |
| (1) | The calculated percentage for aggregated vintage years is not meaningful. |
| (2) | The monthly yield is the weighted-average yield determined by dividing purchased receivable revenues recognized in the period by the average of the beginning monthly carrying values of the purchased receivables for the period presented. |
43
Account Representative Productivity
We measure traditional call center account representative tenure by two major categories, those with less than one year of experience and those with one or more years of experience. The following table displays our results.
Account Representatives by Experience
| | | | | | |
| | | For the Year Ended
December 31, |
| | | 2008 | | 2007(3) | | 2006(3,4) |
Number of account representatives: | | | | | | |
One year or more(1) | | 515 | | 558 | | 604 |
Less than one year(2) | | 437 | | 356 | | 404 |
| | | | | | |
Total account representatives | | 952 | | 914 | | 1,008 |
| | | | | | |
| (1) | Based on number of average traditional call center Full Time Equivalent (“FTE”) account representatives and supervisors with one or more years of service. |
| (2) | Based on number of average traditional call center FTE account representatives and supervisors with less than one year of service, including new associates in training. |
| (3) | Certain associates have been reclassified to make the prior year disclosures comparable to 2008. |
| (4) | Excludes PARC’s FTE account representatives for periods prior to January 1, 2007. |
The following table displays our account representative productivity.
Overall Account Representative Collection Averages
| | | | | | | | | |
| | | For the Year Ended
December 31, |
| | | 2008 | | 2007(1) | | 2006(1,2) |
Overall collection averages | | $ | 173,209 | | $ | 193,000 | | $ | 161,965 |
| (1) | The overall collection average has been restated to make the prior year disclosures comparable to 2008. |
| (2) | Excludes PARC’s FTE account representatives for periods prior to January 1, 2007. |
44
Cash Collections
The following tables provide further detailed vintage collection analysis on an annual and a cumulative basis.
Historical Collections(1)
| | | | | | | | | | | | | | | | | | | | | | | | | | | | | | | | | | | | | | | | | | | |
Purchase Period | | Purchase
Price(3) | | Year Ended December 31, | |
| | | 1999 | | | 2000 | | | 2001 | | | 2002 | | | 2003 | | | 2004 | | | 2005 | | | 2006 | | | 2007 | | | 2008 | |
| | | (dollars in thousands) | |
Pre-1999 | | | | | $ | 25,286 | | | $ | 23,779 | | | $ | 19,132 | | | $ | 15,565 | | | $ | 11,377 | | | $ | 8,391 | | | $ | 7,265 | | | $ | 5,360 | | | $ | 4,205 | | | $ | 3,043 | |
1999 | | $ | 12,924 | | | 3,761 | | | | 11,331 | | | | 10,862 | | | | 9,750 | | | | 8,278 | | | | 6,675 | | | | 5,022 | | | | 3,935 | | | | 2,949 | | | | 1,982 | |
2000 | | | 20,592 | | | — | | | | 8,896 | | | | 23,444 | | | | 22,559 | | | | 20,318 | | | | 17,196 | | | | 14,062 | | | | 10,603 | | | | 7,410 | | | | 5,258 | |
2001 | | | 43,030 | | | — | | | | — | | | | 17,630 | | | | 50,327 | | | | 50,967 | | | | 45,713 | | | | 39,865 | | | | 30,472 | | | | 21,714 | | | | 13,351 | |
2002 | | | 72,255 | | | — | | | | — | | | | — | | | | 22,339 | | | | 70,813 | | | | 72,024 | | | | 67,649 | | | | 55,373 | | | | 39,839 | | | | 24,529 | |
2003 | | | 87,150 | | | — | | | | — | | | | — | | | | — | | | | 36,067 | | | | 94,564 | | | | 94,234 | | | | 79,423 | | | | 58,359 | | | | 38,408 | |
2004 | | | 86,543 | | | — | | | | — | | | | — | | | | — | | | | — | | | | 23,365 | | | | 68,354 | | | | 62,673 | | | | 48,093 | | | | 32,276 | |
2005 | | | 100,764 | | | — | | | | — | | | | — | | | | — | | | | — | | | | — | | | | 23,459 | | | | 60,280 | | | | 50,811 | | | | 35,638 | |
2006(2) | | | 142,262 | | | — | | | | — | | | | — | | | | — | | | | — | | | | — | | | | — | | | | 32,751 | | | | 101,529 | | | | 79,953 | |
2007 | | | 169,547 | | | — | | | | — | | | | — | | | | — | | | | — | | | | — | | | | — | | | | — | | | | 36,269 | | | | 93,183 | |
2008 | | | 155,185 | | | — | | | | — | | | | — | | | | — | | | | — | | | | — | | | | — | | | | — | | | | — | | | | 41,957 | |
| | | | | | | | | | | | | | | | | | | | | | | | | | | | | | | | | | | | | | | | | | | |
Total | | | | | $ | 29,047 | | | $ | 44,006 | | | $ | 71,068 | | | $ | 120,540 | | | $ | 197,820 | | | $ | 267,928 | | | $ | 319,910 | | | $ | 340,870 | | | $ | 371,178 | | | $ | 369,578 | |
| | | | | | | | | | | | | | | | | | | | | | | | | | | | | | | | | | | | | | | | | | | |
|
| Cumulative Collections(1) | |
Purchase Period | | Purchase
Price(3) | | Total Through December 31, | |
| | | 1999 | | | 2000 | | | 2001 | | | 2002 | | | 2003 | | | 2004 | | | 2005 | | | 2006 | | | 2007 | | | 2008 | |
| | | (dollars in thousands) | |
1999 | | $ | 12,924 | | $ | 3,761 | | | $ | 15,092 | | | $ | 25,954 | | | $ | 35,704 | | | $ | 43,982 | | | $ | 50,657 | | | $ | 55,679 | | | $ | 59,614 | | | $ | 62,563 | | | $ | 64,545 | |
2000 | | | 20,592 | | | — | | | | 8,896 | | | | 32,340 | | | | 54,899 | | | | 75,217 | | | | 92,413 | | | | 106,475 | | | | 117,078 | | | | 124,488 | | | | 129,746 | |
2001 | | | 43,030 | | | — | | | | — | | | | 17,630 | | | | 67,957 | | | | 118,924 | | | | 164,637 | | | | 204,502 | | | | 234,974 | | | | 256,688 | | | | 270,039 | |
2002 | | | 72,255 | | | — | | | | — | | | | — | | | | 22,339 | | | | 93,152 | | | | 165,176 | | | | 232,825 | | | | 288,198 | | | | 328,037 | | | | 352,566 | |
2003 | | | 87,150 | | | — | | | | — | | | | — | | | | — | | | | 36,067 | | | | 130,631 | | | | 224,865 | | | | 304,288 | | | | 362,647 | | | | 401,055 | |
2004 | | | 86,543 | | | — | | | | — | | | | — | | | | — | | | | — | | | | 23,365 | | | | 91,719 | | | | 154,392 | | | | 202,485 | | | | 234,761 | |
2005 | | | 100,764 | | | — | | | | — | | | | — | | | | — | | | | — | | | | — | | | | 23,459 | | | | 83,739 | | | | 134,550 | | | | 170,188 | |
2006(2) | | | 142,262 | | | — | | | | — | | | | — | | | | — | | | | — | | | | — | | | | — | | | | 32,751 | | | | 134,280 | | | | 214,233 | |
2007 | | | 169,547 | | | — | | | | — | | | | — | | | | — | | | | — | | | | — | | | | — | | | | — | | | | 36,269 | | | | 129,452 | |
2008 | | | 155,185 | | | — | | | | — | | | | — | | | | — | | | | — | | | | — | | | | — | | | | — | | | | — | | | | 41,957 | |
|
| Cumulative Collections as Percentage of Purchase Price(1) | |
Purchase Period | | Purchase
Price(3) | | Total Through December 31, | |
| | | 1999 | | | 2000 | | | 2001 | | | 2002 | | | 2003 | | | 2004 | | | 2005 | | | 2006 | | | 2007 | | | 2008 | |
1999 | | $ | 12,924 | | | 29 | % | | | 117 | % | | | 201 | % | | | 276 | % | | | 340 | % | | | 392 | % | | | 431 | % | | | 461 | % | | | 484 | % | | | 499 | % |
2000 | | | 20,592 | | | — | | | | 43 | | | | 157 | | | | 267 | | | | 365 | | | | 449 | | | | 517 | | | | 569 | | | | 605 | | | | 630 | |
2001 | | | 43,030 | | | — | | | | — | | | | 41 | | | | 158 | | | | 276 | | | | 383 | | | | 475 | | | | 546 | | | | 597 | | | | 628 | |
2002 | | | 72,255 | | | — | | | | — | | | | — | | | | 31 | | | | 129 | | | | 229 | | | | 322 | | | | 399 | | | | 454 | | | | 488 | |
2003 | | | 87,150 | | | — | | | | — | | | | — | | | | — | | | | 41 | | | | 150 | | | | 258 | | | | 349 | | | | 416 | | | | 460 | |
2004 | | | 86,543 | | | — | | | | — | | | | — | | | | — | | | | — | | | | 27 | | | | 106 | | | | 178 | | | | 234 | | | | 271 | |
2005 | | | 100,764 | | | — | | | | — | | | | — | | | | — | | | | — | | | | — | | | | 23 | | | | 83 | | | | 134 | | | | 169 | |
2006(2) | | | 142,262 | | | — | | | | — | | | | — | | | | — | | | | — | | | | — | | | | — | | | | 23 | | | | 94 | | | | 151 | |
2007 | | | 169,547 | | | — | | | | — | | | | — | | | | — | | | | — | | | | — | | | | — | | | | — | | | | 21 | | | | 76 | |
2008 | | | 155,185 | | | — | | | | — | | | | — | | | | — | | | | — | | | | — | | | | — | | | | — | | | | — | | | | 27 | |
| (1) | Does not include proceeds from sales of any receivables. |
| (2) | Includes $8.3 million of portfolios acquired from the acquisition of PARC on April 28, 2006. |
| (3) | Purchase price refers to the cash paid to a seller to acquire a portfolio less buybacks less the purchase price for accounts that were sold at the time of purchase to another debt purchaser. |
45
Seasonality
The success of our business depends on our ability to collect on our purchased portfolios of charged-off consumer receivables. Collections within portfolios tend to be seasonally higher in the first and second quarters of the year due to consumers’ receipt of tax refunds and other factors. Conversely, collections within portfolios tend to be lower in the third and fourth quarters of the year due to consumers’ spending in connection with summer vacations, the holiday season and other factors. However, revenue recognized is relatively level, excluding the impact of impairments, due to the application of the provisions prescribed by SOP 03-3. In addition, our operating results may be affected to a lesser extent by the timing of purchases of charged-off consumer receivables due to the initial costs associated with purchasing and integrating these receivables into our system. Consequently, income and margins may fluctuate from quarter to quarter.
Below is a table that illustrates our quarterly cash collections from January 1, 2004 through December 31, 2008:
Cash Collections
| | | | | | | | | | | | | | | |
Quarter | | 2008 | | 2007 | | 2006 | | 2005 | | 2004 |
First | | $ | 100,264,281 | | $ | 95,853,350 | | $ | 89,389,858 | | $ | 80,397,640 | | $ | 65,196,055 |
Second | | | 95,192,743 | | | 95,432,021 | | | 89,609,982 | | | 84,862,856 | | | 67,566,031 |
Third | | | 90,775,528 | | | 90,748,442 | | | 80,914,791 | | | 78,159,364 | | | 66,825,822 |
Fourth | | | 83,345,578 | | | 89,144,650 | | | 80,955,115 | | | 76,490,350 | | | 68,339,797 |
| | | | | | | | | | | | | | | |
Total cash collections | | $ | 369,578,130 | | $ | 371,178,463 | | $ | 340,869,746 | | $ | 319,910,210 | | $ | 267,927,705 |
| | | | | | | | | | | | | | | |
Below is a table that illustrates the percentages by source of our total cash collections:
| | | | | | | | | | | | | | | | | | | | | | | | | | | | | | |
| | | For the year ended December 31, | |
| | | 2008 | | | 2007(1) | | | 2006(1) | | | 2005(1) | | | 2004(1) | |
| | | $ | | % | | | $ | | % | | | $ | | % | | | $ | | % | | | $ | | % | |
Traditional collections | | $ | 163,207,248 | | 44.1 | % | | $ | 172,899,013 | | 46.6 | % | | $ | 167,037,599 | | 49.0 | % | | $ | 168,237,859 | | 52.6 | % | | $ | 153,416,150 | | 57.2 | % |
Legal collections | | | 151,077,999 | | 40.9 | | | | 147,993,920 | | 39.9 | | | | 134,009,973 | | 39.3 | | | | 114,685,727 | | 35.8 | | | | 82,995,594 | | 31.0 | |
Other collections | | | 55,292,883 | | 15.0 | | | | 50,285,530 | | 13.5 | | | | 39,822,174 | | 11.7 | | | | 36,986,624 | | 11.6 | | | | 31,515,961 | | 11.8 | |
| | | | | | | | | | | | | | | | | | | | | | | | | | | | | | |
Total cash collections | | $ | 369,578,130 | | 100.0 | % | | $ | 371,178,463 | | 100.0 | % | | $ | 340,869,746 | | 100.0 | % | | $ | 319,910,210 | | 100.0 | % | | $ | 267,927,705 | | 100.0 | % |
| | | | | | | | | | | | | | | | | | | | | | | | | | | | | | |
| (1) | Certain cash collections have been reclassified to make the 2004 through 2007 disclosures comparable to the 2008 disclosures. |
Liquidity and Capital Resources
Historically, our primary sources of cash have been from operations and bank borrowings. We have traditionally used cash for acquisitions of purchased receivables, repayment of bank borrowings, purchasing property and equipment and working capital to support growth. During 2008, we had repayments of $137.7 million to reduce our outstanding borrowing balances while having $128.0 million in new borrowings. In addition, we entered into a new agreement with a third party collecting on our behalf. Under this agreement, we will receive a total cash advance of $7.0 million through November 2009. We received $4.5 million through December 31, 2008 and incurred $7.0 million in court cost expenses, which were offset against the cash advance. An asset of $2.5 million for the court costs incurred in excess of the cash advance received is included in other assets in the consolidated statements of financial position.
46
Borrowings
We maintain a credit agreement with JPMorgan Chase Bank, N.A., as administrative agent, and a syndicate of lenders named therein, that originated on June 5, 2007 and was amended on March 10, 2008 (the “Amended New Credit Agreement”). Under the terms of the Amended New Credit Agreement, we have a five-year $100.0 million revolving credit facility (the “Revolving Credit Facility”) and a six-year $150.0 million term loan facility (the “Term Loan Facility” and together with the Revolving Credit Facility, the “Amended New Credit Facilities”). The Amended New Credit Facilities bear interest at prime or up to 125 basis points over prime depending upon our liquidity, as defined in the Amended New Credit Agreement. Alternately, at our discretion, we may borrow by entering into one, two, three, six or twelve-month LIBOR contracts at rates between 150 to 250 basis points over the respective LIBOR rates, depending on our liquidity. Our Revolving Credit Facility includes an accordion loan feature that allows us to request a $25.0 million increase as well as sublimits for $10.0 million of letters of credit and for $10.0 million of swingline loans. The Amended New Credit Agreement is secured by a first priority lien on all of our assets. The Amended New Credit Agreement also contains certain covenants and restrictions that we must comply with, which as of December 31, 2008 were:
| | • | | Leverage Ratio (as defined) cannot exceed (i) 1.25 to 1.0 at any time on or before June 29, 2009, (ii) 1.125 to 1.0 at any time on or after June 30, 2009 and on or before December 31, 2010 or (iii) 1.0 to 1.0 at any time thereafter; |
| | • | | Ratio of Consolidated Total Liabilities to Consolidated Tangible Net Worth cannot exceed (i) 2.5 to 1.0 at any time on or before December 30, 2009, (ii) 2.25 to 1.0 at any time on or after December 31, 2009 and on or before December 30, 2010, (iii) 2.0 to 1.0 at any time on or after December 31, 2010 and on or before December 30, 2011 or (iv) 1.5 to 1.0 to any time thereafter; and |
| | • | | Consolidated Tangible Net Worth must equal or exceed $80.0 million plus 50% of positive consolidated net income for three consecutive fiscal quarters ending December 31, 2007 and for each fiscal year ending thereafter, such amount to be added as of December 31, 2007 and as of the end of each such fiscal year thereafter. |
The Amended New Credit Agreement contains a provision that requires us to repay Excess Cash Flow, as defined, to reduce the indebtedness outstanding under our Amended New Credit Agreement. The annual repayment of our Excess Cash Flow is first effective with the issuance of our audited consolidated financial statements for fiscal year 2008 and is generally due within 10 days of the issuance of the annual financial statements. The repayment provisions are:
| | • | | 50% of the Excess Cash Flow for such fiscal year if the Leverage Ratio was greater than 1.0 to 1.0 as of the end of such fiscal year; |
| | • | | 25% of the Excess Cash Flow for such fiscal year if the Leverage Ratio was less than or equal to 1.0 to 1.0 but greater than 0.875 to 1.0 as of the end of such fiscal year; or |
| | • | | 0% if the Leverage Ratio is less than or equal to 0.875 to 1.0 as of the end of such fiscal year. |
Commitment fees on the unused portion of the Revolving Credit Facility are paid quarterly, in arrears, and are calculated as an amount equal to a margin of 0.25% to 0.50%, depending on our liquidity, on the average amount available on the Revolving Credit Facility.
The Amended New Credit Agreement requires us to effectively cap, collar or exchange interest rates on a notional amount of at least 25% of the outstanding principal amount of the Term Loan Facility. We have an interest rate swap agreement that hedges a portion of the interest rate expense on the Term Loan Facility.
We had $181.6 million principal balance outstanding on our Amended New Credit Facilities at December 31, 2008. We have a required prepayment, under the Excess Cash Flow provision of the Amended New Credit Agreement, of $2.4 million of principal on our Term Loan Facility for 2008. This prepayment is related to the Excess Cash Flow for the twelve months ended December 31, 2008. We believe we are in compliance with all terms of the Amended New Credit Agreement as of December 31, 2008.
47
Cash Flows
The majority of our purchases have been funded with borrowings against our Revolving Credit Facility and with internal cash flow. For the year ended December 31, 2008, we invested $152.3 million in purchased receivables, net of buybacks, while having a net repayment of $9.7 million on our Amended New Credit Facilities. The net repayment on our Amended New Credit Facilities included $137.7 million of repayments partially offset by $128.0 million of borrowings against our Revolving Credit Facility. Our cash balance has decreased from $10.5 million at December 31, 2007 to $6.0 million as of December 31, 2008.
Our operating activities provided cash of $39.7 million, $51.2 million and $65.8 million for the years ended December 31, 2008, 2007 and 2006, respectively. Cash provided by operating activities for the years ended December 31, 2008, 2007 and 2006 were generated primarily from net income earned through cash collections as adjusted for the timing of payments in income taxes, accounts payable and accrued liabilities as of December 31, 2008, 2007 and 2006, respectively, compared to the previous year.
Investing activities used cash of $33.6 million, $70.3 million and $77.3 million for the years ended December 31, 2008, 2007 and 2006, respectively. Cash used for investing purposes was primarily due to acquisitions of purchased receivables, net of cash collections applied to principal, which is net of buybacks for all vintage years. In addition, we acquired $5.7 million in property and equipment, primarily software and computer equipment related to the new collection platform during 2008. In 2006 we used $14.7 million to acquire PARC, net of cash acquired.
Financing activities used cash of $10.5 million for the year ended December 31, 2008. Financing activities provided cash of $18.3 million for the year ended December 31, 2007 and used cash of $27.7 million for the year ended December 31, 2006. Cash used by financing activities for the year ended December 31, 2008 was primarily due to repayments on our Revolving Credit Facility and Term Loan Facility of $137.7 million net of borrowings under the Revolving Credit Facility of $128.0 million. In addition, cash used by financing activities for the year ended December 31, 2008 was due to payment of deferred financing costs of $0.7 million associated with the Amended New Credit Agreement. Cash provided by financing activities in 2007 was primarily due to borrowings of $263.0 million under our Amended New Credit Facilities and former credit agreement to fund the recapitalization transactions and investments in purchased receivables. The cash provided by financing activities in 2007 was partially offset by $88.8 million repayment on our former credit agreement, Amended New Credit Facilities and capital lease obligations as well as payments of $75.0 million for our repurchase of 4.0 million shares in accordance with the recapitalization plan. Furthermore, our Board of Directors declared a special one-time cash dividend of $2.45 per share, or $74.9 million in aggregate, which was paid on July 31, 2007 to holders of record on July 19, 2007. Also in 2007, we exercised our right to buy shares from our former associates for $15.00 per share, or $2.0 million. Cash used by financing activities in 2006 was primarily due to the $40.2 million repurchase of 2.5 million shares in accordance with a stock repurchase program, as well as the $4.4 million repayment of PARC’s loan balances on the date of acquisition. Cash provided by financing activities in 2006 was due to $17.0 million of borrowings against our former credit agreement to fund the investment in purchased receivables.
We believe that cash generated from operations combined with borrowing available under our Amended New Credit Facilities, will be sufficient to fund our operations for the next twelve months, although no assurance can be given in this regard. In the future, if we need additional capital for investment in purchased receivables, working capital or to grow our business or acquire other businesses, we may seek to sell additional equity or debt securities or we may seek to increase the availability under our Revolving Credit Facility.
48
Future Contractual Cash Obligations
The following table summarizes our future contractual cash obligations as of December 31, 2008:
| | | | | | | | | | | | | | | | | | |
| | | Year Ending December 31, | | |
| | | 2009 | | 2010 | | 2011 | | 2012 | | 2013 | | Thereafter |
Operating lease obligations | | | 5,551,916 | | | 4,611,233 | | | 4,321,372 | | | 4,020,146 | | | 3,642,407 | | | 8,995,391 |
Purchase commitment(1) | | | 924,000 | | | — | | | — | | | — | | | — | | | — |
Purchased receivables(2) | | | 46,332,000 | | | — | | | — | | | — | | | — | | | — |
Revolving credit(3) | | | — | | | — | | | — | | | 33,800,000 | | | — | | | — |
Term loan(4) | | | 3,927,486 | | | 1,500,000 | | | 1,500,000 | | | 1,500,000 | | | 139,322,514 | | | — |
Contractual interest on derivative instruments | | | 4,696,927 | | | 3,444,413 | | | 2,198,781 | | | 946,268 | | | — | | | — |
| | | | | | | | | | | | | | | | | | |
Total(5) | | $ | 61,432,329 | | $ | 9,555,646 | | $ | 8,020,153 | | $ | 40,266,414 | | $ | 142,964,921 | | $ | 8,995,391 |
| | | | | | | | | | | | | | | | | | |
| (1) | In 2007, we signed an agreement with a software provider and initiated a project to install a new collection platform. We have a contractual commitment to purchase $0.9 million in additional software. In addition, we expect to spend approximately $1.5 million over the next year to fully implement this software. Costs will be capitalized in accordance with the guidance in SOP 98-1 “Accounting for the Costs of Computer Software Developed or Obtained for Internal Use”. This project is funded with cash from operations and borrowings on our Revolving Credit Facility. |
| (2) | We have six forward flow contracts that have terms beyond December 31, 2008 with the last contract expiring in December 2009. In addition to the six forward flow contracts, we have two on-going forward flow contracts that have estimated monthly purchases of approximately $15,500. |
| (3) | To the extent that a balance is outstanding on our Revolving Credit Facility, it would be due in June 2012 or earlier as defined in the Amended New Credit Agreement. Interest on our Revolving Credit Facility is variable and is not included within the amount outstanding as of December 31, 2008. |
| (4) | To the extent that a balance is outstanding on our Term Loan Facility, it would be due in June 2013. The variable interest is not included within the amount outstanding as of December 31, 2008. In addition, we are required to prepay $2.4 million of principal on our Term Loan Facility in the first quarter of 2009. This prepayment is related to the Excess Cash Flow for the twelve months ended December 31, 2008, as defined in our Amended New Credit Amendment. |
| (5) | We have recorded a liability of $0.9 million relating to uncertain tax positions, which has been excluded from the table above because the amount and fiscal year of the payment cannot be reliably estimated. |
Off-Balance Sheet Arrangements
We currently do not have any off-balance sheet arrangements.
Critical Accounting Policies
Revenue Recognition
We utilize the interest method of accounting for our purchased receivables because we believe that the amounts and timing of cash collections for our purchased receivables can be reasonably estimated. This belief is predicated on our historical results and our knowledge of the industry. The interest method is prescribed by SOP 03-3.
We adopted the provisions of SOP 03-3 in January 2005 and apply SOP 03-3 to purchased receivables acquired after December 31, 2004. The provisions of SOP 03-3 that relate to decreases in expected cash flows amend previously followed guidance, PB 6, for consistent treatment and apply prospectively to purchased receivables acquired before January 1, 2005. We purchase pools of homogenous accounts receivable and record
49
each pool at its acquisition cost. Pools purchased after 2004 may be aggregated into one or more static pools within each quarter, based on common risk characteristics. Risk characteristics of purchased receivables are assumed to be similar since purchased receivables are usually in the late stages of the post charged-off collection cycle. We therefore aggregate most pools purchased within each quarter. Pools purchased before 2005 may not be aggregated with other pool purchases. Each static pool, either aggregated or non-aggregated, retains its own identity and does not change over the remainder of its life. Each static pool is accounted for as a single unit for recognition of revenue, principal payments and impairments.
Each static pool of receivables is statistically modeled to determine its projected cash flows based on historical cash collections for pools with similar characteristics. An internal rate of return (“IRR”) is calculated for each static pool of receivables based on the projected cash flows. The IRR is applied to the remaining balance of each static pool of accounts to determine the revenue recognized. Each static pool is analyzed at least quarterly to assess the actual performance compared to the expected performance. To the extent there are differences in actual performance versus expected performance, the IRR is adjusted prospectively to reflect the revised estimate of cash flows over the remaining life of the static pool. Effective January 2005, under SOP 03-3, if the revised cash flow estimates are less than the original estimates, the IRR remains unchanged and an impairment is recognized. If cash flow estimates increase subsequent to recording an impairment, reversal of the previously recognized impairment is made prior to any increases to the IRR.
The cost recovery method prescribed by SOP 03-3 is used when collections on a particular portfolio cannot be reasonably predicted. Under the cost recovery method, no revenue is recognized until we have fully collected the cost of the portfolio.
Application of the interest method of accounting requires the use of estimates, primarily estimated remaining collections, to calculate a projected IRR for each pool. These estimates are primarily based on historical cash collections. If future cash collections are materially different in amount or timing than the remaining collections estimate, earnings could be affected, either positively or negatively. Higher collection amounts or cash collections that occur sooner than projected will have a favorable impact on yields and revenues. Lower collection amounts or cash collections that occur later than projected will have an unfavorable impact and may result in an impairment being recorded.
Goodwill and Intangible Assets not Subject to Amortization
We periodically review the carrying value of intangible assets not subject to amortization, including goodwill, to determine whether impairment may exist. SFAS No. 142, “Goodwill and Other Intangible Assets”, requires that goodwill and certain intangible assets not subject to amortization be assessed annually for impairment using fair value measurement techniques.
Specifically, goodwill impairment is determined using a two-step test. The first step of the goodwill impairment test is used to identify potential impairment by comparing the fair value of a reporting unit with its book value, including goodwill. If the fair value of the reporting unit exceeds its book value, goodwill is considered not impaired and the second step of the impairment test is unnecessary. If the book value of the reporting unit exceeds its fair value, the second step of the goodwill impairment test is performed to measure the amount of impairment loss, if any. The second step of the goodwill impairment test compares the implied fair value of the reporting unit’s goodwill with the book value of that goodwill. If the book value of the reporting unit’s goodwill exceeds the implied fair value of that goodwill, an impairment loss is recognized in an amount equal to that excess. The implied fair value of goodwill is determined in the same manner as the amount of goodwill recognized in a business combination. That is, the fair value of the reporting unit is allocated to all of the assets and liabilities of that unit as if the reporting unit had been acquired in a business combination and the fair value of the reporting unit was the purchase price paid to acquire the reporting unit.
The estimate of fair value of our reporting unit, our purchased receivables operating segment is determined using various valuation techniques including market capitalization and an analysis of discounted cash flows. At
50
the time of the annual goodwill impairment test in the fourth quarter of 2008, market capitalization was substantially higher than book value and goodwill was considered not to be impaired. Given recent declines in our stock price, we also performed a discounted cash flow analysis. A discounted cash flow analysis requires us to make various judgmental assumptions including assumptions about future cash flows, growth rates, and discount rates. We base assumptions about future cash flows and growth rates on our budget and long-term plans. Discount rate assumptions are based on an assessment of the risk inherent in the reporting unit. The fair value of goodwill using a discounted cash flow analysis also exceeded the book value as of December 31, 2008; therefore, we did not recognize an impairment of goodwill.
The annual impairment test for other intangible assets not subject to amortization, for example, trademark and trade names, consists of a comparison of the fair value of the intangible asset with its carrying value. If the carrying value of the intangible asset exceeds its fair value, an impairment loss is recognized in an amount equal to that excess. The estimates of fair value of intangible assets not subject to amortization are determined using various discounted cash flow valuation methodologies. Significant assumptions are inherent in this process, including estimates of discount rates. Discount rate assumptions are based on an assessment of the risk inherent in the respective intangible assets. We performed a discounted cash flow analysis of our trademark and trade names as of December 31, 2008 and determined that no impairment charges were required.
Income Taxes
We record a tax provision for the anticipated tax consequences of the reported results of operations. In accordance with SFAS No. 109, “Accounting for Income Taxes,” (“SFAS 109”) the provision for income taxes is computed using the asset and liability method, under which deferred tax assets and liabilities are recognized for the expected future tax consequences of temporary differences between the financial reporting and tax basis of assets and liabilities, and for operating losses and tax credit carry-forwards. Deferred tax assets and liabilities are measured using the currently enacted tax rates that apply to taxable income in effect for the years in which those tax assets are expected to be realized or settled.
We believe it is more likely than not that forecasted income, including income that may be generated as a result of certain tax planning strategies, together with the tax effects of the deferred tax liabilities, will be sufficient to fully recover the remaining deferred tax assets. In the event that all or part of the deferred tax assets are determined not to be realizable in the future, a valuation allowance would be established and charged to earnings in the period such determination is made. Similarly, if we subsequently realize deferred tax assets that were previously determined to be unrealizable, the respective valuation allowance would be reversed, resulting in a positive adjustment to earnings or a decrease in goodwill in the period such determination is made. In addition, the calculation of tax liabilities involves significant judgment in estimating the impact of uncertainties in the application of complex tax laws. Resolution of these uncertainties in a manner inconsistent with our expectations could have a material impact on our results of operations and financial position.
FASB Interpretation No. 48, “Accounting for Uncertainty in Income Taxes—an interpretation of SFAS No. 109” (“FIN 48”), clarifies the accounting for uncertainty in income taxes recognized in an enterprise’s financial statements in accordance with SFAS 109. FIN 48 prescribes a recognition threshold and measurement attribute for the financial statement recognition and measurement of a tax position taken or expected to be taken in a tax return. FIN 48 also provides guidance on derecognition, classification, interest and penalties, accounting in interim periods, disclosure and transition. We adopted the provisions of FIN 48 on January 1, 2007.
Recently Issued Accounting Pronouncements
SFAS No. 141 (R), “Business Combinations” and SFAS No. 160, “Noncontrolling Interests in Consolidated Financial Statements, an amendment of ARB No. 51”
In December 2007, the FASB issued SFAS No. 141(R), “Business Combinations”, (“SFAS 141(R)”), and SFAS No. 160, “Noncontrolling Interests in Consolidated Financial Statements, an amendment of ARB No. 51”,
51
(“SFAS 160”). These pronouncements are required to be adopted concurrently and are effective for business combination transactions for which the acquisition date is on or after the beginning of the first annual reporting period beginning on or after December 15, 2008. Early adoption is prohibited, thus the provisions of these pronouncements will be effective for us in fiscal year 2009. The adoption of SFAS 141(R) is not expected to have a material impact on our consolidated statements of financial position, operations or cash flows at this time.
SFAS 161, “Disclosures about Derivative Instruments and Hedging Activities”
In March 2008, the FASB issued SFAS 161, “Disclosures about Derivative Instruments and Hedging Activities” (“SFAS 161”). SFAS 161 requires expanded disclosures regarding the location and amounts of derivative instruments in an entity’s financial statements, how derivative instruments and related hedged items are accounted for under SFAS 133, “Accounting for Derivative Instruments and Hedging Activities”, and how derivative instruments and related hedged items affect an entity’s financial position, operating results and cash flows. SFAS 161 is effective for periods beginning on or after November 15, 2008. The adoption of SFAS 161 is not expected to have a material impact on our consolidated statements of financial position, operations or cash flows.
FASB Staff Position 142-3 “Determination of the Useful Life of Intangible Assets”
In April 2008, the FASB issued Staff Position (“FSP”) 142-3, “Determination of the Useful Life of Intangible Assets”, (“FSP 142-3”). FSP 142-3 amends the factors that should be considered in developing renewal or extension assumptions used to determine the useful life of a recognized intangible asset under SFAS No. 142, “Goodwill and Other Intangible Assets”. FSP 142-3 is effective for fiscal years beginning after December 15, 2008. The adoption of FSP 142-3 is not expected to have a material impact on our consolidated statements of financial position, operations or cash flows at this time.
SFAS No. 162,” The Hierarchy of Generally Accepted Accounting Principles”
In May 2008, the FASB issued SFAS No. 162 “The Hierarchy of Generally Accepted Accounting Principles” (“SFAS 162”). SFAS 162 identifies the sources of accounting principles generally accepted in the United States. SFAS 162 is effective November 15, 2008. The adoption of SFAS 162 did not have a material impact on our consolidated statements of financial position, operations or cash flows.
| Item 7A. | Quantitative and Qualitative Disclosures about Market Risk |
Our exposure to market risk relates to the interest rate risk with our Amended New Credit Facilities. We may periodically enter into interest rate swap agreements to modify the interest rate exposure associated with our outstanding debt. The outstanding borrowings on our Amended New Credit Facilities were $181.6 million, $191.3 and $17.0 million as of December 31, 2008, 2007 and 2006, respectively. In September 2007, we entered into an amortizing interest rate swap agreement whereby, on a quarterly basis, we swap variable rates equal to three-month LIBOR for fixed rates on the notional amount of $125 million. Every year thereafter, on the anniversary of the swap agreement the notional amount will decrease by $25 million. The hedged borrowings on our Amended New Credit Facilities were $100.0 million at December 31, 2008. The outstanding unhedged borrowings on our Amended New Credit Facilities were $81.6 million as of December 31, 2008, consisting of $33.8 million outstanding on the Revolving Credit Facility and $47.8 million outstanding on the term loan facility. Interest rates on unhedged borrowings may be based on the Prime rate or LIBOR, at our discretion. Assuming a 200 basis point increase in interest rates, interest expense would have increased approximately $3.5 million, $1.1 million and less than $0.1 million on the unhedged borrowings for the year ended December 31, 2008, 2007 and 2006, respectively.
For the year ended December 31, 2008, the swap was determined to be highly effective in hedging against fluctuations in variable interest rates associated with the underlying debt. Interest rates have decreased since we
52
entered into our swap agreement, reducing the fair value and resulting in a liability balance. Additional declines in interest rates will further reduce the fair value, while increasing interest rates will increase the fair value.
Interest rate fluctuations do not have a material impact on interest income.
| Item 8. | Financial Statements and Supplementary Data |
The financial statements filed herewith are set forth on the Index to Consolidated Financial Statements on page F-1 of the separate financial section of this Annual Report.
| Item 9. | Changes in and Disagreements With Accountants on Accounting and Financial Disclosure |
We have no information to report that is required by Item 304(b) of Regulation S-K.
| Item 9A. | Controls and Procedures |
Conclusion Regarding the Effectiveness of Disclosure Controls and Procedures
As of the end of the period covered by this report, we carried out an evaluation, under the supervision and with the participation of our management, including our Chief Executive Officer and Chief Financial Officer, of the effectiveness of the design and operation of our disclosure controls and procedures pursuant to Rule 13a-15 of the Securities Exchange Act of 1934. Based upon that evaluation, our Chief Executive Officer and our Chief Financial Officer concluded that our disclosure controls and procedures were effective to cause material information required to be disclosed by us in the reports that we file or submit under the Securities Exchange Act of 1934 to be recorded, processed, summarized and reported within the time periods specified in the Commission’s rules and forms.
Management’s Report on Internal Control Over Financial Reporting
Refer to the Report of Management on Internal Control Over Financial Reporting located on page F-2 of the separate financial section of this Annual Report.
There have been no changes in our internal controls over financial reporting that occurred during our fiscal quarter ended December 31, 2008 that have materially affected, or are reasonable likely to materially affect, our internal controls over financial reporting.
| Item 9B. | Other Information |
None.
PART III
| Item 10. | Directors, Executive Officers and Corporate Governance |
The Company has adopted a code of business conduct applicable to all directors, officers and associates, and which complies with the definition of a “code of ethics” set forth in Section 406(c) of the Sarbanes-Oxley Act of 2002 and the requirement of a “code of ethics” prescribed by Rule 4350(n) of The NASDAQ Marketplace Rules. The code of business conduct is accessible at no charge on the Company’s website atwww.assetacceptance.com.In the event we make any amendment to, or grant any waiver of, a provision of our code of business conduct that applies to the principal executive, financial or accounting officer, or any person performing similar functions, that requires disclosure under applicable SEC rules, we intend to disclose such amendment or waiver, the nature of and reasons for it, along with the name of the person to whom it was granted and the date, on our website.
The other information required by Item 10 is included in the Proxy Statement for the 2009 Annual Meeting of Stockholders of the Company to be held May 14, 2009, which will be filed with the Securities and Exchange
53
Commission (the “Proxy Statement”) and is incorporated herein by reference. Information about our Executive Officers is set forth in Part I. Supplemental Item, under the caption “Executive Officers of the Company”.
| Item 11. | Executive Compensation |
The information required by Item 11 is included in the Proxy Statement for the 2009 Annual Meeting of Stockholders of the Company, which will be filed with the Securities and Exchange Commission and is incorporated herein by reference.
| Item 12. | Security Ownership Of Certain Beneficial Owners And Management And Related Stockholder Matters |
The information required by Item 12 is included in the Proxy Statement for the 2009 Annual Meeting of Stockholders of the Company, which will be filed with the Securities and Exchange Commission and is incorporated herein by reference.
The following table contains information about our securities that may be issued upon the exercise of options, warrants and rights under all of our equity compensation plans as of December 31, 2008:
| | | | | | | |
Plan Category | | Number of
Securities to be
Issued upon
Exercise of
Outstanding
Options, Warrants
and Rights | | Weighted Average
Exercise Price of
Outstanding Options,
Warrants and Rights | | Number of Securities
Remaining Available
For Future Issuance
Under Equity
Compensation Plans
(Excluding
Outstanding Options,
Warrants And
Rights) |
Equity compensation plans approved by stockholders | | 961,282 | | $ | 12.96 | | 2,673,763 |
| Item 13. | Certain Relationships and Related Transactions, and Director Independence |
The information required by Item 13 is included in the Proxy Statement for the 2009 Annual Meeting of Stockholders of the Company, which will be filed with the Securities and Exchange Commission and is incorporated herein by reference.
| Item 14. | Principal Accountant Fees And Services |
The information required by Item 14 is included in the Proxy Statement for the 2009 Annual Meeting of Stockholders of the Company, which will be filed with the Securities and Exchange Commission and is incorporated herein by reference.
PART IV
| Item 15. | Exhibits, Consolidated Financial Statements Schedules |
(a) The financial statements filed herewith are set forth in the Index to Consolidated Financial Statements on page F-1 of the separate financial section of this Annual Report, which is incorporated herein by reference.
(b) The following exhibits are filed as a part of this Annual Report.
| | |
Exhibit Number | | Description |
| |
| 2.1 | | Asset Contribution and Securities Purchase Agreement among Asset Acceptance Holdings, LLC, AAC Holding Corp., Consumer Credit Corp., their respective shareholders and AAC Investors, Inc. dated September 30, 2002. (Incorporated by reference to Exhibit 2.1 filed with Asset Acceptance Capital Corp. Registration Statement on Form S-1 (Registration No. 333-109987)) |
54
| | |
Exhibit Number | | Description |
| |
| 2.2 | | Share Exchange Agreement dated October 24, 2003, among Asset Acceptance Capital Corp., AAC Investors, Inc., RBR Holding Corp. and the other parties thereto. (Incorporated by reference to Exhibit 2.2 filed with Asset Acceptance Capital Corp. Registration Statement on Form S-1 (Registration No. 333-109987)) |
| |
| 3.1 | | Amended and Restated Certificate of Incorporation of Asset Acceptance Capital Corp. (Incorporated by reference to Exhibit 3.1 filed with Asset Acceptance Capital Corp. Annual Report on Form 10-K originally filed on March 25, 2004) |
| |
| 3.2 | | Amended and Restated Bylaws of Asset Acceptance Capital Corp. as of July 25, 2007 (Incorporated by reference to Exhibit 3.1 filed with Current Report on Form 8-K filed on July 31, 2007) |
| |
| 4.1 | | Form of Common Stock Certificate. (Incorporated by reference to Exhibit 4.1 filed with Asset Acceptance Capital Corp. Registration Statement on Form S-1 (Registration No. 333-109987)) |
| |
| 10.1 | | Form of Amended and Restated Registration Rights Agreement among Asset Acceptance Capital Corp. and its stockholders. (Incorporated by reference to Exhibit 10.3 filed with Asset Acceptance Capital Corp. Registration Statement on Form S-1 (Registration No. 333-109987)) |
| |
| 10.2 | | Asset Acceptance Holdings, LLC Year 2002 Share Appreciation Rights Plan effective as of September 30, 2002. (Incorporated by reference to Exhibit 10.4 filed with Asset Acceptance Capital Corp. Registration Statement on Form S-1 (Registration No. 333-109987)) |
| |
| 10.3 | | Form of Share Appreciation Rights Agreement used in connection with grants under the Asset Acceptance Holdings, LLC Year 2002 Share Appreciation Rights Plan. (Incorporated by reference to Exhibit 10.5 filed with Asset Acceptance Capital Corp. Registration Statement on Form S-1 (Registration No. 333-109987)) |
| |
| 10.4+* | | 2004 Stock Incentive Plan (as amended and restated effective October 29, 2008) |
| |
| 10.5 | | Lease dated November 17, 2000 between Brooklyn Heights Business Park Limited and Asset Acceptance Corp. for the property located at 600 Safeguard Plaza, Brooklyn Heights, Ohio, as amended. (Incorporated by reference to Exhibit 10.10 filed with Asset Acceptance Capital Corp. Registration Statement on Form S-1 (Registration No. 333-109987)) |
| |
| 10.6 | | Second Amendment to Lease Agreement (for property located at 600 Safeguard Plaza, Brooklyn Heights, Ohio). (Incorporated by reference to Exhibit 10.10 filed with Asset Acceptance Capital Corp. Annual Report on Form 10-K originally filed February 27, 2006) |
| |
| 10.7 | | Lease Agreement dated April 25, 2003 between Northpoint Atrium Limited Partnership and Asset Acceptance, LLC for the property located at 10500 Heritage Street, San Antonio, Texas. (Incorporated by reference to Exhibit 10.14 filed with Asset Acceptance Capital Corp. Registration Statement on Form S-1 (Registration No. 333-109987)) |
| |
| 10.8 | | First Amendment to Lease Agreement dated as of April 11, 2008, between Asset Acceptance, LLC, and Northpoint Atrium Office Building, Ltd. (Incorporated by reference to Exhibit 10.1 included with the Current Report on Form 8-K filed on May 6, 2008) |
| |
| 10.9 | | Lease Agreement dated July 25, 2003 between Orsett/ Piedmont Limited Liability Company and Asset Acceptance, LLC for the property located at 9801 South 51st Street, Phoenix, Arizona. (Incorporated by reference to Exhibit 10.15 filed with Asset Acceptance Capital Corp. Registration Statement on Form S-1 (Registration No. 333-109987)) |
| |
| 10.10 | | Business Lease dated August 25, 2003 between First Industrial Development Services, Inc. and Asset Acceptance, LLC for the property located in Hillsborough County, Florida, as amended by First Amendment to Lease dated December 29, 2003. (Incorporated by reference to Exhibit 10.16 filed with Asset Acceptance Capital Corp. Registration Statement on Form S-1 (Registration No. 333-109987)) |
55
| | |
Exhibit Number | | Description |
| 10.11* | | Second Amendment to Lease Agreement dated as of December 15, 2008, between Asset Acceptance, LLC and WI Commercial Properties, Inc. (“WICP”) for the property located in Hillsborough County, Florida |
| |
| 10.12 | | Lease Agreement dated October 31, 2003 by and between Van Dyke Office LLC and Asset Acceptance, LLC for the property located at 28405 Van Dyke Avenue, Warren, Michigan. (Incorporated by reference to Exhibit 10.17 filed with Asset Acceptance Capital Corp. Registration Statement on Form S-1 (Registration No. 333-109987)) |
| |
| 10.13 | | First Amendment to Lease Agreement and Second Amendment to Lease Agreement (for property located at 28405 Van Dyke Avenue, Warren, Michigan). (Incorporated by reference to Exhibit 10.29 filed with Asset Acceptance Capital Corp. Amendment No. 1 to Registration Statement on Form S-1 (Registration No. 333-123178)) |
| |
| 10.14 | | Third Amendment to Lease Agreement for property located at 28405 Van Dyke (Incorporated by reference to Exhibit 10.1 filed with Asset Acceptance Capital Corp. Quarterly Report on Form 10-Q originally filed on May 10, 2006) |
| |
| 10.15 | | Fourth Amendment to Lease Agreement for property located at 28405 Van Dyke (Incorporated by reference to Exhibit 10.2 filed with Asset Acceptance Capital Corp. Quarterly Report on Form 10-Q originally filed on August 9, 2006) |
| |
| 10.16 | | Lease Agreement dated April 25, 2005 between 55 E. Jackson LLC and Asset Acceptance, LLC for the property located at 55 E. Jackson Boulevard, Chicago, Illinois 60604 (Incorporated by reference to Exhibit 10.30 filed with Asset Acceptance Capital Corp. Annual report on Form 10-K originally filed on February 27, 2006) |
| |
| 10.17+ | | Employment Agreement dated as of July 20, 2007, as amended by Amendment No. 1, dated October 18, 2007, between Asset Acceptance, LLC and Rion B. Needs (Incorporated by reference to Exhibit 10.3 filed with Asset Acceptance Capital Corp. Quarterly Report on Form 10-Q originally filed on November 9, 2007) |
| |
| 10.18+ | | Second Amendment to Employment Agreement, dated as of December 29, 2008, between Rion B. Needs and Asset Acceptance, LLC (Incorporated by reference to Exhibit 10.1 included with the Current Report on Form 8-K filed on January 2, 2009) |
| |
| 10.19+ | | Employment Agreement dated as of October 1, 2007, between Asset Acceptance, LLC and Deborah L. Everly (Incorporated by reference to Exhibit 10.4 filed with Asset Acceptance Capital Corp. Quarterly Report on Form 10-Q originally filed on November 9, 2007) |
| |
| 10.20+ | | First Amendment to Employment Agreement, dated December 19, 2008, between Asset Acceptance, LLC and Deborah L. Everly (Incorporated by reference to Exhibit 10.1 included filed with the Current Report on Form 8-K filed on December 24, 2008) |
| |
| 10.21+ | | Employment Agreement dated September 30, 2002, between Mark A. Redman and Asset Acceptance Holdings, LLC and the form of Amendment No. 1 thereto. (Incorporated by reference to Exhibit 10.20 filed with Asset Acceptance Capital Corp. Registration Statement on Form S-1 (Registration No. 333-109987)) |
| |
| 10.22+ | | Second Amendment To Employment Agreement, dated December 23, 2005, between Mark A. Redman and Asset Acceptance Holdings, LLC (Incorporated by reference to Exhibit 10.28 filed with Asset Acceptance Capital Corp. Annual report on Form 10-K originally filed on February 27, 2006) |
| |
| 10.23+ | | Third Amendment to Employment Agreement, dated as of December 31, 2008, between Mark A. Redman and Asset Acceptance Holdings, LLC (Incorporated by reference to Exhibit 10.2 included with the Current Report on Form 8-K filed on January 2, 2009) |
56
| | |
Exhibit Number | | Description |
| 10.24 | | Agreement between Ontario Systems Corporation and Lee Acceptance Corp. dated June 26, 1992, as amended. (Incorporated by reference to Exhibit 10.22 filed with Asset Acceptance Capital Corp. Registration Statement on Form S-1 (Registration No. 333-109987)) |
| |
| 10.25 | | Stock Purchase Agreement between Asset Acceptance Holdings, LLC and the Shareholders of Premium Asset Recovery Corporation (Incorporated by reference to Exhibit 10.3 filed with Asset Acceptance Capital Corp. Quarterly Report on Form 10-Q originally filed on August 9, 2006) |
| |
| 10.26+ | | 2006 Amendment to 2004 Stock Incentive Plan (Incorporated by reference to Exhibit 10.33 filed with Asset Acceptance Capital Corp. Annual Report on Form 10-K originally filed on March 5, 2007) |
| |
| 10.27+ | | 2007 Annual Incentive Compensation Plan for Management (Incorporated by reference to Exhibit 10.1 included with the Current Report on Form 8-K filed on February 16, 2007) |
| |
| 10.28+ | | Form of Nonqualified Stock Option Agreement (Incorporated by reference to Exhibit 10.1 included with the Current Report on Form 8-K filed on August 20, 2007) |
| |
| 10.29+ | | Form of Restricted Stock Unit Award Agreement (Performance Based) (Incorporated by reference to Exhibit 10.2 included with the Current Report on Form 8-K filed on August 20, 2007) |
| |
| 10.30 | | Stock Repurchase Agreement dated as of May 8, 2007, among Asset Acceptance Capital Corp., AAC Quad-C Investors LLC, Nathaniel F. Bradley IV and Mark A. Redman (Incorporated by reference to Exhibit 99(D)(2) included with Asset Acceptance Capital Corp.’s Schedule TO as filed on May 9, 2007) |
| |
| 10.31+ | | Amendment to the 2004 Stock Incentive Plan (Incorporated by reference to Exhibit 10.1 included with the Current Report on Form 8-K filed on May 29, 2007) |
| |
| 10.32 | | Credit Agreement dated June 5, 2007, between Asset Acceptance Capital Corp. and JPMorgan Chase Bank, National Association (Incorporated by reference to Exhibit 10.1 included with the Current Report on Form 8-K filed on June 5, 2007) |
| |
| 10.33 | | First Amendment to the Credit Agreement dated as of June 5, 2007, between Asset Acceptance Capital Corp. and JPMorgan Chase Bank, N.A. and other lenders (Incorporated by reference to Exhibit 10.1 included with the Current Report on Form 8-K filed on March 11, 2008) |
| |
| 10.34+ | | 2004 Stock Incentive Plan (as amended and restated) (Incorporated by reference to Exhibit 10.1 filed with Asset Acceptance Capital Corp. Quarterly Report on Form 10-Q originally filed on November 9, 2007) |
| |
| 10.35+ | | 2007 Annual Incentive Compensation Plan for Management (as amended and restated) (Incorporated by reference to Exhibit 10.2 filed with Asset Acceptance Capital Corp. Quarterly Report on Form 10-Q, originally filed on November 9, 2007) |
| |
| 10.36+ | | 2008 Annual Incentive Compensation Plan for Management (Incorporated by reference to Exhibit 10.2 filed with Asset Acceptance Capital Corp. Quarterly Report on Form 10-Q originally filed on May 1, 2008) |
| |
| 21.1* | | Subsidiaries of Asset Acceptance Capital Corp. |
| |
| 23.1* | | Consent of Independent Registered Public Accounting Firm (Grant Thornton LLP) |
| |
| 23.2* | | Consent of Independent Registered Public Accounting Firm (Ernst & Young LLP) |
| |
| 31.1* | | Certification of Chief Executive Officer dated March 5, 2009 relating to the Registrant’s Annual Report on Form 10-K for the year ended December 31, 2008 |
57
| | |
Exhibit Number | | Description |
| 31.2* | | Certification of Chief Financial Officer dated March 5, 2009, relating to the Registrant’s Annual Report on Form 10-K for the year ended December 31, 2008 |
| |
| 32.1* | | Certification of Chief Executive Officer and Chief Financial Officer of Registrant, dated March 5, 2009, pursuant to 18 U.S.C. Section 1350 as adopted pursuant to Section 906 of the Sarbanes-Oxley Act of 2002, relating to the Registrant’s Annual Report on Form 10-K for the year ended December 31, 2008 |
| + | Management contract or compensatory plan or arrangement |
58
SIGNATURES
Pursuant to the requirements of Section 13 or 15(d) of the Securities Exchange Act of 1934, the Registrant has duly caused this Report to be signed on its behalf by the undersigned, thereunto duly authorized on March 5, 2009.
| | |
| ASSET ACCEPTANCE CAPITAL CORP. |
| |
By : | | /S/ RION B. NEEDS |
| | Rion B. Needs, |
| | President and Chief Executive Officer |
Pursuant to the requirements of the Securities Exchange Act of 1934, this Report has been signed below by the following persons on behalf of the Registrant and in the capacities indicated and on March 5, 2009.
| | |
Signature | | Title |
/S/ RION B. NEEDS Rion B. Needs | | President, Chief Executive Officer and Director (principal executive officer) |
| |
/S/ MARK A. REDMAN Mark A. Redman | | Senior Vice President and Chief Financial Officer (principal financial officer and principal accounting officer) |
| |
/S/ NATHANIEL F. BRADLEY IV Nathaniel F. Bradley IV | | Chairman of the Board and Director |
| |
/S/ JENNIFER ADAMS Jennifer Adams | | Director |
| |
/S/ TERRENCE D. DANIELS Terrence D. Daniels | | Director |
| |
/S DONALD HAIDER Donald Haider | | Director |
| |
/S/ ANTHONY R. IGNACZAK Anthony R. Ignaczak | | Director |
| |
/S/ WILLIAM I JACOBS William I Jacobs | | Director |
| |
/S/ H. EUGENE LOCKHART H. Eugene Lockhart | | Director |
| |
William F. Pickard | | Director |
59
ASSET ACCEPTANCE CAPITAL CORP.
INDEX TO CONSOLIDATED FINANCIAL STATEMENTS
Consolidated Financial Statements
F-1
REPORT OF MANAGEMENT ON INTERNAL CONTROL OVER FINANCIAL REPORTING
The Board of Directors and Stockholders
Asset Acceptance Capital Corp.
Asset Acceptance Capital Corp. (the “Company”) management is responsible for establishing and maintaining adequate internal control over financial reporting as such term is defined in Exchange Act Rules 13a-15(f). The Company’s internal control system is designed to provide reasonable assurance regarding the reliability of financial reporting and the preparation of financial statements in accordance with generally accepted accounting principles.
Under the supervision and with the participation of management, including its principal executive officer and principal financial officer, the Company’s management assessed the design and operating effectiveness of internal control over financial reporting as of December 31, 2008 based on the framework set forth in Internal Control – Integrated Framework issued by the Committee of Sponsoring Organizations of the Treadway Commission (the “COSO criteria”).
Based on this assessment, management concluded that the Company’s internal control over financial reporting was effective as of December 31, 2008, based on the COSO criteria. Grant Thornton, LLP, an independent registered public accounting firm, has issued a report on the Company’s internal control over financial reporting as of December 31, 2008. That report is included herein.
Asset Acceptance Capital Corp.
|
|
/S/ RION B. NEEDS |
| President and Chief Executive Officer |
| March 5, 2009 |
|
/S/ MARK A. REDMAN |
| Senior Vice President and Chief Financial Officer |
| March 5, 2009 |
F-2
REPORT OF INDEPENDENT REGISTERED PUBLIC ACCOUNTING FIRM
Board of Directors and Stockholders
Asset Acceptance Capital Corp.
We have audited Asset Acceptance Capital Corp. (a Delaware corporation) and subsidiaries’ internal control over financial reporting as of December 31, 2008, based on criteria established in Internal Control—Integrated Framework issued by the Committee of Sponsoring Organizations of the Treadway Commission (COSO). Asset Acceptance Capital Corp. and subsidiaries’ management is responsible for maintaining effective internal control over financial reporting and for its assessment of the effectiveness of internal control over financial reporting, included in the accompanying Managements Report on Internal Control Over Financial Reporting. Our responsibility is to express an opinion on Asset Acceptance Capital Corp. and subsidiaries’ internal control over financial reporting based on our audit.
We conducted our audit in accordance with the standards of the Public Company Accounting Oversight Board (United States). Those standards require that we plan and perform the audit to obtain reasonable assurance about whether effective internal control over financial reporting was maintained in all material respects. Our audit included obtaining an understanding of internal control over financial reporting, assessing the risk that a material weakness exists, testing and evaluating the design and operating effectiveness of internal control based on the assessed risk, and performing such other procedures as we considered necessary in the circumstances. We believe that our audit provides a reasonable basis for our opinion.
A company’s internal control over financial reporting is a process designed to provide reasonable assurance regarding the reliability of financial reporting and the preparation of financial statements for external purposes in accordance with generally accepted accounting principles. A company’s internal control over financial reporting includes those policies and procedures that (1) pertain to the maintenance of records that, in reasonable detail, accurately and fairly reflect the transactions and dispositions of the assets of the company; (2) provide reasonable assurance that transactions are recorded as necessary to permit preparation of financial statements in accordance with generally accepted accounting principles, and that receipts and expenditures of the company are being made only in accordance with authorizations of management and directors of the company; and (3) provide reasonable assurance regarding prevention or timely detection of unauthorized acquisition, use, or disposition of the company’s assets that could have a material effect on the financial statements.
Because of its inherent limitations, internal control over financial reporting may not prevent or detect misstatements. Also, projections of any evaluation of effectiveness to future periods are subject to the risk that controls may become inadequate because of changes in conditions, or that the degree of compliance with the policies or procedures may deteriorate.
In our opinion, Asset Acceptance Capital Corp. and subsidiaries maintained, in all material respects, effective internal control over financial reporting as of December 31, 2008, based on criteria established in Internal Control—Integrated Framework issued by COSO.
We also have audited, in accordance with the standards of the Public Company Accounting Oversight Board (United States), the consolidated statement of financial position of Asset Acceptance Capital Corp. and subsidiaries as of December 31, 2008, and the related consolidated statements of operations, shareholders’ equity and comprehensive income and cash flows for the year ended December 31, 2008 and our report dated March 5, 2009 expressed an unqualified opinion on those financial statements.
/s/ GRANT THORNTON LLP
Southfield, Michigan
March 5, 2009
F-3
REPORT OF INDEPENDENT REGISTERED PUBLIC ACCOUNTING FIRM
Board of Directors and
Stockholders of Asset Acceptance Capital Corp.
We have audited the accompanying consolidated statement of financial position of Asset Acceptance Capital Corp. (a Delaware corporation) and subsidiaries (the “Company”) as of December 31, 2008, and the related consolidated statements of operations, stockholders’ equity and comprehensive income, and cash flows for the year ended December 31, 2008. These financial statements are the responsibility of the Company’s management. Our responsibility is to express an opinion on these financial statements based on our audit.
We conducted our audit in accordance with the standards of the Public Company Accounting Oversight Board (United States). Those standards require that we plan and perform the audit to obtain reasonable assurance about whether the financial statements are free of material misstatement. An audit includes examining, on a test basis, evidence supporting the amounts and disclosures in the financial statements. An audit also includes assessing the accounting principles used and significant estimates made by management, as well as evaluating the overall financial statement presentation. We believe that our audit provides a reasonable basis for our opinion.
In our opinion, the consolidated financial statements referred to above present fairly, in all material respects, the consolidated financial position of Asset Acceptance Capital Corp. and subsidiaries as of December 31, 2008, and the consolidated results of their operations and their cash flows for the year ended December 31, 2008 in conformity with accounting principles generally accepted in the United States of America.
We also have audited, in accordance with the standards of the Public Company Accounting Oversight Board (United States), Asset Acceptance Capital Corp. and subsidiaries’ internal control over financial reporting as of December 31, 2008, based on criteria established in Internal Control—Integrated Framework issued by the Committee of Sponsoring Organizations of the Treadway Commission (COSO) and our report dated March 5, 2009 expressed an unqualified opinion on the effectiveness of the Company’s internal control over financial reporting.
/s/ GRANT THORNTON LLP
Southfield, Michigan
March 5, 2009
F-4
REPORT OF INDEPENDENT REGISTERED PUBLIC ACCOUNTING FIRM
The Board of Directors and Stockholders
Asset Acceptance Capital Corp.
We have audited the accompanying consolidated statement of financial position of Asset Acceptance Capital Corp. and subsidiaries (the “Company”) as of December 31, 2007 and the related consolidated statements of operations, stockholders’ equity and comprehensive income, and cash flows for each of the two years in the period ended December 31, 2007. These financial statements are the responsibility of the Company’s management. Our responsibility is to express an opinion on these financial statements based on our audits.
We conducted our audits in accordance with the standards of the Public Company Accounting Oversight Board (United States). Those standards require that we plan and perform the audit to obtain reasonable assurance about whether the financial statements are free of material misstatement. An audit includes examining, on a test basis, evidence supporting the amounts and disclosures in the financial statements. An audit also includes assessing the accounting principles used and significant estimates made by management, as well as evaluating the overall financial statement presentation. We believe that our audits provide a reasonable basis for our opinion.
In our opinion, the financial statements referred to above present fairly, in all material respects, the consolidated financial position of Asset Acceptance Capital Corp. at December 31, 2007 and the consolidated results of their operations and their cash flows for each of the two years in the period ended December 31, 2007, in conformity with U.S. generally accepted accounting principles.
/s/ Ernst & Young LLP
Detroit, Michigan
March 10, 2008
F-5
ASSET ACCEPTANCE CAPITAL CORP.
Consolidated Statements of Financial Position
| | | | | | | | |
| | | December 31,
2008 | | | December 31,
2007 | |
| ASSETS | | | | | | | | |
| | |
Cash | | $ | 6,042,859 | | | $ | 10,474,479 | |
Purchased receivables, net | | | 361,808,502 | | | | 346,198,900 | |
Income taxes receivable | | | 3,934,029 | | | | 4,181,245 | |
Property and equipment, net | | | 12,526,817 | | | | 11,006,658 | |
Goodwill and other intangible assets | | | 16,776,188 | | | | 17,464,688 | |
Other assets | | | 7,082,721 | | | | 6,083,211 | |
| | | | | | | | |
Total assets | | $ | 408,171,116 | | | $ | 395,409,181 | |
| | | | | | | | |
| LIABILITIES AND STOCKHOLDERS’ EQUITY | | | | | | | | |
| | |
Liabilities: | | | | | | | | |
Accounts payable | | $ | 3,388,320 | | | $ | 3,377,068 | |
Accrued liabilities | | | 21,476,207 | | | | 17,423,378 | |
Income taxes payable | | | 658,329 | | | | 756,457 | |
Notes payable | | | 181,550,000 | | | | 191,250,000 | |
Deferred tax liability, net | | | 64,470,002 | | | | 60,164,784 | |
Capital lease obligations | | | — | | | | 18,242 | |
| | | | | | | | |
Total liabilities | | | 271,542,858 | | | | 272,989,929 | |
| | | | | | | | |
Stockholders’ equity: | | | | | | | | |
Preferred stock, $0.01 par value, 10,000,000 shares authorized, no shares issued and outstanding | | | — | | | | — | |
Common stock, $0.01 par value, 100,000,000 shares authorized; issued shares—33,169,552 and 33,119,597 at December 31, 2008 and 2007, respectively | | | 331,696 | | | | 331,196 | |
Additional paid in capital | | | 146,915,791 | | | | 145,610,742 | |
Retained earnings | | | 35,188,314 | | | | 19,465,118 | |
Accumulated other comprehensive loss, net of tax | | | (4,664,862 | ) | | | (2,012,127 | ) |
Common stock in treasury; at cost, 2,596,521 and 2,551,556 shares at December 31, 2008 and 2007, respectively | | | (41,142,681 | ) | | | (40,975,677 | ) |
| | | | | | | | |
Total stockholders’ equity | | | 136,628,258 | | | | 122,419,252 | |
| | | | | | | | |
Total liabilities and stockholders’ equity | | $ | 408,171,116 | | | $ | 395,409,181 | |
| | | | | | | | |
See accompanying notes.
F-6
ASSET ACCEPTANCE CAPITAL CORP.
Consolidated Statements of Operations
| | | | | | | | | | | | |
| | | For the Years Ended December 31, | |
| | | 2008 | | | 2007 | | | 2006 | |
Revenues | | | | | | | | | | | | |
Purchased receivable revenues, net | | $ | 232,900,782 | | | $ | 245,691,739 | | | $ | 251,693,213 | |
Gain on sale of purchased receivables | | | 165,040 | | | | 839,824 | | | | 2,953,607 | |
Other revenues, net | | | 1,146,494 | | | | 1,466,620 | | | | 225,946 | |
| | | | | | | | | | | | |
Total revenues | | | 234,212,316 | | | | 247,998,183 | | | | 254,872,766 | |
| | | | | | | | | | | | |
Expenses | | | | | | | | | | | | |
Salaries and benefits | | | 82,840,199 | | | | 82,916,662 | | | | 82,273,658 | |
Collections expense | | | 89,966,906 | | | | 99,386,744 | | | | 79,367,568 | |
Occupancy | | | 7,727,356 | | | | 9,138,443 | | | | 8,967,026 | |
Administrative | | | 10,510,635 | | | | 10,529,482 | | | | 8,375,981 | |
Restructuring charges | | | — | | | | 906,497 | | | | — | |
Depreciation and amortization | | | 3,954,802 | | | | 4,274,932 | | | | 4,179,206 | |
Impairment of assets | | | 616,343 | | | | 266,667 | | | | — | |
Loss on disposal of equipment and other assets | | | 221,865 | | | | 136,832 | | | | 22,699 | |
| | | | | | | | | | | | |
Total operating expenses | | | 195,838,106 | | | | 207,556,259 | | | | 183,186,138 | |
| | | | | | | | | | | | |
Income from operations | | | 38,374,210 | | | | 40,441,924 | | | | 71,686,628 | |
Other income (expense) | | | | | | | | | | | | |
Interest income | | | 31,996 | | | | 470,694 | | | | 2,034,733 | |
Interest expense | | | (13,023,938 | ) | | | (8,145,456 | ) | | | (645,694 | ) |
Other | | | 21,896 | | | | 151,154 | | | | (12,090 | ) |
| | | | | | | | | | | | |
Income before income taxes | | | 25,404,164 | | | | 32,918,316 | | | | 73,063,577 | |
Income taxes | | | 9,680,968 | | | | 12,511,803 | | | | 27,545,579 | |
| | | | | | | | | | | | |
Net income | | $ | 15,723,196 | | | $ | 20,406,513 | | | $ | 45,517,998 | |
| | | | | | | | | | | | |
Weighted-average number of shares: | | | | | | | | | | | | |
Basic | | | 30,566,031 | | | | 32,516,866 | | | | 36,589,408 | |
Diluted | | | 30,592,317 | | | | 32,604,100 | | | | 36,620,577 | |
Earnings per common share outstanding: | | | | | | | | | | | | |
Basic | | $ | 0.51 | | | $ | 0.63 | | | $ | 1.24 | |
Diluted | | $ | 0.51 | | | $ | 0.63 | | | $ | 1.24 | |
Dividends per common share | | $ | — | | | $ | 2.45 | | | $ | — | |
See accompanying notes.
F-7
ASSET ACCEPTANCE CAPITAL CORP.
Consolidated Statements of Stockholders’ Equity and Comprehensive Income
| | | | | | | | | | | | | | | | | | | | | | | | | | | | | | | |
| | | Number
of Shares | | | Common
Stock | | | Comprehensive
Income | | | Additional
Paid in
Capital | | | Retained
Earnings | | | Accumulated
Other
Comprehensive
Loss, net of tax | | | Common
Stock in
Treasury | | | Total
Stockholders’
Equity | |
Balance at December 31, 2005 | | 37,225,275 | | | $ | 372,253 | | | | | | | $ | 160,361,599 | | | $ | 88,726,502 | | | $ | — | | | $ | — | | | $ | 249,460,354 | |
Comprehensive income | | | | | | | | | | | | | | | | | | | | | | | | | | | | | | | |
Net income | | — | | | | — | | | $ | 45,517,998 | | | | — | | | | 45,517,998 | | | | — | | | | — | | | | 45,517,998 | |
| | | | | | | | | | | | | | | | | | | | | | | | | | | | | | | |
Other comprehensive income, net of tax | | | | | | | | | | | | | | | | | | | | | | | | | | | | | | | |
Comprehensive income | | — | | | | — | | | $ | 45,517,998 | | | | — | | | | — | | | | — | | | | — | | | | — | |
| | | | | | | | | | | | | | | | | | | | | | | | | | | | | | | |
Repurchases of common stock | | — | | | | — | | | | | | | | — | | | | — | | | | — | | | | (40,504,737 | ) | | | (40,504,737 | ) |
Issuance of treasury shares | | — | | | | — | | | | | | | | 58,350 | | | | — | | | | — | | | | 225,000 | | | | 283,350 | |
Compensation expense under share-based compensation plan | | — | | | | — | | | | | | | | 1,421,154 | | | | — | | | | — | | | | — | | | | 1,421,154 | |
| | | | | | | | | | | | | | | | | | | | | | | | | | | | | | | |
Balance at December 31, 2006 | | 37,225,275 | | | $ | 372,253 | | | | | | | $ | 161,841,103 | | | $ | 134,244,500 | | | | — | | | $ | (40,279,737 | ) | | $ | 256,178,119 | |
Comprehensive income | | | | | | | | | | | | | | | | | | | | | | | | | | | | | | | |
Net income | | — | | | | — | | | $ | 20,406,513 | | | | — | | | | 20,406,513 | | | | — | | | | — | | | | 20,406,513 | |
| | | | | | | | | | | | | | | | | | | | | | | | | | | | | | | |
Other comprehensive income, net of tax | | | | | | | | | | | | | | | | | | | | | | | | | | | | | | | |
Unrealized loss on cash flow hedge, net of deferred tax of $1,113,876 | | — | | | | | | | | (2,012,127 | ) | | | | | | | | | | | (2,012,127 | ) | | | | | | | (2,012,127 | ) |
| | | | | | | | | | | | | | | | | | | | | | | | | | | | | | | |
Comprehensive income | | — | | | | | | | $ | 18,394,386 | | | | | | | | | | | | | | | | | | | | | |
| | | | | | | | | | | | | | | | | | | | | | | | | | | | | | | |
Repurchases of common stock, retired | | (4,130,792 | ) | | | (41,308 | ) | | | | | | | (17,688,878 | ) | | | (60,294,195 | ) | | | — | | | | — | | | | (78,024,381 | ) |
Repurchases of treasury shares | | — | | | | — | | | | | | | | — | | | | — | | | | — | | | | (695,940 | ) | | | (695,940 | ) |
Issuance of common stock | | 25,114 | | | | 251 | | | | | | | | (251 | ) | | | — | | | | — | | | | | | | | | |
Compensation expense under share-based compensation plan | | — | | | | — | | | | | | | | 1,458,768 | | | | — | | | | — | | | | — | | | | 1,458,768 | |
Cash dividends paid | | — | | | | — | | | | | | | | — | | | | (74,891,700 | ) | | | — | | | | — | | | | (74,891,700 | ) |
| | | | | | | | | | | | | | | | | | | | | | | | | | | | | | | |
Balance at December 31, 2007 | | 33,119,597 | | | $ | 331,196 | | | | | | | $ | 145,610,742 | | | $ | 19,465,118 | | | $ | (2,012,127 | ) | | $ | (40,975,677 | ) | | $ | 122,419,252 | |
| | | | | | | | | | | | | | | | | | | | | | | | | | | | | | | |
Comprehensive income | | | | | | | | | | | | | | | | | | | | | | | | | | | | | | | |
Net income | | — | | | | — | | | $ | 15,723,196 | | | | — | | | | 15,723,196 | | | | — | | | | — | | | | 15,723,196 | |
| | | | | | | | | | | | | | | | | | | | | | | | | | | | | | | |
Other comprehensive income, net of tax | | | | | | | | | | | | | | | | | | | | | | | | | | | | | | | |
Unrealized loss on cash flow hedge, net of deferred tax of $1,464,836 | | — | | | | | | | | (2,652,735 | ) | | | | | | | | | | | (2,652,735 | ) | | | | | | | (2,652,735 | ) |
| | | | | | | | | | | | | | | | | | | | | | | | | | | | | | | |
Comprehensive income | | — | | | | | | | $ | 13,070,461 | | | | | | | | | | | | | | | | | | | | | |
| | | | | | | | | | | | | | | | | | | | | | | | | | | | | | | |
Repurchases of treasury shares | | — | | | | — | | | | | | | | — | | | | — | | | | — | | | | (167,004 | ) | | | (167,004 | ) |
Issuance of common stock | | 49,955 | | | | 500 | | | | | | | | | | | | — | | | | — | | | | | | | | 500 | |
Compensation expense under share-based compensation plan | | — | | | | — | | | | | | | | 1,305,049 | | | | — | | | | — | | | | — | | | | 1,305,049 | |
| | | | | | | | | | | | | | | | | | | | | | | | | | | | | | | |
Balance at December 31, 2008 | | 33,169,552 | | | $ | 331,696 | | | | | | | $ | 146,915,791 | | | $ | 35,188,314 | | | $ | (4,664,862 | ) | | $ | (41,142,681 | ) | | $ | 136,628,258 | |
| | | | | | | | | | | | | | | | | | | | | | | | | | | | | | | |
See accompanying notes.
F-8
ASSET ACCEPTANCE CAPITAL CORP.
Consolidated Statements of Cash Flows
| | | | | | | | | | | | |
| | | For the Years Ended December 31, | |
| | | 2008 | | | 2007 | | | 2006 | |
Cash flows from operating activities | | | | | | | | | | | | |
Net income | | $ | 15,723,196 | | | $ | 20,406,513 | | | $ | 45,517,998 | |
Adjustments to reconcile net income to net cash provided by operating activities: | | | | | | | | | | | | |
Depreciation and amortization | | | 3,954,802 | | | | 4,274,932 | | | | 4,179,206 | |
Deferred income taxes | | | 5,770,054 | | | | 646,442 | | | | 136,730 | |
Share-based and other non-cash compensation expense | | | 1,329,298 | | | | 1,458,768 | | | | 1,421,154 | |
Net impairment of purchased receivables | | | 13,040,736 | | | | 24,393,500 | | | | 17,891,809 | |
Non-cash revenue | | | (575,006 | ) | | | (756,671 | ) | | | (1,136,906 | ) |
Loss on disposal of equipment and other assets | | | 221,865 | | | | 136,832 | | | | 22,699 | |
Gain on sale of purchased receivables | | | (165,040 | ) | | | (839,824 | ) | | | (2,953,607 | ) |
Impairment of assets | | | 616,343 | | | | 266,667 | | | | — | |
Changes in assets and liabilities, net of effects from purchase of PARC in 2006: | | | | | | | | | | | | |
(Decrease) increase in accounts payable and other accrued liabilities | | | (53,490 | ) | | | 981,779 | | | | 1,177,058 | |
(Increase) decrease in other assets | | | (338,935 | ) | | | 382,429 | | | | 3,723,798 | |
Increase (decrease) in income taxes | | | 149,088 | | | | (189,362 | ) | | | (4,140,814 | ) |
| | | | | | | | | | | | |
Net cash provided by operating activities | | | 39,672,911 | | | | 51,162,005 | | | | 65,839,125 | |
| | | | | | | | | | | | |
Cash flows from investing activities | | | | | | | | | | | | |
Investment in purchased receivables, net of buybacks | | | (152,289,315 | ) | | | (170,847,886 | ) | | | (133,149,151 | ) |
Principal collected on purchased receivables | | | 124,211,618 | | | | 101,849,895 | | | | 72,421,630 | |
Proceeds from sale of purchased receivables | | | 167,405 | | | | 842,594 | | | | 3,370,252 | |
Purchase of property and equipment | | | (5,658,784 | ) | | | (2,377,522 | ) | | | (5,408,237 | ) |
Proceeds from sale of property and equipment | | | 7,800 | | | | 276,638 | | | | 157,497 | |
Purchase of investment securities | | | — | | | | — | | | | (14,935,000 | ) |
Proceeds from sale of investment securities | | | — | | | | — | | | | 14,935,000 | |
Payment for purchase of PARC, net of cash acquired | | | — | | | | — | | | | (14,675,912 | ) |
| | | | | | | | | | | | |
Net cash used in investing activities | | | (33,561,276 | ) | | | (70,256,281 | ) | | | (77,283,921 | ) |
| | | | | | | | | | | | |
Cash flows from financing activities | | | | | | | | | | | | |
Borrowings under notes payable | | | 128,000,000 | | | | 263,000,000 | | | | 17,000,000 | |
Repayment of notes payable | | | (137,700,000 | ) | | | (88,750,000 | ) | | | — | |
Payment of deferred financing costs | | | (660,575 | ) | | | (2,315,096 | ) | | | — | |
Repayment of capital lease obligations | | | (15,927 | ) | | | (61,579 | ) | | | (131,920 | ) |
Repurchase of common stock | | | (166,753 | ) | | | (78,720,321 | ) | | | (40,504,737 | ) |
Cash dividends paid | | | — | | | | (74,891,700 | ) | | | — | |
Proceeds received for treasury shares | | | — | | | | — | | | | 283,350 | |
Repayment of bank and other secured debt assumed from PARC | | | — | | | | — | | | | (4,413,380 | ) |
| | | | | | | | | | | | |
Net cash (used in) provided by financing activities | | | (10,543,255 | ) | | | 18,261,304 | | | | (27,766,687 | ) |
| | | | | | | | | | | | |
Net decrease in cash | | | (4,431,620 | ) | | | (832,972 | ) | | | (39,211,483 | ) |
Cash at beginning of period | | | 10,474,479 | | | | 11,307,451 | | | | 50,518,934 | |
| | | | | | | | | | | | |
Cash at end of period | | $ | 6,042,859 | | | $ | 10,474,479 | | | $ | 11,307,451 | |
| | | | | | | | | | | | |
Supplemental disclosure of cash flow information | | | | | | | | | | | | |
Cash paid for interest | | $ | 12,588,205 | | | $ | 6,647,856 | | | $ | 321,238 | |
Net cash paid for income taxes | | $ | 3,724,444 | | | $ | 12,176,983 | | | $ | 31,482,195 | |
Non-cash investing and financing activities: | | | | | | | | | | | | |
Change in fair value of swap liability | | $ | 4,117,571 | | | $ | 3,126,003 | | | $ | — | |
Change in unrealized loss on cash flow hedge | | $ | (2,652,735 | ) | | $ | (2,012,127 | ) | | $ | — | |
Capital lease obligations incurred | | $ | — | | | $ | — | | | $ | 24,797 | |
Assumption of liabilities in conjunction with purchase of PARC: | | | | | | | | | | | | |
Fair value of assets acquired less cash acquired | | $ | — | | | $ | — | | | $ | 20,311,217 | |
Cash paid for capital stock less cash acquired | | | — | | | | — | | | | (14,675,912 | ) |
| | | | | | | | | | | | |
Net liabilities assumed | | $ | — | | | $ | — | | | $ | 5,635,305 | |
| | | | | | | | | | | | |
See accompanying notes.
F-9
ASSET ACCEPTANCE CAPITAL CORP.
NOTES TO CONSOLIDATED FINANCIAL STATEMENTS
1. Basis of Presentation and Summary of Significant Accounting Policies
Nature of Operations
Asset Acceptance Capital Corp. (a Delaware corporation) and its subsidiaries (collectively referred to as the “Company”) are engaged in the purchase and collection of defaulted and charged-off accounts receivable portfolios. These receivables are acquired from consumer credit originators, primarily credit card issuers, consumer finance companies, healthcare providers, retail merchants, telecommunications and other utility providers as well as from resellers and other holders of consumer debt. The Company periodically sells receivables from these portfolios to unaffiliated companies.
In addition, the Company finances the sales of consumer product retailers.
Reporting Entity
The consolidated financial statements include the accounts of Asset Acceptance Capital Corp. consisting of direct and indirect subsidiaries AAC Investors, Inc., RBR Holding Corp., Asset Acceptance Holdings, LLC, Asset Acceptance, LLC, Consumer Credit, LLC and Premium Asset Recovery Corporation (“PARC”). All significant intercompany balances and transactions have been eliminated in consolidation. The Company currently has two operating segments according to Financial Accounting Standards Board (“FASB”) Statement of Financial Accounting Standards (“SFAS”) 131, “Disclosures about Segments of an Enterprise and Related Information”, one for purchased receivables and one for finance contract receivables. The finance contract receivables operating segment is not material and therefore is not disclosed separately from the purchased receivables segment.
Cash
The Company maintains cash balances with high quality financial institutions. Management periodically evaluates the creditworthiness of such institutions. Cash balances may be in excess of the amounts insured by the Federal Deposit Insurance Corporation.
Purchased Receivables Portfolios and Revenue Recognition
Purchased receivables are receivables that have been charged-off as uncollectible by the originating organization and typically have been subject to previous collection efforts. The Company acquires the rights to the unrecovered balances owed by individual debtors through such purchases. The receivable portfolios are purchased at a substantial discount (generally more than 90%) from their face values and are initially recorded at the Company’s acquisition cost, which equals fair value at the acquisition date. Financing for the purchases is primarily provided by the Company’s cash generated from operations and the Company’s revolving credit facility.
The Company accounts for its investment in purchased receivables using the guidance provided by the Accounting Standards Executive Committee Statement of Position 03-3, “Accounting for Certain Loans or Debt Securities Acquired in a Transfer” (“SOP 03-3”). The provisions of SOP 03-3 were adopted by the Company effective January 2005 and apply to purchased receivables acquired after December 31, 2004. The provisions of SOP 03-3 that relate to decreases in expected cash flows amend previously followed guidance, the Accounting Standards Executive Committee Practice Bulletin 6, “Amortization of Discounts on Certain Acquired Loans” (“PB 6”), for consistent treatment and apply prospectively to purchased receivables acquired before January 1, 2005. The Company purchases pools of homogenous accounts receivable. Pools purchased after 2004 may be aggregated into one or more static pools within each quarter, based on common risk characteristics. Risk
F-10
characteristics of purchased receivables are generally considered to be similar since purchased receivables are usually in the late stages of the post charged-off collection cycle. The Company therefore aggregates most pools purchased within each quarter. Pools purchased before 2005 may not be aggregated with other pool purchases. Each static pool, either aggregated or non-aggregated, retains its own identity and does not change over the remainder of its life. Each static pool is accounted for as a single unit for recognition of revenue, principal payments and impairments.
Collections on each static pool are allocated to revenue and principal reduction based on the estimated internal rate of return (“IRR”). The IRR is the rate of return that each static pool requires to amortize the cost or carrying value of the pool to zero over its estimated life. Each pool’s IRR is determined by estimating future cash flows, which are based on historical collection data for pools with similar characteristics. The actual life of each pool may vary, but pools generally amortize between 36 and 84 months depending on the expected collection period. Monthly cash flows greater than revenue recognized will reduce the carrying value of each static pool and monthly cash flows lower than revenue recognized will increase the carrying value of the static pool. Each pool is reviewed at least quarterly and compared to historical trends to determine whether it is performing as expected. This comparison is used to determine future estimated cash flows. If the revised cash flow estimates are greater than the original estimates, the IRR is adjusted prospectively to reflect the revised estimate of cash flows over the remaining life of the static pool. If the revised cash flow estimates are less than the original estimates, the IRR remains unchanged and an impairment is recognized. If the cash flow estimates increase subsequent to recording an impairment, reversal of the previously recognized impairment is made prior to any increases to the IRR.
The cost recovery method prescribed by SOP 03-3 is used when collections on a particular portfolio cannot be reasonably predicted. When appropriate, the cost recovery method may be used for pools that previously had a yield assigned to them. Under the cost recovery method, no revenue is recognized until the Company has fully collected the cost of the portfolio. As of December 31, 2008, the Company had 62 unamortized pools on the cost recovery method, including all healthcare pools, with an aggregate carrying value of $9,804,318 or about 2.7% of the total carrying value of all purchased receivables. The Company had 51 unamortized pools on the cost recovery method with an aggregate carrying value of $26,939,749, or about 7.8% of the total carrying value of all purchased receivables as of December 31, 2007.
The agreements to purchase receivables typically include general representations and warranties from the sellers covering account holder death, bankruptcy, fraud and settled or paid accounts prior to sale. These representations and warranties permit the return of certain ineligible accounts from the Company back to the seller. The general time frame to return accounts is within 90 to 240 days from the date of the purchase agreement. Proceeds from returns, also referred to as buybacks, are applied against the carrying value of the static pool.
Periodically the Company will sell, on a non-recourse basis, all or a portion of a pool to third parties. The Company does not have any significant continuing involvement with the sold pools subsequent to sale. Proceeds of these sales are compared to the carrying value of the accounts and a gain or loss is recognized on the difference between proceeds received and carrying value, in accordance with the SFAS No. 140, “Accounting for Transfers and Servicing of Financial Assets and Extinguishments of Liabilities – a replacement of SFAS 125”, as amended. The agreements to sell receivables typically include general representations and warranties. Any accounts returned to the Company under these representations and warranties, and during the negotiated time frame, are netted against any “gains on sale of purchased receivables” or if they exceed the total reported gains for the period as a “loss on sale of purchased receivables”, which would be accrued for if material to the consolidated financial statements.
F-11
Changes in purchased receivables portfolios for the years ended December 31, 2008 and 2007 were as follows:
| | | | | | | | |
| | | Year Ended December 31, | |
| | | 2008 | | | 2007 | |
Beginning balance | | $ | 346,198,900 | | | $ | 300,840,508 | |
Investment in purchased receivables, net of buybacks | | | 152,289,315 | | | | 170,847,886 | |
Cost of sale of purchased receivables, net of returns | | | (2,365 | ) | | | (2,770 | ) |
Cash collections | | | (369,578,130 | ) | | | (371,178,463 | ) |
Purchased receivable revenues | | | 232,900,782 | | | | 245,691,739 | |
| | | | | | | | |
Ending balance | | $ | 361,808,502 | | | $ | 346,198,900 | |
| | | | | | | | |
During the year ended December 31, 2007, the Company refined its model for collections forecasting on its purchased receivables portfolios. In addition, the Company extended the expected lives of many purchased receivables portfolios other than healthcare portfolios acquired in 2003 and later to 84 months, from 60 months. Cash collections may continue beyond 84 months; however, these amounts cannot be reasonably predicted. The revised collection forecasts and extension of collection lives were a change in accounting estimate in accordance with SFAS No. 154, “Accounting Changes and Error Corrections – A Replacement of APB Opinion No. 20 and FASB Statement No. 3”. The revised collection forecasts and extension of portfolio lives contributed a net impairment of $14,777,300 for the year ended December 31, 2007. Total net impairments for the year ended December 31, 2007 were $24,393,500. In addition, yields on certain portfolios were adjusted upwards as a result of the extension of portfolio lives. The impact of the net impairment from the change in accounting estimate was to decrease income from operations by $14,777,300, net income by $9,161,926 and both basic and fully diluted earnings per share for the year ended December 31, 2007 by $0.28.
Accretable yield represents the amount of revenue the Company can expect over the remaining life of the existing portfolios. Nonaccretable yield represents the difference between the remaining expected cash flows and the total contractual obligation outstanding (face value) of the purchased receivables. Changes in accretable yield for the year ended December 31, 2008 and 2007 were as follows:
| | | | | | | | |
| | | Year Ended December 31, | |
| | | 2008 | | | 2007 | |
Beginning balance(1) | | $ | 559,605,071 | | | $ | 958,629,284 | |
Adjustment to reduce estimated collections from 120 months to their estimated collection lives, generally 60 months | | | — | | | | (540,938,970 | ) |
| | | | | | | | |
Revised beginning balance | | | 559,605,071 | | | | 417,690,314 | |
Revenue recognized on purchased receivables | | | (232,900,782 | ) | | | (245,691,739 | ) |
Additions due to purchases during the period | | | 188,759,459 | | | | 210,391,421 | |
Reclassifications from nonaccretable yield | | | 19,521,396 | | | | 177,215,075 | |
| | | | | | | | |
Ending balance(2) | | $ | 534,985,144 | | | $ | 559,605,071 | |
| | | | | | | | |
| (1) | The balances are based on the estimated remaining collections, which refers to the sum of all future projected cash collections on our owned portfolios. The January 1, 2008 beginning balance reflects the extension of certain portfolios’ lives from 60 to 84 months during 2007. |
| (2) | Accretable yields are a function of estimated remaining cash flows and are based on historical cash collections. |
F-12
Cash collections for the years ended December 31, 2008, 2007 and 2006 include collections from fully amortized pools of which 100% of the collections were reported as revenue. Components of cash collections from fully amortized pools were as follows:
| | | | | | | | | |
| | | Year Ended December 31, |
| | | 2008 | | 2007 | | 2006 |
Cash collections from fully amortized pools: | | | | | | | | | |
Amortizing before the end of their expected life | | $ | 30,689,189 | | $ | 21,138,942 | | $ | 21,036,667 |
Amortizing after their expected life | | | 41,845,346 | | | 55,476,980 | | | 40,252,055 |
Accounted under the cost recovery method | | | 6,090,186 | | | 5,419,519 | | | 4,775,321 |
| | | | | | | | | |
Total cash collections from fully amortized pools | | $ | 78,624,721 | | $ | 82,035,441 | | $ | 66,064,043 |
| | | | | | | | | |
Changes in purchased receivables portfolios under the cost recovery method for the years ended December 31, 2008 and 2007 were as follows:
| | | | | | | | |
| | | Year Ended December 31, | |
| | | 2008(1) | | | 2007 | |
Portfolios under the cost recovery method: | | | | | | | | |
Beginning balance | | $ | 26,991,102 | | | $ | 7,246,315 | |
Addition of portfolios(2) | | | 5,253,839 | | | | 32,853,806 | |
Buybacks, impairments and resales adjustments | | | (1,885,496 | ) | | | (981,747 | ) |
Cash collections on all portfolios under the cost recovery method until fully amortized | | | (20,555,127 | ) | | | (12,127,272 | ) |
| | | | | | | | |
Ending balance | | $ | 9,804,318 | | | $ | 26,991,102 | |
| | | | | | | | |
| (1) | The 2008 beginning and ending balances and 2007 ending balance include the first quarter of 2005 aggregate and all healthcare portfolios. The carrying values of the first quarter of 2005 aggregate and all healthcare portfolios were $3,432,876 and $5,090,037, respectively, of the total carrying value of purchased receivables as of December 31, 2008. The carrying values of the first quarter of 2005 aggregate and all healthcare portfolios were $11,969,159 and $8,642,919, respectively, of the total carrying value of purchased receivables as of December 31, 2007. |
| (2) | The addition of portfolios for the year ended December 31, 2007 includes the first quarter of 2005 aggregate and healthcare portfolios not previously on the cost recovery method. |
During the years ended December 31, 2008, 2007 and 2006, the Company recorded net impairments of $13,040,736, $24,393,500 and $17,891,809, respectively, related to its purchased receivables. The net impairments reduced revenue and the carrying value of the purchased receivable portfolios. Changes in the purchased receivables valuation allowance for the years ended December 31, 2008, 2007 and 2006 were as follows:
| | | | | | | | | | | | |
| | | Year Ended December 31, | |
| | | 2008 | | | 2007 | | | 2006 | |
Beginning balance | | $ | 62,091,755 | | | $ | 39,714,055 | | | $ | 22,285,355 | |
Impairments | | | 16,112,536 | | | | 25,939,000 | | | | 21,017,509 | |
Reversal of impairments | | | (3,071,800 | ) | | | (1,545,500 | ) | | | (3,125,700 | ) |
Deductions(1) | | | (3,183,165 | ) | | | (2,015,800 | ) | | | (463,109 | ) |
| | | | | | | | | | | | |
Ending balance | | $ | 71,949,326 | | | $ | 62,091,755 | | | $ | 39,714,055 | |
| | | | | | | | | | | | |
| (1) | Deductions represent impairments on purchased receivable portfolios that became fully amortized during the period and, therefore, the balance is eliminated because it can no longer be reversed. |
F-13
Seasonality
Collections within portfolios tend to be seasonally higher in the first and second quarters of the year due to consumers’ receipt of tax refunds and other factors. Conversely, collections within portfolios tend to be lower in the third and fourth quarters of the year due to consumers’ spending in connection with summer vacations, the holiday season and other factors. However, revenue recognized is relatively level, excluding the impact of impairments, due to the application of the provisions prescribed by SOP 03-3. In addition, the Company’s operating results may be affected to a lesser extent by the timing of purchases of charged-off consumer receivables due to the initial costs associated with purchasing and loading these receivables into the Company’s systems. Consequently, income and margins may fluctuate from quarter to quarter.
Collections from Third Parties
The Company regularly utilizes unaffiliated third parties, primarily attorneys and other contingent collection agencies, to collect certain account balances on behalf of the Company in exchange for a percentage of balances collected by the third party. The Company includes the reimbursement of certain legal and other costs as cash collections, thereby recording the gross proceeds received by the unaffiliated third parties as cash collections. The Company records the percentage of the gross cash collections paid to the third parties as a component of collections expense. The percent of gross cash collections from such third party relationships were 30.9%, 26.8% and 24.2% for the years ended December 31, 2008, 2007 and 2006, respectively.
Accrued Liabilities
As of December 31, 2008 and 2007, the total of accrued liabilities was $21,476,206 and $17,423,378, respectively. The details of the balances are identified in the following table.
| | | | | | |
| | | December 31,
2008 | | December 31,
2007 |
Accrued payroll, benefits and bonuses | | $ | 7,676,269 | | $ | 7,271,593 |
Fair value of derivative instruments | | | 7,243,574 | | | 3,126,003 |
Deferred rent | | | 3,397,941 | | | 3,754,365 |
Accrued general and administrative expenses | | | 2,128,355 | | | 2,003,463 |
Accrued interest expenses | | | 870,829 | | | 974,900 |
Other accrued expenses | | | 159,238 | | | 293,054 |
| | | | | | |
Total accrued liabilities | | $ | 21,476,206 | | $ | 17,423,378 |
| | | | | | |
Concentrations of Risk
For the years ended December 31, 2008 and 2007, the Company invested 58.4% and 36.8%, respectively, in purchased receivables from its top three sellers. The top three sellers were different in each of the twelve month periods presented.
Interest Expense
Interest expense included interest on the Company’s credit facilities, unused facility fees, the ineffective portion of the change in fair value of the Company’s derivative financial instrument (refer to Note 4, “Derivative Financial Instruments and Risk Management”) and amortization of deferred financing costs. During the year ended December 31, 2008, the Company recorded interest expense of $13,023,938, including the amortization of $593,737 in deferred financing costs. During the year ended December 31, 2007, the Company recorded interest expense of $8,145,456, including the amortization of $601,532 in deferred financing costs.
F-14
In addition, interest expense of $87,229 and $2,630 related to software development for internal use was capitalized for the year ended December 31, 2008 and 2007, respectively.
Use of Estimates
The preparation of financial statements in conformity with accounting principles generally accepted in the United States requires management to make estimates and assumptions that affect the reported amounts of assets and liabilities and disclosure of contingent assets and liabilities at the date of the financial statements and the reported amounts of revenues and expenses during the reporting period. Actual results could differ from those estimates.
Earnings Per Share
Earnings per share reflect net income divided by the weighted-average number of shares outstanding. Diluted weighted-average shares outstanding at December 31, 2008 and 2007, respectively, included 26,286 and 87,234 dilutive shares related to outstanding options, deferred stock units, restricted shares and restricted share units (the “Share-Based Awards”). There were 821,763 and 485,849 outstanding Share-Based Awards that were not included within the diluted weighted-average shares as their fair value or exercise price exceeded the market price of the Company’s stock at December 31, 2008 and 2007, respectively. As such, they were anti-dilutive.
Goodwill and Other Intangible Assets
Intangible assets with finite lives arising from business combinations are amortized over their estimated useful lives, ranging from five to seven years, using the straight-line and double-declining methods. As prescribed by SFAS 142, “Goodwill and Other Intangible Assets” (“SFAS 142”), goodwill and trademark and trade names with indefinite lives are not amortized. Goodwill and other intangible assets are reviewed annually to assess recoverability or more frequently if impairment indicators are present, in accordance with SFAS 142. Impairment charges are recorded for intangible assets when the estimated fair value is less than the book value of that asset.
The first step of the goodwill impairment test compares the fair value of a reporting unit with the book value, including goodwill. If the fair value of the reporting unit exceeds its book value, goodwill is considered not impaired. The estimate of fair value of the Company’s reporting unit, the purchased receivables operating segment, is determined using various valuation techniques, including market capitalization and an analysis of discounted cash flows. At the time of the Company’s annual goodwill impairment test in the fourth quarter of 2008, market capitalization was substantially higher than book value and goodwill was considered not to be impaired. Given recent declines in the Company’s stock price, a discounted cash flow analysis was also performed. The fair value of goodwill using a discounted cash flow analysis also exceeded the book value as of December 31, 2008; therefore, an impairment was not recognized.
The annual impairment test for other intangible assets not subject to amortization, for example, trademark and trade names, consists of a comparison of the fair value of the intangible asset with its carrying value. The Company performed a discounted cash flow analysis of trademark and trade names as of December 31, 2008 and determined that no impairment charges were required.
During the quarter ended March 31, 2008, the Company decided to no longer service medical receivables on a contingent fee basis. As a result, the Company recognized an impairment charge of $445,651, the net book value of intangible assets for customer contracts and relationships associated with the contingent collection business. During the fourth quarter of 2007, one associate was released from his non-compete and employment agreements, which led to a $266,667 impairment for the remaining book value. Refer to Note 5, “Property and Equipment” for further information on an additional impairment of assets. These impairments are recorded in “Impairment of assets” in the consolidated statements of operations.
F-15
Goodwill and other intangible assets, with indefinite lives that are not amortized, consisted of the following:
| | | | | | |
| | | December 31,
2008 | | December 31,
2007 |
Goodwill | | $ | 14,323,071 | | $ | 14,323,071 |
Trademark and trade names | | | 1,980,000 | | | 1,980,000 |
| | | | | | |
Total goodwill and other intangible assets | | $ | 16,303,071 | | $ | 16,303,071 |
| | | | | | |
Other intangible assets, having original estimated useful lives ranging from five to seven years consisted of the following:
| | | | | | | | |
| | | December 31,
2008 | | | December 31,
2007 | |
Non-compete agreements | | $ | 1,000,000 | | | $ | 1,060,000 | |
Customer contracts and relationships | | | — | | | | 830,000 | |
Other intangible assets | | | 840,000 | | | | 840,000 | |
| | | | | | | | |
Total other intangible assets | | | 1,840,000 | | | | 2,730,000 | |
Less accumulated amortization | | | (1,366,883 | ) | | | (1,568,383 | ) |
| | | | | | | | |
Net other intangible assets | | $ | 473,117 | | | $ | 1,161,617 | |
| | | | | | | | |
The accumulated amortization is netted against other intangible assets, which is included in “Goodwill and other intangible assets” in the consolidated statements of financial position. Amortization expense was $242,849, $608,927 and $532,767 for the years ended December 31, 2008, 2007 and 2006, respectively. Estimated amortization expense for intangible assets subject to amortization at December 31, 2008 is as follows:
| | | |
Year | | Expense |
2009 | | $ | 206,450 |
2010 | | | 200,000 |
2011 | | | 66,667 |
Thereafter | | | — |
| | | |
Totals | | $ | 473,117 |
| | | |
Comprehensive Income
Components of comprehensive income are changes in equity other than those resulting from investments by owners and distributions to owners. Net income is the primary component of comprehensive income. The Company’s only component of comprehensive income other than net income is the change in unrealized gain or loss on derivatives qualifying as cash flow hedges, net of income taxes. The aggregate amount of such changes to equity that have not yet been recognized in net income are reported in the equity portion of the accompanying consolidated statements of financial position as accumulated other comprehensive loss, net of income taxes.
Fair Value of Financial Instruments
The fair value of financial instruments is estimated using available market information and other valuation methods. Refer to Note 11, “Estimated Fair Value of Financial Instruments” for more information.
Reclassifications
Certain amounts in the prior periods presented have been reclassified to conform to the current period financial statement presentation. These reclassifications have no material effect on previously reported consolidated statements of financial position, operations or cash flows.
F-16
Recently Issued Accounting Pronouncements
SFAS No. 141 (R), “Business Combinations” and SFAS No. 160, “Noncontrolling Interests in Consolidated Financial Statements, an amendment of ARB No. 51”
In December 2007, the FASB issued SFAS No. 141(R), “Business Combinations”, (“SFAS 141(R)”), and SFAS No. 160, “Noncontrolling Interests in Consolidated Financial Statements, an amendment of ARB No. 51”, (“SFAS 160”). These pronouncements are required to be adopted concurrently and are effective for business combination transactions for which the acquisition date is on or after the beginning of the first annual reporting period beginning on or after December 15, 2008. Early adoption is prohibited, thus the provisions of these pronouncements will be effective for the Company in fiscal year 2009. The adoption of SFAS 141(R) is not expected to have a material impact on the Company’s consolidated statements of financial position, operations or cash flows at this time.
SFAS 161, “Disclosures about Derivative Instruments and Hedging Activities”
In March 2008, the FASB issued SFAS 161, “Disclosures about Derivative Instruments and Hedging Activities” (“SFAS 161”). SFAS 161 requires expanded disclosures regarding the location and amounts of derivative instruments in an entity’s financial statements, how derivative instruments and related hedged items are accounted for under SFAS 133, “Accounting for Derivative Instruments and Hedging Activities”, and how derivative instruments and related hedged items affect an entity’s financial position, operating results and cash flows. SFAS 161 is effective for periods beginning on or after November 15, 2008. The adoption of SFAS 161 is not expected to have a material impact on the Company’s consolidated statements of financial position, operations or cash flows.
FASB Staff Position 142-3 “Determination of the Useful Life of Intangible Assets”
In April 2008, the FASB issued Staff Position (“FSP”) 142-3, “Determination of the Useful Life of Intangible Assets”, (“FSP 142-3”). FSP 142-3 amends the factors that should be considered in developing renewal or extension assumptions used to determine the useful life of a recognized intangible asset under SFAS No. 142, “Goodwill and Other Intangible Assets”. FSP 142-3 is effective for fiscal years beginning after December 15, 2008. The adoption of FSP 142-3 is not expected to have a material impact on the Company’s consolidated statements of financial position, operations and cash flows at this time.
SFAS No. 162, “The Hierarchy of Generally Accepted Accounting Principles”
In May 2008, the FASB issued SFAS No. 162 “The Hierarchy of Generally Accepted Accounting Principles” (“SFAS 162”). SFAS 162 identifies the sources of accounting principles generally accepted in the United States. SFAS 162 is effective November 15, 2008. The adoption of SFAS 162 did not have a material impact on the Company’s consolidated statements of financial position, operations or cash flows.
2. Recapitalization
On April 24, 2007, the Company announced a recapitalization plan (the “Recapitalization Plan”) to return $150,000,000 to the Company’s shareholders. Pursuant to the Recapitalization Plan, on June 12, 2007, the Company completed a modified “Dutch auction” tender offer, resulting in the repurchase of 1,982,250 of the Company’s common shares for an aggregate purchase price of $37,167,188, or $18.75 per share.
On June 28, 2007, under a repurchase agreement announced on April 24, 2007, the Company purchased shares from (i) its largest shareholder, (ii) its then Chairman, President and Chief Executive Officer, and (iii) its Senior Vice President and Chief Financial Officer. These shareholders elected not to tender any shares in the tender offer and the repurchase agreement allowed them to maintain their pro rata beneficial ownership interest
F-17
in the Company after giving effect to the tender offer and purchases under the repurchase agreement. The Company repurchased 2,017,750 common shares from these shareholders for an aggregate price of $37,832,813, or $18.75 per share.
On June 18, 2007, the Company’s Board of Directors declared a special one-time cash dividend of $2.45 per share, or $74,891,700 in aggregate, which was paid on July 31, 2007 to holders of record on July 19, 2007.
In order to fund these transactions, the Company obtained a $150,000,000 term loan through a new credit agreement aggregating $250,000,000, which was funded on June 12, 2007, and terminated its former credit agreement. Refer to Note 3, “Notes Payable” for further information.
As a result of the payment of the special one-time cash dividend, the Company adjusted the number of deferred stock units outstanding under the Company’s 2004 stock incentive plan, as amended, and also changed the exercise price and number of outstanding stock options issued under the 2004 stock incentive plan, as amended, in order to avoid dilution to holders of the deferred stock units and outstanding stock options. Refer to Note 8, “Share-Based Compensation” for further information.
During the year ended December 31, 2007, the Company incurred $1,100,085 in transaction costs associated with the Dutch auction tender offer and recorded these costs as a reduction in stockholders’ equity. In addition, the Company incurred $2,315,088 in fees, which were recorded as a deferred financing cost and included in other assets in the consolidated statements of financial position.
3. Notes Payable
The new credit agreement with JPMorgan Chase Bank, N.A., as administrative agent, and a syndicate of lenders named therein, that originated on June 5, 2007 was amended on March 10, 2008 (the “Amended New Credit Agreement”). Under the terms of the Amended New Credit Agreement, the Company has a five-year $100,000,000 revolving credit facility (the “Revolving Credit Facility”) and a six-year $150,000,000 term loan facility (the “Term Loan Facility” and, together with the Revolving Credit Facility, the “Amended New Credit Facilities”). The Amended New Credit Facilities bear interest at prime or up to 125 basis points over prime depending upon the Company’s liquidity, as defined in the Amended New Credit Agreement. Alternately, at the Company’s discretion, the Company may borrow by entering into one, two, three, six or twelve-month contracts based on the London Inter Bank Offer Rate (“LIBOR”) at rates between 150 to 250 basis points over the respective LIBOR rates, depending on the Company’s liquidity. The Company’s Revolving Credit Facility includes an accordion loan feature that allows it to request a $25,000,000 increase as well as sublimits for $10,000,000 of letters of credit and for $10,000,000 of swingline loans. The Amended New Credit Agreement is secured by a first priority lien on all of the Company’s assets. The Amended New Credit Agreement also contains certain covenants and restrictions that the Company must comply with, which, as of December 31, 2008 were:
| | • | | Leverage Ratio (as defined) cannot exceed (i) 1.25 to 1.0 at any time on or before June 29, 2009, (ii) 1.125 to 1.0 at any time on or after June 30, 2009 and on or before December 30, 2010 or (iii) 1.0 to 1.0 at any time thereafter; |
| | • | | Ratio of Consolidated Total Liabilities to Consolidated Tangible Net Worth cannot exceed (i) 2.5 to 1.0 at any time on or before December 30, 2009, (ii) 2.25 to 1.0 at any time on or after December 31, 2009 and on or before December 30, 2010, (iii) 2.0 to 1.0 at any time on or after December 31, 2010 and on or before December 30, 2011 or (iv) 1.5 to 1.0 to any time thereafter; and |
| | • | | Consolidated Tangible Net Worth must equal or exceed $80,000,000 plus 50% of positive consolidated net income for three consecutive fiscal quarters ending December 31, 2007 and for each fiscal year ending thereafter, such amount to be added as of December 31, 2007 and as of the end of each such fiscal year thereafter. |
F-18
The Amended New Credit Agreement contains a provision that requires the Company to repay Excess Cash Flow, as defined, to reduce the indebtedness outstanding under its Amended New Credit Agreement. The annual repayment of the Company’s Excess Cash Flow is first effective with the issuance of our audited consolidated financial statements for fiscal year 2008 and is generally due within 10 days of the issuance of the annual financial statements. The repayment provisions are:
| | • | | 50% of the Excess Cash Flow for such fiscal year if the Leverage Ratio was greater than 1.0 to 1.0 as of the end of such fiscal year; |
| | • | | 25% of the Excess Cash Flow for such fiscal year if the Leverage Ratio was less than or equal to 1.0 to 1.0 but greater than 0.875 to 1.0 as of the end of such fiscal year; or |
| | • | | 0% if the Leverage Ratio is less than or equal to 0.875 to 1.0 as of the end of such fiscal year. |
Commitment fees on the unused portion of the Revolving Credit Facility are paid quarterly, in arrears, and are calculated as an amount equal to a margin of 0.25% to 0.50%, depending on the Company’s liquidity, on the average amount available on the Revolving Credit Facility.
The Amended New Credit Agreement requires the Company to effectively cap, collar or exchange interest rates on a notional amount of at least 25% of the outstanding principal amount of the Term Loan Facility. Refer to Note 4, “Derivative Financial Instruments and Risk Management” for additional information.
The Company had $181,550,000 and $191,250,000 principal balance outstanding on its Amended New Credit Facilities at December 31, 2008 and 2007, respectively, of which $147,750,000 and $149,250,000 was part of the new Term Loan Facility at December 31, 2008 and 2007, respectively, and $33,800,000 and $42,000,000 was part of the new Revolving Credit Facility at December 31, 2008 and 2007, respectively. The Term Loan Facility requires quarterly repayments totaling $1,500,000 annually until March 2013 with the remaining balance due in June 2013. The Company has a required prepayment of approximately $2,400,000 of principal on its Term Loan Facility as of December 31, 2008. This prepayment is related to the excess cash flow for the twelve months ended December 31, 2008. The weighted average interest rates on the amount outstanding at December 31, 2008 and 2007 were 5.62% and 7.18%, respectively.
The Company believes it is in compliance with all terms of the Amended New Credit Agreement as of December 31, 2008.
Termination of Former Credit Agreement. On June 12, 2007, the initial funding occurred under the new credit agreement and, as a result, the Company’s former credit agreement, dated as of December 31, 2002, as amended, with JPMorgan Chase, N.A., as agent, and syndicate of lenders named therein, which contained a $100,000,000 revolving credit facility, terminated. The former credit agreement was scheduled to expire in May 2008. The Company incurred no penalties or prepayment premiums in connection with early termination of the former credit agreement. Under the terms of the former credit agreement, the Company paid interest at prime or 25 basis points over prime depending upon the Company’s liquidity, as defined in the former credit agreement. Alternately, at the Company’s discretion, it could have borrowed by entering into one, two or three-month LIBOR contracts at rates between 150 to 250 basis points over the respective LIBOR rates, depending on the Company’s liquidity. The Company’s former credit agreement included an accordion loan feature that allowed it to request a $20,000,000 increase in the credit facility.
4. Derivative Financial Instruments and Risk Management
Risk Management
The Company may periodically enter into derivative financial instruments, typically interest rate swap agreements, to reduce its exposure to fluctuations in interest rates on variable-rate debt and their impact on earnings and cash flows. The Company does not utilize derivative financial instruments with a level of
F-19
complexity or with a risk greater than the exposure to be managed nor does it enter into or hold derivatives for trading or speculative purposes. The Company periodically reviews the creditworthiness of the swap counterparty to assess the counterparty’s ability to honor its obligation.
Based on the provisions of SFAS No. 133, “Accounting for Derivative Instruments and Hedging Activities” as amended and interpreted; the Company records derivative financial instruments at fair value. Refer to Note 11, “Estimated Fair Value of Financial Instruments” for additional information. Counterparty default would expose the Company to fluctuations in variable interest rates.
Derivative Financial Instruments
In September 2007, the Company entered into an amortizing interest rate swap agreement whereby, on a quarterly basis, it swaps variable rates under its Term Loan Facility for fixed rates. At inception and for the first year, the notional amount of the swap was $125,000,000. Every year thereafter, on the anniversary of the swap agreement the notional amount will decrease by $25,000,000. As of December 31, 2008, the notional amount is $100,000,000. This swap agreement expires on September 13, 2012.
The Company’s financial derivative instrument is designated and qualifies as a cash flow hedge, and the effective portion of the gain or loss on such hedge is reported as a component of other comprehensive income in the consolidated financial statements. To the extent that the hedging relationship is not effective, the ineffective portion of the change in fair value of the derivative is recorded in other income (expense). For the years ended December 31, 2008 and 2007, the ineffective portion of the change in fair value of the derivative recorded in earnings was $2,642 and $4,935, respectively. Hedges that receive designated hedge accounting treatment are evaluated for effectiveness at the time that they are designated as well as through the hedging period.
The fair value of the Company’s cash flow hedge has been recorded as a liability and is included with accrued liabilities in the consolidated statements of financial position. The fair value of the liability was $7,243,574 and $3,126,003 at December 31, 2008 and 2007, respectively. Changes in fair value were recorded as an adjustment to other comprehensive income, net of tax, of $4,664,862 and $2,012,127 at December 31, 2008 and 2007, respectively. Amounts in other comprehensive income will be reclassified into earnings under certain situations; for example, if the occurrence of the transaction is no longer probable or no longer qualifies for hedge accounting. The Company does not expect to reclassify any amount currently included in other comprehensive income into earnings within the next 12 months.
5. Property and Equipment
Property and equipment, having estimated useful lives ranging from three to ten years consisted of the following:
| | | | | | | | |
| | | December 31,
2008 | | | December 31,
2007 | |
Computers and software | | $ | 15,341,320 | | | $ | 12,838,395 | |
Furniture and fixtures | | | 10,340,371 | | | | 10,074,927 | |
Leasehold improvements | | | 2,264,658 | | | | 2,156,864 | |
Equipment under capital lease | | | — | | | | 133,063 | |
Automobiles | | | — | | | | 51,709 | |
| | | | | | | | |
Total property and equipment, cost | | | 27,946,349 | | | | 25,254,958 | |
Less accumulated depreciation and amortization | | | (15,419,532 | ) | | | (14,248,300 | ) |
| | | | | | | | |
Net property and equipment | | $ | 12,526,817 | | | $ | 11,006,658 | |
| | | | | | | | |
Property and equipment is recorded at cost. Expenditures for repairs and maintenance are charged to operations as incurred. Material leasehold improvements are capitalized and depreciated over the remaining life
F-20
of the lease. The Company records depreciation and amortization expense on a straight-line basis with lives ranging from three to ten years. During the fourth quarter of 2008, the Company decided to discontinue the implementation of a software product. As a result, the Company recognized an impairment charge of $170,692, the amount previously invested to implement this product, in “Impairment of assets” in the consolidated statements of operations. Refer to “Goodwill and Other Intangible Assets” within Note 1, “Basis of Presentation and Summary of Significant Accounting Policies” for further information on additional impairment of assets. Depreciation and amortization expense was $3,711,953, $3,666,005 and $3,646,439 for property and equipment for the years ended December 31, 2008, 2007 and 2006, respectively.
The Company capitalizes qualifying computer software development costs according to SOP 98-1 “Accounting for the Costs of Computer Software Developed or Obtained for Internal Use”. Costs incurred during the application development stage are capitalized and amortized over the software’s useful life on a straight-line basis, beginning when the project is completed. Costs associated with preliminary project stage activities, training, maintenance and all other post implementation stage activities are expensed as incurred. The Company’s policy provides for the capitalization of certain direct payroll costs for employees who are directly associated with internal use computer software projects, as well as external direct costs of services associated with developing or obtaining internal use software, including interest expense. Capitalizable personnel costs are limited to the time directly spent on such projects. As of December 31, 2008, the Company capitalized $257,443 of these direct payroll costs related to software developed for internal use. There were no capitalized direct payroll costs related to software developed for internal use during the twelve months ended December 31, 2007.
6. Associate Benefits
The Company maintains a defined contribution profit sharing plan with 401(k) features for substantially all associates. Associates may contribute up to the annual maximum amount determined by the Internal Revenue Service ($15,500 for 2008) to the plan each year. Effective January 1, 2007, the Company amended its plan to provide a match for each eligible participant’s salary deferrals. The Company matched 100% on the first 3% contributed by each participant’s salary deferrals and matched 50% on the next 3% contributed by each participant’s salary deferrals. The Company’s match was contributed each pay period for 2008. The Company contributed a “safe harbor” contribution, as defined by the Internal Revenue Service, of 3% of each eligible participant’s compensation, as defined, to the plan for 2006. The Company’s related expense was $1,817,208, $1,868,280 and $1,277,087 for the years ended December 31, 2008, 2007 and 2006, respectively. The unpaid contribution was $116,002 and $118,548 as of December 31, 2008 and 2007, respectively. The unpaid contribution is included in “Accrued Liabilities” in the consolidated statements of financial position.
The Company is self-insured for health and prescription drug benefits. Amounts charged to expense for health and prescription drug benefits, related administration and stop-loss insurance premiums were $7,835,525, $7,850,823 and $6,986,404 for the years ended December 31, 2008, 2007 and 2006, respectively, and was based on actual and estimated claims incurred. Accrued liabilities on the consolidated statements of financial position include $540,000 and $701,000 for estimated health and drug benefits incurred but not paid for as of December 31, 2008 and 2007, respectively.
7. Restructuring Charges
The Company recognizes costs associated with exit or disposal activities in accordance with SFAS No. 146, “Accounting for Costs Associated with Exit or Disposal Activities” (“SFAS 146”). Examples of costs covered by SFAS 146 include associate termination benefits, contract termination costs and other costs to consolidate or close facilities and relocate associates.
F-21
In order to eliminate excess office capacity and to increase efficiency, on March 1, 2007, the Company announced plans to close its White Marsh, Maryland and Wixom, Michigan offices during 2007. In conjunction with these office closures, the Company incurred $906,497 in restructuring charges. Restructuring charges include one-time associate termination benefits of $361,021, contract termination costs of $470,975 for the remaining lease payments on the Wixom, Michigan office, and other exit costs of $74,501. On August 31, 2007, the Company concluded the sale of the White Marsh, Maryland office, which included the sale of tangible assets located in the office and intangible assets associated with the office. These sale proceeds of $271,308 are included in pre-tax loss on disposal of equipment.
These expenses are included in “Restructuring charges” in the consolidated statements of operations. There were no restructuring charges in 2008 or 2006.
8. Share-Based Compensation
The Company recognized share-based compensation in accordance with SFAS No. 123(R), “Share-Based Payment”, a revision of SFAS 123, “Accounting for Stock-Based Compensation”, using the modified prospective application. SFAS 123(R) requires all stock-based compensation awards granted to associates to be recognized in the consolidated financial statements at fair value, similar to that prescribed under SFAS 123.
The Company adopted a stock incentive plan (the “Stock Incentive Plan”) during February 2004 that authorizes the use of stock options, stock appreciation rights, restricted stock grants and units, performance share awards and annual incentive awards to eligible key associates, non-associate directors and consultants. The Company has reserved 3,700,000 shares of common stock for issuance in conjunction with all options and other stock-based awards to be granted under the plan and 2,673,763 shares are available for issuance, excluding outstanding stock-based awards. The purpose of the plan is (1) to promote the best interests of the Company and its stockholders by encouraging associates and other participants to acquire an ownership interest in the Company, thus aligning their interests with those of stockholders and (2) to enhance the ability of the Company to attract and retain qualified associates, non-associate directors and consultants. No participant may be granted options during any one fiscal year to purchase more than 500,000 shares of common stock.
The Company amended its Stock Incentive Plan in May 2007 to expand an anti-dilution provision of the plan. The additional compensation expense resulting from the amendment to the Stock Incentive Plan for the year ended December 31, 2007 was $ $526,757.
As discussed in Note 2, “Recapitalization” the Company commenced a recapitalization transaction, including declaration of a special one-time cash dividend, in the quarter ended June 30, 2007. The payment of the special one-time cash dividend resulted in an increase in the number of deferred stock units outstanding and a change to the exercise price and number of outstanding stock options under the anti-dilution provisions of the Stock Incentive Plan. The methodology used to adjust the awards was consistent with Internal Revenue Code Section 409A and 424 and the proposed regulations promulgated thereunder, compliance with which was necessary to avoid adverse tax issues for the holders of awards. Such methodology also results in the fair value of the adjusted awards post-dividend to be equal to that of the unadjusted awards pre-dividend. The result is that there is no additional compensation expense in accordance with accounting for modifications to awards under SFAS 123(R).
Based on historical experience, the Company used an annual forfeiture rate of 15% for associate grants. Grants made to non-associate directors have no forfeiture rates associated with them due to immediate vesting of grants to this group.
The Company’s share-based compensation arrangements are described below.
F-22
Stock Options
The Company utilizes the Whaley Quadratic approximation model, an intrinsic value method, to calculate the fair value of the stock awards on the date of grant using the assumptions noted in the following table. In addition, changes to the subjective input assumptions can result in different fair market value estimates. With regard to the Company’s assumptions stated below, the expected volatility is based on the historical volatility of the Company’s stock and management’s estimate of the volatility over the contractual term of the options. The expected term of the option is based on management’s estimate of the period of time for which the options are expected to be outstanding. The risk-free rate is derived from the five-year U.S. Treasury yield curve on the date of grant.
| | | | | | | | | |
Options issue year: | | 2008 | | | 2007 | | | 2006 | |
Expected volatility | | 46.50 | % | | 45.30%-46.92 | % | | 46.00 | % |
Expected dividends | | 0.00 | % | | 0.00 | % | | 0.00 | % |
Expected term | | 5 Years | | | 5 Years | | | 5 Years | |
Risk-free rate | | 3.09 | % | | 3.42%-4.98 | % | | 4.55%-5.02 | % |
As of December 31, 2008, the Company had options outstanding for 712,991 shares of its common stock under the Stock Incentive Plan. These options have been granted to key associates and non-associate directors of the Company. Option awards are generally granted with an exercise price equal to the market price of the Company’s stock at the date of grant and have 10-year contractual terms. The options granted to key associates generally vest between one and five years from the grant date whereas the options granted to non-associate directors generally vest immediately. The fair values of the stock options are expensed on a straight-line basis over the vesting period. The related expense for the year ended December 31, 2008 included $205,045 in administrative expenses for non-associate directors and $295,743 in salaries and benefits expense for associates. The related expense for the year ended December 31, 2007 included $1,086,378 in administrative expenses for non-associate directors and $195,078 in salaries and benefits expense for associates. Included in this expense is $476,266 in administrative expenses and $50,491 in salaries and benefits expense relating to the 2007 amendment to the Stock Incentive Plan. The related expense for the year ended December 31, 2006 included $1,237,760 in administrative expenses for non-associate directors and $63,479 in salaries and benefits expense for associates. The total tax benefit recognized in the consolidated statements of operations was $190,800, $486,953 and $486,663 for the years ended December 31, 2008, 2007 and 2006, respectively. The following summarizes all stock option related transactions from January 1, 2008 through December 31, 2008:
| | | | | | | | | | | |
| | | Options
Outstanding | | | Weighted-Average
Exercise Price | | Weighted-Average
Remaining
Contractual Term | | Aggregate
Intrinsic
Value |
| | | | | | | | (in years) | | |
January 1, 2008 | | 691,599 | | | $ | 14.03 | | | | | |
Granted | | 42,500 | | | | 13.21 | | | | | |
Exercised | | — | | | | — | | | | | |
Forfeited or expired | | (21,108 | ) | | | 17.13 | | | | | |
| | | | | | | | | | | |
Outstanding at December 31, 2008 | | 712,991 | | | | 13.89 | | 7.50 | | $ | — |
| | | | | | | | | | | |
Exercisable at December 31, 2008 | | 519,595 | | | $ | 15.29 | | 7.11 | | $ | — |
| | | | | | | | | | | |
The weighted-average fair value of the options granted during the years ended December 31, 2008, 2007 and 2006 was $5.86, $4.94 and $6.78, (as adjusted for the special one-time cash dividend paid on July 31, 2007), respectively. The total intrinsic value of options exercised during the year ended December 31, 2006 was $30,000.
As of December 31, 2008, there was $834,997 of total unrecognized compensation expense related to nonvested stock options granted under the Stock Incentive Plan. The total unrecognized compensation expense is
F-23
comprised of $741,794 for options expected to vest and $93,203 for options not expected to vest. The unrecognized compensation expense for options expected to vest is expected to be recognized over a weighted-average period of 2.68 years.
Cash received from options exercised during the year ended December 31, 2006 was $283,350 and the actual tax benefit realized for the tax deductions was $11,220 for the year ended December 31, 2006. No options were exercised during 2008 and 2007.
Deferred Stock Units
As of December 31, 2008, the Company had granted 23,681 deferred stock units (“DSUs”) of its common stock to non-associate directors under the Company’s 2004 Stock Incentive Plan. DSUs represent the Company’s obligation to deliver one share of common stock for each unit at a later date elected by the Director, such as when the Director’s service on the Board ends. DSUs have no vesting provisions and are not subject to forfeiture. DSUs do not have voting rights but would receive common stock dividend equivalents in the form of additional DSUs. The value of each DSU is equal to the market price of the Company’s stock at the date of grant.
The fair value of the DSUs granted during the year ended December 31, 2008 was expensed immediately to correspond with the vesting schedule. The related expense for the years ended December 31, 2008 and 2007 included $125,019 and $120,533 in administrative expenses, respectively. There were no DSUs granted or outstanding during the year ended December 31, 2006.
The following summarizes all DSU related transactions from January 1, 2008 through December 31, 2008.
| | | | | |
| | | DSUs | | Weighted-Average
Grant-Date
Fair Value |
January 1, 2008 | | 8,965 | | $ | 13.44 |
Granted | | 14,716 | | | 8.50 |
| | | | | |
Balance at December 31, 2008 | | 23,681 | | $ | 10.37 |
| | | | | |
There was no unrecognized compensation expense related nonvested share-based compensation arrangement granted with DSUs for the years ended December 31, 2008 and 2007.
Restricted Shares and Restricted Share Units
The Company grants restricted shares and restricted share units (restricted shares and restricted share units are referred to as “RSUs”) to key associates and non-associate directors under the Stock Incentive Plan. Each RSU is equal to one share of the Company’s common stock. The value of the RSUs is equal to the market price of the Company’s stock at the date of grant. The RSUs granted to associates generally vest over two to four years based upon service or performance conditions. RSUs granted to non-associate directors generally vest when the non-associate director terminates his or her board service.
The fair value of the RSUs is expensed on a straight-line basis over the requisite service period based on the number of RSUs that are expected to vest. For RSUs with performance conditions, if goals are not expected to be met, the compensation expense previously recognized is reversed. The related expense for the year ended December 31, 2008 included $154,147 in administrative expenses for non-associate directors and $525,344 in salaries and benefits expense for associates, which included a reversal of $99,240 for RSUs not expected to vest. The related expense for the year ended December 31, 2007 included $56,779 in salaries and benefits expense for associates, which included a reversal of $119,916 for RSUs not expected to vest. The related expense for the year ended December 31, 2006 included $119,916 in salaries and benefits expense for associates.
F-24
The Company issues shares of common stock for RSUs as they vest. During 2008, 49,955 shares of common stock were issued for vested RSUs. The following summarizes all RSU related transactions from January 1, 2008 through December 31, 2008.
| | | | | | |
Nonvested RSUs | | RSUs | | | Weighted-Average
Grant-Date
Fair Value |
Nonvested at January 1, 2008 | | 290,760 | | | $ | 11.12 |
Granted | | 14,169 | | | | 13.21 |
Issued (vested) | | (49,955 | ) | | | 10.85 |
Forfeited | | (30,364 | ) | | | 18.88 |
| | | | | | |
Nonvested at December 31, 2008 | | 224,610 | | | $ | 10.27 |
| | | | | | |
As of December 31, 2008, there was $1,991,869 of total unrecognized compensation expense related to the nonvested RSUs. The total unrecognized compensation expense is comprised of $949,119 for RSUs expected to vest and $1,042,750 for shares not expected to vest. The unrecognized compensation expense for RSUs expected to vest is expected to be recognized over a weighted-average period of 2.30 years.
9. Contingencies
Litigation Contingencies
The Company is involved in certain legal matters that management considers incidental to its business. The Company recognizes liabilities for contingencies and commitments when a loss is probable and estimable. The company recognizes expense for defense costs when incurred.
Management has evaluated pending and threatened litigation against the Company as of December 31, 2008 and does not believe exposure to be material.
10. Long-Term Commitments
Leases
The Company accounts for leasing arrangements according to SFAS 13 “Accounting for Leases”. The Company has several operating leases outstanding which are primarily for office space. The leases expire at various dates through 2016 and may provide renewal options. The total amount of rental payments due over the lease term are charged to rent expense using the straight-line method over the term of the lease. The difference between rent expense recorded and the amount paid is credited or charged to “Deferred rent”, which is included with “Accrued liabilities” in the consolidated statements of financial position. Total rent expense related to operating leases was $6,134,193, $7,406,696 and $7,334,989 for the years ended December 31, 2008, 2007 and 2006, respectively.
The following is a schedule of future minimum lease payments under operating leases as of December 31, 2008:
| | | |
| | | Operating
Leases |
Years ending December 31: | | | |
2009 | | $ | 5,551,916 |
2010 | | | 4,611,233 |
2011 | | | 4,321,372 |
2012 | | | 4,020,146 |
2013 | | | 3,642,407 |
2014 and thereafter | | | 8,995,391 |
| | | |
Total minimum lease payments | | $ | 31,142,465 |
| | | |
F-25
Other Long-Term Commitments
The Company’s Term Loan Facility requires quarterly repayments totaling $1,500,000 annually until March 2013 with the remaining balance due in June 2013. To the extent that a balance is outstanding on the Company’s Revolving Credit Facility, it would be due in June 2012, or earlier as defined in the Amended New Credit Agreement. Refer to Note 3, “Notes Payable”, for more details about the Company’s Credit Facilities. The Company has contractual interest due on derivative instruments totaling $11,286,389 through September 2012.
Employment Agreements
The Company has three employment agreements with certain members of management. Such agreements call for the payment of base compensation and certain benefits, such as medical insurance and prorated bonuses. One of the three employment agreements automatically renews on its expiration date for one year unless the executive or the Company terminates the employment agreement in writing. The agreements also include confidentiality and non-compete provisions.
Registration Rights Agreement
The Company has a registration rights agreement with certain stockholders. Pursuant to the agreement, the Company will pay all costs related to any secondary securities offering requested by these stockholders and the stockholders may sell any outstanding shares owned by them. The Company filed a registration statement on behalf of one of the selling stockholders in 2008 to register 10,932,051 shares of common stock currently held by the stockholder and paid $45,246 costs related to the registration statement. The selling stockholders collectively retain the right to request two additional registrations of specified shares under the registration rights agreement, in which case, the Company will be required to bear applicable offering expenses in the quarter in which any future offering occurs.
Forward Flow Agreements
The Company is party to several forward flow agreements that allow for the purchase of defaulted consumer receivables at pre-established prices. The expected remaining amount to be purchased under existing forward flow agreements at December 31, 2008 is $46,332,000.
11. Estimated Fair Value of Financial Instruments
The accompanying financial statements include estimated fair value information as of December 31, 2008 and 2007, as required by SFAS No. 107, “Disclosures About Fair Value of Financial Instruments”. In addition, the Company adopted SFAS No. 157, “Fair Value Measurements” (“SFAS 157”) as of January 1, 2008 as it applies to financial assets and liabilities. SFAS 157 defines fair value, establishes a framework for measuring fair value, and expands disclosures about fair value measurements. SFAS 157 applies where other accounting pronouncements require or permit fair value measurements; it does not require any new fair value measurements. The adoption of SFAS 157 did not have a material impact on the Company’s consolidated statements of financial position, operations or cash flows.
According to FASB Staff Position No. FAS 157-2, the application of SFAS 157 to certain non-financial assets and liabilities, including goodwill and other indefinite-lived assets, was deferred to fiscal years beginning after November 15, 2008. The Company’s goodwill and other indefinite-lived intangible assets tested for impairment on a recurring basis and the deferral of SFAS 157 applies to these terms.
The Company has chosen not to adopt SFAS No. 159, “Fair Value Option” (“SFAS” 159). SFAS 159 allows entities to choose to measure eligible financial instruments and certain other items at fair value, that are not otherwise required to be measured at fair value.
F-26
As required under SFAS 157, the Company groups assets and liabilities at fair value in three levels, based on the markets in which the assets and liabilities are traded and the reliability of the assumptions used to determine fair value. These levels are:
Level 1—Valuation is based upon quoted prices for identical instruments traded in active markets.
Level 2—Valuation is based upon quoted prices for similar instruments in active markets, quoted prices for
identical or similar instruments in markets that are not active, and model-based valuation techniques for which all significant assumptions are observable in the market.
Level 3—Valuation is generated from model-based techniques that use at least one significant assumption
not observable in the market. These unobservable assumptions reflect estimates of assumptions that market participants would use in pricing the asset or liability.
Disclosure of the estimated fair values of financial instruments often requires the use of estimates. The Company uses the following methods and assumptions to estimate the fair value of financial instruments.
Interest Rate Swap Agreement
The fair value of the interest rate swap agreement represents the amount the Company would receive or pay to terminate or otherwise settle the contract at the consolidated statements of financial position date, taking into consideration current unearned gains and losses. The interest rate swap agreement was valued using Level 2 inputs, which are inputs other than quoted prices that are observable, either directly or indirectly. The fair value was determined using a market approach, and is based on the three-month LIBOR curve for the remaining term of the swap agreement. Refer to Note 4, “Derivative Financial Instruments and Risk Management”, for additional information about the fair value of the interest rate swap.
Purchased Receivables
The Company initially records purchased receivables at cost, which is discounted from the contractual receivable balance. The ending balance of the purchased receivables is reduced as cash is received based upon the guidance of PB 6 and SOP 03-3. The carrying value of receivables was $361,808,502 and $346,198,900 at December 31, 2008 and 2007, respectively. The Company computes fair value of these receivables by discounting the future cash flows generated by its forecasting model using an adjusted weighted average cost of capital, reflective of other market participants cost of capital. The fair value of the purchased receivables approximated carrying value at both December 31, 2008 and 2007.
Credit Facilities and Former Credit Agreement
The Company’s Amended New Credit Facilities had carrying amounts of $181,550,000 and $191,250,000 as of December 31, 2008 and 2007, respectively. The Company computed the approximate fair value of the Credit Facilities to be $148,556,650 and $158,652,946 as of December 31, 2008 and 2007, respectively. The fair value of the Company’s Amended New Credit Facilities is based on borrowing rates currently available to the Company and similar market participants.
12. Income Taxes
The Company recorded an income tax provision of $9,680,968, $12,511,803 and $27,545,579 for the years ended December 31, 2008, 2007 and 2006, respectively. The provision for income tax expense reflects an effective income tax rate of 38.1%, 38.0% and 37.7% for the years ended December 31, 2008, 2007 and 2006, respectively.
F-27
Effective January 1, 2007, the Company adopted SFAS Interpretation No. 48, “Accounting for Uncertainty in Income Taxes—an interpretation of FASB Statement No. 109” (“FIN 48”). FIN 48 prescribes a recognition threshold and measurement attribute for the financial statement recognition and measurement of a tax position taken in a tax return. FIN 48 also provides guidance regarding subsequent derecognition of a tax position, classification, interest and penalties, accounting in interim periods, disclosure, and transition method. The Company did not record any cumulative effect adjustment to retained earnings as a result of adopting FIN 48.
| | | | | | | |
| | | Year Ended December 31 |
| | | 2008 | | | 2007 |
Unrecognized tax benefits: | | | | | | | |
Beginning balance | | $ | 778,663 | | | $ | — |
Increases in positions taken in prior years | | | 120,884 | | | | 600,000 |
(Decrease) increase in positions taken in current year | | | (3,702 | ) | | | 178,663 |
Decreases in positions due to settlements with tax authorities | | | — | | | | — |
Decreases in positions as a result of a lapse in the statute of limitations | | | — | | | | — |
| | | | | | | |
Ending balance | | $ | 895,845 | | | $ | 778,663 |
| | | | | | | |
As of December 31, 2008, the Company had unrecognized tax benefits of $582,299 that, if recognized, would impact the Company’s effective tax rate. It is expected that the amount of unrecognized tax benefits will change in the next twelve months; however, the Company does not expect the change to have a significant impact on the results of operations or financial position of the Company.
The Company’s liability for income taxes associated with uncertain tax positions includes interest and penalties. Interest and penalties related to the Company’s uncertain tax positions at January 1, 2008, were not significant and were included in interest expense and administrative expense, respectively, in the consolidated statements of operations.
The corporate federal income tax returns of the Company for 2005, 2006 and 2007 are subject to examination by the IRS, generally for three years after they are filed. The state income tax returns and other state tax filings of the Company are subject to examination by the state taxing authorities, for various periods generally up to four years after they are filed.
The components of income tax expense from operations are set forth below:
| | | | | | | | | | |
| | | Year Ended December 31, | |
| | | 2008 | | 2007 | | 2006 | |
Income taxes consist of: | | | | | | | | | | |
Federal deferred | | $ | 5,478,063 | | $ | 626,079 | | $ | 338,836 | |
Federal actual | | | 3,131,841 | | | 10,884,146 | | | 25,483,469 | |
State actual | | | 779,073 | | | 981,320 | | | 1,925,380 | |
State deferred—net | | | 291,991 | | | 20,258 | | | (202,106 | ) |
| | | | | | | | | | |
Total | | $ | 9,680,968 | | $ | 12,511,803 | | $ | 27,545,579 | |
| | | | | | | | | | |
F-28
Tax expense differs from the application of statutory rates to pretax income. The reconciliation of income tax expense and the statutory rates is set forth below:
| | | | | | | | | | | |
| | | Year Ended December 31, |
| | | 2008 | | | 2007 | | | 2006 |
Federal taxes at statutory rate | | $ | 8,891,457 | | | $ | 11,595,084 | | | $ | 25,550,425 |
Other adjustments | | | (8,178 | ) | | | (1,787 | ) | | | 214,130 |
State income taxes, net of federal tax benefit | | | 797,689 | | | | 918,506 | | | | 1,781,024 |
| | | | | | | | | | | |
Effective income taxes | | $ | 9,680,968 | | | $ | 12,511,803 | | | $ | 27,545,579 |
| | | | | | | | | | | |
Deferred tax assets and liabilities are recognized for the estimated future tax effect of temporary differences between the tax basis of assets or liabilities and the reported amounts in the financial statements.
At December 31, 2008, one of the Company’s subsidiaries, which is a separate entity for tax purposes, had a net operating loss carryforward for tax purposes of approximately $2,500,000, which may be carried forward for 20 years and will expire in 2028.
The tax effect of temporary differences that gave rise to the Company’s deferred tax assets and liabilities consisted of the following:
| | | | | | |
| | | December 31,
2008 | | December 31,
2007 |
Deferred tax asset: | | | | | | |
Tax effect of comprehensive income | | $ | 2,578,712 | | $ | 1,113,876 |
Stock options | | | 1,790,545 | | | 1,557,726 |
Accrued expenses | | | 1,605,142 | | | 1,865,604 |
Charge-off adjustment | | | 667,075 | | | 608,854 |
Intangible assets | | | 233,504 | | | 308,585 |
Other | | | 1,653,194 | | | 585,490 |
| | | | | | |
Total | | | 8,528,172 | | | 6,040,135 |
| | | | | | |
Deferred tax liability: | | | | | | |
Purchased receivables revenue recognition | | | 68,088,077 | | | 62,721,827 |
Property and equipment | | | 1,635,662 | | | 1,513,840 |
Deferred revenue | | | 927,737 | | | — |
Special tax basis adjustment | | | 733,035 | | | 616,506 |
Transaction costs | | | 711,478 | | | 851,318 |
Prepaid expenses | | | 376,736 | | | 185,762 |
Other | | | 525,449 | | | 315,666 |
| | | | | | |
Total | | | 72,998,174 | | | 66,204,919 |
| | | | | | |
Net deferred tax liability | | $ | 64,470,002 | | $ | 60,164,784 |
| | | | | | |
F-29
13. Selected Quarterly Operating Results (unaudited)
The following tables set forth a summary of the Company’s consolidated results on a quarterly basis for the years ended December 31, 2008 and 2007. The information for each of these quarters is unaudited and, in the Company’s opinion, has been prepared on a basis consistent with the Company’s audited consolidated financial statements appearing elsewhere in this Annual Report. This information includes all adjustments, consisting only of normal recurring adjustments the Company considered necessary for a fair presentation of this information when read in conjunction with the Company’s consolidated financial statements and related notes appearing elsewhere in this Annual Report. Results of operations for any quarter are not necessarily indicative of the results for a full year or any future periods.
Quarterly Financial Data
| | | | | | | | | | | | |
| | | Quarter |
| | | First | | Second | | Third | | Fourth |
2008 | | | | | | | | | | | | |
Total revenues | | $ | 64,354,730 | | $ | 56,479,499 | | $ | 58,353,763 | | $ | 55,024,324 |
Total operating expenses | | | 50,102,324 | | | 49,675,339 | | | 50,084,817 | | | 45,975,626 |
Income from operations | | | 14,252,406 | | | 6,804,160 | | | 8,268,946 | | | 9,048,698 |
Net income | | | 6,777,824 | | | 2,124,158 | | | 3,039,979 | | | 3,781,235 |
Total comprehensive income | | | 4,603,816 | | | 4,240,849 | | | 2,973,212 | | | 1,252,584 |
Weighted average shares: | | | | | | | | | | | | |
Basic | | | 30,553,019 | | | 30,561,421 | | | 30,570,423 | | | 30,579,066 |
Diluted | | | 30,565,690 | | | 30,606,807 | | | 30,614,701 | | | 30,581,939 |
Earnings per common share outstanding: | | | | | | | | | | | | |
Basic | | $ | 0.22 | | $ | 0.07 | | $ | 0.10 | | $ | 0.12 |
Diluted | | $ | 0.22 | | $ | 0.07 | | $ | 0.10 | | $ | 0.12 |
| | | | | | | | | | | | | |
| | | Quarter |
| | | First | | Second | | Third | | | Fourth |
2007 | | | | | | | | | | | | | |
Total revenues | | $ | 67,306,027 | | $ | 65,865,874 | | $ | 52,587,497 | | | $ | 62,238,785 |
Total operating expenses | | | 51,302,724 | | | 51,665,388 | | | 52,174,978 | | | | 52,413,169 |
Income from operations | | | 16,003,303 | | | 14,200,486 | | | 412,519 | | | | 9,825,616 |
Net income (loss) | | | 9,851,253 | | | 8,279,165 | | | (1,675,499 | ) | | | 3,951,594 |
Total comprehensive income | | | 9,851,253 | | | 8,279,165 | | | (2,177,046 | ) | | | 2,441,014 |
Weighted average shares: | | | | | | | | | | | | | |
Basic | | | 34,718,820 | | | 34,279,507 | | | 30,568,041 | | | | 30,568,041 |
Diluted | | | 34,725,992 | | | 34,293,511 | | | 30,568,041 | | | | 30,769,614 |
Earnings per common share outstanding: | | | | | | | | | | | | | |
Basic | | $ | 0.28 | | $ | 0.24 | | $ | (0.05 | ) | | $ | 0.13 |
Diluted | | $ | 0.28 | | $ | 0.24 | | $ | (0.05 | ) | | $ | 0.13 |
F-30
Quarterly Changes in Valuation Allowance for Purchased Receivables
| | | | | | | | | | | | | | | | |
| | | Quarter | |
| 2008 | | First | | | Second | | | Third | | | Fourth | |
Beginning balance | | $ | 62,091,755 | | | $ | 61,239,905 | | | $ | 66,185,655 | | | $ | 68,892,455 | |
Impairments | | | 1,795,533 | | | | 5,810,417 | | | | 3,544,000 | | | | 4,962,586 | |
Reversal of impairments | | | (1,411,250 | ) | | | (841,250 | ) | | | (459,200 | ) | | | (360,100 | ) |
Deductions(1) | | | (1,236,133 | ) | | | (23,417 | ) | | | (378,000 | ) | | | (1,545,615 | ) |
| | | | | | | | | | | | | | | | |
Ending balance | | $ | 61,239,905 | | | $ | 66,185,655 | | | $ | 68,892,455 | | | $ | 71,949,326 | |
| | | | | | | | | | | | | | | | |
| (1) | Deductions represent impairments on purchased receivable portfolios that became fully amortized during the period and, therefore, the allowance is eliminated because it can no longer be reversed. |
| | | | | | | | | | | | | | | | |
| | | Quarter | |
| 2007 | | First | | | Second | | | Third | | | Fourth | |
Beginning balance | | $ | 39,714,055 | | | $ | 43,825,155 | | | $ | 48,415,655 | | | $ | 62,256,655 | |
Impairments | | | 4,714,000 | | | | 5,320,000 | | | | 14,216,000 | | | | 1,689,000 | |
Reversal of impairments | | | (240,900 | ) | | | (176,900 | ) | | | (375,000 | ) | | | (752,700 | ) |
Deductions(1) | | | (362,000 | ) | | | (552,600 | ) | | | — | | | | (1,101,200 | ) |
| | | | | | | | | | | | | | | | |
Ending balance | | $ | 43,825,155 | | | $ | 48,415,655 | | | $ | 62,256,655 | | | $ | 62,091,755 | |
| | | | | | | | | | | | | | | | |
| (1) | Deductions represent impairments on purchased receivable portfolios that became fully amortized during the period and, therefore, the allowance is eliminated because it can no longer be reversed. |
F-31