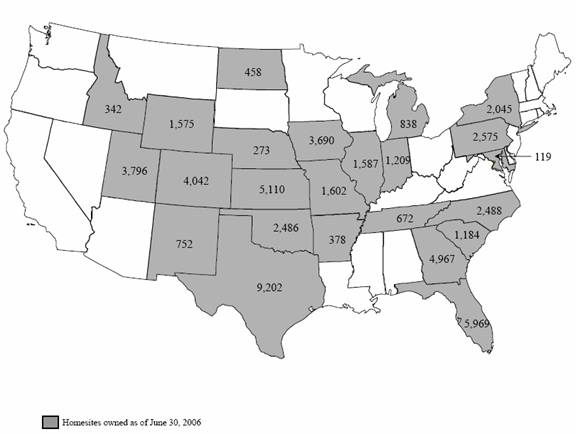
| Portfolio Map |
1
| Press Release Text |
AFFORDABLE RESIDENTIAL COMMUNITIES ANNOUNCES
SECOND QUARTER 2006 RESULTS
DENVER, CO — (BUSINESS WIRE) — Wednesday, August 2, 2006 — Affordable Residential Communities Inc. (NYSE:ARC) today announced results for the second quarter ended June 30, 2006.
Second Quarter Operating Results
Consolidated gross revenue for the second quarter of 2006 was $61.6 million in the first quarter of 2006 compared to $60.4 million in the first quarter of 2006 and $68.5 million in the second quarter of 2005. Net income to common shareholders for the second quarter of 2006 was $0.2 million, or $0.01 per share, compared to a net loss of ($3.9) million, or ($0.10) per share, in the first quarter of 2006 and a net loss of ($18.2) million, or ($0.45) per share, in the second quarter of 2005. Net income in the second and first quarters of 2006 includes gains on sales of discontinued operations of $15.6 million, or $0.38 per share, and $10.3 million, or $0.25 per share, respectively.
Net loss from continuing operations in the second quarter of 2006 was $12.8 million as compared to $12.5 million in the first quarter of 2006 and $15.9 million in the second quarter of 2005, reflecting increases in community net segment income, retail net segment losses and, with respect to the second quarter of 2005, increased interest expense and reduced general and administrative and property management expenses.
Net segment income was $34.8 million in the second quarter of 2006 as compared to $34.5 million in the first quarter of 2006 and $28.0 million in the second quarter of 2005, reflecting increased community net segment income partially offset by increased retail net segment losses with respect to the first quarter of 2006. Community net segment income increased to $36.9 million the second quarter of 2006 as compared to $35.7 million in the first quarter of 2006 and $29.5 million in the second quarter of 2005 as a result of an increase in average homeowner rental rates. In addition, as compared to the first quarter of 2006, community net segment income in the second quarter of 2006 reflects slightly reduced operating expenses primarily resulting from reduced repairs and maintenance expense. With respect to the second quarter of 2005, operating expenses reflect lower salaries and benefits and repairs and maintenance costs partially offset by higher real estate taxes and utilities expenses.
Retail net segment loss was $1.7 million in the second quarter of 2006, as compared to $0.8 million in the first quarter of 2006 and $0.9 million in the second quarter of 2005. Second quarter 2006 results reflect increased operating expenses and approximately equal gross margins and volume of homes sold with respect to the first quarter of 2006 and lower volume of homes sold, higher margins and lower retail expenses with respect to the second quarter of 2005. The increased operating expenses as compared to the first quarter of 2006 resulted primarily from increased commissions paid on leasing activity and increased advertising expenses.
Net occupancy decreased by 85 residents during the second quarter of 2006 to overall occupancy of 83.5% compared with a net occupancy decrease of 6 residents in the first quarter of 2006 to 83.7% and a net occupancy increase of 785 residents to 84.3% in the second quarter of 2005. As compared to the first quarter of 2006, the Company had approximately equal homeowner and home renter activity. As compared to the second quarter of 2005, the Company had lower homeowner and home renter moveouts, higher homeowner move-ins and lower home sales and lease with option to purchase transactions.
2
General and administrative and property management expenses were $5.0 million and $1.6 million, respectively, in the second quarter of 2006 as compared to $4.4 million and $1.6 million in the first quarter of 2006, respectively, and $6.4 million and $2.4 million in the second quarter of 2005, respectively. As compared to the first quarter of 2006, such expenses reflect costs incurred in the second quarter of 2006 for completion of the Company’s internal control evaluation as required by the Sarbanes-Oxley Act. As compared to the second quarter of 2005, such expenses reflect lower employee costs for salary and benefits and travel and lower costs related to compliance with Company’s internal control evaluation as required by the Sarbanes-Oxley Act.
Interest expense was $20.0 million in the second quarter of 2006, as compared to $19.6 million in the first quarter of 2006 and $17.0 million in the second quarter of 2005. As compared to the first quarter of 2006, interest expense reflects increases in rates on the Company’s variable rate debt partially offset by the repayment of variable rate debt from net proceeds of the community sales, as discussed below. As compared to the second quarter of 2005, interest expense reflects higher average balances and average interest rates for borrowings to support the Company’s investment in home purchases and capital spending in 2005 partially offset by debt repaid from the net proceeds of community sales in the first and second quarters of 2006.
Depreciation and amortization expense was $21.8 million in the second quarter of 2006, as compared to $21.6 million in the first quarter of 2006 and $18.8 million in the second quarter of 2005. As compared to the first quarter of 2006, depreciation and amortization expense reflects approximately $5 million of capital spending and home purchases incurred since the first quarter of 2006. As compared to the second quarter of 2005, depreciation and amortization expense reflects approximately $84 million of capital spending and home purchases incurred since the second quarter of 2005.
First Half Operating Results
Consolidated gross revenue for the six months ended June 30, 2006, was $122.0 million as compared to $127.4 million in the six months ended June 30, 2005. Real estate revenue was $115.5 million in the six months ended June 30, 2006 as compared to $103.0 million in the six months ended June 30, 2005. Retail home sales revenue for the six months ended June 30, 2006, was $5.7 million as compared to $23.9 million in the six months ended June 30, 2005.
Net loss to common shareholders for the six months ended June 30, 2006 was ($3.7) million, or ($0.09) per share, compared to a net loss of ($34.1) million, or ($0.83) per share, in the six months ended June 30, 2005. Net income in the six months ended June 30, 2006, includes gains on sales of discontinued operations of $25.9 million, or $0.63 per share, associated with the closing of community sales contracts as discussed below.
Community Sales Results
During the second quarter of 2006, the Company discontinued, and entered into contracts to sell, two communities in addition to the previously announced contracts to sell 38 communities. Through July 31, 2006, the Company has closed sales for 38 of these 40 communities, resulting in $82.5 million of cash proceeds net of related debt, defeasance and other closing costs of $65.4 million. The Company expects to close the sale of one additional community during 2006 and another in 2007. However, there can be no assurance that the Company will realize net cash proceeds from the sales of these communities or that sales under contract will ultimately close.
3
For the second quarter of 2006, the Company recorded gains totaling $15.6 million on the closing of the above-mentioned community sales, bringing year-to-date gains on sales to $25.9 million. The Company records such gains on sales only when the sales close. In 2005, subsequent to the second quarter, the Company recorded charges of $10.2 million for the discontinued communities in which the Company expected to incur a loss. There can be no assurances that the remaining two community sales transactions will close, or that, if they do close, any gains will be recognized with respect to any such transactions.
Balance Sheet and Liquidity
At June 30, 2006, the Company had $32.2 million in cash and cash equivalents and approximately $72.2 million of additional borrowing capacity available under its lease receivables line of credit. On July 11, 2006, as previously announced, the Company entered into a $230 million mortgage debt facility in which it repaid approximately $175 million of its senior variable rate mortgage and its revolving credit mortgage facility and, with the additional $55 million, paid debt issuance expenses and partially repaid its lease receivables facility and its consumer finance facility. The Company also used the excess funds to complete a partial defeasance of one of its communities that is held for sale. As a result of the refinancing, the Company increased the proportion of our fixed rate debt to approximately 90% as compared to 75% at June 30, 2006.
At June 30, 2006, the Company had approximately $1.1 billion in outstanding debt related to continuing operations and approximately $20.1 million related to communities held for sale. The weighted average interest rate on the Company’s aggregate outstanding debt related to continuing operations was 7.12% at June 30, 2006. After giving effect to the refinancing, approximately 98% of the Company’s outstanding debt is due in 2008 or later.
Second Quarter 2006 Conference Call
The Company will host a conference call, today, Wednesday, August 2, 2006, at 5:00 P.M. Eastern time. The call will be webcast live over the Internet from the Company’s website at www.aboutarc.com under the section titled “Webcast”. Participants should follow the instructions provided on the website for the download and installation of audio applications necessary to join the webcast. The call also can be accessed live over the phone by dialing (800) 289-0572 or (913) 981-5543 for international callers.
A replay will be available at approximately 8:00 P.M. Eastern time after the call and can be accessed by dialing 1-888-203-1112 or 1-719-457-0820 for international callers; the password is 2694410. The replay will be available from August 2, 2006 through August 9, 2006, and also will be archived on ARC’s website.
About Affordable Residential Communities Inc.
Affordable Residential Communities Inc. (“ARC”), excluding discontinued operations, currently owns and operates approximately 57,350 homesites located in 276 communities in 24 states. ARC is focused on the acquisition, renovation, repositioning and operation of primarily all-age manufactured home communities with headquarters in Englewood, CO.
4
CONTACTS
Affordable Residential Communities Inc.
Larry Willard, Chief Executive Officer
(866) 847-8931
investor.relations@aboutarc.com
or
Integrated Corporate Relations, Inc.
Brad Cohen, (203) 682-8211
Forward-Looking Statements
This news release contains forward-looking statements within the meaning of the Private Securities Litigation Reform Act of 1995. The forward-looking statements contained in this news release are subject to certain risks and uncertainties including, but not limited to, statements about the Company’s plans, objectives, expectations and intentions and other statements that are not historical facts. Actual results may differ materially from those set forth in the forward-looking statements. The following factors, among others, could cause actual results to differ from those set forth in the forward-looking statements: general risks affecting the real estate industry; the Company’s ability to maintain or increase rental rates and occupancy with respect to properties currently owned; the Company’s assumptions on rental home and home sales and financing activity; completion of pending acquisitions and sales, if any, and terms of and timing with respect thereto; the Company’s growth and expansion into new markets or successful integration of acquisitions; and the effect of interest rates. Additional factors that could cause the Company’s results to differ materially from those described in the forward-looking statements can be found in the Company’s 2005 Annual Report on Form 10-K (included under the heading “Forward-Looking Statements”), and in the Company’s Quarterly Reports on Form 10-Q filed with the Securities and Exchange Commission (“SEC”) and available at the SEC’s internet site (http://www.sec.gov). The forward-looking statements contained in this news release speak only as of the date of the release, and the Company assumes no obligation to update the forward-looking statements or update the reasons why actual results could differ from those contained in the forward-looking statements.
5

| Top 20 Markets |
| | Number
of Total | | Percentage
of Total | | Occupancy | |
Markets (a) | | Homesites | | Homesites | | 06/30/06 | | 03/31/06 | | 12/31/05 | | 09/30/05 | | 06/30/05 | | 03/31/05 | |
Dallas — Ft. Worth, TX | | 7,181 | | 12.5 | % | 80.2 | % | 80.4 | % | 81.4 | % | 84.2 | % | 82.7 | % | 79.8 | % |
Atlanta, GA | | 4,967 | | 8.7 | % | 89.2 | % | 89.1 | % | 89.1 | % | 90.0 | % | 89.2 | % | 86.7 | % |
Salt Lake City, UT | | 3,796 | | 6.6 | % | 93.4 | % | 92.6 | % | 92.2 | % | 93.1 | % | 92.1 | % | 91.1 | % |
Front Range of CO | | 3,290 | | 5.7 | % | 83.8 | % | 84.0 | % | 84.9 | % | 88.2 | % | 89.1 | % | 87.0 | % |
Kansas City — Lawrence — Topeka, MO — KS | | 2,424 | | 4.2 | % | 87.4 | % | 87.2 | % | 87.6 | % | 89.6 | % | 89.6 | % | 88.1 | % |
Jacksonville, FL | | 2,259 | | 3.9 | % | 90.2 | % | 90.7 | % | 89.5 | % | 89.7 | % | 88.2 | % | 86.9 | % |
Wichita, KS | | 2,162 | | 3.8 | % | 61.9 | % | 64.6 | % | 64.8 | % | 67.5 | % | 66.7 | % | 62.7 | % |
St. Louis, MO — IL | | 1,914 | | 3.3 | % | 79.5 | % | 79.1 | % | 80.3 | % | 80.9 | % | 81.0 | % | 78.7 | % |
Oklahoma City, OK | | 1,891 | | 3.3 | % | 78.2 | % | 80.1 | % | 78.4 | % | 80.5 | % | 78.5 | % | 77.1 | % |
Orlando, FL | | 1,858 | | 3.2 | % | 92.9 | % | 92.4 | % | 91.1 | % | 91.0 | % | 89.2 | % | 87.9 | % |
Greensboro — Winston Salem, NC | | 1,396 | | 2.4 | % | 66.0 | % | 67.0 | % | 68.5 | % | 69.8 | % | 69.5 | % | 68.2 | % |
Davenport — Moline — Rock Island, IA — IL | | 1,382 | | 2.4 | % | 86.5 | % | 86.9 | % | 87.0 | % | 87.8 | % | 86.8 | % | 83.9 | % |
Elkhart — Goshen, IN | | 1,209 | | 2.1 | % | 87.5 | % | 88.5 | % | 86.5 | % | 86.8 | % | 85.6 | % | 82.1 | % |
Charleston — North Charleston, SC | | 1,184 | | 2.1 | % | 81.5 | % | 83.0 | % | 84.1 | % | 83.7 | % | 81.8 | % | 77.9 | % |
Raleigh — Durham — Chapel Hill, NC | | 1,092 | | 1.9 | % | 91.5 | % | 90.3 | % | 90.7 | % | 90.1 | % | 85.7 | % | 83.4 | % |
Sioux City, IA — NE | | 994 | | 1.7 | % | 81.2 | % | 79.6 | % | 79.3 | % | 80.5 | % | 79.8 | % | 78.5 | % |
Syracuse, NY | | 939 | | 1.6 | % | 61.0 | % | 61.3 | % | 64.9 | % | 67.5 | % | 64.7 | % | 54.2 | % |
Des Moines, IA | | 859 | | 1.5 | % | 88.1 | % | 88.0 | % | 88.0 | % | 88.5 | % | 86.9 | % | 86.5 | % |
Flint, MI | | 838 | | 1.5 | % | 72.3 | % | 72.9 | % | 73.0 | % | 73.4 | % | 74.0 | % | 72.4 | % |
Pueblo, CO | | 752 | | 1.3 | % | 65.0 | % | 67.0 | % | 69.1 | % | 70.5 | % | 70.0 | % | 71.0 | % |
Subtotal — Top 20 Markets | | 42,387 | | 73.7 | % | 82.8 | % | 83.0 | % | 83.3 | % | 84.8 | % | 83.7 | % | 81.3 | % |
| | | | | | | | | | | | | | | | | |
All Other Markets | | 14,972 | | 26.3 | % | 85.6 | % | 85.4 | % | 85.4 | % | 86.5 | % | 85.9 | % | 84.8 | % |
| | | | | | | | | | | | | | | | | |
Total / Weighted Average | | 57,359 | | 100.0 | % | 83.5 | % | 83.7 | % | 83.8 | % | 85.2 | % | 84.3 | % | 82.2 | % |
| | Total | | Total | | Rental Income Per Occupied Homesite Per Month (b) | |
Markets (a) | | Homesites | | Homesites | | 06/30/06 | | 03/31/06 | | 12/31/05 | | 09/30/05 | | 06/30/05 | | 03/31/05 | |
Dallas — Ft. Worth, TX | | 7,181 | | 12.5 | % | $ | 400 | | $ | 384 | | $ | 370 | | $ | 347 | | $ | 349 | | $ | 353 | |
Atlanta, GA | | 4,967 | | 8.7 | % | 389 | | 387 | | 371 | | 353 | | 349 | | 345 | |
Salt Lake City, UT | | 3,796 | | 6.6 | % | 368 | | 364 | | 351 | | 348 | | 348 | | 348 | |
Front Range of CO | | 3,290 | | 5.7 | % | 463 | | 460 | | 450 | | 430 | | 429 | | 425 | |
Kansas City — Lawrence — Topeka, MO — KS | | 2,424 | | 4.2 | % | 319 | | 315 | | 295 | | 291 | | 285 | | 280 | |
Jacksonville, FL | | 2,259 | | 3.9 | % | 374 | | 371 | | 363 | | 350 | | 349 | | 348 | |
Wichita, KS | | 2,162 | | 3.8 | % | 316 | | 301 | | 279 | | 270 | | 273 | | 287 | |
St. Louis, MO — IL | | 1,914 | | 3.3 | % | 323 | | 312 | | 306 | | 296 | | 290 | | 287 | |
Oklahoma City, OK | | 1,891 | | 3.3 | % | 327 | | 317 | | 298 | | 281 | | 289 | | 295 | |
Orlando, FL | | 1,858 | | 3.2 | % | 397 | | 392 | | 383 | | 375 | | 377 | | 364 | |
Greensboro — Winston Salem, NC | | 1,396 | | 2.4 | % | 303 | | 296 | | 277 | | 273 | | 270 | | 259 | |
Davenport — Moline — Rock Island, IA — IL | | 1,382 | | 2.4 | % | 303 | | 295 | | 277 | | 267 | | 265 | | 265 | |
Elkhart — Goshen, IN | | 1,209 | | 2.1 | % | 384 | | 383 | | 358 | | 335 | | 326 | | 319 | |
Charleston — North Charleston, SC | | 1,184 | | 2.1 | % | 309 | | 307 | | 276 | | 267 | | 251 | | 241 | |
Raleigh — Durham — Chapel Hill, NC | | 1,092 | | 1.9 | % | 394 | | 385 | | 365 | | 348 | | 340 | | 344 | |
Sioux City, IA — NE | | 994 | | 1.7 | % | 337 | | 330 | | 305 | | 295 | | 290 | | 285 | |
Syracuse, NY | | 939 | | 1.6 | % | 383 | | 380 | | 376 | | 345 | | 340 | | 342 | |
Des Moines, IA | | 859 | | 1.5 | % | 359 | | 353 | | 318 | | 313 | | 307 | | 302 | |
Flint, MI | | 838 | | 1.5 | % | 402 | | 395 | | 378 | | 361 | | 358 | | 352 | |
Pueblo, CO | | 752 | | 1.3 | % | 334 | | 331 | | 321 | | 318 | | 321 | | 327 | |
| | | | | | | | | | | | | | | | | |
Subtotal — Top 20 Markets | | 42,387 | | 73.7 | % | 371 | | 365 | | 349 | | 335 | | 334 | | 332 | |
| | | | | | | | | | | | | | | | | |
All Other Markets | | 14,972 | | 26.3 | % | 336 | | 331 | | 317 | | 312 | | 310 | | 310 | |
| | | | | | | | | | | | | | | | | |
Total / Weighted Average | | 57,359 | | 100.0 | % | $ | 362 | | $ | 355 | | $ | 342 | | $ | 333 | | $ | 327 | | $ | 326 | |
(a) Markets are defined by our management.
(b) Rental Income is defined as homeowner rental income, home rental income, and other rental income reduced by move-in bonuses and rent concessions.
14
| Asset Highlights |
Capital Expenditure Summary
| | Three Months Ended | |
($ in thousands) | | 06/30/06 | | 03/31/06 | | 12/31/05 | | 9/30/05 | | 06/30/05 | | 03/31/05 | |
Recurring capital expenditures (a) | | $ | 562 | | $ | 378 | | $ | 987 | | $ | 2,778 | | $ | 2,905 | | $ | 3,352 | |
| | | | | | | | | | | | | |
Recurring capital expenditures per average site per annum | | 39 | | 26 | | 69 | | 194 | | 201 | | 231 | |
| | | | | | | | | | | | | |
Homesite upgrades (b) | | 242 | | 453 | | 2,327 | | 3,659 | | 2,959 | | 2,436 | |
| | | | | | | | | | | | | |
Expansion, development, renovation and improvements (c) | | 166 | | 355 | | 1,944 | | 2,805 | | 4,046 | | 6,226 | |
| | | | | | | | | | | | | |
Other capital expenditures (d) | | — | | — | | — | | — | | 191 | | 215 | |
Total capital improvements | | $ | 970 | | $ | 1,186 | | $ | 5,258 | | $ | 9,242 | | $ | 10,101 | | $ | 12,229 | |
| | | | | | | | | | | | | |
Recurring capital expenditures including discontinued operations (a) | | $ | 562 | | $ | 378 | | $ | 987 | | $ | 2,778 | | $ | 3,111 | | $ | 3,835 | |
Manufactured Home Data
| | Three Months Ended | |
($ in thousands) | | 06/30/06 | | 03/31/06 | | 12/31/05 | | 9/30/05 | | 06/30/05 | | 03/31/05 | |
Home purchase data | | | | | | | | | | | | | |
Number of manufactured homes purchased | | 262 | | 167 | | 618 | | 1,430 | | 1,308 | | 982 | |
| | | | | | | | | | | | | |
Home sales data | | | | | | | | | | | | | |
New homes sold | | 12 | | 11 | | 49 | | 114 | | 186 | | 38 | |
Used homes sold | | 118 | | 121 | | 189 | | 469 | | 716 | | 701 | |
Total homes sales | | 130 | | 132 | | 238 | | 583 | | 902 | | 739 | |
| | | | | | | | | | | | | |
Average homes sale price | | $ | 23,023 | | $ | 20,364 | | $ | 19,887 | | $ | 18,431 | | $ | 18,175 | | $ | 10,101 | |
| | | | | | | | | | | | | | | | | | | |
| | 06/30/06 | | 03/31/06 | | 12/31/05 | | 9/30/05 | | 06/30/05 | | 03/31/05 | |
Home Inventory Data | | | | | | | | | | | | | |
Home inventory | | 9,440 | | 9,308 | | 9,273 | | 8,893 | | 8,046 | | 7,640 | |
| | | | | | | | | | | | | |
Gross asset value including setup costs ($000’s) | | $ | 262,850 | | $ | 261,552 | | $ | 261,164 | | $ | 250,797 | | $ | 222,222 | | $ | 192,496 | |
Gross asset value per home | | $ | 27,844 | | $ | 28,100 | | $ | 28,164 | | $ | 28,202 | | $ | 27,619 | | $ | 25,196 | |
| | | | | | | | | | | | | |
Current asset value including setup costs ($000’s) | | $ | 212,798 | | $ | 217,923 | | $ | 224,087 | | $ | 221,304 | | $ | 195,883 | | $ | 166,896 | |
Current asset value per home | | $ | 22,542 | | $ | 23,412 | | $ | 24,166 | | $ | 24,885 | | $ | 24,345 | | $ | 21,845 | |
Dispositions
Transaction | | Quarter | | Market | | Number of
Communities | | Number of
Homesites | | Net Assets
Held for Sale | | Gain (Loss)
on Sale | | Impairment
Loss | |
Discontinued | | 3rd Quarter 2005 | | Various | | 79 | | 13,393 | | $ | 139,517 | | $ | — | | $ | (34,794 | ) |
Recontinued | | 4th Quarter 2005 | | Various | | (41 | ) | (8,067 | ) | (67,239 | ) | — | | 24,540 | |
| | | | | | 38 | | 5,326 | | 72,278 | | $ | — | | $ | (10,254 | ) |
Closed | | 1st Quarter 2006 | | Various | | (27 | ) | (2,860 | ) | (34,497 | ) | 10,296 | | — | |
Closed | | 2nd Quarter 2006 | | Various | | (9 | ) | (1,811 | ) | (37,881 | ) | 15,613 | | — | |
Discontinued | | 2nd Quarter 2006 | | Various | | 2 | | 334 | | 8,193 | | — | | — | |
| | | | | | 4 | | 989 | | $ | 8,093 | | $ | 25,909 | | $ | (10,254 | ) |
(a) Includes capital expenditures necessary to maintain asset quality, including purchasing and replacing assets used to operate the community. These capital expenditures include repairs of roads, driveways, pools, renovation of clubhouses and replacement or installation of street lights, playground equipment, signage, maintenance facilities, manager housing and property vehicles. These capital expenditures do not include water meters, sheds, homes or community acquisitions. Our minimum capitalizable amount of a project is $500.
(b) Includes capital expenditures that improve homesites for placement of a new home typically when an existing older home moves out and the site is prepared for a new home. Many of these activities are governed by manufacturers’ installation requirements and state building codes and include grading, electrical, concrete, landscaping, drainage and water/sewer lines. We estimate that the new home will be in the community for an average of at least 20 years although we depreciate these costs over 10 years.
(c) These are the costs to develop, expand, renovate and improve communities following acquisition. They include costs for engineering, driveways, paving, utilities, and amenities.
(d) These costs include capitalized interest and wages.
15