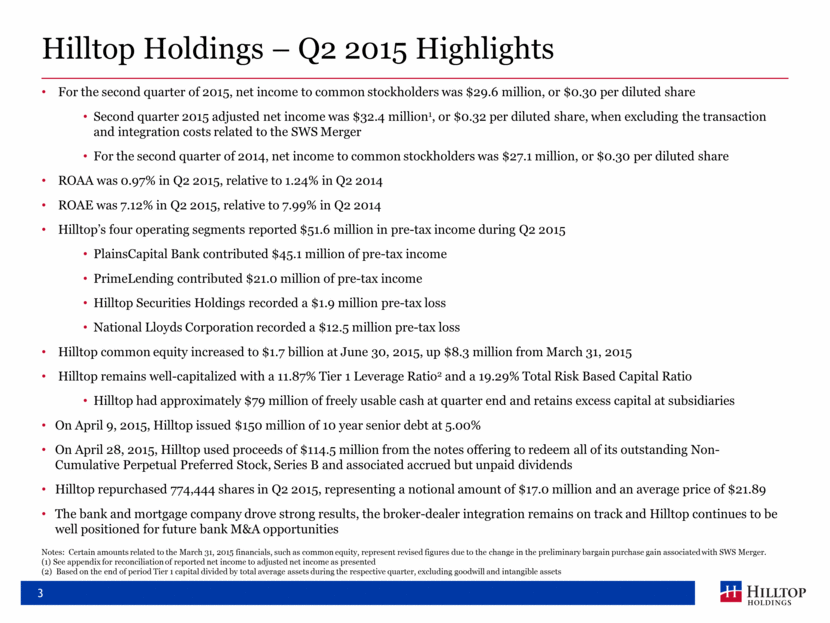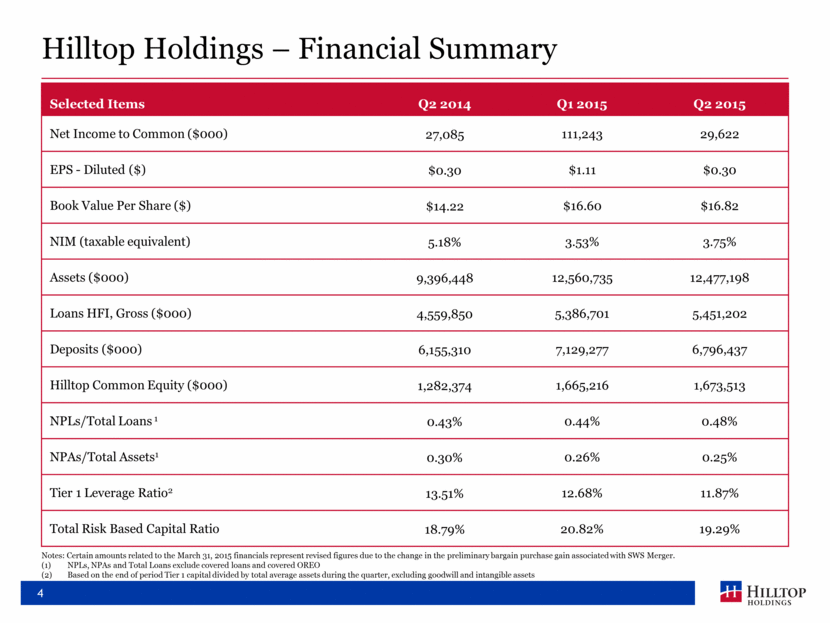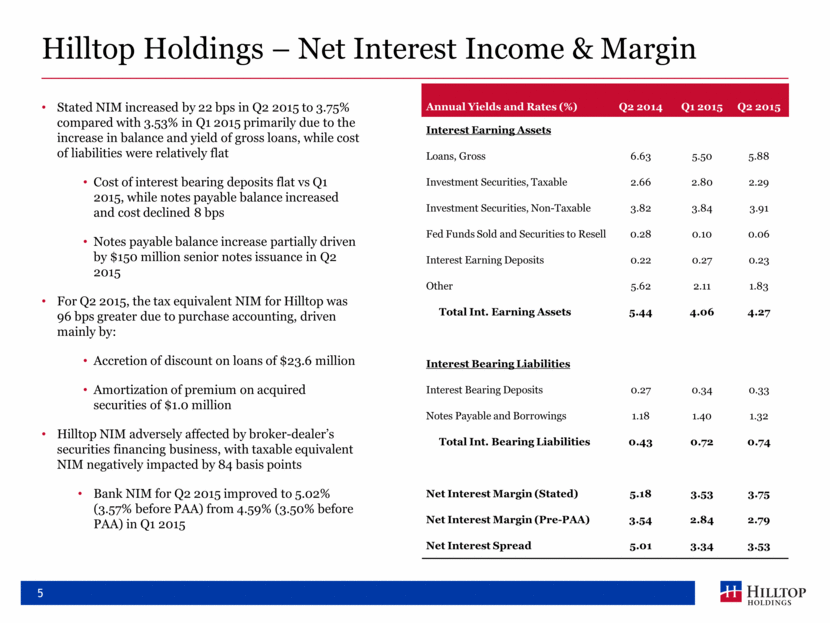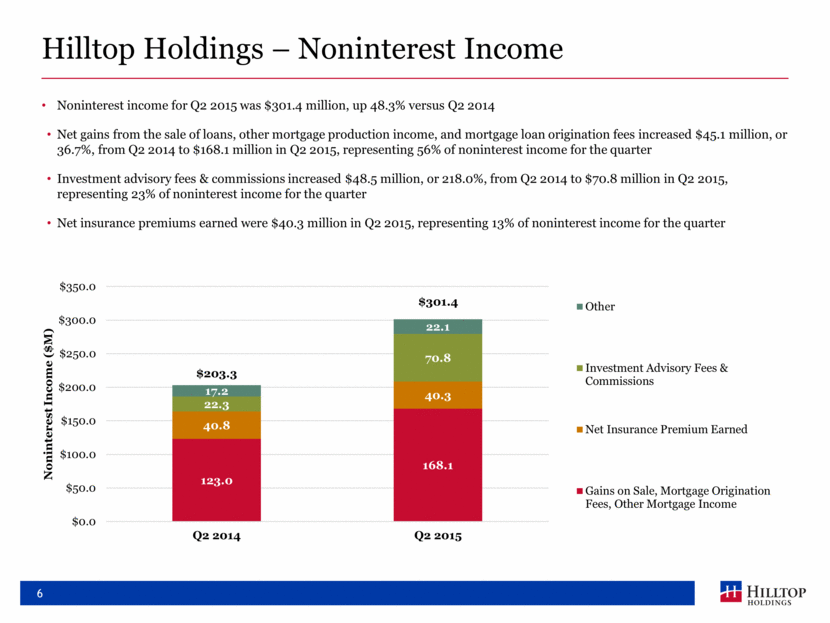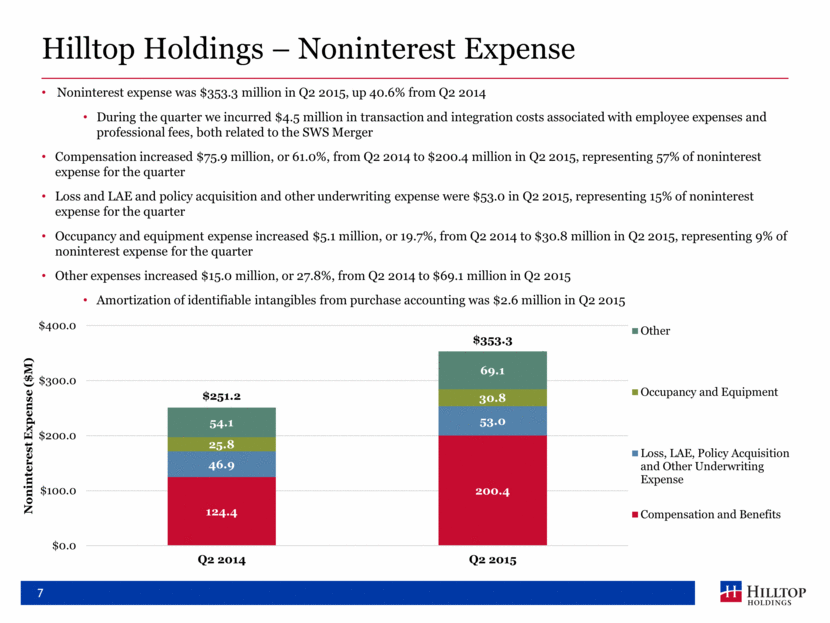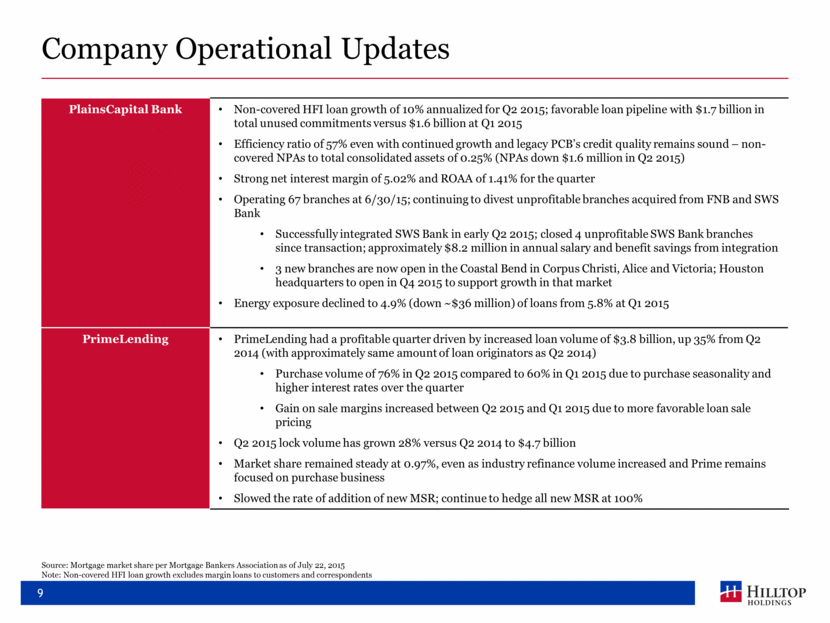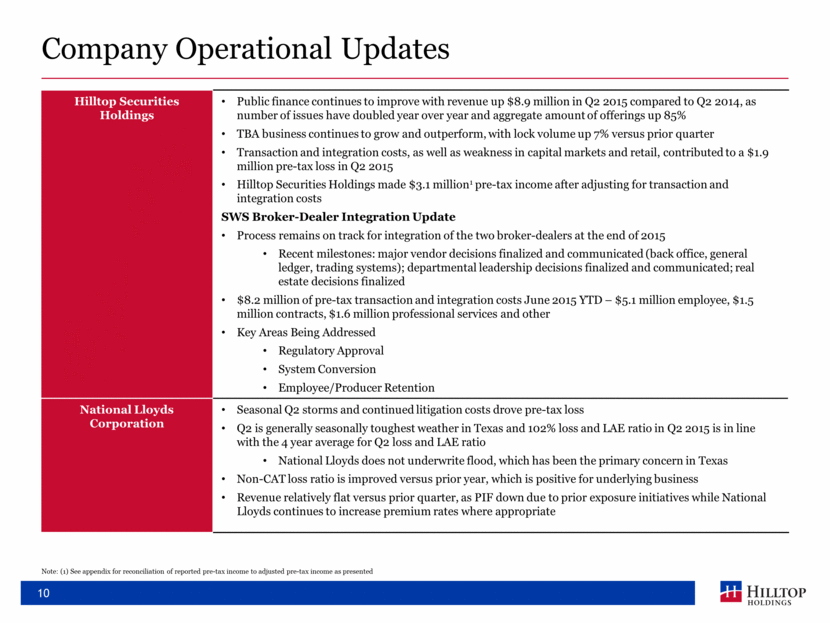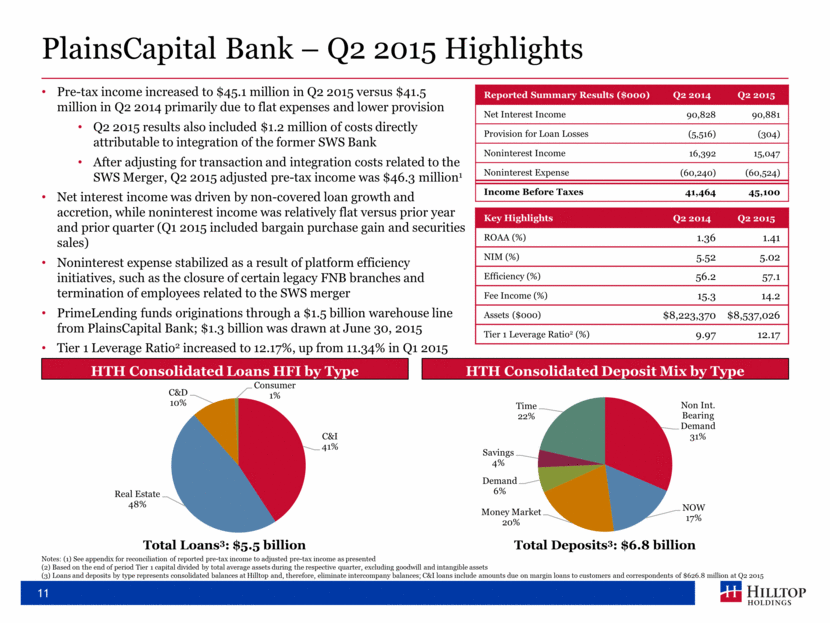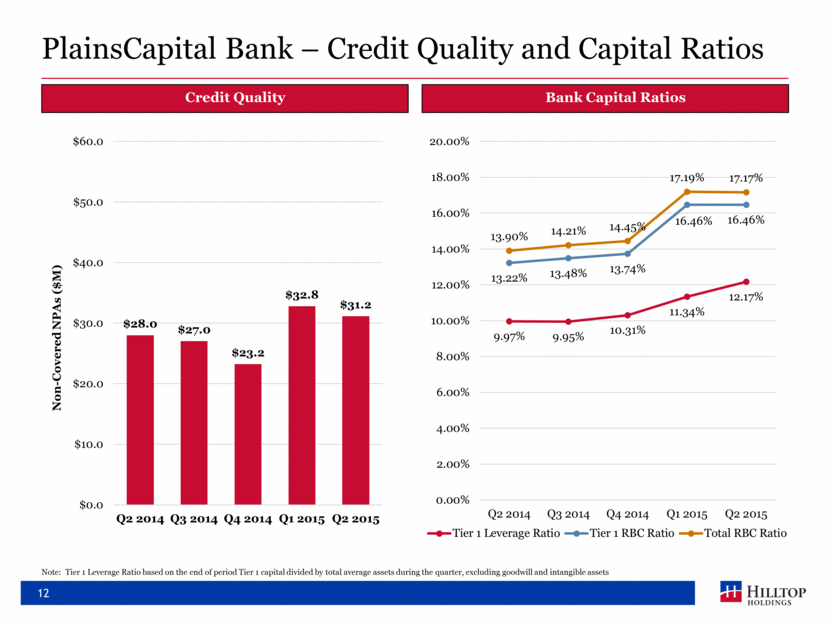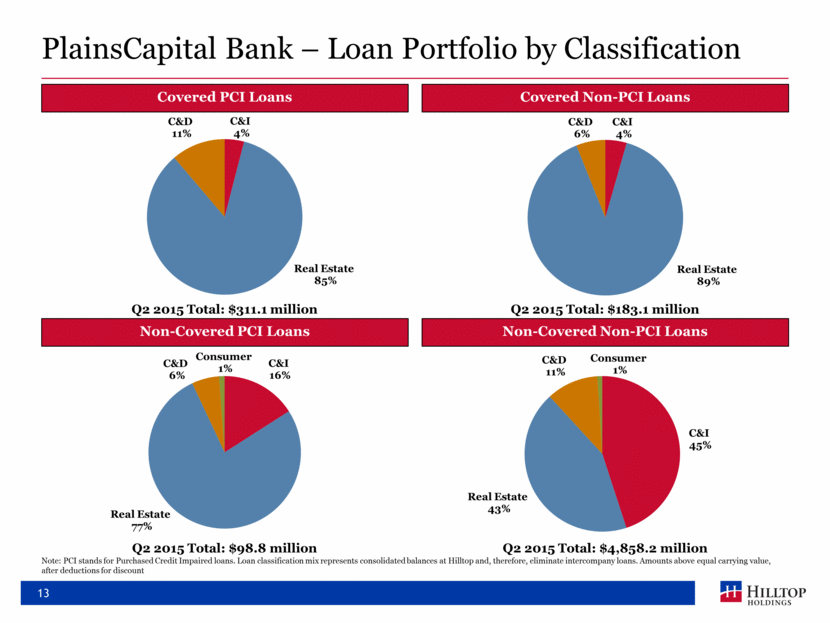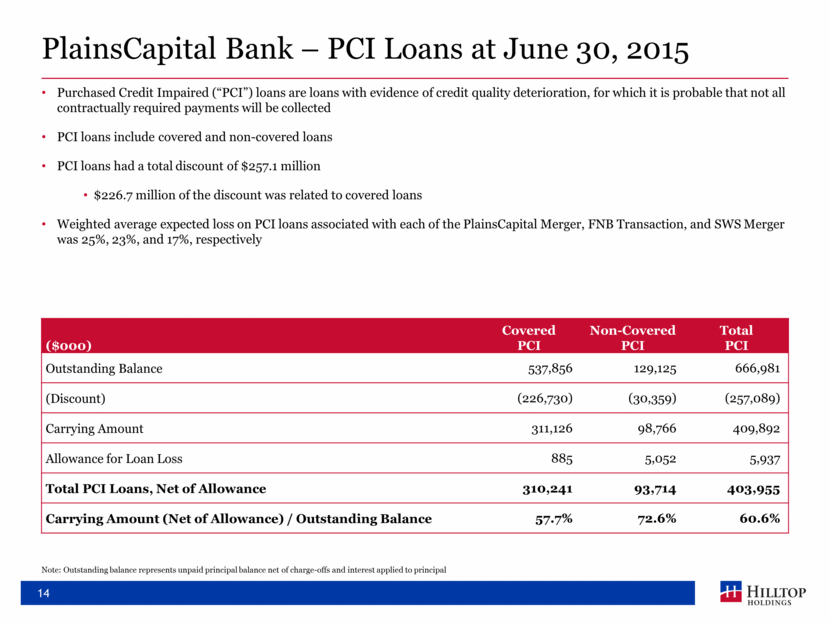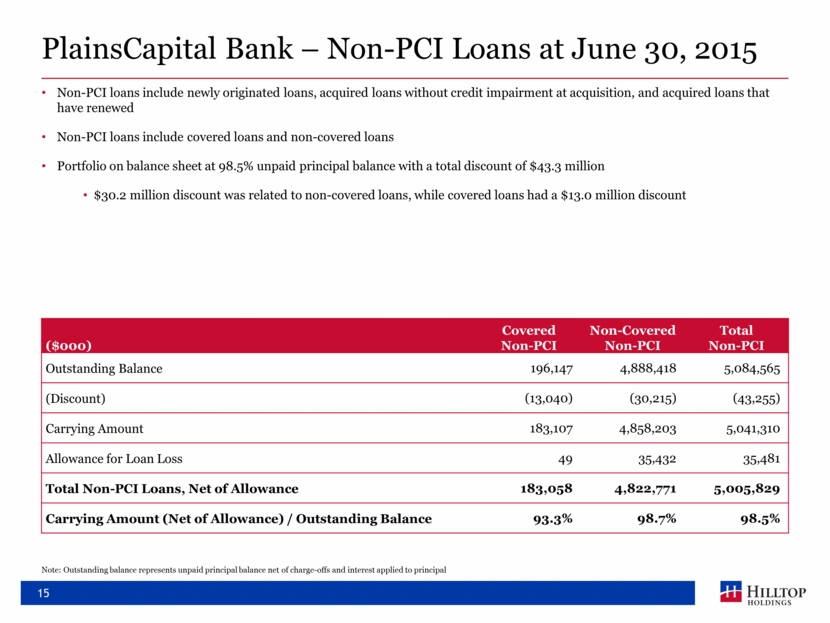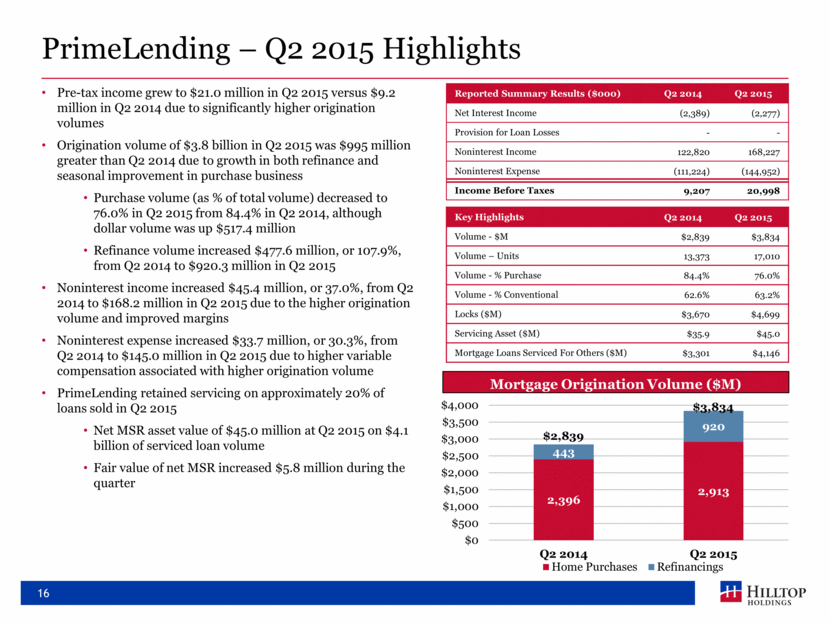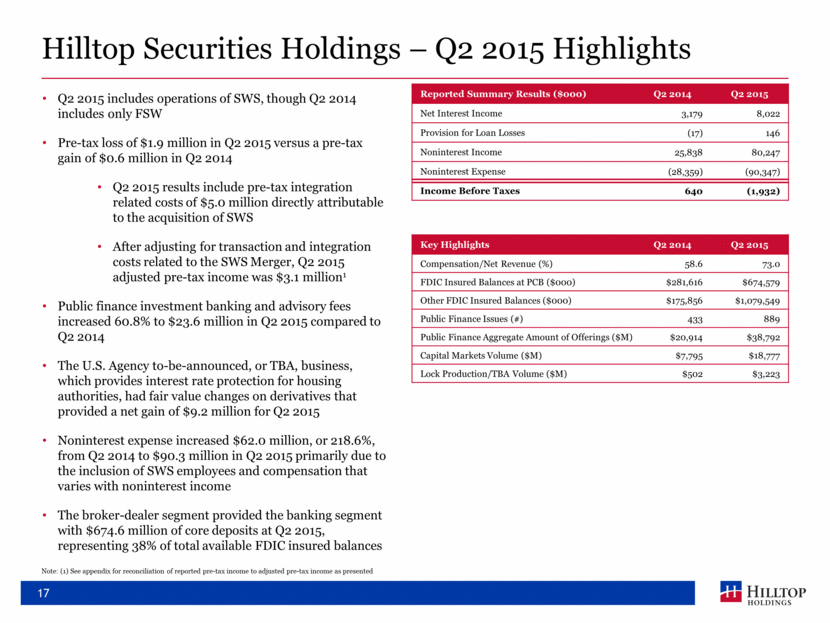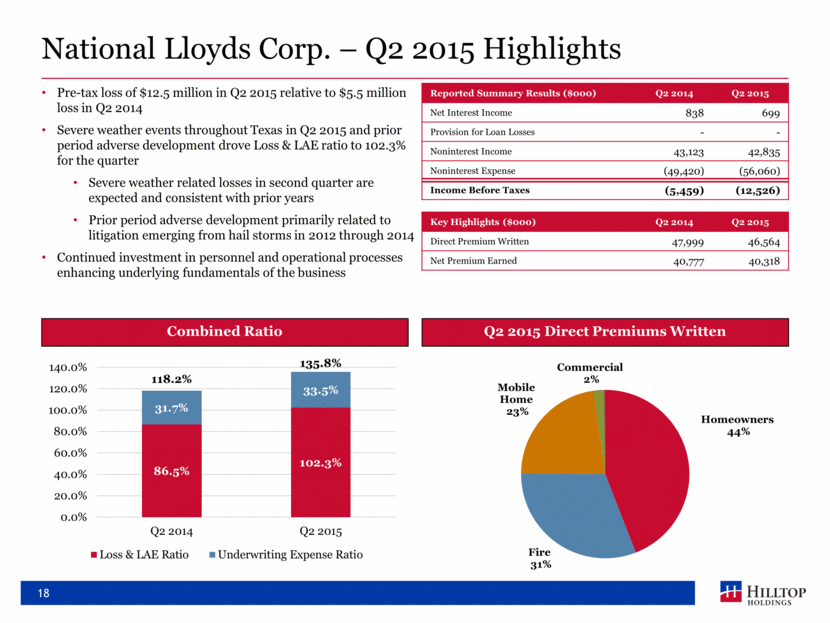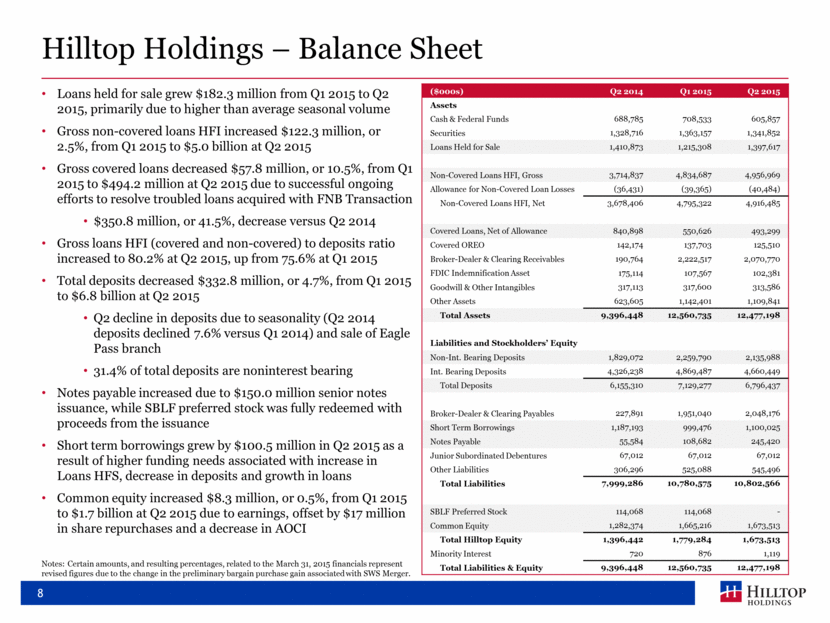
| Hilltop Holdings – Balance Sheet Loans held for sale grew $182.3 million from Q1 2015 to Q2 2015, primarily due to higher than average seasonal volume Gross non-covered loans HFI increased $122.3 million, or 2.5%, from Q1 2015 to $5.0 billion at Q2 2015 Gross covered loans decreased $57.8 million, or 10.5%, from Q1 2015 to $494.2 million at Q2 2015 due to successful ongoing efforts to resolve troubled loans acquired with FNB Transaction $350.8 million, or 41.5%, decrease versus Q2 2014 Gross loans HFI (covered and non-covered) to deposits ratio increased to 80.2% at Q2 2015, up from 75.6% at Q1 2015 Total deposits decreased $332.8 million, or 4.7%, from Q1 2015 to $6.8 billion at Q2 2015 Q2 decline in deposits due to seasonality (Q2 2014 deposits declined 7.6% versus Q1 2014) and sale of Eagle Pass branch 31.4% of total deposits are noninterest bearing Notes payable increased due to $150.0 million senior notes issuance, while SBLF preferred stock was fully redeemed with proceeds from the issuance Short term borrowings grew by $100.5 million in Q2 2015 as a result of higher funding needs associated with increase in Loans HFS, decrease in deposits and growth in loans Common equity increased $8.3 million, or 0.5%, from Q1 2015 to $1.7 billion at Q2 2015 due to earnings, offset by $17 million in share repurchases and a decrease in AOCI 8 ($000s) Q2 2014 Q1 2015 Q2 2015 Assets Cash & Federal Funds 688,785 708,533 605,857 Securities 1,328,716 1,363,157 1,341,852 Loans Held for Sale 1,410,873 1,215,308 1,397,617 Non-Covered Loans HFI, Gross 3,714,837 4,834,687 4,956,969 Allowance for Non-Covered Loan Losses (36,431) (39,365) (40,484) Non-Covered Loans HFI, Net 3,678,406 4,795,322 4,916,485 Covered Loans, Net of Allowance 840,898 550,626 493,299 Covered OREO 142,174 137,703 125,510 Broker-Dealer & Clearing Receivables 190,764 2,222,517 2,070,770 FDIC Indemnification Asset 175,114 107,567 102,381 Goodwill & Other Intangibles 317,113 317,600 313,586 Other Assets 623,605 1,142,401 1,109,841 Total Assets 9,396,448 12,560,735 12,477,198 Liabilities and Stockholders’ Equity Non-Int. Bearing Deposits 1,829,072 2,259,790 2,135,988 Int. Bearing Deposits 4,326,238 4,869,487 4,660,449 Total Deposits 6,155,310 7,129,277 6,796,437 Broker-Dealer & Clearing Payables 227,891 1,951,040 2,048,176 Short Term Borrowings 1,187,193 999,476 1,100,025 Notes Payable 55,584 108,682 245,420 Junior Subordinated Debentures 67,012 67,012 67,012 Other Liabilities 306,296 525,088 545,496 Total Liabilities 7,999,286 10,780,575 10,802,566 SBLF Preferred Stock 114,068 114,068 - Common Equity 1,282,374 1,665,216 1,673,513 Total Hilltop Equity 1,396,442 1,779,284 1,673,513 Minority Interest 720 876 1,119 Total Liabilities & Equity 9,396,448 12,560,735 12,477,198 Notes: Certain amounts, and resulting percentages, related to the March 31, 2015 financials represent revised figures due to the change in the preliminary bargain purchase gain associated with SWS Merger. |

