Exhibit 99.1
Hilltop HoldingsInc. Q12016EarningsPresentation April 29, 2016
Preface 200 Crescent Court, Suite 1330 Dallas, TX 75201 Phone: (214) 855-2177 Fax: (817) 887-1687 www.hilltop-holdings.com FORWARD-LOOKING STATEMENTS Please contact: Isabell Novakov Phone: (214) 252-4029 Email: inovakov@plainscapital.com This presentation and statements made by representatives of Hilltop Holdings Inc. (“Hilltop” or the “Company”) during the course of this presentation include “forward-looking statements” within the meaning of the Private Securities Litigation Reform Act of 1995. These forward-looking statements involve known and unknown risks, uncertainties and other factors that may cause our actual results, performance or achievements to be materially different from any future results, performance or achievements anticipated in such statements. Forward-looking statements speak only as of the date they are made and, except as required by law, we do not assume any duty to update forward-looking statements. Such forward-looking statements include, but are not limited to, statements concerning such things as our business strategy, our financial condition, our efforts to make strategic acquisitions, the integration of the operations acquired from SWS Group, Inc. (“SWS”), our revenue, our liquidity and sources of funding, market trends, operations and business, expectations concerning mortgage loan origination volume, expected losses on covered loans and related reimbursements from the Federal Deposit Insurance Corporation (“FDIC”), expected levels of refinancing as a percentage of total loan origination volume, projected losses on mortgage loans originated, anticipated changes in our revenues or earnings, the effects of government regulation applicable to our operations, the appropriateness of our allowance for loan losses and provision for loan losses, the collectability of loans and litigation, our other plans, objectives, strategies, expectations and intentions and other statements that are not statements of historical fact, and may be identified by words such as “anticipates,” “believes,” “could,” “estimates,” “expects,” “forecasts,” “goal,” “intends,” “may,” “might,” “plan,” “probable,” “projects,” “seeks,” “should,” “target,” “view” or “would” or the negative of these words and phrases or similar words or phrases. The following factors, among others, could cause actual results to differ from those set forth in the forward-looking statements: (i) risks associated with merger and acquisition integration, including our ability to promptly and effectively integrate our businesses with those acquired from SWS and achieve the anticipated synergies and cost savings in connection therewith, as well as the diversion of management time on acquisition-and integration-related issues; (ii) our ability to estimate loan losses; (iii) changes in the default rate of our loans; (iv) changes in general economic, market and business conditions in areas or markets where we compete, including changes in the price of crude oil; (v) risks associated with concentration in real estate related loans; (vi) severe catastrophic events in Texas and other areas of the southern United States; (vii) changes in the interest rate environment; (viii) cost and availability of capital; (vix) effectiveness of our data security controls in the face of cyber attacks; (x) changes in state and federal laws, regulations or policies affecting one or more of the our business segments, including changes in regulatory fees, deposit insurance premiums, capital requirements and the Dodd-Frank Wall Street Reform and Consumer Protection Act; (xi) approval of new, or changes in, accounting policies and practices; (xii) changes in key management; (xiii) competition in our banking, broker-dealer, mortgage origination and insurance segments from other banks and financial institutions, as well as investment banking and financial advisory firms, mortgage bankers, asset-based non-bank lenders, government agencies and insurance companies; (xiv) our ability to obtain reimbursements for losses on acquired loans under loss-share agreements with the FDIC to the extent the FDIC determines that we did not adequately manage the covered loan portfolio; (xv) failure of our insurance segment reinsurers to pay obligations under reinsurance contracts; and (xvi) our ability to use excess cash in an effective manner, including the execution of successful acquisitions. For further discussion of such factors, see the risk factors described in the Hilltop Annual Report on Form 10-K for the year ended December 31, 2015, Quarterly Report on Form 10-Q for the three months ended March 31, 2016, and other reports filed with the Securities and Exchange Commission. All forward-looking statements are qualified in their entirety by this cautionary statement. 2 Additional Information Corporate Headquarters
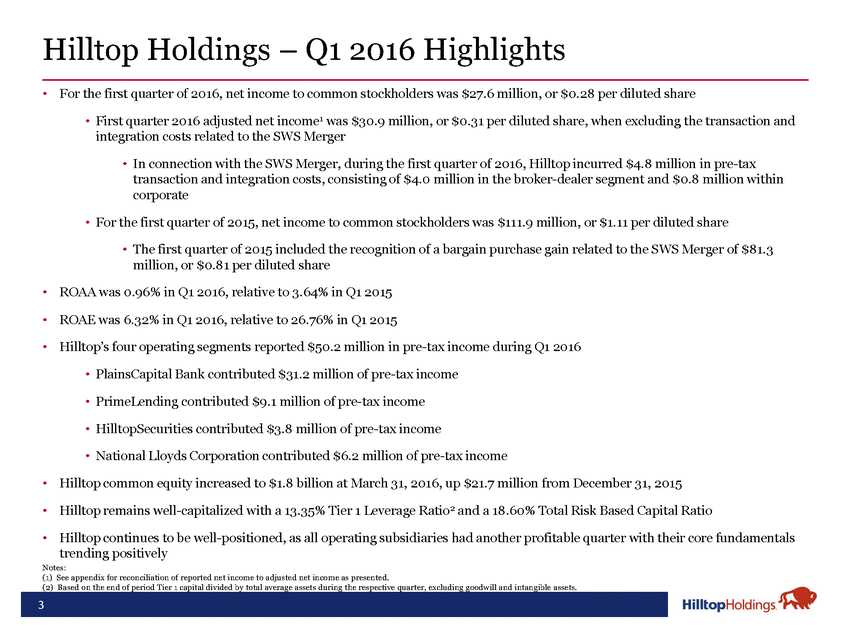
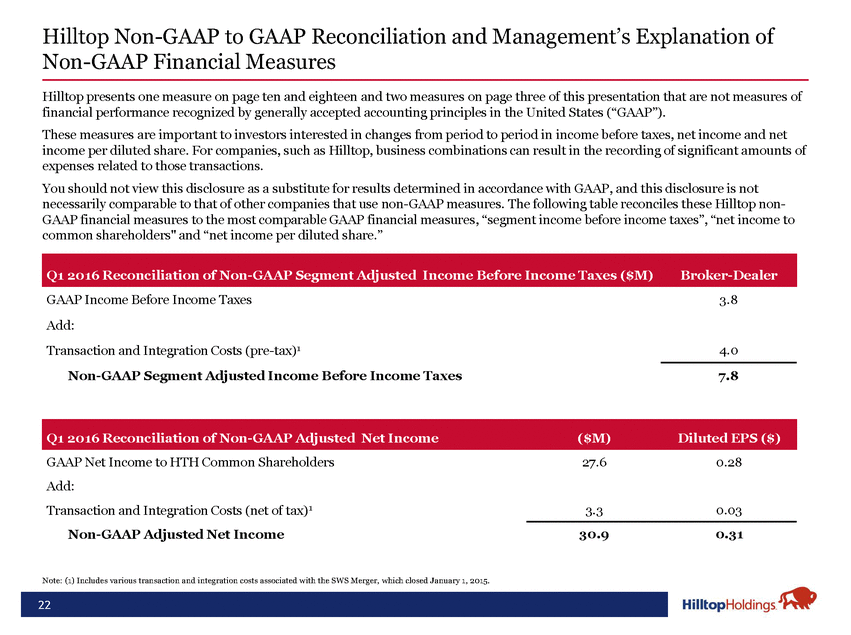
Hilltop Holdings – Q1 2016 Highlights • For the first quarter of 2016, net income to common stockholders was $27.6 million, or $0.28 per diluted share • First quarter 2016 adjusted net income1 was $30.9 million, or $0.31 per diluted share, when excluding the transaction and integration costs related to the SWS Merger • In connection with the SWS Merger, during the first quarter of 2016, Hilltop incurred $4.8 million in pre-tax transaction and integration costs, consisting of $4.0 million in the broker-dealer segment and $0.8 million within corporate • For the first quarter of 2015, net income to common stockholders was $111.9 million, or $1.11 per diluted share • The first quarter of 2015 included the recognition of a bargain purchase gain related to the SWS Merger of $81.3 million, or $0.81 per diluted share • ROAA was 0.96% in Q1 2016, relative to 3.64% in Q1 2015 • ROAE was 6.32% in Q1 2016, relative to 26.76% in Q1 2015 • Hilltop’s four operating segments reported $50.2 million in pre-tax income during Q1 2016 • PlainsCapital Bank contributed $31.2 million of pre-tax income • PrimeLending contributed $9.1 million of pre-tax income • HilltopSecurities contributed $3.8 million of pre-tax income • National Lloyds Corporation contributed $6.2 million of pre-tax income • Hilltop common equity increased to $1.8 billion at March 31, 2016, up $21.7 million from December 31, 2015 • Hilltop remains well-capitalized with a 13.35% Tier 1 Leverage Ratio2 and a 18.60% Total Risk Based Capital Ratio • Hilltop continues to be well-positioned, as all operating subsidiaries had another profitable quarter with their core fundamentals trending positively Notes: (1) See appendix for reconciliation of reported net income to adjusted net income as presented. (2) Based on the end of period Tier 1 capital divided by total average assets during the respective quarter, excluding goodwill and intangible assets. 3
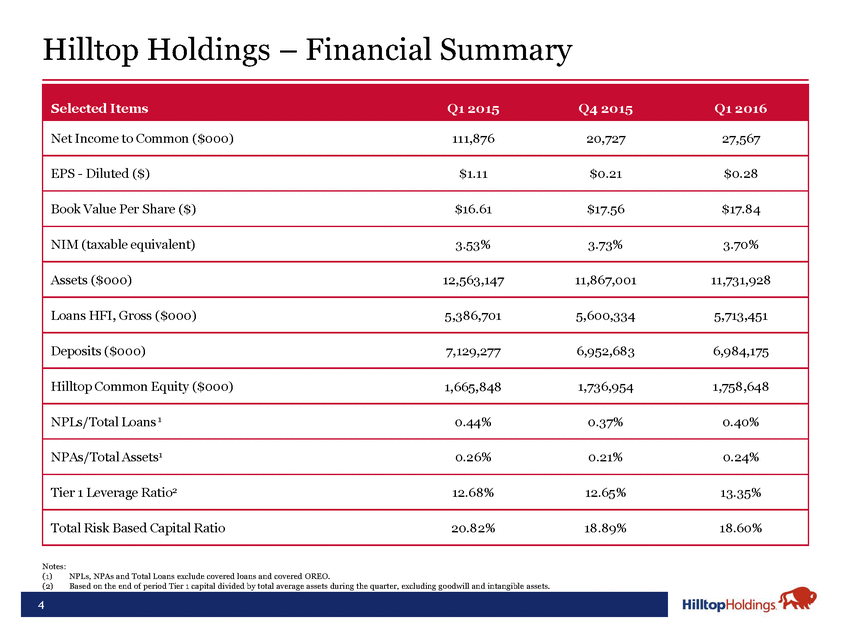
Hilltop Holdings – Financial Summary Notes: (1) (2) NPLs, NPAs and Total Loans exclude covered loans and covered OREO. Based on the end of period Tier 1 capital divided by total average assets during the quarter, excluding goodwill and intangible assets. 4 Selected ItemsQ1 2015Q4 2015Q1 2016 Net Income to Common ($000)111,87620,72727,567 EPS - Diluted ($)$1.11$0.21$0.28 Book Value Per Share ($)$16.61$17.56$17.84 NIM (taxable equivalent)3.53%3.73%3.70% Assets ($000)12,563,14711,867,00111,731,928 Loans HFI, Gross ($000)5,386,7015,600,3345,713,451 Deposits ($000)7,129,2776,952,6836,984,175 Hilltop Common Equity ($000)1,665,8481,736,9541,758,648 NPLs/Total Loans 1 0.44%0.37%0.40% NPAs/Total Assets1 0.26%0.21%0.24% Tier 1 Leverage Ratio2 12.68%12.65%13.35% Total Risk Based Capital Ratio20.82%18.89%18.60%
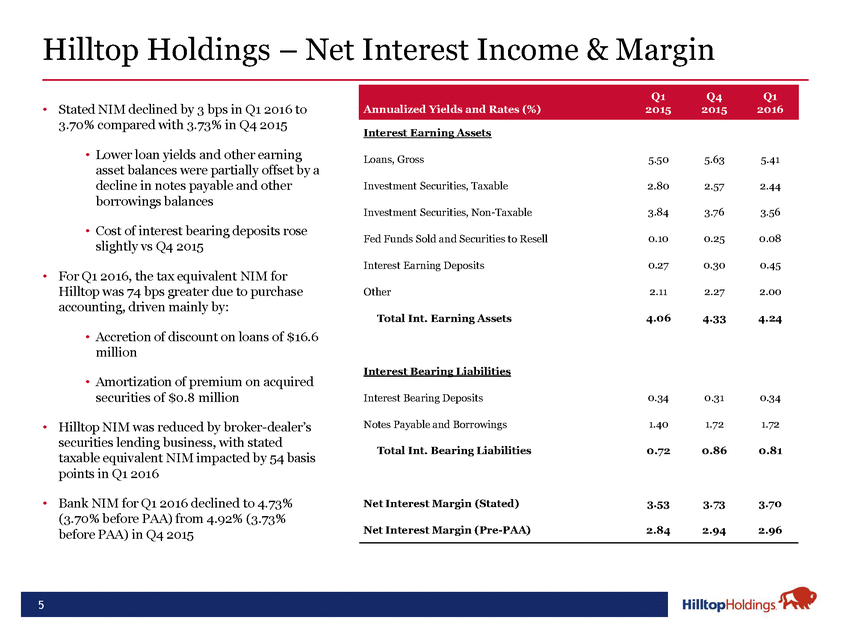
Hilltop Holdings – Net Interest Income & Margin • Stated NIM declined by 3 bps in Q1 2016 to 3.70% compared with 3.73% in Q4 2015 Interest Earning Assets • Lower loan yields and other earning asset balances were partially offset by a decline in notes payable and other borrowings balances Loans, Gross 5.50 5.63 5.41 Investment Securities, Taxable 2.80 2.57 2.44 Investment Securities, Non-Taxable 3.84 3.76 3.56 • Cost of interest bearing deposits rose slightly vs Q4 2015 Fed Funds Sold and Securities to Resell 0.10 0.25 0.08 Interest Earning Deposits 0.27 0.30 0.45 • For Q1 2016, the tax equivalent NIM for Hilltop was 74 bps greater due to purchase accounting, driven mainly by: Other 2.11 2.27 2.00 Total Int. Earning Assets 4.06 4.33 4.24 • Accretion of discount on loans of $16.6 million Interest Bearing Liabilities • Amortization of premium on acquired securities of $0.8 million Interest Bearing Deposits 0.34 0.31 0.34 1.40 1.72 1.72 Notes Payable and Borrowings • Hilltop NIM was reduced by broker-dealer’s securities lending business, with stated taxable equivalent NIM impacted by 54 basis points in Q1 2016 Total Int. Bearing Liabilities 0.72 0.86 0.81 • Bank NIM for Q1 2016 declined to 4.73% (3.70% before PAA) from 4.92% (3.73% before PAA) in Q4 2015 Net Interest Margin (Stated) 3.53 3.73 3.70 2.84 2.94 2.96 Net Interest Margin (Pre-PAA) 5 Q1Q4Q1 Annualized Yields and Rates (%)201520152016
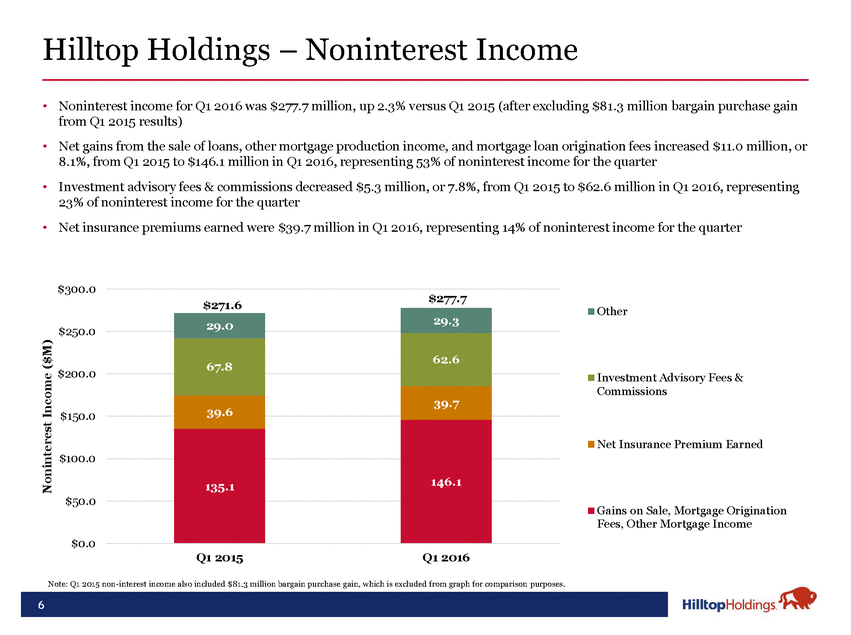
Hilltop Holdings – Noninterest Income • Noninterest income for Q1 2016 was $277.7 million, up 2.3% versus Q1 2015 (after excluding $81.3 million bargain purchase gain from Q1 2015 results) Net gains from the sale of loans, other mortgage production income, and mortgage loan origination fees increased $11.0 million, or 8.1%, from Q1 2015 to $146.1 million in Q1 2016, representing 53% of noninterest income for the quarter Investment advisory fees & commissions decreased $5.3 million, or 7.8%, from Q1 2015 to $62.6 million in Q1 2016, representing 23% of noninterest income for the quarter Net insurance premiums earned were $39.7 million in Q1 2016, representing 14% of noninterest income for the quarter • • • $300.0 $277.7 $271.6 Other $250.0 $200.0 Investment Advisory Fees & Commissions $150.0 Net Insurance Premium Earned $100.0 $50.0 Gains on Sale, Mortgage Origination Fees, Other Mortgage Income $0.0 Q1 2015 Q1 2016 Note: Q1 2015 non-interest income also included $81.3 million bargain purchase gain, which is excluded from graph for comparison purposes. Noninterest Income ($M) 6 29.3 29.0 62.6 67.8 39.7 39.6 146.1 135.1
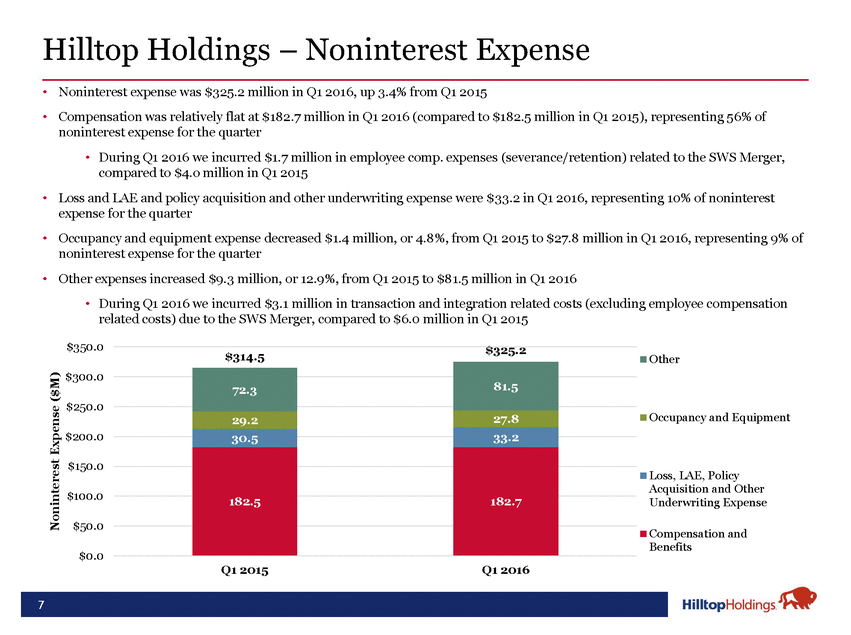
Hilltop Holdings – Noninterest Expense • • Noninterest expense was $325.2 million in Q1 2016, up 3.4% from Q1 2015 Compensation was relatively flat at $182.7 million in Q1 2016 (compared to $182.5 million in Q1 2015), representing 56% of noninterest expense for the quarter • During Q1 2016 we incurred $1.7 million in employee comp. expenses (severance/retention) related to the SWS Merger, compared to $4.o million in Q1 2015 Loss and LAE and policy acquisition and other underwriting expense were $33.2 in Q1 2016, representing 10% of noninterest expense for the quarter Occupancy and equipment expense decreased $1.4 million, or 4.8%, from Q1 2015 to $27.8 million in Q1 2016, representing 9% of noninterest expense for the quarter Other expenses increased $9.3 million, or 12.9%, from Q1 2015 to $81.5 million in Q1 2016 • During Q1 2016 we incurred $3.1 million in transaction and integration related costs (excluding employee compensation related costs) due to the SWS Merger, compared to $6.0 million in Q1 2015 • • • $350.0 $325.2 $314.5 Other $300.0 $250.0 Occupancy and Equipment $200.0 $150.0 Loss, LAE, Policy Acquisition and Other Underwriting Expense $100.0 $50.0 Compensation and Benefits $0.0 Q1 2015 Q1 2016 Noninterest Expense ($M) 7 81.5 72.3 27.8 29.2 30.5 33.2 182.5 182.7
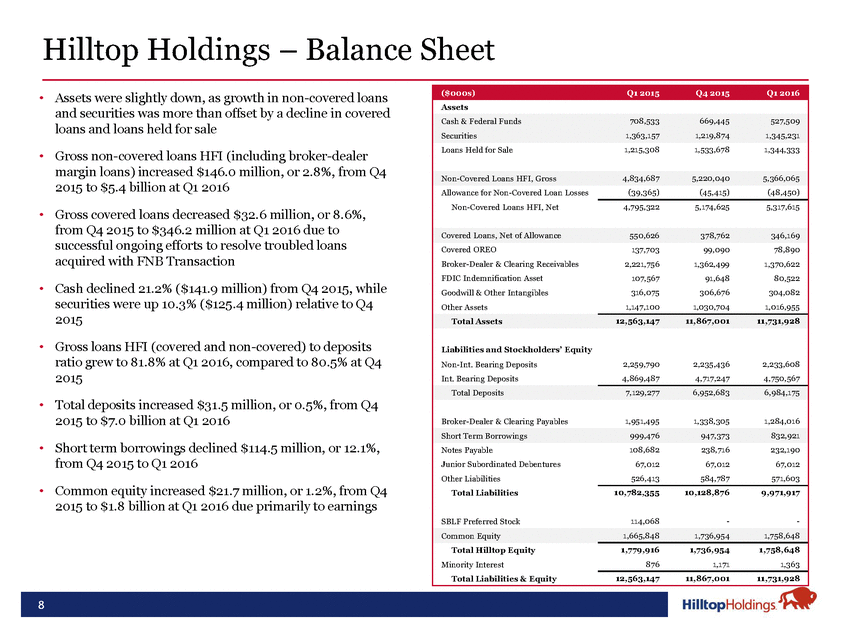
Hilltop Holdings – Balance Sheet • Assets were slightly down, as growth in non-covered loans and securities was more than offset by a decline in covered loans and loans held for sale • Gross non-covered loans HFI (including broker-dealer margin loans) increased $146.0 million, or 2.8%, from Q4 2015 to $5.4 billion at Q1 2016 • Gross covered loans decreased $32.6 million, or 8.6%, from Q4 2015 to $346.2 million at Q1 2016 due to successful ongoing efforts to resolve troubled loans acquired with FNB Transaction • Cash declined 21.2% ($141.9 million) from Q4 2015, while securities were up 10.3% ($125.4 million) relative to Q4 2015 • Gross loans HFI (covered and non-covered) to deposits ratio grew to 81.8% at Q1 2016, compared to 80.5% at Q4 2015 • Total deposits increased $31.5 million, or 0.5%, from Q4 2015 to $7.0 billion at Q1 2016 • Short term borrowings declined $114.5 million, or 12.1%, from Q4 2015 to Q1 2016 • Common equity increased $21.7 million, or 1.2%, from Q4 2015 to $1.8 billion at Q1 2016 due primarily to earnings 8 ($000s)Q1 2015Q4 2015Q1 2016 Assets Cash & Federal Funds708,533669,445527,509 Securities1,363,1571,219,8741,345,231 Loans Held for Sale1,215,3081,533,6781,344,333 Non-Covered Loans HFI, Gross4,834,6875,220,0405,366,065 Allowance for Non-Covered Loan Losses Non-Covered Loans HFI, Net (39,365)(45,415)(48,450) 4,795,3225,174,6255,317,615 Covered Loans, Net of Allowance550,626378,762346,169 Covered OREO137,70399,09078,890 Broker-Dealer & Clearing Receivables2,221,7561,362,4991,370,622 FDIC Indemnification Asset107,56791,64880,522 Goodwill & Other Intangibles316,075306,676304,082 Other Assets1,147,1001,030,7041,016,955 Total Assets12,563,14711,867,00111,731,928 Liabilities and Stockholders’ Equity Non-Int. Bearing Deposits2,259,7902,235,4362,233,608 Int. Bearing Deposits4,869,4874,717,2474,750,567 Total Deposits7,129,2776,952,6836,984,175 Broker-Dealer & Clearing Payables1,951,4951,338,3051,284,016 Short Term Borrowings999,476947,373832,921 Notes Payable Junior Subordinated Debentures Other Liabilities Total Liabilities SBLF Preferred Stock 108,682238,716232,190 67,01267,01267,012 526,413584,787571,603 10,782,35510,128,8769,971,917 114,068--Common Equity1,665,8481,736,9541,758,648 Total Hilltop Equity Minority Interest Total Liabilities & Equity 1,779,9161,736,9541,758,648 8761,1711,363 12,563,14711,867,00111,731,928
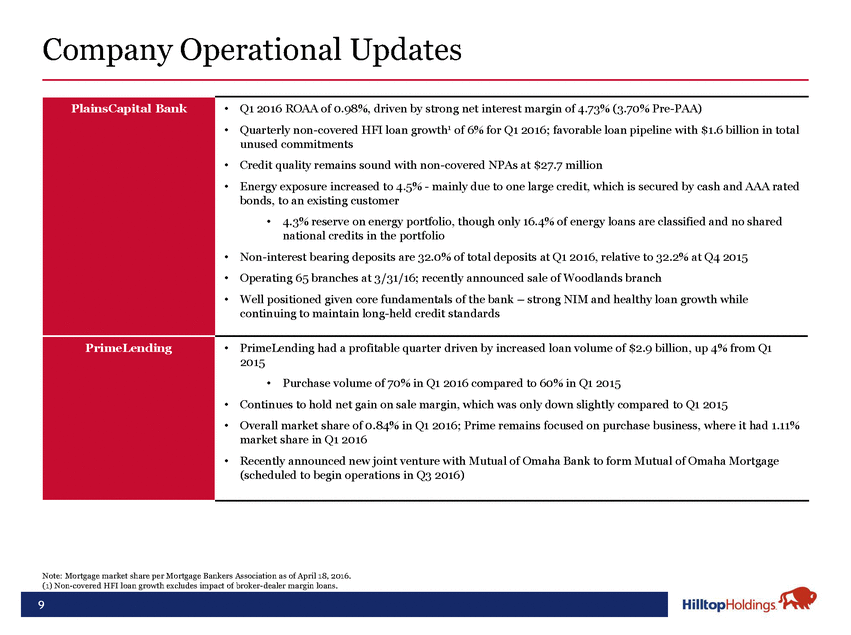
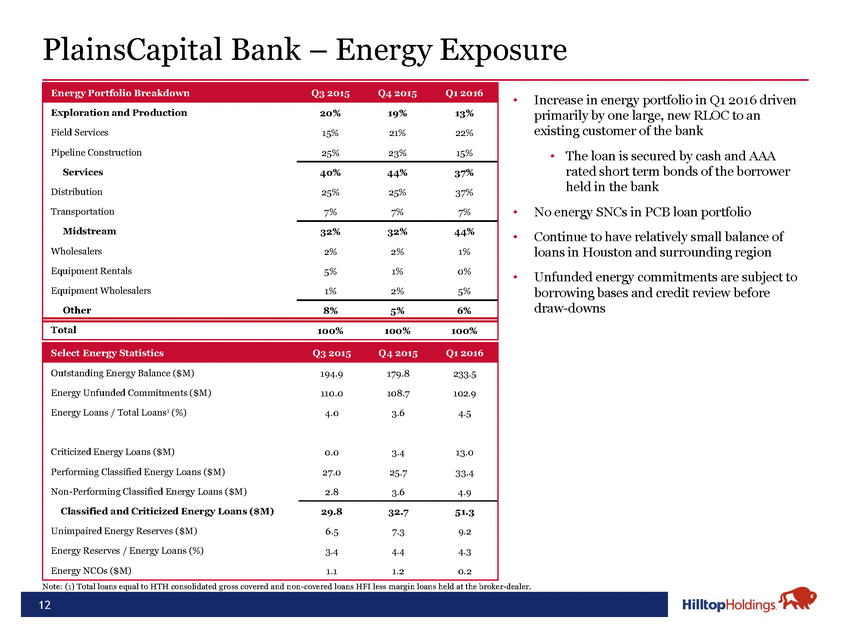
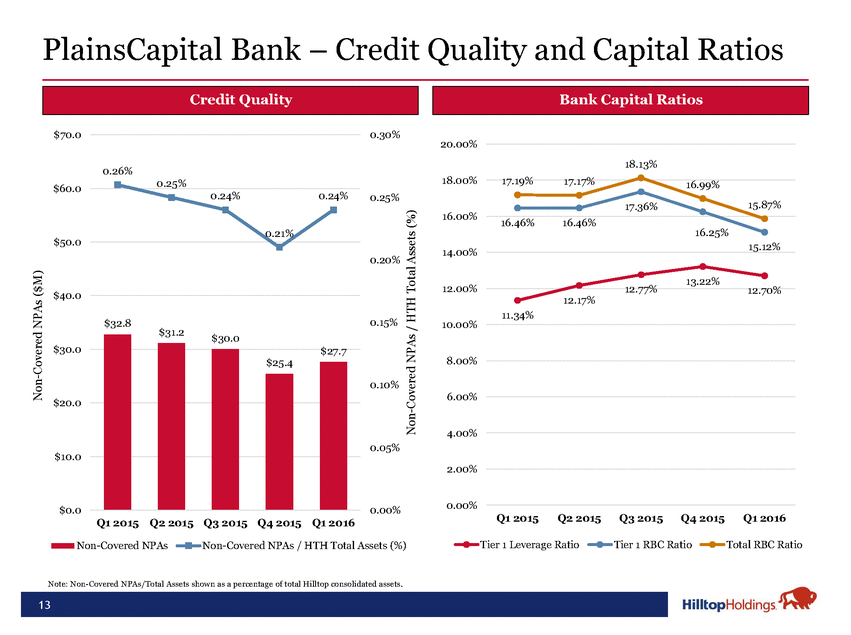
Company Operational Updates Note: Mortgage market share per Mortgage Bankers Association as of April 18, 2016. (1) Non-covered HFI loan growth excludes impact of broker-dealer margin loans. 9 PlainsCapital Bank •Q1 2016 ROAA of 0.98%, driven by strong net interest margin of 4.73% (3.70% Pre-PAA) •Quarterly non-covered HFI loan growth1 of 6% for Q1 2016; favorable loan pipeline with $1.6 billion in total unused commitments •Credit quality remains sound with non-covered NPAs at $27.7 million •Energy exposure increased to 4.5% - mainly due to one large credit, which is secured by cash and AAA rated bonds, to an existing customer •4.3% reserve on energy portfolio, though only 16.4% of energy loans are classified and no shared national credits in the portfolio •Non-interest bearing deposits are 32.0% of total deposits at Q1 2016, relative to 32.2% at Q4 2015 •Operating 65 branches at 3/31/16; recently announced sale of Woodlands branch •Well positioned given core fundamentals of the bank – strong NIM and healthy loan growth while continuing to maintain long-held credit standards PrimeLending •PrimeLending had a profitable quarter driven by increased loan volume of $2.9 billion, up 4% from Q1 2015 •Purchase volume of 70% in Q1 2016 compared to 60% in Q1 2015 •Continues to hold net gain on sale margin, which was only down slightly compared to Q1 2015 •Overall market share of 0.84% in Q1 2016; Prime remains focused on purchase business, where it had 1.11% market share in Q1 2016 •Recently announced new joint venture with Mutual of Omaha Bank to form Mutual of Omaha Mortgage (scheduled to begin operations in Q3 2016)
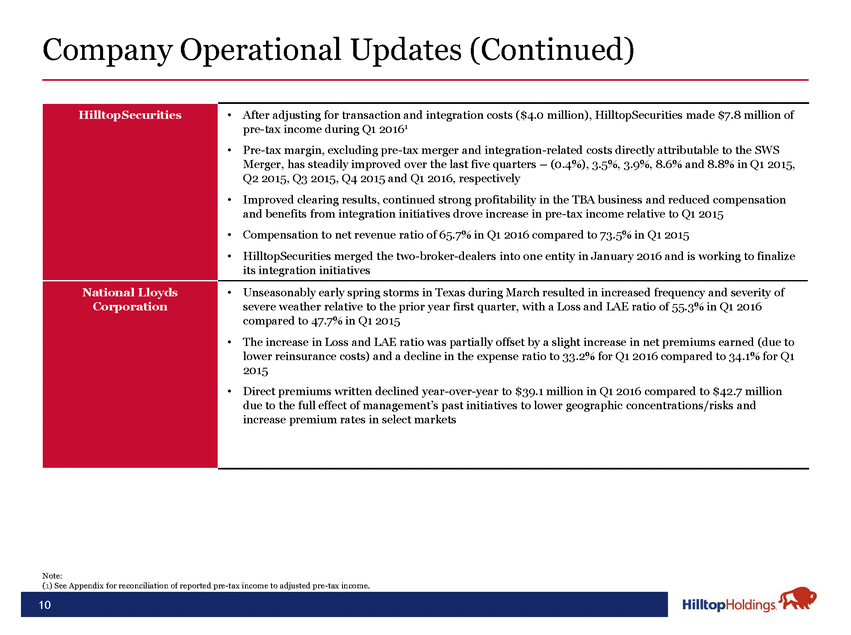
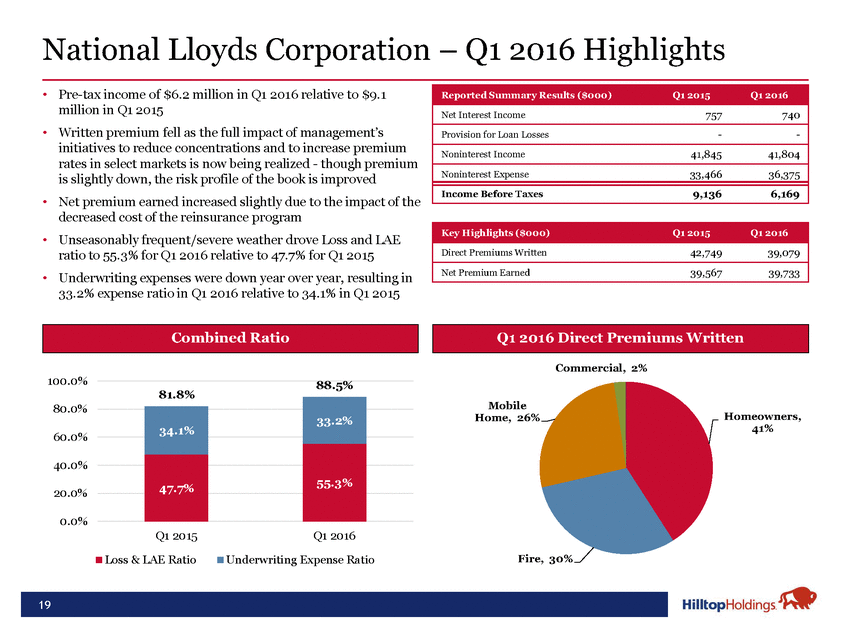
Company Operational Updates (Continued) Note: (1) See Appendix for reconciliation of reported pre-tax income to adjusted pre-tax income. 10 HilltopSecurities •After adjusting for transaction and integration costs ($4.0 million), HilltopSecurities made $7.8 million of pre-tax income during Q1 20161 •Pre-tax margin, excluding pre-tax merger and integration-related costs directly attributable to the SWS Merger, has steadily improved over the last five quarters – (0.4%), 3.5%, 3.9%, 8.6% and 8.8% in Q1 2015, Q2 2015, Q3 2015, Q4 2015 and Q1 2016, respectively •Improved clearing results, continued strong profitability in the TBA business and reduced compensation and benefits from integration initiatives drove increase in pre-tax income relative to Q1 2015 •Compensation to net revenue ratio of 65.7% in Q1 2016 compared to 73.5% in Q1 2015 •HilltopSecurities merged the two-broker-dealers into one entity in January 2016 and is working to finalize its integration initiatives National Lloyds Corporation •Unseasonably early spring storms in Texas during March resulted in increased frequency and severity of severe weather relative to the prior year first quarter, with a Loss and LAE ratio of 55.3% in Q1 2016 compared to 47.7% in Q1 2015 •The increase in Loss and LAE ratio was partially offset by a slight increase in net premiums earned (due to lower reinsurance costs) and a decline in the expense ratio to 33.2% for Q1 2016 compared to 34.1% for Q1 2015 •Direct premiums written declined year-over-year to $39.1 million in Q1 2016 compared to $42.7 million due to the full effect of management’s past initiatives to lower geographic concentrations/risks and increase premium rates in select markets
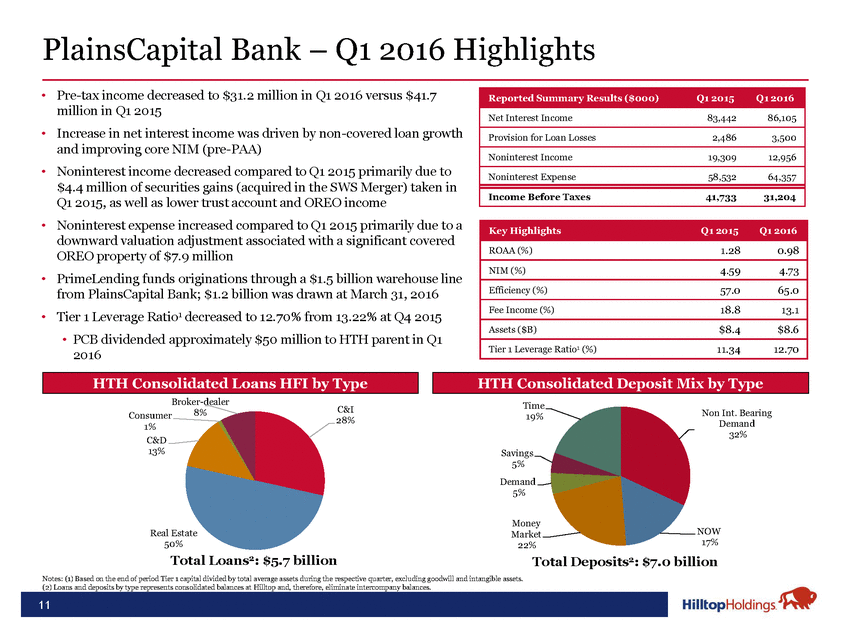
PlainsCapital Bank – Q1 2016 Highlights • Pre-tax income decreased to $31.2 million in Q1 2016 versus $41.7 million in Q1 2015 Increase in net interest income was driven by non-covered loan growth and improving core NIM (pre-PAA) Noninterest income decreased compared to Q1 2015 primarily due to $4.4 million of securities gains (acquired in the SWS Merger) taken in Q1 2015, as well as lower trust account and OREO income Noninterest expense increased compared to Q1 2015 primarily due to a downward valuation adjustment associated with a significant covered OREO property of $7.9 million PrimeLending funds originations through a $1.5 billion warehouse line from PlainsCapital Bank; $1.2 billion was drawn at March 31, 2016 Tier 1 Leverage Ratio1 decreased to 12.70% from 13.22% at Q4 2015 • • • • • • PCB dividended approximately $50 million to HTH parent in Q1 2016 Broker-dealer Time 19% C&I 28% 8% Non Int. Bearing Demand 32% Consumer 1% C&D 13% Savings 5% Demand 5% Money Market 22% NOW 17% Real Estate 50% Total Loans2: $5.7 billion Total Deposits2: $7.0 billion Notes: (1) Based on the end of period Tier 1 capital divided by total average assets during the respective quarter, excluding goodwill and intangible assets. (2) Loans and deposits by type represents consolidated balances at Hilltop and, therefore, eliminate intercompany balances. 11 HTH Consolidated Deposit Mix by Type HTH Consolidated Loans HFI by Type Key HighlightsQ1 2015Q1 2016 ROAA (%)1.280.98 NIM (%)4.594.73 Efficiency (%)57.065.0 Fee Income (%)18.813.1 Assets ($B)$8.4$8.6 Tier 1 Leverage Ratio1 (%)11.3412.70 Reported Summary Results ($000)Q1 2015Q1 2016 Net Interest Income83,44286,105 Provision for Loan Losses2,4863,500 Noninterest Income19,30912,956 Noninterest Expense58,53264,357 Income Before Taxes41,73331,204
PlainsCapital Bank – Energy Exposure • Increase in energy portfolio in Q1 2016 driven primarily by one large, new RLOC to an existing customer of the bank • The loan is secured by cash and AAA rated short term bonds of the borrower held in the bank No energy SNCs in PCB loan portfolio Continue to have relatively small balance of loans in Houston and surrounding region Unfunded energy commitments are subject to borrowing bases and credit review before draw-downs • • • Note: (1) Total loans equal to HTH consolidated gross covered and non-covered loans HFI less margin loans held at the broker-dealer. 12 Energy Portfolio BreakdownQ3 2015Q4 2015Q1 2016 Exploration and Production Field Services Pipeline Construction Services Distribution Transportation Midstream Wholesalers Equipment Rentals Equipment Wholesalers Other 20%19%13% 15%21%22% 25%23%15% 40%44%37% 25%25%37% 7%7%7% 32%32%44% 2%2%1% 5%1%0% 1%2%5% 8%5%6% Total100%100%100% Select Energy StatisticsQ3 2015Q4 2015Q1 2016 Outstanding Energy Balance ($M) Energy Unfunded Commitments ($M) Energy Loans / Total Loans1 (%) Criticized Energy Loans ($M) Performing Classified Energy Loans ($M) Non-Performing Classified Energy Loans ($M) Classified and Criticized Energy Loans ($M) Unimpaired Energy Reserves ($M) Energy Reserves / Energy Loans (%) Energy NCOs ($M) 194.9179.8233.5 110.0108.7102.9 4.03.64.5 0.03.413.0 27.025.733.4 2.83.64.9 29.832.751.3 6.57.39.2 3.44.44.3 1.11.20.2
PlainsCapital Bank – Credit Quality and Capital Ratios $70.0 0.30% 20.00% 18.13% 0.26% 18.00% 17.19% 17.17% 0.25% 16.99% $60.0 0.24% 0.24% 0.25% 15.87% 17.36% 16.00% 16.46% 16.46% 0.21% 16.25% $50.0 15.12% 14.00% 0.20% 13.22% 12.00% 12.77% 12.70% $40.0 12.17% 11.34% 0.15% $32.8 10.00% $31.2 $30.0 $30.0 8.00% $25.4 0.10% 6.00% $20.0 4.00% 0.05% $10.0 2.00% 0.00% $0.0 0.00% Q1 2015 Q2 2015 Q3 2015 Q4 2015 Q1 2016 Q1 2015 Q2 2015 Q3 2015 Q4 2015 Q1 2016 Tier 1 Leverage Ratio Tier 1 RBC Ratio Total RBC Ratio Non-Covered NPAs Non-Covered NPAs / HTH Total Assets (%) Note: Non-Covered NPAs/Total Assets shown as a percentage of total Hilltop consolidated assets. Non-Covered NPAs ($M) Non-Covered NPAs / HTH Total Assets (%) 13 $27.7 • Bank Capital Ratios • Credit Quality
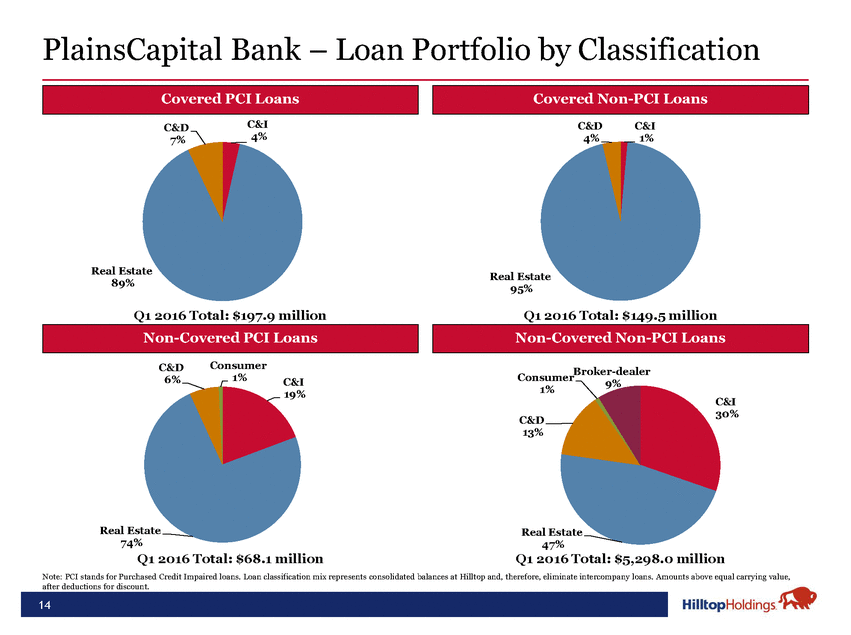
PlainsCapital Bank – Loan Portfolio by Classification C&I 4% C&D 4% C&I C&D 7% 1% Real Estate 89% Real Estate 95% Q1 2016 Total: $197.9 million Q1 2016 Total: $149.5 million Consumer 1% C&D 6% Broker-dealer Consumer 1% C&I 19% 9% C&I 30% C&D 13% Real Estate 74% Q1 2016 Total: $68.1 million Real Estate 47% Q1 2016 Total: $5,298.0 million Note: PCI stands for Purchased Credit Impaired loans. Loan classification mix represents consolidated balances at Hilltop and, therefore, eliminate intercompany loans. Amounts above equal carrying value, after deductions for discount. 14 Non-Covered Non-PCI Loans Non-Covered PCI Loans Covered Non-PCI Loans Covered PCI Loans
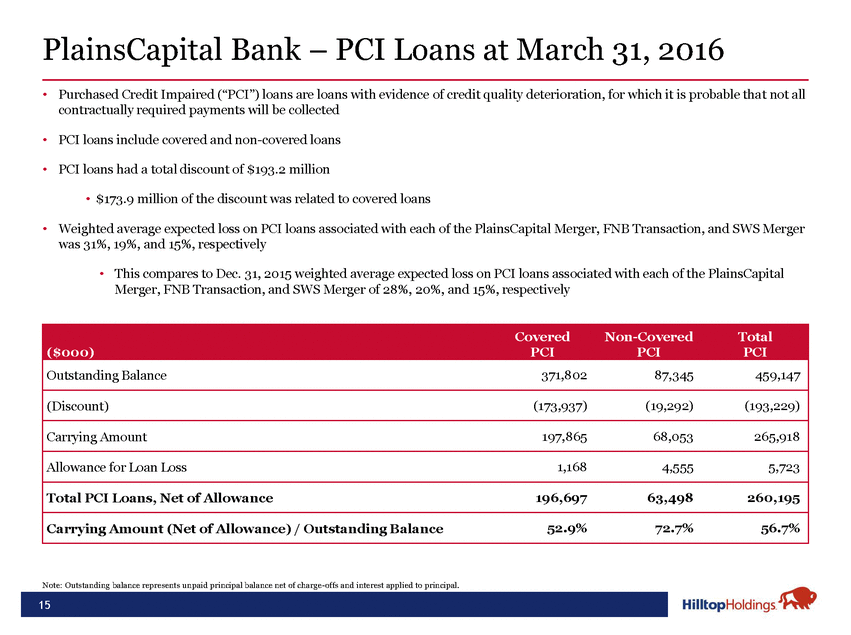
PlainsCapital Bank – PCI Loans at March 31, 2016 • Purchased Credit Impaired (“PCI”) loans are loans with evidence of credit quality deterioration, for which it is probable that not all contractually required payments will be collected • PCI loans include covered and non-covered loans • PCI loans had a total discount of $193.2 million • $173.9 million of the discount was related to covered loans • Weighted average expected loss on PCI loans associated with each of the PlainsCapital Merger, FNB Transaction, and SWS Merger was 31%, 19%, and 15%, respectively • This compares to Dec. 31, 2015 weighted average expected loss on PCI loans associated with each of the PlainsCapital Merger, FNB Transaction, and SWS Merger of 28%, 20%, and 15%, respectively Note: Outstanding balance represents unpaid principal balance net of charge-offs and interest applied to principal. 15 CoveredNon-CoveredTotal ($000)PCIPCIPCI Outstanding Balance371,80287,345459,147 (Discount)(173,937)(19,292)(193,229) Carrying Amount197,86568,053265,918 Allowance for Loan Loss1,1684,5555,723 Total PCI Loans, Net of Allowance196,69763,498260,195 Carrying Amount (Net of Allowance) / Outstanding Balance52.9%72.7%56.7%
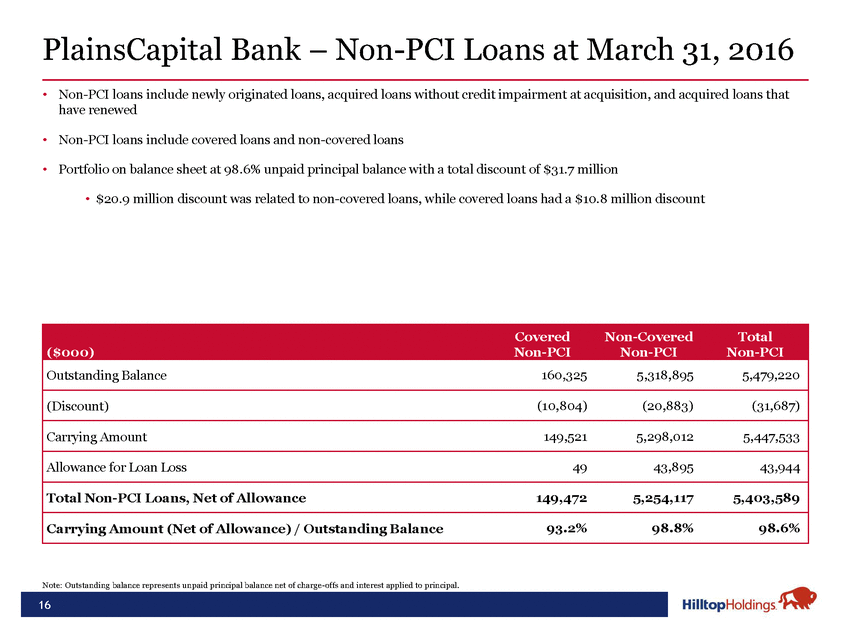
PlainsCapital Bank – Non-PCI Loans at March 31, 2016 • Non-PCI loans include newly originated loans, acquired loans without credit impairment at acquisition, and acquired loans that have renewed • Non-PCI loans include covered loans and non-covered loans • Portfolio on balance sheet at 98.6% unpaid principal balance with a total discount of $31.7 million • $20.9 million discount was related to non-covered loans, while covered loans had a $10.8 million discount Note: Outstanding balance represents unpaid principal balance net of charge-offs and interest applied to principal. 16 CoveredNon-CoveredTotal ($000)Non-PCINon-PCINon-PCI Outstanding Balance160,3255,318,8955,479,220 (Discount)(10,804)(20,883)(31,687) Carrying Amount149,5215,298,0125,447,533 Allowance for Loan Loss4943,89543,944 Total Non-PCI Loans, Net of Allowance149,4725,254,1175,403,589 Carrying Amount (Net of Allowance) / Outstanding Balance93.2%98.8%98.6%
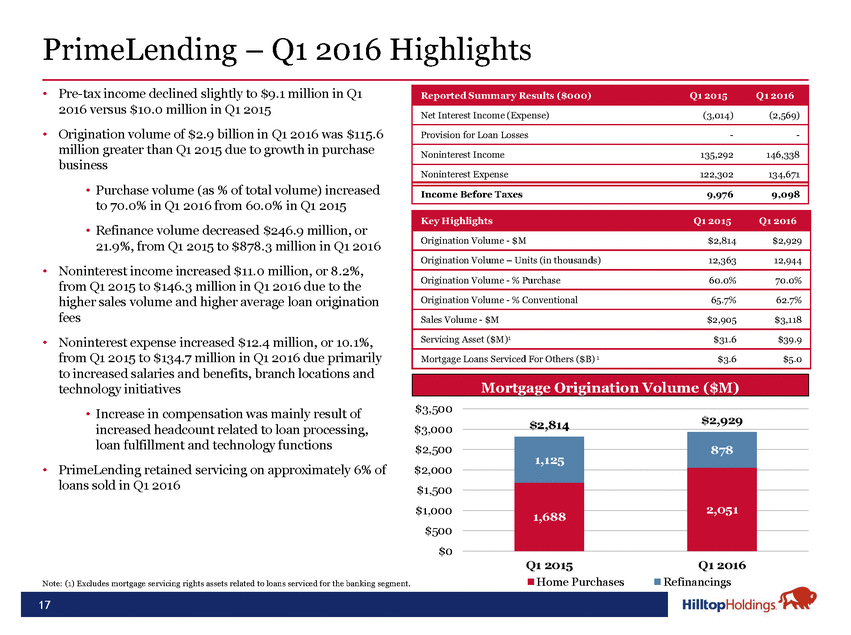
PrimeLending – Q1 2016 Highlights • Pre-tax income declined slightly to $9.1 million in Q1 2016 versus $10.0 million in Q1 2015 Origination volume of $2.9 billion in Q1 2016 was $115.6 million greater than Q1 2015 due to growth in purchase business • Purchase volume (as % of total volume) increased to 70.0% in Q1 2016 from 60.0% in Q1 2015 • Refinance volume decreased $246.9 million, or 21.9%, from Q1 2015 to $878.3 million in Q1 2016 Noninterest income increased $11.0 million, or 8.2%, from Q1 2015 to $146.3 million in Q1 2016 due to the higher sales volume and higher average loan origination fees Noninterest expense increased $12.4 million, or 10.1%, from Q1 2015 to $134.7 million in Q1 2016 due primarily to increased salaries and benefits, branch locations and technology initiatives • Increase in compensation was mainly result of increased headcount related to loan processing, loan fulfillment and technology functions PrimeLending retained servicing on approximately 6% of loans sold in Q1 2016 • • • $3,500 $3,000 $2,500 $2,000 $1,500 $1,000 $500 $0 $2,814 $2,929 • Q1 2015 Q1 2016 Refinancings Home Purchases Note: (1) Excludes mortgage servicing rights assets related to loans serviced for the banking segment. 17 878 1,125 2,051 1,688 Mortgage Origination Volume ($M) Key HighlightsQ1 2015Q1 2016 Origination Volume - $M$2,814$2,929 Origination Volume – Units (in thousands)12,36312,944 Origination Volume - % Purchase60.0%70.0% Origination Volume - % Conventional65.7%62.7% Sales Volume - $M$2,905$3,118 Servicing Asset ($M)1 $31.6$39.9 Mortgage Loans Serviced For Others ($B) 1 $3.6$5.0 Reported Summary Results ($000)Q1 2015Q1 2016 Net Interest Income (Expense)(3,014)(2,569) Provision for Loan Losses--Noninterest Income135,292146,338 Noninterest Expense122,302134,671 Income Before Taxes9,9769,098
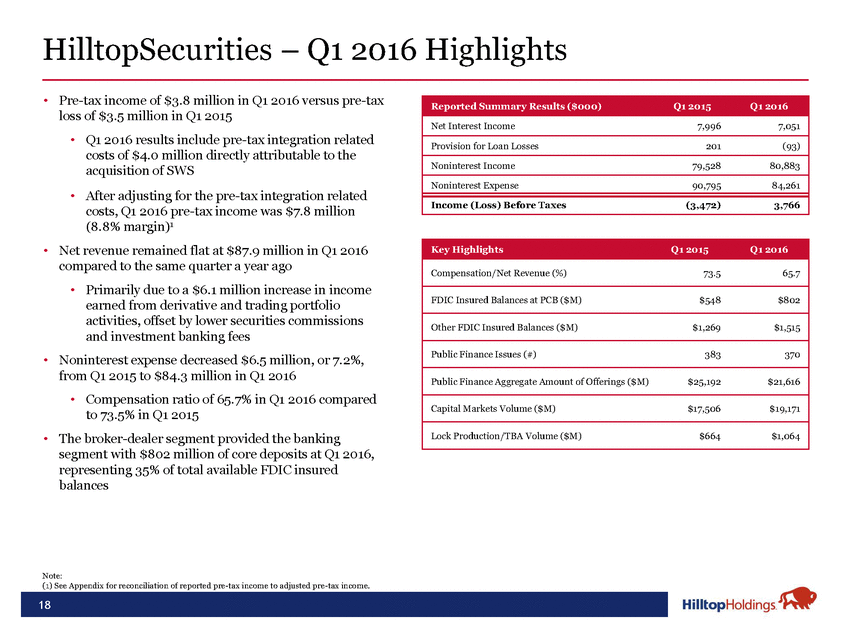
HilltopSecurities – Q1 2016 Highlights • Pre-tax income of $3.8 million in Q1 2016 versus pre-tax loss of $3.5 million in Q1 2015 • Q1 2016 results include pre-tax integration related costs of $4.0 million directly attributable to the acquisition of SWS • After adjusting for the pre-tax integration related costs, Q1 2016 pre-tax income was $7.8 million (8.8% margin)1 Net revenue remained flat at $87.9 million in Q1 2016 compared to the same quarter a year ago • Primarily due to a $6.1 million increase in income earned from derivative and trading portfolio activities, offset by lower securities commissions and investment banking fees Noninterest expense decreased $6.5 million, or 7.2%, from Q1 2015 to $84.3 million in Q1 2016 • Compensation ratio of 65.7% in Q1 2016 compared to 73.5% in Q1 2015 The broker-dealer segment provided the banking segment with $802 million of core deposits at Q1 2016, representing 35% of total available FDIC insured balances • • • Note: (1) See Appendix for reconciliation of reported pre-tax income to adjusted pre-tax income. 18 Key HighlightsQ1 2015Q1 2016 Compensation/Net Revenue (%)73.565.7 FDIC Insured Balances at PCB ($M)$548$802 Other FDIC Insured Balances ($M)$1,269$1,515 Public Finance Issues (#)383370 Public Finance Aggregate Amount of Offerings ($M)$25,192$21,616 Capital Markets Volume ($M)$17,506$19,171 Lock Production/TBA Volume ($M)$664$1,064 Reported Summary Results ($000)Q1 2015Q1 2016 Net Interest Income7,9967,051 Provision for Loan Losses201(93) Noninterest Income79,52880,883 Noninterest Expense90,79584,261 Income (Loss) Before Taxes(3,472)3,766
National Lloyds Corporation – Q1 2016 Highlights • Pre-tax income of $6.2 million in Q1 2016 relative to $9.1 million in Q1 2015 Written premium fell as the full impact of management’s initiatives to reduce concentrations and to increase premium rates in select markets is now being realized - though premium is slightly down, the risk profile of the book is improved Net premium earned increased slightly due to the impact of the decreased cost of the reinsurance program Unseasonably frequent/severe weather drove Loss and LAE ratio to 55.3% for Q1 2016 relative to 47.7% for Q1 2015 Underwriting expenses were down year over year, resulting in 33.2% expense ratio in Q1 2016 relative to 34.1% in Q1 2015 • • • • Commercial, 2% 100.0% 88.5% 81.8% Mobile Home, 26% 80.0% Homeowners, 41% 60.0% 40.0% 20.0% 0.0% Q1 2015 Loss & LAE Ratio Q1 2016 Underwriting Expense Ratio Fire, 30% 19 33.2% 34.1% 55.3% 47.7% Q1 2016 Direct Premiums Written Combined Ratio Key Highlights ($000)Q1 2015Q1 2016 Direct Premiums Written42,74939,079 Net Premium Earned39,56739,733 Reported Summary Results ($000)Q1 2015Q1 2016 Net Interest Income757740 Provision for Loan Losses--Noninterest Income41,84541,804 Noninterest Expense33,46636,375 Income Before Taxes9,1366,169
Questions? 20
Appendix 21
Hilltop Non-GAAP to GAAP Reconciliation and Management’s Explanation of Non-GAAP Financial Measures Hilltop presents one measure on page ten and eighteen and two measures on page three of this presentation that are not measures of financial performance recognized by generally accepted accounting principles in the United States (“GAAP”). These measures are important to investors interested in changes from period to period in income before taxes, net income and net income per diluted share. For companies, such as Hilltop, business combinations can result in the recording of significant amounts of expenses related to those transactions. You should not view this disclosure as a substitute for results determined in accordance with GAAP, and this disclosure is not necessarily comparable to that of other companies that use non-GAAP measures. The following table reconciles these Hilltop non-GAAP financial measures to the most comparable GAAP financial measures, “segment income before income taxes”, “net income to common shareholders" and “net income per diluted share.” GAAP Income Before Income Taxes Add: Transaction and Integration Costs (pre-tax)1 Non-GAAP Segment Adjusted Income Before Income Taxes 3.8 4.0 7.8 GAAP Net Income to HTH Common Shareholders Add: Transaction and Integration Costs (net of tax)1 Non-GAAP Adjusted Net Income 27.6 0.28 3.3 0.03 30.9 0.31 Note: (1) Includes various transaction and integration costs associated with the SWS Merger, which closed January 1, 2015. 22 Q1 2016 Reconciliation of Non-GAAP Adjusted Net Income($M)Diluted EPS ($) Q1 2016 Reconciliation of Non-GAAP Segment Adjusted Income Before Income Taxes ($M)Broker-Dealer