EXHIBIT 99.1
Hilltop HoldingsInc. Q12017EarningsPresentation April 26, 2017
Preface 200 Crescent Court, Suite 1330 Dallas, TX 75201 Phone: (214) 855-2177 www.hilltop-holdings.com Please contact: Isabell Novakov Phone: (214) 252-4029 Email: inovakov@hilltop-holdings.com FORWARD-LOOKING STATEMENTS This presentation and statements made by representatives of Hilltop Holdings Inc. (“Hilltop” or the “Company”) during the course of this presentation include “forward-looking statements” within the meaning of the Private Securities Litigation Reform Act of 1995. These forward-looking statements involve known and unknown risks, uncertainties and other factors that may cause our actual results, performance or achievements to be materially different from any future results, performance or achievements anticipated in such statements. Forward-looking statements speak only as of the date they are made and, except as required by law, we do not assume any duty to update forward-looking statements. Such forward-looking statements include, but are not limited to, statements concerning such things as our business strategy, our financial condition, our efforts to make strategic acquisitions, the costs of integration of the operations acquired in the SWS Merger, our revenue, our liquidity and sources of funding, market trends, operations and business, stock repurchases, dividend payments, expectations concerning mortgage loan origination volume and interest rate compression, expected losses on covered loans and related reimbursements from the Federal Deposit Insurance Corporation (“FDIC”), expected levels of refinancing as a percentage of total loan origination volume, projected losses on mortgage loans originated, the effects of government regulation applicable to our operations, the appropriateness of our allowance for loan losses and provision for lending losses, the collectability of loans and the outcome of litigation, our other plans, objectives, strategies, expectations and intentions and other statements that are not statements of historical fact, and may be identified by words such as “anticipates,” “believes,” “could,” “estimates,” “expects,” “forecasts,” “goal,” “intends,” “may,” “might,” “plan,” “probable,” “projects,” “seeks,” “should,” “target,” “view” or “would” or the negative of these words and phrases or similar words or phrases. The following factors, among others, could cause actual results to differ from those set forth in the forward-looking statements: (i) the credit risks of loan activities, including our ability to estimate loan losses; (ii) the effects of changes in the level of, and trends in, loan delinquencies and write-offs; (iii) changes in general economic, market and business conditions in areas or markets where we compete, including changes in the price of crude oil; (iv) changes in the interest rate environment; (v) risks associated with concentration in real estate related loans; (vi) risks associated with merger and acquisition integration; (vii) severe catastrophic events in Texas and other areas of the southern United States; (viii) effectiveness of our data security controls in the face of cyber attacks; (ix) the effects of our indebtedness on our ability to manage our business successfully, including the restrictions imposed by the indenture governing our indebtedness; (x) cost and availability of capital; (xi) changes in state and federal laws, regulations or policies affecting one or more of the our business segments, including changes in regulatory fees, deposit insurance premiums, capital requirements and the Dodd-Frank Wall Street Reform and Consumer Protection Act; (xii) changes in key management; (xiii) competition in our banking, broker-dealer, mortgage origination and insurance segments from other banks and financial institutions, as well as investment banking and financial advisory firms, mortgage bankers, asset-based non-bank lenders, government agencies and insurance companies; (xiv) our obligations under loss-share agreements with the FDIC, including the possibility that we may be required to make a “true-up” payment to the FDIC; (xv) failure of our insurance segment reinsurers to pay obligations under reinsurance contracts; and (xvi) our ability to use excess capital in an effective manner. For further discussion of such factors, see the risk factors described in our most recent Annual Report on Form 10-K , and subsequent Quarterly Reports on Form 10-Q and other reports, that we have filed with the Securities and Exchange Commission. All forward-looking statements are qualified in their entirety by this cautionary statement. 2 Additional Information Corporate Headquarters
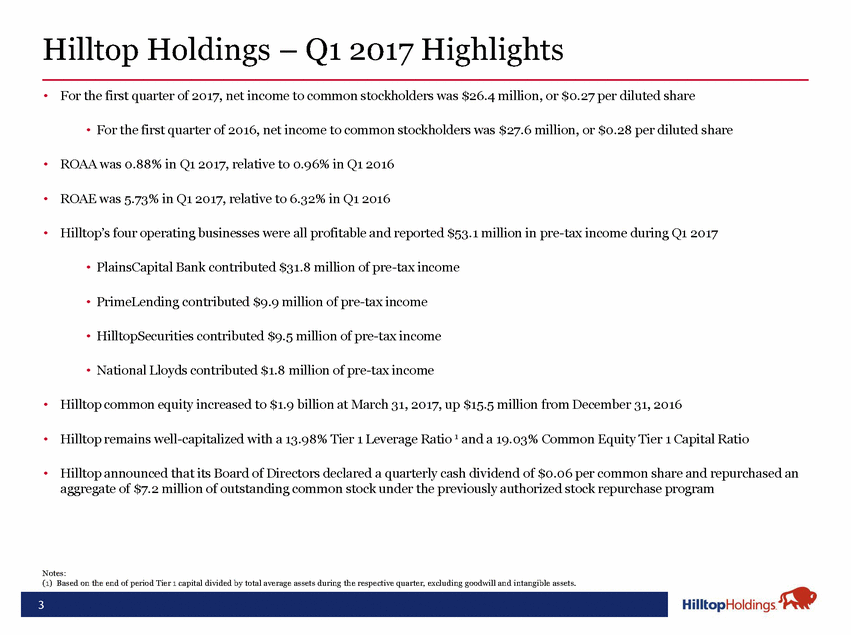
Hilltop Holdings – Q1 2017 Highlights • For the first quarter of 2017, net income to common stockholders was $26.4 million, or $0.27 per diluted share • For the first quarter of 2016, net income to common stockholders was $27.6 million, or $0.28 per diluted share • ROAA was 0.88% in Q1 2017, relative to 0.96% in Q1 2016 • ROAE was 5.73% in Q1 2017, relative to 6.32% in Q1 2016 • Hilltop’s four operating businesses were all profitable and reported $53.1 million in pre-tax income during Q1 2017 • PlainsCapital Bank contributed $31.8 million of pre-tax income • PrimeLending contributed $9.9 million of pre-tax income • HilltopSecurities contributed $9.5 million of pre-tax income • National Lloyds contributed $1.8 million of pre-tax income • Hilltop common equity increased to $1.9 billion at March 31, 2017, up $15.5 million from December 31, 2016 • Hilltop remains well-capitalized with a 13.98% Tier 1 Leverage Ratio 1 and a 19.03% Common Equity Tier 1 Capital Ratio • Hilltop announced that its Board of Directors declared a quarterly cash dividend of $0.06 per common share and repurchased an aggregate of $7.2 million of outstanding common stock under the previously authorized stock repurchase program Notes: (1) Based on the end of period Tier 1 capital divided by total average assets during the respective quarter, excluding goodwill and intangible assets. 3
Hilltop Holdings – Financial Summary Notes: (1) (2) See appendix for reconciliation of NIM to taxable equivalent NIM, as well as taxable equivalent NIM to Pre-PAA taxable equivalent NIM, as presented. Based on the end of period Tier 1 capital divided by total average assets during the quarter, excluding goodwill and intangible assets. 4 Selected ItemsQ1 2016Q4 2016Q1 2017 Net Income to Common Stockholders ($000)27,56735,32126,434 EPS - Diluted ($)$0.28$0.36$0.27 Book Value Per Share ($)$17.84$18.98$19.17 Net Interest Margin3.67%3.80%3.52% Taxable Equivalent NIM (Pre-PAA Taxable Equivalent NIM) 1 3.70% (2.96%)3.82% (3.11%)3.54% (3.05%) Assets ($000)11,731,92812,738,06212,338,427 Loans HFI, Gross ($000)5,682,9336,099,6266,019,287 Deposits ($000)6,984,1757,063,8117,329,862 Hilltop Common Equity ($000)1,758,6481,870,5091,886,000 Non-Covered NPLs / Total Non-Covered Loans0.40%0.32%0.41% Non-Covered NPAs / Total Assets0.24%0.24%0.28% Non-Covered Allowance for Loan Losses / Gross Non-Covered Loans0.91%0.93%0.95% Tier 1 Leverage Ratio 2 13.35%13.51%13.98% Common Equity Tier 1 Capital Ratio17.56%18.30%19.03%
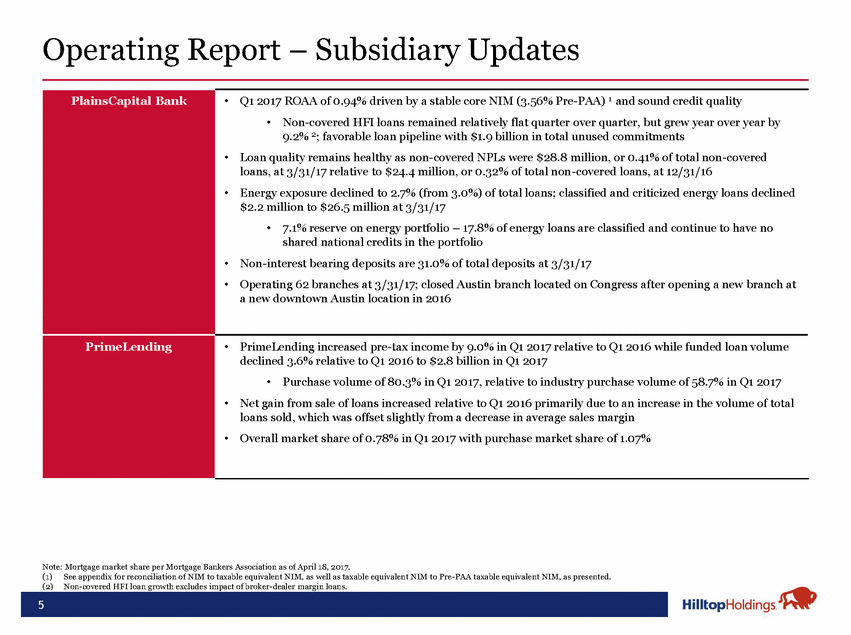
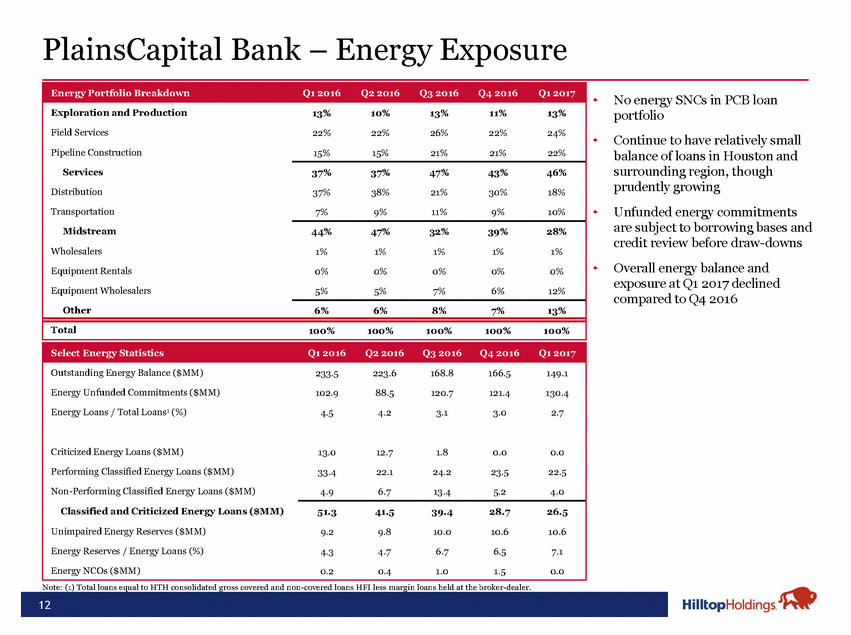
Operating Report – Subsidiary Updates Note: Mortgage market share per Mortgage Bankers Association as of April 18, 2017. (1) See appendix for reconciliation of NIM to taxable equivalent NIM, as well as taxable equivalent NIM to Pre-PAA taxable equivalent NIM, as presented. (2) Non-covered HFI loan growth excludes impact of broker-dealer margin loans. 5 PlainsCapital Bank •Q1 2017 ROAA of 0.94% driven by a stable core NIM (3.56% Pre-PAA) 1 and sound credit quality •Non-covered HFI loans remained relatively flat quarter over quarter, but grew year over year by 9.2% 2; favorable loan pipeline with $1.9 billion in total unused commitments •Loan quality remains healthy as non-covered NPLs were $28.8 million, or 0.41% of total non-covered loans, at 3/31/17 relative to $24.4 million, or 0.32% of total non-covered loans, at 12/31/16 •Energy exposure declined to 2.7% (from 3.0%) of total loans; classified and criticized energy loans declined $2.2 million to $26.5 million at 3/31/17 •7.1% reserve on energy portfolio – 17.8% of energy loans are classified and continue to have no shared national credits in the portfolio •Non-interest bearing deposits are 31.0% of total deposits at 3/31/17 •Operating 62 branches at 3/31/17; closed Austin branch located on Congress after opening a new branch at a new downtown Austin location in 2016 PrimeLending •PrimeLending increased pre-tax income by 9.0% in Q1 2017 relative to Q1 2016 while funded loan volume declined 3.6% relative to Q1 2016 to $2.8 billion in Q1 2017 •Purchase volume of 80.3% in Q1 2017, relative to industry purchase volume of 58.7% in Q1 2017 •Net gain from sale of loans increased relative to Q1 2016 primarily due to an increase in the volume of total loans sold, which was offset slightly from a decrease in average sales margin •Overall market share of 0.78% in Q1 2017 with purchase market share of 1.07%
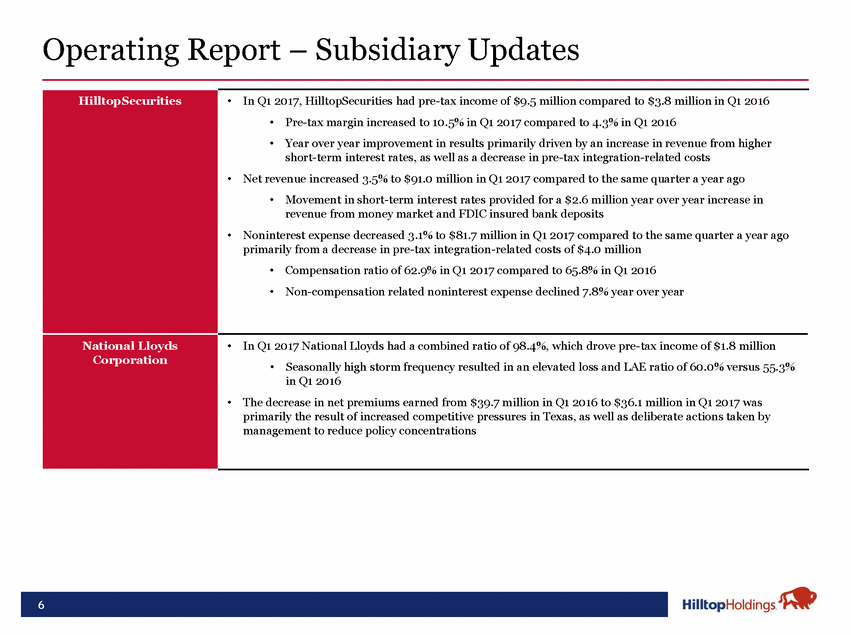
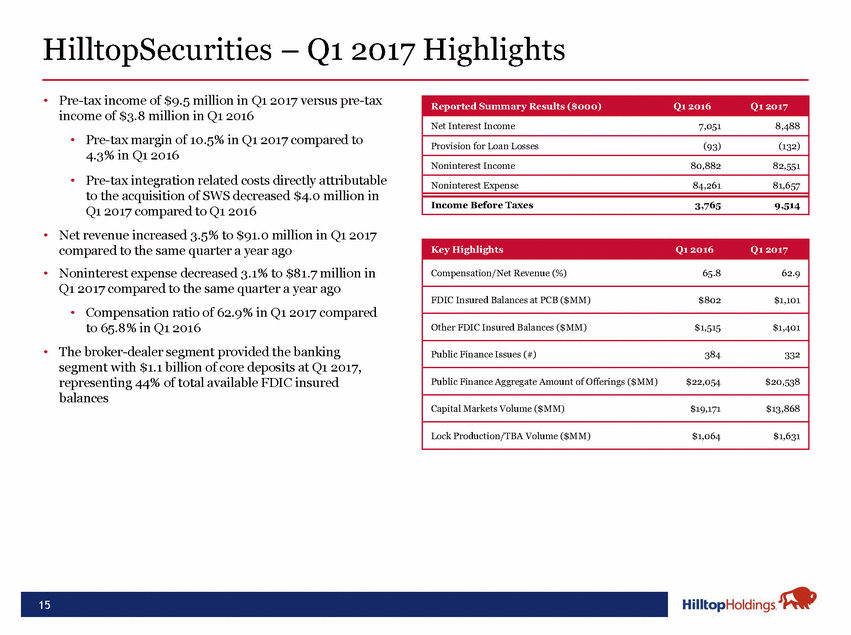
Operating Report – Subsidiary Updates 6 HilltopSecurities •In Q1 2017, HilltopSecurities had pre-tax income of $9.5 million compared to $3.8 million in Q1 2016 • Pre-tax margin increased to 10.5% in Q1 2017 compared to 4.3% in Q1 2016 • Year over year improvement in results primarily driven by an increase in revenue from higher short-term interest rates, as well as a decrease in pre-tax integration-related costs •Net revenue increased 3.5% to $91.0 million in Q1 2017 compared to the same quarter a year ago • Movement in short-term interest rates provided for a $2.6 million year over year increase in revenue from money market and FDIC insured bank deposits •Noninterest expense decreased 3.1% to $81.7 million in Q1 2017 compared to the same quarter a year ago primarily from a decrease in pre-tax integration-related costs of $4.0 million • Compensation ratio of 62.9% in Q1 2017 compared to 65.8% in Q1 2016 • Non-compensation related noninterest expense declined 7.8% year over year National Lloyds Corporation •In Q1 2017 National Lloyds had a combined ratio of 98.4%, which drove pre-tax income of $1.8 million •Seasonally high storm frequency resulted in an elevated loss and LAE ratio of 60.0% versus 55.3% in Q1 2016 •The decrease in net premiums earned from $39.7 million in Q1 2016 to $36.1 million in Q1 2017 was primarily the result of increased competitive pressures in Texas, as well as deliberate actions taken by management to reduce policy concentrations
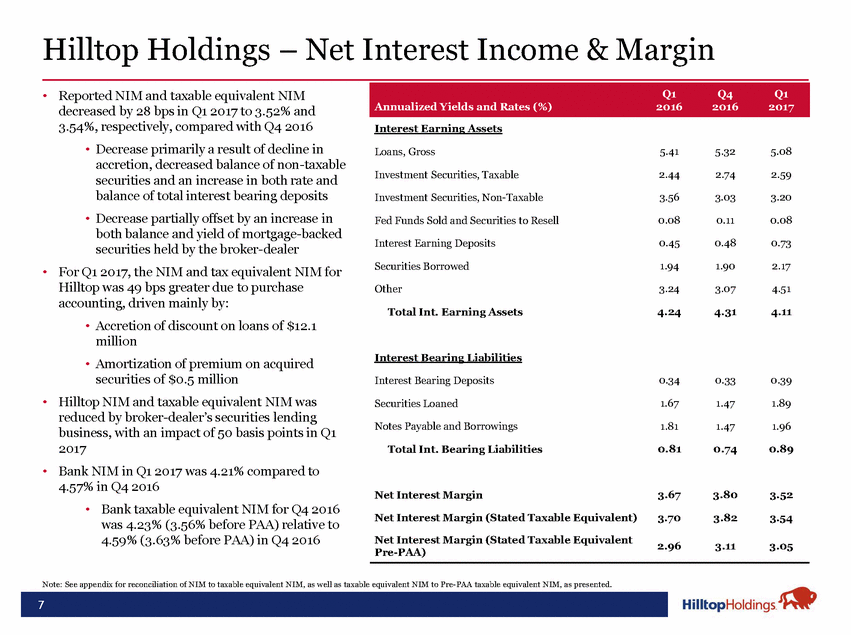
Hilltop Holdings – Net Interest Income & Margin • Reported NIM and taxable equivalent NIM decreased by 28 bps in Q1 2017 to 3.52% and 3.54%, respectively, compared with Q4 2016 • Decrease primarily a result of decline in accretion, decreased balance of non-taxable securities and an increase in both rate and balance of total interest bearing deposits • Decrease partially offset by an increase in both balance and yield of mortgage-backed securities held by the broker-dealer For Q1 2017, the NIM and tax equivalent NIM for Hilltop was 49 bps greater due to purchase accounting, driven mainly by: • Accretion of discount on loans of $12.1 million • Amortization of premium on acquired securities of $0.5 million Hilltop NIM and taxable equivalent NIM was reduced by broker-dealer’s securities lending business, with an impact of 50 basis points in Q1 2017 Bank NIM in Q1 2017 was 4.21% compared to 4.57% in Q4 2016 • Bank taxable equivalent NIM for Q4 2016 was 4.23% (3.56% before PAA) relative to 4.59% (3.63% before PAA) in Q4 2016 Interest Earning Assets 5.41 5.32 5.08 Loans, Gross Investment Securities, Taxable 2.44 2.74 2.59 3.56 3.03 3.20 Investment Securities, Non-Taxable Fed Funds Sold and Securities to Resell 0.08 0.11 0.08 0.45 0.48 0.73 Interest Earning Deposits Securities Borrowed 1.94 1.90 2.17 • Other 3.24 3.07 4.51 Total Int. Earning Assets 4.24 4.31 4.11 Interest Bearing Liabilities Interest Bearing Deposits 0.34 0.33 0.39 • Securities Loaned 1.67 1.47 1.89 Notes Payable and Borrowings 1.81 1.47 1.96 0.81 0.74 0.89 Total Int. Bearing Liabilities • 3.67 3.80 3.52 Net Interest Margin Net Interest Margin (Stated Taxable Equivalent) 3.70 3.82 3.54 Net Interest Margin (Stated Taxable Equivalent Pre-PAA) 2.96 3.11 3.05 Note: See appendix for reconciliation of NIM to taxable equivalent NIM, as well as taxable equivalent NIM to Pre-PAA taxable equivalent NIM, as presented. 7 Q1Q4Q1 Annualized Yields and Rates (%)201620162017
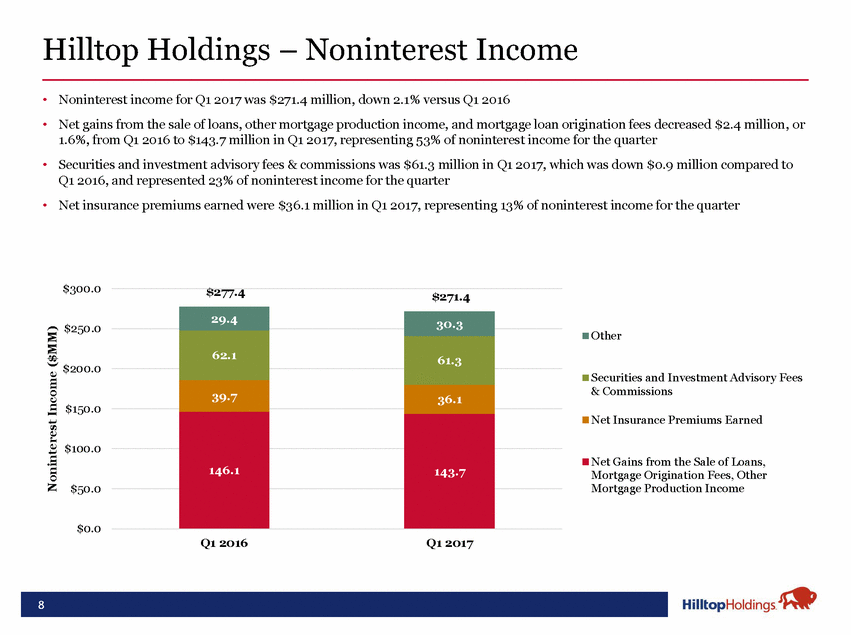
Hilltop Holdings – Noninterest Income • • Noninterest income for Q1 2017 was $271.4 million, down 2.1% versus Q1 2016 Net gains from the sale of loans, other mortgage production income, and mortgage loan origination fees decreased $2.4 million, or 1.6%, from Q1 2016 to $143.7 million in Q1 2017, representing 53% of noninterest income for the quarter Securities and investment advisory fees & commissions was $61.3 million in Q1 2017, which was down $0.9 million compared to Q1 2016, and represented 23% of noninterest income for the quarter Net insurance premiums earned were $36.1 million in Q1 2017, representing 13% of noninterest income for the quarter • • $300.0 $277.4 $271.4 $250.0 Other $200.0 Securities and Investment Advisory Fees & Commissions $150.0 Net Insurance Premiums Earned $100.0 Net Gains from the Sale of Loans, Mortgage Origination Fees, Other Mortgage Production Income $50.0 $0.0 Q1 2016 Q1 2017 Noninterest Income ($MM) 8 29.4 30.3 62.1 61.3 39.7 36.1 143.7 146.1
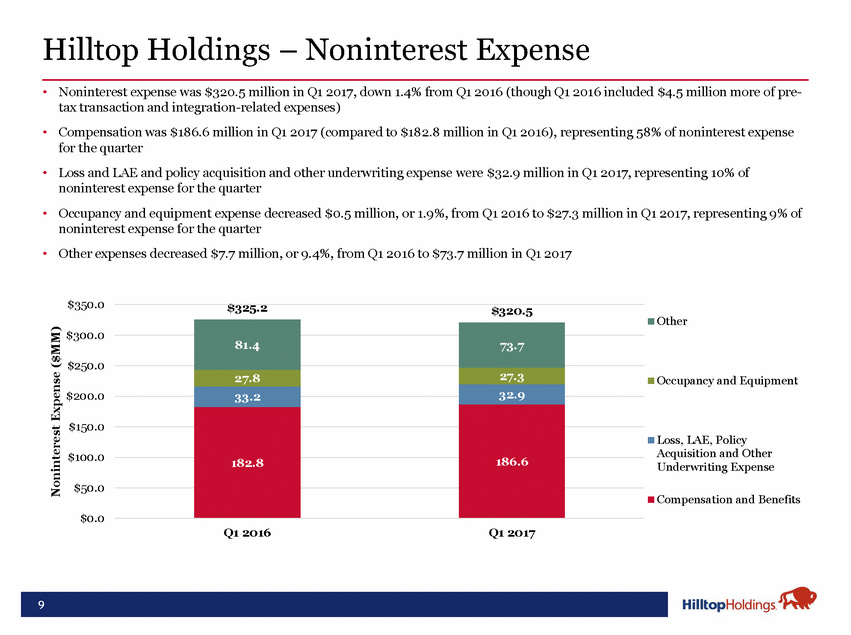
Hilltop Holdings – Noninterest Expense • Noninterest expense was $320.5 million in Q1 2017, down 1.4% from Q1 2016 (though Q1 2016 included $4.5 million more of pre-tax transaction and integration-related expenses) Compensation was $186.6 million in Q1 2017 (compared to $182.8 million in Q1 2016), representing 58% of noninterest expense for the quarter Loss and LAE and policy acquisition and other underwriting expense were $32.9 million in Q1 2017, representing 10% of noninterest expense for the quarter Occupancy and equipment expense decreased $0.5 million, or 1.9%, from Q1 2016 to $27.3 million in Q1 2017, representing 9% of noninterest expense for the quarter Other expenses decreased $7.7 million, or 9.4%, from Q1 2016 to $73.7 million in Q1 2017 • • • • $350.0 $325.2 $320.5 Other $300.0 $250.0 Occupancy and Equipment $200.0 $150.0 Loss, LAE, Policy Acquisition and Other Underwriting Expense $100.0 $50.0 Compensation and Benefits $0.0 Q1 2016 Q1 2017 Noninterest Expense ($MM) 9 81.4 73.7 27.8 27.3 33.2 32.9 182.8 186.6
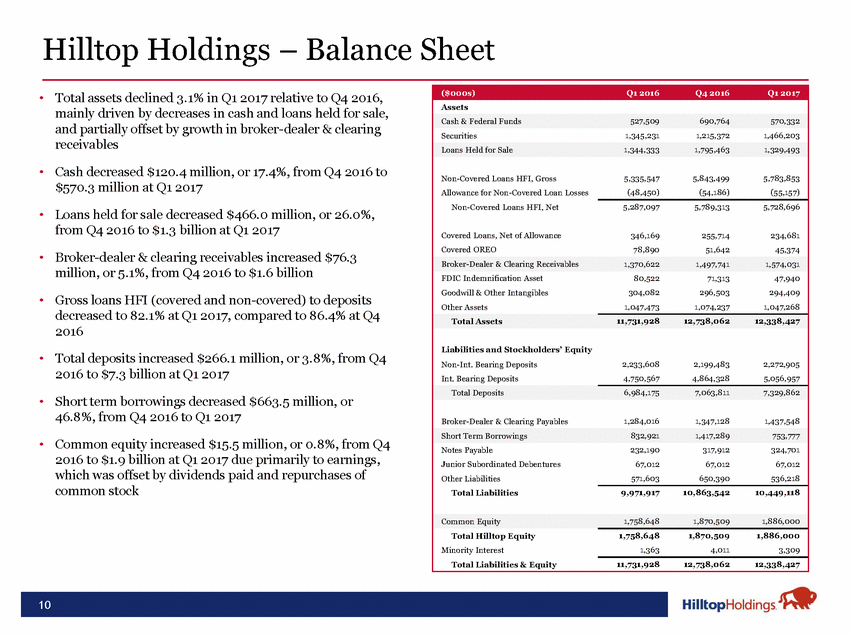
Hilltop Holdings – Balance Sheet • Total assets declined 3.1% in Q1 2017 relative to Q4 2016, mainly driven by decreases in cash and loans held for sale, and partially offset by growth in broker-dealer & clearing receivables • Cash decreased $120.4 million, or 17.4%, from Q4 2016 to $570.3 million at Q1 2017 • Loans held for sale decreased $466.0 million, or 26.0%, from Q4 2016 to $1.3 billion at Q1 2017 • Broker-dealer & clearing receivables increased $76.3 million, or 5.1%, from Q4 2016 to $1.6 billion • Gross loans HFI (covered and non-covered) to deposits decreased to 82.1% at Q1 2017, compared to 86.4% at Q4 2016 • Total deposits increased $266.1 million, or 3.8%, from Q4 2016 to $7.3 billion at Q1 2017 • Short term borrowings decreased $663.5 million, or 46.8%, from Q4 2016 to Q1 2017 • Common equity increased $15.5 million, or 0.8%, from Q4 2016 to $1.9 billion at Q1 2017 due primarily to earnings, which was offset by dividends paid and repurchases of common stock 10 ($000s)Q1 2016Q4 2016Q1 2017 Assets Cash & Federal Funds527,509690,764570,332 Securities1,345,2311,215,3721,466,203 Loans Held for Sale1,344,3331,795,4631,329,493 Non-Covered Loans HFI, Gross Allowance for Non-Covered Loan Losses Non-Covered Loans HFI, Net Covered Loans, Net of Allowance Covered OREO 5,335,5475,843,4995,783,853 (48,450) (54,186) (55,157) 5,287,0975,789,3135,728,696 346,169255,714234,681 78,89051,64245,374 Broker-Dealer & Clearing Receivables1,370,6221,497,7411,574,031 FDIC Indemnification Asset80,52271,31347,940 Goodwill & Other Intangibles304,082296,503294,409 Other Assets1,047,4731,074,2371,047,268 Total Assets11,731,92812,738,06212,338,427 Liabilities and Stockholders’ Equity Non-Int. Bearing Deposits2,233,6082,199,4832,272,905 Int. Bearing Deposits4,750,5674,864,3285,056,957 Total Deposits6,984,1757,063,8117,329,862 Broker-Dealer & Clearing Payables1,284,0161,347,1281,437,548 Short Term Borrowings832,9211,417,289753,777 Notes Payable Junior Subordinated Debentures Other Liabilities Total Liabilities 232,190317,912324,701 67,01267,01267,012 571,603650,390536,218 9,971,91710,863,54210,449,118 Common Equity1,758,6481,870,5091,886,000 Total Hilltop Equity Minority Interest Total Liabilities & Equity 1,758,6481,870,5091,886,000 1,3634,0113,309 11,731,92812,738,06212,338,427
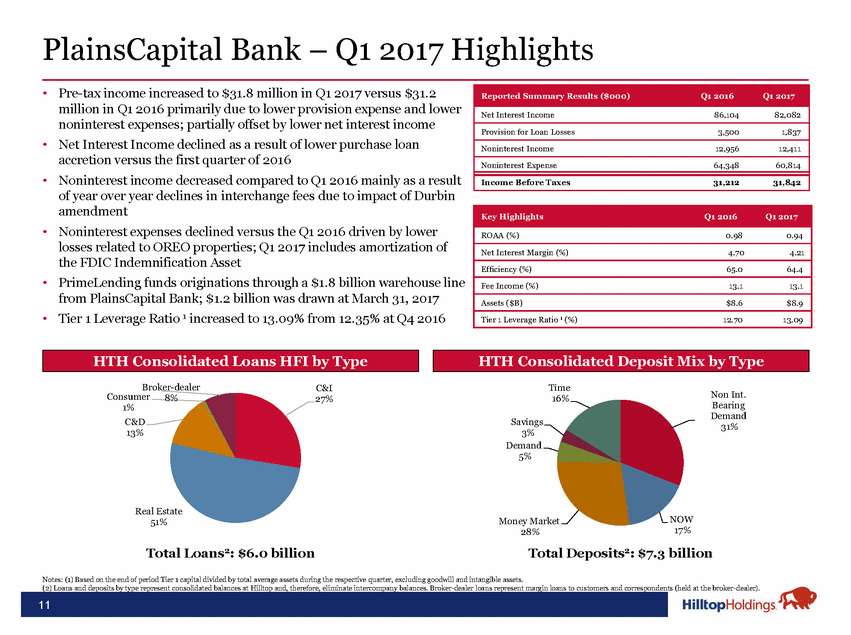
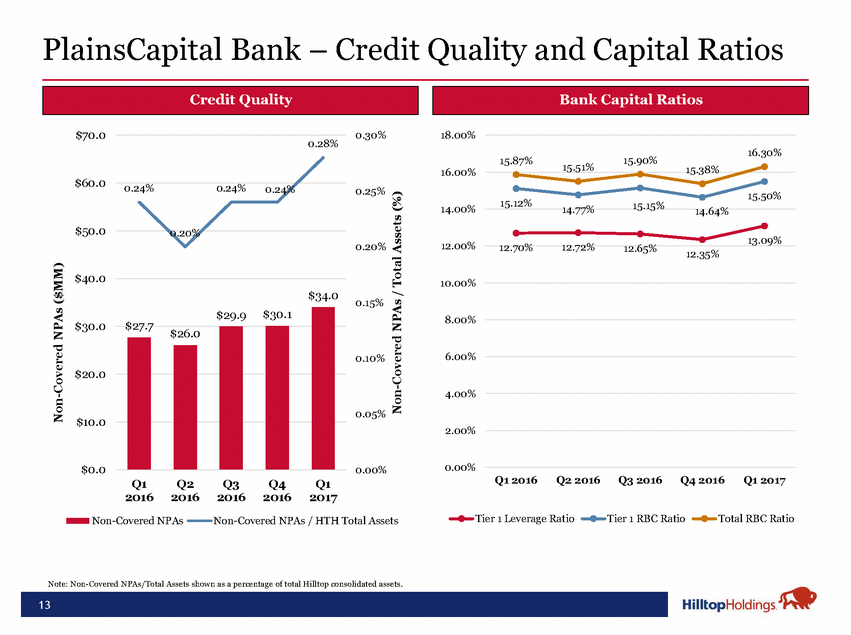
PlainsCapital Bank – Q1 2017 Highlights • Pre-tax income increased to $31.8 million in Q1 2017 versus $31.2 million in Q1 2016 primarily due to lower provision expense and lower noninterest expenses; partially offset by lower net interest income Net Interest Income declined as a result of lower purchase loan accretion versus the first quarter of 2016 Noninterest income decreased compared to Q1 2016 mainly as a result of year over year declines in interchange fees due to impact of Durbin amendment Noninterest expenses declined versus the Q1 2016 driven by lower losses related to OREO properties; Q1 2017 includes amortization of the FDIC Indemnification Asset PrimeLending funds originations through a $1.8 billion warehouse line from PlainsCapital Bank; $1.2 billion was drawn at March 31, 2017 Tier 1 Leverage Ratio 1 increased to 13.09% from 12.35% at Q4 2016 • • • • • Broker-dealer C&I 27% Time 16% Non Int. Bearing Demand 31% Consumer 1% C&D 13% 8% Savings 3% Demand 5% Real Estate 51% NOW 17% Money Market 28% Total Loans2: $6.0 billion Total Deposits2: $7.3 billion Notes: (1) Based on the end of period Tier 1 capital divided by total average assets during the respective quarter, excluding goodwill and intangible assets. (2) Loans and deposits by type represent consolidated balances at Hilltop and, therefore, eliminate intercompany balances. Broker-dealer loans represent margin loans to customers and correspondents (held at the broker-dealer). 11 HTH Consolidated Deposit Mix by Type HTH Consolidated Loans HFI by Type Key HighlightsQ1 2016Q1 2017 ROAA (%)0.980.94 Net Interest Margin (%)4.704.21 Efficiency (%)65.064.4 Fee Income (%)13.113.1 Assets ($B)$8.6$8.9 Tier 1 Leverage Ratio 1 (%)12.7013.09 Reported Summary Results ($000)Q1 2016Q1 2017 Net Interest Income86,10482,082 Provision for Loan Losses3,5001,837 Noninterest Income12,95612,411 Noninterest Expense64,34860,814 Income Before Taxes31,21231,842
PlainsCapital Bank – Energy Exposure • No energy SNCs in PCB loan portfolio Continue to have relatively small balance of loans in Houston and surrounding region, though prudently growing Unfunded energy commitments are subject to borrowing bases and credit review before draw-downs Overall energy balance and exposure at Q1 2017 declined compared to Q4 2016 • • • Note: (1) Total loans equal to HTH consolidated gross covered and non-covered loans HFI less margin loans held at the broker-dealer. 12 Energy Portfolio BreakdownQ1 2016Q2 2016Q3 2016Q4 2016Q1 2017 Exploration and Production Field Services Pipeline Construction Services Distribution Transportation Midstream Wholesalers Equipment Rentals Equipment Wholesalers Other 13%10%13%11%13% 22%22%26%22%24% 15%15%21%21%22% 37%37%47%43%46% 37%38%21%30%18% 7%9%11%9%10% 44%47%32%39%28% 1%1%1%1%1% 0%0%0%0%0% 5%5%7%6%12% 6%6%8%7%13% Total100%100%100%100%100% Select Energy StatisticsQ1 2016Q2 2016Q3 2016Q4 2016Q1 2017 Outstanding Energy Balance ($MM) Energy Unfunded Commitments ($MM) Energy Loans / Total Loans1 (%) Criticized Energy Loans ($MM) Performing Classified Energy Loans ($MM) Non-Performing Classified Energy Loans ($MM) Classified and Criticized Energy Loans ($MM) Unimpaired Energy Reserves ($MM) Energy Reserves / Energy Loans (%) Energy NCOs ($MM) 233.5223.6168.8166.5149.1 102.988.5120.7121.4130.4 4.54.23.13.02.7 13.012.71.80.00.0 33.422.124.223.522.5 4.96.713.45.24.0 51.341.539.428.726.5 9.29.810.010.610.6 4.34.76.76.57.1 0.20.41.01.50.0
PlainsCapital Bank – Credit Quality and Capital Ratios $70.0 0.30% 18.00% 0.28% 16.30% 15.87% 15.90% 15.51% 15.38% 16.00% $60.0 0.24% 0.24% 0.24% 0.25% 15.50% 15.12% 14.77% 15.15% 14.64% 14.00% $50.0 0.20% 13.09% 12.00% 0.20% 12.70% 12.72% 12.65% 12.35% $40.0 10.00% $34.0 0.15% 8.00% $30.0 6.00% 0.10% $20.0 4.00% 0.05% $10.0 2.00% 0.00% $0.0 0.00% Q1 2016 Q2 2016Q3 2016 Q4 2016 Q1 2017 Q1 2016 Q2 2016 Q3 2016 Q4 2016 Q1 2017 Tier 1 Leverage Ratio Tier 1 RBC Ratio Total RBC Ratio Non-Covered NPAs Non-Covered NPAs / HTH Total Assets Note: Non-Covered NPAs/Total Assets shown as a percentage of total Hilltop consolidated assets. Non-Covered NPAs ($MM) Non-Covered NPAs / Total Assets (%) 13 $27.7$29.9$30.1 $26.0 • Bank Capital Ratios • Credit Quality
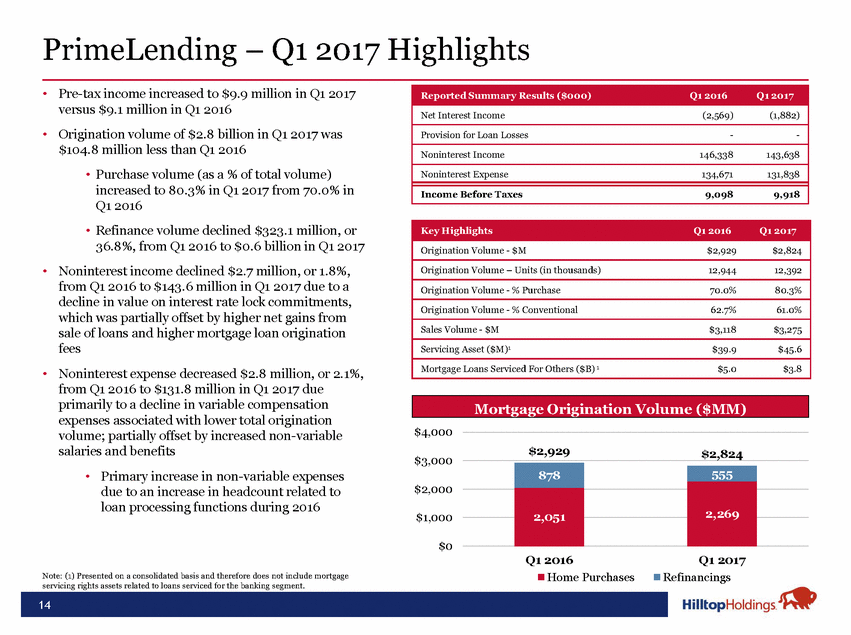
PrimeLending – Q1 2017 Highlights • Pre-tax income increased to $9.9 million in Q1 2017 versus $9.1 million in Q1 2016 Origination volume of $2.8 billion in Q1 2017 was $104.8 million less than Q1 2016 • Purchase volume (as a % of total volume) increased to 80.3% in Q1 2017 from 70.0% in Q1 2016 • Refinance volume declined $323.1 million, or 36.8%, from Q1 2016 to $0.6 billion in Q1 2017 Noninterest income declined $2.7 million, or 1.8%, from Q1 2016 to $143.6 million in Q1 2017 due to a decline in value on interest rate lock commitments, which was partially offset by higher net gains from sale of loans and higher mortgage loan origination fees Noninterest expense decreased $2.8 million, or 2.1%, from Q1 2016 to $131.8 million in Q1 2017 due primarily to a decline in variable compensation expenses associated with lower total origination volume; partially offset by increased non-variable salaries and benefits • Primary increase in non-variable expenses due to an increase in headcount related to loan processing functions during 2016 • • • $4,000 $2,929 $2,824 $3,000 $2,000 $1,000 $0 Q1 2016 Q1 2017 Refinancings Note: (1) Presented on a consolidated basis and therefore does not include mortgage servicing rights assets related to loans serviced for the banking segment. Home Purchases 14 878 555 2,269 2,051 Mortgage Origination Volume ($MM) Key HighlightsQ1 2016Q1 2017 Origination Volume - $M$2,929$2,824 Origination Volume – Units (in thousands)12,94412,392 Origination Volume - % Purchase70.0%80.3% Origination Volume - % Conventional62.7%61.0% Sales Volume - $M$3,118$3,275 Servicing Asset ($M)1 $39.9$45.6 Mortgage Loans Serviced For Others ($B) 1 $5.0$3.8 Reported Summary Results ($000)Q1 2016Q1 2017 Net Interest Income(2,569)(1,882) Provision for Loan Losses--Noninterest Income146,338143,638 Noninterest Expense134,671131,838 Income Before Taxes9,0989,918
HilltopSecurities – Q1 2017 Highlights • Pre-tax income of $9.5 million in Q1 2017 versus pre-tax income of $3.8 million in Q1 2016 • Pre-tax margin of 10.5% in Q1 2017 compared to 4.3% in Q1 2016 • Pre-tax integration related costs directly attributable to the acquisition of SWS decreased $4.0 million in Q1 2017 compared to Q1 2016 Net revenue increased 3.5% to $91.0 million in Q1 2017 compared to the same quarter a year ago Noninterest expense decreased 3.1% to $81.7 million in Q1 2017 compared to the same quarter a year ago • Compensation ratio of 62.9% in Q1 2017 compared to 65.8% in Q1 2016 The broker-dealer segment provided the banking segment with $1.1 billion of core deposits at Q1 2017, representing 44% of total available FDIC insured balances • • • 15 Key HighlightsQ1 2016Q1 2017 Compensation/Net Revenue (%)65.862.9 FDIC Insured Balances at PCB ($MM)$802$1,101 Other FDIC Insured Balances ($MM)$1,515$1,401 Public Finance Issues (#)384332 Public Finance Aggregate Amount of Offerings ($MM)$22,054$20,538 Capital Markets Volume ($MM)$19,171$13,868 Lock Production/TBA Volume ($MM)$1,064$1,631 Reported Summary Results ($000)Q1 2016Q1 2017 Net Interest Income7,0518,488 Provision for Loan Losses(93)(132) Noninterest Income80,88282,551 Noninterest Expense84,26181,657 Income Before Taxes3,7659,514
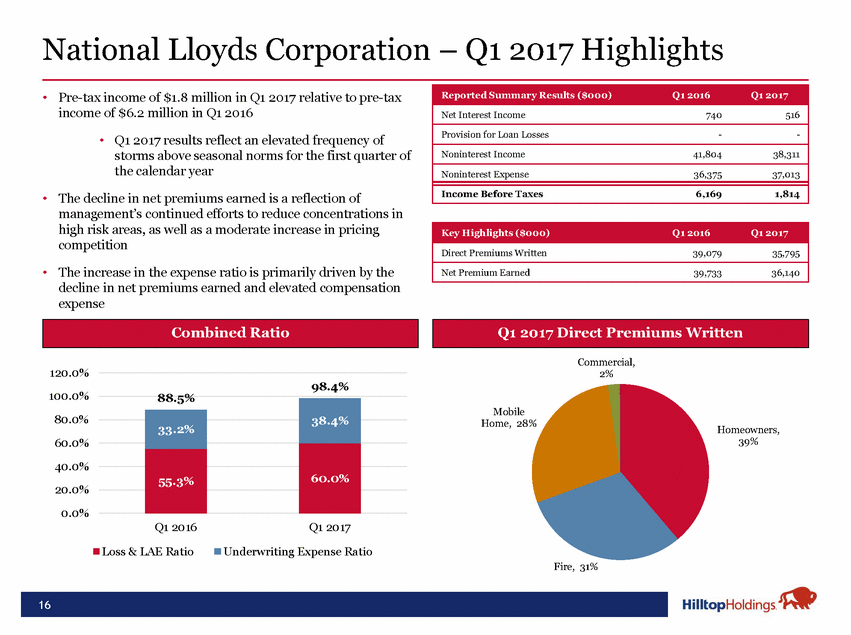
National Lloyds Corporation – Q1 2017 Highlights • Pre-tax income of $1.8 million in Q1 2017 relative to pre-tax income of $6.2 million in Q1 2016 • Q1 2017 results reflect an elevated frequency of storms above seasonal norms for the first quarter of the calendar year • The decline in net premiums earned is a reflection of management’s continued efforts to reduce concentrations in high risk areas, as well as a moderate increase in pricing competition • The increase in the expense ratio is primarily driven by the decline in net premiums earned and elevated compensation expense Commercial, 2% 120.0% 100.0% 80.0% 60.0% 40.0% 20.0% 0.0% 98.4% 88.5% Mobile Home, 28% Homeowners, 39% Q1 2016 Loss & LAE Ratio Q1 2017 Underwriting Expense Ratio Fire, 31% 16 38.4% 33.2% 60.0% 55.3% Q1 2017 Direct Premiums Written Combined Ratio Key Highlights ($000)Q1 2016Q1 2017 Direct Premiums Written39,07935,795 Net Premium Earned39,73336,140 Reported Summary Results ($000)Q1 2016Q1 2017 Net Interest Income740516 Provision for Loan Losses--Noninterest Income41,80438,311 Noninterest Expense36,37537,013 Income Before Taxes6,1691,814
Questions? 17
Appendix 18
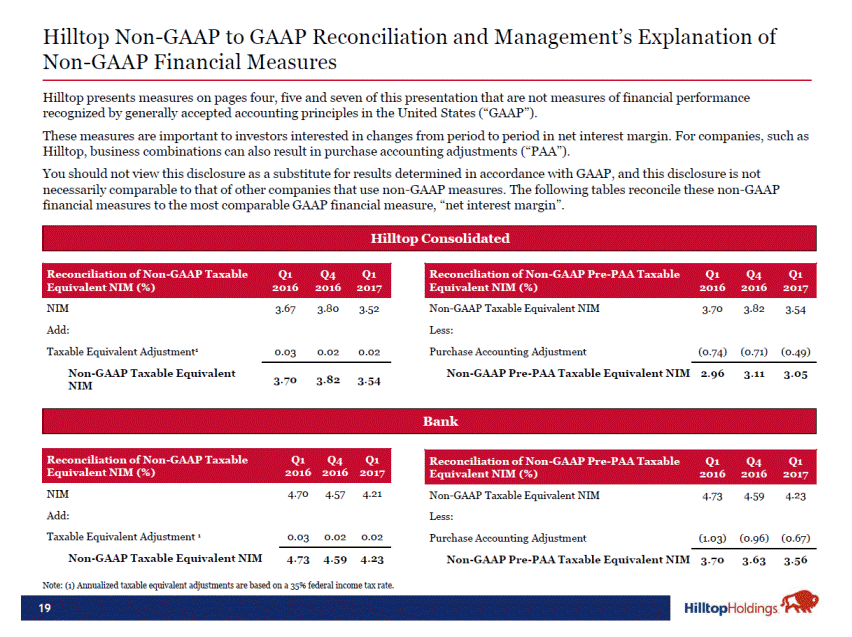
Hilltop Non-GAAP to GAAP Reconciliation and Management’s Explanation of Non-GAAP Financial Measures Hilltop presents measures on pages four, five and seven of this presentation that are not measures of financial performance recognized by generally accepted accounting principles in the United States (“GAAP”). This measure is important to investors interested in changes from period to period in net interest margin. For companies, such as Hilltop, business combinations can result in purchase accounting adjustments (“PAA”). You should not view this disclosure as a substitute for results determined in accordance with GAAP, and this disclosure is not necessarily comparable to that of other companies that use non-GAAP measures. The following tables reconciles this Hilltop non-GAAP financial measure to the most comparable GAAP financial measure, “net interest margin��. NIM Add: Taxable Equivalent Adjustment1 Non-GAAP Taxable Equivalent NIM 3.67 3.80 3.52 Non-GAAP Taxable Equivalent NIM Less: Purchase Accounting Adjustment Non-GAAP Pre-PAA Taxable Equivalent NIM 3.70 3.82 3.54 0.03 0.02 0.02 (0.74) (0.71) (0.49) 2.96 3.11 3.05 3.70 3.82 3.54 NIM 4.70 4.57 4.21 Non-GAAP Taxable Equivalent NIM 4.73 4.59 4.23 Add: Taxable Equivalent Adjustment 1 Non-GAAP Taxable Equivalent NIM Less: Purchase Accounting Adjustment Non-GAAP Pre-PAA Taxable Equivalent NIM 0.03 0.02 0.02 (1.03) (0.96) (0.67) 4.73 4.59 4.23 3.70 3.63 3.56 Note: (1) Annualized taxable equivalent adjustments are based on a 35% federal income tax rate. 19 Reconciliation of Non-GAAP TaxableQ1Q4Q1 Equivalent NIM (%)2016 2016 2017 Reconciliation of Non-GAAP Pre-PAA TaxableQ1Q4Q1 Equivalent NIM (%)201620162017 •Bank Reconciliation of Non-GAAP Pre-PAA TaxableQ1Q4Q1 Equivalent NIM (%)201620162017 Reconciliation of Non-GAAP TaxableQ1Q4Q1 Equivalent NIM (%)201620162017 •Hilltop Consolidated
Loan Portfolio by Classification C&D 2% C&I C&D 3% C&I 1% 1% Real Estate 97% Real Estate 96% Q1 2017 Total: $117.0 million Q1 2017 Total: $118.4 million C&D Consumer Broker-dealer C&I 17% 1% 6% 8% Consumer 1% C&D 13% C&I 29% Real Estate 49% Q1 2017 Total: $5,736.1 million Real Estate 77% Q1 2017 Total: $47.8 million Note: PCI stands for Purchased Credit Impaired loans. Loan classification mix represents consolidated balances at Hilltop and, therefore, eliminate intercompany loans. Amounts above equal carrying value, after deductions for discount 20 Non-Covered Non-PCI Loans Non-Covered PCI Loans Covered Non-PCI Loans Covered PCI Loans
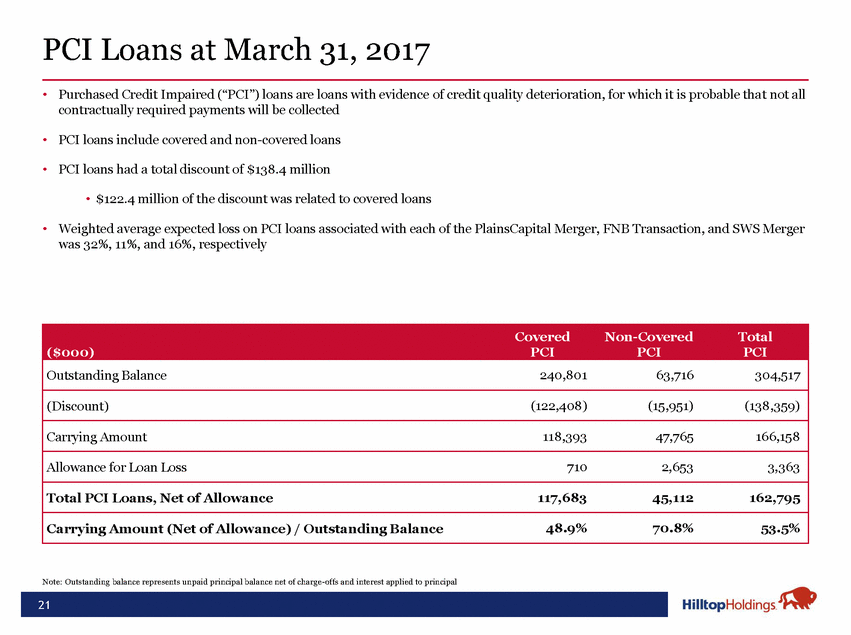
PCI Loans at March 31, 2017 • Purchased Credit Impaired (“PCI”) loans are loans with evidence of credit quality deterioration, for which it is probable that not all contractually required payments will be collected • PCI loans include covered and non-covered loans • PCI loans had a total discount of $138.4 million • $122.4 million of the discount was related to covered loans • Weighted average expected loss on PCI loans associated with each of the PlainsCapital Merger, FNB Transaction, and SWS Merger was 32%, 11%, and 16%, respectively Note: Outstanding balance represents unpaid principal balance net of charge-offs and interest applied to principal 21 CoveredNon-CoveredTotal ($000)PCIPCIPCI Outstanding Balance240,80163,716304,517 (Discount)(122,408)(15,951)(138,359) Carrying Amount118,39347,765166,158 Allowance for Loan Loss7102,6533,363 Total PCI Loans, Net of Allowance117,68345,112162,795 Carrying Amount (Net of Allowance) / Outstanding Balance48.9%70.8%53.5%
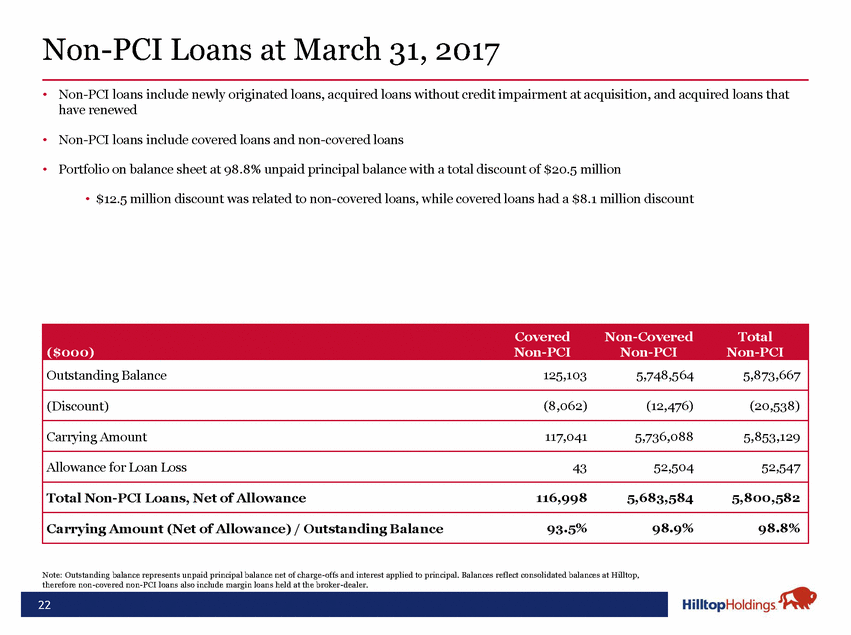
Non-PCI Loans at March 31, 2017 • Non-PCI loans include newly originated loans, acquired loans without credit impairment at acquisition, and acquired loans that have renewed • Non-PCI loans include covered loans and non-covered loans • Portfolio on balance sheet at 98.8% unpaid principal balance with a total discount of $20.5 million • $12.5 million discount was related to non-covered loans, while covered loans had a $8.1 million discount Note: Outstanding balance represents unpaid principal balance net of charge-offs and interest applied to principal. Balances reflect consolidated balances at Hilltop, therefore non-covered non-PCI loans also include margin loans held at the broker-dealer. 22 CoveredNon-CoveredTotal ($000)Non-PCINon-PCINon-PCI Outstanding Balance125,1035,748,5645,873,667 (Discount)(8,062)(12,476)(20,538) Carrying Amount117,0415,736,0885,853,129 Allowance for Loan Loss4352,50452,547 Total Non-PCI Loans, Net of Allowance116,9985,683,5845,800,582 Carrying Amount (Net of Allowance) / Outstanding Balance93.5%98.9%98.8%