Exhibit 99.1

Hilltop Holdings Inc. Investor Presentation May 2020
Preface Corporate Headquarters 6565 Hillcrest Ave Dallas, TX 75205 Phone: 214-855-2177 www.hilltop-holdings.com Additional Information Please Contact: Erik Yohe Phone: 214-525-4634 Email: eyohe@hilltop-holdings.com FORWARD-LOOKING STATEMENTS This presentation and statements made by representatives of Hilltop Holdings Inc. (“Hilltop” or the “Company”) during the course of this presentation include “forward-looking statements” within the meaning of the Private Securities Litigation Reform Act of 1995. These forward-looking statements involve known and unknown risks, uncertainties and other factors that may cause our actual results, performance or achievements to be materially different from any future results, performance or achievements anticipated in such statements. Forward-looking statements speak only as of the date they are made and, except as required by law, we do not assume any duty to update forward-looking statements. Such forward-looking statements include, but are not limited to, statements concerning such things as our outlook, our business strategy, our financial condition, our efforts to make strategic acquisitions, our revenue, our liquidity and sources of funding, market trends, operations and business, taxes, the impact of natural disasters or public health emergencies, such as the current coronavirus (“COVID-19”) global pandemic, the pending sale of National Lloyds Corporation and regulatory approval thereof, information technology expenses, capital levels, mortgage servicing rights (“MSR”) assets, stock repurchases, dividend payments, expectations concerning mortgage loan origination volume, loan volume and interest rate compression, expected levels of refinancing as a percentage of total loan origination volume, projected losses on mortgage loans originated, loss estimates related to natural disasters, total expenses, anticipated changes in our revenue, earnings, or taxes, the effects of government regulation applicable to our operations, the appropriateness of, and changes in, our allowance for credit losses and provision for (reversal of) credit losses, including as a result of the “current expected credit losses” (CECL) model, anticipated investment yields, expected accretion of discount on loans in future periods, the collectability of loans, cybersecurity incidents, construction costs, cost savings expected from initiatives implemented and planned, including core system upgrades and cost reduction efforts, the outcome of litigation, and our other plans, objectives, strategies, expectations and intentions and other statements that are not statements of historical fact, and may be identified by words such as “anticipates,” “believes,” “building”, “could,” “estimates,” “expects,” “forecasts,” “goal,” “guidance”, “intends,” “may,” “might,” “outlook”, “plan,” “probable,” “projects,” “seeks,” “should,” “target,” “view” or “would” or the negative of these words and phrases or similar words or phrases. The following factors, among others, could cause actual results to differ from those set forth in the forward-looking statements: (i) changes in general economic, market and business conditions in areas or markets where we compete, including changes in the price of crude oil; (ii) the COVID-19 pandemic and the response of governmental authorities to the pandemic, which have caused and are causing significant harm to the global economy and our business; (iii) the credit risks of lending activities, including our ability to estimate credit losses and increases to the allowance for credit losses as a result of the implementation of CECL; (iv) the effects of changes in the level of, and trends in, loan delinquencies and write-offs; (v) changes in the interest rate environment; (vi) the failure of the National Lloyds Corporation sale transaction to close on the expected timeline or at all; (vii) the effect of the announcement of the National Lloyds Corporation transaction on agent or customer relationships and operating results; (viii) our ability to obtain regulatory approvals and meet other closing conditions to the sale of National Lloyds Corporation; (ix) risks associated with concentration in real estate related loans; (x) effectiveness of our data security controls in the face of cyber attacks; (xi) severe catastrophic events in Texas and other areas of the southern United States; (xii) the effects of our indebtedness on our ability to manage our business successfully, including the restrictions imposed by the indenture governing our indebtedness; (xiii) cost and availability of capital; (xiv) changes in state and federal laws, regulations or policies affecting one or more of our business segments, including changes in regulatory fees, deposit insurance premiums, capital requirements and the Dodd-Frank Wall Street Reform and Consumer Protection Act; (xv) changes in key management; (xvi) competition in our banking, broker-dealer, mortgage origination and insurance segments from other banks and financial institutions, as well as investment banking and financial advisory firms, mortgage bankers, asset-based non-bank lenders, government agencies and insurance companies; (xvii) legal and regulatory proceedings; (xviii) failure of our insurance segment reinsurers to pay obligations under reinsurance contracts; (xix) risks associated with merger and acquisition integration; and (xx) our ability to use excess capital in an effective manner. For further discussion of such factors, see the risk factors described in our most recent Annual Report on Form 10-K, and subsequent Quarterly Reports on Form 10-Q and other reports, that we have filed with the Securities and Exchange Commission. All forward-looking statements are qualified in their entirety by this cautionary statement. The information contained herein is preliminary and based on Company data available at the time of the earnings presentation. It speaks only as of the particular date or dates included in the accompanying slides. Hilltop Holdings does not undertake an obligation to, and disclaims any duty to, update any of the information herein.

Company Overview
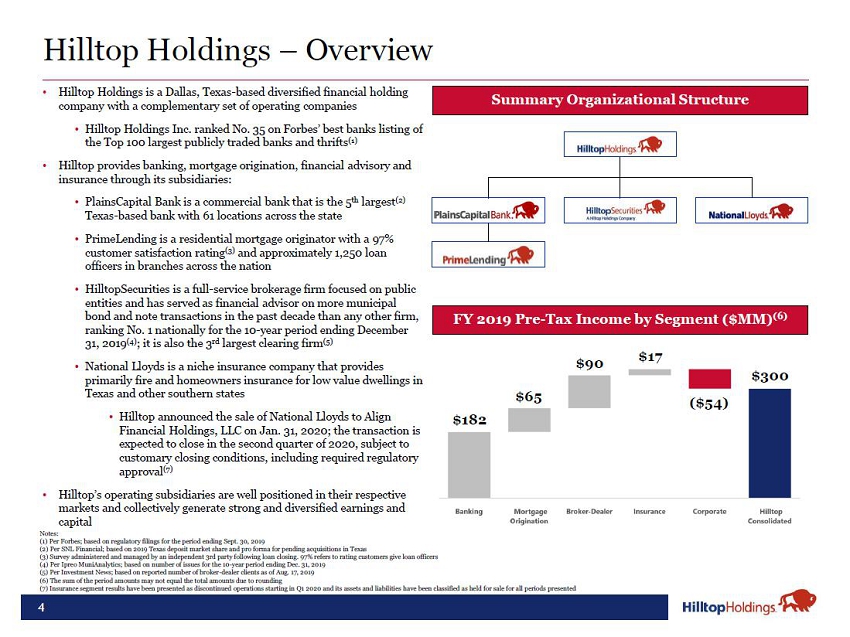
Hilltop Holdings – Overview Hilltop Holdings is a Dallas, Texas-based diversified financial holding company with a complementary set of operating companies Hilltop Holdings Inc. ranked No. 35 on Forbes’ best banks listing of the Top 100 largest publicly traded banks and thrifts(1) Hilltop provides banking, mortgage origination, financial advisory and insurance through its subsidiaries: PlainsCapital Bank is a commercial bank that is the 5th largest(2) Texas-based bank with 61 locations across the state PrimeLending is a residential mortgage originator with a 96% customer satisfaction rating(3) and approximately 1,250 loan officers in branches across the nation HilltopSecurities is a full-service brokerage firm focused on public entities and has served as financial advisor on more municipal bond and note transactions in the past decade than any other firm, ranking No. 1 nationally for the 10-year period ending December 31, 2019(4); it is also the 3rd largest clearing firm(5) National Lloyds is a niche insurance company that provides primarily fire and homeowners insurance for low value dwellings in Summary Organizational Structure FY 2019 Pre-Tax Income by Segment ($MM)(6) $90$17 $300 Texas and other southern states Hilltop announced the sale of National Lloyds to Align Financial Holdings, LLC on Jan. 31, 2020; the transaction is expected to close in the second quarter of 2020, subject to customary closing conditions, including required regulatory approval(7) Hilltop’s operating subsidiaries are well positioned in their respective markets and collectively generate strong and diversified earnings and capital $182 $65 ($54) Notes: Per Forbes; based on regulatory filings for the period ending Sept. 30, 2019 Per SNL Financial; based on 2019 Texas deposit market share and pro forma for pending acquisitions in Texas Survey administered and managed by an independent 3rd party following loan closing. 96% refers to rating customers give loan officers Per Ipreo MuniAnalytics; based on number of issues for the 10-year period ending Dec. 31, 2019 Per Investment News; based on reported number of broker-dealer clients as of Aug. 17, 2019 The sum of the period amounts may not equal the total amounts due to rounding Insurance segment results have been presented as discontinued operations starting in Q1 2020 and its assets and liabilities have been classified as held for sale for all periods presented
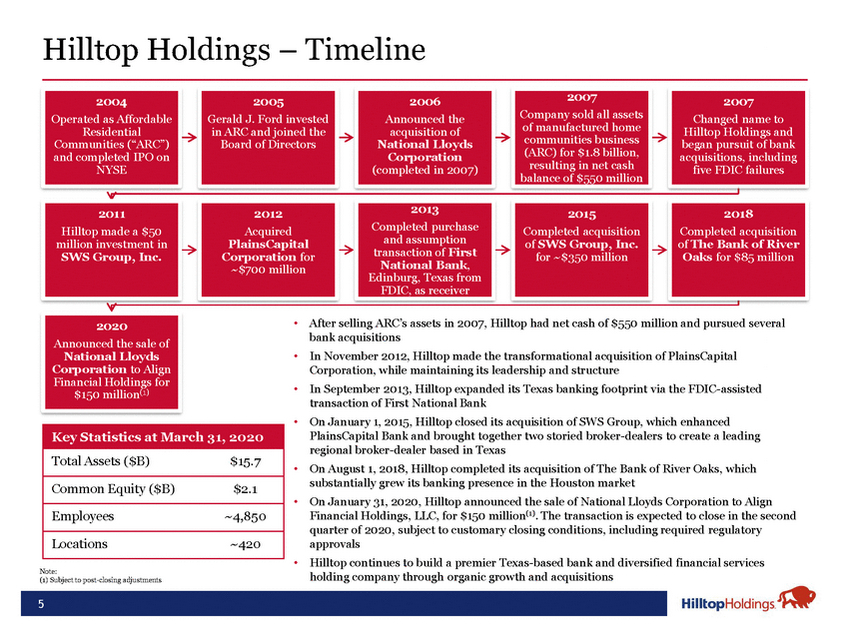
Hilltop Holdings – Timeline 2004 Operated as Affordable Residential Communities (“ARC”) and completed IPO on NYSE 2005 Gerald J. Ford invested in ARC and joined the Board of Directors 2006 Announced the acquisition of National Lloyds Corporation (completed in 2007) 2007 Company sold all assets of manufactured home communities business (ARC) for $1.8 billion, resulting in net cash balance of $550 million 2007 Changed name to Hilltop Holdings and began pursuit of bank acquisitions, including five FDIC failures 2011 Hilltop made a $50 million investment in SWS Group, Inc. 2012 Acquired PlainsCapital Corporation for ~$700 million 2013 Completed purchase and assumption transaction of First National Bank, Edinburg, Texas from FDIC, as receiver 2015 Completed acquisition of SWS Group, Inc. for ~$350 million 2018 Completed acquisition of The Bank of River Oaks for $85 million 2020 Announced the sale of National Lloyds Corporation to Align Financial Holdings for $150 million(1) Note: After selling ARC’s assets in 2007, Hilltop had net cash of $550 million and pursued several bank acquisitions In November 2012, Hilltop made the transformational acquisition of PlainsCapital Corporation, while maintaining its leadership and structure In September 2013, Hilltop expanded its Texas banking footprint via the FDIC-assisted transaction of First National Bank Key Statistics at March 31, 2020 Total Assets ($B) $15.7 Common Equity ($B) $2.1 Employees ~4,850 Locations ~420 On August 1, 2018, Hilltop completed its acquisition of The Bank of River Oaks, which substantially grew its banking presence in the Houston market On January 31, 2020, Hilltop announced the sale of National Lloyds Corporation to Align Financial Holdings, LLC, for $150 million(1). The transaction is expected to close in the second quarter of 2020, subject to customary closing conditions, including required regulatory approvals Hilltop continues to build a premier Texas-based bank and diversified financial services holding company through organic growth and acquisitions
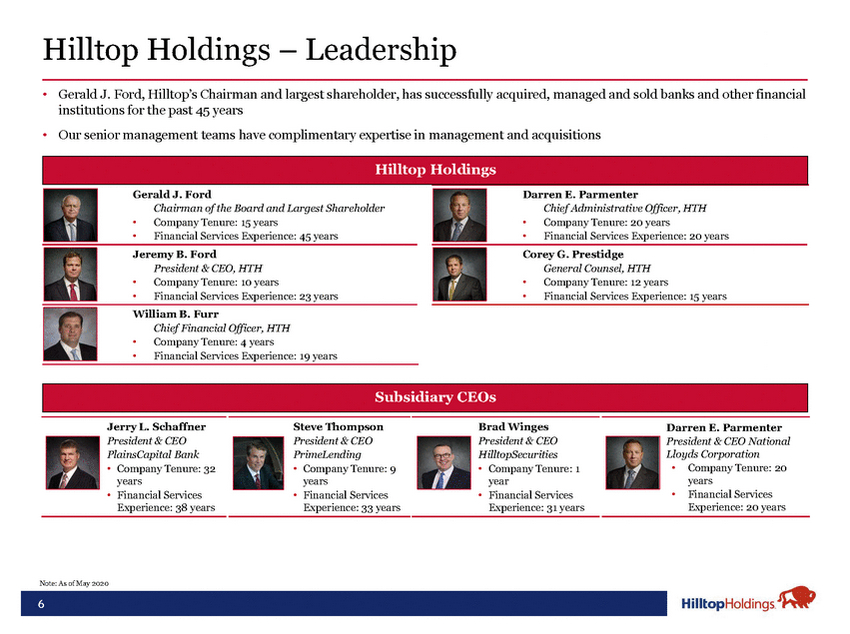
Hilltop Holdings – Leadership Gerald J. Ford, Hilltop’s Chairman and largest shareholder, has successfully acquired, managed and sold banks and other financial institutions for the past 45 years Our senior management teams have complimentary expertise in management and acquisitions Subsidiary CEOs Jerry L. Schaffner President & CEO PlainsCapital Bank Company Tenure: 32 years Financial Services Experience: 38 years Steve Thompson President & CEO PrimeLending Company Tenure: 9 years Financial Services Experience: 33 years Brad Winges President & CEO HilltopSecurities Company Tenure: 1 year Financial Services Experience: 31 years Darren E. Parmenter President & CEO National Lloyds Corporation Company Tenure: 20 years Financial Services Experience: 20 years
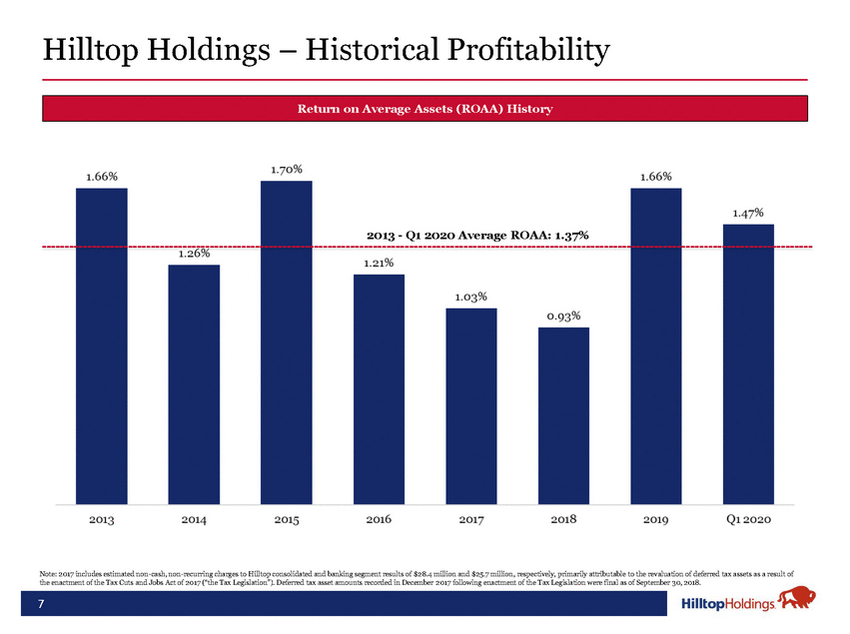
Return on Average Assets (ROAA) History 2013 - Q1 2020 Average ROAA: 1.37% Note: 2017 includes estimated non-cash, non-recurring charges to Hilltop consolidated and banking segment results of $28.4 million and $25.7 million, respectively, primarily attributable to the revaluation of deferred tax assets as a result of
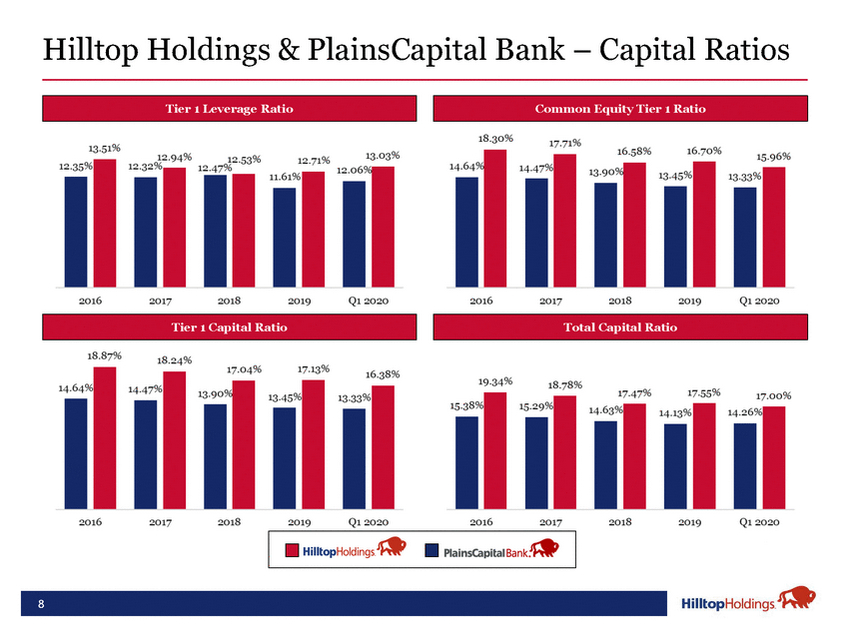
Tier 1 Leverage RatioCommon Equity Tier 1 Ratio Tier 1 Capital RatioTotal Capital Ratio
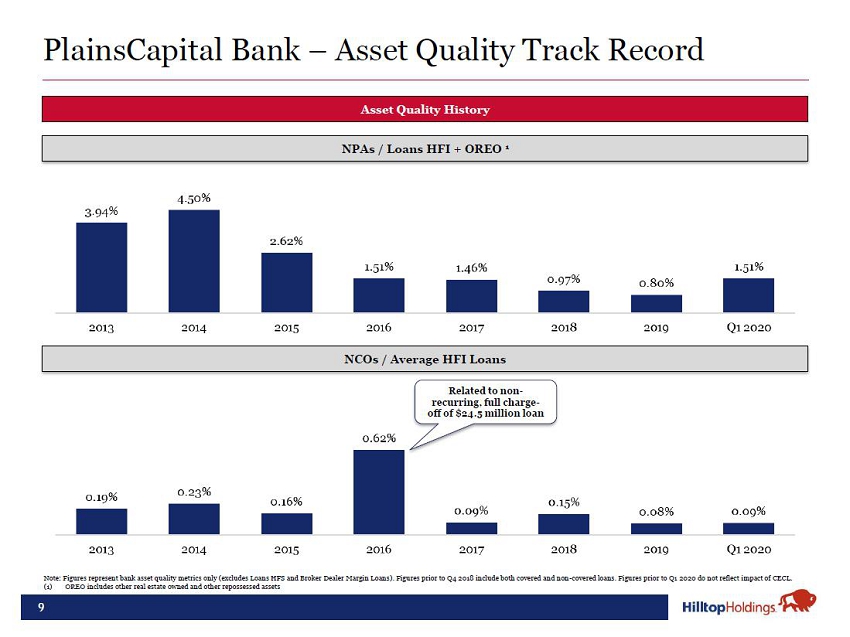
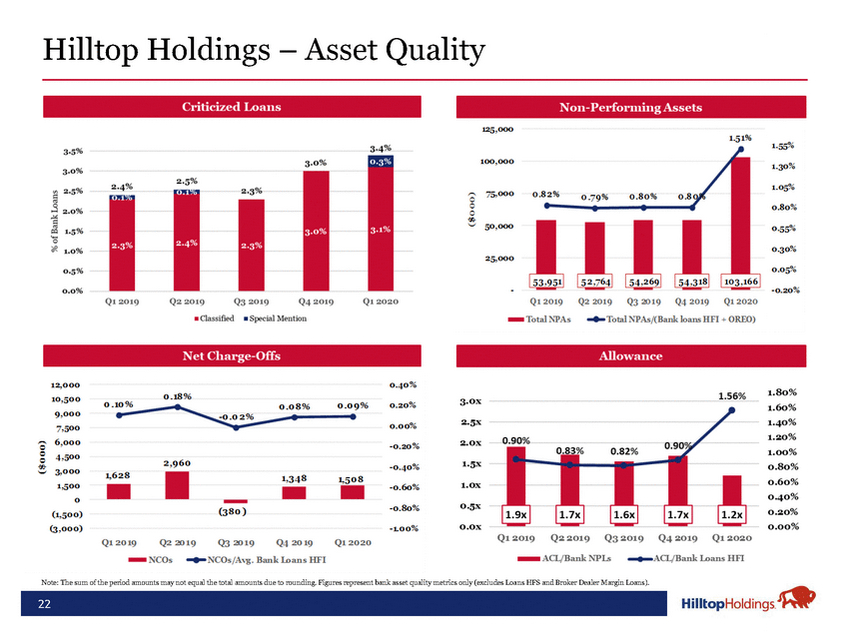
Asset Quality History NPAs / Loans HFI + OREO 1 NCOs / Average HFI Loans Related to non-recurring, full charge-off of $24.5 million loan Note: Figures represent bank asset quality metrics only (excludes Loans HFS and Broker Dealer Margin Loans). Figures prior to Q4 2018 include both covered and non-covered loans. (1)OREO includes other real estate owned and other repossessed assets

COVID-19 Update
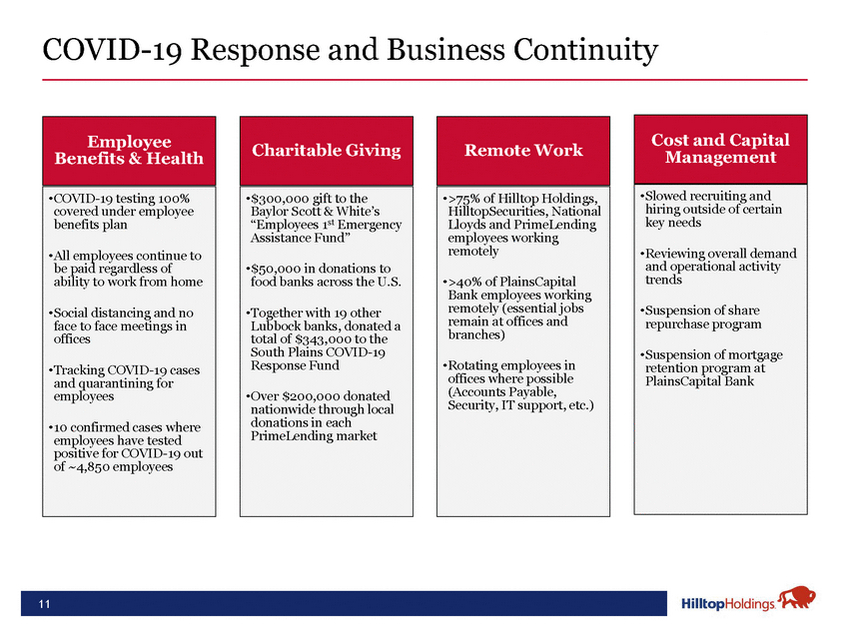
Employee Benefits & Health Charitable Giving Remote Work Cost and Capital Management •COVID-19 testing 100% covered under employee benefits plan •All employees continue to be paid regardless of ability to work from home •Social distancing and no face to face meetings in offices •Tracking COVID-19 cases and quarantining for employees •10 confirmed cases where employees have tested positive for COVID-19 out of ~4,850 employees •$300,000 gift to the Baylor Scott & White’s “Employees 1st Emergency Assistance Fund” •$50,000 in donations to food banks across the U.S. •Together with 19 other Lubbock banks, donated a total of $343,000 to the South Plains COVID-19 Response Fund •Over $200,000 donated nationwide through local donations in each PrimeLending market •>75% of Hilltop Holdings, HilltopSecurities, National Lloyds and PrimeLending employees working remotely •>40% of PlainsCapital Bank employees working remotely (essential jobs remain at offices and branches) •Rotating employees in offices where possible (Accounts Payable, Security, IT support, etc.) •Slowed recruiting and hiring outside of certain key needs •Reviewing overall demand and operational activity trends •Suspension of share repurchase program •Suspension of mortgage retention program at PlainsCapital Bank
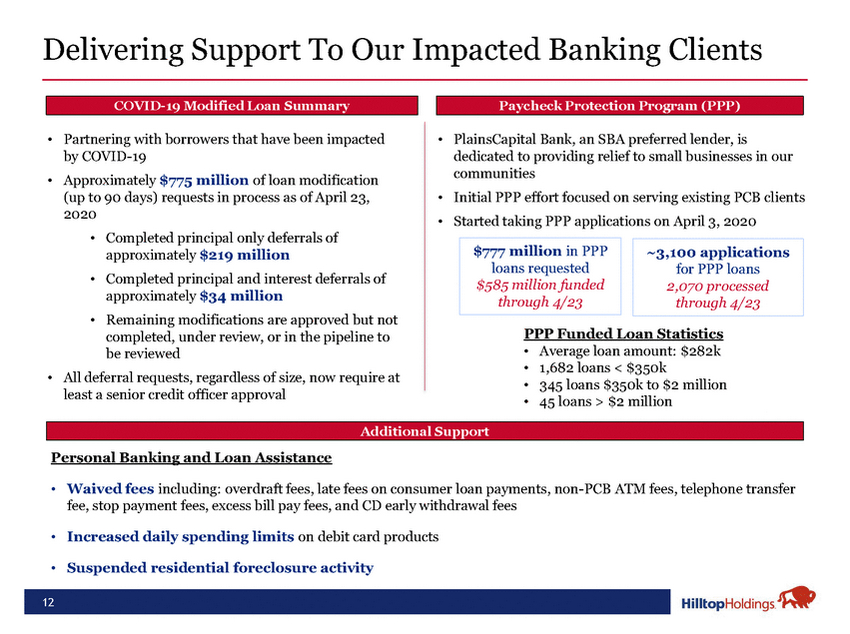
COVID-19 Modified Loan SummaryPaycheck Protection Program (PPP) Partnering with borrowers that have been impacted by COVID-19 Approximately $775 million of loan modification (up to 90 days) requests in process as of April 23, 2020 Completed principal only deferrals of PlainsCapital Bank, an SBA preferred lender, is dedicated to providing relief to small businesses in our communities Initial PPP effort focused on serving existing PCB clients Started taking PPP applications on April 3, 2020 approximately $219 million Completed principal and interest deferrals of approximately $34 million Remaining modifications are approved but not $777 million in PPP loans requested $585 million funded through 4/23 ~3,100 applications for PPP loans 2,070 processed through 4/23 completed, under review, or in the pipeline to be reviewed All deferral requests, regardless of size, now require at least a senior credit officer approval PPP Funded Loan Statistics Average loan amount: $282k • 1,682 loans < $350k 345 loans $350k to $2 million 45 loans > $2 million Personal Banking and Loan Assistance Additional Support Waived fees including: overdraft fees, late fees on consumer loan payments, non-PCB ATM fees, telephone transfer fee, stop payment fees, excess bill pay fees, and CD early withdrawal fees Increased daily spending limits on debit card products Suspended residential foreclosure activity
Recent Results & Operational Highlights
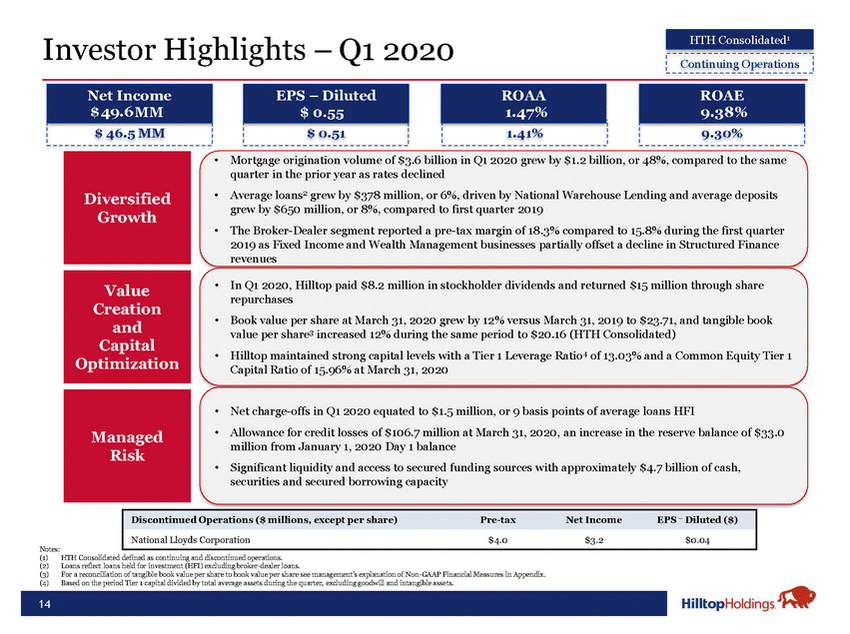
Investor Highlights – Q1 2020 HTH Consolidated1 Continuing Operations Net Income EPS – Diluted ROAA ROAE $$4298..61MM $ 0.5530 01.467%95.7368%% $ 46.5 MM$ 0.511.41%9.30% Diversified Growth Value Creation and Capital Optimization Mortgage origination volume of $3.6 billion in Q1 2020 grew by $1.2 billion, or 48%, compared to the same quarter in the prior year as rates declined Average loans2 grew by $378 million, or 6%, driven by National Warehouse Lending and average deposits grew by $650 million, or 8%, compared to first quarter 2019 The Broker-Dealer segment reported a pre-tax margin of 18.3% compared to 15.8% during the first quarter 2019 as Fixed Income and Wealth Management businesses partially offset a decline in Structured Finance revenues In Q1 2020, Hilltop paid $8.2 million in stockholder dividends and returned $15 million through share repurchases Book value per share at March 31, 2020 grew by 12% versus March 31, 2019 to $23.71, and tangible book value per share3 increased 12% during the same period to $20.16 (HTH Consolidated) Hilltop maintained strong capital levels with a Tier 1 Leverage Ratio4 of 13.03% and a Common Equity Tier 1 Capital Ratio of 15.96% at March 31, 2020 Managed Risk Net charge-offs in Q1 2020 equated to $1.5 million, or 9 basis points of average loans HFI Allowance for credit losses of $106.7 million at March 31, 2020, an increase in the reserve balance of $33.0 million from January 1, 2020 Day 1 balance Significant liquidity and access to secured funding sources with approximately $4.7 billion of cash, securities and secured borrowing capacity Discontinued Operations ($ millions, except per share) Pre-tax Net Income EPS – Diluted ($) National Lloyds Corporation $4.0 $3.2 $0.04 HTH Consolidated defined as continuing and discontinued operations. Loans reflect loans held for investment (HFI) excluding broker-dealer loans. For a reconciliation of tangible book value per share to book value per share see management’s explanation of Non-GAAP Financial Measures in Appendix. Based on the period Tier 1 capital divided by total average assets during the quarter, excluding goodwill and intangible assets.
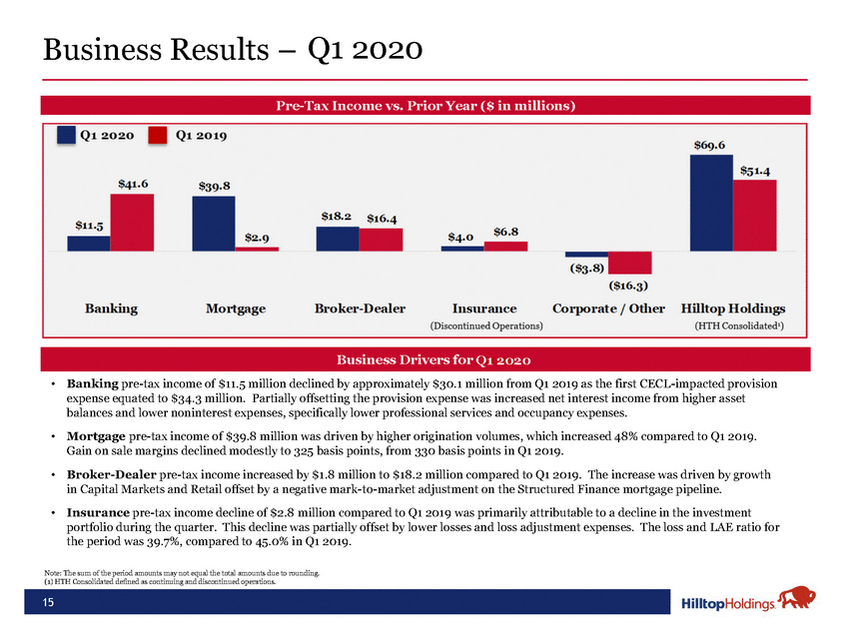
Pre-Tax Income vs. Prior Year ($ in millions) Business Drivers for1Q210210920 Banking pre-tax income of $11.5 million declined by approximately $30.1 million from Q1 2019 as the first CECL-impacted provision expense equated to $34.3 million. Partially offsetting the provision expense was increased net interest income from higher asset balances and lower noninterest expenses, specifically lower professional services and occupancy expenses. Mortgage pre-tax income of $39.8 million was driven by higher origination volumes, which increased 48% compared to Q1 2019. Gain on sale margins declined modestly to 325 basis points, from 330 basis points in Q1 2019. Broker-Dealer pre-tax income increased by $1.8 million to $18.2 million compared to Q1 2019. The increase was driven by growth in Capital Markets and Retail offset by a negative mark-to-market adjustment on the Structured Finance mortgage pipeline. Insurance pre-tax income decline of $2.8 million compared to Q1 2019 was primarily attributable to a decline in the investment portfolio during the quarter. This decline was partially offset by lower losses and loss adjustment expenses. The loss and LAE ratio for the period was 39.7%, compared to 45.0% in Q1 2019. Note: The sum of the period amounts may not equal the total amounts due to rounding. (1) HTH Consolidated defined as continuing and discontinued operations.
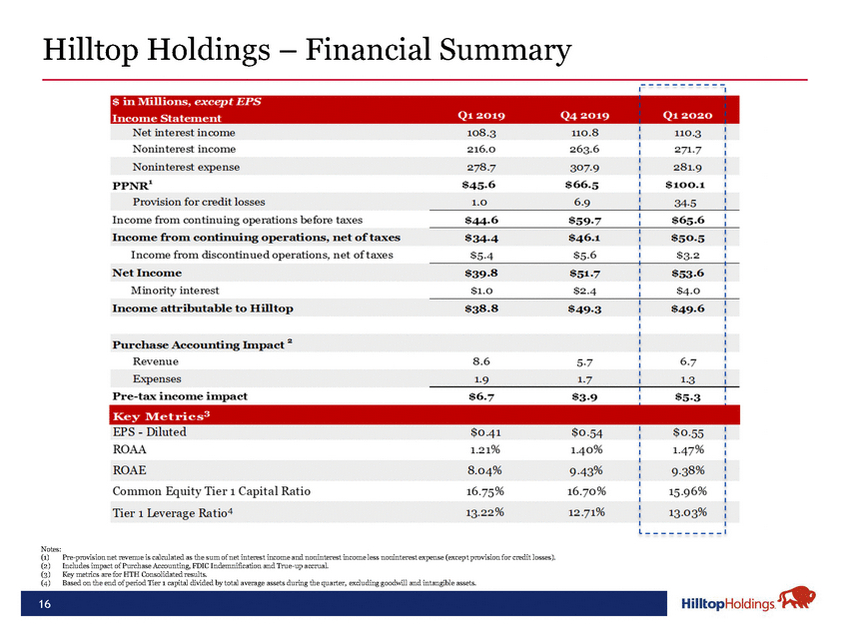
Notes: Pre-provision net revenue is calculated as the sum of net interest income and noninterest income less noninterest expense (except provision for credit losses). Includes impact of Purchase Accounting, FDIC Indemnification and True-up accrual. Key metrics are for HTH Consolidated results. Based on the end of period Tier 1 capital divided by total average assets during the quarter, excluding goodwill and intangible assets.
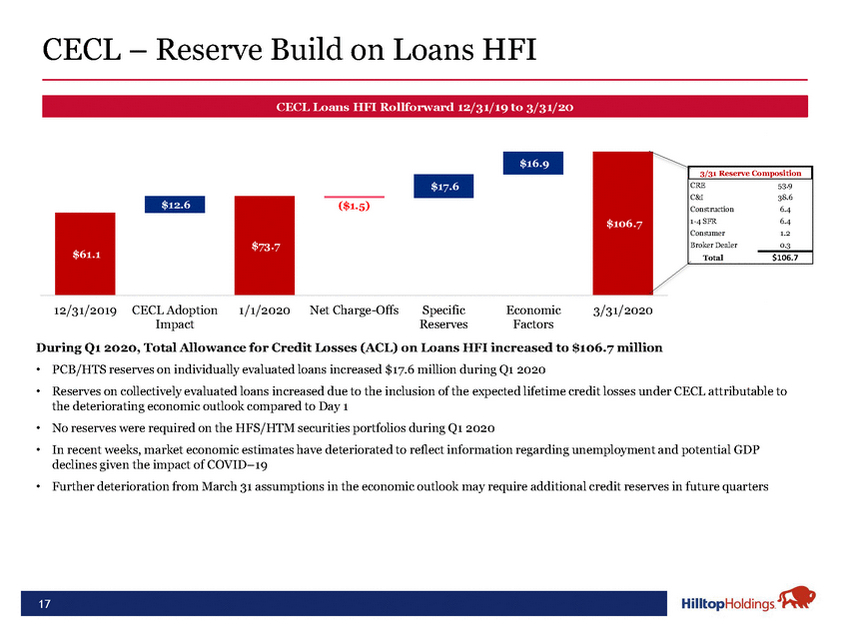
CECL Loans HFI Rollforward 12/31/19 to 3/31/20 $12.6 ($1.5) $17.6 $16.9 $106.7 CRE 53.9 C&I 38.6 Construction 6.4 1-4 SFR 6.4 Consumer 1.2 Broker Dealer 0.3 $61.1 $73.7 Total$106.7 During Q1 2020, Total Allowance for Credit Losses (ACL) on Loans HFI increased to $106.7 million PCB/HTS reserves on individually evaluated loans increased $17.6 million during Q1 2020 Reserves on collectively evaluated loans increased due to the inclusion of the expected lifetime credit losses under CECL attributable to the deteriorating economic outlook compared to Day 1 No reserves were required on the HFS/HTM securities portfolios during Q1 2020 In recent weeks, market economic estimates have deteriorated to reflect information regarding unemployment and potential GDP declines given the impact of COVID–19 Further deterioration from March 31 assumptions in the economic outlook may require additional credit reserves in future quarters
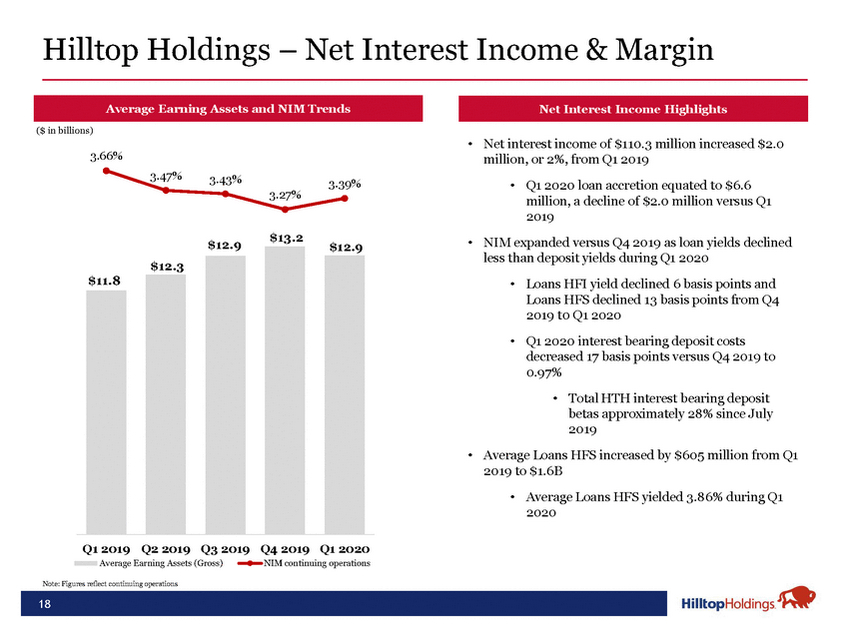
Average Earning Assets and NIM TrendsNet Interest Income Highlights ($ in billions) 3.66% 3.47%3.43% 3.27% 3.39% Net interest income of $110.3 million increased $2.0 million, or 2%, from Q1 2019 Q1 2020 loan accretion equated to $6.6 million, a decline of $2.0 million versus Q1 2019 $11.8 $12.3 $12.9$13.2$12.9 NIM expanded versus Q4 2019 as loan yields declined less than deposit yields during Q1 2020 Loans HFI yield declined 6 basis points and Loans HFS declined 13 basis points from Q4 2019 t0 Q1 2020 Q1 2020 interest bearing deposit costs decreased 17 basis points versus Q4 2019 to 0.97% Total HTH interest bearing deposit betas approximately 28% since July 2019 Average Loans HFS increased by $605 million from Q1 2019 to $1.6B Average Loans HFS yielded 3.86% during Q1 2020 Q1 2019 Q2 2019 Q3 2019 Q4 2019 Q1 2020 Average Earning Assets (Gross)NIM continuing operations Note: Figures reflect continuing operations
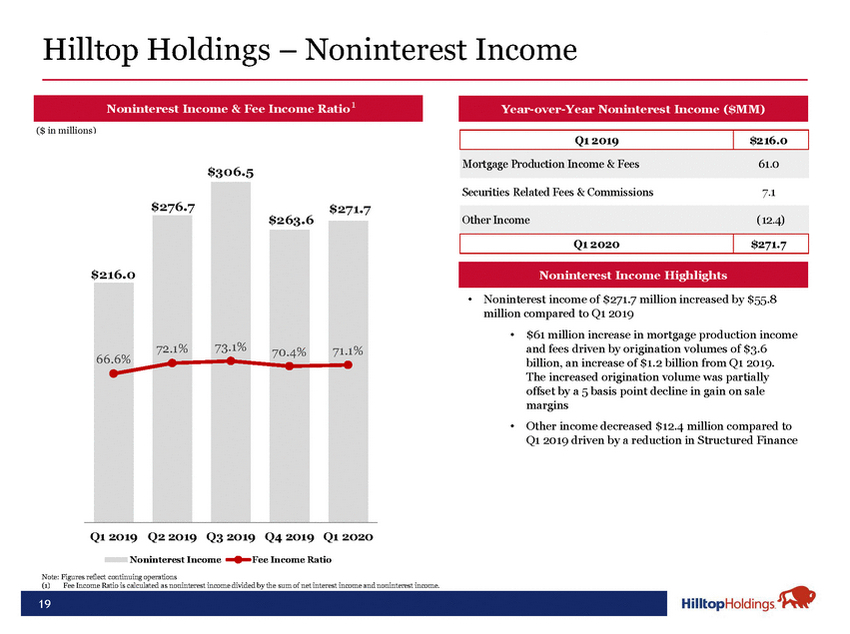
Noninterest Income & Fee Income Ratio 1 Year-over-Year Noninterest Income ($MM) Q1 2019 $216.0 Mortgage Production Income & Fees61.0 $276.7 $306.5 $263.6 $271.7 Securities Related Fees & Commissions7.1 Other Income(12.4) Q1 2020 $271.7 Noninterest Income Highlights 66.6% 72.1%73.1%70.4%71.1% Noninterest income of $271.7 million increased by $55.8 million compared to Q1 2019 $61 million increase in mortgage production income and fees driven by origination volumes of $3.6 billion, an increase of $1.2 billion from Q1 2019. The increased origination volume was partially offset by a 5 basis point decline in gain on sale margins Other income decreased $12.4 million compared to Q1 2019 driven by a reduction in Structured Finance Q1 2019 Q2 2019 Q3 2019 Q4 2019 Q1 2020 Noninterest IncomeFee Income Ratio
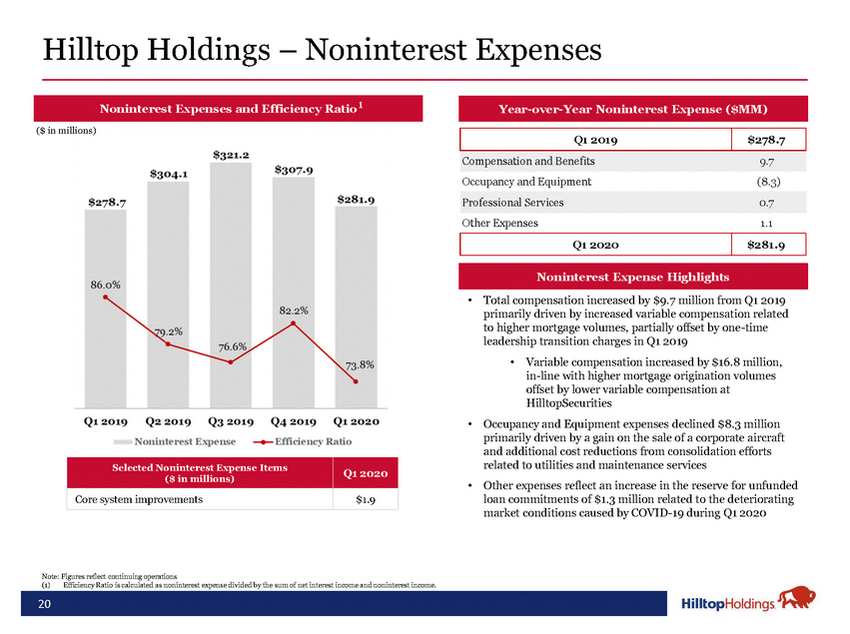
Noninterest Expenses and Efficiency Ratio1 Year-over-Year Noninterest Expense ($MM) Q1 2019 $278.7 Compensation and Benefits9.7 Noninterest Expense Highlights Total compensation increased by $9.7 million from Q1 2019 primarily driven by increased variable compensation related to higher mortgage volumes, partially offset by one-time leadership transition charges in Q1 2019 Variable compensation increased by $16.8 million, in-line with higher mortgage origination volumes offset by lower variable compensation at HilltopSecurities Selected Noninterest Expense Items ($ in millions)Q1 2020 Core system improvements $1.9 Other expenses reflect an increase in the reserve for unfunded loan commitments of $1.3 million related to the deteriorating market conditions caused by COVID-19 during Q1 2020
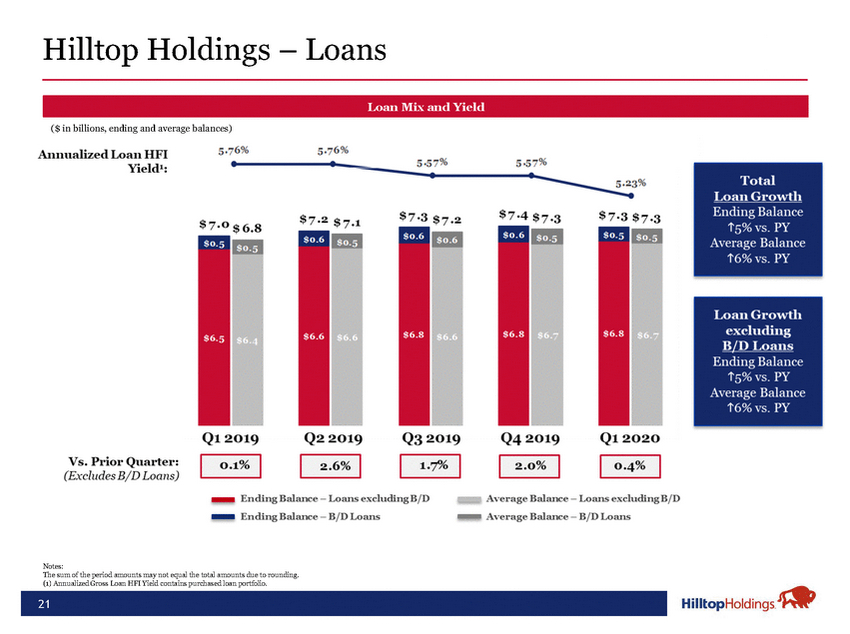
Loan Mix and Yield ($ in billions, ending and average balances) Notes: The sum of the period amounts may not equal the total amounts due to rounding.
[LOGO]
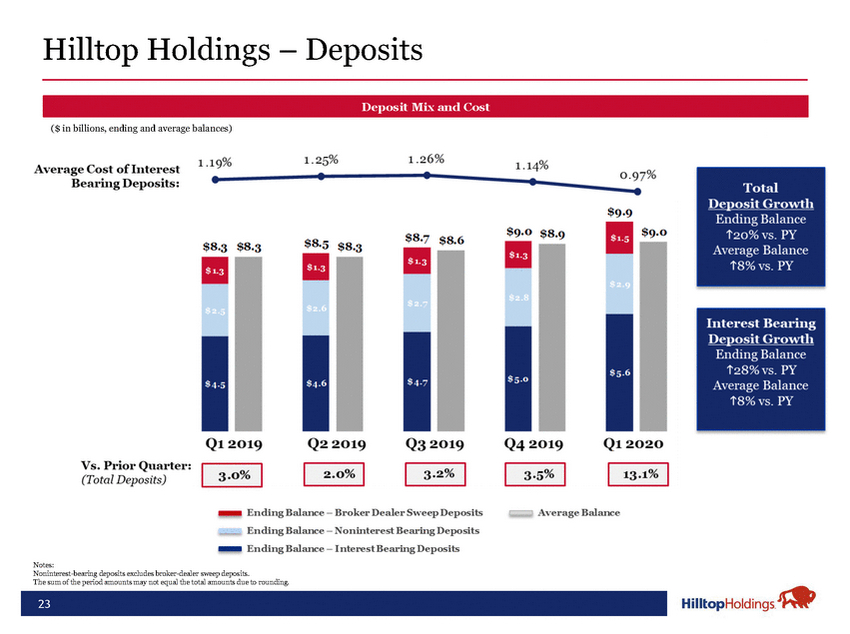
Deposit Mix and Cost ($ in billions, ending and average balances) Notes: Noninterest-bearing deposits excludes broker-dealer sweep deposits.
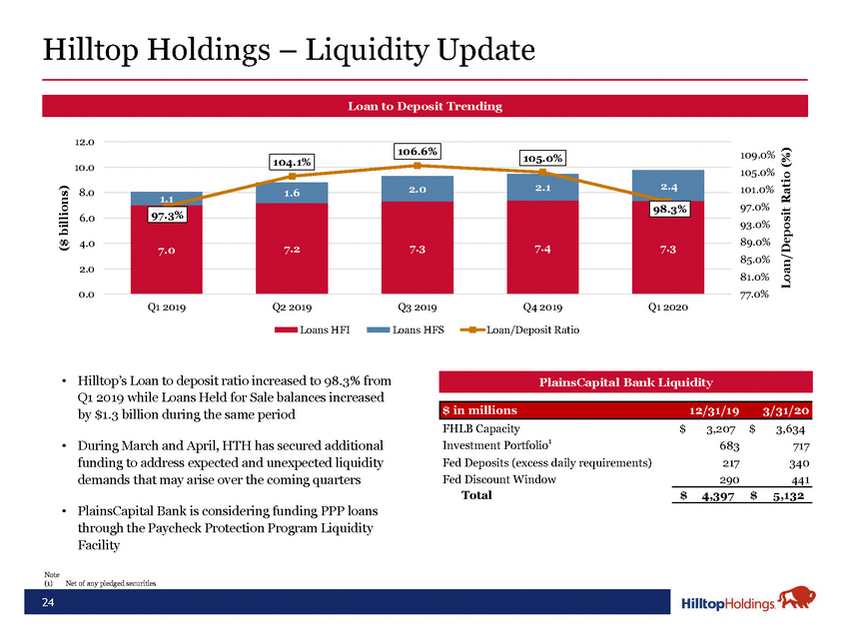
Loan to Deposit Trending 12.0 10.0 104.1% 106.6% 105.0% 2.12.4 Loan/Deposit Ratio (%) 105.0% ($ billions) 6.0 1.11.62.0 97.3% 98.3% 101.0% 97.0% 93.0% 4.0 2.0 0.0 7.07.27.37.47.3 Q1 2019Q2 2019Q3 2019Q4 2019Q1 2020 89.0% 85.0% 81.0% 77.0% Loans HFILoans HFSLoan/Deposit Ratio Hilltop’s Loan to deposit ratio increased to 98.3% from Q1 2019 while Loans Held for Sale balances increased by $1.3 billion during the same period PlainsCapital Bank Liquidity $ in millions12/31/193/31/20 FHLB Capacity $3,207$ 3,634 During March and April, HTH has secured additional funding to address expected and unexpected liquidity demands that may arise over the coming quarters Investment Portfolio1683 717 Fed Deposits (excess daily requirements)217 340 Fed Discount Window290 441 PlainsCapital Bank is considering funding PPP loans through the Paycheck Protection Program Liquidity Facility Total $4,397$ 5,132 Note Net of any pledged securities
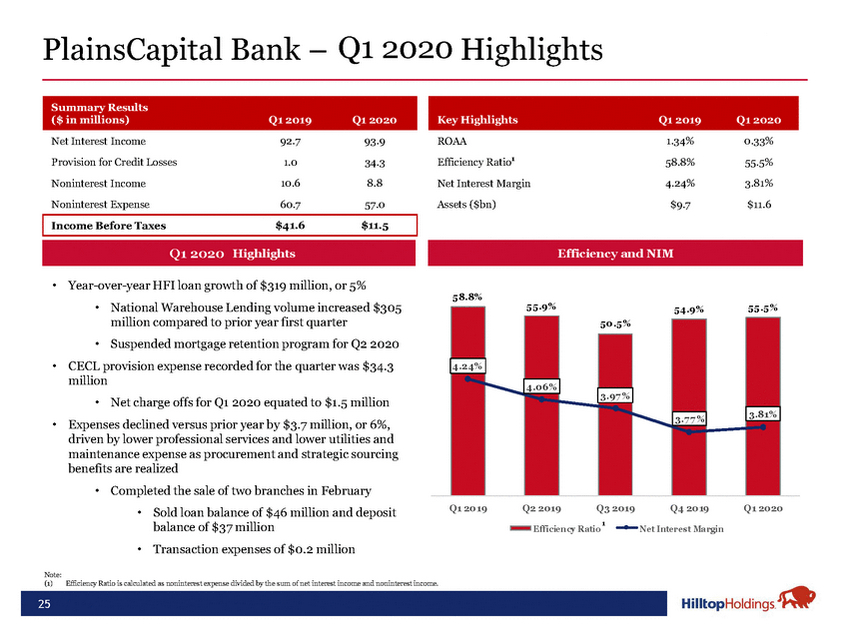
Income Before Taxes$41.6$11.5 Q1 2020 Highlights Q1 2019 Key Highlights Q1 2019 Q1 2020 ROAA 1.34% 0.33% Efficiency Ratio1 58.8% 55.5% Net Interest Margin 4.24% 3.81% Assets ($bn) $9.7 $11.6 Year-over-year HFI loan growth of $319 million, or 5% National Warehouse Lending volume increased $305 million compared to prior year first quarter Suspended mortgage retention program for Q2 2020 CECL provision expense recorded for the quarter was $34.3 million Net charge offs for Q1 2020 equated to $1.5 million Expenses declined versus prior year by $3.7 million, or 6%, driven by lower professional services and lower utilities and maintenance expense as procurement and strategic sourcing benefits are realized Completed the sale of two branches in February 58.8% 4.24% 55.9% 4.06% 50.5% 3.97 % 54.9%55.5% 7 %3.81% Sold loan balance of $46 million and deposit Q1 2019Q2 2019Q3 2019Q4 2019Q1 2020 balance of $37 million Transaction expenses of $0.2 million 1 Efficiency Ratio Net Interest Margin Note: Efficiency Ratio is calculated as noninterest expense divided by the sum of net interest income and noninterest income.
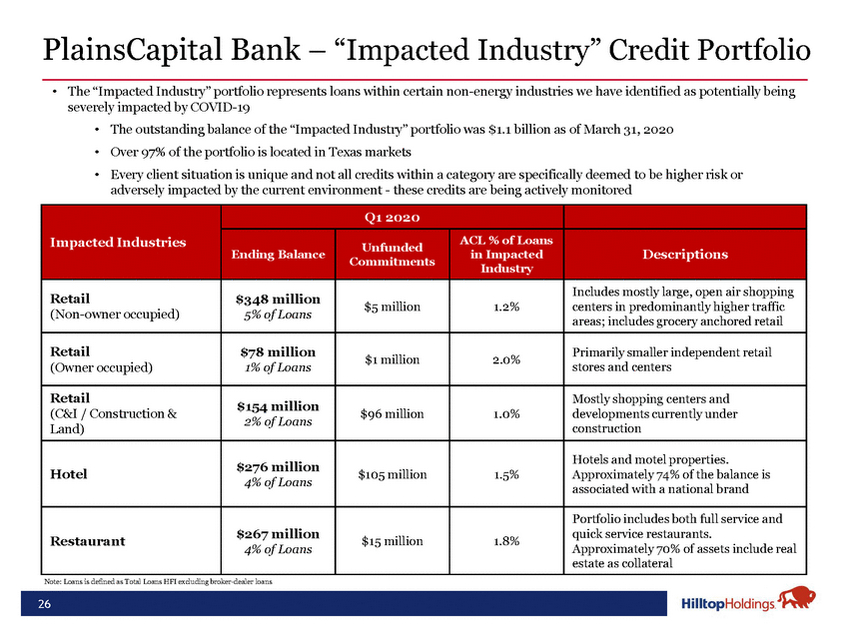
PlainsCapital Bank – “Impacted Industry” Credit Portfolio The “Impacted Industry” portfolio represents loans within certain non-energy industries we have identified as potentially being severely impacted by COVID-19 The outstanding balance of the “Impacted Industry” portfolio was $1.1 billion as of March 31, 2020 Over 97% of the portfolio is located in Texas markets Every client situation is unique and not all credits within a category are specifically deemed to be higher risk or adversely impacted by the current environment - these credits are being actively monitored
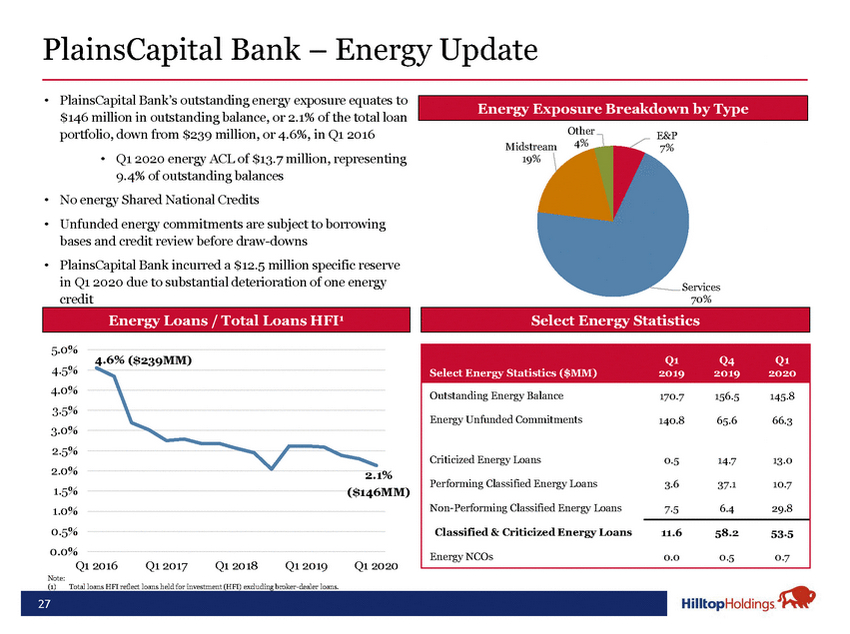
PlainsCapital Bank’s outstanding energy exposure equates to $146 million in outstanding balance, or 2.1% of the total loan Energy Exposure Breakdown by Type portfolio, down from $239 million, or 4.6%, in Q1 2016 Q1 2020 energy ACL of $13.7 million, representing 9.4% of outstanding balances No energy Shared National Credits Unfunded energy commitments are subject to borrowing bases and credit review before draw-downs PlainsCapital Bank incurred a $12.5 million specific reserve in Q1 2020 due to substantial deterioration of one energy credit Midstream 19% Other 4% E&P 7% Services 70% Energy Loans / Total Loans HFI1 Select Energy Statistics 5.0% 4.5% 4.0% 3.5% 3.0% 2.5% 2.0% 4.6% ($239MM) Select Energy Statistics ($MM) Q1 2019 Q4 2019 Q1 2020 Outstanding Energy Balance 170.7 156.5 145.8 Energy Unfunded Commitments 140.8 65.6 66.3 Criticized Energy Loans 0.5 14.7 13.0 Performing Classified Energy Loans 3.6 37.1 10.7 Non-Performing Classified Energy Loans 7.5 6.4 29.8 Classified & Criticized Energy Loans 11.6 58.2 53.5 Energy NCOs 0.0 0.5 0.7 1.5% 1.0% 0.5% 0.0% ($146MM) Note: Q1 2016Q1 2017Q1 2018Q1 2019Q1 2020 (1)Total loans HFI reflect loans held for investment (HFI) excluding broker-dealer loans.
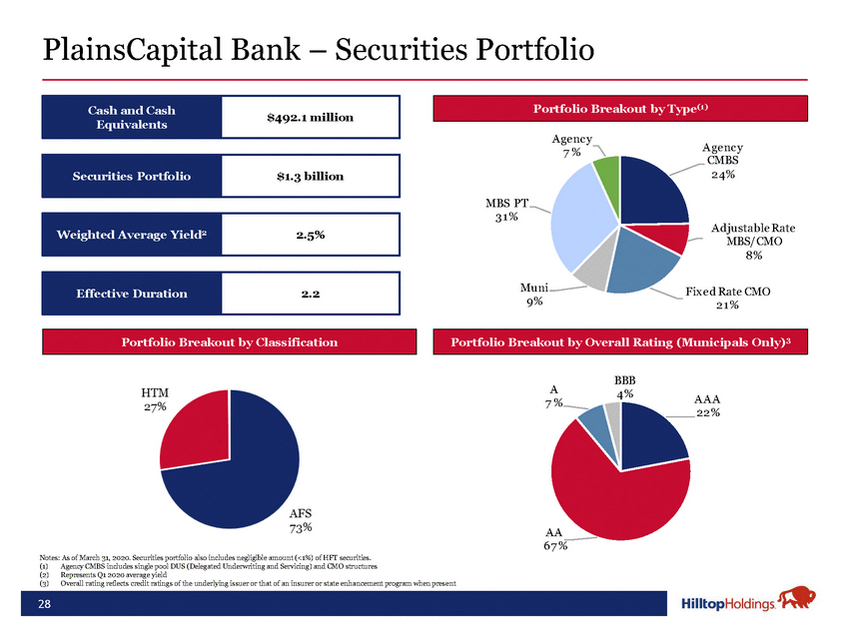
Cash and Cash Equivalents $492.1 million Portfolio Breakout by Type(1) A gency Securities Portfolio Weighted Average Yield2 Effective Duration $1.3 billion 2.5% 2.2 7% MBS PT 31 % Muni 9% A gency CMBS 24% A djustable Rate MBS/CMO 8% Fix ed Rate CMO 21 % Portfolio Breakout by ClassificationPortfolio Breakout by Overall Rating (Municipals Only)3 Notes: As of March 31, 2020. Securities portfolio also includes negligible amount (<1%) of HFT securities. Agency CMBS includes single pool DUS (Delegated Underwriting and Servicing) and CMO structures Represents Q1 2020 average yield Overall rating reflects credit ratings of the underlying issuer or that of an insurer or state enhancement program when present A 7% AA 67 % BBB 4% AAA 22%
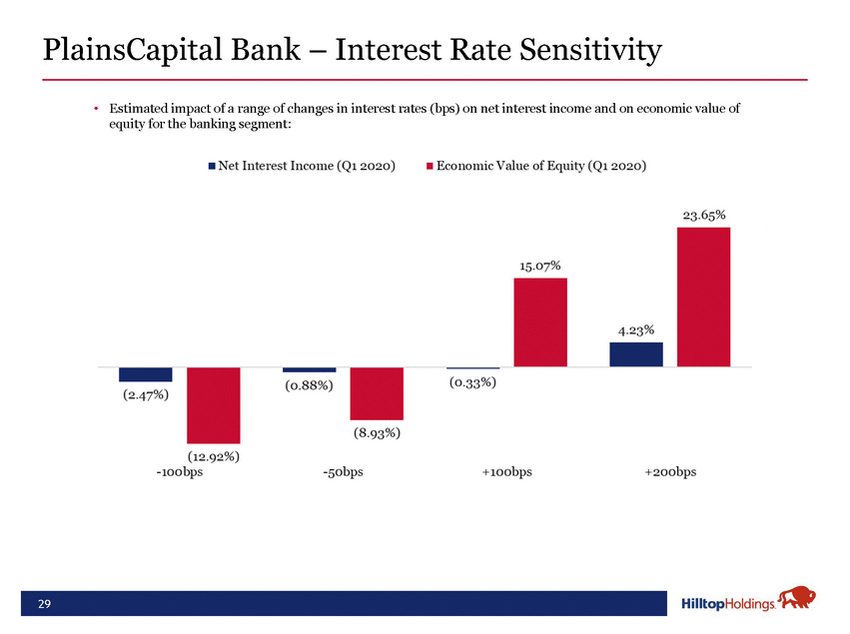
Estimated impact of a range of changes in interest rates (bps) on net interest income and on economic value of equity for the banking segment:
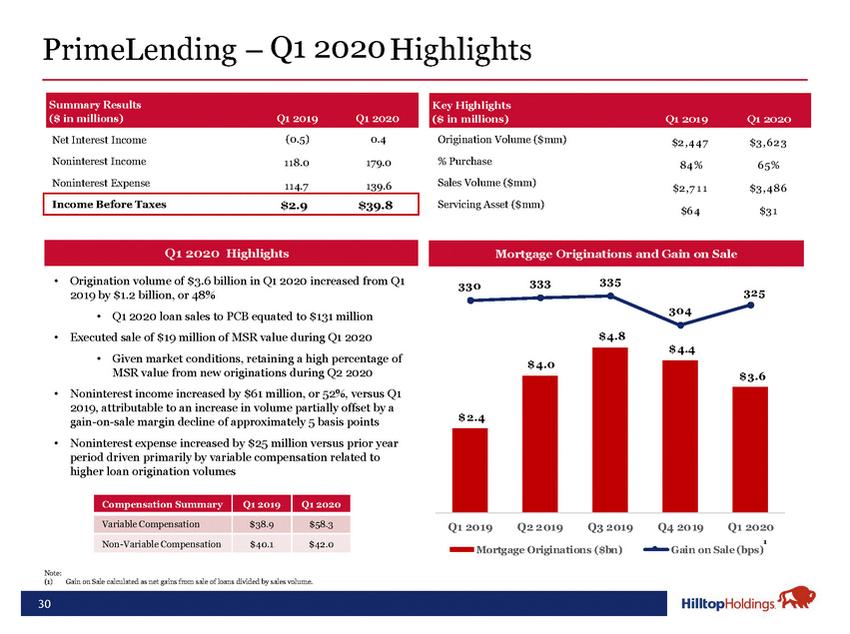
Key Highlights ($ in millions) Q1 2019 Q1 2020 Origination Volume ($mm) $2 ,4 4 7 $3 ,6 2 3 % Purchase 84 % 6 5% Sales Volume ($mm) $2 ,7 1 1 $3 ,4 86 Servicing Asset ($mm) $6 4 $3 1 Origination volume of $3.6 billion in Q1 2020 increased from Q1 2019 by $1.2 billion, or 48% Q1 2020 loan sales to PCB equated to $131 million Executed sale of $19 million of MSR value during Q1 2020 Mortgage Originations and Gain on Sale 330333335 304 $ 4.8 325 Given market conditions, retaining a high percentage of MSR value from new originations during Q2 2020 Noninterest income increased by $61 million, or 52%, versus Q1 2019, attributable to an increase in volume partially offset by a gain-on-sale margin decline of approximately 5 basis points Noninterest expense increased by $25 million versus prior year period driven primarily by variable compensation related to higher loan origination volumes $ 2.4 $ 4.0 $ 4.4 $ 3.6 Compensation Summary Q1 2019 Q1 2020 Variable Compensation $38.9 $58.3 Non-Variable Compensation $40.1 $42.0 1 Mortgage Originations ($bn)Gain on Sale (bps) Note: Gain on Sale calculated as net gains from sale of loans divided by sales volume.
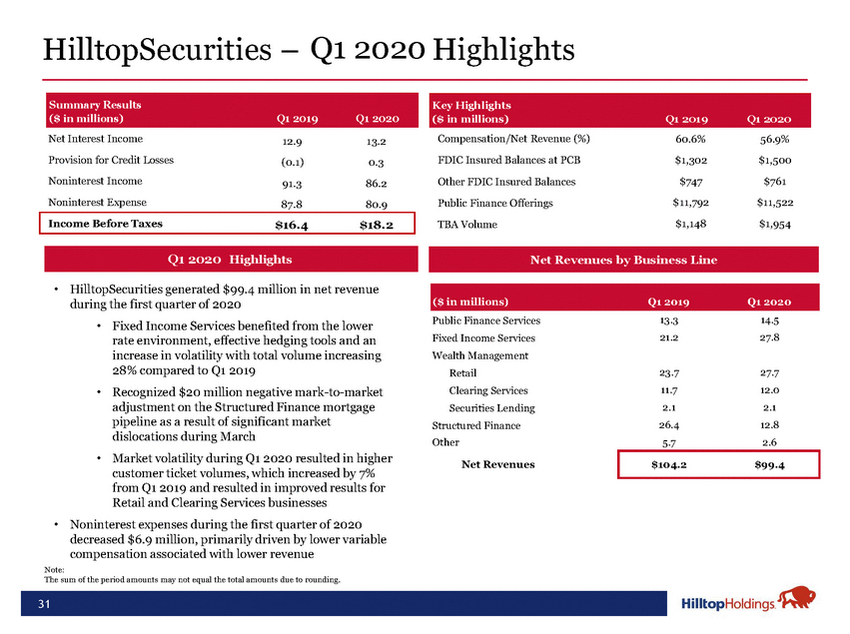
Income Before Taxes $16.4$18.2 Key Highlights ($ in millions) Q1 2019 Q1 2020 Compensation/Net Revenue (%)60.6%56.9% FDIC Insured Balances at PCB$1,302$1,500 Other FDIC Insured Balances$747$761 Public Finance Offerings$11,792$11,522 TBA Volume$1,148$1,954 Highlights Q1 2019Net Revenues by Business Line HilltopSecurities generated $99.4 million in net revenue during the first quarter of 2020 Fixed Income Services benefited from the lower rate environment, effective hedging tools and an increase in volatility with total volume increasing 28% compared to Q1 2019 Recognized $20 million negative mark-to-market adjustment on the Structured Finance mortgage pipeline as a result of significant market dislocations during March Market volatility during Q1 2020 resulted in higher customer ticket volumes, which increased by 7% from Q1 2019 and resulted in improved results for Retail and Clearing Services businesses Noninterest expenses during the first quarter of 2020 decreased $6.9 million, primarily driven by lower variable compensation associated with lower revenue ($ in millions)Q1 2019Q1 2020 Public Finance Services13.314.5 Fixed Income Services21.227.8 Wealth Management Retail23.727.7 Clearing Services11.712.0 Securities Lending2.12.1 Structured Finance26.412.8 Other5.72.6 Net Revenues$104.2$99.4 Note: The sum of the period amounts may not equal the total amounts due to rounding.
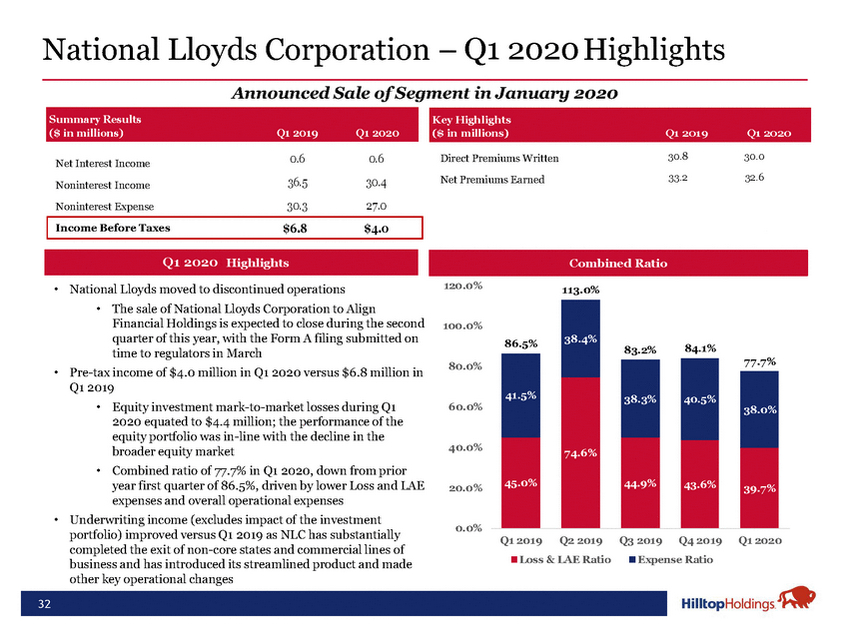
Key Highlights ($ in millions) Q1 2019 Q1 2020 Direct Premiums Written30.830.0 Net Premiums Earned33.232.6 QQ1 420220018 HighlightsCombined Ratio National Lloyds moved to discontinued operations The sale of National Lloyds Corporation to Align Financial Holdings is expected to close during the second quarter of this year, with the Form A filing submitted on time to regulators in March Pre-tax income of $4.0 million in Q1 2020 versus $6.8 million in Q1 2019 Equity investment mark-to-market losses during Q1 2020 equated to $4.4 million; the performance of the equity portfolio was in-line with the decline in the broader equity market Combined ratio of 77.7% in Q1 2020, down from prior 120.0% 100.0% 80.0% 60.0% 40.0% 86.5% 41.5% 113.0% 38.4% 74.6% 83.2%84.1% %40.5% 77.7% 38.0% year first quarter of 86.5%, driven by lower Loss and LAE expenses and overall operational expenses Underwriting income (excludes impact of the investment 20.0% 0.0% 45.0% 44.9%43.6%39.7% portfolio) improved versus Q1 2019 as NLC has substantially completed the exit of non-core states and commercial lines of business and has introduced its streamlined product and made other key operational changes Q1 2019Q2 2019Q3 2019Q4 2019Q1 2020 Loss & LAE RatioExpense Ratio
[LOGO]
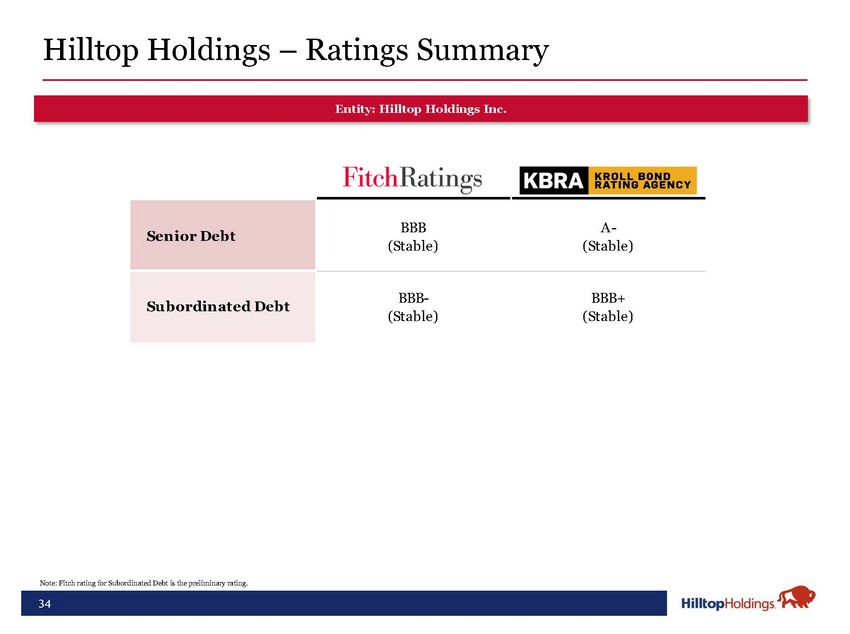
Entity: Hilltop Holdings Inc.
Appendix
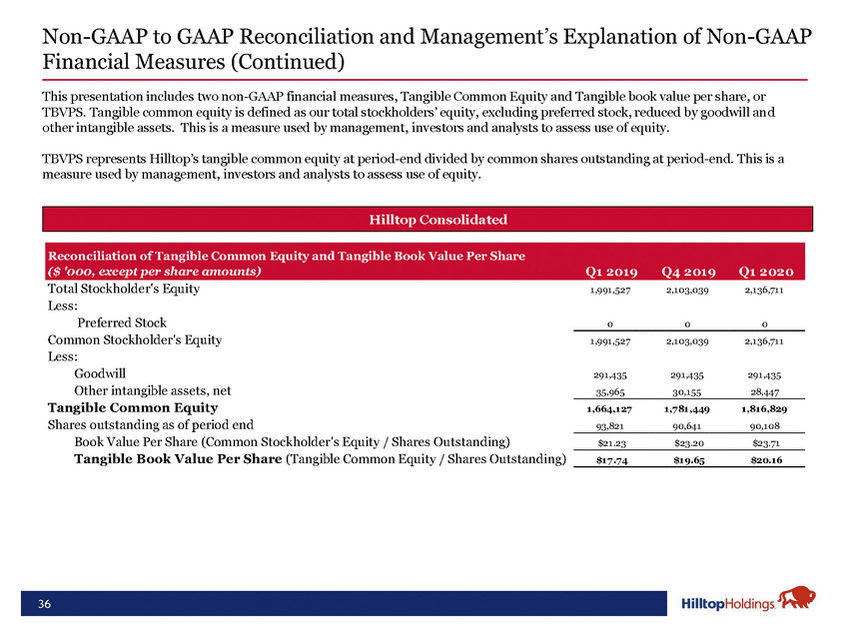
Non-GAAP to GAAP Reconciliation and Management’s Explanation of Non-GAAP Financial Measures (Continued) This presentation includes two non-GAAP financial measures, Tangible Common Equity and Tangible book value per share, or TBVPS. Tangible common equity is defined as our total stockholders’ equity, excluding preferred stock, reduced by goodwill and other intangible assets. This is a measure used by management, investors and analysts to assess use of equity. TBVPS represents Hilltop’s tangible common equity at period-end divided by common shares outstanding at period-end. This is a measure used by management, investors and analysts to assess use of equity. Hilltop Consolidated