Exhibit 99.1
Hilltop Holdings Inc. Earnings Presentation Q4 2021 January 28, 2022 |
Preface 2 Additional Information Corporate Headquarters 6565 Hillcrest Ave Dallas, TX 75205 Phone: 214 - 855 - 2177 www.hilltop - holdings.com Please Contact: Erik Yohe Phone: 214 - 525 - 4634 Email: eyohe@hilltop - holdings.com FORWARD - LOOKING STATEMENTS This presentation and statements made by representatives of Hilltop Holdings Inc. (“Hilltop” or the “Company”) during the cou rse of this presentation include “forward - looking statements” within the meaning of the Private Securities Litigation Reform Act of 1995. These forward - looking statements involve known and unknown risks, uncertainties and other factors that may cause our actual results, performance or achievements to be materially different from any future resul ts, performance or achievements anticipated in such statements. Forward - looking statements speak only as of the date they are made and, except as required by law, we do not assume any duty to update forward - looking statements. Such forward - looking statements include, but are not limited to, statements concerning such things as our outlook, o ur business strategy, our financial condition, our efforts to make strategic acquisitions, our revenue, our liquidity and sources of funding, market trends, operations and bus iness, the impact of natural disasters or public health emergencies, such as the current coronavirus (“COVID - 19”) global pandemic or disruptions in global or national supply cha ins, information technology expenses, capital levels, mortgage servicing rights (“MSR”) assets, use of proceeds from offerings, stock repurchases, dividend payments, expec tat ions concerning mortgage loan origination volume, servicer advances and interest rate compression, expected levels of refinancing as a percentage of total loan origina tio n volume, projected losses on mortgage loans originated, total expenses, anticipated changes in our revenue, earnings, or taxes, the effects of government regulation appl ica ble to our operations, the appropriateness of, and changes in, our allowance for credit losses and provision for (reversal of) credit losses, including as a result of the “curr ent expected credit losses” (CECL) model, expected future benchmark rates and economic growth, anticipated investment yields, expected accretion of discount on loans in future per iods, the collectability of loans, cybersecurity incidents, the outcome of litigation, and our other plans, objectives, strategies, expectations and intentions and other stat eme nts that are not statements of historical fact, and may be identified by words such as “anticipates,” “believes,” “building”, “could,” “estimates,” “expects,” “forecasts,” “goal ,” “guidance”, “intends,” “may,” “might,” “outlook”, “plan,” “probable,” “projects,” “seeks,” “should,” “target,” “view” or “would” or the negative of these words and phrases or sim ilar words or phrases. The following factors, among others, could cause actual results to differ from those set forth in the forward - looking statements: (i) the COVID - 19 pandemic a nd the response of governmental authorities to the pandemic and disruptions in global or national supply chains, which have had and may continue to have an adverse impact t o t he global economy and our business operations and performance; (ii) the credit risks of lending activities, including our ability to estimate credit losses and inc reases to the allowance for credit losses, as well as the effects of changes in the level of, and trends in, loan delinquencies and write - offs; (iii) effectiveness of our data security c ontrols in the face of cyber attacks; (iv) changes in general economic, market and business conditions in areas or markets where we compete, including changes in the price of crud e o il; (v) risks associated with concentration in real estate related loans; (vi) changes in the interest rate environment and transitions away from LIBOR; (vi) risks associat ed with concentration in real estate related loans; (vii) the effects of our indebtedness on our ability to manage our business successfully, including the restrictions imposed by the in denture governing our indebtedness; (viii) changes in state and federal laws, regulations or policies affecting one or more of our business segments, including changes in regul ato ry fees, deposit insurance premiums, capital requirements and the Dodd - Frank Wall Street Reform and Consumer Protection Act; (ix) cost and availability of capital; (x) chang es in key management; (xi) competition in our banking, broker - dealer and mortgage origination segments from other banks and financial institutions, as well as investment bank ing and financial advisory firms, mortgage bankers, asset - based non - bank lenders and government agencies; (xii) legal and regulatory proceedings; (xiii) risks associated w ith merger and acquisition integration; and (xiv) our ability to use excess capital in an effective manner. For further discussion of such factors, see the risk factors descr ibe d in our most recent Annual Report on Form 10 - K, and subsequent Quarterly Reports on Form 10 - Q and other reports, that we have filed with the Securities and Exchange Commission. All forward - looking statements are qualified in their entirety by this cautionary statement. The information contained herein is preliminary and based on Company data available at the time of the earnings presentation. I t speaks only as of the particular date or dates included in the accompanying slides. Hilltop Holdings does not undertake an obligation to, and disclaims any duty to, update any of the information herein. |
Q4 2021 3 Investor Highlights – Notes: (1) Average Bank Loans HFI reflect consolidated loans held for investment excluding margin loans from the broker - dealer business. (2) Mortgage Banking Association Forecast 1/21/2022 • PlainsCapital Bank generated $68.4 million in pre - tax income during Q4 2021, an increase of $9.2 million from Q4 2020 • Average bank loans HFI 1 increased from Q3 2021 by $122 million, or 2%, as growth in 1 - 4 family retained mortgages and commercial loans more than offset runoff in Paycheck Protection Program (PPP) loan balances • Average bank deposits increased from Q3 2021 by $460 million, or 4%, as growth in core deposits continues • Reversal of credit losses of $18.5 million reflects continued improvements in asset quality and the overall macroeconomic outlook • PrimeLending generated $31.3 million in pre - tax income during Q4 2021, a decrease of $52.7 million from Q4 2020 • Mortgage origination volume in Q4 2021 was $5.0 billion, a decline of 27% from Q4 2020; overall industry volume declined approximately 34% over the same period 2 • Gain - on - sale of loans sold to third parties stable at 362 basis points for Q4 2021 • Loan originator headcount of 1,309, an increase of 84 from Q4 2020 • HilltopSecurities generated $1.7 million in pre - tax income during Q4 2021, a decrease of $32.6 million from Q4 2020 • Public Finance Services net revenue declined 7% from Q4 2020, in line with the decline in industry - wide municipal issuance volume • Structured Finance and Fixed Income Services net revenues were down 73% and 57%, respectively, from Q4 2020, reflecting a softening in the mortgage market and a material industry decline in trading and capital markets activity ROAA ..86% EPS – Diluted $0.30 ROAE 5.76% 9.93% $62.2 $0.78 1.41% Net Income MM |
$19.65 $20.16 $21.85 $23.52 $24.77 $25.93 $26.93 $27.77 $28.37 16.70% 15.96% 18.46% 19.85% 18.97% 19.63% 20.22% 21.28% 21.22% $0.08 $0.09 $0.09 $0.09 $0.09 $0.12 $0.12 $0.12 $0.12 6.00% 8.00% 10.00% 12.00% 14.00% 16.00% 18.00% 20.00% 22.00% 24.00% $- $5.00 $10.00 $15.00 $20.00 $25.00 $30.00 $35.00 $40.00 Q4 2019 Q1 2020 Q2 2020 Q3 2020 Q4 2020 Q1 2021 Q2 2021 Q3 2021 Q4 2021 Tangible Book Value Per Share (Tangible Common Equity / Shares Outstanding) Common Equity Tier 1 risk based ratio Dividends per share Investor Highlights – Capital Highlights 4 Capital Management and Tangible Book Value Growth TBVPS h 15% Versus 12/31/20 h 20% CAGR Since 12/31/19 • All regulatory capital ratios remained in excess of well - capitalized and internal policy limits at December 31, 2021 • During 2021, HTH returned $162.6 million of capital to shareholders • $39.0 million of dividends and $123.6 million in share repurchases • 43% of earnings were distributed to shareholders in 2021 • In January 2022, the HTH Board of Directors authorized a new stock repurchase program through January 2023, under which Hilltop may repurchase, in the aggregate, up to $100.0 million of its outstanding common stock 1 1 Notes: (1) Tangible common equity and tangible book value per common share (TBVPS) are non - GAAP financial measures. For a reconciliation o f tangible common equity and tangible book value per share to the nearest GAAP measure, see the appendix. (2) At period end. 2 2 |
5 Hilltop Holdings – Q4 Financial Summary $ in Millions, except EPS Income Statement and Key Metrics Q4 2021 Q3 2021 QoQ% Q4 2020 YoY% Net interest income $104.3 $105.1 (1%) $107.4 (3%) Noninterest income 284.8 367.9 (23%) 447.9 (36%) Noninterest expenses 322.2 355.2 (9%) 402.3 (20%) Efficiency ratio 82.8% 75.1% 72.5% Pre-provision net revenue 1 66.9 117.9 (43%) 153.0 (56%) Net charge offs (recoveries) ($0.4) ($0.1) 549% $2.7 (115%) Net ACL build / (release) (18.2) (5.7) 219% (6.2) 194% Provision for (reversal of) credit losses (18.6) (5.8) 219% (3.5) 430% Income from continuing operations, before taxes 85.5 123.7 (31%) 156.4 (45%) Net income 64.8 95.4 (32%) 120.9 (46%) Minority interest 2.6 2.5 4% 4.4 (41%) Income attributable to Hilltop $62.2 $92.9 (33%) $116.4 (47%) Return on average assets 1.41% 2.13% 2.83% Return on average equity 9.93% 14.96% 20.56% EPS - Diluted $0.78 $1.15 (32%) $1.35 (42%) EOP Shares outstanding (in thousands) 78,965 78,959 0% 82,185 (4%) Average assets $18,255 $17,750 3% $16,988 7% EOP Assets 18,689 17,990 4% 16,944 10% EOP Loans HFI, net 7,789 7,443 5% 7,544 3% EOP Deposits 12,818 12,132 6% 11,242 14% Notes: (1) Pre - provision net revenue is calculated as the sum of net interest income and noninterest income less noninterest expense (excep t provision for credit losses). |
6 Hilltop Holdings – FY Financial Summary Notes: (1) Pre - provision net revenue is calculated as the sum of net interest income and noninterest income less noninterest expense (excep t provision for credit losses). $ in Millions, except EPS FY 2021 FY 2021 FY 2020 Income Statement and Key Metrics Actuals Budget QoQ% Actuals YoY% Net interest income $423.0 $401.3 5% $424.2 (0%) Noninterest income 1,410.3 1,363.2 3% 1,690.5 (17%) Noninterest expenses 1,387.4 1,392.9 (0%) 1,453.8 (5%) Efficiency ratio 75.7% 78.9% 68.7% Pre-provision net revenue 1 445.9 371.6 20% 660.8 (33%) Net charge offs (recoveries) ($0.5) $88.2 (101%) $21.1 (102%) Net ACL build / (release) (57.7) 0.0 NR 75.4 (177%) Provision for (reversal of) credit losses (58.2) 88.2 (166%) 96.5 (160%) Income from continuing operations, before taxes 504.1 283.4 78% 564.4 (11%) Net income 386.1 219.3 76% 469.7 (18%) Minority interest $11.6 $14.9 (22%) 21.8 (47%) Income attributable to Hilltop $374.5 $204.5 83% $447.8 (16%) Return on average assets 2.17% 1.32% 2.88% Return on average equity 15.38% 8.90% 20.03% EPS - Diluted $4.61 $2.52 83% $5.01 (8%) EOP Shares outstanding (in thousands) 78,965 80,500 (2%) 82,185 (4%) Average assets $17,796 $16,650 7% $16,314 9% EOP Assets 18,689 16,620 12% 16,944 10% EOP Loans HFI, net 7,789 7,912 (2%) 7,544 3% EOP Deposits 12,818 10,953 17% 11,242 14% $ in Millions, except EPS FY 2021 FY 2021 FY 2020 Income Statement and Key Metrics Actuals Budget QoQ% Actuals YoY% Net interest income $423.0 $401.3 5% $424.2 (0%) Noninterest income 1,410.3 1,363.2 3% 1,690.5 (17%) Noninterest expenses 1,387.4 1,392.9 (0%) 1,453.8 (5%) Efficiency ratio 75.7% 78.9% 68.7% Pre-provision net revenue 1 445.9 371.6 20% 660.8 (33%) Net charge offs (recoveries) ($0.5) $88.2 (101%) $21.1 (102%) Net ACL build / (release) (57.7) 0.0 NR 75.4 (177%) Provision for (reversal of) credit losses (58.2) 88.2 (166%) 96.5 (160%) Income from continuing operations, before taxes 504.1 283.4 78% 564.4 (11%) Net income 386.1 219.3 76% 469.7 (18%) Minority interest $11.6 $14.9 (22%) 21.8 (47%) Income attributable to Hilltop $374.5 $204.5 83% $447.8 (16%) Return on average assets 2.17% 1.32% 2.88% Return on average equity 15.38% 8.90% 20.03% EPS - Diluted $4.61 $2.52 83% $5.01 (8%) EOP Shares outstanding (in thousands) 78,965 80,500 (2%) 82,185 (4%) Average assets $17,796 $16,650 7% $16,314 9% EOP Assets 18,689 16,620 12% 16,944 10% EOP Loans HFI, net 7,789 7,912 (2%) 7,544 3% EOP Deposits 12,818 10,953 17% 11,242 14% |
$0.4 ( $5.5 ) ($11.3) ($1.8) 1.94% 1.85% 1.51% 1.45% 1.16% 0.00% 0.50% 1.00% 1.50% 2.00% 2.50% 3.00% 3.50% 4.00% $0.0 $20.0 $40.0 $60.0 $80.0 $100.0 $120.0 $140.0 $160.0 12/31/2020 3/31/2021 6/30/2021 9/30/2021 Net Recovery Specific Reserves Collective - Economic Conditions Collective - Portfolio Changes 12/31/2021 7 Hilltop Holdings – Allowance for Credit Losses Allowance for Credit Losses at Period End 12/31/21 Reserve Composition ($ in millions) CRE $59.4 1.95% C&I 21.8 1.57% Construction 4.7 0.52% 1 - 4 SFR 4.6 0.35% Consumer 0.6 1.79% Broker Dealer 0.2 0.02% Mortgage Warehouse 0.2 0.05% Total ACL $91.4 1.16% ACL / Total Loans HFI $149.0 $144.5 $115.3 ($ in millions) $91.4 Provision for (Reversal of) Credit Losses • Applied Moody’s Analytics December 2021 Consensus scenario for economic forecast • Specific reserve release in the period was driven by a single relationship with two loans. Both loans were paid off in full during the quarter • Reserve builds (releases) will be driven by new loan production, credit performance and macroeconomic variable adjustments over time • ACL % of Loans HFI excluding Broker Dealer margin loans, mortgage warehouse and PPP loans equated to 1.37% as of December 31, 2021 ACL / Loans HFI ($ in millions) $109.5 |
2.71% 2.69% 2.62% 2.53% 2.44% 1.00% 1.50% 2.00% 2.50% 3.00% 3.50% Q4 2020 Q1 2021 Q2 2021 Q3 2021 Q4 2021 8 Hilltop Holdings – Net Interest Income & Margin Net Interest Margin 2 Net Interest Margin Rollforward ($ in millions) Net Interest Income $107.4 $105.7 $107.9 $105.1 $104.3 $80.0 $85.0 $90.0 $95.0 $100.0 $105.0 $110.0 Q4 2020 Q1 2021 Q2 2021 Q3 2021 Q4 2021 Q3 2021 2.53% Cash Increases (0.08) PPP Loans (0.05) Loans HFS (0.03) Investments 0.02 Core Deposits 0.02 Other 0.03 Q4 2021 2.44% Key Drivers & Statistics Q4'20 Q3'21 Q4'21 ($ in millions, except as noted) HTH Consolidated Average Earning Assets ($B) $15.7 $16.5 $17.0 Banking Accretion Income $5.6 $3.2 $4.7 PPP Balance (period end) $487 $133 $78 PPP Interest & Fee Income $7.8 $5.1 $2.5 Cash and Due (Avg. Balance) $1,086 $2,095 $2,628 Mortgage Loans Held for Sale (period end) $2,788 $2,109 $1,878 ($ in millions) |
9 Hilltop Holdings – Net Interest Income Rate Impacts - 8% - 4% 5% 11% -10% -5% 0% 5% 10% 15% -100 -50 +50 +100 Interest Rate Change (Basis Points) Estimated Impact on 12 - month Net Interest Income 1 Note: (1) Impact assumes instantaneous change to interest rates. Assumes interest rate floor at 1 basis point HTH Net Interest Income profile remains asset sensitive: • Variable rate loans reflect approximately 44% or $3.1 billion of bank loans HFI (excluding Mortgage Warehouse) at December 31, 2021 • $2.7 billion of variable rate loans currently at or below the floor rate levels Alternative scenario: • Asset sensitivity in +100 basis point gradual increase scenario falls to approximately 5% • Each 25 basis point increase by the Fed would positively impact NII by approximately $5 million Impact of lower fees and accretion: • PPP Fees and projected loan accretion income expected to decline by $25 – 30 million versus 2021 levels |
$297.5 $310.4 $242.0 $242.3 $192.3 $141.2 $98.6 $83.5 $116.1 $82.9 $12.1 $11.3 $10.2 $11.7 $11.8 ($2.9) ($2.8) $4.3 ($2.2) ($2.2) $447.9 $417.6 $339.9 $367.9 $284.8 Q4 2020 Q1 2021 Q2 2021 Q3 2021 Q4 2021 PrimeLending HilltopSecurities PlainsCapital Bank Corporate / Other 10 Hilltop Holdings – Noninterest Income Year - over - Year Noninterest Income ($MM) Noninterest Income Key Drivers & Statistics ($ in millions) Q4 2020 $447.9 Mortgage Production Income & Fees (105.5) Securities Related Fees & Commissions (2.4) Other Income (55.1) Q4 2021 $284.8 Q4'20 Q3'21 Q4'21 Broker Dealer TBA Lock Volume ($mm) $2,388 $1,775 $1,516 Mortgage Origination Volume ($B) $6.8 $5.6 $5.0 Net gains from mortgage loan sales (bps): Loans sold to third parties 451 359 362 Impact of loans sold to bank (3) (13) (15) As reported 448 346 347 |
$225.3 $213.8 $211.9 $213.5 $213.0 $177.0 $152.9 $131.5 $141.7 $109.1 $402.3 $366.7 $343.4 $355.2 $322.2 72.5% 70.1% 76.7% 75.1% 82.8% Q4 2020 Q1 2021 Q2 2021 Q3 2021 Q4 2021 Variable Compensation Expenses Other Than Variable Compensation Efficiency Ratio 11 Hilltop Holdings – Noninterest Expenses Year - over - Year Noninterest Expense ($MM) Noninterest Expenses and Efficiency Ratio Key Drivers & Statistics Note: (1) Efficiency Ratio is calculated as noninterest expense divided by the sum of net interest income and noninterest income. 1 ($ in millions) Q4 2020 $402.3 Compensation and Benefits (61.8) Occupancy and Equipment (1.9) Professional Services (12.0) Other Expenses (4.5) Q4 2021 $322.2 Q4'20 Q3'21 Q4'21 Banking Full-Service Branches 60 59 58 Efficiency Ratio % (Bank Only) 53.0% 48.8% 54.2% Mortgage Variable Compensation ($mm) $116.7 $88.2 $73.2 Variable Comp / Originated Volume 1.72% 1.58% 1.47% Efficiency Ratio % (PrimeLending Only) 71.1% 74.0% 83.4% Broker-Dealer Variable Compensation ($mm) $60.3 $53.5 $35.9 Compensation / Net Revenue % 58.4% 65.1% 69.1% |
39% 24% 11% 17% 0% 9% Commercial real estate Commercial and industrial Construction and land development 1-4 family residential Consumer Margin loans at Broker-Dealer $6.7 $6.5 $6.3 $6.1 $6.2 $0.4 $0.5 $0.6 $0.6 $0.7 $0.2 $0.3 $0.5 $0.7 $0.9 $0.5 $0.5 $0.3 $0.1 $0.1 $7.7 $7.8 $7.6 $7.6 $7.9 $- $1.0 $2.0 $3.0 $4.0 $5.0 $6.0 $7.0 $8.0 Q4 2020 Q1 2021 Q2 2021 Q3 2021 Q4 2021 PPP Loans 1 - 4 Family PrimeLending Retained Mortgages Broker-Dealer Loans All Other Loans 12 Notes: (1) 1 - 4 Family PrimeLending Retained Mortgages are loans purchased at par by PlainsCapital Bank from PrimeLending. These are exclusive of the 1 - 4 family residential mortgages originated through PlainsCapital Bank. The sum of the period amounts may not equal the total amounts due to rounding. Loan Mix at Period End Hilltop Holdings – Loans Key Drivers & Statistics Q4'20 Q3'21 Q4'21 Average Loans HFI Balance ($B) $7.7 $7.5 $7.7 Annualized Loan HFI Yield % 4.62% 4.33% 4.25% Gross Loans HFI by Type at 12/31/21 ($ in billions) Bank Loans HFI – Fixed vs. Variable Rate at 12/31/21 54% 40% 6% Fixed rate Variable rate at floors Variable rate not at floors 1 |
1.9x 1.8x 1.7x 1.8x 1.8x 2.05% 1.98% 1.64% 1.58% 1.28% 0.00% 0.50% 1.00% 1.50% 2.00% 2.50% 1.0x 1.2x 1.4x 1.6x 1.8x 2.0x 2.2x 2.4x 2.6x 2.8x 3.0x Q4 2020 Q1 2021 Q2 2021 Q3 2021 Q4 2021 ACL/Bank NPLs ACL/Bank Loans HFI 2,688 (564) 510 (62) (405) 0.15% - 0.03% 0.03% 0.00% - 0.01% -1.00% -0.50% 0.00% 0.50% 1.00% 1.50% 2.00% (1,000) 0 1,000 2,000 3,000 4,000 5,000 Q4 2020 Q1 2021 Q2 2021 Q3 2021 Q4 2021 ($000) NCOs NCOs/Avg. Bank Loans HFI 5.9% 5.7% 4.6% 4.1% 3.3% 0.2% 0.1% 0.2% 0.1% 0.0% 6.1% 5.7% 4.8% 4.2% 3.3% 0.0% 1.0% 2.0% 3.0% 4.0% 5.0% 6.0% 7.0% Q4 2020 Q1 2021 Q2 2021 Q3 2021 Q4 2021 % of Bank Loans Classified Special Mention 101,324 99,759 90,061 83,801 53,982 1.39% 1.36% 1.28% 1.21% 0.76% 0.00% 0.25% 0.50% 0.75% 1.00% 1.25% 1.50% 1.75% - 25,000 50,000 75,000 100,000 125,000 Q4 2020 Q1 2021 Q2 2021 Q3 2021 Q4 2021 ($000) Total NPAs Total NPAs/(Bank Loans HFI + OREO) 13 Hilltop Holdings – Asset Quality Criticized Loans Non - Performing Assets Notes: The sum of the period amounts may not equal the total amounts due to rounding. Figures represent bank asset quality me tri cs only (excludes Loans HFS and Broker Dealer Margin Loans). (1) Total NPAs included non - accrual loans, accruing TDRs, OREO and other repossessed assets. Net Charge - Offs (Recoveries) Allowance for Credit Losses 1 1 |
41% 43% 12% 4% Demand Money Market Time Other $6.2 $6.4 $6.5 $6.7 $7.2 $3.6 $4.0 $4.2 $4.4 $4.6 $0.7 $0.7 $0.7 $0.8 $0.8 $0.7 $0.6 $0.3 $0.2 $0.2 $11.2 $11.7 $11.7 $12.1 $12.8 Q4 2020 Q1 2021 Q2 2021 Q3 2021 Q4 2021 Interest-Bearing Deposits Noninterest-Bearing Deposits Broker Dealer Sweep Deposits Brokered Deposits 14 Notes: The sum of the period amounts may not equal the total amounts due to rounding. (1) Annualized. Deposit Mix at Period End Hilltop Holdings – Deposits Key Drivers & Statistics Q4'20 Q3'21 Q4'21 Total Deposits ($B)(average balance) $11.2 $11.9 $12.4 Cost of Interest-Bearing Deposits 1 0.49% 0.28% 0.22% Cost of Brokered Deposits 1 0.53% 0.33% 0.25% Cost of Total Deposits 1 0.33% 0.18% 0.14% Interest - Bearing Deposits by Type at 12/31/21 ($ in billions) |
15 Hilltop Holdings – 2022 Outlook Commentary Loan Growth (Full year averag e HFI loan growth) • 1 – 4 family loan retention $30 – $75 million per month, through first half of 2022 • FY average commercial loan growth: 2 – 5%, excluding PPP loans Deposit Growth (Full year average deposit growth) • FY average total deposits decline: 3% – 7%, excluding any additional stimulus efforts Net Interest Income • NII growth 0 – 3%, headwinds from lower PPP and accretion • Outlook assumes two rate increases by the Federal Reserve during 2022 • Purchase accounting accretion expected to decline by 50% versus 2021 levels • Loan floors and competition expected to pressure loan yields during 2022 • Modeled ‘through the cycle’ IB deposit beta of 50% Noninterest Income • Mortgage gain on sale margins continue to be pressured as volumes decline across the industry, FY average 300 – 325 bps (third party sales) • Mortgage origination volume: $17 – $20 billion Noninterest Expense • Non - variable e xpenses increase: 3% – 6% • Variable expenses will follow revenue contribution from fee businesses Provision Expense / (Reversal) • FY net charge - offs / total loans HFI: 20 – 35 basis points Effective Tax Rate (GAAP) • 22 – 24% full year basis |
Appendix 16 |
53.0% 48.4% 49.7% 48.8% 54.2% Q4 2020 Q1 2021 Q2 2021 Q3 2021 Q4 2021 3.37% 3.30% 3.19% 2.99% 2.81% Q4 2020 Q1 2021 Q2 2021 Q3 2021 Q4 2021 PlainsCapital Bank – Highlights Q4 2021 17 Efficiency Ratio 1 Notes: (1) Efficiency Ratio is calculated as noninterest expense divided by the sum of net interest income and noninterest income. Net Interest Margin Key Highlights Q4 2020 Q4 2021 FY 2020 FY 2021 ROAA 1.37% 1.44% 0.63% 1.55% Full Service Branches 60 58 60 58 Net Interest Margin 3.37% 2.81% 3.31% 3.07% Assets ($B) $13.3 $14.3 $13.3 $14.3 Summary Results ($ in millions) Q4 2020 Q4 2021 FY 2020 FY 2021 Net Interest Income $106.4 $97.2 $390.9 $406.5 Provision for (reversal of) Credit Losses (3.5) (18.5) 96.3 (58.2) Noninterest Income 12.1 11.8 41.4 45.1 Noninterest Expense 62.9 59.0 232.4 226.9 Income Before Taxes $59.2 $68.4 $103.5 $282.9 |
18 PrimeLending – Highlights Gain on Sale Overview Notes: (1) Gain on Sale calculated as net gains from sale of loans divided by sales volume. Reported Gain on Sale reflects impact of lo ans retained by PlainsCapital Bank 1 Mortgage Origination Volume $6.8 $6.2 $5.9 $5.6 $5.0 Q4 2020 Q1 2021 Q2 2021 Q3 2021 Q4 2021 448 388 364 346 347 451 398 376 359 362 Q4 2020 Q1 2021 Q2 2021 Q3 2021 Q4 2021 Reported Gain on Sale (bps) Gain on Sale of Loans Sold to Third Parties ($ in billions) Q4 2021 Summary Results ($ in millions) Q4 2020 Q4 2021 FY 2020 FY 2021 Net Interest Income (Expense) ($6.8) ($3.8) ($10.5) ($20.4) Noninterest Income 297.5 192.3 1,172.5 987.0 Noninterest Expense 206.7 157.2 753.9 731.1 Income Before Taxes $84.0 $31.3 $408.0 $235.5 Key Highlights Q4 2020 Q4 2021 FY 2020 FY 2021 Origination Volume ($mm) $6,798 $4,990 $22,970 $22,668 % Purchase 54% 71% 58% 64% Sales Volume ($mm) $6,571 $4,989 $22,514 $23,059 MSR Asset ($mm) (period end) $144 $87 $144 $87 |
HilltopSecurities – Highlights Q4 2021 19 Notes: The sum of the period amounts may not equal the total amounts due to rounding. Presented net revenue by business line may dif fer slightly from 10 - K due to grouping of certain business lines into ‘Other’. Net Revenues by Business Line Summary Results ($ in millions) Q4 2020 Q4 2021 FY 2020 FY 2021 Net Interest Income $8.9 $11.7 $39.9 $43.3 Provision for Credit Losses 0.1 (0.1) 0.2 (0.0) Noninterest Income 141.2 82.9 491.4 381.1 Noninterest Expense 115.7 93.0 415.5 380.8 Income Before Taxes $34.3 $1.7 $115.6 $43.7 Key Highlights ($ in millions) Q4 2020 Q4 2021 FY 2020 FY 2021 Compensation/Net Revenue (%) 58.4% 69.1% 58.8% 65.1% Pre-tax Margin % 22.8% 1.8% 21.8% 10.3% FDIC Insured Balances at PCB $700 $804 $700 $804 Other FDIC Insured Balances $1,893 $1,503 $1,893 $1,503 Public Finance Offerings $15,753 $14,836 $57,107 $60,293 TBA Lock Volume $2,388 $1,516 $9,075 $7,008 ($ in millions) Q4 2020 Q4 2021 FY 2020 FY 2021 Public Finance Services $33.3 $31.1 95.2 110.0 Fixed Income Services 32.0 13.7 113.5 73.3 Wealth Management Retail 24.9 26.5 97.2 108.3 Clearing Services 8.3 8.0 38.6 31.7 Securities Lending 2.4 1.9 8.5 10.7 Structured Finance 46.8 12.6 169.2 85.4 Other 2.4 0.8 9.0 3.5 Net Revenues $150.1 $94.6 $531.3 $424.5 |
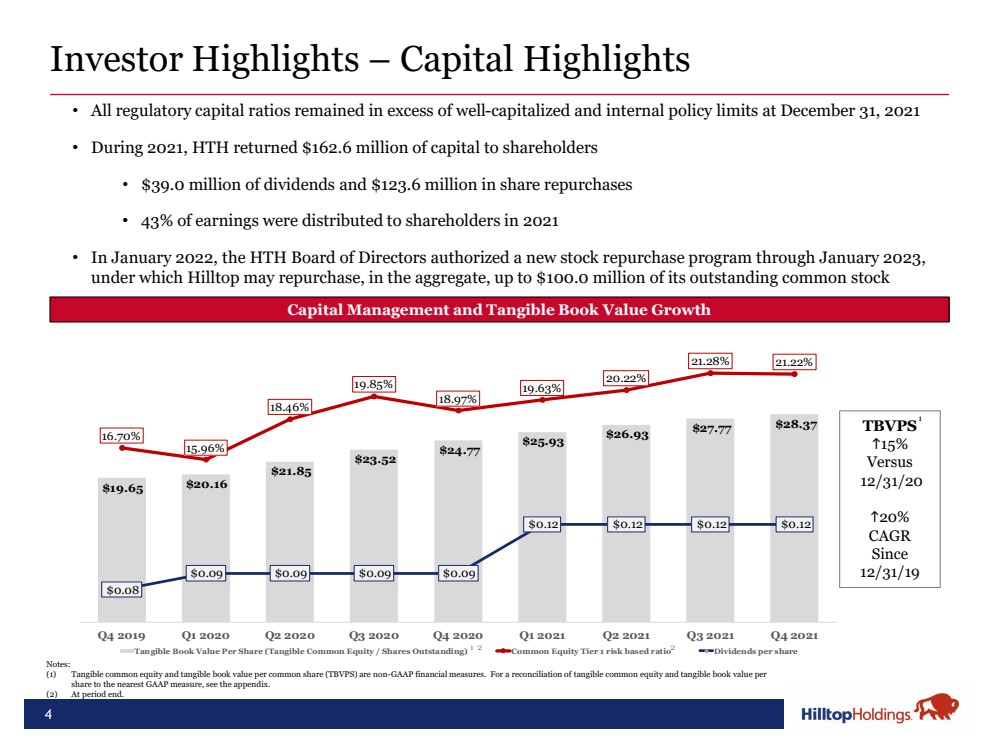
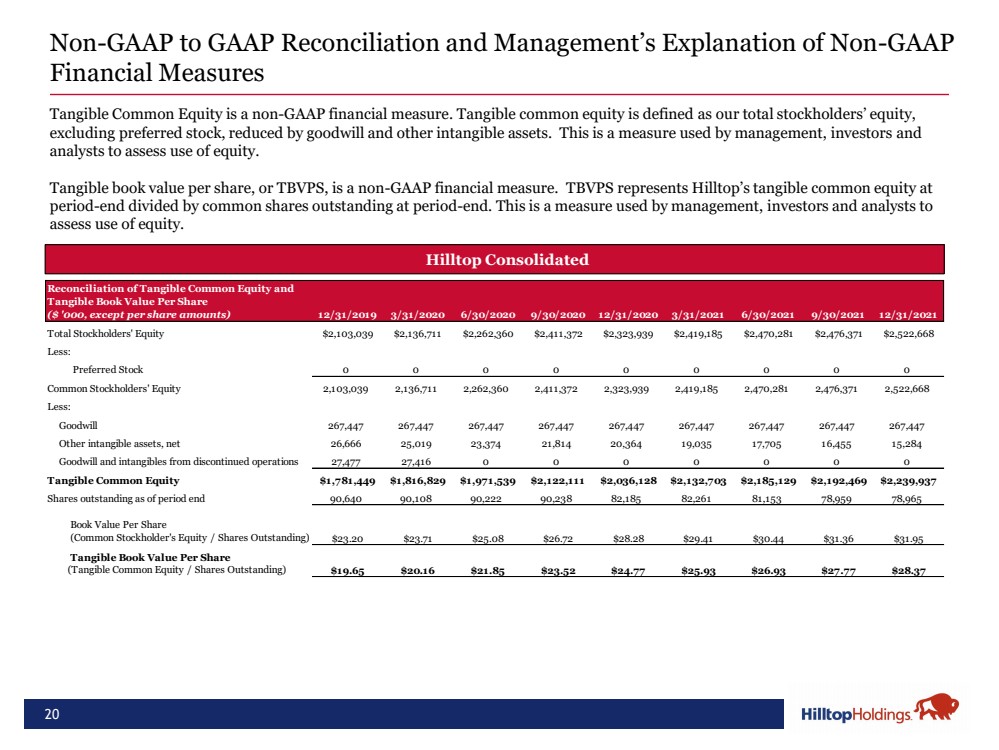
20 Non - GAAP to GAAP Reconciliation and Management’s Explanation of Non - GAAP Financial Measures • Hilltop Consolidated Tangible Common Equity is a non - GAAP financial measure. Tangible common equity is defined as our total stockholders’ equity, excluding preferred stock, reduced by goodwill and other intangible assets. This is a measure used by management, investors and analysts to assess use of equity. Tangible book value per share, or TBVPS, is a non - GAAP financial measure. TBVPS represents Hilltop’s tangible common equity at period - end divided by common shares outstanding at period - end. This is a measure used by management, investors and analysts to assess use of equity. Reconciliation of Tangible Common Equity and Tangible Book Value Per Share ($ '000, except per share amounts) 12/31/2019 3/31/2020 6/30/2020 9/30/2020 12/31/2020 3/31/2021 6/30/2021 9/30/2021 12/31/2021 Total Stockholders' Equity $2,103,039 $2,136,711 $2,262,360 $2,411,372 $2,323,939 $2,419,185 $2,470,281 $2,476,371 $2,522,668 Less: Preferred Stock 0 0 0 0 0 0 0 0 0 Common Stockholders' Equity 2,103,039 2,136,711 2,262,360 2,411,372 2,323,939 2,419,185 2,470,281 2,476,371 2,522,668 Less: Goodwill 267,447 267,447 267,447 267,447 267,447 267,447 267,447 267,447 267,447 Other intangible assets, net 26,666 25,019 23,374 21,814 20,364 19,035 17,705 16,455 15,284 Goodwill and intangibles from discontinued operations 27,477 27,416 0 0 0 0 0 0 0 Tangible Common Equity $1,781,449 $1,816,829 $1,971,539 $2,122,111 $2,036,128 $2,132,703 $2,185,129 $2,192,469 $2,239,937 Shares outstanding as of period end 90,640 90,108 90,222 90,238 82,185 82,261 81,153 78,959 78,965 Book Value Per Share (Common Stockholder's Equity / Shares Outstanding) $23.20 $23.71 $25.08 $26.72 $28.28 $29.41 $30.44 $31.36 $31.95 Tangible Book Value Per Share (Tangible Common Equity / Shares Outstanding) $19.65 $20.16 $21.85 $23.52 $24.77 $25.93 $26.93 $27.77 $28.37 |