UNITED STATES
SECURITIES AND EXCHANGE COMMISSION
Washington, D.C. 20549
FORM N-CSR
CERTIFIED SHAREHOLDER REPORT OF REGISTERED
MANAGEMENT INVESTMENT COMPANIES
Investment Company Act file number | 811-21437 | |||||||
| ||||||||
Cohen & Steers REIT and Utility Income Fund, Inc. | ||||||||
(Exact name of registrant as specified in charter) | ||||||||
| ||||||||
280 Park Avenue, 10th Floor, New York, NY |
| 10017 | ||||||
(Address of principal executive offices) |
| (Zip code) | ||||||
| ||||||||
Adam M. Derechin | ||||||||
(Name and address of agent for service) | ||||||||
| ||||||||
Registrant’s telephone number, including area code: | (212) 832-3232 |
| ||||||
| ||||||||
Date of fiscal year end: | December 31 |
| ||||||
| ||||||||
Date of reporting period: | December 31, 2007 |
| ||||||
Item 1. Reports to Stockholders.
COHEN & STEERS REIT AND UTILITY INCOME FUND, INC.
February 8, 2008
To Our Shareholders:
We are pleased to submit to you our report for the year ended December 31, 2007. The net asset value at that date was $22.13 per common share. The fund's common stock is traded on the New York Stock Exchange (NYSE) and its share price can differ from its net asset value; at year end, the fund's closing price on the NYSE was $20.11. The total return, including income, for the fund and the comparative benchmarks were:
| Six Months Ended December 31, 2007 | Year Ended December 31, 2007 | ||||||||||
| Cohen & Steers REIT and Utility Income Fund at Market Valuea | 0.46 | % | –1.24 | % | |||||||
| Cohen & Steers REIT and Utility Income Fund at Net Asset Valuea | –3.53 | % | –3.69 | % | |||||||
| FTSE NAREIT Equity REIT Indexb | –10.42 | % | –15.69 | % | |||||||
| S&P 500 Indexb | –1.37 | % | 5.49 | % | |||||||
| S&P 1500 Utilities Indexb | 8.33 | % | 16.46 | % | |||||||
| Blended Benchmark—40% FTSE NAREIT Equity REIT Index, 40% S&P 1500 Utilities Index, 20% Merrill Lynch Fixed Rate Preferred Indexb | –3.32 | % | –2.63 | % | |||||||
The performance data quoted represent past performance. Past performance is no guarantee of future results. The investment return and the principal value of an investment will fluctuate and shares, if sold, may be worth more or less than their original cost. Current performance may be lower or higher than the performance data quoted. Performance results reflect the effects of leverage, resulting from the issuance of preferred shares.
A long-term capital gain distribution of $0.45 per share was declared for shareholders of record on December 26, 2007 and was paid on December 31, 2007.
Three monthly dividends of $0.1375 per common share were declared and will be paid to common shareholders on January 31, 2008, February 29, 2008 and March 31, 2008c.
a As a closed-end investment company, the price of the fund's New York Stock Exchange-traded shares will be set by market forces and at times may deviate from the net asset value per share of the fund.
b The FTSE NAREIT Equity REIT Index is an unmanaged, market capitalization weighted index of all publicly traded REITs that invest predominantly in the equity ownership of real estate. The index is designed to reflect the performance of all publicly traded equity REITs as a whole. The S&P 500 Index is an unmanaged index of common stocks that is frequently used as a general measure of stock market performance. The S&P 1500 Utilities Index is an unmanaged market capitalization weighted index of 75 companies whose primary business involves the generation, transmission and/or distribution of electricity and/or natural gas. The Merrill Lynch Fixed Rate Preferred Index is an unmanaged index of preferred securities.
c Please note that distributions paid by the fund to shareholders are subject to recharacterization for tax purposes. The final tax treatment of these distributions is reported to shareholders after the close of the calendar year.
1
COHEN & STEERS REIT AND UTILITY INCOME FUND, INC.
Investment Review
The year was a turbulent one for REITs, which suffered a decline after four straight years of double-digit gains and seven years of positive total returns. As the year began, real estate securities continued to be buoyed by a number of factors. The economy was strong, driving growth in demand for commercial real estate. New supply of competitive commercial real estate product was relatively muted, despite real estate being in a mature stage of its cycle. Debt markets were highly liquid and accommodative of real estate M&A activity, including leveraged buyouts (LBOs). This was highlighted in January by a bidding contest for Equity Office Properties, which was acquired by The Blackstone Group in a $41 billion transaction, at a 24% premium to the market price when the offer was first made.
REITs disproportionately hit by credit woes
While real estate fundamentals did stay generally healthy through the year, concerns over subprime mortgages began to mount, resulting in a general re-pricing of risk and a dramatic widening of credit spreads in July. Commercial banks, seeking to preserve capital to offset losses from a variety of financial instruments, became reluctant to lend. Loans to finance LBOs stopped abruptly, removing a positive catalyst for the REIT market (REITs had been a prime target of private equity investors). In addition, the credit crunch increased the possibility of a U.S. economic recession, fueling worries over underlying fundamentals for real estate.
Real estate securities, which had reached an all-time high in February 2007, declined more than 20% from that peak by August. REITs were volatile over the remainder of the year, as investors reacted to monetary news (the Federal Reserve reduced interest rates from 5.25% to 4.25% between September and the end of the year) and the latest unsettling credit news.
Another strong year for utility stocks
Utilities outperformed the broad U.S. stock market by a wide margin in 2007, registering their fifth consecutive year of double-digit returns as measured by the S&P 1500 Utilities Index. Utilities securities continued to benefit from strong fundamentals—robust demand and tight supply have resulted in high power prices across the country. This has helped the group's earnings growth stay well above its historical average, given that retail demand for electricity and natural gas is relatively inelastic.
Utilities also benefited from their relatively defensive nature. Many segments of the industry operate with regulated pricing, supporting relatively stable revenues and cash flows. This proved to be an attractive feature amid tightening credit markets and concerns over the economy.
Securities of non-regulated utilities performed well as a group. These companies benefit from the opportunity to sell electricity at market prices. While their stocks can be more volatile than regulated utilities, they have been a significant beneficiary of strong energy fundamentals and high wholesale commodity prices over the past few years.
2
COHEN & STEERS REIT AND UTILITY INCOME FUND, INC.
Preferred securities suffer their worst year ever
The Merrill Lynch Fixed Rate Preferred Index had a total return of –11.3% in 2007. This represented preferreds' poorest yearly performance on record and reflected a surge in issuance. Faced with diminished capital and increased balance-sheet risk, numerous financial institutions sought to recapitalize themselves in the preferred market (driving yields up and prices down) instead of the equity market, where financial shares were trading at several-year lows. At year-end, yields on corporate and REIT preferreds —which together accounted for roughly 20% of the fund—were 7.4% and 8.5%, respectively. By comparison, the 10-year Treasury and corporate bonds, as represented by the Merrill Lynch Corporate Master Index, offered yields of 4.0% and 5.8%, respectively.
REITs weakness offsets strong utility performance
The fund had a decline in the period, as strength in utilities was more than offset by weakness in the REIT and preferred areas. Factors that hindered performance included REIT stock selection in the industrial, office, shopping center and self storage sectors; our stock selection in the hotel sector and overweight and stock selection in the health care sector (the best performing property sector in the NAREIT index in the period) aided relative return.
In the utilities portion of the fund, our non-U.S. holdings contributed positively to performance, benefiting from higher power prices in Europe. The fund's preferred securities had a collective decline, but outperformed the preferred security market broadly, which we attribute to our emphasis on higher-quality issues.
Investment Outlook
Real estate securities, which had factored in a good deal of positive news at the start of the year, ended 2007 with considerable pessimism priced into their shares. Overall, REITs were trading at an 18% discount to their underlying net asset value as of December 31, 2007, compared with a premium of 13% at the end of 2006, and compared with a historical average premium of 5%. The size of this discount suggests to us that the market is expecting at least a mild recession and perhaps a meaningful decline in property values. Our view is that the economy will slow, with some possibility of it dipping into a shallow recession, before reaccelerating as monetary actions take hold. We have already factored modest declines into property asset values due to higher cap rates, particularly for class B properties and secondary markets; but we do not expect a dramatic downturn due to strength in cash flows and fundamentals.
We believe that modest levels of employment growth stand to support demand for sectors such as offices, apartments and hotels, yet new supply is likely to be quite restrained due to the lack of credit for construction loans, which are, by their nature, more risky. Of course, ongoing credit woes could continue to hamper REITs and stocks broadly, but we believe REITs are positioned to perform well once investors sense that the worst of the credit news is behind us. In this environment, where investment opportunities are increasing due to the credit crunch, we remain highly focused on companies with strong managements, compelling long-term business models and properties in the most desirable locations.
3
COHEN & STEERS REIT AND UTILITY INCOME FUND, INC.
Supportive trends for utilities
In addition to potentially benefiting from their defensive characteristics within a slowing economy (utilities have often outperformed the broader market during periods of economic weakness), utilities in our view could continue to draw support from existing trends. Earnings growth is expected to remain at historically high levels—about three times the group's longtime average. This forecast is supported by higher prices for electricity and natural gas, amid continued strong demand, and more importantly, limited supply growth.
We believe that earnings growth will also benefit from new infrastructure investment, as utilities look to replace aging assets and expand existing networks. Regulated utilities, which account for a significant portion of the fund's holdings, earn a defined rate of rate of return on these investments. We believe that two of the most significant infrastructure opportunities are in electricity transmission and natural gas pipelines.
Regarding valuations, we believe that utility stocks remain attractive, given their strong projected earnings growth and reasonable valuations—modestly above the historical average. While we expect overall market volatility to remain high, we believe utilities offer the potential for attractive total returns over time.
Yields and diversification
We believe that the fund offers an attractive combination of diversification and income potential. Real estate and utilities securities represent two of the higher income-producing sectors of the equity market, yet have relatively low historical correlation with each other. Preferred securities, which in our view currently offer compelling yields, typically help mitigate overall volatility.
4
COHEN & STEERS REIT AND UTILITY INCOME FUND, INC.
Sincerely,
 |  | ||||||
| MARTIN COHEN | ROBERT H. STEERS | ||||||
| Co-chairman | Co-chairman | ||||||
 |  | ||||||
| ROBERT S. BECKER | WILLIAM F. SCAPELL | ||||||
| Portfolio Manager | Portfolio Manager | ||||||
 |  | ||||||
| JOSEPH M. HARVEY | THOMAS N. BOHJALIAN | ||||||
| Portfolio Manager | Portfolio Manager | ||||||
The views and opinions in the preceding commentary are as of the date stated and are subject to change. This material represents an assessment of the market environment at a specific point in time, should not be relied upon as investment advice and is not intended to predict or depict performance of any investment.
Visit Cohen & Steers online at cohenandsteers.com
For more information about any of our funds, visit cohenandsteers.com, where you'll find daily net asset values, fund fact sheets and portfolio highlights. You can also access newsletters, education tools and market updates covering REIT, utility and preferred securities sectors.
In addition, our Web site contains comprehensive information about our firm, including our most recent press releases, profiles of our senior investment professionals, and an overview of our investment approach.
5
COHEN & STEERS REIT AND UTILITY INCOME FUND, INC.
Our Leverage Strategy
(Unaudited)
While we do not attempt to predict what future interest rates will be, it has been our philosophy to utilize interest rate swap transactions to seek to reduce the interest rate risk inherent in our utilization of leverage. Our leverage strategy involves issuing auction market preferred shares (AMPS) to raise additional capital for the fund, with an objective of increasing the net income available for shareholders. As of December 31, 2007, AMPS represented 38% of the fund's managed assets. Considering that AMPS have variable dividend rates, we seek to lock in the rate on a significant portion of this additional capital through interest rate swap agreements (where we effectively convert our variable rate obligation to a fixed rate obligation for the term of the swap agreements). Specifically, we have fixed the rate on 43% of our borrowings at an average interest rate of 3.5% for an average remaining period of 1.3 years (when we first entered i nto the swaps, the average term was 5.0 years). By locking in a significant portion or our leveraging costs, we have endeavored to adequately protect the dividend-paying ability of the fund. The use of leverage increases the volatility of the fund's net asset value in both up and down markets. However, we believe that locking in a portion of the fund's leveraging costs for the term of the swap agreements partially protects the fund from any impact that an increase in short-term interest rates may have as a result of the use of leverage.
Leverage Factsa
| Leverage (as a % of managed assets) | 38 | % | |||||
| % Fixed Rate | 43 | % | |||||
| % Variable Rate | 57 | % | |||||
| Weighted Average Rate on Swaps | 3.5 | % | |||||
| Weighted Average Term on Swaps | 1.3 years | ||||||
| Current Rate on AMPSb | 5.9 | % | |||||
a Data as of December 31, 2007. Information subject to change.
b See Note 5 in Notes to Financial Statements.
6
COHEN & STEERS REIT AND UTILITY INCOME FUND, INC.
DECEMBER 31, 2007
Top Ten Holdingsa
(Unaudited)
| Security | Market Value | % of Managed Assets | |||||||||
| Duke Energy Corp. | $ | 84,373,934 | 4.0 | % | |||||||
| Public Service Enterprise Group | 74,711,520 | 3.6 | |||||||||
| Progress Energy | 67,748,727 | 3.2 | |||||||||
| Southern Co. | 66,735,250 | 3.2 | |||||||||
| Exelon Corp. | 63,385,296 | 3.0 | |||||||||
| Nationwide Health Properties | 63,100,755 | 3.0 | |||||||||
| Consolidated Edison | 57,862,825 | 2.8 | |||||||||
| Entergy Corp. | 55,624,608 | 2.7 | |||||||||
| Spectra Energy Corp. | 52,008,452 | 2.5 | |||||||||
| Ameren Corp. | 47,314,488 | 2.3 | |||||||||
a Top ten holdings are determined on the basis of the market value of individual securities held. The fund may also hold positions in other types of securities issued by the companies listed above. See the Schedule of Investments for additional details on such other positions.
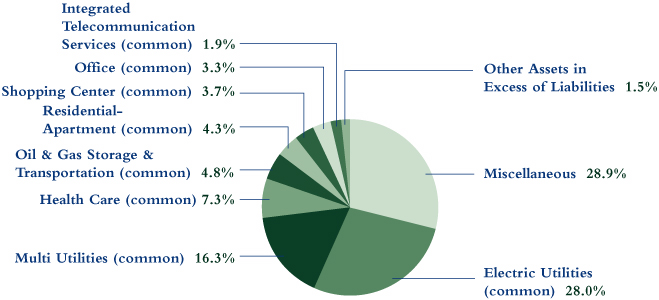
Sector Breakdown
(Based on Managed Assets)
(Unaudited)
7
COHEN & STEERS REIT AND UTILITY INCOME FUND, INC.
SCHEDULE OF INVESTMENTS
December 31, 2007
| Number of Shares | Value | ||||||||||||||
| COMMON STOCK | 126.6 | % | |||||||||||||
| ENERGY | 8.8 | % | |||||||||||||
| INTEGRATED OIL & GAS | 0.5 | % | |||||||||||||
| Duncan Energy Partners LP | 81,000 | $ | 1,768,230 | ||||||||||||
| Targa Resources Partners LP | 147,000 | 4,354,140 | |||||||||||||
| 6,122,370 | |||||||||||||||
| OIL & GAS EQUIPMENT & SERVICES | 0.2 | % | |||||||||||||
| Exterran Partners LP | 88,500 | 2,839,965 | |||||||||||||
| OIL & GAS REFINING & MARKETING | 0.4 | % | |||||||||||||
| Spectra Energy Income Fund (Canada) | 172,600 | 1,573,940 | |||||||||||||
| Spectra Energy Income Fund, 144Aa (Canada) | 475,000 | 4,331,526 | |||||||||||||
| 5,905,466 | |||||||||||||||
| OIL & GAS STORAGE & TRANSPORATION | 7.7 | % | |||||||||||||
| DCP Midstream Partners LP | 142,000 | 6,524,900 | |||||||||||||
| Energy Transfer Partners LP | 95,600 | 5,150,928 | |||||||||||||
| Enterprise Products Partners LP | 202,200 | 6,446,136 | |||||||||||||
| Kinder Morgan Energy Partners LP | 123,192 | 6,651,136 | |||||||||||||
| Magellan Midstream Partners LP | 97,900 | 4,244,944 | |||||||||||||
| SemGroup Energy Partners LP | 61,200 | 1,764,396 | |||||||||||||
| Spectra Energy Corp. | 2,014,270 | 52,008,452 | |||||||||||||
| Teekay LNG Partners LP | 69,300 | 2,056,131 | |||||||||||||
| Teekay Offshore Partners LP | 78,900 | 1,995,381 | |||||||||||||
| Williams Partners LP | 336,900 | 13,206,480 | |||||||||||||
| 100,048,884 | |||||||||||||||
| TOTAL ENERGY | 114,916,685 | ||||||||||||||
| INTEGRATED TELECOMMUNICATION SERVICES | 3.0 | % | |||||||||||||
| AT&T | 267,000 | 11,096,520 | |||||||||||||
| Citizens Communications Co. | 361,100 | 4,596,803 | |||||||||||||
| Fairpoint Communications | 731,315 | 9,521,721 | |||||||||||||
| Verizon Communications | 253,118 | 11,058,726 | |||||||||||||
| Windstream Corp. | 200,000 | 2,604,000 | |||||||||||||
| 38,877,770 | |||||||||||||||
See accompanying notes to financial statements.
8
COHEN & STEERS REIT AND UTILITY INCOME FUND, INC.
SCHEDULE OF INVESTMENTS—(Continued)
December 31, 2007
| Number of Shares | Value | ||||||||||||||
| REAL ESTATE | 41.6 | % | |||||||||||||
| DIVERSIFIED | 2.3 | % | |||||||||||||
| Colonial Properties Trust | 253,747 | $ | 5,742,295 | ||||||||||||
| iStar Financial | 382,300 | 9,958,915 | |||||||||||||
| Land Securities Group PLC (United Kingdom) | 100,300 | 3,006,838 | |||||||||||||
| Vornado Realty Trust | 136,950 | 12,044,752 | |||||||||||||
| 30,752,800 | |||||||||||||||
| HEALTH CARE | 11.8 | % | |||||||||||||
| HCP | 848,100 | 29,496,918 | |||||||||||||
| Health Care REIT | 467,500 | 20,892,575 | |||||||||||||
| Nationwide Health Properties | 2,011,500 | 63,100,755 | |||||||||||||
| Omega Healthcare Investors | 343,900 | 5,519,595 | |||||||||||||
| Senior Housing Properties Trust | 702,382 | 15,930,024 | |||||||||||||
| Ventas | 400,000 | 18,100,000 | |||||||||||||
| 153,039,867 | |||||||||||||||
| HOTEL | 2.6 | % | |||||||||||||
| DiamondRock Hospitality Co. | 940,100 | 14,082,698 | |||||||||||||
| Hospitality Properties Trust | 342,800 | 11,045,016 | |||||||||||||
| Strategic Hotels & Resorts | 547,800 | 9,164,694 | |||||||||||||
| 34,292,408 | |||||||||||||||
| INDUSTRIAL | 2.4 | % | |||||||||||||
| DCT Industrial Trust | 777,186 | 7,235,602 | |||||||||||||
| EastGroup Properties | 114,000 | 4,770,900 | |||||||||||||
| First Industrial Realty Trust | 141,700 | 4,902,820 | |||||||||||||
| ING Industrial Fund (Australia) | 4,600,335 | 10,259,886 | |||||||||||||
| Segro PLC (United Kingdom) | 434,980 | 4,069,595 | |||||||||||||
| 31,238,803 | |||||||||||||||
| MORTGAGE | 0.5 | % | |||||||||||||
| Annaly Capital Management | 324,842 | 5,905,628 | |||||||||||||
| OFFICE | 5.3 | % | |||||||||||||
| BioMed Realty Trust | 210,453 | 4,876,196 | |||||||||||||
| Boston Properties | 16,000 | 1,468,960 | |||||||||||||
See accompanying notes to financial statements.
9
COHEN & STEERS REIT AND UTILITY INCOME FUND, INC.
SCHEDULE OF INVESTMENTS—(Continued)
December 31, 2007
| Number of Shares | Value | ||||||||||||||
| Brandywine Realty Trust | 763,937 | $ | 13,697,391 | ||||||||||||
| Highwoods Properties | 382,200 | 11,229,036 | |||||||||||||
| HRPT Properties Trust | 702,295 | 5,428,740 | |||||||||||||
| ING Office Fund (Australia) | 3,472,712 | 4,939,729 | |||||||||||||
| Mack-Cali Realty Corp. | 453,400 | 15,415,600 | |||||||||||||
| Parkway Properties | 126,200 | 4,666,876 | |||||||||||||
| SL Green Realty Corp. | 80,204 | 7,495,866 | |||||||||||||
| 69,218,394 | |||||||||||||||
| OFFICE/INDUSTRIAL | 1.9 | % | |||||||||||||
| First Potomac Realty Trust | 195,867 | 3,386,540 | |||||||||||||
| Liberty Property Trust | 729,895 | 21,028,275 | |||||||||||||
| 24,414,815 | |||||||||||||||
| RESIDENTIAL—APARTMENT | 6.9 | % | |||||||||||||
| American Campus Communities | 299,300 | 8,036,205 | |||||||||||||
| Apartment Investment & Management Co.b | 522,900 | 18,160,317 | |||||||||||||
| Education Realty Trust | 467,800 | 5,258,072 | |||||||||||||
| GMH Communities Trust | 392,100 | 2,164,392 | |||||||||||||
| Home Properties | 786,387 | 35,269,457 | |||||||||||||
| Mid-America Apartment Communities | 201,600 | 8,618,400 | |||||||||||||
| UDR | 632,100 | 12,547,185 | |||||||||||||
| 90,054,028 | |||||||||||||||
| SELF STORAGE | 1.3 | % | |||||||||||||
| Extra Space Storage | 628,500 | 8,981,265 | |||||||||||||
| Sovran Self Storage | 218,600 | 8,765,860 | |||||||||||||
| 17,747,125 | |||||||||||||||
| SHOPPING CENTER | 6.0 | % | |||||||||||||
| COMMUNITY CENTER | 3.4 | % | |||||||||||||
| Cedar Shopping Centers | 571,300 | 5,844,399 | |||||||||||||
| Developers Diversified Realty Corp. | 509,200 | 19,497,268 | |||||||||||||
| Inland Real Estate Corp. | 753,500 | 10,669,560 | |||||||||||||
| Urstadt Biddle Properties—Class A | 517,500 | 8,021,250 | |||||||||||||
| 44,032,477 | |||||||||||||||
See accompanying notes to financial statements.
10
COHEN & STEERS REIT AND UTILITY INCOME FUND, INC.
SCHEDULE OF INVESTMENTS—(Continued)
December 31, 2007
| Number of Shares | Value | ||||||||||||||
| FREE STANDING | 1.7 | % | |||||||||||||
| National Retail Properties | 934,200 | $ | 21,841,596 | ||||||||||||
| REGIONAL MALL | 0.9 | % | |||||||||||||
| General Growth Properties | 210,479 | 8,667,525 | |||||||||||||
| Glimcher Realty Trust | 249,500 | 3,565,355 | |||||||||||||
| 12,232,880 | |||||||||||||||
| TOTAL SHOPPING CENTER | 78,106,953 | ||||||||||||||
| SPECIALTY | 0.6 | % | |||||||||||||
| Entertainment Properties Trust | 161,300 | 7,581,100 | |||||||||||||
| TOTAL REAL ESTATE | 542,351,921 | ||||||||||||||
| UTILITIES | 73.2 | % | |||||||||||||
| ELECTRIC UTILITIES | 45.1 | % | |||||||||||||
| American Electric Power Co. | 186,400 | 8,678,784 | |||||||||||||
| Cleco Corp. | 243,500 | 6,769,300 | |||||||||||||
| DPL | 112,900 | 3,347,485 | |||||||||||||
| Duke Energy Corp. | 4,183,140 | 84,373,934 | |||||||||||||
| E.ON AG (ADR) (Germany) | 308,096 | 21,628,339 | |||||||||||||
| Edison International | 352,000 | 18,786,240 | |||||||||||||
| Electricite de France (France) | 172,600 | 20,561,468 | |||||||||||||
| Entergy Corp. | 465,400 | 55,624,608 | |||||||||||||
| Exelon Corp. | 776,400 | 63,385,296 | |||||||||||||
| FirstEnergy Corp. | 533,000 | 38,557,220 | |||||||||||||
| Fortum Oyj (Finland) | 139,000 | 6,261,362 | |||||||||||||
| FPL Group | 346,497 | 23,485,567 | |||||||||||||
| ITC Holdings Corp. | 195,800 | 11,047,036 | |||||||||||||
| Mirant Corp.c | 91,000 | 3,547,180 | |||||||||||||
| Northeast Utilities | 234,000 | 7,326,540 | |||||||||||||
| Pepco Holdings | 990,800 | 29,060,164 | |||||||||||||
| Pinnacle West Capital Corp. | 397,500 | 16,857,975 | |||||||||||||
| PPL Corp. | 447,000 | 23,284,230 | |||||||||||||
| Progress Energy | 1,398,900 | 67,748,727 | |||||||||||||
| Scottish and Southern Energy PLC (United Kingdom) | 308,328 | 10,053,353 | |||||||||||||
| Southern Co. | 1,722,200 | 66,735,250 | |||||||||||||
| 587,120,058 | |||||||||||||||
See accompanying notes to financial statements.
11
COHEN & STEERS REIT AND UTILITY INCOME FUND, INC.
SCHEDULE OF INVESTMENTS—(Continued)
December 31, 2007
| Number of Shares | Value | ||||||||||||||
| INDEPENDENT POWER PRODUCERS & ENERGY TRADERS | 1.9 | % | |||||||||||||
| Constellation Energy Group | 162,000 | $ | 16,609,860 | ||||||||||||
| Dynegy Class Ac | 59,500 | 424,830 | |||||||||||||
| NRG Energyc | 172,000 | 7,454,480 | |||||||||||||
| 24,489,170 | |||||||||||||||
| MULTI UTILITIES | 26.2 | % | |||||||||||||
| Ameren Corp. | 872,800 | 47,314,488 | |||||||||||||
| Consolidated Edisond | 1,184,500 | 57,862,825 | |||||||||||||
| Dominion Resources | 469,400 | 22,273,030 | |||||||||||||
| DTE Energy Co. | 1,041,200 | 45,771,152 | |||||||||||||
| Integrys Energy Group | 58,300 | 3,013,527 | |||||||||||||
| NSTAR | 311,374 | 11,277,966 | |||||||||||||
| PG&E Corp. | 749,000 | 32,274,410 | |||||||||||||
| Public Service Enterprise Group | 760,500 | 74,711,520 | |||||||||||||
| RWE AG (Germany) | 50,483 | 7,085,634 | |||||||||||||
| Sempra Energy | 27,983 | 1,731,588 | |||||||||||||
| TECO Energy | 291,100 | 5,009,831 | |||||||||||||
| United Utilities PLC (United Kingdom) | 92,301 | 1,389,032 | |||||||||||||
| Vectren Corp. | 281,100 | 8,154,711 | |||||||||||||
| Xcel Energy | 1,051,200 | 23,725,584 | |||||||||||||
| 341,595,298 | |||||||||||||||
| TOTAL UTILITIES | 953,204,526 | ||||||||||||||
| TOTAL COMMON STOCK (Identified cost—$1,334,243,487) | 1,649,350,902 | ||||||||||||||
| PREFERRED SECURITIES—$25 PAR VALUE | 15.8 | % | |||||||||||||
| BANK | 0.6 | % | |||||||||||||
| BAC Capital Trust III, 7.00%, due 8/15/32, Series X | 90,000 | 2,079,000 | |||||||||||||
| Colonial Capital Trust IV, 7.875%, due 10/1/33 | 74,100 | 1,659,840 | |||||||||||||
| U.S. Bancorp, 5.843%, Series B (FRN) | 99,952 | 2,171,957 | |||||||||||||
| Wachovia Corp., 8.00% | 97,000 | 2,454,100 | |||||||||||||
| 8,364,897 | |||||||||||||||
See accompanying notes to financial statements.
12
COHEN & STEERS REIT AND UTILITY INCOME FUND, INC.
SCHEDULE OF INVESTMENTS—(Continued)
December 31, 2007
| Number of Shares | Value | ||||||||||||||
| BANK—FOREIGN | 1.1 | % | |||||||||||||
| Santander Finance Preferred, 6.80% | 300,000 | $ | 6,615,000 | ||||||||||||
| Santander Finance Preferred, 6.50%, 144Aa | 80,000 | 1,670,000 | |||||||||||||
| Santander Finance Preferred, 5.661%, Series 6 (FRN) | 280,000 | 5,292,000 | |||||||||||||
| 13,577,000 | |||||||||||||||
| ELECTRIC—INTEGRATED | 0.2 | % | |||||||||||||
| FPL Group Capital, 7.45%, due 9/1/67, Series E | 120,000 | 3,120,000 | |||||||||||||
| FINANCE—INVESTMENT BANKER/BROKER | 0.4 | % | |||||||||||||
| JP Morgan Chase Capital X, 7.00% | 100,000 | 2,360,000 | |||||||||||||
| Merrill Lynch & Co., 5.482%, Series 5 (FRN) | 155,133 | 2,714,827 | |||||||||||||
| 5,074,827 | |||||||||||||||
| INSURANCE | 1.7 | % | |||||||||||||
| LIFE/HEALTH INSURANCE | 0.2 | % | |||||||||||||
| Delphi Financial Group, 7.376%, due 5/15/37 | 129,000 | 2,379,405 | |||||||||||||
| MULTI-LINE—FOREIGN | 0.4 | % | |||||||||||||
| ING Groep N.V., 6.375% | 62,893 | 1,266,036 | |||||||||||||
| ING Groep N.V., 7.375% | 142,000 | 3,378,180 | |||||||||||||
| 4,644,216 | |||||||||||||||
| PROPERTY CASUALTY | 0.4 | % | |||||||||||||
| Berkley W R Capital Trust II, 6.75%, due 7/26/45 | 47,100 | 987,687 | |||||||||||||
| Markel Corp., 7.50%, due 8/22/46 | 200,000 | 4,822,000 | |||||||||||||
| 5,809,687 | |||||||||||||||
| PROPERTY CASUALTY—FOREIGN | 0.5 | % | |||||||||||||
| ACE Ltd., 7.80%, Series C | 140,000 | 3,346,000 | |||||||||||||
| Arch Capital Group Ltd., 8.00% | 125,000 | 3,123,750 | |||||||||||||
| 6,469,750 | |||||||||||||||
| REINSURANCE—FOREIGN | 0.2 | % | |||||||||||||
| Aspen Insurance Holdings Ltd., 7.401%, Series A | 150,000 | 3,277,500 | |||||||||||||
| TOTAL INSURANCE | 22,580,558 | ||||||||||||||
See accompanying notes to financial statements.
13
COHEN & STEERS REIT AND UTILITY INCOME FUND, INC.
SCHEDULE OF INVESTMENTS—(Continued)
December 31, 2007
| Number of Shares | Value | ||||||||||||||
| INTEGRATED TELECOMMUNICATION SERVICES | 0.4 | % | |||||||||||||
| Telephone & Data Systems, 7.60%, due 12/1/41, Series A | 230,500 | $ | 4,799,010 | ||||||||||||
| United States Cellular Corp., 7.50%, due 6/15/34 | 39,700 | 833,700 | |||||||||||||
| 5,632,710 | |||||||||||||||
| MEDIA—DIVERSIFIED SERVICES | 1.1 | % | |||||||||||||
| Comcast Corp., 6.625%, due 5/15/56 | 122,037 | 2,512,742 | |||||||||||||
| Comcast Corp., 7.00%, due 9/15/55, Series B | 451,000 | 10,120,440 | |||||||||||||
| Liberty Media Corp., 8.75%, due 2/1/30 (PPLUS) | 54,000 | 1,242,000 | |||||||||||||
| 13,875,182 | |||||||||||||||
| OIL—EXPLORATION AND PRODUCTION | 0.1 | % | |||||||||||||
| Nexen, 7.35%, due 11/1/43, Series B | 29,111 | 675,084 | |||||||||||||
| REAL ESTATE | 10.1 | % | |||||||||||||
| DIVERSIFIED | 1.8 | % | |||||||||||||
| Forest City Enterprises, 7.375%, Class A | 519,000 | 11,724,210 | |||||||||||||
| iStar Financial, 7.875%, Series E | 249,300 | 4,921,182 | |||||||||||||
| iStar Financial, 7.65%, Series G | 88,300 | 1,624,720 | |||||||||||||
| iStar Financial, 7.50%, Series I | 250,000 | 4,600,000 | |||||||||||||
| Lexington Corporate Properties Trust, 8.05%, Series B | 34,400 | 717,240 | |||||||||||||
| 23,587,352 | |||||||||||||||
| HEALTH CARE | 2.8 | % | |||||||||||||
| Health Care REIT, 7.875%, Series D | 153,536 | 3,575,854 | |||||||||||||
| Health Care REIT, 7.625%, Series F | 305,600 | 6,756,816 | |||||||||||||
| LTC Properties, 8.00%, Series F | 600,000 | 13,266,000 | |||||||||||||
| Omega Healthcare Investors, 8.375%, Series D | 500,000 | 12,385,000 | |||||||||||||
| 35,983,670 | |||||||||||||||
| HOTEL | 0.6 | % | |||||||||||||
| Ashford Hospitality Trust, 8.55%, Series A | 29,633 | 555,619 | |||||||||||||
| Equity Inns, 8.00%, Series Ce | 71,225 | 961,537 | |||||||||||||
| Host Hotels & Resorts, 8.875%, Series E | 80,000 | 2,008,000 | |||||||||||||
| LaSalle Hotel Properties, 8.00%, Series E | 170,000 | 3,247,000 | |||||||||||||
| Strategic Hotels & Resorts, 8.25%, Series B | 90,800 | 1,747,900 | |||||||||||||
| 8,520,056 | |||||||||||||||
See accompanying notes to financial statements.
14
COHEN & STEERS REIT AND UTILITY INCOME FUND, INC.
SCHEDULE OF INVESTMENTS—(Continued)
December 31, 2007
| Number of Shares | Value | ||||||||||||||
| OFFICE | 2.6 | % | |||||||||||||
| Alexandria Real Estate Equities, 8.375%, Series C | 374,250 | $ | 9,824,062 | ||||||||||||
| Brandywine Realty Trust, 7.50%, Series C | 177,410 | 3,626,260 | |||||||||||||
| Kilroy Realty Corp., 7.80%, Series E | 99,500 | 2,238,750 | |||||||||||||
| Maguire Properties, 7.625%, Series A | 196,240 | 2,735,586 | |||||||||||||
| SL Green Realty Corp., 7.625%, Series C | 424,500 | 9,653,130 | |||||||||||||
| SL Green Realty Corp., 7.875%, Series D | 227,650 | 5,201,803 | |||||||||||||
| 33,279,591 | |||||||||||||||
| OFFICE/INDUSTRIAL | 0.6 | % | |||||||||||||
| PS Business Parks, 7.00%, Series H | 55,959 | 1,096,796 | |||||||||||||
| PS Business Parks, 6.875%, Series I | 245,000 | 4,704,000 | |||||||||||||
| PS Business Parks, 7.95%, Series K | 65,000 | 1,430,650 | |||||||||||||
| 7,231,446 | |||||||||||||||
| RESIDENTIAL—APARTMENT | 0.4 | % | |||||||||||||
| Apartment Investment & Management Co., 9.375%, Series G | 35,000 | 854,000 | |||||||||||||
| Apartment Investment & Management Co., 8.00%, Series T | 138,400 | 2,884,256 | |||||||||||||
| Apartment Investment & Management Co., 8.00%, Series V | 47,200 | 969,016 | |||||||||||||
| Apartment Investment & Management Co., 7.875%, Series Y | 34,000 | 681,020 | |||||||||||||
| 5,388,292 | |||||||||||||||
| SHOPPING CENTER | 1.3 | % | |||||||||||||
| COMMUNITY CENTER | 1.0 | % | |||||||||||||
| Cedar Shopping Centers, 8.875%, Series A | 137,500 | 3,231,250 | |||||||||||||
| Developers Diversified Realty Corp., 7.50%, Series I | 300,700 | 6,236,518 | |||||||||||||
| Kimco Realty Corp., 7.75%, Series G | 88,700 | 2,027,682 | |||||||||||||
| Saul Centers, 8.00%, Series A | 96,300 | 2,378,610 | |||||||||||||
| 13,874,060 | |||||||||||||||
| REGIONAL MALL | 0.3 | % | |||||||||||||
| CBL & Associates Properties, 7.75%, Series C | 114,710 | 2,523,620 | |||||||||||||
| CBL & Associates Properties, 7.375%, Series D | 60,000 | 1,176,000 | |||||||||||||
| 3,699,620 | |||||||||||||||
| TOTAL SHOPPING CENTER | 17,573,680 | ||||||||||||||
| TOTAL REAL ESTATE | 131,564,087 | ||||||||||||||
See accompanying notes to financial statements.
15
COHEN & STEERS REIT AND UTILITY INCOME FUND, INC.
SCHEDULE OF INVESTMENTS—(Continued)
December 31, 2007
| Number of Shares | Value | ||||||||||||||
| UTILITIES—ELECTRIC UTILITIES | 0.1 | % | |||||||||||||
| Entergy Corp., 7.625% ($50 par value) | 24,800 | $ | 1,779,400 | ||||||||||||
| TOTAL PREFERRED SECURITIES—$25 PAR VALUE (Identified cost—$233,978,086) | 206,243,745 | ||||||||||||||
| PREFERRED SECURITIES—CAPITAL SECURITIES | 11.3 | % | |||||||||||||
| AUTO—FOREIGN | 0.6 | % | |||||||||||||
| Porsche International Finance PLC, 7.20%, due 2/28/49 | 8,000,000 | 7,998,000 | |||||||||||||
| BANK | 1.1 | % | |||||||||||||
| Astoria Capital Trust I, 9.75%, due 11/1/29, Series B | 3,000,000 | 3,127,785 | |||||||||||||
| CBG Florida REIT Corp., 7.114%, due 2/15/49, 144Aa | 3,000,000 | 2,792,169 | |||||||||||||
| Sovereign Capital Trust VI, 7.908%, due 6/13/36 | 6,415,000 | 6,218,181 | |||||||||||||
| Washington Mutual Preferred Funding Cayman, 7.25%, due 3/29/49, Series A-1, 144Aa | 3,000,000 | 1,973,502 | |||||||||||||
| 14,111,637 | |||||||||||||||
| BANK—FOREIGN | 0.5 | % | |||||||||||||
| Credit Agricole SA/London, 6.637%, due 12/31/49, 144Aa | 2,000,000 | 1,858,650 | |||||||||||||
| Royal Bank of Scotland Group PLC, 6.99%, due 10/29/49, 144Aa | 2,000,000 | 1,997,468 | |||||||||||||
| Standard Chartered PLC, 7.014%, due 12/30/49, 144Aa | 2,500,000 | 2,374,198 | |||||||||||||
| 6,230,316 | |||||||||||||||
| ELECTRIC | 1.1 | % | |||||||||||||
| MULTI UTILITIES | 0.7 | % | |||||||||||||
| Dominion Resources, 7.50%, due 6/30/66, Series A | 5,440,000 | 5,386,650 | |||||||||||||
| Dominion Resources Capital Trust I, 7.83%, due 12/1/27 | 2,000,000 | 2,091,428 | |||||||||||||
| Puget Sound Energy, 6.974%, due 6/1/67, Series Ae | 2,000,000 | 1,844,230 | |||||||||||||
| 9,322,308 | |||||||||||||||
| UTILITIES | 0.4 | % | |||||||||||||
| DPL Capital Trust II, 8.125%, due 9/1/31 | 4,000,000 | 4,684,876 | |||||||||||||
| TOTAL ELECTRIC | 14,007,184 | ||||||||||||||
| FINANCE | 2.1 | % | |||||||||||||
| CREDIT CARD | 0.3 | % | |||||||||||||
| Capital One Capital III, 7.686%, due 8/15/36 | 4,500,000 | 3,668,395 | |||||||||||||
See accompanying notes to financial statements.
16
COHEN & STEERS REIT AND UTILITY INCOME FUND, INC.
SCHEDULE OF INVESTMENTS—(Continued)
December 31, 2007
| Number of Shares | Value | ||||||||||||||
| DIVERSIFIED FINANCIAL SERVICES | 1.5 | % | |||||||||||||
| Citigroup Capital XXI, 8.30%, due 12/21/57 | 2,500,000 | $ | 2,617,885 | ||||||||||||
| Old Mutual Capital Funding, 8.00%, (Eurobond) | 15,450,000 | 15,493,260 | |||||||||||||
| Webster Capital Trust IV, 7.65%, due 6/15/37 | 2,000,000 | 1,695,272 | |||||||||||||
| 19,806,417 | |||||||||||||||
| INVESTMENT BANKER/BROKER | 0.3 | % | |||||||||||||
| JP Morgan Chase Capital XVIII, 6.95%, due 8/17/36, Series R | 2,000,000 | 1,905,406 | |||||||||||||
| JP Morgan Chase Capital XXV, 6.80%, due 10/1/37, Series Y | 2,000,000 | 1,928,918 | |||||||||||||
| 3,834,324 | |||||||||||||||
| TOTAL FINANCE | 27,309,136 | ||||||||||||||
| FOOD | 0.6 | % | |||||||||||||
| Dairy Farmers of America, 7.875%, 144Aa,e,f | 42,500 | 3,792,700 | |||||||||||||
| Gruma S.A., 7.75%, due 12/29/49, 144Aa | 3,500,000 | 3,403,750 | |||||||||||||
| 7,196,450 | |||||||||||||||
| GAS UTILITIES | 0.7 | % | |||||||||||||
| Southern Union Co., 7.20%, due 11/1/66 | 9,800,000 | 9,688,084 | |||||||||||||
| INSURANCE | 3.1 | % | |||||||||||||
| FINANCIAL GUARANTEE | 0.1 | % | |||||||||||||
| Security Capital Assurance Ltd., 6.88%, due 6/30/49, Series Af | 3,700,000 | 1,554,000 | |||||||||||||
| LIFE/HEALTH INSURANCE | 1.3 | % | |||||||||||||
| Liberty Mutual Group, 7.00%, due 3/15/37, 144Aa | 2,000,000 | 1,816,012 | |||||||||||||
| Liberty Mutual Group, 7.50%, due 8/15/36, 144Aa | 1,750,000 | 1,712,524 | |||||||||||||
| Liberty Mutual Group, 7.80%, due 3/15/37, 144Aa | 8,000,000 | 7,135,000 | |||||||||||||
| Liberty Mutual Insurance, 7.697%, due 10/15/97, 144Aa | 7,000,000 | 6,581,631 | |||||||||||||
| 17,245,167 | |||||||||||||||
| MULTI-LINE | 1.3 | % | |||||||||||||
| AFC Capital Trust I, 8.207%, due 2/3/27, Series Be | 9,000,000 | 8,624,745 | |||||||||||||
| Catlin Insurance Co., 7.249%, due 12/1/49, 144Aa | 4,000,000 | 3,663,056 | |||||||||||||
| Metlife Capital Trust IV, 7.875%, due 12/15/37, 144Aa | 4,000,000 | 4,087,328 | |||||||||||||
| 16,375,129 | |||||||||||||||
See accompanying notes to financial statements.
17
COHEN & STEERS REIT AND UTILITY INCOME FUND, INC.
SCHEDULE OF INVESTMENTS—(Continued)
December 31, 2007
| Number of Shares | Value | ||||||||||||||
| PROPERTY CASUALTY | 0.3 | % | |||||||||||||
| Progressive Corp. (The), 6.70%, due 6/15/37 | 3,000,000 | $ | 2,789,835 | ||||||||||||
| White Mountains Re Group Ltd., 7.506%, due 5/29/49, 144Aa | 2,000,000 | 1,794,608 | |||||||||||||
| 4,584,443 | |||||||||||||||
| REINSURANCE | 0.1 | % | |||||||||||||
| PartnerRe Finance II, 6.44%, due 12/1/66 | 2,000,000 | 1,762,034 | |||||||||||||
| TOTAL INSURANCE | 41,520,773 | ||||||||||||||
| OIL & GAS STORAGE & TRANSPORTATION | 0.6 | % | |||||||||||||
| Enterprise Products Operating LP, 8.375%, due 8/1/66 | 3,500,000 | 3,588,890 | |||||||||||||
| PPL Capital Funding, 6.70%, due 3/30/67, Series A | 5,000,000 | 4,608,160 | |||||||||||||
| 8,197,050 | |||||||||||||||
| OIL—EXPLORATION AND PRODUCTION | 0.9 | % | |||||||||||||
| Pemex Project Funding Master Trust, 7.75%, due 9/28/49 | 11,500,000 | 11,629,375 | |||||||||||||
| TOTAL PREFERRED SECURITIES—CAPITAL SECURITIES (Identified cost—$157,356,183) | 147,888,005 | ||||||||||||||
| Principal Amount | |||||||||||||||
| CORPORATE BONDS | 4.8 | % | |||||||||||||
| INDEPENDENT POWER PRODUCER | 0.1 | % | |||||||||||||
| NRG Energy, 7.375%, due 1/15/17 | $ | 2,000,000 | 1,955,000 | ||||||||||||
| INTEGRATED TELECOMMUNICATION SERVICES | 1.9 | % | |||||||||||||
| Citizens Communications Co., 7.875%, due 1/15/27 | 2,000,000 | 1,915,000 | |||||||||||||
| Citizens Communications Co., 9.00%, due 8/15/31 | 14,500,000 | 14,536,250 | |||||||||||||
| Embarq Corp., 7.995%, due 6/1/36 | 8,000,000 | 8,455,072 | |||||||||||||
| 24,906,322 | |||||||||||||||
| MEDIA | 1.4 | % | |||||||||||||
| Cablevision Systems Corp., 8.00%, due 4/15/12 | 4,150,000 | 4,046,250 | |||||||||||||
| CSC Holdings, 7.625%, due 7/15/18 | 1,000,000 | 923,750 | |||||||||||||
| Rogers Cable, 8.75%, due 5/1/32 | 10,430,000 | 13,145,315 | |||||||||||||
| 18,115,315 | |||||||||||||||
| OIL & GAS EXPLORATION & PRODUCTION | 0.5 | % | |||||||||||||
| Kerr-McGee Corp., 7.875%, due 9/15/31 | 6,000,000 | 7,175,184 | |||||||||||||
See accompanying notes to financial statements.
18
COHEN & STEERS REIT AND UTILITY INCOME FUND, INC.
SCHEDULE OF INVESTMENTS—(Continued)
December 31, 2007
| Principal Amount | Value | ||||||||||||||
| OIL & GAS STORAGE & TRANSPORTATION | 0.3 | % | |||||||||||||
| Williams Cos. (The), 7.75%, due 6/15/31 | $ | 3,000,000 | 3,300,000 | ||||||||||||
| PIPELINES | 0.2 | % | |||||||||||||
| Enbridge Energy Partners LP, 8.05%, due 10/1/37 | 2,000,000 | 1,978,550 | |||||||||||||
| REAL ESTATE | 0.4 | % | |||||||||||||
| BF Saul REIT, 7.50%, due 3/1/14 | 5,000,000 | 4,625,000 | |||||||||||||
| TOTAL CORPORATE BONDS (Identified cost—$60,504,383) | 62,055,371 | ||||||||||||||
| COMMERCIAL PAPER | 2.9 | % | |||||||||||||
| State Street Boston, 2.00%, due 1/2/08 (Identified cost—$37,222,932) | 37,225,000 | 37,222,932 | |||||||||||||
| TOTAL INVESTMENTS (Identified cost—$1,823,305,071) | 161.4 | % | 2,102,760,955 | ||||||||||||
| LIABILITIES IN EXCESS OF OTHER ASSETS | (0.4 | )% | (5,281,410 | ) | |||||||||||
| LIQUIDATION VALUE OF PREFERRED SHARES | (61.0 | )% | (795,000,000 | ) | |||||||||||
| NET ASSETS APPLICABLE TO COMMON SHARES (Equivalent to $22.13 per share based on 58,858,135 shares of common stock outstanding) | 100.0 | % | $ | 1,302,479,545 | |||||||||||
See accompanying notes to financial statements.
19
COHEN & STEERS REIT AND UTILITY INCOME FUND, INC.
SCHEDULE OF INVESTMENTS—(Continued)
December 31, 2007
Glossary of Portfolio Abbreviations
ADR American Depositary Receipt
FRN Floating Rate Note
PPLUS Preferred Plus Trust
REIT Real Estate Investment Trust
Note: Percentages indicated are based on the net assets applicable to common shares of the fund.
a Resale is restricted to qualified institutional investors. Aggregate holdings equal 3.9% of net assets applicable to common shares.
b 34,900 shares segregated as collateral for interest rate swap transactions.
c Non-income producing security.
d 110,000 shares segregated as collateral for interest rate swap transactions.
e Illiquid security. Aggregate holdings equal 1.2% of net assets applicable to common shares.
f Fair valued security. Aggregate holdings equal 0.4% of net assets applicable to common shares.
See accompanying notes to financial statements.
20
COHEN & STEERS REIT AND UTILITY INCOME FUND, INC.
SCHEDULE OF INVESTMENTS—(Continued)
December 31, 2007
Interest rate swaps outstanding at December 31, 2007 are as follows:
| Counterparty | Notional Amount | Fixed Rate Payable | Floating Ratea (reset monthly) Receivable | Termination Date | Unrealized Appreciation/ (Depreciation) | ||||||||||||||||||
| Merrill Lynch Derivative Products AG | $ | 46,000,000 | 3.228 | % | 4.845 | % | March 29, 2008 | $ | 164,400 | ||||||||||||||
| Merrill Lynch Derivative Products AG | $ | 34,000,000 | 3.535 | % | 4.896 | % | April 23, 2008 | 126,225 | |||||||||||||||
| Merrill Lynch Derivative Products AG | $ | 46,000,000 | 3.415 | % | 4.845 | % | March 29, 2009 | 254,321 | |||||||||||||||
| Merrill Lynch Derivative Products AG | $ | 46,000,000 | 3.461 | % | 4.845 | % | March 29, 2010 | 283,702 | |||||||||||||||
| Royal Bank of Canada | $ | 68,000,000 | 2.990 | % | 4.865 | % | March 26, 2009 | 740,548 | |||||||||||||||
| UBS AG | $ | 34,000,000 | 3.440 | % | 4.965 | % | April 19, 2008 | 142,484 | |||||||||||||||
| UBS AG | $ | 34,000,000 | 4.060 | % | 4.965 | % | April 19, 2010 | (222,809 | ) | ||||||||||||||
| UBS AG | $ | 34,000,000 | 4.173 | % | 4.855 | % | April 28, 2010 | (317,361 | ) | ||||||||||||||
| $ | 1,171,510 | ||||||||||||||||||||||
a Based on LIBOR (London Interbank Offered Rate). Represents rates in effect at December 31, 2007.
See accompanying notes to financial statements.
21
COHEN & STEERS REIT AND UTILITY INCOME FUND, INC.
STATEMENT OF ASSETS AND LIABILITIES
December 31, 2007
| ASSETS: | |||||||
| Investments in securities, at value (Identified cost—$1,823,305,071) | $ | 2,102,760,955 | |||||
| Cash | 204,819 | ||||||
| Dividends and interest receivable | 10,856,133 | ||||||
| Unrealized appreciation on interest rate swap transactions | 1,711,680 | ||||||
| Receivable for investment securities sold | 1,140,227 | ||||||
| Other assets | 41,876 | ||||||
| Total Assets | 2,116,715,690 | ||||||
| LIABILITIES: | |||||||
| Payable for investment securities purchased | 9,756,074 | ||||||
| Payable for dividends declared on common shares | 5,129,095 | ||||||
| Payable for dividends declared on preferred shares | 2,162,519 | ||||||
| Payable for investment management fees | 1,184,156 | ||||||
| Unrealized depreciation on interest rate swap transactions | 540,170 | ||||||
| Payable for administration fees | 78,901 | ||||||
| Payable for directors' fees | 4,099 | ||||||
| Other liabilities | 381,131 | ||||||
| Total Liabilities | 19,236,145 | ||||||
| LIQUIDATION VALUE OF PREFERRED SHARES | 795,000,000 | ||||||
| TOTAL NET ASSETS APPLICABLE TO COMMON SHARES | $ | 1,302,479,545 | |||||
| NET ASSETS APPLICABLE TO COMMON SHARES consist of: | |||||||
| Common Stock ($0.001 par value, 58,858,135 shares issued and outstanding) | $ | 1,026,146,757 | |||||
| Dividends in excess of net investment income | (4,240,392 | ) | |||||
| Accumulated net realized loss | (57,158 | ) | |||||
| Net unrealized appreciation | 280,630,338 | ||||||
| $ | 1,302,479,545 | ||||||
| NET ASSET VALUE PER COMMON SHARE: | |||||||
| ($1,302,479,545 ÷ 58,858,135 shares outstanding) | $ | 22.13 | |||||
| MARKET PRICE PER COMMON SHARE | $ | 20.11 | |||||
| MARKET PRICE DISCOUNT TO NET ASSET VALUE PER COMMON SHARE | (9.13 | )% | |||||
See accompanying notes to financial statements.
22
COHEN & STEERS REIT AND UTILITY INCOME FUND, INC.
STATEMENT OF OPERATIONS
For the Year Ended December 31, 2007
| Investment Income: | |||||||
| Dividend income (net of $506,341 of foreign withholding tax) | $ | 81,667,630 | |||||
| Interest income | 15,998,293 | ||||||
| Total Income | 97,665,923 | ||||||
| Expenses: | |||||||
| Investment management fees | 19,026,873 | ||||||
| Preferred remarketing fee | 1,972,194 | ||||||
| Administration fees | 1,245,059 | ||||||
| Custodian fees and expenses | 250,958 | ||||||
| Professional fees | 238,497 | ||||||
| Shareholder reporting expenses | 227,863 | ||||||
| Directors' fees and expenses | 53,735 | ||||||
| Transfer agent fees and expenses | 26,040 | ||||||
| Miscellaneous | 179,192 | ||||||
| Total Expenses | 23,220,411 | ||||||
| Reduction of Expenses | (4,476,911 | ) | |||||
| Net Expenses | 18,743,500 | ||||||
| Net Investment Income | 78,922,423 | ||||||
| Net Realized and Unrealized Gain (Loss): | |||||||
| Net realized gain (loss) on: | |||||||
| Investments | 32,606,648 | ||||||
| Foreign currency transactions | (68,028 | ) | |||||
| Interest rate swap transactions | 6,451,659 | ||||||
| Net realized gain | 38,990,279 | ||||||
| Net change in unrealized appreciation (depreciation) on: | |||||||
| Investments | (128,786,762 | ) | |||||
| Foreign currency translations | 3,044 | ||||||
| Interest rate swap transactions | (10,018,825 | ) | |||||
| Net change in unrealized appreciation (depreciation) | (138,802,543 | ) | |||||
| Net realized and unrealized loss | (99,812,264 | ) | |||||
| Net Decrease in Net Assets Resulting from Operations | (20,889,841 | ) | |||||
| Less Dividends and Distributions to Preferred Shareholders | (42,768,598 | ) | |||||
| Net Decrease in Net Assets from Operations Applicable to Common Shares | $ | (63,658,439 | ) | ||||
See accompanying notes to financial statements.
23
COHEN & STEERS REIT AND UTILITY INCOME FUND, INC.
STATEMENT OF CHANGES IN NET ASSETS
| For the Year Ended December 31, 2007 | For the Year Ended December 31, 2006 | ||||||||||
| Change in Net Assets Applicable to Common Shares: | |||||||||||
| From Operations: | |||||||||||
| Net investment income | $ | 78,922,423 | $ | 78,650,786 | |||||||
| Net realized gain | 38,990,279 | 72,444,479 | |||||||||
| Net change in unrealized appreciation (depreciation) | (138,802,543 | ) | 255,409,943 | ||||||||
| Net increase (decrease) in net assets resulting from operations | (20,889,841 | ) | 406,505,208 | ||||||||
| Less Dividends and Distributions to Preferred Shareholders from: | |||||||||||
| Net investment income | (32,007,551 | ) | (19,018,097 | ) | |||||||
| Net realized gain on investments | (10,761,047 | ) | (15,258,474 | ) | |||||||
| Total dividends and distributions to preferred shareholders | (42,768,598 | ) | (34,276,571 | ) | |||||||
| Net increase (decrease) in net assets from operations applicable to common shares | (63,658,439 | ) | 372,228,637 | ||||||||
| Less Dividends and Distributions to Common Shareholders from: | |||||||||||
| Net investment income | (58,279,954 | ) | (66,563,658 | ) | |||||||
| Net realized gain on investments | (19,130,750 | ) | (51,082,718 | ) | |||||||
| Tax return of capital | (39,569,854 | ) | (20,817,396 | ) | |||||||
| Total dividends and distributions to common shareholders | (116,980,558 | ) | (138,463,772 | ) | |||||||
| Capital Stock Transactions: | |||||||||||
| Decrease in net assets from underwriting commissions and offering expenses from issuance of preferred shares | (1,184,000 | ) | (855,487 | ) | |||||||
| Total increase (decrease) in net assets applicable to common shares | (181,822,997 | ) | 232,909,378 | ||||||||
| Net Assets Applicable to Common Shares: | |||||||||||
| Beginning of year | 1,484,302,542 | 1,251,393,164 | |||||||||
| End of yeara | $ | 1,302,479,545 | $ | 1,484,302,542 | |||||||
a Includes dividends in excess of net investment income of $4,240,392 and $2,298,808, respectively.
See accompanying notes to financial statements.
24
COHEN & STEERS REIT AND UTILITY INCOME FUND, INC.
FINANCIAL HIGHLIGHTS
The following table includes selected data for a common share outstanding throughout each period and other performance information derived from the financial statements. It should be read in conjunction with the financial statements and notes thereto.
| For the Year Ended December 31, | For the Period January 30, 2004a through | ||||||||||||||||||
| Per Share Operating Performance: | 2007 | 2006 | 2005 | December 31, 2004 | |||||||||||||||
| Net asset value per common share, beginning of period | $ | 25.22 | $ | 21.26 | $ | 21.51 | $ | 19.10 | |||||||||||
| Income from investment operations: | |||||||||||||||||||
| Net investment income | 1.50 | 1.43 | 1.17 | b | 0.90 | ||||||||||||||
| Net realized and unrealized gain (loss) | (1.85 | ) | 5.47 | 0.57 | 2.97 | ||||||||||||||
| Total income (loss) from investment operations | (0.35 | ) | 6.90 | 1.74 | 3.87 | ||||||||||||||
| Less dividends and distributions to preferred shareholders from: | |||||||||||||||||||
| Net investment income | (0.55 | ) | (0.32 | ) | (0.25 | ) | (0.12 | ) | |||||||||||
| Net realized gain on investments | (0.18 | ) | (0.26 | ) | (0.12 | ) | (0.01 | ) | |||||||||||
| Total dividends and distributions to preferred shareholders | (0.73 | ) | (0.58 | ) | (0.37 | ) | (0.13 | ) | |||||||||||
| Total from investment operations applicable to common shares | (1.08 | ) | 6.32 | 1.37 | 3.74 | ||||||||||||||
| Less: Offering costs charged to paid-in capital—preferred shares | (0.02 | ) | (0.01 | ) | (0.02 | ) | (0.12 | ) | |||||||||||
| Offering costs charged to paid-in capital—common shares | — | — | — | (0.04 | ) | ||||||||||||||
| Dilutive effect of common share offering | — | — | — | (0.12 | ) | ||||||||||||||
| Preferred and common share offering cost adjustment | — | — | 0.00 | c | — | ||||||||||||||
| Total offering costs | (0.02 | ) | (0.01 | ) | (0.02 | ) | (0.28 | ) | |||||||||||
| Less dividends and distributions to common shareholders from: | |||||||||||||||||||
| Net investment income | (0.99 | ) | (1.13 | ) | (0.93 | ) | (0.79 | ) | |||||||||||
| Net realized gain on investments | (0.33 | ) | (0.87 | ) | (0.46 | ) | (0.03 | ) | |||||||||||
| Tax return of capital | (0.67 | ) | (0.35 | ) | (0.21 | ) | (0.23 | ) | |||||||||||
| Total dividends and distributions to common shareholders | (1.99 | ) | (2.35 | ) | (1.60 | ) | (1.05 | ) | |||||||||||
| Net increase (decrease) in net asset value per common share | (3.09 | ) | 3.96 | (0.25 | ) | 2.41 | |||||||||||||
| Net asset value, per common share, end of period | $ | 22.13 | $ | 25.22 | $ | 21.26 | $ | 21.51 | |||||||||||
| Market value, per common share, end of period | $ | 20.11 | $ | 22.35 | $ | 17.66 | $ | 18.76 | |||||||||||
| Net asset value total returne | –3.69 | % | 32.65 | % | 7.65 | % | 19.46 | %d | |||||||||||
| Market value returne | –1.24 | % | 41.52 | % | 2.53 | % | –0.50 | %d | |||||||||||
See accompanying notes to financial statements.
25
COHEN & STEERS REIT AND UTILITY INCOME FUND, INC.
FINANCIAL HIGHLIGHTS—(Continued)
| For the Year Ended December 31, | For the Period January 30, 2004a through | ||||||||||||||||||
| Ratios/Supplemental Data: | 2007 | 2006 | 2005 | December 31, 2004 | |||||||||||||||
| Net assets applicable to common shares, end of period (in millions) | $ | 1,302.5 | $ | 1,484.3 | $ | 1,251.4 | $ | 1,266.2 | |||||||||||
| Ratio of expenses to average daily net assets applicable to common shares (before expense reduction)g | 1.60 | % | 1.57 | % | 1.57 | % | 1.49 | %f | |||||||||||
| Ratio of expenses to average daily net assets applicable to common shares (net of expense reduction)g | 1.29 | % | 1.27 | % | 1.27 | % | 1.21 | %f | |||||||||||
| Ratio of net investment income to average daily net assets applicable to common shares (before expense reduction)g | 5.12 | % | 5.47 | % | 5.15 | % | 5.40 | %f | |||||||||||
| Ratio of net investment income to average daily net assets applicable to common shares (net of expense reduction)g | 5.42 | % | 5.77 | % | 5.45 | % | 5.68 | %f | |||||||||||
| Ratio of expenses to average daily managed assets (before expense reduction)g,h | 1.04 | % | 1.04 | % | 1.04 | % | 1.04 | %f | |||||||||||
| Ratio of expenses to average daily managed assets (net of expense reduction)g,h | 0.84 | % | 0.84 | % | 0.84 | % | 0.84 | %f | |||||||||||
| Portfolio turnover rate | 22 | % | 24 | % | 20 | % | 18 | %d | |||||||||||
| Preferred Shares: | |||||||||||||||||||
| Liquidation value, end of period (in 000's) | $ | 795,000 | $ | 700,000 | $ | 645,000 | $ | 570,000 | |||||||||||
| Total shares outstanding (in 000's) | 32 | 28 | 26 | 23 | |||||||||||||||
| Asset coverage ratio | 264 | % | 312 | % | 294 | % | 322 | % | |||||||||||
| Asset coverage per share | $ | 65,958 | $ | 78,011 | $ | 73,504 | $ | 80,534 | |||||||||||
| Liquidation preference per share | $ | 25,000 | $ | 25,000 | $ | 25,000 | $ | 25,000 | |||||||||||
| Average market value per sharei | $ | 25,000 | $ | 25,000 | $ | 25,000 | $ | 25,000 | |||||||||||
a Commencement of operations.
b Calculation based on average common shares outstanding.
c Amount is less than $0.005.
d Not annualized.
e Total market value return is computed based upon the New York Stock Exchange market price of the fund's shares and excludes the effects of brokerage commissions. Total net asset value return measures the changes in value over the period indicated, taking into account dividends as reinvested. Dividends and distributions, if any, are assumed for purposes of these calculations, to be reinvested at prices obtained under the fund's dividend reinvestment plan.
f Annualized.
g Ratios do not reflect dividend payments to preferred shareholders.
h Average daily managed assets represent net assets applicable to common shares plus liquidation preference of preferred shares.
i Based on weekly prices.
See accompanying notes to financial statements.
26
COHEN & STEERS REIT AND UTILITY INCOME FUND, INC.
NOTES TO FINANCIAL STATEMENTS
Note 1. Significant Accounting Policies
Cohen & Steers REIT and Utility Income Fund, Inc. (the fund) was incorporated under the laws of the State of Maryland on October 1, 2003 and is registered under the Investment Company Act of 1940, as amended, as a nondiversified, closed-end management investment company. The fund's investment objective is high current income.
The following is a summary of significant accounting policies consistently followed by the fund in the preparation of its financial statements. The policies are in conformity with accounting principles generally accepted in the United States of America (GAAP). The preparation of the financial statements in accordance with GAAP requires management to make estimates and assumptions that affect the reported amounts of assets and liabilities at the date of the financial statements and the reported amounts of income and expenses during the reporting period. Actual results could differ from those estimates.
Portfolio Valuation: Investments in securities that are listed on the New York Stock Exchange are valued, except as indicated below, at the last sale price reflected at the close of the New York Stock Exchange on the business day as of which such value is being determined. If there has been no sale on such day, the securities are valued at the mean of the closing bid and asked prices for the day or, if no asked price is available, at the bid price.
Securities not listed on the New York Stock Exchange but listed on other domestic or foreign securities exchanges or admitted to trading on the National Association of Securities Dealers Automated Quotations, Inc. (Nasdaq) national market system are valued in a similar manner. Securities traded on more than one securities exchange are valued at the last sale price on the business day as of which such value is being determined as reflected on the tape at the close of the exchange representing the principal market for such securities.
Readily marketable securities traded in the over-the-counter market, including listed securities whose primary market is believed by Cohen & Steers Capital Management, Inc. (the investment manager) to be over-the-counter, but excluding securities admitted to trading on the Nasdaq National List, are valued at the official closing prices as reported by Nasdaq, the National Quotation Bureau, or such other comparable sources as the Board of Directors deem appropriate to reflect their fair market value. If there has been no sale on such day, the securities are valued at the mean of the closing bid and asked prices for the day, or if no asked price is available, at the bid price. However, certain fixed-income securities may be valued on the basis of prices provided by a pricing service when such prices are believed by the Board of Directors to reflect the fair market value of such securities. Where securities are traded on more than one exchan ge and also over-the-counter, the securities will generally be valued using the quotations the Board of Directors believes most closely reflect the value of such securities.
Securities for which market prices are unavailable, or securities for which the investment manager determines that bid and/or asked price does not reflect market value, will be valued at fair value pursuant to procedures approved by the fund's Board of Directors. Circumstances in which market prices may be unavailable include, but are not limited to, when trading in a security is suspended, the exchange on which the security is traded is subject to an unscheduled close or disruption or material events occur after the close of the exchange on which the security
27
COHEN & STEERS REIT AND UTILITY INCOME FUND, INC.
NOTES TO FINANCIAL STATEMENTS—(Continued)
is principally traded. In these circumstances, the fund determines fair value in a manner that fairly reflects the market value of the security on the valuation date based on consideration of any information or factors it deems appropriate. These may include recent transactions in comparable securities, information relating to the specific security and developments in the markets.
The fund's use of fair value pricing may cause the net asset value of fund shares to differ from the net asset value that would be calculated using market quotations. Fair value pricing involves subjective judgments and it is possible that the fair value determined for a security may be materially different than the value that could be realized upon the sale of that security.
Short-term debt securities, which have a maturity date of 60 days or less, are valued at amortized cost, which approximates value.
Security Transactions and Investment Income: Security transactions are recorded on trade date. Realized gains and losses on investments sold are recorded on the basis of identified cost. Interest income is recorded on the accrual basis. Discounts are accreted and premiums are amortized over the life of the respective securities. Dividend income is recorded on the ex-dividend date except for certain dividends on foreign securities, which are recorded as soon as the fund is informed after the ex-dividend date. The fund records distributions received in excess of income from underlying investments as a reduction of cost of investments and/or realized gain. Such amounts are based on estimates if actual amounts are not available, and actual amounts of income, realized gain and return of capital may differ from the estimated amounts. The fund adjusts the estimated amoun ts of the components of distributions (and consequently its net investment income) as an increase to unrealized appreciation/ (depreciation) and realized gain/(loss) on investments as necessary once the issuers provide information about the actual composition of the distributions.
Foreign Currency Translations: The books and records of the fund are maintained in U.S. dollars as follows: (1) the foreign currency market value of investment securities, other assets and liabilities and foreign currency contracts are translated at the exchange rates prevailing at the end of the period; and (2) purchases, sales, income and expenses are translated at the exchange rates prevailing on the respective dates of such transactions. The resultant exchange gains and losses are recorded as realized and unrealized gain/loss on foreign exchange transactions. Pursuant to U.S. federal income tax regulations, certain foreign exchange gains/losses included in realized and unrealized gain/loss are included in or are a reduction of ordinary income for federal income tax purposes. The fund does not isolate that portion of the results of operations arising as a resul t of changes in the foreign exchange rates from the changes in the market prices of the securities.
Foreign Securities: The fund may directly purchase securities of foreign issuers. Investing in securities of foreign issuers involves special risks not typically associated with investing in securities of U.S. issuers. The risks include possible revaluation of currencies, the ability to repatriate funds, less complete financial information about companies and possible future adverse political and economic developments. Moreover, securities of many
28
COHEN & STEERS REIT AND UTILITY INCOME FUND, INC.
NOTES TO FINANCIAL STATEMENTS—(Continued)
foreign issuers and their markets may be less liquid and their prices more volatile than those of securities of comparable U.S. issuers.
Interest Rate Swaps: The fund uses interest rate swaps in connection with the sale of preferred shares. The interest rate swaps are intended to reduce the risk that an increase in short-term interest rates could have on the performance of the fund's common shares as a result of the floating rate structure of the preferred shares. In these interest rate swaps, the fund agrees to pay the other party to the interest rate swap (which is known as the counterparty) a fixed rate payment in exchange for the counterparty agreeing to pay the fund a variable rate payment that is intended to approximate the fund's variable rate payment obligation on the preferred shares. The payment obligation is based on the notional amount of the swap. Depending on the state of interest rates in general, the use of interest rate swaps could enhance or harm the overall performance of the com mon shares. The market value of interest rate swaps is based on pricing models that consider the time value of money, volatility, the current market and contractual prices of the underlying financial instrument. Unrealized appreciation is reported as an asset and unrealized depreciation is reported as a liability on the Statement of Assets and Liabilities. The change in value of swaps, including the accrual of periodic amounts of interest to be paid or received on swaps, is reported as unrealized appreciation or depreciation in the Statement of Operations. A realized gain or loss is recorded upon payment or receipt of a periodic payment or termination of swap agreements. Swap agreements involve, to varying degrees, elements of market and counterparty risk, and exposure to loss in excess of the related amounts reflected in the Statement of Assets and Liabilities.
Dividends and Distributions to Shareholders: Dividends from net investment income and capital gain distributions are determined in accordance with U.S. federal income tax regulations, which may differ from GAAP. Dividends from net investment income are declared and paid monthly. Net realized capital gains, unless offset by any available capital loss carryforward, are typically distributed to shareholders at least annually. Dividends and distributions to shareholders are recorded on the ex-dividend date and are automatically reinvested in full and fractional shares of the fund unless the shareholder has elected to have them paid in cash.
Distributions paid by the fund are subject to recharacterization for tax purposes. Based upon the results of operations for the year ended December 31, 2007, a portion of the dividends have been reclassified to return of capital and distributions of net realized capital gains.
Series M7, Series T7, Series T7-2, Series W7, Series TH7 and Series F7 preferred shares pay dividends based on a variable interest rate set at auctions, normally held every seven days. Dividends and distributions are declared and recorded for the subsequent seven day period on the auction date. In most instances, dividends are payable every seven days, on the first business day following the end of the dividend period.
Series M28, Series T28, Series W28 and Series F28 preferred shares pay dividends based on a variable interest rate set at auctions, normally held every 28 days. The dividends are declared and recorded for the subsequent 28 day
29
COHEN & STEERS REIT AND UTILITY INCOME FUND, INC.
NOTES TO FINANCIAL STATEMENTS—(Continued)
period on the auction date. In most instances, dividends are payable every 28 days, on the first business day following the end of the dividend period.
Income Taxes: It is the policy of the fund to continue to qualify as a regulated investment company, if such qualification is in the best interest of the shareholders, by complying with the requirements of Subchapter M of the Internal Revenue Code applicable to regulated investment companies, and by distributing substantially all of its taxable earnings to its shareholders. Accordingly, no provision for federal income or excise tax is necessary.
Note 2. Investment Management Fees, Administration Fees and Other Transactions with Affiliates
Investment Management Fees: The investment manager serves as the fund's investment manager pursuant to an investment management agreement (the management agreement). Under the terms of the management agreement, the investment manager provides the fund with day-to-day investment decisions and generally manages the fund's investments in accordance with the stated polices of the fund, subject to the supervision of the Board of Directors.
For the services under the management agreement, the fund pays the investment manager a management fee, accrued daily and paid monthly, at an annual rate of 0.85% of the fund's average daily managed asset value. Managed asset value is the net asset value of the common shares plus the liquidation preference of the preferred shares.
The investment manager has contractually agreed to waive its investment management fee in the amount of 0.20% of average daily managed asset value for the first five years of the fund's operations, 0.15% of average daily managed asset value in year six, 0.10% of average daily managed asset value in year seven and 0.05% of average daily managed asset value in year eight. During the year ended December 31, 2007, the investment manager waived its fee at the annual rate of 0.20%.
Administration Fees: The fund has entered into an administration agreement with the investment manager under which the investment manager performs certain administrative functions for the fund and receives a fee, accrued daily and paid monthly, at the annual rate of 0.06% of the fund's average daily managed assets up to $1 billion, 0.04% of the fund's average daily managed assets in excess of $1 billion up to $1.5 billion and 0.02% of the fund's average daily managed assets in excess of $1.5 billion. For the year ended December 31, 2007, the fund incurred $947,691 in administration fees. Additionally, the fund has retained State Street Bank and Trust Company as sub-administrator under a fund accounting and administration agreement.
Directors' and Officers' Fees: Certain directors and officers of the fund are also directors, officers, and/or employees of the investment manager. The fund does not pay compensation to any affiliated directors and officers except for the Chief Compliance Officer, who received $14,770 from the fund for the year ended December 31, 2007.
30
COHEN & STEERS REIT AND UTILITY INCOME FUND, INC.
NOTES TO FINANCIAL STATEMENTS—(Continued)
Note 3. Purchases and Sales of Securities
Purchases and sales of securities, excluding short-term investments, for the year ended December 31, 2007, totaled $510,286,241 and $489,800,432, respectively.
Note 4. Income Tax Information
The tax character of dividends and distributions paid was as follows:
| For the Year Ended December 31, | |||||||||||
| 2007 | 2006 | ||||||||||
| Ordinary income | $ | 90,287,505 | $ | 87,876,128 | |||||||
| Long-term capital gains | 29,891,797 | 64,046,819 | |||||||||
| Tax return of capital | 39,569,854 | 20,817,396 | |||||||||
| Total dividends and distributions | $ | 159,749,156 | $ | 172,740,343 | |||||||
As of December 31, 2007, the tax-basis components of accumulated earnings and the federal tax cost were as follows:
| Gross unrealized appreciation | $ | 733,255,578 | |||||
| Gross unrealized depreciation | (455,956,986 | ) | |||||
| Net unrealized appreciation | $ | 277,298,592 | |||||
| Cost for federal income tax purposes | $ | 1,825,462,363 | |||||
As of December 31, 2007, the fund had temporary book/tax differences primarily attributable to timing differences on dividends payable and the mark-to-market of passive foreign investment companies and permanent book/tax differences primarily attributable to differing treatment on interest rate swaps. To reflect reclassifications arising from the permanent differences, paid-in capital was charged $273,548, accumulated net realized gain was charged $9,149,950 and accumulated net investment income was credited $9,423,498.
Note 5. Capital Stock
The fund is authorized to issue 100 million shares of common stock at a par value of $0.001 per share.
During the year ended December 31, 2007 and the year ended December 31, 2006, the fund issued no shares of common stock for the reinvestment of dividends.
31
COHEN & STEERS REIT AND UTILITY INCOME FUND, INC.
NOTES TO FINANCIAL STATEMENTS—(Continued)
The fund's articles of incorporation authorize the issuance of fund preferred shares, par value $0.001 per share, in one or more classes or series, with rights as determined by the Board of Directors, by action of the Board of Directors without the approval of the common shareholders.
On February 14, 2007, the fund issued 3,800 auction market preferred shares, Series T7-2 (par value $0.001). Proceeds paid to the fund amounted to $93,816,000 after deduction of underwriting commissions and offering expenses of $1,184,000. This issue has received a "AAA/Aaa" rating from Standard & Poor's and Moody's.
On February 22, 2006 the fund issued 2,200 auction market preferred shares, Series M28 (par value $0.001). Proceeds paid to the fund amounted to $54,144,513 after deduction of underwriting commissions and offering expenses of $855,487. This issue has received a "AAA/Aaa" rating from Standard & Poor's and Moody's.
Preferred shares are senior to the fund's common shares and will rank on a parity with shares of any other series of preferred shares, and with shares of any other series of preferred stock of the fund, as to the payment of dividends and the distribution of assets upon liquidation. If the fund does not timely cure a failure to (1) maintain a discounted value of its portfolio equal to the preferred shares basic maintenance amount, (2) maintain the 1940 Act preferred shares asset coverage, or (3) file a required certificate related to asset coverage on time, the preferred shares will be subject to a mandatory redemption at the redemption price of $25,000 per share plus an amount equal to accumulated but unpaid dividends thereon to the date fixed for redemption. To the extent permitted under the 1940 Act and Maryland Law, the fund at its option may without consent of the holders of preferred shares, redeem preferred shares having a dividend per iod of one year or less, in whole, or in part, on the business day after the last day of such dividend period upon not less than 15 calendar days and not more than 40 calendar days prior to notice. The optional redemption price is $25,000 per share plus an amount equal to accumulated but unpaid dividends thereon to the date fixed for redemption.
The fund's common shares and preferred shares have equal voting rights of one vote per share and vote together as a single class, except in certain circumstances regarding the election of directors. In addition, the affirmative vote of the holders of a majority, as defined in the 1940 Act, of the outstanding preferred shares shall be required to (1) approve any plan of reorganization that would adversely affect the preferred shares and (2) approve any matter that materially and adversely affects the rights, preferences, or powers of that series.
32
COHEN & STEERS REIT AND UTILITY INCOME FUND, INC.
NOTES TO FINANCIAL STATEMENTS—(Continued)
The following table reflects the preferred shares issued and outstanding as of December 31, 2007 along with the range of dividend rates paid during the year ended December 31, 2007:
| Value | Range | ||||||||||
| Auction market preferred shares, Series M7, ($25,000 liquidation value, $0.001 par value, 3,360 shares issued and outstanding) | $ | 84,000,000 | 4.80 | %-6.35% | |||||||
| Auction market preferred shares, Series M28, ($25,000 liquidation value, $0.001 par value, 2,200 shares issued and outstanding) | $ | 55,000,000 | 5.09 | %-6.25% | |||||||
| Auction market preferred shares, Series T7, ($25,000 liquidation value, $0.001 par value, 3,360 shares issued and outstanding) | $ | 84,000,000 | 4.95 | %-6.50% | |||||||
| Auction market preferred shares, Series T7-2, ($25,000 liquidation value, $0.001 par value, 3,800 shares issued and outstanding) | $ | 95,000,000 | 5.00 | %-6.50% | |||||||
| Auction market preferred shares, Series T28, ($25,000 liquidation value, $0.001 par value, 3,000 shares issued and outstanding) | $ | 75,000,000 | 5.15 | %-6.10% | |||||||
| Auction market preferred shares, Series W7, ($25,000 liquidation value, $0.001 par value, 3,360 shares issued and outstanding) | $ | 84,000,000 | 4.80 | %-6.35% | |||||||
| Auction market preferred shares, Series W28, ($25,000 liquidation value, $0.001 par value, 3,000 shares issued and outstanding) | $ | 75,000,000 | 5.19 | %-6.50% | |||||||
| Auction market preferred shares, Series TH7, ($25,000 liquidation value, $0.001 par value, 3,360 shares issued and outstanding) | $ | 84,000,000 | 4.90 | %-6.25% | |||||||
| Auction market preferred shares, Series F7, ($25,000 liquidation value, $0.001 par value, 3,360 shares issued and outstanding) | $ | 84,000,000 | 4.80 | %-6.40% | |||||||
| Auction market preferred shares, Series F28, ($25,000 liquidation value, $0.001 par value, 3,000 shares issued and outstanding) | $ | 75,000,000 | 5.04 | %-6.65% | |||||||
| $ | 795,000,000 | ||||||||||
The Articles Supplementary (the "Articles") creating each series of Auction Market Preferred Shares ("AMPS") provide for dividends to be paid at either the rate set in the current auction, or at the maximum rate as defined in the Articles if sufficient clearing bids for the AMPS are not received in the current auction. Beginning on
33
COHEN & STEERS REIT AND UTILITY INCOME FUND, INC.
NOTES TO FINANCIAL STATEMENTS—(Continued)
February 13, 2008, sufficient clearing bids were not received for a number of auctions for certain AMPS series of the fund, and therefore, the maximum rates were declared on the respective AMPS series. Based upon the current ratings of the AMPS, the maximum rate for shares of a series will be the greater of 125% of LIBOR or 125 basis points plus LIBOR. For February 13 and 14, 2008, the maximum annualized rates on the AMPS ranged from 4.365% to 4.376%.
An existing owner of AMPS may sell, transfer or dispose of AMPS only in an auction, pursuant to a bid or sell order in accordance with the auction procedures, or outside an auction, to or through a broker-dealer. Existing holders will be able to sell all of the AMPS that are the subject of their submitted sell orders only if there are bidders willing to purchase those AMPS in the auction. An auction fails when there is an insufficient number of bidders. A failed auction is not a default. Dividends continue to be paid on the AMPS at the maximum rate rather than an auction rate. Broker-dealers, which have been appointed by the fund to serve as dealers for the auctions, may submit a bid in an auction to avoid an auction failure, but are not obligated to do so. Recently, due to liquidity concerns in the market, some broker-dealers have either reduced their demand or decided not to submit bids to purchase AMPS.
The AMPS continue to be rated Aaa by Moody's Investor Services and AAA by Standard & Poor's. In addition, the fund continues to meet certain specified asset coverage tests required by the rating agencies as well as the 200% asset coverage test with respect to AMPS set forth in the Investment Company Act of 1940, as amended.
Note 6. Other
In the normal course of business, the fund enters into contracts that provide general indemnifications. The fund's maximum exposure under these arrangements is dependent on claims that may be made against the fund in the future and, therefore, cannot be estimated; however, based on experience, the risk of material loss from such claims is considered remote.
Note 7. New Accounting Pronouncements
In July 2006, the Financial Accounting Standards Board (FASB) issued Interpretation 48, Accounting for Uncertainty in Income Taxes—an interpretation of FASB Statement 109 (FIN 48). FIN 48 clarifies the accounting for income taxes by prescribing the minimum recognition threshold a tax position must meet before being recognized in the financial statements. FIN 48 is effective for fiscal years beginning after December 15, 2006. An assessment of the fund's tax positions has been made and it has been determined that there is no impact to the fund's financial statements.
In September 2006, Statement of Financial Accounting Standards No. 157, Fair Value Measurements (SFAS 157), was issued and is effective for fiscal years beginning after November 15, 2007. SFAS 157 defines fair value, establishes a framework for measuring fair value and expands disclosures about fair value measurements. Management has evaluated the impact of SFAS 157 and it is not expected to have a material impact on the fund's net assets or results of operations.
34
COHEN & STEERS REIT AND UTILITY INCOME FUND, INC.
REPORT OF INDEPENDENT REGISTERED PUBLIC ACCOUNTING FIRM
To the Board of Directors and Shareholders of
Cohen & Steers REIT & Utility Income Fund, Inc.
In our opinion, the accompanying statement of assets and liabilities, including the schedule of investments, and the related statements of operations and of changes in net assets and the financial highlights present fairly, in all material respects, the financial position of Cohen & Steers REIT & Utility Income Fund, Inc. (the "Fund") at December 31, 2007, the results of its operations for the year then ended, the changes in its net assets for each of the two years in the period then ended and the financial highlights for each of the periods presented, in conformity with accounting principles generally accepted in the United States of America. These financial statements and financial highlights (hereafter referred to as "financial statements") are the responsibility of the Fund's management. Our responsibility is to express an opinion on these financial statements based on our audits. We conducted our audits of these financial statem ents in accordance with the standards of the Public Company Accounting Oversight Board (United States). Those standards require that we plan and perform the audit to obtain reasonable assurance about whether the financial statements are free of material misstatement. An audit includes examining, on a test basis, evidence supporting the amounts and disclosures in the financial statements, assessing the accounting principles used and significant estimates made by management, and evaluating the overall financial statement presentation. We believe that our audits, which included confirmation of securities at December 31, 2007 by correspondence with the custodian and brokers, provide a reasonable basis for our opinion.
PricewaterhouseCoopers LLP
New York, New York
February 15, 2008
35
COHEN & STEERS REIT AND UTILITY INCOME FUND, INC.
AVERAGE ANNUAL TOTAL RETURNS
(periods ended December 31, 2007) (Unaudited)
| Based on Net Asset Value | Based on Market Value | ||||||||||||||
| One Year | Since Inception (1/30/04) | One Year | Since Inception (1/30/04) | ||||||||||||
| –3.69 | % | 13.51 | % | –1.24 | % | 9.48 | % | ||||||||
The performance data quoted represent past performance. Past performance is no guarantee of future results. The investment return will vary and the principal value of an investment will fluctuate and shares, if sold, may be worth more or less than their original cost. Current performance may be lower or higher than the performance data quoted. Performance results reflect the effect of leverage resulting from the issuance of preferred shares.
TAX INFORMATION—2007 (Unaudited)
Pursuant to the Jobs and Growth Relief Reconciliation Act of 2003, the fund designates qualified dividend income of $45,719,297. Additionally, 44.0% of the ordinary dividends qualified for the dividends received deduction available to corporations. Also, the fund designates a long-term capital gain distribution of $29,891,797 at the 15% rate or maximum allowable.
REINVESTMENT PLAN
The fund has a dividend reinvestment plan (the "Plan") commonly referred to as an "opt-out" plan. Each common shareholder who participates in the Plan will have all distributions of dividends and capital gains automatically reinvested in additional common shares by The Bank of New York as agent (the "Plan Agent"). Shareholders who elect not to participate in the plan will receive all distributions in cash paid by check mailed directly to the shareholder of record (or if the shares are held in street or other nominee name, then to the nominee) by the Plan Agent, as dividend disbursing agent. Shareholders whose common shares are held in the name of a broker or nominee should contact the broker or nominee to determine whether and how they may participate in the Plan.
The Plan Agent serves as agent for the shareholders in administering the plan. After the fund declares a dividend or makes a capital gain distribution, the plan agent will, as agent for the shareholders, either (i) receive the cash payment and use it to buy common shares in the open market, on the NYSE or elsewhere, for the participants' accounts or (ii) distribute newly issued common shares of the Fund on behalf of the participants. The Plan Agent will receive cash from the fund with which to buy common shares in the open market if, on the distribution payment date, the net asset value per share exceeds the market price per share plus estimated brokerage commissions on that date. The Plan Agent will receive the dividend or distribution in newly issued common shares of the fund if, on the payment date, the market price per share plus estimated brokerage commissions equals or exceeds the net asset value per share of the fund on that date. The number of shares to be issued will be computed at a per share rate equal to the greater of (i) the net asset value or (ii) 95% of the closing market price per share on the payment date.
36
COHEN & STEERS REIT AND UTILITY INCOME FUND, INC.
Participants in the Plan may withdraw from the plan upon notice to the Plan Agent. Such withdrawal will be effective immediately if received not less than ten days prior to a distribution record date; otherwise, it will be effective for all subsequent distributions. When a participant withdraws from the Plan or upon termination of the Plan as provided below, certificates for whole common shares credited to his or her account under the Plan will be issued and a cash payment will be made for any fraction of a common share credited to such account. If any participant elects to have the Plan Agent sell all or part of his or her shares and remit the proceeds, the Plan Agent is authorized to deduct a $15.00 fee plus $0.10 per share brokerage commissions.
The Plan Agent's fees for the handling of reinvestment of distributions will be paid by the fund. However, each participant will pay a pro rata share of brokerage commissions incurred with respect to the Plan Agent's open market purchases in connection with the reinvestment of distributions. The automatic reinvestment of distributions will not relieve participants of any income tax that may be payable or required to be withheld on such distributions.
The fund reserves the right to amend or terminate the Plan. All correspondence concerning the plan should be directed to the Plan Agent at 800-432-8224.
OTHER INFORMATION
Notice is hereby given in accordance with Section 23(c) of the Investment Company Act of 1940 that the fund may purchase, from time to time, shares of its common stock in the open market.
A description of the policies and procedures that the fund uses to determine how to vote proxies relating to portfolio securities is available (i) without charge, upon request, by calling 800-330-7348, (ii) on our Web site at cohenandsteers.com or (iii) on the Securities and Exchange Commission's Web site at http://www.sec.gov. In addition, the fund's proxy voting record for the most recent 12-month period ended June 30 is available (i) without charge, upon request, by calling 800-330-7348 or (ii) on the SEC's Web site at http://www.sec.gov.
The fund files its complete schedule of portfolio holdings with the SEC for the first and third quarters of each fiscal year on Form N-Q. The fund's Forms N-Q are available (i) without charge, upon request by calling 800-330-7348, or (ii) on the SEC's Web site at http://www.sec.gov. In addition, the Forms N-Q may be reviewed and copied at the SEC's Public Reference Room in Washington, DC. Information on the operation of the Public Reference Room may be obtained by calling 800-SEC-0330.
As required, the fund has submitted to the New York Stock Exchange ("NYSE") the annual certification of the fund's chief executive officer certifying as to compliance with of the NYSE's Corporate Governance listing standards. The fund also has included the certifications of the fund's chief executive officer and chief financial officer required by Section 302 of the Sarbanes-Oxley Act of 2002 as exhibits to its most recent Form N-CSR.
Please note that the distributions paid by the fund to shareholders are subject to recharacterization for tax purposes. The fund may also pay distributions in excess of the fund's net investment company taxable income and this excess would be a tax-free return of capital distributed from the fund's assets. To the extent this occurs, the fund's shareholders of record will be notified of the estimated amount of capital returned to shareholders for each
37
COHEN & STEERS REIT AND UTILITY INCOME FUND, INC.
such distribution and this information will also be available at cohenandsteers.com. The final tax treatment of all distributions is reported to shareholders on their 1099-DIV forms, which are mailed after the close of each calendar year. Distributions of capital decrease the fund's total assets and, therefore, could have the effect of increasing the fund's expense ratio. In addition, in order to make these distributions, the fund may have to sell portfolio securities at a less than opportune time.
The Board of Directors approved amendments to eliminate the non-fundamental investment restriction regarding the purchase of securities on margin. The board of directors also approved amendments to permit the fund to write call options on up to 25% of its managed assets. Call options would be written on both indices and securities. The fund may write call options on "broad-based" equity indexes, as well as on narrower market indexes, such as those in respect of select sectors. The fund also may write options on exchange-traded funds and other similar instruments designed to correlate with the performance of an equity index or market segment. Finally, the fund may write options on select sectors and single stocks. The Fund may write listed/exchange-traded options contracts, as well as unlisted or "over-the-counter" options contracts, particularly with respect to options on foreign securities or indexes.
PRIVACY POLICY*
In the course of doing business with Cohen & Steers, you may share personal information with us. We are committed to maintaining the privacy of this information and recognize the importance of preventing unauthorized access to it. You may provide personal information on account applications and requests for forms or other literature (such as your address and social security number) and through account transactions with us (such as purchases, sales and account balances). You may also provide us with this information through written, electronic and telephone account inquiries.
We do not sell personal information about current and former customers to anyone, and we do not disclose it unless necessary to process a transaction, service an account or as otherwise required or permitted by law. For example, we may disclose information to companies that perform administrative services for Cohen & Steers, such as transfer agents, or printers that assist us in the distribution of investor materials. These organizations will use this information only for purposes of providing the required services or as otherwise may be required by law. We may also share personal information within the Cohen & Steers family of companies to provide you with additional information about our products and services.
We maintain physical, electronic and procedural safeguards to protect your personal information. Within Cohen & Steers, we restrict access to your personal information to those employees who need it to perform their jobs, such as servicing your account or informing you of new products and services.
The accuracy of your personal information is important. If you need to correct or update your personal or
* This privacy policy applies to the following Cohen & Steers companies: Cohen & Steers Capital Management, Inc., Cohen & Steers Securities, LLC, Cohen & Steers Capital Advisors, LLC and the Cohen & Steers Funds.
38
COHEN & STEERS REIT AND UTILITY INCOME FUND, INC.
account information, please call us at 800-330-7348. We will be happy to review, correct or update your personal or account information.
APPROVAL OF INVESTMENT MANAGEMENT AGREEMENT
The board of directors of the fund, including a majority of the directors who are not parties to the fund's investment management agreement (the "Management Agreement"), or interested persons of any such party ("Independent Directors"), has the responsibility under the 1940 Act to approve the fund's Management Agreement for its initial two year term and its continuation annually thereafter at a meeting of the board called for the purpose of voting on the approval or continuation. At a meeting held in person on December 12, 2007, the Management Agreement was discussed and was unanimously continued for a one-year term by the fund's board, including the Independent Directors. The Independent Directors were represented by independent counsel who assisted them in their deliberations during the meeting and executive session.
In considering whether to continue the Management Agreement, the board reviewed materials provided by the fund's investment manager (the "Investment Manager") and fund counsel which included, among other things, fee, expense and performance information compared to peer funds ("Peer Funds") prepared by an independent data provider, supplemental performance and summary information prepared by the Investment Manager, and memoranda outlining the legal duties of the board. The board also spoke directly with representatives of the independent data provider and met with investment management personnel. In addition, the board considered information provided from time to time by the Investment Manager throughout the year at meetings of the board, including presentations by portfolio managers relating to the investment performance of the fund and the investment strategies used in pursuing the fund's objective. In particular, the board considered the f ollowing:
(i) The nature, extent and quality of services to be provided by the Investment Manager: The board reviewed the services that the Investment Manager provides to the fund, including, but not limited to, making the day-to-day investment decisions for the fund, and generally managing the fund's investments in accordance with the stated policies of the fund. The board also discussed with officers and portfolio managers of the fund the amount of time the Investment Manager dedicates to the fund and the types of transactions that were being done on behalf of the fund. Additionally, the board took into account the services provided by the Investment Manager to its other funds, including those that invest substantially in real estate securities and have investment objectives and strategies similar to the fund.
The board next considered the education, background and experience of the Investment Manager's personnel, noting particularly that the favorable history and reputation of the portfolio managers for the fund, has had, and would likely continue to have, a favorable impact on the success of the fund. The board further noted the Investment Manager's ability to attract quality and experienced personnel. The board then considered the administrative services provided by the Investment Manager, including compliance and accounting services. After consideration
39
COHEN & STEERS REIT AND UTILITY INCOME FUND, INC.
of the above factors, among others, the board concluded that the nature, quality and extent of services provided by the Investment Manager are adequate and appropriate.
(ii) Investment performance of the fund and the Investment Manager: The board considered the investment performance of the fund compared to Peer Funds and compared to relevant benchmarks. The board noted that the fund's dual focus on REITs and utility securities is unique and as a result, the Peer Funds generally consisted of real-estate only or utility-only funds, making it difficult to make quantitative comparisons of the fund's performance with the Peer Funds. Nonetheless, the board noted that the fund was the median performer for the one-year period among the Peer Funds for the one-year period and outperformed the Peer Fund median for the three-year period. The representatives of the Investment Manager also discussed the fund's favorable performance against one specific peer fund with an asset mix that the Investment Manager believed to be the most comparable to the fund, nothing that the fund had outperformed that fund over the 3-year period. The board also noted that the fund outperformed its blended benchmark for both the 1- and 3-year periods.
The board also considered the Investment Manager's performance in managing other funds that invest in real estate and utility securities. The board determined that fund performance, in light of all of the considerations noted above, was satisfactory.
(iii) Cost of the services to be provided and profits to be realized by the Investment Manager from the relationship with the fund: Next, the board considered the management fees and administrative fees payable by the fund, as well as total expense ratios. As part of their analysis, the board gave substantial consideration to the fee and expense analyses provided by the independent data provider. The board noted that the advisory fee and gross expense ratio were above the Peer Funds' medians, but also considered the fee waiver currently in place and that the fund's net expense ratio was in-line with Peer Funds. The board concluded that the fund's current expense structure is competitive in the peer group.
The board also reviewed information regarding the profitability to the Investment Manager of its relationship with the fund. The board considered the level of the Investment Manager's profits and whether the profits were reasonable for the Investment Manager. The board noted that the Investment Manager was currently waiving fees and/or reimbursing expenses of the fund. The board took into consideration other benefits to be derived by the Investment Manager in connection with the Management Agreement, noting particularly the research and related services, within the meaning of Section 28(e) of the Securities Exchange Act of 1934, as amended, that the Investment Manager receives by allocating the fund's brokerage transactions. The board also considered the fees received by the Investment Manager under the Administration Agreement, but noted the significant services received, such as operational services and furnishing office space and faciliti es for the fund, and providing persons satisfactory to the board to serve as officers of the fund, and that these services were beneficial to the fund. The board concluded that the profits realized by the Investment Manager from its administrative relationship with the fund
40
COHEN & STEERS REIT AND UTILITY INCOME FUND, INC.
were reasonable and consistent with fiduciary duties.
(iv) The extent to which economies of scale would be realized as the fund grows and whether fee levels would reflect such economies of scale: The board noted that as a closed-end fund, the fund would not be expected to have inflows of capital that might produce increasing economies of scale. The board determined that, given the fund's closed-end structure, shareholders appropriately benefited from economies of scale.
(v) Comparison of services rendered and fees paid to those under other investment management contracts, such as contracts of the same and other investment managers or other clients: As discussed above in (i) and (iii), the board compared both the services rendered and the fees paid under the Management Agreement to those under other investment management contracts of other investment managers managing Peer Funds. The board compared both the services rendered and the fees paid under the Management Agreement to the Investment Manager's other fund advisory agreements. The board determined that on a comparative basis the fees under the Management Agreement were reasonable in relation to the services provided.
No single factor was cited as determinative to the decision of the board. Rather, after weighing all of the considerations and conclusions discussed above, the board, including the Independent Directors, unanimously approved the continuation of the Management Agreement.
41
COHEN & STEERS REIT AND UTILITY INCOME FUND, INC.
MANAGEMENT OF THE FUND
The business and affairs of the fund are managed under the direction of the board of directors. The board of directors approves all significant agreements between the fund and persons or companies furnishing services to it, including the fund's agreements with its advisor, administrator, custodian and transfer agent. The management of the fund's day-to-day operations is delegated to its officers, the advisor and the fund's administrator, subject always to the investment objective and policies of the fund and to the general supervision of the board of directors.
The directors and officers of the fund and their principal occupations during the past five years are set forth below. The statement of additional information (SAI) includes additional information about fund directors and is available, without charge, upon request by calling 800-330-7348.
| Name, Address and Age* | Position(s) Held with Fund | Term of Office | Principal Occupation During Past 5 Years (Including Other Directorships Held) | Number of Funds Within Fund Complex Overseen by Director (Including the Fund) | Length of Time Served** | ||||||||||||||||||
| Interested Directors1 | |||||||||||||||||||||||
| Robert H. Steers Age: 54 | Director and Co-Chairman | 2009 | Co-Chairman and Co-Chief Executive Officer of Cohen & Steers Capital Management, Inc. (CSCM), the fund's investment manager, and its parent company, Cohen & Steers, Inc. (CNS) since 2004. Vice President and Director, Cohen & Steers Securities, LLC (CSSL), the Cohen & Steers open-end funds' distributor. Prior thereto, Chairman of CSCM and the Cohen & Steers funds. | 22 | 1991 to present | ||||||||||||||||||
| Martin Cohen Age: 59 | Director and Co-Chairman | 2010 | Co-Chairman and Co-Chief Executive Officer of CSCM and CNS. Vice President and Director of CSSL. Prior thereto, President of the CSCM and the Cohen & Steers funds. | 22 | 1991 to present | ||||||||||||||||||
(table continued on next page)
* The address for each director is 280 Park Avenue, New York, NY 10017.
** The length of time served represents the year in which the director was first elected or appointed to any fund in the Cohen & Steers fund complex.
1 "Interested person", as defined in the 1940 Act, of the fund because of affiliation with CSCM.
42
COHEN & STEERS REIT AND UTILITY INCOME FUND, INC.
(table continued from previous page)
| Name, Address and Age* | Position(s) Held with Fund | Term of Office | Principal Occupation During Past 5 Years (Including Other Directorships Held) | Number of Funds Within Fund Complex Overseen by Director (Including the Fund) | Length of Time Served** | ||||||||||||||||||
| Disinterested Directors | |||||||||||||||||||||||
| Bonnie Cohen2 Age: 65 | Director | 2008 | Consultant. Director, Reis, Inc.; Chair of the Board of Global Heritage Fund; Program member, The Moriah Fund; Advisory Committee member, The Posse Foundation; Board member, District of Columbia Public Libraries; Visiting Committee, Harvard Business School. Former Under Secretary of State for Management, United States Department of State, 1996-2000. | 22 | 2001 to present | ||||||||||||||||||
| George Grossman Age: 54 | Director | 2009 | Attorney-at-law. | 22 | 1993 to present | ||||||||||||||||||
| Richard E. Kroon Age: 65 | Director | 2008 | Member of Investment Committee, Monmouth University; retired Chairman and Managing Partner of the Sprout Group venture capital funds, then an affiliate of Donaldson, Lufkin & Jenrette Securities Corporation; and former Chairman of the National Venture Capital Association. | 22 | 2004 to present | ||||||||||||||||||
| Richard J. Norman Age: 64 | Director | 2010 | Private Investor. Board of Directors of Maryland Public Television, Advisory Board Member of the Salvation Army. Prior thereto, Investment Representative of Morgan Stanley Dean Witter. | 22 | 2001 to present | ||||||||||||||||||
(table continued on next page)
* The address for each director is 280 Park Avenue, New York, NY 10017.
** The length of time served represents the year in which the director was first elected or appointed to any fund in the Cohen & Steers fund complex.
2 Martin Cohen and Bonnie Cohen are not related.
43
COHEN & STEERS REIT AND UTILITY INCOME FUND, INC.
(table continued from previous page)
| Name, Address and Age* | Position(s) Held with Fund | Term of Office | Principal Occupation During Past 5 Years (Including Other Directorships Held) | Number of Funds Within Fund Complex Overseen by Director (Including the Fund) | Length of Time Served** | ||||||||||||||||||
| Frank K. Ross Age: 64 | Director | 2010 | Professor of Accounting, Howard University; Board member of Pepco Holdings, Inc. (electric utility). Formerly, Midatlantic Area Managing Partner for Audit and Risk Advisory Services at KPMG LLP and Managing Partner of its Washington, DC office. | 22 | 2004 to present | ||||||||||||||||||
| Willard H. Smith Jr. Age: 71 | Director | 2008 | Board member of Essex Property Trust Inc., Realty Income Corporation and Crest Net Lease, Inc. Managing Director at Merrill Lynch & Co., Equity Capital Markets Division from 1983 to 1995. | 22 | 1996 to present | ||||||||||||||||||
| C. Edward Ward Jr. Age: 61 | Director | 2009 | Member of the Board of Trustees of Directors Manhattan College, Riverdale, New York. Formerly head of closed-end fund listings for the New York Stock Exchange. | 22 | 2004 to present | ||||||||||||||||||
* The address for each director is 280 Park Avenue, New York, NY 10017.
** The length of time served represents the year in which the director was first elected or appointed to any fund in the Cohen & Steers fund complex.
44
COHEN & STEERS REIT AND UTILITY INCOME FUND, INC.
The officers of the fund (other than Messrs. Cohen and Steers, whose biographies are provided above), their address, their ages and their principal occupations for at least the past five years are set forth below.
| Name, Address and Age* | Position(s) with Fund | Principal Occupation During Past 5 Years | Length of Time Served** | ||||||||||||
| Adam M. Derechin Age: 43 | President and chief executive officer | Chief Operating Officer of CSCM (since 2003) and CNS (since 2004). Prior to that, Senior Vice President of CSCM and Vice President and Assistant Treasurer of the Cohen & Steers funds. | Since 2005 | ||||||||||||
| Joseph M. Harvey Age: 44 | Vice President | President of CSCM (since 2003) and CNS (since 2004). Prior to that, Senior Vice President and Director of Investment Research of CSCM. | Since 2004 | ||||||||||||
| James S. Corl Age: 41 | Vice President | Executive Vice President of CSCM since 2004. Prior to that, Senior Vice President of CSCM. | Since 2004 | ||||||||||||
| Thomas N. Bohjalian Age: 42 | Vice President | Senior Vice President of CSCM since 2006. Prior to that, Vice President of CSCM from 2003 through 2005. Prior thereto, Vice President at AEW Capital Management. | Since 2006 | ||||||||||||
| Robert S. Becker Age: 38 | Vice President | Senior Vice President of CSCM since 2003. Prior to that, portfolio manager at Franklin Templeton Investments. | Since 2003 | ||||||||||||
| William F. Scapell Age: 40 | Vice President | Senior Vice President of CSCM since 2003. Prior to that, chief strategist for preferred securities at Merrill Lynch & Co., Inc. | Since 2003 | ||||||||||||
| Francis C. Poli Age: 45 | Secretary | Executive Vice President, Secretary and General Counsel of CSCM and CNS since March 2007. Prior thereto, General Counsel of Allianz Global Investors of America LP. | Since 2007 | ||||||||||||
| James Giallanza Age: 41 | Treasurer | Senior Vice President of CSCM since September 2006. Prior thereto, Deputy Head of the US Funds Administration and Treasurer & CFO of various mutual funds within the Legg Mason (formally Citigroup Asset Management) fund complex from August 2004 to September 2006; Director/Controller of the US wholesale business at UBS Global Asset Management (U.S.) from September 2001 to July 2004. | Since 2006 | ||||||||||||
(table continued on next page)
* The address of each officer is 280 Park Avenue, New York, NY 10017.
** Officers serve one-year terms. The length of time served represents the year in which the officer was first elected to that position in any fund in the Cohen & Steers fund complex. All of the officers listed above are officers of one or more of the other funds in the complex.
45
COHEN & STEERS REIT AND UTILITY INCOME FUND, INC.
(table continued from previous page)
| Name, Address and Age* | Position(s) with Fund | Principal Occupation During Past 5 Years | Length of Time Served** | ||||||||||||
| Lisa Phelan Age: 39 | Chief Compliance Officer | Vice President & Director of Compliance of CSCM since January 2006. Chief Compliance Officer of CSSL since 2004. Prior to that, Compliance Officer of CSCM since 2004. Chief Compliance Officer, Avatar Associates & Overture Asset Managers, 2003-2004. First VP, Risk Management, Prudential Securities, Inc. 2000-2003. | Since 2006 | ||||||||||||
* The address of each officer is 280 Park Avenue, New York, NY 10017.
** Officers serve one-year terms. The length of time served represents the year in which the officer was first elected to that position in any fund in the Cohen & Steers fund complex. All of the officers listed above are officers of one or more of the other funds in the complex.
46
COHEN & STEERS REIT AND UTILITY INCOME FUND, INC.
Meet the Cohen & Steers family of open-end funds:
COHEN & STEERS
REALTY SHARES
• Designed for investors seeking maximum total return, investing primarily in REITs
• Symbol: CSRSX
COHEN & STEERS
REALTY INCOME FUND
• Designed for investors seeking maximum total return, investing primarily in real estate securities with an emphasis on both income and appreciation
• Symbols: CSEIX, CSBIX, CSCIX, CSDIX
COHEN & STEERS
INTERNATIONAL REALTY FUND
• Designed for investors seeking maximum total return, investing primarily in international real estate securities
• Symbols: IRFAX, IRFCX, IRFIX
COHEN & STEERS
DIVIDEND VALUE FUND
• Designed for investors seeking high current income and long-term growth of income and capital appreciation, investing primarily in dividend paying common stocks and preferred stocks
• Symbols: DVFAX, DVFCX, DVFIX
COHEN & STEERS
INSTITUTIONAL GLOBAL REALTY SHARES
• Designed for investors seeking maximum total return, investing primarily in global real estate securities
• Symbol: GRSIX
COHEN & STEERS
INSTITUTIONAL REALTY SHARES
• Designed for institutional investors seeking maximum total return, investing primarily in REITs
• Symbol: CSRIX
COHEN & STEERS
GLOBAL REALTY SHARES
• Designed for investors seeking maximum total return, investing in global real estate equity securities
• Symbols: CSFAX, CSFBX, CSFCX, CSSPX
COHEN & STEERS
UTILITY FUND
• Designed for investors seeking maximum total return, investing primarily in utilities
• Symbols: CSUAX, CSUBX, CSUCX, CSUIX
COHEN & STEERS
ASIA PACIFIC REALTY SHARES
• Designed for investors seeking maximum total return, investing primarily in real estate securities located in the Asia Pacific region
• Symbols: APFAX, APFCX, APFIX
COHEN & STEERS
EUROPEAN REALTY SHARES
• Designed for investors seeking maximum total return, investing primarily in real estate securities located in Europe
• Symbols: EURAX, EURCX, EURIX
Please consider the investment objectives, risks, charges and expenses of the fund carefully before investing. A prospectus containing this and other information can be obtained by calling 800-330-7348 or by visiting cohenandsteers.com. Please read the prospectus carefully before investing.
Cohen & Steers Securities, LLC, Distributor
47
COHEN & STEERS REIT AND UTILITY INCOME FUND, INC.
OFFICERS AND DIRECTORS
Robert H. Steers
Director and co-chairman
Martin Cohen
Director and co-chairman
Bonnie Cohen
Director
George Grossman
Director
Richard E. Kroon
Director
Richard J. Norman
Director
Frank K. Ross
Director
Willard H. Smith Jr.
Director
C. Edward Ward, Jr.
Director
Adam M. Derechin
President and chief executive officer
Joseph M. Harvey
Vice president
James S. Corl
Vice president
William F. Scapell
Vice president
Robert S. Becker
Vice president
Thomas N. Bohjalian
Vice president
Francis C. Poli
Secretary
James Giallanza
Treasurer and chief financial officer
Lisa D. Phelan
Chief compliance officer
KEY INFORMATION
Investment Manager
Cohen & Steers Capital Management, Inc.
280 Park Avenue
New York, NY 10017
(212) 832-3232
Fund Subadministrator and Custodian
State Street Bank and Trust Company
One Lincoln Street
Boston, MA 02111
Transfer Agent—Common Shares
The Bank of New York Mellon
101 Barclay Street
New York, NY 10286
(800) 432-8224
Transfer Agent—Preferred Shares
The Bank of New York Mellon
101 Barclay Street
New York, NY 10286
Legal Counsel
Stroock & Stroock & Lavan LLP
180 Maiden Lane
New York, NY 10038
New York Stock Exchange Symbol: RTU
Web site: cohenandsteers.com
This report is for shareholder information. This is not a prospectus intended for use in the purchase or sale of fund shares. Past performance is of course no guarantee of future results and your investment may be worth more or less at the time you sell.
48
COHEN & STEERS
REIT AND UTILITY INCOME FUND
280 PARK AVENUE
NEW YORK, NY 10017

eDelivery NOW AVAILABLE
Stop traditional mail delivery; receive your shareholder reports and prospectus online.
Sign up at cohenandsteers.com
ANNUAL REPORT
DECEMBER 31, 2007
RTUAR
Item 2. Code of Ethics.
The registrant has adopted a Code of Ethics that applies to its Principal Executive Officer and Principal Financial Officer. The registrant undertakes to provide to any person without charge, upon request, a copy of the Code of Ethics. Such request can be made by calling 800-330-7348 or writing to the Secretary of the registrant, 280 Park Avenue, New York, NY 10017.
Item 3. Audit Committee Financial Expert.
The registrant’s board has determined that Frank K. Ross, a member of the board’s Audit Committee, is an “audit committee financial expert”. Mr. Ross is “independent,” as such term is defined in this Item.
Item 4. Principal Accountant Fees and Services.
(a) – (d) Aggregate fees billed to the registrant for the last two fiscal years for professional services rendered by the registrant’s principal accountant were as follows:
|
| 2007 |
| 2006 |
| ||
Audit Fees |
| $ | 58,100 |
| $ | 69,030 |
|
Audit-Related Fees |
| $ | 110,500 |
| $ | 128,000 |
|
Tax Fees |
| $ | 14,500 |
| $ | 13,500 |
|
All Other Fees |
| — |
| — |
| ||
Audit-related fees were billed in connection with the preparation and issuance of certification reports to rating agencies relating to the registrant’s preferred shares. Tax fees were billed in connection with the preparation of tax returns, calculation and designation of dividends and other miscellaneous tax services.
Aggregate fees billed by the registrant’s principal accountant for the last two fiscal years for non-audit services provided to the registrant’s investment adviser (not including a sub-adviser whose role is primarily portfolio management and is subcontracted or overseen by another investment adviser) and any entity controlling, controlled by, or under common control with the investment adviser that provides ongoing services to the registered investment company, where the engagement relates directly to the operations and financial reporting of the registrant, were as follows:
|
| 2007 |
| 2006 |
| ||
Audit-Related Fees |
| — |
| — |
| ||
Tax Fees |
| — |
| — |
| ||
All Other Fees |
| $ | 85,000 |
| $ | 65,000 |
|
These other fees were billed in connection with internal control reviews.
(e)(1) The registrant’s audit committee is required to pre-approve audit and non-audit services performed for the registrant by the principal accountant. The audit committee also is required to
pre-approve non-audit services performed by the registrant’s principal accountant for the registrant’s investment adviser (not including any sub-adviser whose role is primarily portfolio management and is subcontracted with or overseen by another investment adviser) and/or to any entity controlling, controlled by or under common control with the registrant’s investment adviser that provides ongoing services to the registrant, if the engagement for services relates directly to the operations and financial reporting of the registrant.
The audit committee may delegate pre-approval authority to one or more of its members who are independent members of the board of directors of the registrant. The member or members to whom such authority is delegated shall report any pre-approval decisions to the audit committee at its next scheduled meeting. The audit committee may not delegate its responsibility to pre-approve services to be performed by the registrant’s principal accountant to the investment adviser.
(e) (2) No services included in (b) – (d) above were approved by the audit committee pursuant to paragraphs (c)(7)(i)(C) of Rule 2-01 of Regulation S-X.
(f) Not applicable.
(g) For the fiscal years ended December 31, 2007 and December 31, 2006, the aggregate fees billed by the registrant’s principal accountant for non-audit services rendered to the registrant and for non-audit services rendered to the registrant’s investment adviser (not including any sub-adviser whose role is primarily portfolio management and is subcontracted with or overseen by another investment adviser) and/or to any entity controlling, controlled by or under common control with the registrant’s investment adviser that provides ongoing services to the registrant were $210,000 and $206,500, respectively.
(h) The registrant’s audit committee considered whether the provision of non-audit services that were rendered to the registrant’s investment adviser (not including any sub-adviser whose role is primarily portfolio management and is subcontracted with or overseen by another investment adviser) and/or to any entity controlling, controlled by or under common control with the registrant’s investment adviser that provides ongoing services to the registrant that were not required to be pre-approved pursuant to paragraph (c)(7)(ii) of Rule 2-01 of Regulation S-X was compatible with maintaining the principal accountant’s independence.
Item 5. Audit Committee of Listed Registrants.
The registrant has a separately-designated standing audit committee established in accordance with Section 3(a)(58)(A) of the Securities Exchange Act of 1934. The members of the committee are Frank K. Ross (chairman), Bonnie Cohen, George Grossman and Richard E. Kroon.
Item 6. Schedule of Investments.
Included in Item 1 above.
Item 7. Disclosure of Proxy Voting Policies and Procedures for Closed-End Management Investment Companies.
The registrant has delegated voting of proxies in respect of portfolio holdings to Cohen & Steers Capital Management, Inc., in accordance with the policies and procedures set forth below.
COHEN & STEERS CAPITAL MANAGEMENT, INC.
STATEMENT OF POLICIES AND PROCEDURES REGARDING THE VOTING OF SECURITIES
This statement sets forth the policies and procedures that Cohen & Steers Capital Management, Inc. (“C&S”) follows in exercising voting rights with respect to securities held in our client portfolios. All proxy-voting rights that are exercised by C&S shall be subject to this Statement of Policy and Procedures.
I. Objectives
Voting rights are an important component of corporate governance. C&S has three overall objectives in exercising voting rights:
A. Responsibility. C&S shall seek to ensure that there is an effective means in place to hold companies accountable for their actions. While management must be accountable to its board, the board must be accountable to a company’s shareholders. Although accountability can be promoted in a variety of ways, protecting shareholder voting rights may be among our most important tools.
B. Rationalizing Management and Shareholder Concerns. C&S seeks to ensure that the interests of a company’s management and board are aligned with those of the company’s shareholders. In this respect, compensation must be structured to reward the creation of shareholder value.
C. Shareholder Communication. Since companies are owned by their shareholders, C&S seeks to ensure that management effectively communicates with its owners about the company’s business operations and financial performance. It is only with effective communication that shareholders will be able to assess the performance of management and to make informed decisions on when to buy, sell or hold a company’s securities.
II. General Principles
In exercising voting rights, C&S shall conduct itself in accordance with the general principles set forth below.
1. The ability to exercise a voting right with respect to a security is a valuable right and, therefore, must be viewed as part of the asset itself.
2. In exercising voting rights, C&S shall engage in a careful evaluation of issues that may materially affect the rights of shareholders and the value of the security.
3. Consistent with general fiduciary principles, the exercise of voting rights shall always be conducted with reasonable care, prudence and diligence.
4. In exercising voting rights on behalf of clients, C&S shall conduct itself in the same manner as if C&S were the constructive owner of the securities.
5. To the extent reasonably possible, C&S shall participate in each shareholder voting opportunity.
6. Voting rights shall not automatically be exercised in favor of management-supported proposals.
7. C&S, and its officers and employees, shall never accept any item of value in consideration of a favorable proxy voting decision.
III. General Guidelines
Set forth below are general guidelines that C&S shall follow in exercising proxy voting rights:
Prudence
In making a proxy voting decision, C&S shall give appropriate consideration to all relevant facts and circumstances, including the value of the securities to be voted and the likely effect any vote may have on that value. Since voting rights must be exercised on the basis of an informed judgment, investigation shall be a critical initial step.
Third Party Views
While C&S may consider the views of third parties, C&S shall never base a proxy voting decision solely on the opinion of a third party. Rather, decisions shall be based on a reasonable and good faith determination as to how best to maximize shareholder value.
Shareholder Value
Just as the decision whether to purchase or sell a security is a matter of judgment, determining whether a specific proxy resolution will increase the market value of a security is a matter of judgment as to which informed parties may differ. In determining how a proxy vote may affect the economic value of a security, C&S shall consider both short-term and long-term views about a company’s business and prospects, especially in light of our projected holding period on the stock (e.g., C&S may discount long-term views on a short-term holding).
IV. Specific Issues
Set forth below are guidelines as to how specific proxy voting issues shall be analyzed and assessed. While these guidelines will provide a framework for our decision making process, the mechanical application of these guidelines can never address all proxy voting decisions. When new issues arise or old issues present nuances not encountered before, C&S must be guided by its reasonable judgment to vote in a manner that C&S deems to be in the best interests of its clients.
A. Stock-Based Compensation
Approval of Plans or Plan Amendments. By their nature, compensation plans must be evaluated on a case-by-case basis. As a general matter, C&S always favors compensation plans that align the interests of management and shareholders. C&S generally approves compensation plans under the following conditions:
10% Rule. The dilution effect of the newly authorized shares, plus the shares reserved for issuance in connection with all other stock related plans, generally should not exceed 10%.
Exercise Price. The minimum exercise price of stock options should be at least equal to the market price of the stock on the date of grant.
Plan Amendments. Compensation plans should not be materially amended without shareholder approval.
Non-Employee Directors. Awards to non-employee directors should not be subject to management discretion, but rather should be made under non-discretionary grants specified by the terms of the plan.
Repricing/Replacement of Underwater Options. Stock options generally should not be re-priced, and never should be re-priced without shareholder approval. In addition, companies should not issue new options, with a lower strike price, to make up for previously issued options that are substantially underwater. C&S will vote against the election of any slate of directors that, to its knowledge, has authorized a company to re-price or replace underwater options during the most recent year without shareholder approval.
Reload/Evergreen Features. We will generally vote against plans that enable the issuance of reload options and that provide an automatic share replenishment (“evergreen”) feature.
Measures to Increase Executive Long-Term Stock Ownership. We support measures to increase the long-term stock ownership by a company’s executives. These include requiring senior executives to hold a minimum amount of stock in a company (often expressed as a percentage of annual compensation), requiring stock acquired through option exercise to be held for a certain minimum amount of time, and issuing restricted stock awards instead of options. In this respect, we support the expensing of option grants because it removes the incentive of a company to issue options in lieu of restricted stock. We also support employee stock purchase plans, although we generally believe the discounted purchase price should be at least 85% of the current market price.
Vesting. Restricted stock awards normally should vest over at least a two-year period.
Other stock awards. Stock awards other than stock options and restricted stock awards should be granted in lieu of salary or a cash bonus, and the number of shares awarded should be reasonable.
B. Change of Control Issues
While we recognize that a takeover attempt can be a significant distraction for the board and management to deal with, the simple fact is that the possibility of a corporate takeover keeps management focused on maximizing shareholder value. As a result, C&S opposes measures that are designed to prevent or obstruct corporate takeovers because they can entrench current management. The following are C&S’s guidelines on change of control issues:
Shareholder Rights Plans. C&S acknowledges that there are arguments for and against shareholder rights plans, also known as “poison pills.” Companies should put their case for rights plans to shareholders. We generally vote against any directors who, without shareholder approval, to our knowledge have instituted a new poison pill plan, extended an existing plan, or adopted a new plan upon the expiration of an existing plan during the past year.
Golden Parachutes. C&S opposes the use of accelerated employment contracts that result in cash grants of greater than three times annual compensation (salary and bonus) in the event of termination of employment following a change in control of a company. In general, the guidelines call for voting against “golden parachute” plans because they impede potential takeovers that shareholders should be free to consider. We generally withhold our votes at the next shareholder meeting for directors who to our knowledge approved golden parachutes.
Approval of Mergers – C&S votes against proposals that require a super-majority of shareholders to approve a merger or other significant business combination. We support proposals that seek to lower super-majority voting requirements.
C. Routine Issues
Director Nominees in a Non-Contested Election – C&S generally votes in favor of management proposals on director nominees.
Director Nominees in a Contested Election – By definition, this type of board candidate or slate runs for the purpose of seeking a significant change in corporate policy or control. Therefore, the economic impact of the vote in favor of or in opposition to that director or slate must be analyzed using a higher standard normally applied to changes in control. Criteria for evaluating director nominees as a group or individually should include: performance; compensation, corporate governance provisions and takeover activity; criminal activity; attendance at meetings; investment in the company; interlocking directorships; inside, outside and independent directors; whether the chairman and CEO titles are held by the same person; number of other board seats; and other experience. It is impossible to have a general policy regarding director nominees in a contested election.
Board Composition – C&S supports the election of a board that consists of at least a majority of independent directors. We generally withhold our support for non-independent directors who serve on a company’s audit, compensation and/or nominating committees. We also generally withhold support for director candidates who have not attended a sufficient number of board or committee meetings to effectively discharge their duties as directors.
Classified Boards – Because a classified board structure prevents shareholders from electing a full slate of directors at annual meetings, C&S generally votes against classified boards. We vote in favor of shareholder proposals to declassify a board of directors unless a company’s charter or governing corporate law allows shareholders, by written consent, to remove a majority of directors at any time, with or without cause.
Barriers to Shareholder Action – We vote to support proposals that lower the barriers to shareholder action. This includes the right of shareholders to call a meeting and the right of shareholders to act by written consent.
Cumulative Voting – Having the ability to cumulate our votes for the election of directors – that is, cast more than one vote for a director about whom they feel strongly – generally increases shareholders’ rights to effect change in the management of a corporation. We generally support, therefore, proposals to adopt cumulative voting.
Ratification of Auditors – Votes generally are cast in favor of proposals to ratify an independent auditor, unless there is a reason to believe the auditing firm is no longer performing its required duties or there are exigent circumstances requiring us to vote against the approval of the recommended auditor. For example, our general policy is to vote against an independent auditor that receives more than 50% of its total fees from a company for non-audit services.
D. Stock Related Items
Increase Additional Common Stock – C&S’s guidelines generally call for approval of increases in authorized shares, provided that the increase is not greater than three times the number of shares outstanding and reserved for issuance (including shares reserved for stock-related plans and securities convertible into common stock, but not shares reserved for any poison pill plan).
Votes generally are cast in favor of proposals to authorize additional shares of stock except where the proposal:
1. creates a blank check preferred stock; or
2. establishes classes of stock with superior voting rights.
Blank Check Preferred Stock – Votes generally are cast in opposition to management proposals authorizing the creation of new classes of preferred stock with unspecific voting, conversion, distribution and other rights, and management proposals to increase the number of authorized blank check preferred shares. C&S may vote in favor of this type of proposal when it receives assurances to its reasonable satisfaction that (i) the preferred stock was authorized by the board for the use of legitimate capital formation purposes and not for anti-takeover purposes, and (ii) no preferred stock will be issued with voting power that is disproportionate to the economic interests of the preferred stock. These representations should be made either in the proxy statement or in a separate letter from the company to C&S.
Preemptive Rights – Votes are cast in favor of shareholder proposals restoring limited preemptive rights.
Dual Class Capitalizations – Because classes of common stock with unequal voting rights limit the rights of certain shareholders, C&S votes against adoption of a dual or multiple class capitalization structure.
E. Social Issues
C&S believes that it is the responsibility of the board and management to run a company on a daily basis. With this in mind, in the absence of unusual circumstances, we do not believe that shareholders should be involved in determining how a company should address broad social and policy issues. As a result, we generally vote against these types of proposals, which are generally initiated by shareholders, unless we believe the proposal has significant economic implications.
F. Other Situations
No set of guidelines can anticipate all situations that may arise. Our portfolio managers and analysts will be expected to analyze proxy proposals in an effort to gauge the impact of a proposal on the financial prospects of a company, and vote accordingly. These policies are intended to provide guidelines for voting. They are not, however, hard and fast rules because corporate governance issues are so varied.
V. Proxy Voting Procedures
C&S shall maintain a record of all voting decisions for the period required by applicable laws. In each case in which C&S votes contrary to the stated policies set forth in these guidelines, the record shall indicate the reason for such a vote.
The Investment Committee of C&S shall have responsibility for voting proxies. The Investment Committee shall appoint a designee (the “Designee”) who shall be responsible for ensuring that the Investment Committee is aware of all upcoming proxy voting opportunities. The Designee shall ensure that proxy votes are properly recorded and that the requisite information regarding each proxy voting opportunity is maintained. The General Counsel of C&S shall have overall responsibility for ensuring that C&S complies with all proxy voting requirements and procedures.
VI. Recordkeeping
The Designee shall be responsible for recording and maintaining the following information with respect to each proxy voted by C&S:
* Name of the company
* Ticker symbol
* CUSIP number
* Shareholder meeting date
* Brief identification of each matter voted upon
* Whether the matter was proposed by management or a shareholder
* Whether C&S voted on the matter
* If C&S voted, then how C&S voted
* Whether C&S voted with or against management
The General Counsel of C&S shall be responsible for maintaining and updating these Policies and Procedures, and for maintaining any records of written client requests for proxy voting information. The General Counsel shall ensure that the Investment Committee maintains documents that were prepared by C&S and were deemed material to making a voting decision or that memorialized the basis for the decision.
C&S shall rely on the SEC’s EDGAR filing system with respect to the requirement to maintain proxy materials regarding client securities.
VII. Conflicts of Interest
There may be situations in which C&S may face a conflict between its interests and those of its clients or fund shareholders. Potential conflicts are most likely to fall into three general categories:
* Business Relationships – This type of conflict would occur if C&S or an affiliate has a substantial business relationship with the company or a proponent of a proxy proposal relating to
the company (such as an employee group) such that failure to vote in favor of management (or the proponent) could harm the relationship of C&S or its affiliate with the company or proponent. In the context of C&S, this could occur if Cohen & Steers Capital Advisors, a wholly owned subsidiary of C&S (“Capital Advisors”), has a material business relationship with a company that C&S has invested in on behalf of its clients, and C&S is encouraged to vote in favor of management as an inducement to acquire or maintain the Capital Advisors relationship.
* Personal Relationships – C&S or an affiliate could have a personal relationship with other proponents of proxy proposals, participants in proxy contests, corporate directors or director nominees.
* Familial Relationships – C&S or an affiliate could have a familial relationship relating to a company (e.g., spouse or other relative who serves as a director or nominee of a public company).
The next step is to identify if a conflict is material. A material matter is one that is reasonably likely to be viewed as important by the average shareholder. Materiality will be judged under a two-step approach:
* Financial Based Materiality – C&S presumes a conflict to be non-material unless it involves at least $500,000.
* Non-Financial Based Materiality – Non-financial based materiality would impact the members of the C&S Investment Committee, who are responsible for making proxy voting decisions.
Finally, if a material conflict exists, C&S shall vote in accordance with the advice of a proxy voting service. C&S currently uses ISS to provide advice on proxy voting decisions.
The General Counsel of C&S shall have responsibility for supervising and monitoring conflicts of interest in the proxy voting process according to the following process:
1. Identifying Conflicts – The General Counsel of C&S is responsible for monitoring the relationships of Capital Advisors for purposes of C&S’s Inside Information Policies and Procedures. The General Counsel of C&S (or his designee) maintains a watch list and a restricted list. The Investment Committee is unaware of the content of the watch list and therefore it is only those companies on the restricted list, which is made known to everyone at C&S, for which potential concerns might arise. When a company is placed on the restricted list, the General Counsel of C&S(or his designee) shall promptly inquire of the Designee as to whether there is a pending proxy voting opportunity with respect to that company, and continue to inquire on a weekly basis until such time as the company is no longer included on the restricted list. When there is a proxy voting opportunity with respect to a company that has been placed on the restricted list, the General Counsel of C&S shall inform the Investment Committee that no proxy vote is to be submitted for that company until the General Counsel completes the conflicts analysis.
For purposes of monitoring personal or familial relationships, the General Counsel of C&S (or his designee) shall notify on at least an annual basis the members of the Investment Committee of their obligation to disclose any personal or familial relationships with a portfolio company that could raise potential conflict of interest concerns. Investment Committee members shall also advise the General Counsel of C&S (or his designee) if (i) there are material changes to any previously furnished information, (ii) a person with whom a personal or familial relationship exists is subsequently nominated as a director or (iii) a personal or familial relationship exists with any proponent of a proxy proposal or a participant in a proxy contest.
2. Identifying Materiality –The General Counsel of C&S (or his designee) shall be responsible for determining whether a conflict is material. He shall evaluate financial based materiality in terms of both actual and potential fees to be received. Non-financial based items impacting a member of the Investment Committee shall be presumed to be material.
3. Communication with Investment Committee; Voting of Proxy –If the General Counsel of C&S determines that the relationship between Capital Advisors and a company is financially material, he shall communicate that information to the members of the Investment Committee and instruct them, and the Designee, that C&S will vote its proxy based on the advice of ISS or other consulting firm then engaged by C&S. Any personal or familial relationship, or any other business relationship, that exists between a company and any member of the Investment Committee shall be presumed to be material, in which case C&S again will vote its proxy based on the advice of ISS or other consulting firm then engaged by C&S. The fact that a member of the Investment Committee personally owns securities issued by a company will not disqualify C&S from voting common stock issued by that company, since the member’s personal and professional interests will be aligned.
In cases in which C&S will vote its proxy based on the advice of ISS or other consulting firm then engaged by C&S, the General Counsel of C&S (or his designee) shall be responsible for ensuring that the Designee votes proxies in this manner. The General Counsel of C&S will maintain a written record of each instance when a conflict arises and how the conflict is resolved (e.g., whether the conflict is judged to be material, the basis on which the materiality is decision is made and how the proxy is voted).
VIII. Cohen & Steers Funds
Proxies relating to portfolio securities held by any Cohen & Steers Fund shall be voted in accordance with this Statement of Policies and Procedures. For this purpose, the Board of Directors of the Cohen & Steers Funds has delegated to C&S the responsibility for voting proxies on behalf of the Funds. The General Counsel of C&S shall make an annual presentation to the Board regarding this Statement of Policy and Procedures, including whether any revisions are recommended, and shall report to the Board at each regular, quarterly meeting with respect to any conflict of interest situation that arose regarding the proxy voting process.
IX. Annual Review; Reporting
The chief compliance officer (CCO) of C&S (or his designee) shall conduct an annual review to assess compliance with these policies and procedures. This review will include sampling a
limited number of proxy votes during the prior year to determine if they were consistent with these policies and procedures. The results of this review will be reported to the General Counsel of C&S and the CCO of the Funds.
Any violations of these policies and procedures shall be reported to the General Counsel or CCO of C&S. If the violation relates to any Cohen & Steers Fund, the General Counsel or CCO of C&S shall report such violation to the CCO of the Funds.
Item 8. Portfolio Managers of Closed-End Investment Companies.
Information pertaining to the portfolio managers of the registrant, as of February 29, 2008, is set forth below.
Martin Cohen
· Director and co-chairman
· Portfolio manager since inception |
| Co-founder, co-chairman and co-chief executive officer of Cohen & Steers Capital Management, Inc. (“C&S”) and its parent company, Cohen & Steers, Inc. (“CNS”). Vice president and director of Cohen & Steers Securities, LLC. Director and |
|
|
|
Robert Steers
· Director and co-chairman
· Portfolio manager since inception |
| Co-founder, co-chairman and co-chief executive officer of C&S and CNS. Vice President and Director of Cohen & Steers Securities, LLC. Director and co-chairman of each of the Cohen & Steers funds. Previously, chairman of C&S and each of the Cohen & Steers funds. |
|
|
|
Joseph Harvey
· Vice president
· Portfolio manager since 2004 |
| President of C&S and CNS. Previously, senior vice president of C&S and director of research. |
|
|
|
William F. Scapell
· Vice President
· Portfolio manager since inception |
| Senior vice president of C&S. Previously, chief strategist for preferred securities at Merrill Lynch & Co. |
|
|
|
Robert Becker
· Vice President
· Portfolio manager since inception |
| Senior vice president of C&S. Previously, co-portfolio manager for the Franklin Utilities Fund at Franklin Templeton Investments. |
Thomas Bohjalian
· Vice President
· Portfolio manager since 2006 |
| Senior vice president of C&S. Previously, vice president of C&S. |
C&S utilizes a team-based approach in managing the registrant. Mr. Cohen and Mr. Steers are the leaders of this team and they act in a supervisory capacity. Mr. Harvey, Mr. Becker and Mr. Bohjalian direct and supervise the execution of the registrant’s investment strategy, and lead and guide the other members of the team. Mr. Scapell manages the registrant’s preferred securities investments.
Each portfolio manager listed above manages other investment companies and/or investment vehicles and accounts in addition to the registrant. The following tables show, as of December 31, 2007, the number of accounts each portfolio manager managed in each of the listed categories and the total assets in the accounts managed within each category. The portfolio managers do not receive performance-based fees with respect to any of the registered investment companies, other pooled investment vehicles or other accounts that they manage.
Martin Cohen
|
| Number of accounts |
| Total assets |
| |
|
|
|
|
|
| |
· Registered investment companies |
| 20 |
| $ | 16,852,445,000 |
|
|
|
|
|
|
|
|
· Other pooled investment vehicles |
| 23 |
| $ | 5,601,817,000 |
|
|
|
|
|
|
|
|
· Other accounts |
| 52 |
| $ | 4,152,287,000 |
|
Robert Steers
|
| Number of accounts |
| Total assets |
| |
|
|
|
|
|
| |
· Registered investment companies |
| 20 |
| $ | 16,852,445,000 |
|
|
|
|
|
|
|
|
· Other pooled investment vehicles |
| 23 |
| $ | 5,601,817,000 |
|
|
|
|
|
|
|
|
· Other accounts |
| 52 |
| $ | 4,152,287,000 |
|
Joseph Harvey
|
| Number of accounts |
| Total assets |
| |
|
|
|
|
|
| |
· Registered investment companies |
| 20 |
| $ | 16,852,445,000 |
|
|
|
|
|
|
|
|
· Other pooled investment vehicles |
| 23 |
| $ | 5,601,817,000 |
|
|
|
|
|
|
|
|
· Other accounts |
| 52 |
| $ | 4,152,287,000 |
|
William F. Scapell
|
| Number of accounts |
| Total assets |
| |
|
|
|
|
|
| |
· Registered investment companies |
| 10 |
| $ | 10,372,197,000 |
|
|
|
|
|
|
|
|
· Other pooled investment vehicles |
| 2 |
| $ | 66,154,000 |
|
|
|
|
|
|
|
|
· Other accounts |
| 13 |
| $ | 556,978,000 |
|
Robert Becker
|
| Number of accounts |
| Total assets |
| |
|
|
|
|
|
| |
· Registered investment companies |
| 4 |
| $ | 4,698,016,000 |
|
|
|
|
|
|
|
|
· Other pooled investment vehicles |
| 0 |
| $ | 0 |
|
|
|
|
|
|
|
|
· Other accounts |
| 0 |
| $ | 0 |
|
Thomas Bohjalian
|
| Number of accounts |
| Total assets |
| |
|
|
|
|
|
| |
· Registered investment companies |
| 7 |
| $ | 7,437,844,000 |
|
|
|
|
|
|
|
|
· Other pooled investment vehicles |
| 2 |
| $ | 66,154,000 |
|
|
|
|
|
|
|
|
· Other accounts |
| 8 |
| $ | 378,527,000 |
|
Share Ownership. The following table indicates the dollar range of securities of the registrant owned by the registrant’s portfolio managers as of December 31, 2007:
|
| Dollar Range of Securities Owned |
|
Martin Cohen |
| $500,001 - $1,000,000 |
|
Robert Steers |
| $500,001 - $1,000,000 |
|
Joseph Harvey |
| None |
|
William F. Scapell |
| None |
|
Robert Becker |
| None |
|
Thomas Bohjalian |
| None |
|
Conflicts of Interest. It is possible that conflicts of interest may arise in connection with the portfolio managers’ management of the registrant’s investments on the one hand and the investments of other accounts or vehicles for which the portfolio managers are responsible on the other. For example, a portfolio manager may have conflicts of interest in allocating management time, resources and investment opportunities among the registrant and the other accounts or vehicles he advises. In addition, due to differences in the investment strategies or restrictions among the registrant and the other accounts, a portfolio manager may take action with respect to another account that differs from the action taken with respect to the registrant.
In some cases, another account managed by a portfolio manager may provide more revenue to C&S. While this may appear to create additional conflicts of interest for the portfolio manager in the allocation of management time, resources and investment opportunities, C&S strives to ensure that portfolio managers endeavor to exercise their discretion in a manner that is equitable to all interested persons. In this regard, in the absence of specific account-related impediments (such as client-imposed restrictions or lack of available cash), it is the policy of C&S to allocate investment ideas pro rata to all accounts with the same primary investment objective.
In addition, certain of the portfolio managers may from time to time manage one or more accounts on behalf of C&S and its affiliated companies (the “CNS Accounts”). Certain securities held in the CNS Accounts also may be held in the account of the registrant or other client accounts of C&S. C&S has adopted procedures that are designed to ensure that the interests of the CNS Accounts are never placed ahead of the interests of the registrant or any other client account. In this regard, C&S will not purchase or sell a security for the CNS Accounts until C&S has completed its purchase or sale program for the registrant and any other client accounts. While it is possible that a security will be sold out of the CNS Accounts but continue to be held for the registrant or one or more other client accounts, this will occur only if C&S, acting in its reasonable judgment and consistent with its fiduciary duties, believes this to be appropriate for, and consistent with the objectives and profile of, the registrant or other client accounts.
Advisor Compensation Structure. Compensation of the Advisor’s portfolio managers and other investment professionals has three primary components: (1) a base salary, (2) an annual cash bonus and (3) annual stock-based compensation consisting generally of restricted stock units of the Advisor’s parent, CNS. The Advisor’s investment professionals, including the portfolio managers, also receive certain retirement, insurance and other benefits that are broadly available to all of its employees. Compensation of the Advisor’s investment professionals is reviewed primarily on an annual basis.
Method to Determine Compensation. The Advisor compensates its portfolio managers based primarily on the total return performance of funds and accounts managed by the portfolio manager versus appropriate peer groups or benchmarks. In evaluating the performance of a portfolio manager, primary emphasis is normally placed on one- and three-year performance, with secondary consideration of performance over longer periods of time. Performance is evaluated on a pre-tax and pre-expense basis. In addition to rankings within peer groups of funds on the basis of absolute performance, consideration may also be given to risk-adjusted performance. For funds and accounts with a primary investment objective of high current income, consideration will also be given to the fund’s and account’s success in achieving this objective. For portfolio managers responsible for multiple funds and accounts, investment performance is evaluated on an aggregate basis. The Advisor does not have any funds or accounts with performance-based advisory fees. Portfolio managers are also evaluated on the basis of their success in managing their dedicated team of analysts. Base compensation for portfolio managers of the Advisor varies in line with the portfolio manager’s seniority and position with the firm.
Salaries, bonuses and stock-based compensation are also influenced by the operating performance of the Advisor and CNS. While the annual salaries of the Advisor’s portfolio managers are fixed, cash bonuses and stock based compensation may fluctuate significantly from year to year, based on changes in manager performance and other factors.
Item 9. Purchases of Equity Securities by Closed-End Management Investment Company and Affiliated Purchasers.
Not applicable.
Item 10. Submission of Matters to a Vote of Security Holders.
Not applicable.
Item 11. Controls and Procedures.
(a) The registrant’s principal executive officer and principal financial officer have concluded that the registrant’s disclosure controls and procedures are reasonably designed to ensure that information required to be disclosed by the registrant in this Form N-CSR was recorded, processed, summarized and reported within the time periods specified in the Securities and Exchange Commission’s rules and forms, based upon such officers’ evaluation of these controls and procedures as of a date within 90 days of the filing date of this report.
(b) There were no changes in the registrant’s internal control over financial reporting that occurred during the second fiscal quarter of the period covered by this report that have materially affected, or are reasonably likely to materially affect, the registrant’s internal control over financial reporting.
Item 12. Exhibits.
(a)(1) Not applicable.
(a) (2) Certifications of principal executive officer and principal financial officer as required by Rule 30a-2(a) under the Investment Company Act of 1940.
(b) Certifications of chief executive officer and chief financial officer as required by Rule 30a-2(b) under the Investment Company Act of 1940.
SIGNATURES
Pursuant to the requirements of the Securities Exchange Act of 1934 and the Investment Company Act of 1940, the registrant has duly caused this report to be signed on its behalf by the undersigned, thereunto duly authorized.
COHEN & STEERS REIT AND UTILITY INCOME FUND, INC. |
|
| |||||
By: | /s/ | Adam M. Derechin |
| ||
Name: Adam M. Derechin | |||||
Title: President and Chief Executive Officer | |||||
| |||||
Date: | February 29, 2008 |
| |||
Pursuant to the requirements of the Securities Exchange Act of 1934 and the Investment Company Act of 1940, this report has been signed below by the following persons on behalf of the registrant and in the capacities and on the dates indicated.
By: | /s/ | Adam M. Derechin |
| ||
Name: Adam M. Derechin | |||||
Title: President and Chief Executive Officer | |||||
(principal executive officer) | |||||
| |||||
By: | /s/ | James Giallanza |
| ||
Name: James Giallanza | |||||
Title: Treasurer | |||||
(principal financial officer) | |||||
| |||||
| |||||
Date: | February 29, 2008 |
| |||