UNITED STATES
SECURITIES AND EXCHANGE COMMISSION
Washington, D.C. 20549
FORM N-CSR
CERTIFIED SHAREHOLDER REPORT OF REGISTERED
MANAGEMENT INVESTMENT COMPANIES
| | |
| Investment Company Act file number | | 811-21471 |
Nuveen Tax-Advantaged Total Return Strategy Fund
(Exact name of registrant as specified in charter)
Nuveen Investments
333 West Wacker Drive, Chicago, IL 60606
(Address of principal executive offices) (Zip code)
Gifford R. Zimmerman
Nuveen Investments
333 West Wacker Drive, Chicago, IL 60606
(Name and address of agent for service)
Registrant’s telephone number, including area code: (312) 917-7700
Date of fiscal year end: December 31
Date of reporting period: June 30, 2017
Form N-CSR is to be used by management investment companies to file reports with the Commission not later than 10 days after the transmission to stockholders of any report that is required to be transmitted to stockholders under Rule 30e-1 under the Investment Company Act of 1940 (17 CFR 270.30e-1). The Commission may use the information provided on Form N-CSR in its regulatory, disclosure review, inspection, and policy making roles.
A registrant is required to disclose the information specified by Form N-CSR, and the Commission will make this information public. A registrant is not required to respond to the collection of information contained in Form N-CSR unless the Form displays a currently valid Office of Management and Budget (“OMB”) control number. Please direct comments concerning the accuracy of the information collection burden estimate and any suggestions for reducing the burden to Secretary, Securities and Exchange Commission, 450 Fifth Street, NW, Washington, DC 20549-0609. The OMB has reviewed this collection of information under the clearance requirements of 44 U.S.C. ss.3507.
ITEM 1. REPORTS TO STOCKHOLDERS.
| | |
| | |  |
| Closed-End Funds | |
| | | | | | |
| | | | | | | Semi-Annual Report June 30, 2017 |
| | | |
| | | | | | |
| | | | | | | |
| JTA | | | | | | |
| Nuveen Tax-Advantaged Total Return Strategy Fund | | |
| | | | | | | | | | | | |
| | | | | | |
| | | | |
| | | | | | | | |
| |
| | Life is Complex |
| |
| | Nuveen makes things e-simple. It only takes a minute to sign up for e-Reports. Once enrolled, you’ll receive an e-mail as soon as your Nuveen Fund information is ready – no more waiting for delivery by regular mail. Just click on the link within the e-mail to see the report and save it on your computer if you wish. |
| | |
| | Free e-Reports right to your e-mail! |
| |
| | www.investordelivery.com If you receive your Nuveen Fund distributions and statements from your financial advisor or brokerage account. |
| |
| or | | www.nuveen.com/accountaccess If you receive your Nuveen Fund distributions and statements directly from Nuveen. |
Table
of Contents
Chairman’s Letter
to Shareholders

Dear Shareholders,
Some of the key assumptions driving the markets higher at the beginning of 2017 have recently come into question. Following the collapse of the health care reform bill in the Senate, progress on the rest of the White House’s pro-growth fiscal agenda, including tax reform and large infrastructure projects, is expected to be delayed. Economic growth projections, in turn, have been lowered, and with inflation recently waning, the markets are expecting fewer rate hikes from the Federal Reserve (Fed) than the Fed itself had predicted. Yet, asset prices continued to rise.
Investors have largely looked beyond policy disappointments and focused instead on the healthy profits reported by U.S. companies during the first two quarters of 2017. U.S. growth has remained slow and steady, European growth has surprised to the upside and concern that China would decelerate too rapidly has eased, further contributing to an optimistic tone in the markets. Additionally, political risk in Europe has moderated, with the election of mainstream candidates in the Dutch and French elections earlier this year.
The remainder of the year could bring challenges to this benign macro environment. The debt ceiling looms, with a vote needed from Congress to raise or suspend the nation’s borrowing limit before the Treasury is unable to pay its bills in full or on time (likely in early October). The mechanics of the U.K.’s separation from the European Union remain to be seen, as “Brexit” negotiations develop. A tightening of financial conditions in China or a more aggressive-than-expected policy action from the Fed, European Central Bank or Bank of Japan could also turn into headwinds.
Market volatility readings have been remarkably low lately, but conditions can change quickly. As market conditions evolve, Nuveen remains committed to rigorously assessing opportunities and risks. If you’re concerned about how resilient your investment portfolio might be, we encourage you to talk to your financial advisor. On behalf of the other members of the Nuveen Fund Board, we look forward to continuing to earn your trust in the months and years ahead.
Sincerely,

William J. Schneider
Chairman of the Board
August 23, 2017
Portfolio Managers’
Comments
Nuveen Tax-Advantaged Total Return Strategy Fund (JTA)
The Fund features portfolio management by two affiliates of Nuveen, LLC. The Fund’s investments in dividend-paying common and preferred stocks and call options written are managed by NWQ Investment Management Company, LLC (NWQ), while the Fund’s investments in senior corporate loans and other debt instruments are managed by Symphony Asset Management LLC (Symphony). James T. Stephenson, CFA, Managing Director of NWQ, along with Thomas J. Ray, CFA, and Susi Budiman, CFA, manage the NWQ portion of the Fund. The Symphony team is led by Gunther Stein, who serves as the firm’s Chief Investment Officer and Chief Executive Officer.
Here the portfolio management team reviews their management strategies and the performance of the Fund for the six-month reporting period ended June 30, 2017.
What key strategies were used to manage the Fund during this six-month reporting period ended June 30, 2017?
The Fund is designed to seek a high level of after-tax total return consisting primarily of tax-advantaged dividend income and capital appreciation. In pursuit of this objective, the Fund invests a substantial majority of its assets in common and preferred stocks whose dividends qualify for reduced income tax treatment. The Fund also invests a portion of its assets in senior loans to generate additional income and help mitigate the potential net asset value and income volatility of the Fund’s leverage structure due to changes in long-term and short-term interest rates. In an effort to achieve this, the Fund invests at least 60% in common stocks whose dividends may be eligible for favorable income tax treatment. The Fund also invests to a more limited extent in preferred stocks, which can range from a minimum of 5% to a maximum of 20%, that are eligible to pay tax-advantaged dividends, as well as 20% in senior loans and other debt instruments.
NWQ Key Strategies
For the common and preferred equity portion of the Fund’s portfolio, NWQ continued to employ an opportunistic, bottom-up strategy that focused on identifying undervalued companies possessing favorable risk/reward characteristics as well as what it thought were emerging catalysts that could unlock value or improve profitability. These catalysts included management changes, restructuring efforts, recognition of hidden assets and/or a positive change in the underlying fundamentals. We also focused on downside risk management and paid a great deal of attention to a
This material is not intended to be a recommendation or investment advice, does not constitute a solicitation to buy or sell securities, and is not provided in a fiduciary. The information provided does not take into account the specific objectives or circumstances of any particular investor, or suggest any specific course of action. Investment decisions should be made based on an investor’s objectives or circumstances and in consultation with his or her advisors.
Certain statements in this report are forward-looking statements. Discussions of specific investments are for illustration only and are not intended as recommendations of individual investments. The forward-looking statements and other views expressed herein are those of the portfolio managers as of the date of this report. Actual future results or occurrences may differ significantly from those anticipated in any forward-looking statements and the views expressed herein are subject to change at any time, due to numerous market and other factors. The Fund disclaims any obligation to update publicly or revise any forward-looking statements or views expressed herein.
For financial reporting purposes, the ratings disclosed are the highest rating given by one of the following national rating agencies: Standard & Poor’s (S&P), Moody’s Investors Service, Inc. (Moody’s) or Fitch, Inc. (Fitch). This treatment of split-rated securities may differ from that used for other purposes, such as for Fund investment policies. Credit ratings are subject to change. AAA, AA, A and BBB are investment grade ratings; BB, B, CCC, CC, C and D are below investment grade ratings. Certain bonds backed by U.S. Government or agency securities are regarded as having an implied rating equal to the rating of such securities. Holdings designated N/R are not rated by these national rating agencies.
Refer to the Glossary of Terms Used in this Report for further definition of the terms used within this section.
Portfolio Managers’ Comments (continued)
company’s balance sheet and cash flow statement, not just the income statement. NWQ believes that cash flow analysis offers a more objective picture of a company’s financial position than an evaluation based on earnings alone.
Within the global equity income strategy managed by NWQ, up to 70% of the Fund’s managed assets can be invested in non-U.S. issues of any currency, including up to 20% in emerging market countries. JTA’s investment objective is to achieve a high level of after-tax total return, consisting primarily of tax-advantaged dividend income and capital appreciation. The Fund seeks to obtain a dividend yield at least 100 basis points (bps) above the MSCI World Index and employs a value based approach in our bottom up analysis. NWQ looks for attractive absolute valuation, positive risk/reward with downside risk management and catalysts that can drive a positive revaluation of companies.
For the global equity portion of the Fund’s portfolio, NWQ’s global, value based strategy gives them plenty of opportunities to find not only attractive valuations, but high yields and a diversified portfolio. The Fund currently is overweight European equities. NWQ also believes the market underestimates the inherent operating leverage in many European companies due to the length of time they have had to rationalize their cost structures. Global financials also remain a target rich opportunity. NWQ focuses on companies with strong balance sheets on the cusp of returning significant amounts of cash to shareholders.
While economic concerns and persistently stubborn low interest rates have weighed on the names, NWQ feels the risk/ reward is heavily skewed to the upside. Balance sheets are improved, riskier businesses have been exited and valuations remain low. NWQ has found a variety of compelling opportunities across banks, insurance and services in numerous geographies. For the preferred securities portion of the Fund’s portfolio, NWQ reviews the specific characteristics of the preferred stocks available for investment and evaluate the effect on holding such an investment. These characteristics might include price, yield, issuer, rating, liquidity premium/discount and any other potential issues that can affect the value of the position. Additionally, because the preferred market is concentrated both by issuer and industry, attention is focused on the diversification of the Fund.
Symphony Key Strategies
In the senior loan and other debt portion of the Fund’s portfolio, Symphony continued to manage and monitor senior loan market risks. The overall macroeconomic backdrop during the reporting period remained supportive of the leveraged loan asset class. The Fund’s capital remained invested in issuers with strong credit profiles among non-investment grade debt, while offering attractive current income and yield. Fundamentally, Symphony feels that many of these companies have stable businesses, good asset coverage for senior debt holders and could perform well in a stable to slow growth environment.
How did the Fund perform during this six-month reporting period ended June 30, 2017?
The table in the Performance Overview and Holding Summaries section of this report provides total returns for the six-month, one-year, five-year and ten-year periods ended June 30, 2017. The Fund’s total returns at net asset value (NAV) are compared with the performance of a corresponding market index. For the six-month reporting period ended June 30, 2017, the Fund’s common share at NAV outperformed the S&P 500® Index and both its new and old secondary Blended Benchmarks.
NWQ
The equity portion of the Fund’s portfolio, managed by NWQ, contributed to the Fund’s outperformance versus its new blended benchmark given positive stock selection in the financial services and information technology sectors, as well as lower exposure to the weak energy sector. This was partially offset by weakness in the consumer discretionary, health care and consumer staples sectors. Geographically, the Fund’s investments in Germany, the Netherlands and Australia helped performance, while investments in the U.S., Switzerland, and Israel detracted from performance.
Individual holdings that positively contributed to performance included information technology holding Oracle Corporation. The enterprise software provider appreciated as its earnings showed an acceleration in cloud and database revenue growth. Also positively contributing to performance was utilities holding Veolia Environment S.A., which reported solid second quarter earnings. Our thesis for Veolia hinges on improving free-cash-flow through cost-cutting and the shedding of unprofitable contracts and the company should benefit from a liberalization of the French economy that may allow them to cut headcount at a faster rate. Finally, Dutch multi-national banking and financial services firm, ING Groep N.V., appreciated given results of the European elections and the improving economy. NWQ believes ING will be one of the better performing names among its peers.
Positions that detracted from performance include consumer discretionary holding National CineMedia, Inc., which declined after reporting weaker than expected first quarter earnings and significantly reduced annual guidance due to lower theater advertising spend expectations. NWQ views National CineMedia as a company in transition from a legacy, local-centric advertising platform, to a more interactive millennial-focused national platform. Although this transition may take longer than expected as the company is facing cyclical advertising weakness, NWQ views National CineMedia as one of the few ways to target a hard-to-reach demographic. NWQ also believes that due to its relationship with exhibitors, National CineMedia’s dividend is sustainable. Telecommunication services holding Frontier Communications Corporation also detracted from performance. The company recently acquired assets from Verizon in California, Texas and Florida and the integration has gone worse than expected. NWQ eliminated the position during the reporting period. Lastly, materials sector holding CVR Partners LP detracted from performance. CVR is a Master Limited Partnership that formed to own, operate and grow its nitrogen fertilizer business. Though there was a rebound in ammonia pricing, this rally was short-lived due to ramping competitive capacity and a delayed planting season that allowed more product to make its way into the Midwest in time for application. NWQ expects ammonia pricing to remain near trough levels for the remainder of the year before rebounding in 2018 and beyond.
For the preferred portion managed by NWQ, all sectors and holdings positively contributed to performance. Preferred holdings in the financial sector performed particularly well, including KeyCorp and Wells Fargo & Company. KeyCorp, the top contributor for the reporting period, is one of the largest U.S bank-based financial services companies. It announced fourth quarter 2016 earnings that beat expectations. In addition, KeyCorp. completed its acquisition of First Niagara more quickly than originally thought, which bodes well for future growth. Wells Fargo was another key contributor. NWQ identified this investment opportunity in late 2015 as this convertible preferred security offered an attractive yield pick-up versus Wells Fargo’s straight preferred. It is commonly overlooked by dedicated convertible managers due to a lack of sensitivity to Wells Fargo’s common stock, and by preferred managers given it’s classification as a convertible. The security is beginning to gain attention from preferred managers as they seek yield opportunities in the asset class and was added to the iShares U.S. Preferred Stock ETF holdings. The yield decline in long maturity securities also helped support the move of this preferred given its longer duration. Another top contributor was industrial sector holding CHS Inc. The agricultural and energy cooperative CHS intends to issue $20 million in new Class B Series 1 Preferred Stock, which was well received. No positions detracted during the reporting period.
The Fund also writes call options on individual stocks, while investing in these same stocks, to enhance returns while foregoing some upside potential. The effect on performance for the reporting period was negligible.
Symphony
The senior loan and other debt instruments portion of the Fund’s portfolio, managed by Symphony, contributed positively to the Fund’s performance during the reporting period. All sectors positively contributed to overall performance, with the exception of the energy sector which detracted from performance. In particular, the consumer discretionary, information technology and health care sectors were the strongest performers during the reporting period.
The Fund’s position in consumer discretionary holdings, Cumulus Media, Inc. and Seaworld Parks and Entertainment, Inc. contributed to performance. During the reporting period, the large broadcasting company reported it has taken
Portfolio Managers’ Comments (continued)
steps to block possible takeover attempts. Cumulus’ board adopted a rights agreement designed to protect the Company’s substantial net operating loss carryforwards in order to preserve the Company’s long-term value and maintain the integrity of the Company’s ongoing restructuring process. The loans appreciated on the news. Also positively contributing were the loans of Seaworld Parks and Entertainment, Inc. The loans contributed nicely to returns as a proposed $400 million five year term loan B-4 and $400 million seven year term loan B-5 were announced during the period. The proceeds of the proposed term loan B-4 and B-5 would refinance approximately $544 million of the $1.328 billion term loan B-2 and all of the $246 million term loan B-3 as well as pay transaction expenses. The transaction is expected to increase debt by $10 million and extend out a portion of its debt schedule to 2022 and 2024 from 2020. Additionally, performance was benefited by the loan of health care holding Community Health Systems, Inc. During the reporting period, the company announced the sale of several of its hospitals in an ongoing effort to reduce its debt. The loans appreciated on the news.
The specific loans that detracted from performance included positions in industrial sector holding Harvey Gulf International Marine, LLC. The company provides service vessels to support offshore drilling and production operations predominantly in the U.S. Gulf of Mexico. During the reporting period, the loans were downgraded, a reflection of its escalating financial leverage and weak liquidity. Also detracting from performance was our consumer discretionary holding, Petco Animal Supplies, Inc. The loans of the specialty retailer of pet food, supplies and services sold off during the reporting period, as the company continues to consolidate stores in the wake of lagging sales as it repositions its business to better compete with online retailers. Lastly, energy sector holding Fieldwood Energy LLC detracted from performance. Energy-related companies continue to be pressured by sagging energy and commodity prices. Oil prices fell below $43 per barrel despite an announcement by the Organization of the Petroleum Exporting Countries (OPEC) to extend its production cut through March 2018.
Fund
Leverage
IMPACT OF THE FUND’S LEVERAGE STRATEGY ON PERFORMANCE
One important factor impacting the return of the Fund relative to its comparative benchmarks was the Fund’s use of leverage through the use of bank borrowings. The Fund uses leverage because our research has shown that, over time, leveraging provides opportunities for additional income and total return for common shareholders. However, use of leverage also can expose common shareholders to additional volatility. For example, as the prices of securities held by the Fund decline, the negative impact of these valuation changes on common share NAV and common shareholder total return is magnified by the use of leverage. Conversely, leverage may enhance common share returns during periods when the prices of securities held by the Fund generally are rising. The Fund’s use of leverage had a positive impact on performance during this reporting period.
The Fund continued to utilize forward starting interest rate swap contracts to partially hedge its future interest cost of leverage, which as mentioned previously, is through the use of bank borrowings. The swap contracts had a positive impact on performance during this reporting period.
As of June 30, 2017, the Fund’s percentages of leverage are as shown in the accompanying table.
| | | | |
| | | JTA | |
Effective Leverage* | | | 30.69 | % |
Regulatory Leverage* | | | 30.69 | % |
| * | Effective leverage is the Fund’s effective economic leverage, and includes both regulatory leverage and the leverage effects of certain derivative and other investments in a Fund’s portfolio that increase the Fund’s investment exposure. Regulatory leverage consists of preferred shares issued or borrowings of the Fund. Both of these are part of the Fund’s capital structure. The Fund, however, may from time to time borrow on a typically transient basis in connection with its day-to-day operations, primarily In connection with the need to settle portfolio trades. Such incidental borrowings are excluded from the calculation of the Fund’s effective leverage ratio. Regulatory leverage is subject to asset coverage limits set forth in the Investment Company Act of 1940. |
THE FUND’S REGULATORY LEVERAGE
Bank Borrowings
As noted above, the Fund employs leverage through the use of bank borrowings. The Fund’s bank borrowing activities are as shown in the accompanying table.
| | | | | | | | | | | | | | | | | | | | | | | | | | | | | | | | | | |
| Current Reporting Period | | | | | | Subsequent to the Close of
the Reporting Period | |
| January 1, 2017 | | | Draws | | | Paydowns | | | June 30, 2017 | | | Average Balance
Outstanding | | | | | | Draws | | | Paydowns | | | August 25, 2017 | |
| | $76,800,000 | | | | $7,000,000 | | | | $ — | | | | $83,800,000 | | | | $77,467,956 | | | | | | | | $ — | | | | $ — | | | | $83,800,000 | |
Refer to Notes to Financial Statements, Note 9 – Borrowing Arrangements for further details.
Common Share
Information
DISTRIBUTION INFORMATION
The following information regarding the Fund’s distributions is current as of May 31, 2017, the date of the distribution data included within the Fund’s most recent distribution notice at the time this report was prepared. The Fund’s distribution levels may vary over time based on the Fund’s investment activities and portfolio investment value changes.
The Fund has adopted a managed distribution program. The goal of the Fund’s managed distribution program is to provide shareholders relatively consistent and predictable cash flow by systematically converting its expected long-term return potential into regular distributions. As a result, regular distributions throughout the year will likely include a portion of expected long-term and/or short-term gains (both realized and unrealized), along with net investment income.
Important points to understand about Nuveen fund managed distributions are:
| • | | The Fund seeks to establish a relatively stable common share distribution rate that roughly corresponds to the projected total return from its investment strategy over an extended period of time. However, you should not draw any conclusions about the Fund’s past or future investment performance from its current distribution rate. |
| • | | Actual common share returns will differ from projected long-term returns (and therefore the Fund’s distribution rate), at least over shorter time periods. Over a specific timeframe, the difference between actual returns and total distributions will be reflected in an increasing (returns exceed distributions) or a decreasing (distributions exceed returns) Fund net asset value. |
| • | | Each period’s distributions are expected to be paid from some or all of the following sources: |
| | • | | net investment income consisting of regular interest and dividends, |
| | • | | net realized gains from portfolio investments, and |
| | • | | unrealized gains, or, in certain cases, a return of principal (non-taxable distributions). |
| • | | A non-taxable distribution is a payment of a portion of the Fund’s capital. When the Fund’s returns exceed distributions, it may represent portfolio gains generated, but not realized as a taxable capital gain. In periods when the Fund’s returns fall short of distributions, it will represent a portion of your original principal unless the shortfall is offset during other time periods over the life of your investment (previous or subsequent) when the Fund’s total return exceeds distributions. |
| • | | Because distribution source estimates are updated throughout the current fiscal year based on the Fund’s performance, these estimates may differ from both the tax information reported to you in the Fund’s 1099 statement, as well as the ultimate economic sources of distributions over the life of your investment. |
The following table provides information regarding the Fund’s distributions and total return performance over various time periods. This information is intended to help you better understand whether the Fund’s returns for the specified time periods were sufficient to meet its distributions.
Data as of May 31, 2017
| | | | | | | | | | | | | | | | | | | | | | | | | | | | | | | | | | | | | | | | |
| | | Per Share Distributions | | | | | | | | | | | | | | | Annualized Total Return
on NAV | | | | |
Inception
Date | | Quarterly | | | Monthly
Equivalent | | | Monthly
Net
Investment
Income1 | | | YTD Net
Realized
Gain/Loss2 | | | Inception
Unrealized
Gain/Loss2 | | | Current
Distribution
Rate on NAV3 | | | 1-Year | | | 5-Year | | | YTD | | | YTD
Distribution
Rate on NAV4 | |
01/2004 | | | $0.2480 | | | | $0.0827 | | | | $0.0539 | | | | $(0.0719) | | | | $2.1257 | | | | 7.26% | | | | 12.87% | | | | 12.82% | | | | 9.49% | | | | 3.63% | |
| 1 | Net investment income is expressed as a monthly amount using a six-month average. |
| 2 | These are approximations. Actual amounts may be more or less than amounts listed above. |
| 3 | Current distribution, annualized, expressed over the most recent month-end NAV. |
| 4 | Sum of year-to-date distributions expressed over the most recent month-end NAV. |
The following table provides estimates of the Fund’s distribution sources, reflecting year-to-date cumulative experience through the latest month-end. These estimates are for informational purposes only. The Fund attributes these estimates equally to each regular distribution throughout the year. Consequently, the estimated information shown below is for the current distribution, and also represents an updated estimate for all prior months in the year.
The amounts and sources of distributions reported in this notice are only estimates and are not being provided for tax reporting purposes. The actual amounts and character of the distributions for tax reporting purposes will be reported to shareholders on Form 1099-DIV which will be sent to shareholders shortly after calendar year-end. More details about the Fund’s distributions and the basis for these estimates are available on www.nuveen.com/cef.
Data as of May 31, 2017
| | | | | | | | | | | | | | | | | | | | | | | | | | | | | | |
| | | | Current Quarter | | | Calendar YTD | |
| | | | Estimated Source of Distribution | | | Estimated Per Share Amounts | |
Per Share
Distribution | | | Net
Investment
Income1 | | | Realized
Gains | | | Return of
Capital2 | | | Distributions3 | | | Net
Investment
Income1 | | | Realized
Gains | | | Return
of
Capital2 | |
| | $0.2480 | | | | 71.0% | | | | 0.0% | | | | 29.0% | | | | $0.4960 | | | | $0.3524 | | | | $ — | | | | $0.1436 | |
| 1 | Net investment income is a projection through the end of the current quarter based on the most recent month-end data. |
| 2 | Return of capital may represent unrealized gains, return of shareholder's principal, or both. In certain circumstances, all or a portion of the return of capital may be characterized as ordinary income under federal tax law. The actual tax characterization will be provided to shareholders on Form 1099-DIV shortly after calendar year-end. |
| 3 | Includes the most recent quarterly distribution declaration. |
COMMON SHARE REPURCHASES
During August 2017 (subsequent to the close of the reporting period), the Fund’s Board of Trustees reauthorized an open-market share repurchase program, allowing the Fund to repurchase an aggregate of up to approximately 10% of its outstanding shares.
As of June 30, 2017, and since the inception of the Fund’s repurchase program, the Fund has cumulatively repurchased and retired its outstanding common shares as shown in the accompanying table.
| | | | |
| | | JTA | |
Common shares cumulatively repurchased and retired | | | 122,745 | |
Common shares authorized for repurchase | | | 1,385,000 | |
During the current reporting period, the Fund did not repurchase any of its outstanding common shares.
OTHER COMMON SHARE INFORMATION
As of June 30, 2017, and during the current reporting period, the Fund’s common share price was trading at a premium/(discount) to its common share NAV as shown in the accompanying table.
| | | | |
| | | JTA | |
Common share NAV | | | $13.67 | |
Common share price | | | $12.90 | |
Premium/(Discount) to NAV | | | (5.63 | )% |
6-month average premium/(discount) to NAV | | | (8.01 | )% |
Risk
Considerations
Fund shares are not guaranteed or endorsed by any bank or other insured depository institution, and are not federally insured by the Federal Deposit Insurance Corporation.
Nuveen Tax-Advantaged Total Return Strategy Fund (JTA)
Investing in closed-end funds involves risk; principal loss is possible. There is no guarantee the Fund’s investment objectives will be achieved. Closed-end fund shares may frequently trade at a discount or premium to their net asset value. Common stock returns often have experienced significant volatility. Adjustable Rate Senior Loans may not be fully secured by collateral, generally do not trade on exchanges, and are typically issued by unrated or below-investment grade companies, and therefore are subject to greater liquidity and credit risk. Lower credit debt securities may be more likely to fail to make timely interest or principal payments. Leverage increases return volatility and magnifies the Fund’s potential return and its risks; there is no guarantee a fund’s leverage strategy will be successful. For these and other risks, including tax risk, please see the Fund’s web page at www.nuveen.com/JTA.
THIS PAGE INTENTIONALLY LEFT BLANK
JTA
Nuveen Tax-Advantaged Total Return Strategy Fund
Performance Overview and Holding Summaries as of June 30, 2017
Refer to the Glossary of Terms Used in this Report for further definition of the terms used within this section.
Average Annual Total Returns as of June 30, 2017
| | | | | | | | | | | | | | | | |
| | | Cumulative | | | Average Annual | |
| | | 6-Month | | | 1-Year | | | 5-Year | | | 10-Year | |
| JTA at Common Share NAV | | | 11.47% | | | | 18.94% | | | | 12.00% | | | | 1.41% | |
| JTA at Common Share Price | | | 18.50% | | | | 24.00% | | | | 13.79% | | | | 1.64% | |
| Blended Benchmark (new) | | | 8.69% | | | | 15.09% | | | | 10.70% | | | | 4.80% | |
| Blended Benchmark (old) | | | 5.85% | | | | 14.48% | | | | 10.85% | | | | 4.87% | |
| S&P 500® Index | | | 9.34% | | | | 17.90% | | | | 14.63% | | | | 7.18% | |
Average Annual Total Returns as of June 30, 20171
(including retained gain tax credit/refund)
| | | | | | | | | | | | | | | | |
| | | Cumulative | | | Average Annual | |
| | | 6-Month | | | 1-Year | | | 5-Year | | | 10-Year | |
| JTA at Common Share NAV | | | 11.47% | | | | 18.94% | | | | 12.00% | | | | 1.47% | |
| JTA at Common Share Price | | | 18.50% | | | | 24.00% | | | | 13.79% | | | | 1.71% | |
Past performance is not predictive of future results. Current performance may be higher or lower than the data shown. Returns do not reflect the deduction of taxes that shareholders may have to pay on Fund distributions or upon the sale of Fund shares. Returns at NAV are net of Fund expenses, and assume reinvestment of distributions. Comparative index return information is provided for the Fund’s shares at NAV only. Indexes are not available for direct investment.
Common Share Price Performance — Weekly Closing Price
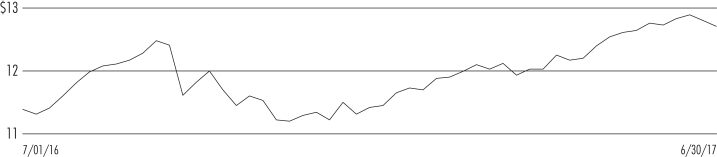
| 1 | The Fund elected to retain a portion of its realized long-term capital gains for the tax year ended December 31, 2007 and pay required federal corporate income taxes on these amounts. These standardized total returns include the economic benefit to common shareholders of record of this tax credit/refund. The Fund had no retained capital gains for the tax years ended December 31, 2008 through December 31, 2016. |
This data relates to the securities held in the Fund’s portfolio of investments as of the end of the reporting period. It should not be construed as a measure of performance for the Fund itself. Holdings are subject to change.
For financial reporting purposes, the ratings disclosed are the highest rating given by one of the following national rating agencies: Standard & Poor’s Group, Moody’s Investors Service, Inc. or Fitch, Inc. This treatment of split-rated securities may differ from that used for other purposes, such as for Fund investment policies. Credit ratings are subject to change. AAA, AA, A and BBB are investment grade ratings; BB, B, CCC, CC, C and D are below-investment grade ratings. Certain bonds backed by U.S. Government or agency securities are regarded as having an implied rating equal to the rating of such securities. Holdings designated N/R are not rated by these national rating agencies.
Fund Allocation
(% of net assets)
| | | | |
| Common Stocks | | | 100.0% | |
| Convertible Preferred Securities | | | 4.2% | |
| $25 Par (or similar) Retail Preferred | | | 6.9% | |
| Variable Rate Senior Loan Interests | | | 25.3% | |
| Corporate Bonds | | | 0.7% | |
| $1,000 Par (or similar) Institutional Preferred | | | 5.1% | |
| Repurchase Agreements | | | 2.9% | |
| Investment Companies | | | 0.9% | |
| Other Assets Less Liabilities | | | (1.7)% | |
Net Assets Plus Borrowings | | | 144.3% | |
| Borrowings | | | (44.3)% | |
Net Assets | | | 100% | |
Portfolio Credit Quality
(% of total fixed-income investments)
| | | | |
| A | | | 1.9% | |
| BBB | | | 26.6% | |
| BB or Lower | | | 58.4% | |
| N/R (not rated) | | | 13.1% | |
Total | | | 100% | |
Portfolio Composition
(% of total investments)
| | | | |
| Banks | | | 17.0% | |
| Insurance | | | 8.5% | |
| Pharmaceuticals | | | 6.9% | |
| Software | | | 6.1% | |
| Capital Markets | | | 5.1% | |
| Diversified Telecommunication Services | | | 3.7% | |
| Oil, Gas & Consumable Fuels | | | 3.7% | |
| Media | | | 3.5% | |
| Chemicals | | | 3.5% | |
| Food Products | | | 3.0% | |
| Industrial Conglomerates | | | 2.6% | |
Multi-Utilities | | | 2.3% | |
| Semiconductors & Semiconductor Equipment | | | 2.2% | |
| Air Freight & Logistics | | | 2.0% | |
| Tobacco | | | 2.0% | |
| Equity Real Estate Investment Trusts | | | 1.9% | |
| Electric Utilities | | | 1.8% | |
| Diversified Financial Services | | | 1.6% | |
| Automobiles | | | 1.4% | |
| Other | | | 18.6% | |
| Repurchase Agreements | | | 2.0% | |
| Investment Companies | | | 0.6% | |
Total | | | 100% | |
Top Five Issuers
(% of total investments)
| | | | |
| Citigroup Inc. | | | 3.2% | |
| Oracle Corporation | | | 3.1% | |
| GlaxoSmithKline PLC | | | 2.6% | |
| Dow Chemical Company | | | 2.5% | |
| Allied Irish Banks | | | 2.3% | |
Country Allocation2
(% of total investments)
| | | | |
| United States | | | 55.4% | |
| Germany | | | 7.8% | |
| United Kingdom | | | 7.0% | |
| Japan | | | 5.1% | |
Netherlands | | | 3.9% | |
Ireland | | | 3.3% | |
France | | | 3.1% | |
| Switzerland | | | 2.6% | |
| Bermuda | | | 2.4% | |
| Spain | | | 1.9% | |
| Other | | | 7.5% | |
Total | | | 100% | |
| 2 | Includes 3.1% (as a percentage of total investments) in emerging market countries. |
Shareholder
Meeting Report
The annual meeting of shareholders was held in the offices of Nuveen on April 6, 2017 for JTA; at this meeting the shareholders were asked to elect Board Members.
| | | | |
| | | JTA | |
| | | Common
Shares | |
Approval of the Board Members was reached as follows: | | | | |
William Adams IV | | | | |
For | | | 11,891,974 | |
Withhold | | | 201,553 | |
Total | | | 12,093,527 | |
David J. Kundert | | | | |
For | | | 11,891,049 | |
Withhold | | | 202,478 | |
Total | | | 12,093,527 | |
John K. Nelson | | | | |
For | | | 11,889,656 | |
Withhold | | | 203,871 | |
Total | | | 12,093,527 | |
Terence J. Toth | | | | |
For | | | 11,892,488 | |
Withhold | | | 201,039 | |
Total | | | 12,093,527 | |
JTA
| | |
Nuveen Tax-Advantaged Total Return Strategy Fund | | |
Portfolio of Investments | | June 30, 2017 (Unaudited) |
| | | | | | | | | | | | | | | | | | | | |
| Shares | | | Description (1) | | | | | | | | | | | Value | |
| | |
| | | | LONG-TERM INVESTMENTS – 142.2% (97.4% of Total Investments) | | | | | |
| | | | | |
| | | | COMMON STOCKS – 100.0% (68.5% of Total Investments) | | | | | | | | | | | | | | | | |
| | | | | |
| | | | Air Freight & Logistics – 3.0% | | | | | | | | | | | | |
| | | | | |
| | 150,000 | | | Deutsche Post AG, (5) | | | | | | | | | | | | | | $ | 5,630,737 | |
| | | | | |
| | | | Automobiles – 1.5% | | | | | | | | | | | | |
| | | | | |
| | 38,400 | | | Daimler AG, (5) | | | | | | | | | | | | | | | 2,785,100 | |
| | | | | |
| | | | Banks – 17.9% | | | | | | | | | | | | |
| | | | | |
| | 1,120,000 | | | Allied Irish Banks | | | | | | | | | | | | | | | 6,332,078 | |
| | 11,100,000 | | | Bank of Ireland, (2), (5) | | | | | | | | | | | | | | | 2,918,013 | |
| | 97,000 | | | CIT Group Inc., (3), (4) | | | | | | | | | | | | | | | 4,723,900 | |
| | 96,500 | | | Citigroup Inc., (4) | | | | | | | | | | | | | | | 6,453,920 | |
| | 270,000 | | | ING Groep N.V., Sponsored ADR, (4) | | | | | | | | | | | | | | | 4,695,300 | |
| | 39,500 | | | JPMorgan Chase & Co. | | | | | | | | | | | | | | | 3,610,300 | |
| | 90,000 | | | The Bank of NT Butterfield and Son Limited, (4) | | | | | | | | | | | | | | | 3,069,000 | |
| | 1,540,700 | | | Unicaja Banco, 144A, (2) | | | | | | | | | | | | | | | 2,058,861 | |
| | | | Total Banks | | | | | | | | | | | | | | | 33,861,372 | |
| | | | | |
| | | | Building Products – 1.5% | | | | | | | | | | | | |
| | | | | |
| | 67,500 | | | Johnson Controls International PLC | | | | | | | | | | | | | | | 2,926,800 | |
| | | | | |
| | | | Capital Markets – 5.7% | | | | | | | | | | | | |
| | | | | |
| | 160,000 | | | Ares Capital Corporation | | | | | | | | | | | | | | | 2,620,800 | |
| | 28,900 | | | Aurelius AG, (5) | | | | | | | | | | | | | | | 1,553,140 | |
| | 285,000 | | | Deutsche Boerse AG, ADR, (4), (5) | | | | | | | | | | | | | | | 3,006,750 | |
| | 212,500 | | | UBS Group AG, (5) | | | | | | | | | | | | | | | 3,613,750 | |
| | | | Total Capital Markets | | | | | | | | | | | | | | | 10,794,440 | |
| | | | | |
| | | | Chemicals – 4.2% | | | | | | | | | | | | |
| | | | | |
| | 270,000 | | | CVR Partners LP | | | | | | | | | | | | | | | 942,300 | |
| | 110,500 | | | Dow Chemical Company | | | | | | | | | | | | | | | 6,969,235 | |
| | | | Total Chemicals | | | | | | | | | | | | | | | 7,911,535 | |
| | | | | |
| | | | Communications Equipment – 1.2% | | | | | | | | | | | | |
| | | | | |
| | 71,400 | | | Cisco Systems, Inc. | | | | | | | | | | | | | | | 2,234,820 | |
| | | | | |
| | | | Diversified Financial Services – 1.6% | | | | | | | | | | | | |
| | | | | |
| | 295,000 | | | Challenger Limited, (5) | | | | | | | | | | | | | | | 3,025,367 | |
| | | | | |
| | | | Diversified Telecommunication Services – 4.5% | | | | | | | | | | | | |
| | | | | |
| | 126,000 | | | Nippon Telegraph and Telephone Corporation, ADR | | | | | | | | | | | | | | | 5,937,120 | |
| | 187,000 | | | Telefonica Brasil SA | | | | | | | | | | | | | | | 2,534,426 | |
| | | | Total Diversified Telecommunication Services | | | | | | | | | | | | | | | 8,471,546 | |
| | | | | |
| | | | Electrical Equipment – 1.2% | | | | | | | | | | | | |
| | | | | |
| | 29,700 | | | Eaton PLC | | | | | | | | | | | | | | | 2,311,551 | |
| | | | | |
| | | | Equity Real Estate Investment Trusts – 2.7% | | | | | | | | | | | | |
| | | | | |
| | 239,500 | | | Colony Northstar, Inc. | | | | | | | | | | | | | | | 3,374,555 | |
| | 22,500 | | | Life Storage, Inc. | | | | | | | | | | | | | | | 1,667,250 | |
| | | | Total Equity Real Estate Investment Trusts | | | | | | | | | | | | | | | 5,041,805 | |
| | | | | |
| | | | Food & Staples Retailing – 1.5% | | | | | | | | | | | | |
| | | | | |
| | 35,800 | | | CVS Health Corporation | | | | | | | | | | | | | | | 2,880,468 | |
| | | | |
| JTA | | Nuveen Tax-Advantaged Total Return Strategy Fund | | |
| | Portfolio of Investments (continued) | | June 30, 2017 (Unaudited) |
| | | | | | | | | | | | | | | | | | | | |
| Shares | | | Description (1) | | | | | | | | | | | Value | |
| | | | | |
| | | | Food Products – 2.1% | | | | | | | | | | | | |
| | | | | |
| | 398,100 | | | Orkla ASA, Sponsored ADR, (4), (5) | | | | | | | | | | | | | | $ | 4,056,639 | |
| | | | | |
| | | | Health Care Providers & Services – 0.0% | | | | | | | | | | | | |
| | | | | |
| | 6,594 | | | Millennium Health LLC, (2) | | | | | | | | | | | | | | | 9,891 | |
| | | | | |
| | | | Household Durables – 1.9% | | | | | | | | | | | | |
| | | | | |
| | 205,650 | | | Sekisui House, Ltd., (5) | | | | | | | | | | | | | | | 3,634,575 | |
| | | | | |
| | | | Industrial Conglomerates – 3.6% | | | | | | | | | | | | |
| | | | | |
| | 62,000 | | | General Electric Company, (3) | | | | | | | | | | | | | | | 1,674,620 | |
| | 82,800 | | | Philips Electronics, (4) | | | | | | | | | | | | | | | 2,965,896 | |
| | 16,100 | | | Siemens AG, (5) | | | | | | | | | | | | | | | 2,214,618 | |
| | | | Total Industrial Conglomerates | | | | | | | | | | | | | | | 6,855,134 | |
| | | | | |
| | | | Insurance – 11.0% | | | | | | | | | | | | |
| | | | | |
| | 94,000 | | | Ageas, (5) | | | | | | | | | | | | | | | 3,785,488 | |
| | 180,500 | | | Allianz S.E., Sponsored ADR, (4), (5) | | | | | | | | | | | | | | | 3,569,387 | |
| | 50,600 | | | CNA Financial Corporation, (3) | | | | | | | | | | | | | | | 2,466,750 | |
| | 84,800 | | | NN Group NV, (5) | | | | | | | | | | | | | | | 3,008,960 | |
| | 21,600 | | | Renaissance Re Holdings, Limited | | | | | | | | | | | | | | | 3,003,480 | |
| | 106,954 | | | Unum Group, (4) | | | | | | | | | | | | | | | 4,987,265 | |
| | | | Total Insurance | | | | | | | | | | | | | | | 20,821,330 | |
| | | | | |
| | | | Media – 1.8% | | | | | | | | | | | | |
| | | | | |
| | 2,099 | | | Metro-Goldwyn-Mayer, (2) | | | | | | | | | | | | | | | 199,756 | |
| | 121,900 | | | National CineMedia, Inc. | | | | | | | | | | | | | | | 904,498 | |
| | 3,184 | | | Tribune Media Company, (6) | | | | | | | | | | | | | | | — | |
| | 70,000 | | | Viacom Inc., Class B | | | | | | | | | | | | | | | 2,349,900 | |
| | | | Total Media | | | | | | | | | | | | | | | 3,454,154 | |
| | | | | |
| | | | Multi-Utilities – 3.3% | | | | | | | | | | | | |
| | | | | |
| | 299,100 | | | Veolia Environment S.A., ADR, (5) | | | | | | | | | | | | | | | 6,327,927 | |
| | | | | |
| | | | Oil, Gas & Consumable Fuels – 5.0% | | | | | | | | | | | | |
| | | | | |
| | 22,900 | | | Chevron Corporation, (4) | | | | | | | | | | | | | | | 2,389,157 | |
| | 177,500 | | | Enterprise Products Partnership LP | | | | | | | | | | | | | | | 4,806,700 | |
| | 9 | | | Southcross Holdings Borrower LP, (2) | | | | | | | | | | | | | | | 5,152 | |
| | 47,100 | | | Total SA, Sponsored ADR | | | | | | | | | | | | | | | 2,335,689 | |
| | | | Total Oil Gas & Consumable Fuels | | | | | | | | | | | | | | | 9,536,698 | |
| | | | | |
| | | | Pharmaceuticals – 8.4% | | | | | | | | | | | | |
| | | | | |
| | 70,500 | | | AstraZeneca PLC, Sponsored ADR, (4) | | | | | | | | | | | | | | | 2,403,345 | |
| | 166,000 | | | GlaxoSmithKline PLC, Sponsored ADR, (4) | | | | | | | | | | | | | | | 7,157,920 | |
| | 99,000 | | | Roche Holdings AG, Sponsored ADR, (4), (5) | | | | | | | | | | | | | | | 3,148,200 | |
| | 61,000 | | | Takeda Chemical Industries, (5) | | | | | | | | | | | | | | | 3,096,907 | |
| | | | Total Pharmaceuticals | | | | | | | | | | | | | | | 15,806,372 | |
| | | | | |
| | | | Real Estate Management & Development – 1.0% | | | | | | | | | | | | |
| | | | | |
| | 1,139,500 | | | Sino Land Company Limited, (5) | | | | | | | | | | | | | | | 1,866,937 | |
| | | | | |
| | | | Road & Rail – 1.5% | | | | | | | | | | | | |
| | | | | |
| | 25,700 | | | Union Pacific Corporation | | | | | | | | | | | | | | | 2,798,987 | |
| | | | | |
| | | | Semiconductors & Semiconductor Equipment – 3.2% | | | | | | | | | | | | |
| | | | | |
| | 228,500 | | | Cypress Semiconductor Corporation | | | | | | | | | | | | | | | 3,119,025 | |
| | 135,000 | | | Infineon Technologies AG, (5) | | | | | | | | | | | | | | | 2,867,475 | |
| | | | Total Semiconductors & Semiconductor Equipment | | | | | | | | | | | | | | | 5,986,500 | |
| | | | | |
| | | | Software – 6.6% | | | | | | | | | | | | |
| | | | | |
| | 56,000 | | | Microsoft Corporation, (4) | | | | | | | | | | | | | | | 3,860,080 | |
| | | | | | | | | | | | | | | | | | | | |
| Shares | | | Description (1) | | | | | | | | | | | Value | |
| | | | | |
| | | | Software (continued) | | | | | | | | | | | | |
| | | | | |
| | 172,000 | | | Oracle Corporation | | | | | | | | | | | | | | $ | 8,624,080 | |
| | | | Total Software | | | | | | | | | | | | | | | 12,484,160 | |
| | | | | |
| | | | Specialty Retail – 1.1% | | | | | | | | | | | | |
| | | | | |
| | 509,000 | | | Kingfisher PLC, (5) | | | | | | | | | | | | | | | 1,993,708 | |
| | | | | |
| | | | Tobacco – 3.0% | | | | | | | | | | | | |
| | | | | |
| | 123,000 | | | Imperial Brands PLC, Sponsored ADR, (4), (5) | | | | | | | | | | | | | | | 5,626,020 | |
| | | | Total Common Stocks (cost $159,643,687) | | | | | | | | | | | | | | | 189,134,573 | |
| | | | | |
| Shares | | | Description (1) | | Coupon | | | | | | Ratings (7) | | | Value | |
| | |
| | | | CONVERTIBLE PREFERRED SECURITIES – 4.2% (2.9% of Total Investments) | | | | | |
| | | | | |
| | | | Banks – 0.6% | | | | | | | | | | | | |
| | | | | |
| | 525 | | | Bank of America Corporation | | | 7.250% | | | | | | | | BB+ | | | $ | 662,544 | |
| | 425 | | | Wells Fargo & Company | | | 7.500% | | | | | | | | BBB | | | | 557,222 | |
| | | | Total Banks | | | | | | | | | | | | | | | 1,219,766 | |
| | | | | |
| | | | Electric Utilities – 2.3% | | | | | | | | | | | | |
| | | | | |
| | 81,400 | | | Great Plains Energy Inc., (4) | | | 7.000% | | | | | | | | N/R | | | | 4,317,456 | |
| | | | | |
| | | | Pharmaceuticals – 1.3% | | | | | | | | | | | | |
| | | | | |
| | 4,090 | | | Teva Pharmaceutical Industries Limited, (5) | | | 7.000% | | | | | | | | N/R | | | | 2,412,691 | |
| | | | Total Convertible Preferred Securities (cost $8,999,331) | | | | | | | | | | | | | | | 7,949,913 | |
| | | | | |
| Shares | | | Description (1) | | Coupon | | | | | | Ratings (7) | | | Value | |
| | |
| | | | $25 PAR (OR SIMILAR) RETAIL PREFERRED – 6.9% (4.7% of Total Investments) | | | | | |
| | | | | |
| | | | Banks – 2.2% | | | | | | | | | | | | |
| | | | | |
| | 12,020 | | | Boston Private Financial Holdings Inc. | | | 6.950% | | | | | | | | N/R | | | $ | 309,154 | |
| | 4,625 | | | Cobank Agricultural Credit Bank, 144A, (5) | | | 6.250% | | | | | | | | BBB+ | | | | 480,711 | |
| | 3,250 | | | Cobank Agricultural Credit Bank, (5) | | | 6.125% | | | | | | | | BBB+ | | | | 325,406 | |
| | 14,122 | | | Fifth Third Bancorp. | | | 6.625% | | | | | | | | Baa3 | | | | 423,519 | |
| | 7,700 | | | First Republic Bank of San Francisco | | | 7.000% | | | | | | | | BBB– | | | | 206,745 | |
| | 3,800 | | | FNB Corporation | | | 7.250% | | | | | | | | Ba2 | | | | 111,492 | |
| | 4,450 | | | HSBC Holdings PLC | | | 8.000% | | | | | | | | Baa1 | | | | 119,304 | |
| | 15,775 | | | Huntington BancShares Inc. | | | 6.250% | | | | | | | | Baa3 | | | | 433,339 | |
| | 7,850 | | | KeyCorp | | | 6.125% | | | | | | | | Baa3 | | | | 230,005 | |
| | 12,300 | | | People’s United Financial, Inc. | | | 5.625% | | | | | | | | BB+ | | | | 343,416 | |
| | 15,544 | | | Regions Financial Corporation | | | 6.375% | | | | | | | | Ba1 | | | | 452,641 | |
| | 3,821 | | | TCF Financial Corporation | | | 7.500% | | | | | | | | BB– | | | | 96,748 | |
| | 18,400 | | | U.S. Bancorp. | | | 6.500% | | | | | | | | A3 | | | | 546,296 | |
| | | | Total Banks | | | | | | | | | | | | | | | 4,078,776 | |
| | | | | |
| | | | Capital Markets – 1.1% | | | | | | | | | | | | |
| | | | | |
| | 11,400 | | | Charles Schwab Corporation | | | 6.000% | | | | | | | | BBB | | | | 309,624 | |
| | 3,775 | | | Charles Schwab Corporation | | | 5.950% | | | | | | | | BBB | | | | 102,944 | |
| | 20,850 | | | Ladenburg Thalmann Financial Services Inc. | | | 8.000% | | | | | | | | N/R | | | | 516,663 | |
| | 24,175 | | | Morgan Stanley | | | 7.125% | | | | | | | | Ba1 | | | | 716,547 | |
| | 16,200 | | | Stifel Financial Corporation | | | 6.250% | | | | | | | | BB– | | | | 431,730 | |
| | | | Total Capital Markets | | | | | | | | | | | | | | | 2,077,508 | |
| | | | | |
| | | | Consumer Finance – 1.1% | | | | | | | | | | | | |
| | | | | |
| | 9,200 | | | Capital One Financial Corporation | | | 6.700% | | | | | | | | Baa3 | | | | 252,356 | |
| | 3,800 | | | Discover Financial Services | | | 6.500% | | | | | | | | BB– | | | | 97,964 | |
| | 65,000 | | | GMAC Capital Trust I | | | 5.785% | | | | | | | | B+ | | | | 1,703,000 | |
| | | | Total Consumer Finance | | | | | | | | | | | | | | | 2,053,320 | |
| | | | |
| JTA | | Nuveen Tax-Advantaged Total Return Strategy Fund | | |
| | Portfolio of Investments (continued) | | June 30, 2017 (Unaudited) |
| | | | | | | | | | | | | | | | | | | | |
| Shares | | | Description (1) | | Coupon | | | | | | Ratings (7) | | | Value | |
| | | | | |
| | | | Diversified Financial Services – 0.1% | | | | | | | | | | | | |
| | | | | |
| | 10,600 | | | KKR Financial Holdings LLC | | | 7.375% | | | | | | | | BBB | | | $ | 276,448 | |
| | | | | |
| | | | Electric Utilities – 0.1% | | | | | | | | | | | | |
| | | | | |
| | 3,035 | | | Alabama Power Company, (5) | | | 6.500% | | | | | | | | A3 | | | | 78,341 | |
| | 1,300 | | | Alabama Power Company, (5) | | | 6.450% | | | | | | | | A3 | | | | 33,597 | |
| | | | Total Electric Utilities | | | | | | | | | | | | | | | 111,938 | |
| | | | | |
| | | | Food Products – 0.4% | | | | | | | | | | | | |
| | | | | |
| | 360 | | | CHS Inc. | | | 7.875% | | | | | | | | N/R | | | | 10,416 | |
| | 14,600 | | | CHS Inc. | | | 7.100% | | | | | | | | N/R | | | | 429,532 | |
| | 11,205 | | | CHS Inc. | | | 6.750% | | | | | | | | N/R | | | | 316,877 | |
| | | | Total Food Products | | | | | | | | | | | | | | | 756,825 | |
| | | | | |
| | | | Insurance – 1.4% | | | | | | | | | | | | |
| | | | | |
| | 14,089 | | | Allstate Corporation | | | 6.750% | | | | | | | | BBB– | | | | 380,685 | |
| | 13,300 | | | Arch Capital Group Limited | | | 6.750% | | | | | | | | BBB | | | | 341,145 | |
| | 20,710 | | | Aspen Insurance Holdings Limited | | | 7.250% | | | | | | | | N/R | | | | 517,750 | |
| | 20,020 | | | Endurance Specialty Holdings Limited | | | 6.350% | | | | | | | | BBB– | | | | 533,533 | |
| | 19,301 | | | Maiden Holdings Limited | | | 8.250% | | | | | | | | BB | | | | 490,245 | |
| | 9,470 | | | National General Holding Company | | | 7.500% | | | | | | | | N/R | | | | 244,800 | |
| | 8,175 | | | National General Holding Company | | | 7.500% | | | | | | | | N/R | | | | 210,997 | |
| | | | Total Insurance | | | | | | | | | | | | | | | 2,719,155 | |
| | | | | |
| | | | Thrifts & Mortgage Finance – 0.5% | | | | | | | | | | | | |
| | | | | |
| | 4,631 | | | Astoria Financial Corporation | | | 6.500% | | | | | | | | Ba2 | | | | 119,202 | |
| | 24,550 | | | Federal Agricultural Mortgage Corporation | | | 6.875% | | | | | | | | N/R | | | | 683,718 | |
| | 8,100 | | | New York Community Bancorp Inc. | | | 6.375% | | | | | | | | Ba1 | | | | 231,660 | |
| | | | Total Thrifts & Mortgage Finance | | | | | | | | | | | | | | | 1,034,580 | |
| | | | Total $25 Par (or similar) Retail Preferred (cost $12,075,962) | | | | | | | | | | | | | | | 13,108,550 | |
| | | | | |
Principal
Amount (000) | | | Description (1) | | Coupon (8) | | | Maturity (9) | | | Ratings (7) | | | Value | |
| | |
| | | | VARIABLE RATE SENIOR LOAN INTERESTS – 25.3% (17.3% of Total Investments) (8) | | | | | |
| | | | | |
| | | | Aerospace & Defense – 0.8% | | | | | | | | | | | | |
| | | | | |
| $ | 995 | | | Leidos Holdings, Inc., Term Loan B | | | 3.500% | | | | 8/16/23 | | | | BBB– | | | $ | 1,001,716 | |
| | 495 | | | Transdigm, Inc., Extend Term Loan F | | | 4.226% | | | | 6/09/23 | | | | Ba2 | | | | 494,775 | |
| | 1,490 | | | Total Aerospace & Defense | | | | | | | | | | | | | | | 1,496,491 | |
| | | | | |
| | | | Airlines – 0.5% | | | | | | | | | | | | |
| | | | | |
| | 500 | | | American Airlines, Inc., Term Loan B | | | 3.659% | | | | 12/14/23 | | | | BB+ | | | | 500,978 | |
| | 477 | | | Delta Air Lines, Inc., Term Loan B1 | | | 3.617% | | | | 10/18/18 | | | | Baa2 | | | | 480,076 | |
| | 977 | | | Total Airlines | | | | | | | | | | | | | | | 981,054 | |
| | | | | |
| | | | Automobiles – 0.6% | | | | | | | | | | | | |
| | | | | |
| | 1,114 | | | Formula One Group, Term Loan B | | | 4.504% | | | | 2/01/24 | | | | B | | | | 1,115,724 | |
| | | | | |
| | | | Building Products – 0.3% | | | | | | | | | | | | |
| | | | | |
| | 497 | | | Quikrete Holdings, Inc., Term Loan B | | | 3.931% | | | | 11/15/23 | | | | N/R | | | | 496,955 | |
| | | | | |
| | | | Capital Markets – 0.3% | | | | | | | | | | | | |
| | | | | |
| | 500 | | | RPI Finance Trust, Term Loan B6 | | | 3.296% | | | | 3/27/23 | | | | Baa2 | | | | 502,423 | |
| | | | | |
| | | | Chemicals – 0.9% | | | | | | | | | | | | |
| | | | | |
| | 670 | | | Axalta Coating Systems, Term Loan, First Lien | | | 3.300% | | | | 6/01/24 | | | | BBB– | | | | 672,873 | |
| | 199 | | | Mineral Technologies, Inc., Term Loan B2 | | | 4.750% | | | | 5/07/21 | | | | BB+ | | | | 201,614 | |
| | 773 | | | Univar, Inc., Term Loan B | | | 3.976% | | | | 7/01/22 | | | | BB | | | | 774,889 | |
| | 1,642 | | | Total Chemicals | | | | | | | | | | | | | | | 1,649,376 | |
| | | | | | | | | | | | | | | | | | | | |
Principal
Amount (000) | | | Description (1) | | Coupon (8) | | | Maturity (9) | | | Ratings (7) | | | Value | |
| | | | | |
| | | | Commercial Services & Supplies – 0.5% | | | | | | | | | | | | |
| | | | | |
| $ | 990 | | | West Corporation, Refinanced Term Loan B12 | | | 3.750% | | | | 6/17/23 | | | | BB– | | | $ | 991,672 | |
| | | | | |
| | | | Communications Equipment – 0.1% | | | | | | | | | | | | |
| | | | | |
| | 238 | | | CommScope, Inc., Term Loan B | | | 3.296% | | | | 12/29/22 | | | | Baa3 | | | | 238,758 | |
| | | | | |
| | | | Consumer Finance – 0.5% | | | | | | | | | | | | |
| | | | | |
| | 894 | | | First Data Corporation, Term Loan B | | | 3.716% | | | | 4/26/24 | | | | BB | | | | 894,796 | |
| | | | | |
| | | | Containers & Packaging – 0.9% | | | | | | | | | | | | |
| | | | | |
| | 383 | | | Berry Plastics Holding Corporation, Term Loan I | | | 3.680% | | | | 10/01/22 | | | | BB | | | | 384,109 | |
| | 1,267 | | | Reynolds Group Holdings, Inc., Term Loan, First Lien | | | 4.226% | | | | 2/05/23 | | | | B+ | | | | 1,270,084 | |
| | 1,650 | | | Total Containers & Packaging | | | | | | | | | | | | | | | 1,654,193 | |
| | | | | |
| | | | Diversified Consumer Services – 0.3% | | | | | | | | | | | | |
| | | | | |
| | 540 | | | Hilton Hotels Corporation, Term Loan B2 | | | 3.216% | | | | 10/25/23 | | | | BBB– | | | | 541,855 | |
| | | | | |
| | | | Diversified Financial Services – 0.6% | | | | | | | | | | | | |
| | | | | |
| | 741 | | | MGM Growth Properties, Term Loan B | | | 3.476% | | | | 4/25/23 | | | | BB+ | | | | 742,803 | |
| | 414 | | | Veritas US, Inc., Term Loan B1 | | | 5.796% | | | | 1/27/23 | | | | B+ | | | | 414,889 | |
| | 1,155 | | | Total Diversified Financial Services | | | | | | | | | | | | | | | 1,157,692 | |
| | | | | |
| | | | Diversified Telecommunication Services – 0.9% | | | | | | | | | | | | |
| | | | | |
| | 1,000 | | | CenturyLink, Inc., Term Loan B | | | 1.375% | | | | 1/31/25 | | | | BBB– | | | | 990,070 | |
| | 522 | | | Intelsat Jackson Holdings, S.A., Tranche B2, Term Loan | | | 4.000% | | | | 6/30/19 | | | | B1 | | | | 518,274 | |
| | 264 | | | WideOpenWest Finance LLC, Term Loan B | | | 0.000% | | | | 8/01/23 | | | | B | | | | 264,364 | |
| | 1,786 | | | Total Diversified Telecommunication Services | | | | | | | | | | | | | | | 1,772,708 | |
| | | | | |
| | | | Electric Utilities – 0.3% | | | | | | | | | | | | |
| | | | | |
| | 405 | | | Vistra Operations Co., Term Loan B | | | 3.976% | | | | 8/04/23 | | | | BB+ | | | | 402,071 | |
| | 93 | | | Vistra Operations Co., Term Loan C | | | 3.795% | | | | 8/04/23 | | | | Ba2 | | | | 92,161 | |
| | 498 | | | Total Electric Utilities | | | | | | | | | | | | | | | 494,232 | |
| | | | | |
| | | | Energy Equipment & Services – 0.0% | | | | | | | | | | | | |
| | | | | |
| | 149 | | | Ocean Rig ASA, Tranche B1, Term Loan (10) | | | 0.000% | | | | 3/31/21 | | | | CCC– | | | | 96,474 | |
| | | | | |
| | | | Equity Real Estate Investment Trusts – 0.2% | | | | | | | | | | | | |
| | | | | |
| | 313 | | | Communications Sales & Leasing, Inc., Shortfall Term Loan | | | 4.226% | | | | 10/24/22 | | | | BB– | | | | 314,058 | |
| | | | | |
| | | | Food & Staples Retailing – 0.4% | | | | | | | | | | | | |
| | | | | |
| | 800 | | | Albertson’s LLC, Term Loan B4 | | | 3.976% | | | | 8/25/21 | | | | BB | | | | 791,560 | |
| | | | | |
| | | | Food Products – 0.6% | | | | | | | | | | | | |
| | | | | |
| | 573 | | | Jacobs Douwe Egberts, Term Loan B | | | 3.438% | | | | 7/02/22 | | | | BB | | | | 576,570 | |
| | 582 | | | US Foods, Inc., New Term Loan B | | | 3.980% | | | | 6/27/23 | | | | BB | | | | 584,882 | |
| | 1,155 | | | Total Food Products | | | | | | | | | | | | | | | 1,161,452 | |
| | | | | |
| | | | Health Care Equipment & Supplies – 0.2% | | | | | | | | | | | | |
| | | | | |
| | 444 | | | Acelity, Term Loan B | | | 4.546% | | | | 2/02/24 | | | | B1 | | | | 442,897 | |
| | | | | |
| | | | Health Care Providers & Services – 1.7% | | | | | | | | | | | | |
| | | | | |
| | 209 | | | Community Health Systems, Inc., Term Loan G | | | 3.976% | | | | 12/31/19 | | | | BB– | | | | 208,596 | |
| | 418 | | | Community Health Systems, Inc., Term Loan H | | | 4.230% | | | | 1/27/21 | | | | BB– | | | | 417,917 | |
| | 806 | | | DaVita HealthCare Partners, Inc., Tranche B, Term Loan | | | 3.976% | | | | 6/24/21 | | | | BBB– | | | | 808,386 | |
| | 564 | | | Envision Healthcare Corporation, Term Loan B, First Lien, (DD1) | | | 4.300% | | | | 12/01/23 | | | | BB– | | | | 566,259 | |
| | 1,002 | | | HCA, Inc., Tranche B8, Term Loan | | | 3.476% | | | | 2/15/24 | | | | BBB– | | | | 1,008,128 | |
| | 56 | | | HCA, Inc., Term Loan B9 | | | 3.226% | | | | 3/18/23 | | | | BBB– | | | | 56,585 | |
| | 331 | | | Millennium Laboratories, Inc., Term Loan B, First Lien | | | 7.726% | | | | 12/21/20 | | | | CCC+ | | | | 201,361 | |
| | 3,386 | | | Total Health Care Providers & Services | | | | | | | | | | | | | | | 3,267,232 | |
| | | | |
| JTA | | Nuveen Tax-Advantaged Total Return Strategy Fund | | |
| | Portfolio of Investments (continued) | | June 30, 2017 (Unaudited) |
| | | | | | | | | | | | | | | | | | | | |
Principal
Amount (000) | | | Description (1) | | Coupon (8) | | | Maturity (9) | | | Ratings (7) | | | Value | |
| | | | | |
| | | | Health Care Technology – 0.4% | | | | | | | | | | | | |
| | | | | |
| $ | 748 | | | Emdeon, Inc., Closing Date Term Loan | | | 3.976% | | | | 3/01/24 | | | | Ba3 | | | $ | 749,161 | |
| | | | | |
| | | | Hotels, Restaurants & Leisure – 1.7% | | | | | | | | | | | | |
| | | | | |
| | 1,530 | | | Burger King Corporation, Term Loan B3 | | | 3.500% | | �� | | 2/16/24 | | | | Ba3 | | | | 1,527,190 | |
| | 1,137 | | | Seaworld Parks and Entertainment, Inc., Term Loan B5 | | | 4.296% | | | | 4/01/24 | | | | BB– | | | | 1,136,429 | |
| | 496 | | | YUM Brands, New Term Loan B | | | 3.209% | | | | 6/16/23 | | | | BBB– | | | | 498,800 | |
| | 3,163 | | | Total Hotels, Restaurants & Leisure | | | | | | | | | | | | | | | 3,162,419 | |
| | | | | |
| | | | Household Products – 0.2% | | | | | | | | | | | | |
| | | | | |
| | 344 | | | Spectrum Brands, Inc., Refinanced Term Loan | | | 3.170% | | | | 6/23/22 | | | | BB+ | | | | 345,816 | |
| | | | | |
| | | | Independent Power & Renewable Electricity Producers – 0.1% | | | | | | | | | | | | |
| | | | | |
| | 148 | | | Dynegy, Inc., Tranche Term Loan C1 | | | 4.476% | | | | 2/07/24 | | | | BB | | | | 148,076 | |
| | | | | |
| | | | Internet and Direct Marketing Retail – 0.2% | | | | | | | | | | | | |
| | | | | |
| | 477 | | | Travelport LLC, Term C Loan | | | 4.432% | | | | 9/02/21 | | | | B+ | | | | 478,488 | |
| | | | | |
| | | | IT Services – 1.1% | | | | | | | | | | | | |
| | | | | |
| | 391 | | | Gartner, Inc., Term Loan A | | | 3.226% | | | | 3/21/22 | | | | BB+ | | | | 393,402 | |
| | 249 | | | Gartner, Inc., Term Loan B | | | 3.226% | | | | 4/05/24 | | | | BB+ | | | | 250,466 | |
| | 500 | | | Tempo Acquisition LLC, Term Loan B | | | 4.060% | | | | 5/01/24 | | | | B1 | | | | 501,758 | |
| | 476 | | | Vantiv, Inc., Term Loan B | | | 3.659% | | | | 10/14/23 | | | | BBB– | | | | 480,492 | |
| | 496 | | | WEX, Inc., Term Loan B | | | 0.000% | | | | 7/01/23 | | | | BB– | | | | 499,560 | |
| | 2,112 | | | Total IT Services | | | | | | | | | | | | | | | 2,125,678 | |
| | | | | |
| | | | Leisure Products – 0.3% | | | | | | | | | | | | |
| | | | | |
| | 517 | | | 24 Hour Fitness Worldwide, Inc., Term Loan B | | | 5.046% | | | | 5/28/21 | | | | Ba3 | | | | 514,836 | |
| | | | | |
| | | | Life Sciences Tools & Services – 0.2% | | | | | | | | | | | | |
| | | | | |
| | 390 | | | Inventiv Health, Inc., Term Loan B, (WI/DD) | | | TBD | | | | TBD | | | | BB+ | | | | 390,865 | |
| | | | | |
| | | | Machinery – 0.3% | | | | | | | | | | | | |
| | | | | |
| | 212 | | | Gates Global LLC, Initial Dollar Term Loan B1 | | | 4.546% | | | | 4/01/24 | | | | B+ | | | | 211,824 | |
| | 410 | | | Rexnord LLC, Term Loan B, First Lien | | | 3.970% | | | | 8/21/23 | | | | BB– | | | | 410,428 | |
| | 622 | | | Total Machinery | | | | | | | | | | | | | | | 622,252 | |
| | | | | |
| | | | Media – 3.3% | | | | | | | | | | | | |
| | | | | |
| | 994 | | | Cequel Communications LLC, Term Loan B | | | 3.466% | | | | 7/28/25 | | | | BB– | | | | 986,659 | |
| | 480 | | | Charter Communications Operating Holdings LLC, Term Loan E | | | 3.230% | | | | 7/01/20 | | | | BBB– | | | | 481,951 | |
| | 92 | | | Clear Channel Communications, Inc., Term Loan E | | | 8.726% | | | | 7/30/19 | | | | Caa1 | | | | 75,530 | |
| | 747 | | | Clear Channel Communications, Inc., Tranche D, Term Loan | | | 7.976% | | | | 1/30/19 | | | | Caa1 | | | | 613,224 | |
| | 690 | | | Cumulus Media, Inc., Term Loan B | | | 4.480% | | | | 12/23/20 | | | | Caa1 | | | | 560,430 | |
| | 587 | | | Lions Gate Entertainment Corporation, Term Loan B | | | 4.226% | | | | 12/08/23 | | | | Ba2 | | | | 591,906 | |
| | 42 | | | Nexstar Broadcasting Group, Term Loan, First Lien | | | 0.000% | | | | 1/17/24 | | | | BB+ | | | | 42,065 | |
| | 344 | | | Nexstar Broadcasting Group, Term Loan B | | | 0.000% | | | | 1/17/24 | | | | BB+ | | | | 344,193 | |
| | 500 | | | Virgin Media Investment Holdings, Limited Term Loan I | | | 3.909% | | | | 1/31/25 | | | | BB– | | | | 500,750 | |
| | 490 | | | Springer Science & Business Media, Inc., Term Loan B9, First Lien | | | 4.796% | | | | 8/14/20 | | | | B | | | | 491,194 | |
| | 1,496 | | | Univision Communications, Inc., Term Loan C5 | | | 3.976% | | | | 3/15/24 | | | | BB– | | | | 1,469,229 | |
| | 6,462 | | | Total Media | | | | | | | | | | | | | | | 6,157,131 | |
| | | | | |
| | | | Multiline Retail – 0.6% | | | | | | | | | | | | |
| | | | | |
| | 430 | | | Bass Pro Group LLC, Term Loan B, First Lien | | | 4.367% | | | | 6/05/20 | | | | B+ | | | | 429,100 | |
| | 740 | | | Dollar Tree, Inc., Term Loan B2 | | | 4.250% | | | | 7/06/22 | | | | BBB– | | | | 751,104 | |
| | 1,170 | | | Total Multiline Retail | | | | | | | | | | | | | | | 1,180,204 | |
| | | | | |
| | | | Oil, Gas & Consumable Fuels – 0.3% | | | | | | | | | | | | |
| | | | | |
| | 208 | | | Fieldwood Energy LLC, Term Loan, First Lien | | | 8.296% | | | | 8/31/20 | | | | B2 | | | | 196,422 | |
| | 134 | | | Fieldwood Energy LLC, Term Loan, Second Lien | | | 8.421% | | | | 9/30/20 | | | | CCC– | | | | 75,594 | |
| | 358 | | | Fieldwood Energy LLC, Term Loan, Second Lien | | | 8.421% | | | | 9/30/20 | | | | B– | | | | 286,429 | |
| | | | | | | | | | | | | | | | | | | | |
Principal
Amount (000) | | | Description (1) | | Coupon (8) | | | Maturity (9) | | | Ratings (7) | | | Value | |
| | | | | |
| | | | Oil, Gas & Consumable Fuels (continued) | | | | | | | | | | | | |
| | | | | |
| $ | 189 | | | Harvey Gulf International Marine, LLC, Term Loan B | | | 5.750% | | | | 6/18/20 | | | | CCC– | | | $ | 85,359 | |
| | 9 | | | Southcross Holdings Borrower L.P., Term Loan B, First Lien | | | 3.500% | | | | 4/13/23 | | | | CCC+ | | | | 7,635 | |
| | 898 | | | Total Oil, Gas & Consumable Fuels | | | | | | | | | | | | | | | 651,439 | |
| | | | | |
| | | | Personal Products – 0.4% | | | | | | | | | | | | |
| | | | | |
| | 731 | | | Coty, Inc., Term Loan A | | | 2.826% | | | | 10/27/20 | | | | BBB– | | | | 728,237 | |
| | | | | |
| | | | Pharmaceuticals – 0.4% | | | | | | | | | | | | |
| | | | | |
| | 748 | | | Grifols, Inc., Term Loan B | | | 3.436% | | | | 1/31/25 | | | | BB | | | | 749,816 | |
| | 61 | | | Valeant Pharmaceuticals International, Inc., Series F3, Tranche B, Term Loan | | | 5.830% | | | | 4/01/22 | | | | BB– | | | | 61,870 | |
| | 809 | | | Total Pharmaceuticals | | | | | | | | | | | | | | | 811,686 | |
| | | | | |
| | | | Professional Services – 0.2% | | | | | | | | | | | | |
| | | | | |
| | 398 | | | Nielsen Finance LLC, Term Loan B4 | | | 3.096% | | | | 10/04/23 | | | | BBB– | | | | 399,041 | |
| | | | | |
| | | | Software – 2.4% | | | | | | | | | | | | |
| | | | | |
| | 475 | | | BMC Software, Inc., Initial Term Loan B1, (DD1) | | | 5.226% | | | | 9/10/22 | | | | B+ | | | | 476,898 | |
| | 770 | | | Ellucian, Term Loan B, First Lien | | | 4.546% | | | | 9/30/22 | | | | B | | | | 768,874 | |
| | 613 | | | Infor (US), Inc., Term Loan B | | | 4.046% | | | | 2/01/22 | | | | B1 | | | | 610,170 | |
| | 129 | | | Micro Focus International PLC, New Term Loan | | | 3.964% | | | | 6/21/24 | | | | BB– | | | | 129,365 | |
| | 871 | | | Micro Focus International PLC, Term Loan B | | | 4.030% | | | | 4/21/24 | | | | BB– | | | | 873,635 | |
| | 644 | | | SS&C Technologies, Inc./ Sunshine Acquisition II, Inc., 2017 Refinancing New Term Loan B1 | | | 3.476% | | | | 7/08/22 | | | | BB+ | | | | 647,369 | |
| | 39 | | | SS&C Technologies, Inc./ Sunshine Acquisition II, Inc., 2017 Refinancing New Term Loan B2 | | | 3.476% | | | | 7/08/22 | | | | BB+ | | | | 39,266 | |
| | 923 | | | Tibco Software, Inc., Term Loan B | | | 5.730% | | | | 12/04/20 | | | | B1 | | | | 928,824 | |
| | 4,464 | | | Total Software | | | | | | | | | | | | | | | 4,474,401 | |
| | | | | |
| | | | Specialty Retail – 0.6% | | | | | | | | | | | | |
| | | | | |
| | 558 | | | Burlington Coat Factory Warehouse Corporation, Term Loan B4 | | | 3.960% | | | | 8/13/21 | | | | BB+ | | | | 560,826 | |
| | 490 | | | Petco Animal Supplies, Inc., Term Loan B1 | | | 4.172% | | | | 1/26/23 | | | | B1 | | | | 444,259 | |
| | 134 | | | Petsmart Inc., Term Loan B, First Lien | | | 4.220% | | | | 3/11/22 | | | | Ba3 | | | | 125,205 | |
| | 1,182 | | | Total Specialty Retail | | | | | | | | | | | | | | | 1,130,290 | |
| | | | | |
| | | | Technology Hardware, Storage & Peripherals – 1.1% | | | | | | | | | | | | |
| | | | | |
| | 814 | | | Dell International LLC, New Term Loan B | | | 3.730% | | | | 9/07/23 | | | | BBB– | | | | 817,883 | |
| | 1,290 | | | Western Digital, Inc., New Term Loan B | | | 3.976% | | | | 4/29/23 | | | | BBB– | | | | 1,297,180 | |
| | 2,104 | | | Total Technology Hardware, Storage & Peripherals | | | | | | | | | | | | | | | 2,115,063 | |
| | | | | |
| | | | Trading Companies & Distributors – 0.5% | | | | | | | | | | | | |
| | | | | |
| | 886 | | | Avolon, Term Loan B2 | | | 3.962% | | | | 3/21/22 | | | | BBB– | | | | 892,791 | |
| | | | | |
| | | | Wireless Telecommunication Services – 0.4% | | | | | | | | | | | | |
| | | | | |
| | 748 | | | Sprint Corporation, Term Loan, First Lien | | | 3.750% | | | | 2/02/24 | | | | Ba2 | | | | 749,139 | |
| $ | 48,591 | | | Total Variable Rate Senior Loan Interests (cost $48,379,821) | | | | | | | | | | | | | | | 47,888,615 | |
| | | | | |
Principal
Amount (000) | | | Description (1) | | Coupon | | | Maturity | | | Ratings (7) | | | Value | |
| | | | | |
| | | | CORPORATE BONDS – 0.7% (0.5% of Total Investments) | | | | | | | | | | | | |
| | | | | |
| | | | Banks – 0.6% | | | | | | | | | | | | |
| | | | | |
| $ | 25 | | | Bank of America Corporation | | | 6.300% | | | | N/A (11) | | | | BB+ | | | $ | 28,031 | |
| | 500 | | | JPMorgan Chase & Company | | | 6.750% | | | | N/A (11) | | | | BBB– | | | | 568,125 | |
| | 525 | | | M&T Bank Corporation | | | 6.450% | | | | N/A (11) | | | | Baa2 | | | | 580,125 | |
| | 1,050 | | | Total Banks | | | | | | | | | | | | | | | 1,176,281 | |
| | | | | |
| | | | Media – 0.1% | | | | | | | | | | | | |
| | | | | |
| | 133 | | | iHeartCommunications, Inc. | | | 9.000% | | | | 12/15/19 | | | | Caa1 | | | | 104,405 | |
| $ | 1,183 | | | Total Corporate Bonds (cost $1,224,689) | | | | | | | | | | | | | | | 1,280,686 | |
| | | | |
| JTA | | Nuveen Tax-Advantaged Total Return Strategy Fund | | |
| | Portfolio of Investments (continued) | | June 30, 2017 (Unaudited) |
| | | | | | | | | | | | | | | | | | | | |
Principal
Amount (000) | | | Description (1) | | Coupon | | | Maturity | | | Ratings (7) | | | Value | |
| | |
| | | | $1,000 PAR (OR SIMILAR) INSTITUTIONAL PREFERRED – 5.1% (3.5% of Total Investments) | | | | | |
| | | | | |
| | | | Banks – 3.5% | | | | | | | | | | | | |
| | | | | |
| $ | 275 | | | Bank of America Corporation | | | 6.500% | | | | N/A (11) | | | | BB+ | | | $ | 305,781 | |
| | 425 | | | CIT Group Inc., Series A | | | 5.800% | | | | N/A (11) | | | | B+ | | | | 443,062 | |
| | 450 | | | Citigroup Inc. | | | 5.800% | | | | N/A (11) | | | | BB+ | | | | 469,125 | |
| | 500 | | | Citigroup Inc. | | | 6.250% | | | | N/A (11) | | | | BB+ | | | | 554,688 | |
| | 1,295 | | | Citigroup Inc. | | | 5.950% | | | | N/A (11) | | | | BB+ | | | | 1,362,625 | |
| | 200 | | | Citizens Financial Group Inc. | | | 5.500% | | | | N/A (11) | | | | BB+ | | | | 209,000 | |
| | 50 | | | Cobank Agricultural Credit Bank | | | 6.250% | | | | N/A (11) | | | | BBB+ | | | | 54,911 | |
| | 840 | | | General Electric Capital Corporation | | | 5.000% | | | | N/A (11) | | | | A | | | | 891,576 | |
| | 250 | | | JP Morgan Chase & Company | | | 7.900% | | | | N/A (11) | | | | BBB– | | | | 259,875 | |
| | 250 | | | JP Morgan Chase & Company | | | 6.100% | | | | N/A (11) | | | | BBB– | | | | 271,250 | |
| | 600 | | | PNC Financial Services Inc. | | | 6.750% | | | | N/A (11) | | | | Baa2 | | | | 676,500 | |
| | 450 | | | SunTrust Bank Inc. | | | 5.625% | | | | N/A (11) | | | | Baa3 | | | | 469,688 | |
| | 300 | | | Wells Fargo & Company | | | 5.875% | | | | N/A (11) | | | | BBB | | | | 330,591 | |
| | 225 | | | Zions Bancorporation | | | 7.200% | | | | N/A (11) | | | | BB– | | | | 246,656 | |
| | 6,110 | | | Total Banks | | | | | | | | | | | | | | | 6,545,328 | |
| | | | | |
| | | | Capital Markets – 0.4% | | | | | | | | | | | | |
| | | | | |
| | 400 | | | Capital One Financial Corporation | | | 5.550% | | | | N/A (11) | | | | Baa3 | | | | 420,000 | |
| | 275 | | | Goldman Sachs Group Inc. | | | 5.300% | | | | N/A (11) | | | | Ba1 | | | | 288,750 | |
| | 100 | | | Morgan Stanley | | | 5.550% | | | | N/A (11) | | | | Ba1 | | | | 104,475 | |
| | 775 | | | Total Capital Markets | | | | | | | | | | | | | | | 813,225 | |
| | | | | |
| | | | Food Products – 1.2% | | | | | | | | | | | | |
| | | | | |
| | 2,121 | | | Land O’ Lakes Incorporated, 144A | | | 8.000% | | | | N/A (11) | | | | BB | | | | 2,327,797 | |
| $ | 9,006 | | | Total $1,000 Par (or similar) Institutional Preferred (cost $8,994,967) | | | | | | | | | | | | | | | 9,686,350 | |
| | | | Total Long-Term Investments (cost $239,318,457) | | | | | | | | | | | | | | | 269,048,687 | |
| | | | | |
Shares/
Principal
Amount (000) | | | Description (1) | | Coupon | | | Maturity | | | | | | Value | |
| | | | | |
| | | | SHORT-TERM INVESTMENTS – 3.8% (2.6% of Total Investments) | | | | | | | | | | | | | | | | |
| | | | | |
| | | | INVESTMENT COMPANIES – 0.9% (0.6% of Total Investments) | | | | | | | | | | | | |
| | | | | |
| | 1,689,131 | | | BlackRock Liquidity Funds T-Fund Portfolio, (12) | | | N/A | | | | N/A | | | | | | | $ | 1,689,131 | |
| | | | | |
| | | | REPURCHASE AGREEMENTS – 2.9% (2.0% of Total Investments) | | | | | | | | | | | | |
| | | | | |
| $ | 5,554 | | | Repurchase Agreement with Fixed Income Clearing Corporation, dated 6/30/17, repurchase price $5,554,517, collateralized by $5,515,000 United States of America Treasury Inflation Indexed Obligations, 0.375%, due 7/15/25, value $5,667,286 | | | 0.120% | | | | 7/03/17 | | | | | | | | 5,554,461 | |
| | | | Total Short-Term Investments (cost $7,243,592) | | | | | | | | | | | | | | | 7,243,592 | |
| | | | Total Investments (cost $246,562,049) – 146.0% | | | | | | | | | | | | | | | 276,292,279 | |
| | | | Borrowings – (44.3)%, (13), (14) | | | | | | | | | | | | | | | (83,800,000 | ) |
| | | | Other Assets Less Liabilities – (1.7)%, (15) | | | | | | | | | | | | | | | (3,253,869 | ) |
| | | | Net Assets Applicable to Common Shares – 100% | | | | | | | | | | | | | | $ | 189,238,410 | |
Investments in Derivatives as of June 30, 2017
Interest Rate Swaps (OTC Uncleared)
| | | | | | | | | | | | | | | | | | | | | | | | | | | | | | | | | | | | | | | | |
| Counterparty | | Notional
Amount | | | Fund
Pay/Receive
Floating Rate | | | Floating Rate Index | | | Fixed Rate
(Annualized) | | | Fixed Rate
Payment
Frequency | | | Effective
Date (16) | | | Optional
Termination
Date | | | Termination
Date | | | Value | | | Unrealized
Appreciation
(Depreciation) | |
JP Morgan Chase Bank, N.A. | | $ | 18,475,000 | | | | Receive | | | | 1-Month USD-LIBOR-ICE | | | | 1.462 | % | | | Monthly | | | | 12/01/17 | | | | 12/01/18 | | | | 12/01/20 | | | $ | (30,155 | ) | | $ | (289,608 | ) |
JP Morgan Chase Bank, N.A. | | | 41,800,000 | | | | Receive | | | | 1-Month USD-LIBOR-ICE | | | | 1.969 | | | | Monthly | | | | 6/01/18 | | | | 7/01/25 | | | | 7/01/27 | | | | 226,005 | | | | 226,005 | |
| | | $ | 60,275,000 | | | | | | | | | | | | | | | | | | | | | | | | | | | | | | | $ | 195,850 | | | $ | (63,603 | ) |
For Fund portfolio compliance purposes, the Fund’s industry classifications refer to any one or more of the industry sub-classifications used by one or more widely recognized market indexes or ratings group indexes, and/or as defined by Fund management. This definition may not apply for purposes of this report, which may combine industry sub-classifications into sectors for reporting ease.
| (1) | All percentages shown in the Portfolio of Investments are based on net assets applicable to common shares unless otherwise noted. |
| (2) | Non-income producing; issuer has not declared a dividend within the past twelve months. |
| (3) | Investment, or portion of investment, has been pledged to collateralize the net payment obligations for investments in derivatives. |
| (4) | Investment, or portion of investment, is hypothecated as described in Notes to Financial Statements, Note 9 – Borrowing Arrangements, Rehypothecation. The total value of investments hypothecated as of the end of the reporting period was $60,415,367. |
| (5) | For fair value measurement disclosure purposes, investment classified as Level 2. See Notes to Financial Statements, Note 2 – Investment Valuation and Fair Value measurements for more information. |
| (6) | Investment valued at fair value using methods determined in good faith by, or at the discretion of, the Board. For fair value measurement disclosure purposes, investment classified as Level 3. See Notes to Financial Statements, Note 2 – Investment Valuation and Fair Value Measurements for more information. |
| (7) | For financial reporting purposes, the ratings disclosed are the highest of Standard & Poor’s Group (“Standard & Poor’s”), Moody’s Investors Service, Inc. (“Moody’s”) or Fitch, Inc. (“Fitch”) rating. This treatment of split-rated securities may differ from that used for other purposes, such as for Fund investment policies. Ratings below BBB by Standard & Poor’s, Baa by Moody’s or BBB by Fitch are considered to be below investment grade. Holdings designated N/R are not rated by any of these national rating agencies. |
| (8) | Senior loans generally pay interest at rates which are periodically adjusted by reference to a base short-term, floating lending rate plus an assigned fixed rate. These floating lending rates are generally (i) the lending rate referenced by the London Inter-Bank Offered Rate (“LIBOR”), or (ii) the prime rate offered by one or more major United States banks. Senior loans may be considered restricted in that the Fund ordinarily is contractually obligated to receive approval from the agent bank and/or borrower prior to the disposition of a senior loan. The rate shown in the coupon as of the end of the reporting period. |
| (9) | Senior loans generally are subject to mandatory and/or optional prepayment. Because of these mandatory prepayment conditions and because there may be significant economic incentives for a borrower to prepay, prepayments of senior loans may occur. As a result, the actual remaining maturity of senior loans held may be substantially less than the stated maturities shown. |
| (10) | As of, or subsequent to, the end of the reporting period, this security is non-income producing. Non-income producing, in the case of a fixed-income security, generally denotes that the issuer has (1) defaulted on the payment of principal or interest, (2) is under the protection of the Federal Bankruptcy Court or (3) the Fund’s Adviser has concluded that the issue is not likely to meet its future interest payment obligations and has ceased accruing additional income on the Fund’s records. |
| (11) | Perpetual security. Maturity date is not applicable. |
| (12) | A copy of the most recent financial statements for these investment companies can be obtained directly from the Securities and Exchange Commission on its website at http://www.sec.gov. |
| (13) | Borrowings as a percentage of Total Investments is 30.3%. |
| (14) | The Fund may pledge up to 100% of its eligible investments (excluding any investments separately pledged as collateral for specific investments in derivatives) in the Portfolio of Investments as collateral for borrowings. As of the end of the reporting period, investments with a value of $181,350,600 have been pledged as collateral for borrowings. |
| (15) | Other assets less liabilities includes the unrealized appreciation (depreciation) of certain over-the-counter (“OTC”) derivatives as presented on the Statement of Assets and Liabilities, when applicable. The unrealized appreciation (depreciation) of OTC-cleared and exchange-traded derivatives is recognized as part of cash collateral at brokers and/or the receivable or payable for variation margin as presented on the Statement of Assets and Liabilities, when applicable. |
| (16) | Effective date represents the date on which both the Fund and counterparty commence interest payment accruals on each contract. |
| (DD1) | Portion of investment purchased on a delayed delivery basis. |
| (WI/DD) | Purchased on a when-issued or delayed delivery basis. |
| 144A | Investment is exempt from registration under Rule 144A of the Securities Act of 1933, as amended. These investments may only be resold in transactions exempt from registration, which are normally those transactions with qualified institutional buyers. |
| ADR | American Depositary Receipt |
| TBD | Senior loan purchased on a when-issued or delayed-delivery basis. Certain details associated with this purchase are not known prior to the settlement date of the transaction. In addition, senior loans typically trade without accrued interest and therefore a coupon rate is not available prior to settlement. At settlement, if still unknown, the borrower or counterparty will provide the Fund with the final coupon rate and maturity date. |
| USD-LIBOR-ICE | United States Dollar – London Inter-Bank Offered Rate – Intercontinental Exchange |
See accompanying notes to financial statements.
| | | | | | |
Statement of Assets and Liabilities | | June 30, 2017 (Unaudited) |
| | | | |
Assets | | | | |
Long-term Investments, at value (cost $239,318,457) | | $ | 269,048,687 | |
Short-term Investments, at value (cost approximates value) | | | 7,243,592 | |
Cash | | | 27,391 | |
Interest rate swaps premiums paid | | | 259,453 | |
Receivable for: | | | | |
Dividends | | | 598,348 | |
Interest | | | 306,828 | |
Investments sold | | | 1,236,923 | |
Reclaims | | | 372,724 | |
Other assets | | | 45,569 | |
Total assets | | | 279,139,515 | |
Liabilities | | | | |
Borrowings | | | 83,800,000 | |
Unrealized depreciation on interest rate swaps, net | | | 63,603 | |
Payable for: | | | | |
Dividends | | | 3,324,283 | |
Investments purchased | | | 2,466,209 | |
Accrued expenses: | | | | |
Interest on borrowings | | | 8,417 | |
Management fees | | | 190,483 | |
Trustees fees | | | 42,606 | |
Other | | | 5,504 | |
Total liabilities | | | 89,901,105 | |
Net assets applicable to common shares | | $ | 189,238,410 | |
Common shares outstanding | | | 13,843,146 | |
Net asset value (“NAV”) per common share outstanding | | $ | 13.67 | |
Net assets applicable to common shares consist of: | | | | |
Common shares, $.01 par value per share | | $ | 138,431 | |
Paid-in surplus | | | 193,788,681 | |
Undistributed (Over-distribution of) net investment income | | | (2,501,325 | ) |
Accumulated net realized gain (loss) | | | (31,855,369 | ) |
Net unrealized appreciation (depreciation) | | | 29,667,992 | |
Net assets applicable to common shares | | $ | 189,238,410 | |
Authorized shares: | | | | |
Common | | | Unlimited | |
Preferred | | | Unlimited | |
See accompanying notes to financial statements.
| | | | | | |
Statement of Operations | | Six Months Ended June 30, 2017 (Unaudited) |
��
| | | | |
Investment Income | | | | |
Dividends (net of foreign tax withheld of $330,315) | | $ | 4,909,183 | |
Interest | | | 1,385,760 | |
Other | | | 18,596 | |
Total investment income | | | 6,313,539 | |
Expenses | | | | |
Management fees | | | 1,116,816 | |
Interest expense on borrowings | | | 620,848 | |
Custodian fees | | | 29,747 | |
Trustees fees | | | 3,869 | |
Professional fees | | | 18,882 | |
Shareholder reporting expenses | | | 26,576 | |
Shareholder servicing agent fees | | | 335 | |
Stock exchange listing fees | | | 3,449 | |
Investor relations expense | | | 27,597 | |
Other | | | 7,093 | |
Total expenses | | | 1,855,212 | |
Net investment income (loss) | | | 4,458,327 | |
Realized and Unrealized Gain (Loss) | | | | |
Net realized gain (loss) from: | | | | |
Investments and foreign currency | | | 2,492,316 | |
Options written | | | 23,272 | |
Swaps | | | (613,786 | ) |
Change in net unrealized appreciation (depreciation) of: | | | | |
Investments and foreign currency | | | 12,839,794 | |
Swaps | | | 801,725 | |
Net realized and unrealized gain (loss) | | | 15,543,321 | |
Net increase (decrease) in net assets applicable to common shares from operations | | $ | 20,001,648 | |
See accompanying notes to financial statements.
| | | | | | |
Statement of Changes in Net Assets | | (Unaudited) |
| | | | | | | | |
| | | Six Months
Ended 6/30/17 | | | Year
Ended
12/31/16 | |
Operations | | | | | | | | |
Net investment income (loss) | | $ | 4,458,327 | | | $ | 6,455,327 | |
Net realized gain (loss) from: | | | | | | | | |
Investments and foreign currency | | | 2,492,316 | | | | 2,100,108 | |
Options written | | | 23,272 | | | | 301,922 | |
Swaps | | | (613,786 | ) | | | 3,006 | |
Change in net unrealized appreciation (depreciation) of: | | | | | | | | |
Investments and foreign currency | | | 12,839,794 | | | | 118,017 | |
Options written | | | — | | | | (83,089 | ) |
Swaps | | | 801,725 | | | | (136,807 | ) |
Net increase (decrease) in net assets applicable to common shares from operations | | | 20,001,648 | | | | 8,758,484 | |
Distributions to Common Shareholders | | | | | | | | |
From and in excess of net investment income | | | (6,866,200 | ) | | | — | |
From net investment income | | | — | | | | (9,043,510 | ) |
Return of capital | | | — | | | | (4,965,754 | ) |
Decrease in net assets applicable to common shares from distributions to common shareholders | | | (6,866,200 | ) | | | (14,009,264 | ) |
Net increase (decrease) in net assets applicable to common shares | | | 13,135,448 | | | | (5,250,780 | ) |
Net assets applicable to common shares at the beginning of period | | | 176,102,962 | | | | 181,353,742 | |
Net assets applicable to common shares at the end of period | | $ | 189,238,410 | | | $ | 176,102,962 | |
Undistributed (Over-distribution of) net investment income at the end of period | | $ | (2,501,325 | ) | | $ | (93,452 | ) |
See accompanying notes to financial statements.
| | | | | | |
Statement of Cash Flows | | Six Months Ended June 30, 2017 (Unaudited) |
| | | | |
Cash Flows from Operating Activities: | | | | |
Net Increase (Decrease) In Net Assets Applicable to Common Shares from Operations | | $ | 20,001,648 | |
Adjustments to reconcile the net increase (decrease) in net assets applicable to common shares from operations to net cash provided by (used in) operating activities: | | | | |
Purchases of investments | | | (65,884,812 | ) |
Proceeds from sales and maturities of investments | | | 62,553,308 | |
Proceeds from (Purchases of) short-term investments, net | | | (5,182,457 | ) |
Proceeds from (payments for) cash denominated in foreign currencies, net | | | 101,831 | |
Premiums received (paid) for interest rate swaps | | | 341,566 | |
Premiums received for options written | | | 21,788 | |
Capital gain and return of capital distributions from investments | | | 27,504 | |
Payment-in-kind distributions | | | (236 | ) |
Proceeds from litigation settlement | | | 119,787 | |
Amortization (Accretion) of premiums and discounts, net | | | 8,618 | |
(Increase) Decrease in: | | | | |
Receivable for dividends | | | (174,612 | ) |
Receivable for interest | | | 71,496 | |
Receivable for investments sold | | | 2,322,364 | |
Receivable for reclaims | | | (138,310 | ) |
Other assets | | | (2,328 | ) |
Increase (Decrease) in: | | | | |
Payable for investments purchased | | | (1,364,391 | ) |
Accrued interest on borrowings | | | (614 | ) |
Accrued management fees | | | 5,950 | |
Accrued Trustees fees | | | (191 | ) |
Accrued other expenses | | | (101,494 | ) |
Net realized (gain) loss from: | | | | |
Investments and foreign currency | | | (2,492,316 | ) |
Options written | | | (23,272 | ) |
Change in net unrealized (appreciation) depreciation of: | | | | |
Investments and foreign currency | | | (12,839,794 | ) |
Swaps | | | (801,725 | ) |
Net cash provided by (used in) operating activities | | | (3,430,692 | ) |
Cash Flows from Financing Activities: | | | | |
Proceeds from borrowings | | | 7,000,000 | |
Cash distributions paid to common shareholders | | | (3,541,917 | ) |
Net cash provided by (used in) financing activities | | | 3,458,083 | |
Net Increase (Decrease) in Cash | | | 27,391 | |
Cash at the beginning of period | | | — | |
Cash at the end of period | | $ | 27,391 | |
| |
| Supplemental Disclosures of Cash Flow Information | | | |
Cash paid for interest on borrowings (excluding borrowing costs) | | $ | 621,462 | |
See accompanying notes to financial statements.
Financial
Highlights (Unaudited)
Selected data for a common share outstanding throughout each period:
| | | | | | | | | | | | | | | | | | | | | | | | | | | | | | | | | | | | | | | | | | | | |
| | | | |
| | | | | | Investment Operations | | | Less Distributions to
Common Shareholders | | | Common Share | |
| | | Beginning
Common
Share
NAV | | | Net
Investment
Income
(Loss)(a) | | | Net
Realized/
Unrealized
Gain (Loss) | | | Total | | | From
Net
Investment
Income | | | From
Accum-
ulated
Net
Realized
Gains | | | Return of
Capital | | | Total | | | Discount
from
Shares
Repurchased
and
Retired | | | Ending
NAV | | | Ending
Share
Price | |
Year Ended 12/31: | |
2017(f) | | $ | 12.72 | | | $ | 0.32 | | | $ | 1.13 | | | $ | 1.45 | | | $ | (0.50 | )*** | | $ | — | | | $ | — | | | $ | (0.50 | ) | | $ | — | | | $ | 13.67 | | | $ | 12.90 | |
2016 | | | 13.10 | | | | 0.47 | | | | 0.16 | | | | 0.63 | | | | (0.65 | ) | | | — | | | | (0.36 | ) | | | (1.01 | ) | | | — | | | | 12.72 | | | | 11.32 | |
2015 | | | 14.39 | | | | 0.47 | | | | (0.67 | ) | | | (0.20 | ) | | | (1.09 | ) | | | — | | | | — | | | | (1.09 | ) | | | — | | | | 13.10 | | | | 11.67 | |
2014 | | | 14.71 | | | | 0.49 | | | | 0.22 | | | | 0.71 | | | | (1.03 | ) | | | — | | | | — | | | | (1.03 | ) | | | — | | | | 14.39 | | | | 13.29 | |
2013 | | | 11.67 | | | | 0.34 | | | | 3.63 | | | | 3.97 | | | | (0.87 | ) | | | — | | �� | | (0.06 | ) | | | (0.93 | ) | | | — | | | | 14.71 | | | | 14.10 | |
2012 | | | 10.97 | | | | 0.37 | | | | 1.21 | | | | 1.58 | | | | (0.48 | ) | | | — | | | | (0.40 | ) | | | (0.88 | ) | | | — | * | | | 11.67 | | | | 10.51 | |
| | | | | | | | |
| | | Borrowings at the End of Period | |
| | | Aggregate
Amount
Outstanding
(000) | | | Asset
Coverage
Per $1,000 | |
Year Ended 12/31: | | | | | | | | |
2017(f) | | $ | 83,800 | | | $ | 3,258 | |
2016 | | | 76,800 | | | | 3,293 | |
2015 | | | 82,400 | | | | 3,201 | |
2014 | | | 89,400 | | | | 3,229 | |
2013 | | | 85,000 | | | | 3,394 | |
2012 | | | 67,900 | | | | 3,377 | |
| | | | | | | | | | | | | | | | | | | | | | | | | | | | | | |
| | | | | | | Common Share Supplemental Data/
Ratios Applicable to Common Shares | |
Common Share
Total Returns | | | | | | Ratios to Average Net Assets
Before Reimbursement(c) | | | Ratios to Average Net Assets
After Reimbursement(c)(d) | | | | |
Based
on
NAV(b) | | | Based
on
Share
Price(b) | | |
Ending
Net
Assets
(000) | | | Expenses | | | Net
Investment
Income (Loss) | | | Expenses | | | Net
Investment
Income (Loss) | | | Portfolio
Turnover
Rate(e) | |
| | | | | | | | | | | | | | | | | | | | | | | | | | | | | | |
| | 11.47 | % | | | 18.50 | % | | $ | 189,238 | | | | 2.03 | %** | | | 4.89 | %** | | | N/A | | | | N/A | | | | 24 | % |
| | 5.10 | | | | 5.85 | | | | 176,103 | | | | 1.93 | | | | 3.69 | | | | N/A | | | | N/A | | | | 42 | |
| | (1.49 | ) | | | (4.17 | ) | | | 181,354 | | | | 1.87 | | | | 3.34 | | | | N/A | | | | N/A | | | | 49 | |
| | 4.91 | | | | 1.44 | | | | 199,255 | | | | 1.85 | | | | 3.35 | | | | N/A | | | | N/A | | | | 34 | |
| | 34.97 | | | | 44.22 | | | | 203,528 | | | | 1.87 | | | | 2.55 | | | | N/A | | | | N/A | | | | 39 | |
| | 14.54 | | | | 19.31 | | | | 161,395 | | | | 2.00 | | | | 3.11 | | | | 1.99 | % | | | 3.12 | % | | | 37 | |
| (a) | Per share Net Investment Income (Loss) is calculated using the average daily shares method. |
| (b) | Total Return Based on Common Share NAV is the combination of changes in common share NAV, reinvested dividend income at NAV and reinvested capital gains distributions at NAV, if any. The last dividend declared in the period, which is typically paid on the first business day of the following month, is assumed to be reinvested at the ending NAV. The actual reinvest price for the last dividend declared in the period may often be based on the Fund’s market price (and not its NAV), and therefore may be different from the price used in the calculation. Total returns are not annualized. |
Total Return Based on Common Share Price is the combination of changes in the market price per share and the effect of reinvested dividend income and reinvested capital gains distributions, if any, at the average price paid per share at the time of reinvestment. The last dividend declared in the period, which is typically paid on the first business day of the following month, is assumed to be reinvested at the ending market price. The actual reinvestment for the last dividend declared in the period takes place over several days, and in some instances may not be based on the market price, so the actual reinvestment price may be different from the price used in the calculation. Total returns are not annualized.
| (c) • | Net Investment Income (Loss) ratios reflect income earned and expenses incurred on assets attributable to borrowings (as described in Note 9 –Borrowing Arrangements). |
| | • | Each ratio includes the effect of all interest expense paid and other costs related to borrowings, as follows: |
| | | | |
Ratios of Borrowings Interest Expense to Average Net Assets Applicable
to Common Shares | |
Year Ended 12/31: | | | | |
2017(f) | | | 0.68 | %** |
2016 | | | 0.53 | |
2015 | | | 0.47 | |
2014 | | | 0.45 | |
2013 | | | 0.49 | |
2012 | | | 0.58 | |
| (d) | After expense reimbursement from the Adviser, where applicable. As of January 31, 2012, the Adviser is no longer reimbursing the Fund for any fees or expenses. |
| (e) | Portfolio Turnover Rate is calculated based on the lesser of long-term purchases or sales (as disclosed in Note 5 – Investment Transactions) divided by the average long-term market value during the period. |
| (f) | For the six months ended June 30, 2017. |
| * | Rounds to less than $0.01 per share. |
| *** | Represents distributions paid “From and in excess of net investment income” for the six months ended June 30, 2017 (as described in Note 1 – General Information and Significant Accounting Policies, Dividends and Distributions to Common Shareholders). |
| N/A | Fund no longer has a contractual reimbursement agreement with the Adviser. |
See accompanying notes to financial statements.
Notes to
Financial Statements (Unaudited)
1. General Information and Significant Accounting Policies
General Information
Fund Information
Nuveen Tax-Advantaged Total Return Strategy Fund (the “Fund”) is registered under the Investment Company Act of 1940, as amended, as a diversified closed-end management investment company. The Fund’s common shares are listed on the New York Stock Exchange (“NYSE”) and trade under the ticker symbol “JTA.” The Fund was organized as a Massachusetts business trust on October 1, 2003.
The end of the reporting period for the Fund is June 30, 2017, and the period covered by these Notes to Financial Statements is the six months ended June 30, 2017 (the “current fiscal period”).
Investment Adviser
The Fund’s investment adviser is Nuveen Fund Advisors, LLC (the “Adviser”), a subsidiary of Nuveen, LLC (“Nuveen”). Nuveen is the investment management arm of Teachers Insurance and Annuity Association of America (TIAA). The Adviser has overall responsibility for management of the Fund, oversees the management of the Fund’s portfolio, manages the Fund’s business affairs and provides certain clerical, bookkeeping and other administrative services, and, if necessary, asset allocation decisions. The Adviser has entered into sub-advisory agreements with NWQ Investment Management Company, LLC (“NWQ”) and Symphony Asset Management LLC (“Symphony”) (each a “Sub-Adviser” and collectively, the “Sub-Advisers”), each an affiliate of Nuveen. NWQ manages the portion of the Fund’s investment portfolio allocated to dividend-paying common and preferred stocks, including American Depositary Receipts (“ADRs”) and the Fund’s options strategy. Symphony manages the portion of the Fund’s investment portfolio allocated to senior loans and other debt instruments. The Adviser is responsible for managing the Fund’s investments in swap contracts.
Investment Objectives and Principal Investment Strategies
The Fund’s investment objective is to achieve a high level of after-tax total return consisting primarily of tax-advantaged dividend income and capital appreciation. The Fund invests at least 60% of the Fund’s managed assets in tax-advantaged income-producing equity securities, including dividend received deduction (DRD) preferred securities. The Fund also invests 15% to 25% in senior loans and other debt instruments, as well as 5% to 15% in preferred stocks that are eligible to pay tax-advantage dividends.
Significant Accounting Policies
The Fund is an investment company and follows accounting and reporting guidance under Financial Accounting Standards Board (FASB) Accounting Standards Codification (ASC) Topic 946 “Financial Services – Investment Companies.” The following is a summary of significant accounting policies followed by the Fund in the preparation of its financial statements in accordance with U.S. generally accepted accounting principles (“U.S. GAAP”).
Investment Transactions
Investment transactions are recorded on a trade date basis. Trade date for senior and subordinated loans purchased in the “primary market” is considered the date on which the loan allocations are determined. Trade date for senior and subordinated loans purchased in the “secondary market” is the date on which the transaction is entered into. Realized gains and losses from investment transactions are determined on the specific identification method, which is the same basis used for federal income tax purposes. Investments purchased on a when-issued/delayed delivery basis may have extended settlement periods. Any investments so purchased are subject to market fluctuation during this period. The Fund has earmarked securities in it’s portfolio with a current value at least equal to the amount of the when-issued/delayed delivery purchase commitments.
As of the end of the reporting period, the Fund’s outstanding when-issued/delayed delivery purchase commitments were as follows:
| | | | |
Outstanding when-issued/delayed delivery purchase commitments | | | $472,261 | |
Investment Income
Dividend income is recorded on the ex-dividend date or, for foreign securities, when information is available. Interest income, which reflects the amortization of premiums and includes accretion of discounts for financial reporting purposes, is recorded on an accrual basis. Fee income consists primarily of amendment fees. Amendment fees are earned as compensation for evaluating and accepting changes to an original senior loan agreement and are recognized when received. Fee income and amendment fees are a component of “Interest income” on the Statement of Operations, if any. Other income is comprised of fees earned in connection with the rehypothecation of pledged collateral as further described in Note 9 – Borrowing Arrangements, Rehypothecation.
Professional Fees
Professional fees presented on the Statement of Operations consist of legal fees incurred in the normal course of operations, audit fees, tax consulting fees and, in some cases, workout expenditures. Workout expenditures are incurred in an attempt to protect or enhance an investment or to pursue other claims or legal actions on behalf of Fund shareholders. If a refund is received for workout expenditures paid in a prior reporting period, such amounts will be recognized as “Legal fee refund” on the Statement of Operations.
Dividends and Distributions to Common Shareholders
Distributions to common shareholders are recorded on the ex-dividend date. The amount and timing of distributions are determined in accordance with federal income tax regulations, which may differ from U.S. GAAP.
The Fund makes quarterly cash distributions to common shareholders of a stated dollar amount per share. Subject to approval and oversight by the Fund’s Board of Trustees (the “Board”), the Fund seeks to maintain a stable distribution level designed to deliver the long-term return potential of the Fund’s investment strategy through regular quarterly distributions (a “Managed Distribution Program”). Total distributions during a calendar year generally will be made from the Fund’s net investment income, net realized capital gains and net unrealized capital gains in the Fund’s portfolio, if any. The portion of distributions paid attributed to net unrealized gains, if any, is distributed from the Fund’s assets and is treated by shareholders as a nontaxable distribution (“return of capital”) for tax purposes. In the event that total distributions during a calendar year exceed the Fund’s total return on net asset value (“NAV”), the difference will reduce NAV per share. If the Fund’s total return on NAV exceeds total distributions during a calendar year, the excess will be reflected as an increase in NAV per share. The final determination of the source and character of all distributions paid by the Fund during the fiscal year is made after the end of the fiscal year and is reflected in the financial statements contained in the annual report as of December 31 each year.
The tax character of Fund distributions for a fiscal year is dependent upon the amount and tax character of distributions received from securities held in the Fund’s portfolio. Distributions received from certain securities in which the Fund invests, most notably REIT securities, may be characterized for tax purposes as ordinary income, long-term capital gain and/or a return of capital. The issuer of a security reports the tax character of its distributions only once per year, generally during the first two months of the calendar year. The distribution is included in the Fund’s ordinary income until such time the Fund is notified by the issuer of the actual tax character. For the current fiscal period dividend income, net realized gain (loss) and unrealized appreciation (depreciation) recognized on the Statement of Operations reflect the amounts of ordinary income, capital gain, and/or return of capital as reported by the issuers of such securities.
The distributions made by the Fund during the current fiscal period are provisionally classified as being “From and in excess of net investment income,” and those distributions will be classified as being from net investment income, net realized capital gains and/or a return of capital for tax purposes after the fiscal year end. For purposes of calculating “Undistributed (Overdistribution of) net investment income” as of the end of the reporting period, the distribution amounts provisionally classified as “From and in excess of net investment income” were treated as being entirely from net investment income. Consequently, the financial statements as of the end of the reporting period, reflect an over-distribution of net investment income.
Compensation
The Fund pays no compensation directly to those of its trustees who are affiliated with the Adviser or to its officers, all of whom receive remuneration for their services to the Fund from the Adviser or its affiliates. The Board has adopted a deferred compensation plan for independent trustees that enables trustees to elect to defer receipt of all or a portion of the annual compensation they are entitled to receive from certain Nuveen-advised funds. Under the plan, deferred amounts are treated as though equal dollar amounts had been invested in shares of select Nuveen-advised funds.
Indemnifications
Under the Fund’s organizational documents, its officers and trustees are indemnified against certain liabilities arising out of the performance of their duties to the Fund. In addition, in the normal course of business, the Fund enters into contracts that provide general indemnifications to other parties. The Fund’s maximum exposure under these arrangements is unknown as this would involve future claims that may be made against the Fund that have not yet occurred. However, the Fund has not had prior claims or losses pursuant to these contracts and expects the risk of loss to be remote.
Netting Agreements
In the ordinary course of business, the Fund may enter into transactions subject to enforceable master repurchase agreements, International Swaps and Derivative Association, Inc. (“ISDA”) master agreements or other similar arrangements (“netting agreements”). Generally, the right to offset in netting agreements allows the Fund to offset certain securities and derivatives with a specific counterparty, when applicable, as well as any collateral received or delivered to that counterparty based on the terms of the agreements. Generally, the Fund manages its cash collateral and securities collateral on a counterparty basis.
The Fund’s investments subject to netting agreements as of the end of the reporting period, if any, are further described in Note 3 – Portfolio Securities and Investments in Derivatives.
Notes to Financial Statements (Unaudited) (continued)
Use of Estimates
The preparation of financial statements in conformity with U.S. GAAP requires management to make estimates and assumptions that affect the reported amounts of assets and liabilities at the date of the financial statements and the reported amounts of increases and decreases in net assets applicable to common shares from operations during the current fiscal period. Actual results may differ from those estimates.
2. Investment Valuation and Fair Value Measurements
The fair valuation input levels as described below are for fair value measurement purposes.
Fair value is defined as the price that would be received upon selling an investment or transferring a liability in an orderly transaction to an independent buyer in the principal or most advantageous market for the investment. A three-tier hierarchy is used to maximize the use of observable market data and minimize the use of unobservable inputs and to establish classification of fair value measurements for disclosure purposes. Observable inputs reflect the assumptions market participants would use in pricing the asset or liability. Observable inputs are based on market data obtained from sources independent of the reporting entity. Unobservable inputs reflect the reporting entity’s own assumptions about the assumptions market participants would use in pricing the asset or liability. Unobservable inputs are based on the best information available in the circumstances. The following is a summary of the three-tiered hierarchy of valuation input levels.
| | |
| Level 1 – | | Inputs are unadjusted and prices are determined using quoted prices in active markets for identical securities. |
| Level 2 – | | Prices are determined using other significant observable inputs (including quoted prices for similar securities, interest rates, prepayment speeds, credit risk, etc.). |
| Level 3 – | | Prices are determined using significant unobservable inputs (including management’s assumptions in determining the fair value of investments). |
Common stocks and other equity-type securities are valued at the last sales price on the securities exchange on which such securities are primarily traded and are generally classified as Level 1. Securities primarily traded on the NASDAQ National Market (“NASDAQ”) are valued at the NASDAQ Official Closing Price and are generally classified as Level 1. However, securities traded on a securities exchange or NASDAQ for which there were no transactions on a given day or securities not listed on a securities exchange or NASDAQ are valued at the quoted bid price and are generally classified as Level 2. Prices of certain ADRs held by the Fund that trade in the United States are valued based on the last traded price, official closing price or the most recent bid price of the underlying non-U.S.-traded stock, adjusted as appropriate for the underlying-to-ADR conversion ratio and foreign exchange rate, and from time-to-time may also be adjusted further to take into account material events that may take place after the close of the local non-U.S. market but before the close of the NYSE, which may represent a transfer from a Level 1 to a Level 2 security.
Prices of fixed-income securities are provided by an independent pricing service (“pricing service”) approved by the Board. The pricing service establishes a security’s fair value using methods that may include consideration of the following: yields or prices of investments of comparable quality, type of issue, coupon, maturity and rating, market quotes or indications of value from security dealers, evaluations of anticipated cash flows or collateral, general market conditions and other information and analysis, including the obligor’s credit characteristics considered relevant. These securities are generally classified as Level 2. In pricing certain securities, particularly less liquid and lower quality securities, the pricing service may consider information about a security, its issuer or market activity provided by the Adviser. These securities are generally classified as Level 2 or Level 3 depending on the observability of the significant inputs.
Like most fixed-income securities, the senior and subordinated loans in which the Fund invests are not listed on an organized exchange. The secondary market of such investments may be less liquid relative to markets for other fixed-income securities. Consequently, the value of senior and subordinated loans, determined as described above, may differ significantly from the value that would have been determined had there been an active market for that senior loan. These securities are generally classified as Level 2.
Prices of swap contracts are also provided by a pricing service approved by the Board using the same methods as described above and are generally classified as Level 2.
The value of exchange-traded options are based on the mean of the closing bid and ask prices and are generally classified as Level 1. Options traded in the over-the-counter (“OTC”) market are valued using an evaluated mean price and are generally classified as Level 2.
Repurchase agreements are valued at contract amount plus accrued interest, which approximates market value. These securities are generally classified as Level 2.
Investments in investment companies are valued at their respective NAVs on the valuation date and are generally classified as Level 1.
Investments initially valued in currencies other than the U.S. dollar are converted to the U.S. dollar using exchange rates obtained from pricing services. As a result, the NAV of the Fund’s shares may be affected by changes in the value of currencies in relation to the U.S. dollar. The value of securities traded in markets outside the United States or denominated in currencies other than the U.S. dollar may be affected significantly on a day that the NYSE is closed and an investor is not able to purchase, redeem or exchange shares. If significant market events occur between the time of determination of the closing price of a foreign security on an exchange and the time that the Fund’s NAV is determined, or if under the Fund’s procedures, the closing price of a
foreign security is not deemed to be reliable, the security would be valued at fair value as determined in accordance with procedures established in good faith by the Board. These securities are generally classified as Level 2 or Level 3 depending on the observability of the significant inputs.
Certain securities may not be able to be priced by the pre-established pricing methods as described above. Such securities may be valued by the Board and/or its appointee at fair value. These securities generally include, but are not limited to, restricted securities (securities which may not be publicly sold without registration under the Securities Act of 1933, as amended) for which a pricing service is unable to provide a market price; securities whose trading has been formally suspended; debt securities that have gone into default and for which there is no current market quotation; a security whose market price is not available from a pre-established pricing source; a security with respect to which an event has occurred that is likely to materially affect the value of the security after the market has closed but before the calculation of the Fund’s NAV (as may be the case in non-U.S. markets on which the security is primarily traded) or make it difficult or impossible to obtain a reliable market quotation; and a security whose price, as provided by the pricing service, is not deemed to reflect the security’s fair value. As a general principle, the fair value of a security would appear to be the amount that the owner might reasonably expect to receive for it in a current sale. A variety of factors may be considered in determining the fair value of such securities, which may include consideration of the following: yields or prices of investments of comparable quality, type of issue, coupon, maturity and rating, market quotes or indications of value from security dealers, evaluations of anticipated cash flows or collateral, general market conditions and other information and analysis, including the obligor’s credit characteristics considered relevant. These securities are generally classified as Level 2 or Level 3 depending on the observability of the significant inputs. Regardless of the method employed to value a particular security, all valuations are subject to review by the Board and/or its appointee.
The inputs or methodologies used for valuing securities are not an indication of the risks associated with investing in those securities. The following is a summary of the Fund’s fair value measurements as of the end of the reporting period:
| | | | | | | | | | | | | | | | |
| | | Level 1 | | | Level 2 | | | Level 3 | | | Total | |
Long-Term Investments*: | | | | | | | | | | | | | | | | |
Common Stocks | | $ | 121,404,875 | | | $ | 67,729,698 | ** | | $ | — | *** | | $ | 189,134,573 | |
Convertible Preferred Securities | | | 5,537,222 | | | | 2,412,691 | ** | | | — | | | | 7,949,913 | |
$25 par (or similar) Retail Preferred | | | 12,190,495 | | | | 918,055 | ** | | | — | | | | 13,108,550 | |
Variable Rate Senior Loan Interests | | | — | | | | 47,888,615 | | | | — | | | | 47,888,615 | |
Corporate bonds | | | — | | | | 1,280,686 | | | | — | | | | 1,280,686 | |
$1,000 Par (or similar) Institutional Preferred | | | — | | | | 9,686,350 | | | | — | | | | 9,686,350 | |
| | | | |
Short-Term Investments: | | | | | | | | | | | | | | | | |
Investment Companies | | | 1,689,131 | | | | — | | | | — | | | | 1,689,131 | |
Repurchase Agreements | | | — | | | | 5,554,461 | | | | — | | | | 5,554,461 | |
| | | | |
Investments in Derivatives: | | | | | | | | | | | | | | | | |
Interest Rate Swaps**** | | | — | | | | (63,603 | ) | | | — | | | | (63,603 | ) |
Total | | $ | 140,821,723 | | | $ | 135,406,953 | | | $ | — | | | $ | 276,228,676 | |
| * | Refer to the Fund’s Portfolio of Investments for industry classifications. |
| ** | Refer to the Fund’s Portfolio of Investments for securities classified as Level 2. |
| *** | Refer to the Fund’s Portfolio of Investments for securities classified as Level 3. Value equals zero as of the end of the reporting period. |
| **** | Represents net unrealized appreciation (depreciation) as reported in the Fund’s Portfolio of Investments. |
The table below presents the transfers in and out of the three valuation levels for the Fund as of the end of the reporting period when compared to the valuation levels as of the end of the previous fiscal year. Changes in valuation inputs or methodologies may result in transfers into or out of an assigned level within the fair value hierarchy. Transfers in or out of levels are generally due to the availability of publicly available information and to the significance or extent the Adviser determines that the valuation inputs or methodologies may impact the valuation of those securities.
| | | | | | | | | | | | | | | | | | | | | | | | |
| | | Level 1 | | | Level 2 | | | Level 3 | |
| | | Transfers In | | | (Transfers Out) | | | Transfers In | | | (Transfers Out) | | | Transfers In | | | (Transfers Out) | |
Common Stocks | | $ | 2,734,182 | | | $ | — | | | $ | — | | | $ | (2,734,182 | ) | | $ | — | | | $ | — | |
The Board is responsible for the valuation process and has appointed the oversight of the daily valuation process to the Adviser’s Valuation Committee. The Valuation Committee, pursuant to the valuation policies and procedures adopted by the Board, is responsible for making fair value determinations, evaluating the effectiveness of the Fund’s pricing policies and reporting to the Board. The Valuation Committee is aided in its efforts by the Adviser’s dedicated Securities Valuation Team, which is responsible for administering the daily valuation process and applying fair value methodologies as approved by the Valuation Committee. When determining the reliability of independent pricing services for investments owned by the Fund, the Valuation Committee, among other things, conducts due diligence reviews of the pricing services and monitors the quality of security prices received through various testing reports conducted by the Securities Valuation Team.
Notes to Financial Statements (Unaudited) (continued)
The Valuation Committee will consider pricing methodologies it deems relevant and appropriate when making a fair value determination, based on the facts and circumstances specific to the portfolio instrument. Fair value determinations generally will be derived as follows, using public or private market information:
| | (i) | If available, fair value determinations shall be derived by extrapolating from recent transactions or quoted prices for identical or comparable securities. |
| | (ii) | If such information is not available, an analytical valuation methodology may be used based on other available information including, but not limited to: analyst appraisals, research reports, corporate action information, issuer financial statements and shelf registration statements. Such analytical valuation methodologies may include, but are not limited to: multiple of earnings, discount from market value of a similar freely-traded security, discounted cash flow analysis, book value or a multiple thereof, risk premium/yield analysis, yield to maturity and/or fundamental investment analysis. |
The purchase price of a portfolio instrument will be used to fair value the instrument only if no other valuation methodology is available or deemed appropriate, and it is determined that the purchase price fairly reflects the instrument’s current value.
For each portfolio security that has been fair valued pursuant to the policies adopted by the Board, the fair value price is compared against the last available and next available market quotations. The Valuation Committee reviews the results of such testing and fair valuation occurrences are reported to the Board.
3. Portfolio Securities and Investments in Derivatives
Portfolio Securities
Foreign Currency Transactions
To the extent that the Fund may invest in securities and/or contracts that are denominated in a currency other than U.S. dollars, the Fund will be subject to currency risk, which is the risk that an increase in the U.S. dollar relative to the foreign currency will reduce returns or portfolio value. Generally, when the U.S. dollar rises in value against a foreign currency, the Fund’s investments denominated in that currency will lose value because its currency is worth fewer U.S. dollars; the opposite effect occurs if the U.S. dollar falls in relative value. Investments and other assets and liabilities denominated in foreign currencies are converted into U.S. dollars on a spot (i.e. cash) basis at the spot rate prevailing in the foreign currency exchange market at the time of valuation. Purchases and sales of investments and income denominated in foreign currencies are translated into U.S. dollars on the respective dates of such transactions.
As of the end of the reporting period, the Fund’s investments in non-U.S. securities were as follows:
| | | | | | | | |
| | | Value | | | % of Total
Investments | |
Country: | | | | | | | | |
Germany | | $ | 21,627,207 | | | | 7.8 | % |
United Kingdom | | | 19,382,778 | | | | 7.0 | |
Japan | | | 13,951,273 | | | | 5.1 | |
Netherlands | | | 10,670,156 | | | | 3.9 | |
Ireland | | | 9,250,090 | | | | 3.3 | |
France | | | 8,663,616 | | | | 3.1 | |
Switzerland | | | 7,264,373 | | | | 2.6 | |
Bermuda | | | 6,590,230 | | | | 2.4 | |
Spain | | | 5,343,102 | | | | 1.9 | |
Other | | | 20,496,890 | | | | 7.5 | |
Total non-U.S. securities | | $ | 123,239,715 | | | | 44.6 | % |
The books and records of the Fund are maintained in U.S. dollars. Foreign currencies, assets and liabilities are translated into U.S. dollars at 4:00 p.m. Eastern Time. Investment transactions, income and expenses are translated on the respective dates of such transactions. Net realized foreign currency gains and losses resulting from changes in exchange rates include foreign currency gains and losses between trade date and settlement date of the transactions, foreign currency transactions and the difference between the amounts of interest and dividends recorded on the books of the Fund and the amounts actually received.
The realized gains and losses resulting from changes in foreign currency exchange rates and changes in foreign exchange rates associated with (i) foreign currency (ii) investments, (iii) investments in derivatives and (iv) other assets and liabilities are recognized as a component of “Net realized gain (loss) from investments and foreign currency” on the Statement of Operations, when applicable.
The unrealized gains and losses resulting from changes in foreign currency exchange rates and changes in foreign exchange rates associated with (i) investments and (ii) other assets and liabilities are recognized as a component of “Change in unrealized appreciation (depreciation) of investments and
foreign currency” on the Statement of Operations, when applicable. The unrealized gains and losses resulting from changes in foreign exchange rates associated with investments in derivatives are recognized as a component of the respective derivative’s related “Change in net unrealized appreciation (depreciation)” on the Statement of Operations, when applicable.
Repurchase Agreements
In connection with transactions in repurchase agreements, it is the Fund’s policy that its custodian take possession of the underlying collateral securities, the fair value of which exceeds the principal amount of the repurchase transaction, including accrued interest, at all times. If the counterparty defaults, and the fair value of the collateral declines, realization of the collateral may be delayed or limited.
The following table presents the repurchase agreements for the Fund that are subject to netting agreements as of the end of the reporting period, and the collateral delivered related to those repurchase agreements.
| | | | | | | | | | | | |
| Counterparty | | Short-Term
Investments, at Value | | | Collateral
Pledged (From)
Counterparty* | | | Net
Exposure | |
Fixed Income Clearing Corporation | | $ | 5,554,461 | | | $ | (5,554,461 | ) | | $ | — | |
| * | As of the end of the reporting period, the value of the collateral pledged from the counterparty exceeded the value of the repurchase agreements. Refer to the Fund’s Portfolio of Investments for details on the repurchase agreements. |
Zero Coupon Securities
A zero coupon security does not pay a regular interest coupon to its holders during the life of the security. Income to the holder of the security comes from accretion of the difference between the original purchase price of the security at issuance and the par value of the security at maturity and is effectively paid at maturity. The market prices of zero coupon securities generally are more volatile than the market prices of securities that pay interest periodically.
Investments in Derivatives
The Fund is authorized to invest in certain derivative instruments, such as futures, options and swap contracts. The Fund limits its investments in futures, options on futures and swap contracts to the extent necessary for the Adviser to claim the exclusion from registration by the Commodity Futures Trading Commission as a commodity pool operator with respect to the Fund. The Fund records derivative instruments at fair value, with changes in fair value recognized on the Statement of Operations, when applicable. Even though the Fund’s investments in derivatives may represent economic hedges, they are not considered to be hedge transactions for financial reporting purposes.
Options Transactions
The purchase of options involves the risk of loss of all or a part of the cash paid for the options (the premium). The market risk associated with purchasing options is limited to the premium paid. The counterparty credit risk of purchasing options, however, needs also to take into account the current value of the option, as this is the performance expected from the counterparty. When the Fund purchases an option, an amount equal to the premium paid (the premium plus commission) is recognized as a component of “Options purchased, at value” on the Statement of Assets and Liabilities. When the Fund writes an option, an amount equal to the net premium received (the premium less commission) is recognized as a component of “Options written, at value” on the Statement of Assets and Liabilities and is subsequently adjusted to reflect the current value of the written option until the option is exercised or expires or the Fund enters into a closing purchase transaction. The changes in the value of options purchased and/or written during the fiscal period are recognized as a component of “Change in net unrealized appreciation (depreciation) of options purchased and/or written” on the Statement of Operations. When an option is exercised or expires or the Fund enters into a closing purchase transaction, the difference between the net premium received and any amount paid at expiration or on executing a closing purchase transaction, including commission, is recognized as a component of “Net realized gain (loss) from options purchased and/or written” on the Statement of Operations. The Fund, as a writer of an option, has no control over whether the underlying instrument may be sold (called) or purchased (put) and as a result bears the risk of an unfavorable change in the market value of the instrument underlying the written option. There is also the risk the Fund may not be able to enter into a closing transaction because of an illiquid market.
During the current fiscal period, the Fund wrote call options on individual stocks, while investing in these same stocks, to enhance returns while foregoing some upside potential.
The average notional amount of outstanding options written during the current fiscal period was as follows:
| | | | |
Average notional amount of outstanding options written* | | | $ — | |
| * | The average notional amount is calculated based on the outstanding notional at the beginning of the fiscal period and at the end of each fiscal quarter within the current fiscal period. The Fund did not write any call options at the beginning of the fiscal period and at the end of each fiscal quarter within the current fiscal period. |
Notes to Financial Statements (Unaudited) (continued)
The following table presents the amount of net realized gain (loss) and change in net unrealized appreciation (depreciation) recognized on options written on the Statement of Operations during the current fiscal period, and the primary underlying risk exposure.
| | | | | | | | | | |
| Underlying Risk Exposure | | Derivative
Instrument | | Net Realized
Gain (Loss)
from Options Written | | | Change in Net
Unrealized Appreciation
(Depreciation) of
Options Written | |
Equity Price | | Options written | | $ | 23,272 | | | $ | — | |
Interest Rate Swap Contracts
Interest rate swap contracts involve the Fund’s agreement with the counterparty to pay or receive a fixed rate payment in exchange for the counterparty receiving or paying a variable rate payment. Forward interest rate swap contracts involve the Fund’s agreement with a counterparty to pay, in the future, a fixed or variable rate payment in exchange for the counterparty paying the Fund a variable or fixed rate payment, the accruals for which would begin at a specified date in the future (the “effective date”).
The amount of the payment obligation for an interest rate swap is based on the notional amount and the termination date of the contract. Interest rate swap contracts do not involve the delivery of securities or other underlying assets or principal. Accordingly, the risk of loss with respect to the swap counterparty on such transactions is limited to the net amount of interest payments that the Fund is to receive.
Interest rate swap contracts are valued daily. Upon entering into an interest rate swap contract (and beginning on the effective date for a forward interest rate swap contract), the Fund accrues the fixed rate payment expected to be paid or received and the variable rate payment expected to be received or paid on the interest rate swap contracts on a daily basis, and recognizes the daily change in the fair value of the Fund’s contractual rights and obligations under the contracts. For an OTC swap that is not cleared through a clearing house (“OTC Uncleared”), the net amount recorded on these transactions, for each counterparty, is recognized on the Statement of Assets and Liabilities as a component of “Unrealized appreciation or depreciation on interest rate swaps (, net).”
Upon the execution of an OTC swap cleared through a clearing house (“OTC Cleared”), the Fund is obligated to deposit cash or eligible securities, also known as “initial margin,” into an account at its clearing broker equal to a specified percentage of the contract amount. Cash deposited by the Fund to cover initial margin requirements on open swap contracts, if any, is recognized as a component of “Cash collateral at brokers” on the Statement of Assets and Liabilities. Investments in OTC Cleared swaps obligate the Fund and the clearing broker to settle monies on a daily basis representing changes in the prior day’s “mark-to-market” of the swap contract. If the Fund has unrealized appreciation, the clearing broker will credit the Fund’s account with an amount equal to the appreciation. Conversely, if the Fund has unrealized depreciation, the clearing broker will debit the Fund’s account with an amount equal to the depreciation. These daily cash settlements are also known as “variation margin.” Variation margin for OTC Cleared swaps is recognized as a receivable and/or payable for “Variation margin on swap contracts” on the Statement of Assets and Liabilities. Upon the execution of an OTC Uncleared swap, neither the Fund nor the counterparty is required to deposit initial margin as the trades are recorded bilaterally between both parties to the swap contract, and the terms of the variation margin are subject to a predetermined threshold negotiated by the Fund and the counterparty. Variation margin for OTC Uncleared swaps is recognized as a component of “Unrealized appreciation or depreciation on interest rate swaps (, net)” as described in the preceding paragraph.
The net amount of periodic payments settled in cash are recognized as a component of “Net realized gain (loss) from swaps” on the Statement of Operations, in addition to the net realized gain or loss recorded upon the termination of the swap contract. For tax purposes, payments expected to be received or paid on the swap contacts are treated as ordinary income or expense, respectively. Changes in the value of the swap contracts during the fiscal period are recognized as a component of “Change in net unrealized appreciation (depreciation) of swaps” on the Statement of Operations. In certain instances, payments are made or received upon entering into the swap contract to compensate for differences between the stated terms of the swap agreements and prevailing market conditions (credit spreads, currency exchange rates, interest rates, and other relevant factors). Payments received or made at the beginning of the measurement period, if any, are recognized as “Interest rate swaps premiums paid and/or received” on the Statement of Assets and Liabilities.
During the current fiscal period, the Fund continued to utilize forward starting interest rate swap contracts to partially hedge its future interest cost of leverage, which is through the use of bank borrowings.
The average notional amount of interest rate swap contracts outstanding during the current fiscal period was as follows:
| | | | |
Average notional amount of interest rate swap contracts outstanding* | | | $44,725,000 | |
| * | The average notional amount is calculated based on the outstanding notional at the beginning of the fiscal period and at the end of each fiscal quarter within the current fiscal period. |
The following table presents the fair value of all swap contracts held by the Fund as of the end of the reporting period, the location of these instruments on the Statement of Assets and Liabilities and the primary underlying risk exposure.
| | | | | | | | | | | | | | | | | | |
| | | | | Location on the Statement of Assets and Liabilities | |
Underlying Risk Exposure | | Derivative Instrument | | Asset Derivatives | | | | | | (Liability) Derivatives | |
| | | Location | | Value | | | | | | Location | | Value | |
| Interest rate | | Swaps (OTC Uncleared) | | — | | $ | — | | | | | | | Unrealized depreciation on interest rate swaps** | | $ | 226,005 | |
| Interest rate | | Swaps (OTC Uncleared) | | — | | | — | | | | | | | Unrealized depreciation on interest rate swaps** | | | (289,608 | ) |
| Total | | | | | | $ | — | | | | | | | | | $ | (63,603 | ) |
| ** | Some swap contracts require a counterparty to pay or receive a premium, which is disclosed in the Statement of Assets and Liabilities and is not reflected in the cumulative unrealized appreciation (depreciation) presented above. |
The following table presents the swap contracts subject to netting agreements and the collateral delivered related to those swap contracts as of the end of the reporting period.
| | | | | | | | | | | | | | | | | | | | | | | | | | | | |
| | | | | | | | | | | | | | | Gross Amounts Not Offset
on the Statement of Assets and Liabilities | |
| Counterparty | | Gross
Unrealized
Appreciation
on Interest
Rate Swaps*** | | | Gross
Unrealized
(Depreciation)
on Interest
Rate Swaps*** | | | Amounts
Netted on
Statement
of Assets and
Liabilities | | | Net Unrealized
Appreciation
(Depreciation) on
Interest Rate
Swaps | | | Interest
Rate Swaps
Premiums Paid | | | Collateral
Pledged
to (from)
Counterparty | | | Net
Exposure | |
JPMorgan Chase Bank, N.A. | | $ | 226,005 | | | $ | (289,608 | ) | | $ | 226,005 | | | $ | (63,603 | ) | | $ | 63,603 | | | $ | — | | | $ | — | |
| *** | Represents gross unrealized appreciation (depreciation) for the counterparty as reported in the Fund’s Portfolio of Investments. |
The following table presents the amount of net realized gain (loss) and change in net unrealized appreciation (depreciation) recognized on swap contracts on the Statement of Operations during the current fiscal period, and the primary underlying risk exposure.
| | | | | | | | | | |
| Underlying Risk Exposure | | Derivative
Instrument | | Net Realized
Gain (Loss) from
Swaps | | | Change in Net
Unrealized Appreciation
(Depreciation) of
Swaps | |
Interest rate | | Swaps | | $ | (613,786 | ) | | $ | 801,725 | |
Market and Counterparty Credit Risk
In the normal course of business the Fund may invest in financial instruments and enter into financial transactions where risk of potential loss exists due to changes in the market (market risk) or failure of the other party to the transaction to perform (counterparty credit risk). The potential loss could exceed the value of the financial assets recorded on the financial statements. Financial assets, which potentially expose the Fund to counterparty credit risk, consist principally of cash due from counterparties on forward, option and swap transactions, when applicable. The extent of the Fund’s exposure to counterparty credit risk in respect to these financial assets approximates their carrying value as recorded on the Statement of Assets and Liabilities.
The Fund helps manage counterparty credit risk by entering into agreements only with counterparties the Adviser believes have the financial resources to honor their obligations and by having the Adviser monitor the financial stability of the counterparties. Additionally, counterparties may be required to pledge collateral daily (based on the daily valuation of the financial asset) on behalf of the Fund with a value approximately equal to the amount of any unrealized gain above a pre-determined threshold. Reciprocally, when the Fund has an unrealized loss, the Fund has instructed the custodian to pledge assets of the Fund as collateral with a value approximately equal to the amount of the unrealized loss above a pre-determined threshold. Collateral pledges are monitored and subsequently adjusted if and when the valuations fluctuate, either up or down, by at least the pre-determined threshold amount.
4. Fund Shares
The Fund did not have any transactions in common shares during current and prior fiscal periods.
5. Investment Transactions
Long-term purchases and sales (including maturities but excluding derivative transactions) during the current fiscal, aggregated $65,884,812 and $62,553,308, respectively.
Notes to Financial Statements (Unaudited) (continued)
Transactions in options written during the current fiscal period were as follows:
| | | | | | | | |
| | | Number of
Contracts | | | Premiums
Received | |
Options outstanding, beginning of period | | | — | | | $ | — | |
Options written | | | 890 | | | | 21,788 | |
Options terminated in closing purchase transactions | | | — | | | | — | |
Options exercised | | | — | | | | — | |
Options expired | | | (890 | ) | | | (21,788 | ) |
Options outstanding, end of period | | | — | | | $ | — | |
6. Income Tax Information
The Fund intends to distribute substantially all of its net investment company taxable income to shareholders and to otherwise comply with the requirements of Subchapter M of the Internal Revenue Code applicable to regulated investment companies. In any year when the Fund realizes net capital gains, the Fund may choose to distribute all or a portion of its net capital gains to shareholders, or alternatively, to retain all or a portion of its net capital gains and pay federal corporate income taxes on such retained gains.
For all open tax years and all major taxing jurisdictions, management of the Fund has concluded that there are no significant uncertain tax positions that would require recognition in the financial statements. Open tax years are those that are open for examination by taxing authorities (i.e., generally the last four tax year ends and the interim tax period since then). Furthermore, management of the Fund is also not aware of any tax positions for which it is reasonably possible that the total amounts of unrecognized tax benefits will significantly change in the next twelve months.
The following information is presented on an income tax basis. Differences between amounts for financial statement and federal income tax purposes are primarily due to the recognition of premium amortization and timing differences in recognizing certain gains and losses on investment transactions. To the extent that differences arise that are permanent in nature, such amounts are reclassified within the capital accounts as detailed below. Temporary differences do not require reclassification. Temporary and permanent differences do not impact the NAV of the Fund.
As of June 30, 2017, the cost and unrealized appreciation (depreciation) of investments (excluding investments in derivatives), as determined on a federal income tax basis, were as follows:
| | | | |
Cost of investments | | $ | 248,309,177 | |
Gross unrealized: | | | | |
Appreciation | | $ | 36,459,466 | |
Depreciation | | | (8,476,364 | ) |
Net unrealized appreciation (depreciation) of investments | | $ | 27,983,102 | |
| | | | |
| Permanent differences, primarily due to foreign currency transactions, tax basis earnings and profits adjustments, treatment of notional principal contracts, expiration of capital loss carryforwards, complex securities character adjustments and bond premium amortization adjustments, resulted in reclassifications among the Fund’s components of common share net assets as of December 31, 2016, the Fund’s last tax year end, as follows: | |
Paid-in surplus | | $ | (12,085,959 | ) |
Undistributed (Over-distribution of) net investment income | | | 2,409,977 | |
Accumulated net realized gain (loss) | | | 9,675,982 | |
| | | | |
| The tax components of undistributed net ordinary income and net long-term capital gains as of December 31, 2016, the Fund’s last tax year end, were as follows: | |
Undistributed net ordinary income | | $ | — | |
Undistributed net long-term capital gains | | | — | |
The tax character of distributions paid during the Fund’s last tax year ended December 31, 2016, was designated for purposes of the dividends paid deduction as follows: | |
Distributions from net ordinary income1 | | $ | 9,043,510 | |
Distributions from net long-term capital gains | | | — | |
Return of capital | | | 4,965,754 | |
1 Net ordinary income consists of net taxable income derived from dividends and interest, and current year earnings and profits attributable to realized gains. | |
As of December 31, 2016, the Fund’s last tax year end, the Fund had unused capital loss carryforwards available for federal income tax purposes to be applied against future capital gains, if any. If not applied, the carryforwards will expire as shown in the following table. The losses not subject to expiration will be utilized first by the Fund.
| | | | |
Expiration: | | | | |
December 31, 2017 | | $ | 32,157,951 | |
Not subject to expiration | | | — | |
Total | | $ | 32,157,951 | |
During the Fund’s last tax year ended December 31, 2016, the Fund utilized $2,468,137 of its capital loss carryforwards.
As of December 31, 2016, the Fund’s last tax year end, $9,577,865 of the Fund’s capital loss carryforward expired.
7. Management Fees
Management Fees
The Fund’s management fee compensates the Adviser for overall investment advisory and administrative services and general office facilities. The Sub-Advisers are compensated for their services to the Fund from the management fees paid to the Adviser.
The Fund’s management fee consists of two components – a fund-level fee, based only on the amount of assets within the Fund, and a complex-level fee, based on the aggregate amount of all eligible fund assets managed by the Adviser. This pricing structure enables Fund shareholders to benefit from growth in the assets within the Fund as well as from growth in the amount of complex-wide assets managed by the Adviser.
The annual Fund-level fee, payable monthly, is calculated according to the following schedule:
| | | | |
| Average Daily Managed Assets* | | Fund-Level Fee | |
For the first $500 million | | | 0.7000 | % |
For the next $500 million | | | 0.6750 | |
For the next $500 million | | | 0.6500 | |
For the next $500 million | | | 0.6250 | |
For managed assets over $2 billion | | | 0.6000 | |
The annual complex-level fee, payable monthly, is calculated by multiplying the current complex-wide fee rate, determined according to the following schedule by the Fund’s daily managed assets:
| | | | |
| Complex-Level Managed Asset Breakpoint Level* | | Effective Rate at Breakpoint Level | |
$55 billion | | | 0.2000 | % |
$56 billion | | | 0.1996 | |
$57 billion | | | 0.1989 | |
$60 billion | | | 0.1961 | |
$63 billion | | | 0.1931 | |
$66 billion | | | 0.1900 | |
$71 billion | | | 0.1851 | |
$76 billion | | | 0.1806 | |
$80 billion | | | 0.1773 | |
$91 billion | | | 0.1691 | |
$125 billion | | | 0.1599 | |
$200 billion | | | 0.1505 | |
$250 billion | | | 0.1469 | |
$300 billion | | | 0.1445 | |
| * | For the complex-level fees, managed assets include closed-end fund assets managed by the Adviser that are attributable to certain types of leverage. For these purposes, leverage includes the fund’s use of preferred stock and borrowings and certain investments in the residual interest certificates (also called inverse floating rate securities) in tender option bond (TOB) trusts, including the portion of assets held by a TOB trust that has been effectively financed by the trust’s issuance of floating rate securities, subject to an agreement by the Adviser as to certain funds to limit the amount of such assets for determining managed assets in certain circumstances. The complex-level fee is calculated based upon the aggregate daily managed assets of all Nuveen funds that constitute “eligible assets”. Eligible assets do not include assets attributable to investments in other Nuveen funds or assets in excess of a determined amount (originally $2 billion) added to the Nuveen fund complex in connection with the Adviser’s assumption of the management of the former First American Funds effective January 1, 2011. As of June 30, 2017, the complex-level fee for the Fund was 0.1606%. |
8. Senior Loan Commitments
Unfunded Commitments
Pursuant to the terms of certain of the variable rate senior loan agreements, the Fund may have unfunded senior loan commitments. The Fund will maintain with its custodian, cash, liquid securities and/or liquid senior loans having an aggregate value at least equal to the amount of unfunded senior loan commitments. As of the end of the reporting period, the Fund had no such unfunded senior loan commitments.
Notes to Financial Statements (Unaudited) (continued)
Participation Commitments
With respect to the senior loans held in the Fund’s portfolio, the Fund may: 1) invest in assignments; 2) act as a participant in primary lending syndicates; or 3) invest in participations. If the Fund purchases a participation of a senior loan interest, the Fund would typically enter into a contractual agreement with the lender or other third party selling the participation, rather than directly with the borrower. As such, the Fund not only assumes the credit risk of the borrower, but also that of the selling participant or other persons interpositioned between the Fund and the borrower. As of the end of the reporting period, the Fund had no such outstanding participation commitments.
9. Borrowing Arrangements
Borrowings
The Fund has entered into a borrowing arrangement as a means of leverage.
The Fund has a $87,400,000 (maximum commitment amount) committed financing agreement (“Borrowings”). As of the end of the reporting period, the outstanding balance on these Borrowings was $83,800,000.
Interest is charged on these Borrowings at 1-Month LIBOR (London Inter-Bank Offered Rate) plus 0.65% per annum on the amount borrowed and 0.50% per annum on the undrawn balance. The Fund is only charged the 0.50% per annum undrawn fee if the undrawn portion of the Borrowings on that day is more than 20% of the maximum commitment amount. During the current fiscal period, the average daily balance outstanding and average annual interest rate on these Borrowings was $77,467,956 and 1.59%, respectively.
In order to maintain these Borrowings, the Fund must meet certain collateral, asset coverage and other requirements. Borrowings outstanding are fully secured by securities held in the Fund’s portfolio of investments (“Pledged Collateral”).
Borrowings outstanding are recognized as “Borrowings” on the Statement of Assets and Liabilities. Interest expense incurred on the drawn amount and undrawn balance are recognized as a component of “Interest expense on borrowings” on the Statement of Operations.
Rehypothecation
The Fund has entered into a Rehypothecation Side Letter (“Side Letter”) with its prime brokerage lender, allowing it to re-register the Pledged Collateral in its own name or in a name other than the Fund’s to pledge, repledge, hypothecate, rehypothecate, sell, lend or otherwise transfer or use the Pledged Collateral (the “Hypothecated Securities”) with all rights of ownership as described in the Side Letter. Subject to certain conditions, the total value of the outstanding Hypothecated Securities shall not exceed the lesser of (i) 98% of the outstanding balance on the Borrowings to which the Pledged Collateral relates and (ii) 33 1⁄3% of the Fund’s total assets. The Fund may designate any Pledged Collateral as ineligible for rehypothecation. The Fund may also recall Hypothecated Securities on demand.
The Fund also has the right to apply and set-off an amount equal to one-hundred percent (100%) of the then-current fair market value of such Pledged Collateral against the current Borrowings under the Side Letter in the event that the prime brokerage lender fails to timely return the Pledged Collateral and in certain other circumstances. In such circumstances, however, the Fund may not be able to obtain replacement financing required to purchase replacement securities and, consequently, the Fund’s income generating potential may decrease. Even if the Fund is able to obtain replacement financing, it might not be able to purchase replacement securities at favorable prices.
The Fund will receive a fee in connection with the Hypothecated Securities (“Rehypothecation Fees”) in addition to any principal, interest, dividends and other distributions paid on the Hypothecated Securities.
As of the end of the reporting period, the Fund had Hypothecated Securities totalling $60,415,367. During the current fiscal period the Fund earned Rehypothecation Fees of $18,596, which is recognized as “Other income” on the Statement of Operations.
Inter-Fund Borrowing and Lending
The Securities and Exchange Commission (“SEC”) has granted an exemptive order permitting registered open-end and closed-end Nuveen funds to participate in an inter-fund lending facility whereby the Nuveen funds may directly lend to and borrow money from each other for temporary purposes (e.g., to satisfy redemption requests or when a sale of securities “fails,” resulting in an unanticipated cash shortfall) (the “Inter-Fund Program”). The closed-end Nuveen funds, including the Funds covered by this shareholder report, will participate only as lenders, and not as borrowers, in the Inter-Fund Program because such closed-end funds rarely, if ever, need to borrow cash to meet redemptions. The Inter-Fund Program is subject to a number of conditions, including, among other things, the requirements that (1) no fund may borrow or lend money through the Inter-Fund Program unless it receives a more favorable interest rate than is typically available from a bank or other financial institution for a comparable transaction; (2) no fund may borrow on an unsecured basis through the Inter-Fund Program unless the fund’s outstanding borrowings from all sources immediately after the inter-fund borrowing total 10% or less of its total assets; provided that if the borrowing fund has a secured borrowing outstanding from any other lender, including but not limited to another fund, the inter-fund loan must be secured on at least an equal priority basis with at least an equivalent percentage of collateral to loan value; (3) if a fund’s total outstanding borrowings immediately after an inter-fund borrowing would be greater than 10% of its total assets, the fund may
borrow through the inter-fund loan on a secured basis only; (4) no fund may lend money if the loan would cause its aggregate outstanding loans through the Inter-Fund Program to exceed 15% of its net assets at the time of the loan; (5) a fund’s inter-fund loans to any one fund shall not exceed 5% of the lending fund’s net assets; (6) the duration of inter-fund loans will be limited to the time required to receive payment for securities sold, but in no event more than seven days; and (7) each interfund loan may be called on one business day’s notice by a lending fund and may be repaid on any day by a borrowing fund. In addition, a Nuveen fund may participate in the Inter-Fund Program only if and to the extent that such participation is consistent with the fund’s investment objective and investment policies. The Board is responsible for overseeing the Inter-Fund Program.
The limitations detailed above and the other conditions of the SEC exemptive order permitting the Inter-Fund Program are designed to minimize the risks associated with Inter-Fund Program for both the lending fund and the borrowing fund. However, no borrowing or lending activity is without risk. When a fund borrows money from another fund, there is a risk that the loan could be called on one day’s notice or not renewed, in which case the fund may have to borrow from a bank at a higher rate or take other actions to payoff such loan if an inter-fund loan is not available from another fund. Any delay in repayment to a lending fund could result in a lost investment opportunity or additional borrowing costs.
During May 2017, the Board approved the Nuveen funds participation in the Inter-Fund Program. During the current reporting period, the Fund did not enter into any inter-fund loan activity.
10. New Accounting Pronouncements
Amendments to Regulation S-X
In October 2016, the SEC adopted new rules and amended existing rules (together, the “final rules”) intended to modernize the reporting and disclosure of information by registered investment companies. In part, the final rules amend Regulation S-X and require standardized, enhanced disclosure about derivatives in investment company financial statements, as well as other amendments. The compliance date of the amendments to Regulation S-X is August 1, 2017. Management is still evaluating the impact of the final rules, if any.
Accounting Standards Update (“ASU”) 2017-08 (“ASU 2017-08”) Premium Amortization on Purchased Callable Debt Securities
During March 2017, the Financial Accounting Standards Board (“FASB”) issued ASU 2017-08, which shortens the premium amortization period for purchased non-contingently callable debt securities. ASU 2017-08 specifies that the premium amortization period ends at the earliest call date, for purchased non-contingently callable debt securities. ASU 2017-08 is effective for fiscal years, and interim periods within those fiscal years, beginning after December 15, 2018. Management is currently evaluating the implications of ASU 2017-08, if any.
Additional
Fund Information
| | | | | | | | | | |
| Board of Trustees | | | | | | | | | | |
Margo Cook* | | Jack B. Evans | | William C. Hunter | | David J. Kundert | | Albin F. Moschner | | John K. Nelson |
William J. Schneider | | Judith M. Stockdale | | Carole E. Stone | | Terence J. Toth | | Margaret L. Wolff | | Robert C. Young** |
| * | Interested Board Member. |
| ** | Effective July 1, 2017. |
| | | | | | | | |
| | | | | |
Fund Manager Nuveen Fund Advisors, LLC
333 West Wacker Drive
Chicago, IL 60606 | | Custodian State Street Bank
& Trust Company
One Lincoln Street Boston, MA 02111 | | Legal Counsel Chapman and Cutler LLP
Chicago, IL 60603 | | Independent Registered
Public Accounting Firm KPMG LLP 200 East Randolph Drive Chicago, IL 60601 | | Transfer Agent and
Shareholder Services Computershare Trust Company N.A. 250 Royal Street Canton, MA 02021 (800) 257-8787 |
Quarterly Form N-Q Portfolio of Investments Information
The Fund is required to file its complete schedule of portfolio holdings with the Securities and Exchange Commission (SEC) for the first and third quarters of each fiscal year on Form N-Q. You may obtain this information directly from the SEC. Visit the SEC on-line at http://www.sec.gov or in person at the SEC’s Public Reference Room in Washington, D.C. Call the SEC toll-free at (800) SEC-0330 for room hours and operation.
Nuveen Funds’ Proxy Voting Information
You may obtain (i) information regarding how each fund voted proxies relating to portfolio securities held during the most recent twelve-month period ended June 30, without charge, upon request, by calling Nuveen toll-free at (800) 257-8787 or on Nuveen’s website at www.nuveen.com and (ii) a description of the policies and procedures that each fund used to determine how to vote proxies relating to portfolio securities without charge, upon request, by calling Nuveen toll free at (800) 257-8787. You may also obtain this information directly from the SEC. Visit the SEC on-line at http://www.sec.gov.
CEO Certification Disclosure
The Fund’s Chief Executive Officer (CEO) has submitted to the New York Stock Exchange (NYSE) the annual CEO certification as required by Section 303A.12(a) of the NYSE Listed Company Manual. The Fund has filed with the SEC the certification of its CEO and Chief Financial Officer required by Section 302 of the Sarbanes-Oxley Act.
Common Share Repurchases
The Fund intends to repurchase, through its open-market share repurchase program, shares of its own common stock at such times and in such amounts as is deemed advisable. During the period covered by this report, the Fund repurchased shares of its common stock as shown in the accompanying table. Any future repurchases will be reported to shareholders in the next annual or semi-annual report.
| | | | |
| | | JTA | |
Common shares repurchased | | | — | |
FINRA BrokerCheck
The Financial Industry Regulatory Authority (FINRA) provides information regarding the disciplinary history of FINRA member firms and associated investment professionals. This information as well as an investor brochure describing FINRA BrokerCheck is available to the public by calling the FINRA BrokerCheck Hotline number at (800) 289-9999 or by visiting www.FlNRA.org.
Glossary of Terms
Used in this Report
| ∎ | | Average Annual Total Return: This is a commonly used method to express an investment’s performance over a particular, usually multi-year time period. It expresses the return that would have been necessary each year to equal the investment’s actual cumulative performance (including change in NAV or market price and reinvested dividends and capital gains distributions, if any) over the time period being considered. |
| ∎ | | Blended Benchmark (old): A blended return comprised of: 1) 56% of the return of the Russell 3000® Value Index, which measures the performance of those Russell 3000® Index companies with lower price-to book ratios and lower forecasted growth values, 2) 16% of the return of the MSCI EAFE ex-Japan Value Index, a capitalization weighted index that selects the lower 50% of the price-to-book ranked value stocks traded in the developed markets of Europe, Asia and the Far East, excluding Japan, 3) 8% of the return of the BofA/Merrill Lynch DRD (dividends received deduction) Preferred Index, which consists of investment-grade, DRD-eligible, exchange-traded preferred stocks with one year or more to maturity, and 4) 20% of the return of the Credit Suisse Leveraged Loan Index, which consists of approximately $150 billion of tradable term loans with at least one year to maturity and rated BBB or lower. Index returns assume reinvestment of distributions, but do not include the effects of any applicable sales charges or management fees. |
| ∎ | | Blended Benchmark (new): A blended return comprised of: 1) 72% of the return of the MSCI World Index, a free float-adjusted market capitalization weighted index that is designed to measure the equity market performance of developed markets. The MSCI World Index consists of the following 23 developed market country indexes: Australia, Austria, Belgium, Canada, Denmark, Finland, France, Germany, Hong Kong, Ireland, Israel, Italy, Japan, Netherlands, New Zealand, Norway, Portugal, Singapore, Spain, Sweden, Switzerland, the U.K. and the U.S. 2) 8% of the return of the BofA/Merrill Lynch DRD (dividends received deduction) Eligible Preferred Securities Index, which consists of investment-grade, DRD-eligible, exchange-traded preferred stocks with one year or more to maturity, and 3) 20% of the return of the Credit Suisse Leveraged Loan Index, which consists of approximately $150 billion of tradable term loans with at least one year to maturity and rated BBB or lower. Index returns assume reinvestment of distributions, but do not include the effects of any applicable sales charges or management fees. |
| ∎ | | Collateralized Loan Obligation (CLO): A security backed by a pool of debt, often low rated corporate loans. Collateralized loan obligations (CLOs) are similar to collateralized mortgage obligations, except for the different type of underlying loan. |
| ∎ | | Effective Leverage: Effective leverage is a fund’s effective economic leverage, and includes both regulatory leverage (see below) and the leverage effects of certain derivative investments in the fund’s portfolio. |
| ∎ | | Leverage: Leverage is created whenever a fund has investment exposure (both reward and/or risk) equivalent to more than 100% of the investment capital. |
| ∎ | | Morgan Stanley Capital International (MSCI) World Index: A free float-adjusted market capitalization weighted index that is designed to measure the equity market performance of developed markets. The MSCI World Index consists of the following 23 developed market country indexes: Australia, Austria, Belgium, Canada, Denmark, Finland, France, Germany, Hong Kong, Ireland, Israel, Italy, Japan, Netherlands, New Zealand, Norway, Portugal, Singapore, Spain, Sweden, Switzerland, the U.K. and the U.S. Index returns assume reinvestment of distributions, but do not reflect any applicable sales charges or management fees. |
| ∎ | | Net Asset Value (NAV) Per Share: A fund’s Net Assets is equal to its total assets (securities, cash, accrued earnings and receivables) less its total liabilities. NAV per share is equal to the fund’s Net Assets divided by its number of shares outstanding. |
| ∎ | | Regulatory Leverage: Regulatory leverage consists of preferred shares issued by or borrowings of a fund. Both of these are part of the fund’s capital structure. Regulatory leverage is subject to asset coverage limits set in the Investment Company Act of 1940. |
| ∎ | | S&P 500® Index: An unmanaged index generally considered representative of the U.S. stock market. Index returns assume reinvestment of distributions, but do not reflect any applicable sales charges or management fees. |
Reinvest Automatically,
Easily and Conveniently
Nuveen makes reinvesting easy. A phone call is all it takes to set up your reinvestment account.
Nuveen Closed-End Funds Automatic Reinvestment Plan
Your Nuveen Closed-End Fund allows you to conveniently reinvest distributions in additional Fund shares.
By choosing to reinvest, you’ll be able to invest money regularly and automatically, and watch your investment grow through the power of compounding. Just like distributions in cash, there may be times when income or capital gains taxes may be payable on distributions that are reinvested.
It is important to note that an automatic reinvestment plan does not ensure a profit, nor does it protect you against loss in a declining market.
Easy and convenient
To make recordkeeping easy and convenient, each quarter you’ll receive a statement showing your total distributions, the date of investment, the shares acquired and the price per share, and the total number of shares you own.
How shares are purchased
The shares you acquire by reinvesting will either be purchased on the open market or newly issued by the Fund. If the shares are trading at or above net asset value at the time of valuation, the Fund will issue new shares at the greater of the net asset value or 95% of the then-current market price. If the shares are trading at less than net asset value, shares for your account will be purchased on the open market. If the Plan Agent begins purchasing Fund shares on the open market while shares are trading below net asset value, but the Fund’s shares subsequently trade at or above their net asset value before the Plan Agent is able to complete its purchases, the Plan Agent may cease open-market purchases and may invest the uninvested portion of the distribution in newly-issued Fund shares at a price equal to the greater of the shares’ net asset value or 95% of the shares’ market value on the last business day immediately prior to the purchase date. Distributions received to purchase shares in the open market will normally be invested shortly after the distribution payment date. No interest will be paid on distributions awaiting reinvestment. Because the market price of the shares may increase before purchases are completed, the average purchase price per share may exceed the market price at the time of valuation, resulting in the acquisition of fewer shares than if the distribution had been paid in shares issued by the Fund. A pro rata portion of any applicable brokerage commissions on open market purchases will be paid by Plan participants. These commissions usually will be lower than those charged on individual transactions.
Flexible
You may change your distribution option or withdraw from the Plan at any time, should your needs or situation change.
You can reinvest whether your shares are registered in your name, or in the name of a brokerage firm, bank, or other nominee. Ask your investment advisor if his or her firm will participate on your behalf. Participants whose shares are registered in the name of one firm may not be able to transfer the shares to another firm and continue to participate in the Plan.
The Fund reserves the right to amend or terminate the Plan at any time. Although the Fund reserves the right to amend the Plan to include a service charge payable by the participants, there is no direct service charge to participants in the Plan at this time.
Call today to start reinvesting distributions
For more information on the Nuveen Automatic Reinvestment Plan or to enroll in or withdraw from the Plan, speak with your financial advisor or call us at (800) 257-8787.
Annual Investment
Management Agreement Approval Process
The Board of Trustees (the “Board,” and each Trustee, a “Board Member”) of the Fund, including the Board Members who are not parties to the Fund’s advisory or sub-advisory agreements or “interested persons” of any such parties (the “Independent Board Members”), oversees the management of the Fund, including the performance of Nuveen Fund Advisors, LLC, the Fund’s investment adviser (the “Adviser”), and NWQ Investment Management Company, LLC (“NWQ”) and Symphony Asset Management LLC (“Symphony”), the Fund’s sub-advisers (collectively, the “Sub-Advisers”). As required by applicable law, after the initial term of the Fund following commencement of its operations, the Board is required to consider annually whether to renew the management agreement with the Adviser (the “Investment Management Agreement”) and the sub-advisory agreements with the Sub-Advisers (each, a “Sub-Advisory Agreement” and, together with the Investment Management Agreement, the “Advisory Agreements”). Accordingly, the Board met in person on April 11-12, 2017 (the “April Meeting”) and May 23-25, 2017 (the “May Meeting”) to consider the approval of each Advisory Agreement that was up for renewal for an additional one-year period.
The Board considered its review of the Advisory Agreements as an ongoing process encompassing the information received and the deliberations the Board and its committees have had throughout the year. The Board met regularly during the year and received materials and discussed topics that were relevant to the annual consideration of the renewal of the Advisory Agreements, including, among other things, overall market performance and developments; fund investment performance; investment team review; valuation of securities; compliance, regulatory and risk management matters; and other developments. The Board had also established several standing committees, including the Open-end Fund Committee and Closed-end Fund Committee, which met regularly throughout the year to permit the Board Members to delve deeper into the topics particularly relevant to the respective product line. The Board further continued its practice of seeking to meet periodically with the sub-advisers and their investment teams. The accumulated information, knowledge, and experience the Board Members had gained during their tenure on the Board governing the Fund and working with the Fund Advisers (as defined below) were taken into account in their review of the Advisory Agreements.
In addition to the materials received by the Board or its committees throughout the year, the Board reviewed extensive additional materials prepared specifically for its annual review of the Advisory Agreements in response to a request by independent legal counsel on behalf of the Independent Board Members. The materials addressed a variety of topics, including, but not limited to, a description of the services provided by the Adviser and the Sub-Advisers (the Adviser and the Sub-Advisers are each a “Fund Adviser”); an analysis of fund performance including comparative industry data and a detailed focus on performance outliers; an analysis of the Sub-Advisers; an analysis of the fees and expense ratios of the Nuveen funds in absolute terms and in comparison to the fees and expenses of peers with a focus on any expense outliers; an assessment of shareholder services for the Nuveen funds and of the performance of certain service providers; a review of initiatives instituted or continued during the past year; a review of premium/discount trends and leverage management for the closed-end funds; and information regarding the profitability of the Fund Advisers, the compensation of portfolio managers, and compliance and risk matters. The materials provided in connection with the annual review included information compiled and prepared by Broadridge Financial Solutions, Inc. (“Broadridge” or “Lipper”), an independent provider of investment company data, comparing, in relevant part, the Fund’s fees and expenses with those of a comparable universe of funds (the “Peer Universe”), as selected by Broadridge (the “Broadridge Report”). The Independent Board Members also received a memorandum from independent legal counsel outlining their fiduciary duties and legal standards in reviewing the Advisory Agreements.
As part of its annual review, the Board met at the April Meeting to review the investment performance of the Fund and to consider the Adviser’s analysis of each Sub-Adviser evaluating, among other things, the Sub-Adviser’s assets under management, investment team, performance, organizational stability, and investment approach. During the review, the Independent Board Members requested and received additional information from management. At the May Meeting, the Board, including the Independent Board Members, continued its review and ultimately approved the continuation of the Advisory Agreements for an additional year. Throughout the year and throughout their review of the Advisory Agreements, the Independent Board Members were assisted by independent legal counsel and met with counsel separately without management present. In deciding to renew the Advisory Agreements, the Independent Board Members did not identify a particular factor as determinative, but rather the
Annual Investment Management Agreement Approval Process (continued)
decision reflected the comprehensive consideration of all the information presented, and each Board Member may have attributed different weights to the various factors and information considered in connection with the approval process. The following summarizes the principal factors, but not all the factors, the Board considered in its review of the Advisory Agreements and its conclusions.
| A. | | Nature, Extent and Quality of Services |
In evaluating the renewal of the Advisory Agreements, the Independent Board Members received and considered information regarding the nature, extent and quality of the applicable Fund Adviser’s services provided to the Fund and the resulting performance of the Fund. The Board recognized the myriad of services the Adviser and its affiliates provided to manage and operate the Nuveen funds, including (a) product management (such as managing distributions, positioning the product in the marketplace, maintaining and enhancing shareholder communications and reporting to the Board); (b) investment oversight, risk management and securities valuation (such as overseeing the sub-advisers and other service providers, analyzing investment performance and risks, overseeing risk management and disclosure, executing the daily valuation of securities, and analyzing trade execution); (c) fund administration (such as helping to prepare fund tax returns and complete other tax compliance matters and helping to prepare regulatory filings and shareholder reports); (d) fund board administration (such as preparing board materials and organizing and providing assistance for board meetings); (e) compliance (such as helping to devise and maintain the Nuveen funds’ compliance program and test for adherence); (f) legal support (such as helping to prepare registration statements and proxy statements, interpreting regulations and policies and overseeing fund activities); (g) with respect to certain closed-end funds, providing leverage, capital and distribution management services; and (h) with respect to certain open-end funds with portfolios that have a leverage component, providing such leverage management services.
The Board further noted the Adviser’s continued dedication to investing in its business to enhance the quality and breadth of the services provided to the Fund. The Board recognized the Adviser’s investment in staffing over recent years to support the services provided to the Nuveen funds in key areas, including in investment services, product management, retail distribution and information technology, closed-end funds and structured products, as well as in fund administration, operations and risk management. The Board further noted the Adviser’s continued commitment to enhancing its compliance program by, among other things, restructuring the compliance organization, developing a unified compliance program, adding compliance staff, and developing and/or revising policies and procedures as well as building further infrastructure to address new regulatory requirements or guidance and the growth of the complex. The Board also considered the enhancements to Nuveen’s cybersecurity capabilities, systems and processes to value securities, stress test reporting and risk and control self-assessments.
In addition, the Independent Board Members considered information highlighting the various initiatives that the Adviser had implemented or continued over recent years to benefit the open-end fund and closed-end fund product lines and/or particular Nuveen funds. The Board noted the Adviser’s continued efforts to rationalize the open-end fund and closed-end fund product lines through, among other things, mergers, liquidations and repositionings in seeking to provide enhanced shareholder value over the years through increased efficiency, reduced costs, improved performance and revised investment approaches that are more relevant to current shareholder needs. With respect to closed-end Nuveen funds, such initiatives included (a) an increased level of leverage management activities in 2016 and 2017 resulting from the rollover of existing facilities, the negotiation of improved terms and pricing to reduce leverage costs, the innovation of new leverage structures, the rebalancing of leverage of various funds as a result of mergers or new investment mandates, and the restructuring of tender option bonds to be compliant with new regulatory requirements; (b) an increased level of capital management activities (i.e., the management of the issuance and repurchase of shares of certain closed-end funds) during 2016 as a result of market demand as well as an implementation of a cross department review system for shares trading at certain discount levels; (c) continued refinements to a database to permit further analysis of the closed-end fund marketplace and shareholder base; (d) the development of enhanced secondary market board reporting and commentary; (e) the reconfiguration of the framework for determining and maintaining closed-end fund benchmarks to permit more consistency across the complex; and (f) the development of product innovations for new closed-end offerings, including target term funds. The Board also recognized the Adviser’s continued commitment to supporting the closed-end product line through its award winning investor relations support program through which Nuveen seeks to educate investors and financial advisers regarding closed-end funds.
In its review, the Board recognized that initiatives that attracted assets to the Nuveen family of funds generally benefited the Nuveen funds in the complex as fixed costs would be spread over a larger asset base and, as described below, through the complex-wide fee arrangement which generally provides that the management fees of the Nuveen funds (subject to limited exceptions) are reduced as asset levels in the complex reach certain breakpoints in the fee schedule.
Similarly, the Board considered the sub-advisory services provided by the Sub-Advisers to the Fund. The Sub-Advisers generally provided portfolio advisory services for the Fund. The Board reviewed the Adviser’s analysis of each Sub-Adviser which evaluated, among other things, the respective investment team and any changes thereto, the stability and history of the organization, the assets under management, the investment approach and the performance of the Nuveen funds it sub-advises. The Board noted that the Adviser recommended the renewal of each Sub-Advisory Agreement.
Based on its review, the Board determined, in the exercise of its reasonable business judgment, that it was satisfied with the nature, extent and quality of services provided to the Fund under each Advisory Agreement.
| B. | | The Investment Performance of the Fund and Fund Advisers |
As part of its evaluation of the services provided by the Fund Advisers, the Board reviewed Fund performance over the quarter, one-, three- and five-year periods ending December 31, 2016 as well as performance data for the first quarter of 2017 ending March 31, 2017. The Board reviewed performance on an absolute basis and in comparison to the performance of peer funds (the “Performance Peer Group”) and a recognized or customized benchmark (i.e., generally a benchmark derived from multiple recognized benchmarks). The Independent Board Members also reviewed, among other things, the returns of each sleeve of the Fund relative to the benchmark of such sleeve for the quarter, one-, three- and five-year periods ending December 31, 2016, as well as performance information reflecting the first quarter of 2017. For closed-end funds, the Board (or the Closed-end Fund Committee) also reviewed, among other things, the premium or discount to net asset value of the Nuveen closed-end funds as of a specified date and over various periods as well as in comparison to the premium/discount average in their respective Lipper peer category. The Independent Board Members continued to recognize the importance of secondary market trading for the shares of the closed-end funds and the evaluation of the premium and discount levels was a continuing priority for them. The review and analysis of performance information during the annual review of Advisory Agreements incorporated the discussions and performance information the Board Members have had at each of their quarterly meetings throughout the year.
In evaluating performance data, the Independent Board Members recognized some of the limitations of such data and the difficulty in establishing appropriate peer groups and benchmarks for certain of the Nuveen funds. They recognized that each fund operates pursuant to its own investment objective(s), parameters and restrictions which may differ from that of the Performance Peer Group or benchmark. Certain funds may also utilize leverage which may provide benefits or risks to their portfolio compared to an unlevered benchmark. The Independent Board Members had noted that management had classified the Performance Peer Groups as low, medium and high in relevancy to the applicable fund as a result of these differences or other factors. The Independent Board Members recognized that the variations between the Performance Peer Group or benchmark and the Fund will lead to differing performance results and may limit the value of the comparative performance data in assessing the Fund’s performance.
In addition, the Independent Board Members recognized that the performance data is a snapshot in time, in this case as of the end of the 2016 calendar year or end of the first quarter of 2017. A different period may generate significantly different results and longer term performance can be adversely affected by even one period of significant underperformance. Further, a shareholder’s experience in the Fund depends on his or her own holding period which may differ from that reviewed by the Independent Board Members.
In their review of performance, the Independent Board Members focused, in particular, on the Adviser’s analysis of Nuveen funds determined to be underperforming performance outliers and the factors contributing to the respective fund’s performance and any efforts to address performance concerns. With respect to any Nuveen funds for which the Board has identified performance issues, the Board monitors such funds closely until performance improves, discusses with the Adviser the reasons for such results, considers any steps necessary or appropriate to address such issues, and reviews the results of any efforts undertaken. The Board, however, acknowledged that shareholders chose to invest or remain invested in a fund
Annual Investment Management Agreement Approval Process (continued)
knowing that the Adviser and applicable sub-adviser(s) manage the fund, knowing the fund’s investment strategy and seeking exposure to that strategy (even if the strategy was “out of favor” in the marketplace) and knowing the fund’s fee structure.
The Board noted that although the Fund ranked in the fourth quartile in its Performance Peer Group for the one-year period, the Fund ranked in the third quartile for the three- and five-year periods. Further, although the Fund underperformed its blended benchmark in the one- and three-year periods, it outperformed its benchmark in the five-year period. In considering performance, the Board recognized that the Performance Peer Group was classified as low for relevancy. The Board was satisfied with the Fund’s overall performance.
| C. | | Fees, Expenses and Profitability |
The Board evaluated the management fees and other fees and expenses of the Fund. The Board reviewed and considered, among other things, the gross and net management fees paid by the Fund. The Board further considered the net total expense ratio of the Fund (expressed as a percentage of average net assets) as the expense ratio is most reflective of the investors’ net experience in the Fund as it directly reflected the costs of investing in the Fund.
In addition, the Board reviewed the Broadridge Report comparing, in relevant part, the Fund’s gross and net advisory fees and net total expense ratio with those of its Peer Universe. The Independent Board Members also reviewed the methodology regarding the construction of the Peer Universe by Broadridge. In reviewing the comparative data, the Board was aware that various factors may limit some of the usefulness of the data, such as differences in size of the peers; the composition of the Peer Universe; changes each year of funds comprising the Peer Universe; levels of expense reimbursements and fee waivers; and differences in the type and use of leverage. Nevertheless, in reviewing a fund’s fees and expenses compared to the fees and expenses of its peers (excluding leverage costs and leveraged assets), the Board generally considered a fund’s expenses and fees to be higher if they were over 10 basis points higher, slightly higher if they were 6 to 10 basis points higher, in line if they were within approximately 5 basis points higher than the peer average and below if they were below the peer average of the Peer Universe. The Board noted that the substantial majority of the Nuveen funds had a net expense ratio that was near or below their respective peer average.
The Independent Board Members noted that the Fund had a net expense ratio slightly higher than its peer average but a net management fee in line with its peer average.
In their evaluation of the management fee schedule, the Independent Board Members also reviewed the fund-level and complex-wide breakpoint schedules, as described in further detail below. With respect to closed-end funds, the Board considered the effects of leverage on fees and expenses, including the calculation of management fees for funds with tender option bonds.
Based on their review of the information provided, the Board determined that the Fund’s management fees (as applicable) to a Fund Adviser were reasonable in light of the nature, extent and quality of services provided to the Fund.
| | 2. | | Comparisons with the Fees of Other Clients |
The Board also reviewed information regarding the respective Fund Adviser’s fee rates for providing advisory services to other types of clients. For the Adviser and/or the Sub-Advisers, such other clients may include: separately managed accounts (such as retail, institutional or wrap accounts), hedge funds (with respect to Symphony), other investment companies that are not offered by Nuveen but are sub-advised by NWQ or Symphony, foreign investment companies offered by Nuveen (with respect to NWQ), and collective investment trusts (with respect to NWQ). The Board further noted that the Adviser also advises certain exchange-traded funds (“ETFs”) sponsored by Nuveen.
In reviewing the fee rates assessed to other clients, the Board reviewed, among other things, the range of fees assessed for managed accounts, hedge funds and the foreign investment companies offered by Nuveen. With respect to hedge funds, the Board noted that Symphony also assessed a performance fee for advising a hedge fund or account. With respect to foreign funds, the Board noted that unlike the management fees for the Nuveen funds, the management fees for the foreign funds may include distribution fees paid to intermediaries. The Board also reviewed the average fee rate for certain strategies offered by the Sub-Advisers.
The Board recognized the inherent differences between the Nuveen funds and the other types of clients. The Board considered information regarding these various differences which included, among other things, the services required, average account sizes, types of investors targeted, legal structure and operations, and applicable laws and regulations. The Independent Board Members recognized that the foregoing variations resulted in different economics among the product structures and culminated in varying management fees among the types of clients and the Nuveen funds. In general, the Board noted that higher fee levels reflected higher levels of service provided by the Fund Adviser, increased investment management complexity, greater product management requirements and higher levels of business risk or some combination of the foregoing. The Board recognized the breadth of services the Adviser provided to support the Nuveen funds as summarized above and noted that many of such administrative services may not be required to the same extent or at all for the institutional clients or other clients. The Board further recognized the passive management of ETFs compared to the active management required of other Nuveen funds would contribute to differing fee levels.
The Independent Board Members noted that the sub-advisory fee paid by the Adviser to each Sub-Adviser, however, was generally for portfolio management services. The Board noted such sub-advisory fee was more comparable to the fees of retail wrap accounts and other external sub-advisory mandates.
Given the inherent differences in the various products, particularly the extensive services provided to the Fund, the Board concluded that such facts justify the different levels of fees.
| | 3. | | Profitability of Fund Advisers |
In conjunction with their review of fees, the Independent Board Members also considered Nuveen’s level of profitability for its advisory services to the Nuveen funds for the calendar years 2016 and 2015. In considering profitability, the Independent Board Members considered the level of profitability realized by Nuveen before the imposition of any distribution and marketing expenses incurred by the firm from its own resources. In evaluating the profitability, the Independent Board Members evaluated the analysis employed in developing the profitability figures, including the assumptions and methodology employed in allocating expenses. The Independent Board Members recognized the inherent limitations to any cost allocation methodology as different and reasonable approaches may be used and yet yield differing results. The Independent Board Members further reviewed an analysis of the history of the profitability methodology used explaining any changes to the methodology over the years. The Board has appointed two Independent Board Members, who along with independent legal counsel, helped to review and discuss the methodology employed to develop the profitability analysis each year and any proposed changes thereto and to keep the Board apprised of such changes during the year.
In their review, the Independent Board Members evaluated, among other things, Nuveen’s adjusted operating margins, the gross and net revenue margins (pre-tax and after-tax) for advisory activities for the Nuveen funds, and the revenues, expenses, and net income (pre-tax and after-tax) of Nuveen for each of the last two calendar years. The Independent Board Members also reviewed an analysis of the key drivers behind the changes in revenues and expenses that impacted profitability in 2016 versus 2015. The Board, however, observed that Nuveen’s operating margins for its advisory activities in 2016 were similar to that of 2015.
In addition to reviewing Nuveen’s profitability in absolute terms, the Independent Board Members also reviewed the adjusted total company margins of other advisory firms that had publicly available information and comparable assets under management (based on asset size and asset composition). The Independent Board Members, however, noted that the usefulness of the comparative data may be limited as the other firms may have a different business mix and their profitability data may be affected by numerous other factors such as the types of funds managed, the cost allocation methodology used, and their capital structure. Nevertheless, the Board noted that Nuveen’s adjusted operating margins appeared comparable to the adjusted margins of the peers.
Further, the Adviser is a subsidiary of Nuveen, LLC, the investment management arm of Teachers Insurance and Annuity Association of America (“TIAA”). To have a fuller picture of the financial condition and strength of the TIAA complex, together with Nuveen, the Board reviewed a balance sheet for TIAA reflecting its assets, liabilities and capital and contingency reserves for the 2016 and 2015 calendar years.
Annual Investment Management Agreement Approval Process (continued)
In addition to the Adviser’s profitability, the Independent Board Members also considered the profitability of the Sub-Advisers from their relationship with the Nuveen funds. The Independent Board Members reviewed each Sub-Adviser’s revenues, expenses and revenue margins (pre- and post-tax) for its advisory activities for the calendar year ended December 31, 2016.
In evaluating the reasonableness of the compensation, the Independent Board Members also considered other amounts paid to a Fund Adviser for its services to the Fund as well as indirect benefits (such as soft dollar arrangements), if any, the Fund Adviser and its affiliates received or were expected to receive that were directly attributable to the management of the Fund. See Section E below for additional information on indirect benefits a Fund Adviser may receive as a result of its relationship with the Fund.
Based on a consideration of all the information provided, the Board noted that Nuveen’s and each Sub-Adviser’s level of profitability was acceptable and not unreasonable in light of the services provided.
| D. | | Economies of Scale and Whether Fee Levels Reflect These Economies of Scale |
When evaluating the level of the advisory fees, the Independent Board Members considered whether there will be any economies of scale that may be realized by the Fund Adviser as the Fund grows and the extent to which these economies were shared with the Fund and shareholders. The Board recognized that economies of scale are difficult to measure with precision; however, the Board considered that there were several ways the Fund Adviser may share the benefits of economies of scale with the Nuveen funds, including through breakpoints in the management fee schedule reducing the fee rates as asset levels grow, fee waivers and/or expense limitation agreements and the Adviser’s investment in its business which can enhance the services provided to the Nuveen funds. With respect to the fee structure, the Independent Board Members have recognized that economies of scale may be realized when a particular fund grows, but also when the total size of the fund complex grows (even if the assets of a particular fund in the complex have not changed or have decreased). Accordingly, subject to certain exceptions, the funds in the Nuveen complex pay a management fee to the Adviser which is generally comprised of a fund-level component and complex-level component, each of which has a breakpoint schedule. Subject to certain exceptions, the fund-level fee component declines as the assets of the particular fund grow and the complex-level fee component declines when eligible assets of all the Nuveen funds (except for Nuveen ETFs which are subject to a unitary fee) in the Nuveen complex combined grow. In addition, with respect to closed-end funds, the Independent Board Members noted that, although such funds may from time-to-time make additional share offerings, the growth of their assets would occur primarily through the appreciation of such funds’ investment portfolios.
The Independent Board Members reviewed the breakpoint and complex-wide schedules and any savings achieved from fee reductions as a result of the fund-level and complex-level breakpoints for the 2016 calendar year.
In addition, the Independent Board Members recognized the Adviser’s ongoing investment in its business to expand or enhance the services provided to the benefit of all of the Nuveen funds.
Based on their review, the Board concluded that the current fee structure was acceptable and reflected economies of scale to be shared with shareholders when assets under management increase.
The Independent Board Members received and considered information regarding other benefits the respective Fund Adviser or its affiliates may receive as a result of their relationship with the Nuveen funds, including compensation paid to affiliates of a Fund Adviser for services rendered to the funds and research services received by a Fund Adviser from broker-dealers that execute fund trades. The Independent Board Members noted that affiliates of the Adviser may receive compensation for serving as a co-manager for initial public offerings of new Nuveen closed-end funds and as underwriter on shelf offerings for certain existing funds. The Independent Board Members considered the compensation paid for such services in 2016.
In addition to the above, the Independent Board Members considered that the Fund’s portfolio transactions are allocated by the Sub-Advisers and the Sub-Advisers may benefit from research received from broker-dealers that execute Fund portfolio transactions. The Board noted, however, that with respect to transactions in fixed income securities, such securities generally trade on a principal basis and do not generate soft dollar credits. Although the Board recognized the Sub-Advisers may benefit from soft dollar arrangements if they do not have to pay for this research out of their own assets, the Board also recognized that the research may benefit the Fund to the extent it enhances the ability of the Sub-Advisers to manage the Fund.
Based on their review, the Board concluded that any indirect benefits received by a Fund Adviser as a result of its relationship with the Fund were reasonable and within acceptable parameters.
The Board Members did not identify any single factor discussed previously as all-important or controlling. The Board Members, including the Independent Board Members, concluded that the terms of each Advisory Agreement were fair and reasonable, that the respective Fund Adviser’s fees were reasonable in light of the services provided to the Fund and that the Advisory Agreements be renewed.
Notes
Notes
| | | | | | | | | | | | | | |
| | | | | | | | |
| | | | |
| | | | | | | | |
| | |
| | Nuveen: | | |
| | | | Serving Investors for Generations | | | | |
| | |
| | | | |
| | | |
| | | | Since 1898, financial advisors and their clients have relied on Nuveen to provide
dependable investment solutions through continued adherence to proven, long-term investing
principles. Today, we offer a range of high quality solutions designed to
be integral components of a well-diversified core portfolio.
| | |
| | | |
| | | | | | |
| | | | |
| | | | | | Focused on meeting investor needs. Nuveen is the investment management arm of TIAA. We have grown into one of the world’s premier global asset managers, with specialist knowledge across all major asset classes and particular strength in solutions that provide income for investors and that draw on our expertise in alternatives and responsible investing. Nuveen is driven not only by the independent investment processes across the firm, but also the insights, risk management, analytics and other tools and resources that a truly world-class platform provides. As a global asset manager, our mission is to work in partnership with our clients to create solutions which help them secure their financial future. | | |
| | | | | |
| | | | | | | | | | |
| | | | | | Find out how we can help you.
To learn more about how the products and services of Nuveen
may be able to help you meet your financial goals, talk to your
financial advisor, or call us at (800) 257-8787. Please read the information
provided carefully before you invest. Investors should consider the
investment objective and policies, risk considerations, charges and
expenses of any investment carefully. Where applicable, be sure to obtain a
prospectus, which contains this and other relevant information. To obtain
a prospectus, please contact your securities representative or Nuveen,
333 W. Wacker Dr., Chicago, IL 60606. Please read the
prospectus carefully before you invest or send money.
Learn more about Nuveen Funds at: www.nuveen.com/cef
| | |
| | | | | | |
| | | | | | | | | | | | |
| | Securities offered through Nuveen Securities, LLC, member FINRA and SIPC | 333 West Wacker Drive Chicago, IL 60606 | www.nuveen.com | | |
ESA-C-0617D 243976-INV-B-08/18
Item 2. Code of Ethics.
Not applicable to this filing.
Item 3. Audit Committee Financial Expert.
Not applicable to this filing.
Item 4. Principal Accountant Fees and Services.
Not applicable to this filing.
Item 5. Audit Committee of Listed Registrants.
Not applicable to this filing.
Item 6. Schedule of Investments.
(a) See Portfolio of Investments in Item 1.
(b) Not applicable.
Item 7. Disclosure of Proxy Voting Policies and Procedures for Closed-End Management Investment Companies.
Not applicable to this filing.
Item 8. Portfolio Managers of Closed-End Management Investment Companies.
Not applicable to this filing.
Item 9. Purchases of Equity Securities by Closed-End Management Investment Company and Affiliated Purchasers.
Not applicable.
Item 10. Submission of Matters to a Vote of Security Holders.
There have been no material changes to the procedures by which shareholders may recommend nominees to the registrant’s Board implemented after the registrant last provided disclosure in response to this item.
Item 11. Controls and Procedures.
| (a) | The registrant’s principal executive and principal financial officers, or persons performing similar functions, have concluded that the registrant’s disclosure controls and procedures (as defined in Rule 30a-3(c) under the Investment Company Act of 1940, as amended (the “1940 Act”) (17 CFR 270.30a-3(c))) are effective, as of a date within 90 days of the filing date of this report that includes the disclosure required by this paragraph, based on their evaluation of the controls and procedures required by Rule 30a-3(b) under the 1940 Act (17 CFR 270.30a-3(b)) and Rules 13a-15(b) or 15d-15(b) under the Securities Exchange Act of 1934, as amended (the “Exchange Act”) (17 CFR 240.13a-15(b) or 240.15d-15(b)). |
| (b) | There were no changes in the registrant’s internal control over financial reporting (as defined in Rule 30a-3(d) under the 1940 Act (17 CFR 270.30a-3(d)) that occurred during the second fiscal quarter of the period covered by this report that has materially affected, or is reasonably likely to materially affect, the registrant’s internal control over financial reporting. |
Item 12. Exhibits.
File the exhibits listed below as part of this Form.
(a)(1) Any code of ethics, or amendment thereto, that is the subject of the disclosure required by Item 2, to the extent that the registrant intends to satisfy the Item 2 requirements through filing of an exhibit: Not applicable to this filing.
(a)(2) A separate certification for each principal executive officer and principal financial officer of the registrant as required by Rule 30a-2(a) under the 1940 Act (17 CFR 270.30a-2(a)) in the exact form set forth below: See EX-99.CERT attached hereto.
(a)(3) Any written solicitation to purchase securities under Rule 23c-1 under the 1940 Act (17 CFR 270.23c-1) sent or given during the period covered by the report by or on behalf of the registrant to 10 or more persons: Not applicable.
(b) If the report is filed under Section 13(a) or 15(d) of the Exchange Act, provide the certifications required by Rule 30a-2 (b) under the 1940 Act (17 CFR 270.30a-2(b)), Rule 13a-14(b) or Rule 15d-14(b) under the Exchange Act (17 CFR 240.13a-14(b) or 240.15d-14(b)), and Section 1350 of Chapter 63 of Title 18 of the United States Code (18 U.S.C. 1350) as an Exhibit. A certification furnished pursuant to this paragraph will not be deemed “filed” for purposes of Section 18 of the Exchange Act (15 U.S.C. 78r), or otherwise subject to the liability of that section. Such certification will not be deemed to be incorporated by reference into any filing under the Securities Act of 1933 or the Exchange Act, except to the extent that the registration specifically incorporates it by reference: See EX-99.906 CERT attached hereto.
SIGNATURES
Pursuant to the requirements of the Securities Exchange Act of 1934 and the Investment Company Act of 1940, the registrant has duly caused this report to be signed on its behalf by the undersigned, thereunto duly authorized.
(Registrant) Nuveen Tax-Advantaged Total Return Strategy Fund
| | | | |
| By (Signature and Title) | | /s/ Gifford R. Zimmerman | | |
| | Gifford R. Zimmerman | | |
| | Vice President and Secretary | | |
Date: September 7, 2017
Pursuant to the requirements of the Securities Exchange Act of 1934 and the Investment Company Act of 1940, this report has been signed below by the following persons on behalf of the registrant and in the capacities and on the dates indicated.
| | | | |
| By (Signature and Title) | | /s/ Cedric H. Antosiewicz | | |
| | Cedric H. Antosiewicz | | |
| | Chief Administrative Officer | | |
| | (principal executive officer) | | |
Date: September 7, 2017
| | | | |
| By (Signature and Title) | | /s/ Stephen D. Foy | | |
| | Stephen D. Foy | | |
| | Vice President and Controller | | |
| | (principal financial officer) | | |
Date: September 7, 2017