Non-current debenture loans comprise three bonds each with a nominal value of $750m, maturing in September 2010, March 2013, and August 2016 with fixed coupon rates of 7.875%, 5.25%, and 6.125% respectively. Non-current bank loans include an unsecured 4.57% fixed rate debt obligation with a nominal value of £199.8m repayable in 2008.
A reconciliation of net cash outflow after financing to net debt is set out below:
The increase in provisions due to discounting of £15.4m (decrease of £1.2m) is represented by an increase due to the unwinding of the discount of £24.2m (£10.5m) and a decrease due to the change in the discount rate of £8.8m (£11.7m) .
Back to Contents
Notes to the accounts continued
for the 12 months ended December 31, 2006
The discounted pre-tax provision for the gross cost of asbestos is shown above. The related insurance asset is included within “Receivables” in note 17 and the deferred tax asset relating to asbestos payments is included within “Deferred tax” in note 22.
Claimant numbers and costs during the year
Information regarding the movement in asbestos claimants in the year and the cost of resolution in the year is provided below: | |
|
|
|
|
|
|
|
| | 2006 | | 2005 | | 2004 | |
| |
|
|
|
|
| |
| New claimants | 6,350 | | 10,350 | | 18,700 | |
|
|
|
|
|
| |
| Resolutions | (30,100 | ) | (14,750 | ) | (7,150 | ) |
|
|
|
|
|
| |
| Outstanding claimants | 107,600 | | 131,350 | | 135,750 | |
|
|
|
|
|
| |
| Average gross cost of resolution ($) | 1,811 | | 2,929 | | 8,294 | |
|
|
|
|
|
| |
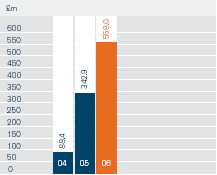
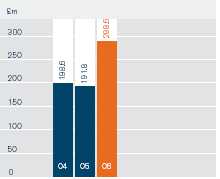
| Gross cost of resolution ($m) | 54.5 | | 43.2 | | 59.3 | |
|
|
|
|
|
| |
| Less insurance recoveries ($m) | (3.4 | ) | (11.5 | ) | (46.5 | ) |
|
|
|
|
|
| |
| Net cost before tax ($m) | 51.1 | | 31.7 | | 12.8 | |
|
|
|
|
|
| |
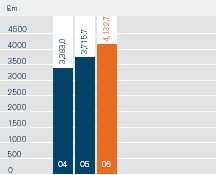
New claimants in 2006 were approximately 6,350 (10,350,18,700). At the end of 2006, outstanding claimants totalled approximately 107,600 (131,350, 135,750). Of the 30,100 (14,750, 7,150) claimants whose cases were resolved during 2006, over 90% were dismissed without payment. In the USA, claimants can file without illness or product identification. In the absence to date of federal reform, a number of states have introduced or are looking to introduce an unimpaired docket which will suspend claims until there is proven evidence of illness.
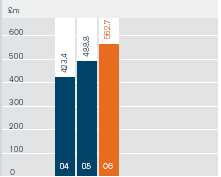
The gross cost of resolving asbestos claims in 2006 was $54.5m ($43.2m, $59.3m) including legal fees of $25.4m ($26.3m, $27.4m) . The net pre-tax cost of asbestos for the year after insurance was $51.1m ($31.7m, $12.8m), equivalent to a sterling cost of £16.9m after tax.
The aggregate amounts paid in settlement and average settlement payments in any given period, together with related defence costs, have fluctuated widely and are expected to continue to fluctuate widely depending on the nature of the claims resolved (including the proportion of which that are mass claims), disease mix, number of other defendants and jurisdiction of claim.
Each of the Company’s relevant US subsidiaries, together with its insurance carriers and outside counsel, review each asbestos claim that is pursued by claimants. In many cases claimants are unable to demonstrate that any injury they have suffered resulted from exposure to the subsidiary’s products, in which case their claim is generally dismissed without payment. In those cases where a compensatable disease, exposure to the subsidiary’s products and causation can be established by claimants, the subsidiary generally settles for amounts that reflect the type of disease, the seriousness of the injury, the age of the claimant, the particular jurisdiction of the claim and the number and solvency of the other defendants.
The Company’s approach to accounting for the asbestos claims against its US subsidiaries is to provide for those costs of resolution which are both probable and reliably estimable. The costs of resolving possible claims are disclosed as contingent liabilities (refer note 26). At present, based on detailed analysis and the assumptions noted below, the provision for those costs which are both probable and reliably estimable equates to approximately eight years of gross cost, assuming an annual level of approximately $60m. Whilst further claims are likely to be resolved beyond this eight year period, the associated costs of resolution are not able to be reliably estimated and hence no provision has been made to cover these possible liabilities.
Assumptions made in establishing the provision relate to the number, disease mix and location of future claimants, trends in dismissal rates, settlement and defence costs, resolution of all existing claimants, time scale of resolution of new claimants, the continued solvency of co-defendants and expected insurance recoveries. In light of the significant uncertainty associated with asbestos claims, there can be no guarantee that the assumptions used to estimate the provision for the cost of resolving asbestos claims will be an accurate prediction of the actual costs that may be incurred and as a result the provision will be subject to potential revision from time to time as additional information becomes available and to reflect any changes in trends.
Gross cost provision
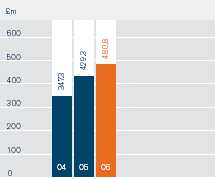
The provision of $496.8m at January 1, 2006 was increased by $60.0m (the estimated gross cost for an additional year) and reduced by the gross cost incurred in 2006 of $54.5m, to give a closing provision at December 31, 2006 of $502.3m. This represents the estimated gross cost of asbestos for the next eight years, and is equivalent to $398.7m on a discounted basis, or £203.7m.
| Movements in the provision for the year were as follows: |
|
| | January 1, | | | | | | | | | | January 1, | | | | | | New | | | | | | December | |
| | 2005 | | Discount | | Provided | | Utilised | | Exchange | | 2006 | | Discount | | Provided | | Insurance | | Utilised | | Exchange | | 31, 2006 | |
|
|
|
|
|
|
|
|
|
|
|
|
|
|
|
|
|
|
|
|
|
|
|
| |
| Undiscounted $m | | | | | | | | | | | | | | | | | | | | | | | | |
|
|
|
|
|
|
|
|
|
|
|
|
|
|
|
|
|
|
|
|
|
|
|
| |
| Gross cost provision | 480.0 | | – | | 60.0 | | (43.2 | ) | – | | 496.8 | | – | | 60.0 | | – | | (54.5 | ) | – | | 502.3 | |
|
|
|
|
|
|
|
|
|
|
|
|
|
|
|
|
|
|
|
|
|
|
|
| |
| Insurance asset | (26.1 | ) | – | | – | | 11.5 | | – | | (14.6 | ) | – | | (20.0 | ) | (58.5 | ) | 3.4 | | – | | (89.7 | ) |
|
|
|
|
|
|
|
|
|
|
|
|
|
|
|
|
|
|
|
|
|
|
|
| |
| Net cost | 453.9 | | – | | 60.0 | | (31.7 | ) | – | | 482.2 | | – | | 40.0 | | (58.5 | ) | (51.1 | ) | – | | 412.6 | |
|
|
|
|
|
|
|
|
|
|
|
|
|
|
|
|
|
|
|
|
|
|
|
| |
| Deferred tax asset | (177.0 | ) | – | | (23.4 | ) | 12.4 | | – | | (188.0 | ) | – | | (15.6 | ) | 22.8 | | 19.9 | | – | | (160.9 | ) |
|
|
|
|
|
|
|
|
|
|
|
|
|
|
|
|
|
|
|
|
|
|
|
| |
| Post-tax net cost | 276.9 | | – | | 36.6 | | (19.3 | ) | – | | 294.2 | | – | | 24.4 | | (35.7 | ) | (31.2 | ) | – | | 251.7 | |
|
|
|
|
|
|
|
|
|
|
|
|
|
|
|
|
|
|
|
|
|
|
|
| |
| | | | | | | | | | | | | | | | | | | | | | | | | |
| Discounted $m | | | | | | | | | | | | | | | | | | | | | | | | |
|
|
|
|
|
|
|
|
|
|
|
|
|
|
|
|
|
|
|
|
|
|
|
| |
| Gross cost provision | 401.2 | | 0.9 | | 39.7 | | (43.2 | ) | – | | 398.6 | | 15.8 | | 38.8 | | – | | (54.5 | ) | – | | 398.7 | |
|
|
|
|
|
|
|
|
|
|
|
|
|
|
|
|
|
|
|
|
|
|
|
| |
| Insurance asset | (24.0 | ) | 0.3 | | – | | 11.5 | | – | | (12.2 | ) | (2.9 | ) | (13.0 | ) | (42.3 | ) | 3.4 | | – | | (67.0 | ) |
|
|
|
|
|
|
|
|
|
|
|
|
|
|
|
|
|
|
|
|
|
|
|
| |
| Net cost | 377.2 | | 1.2 | | 39.7 | | (31.7 | ) | – | | 386.4 | | 12.9 | | 25.8 | | (42.3 | ) | (51.1 | ) | – | | 331.7 | |
|
|
|
|
|
|
|
|
|
|
|
|
|
|
|
|
|
|
|
|
|
|
|
| |
| Deferred tax asset | (147.1 | ) | (0.5 | ) | (15.5 | ) | 12.4 | | – | | (150.7 | ) | (5.0 | ) | (10.1 | ) | 16.5 | | 19.9 | | – | | (129.4 | ) |
|
|
|
|
|
|
|
|
|
|
|
|
|
|
|
|
|
|
|
|
|
|
|
| |
| Post-tax net cost | 230.1 | | 0.7 | | 24.2 | | (19.3 | ) | – | | 235.7 | | 7.9 | | 15.7 | | (25.8 | ) | (31.2 | ) | – | | 202.3 | |
|
|
|
|
|
|
|
|
|
|
|
|
|
|
|
|
|
|
|
|
|
|
|
| |
| | | | | | | | | | | | | | | | | | | | | | | | | |
| Discounted £m | | | | | | | | | | | | | | | | | | | | | | | | |
|
|
|
|
|
|
|
|
|
|
|
|
|
|
|
|
|
|
|
|
|
|
|
| |
| Gross cost provision | 209.0 | | 0.5 | | 21.8 | | (23.8 | ) | 24.7 | | 232.2 | | 8.6 | | 21.1 | | – | | (29.6 | ) | (28.6 | ) | 203.7 | |
|
|
|
|
|
|
|
|
|
|
|
|
|
|
|
|
|
|
|
|
|
|
|
| |
| Insurance asset | (12.5 | ) | 0.1 | | – | | 6.4 | | (1.1 | ) | (7.1 | ) | (1.5 | ) | (7.1 | ) | (23.0 | ) | 1.9 | | 2.6 | | (34.2 | ) |
|
|
|
|
|
|
|
|
|
|
|
|
|
|
|
|
|
|
|
|
|
|
|
| |
| Net cost | 196.5 | | 0.6 | | 21.8 | | (17.4 | ) | 23.6 | | 225.1 | | 7.1 | | 14.0 | | (23.0 | ) | (27.7 | ) | (26.0 | ) | 169.5 | |
|
|
|
|
|
|
|
|
|
|
|
|
|
|
|
|
|
|
|
|
|
|
|
| |
| Deferred tax asset | (76.6 | ) | (0.2 | ) | (8.5 | ) | 6.8 | | (9.3 | ) | (87.8 | ) | (2.7 | ) | (5.5 | ) | 9.0 | | 10.8 | | 10.1 | | (66.1 | ) |
|
|
|
|
|
|
|
|
|
|
|
|
|
|
|
|
|
|
|
|
|
|
|
| |
| Post-tax net cost | 119.9 | | 0.4 | | 13.3 | | (10.6 | ) | 14.3 | | 137.3 | | 4.4 | | 8.5 | | (14.0 | ) | (16.9 | ) | (15.9 | ) | 103.4 | |
|
|
|
|
|
|
|
|
|
|
|
|
|
|
|
|
|
|
|
|
|
|
|
| |
| The rate used to discount the provision and insurance assets was 5.60% (5.30%, 4.25%) . | | | |
| Hanson 2006 www.hanson.biz |
Back to Contents
Insurance asset
The insurance asset of $14.6m at January 1, 2006 was reduced by insurance utilisation during the year of $3.4m, on an undiscounted basis.
Most of the US subsidiaries involved with asbestos claims have had agreements with their respective insurance carriers regarding the defence and settlement of asbestos claims, the terms of which varied for each such subsidiary. These insurance arrangements have resulted in the insurance companies having met substantially all of the amounts such subsidiaries have paid prior to 2006 in settlements and defence costs. In 2006, most of these costs were borne by the relevant subsidiaries. The amounts to be paid by the relevant subsidiaries in future years may vary, depending on litigation and negotiation with the relevant insurers.
On February 13, 2006, Hanson announced that one of its US subsidiaries, responsible for approximately 20% of the group’s present asbestos costs, had reached a settlement with its insurers. The settlement is effective from January 1, 2006 and resolves a number of issues relating to historic insurance policies which provided insurance cover for a range of claims, including those relating to asbestos. Under the settlement, the subsidiary will pay the first $35.0m of its future asbestos costs, which the subsidiary estimates will be paid over approximately four years from January 1, 2006. Thereafter the subsidiary’s asbestos costs will be paid in full by the insurance carriers up to agreed limits. These limits have not been disclosed as they are subject to a confidentiality agreement between the subsidiary and the insurance carriers. These limits, assuming they are not utilised for non-asbestos claims, are expected to provide asbestos insurance cover for this subsidiary well beyond 2020. The receivable recognised as a result of this settlement increased the insurance asset by $58.5m, or £23.0m on a discounted basis. The closing insurance asset at December 31, 2006 is $89.7m, equivalent to £34.2m on a discounted basis as shown in note 17.
Certain other US subsidiaries, not party to the recent settlement, continue to pursue litigation and negotiation to maximise the insurance cover available. Litigation proceedings are progressing in the state of California.
Deferred tax asset
The net cost of asbestos is deductible for US taxation at an estimated rate of 39%. At December 31, 2006, the deferred tax asset relating to the discounted asbestos provision, net of insurance, was £66.1m as shown in note 22.
Income statement
The net impact on the income statement, shown under discontinued items in note 9, was a profit of £1.1m after tax. This consists of a discounted charge after tax of £8.5m, as shown in the ‘Provided’ column of the above table, plus the net impact of the discount unwind and change in discount rate which was a charge of £4.4m after tax as shown in the ‘Discount’ column of the above table, less the new insurance of £14.0m.
Cash flow
The net cash flow impact, shown within net cash inflow from operating activities, was a net cash outflow of £16.9m shown in the ‘Utilised’ column of the above table.
Risk factors
Factors which could cause actual results to differ from these estimates include: (i) adverse trends in the ultimate number of claimants filing asbestos claims against the Company’s US subsidiaries; (ii) increases in the cost of resolving current and future asbestos claims as a result of adverse trends relating to settlement and/or defence costs, dismissal rates, and/or judgment amounts; (iii) increases or decreases in the amount of insurance available to cover asbestos claims; (iv) the emergence of new trends or legal theories that enlarge the number of potential claimants; (v) the impact of bankruptcies of other defendant companies whose share of liability may be imposed on the Company’s US subsidiaries under certain state liability laws; (vi) the unpredictable aspects of the US litigation process; (vii) adverse changes in the mix of asbestos-related diseases with respect to which asbestos claims are made against the Company’s US subsidiaries; and (viii) potential legislative changes.
In light of such factors, the costs of the Company’s US subsidiaries involved in resolving asbestos claims may be materially different from current estimates and consequently might have a material adverse effect on the Company’s consolidated financial condition, results of operations and cash flow. However, assuming that current trends continue, the Company does not expect that such costs will have such a material adverse effect and, even assuming a material deterioration in current trends, on the evidence available to it, the Company does not expect that such claims would impact the ability of the Company to continue as a going concern.
Koppers’ liabilities
Koppers’ environmental obligations and related costs arise primarily from the US chemical and related operations formerly operated by Koppers Company Inc, a company acquired by Beazer PLC, which itself was acquired by the Company in 1991. Members of the Beazer group remain contractually and statutorily liable for certain environmental costs relating to these discontinued operations. During 1998 an agreement was signed under which, for a one-off premium and related transaction costs totalling $275.0m, insurance cover of $800.0m in perpetuity (after payment by members of the Beazer group of the first $100.0m of remediation costs arising since January 1, 1998) was provided by subsidiaries of two reinsurance companies, Centre Solutions and Swiss Re.
At the end of 2006, $467.9m of the $800.0m insurance cover had been utilised. The estimate of future probable cost, discounted at 5.9% (5.3%, 5.1%), is shown as a provision of £104.9m at December 31, 2006. These costs are the responsibility of the insurers and hence a receivable of £104.9m is recorded at December 31, 2006 as shown in note 17.
Based upon existing known circumstances, the Company considers that the remaining $332.1m of insurance cover is expected to meet the related future costs, recognising that the estimate of future probable costs could increase and new sites may arise to which the insurance cover does not apply. Factors which could cause such remediation costs to increase include (i) unknown adverse conditions arising at sites; (ii) third party claims in excess of estimates; (iii) changes to regulatory requirements; (iv) changes in remediation techniques; and (v) any other significant variations to assumptions made in support of these estimates.
Other provisions
Long-term provisions have been discounted at rates of up to 7.1% (6.25%) .
Reclamation obligations have been established to cover those situations where members of the group have either a legal or constructive obligation to carry out remedial works. Reclamation provisions are expected to be utilised over the life of the relevant site. Legal, insurance, environmental and other provisions relate to acquisitions, disposals and rationalisations both arising on acquisitions and provided for in current and prior years. Legal, insurance, environmental and other provisions are expected to be utilised on a reducing basis over the next five years, depending in each case on the nature of the underlying obligation.
Where appropriate, reclamation and environmental provisions have been established after taking into account the opinions of suitably qualified and experienced consultants and after estimating the costs in line with current practice and standards.
Back to Contents
Notes to the accounts continued
for the 12 months ended December 31, 2006
| 22 | Tax payable/receivable and deferred tax |
|
|
| a) | Tax payable/receivable |
|
|
| Current and non-current tax payable/receivable represents expected taxes payable/receivable for tax filings in respect of current and prior years that exceed payments made and received. It also includes provisions for potential adjustments by tax authorities with respect to tax filings. Examination of tax filings by tax authorities may last several years beyond the year of filing. |
At any given time, the group is undergoing tax audits in several tax jurisdictions and covering multiple years. The group has provisions for taxes that may become payable in future periods as a result of these tax audits. The group recognises liabilities for anticipated tax audit issues based on estimates of whether additional taxes will be due. Where the final outcome of these matters is different from the amounts provided, such differences will impact the tax provisions in the period in which such determination is made. Interest on tax liabilities is accrued for in the tax charge and is included in the provisions. The tax provisions are analysed at each balance sheet date and adjustments are made as events occur to warrant adjustments to the provisions. The provisions at December 31, 2006 were £99.3m (£112.8m, £126.9m) . The decrease is due to revisions to the best reasonable estimate of the tax exposures, cash paid on certain audits and foreign exchange movements on non UK provisions.
| Analysis of movements in the net deferred tax balance during the year: |
|
|
|
|
|
| | 2006 | | 2005 | |
| |
|
|
| |
| | £m | | £m | |
|
|
|
| |
| At January 1 | (256.1 | ) | (238.1 | ) |
|
|
|
| |
| Charge to income statement | (12.9 | ) | (3.8 | ) |
|
|
|
| |
| Acquisitions | (72.7 | ) | (20.8 | ) |
|
|
|
| |
| (Charge)/credit to reserves | (3.9 | ) | 11.8 | |
|
|
|
| |
| Other movements | – | | 1.7 | |
|
|
|
| |
| Exchange movements | 13.1 | | (6.9 | ) |
|
|
|
| |
| At December 31 | (332.5 | ) | (256.1 | ) |
|
|
|
| |
| | | | | |
| The deferred tax assets/(liabilities) included in the balance sheet are as follows: |
|
|
|
|
|
| | 2006 | | 2005 | |
| |
|
|
| |
| | £m | | £m | |
|
|
|
| |
| Property, plant and equipment | (549.1 | ) | (531.7 | ) |
|
|
|
| |
| Other assets | (11.5 | ) | 0.2 | |
|
|
|
| |
| Other liabilities | 116.8 | | 108.2 | |
|
|
|
| |
| Asbestos | 66.1 | | 87.8 | |
|
|
|
| |
| Pensions | 37.1 | | 64.2 | |
|
|
|
| |
| Losses | 8.1 | | 15.2 | |
|
|
|
| |
| | (332.5 | ) | (256.1 | ) |
|
|
|
| |
| | | | | |
| Represented in the balance sheet, after offset of balances within countries (as described in note 1), as follows: |
|
|
|
|
|
| | 2006 | | 2005 | |
| |
|
|
| |
| | £m | | £m | |
|
|
|
| |
| Deferred tax assets | 0.8 | | 0.7 | |
|
|
|
| |
| Deferred tax liabilities | (333.3 | ) | (256.8 | ) |
|
|
|
| |
| Net deferred tax liabilities | (332.5 | ) | (256.1 | ) |
|
|
|
| |
| | | | | |
| The deferred tax (charged)/credited to the consolidated income statement is analysed by type of temporary difference as follows: |
|
|
|
|
|
| | 2006 | | 2005 | |
| |
|
|
| |
| | £m | | £m | |
|
|
|
| |
| Property, plant and equipment | 24.6 | | 12.4 | |
|
|
|
| |
| Other assets | (5.0 | ) | (5.8 | ) |
|
|
|
| |
| Other liabilities | (0.1 | ) | (5.2 | ) |
|
|
|
| |
| Asbestos | (11.6 | ) | 1.9 | |
|
|
|
| |
| Pensions | (12.2 | ) | (5.0 | ) |
|
|
|
| |
| Losses | (8.6 | ) | (2.1 | ) |
|
|
|
| |
| | (12.9 | ) | (3.8 | ) |
|
|
|
| |
| | | | | |
| The deferred tax (charged)/credited to the consolidated income statement is analysed as follows: | | | | |
|
|
|
|
|
| | 2006 | | 2005 | |
| |
|
|
| |
| | £m | | £m | |
|
|
|
| |
| From continuing operations | (5.6 | ) | (4.2 | ) |
|
|
|
| |
| From impairments | 2.1 | | (5.6 | ) |
|
|
|
| |
| From discontinued operations | (9.4 | ) | 6.0 | |
|
|
|
| |
| Total charge to consolidated income statement | (12.9 | ) | (3.8 | ) |
|
|
|
| |
Hanson 2006www.hanson.biz
Back to Contents
| | | | |
| | | |
| | | |
| | 101 | |
|
|
|
|
| | | | |
| Notes to the accounts |
| 22 | Tax payable/receivable and deferred taxcontinued |
|
|
| Deferred tax |
| i) | Losses |
|
| The group only recognises a deferred tax asset on losses where it expects to realise the benefit from those losses in the foreseeable future. The group has a significant amount of capital and non-trading losses. These can only be offset against certain types of income in particular legal entities, and no such income is currently envisaged. |
| | | | | |
|
|
|
|
|
| | 2006 | | 2005 | |
| |
|
|
| |
| | £m | | £m | |
|
|
|
| |
| Gross losses | 999.8 | | 656.7 | |
|
|
|
| |
| Deferred tax at applicable tax rates | 300.0 | | 202.0 | |
|
|
|
| |
| Less deferred tax recognised | (8.1 | ) | (15.2 | ) |
|
|
|
| |
| Unrecognised deferred tax | 291.9 | | 186.8 | |
|
|
|
| |
The increase in losses relates to losses generated from restructurings in the current year, as well as agreement of prior year losses with tax authorities.
The losses have no expiry date.
| ii) | Other temporary differences |
| At December 31, 2006 the group has other deductible temporary differences of £16.8m (£20.8m) for which deferred tax assets of £5.1m (£6.4m) have not been recognised because it is not probable that future taxable income will be available against which the group can utilise the benefits. The deductible temporary differences do not expire under current tax legislation. |
| |
| iii) | Unrecognised tax base |
| The group has deductible temporary differences for which no tax benefit has been recognised related to certain additional tax attributes of property, plant and equipment located in the UK and Australia. The amount of these deductible temporary differences at December 31, 2006 was £275.3m (£288.9m) . These additional tax attributes have not been recognised because it is not probable that suitable profits will be available. There is no expiry date for these differences. |
| | |
| iv) | Overseas subsidiaries |
| At December 31, 2006, the group has not provided deferred tax in relation to temporary differences on its overseas subsidiaries, joint-ventures or associates. Quantifying the temporary differences is not practical, however, based on current enacted law, and on the basis that the group can control the timing and realisation of these temporary differences, no material tax consequences are expected to arise. |
| | |
| 23 | Share capital |
|
|
| The share capital of the Company is shown below: |
|
|
|
|
|
|
|
| | 2006 | 2005 | 2004 | 2006 | 2005 | 2004 |
| |
|
|
|
|
|
|
| | Number | Number | Number | £m | £m | £m |
|
|
|
|
|
|
|
| Authorised | | | | | | |
| Ordinary shares of £0.10 (£0.10, £0.10) | 1,000,000,000 | 1,000,000,000 | 1,000,000,000 | 100 | 100 | 100 |
|
|
|
|
|
|
|
| Allotted, called-up and fully paid | | | | | | |
| Ordinary shares of £0.10 (£0.10, £0.10) | 736,968,849 | 736,968,849 | 736,968,849 | 73.7 | 73.7 | 73.7 |
|
|
|
|
|
|
|
| Treasury shares | | | | | | |
| Ordinary shares of £0.10 (£0.10, £0.10) | 24,645,000 | 14,685,000 | 6,350,000 | 2.5 | 1.5 | 0.6 |
|
|
|
|
|
|
|
During the period January 1, 2006 to December 31, 2006 no ordinary share capital was allotted.
At December 31, 2006, 5,482,171 (6,780,839) ordinary shares were reserved to satisfy rights in respect of various employee share option schemes. The nominal value of reserved shares totalled £0.5m (£0.7m) at the balance sheet date, as set out below:
| i) | options were outstanding over 1,415,477 ordinary shares under the Share Option Plan. Of these 39,955 were exercisable at dates up to 2011 at a subscription price of 473.3p per share, 17,761 were exercisable at dates up to 2012 at a subscription price of 461.75p per share and 167,607 were exercisable at dates up to 2013 at a subscription price of 290.4p per share. Subject to performance criteria being met, the remaining options will be capable of being exercised at dates up to 2015. Of these, 621,478 had a subscription price of 439.6p per share and 568,676 had a subscription price of 514.3p per share. |
| |
| | At December 31, 2005 options were outstanding over 2,927,109 ordinary shares under the Share Option Plan. Of these, 164,775 were exercisable at dates up to 2011 at a subscription price of 473.3p per share and 180,718 were exercisable at dates up to 2012 at a subscription price of 461.75p per share. Subject to performance criteria being met, the remaining options will be capable of being exercised at dates up to 2015. Of these, 647,618 had a subscription price of 514.3p per share, 710,196 had a subscription price of 439.6p per share and 1,223,802 had a subscription price of 290.4p per share, and |
| |
| ii) | options were outstanding over 4,066,694 (3,853,729) ordinary shares under the Sharesave Scheme and were capable of being exercised at dates up to 2014, with subscription prices ranging from 318.0p to 611.0p per share with an average of 401.68p (354.75p) per share. |
Back to Contents
Notes to the accounts continued
for the 12 months ended December 31, 2006
| 24 | Reconciliation of changes in total equity |
|
| | | | | | | | | | | | Equity | | | | | |
| | | | | | | | | | | | attributable | | | | | |
| | | | | Cash flow | | Cumulative | | | | | to equity | | | | | |
| | Share capital | Own | | hedge | | translation | | Retained | | Other | holders of | | Minority | | | |
| | (note 23) | shares | | reserve | | reserve | | earnings | | reserves | the Company | | interest | | Total equity | |
| |
|
|
|
|
|
|
|
|
|
|
|
|
|
|
| |
| | £m | £m | | £m | | £m | | £m | | £m | £m | | £m | | £m | |
|
|
|
|
|
|
|
|
|
|
|
|
|
|
|
| |
| At January 1, 2004 | 73.7 | (8.9 | ) | – | | – | | 1,289.5 | | 972.4 | 2,326.7 | | 2.7 | | 2,329.4 | |
|
|
|
|
|
|
|
|
|
|
|
|
|
|
|
| |
| Recognised income and expense | – | – | | – | | (12.1 | ) | 243.9 | | – | 231.8 | | (0.3 | ) | 231.5 | |
|
|
|
|
|
|
|
|
|
|
|
|
|
|
|
| |
| Dividends paid | – | – | | – | | – | | (127.3 | ) | – | (127.3 | ) | – | | (127.3 | ) |
|
|
|
|
|
|
|
|
|
|
|
|
|
|
|
| |
| Employee share awards | – | – | | – | | – | | (1.1 | ) | – | (1.1 | ) | – | | (1.1 | ) |
|
|
|
|
|
|
|
|
|
|
|
|
|
|
|
| |
| Purchase of own shares held in treasury | – | (26.1 | ) | – | | – | | – | | – | (26.1 | ) | – | | (26.1 | ) |
|
|
|
|
|
|
|
|
|
|
|
|
|
|
|
| |
| Disposal of own shares by ESOP Trust | – | 4.9 | | – | | – | | – | | – | 4.9 | | – | | 4.9 | |
|
|
|
|
|
|
|
|
|
|
|
|
|
|
|
| |
| Changes in minority interest | – | – | | – | | – | | – | | – | – | | (0.3 | ) | (0.3 | ) |
|
|
|
|
|
|
|
|
|
|
|
|
|
|
|
| |
| At December 31, 2004 | 73.7 | (30.1 | ) | – | | (12.1 | ) | 1,405.0 | | 972.4 | 2,408.9 | | 2.1 | | 2,411.0 | |
|
|
|
|
|
|
|
|
|
|
|
|
|
|
|
| |
| Restatement for effects of adopting IAS 39 | – | – | | (9.4 | ) | – | | (2.2 | ) | – | (11.6 | ) | – | | (11.6 | ) |
|
|
|
|
|
|
|
|
|
|
|
|
|
|
|
| |
| At January 1, 2005 | 73.7 | (30.1 | ) | (9.4 | ) | (12.1 | ) | 1,402.8 | | 972.4 | 2,397.3 | | 2.1 | | 2,399.4 | |
|
|
|
|
|
|
|
|
|
|
|
|
|
|
|
| |
| Recognised income and expense | – | – | | 6.4 | | 56.8 | | 388.5 | | – | 451.7 | | 0.6 | | 452.3 | |
|
|
|
|
|
|
|
|
|
|
|
|
|
|
|
| |
| Dividends paid | – | – | | – | | – | | (136.2 | ) | – | (136.2 | ) | – | | (136.2 | ) |
|
|
|
|
|
|
|
|
|
|
|
|
|
|
|
| |
| Purchase of own shares held in treasury | – | (46.7 | ) | – | | – | | – | | – | (46.7 | ) | – | | (46.7 | ) |
|
|
|
|
|
|
|
|
|
|
|
|
|
|
|
| |
| Purchase of own shares by ESOP Trust | – | (6.0 | ) | – | | – | | – | | – | (6.0 | ) | – | | (6.0 | ) |
|
|
|
|
|
|
|
|
|
|
|
|
|
|
|
| |
| Disposal of own shares by ESOP Trust | – | 9.5 | | – | | – | | – | | – | 9.5 | | – | | 9.5 | |
|
|
|
|
|
|
|
|
|
|
|
|
|
|
|
| |
| Employee share awards | – | – | | – | | – | | 0.4 | | – | 0.4 | | – | | 0.4 | |
|
|
|
|
|
|
|
|
|
|
|
|
|
|
|
| |
| Changes in minority interest | – | – | | – | | – | | – | | – | – | | (0.4 | ) | (0.4 | ) |
|
|
|
|
|
|
|
|
|
|
|
|
|
|
|
| |
| At December 31, 2005 | 73.7 | (73.3 | ) | (3.0 | ) | 44.7 | | 1,655.5 | | 972.4 | 2,670.0 | | 2.3 | | 2,672.3 | |
|
|
|
|
|
|
|
|
|
|
|
|
|
|
|
| |
| Recognised income and expense | – | – | | 2.5 | | (107.9 | ) | 381.2 | | – | 275.8 | | 0.9 | | 276.7 | |
|
|
|
|
|
|
|
|
|
|
|
|
|
|
|
| |
| Dividends paid | – | – | | – | | – | | (147.5 | ) | – | (147.5 | ) | – | | (147.5 | ) |
|
|
|
|
|
|
|
|
|
|
|
|
|
|
|
| |
| Purchase of own shares held in treasury | – | (64.1 | ) | – | | – | | – | | – | (64.1 | ) | – | | (64.1 | ) |
|
|
|
|
|
|
|
|
|
|
|
|
|
|
|
| |
| Purchase of own shares by ESOP Trust | – | (14.2 | ) | – | | – | | – | | – | (14.2 | ) | – | | (14.2 | ) |
|
|
|
|
|
|
|
|
|
|
|
|
|
|
|
| |
| Disposal of own shares by ESOP Trust | – | 13.2 | | – | | – | | – | | – | 13.2 | | – | | 13.2 | |
|
|
|
|
|
|
|
|
|
|
|
|
|
|
|
| |
| Employee share awards | – | – | | – | | – | | (9.9 | ) | – | (9.9 | ) | – | | (9.9 | ) |
|
|
|
|
|
|
|
|
|
|
|
|
|
|
|
| |
| Changes in minority interest | – | – | | – | | – | | – | | – | – | | 2.3 | | 2.3 | |
|
|
|
|
|
|
|
|
|
|
|
|
|
|
|
| |
| At December 31, 2006 | 73.7 | (138.4 | ) | (0.5 | ) | (63.2 | ) | 1,879.3 | | 972.4 | 2,723.3 | | 5.5 | | 2,728.8 | |
|
|
|
|
|
|
|
|
|
|
|
|
|
|
|
| |
Own shares
On May 31, 1995 the group established an Employee Share Trust (the “Trust”) approved by shareholders on May 15, 1995. The Trust as at December 31, 2006 held 0.2m (0.1m, 1.0m) shares in the Company at a book value of £1.5m (£0.5m, £4.0m) . The Trust waived its rights to dividends payable during the year and to future dividends on its holding of shares. The cost of the Hanson Sharesave Scheme, where awards are granted at a discount to the market price of the Company’s shares, Share Option Plan and the Long Term Incentive Plan is charged to the income statement. During the year, the group contributed £14.2m (£6.0m, £nil) to the Trust.
At December 31, 2006, 24,645,000 shares were held in treasury, none of which has the right to receive dividends. No shares were purchased by the Company to be held in treasury during the period January 1 to February 19, 2007. Pursuant to approval given by shareholders at the AGM held on April 26, 2006, as at December 31, 2006 the Company retains the authority to purchase a further 48,955,000 of its own shares up to the end of the AGM to be held on April 24, 2007. Details of shares purchased during the year are shown below:
|
|
|
|
|
| | | Nominal value of | Average price paid per share, | Total cost of purchasing |
| | Number of shares purchased | shares purchased | inclusive of transaction costs | shares held in treasury |
| |
|
|
|
|
| Period | | £m | (pence) | £m |
|
|
|
|
|
| January 2006 | 3,315,000 | 0.3 | 632.3 | 21.0 |
|
|
|
|
|
| February 2006 | 450,000 | 0.1 | 676.7 | 3.0 |
|
|
|
|
|
| May 2006 | 400,000 | 0.1 | 664.1 | 2.7 |
|
|
|
|
|
| June 2006 | 2,100,000 | 0.2 | 635.9 | 13.4 |
|
|
|
|
|
| July 2006 | 2,150,000 | 0.2 | 646.7 | 13.9 |
|
|
|
|
|
| August 2006 | 1,295,000 | 0.1 | 659.7 | 8.5 |
|
|
|
|
|
| September 2006 | 250,000 | – | 649.0 | 1.6 |
|
|
|
|
|
| Total | 9,960,000 | 1.0 | 643.4 | 64.1 |
|
|
|
|
|
The following own shares are held by the “Trust” and the Company:
|
|
|
|
|
|
|
| | Employee Share Trust | | Treasury Shares | | Total | |
| |
|
|
|
|
| |
| | Number of shares | | Number of shares | | Number of shares | |
|
|
|
|
|
| |
| At January 1, 2005 | 983,392 | | 6,350,000 | | 7,333,392 | |
|
|
|
|
|
| |
| Purchased | 1,000,000 | | 8,335,000 | | 9,335,000 | |
|
|
|
|
|
| |
| Distributed | (1,894,945 | ) | – | | (1,894,945 | ) |
|
|
|
|
|
| |
| At December 31, 2005 | 88,447 | | 14,685,000 | | 14,773,447 | |
|
|
|
|
|
| |
| Purchased | 2,000,000 | | 9,960,000 | | 11,960,000 | |
|
|
|
|
|
| |
| Distributed | (1,869,475 | ) | – | | (1,869,475 | ) |
|
|
|
|
|
| |
| At December 31, 2006 | 218,972 | | 24,645,000 | | 24,863,972 | |
|
|
|
|
|
| |
Cash flow hedge reserve
Movements in the cash flow hedge reserve represent:
| – | changes in the fair value of cash flow hedges; |
| – | the recycling of the above changes through the income statement (totalling £(0.2)m since January 1, 2006), offsetting therein the impact of the underlyinghedged item; and |
| – | related deferred tax. |
The change in the fair value of derivatives in the cash flow hedge reserve in the period relates mainly to interest rate swaps with a maximum maturity date of 2013 hedging floating rate debt and commodity swaps with a maximum maturity date of 2007 hedging fluctuations in energy prices. Underlying cash flows are therefore expected to occur until these dates.
Hanson 2006www.hanson.biz
Back to Contents
| | | | |
| | | |
| | | |
| | 103 | |
|
|
|
|
| | | | |
| Notes to the accounts |
| 24 | Reconciliation of changes in total equitycontinued |
|
|
Cumulative translation reserve
Included within the foreign exchange adjustments of £(107.9)m (£56.8m, £(12.1)m) is foreign exchange of £nil (£0.1m, £(0.3m)) recycled through the income statement on disposal of overseas operations. The reserve was set to £nil on transition to IFRS on January 1, 2004.
Retained earnings
Included within the retained earnings balance of £1,879.3m (£1,655.5m, £1,402.8m) is £45.3m (£37.6m, £(2.5)m) in respect of joint-ventures and associates of which profit after tax for the current year is £33.7m (£43.2m, £2.0m) and dividends are £27.3m (£32.9m, £19.9m) . The undistributed earnings of joint-ventures and associates are £45.3m (£38.9m, £18.0m) .
Other reserves
Other reserves represent merger reserves on acquisition of Pioneer International Limited of £216.3m, and £756.1m created on the reduction of share capital through the Scheme of Arrangement under Section 425 of the Companies Act.
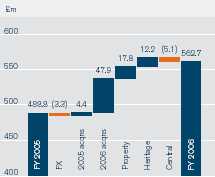
Total cash consideration on acquisitions including acquisition costs for 2006 was £558.0m (£342.9m) .
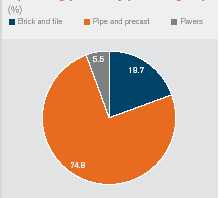
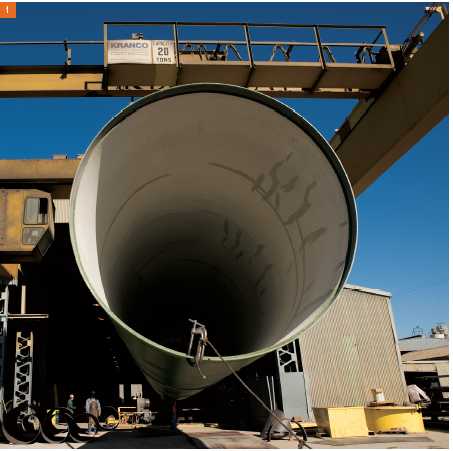
During 2006, Building Products UK acquired the share capital of Red Bank Manufacturing, a producer of terracotta and clay products, on January 10 and Building Products North America acquired the share capital of PaverModule Inc., a concrete paving manufacturer, on January 20 for a total consideration for these acquisitions of £60.6m. On March 2, Aggregates UK purchased the share capital of Civil and Marine (Holdings) Ltd, a leading producer of ground granulated blast furnace slag in the UK, with additional operations in the US and in the Czech Republic, for £248.1m. Aggregates North America completed its acquisition of the share capital of Material Service Corporation, a leading aggregate materials producer in the USA, on June 16 for £166.3m. The group completed a further five acquisitions of entities based in the UK, USA and Spain, along with seven assets acquisitions, primarily concrete plants and quarries, for a total consideration of £83.0m. All acquisitions of share capital included the transfer of the entire voting rights to the group.
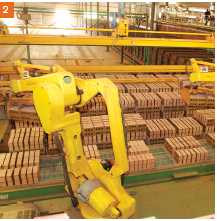
On January 4, 2005, Building Products UK acquired the share capital of UK brick manufacturer, Marshalls Clay Products, for £64.7m and of Thermalite, a market leader in aircrete blocks, on March 7 for £124.2m. On June 17, Aggregates North America acquired the share capital of Mission Valley Rock, Berkeley Ready Mix and Berkeley Asphalt, and Building Products North America acquired the assets of Sherman Pipe, a concrete pipe and precast concrete products business, for a total consideration of £108.0m. Other acquisitions made in the year consisted of three quarries in Southern Indiana by Aggregates North America in December, and a further six acquisitions totalling £46.0m.
|
|
|
|
|
|
|
|
|
|
|
|
|
| | 2006 | | 2006 | | 2006 | | 2005 | | 2005 | | 2005 | |
| |
|
|
|
|
|
|
|
|
|
|
| |
| | Total carrying | | Fair value | | Total | | Total carrying | | Fair value | | Total | |
| | value | | adjustments | | fair value | | value | | adjustments | | fair value | |
| |
|
|
|
|
|
|
|
|
|
|
| |
| | £m | | £m | | £m | | £m | | £m | | £m | |
|
|
|
|
|
|
|
|
|
|
|
| |
| Intangible assets (other than goodwill) | – | | 13.1 | | 13.1 | | – | | 25.6 | | 25.6 | |
|
|
|
|
|
|
|
|
|
|
|
| |
| Property, plant and equipment | 175.0 | | 138.4 | | 313.4 | | 107.6 | | 26.2 | | 133.8 | |
|
|
|
|
|
|
|
|
|
|
|
| |
| Inventories | 35.8 | | (1.8 | ) | 34.0 | | 22.8 | | (0.4 | ) | 22.4 | |
|
|
|
|
|
|
|
|
|
|
|
| |
| Receivables | 50.6 | | 0.3 | | 50.9 | | 20.8 | | 6.2 | | 27.0 | |
|
|
|
|
|
|
|
|
|
|
|
| |
| Cash and cash equivalents | 9.4 | | – | | 9.4 | | 0.1 | | – | | 0.1 | |
|
|
|
|
|
|
|
|
|
|
|
| |
| Payables | (46.3 | ) | (1.3 | ) | (47.6 | ) | (12.7 | ) | (9.2 | ) | (21.9 | ) |
|
|
|
|
|
|
|
|
|
|
|
| |
| Borrowings | (8.3 | ) | – | | (8.3 | ) | (1.9 | ) | – | | (1.9 | ) |
|
|
|
|
|
|
|
|
|
|
|
| |
| Provisions | (7.6 | ) | (2.3 | ) | (9.9 | ) | (1.6 | ) | (0.8 | ) | (2.4 | ) |
|
|
|
|
|
|
|
|
|
|
|
| |
| Pensions | (4.5 | ) | – | | (4.5 | ) | – | | – | | – | |
|
|
|
|
|
|
|
|
|
|
|
| |
| Current tax liabilities | (2.2 | ) | – | | (2.2 | ) | (0.1 | ) | – | | (0.1 | ) |
|
|
|
|
|
|
|
|
|
|
|
| |
| Non-current tax liabilities | – | | – | | – | | (7.7 | ) | – | | (7.7 | ) |
|
|
|
|
|
|
|
|
|
|
|
| |
| Deferred tax liabilities | (18.9 | ) | (53.8 | ) | (72.7 | ) | (6.9 | ) | (13.9 | ) | (20.8 | ) |
|
|
|
|
|
|
|
|
|
|
|
| |
| Minority interest | (2.9 | ) | – | | (2.9 | ) | – | | – | | – | |
|
|
|
|
|
|
|
|
|
|
|
| |
| | 180.1 | | 92.6 | | 272.7 | | 120.4 | | 33.7 | | 154.1 | |
|
|
|
|
|
|
|
|
|
|
|
| |
| Goodwill on acquisition | | | | | 286.7 | | | | | | 190.1 | |
|
|
|
|
|
|
|
|
|
|
|
| |
| | | | | | 559.4 | | | | | | 344.2 | |
|
|
|
|
|
|
|
|
|
|
|
| |
| Consideration: | | | | | | | | | | | | |
| Cash paid | | | | | 551.7 | | | | | | 340.5 | |
|
|
|
|
|
|
|
|
|
|
|
| |
| Other consideration | | | | | 1.4 | | | | | | 1.3 | |
|
|
|
|
|
|
|
|
|
|
|
| |
| Acquisition costs (primarily legal and accounting fees) | | | | | 6.3 | | | | | | 2.4 | |
|
|
|
|
|
|
|
|
|
|
|
| |
| Total consideration | | | | | 559.4 | | | | | | 344.2 | |
|
|
|
|
|
|
|
|
|
|
|
| |
Included in the goodwill arising on acquisitions are items that cannot be individually separated and reliably measured due to their nature. This includes market share, as well as new market and product entry, and synergy benefits. Of the total goodwill on current year acquisitions of £286.7m (£190.1m), £12.5m (£36.9m) is deductible for tax purposes.
For the period since acquisition, turnover of £215.0m and operating profit before impairments of £47.9m in respect of the current year acquisitions is included within the income statement as continuing operations. If the acquisitions had taken place at the beginning of the financial year, the continuing operating profit before impairments of the group would have been £557.3m (£527.6m) and turnover from continuing operations would have been £4,215.1m (£4,048.9m) .
The preliminary allocation of the purchase consideration to net assets and liabilities will be reviewed based on additional information up to a year from the date of acquisition. The Directors do not anticipate that any net adjustments resulting from such reviews will have a material effect on the financial position or results of Hanson’s operations. In respect of acquisitions in 2005, there were no material subsequent amendments to the preliminary allocations made.
Back to Contents
Notes to the accounts continued
for the 12 months ended December 31, 2006
| 26 | Contingent liabilities |
|
| Litigation relating to certain discontinued operations |
| Certain of the Company’s US subsidiaries, either directly or as a result of indemnity obligations, are the subject of claims or lawsuits both on an individual and class action basis for bodily injury or property damage, relating to products incorporating asbestos, coal by-products and chemicals, in particular for the wood treating industry. |
Asbestos
The Company’s approach to accounting for the asbestos claims against its US subsidiaries is to provide for those costs of resolution which are both probable and reliably estimable (refer note 21). The costs of resolving possible claims are disclosed as contingent liabilities. At present, based on detailed analysis and the assumptions noted below, the provision for those costs which are both probable and reliably estimable equates to approximately eight years of gross cost, assuming an annual level of approximately $60m. Whilst further claims are likely to be resolved beyond this eight year period, the associated costs of resolution are not able to be reliably estimated and hence no provision has been made to cover these possible liabilities.
Assumptions made in establishing the provision relate to the number, disease mix and location of future claimants, trends in dismissal rates, settlement and defence costs, resolution of all existing claimants, time scale of resolution of new claimants, the continued solvency of co-defendants and expected insurance recoveries. In light of the significant uncertainty associated with asbestos claims, there can be no guarantee that the assumptions used to estimate the provision for the cost of resolving asbestos claims will be an accurate prediction of the actual costs that may be incurred and as a result the provision will be subject to potential revision from time to time as additional information becomes available and to reflect any changes in trends. Factors which could cause actual results to differ from these estimates include: (i) adverse trends in the ultimate number of claimants filing asbestos claims against the Company’s US subsidiaries; (ii) increases in the cost of resolving current and future asbestos claims as a result of adverse trends relating to settlement and/or defence costs, dismissal rates, and/or judgement amounts; (iii) increases or decreases in the amount of insurance available to cover asbestos claims; (iv) the emergence of new trends or legal theories that enlarge the number of potential claimants; (v) the impact of bankruptcies of other defendant companies whose share of liability may be imposed on the Company’s US subsidiaries under certain state liability laws; (vi) the unpredictable aspects of the US litigation process; (vii) adverse changes in the mix of asbestos-related diseases with respect to which asbestos claims are made against the Company’s US subsidiaries; and (viii) potential legislative changes.
In light of such factors, the costs of the Company’s US subsidiaries involved in resolving asbestos claims may be materially different from current estimates and consequently might have a material adverse effect on the Company’s consolidated financial condition, results of operations and cash flow. However, assuming that current trends continue, the Company does not expect that such costs will have such a material adverse effect and, even assuming a material deterioration in current trends, on the evidence available to it, the Company does not expect that such claims would impact the ability of the Company to continue as a going concern.
Details of asbestos claims against the Company’s US subsidiaries and the Company’s approach to provisioning (and the associated contingent liabilities) are detailed in note 21. At December 31, 2006, approximately 107,600 claimants were outstanding. The amounts of compensation formally claimed in the cases initially filed by these claimants vary but typically follow standard formulations that are used in various jurisdictions by various plaintiffs’ law firms. Of the claimants outstanding as of December 31, 2006, Hanson estimates that approximately 36% do not specify a dollar claim for damages, approximately 57% claim an amount “greater than $10,000” and approximately 7% specify various amounts, typically “greater than” specified amounts between $50,000 and $1m. Hanson is not aware of any claim specifying an amount greater than $40m. Hanson does not believe that the specific dollar amount mentioned in any claim is an accurate gauge of what relief, if any, the claimant may eventually recover from one of Hanson’s US subsidiaries, and most claimants fail to allocate their alleged claims of liability amongst the various named defendants.
Coal by-products and chemicals
These claims and lawsuits relate primarily to former US chemical products and operations, in particular those relating to the wood treating and coal tar derivative industries; products and operations which are unrelated to the group’s present business and activities. In such cases where one of the Company’s subsidiaries is involved, there are often several potential defendants named in the claim or lawsuit. Since the final demerger in 1997 no settlements have been paid by, or judgments rendered against, any of the Company’s subsidiaries which have had or could have a material adverse effect on the Company’s consolidated financial condition, results of operations or cash flow in connection with any such claims or lawsuits. In a number of instances, the claim or lawsuit against the subsidiary has not been pursued and has been dismissed. With respect to those claims or lawsuits that have been or are being pursued, the subsidiary concerned generally believes itself to have had or to have meritorious defences and such claims and lawsuits have been and are being vigorously defended.
The costs of defence and the amounts that are claimed by the plaintiffs, particularly in those lawsuits which involve numerous claimants, can be significant with claims amounting to tens of millions of dollars. The unpredictable aspects of the US litigation process and the potential for juries to award punitive damages mean that there is a possibility that the Company’s subsidiary may suffer at some stage a significant adverse verdict. Insurance issues do arise on these claims and lawsuits, both in terms of settlement and defence coverage, the outcome of which can be uncertain. In certain instances no insurance coverage may be available to the relevant subsidiary. The insurance cover referred to in note 21 relating to the Koppers’ environmental obligations does not apply to the bodily injury claims and lawsuits described in this note, although it will address certain of the property damage claims. The cost relating to these claims is shown in note 21.
Other litigation
Several of the Company’s US subsidiaries are subject to litigation in California courts arising out of sand dredging operations on submerged lands leased from the state of California. The litigation involves allegations that these subsidiaries underpaid royalties due under the leases and that sand was dredged from state owned lands without authorisation. The litigation includes claims by the state of California under California statutes providing for the recovery of treble damages and certain fines, penalties and attorney fees where the wrongful conduct involves false statements or conversion of state owned property. A press release by the California Attorney General states that he is seeking damages of $200m, although the complaint actually filed in court does not specify the amount of damages sought. The court’s decision on a declaratory motion regarding the interpretation of the royalty provisions of the relevant leases has not served to clarify the situation. The parties are now engaged in litigation on all matters arising out of the case. In light of the uncertainties involved in any litigation, no assurances or predictions can be made on the outcome of this litigation.
Various subsidiaries of the Company are also the subject of a number of other pending legal proceedings. The Company does not anticipate that the outcome of these proceedings, either individually or in aggregate, will have a material adverse effect upon the Company’s consolidated financial condition, results of operations or cash flow. However, in light of the uncertainties involved in any litigation and in particular in the USA, where there is the added potential for punitive damage awards, there can be no guarantee that a settlement might have to be made by, or an unfavourable judgement may be rendered against, the Company or one of its subsidiaries, which could have a material adverse effect on the Company’s consolidated financial condition, results of operations or cash flow in connection with the above mentioned non-asbestos claims and lawsuits.
Hanson 2006www.hanson.biz
Back to Contents
| | | | |
| | | |
| | | |
| | 105 | |
|
|
|
|
| | | | |
| Notes to the accounts |
| 26 | Contingent liabilities continued |
|
|
Demergers
In connection with the demergers, each of the four companies into which the Company demerged its respective businesses agreed to indemnify the Company against, among other things, the past, present and future obligations and liabilities of the businesses transferred to it on its respective demerger while the Company agreed to indemnify each of these companies against, among other things, the past, present and future obligations and liabilities of all other businesses owned or previously owned by the Company (including the businesses transferred to the other demerged companies). Neither the Company nor any of its existing subsidiaries has incurred any liability in respect of a claim that related to the above-mentioned businesses demerged by the Company, any such liability being borne by the relevant demerged company without liability to the Company or any of its existing subsidiaries. The Energy Group PLC, one of the demerged companies, was acquired by TXU Corp. in 1998. In November 2002, TXU Corp. announced that several of TXU Corp’s UK subsidiaries had been placed under the administration process in the UK, including The Energy Group PLC. The Energy Group PLC itself is therefore unlikely to be able to fulfil its indemnification obligations to the Company and its existing subsidiaries if and when required. The Company is, however, not aware of any claims against it or its subsidiaries that would give rise to an indemnity obligation owed to the Company or its subsidiaries, on the part of The Energy Group PLC. |
Bonds and guarantees
As at December 31, 2006 the group had contingent liabilities of:
| – | £127.1m (£111.7m, £97.8m) in respect of bank guarantees and performance bonds given to third parties primarily relating to environmental and restoration obligations and the deductible element of insurance programmes, of which £0.2m (£0.2m, £0.2m) relates to former trading activities of the group; and |
| – | £121.1m (£99.7m, £81.6m) in respect of surety bonds issued by US insurance companies in respect of reclamation liabilities of £50.2m (£51.6m, £42.1m), performance bonds of £49.9m (£38.0m, £31.2m) and other surety obligations of £21.0m (£10.1m, £8.3m). |
Whilst the group holds provisions (see note 21) for certain liabilities to which the bonds and guarantees relate, the liabilities under the bonds and guarantees are not directly recorded on the consolidated balance sheet.
Group as lessee:
The future minimum rental commitments as at December 31, for finance leases and non-cancellable operating leases, together with the present value of minimum lease payments under finance leases, are as follows:
|
|
|
|
|
|
|
| |
| Operating leases | | Finance leases | |
| |
|
|
|
|
|
|
| |
| | 2006 | | 2005 | | 2006 | | 2005 | |
| |
|
|
|
|
|
|
| |
| | £m | | £m | | £m | | £m | |
|
|
|
|
|
|
|
| |
| Within one year | 24.6 | | 31.1 | | 1.1 | | 0.4 | |
|
|
|
|
|
|
|
| |
| After one year but not more than two years | 21.1 | | 25.9 | | 0.8 | | 0.2 | |
|
|
|
|
|
|
|
| |
| After two years but not more than three years | 16.9 | | 21.7 | | 0.8 | | – | |
|
|
|
|
|
|
|
| |
| After three years but not more than four years | 13.6 | | 16.8 | | 0.6 | | – | |
|
|
|
|
|
|
|
| |
| After four years but not more than five years | 12.0 | | 14.8 | | 0.3 | | – | |
|
|
|
|
|
|
|
| |
| After more than five years | 123.3 | | 128.5 | | 0.4 | | – | |
|
|
|
|
|
|
|
| |
| Total minimum lease payments | 211.5 | | 238.8 | | 4.0 | | 0.6 | |
|
|
|
|
|
|
|
| |
| Less amount representing finance charges | | | | | (0.6 | ) | (0.1 | ) |
|
|
|
|
|
|
|
| |
| Present value of minimum lease payments | | | | | 3.4 | | 0.5 | |
|
|
|
|
|
|
|
| |
| Future minimum sublease receivable | (9.1 | ) | (8.6 | ) | – | | – | |
|
|
|
|
|
|
|
| |
| | | | | | | | | |
| 28 | Pensions and other post-employment medical plans |
|
|
| i) | Description of plans |
| Hanson provides pension and post-employment medical plans in a number of countries in which it operates in accordance with local employment practices. These arrangements have been subject to change in recent years and, with the exception of some arrangements covered under collective bargaining agreements in the US, new employees are no longer eligible for inclusion in either defined benefit pension plans (“DB plans”) or post-employment medical plans. |
The liabilities of the group’s DB plans primarily relate to pensioners currently in receipt of benefits, ex-employees with accrued rights to receive pensions in future and current employees who were members of DB plans before the relevant cut-off date, being July 2002 in the UK and July 2005 in the USA. The group follows a policy of funding DB plans to a target of the accrued benefit obligation, a level which is higher than the statutory minimum funding level in each country. Together with plan trustees, the group has a long term goal of matching the liabilities of the plans with appropriate assets.
The liabilities of the group’s post-employment medical plans are primarily in the USA and Canada. These comprise a number of separate arrangements which have been closed to new entrants over time such that the substantial part of the liabilities relates to retirees. Post-employment medical liabilities are unfunded and are held as a balance sheet provision.
Where pension benefits are provided to new employees of the group, they are eligible to join defined contribution pension plans (“DC plans”). The group contribution to such plans is generally related to the employee contribution and ranges from 5-10% in the UK and 3-6% in the USA, in each case as a proportion of pensionable salary.
The group also participates in multi-employer pension plans, primarily in the USA. These provide defined benefits to certain of the group’s union employees. Multi-employer pension plans are accounted for as DC plans as it is not possible to isolate the components of such plans which would collectively comprise the group’s liability.
Back to Contents
Notes to the accountscontinued
for the 12 months ended December 31, 2006
| 28 | Pensions and other post-employment medical plans continued |
|
|
| ii) | Details of cash contributions |
|
| Contributions by the group to its pension plans totalled £73.9m (£59.1m, £57.8m) in the year, principally in the UK, USA and Canada. This is represented by regular contributions of £30.3m (£31.1m, £38.0m) and additional contributions of £22.4m (£12.1m, £8.4m) to DB pension plans; contributions to DC plans of £15.5m (£12.1m, £7.6m); and contributions to multi-employer plans of £5.7m (£3.8m, £3.8m) . In addition to the ongoing regular contributions, group companies are scheduled to make additional payments to the principal UK DB plan of £8.4m in each of the next two years. No conclusion has currently been reached on the level of contributions to other plans although, overall, the group expects to maintain its regular contributions at broadly the same level in 2007. Contributions relating to multi-employer plans are based on negotiated collective bargaining agreements. The surpluses and deficits in the multi-employer plans are not considered to have a material impact on the Company. Benefits paid by the group in respect of its post-employment medical plans, totalled £10.4m (£9.0m, £8.5m) . |
| | |
| iii) | Net employee benefit obligations |
|
| The amounts recognised in the balance sheet are as follows: |
| |
|
|
|
|
|
|
|
|
|
|
|
| |
| | Defined | | Defined | | Defined | | Post- | | Post- | | Post- | |
| | benefit | | benefit | | benefit | | employment | | employment | | employment | |
| | pension plans | | pension plans | | Pension plans | | medical plans | | medical plans | | medical plans | |
| |
|
|
|
|
|
|
|
|
|
|
| |
| | 2006 | | 2005 | | 2004 | | 2006 | | 2005 | | 2004 | |
| |
|
|
|
|
|
|
|
|
|
|
| |
| | £m | | £m | | £m | | £m | | £m | | £m | |
|
|
|
|
|
|
|
|
|
|
|
| |
| Present value of funded obligations at December 31 | (2,026.7 | ) | (1,998.7 | ) | (1,779.5 | ) | – | | – | | – | |
|
|
|
|
|
|
|
|
|
|
|
| |
| Fair value of plan assets at December 31 | 2,026.9 | | 1,991.6 | | 1,742.2 | | – | | – | | – | |
|
|
|
|
|
|
|
|
|
|
|
| |
| | 0.2 | | (7.1 | ) | (37.3 | ) | – | | – | | – | |
|
|
|
|
|
|
|
|
|
|
|
| |
| Present value of unfunded obligations | (13.7 | ) | (13.7 | ) | (11.2 | ) | (77.4 | ) | (103.3 | ) | (80.4 | ) |
|
|
|
|
|
|
|
|
|
|
|
| |
| Net liability | (13.5 | ) | (20.8 | ) | (48.5 | ) | (77.4 | ) | (103.3 | ) | (80.4 | ) |
|
|
|
|
|
|
|
|
|
|
|
| |
| Represented by amounts in the balance sheet: | | | | | | | | | | | | |
| Plan deficits | (31.8 | ) | (47.7 | ) | (76.1 | ) | (77.4 | ) | (103.3 | ) | (80.4 | ) |
|
|
|
|
|
|
|
|
|
|
|
| |
| Plan surpluses | 18.3 | | 26.9 | | 27.6 | | – | | – | | – | |
|
|
|
|
|
|
|
|
|
|
|
| |
| Net liability | (13.5 | ) | (20.8 | ) | (48.5 | ) | (77.4 | ) | (103.3 | ) | (80.4 | ) |
|
|
|
|
|
|
|
|
|
|
|
| |
The net liability for the defined benefit and post-employment medical plans is shown before the associated deferred tax credit of £37.1m (£64.2m, £57.5m) .
There are three UK pension plans and two US plans with a surplus of the fair value of plan assets over the present value of obligations at December 31, 2006. These plans had combined net assets of £17.6m and £0.7m respectively. The remaining plans (including post-employment medical plans) had a deficit of £109.2m.
The amounts recognised in the income statement and statement of recognised income and expense are as follows:
|
|
|
|
|
|
|
|
|
|
|
| |
| | | | | | | | Post- | | Post- | | Post- | |
| | | | | | | | employment | | employment | | employment | |
| | Pension plans | | Pension plans | | Pension plans | | medical plans | | medical plans | | medical plans | |
| |
|
|
|
|
|
|
|
|
|
|
| |
| | 2006 | | 2005 | | 2004 | | 2006 | | 2005 | | 2004 | |
| |
|
|
|
|
|
|
|
|
|
|
| |
| | £m | | £m | | £m | | £m | | £m | | £m | |
|
|
|
|
|
|
|
|
|
|
|
| |
| Current service cost (defined benefit plans) | 31.7 | | 31.1 | | 37.1 | | 0.7 | | 1.1 | | 1.1 | |
|
|
|
|
|
|
|
|
|
|
|
| |
| Current service cost (defined contribution plans) | 15.5 | | 12.1 | | 7.6 | | – | | – | | – | |
|
|
|
|
|
|
|
|
|
|
|
| |
| Current service cost (multi-employer plans) | 5.7 | | 3.8 | | 3.8 | | – | | – | | – | |
|
|
|
|
|
|
|
|
|
|
|
| |
| Total recognised in operating profit | 52.9 | | 47.0 | | 48.5 | | 0.7 | | 1.1 | | 1.1 | |
|
|
|
|
|
|
|
|
|
|
|
| |
| | | | | | | | | | | | | |
| Interest costs on plan obligations | 98.3 | | 98.6 | | 96.2 | | 4.9 | | 4.6 | | 3.0 | |
|
|
|
|
|
|
|
|
|
|
|
| |
| Expected return on plan assets | (114.5 | ) | (108.7 | ) | (111.2 | ) | – | | – | | – | |
|
|
|
|
|
|
|
|
|
|
|
| |
| Total recognised in net finance costs | (16.2 | ) | (10.1 | ) | (15.0 | ) | 4.9 | | 4.6 | | 3.0 | |
|
|
|
|
|
|
|
|
|
|
|
| |
| | | | | | | | | | | | | |
| Interest costs on plan obligations recognised in discontinued operations | – | | – | | – | | 0.2 | | – | | – | |
|
|
|
|
|
|
|
|
|
|
|
| |
| Total expense recognised in the income statement | 36.7 | | 36.9 | | 33.5 | | 5.8 | | 5.7 | | 4.1 | |
|
|
|
|
|
|
|
|
|
|
|
| |
| | | | | | | | | | | | | |
| Actual return on plan assets | 129.0 | | 216.2 | | 125.7 | | – | | – | | – | |
|
|
|
|
|
|
|
|
|
|
|
| |
| Less: Expected return on plan assets | (114.5 | ) | (108.7 | ) | (111.2 | ) | – | | – | | – | |
|
|
|
|
|
|
|
|
|
|
|
| |
| Actuarial gain on plan assets | 14.5 | | 107.5 | | 14.5 | | – | | – | | – | |
|
|
|
|
|
|
|
|
|
|
|
| |
| Actuarial (losses)/gains on plan obligations | (43.4 | ) | (98.3 | ) | (37.3 | ) | 10.3 | | (16.3 | ) | (2.9 | ) |
|
|
|
|
|
|
|
|
|
|
|
| |
| Other actuarial losses | – | | (0.9 | ) | – | | – | | – | | – | |
|
|
|
|
|
|
|
|
|
|
|
| |
| Net actuarial (loss)/gain recognised in the statement of recognised income and expense | (28.9 | ) | 8.3 | | (22.8 | ) | 10.3 | | (16.3 | ) | (2.9 | ) |
|
|
|
|
|
|
|
|
|
|
|
| |
| Cumulative amount of actuarial (losses)/gains recognised | (37.7 | ) | (8.8 | ) | (17.1 | ) | (4.9 | ) | (15.2 | ) | 1.1 | |
|
|
|
|
|
|
|
|
|
|
|
| |
The group recognises all actuarial gains and losses through the statement of recognised income and expense in the year in which they arise.
Changes in the present value of the defined benefit obligation are as follows:
|
|
|
|
|
|
|
|
|
|
|
| |
| | Defined | | Defined | | Defined | | Post- | | Post- | | Post- | |
| | benefit | | benefit | | benefit | | employment | | employment | | employment | |
| | pension plans | | pension plans | | pension plans | | medical plans | | medical plans | | medical plans | |
| |
|
|
|
|
|
|
|
|
|
|
| |
| | 2006 | | 2005 | | 2004 | | 2006 | | 2005 | | 2004 | |
| |
|
|
|
|
|
|
|
|
|
|
| |
| | £m | | £m | | £m | | £m | | £m | | £m | |
|
|
|
|
|
|
|
|
|
|
|
| |
| At January 1 | (2,012.4 | ) | (1,790.7 | ) | (1,737.6 | ) | (103.3 | ) | (80.4 | ) | (87.9 | ) |
|
|
|
|
|
|
|
|
|
|
|
| |
| Current service cost for defined benefit plans | (31.7 | ) | (31.1 | ) | (37.1 | ) | (0.7 | ) | (1.1 | ) | (1.1 | ) |
|
|
|
|
|
|
|
|
|
|
|
| |
| Employee contributions | (6.0 | ) | (6.2 | ) | (7.3 | ) | – | | – | | – | |
|
|
|
|
|
|
|
|
|
|
|
| |
| Interest costs on plan obligations | (98.3 | ) | (98.6 | ) | (96.2 | ) | (5.1 | ) | (4.6 | ) | (3.0 | ) |
|
|
|
|
|
|
|
|
|
|
|
| |
| Actuarial (losses)/gains on plan obligations | (43.4 | ) | (98.3 | ) | (37.3 | ) | 10.3 | | (16.3 | ) | (2.9 | ) |
|
|
|
|
|
|
|
|
|
|
|
| |
| Liabilities assumed in a business combination | (21.6 | ) | (11.5 | ) | – | | (0.3 | ) | – | | – | |
|
|
|
|
|
|
|
|
|
|
|
| |
| Benefits paid | 96.5 | | 89.0 | | 83.2 | | 10.4 | | 9.0 | | 8.5 | |
|
|
|
|
|
|
|
|
|
|
|
| |
| Exchange movements | 76.5 | | (65.0 | ) | 41.6 | | 11.3 | | (9.9 | ) | 6.0 | |
|
|
|
|
|
|
|
|
|
|
|
| |
| At December 31 | (2,040.4 | ) | (2,012.4 | ) | (1,790.7 | ) | (77.4 | ) | (103.3 | ) | (80.4 | ) |
|
|
|
|
|
|
|
|
|
|
|
| |
| Hanson 2006 www.hanson.biz |
Back to Contents
| | | | |
| | | |
| | | |
| | 107 | |
|
|
|
|
| | | | |
| Notes to the accounts |
| 28 | Pensions and other post-employment benefits continued |
|
|
| Changes in the fair value of plan assets are as follows: |
|
|
|
|
|
| |
| | Defined | | Defined | | Defined | |
| | benefit | | benefit | | benefit | |
| | pension plans | | pension plans | | pension plans | |
| |
|
|
|
|
| |
| | 2006 | | 2005 | | 2004 | |
| |
|
|
|
|
| |
| | £m | | £m | | £m | |
|
|
|
|
|
| |
| At January 1 | 1,991.6 | | 1,742.2 | | 1,686.5 | |
|
|
|
|
|
| |
| Expected return on plan assets | 114.5 | | 108.7 | | 111.2 | |
|
|
|
|
|
| |
| Actuarial gains on plan assets | 14.5 | | 107.5 | | 14.5 | |
|
|
|
|
|
| |
| Contributions by employee | 6.0 | | 6.2 | | 7.3 | |
|
|
|
|
|
| |
| Contributions by employer | 52.7 | | 43.2 | | 46.4 | |
|
|
|
|
|
| |
| Assets acquired in a business combination | 17.4 | | 10.6 | | – | |
|
|
|
|
|
| |
| Benefits paid | (96.5 | ) | (89.0 | ) | (83.2 | ) |
|
|
|
|
|
| |
| Exchange movements | (73.3 | ) | 62.2 | | (40.5 | ) |
|
|
|
|
|
| |
| At December 31 | 2,026.9 | | 1,991.6 | | 1,742.2 | |
|
|
|
|
|
| |
The trustees of the principal DB plans, together with the group, have sought to reduce the risk of a deficit arising in each plan that might result from a reduction in the discount rate applied to the liabilities by investing a proportion of plan funds in assets of a similar duration to the liabilities. In the UK, the liabilities of the principal plan have a duration of 18.2 years. The bond and similar assets of this plan, which are equivalent to 46.8% of that plan’s liabilities, have a duration of 16.5 years. The asset category ‘bond and similar assets’ includes bonds, investments in pooled funds of money market investments and interest rate swaps which, taken together, have the characteristics of a high quality bond portfolio and annuities. In the USA, the liabilities of the principal plan have a duration of 10.6 years. The bond assets of this plan, which are equivalent to 60.5% of that plan’s liabilities have a duration of 13.5 years. Taken together, the liabilities of the principal plans in the UK and USA referred to above represent 82.7% of group pension liabilities.
The major categories of plan assets are as follows:
|
|
|
|
|
| |
| | 2006 | | 2005 | | 2004 | |
| |
|
|
|
|
| |
| | % | | % | | % | |
|
|
|
|
|
| |
| Equity | 33.7 | | 41.7 | | 46.3 | |
|
|
|
|
|
| |
| Bonds and similar assets | 58.0 | | 51.7 | | 44.2 | |
|
|
|
|
|
| |
| Property | 6.1 | | 5.0 | | 4.5 | |
|
|
|
|
|
| |
| Cash and other | 2.2 | | 1.6 | | 5.0 | |
|
|
|
|
|
| |
| Total | 100.0 | | 100.0 | | 100.0 | |
|
|
|
|
|
| |
| | |
| iv) | Assumptions |
|
| In setting the discount rates for pension liabilities, Hanson has, together with its advisers, assessed the AA corporate bond yields for bonds of a similar duration to that of the liabilities of the principal plans. To develop the expected long-term rate of return on assets assumptions, the group considered the current level of expected returns on risk-free investments (primarily government bonds), the historical level of the risk premium associated with the other asset classes in which the portfolio is invested and the expectations for future returns of each asset class. The expected long-term rate of return for each asset class was weighted based on the asset allocation to develop the expected long-term rate of return on assets assumption for the portfolio, resulting in weighted average assumptions of 5.55% for the UK and 6.30% for the USA at December 31, 2006. |
The major assumptions used to determine the liabilities for the principal US and UK defined benefit plans are set out below:
|
|
|
|
|
|
|
|
|
|
| |
| | UK | | UK | | UK | | US | | US | US | |
| |
|
|
|
|
|
|
|
|
|
| |
| | 2006 | | 2005 | | 2004 | | 2006 | | 2005 | 2004 | |
| |
|
|
|
|
|
|
|
|
|
| |
| | % | | % | | % | | % | | % | % | |
|
|
|
|
|
|
|
|
|
|
| |
| Discount rates at December 31 | 5.00 | | 4.80 | | 5.30 | | 5.80 | | 5.60 | 5.75 | |
|
|
|
|
|
|
|
|
|
|
| |
| Future salary increases | 4.50 | | 4.25 | | 4.50 | | 4.25 | | 4.25 | 4.25 | |
|
|
|
|
|
|
|
|
|
|
| |
| Future pension increases | 3.00 | | 2.75 | | 2.75 | | – | | – | – | |
|
|
|
|
|
|
|
|
|
|
| |
| Inflation rate | 3.00 | | 2.75 | | 2.75 | | 2.50 | | 2.50 | 2.50 | |
|
|
|
|
|
|
|
|
|
|
| |
| Expected rate of return on plan assets: | | | | | | | | | | | |
| Equity | 7.00 | | 7.00 | | 7.25 | | 8.00 | | 8.00 | 8.00 | |
|
|
|
|
|
|
|
|
|
|
| |
| Bonds | 4.50 | | 4.50 | | 4.60 | | 5.50 | | 5.50 | 5.50 | |
|
|
|
|
|
|
|
|
|
|
| |
| Property | 7.00 | | 7.00 | | 7.25 | | n/a | | n/a | n/a | |
|
|
|
|
|
|
|
|
|
|
| |
| Cash and other | 5.00 | | 5.00 | | 5.00 | | 5.00 | | 5.00 | 5.00 | |
|
|
|
|
|
|
|
|
|
|
| |
| Weighted average expected return across plans | 5.55 | | 5.60 | | 5.70 | | 6.30 | | 6.75 | 7.00 | |
|
|
|
|
|
|
|
|
|
|
| |
Over the past year, we have reviewed the mortality experience of the principal plans in the UK and the USA. For the UK, these investigations concluded that the current mortality assumptions needed to be updated and the short cohort has been applied to the mortality tables used in retirement (i.e. PA(90) rated down 5 years for current pensioners and PXA92 (C=2014) for future pensioners). In the USA, the mortality table “RP-2000 projected to 2010” has been adopted in retirement for both current and future pensioners. Further reviews will be undertaken in 2007 as part of the tri-annual actuarial valuation of the principal UK plan and the annual actuarial valuation of the US plan.
Life expectancies arising from the mortality tables the group has used are:
|
|
|
|
|
|
|
|
|
|
|
| |
| | UK | | UK | | UK | | US | | US | | US | |
| |
|
|
|
|
|
|
|
|
|
|
| |
| | 2006 | | 2005 | | 2004 | | 2006 | | 2005 | | 2004 | |
|
|
|
|
|
|
|
|
|
|
|
| |
| Current pensioners (at age 65 – males) | 19.1 | | 18.0 | | 18.0 | | 17.7 | | 16.7 | | 16.7 | |
|
|
|
|
|
|
|
|
|
|
|
| |
| Current pensioners (at age 65 – females) | 23.8 | | 22.5 | | 22.5 | | 20.1 | | 21.3 | | 21.3 | |
|
|
|
|
|
|
|
|
|
|
|
| |
| Future pensioners (at age 65 – males) | 20.8 | | 19.3 | | 19.3 | | 17.7 | | 16.7 | | 16.7 | |
|
|
|
|
|
|
|
|
|
|
|
| |
| Future pensioners (at age 65 – females) | 23.6 | | 22.3 | | 22.3 | | 20.1 | | 21.3 | | 21.3 | |
|
|
|
|
|
|
|
|
|
|
|
| |
Additional assumptions for post-employment medical plans:
|
|
|
|
|
| |
| | 2006 | | 2005 | | 2004 | |
|
|
|
|
|
| |
| Annual increase in healthcare costs for US healthcare plans – initial | 9.0 | % | 9.0 | % | 10.0 | % |
|
|
|
|
|
| |
| Annual increase in healthcare costs for US healthcare plans – ultimate | 5.0 | % | 5.0 | % | 5.0 | % |
|
|
|
|
|
| |
| Year that the rate reaches ultimate trend rate | 2011 | | 2009 | | 2009 | |
|
|
|
|
|
| |
Back to Contents
Notes to the accountscontinued
for the 12 months ended December 31, 2006
| 28 | Pensions and other post-employment medical plans continued |
|
|
| A one percentage point change in the assumed rate of increase/decrease to healthcare costs would have the following effects: |
|
|
|
| |
| | One | | One | |
| | percentage | | percentage | |
| | point increase | | point decrease | |
| |
|
|
| |
| | £m | | £m | |
|
|
|
| |
| Effect on the aggregate of the service cost and interest cost | 0.3 | | (0.3 | ) |
|
|
|
| |
| Effect on defined benefit obligation | 4.1 | | (3.7 | ) |
|
|
|
| |
The effect of experience gains and losses on plan assets and liabilities are as follows:
|
|
|
|
|
|
|
|
|
|
|
| |
| | | | | | | | Post- | | Post- | | Post- | |
| | Defined | | Defined | | Defined | | retirement | | retirement | | retirement | |
| | benefit | | benefit | | benefit | | medical | | medical | | medical | |
| | pension plans | | pension plans | | pension plans | | benefits | | benefits | | benefits | |
| |
|
|
|
|
|
|
|
|
|
|
| |
| | 2006 | | 2005 | | 2004 | | 2006 | | 2005 | | 2004 | |
| |
|
|
|
|
|
|
|
|
|
|
| |
| | £m | | £m | | £m | | £m | | £m | | £m | |
|
|
|
|
|
|
|
|
|
|
|
| |
| Present value of defined benefit obligation | (2,040.4 | ) | (2,012.4 | ) | (1,790.7 | ) | (77.4 | ) | (103.3 | ) | (80.4 | ) |
|
|
|
|
|
|
|
|
|
|
|
| |
| Fair value of plan assets | 2,026.9 | | 1,991.6 | | 1,742.2 | | – | | – | | – | |
|
|
|
|
|
|
|
|
|
|
|
| |
| Net liability | (13.5 | ) | (20.8 | ) | (48.5 | ) | (77.4 | ) | (103.3 | ) | (80.4 | ) |
|
|
|
|
|
|
|
|
|
|
|
| |
| Difference between actual and expected return on plan assets: | | | | | | | | | | | | |
| Amount (£m) | 14.5 | | 107.5 | | 14.5 | | – | | – | | – | |
|
|
|
|
|
|
|
|
|
|
|
| |
| Percentage of plan assets (%) | 0.7 | % | 5.4 | % | 0.8 | % | – | | – | | – | |
|
|
|
|
|
|
|
|
|
|
|
| |
| Experience gains and (losses) on plan liabilities: | | | | | | | | | | | | |
| Amount (£m) | (12.4 | ) | (14.6 | ) | 115.3 | | 10.4 | | (14.0 | ) | 6.9 | |
|
|
|
|
|
|
|
|
|
|
|
| |
| Percentage of plan liabilities (%) | 0.6 | % | 0.7 | % | (6.4 | )% | (13.4 | )% | 13.6 | % | (8.6 | )% |
|
|
|
|
|
|
|
|
|
|
|
| |
As required under IAS 19, the effects of experience gains and losses on plan assets and liabilities shown above exclude the effects of changes in actuarial assumptions.
| 29 | Financial risk management |
|
|
| Exposure to liquidity, credit, and market price risk arises as a result of the day-to-day business activities of the group and the financing of those activities. Derivative financial instruments are used to hedge exposures to fluctuations in interest rates, foreign exchange rates, and energy prices. |
| | |
| a) | Funding and Liquidity Risk |
|
| In addition to the high level of free cash flow of the group, Hanson operates a prudent approach to liquidity management using a mixture of long-term debt together with short-term debt, cash and investments to meet its liabilities when due. This approach allows the group to respond quickly to strategic market opportunities as they arise. |
The group’s core funding is provided by three $750m bonds maturing in September 2010, March 2013 and August 2016 respectively. In addition the group holds the following facilities:
| – | A £500m revolving credit facility, £470m of which expires in April 2011 and £30m of which expires in April 2010. The facility contains a $947m swingline advance facility and a sub-limit of up to £300m for Australian dollar loan note advances. |
| – | A $475m syndicated credit facility expiring in July 2009. This facility is available to be drawn as either cash advances or standby letters of credit. |
| – | Two A$200m bilateral revolving credit facilities maturing in September 2007. |
| – | A €100m bilateral revolving credit facility maturing in August 2007. |
Committed bank facilities
|
|
|
| |
| | Expiring | | Remaining | |
| |
|
|
| |
| | £m | | £m | |
|
|
|
| |
| 2006 | – | | 971.2 | |
|
|
|
| |
| 2007 | 228.5 | | 742.7 | |
|
|
|
| |
| 2008 | – | | 742.7 | |
|
|
|
| |
| 2009 | 242.7 | | 500.0 | |
|
|
|
| |
| 2010 | 30.0 | | 470.0 | |
|
|
|
| |
| 2011 | 470.0 | | – | |
|
|
|
| |
| | |
| b) | Credit Risk |
|
| Credit risk represents the loss which Hanson would suffer if a counterparty failed to meet its contractual obligations. This is an inherent risk in the day to day operations of the group. |
The Board’s policy for mitigating credit risk is to enter into financial transactions with counterparties with a A-/A3 credit rating for long-term transactions and F2/P-2/A2 for short-term transactions. In addition, each counterparty and country are allocated limits for cash and short-term investments. Cash deposits and investments have a maximum term of three months.
At December 31, 2006 there were no significant risk weighted concentrations of credit risk. The maximum exposure under cash and short-term investments to a single counterparty at December 31, 2006 represented no more than 11% of group cash and short-term investments.
| c) | Market Risk |
|
| Market risk is the risk of loss arising from movements in market variables such as interest rates, exchange rates, and energy prices. Market risk is incurred by Hanson as a result of borrowing to meet its financing obligations, by holding investments which earn interest, by operating in currencies other than sterling and by purchasing commodities as inputs into its operations. |
Each of these risks is monitored by the relevant business unit and reviewed by senior management and/or the group Risk Committee.
| Hanson 2006 www.hanson.biz |
Back to Contents
| | | | |
| | | |
| | | |
| | 109 | |
|
|
|
|
| | | | |
| Notes to the accounts |
| 29 | Financial risk management continued |
|
|
| (i) | Interest rate risk |
| The group’s policy on interest rate risk is designed to limit the group’s exposure to fluctuating interest rates. This is achieved by limiting the level of floating interest rate exposure to a maximum determined by both the level of debt and the level of operating profit of the group at any point in time. This approach, which is consistent with the group’s target for leverage, will mean, other things being equal, that for any given level of debt, a higher level of operating profit will result in a higher limit on the level of floating rate debt in the group (and vice versa). Consistent with this policy, at December 31, 2006 the group held 63% of net debt at fixed rates. Hanson uses interest rate swaps as part of fair value hedges, to swap fixed rate debt into floating rates and as part of cash flow hedges to swap floating rate debt into fixed rates, in line with the policy described above. Derivatives are classified separately in the balance sheet as an asset or liability as appropriate. |
In respect of interest-earning financial assets and interest bearing financial liabilities, the following table indicates their weighted average effective interest rates at the balance sheet date and the periods in which they reprice or mature. Interest on financial instruments classified as floating rate is repriced at intervals of less than one year. The other financial assets and liabilities of the group that are not included in the table below are non-interest bearing and are therefore not subject to interest rate risk.
The effective interest rate and repricing or maturity analysis is as follows:
| | | | | | | | | Fixed interest | |
| | | | | | | | |
| |
| | | Weighted | | | | | | Total at | | | | | | | | | | | | | |
| | | average | | | | At floating | | fixed | | | | | | | | | | | | | |
| | | effective | | | | interest | | interest | | 1 year or | | | | | | | | | | More than | |
| | | interest rate | | Total | | rates | | rates | | less | | 1-2 years | | 2-3 years | | 3-4 years | | 4-5 years | | 5 years | |
| As at | |
| |
|
|
|
|
|
|
|
|
|
|
|
|
|
|
|
|
| |
| December 31, 2006 | Notes | % | | £m | | £m | | £m | | £m | | £m | | £m | | £m | | £m | | £m | |
|
|
|
|
|
|
|
|
|
|
|
|
|
|
|
|
|
|
|
|
| |
| Financial liabilities: | | | | | | | | | | | | | | | | | | | | | |
| Bank overdrafts | 20 | 4.79 | | (141.9 | ) | (141.9 | ) | – | | – | | – | | – | | – | | – | | – | |
|
|
|
|
|
|
|
|
|
|
|
|
|
|
|
|
|
|
|
|
| |
| Bank loans* | 20 | 5.77 | | (364.3 | ) | (265.2 | ) | (99.1 | ) | – | | (38.7 | ) | – | | (20.1 | ) | – | | (40.3 | ) |
|
|
|
|
|
|
|
|
|
|
|
|
|
|
|
|
|
|
|
|
| |
| Commercial paper* | 20 | 4.39 | | (492.0 | ) | (364.3 | ) | (127.7 | ) | – | | (51.1 | ) | (76.6 | ) | – | | – | | – | |
|
|
|
|
|
|
|
|
|
|
|
|
|
|
|
|
|
|
|
|
| |
| Debenture loans* | 20 | 6.52 | | (1,161.0 | ) | (509.5 | ) | (651.5 | ) | (12.8 | ) | – | | – | | (191.6 | ) | – | | (447.1 | ) |
|
|
|
|
|
|
|
|
|
|
|
|
|
|
|
|
|
|
|
|
| |
| Finance leases | 20 | | | (3.4 | ) | – | | (3.4 | ) | (1.0 | ) | (0.6 | ) | (0.6 | ) | (0.5 | ) | (0.5 | ) | (0.2 | ) |
|
|
|
|
|
|
|
|
|
|
|
|
|
|
|
|
|
|
|
|
| |
| Other loans | 20 | | | (1.4 | ) | – | | (1.4 | ) | (0.5 | ) | (0.5 | ) | (0.2 | ) | (0.2 | ) | – | | – | |
|
|
|
|
|
|
|
|
|
|
|
|
|
|
|
|
|
|
|
|
| |
| | | | | (2,164.0 | ) | (1,280.9 | ) | (883.1 | ) | (14.3 | ) | (90.9 | ) | (77.4 | ) | (212.4 | ) | (0.5 | ) | (487.6 | ) |
|
|
|
|
|
|
|
|
|
|
|
|
|
|
|
|
|
|
|
|
| |
| Less: | | | | | | | | | | | | | | | | | | | | | |
| Effect of interest rate swaps | | | | – | | 480.9 | | (480.9 | ) | (9.9 | ) | (108.4 | ) | 76.6 | | (185.2 | ) | – | | (254.0 | ) |
|
|
|
|
|
|
|
|
|
|
|
|
|
|
|
|
|
|
|
|
| |
| Total financial liabilities excluding effect of interest rate swaps | | | | (2,164.0 | ) | (800.0 | ) | (1,364.0 | ) | (24.2 | ) | (199.3 | ) | (0.8 | ) | (397.6 | ) | (0.5 | ) | (741.6 | ) |
|
|
|
|
|
|
|
|
|
|
|
|
|
|
|
|
|
|
|
|
| |
| Financial assets: | | | | | | | | | | | | | | | | | | | | | |
| Cash and cash equivalents | 18 | 4.83 | | 766.7 | | 766.7 | | – | | – | | – | | – | | – | | – | | – | |
|
|
|
|
|
|
|
|
|
|
|
|
|
|
|
|
|
|
|
|
| |
| Net debt | 20 | | | (1,397.3 | ) | (33.3 | ) | (1,364.0 | ) | (24.2 | ) | (199.3 | ) | (0.8 | ) | (397.6 | ) | (0.5 | ) | (741.6 | ) |
|
|
|
|
|
|
|
|
|
|
|
|
|
|
|
|
|
|
|
|
| |
| Floating/Fixed comparison (based on net debt)* | | 37 | % | 63 | % | | | | | | | | | | | | |
| Weighted average fixed rate* | | | | 6.3 | % | | | | | | | | | | | | |
| Weighted average fixed period* | | | | 5.8 | years | | | | | | | | | | | | |
| *Including effect of interest rate swaps | | | | | | | | | | | | | | | | | |
| | | | | | | | | | | | | | | | | | | | | |
| | | | | | | | Fixed interest | |
| | | | | | | |
| |
| | | Weighted | | | | | | | | | | | | | | | | | | |
| | | average | | | | | | | | | | | | | | | | | | |
| | | effective | | | At floating | | Total at fixed | | 1 year or | | | | | | | | | | More than | |
| | | interest rate | Total | | interest rates | | interest rates | | less | | 1-2 years | | 2-3 years | | 3-4 years | | 4-5 years | | 5 years | |
| As at | |
|
|
|
|
|
|
|
|
|
|
|
|
|
|
|
|
|
| |
| December 31, 2005 | Notes | % | £m | | £m | | £m | | £m | | £m | | £m | | £m | | £m | | £m | |
|
|
|
|
|
|
|
|
|
|
|
|
|
|
|
|
|
|
|
| |
| Financial liabilities: | | | | | | | | | | | | | | | | | | | | |
| Bank overdrafts | 20 | 4.86 | (20.9 | ) | (20.9 | ) | – | | – | | – | | – | | – | | – | | – | |
|
|
|
|
|
|
|
|
|
|
|
|
|
|
|
|
|
|
|
| |
| Bank loans* | 20 | 5.30 | (371.2 | ) | (264.1 | ) | (107.1 | ) | – | | (0.3 | ) | (42.7 | ) | – | | (21.4 | ) | (42.7 | ) |
|
|
|
|
|
|
|
|
|
|
|
|
|
|
|
|
|
|
|
| |
| Commercial paper* | 20 | 3.26 | (787.4 | ) | (641.8 | ) | (145.6 | ) | – | | – | | (58.2 | ) | (87.4 | ) | – | | – | |
|
|
|
|
|
|
|
|
|
|
|
|
|
|
|
|
|
|
|
| |
| Debenture loans* | 20 | 6.09 | (890.1 | ) | (593.6 | ) | (296.5 | ) | (5.3 | ) | – | | – | | – | | (145.6 | ) | (145.6 | ) |
|
|
|
|
|
|
|
|
|
|
|
|
|
|
|
|
|
|
|
| |
| Finance leases | 20 | | (0.8 | ) | – | | (0.8 | ) | (0.6 | ) | (0.2 | ) | – | | – | | – | | – | |
|
|
|
|
|
|
|
|
|
|
|
|
|
|
|
|
|
|
|
| |
| Other loans | 20 | | (2.2 | ) | – | | (2.2 | ) | (0.6 | ) | (0.5 | ) | (0.4 | ) | (0.2 | ) | (0.2 | ) | (0.3 | ) |
|
|
|
|
|
|
|
|
|
|
|
|
|
|
|
|
|
|
|
| |
| | | | (2,072.6 | ) | (1,520.4 | ) | (552.2 | ) | (6.5 | ) | (1.0 | ) | (101.3 | ) | (87.6 | ) | (167.2 | ) | (188.6 | ) |
|
|
|
|
|
|
|
|
|
|
|
|
|
|
|
|
|
|
|
| |
| Less: | | | | | | | | | | | | | | | | | | | | |
| Effect of interest rate swaps | | | – | | 540.8 | | (540.8 | ) | (10.5 | ) | (199.8 | ) | 101.0 | | 87.4 | | (293.3 | ) | (225.6 | ) |
|
|
|
|
|
|
|
|
|
|
|
|
|
|
|
|
|
|
|
| |
| Total financial liabilities excluding effect of interest rate swaps | | | (2,072.6 | ) | (979.6 | ) | (1,093.0 | ) | (17.0 | ) | (200.8 | ) | (0.3 | ) | (0.2 | ) | (460.5 | ) | (414.2 | ) |
|
|
|
|
|
|
|
|
|
|
|
|
|
|
|
|
|
|
|
| |
| Financial assets: | | | | | | | | | | | | | | | | | | | | |
| Cash and cash equivalents | 18 | 4.21 | 1,083.0 | | 1,083.0 | | – | | – | | – | | – | | – | | – | | – | |
|
|
|
|
|
|
|
|
|
|
|
|
|
|
|
|
|
|
|
| |
| Net debt | 20 | | (989.6 | ) | 103.4 | | (1,093.0 | ) | (17.0 | ) | (200.8 | ) | (0.3 | ) | (0.2 | ) | (460.5 | ) | (414.2 | ) |
|
|
|
|
|
|
|
|
|
|
|
|
|
|
|
|
|
|
|
| |
| Floating/Fixed comparison (based on net debt)* | | 44 | % | 56 | % | | | | | | | | | | | | |
| Weighted average fixed rate* | | | | 6.3 | % | | | | | | | | | | | | |
| Weighted average fixed period* | | | | 5.1 | years | | | | | | | | | | | | |
| *Including effect of interest rate swaps | | | | | | | | | | | | | | | | | |
Back to Contents
Notes to the accountscontinued
for the 12 months ended December 31, 2006
| 29 | Financial risk managementcontinued |
|
|
| During 2006, $125m of the interest rate swaps relating to the 2010 $750m 7.875% fixed rate bond were cancelled, leaving $375m swapped to floating rates and $125m of the interest rate swaps relating to the 2013 $750m 5.25% fixed rate bond were cancelled, leaving $375m swapped to floating rates. In addition, $250m of the 2016 $750m 6.125% fixed rate bond was swapped to floating rates. During 2005, $250m of the interest rate swaps relating to the 2013 $750m 5.25% fixed rate bond were cancelled, leaving $500m swapped to floating rates at December 31, 2005. |
| | |
| (ii) | Foreign exchange risk |
| Due to the nature of the group’s products, which are generally uneconomic to transport long distances, there are few foreign exchange transaction exposures in the course of the group’s day-to-day business. The group does, however, have the majority (63.5%) of its net assets in overseas locations denominated in foreign currencies, principally US dollars (42.1% of net assets). As a consequence, changes in exchange rates affect both reported profit and asset values. The exposure of asset values to changes in foreign exchange rates is controlled to an extent by matching a proportion of currency assets with currency liabilities using both debt and foreign exchange contracts. This means that falling overseas exchange rates will result in both lower asset values and lower levels of net debt in sterling terms. The interest cost of currency liabilities also provides a partial hedge for foreign currency income. |
| |
| The following table summarises the group’s net balance sheet currency exposure as at December 31, 2006: |
| |
| |
| | 2006 | | 2006 | | 2006 | | 2006 | | 2006 | | 2005 | | 2005 | | 2005 | | 2005 | | 2005 | |
| |
| |
| | Gross | | | | Equity | | Net foreign | | | | Gross | | | | Equity | | Net foreign | | | |
| | capital | | Net | | shareholders' | | exchange | | Net currency | | capital | | Net | | shareholders' | | exchange | | Net currency | |
| | employed | | (debt) cash | | funds | | contracts | | exposure | | employed | | (debt) cash | | funds | | contracts | | exposure | |
| |
| |
| | £m | | £m | | £m | | £m | | £m | | £m | | £m | | £m | | £m | | £m | |
|
| |
| Sterling | 1,505.3 | | 292.6 | | 1,797.9 | | (222.1 | ) | 1,575.8 | | 1,225.7 | | 303.6 | | 1,529.3 | | 173.0 | | 1,702.3 | |
| |
| US Dollar | 1,735.8 | | (1,239.7 | ) | 496.1 | | 125.7 | | 621.8 | | 1,551.2 | | (691.5 | ) | 859.7 | | (398.6 | ) | 461.1 | |
| |
| Australian Dollar | 590.9 | | (160.1 | ) | 430.8 | | (54.5 | ) | 376.3 | | 598.6 | | (170.9 | ) | 427.7 | | (92.2 | ) | 335.5 | |
| |
| Euro | 117.1 | | (328.9 | ) | (211.8 | ) | 267.8 | | 56.0 | | 86.1 | | (549.1 | ) | (463.0 | ) | 519.1 | | 56.1 | |
| |
| Other | 171.5 | | 38.8 | | 210.3 | | (116.9 | ) | 93.4 | | 198.0 | | 118.3 | | 316.3 | | (201.3 | ) | 115.0 | |
| |
| Total | 4,120.6 | | (1,397.3 | ) | 2,723.3 | | – | | 2,723.3 | | 3,659.6 | | (989.6 | ) | 2,670.0 | | – | | 2,670.0 | |
| |
| | |
| (iii) | Energy price risk |
| Hanson is exposed to price risk on fuel and other energy purchases in its operations. Energy price risk is managed by a combination of physical supply agreements and derivative instruments which together limit the effect of changing prices on the group’s operating profit. Derivative transactions are accounted for as cash flow hedges where the hedge relationship meets the criteria for hedge accounting, and as non-designated hedges where the criteria are not met. |
| | |
| The notional and carrying values of energy hedges outstanding at December 31, 2006 are as follows: |
| |
| |
| | 2006 | | 2005 | |
| |
| |
| | £m | | £m | |
| |
| Carrying Value | (1.2 | ) | (0.2 | ) |
| Notional Value | 8.6 | | 4.1 | |
| |
| | |
| The maximum length of time over which energy price risk is hedged using derivatives is one year. |
| | |
| (iv) | Hedging |
| Hanson uses derivatives to mitigate or hedge market price risk. Hedges are classified into the following types: |
| |
| Fair value hedges |
| For effective fair value hedges, the hedging instrument is recorded at fair value on the balance sheet, with changes in fair value being taken through the income statement. The carrying amount of the hedged item is adjusted for gains and losses attributable to the risk being hedged. Hanson uses fixed to floating interest rate swaps to hedge the change in fair value of some of its fixed rate debt caused by interest rate movements: |
| |
| – | $375m of the $750m fixed rate bond maturing in 2010 |
| – | $375m of the $750m fixed rate bond maturing in 2013 |
| – | $250m of the $750m fixed rate bond maturing in 2016 |
| – | £199.8m of fixed rate bank debt |
| | |
| Cash flow hedges |
| For cash flow hedges, the fair value of the hedge is carried on the balance sheet. The hedged item is either held off-balance sheet or recorded at historic or amortised cost, depending upon the type of transaction. For effective hedges, changes in the fair value of the hedging instrument are taken to equity. They are then recycled through the income statement in the period during which the hedged item impacts the income statement. |
| |
| Included in the group’s cash flow hedges are US$250m and A$250m of floating to fixed interest rate swaps hedging floating rate borrowings. Other than floating rate borrowings the maximum length of time over which the variability in future cash flows of forecast transactions, is hedged is under one year. |
| |
| Net investment hedges |
| The group holds foreign currency denominated debt and forward exchange contracts as hedges of its foreign currency investments. The value of such contracts is set out in the currency exposure table in section c) (ii) of this note. |
| |
| Non-designated hedges |
| As IFRS has stringent rules under which hedge accounting may be applied, it is not considered practicable to apply hedge accounting for a small number of hedges (including some hedges of energy). These items are of generally low value. Such hedges are deemed non-designated under IAS 39 and are recognised at fair value on the balance sheet with changes in their fair value being recognised immediately through the income statement. |
| |
| The amount of hedge ineffectiveness during the year was not significant. |
| |
| |
| Hanson 2006 www.hanson.biz |
Back to Contents
| | | | |
| | | |
| | | |
| | 111 | |
|
|
|
|
| | | | |
| Notes to the accounts |
| 29 | Financial risk managementcontinued |
|
|
| d) | Fair value of financial instruments |
|
| Fair value is the amount for which an asset could be exchanged, or a liability settled, between knowledgeable, willing parties on an arm’s length basis. For financial instruments carried at fair value, market prices or rates are used to determine fair value where an active market exists. Hanson uses forward prices for valuing forward foreign exchange and commodity contracts and uses swap models with present value calculations based on market yield curves to value interest rate swaps. For short-term assets and liabilities, the carrying amount is approximate to their fair value. |
| | |
| All derivative financial assets and liabilities are shown at fair value on the balance sheet. Under IAS 39 hedge accounting rules, only the portions of the three $750m bonds which form part of an effective fair value hedge are shown at fair value in the balance sheet. The fair value of bonds at December 31, 2006 was £1,178.3m (£940.4m), compared to their carrying value of £1,161.0m as at December 31, 2006. |
| | |
| |
| | | | 2006 | | 2006 | | 2005 | | 2005 | |
| | | |
| |
| | | | Book value | | Fair value | | Book value | | Fair value | |
| | | |
| |
| Fair value of financial assets and liabilities | Notes | | £m | | £m | | £m | | £m | |
| |
| Primary financial instruments held or issued to finance the group’s operations: | | | | | | | | | | |
| Current borrowings | 20 | | (824.2 | ) | (824.2 | ) | (911.0 | ) | (911.0 | ) |
| |
| Non-current borrowings | 20 | | (1,339.8 | ) | (1,357.1 | ) | (1,161.6 | ) | (1,212.3 | ) |
| |
| Cash and short-term deposits | 18 | | 766.7 | | 766.7 | | 1,083.0 | | 1,083.0 | |
| |
| Net debt | | | (1,397.3 | ) | (1,414.6 | ) | (989.6 | ) | (1,040.3 | ) |
| |
| Derivative financial instruments held to manage the interest | | | | | | | | | | |
| rate and currency profile of financial assets and liabilities: | | | | | | | | | | |
| Net interest rate swaps | 17 and 19 | | 1.5 | | 1.5 | | 6.4 | | 6.4 | |
| |
| Derivative financial instruments held to manage cash flows: | | | | | | | | | | |
| Commodity swaps | 19 | | (1.2 | ) | (1.2 | ) | (0.2 | ) | (0.2 | ) |
| |
| Derivative financial instruments held to manage the currency | | | | | | | | | | |
| profile of the net asset investment in overseas subsidiaries: | | | | | | | | | | |
| Net forward exchange contracts | 17 and 19 | | (0.8 | ) | (0.8 | ) | (5.7 | ) | (5.7 | ) |
| |
| | |
| For those financial assets and liabilities which bear either a floating rate of interest or no interest, fair value is estimated to be equivalent to book value. |
| | |
| For non-current receivables (note 17), payables (note 19) and provisions (note 21) fair value is estimated to be equivalent to book value, and is not included in the table above. |
| |
| 30 | Related party transactions |
|
|
| Transactions entered into with related parties are as follows: | | |
| | | | | | | | |
| |
| | Joint-ventures | Joint-ventures | Joint-ventures | Associates | Associates | Associates | |
| |
| |
| | 2006 | 2005 | 2004 | 2006 | 2005 | 2004 | |
| |
| |
| | £m | £m | £m | £m | £m | £m | |
| |
| Sales to related parties | 33.6 | 27.1 | 28.1 | 2.1 | 3.6 | 9.0 | |
| Purchases from related parties | 167.6 | 168.2 | 119.1 | 4.0 | 6.7 | 9.9 | |
| |
| | |
| Details of transactions with Directors are given in the auditable part of the Remuneration report. |
| | |
| Terms and conditions of transactions with related parties |
| Amounts due from and to joint-ventures and associates are disclosed in notes 17 and 19 respectively. There have been no guarantees provided or received for any related party receivables or payables. For the year ended December 31, 2006, the group has not made any provision for doubtful debts relating to amounts owed by related parties £nil (£nil, £nil). This assessment is undertaken each financial year through examining the financial position of the related party and the market in which the related party operates. |
| |
| There have been no significant events since December 31, 2006. |
Back to Contents
Notes to the accountscontinued
for the 12 months ended December 31, 2006
| | |
| 32 | US accounting information |
|
|
a) Comparison of International and US accounting principles
From January 1, 2005, as required by the European Union’s IAS Regulation, the group has prepared its Annual Report and Form 20-F in accordance with International Financial Reporting Standards (IFRS) as adopted by the European Union (EU), which differ in certain respects from US generally accepted accounting principles (US GAAP). These differences relate principally to the following items, and the effect of each of the adjustments to profit for the financial year and net equity that would be required to reconcile to US GAAP is set out below.
IFRS as adopted by the EU differ in certain respects from IFRS as issued by the International Accounting Standards Board (IASB). However, the consolidated financial statements for the periods presented would be no different had the Company applied IFRS as issued by the IASB. References to IFRS hereafter should be construed as references to IFRS as adopted by the EU.
As a result of the group’s transition to IFRS on January 1, 2004, the reconciliations of net income and net equity for 2004 published in previous periods have been restated to reflect the restated profit and net equity reported within the Consolidated income statement and Consolidated balance sheet.
Basis of consolidation
Under IFRS, an entity is consolidated where a parent has control over another entity. Control is defined in IAS 27 “Consolidated and Separate Financial Statements” as “the power to govern the financial and operating policies of an entity so as to obtain benefits from its activities”. Under US GAAP, whilst an entity is also consolidated where control exists, FIN 46(R) also requires the consolidation of a Variable Interest Entity (VIE) where the entity is the primary beneficiary by means other than voting rights.
Under IFRS, equity method accounting records the group’s share of profit and its investment in joint-ventures and associates in a single line item. When a joint-venture or associate is fully consolidated under US GAAP, the joint-venture’s or associate’s balance sheet and income statement are recorded on a line by line basis with a corresponding adjustment to minority interest.
Under FIN 46(R), the group is considered to have a variable interest entity in which Hanson is the primary beneficiary. This entity is Piedras y Arenas Baja, S de R L de CV (“Piedras”), a 50% joint-venture which is accounted for as a joint venture operation and therefore equity accounted in the group’s results under IFRS. Under FIN 46(R) Piedras is considered to be a variable interest entity as the total equity investment at risk is not currently sufficient to enable Piedras to finance its activities without additional financial support from other sources. The Hanson group is considered the primary beneficiary of Piedras as it currently provides more than half of the total debt and financial support to the entity and absorbs the majority of the expected losses.
Piedras is an aggregates producer located in Mexico which in 2006 had turnover of £14.4m (£11.9m) and a pre-tax loss of £0.3m (£0.5m) . In addition it had net assets at December 31, 2006 of £2.7m (£3.5m) . Approximately 71% (80%) of the annual turnover of Piedras is to the group. There is no recourse to the general credit of the Company for creditors (or beneficial interest holders) of the consolidated VIE.
Intangible assets
(i) Goodwill
Under IFRS, goodwill arising on acquisitions completed prior to January 1, 1998 was written off directly to reserves. From December 31, 1997 to January 1, 2004, all acquired goodwill was capitalised and amortised over a period not exceeding 20 years. Since January 1, 2004, goodwill continues to be capitalised, however, amortisation of goodwill ceased at that date. On disposal of a business, the profit or loss on disposal is determined including goodwill reported as part of intangible assets. Under US GAAP prior to January 1, 2002, goodwill arising on acquisitions prior to July 1, 2001, was capitalised and amortised over its estimated useful life, not exceeding 40 years. Under the transition provisions of SFAS 142 “Goodwill and other intangible assets”, goodwill, which arose during the period subsequent to July 1, 2001, was capitalised, but has not been amortised. From January 1, 2002, goodwill is no longer amortised, but is reviewed annually for impairment.
(ii) Other intangible assets
Since January 1, 2002, separately identified intangible assets arising on acquisitions have been capitalised and amortised over their useful lives of between 1 and 28 years under US GAAP. Separately identified intangible assets recognised since transition to IFRS have been amortised on the same basis as under US GAAP.
(iii) Capitalised software
Under IFRS, computer software which is deemed not to be integral to the computer hardware is capitalised as part of intangible assets. Under US GAAP, the balances are classified as property, plant and equipment.
Impairment of goodwill
Under IFRS, goodwill is reviewed for potential impairment on an annual basis and where there is an indication that an impairment may have occurred. The impairment is measured by comparing the carrying value of goodwill for each cash generating unit (CGU) with the higher of the fair value less cost to sell and the value in use. Under US GAAP, goodwill impairment reviews are also conducted when an indicator of impairment exists, in addition to an annual impairment review as required by SFAS 142. The potential impairment is identified by comparing the carrying value of each reporting unit with its fair value. Where the carrying value including any separately identifiable intangible assets is greater than the fair value, an impairment loss is calculated based on the excess of the carrying value of goodwill over the implied fair value of goodwill. Where reporting units identified under US GAAP differ from the CGUs identified under IFRS, a reconciling item may arise.
The group’s reporting units are based on its geographical region and product groups. Goodwill is allocated to these reporting units based on the location and product base of acquisitions and disposals at the date of the transaction.
Joint-ventures and associates
The main adjustments that would have been necessary to reconcile the joint-ventures and associates not domiciled within the United States to US GAAP would have been in respect of deferred tax, pensions and goodwill. The group has not included a reconciling item for these adjustments, as the effect on net income and the balance sheet is not material.
Impairment of long-lived assets to be held and used
Under IFRS, property, plant and equipment and intangible assets subject to depreciation and amortisation are assessed for impairment on an annual basis. Where an indicator suggests that there is potential for impairment, a review is completed comparing the recoverable amount with the carrying value of the asset. The recoverable amount is the higher of the value in use based on the expected future cash flows discounted to present value, or the asset’s fair value less costs to sell. Where the carrying value exceeds the recoverable amount, the asset is impaired to the recoverable amount. If in the subsequent period, the indicator which caused the impairment no longer exists and the recoverable amount has improved, the impairment loss should be reversed.
Under US GAAP, such assets are assessed for impairment using a three-step approach. Where an indicator suggests there is potential for impairment, the group determines whether the sum of the estimated undiscounted cash flows attributable to the long-lived assets in question is less than their carrying amount. It is only if the sum of the undiscounted cash flows is less than the carrying value of the asset that an impairment should be recognised. The impairment loss is calculated based on the amount by which the carrying value of the asset exceeds its fair value. When an impairment is recorded against the cost of the asset, it may not be reversed.
Capitalisation of interest costs
Under IFRS, the capitalisation of interest costs is optional. It is the group’s policy under IFRS not to capitalise interest costs. Under US GAAP, interest costs associated with the construction of major assets over a period of time, such as facilities for use by the group, are capitalised as part of the cost of the tangible fixed asset where the impact of the interest cost is material to the financial statements. The interest cost capitalised represents an allocation of the interest cost incurred during the period required to complete construction of the asset. In 2006, interest costs of £131.3m have been incurred. Of that amount £2.3m has been capitalised during the period as part of property, plant and equipment under US GAAP.
Inventory valuation
Under IFRS, valuing inventory on a last-in-first-out (LIFO) basis is not permitted. However, under US GAAP, where the inventory is valued on a LIFO basis for tax purposes in the local state, the same methodology must be used for accounting purposes.
Deferred stripping costs
On January 1, 2006, the group adopted EITF 04-6 “Accounting for stripping costs incurred during production in the mining industry” (EITF 04-6). Under IFRS, stripping costs in the post-production phase are capitalised in certain situations where the benefit exceeds one year and are amortised during the period over which the benefit is realised. Under US GAAP, where stripping costs are incurred during this phase, the costs are included as part of the costs of inventory produced.
| Hanson 2006 www.hanson.biz |
Back to Contents
| | | | |
| | | |
| | | |
| | 113 | |
|
|
|
|
| | | | |
| Notes to the accounts |
| 32 | US accounting informationcontinued |
|
|
Derivative instruments and hedging activities
The group enters into derivative instruments to limit its exposure to interest rate, foreign exchange and commodity price risks. |
Under UK GAAP until December 31, 2004, certain derivative instruments were not required to be recognised on the balance sheet at fair value. On January 1, 2005, the group adopted IAS 32 and 39 on a prospective basis, requiring designation of hedging instruments and recognition of all derivative instruments at fair value on the balance sheet. The group’s hedging policy remains unchanged but the instruments are accounted for as described in the Accounting policies on page 75.
Under US GAAP, derivative instruments, whether designated as a hedge or not, are required to be recognised on the balance sheet at fair value. From January 1, 2005, the group has applied hedge accounting for the purposes of SFAS 133 “Accounting for derivative instruments and hedging activities” where the requirements of SFAS 133 are met. Prior to that date, hedge accounting was not applied for the purposes of US GAAP and therefore, in 2004, the reconciliation to net income in that period fully reflects the changes in fair value of the derivatives, other than hedges of net investment. Hedges of net investment are the same under US GAAP as under IFRS, being taken to equity.
Transition adjustment
In addition, under US GAAP, transition adjustments were required to include the fair value of derivatives on the balance sheet on the adoption of SFAS 133 at January 1, 2001. For those derivatives considered to be fair value hedges, the January 1, 2001 opening fair value of £17.1m was shown as current assets and liabilities – derivatives and as an adjustment to debt. The adjustment to debt is being subsequently amortised through the income statement over the residual life of the debt. For those derivatives considered to be cash flow hedges, the January 1, 2001 opening value of £0.5m was shown as current assets and liabilities – derivatives, and as an adjustment to other comprehensive income. The amounts in other comprehensive income are recognised in the income statement as the related cash flows are realised.
Pensions
Under both IFRS and US GAAP, the pension cost or credit is determined by reference to the pension liability and the market value of the underlying plan assets. Under IFRS, the group has elected not to apply the corridor approach and all actuarial gains or losses are recognised directly in equity, along with the related tax impact. The corridor approach is applied under US GAAP. Under IFRS, the interest on defined benefit scheme obligations and the expected return on those schemes’ assets are treated as part of finance costs in the Income Statement. Under US GAAP, these items are treated as part of the net periodic pension cost in operating profit.
In 2006, the FASB issued Statement No. 158 “Employers’ accounting for defined benefit pension and other postretirement plans” (SFAS 158) which the group has adopted from December 31, 2006 for US GAAP reporting purposes. As a result, the full defined benefit scheme surplus or deficit as of December 31, 2006 has been recognised in the US GAAP balance sheet.
Share-based payments
Under IFRS, the group applies the fair value method of accounting for its share-based payment schemes. As permitted under the transition rules for IFRS, the group has applied the accounting methodology to awards granted after November 7, 2002. From January 1, 2006 for US GAAP reporting purposes, the group has adopted FASB Statement No. 123 (Revised) “Share-based payments” (SFAS 123R), using the “modified prospective” method. This method requires the group not to restate prior periods but to record the current year charge of awards not vested at the transition date and to continue to report pro forma disclosures as previously required under FASB Statement No. 123 “Accounting for stock based compensation” (SFAS 123).
In 2006, the basis of calculation of income statement charges and balance sheet positions for share based payments is consistent under IFRS and US GAAP. Under US GAAP, for awards granted prior to 2005, the group used a Black Scholes model to calculate the fair value of awards. For awards granted since January 1, 2005, the group has changed its method used to estimate the fair value of certain awards. The Long Term Incentive Plan (LTIP) and Share Option Plan (SOP) are valued using a Monte Carlo simulation model for the portion of awards dependent on market conditions and a Black Scholes model for the portion of awards dependent on non-market conditions. Sharesave awards continue to be valued using a Black Scholes model. The changes in method used to estimate the fair value were made in 2005 in order to be consistent with the estimates used for fair values determined under IFRS.
In periods prior to 2006, the group has applied the intrinsic value method under APB 25 “Accounting for stock issued to employees” as permitted by SFAS 123. In line with the requirements of SFAS 123 and as amended by SFAS 148 “Accounting for stock-based compensation – transaction and disclosure” (SFAS 148), the group provides pro forma disclosure of the impact of applying these standards which are based on a fair value method.Provisions
Under IFRS, provisions are discounted to reflect the time-value of money based on the estimated timing of cash flows. US GAAP applies a stricter definition, permitting discounting only where the timing of cash flows is fixed or reliably determinable. IFRS requires a current market discount rate to be applied to provisions, whereas in the instances that discounting is permitted US GAAP requires the current rate to be used for new provisions, or changes in estimates for existing obligations, without amendment in subsequent periods.
Accounting for restructuring costs
Under IFRS, restructuring costs are recognised where implementation of a formal plan has begun and communicated with those affected. Costs of leased property, plant and equipment, which will no longer provide economic benefit, are provided for as part of the restructuring plan. Under US GAAP, one-time termination benefits are recognised where a detailed formal plan has been communicated to employees. Where employees are required to continue working until they are terminated to be eligible for the termination benefit and that period exceeds the minimum retention period, the cost is recognised rateably over the retention period. Costs of property, plant and equipment that will continue to be incurred under a leasing contract without economic benefit are recognised once the assets cease to be used.
Non-monetary transactions
Under IFRS, exchanges of assets in return for an equity interest in a joint-venture entity are transferred at the fair value of assets surrendered. The fair value of the equity interest received is measured by its fair value, which is equivalent to the fair value of the assets given up adjusted by the amount of cash transferred. In this instance a proportion of the gain or loss on the transaction is recognised in the equity shareholders’ income statement. When the fair values cannot be reliably measured or the transaction lacks commercial substance, no gain or loss on disposal is recognised.
Under US GAAP, from January 2005, the group has adopted SFAS 153 “Exchanges of non-monetary assets”. The issuance of this standard removes future differences as it is to be applied on a prospective basis. However, there are a number of residual differences on acquisitions prior to this date. Previously, APB Opinion No. 29 “Accounting for non-monetary transactions” provided an exemption to its general principles of measuring such transactions at fair value where the exchange related to similar productive assets. SFAS 153 has removed this exemption for transactions taking place after January 2005.
Foreign exchange gains and losses on disposals of businesses
Prior to the transition date of January 1, 2004, under IFRS, cumulative foreign exchange gains and losses relating to disposals were adjusted within reserves. At the date of transition the group opted to set the reserve to nil and subsequent movements have been recycled on disposal of the related business. Under US GAAP, such gains and losses are also included in determining the profit or loss on disposal but they are tracked from the date of acquisition of the entity.
Deferred tax
Under both IFRS and US GAAP, deferred taxation assets and liabilities are provided on differences between the book and tax bases of assets and liabilities except in certain limited circumstances. Certain assets may have more than one tax base and IFRS requires use of the tax base most relevant to the manner of realisation; for those assets which are not depreciable, depletable or amortisable for tax purposes, the tax base may be nil. US GAAP, however, requires the use of the tax base assuming a disposal of the asset. Accordingly, the tax base and the corresponding temporary difference for certain assets will be different under IFRS and US GAAP.
Under IFRS, deferred tax assets are recognised for future deductions and utilisations of tax carry forwards to the extent that it is more likely than not that suitable taxable profit is expected to be available. Under US GAAP, deferred tax assets are recognised at their full amounts and reduced by a valuation allowance to the extent it is more likely than not that suitable taxable profits will not be available.
Differences in deferred taxation may occur as a result of accounting adjustments between IFRS and US GAAP.
Back to Contents
Notes to the accountscontinued
for the 12 months ended December 31, 2006
| | |
| 32 | US accounting information continued |
|
|
Discontinued operations
Discontinued operations are those clearly distinguishable operations and activities which either ceased or left the group in the accounting period or soon thereafter, including assets held for sale, where it is probable that the sale will complete within one year. Prior to January 1, 2004, assets held for sale were not treated as discontinued operations. IFRS includes equity method investments as part of discontinued operations whereas US GAAP specifically excludes equity method investee from scope. |
Acquisition accounting
US GAAP requires that a deferred tax asset or liability be raised to reflect the difference between the tax basis of assets acquired and liabilities assumed, and their fair values at the time of acquisition. The same is true under IFRS. However, where there are differences between the fair values of these assets and liabilities under IFRS and US GAAP, there will be a resulting difference in the deferred tax calculated. The recognition of deferred tax assets or liabilities affects the amount of goodwill recognised on acquisition. IFRS requires that contingent consideration is included within the cost of the consideration at the date of acquisition where it is probable that the resolution of the contingency will result in the transfer of economic benefit and that the amount can be measured reliably. US GAAP, however, only permits recognition of such consideration once the contingency is resolved and the amount to be paid is determinable. Under IFRS, when shares are issued as consideration for an acquisition, the fair value of that consideration is based upon the share price at the date the acquisition is unconditional. Under US GAAP, the acquisition price is based upon the share price over a reasonable period of time before and after the date that the acquisitions are agreed to and announced. Where an acquisition results in negative goodwill, IFRS requires that the excess amount is immediately taken to the income statement. US GAAP requires the excess to initially be proportionally allocated to the fair values assigned to non-current assets.
Asset recognition
Under IFRS, assets which include a degree of uncertainty become recognisable in accordance with the criteria set out in IAS 37 “Provisions, contingent liabilities and contingent assets”. Where such an asset is recognised under IFRS, it is discounted to its present value based on the timing of expected cash flows. Although broadly similar, there are certain circumstances under US GAAP where a contingent asset can only be recognised if additional criteria are met.
New US accounting standards and pronouncements not yet adopted
In September 2006, the FASB issued Statement No. 157 “Fair Value Measurements” (SFAS 157), seeking to clarify the methodology used to measure fair value by emphasizing that market-based measurement should be used as the method to value assets and liabilities. This establishes a fair value hierarchy and incorporates an adjustment for risk in the valuation model. The statement will be applied prospectively from the effective date of January 1, 2008, with limited retrospective effect on financial instruments previously measured at fair value under the initial recognition of FASB Statement 133 “Accounting for derivative instruments and hedging activities”. While it is not possible to determine the financial impact of the prospective element of the statement, the effect of reversing the transition adjustment on adoption of SFAS 133 would be £10.0m credit to US GAAP net equity.
In July 2006, the FASB issued Interpretation No. 48 “Accounting for Uncertainty in Income Taxes – An Interpretation of FASB Statement No. 109” (FIN 48). FIN 48 requires tax benefits from uncertain positions to be recognised only if it is “more likely than not” that the position is sustainable based on its technical merits. The interpretation also requires qualitative and quantitative disclosures, including discussion of reasonably possible changes that might occur in unrecognised tax benefits over the next 12 months, a description of open tax years by major jurisdiction, and a roll-forward of all unrecognised tax benefits. FIN 48 applies for the group’s financial year beginning 1 January 2007. The group is currently in the process of quantifying the net adjustment to retained earnings as of January 1, 2007, which will arise on adoption of FIN 48.
The Emerging Issues Task Force issued Abstract 06-2 “Accounting for Sabbatical Leave and Other Similar Benefits Pursuant to FASB Statement No. 48” (EITF 06-2) in March 2006. The abstract explains that compensated absence during which an employee is not required to carry out any duties in which the compensated absence is required to be earned, must be accrued over the preceding service period. The methodology is applied under IAS 19 “Employee benefits” and has not resulted in a reconciling difference to US GAAP. It is therefore not believed that the adoption of the abstract will have a material impact on transition.
| Hanson 2006 www.hanson.biz |
Back to Contents
| | | | |
| | | |
| | | |
| | 115 | |
|
|
|
|
| | | | |
| Notes to the accounts |
| 32 | US accounting informationcontinued |
|
|
| b) | Net income |
|
|
|
|
|
|
|
| | 2006 | | 2005 | | 2004 | |
| |
|
|
|
|
| |
| | £m | | £m | | £m | |
|
|
|
|
|
| |
| Profit for the financial year as reported in the Consolidated income statement | 401.5 | | 387.6 | | 264.2 | |
|
|
|
|
|
| |
| Minority interest | (1.1 | ) | (0.3 | ) | 0.1 | |
|
|
|
|
|
| |
| Profit for the year attributable to equity holders of the Company | 400.4 | | 387.3 | | 264.3 | |
|
|
|
|
|
| |
| Adjustments: | | | | | | |
| Intangible assets – amortisation | 2.3 | | 1.1 | | 0.6 | |
|
|
|
|
|
| |
| Intangible assets – impairment* | – | | 15.5 | | (321.0 | ) |
|
|
|
|
|
| |
| Investments in joint-ventures | – | | 0.9 | | (0.9 | ) |
|
|
|
|
|
| |
| Property, plant and equipment – impairment | (0.2 | ) | (19.6 | ) | – | |
|
|
|
|
|
| |
| Property, plant and equipment – depreciation | (0.8 | ) | 0.4 | | (0.5 | ) |
|
|
|
|
|
| |
| Inventory valuation | (2.6 | ) | (1.6 | ) | (3.4 | ) |
|
|
|
|
|
| |
| Receivables | 1.1 | | 1.8 | | 21.3 | |
|
|
|
|
|
| |
| Change in fair value of derivatives | 6.4 | | 1.8 | | (7.8 | ) |
|
|
|
|
|
| |
| Pensions | (26.4 | ) | (31.7 | ) | (15.0 | ) |
|
|
|
|
|
| |
| Share-based payments | (3.2 | ) | (11.2 | ) | (0.2 | ) |
|
|
|
|
|
| |
| Provisions | 8.4 | | (14.9 | ) | (42.0 | ) |
|
|
|
|
|
| |
| Profit and loss on disposals – goodwill | – | | (7.2 | ) | 3.7 | |
|
|
|
|
|
| |
| Profit and loss on disposals – cumulative exchange losses | – | | 4.7 | | (5.3 | ) |
|
|
|
|
|
| |
| Interest | 2.3 | | 2.2 | | 2.1 | |
|
|
|
|
|
| |
| Taxation on above adjustments | (12.6 | ) | 23.7 | | 4.1 | |
|
|
|
|
|
| |
| Taxation methodology | (11.7 | ) | 110.5 | | 73.1 | |
|
|
|
|
|
| |
| Net income/(loss) as adjusted to accord with US GAAP | 363.4 | | 463.7 | | (26.9 | ) |
|
|
|
|
|
| |
| Arising from: | | | | | | |
| Continuing operations | 335.6 | | 473.2 | | 3.4 | |
|
|
|
|
|
| |
| Discontinued operations – profit from operations | 22.5 | | 14.5 | | 18.2 | |
|
|
|
|
|
| |
| Discontinued operations – profit/(loss) on disposals | 5.3 | | (24.0 | ) | (48.5 | ) |
|
|
|
|
|
| |
| Net income/(loss) | 363.4 | | 463.7 | | (26.9 | ) |
|
|
|
|
|
| |
| *Includes goodwill previously written off to reserves under UK GAAP pre 1998 | | | | | | |
The 2004 taxation methodology adjustment includes the impact of a tax write-up of depreciable fixed assets under a new tax consolidation regime introduced in Australia.
|
|
|
|
|
|
|
|
|
|
|
|
|
| | 2006 | | 2006 | | 2005 | | 2005 | | 2004 | | 2004 | |
| |
|
|
|
|
|
|
|
|
|
|
| |
| | Per share | | Per ADS | | Per share | | Per ADS | | Per share | | Per ADS | |
| |
|
|
|
|
|
|
|
|
|
|
| |
| | pence | | pence | | pence | | pence | | pence | | pence | |
|
|
|
|
|
|
|
|
|
|
|
| |
| Basic – income from continuing operations | 46.9 | | 234.6 | | 65.0 | | 324.8 | | 0.5 | | 2.3 | |
|
|
|
|
|
|
|
|
|
|
|
| |
| Basic – income/(loss) from discontinued operations | 3.9 | | 19.4 | | (1.3 | ) | (6.5 | ) | (4.1 | ) | (20.6 | ) |
|
|
|
|
|
|
|
|
|
|
|
| |
| Basic – net income/(loss) | 50.8 | | 254.0 | | 63.7 | | 318.3 | | (3.6 | ) | (18.3 | ) |
|
|
|
|
|
|
|
|
|
|
|
| |
| Diluted – income from continuing operations | 46.7 | | 233.0 | | 64.3 | | 321.6 | | 0.5 | | 2.3 | |
|
|
|
|
|
|
|
|
|
|
|
| |
| Diluted – income/(loss) from discontinued operations | 3.8 | | 19.3 | | (1.3 | ) | (6.5 | ) | (4.1 | ) | (20.4 | ) |
|
|
|
|
|
|
|
|
|
|
|
| |
| Diluted – net income/(loss) | 50.5 | | 252.3 | | 63.0 | | 315.1 | | (3.6 | ) | (18.1 | ) |
|
|
|
|
|
|
|
|
|
|
|
| |
| | | | | | | | | | | | | |
| d) | Statement of comprehensive income |
|
|
|
|
|
|
|
| | 2006 | | 2005 | | 2004 | |
| |
|
|
|
|
| |
| | £m | | £m | | £m | |
|
|
|
|
|
| |
| Net income/(loss) as adjusted to accord with US GAAP | 363.4 | | 463.7 | | (26.9 | ) |
|
|
|
|
|
| |
| Other comprehensive income: | | | | | | |
| – Translation adjustment for the period, net of tax of £nil | (124.0 | ) | 82.0 | | (15.5 | ) |
|
|
|
|
|
| |
| – Change in fair value of derivatives and related items, net of tax of £0.7m | 1.5 | | (1.6 | ) | 0.4 | |
|
|
|
|
|
| |
| – Unfunded accumulated benefit obligation and additional minimum liability, net of tax of £0.9m | 1.7 | | (2.4 | ) | 0.1 | |
|
|
|
|
|
| |
| Total comprehensive income/(loss) | 242.6 | | 541.7 | | (41.9 | ) |
|
|
|
|
|
| |
Movements in accumulated other comprehensive income amounts (net of related tax) are as follows:
|
|
|
|
|
|
|
|
|
| |
| | Adjustment to | | | | Derivative | | Foreign | | | |
| | initially apply | | Additional | | financial | | currency | | | |
| | SFAS 158, | | minimum | | instruments | | translation | | | |
| | net of tax | | liability | | gains/(losses) | | adjustments | | Total | |
| |
|
|
|
|
|
|
|
|
| |
| | £m | | £m | | £m | | £m | | £m | |
|
|
|
|
|
|
|
|
|
| |
| At January 1, 2004 | – | | (4.3 | ) | (1.0 | ) | (21.8 | ) | (27.1 | ) |
|
|
|
|
|
|
|
|
|
| |
| Movement in the year | – | | 0.1 | | 0.4 | | (15.5 | ) | (15.0 | ) |
|
|
|
|
|
|
|
|
|
| |
| At December 31, 2004 | – | | (4.2 | ) | (0.6 | ) | (37.3 | ) | (42.1 | ) |
|
|
|
|
|
|
|
|
|
| |
| Movement in the year | – | | (2.4 | ) | (1.6 | ) | 82.0 | | 78.0 | |
|
|
|
|
|
|
|
|
|
| |
| At December 31, 2005 | – | | (6.6 | ) | (2.2 | ) | 44.7 | | 35.9 | |
|
|
|
|
|
|
|
|
|
| |
| Movement in the year | – | | 1.7 | | 1.5 | | (124.0 | ) | (120.8 | ) |
|
|
|
|
|
|
|
|
|
| |
| Transition adjustment for adoption of SFAS 158 at December 31, 2006 (net of tax £150.8m) | (308.9 | ) | 4.9 | | – | | – | | (304.0 | ) |
|
|
|
|
|
|
|
|
|
| |
| At December 31, 2006 | (308.9 | ) | – | | (0.7 | ) | (79.3 | ) | (388.9 | ) |
|
|
|
|
|
|
|
|
|
| |
Back to Contents
Notes to the accounts continued
for the 12 months ended December 31, 2006
| 32 | US accounting informationcontinued |
|
|
| e) | Net equity |
|
|
|
|
|
| | 2006 | | 2005 | |
| |
|
|
| |
| | £m | | £m | |
|
|
|
| |
| Net equity as reported in the consolidated balance sheet | 2,728.8 | | 2,672.3 | |
|
|
|
| |
| Minority interests | (5.5 | ) | (2.3 | ) |
|
|
|
| |
| Attributable to equity holders of the Company | 2,723.3 | | 2,670.0 | |
|
|
|
| |
| Adjustments: | | | | |
| Intangible assets – goodwill | (50.6 | ) | (45.0 | ) |
|
|
|
| |
| Intangible assets – other cost | (19.0 | ) | (13.1 | ) |
|
|
|
| |
| Intangible assets – other accumulated amortisation | 4.2 | | 1.1 | |
|
|
|
| |
| Intangible assets – net adjustment | (65.4 | ) | (57.0 | ) |
|
|
|
| |
| Investments in joint-ventures | (18.3 | ) | (20.6 | ) |
|
|
|
| |
| Property, plant and equipment | 11.6 | | 6.1 | |
|
|
|
| |
| Receivables | 4.1 | | 5.0 | |
|
|
|
| |
| Cash | 0.4 | | – | |
|
|
|
| |
| Inventory | (5.1 | ) | (5.3 | ) |
|
|
|
| |
| Provisions | (42.3 | ) | (63.3 | ) |
|
|
|
| |
| Defined benefit pension surplus | – | | 458.2 | |
|
|
|
| |
| Defined benefit pension deficit | 1.2 | | 27.3 | |
|
|
|
| |
| Trade and other payables | (0.7 | ) | (4.9 | ) |
|
|
|
| |
| Borrowings – derivatives | 11.0 | | 9.4 | |
|
|
|
| |
| Minority interest | (1.4 | ) | (1.7 | ) |
|
|
|
| |
| Taxation on above adjustments | 9.0 | | (141.2 | ) |
|
|
|
| |
| Taxation methodology | 154.1 | | 164.1 | |
|
|
|
| |
| | 58.2 | | 376.1 | |
|
|
|
| |
| Net equity as adjusted to accord with US GAAP | 2,781.5 | | 3,046.1 | |
|
|
|
| |
In 2006, the group has reclassified its opening liability in respect of share-based payments to net equity.
The consolidated statements of cash flows prepared under IFRS present substantially the same information as those required under US GAAP. These statements differ, however, with regard to classification of items within them.
Under US GAAP, cash and cash equivalents for cash flow purposes include short-term liquid resources but not overdrafts. Under IFRS, overdrafts are included within the definition of cash equivalents. Under US GAAP, capitalised interest is treated as part of the cost of the asset to which it relates and thus included as part of investing cash flows; under IFRS all interest is treated as operating activities. Following the adoption of SFAS 123(R) in 2006, the cash flow statement reflects excess tax benefits arising on the vesting of share-based payments as financing cash flows. Under IFRS, the excess tax benefits are recorded as operating cash flows.
|
|
|
|
|
| |
| | 2006 | | 2005 | | 2004 | |
| |
|
|
|
|
| |
| | £m | | £m | | £m | |
|
|
|
|
|
| |
| Cash inflows from operating activities | 444.3 | | 473.4 | | 509.6 | |
|
|
|
|
|
| |
| Cash outflows from investing activities | (778.2 | ) | (460.2 | ) | (208.0 | ) |
|
|
|
|
|
| |
| Cash inflows/(outflows) from financing activities | 42.0 | | (407.1 | ) | (350.5 | ) |
|
|
|
|
|
| |
| Decrease in cash and cash equivalents | (291.9 | ) | (393.9 | ) | (48.9 | ) |
|
|
|
|
|
| |
| Effect of foreign exchange rate changes | (24.0 | ) | 82.6 | | (67.4 | ) |
|
|
|
|
|
| |
| Cash and cash equivalents at January 1 | 1,083.0 | | 1,394.3 | | 1,510.6 | |
|
|
|
|
|
| |
| Cash and cash equivalents at December 31 | 767.1 | | 1,083.0 | | 1,394.3 | |
|
|
|
|
|
| |
| | |
| g) | Additional information required by US GAAP in respect of taxation |
|
|
The components of the income tax (charge)/credit on continuing operations are as follows:
|
|
|
|
|
| |
| | 2006 | | 2005 | | 2004 | |
| |
|
|
|
|
| |
| | £m | | £m | | £m | |
|
|
|
|
|
| |
| Current taxes | (77.0 | ) | (27.1 | ) | (41.0 | ) |
|
|
|
|
|
| |
| Deferred taxes | (23.0 | ) | 141.9 | | 80.9 | |
|
|
|
|
|
| |
| | (100.0 | ) | 114.8 | | 39.9 | |
|
|
|
|
|
| |
In addition tax of £2.6m was credited directly to Additional Paid in Capital (APIC) in respect of excess tax benefits arising on the vesting of share-based payments in the year.
The effective tax rate on continuing operations differs from the UK statutory rate for the following reasons:
|
|
|
|
|
| |
| | 2006 | | 2005 | | 2004 | |
| |
|
|
|
|
| |
| | £m | | £m | | £m | |
|
|
|
|
|
| |
| UK statutory rate | (131.0 | ) | (111.6 | ) | 11.0 | |
|
|
|
|
|
| |
| Effect of different statutory tax rates of overseas jurisdictions | 22.0 | | 34.5 | | 15.0 | |
|
|
|
|
|
| |
| Utilisation of losses brought forward, net of excess losses | 20.3 | | 124.1 | | 2.3 | |
|
|
|
|
|
| |
| Effect of current year events on prior period tax balances | 3.2 | | 52.7 | | 33.8 | |
|
|
|
|
|
| |
| Impairment | – | | – | | (82.1 | ) |
|
|
|
|
|
| |
| Benefit from entering into Australian tax consolidation regime | – | | – | | 64.0 | |
|
|
|
|
|
| |
| Other differences | (14.5 | ) | 15.1 | | (4.1 | ) |
|
|
|
|
|
| |
| Total continuing tax (charge)/credit | (100.0 | ) | 114.8 | | 39.9 | |
|
|
|
|
|
| |
| Hanson 2006 www.hanson.biz |
Back to Contents
| | | | |
| | | |
| | | |
| | 117 | |
|
|
|
|
| | | | |
| Notes to the accounts |
| 32 | US accounting informationcontinued |
|
|
| Significant components of the deferred tax liabilities and assets are as follows: |
| | 2006 | | 2005 | | 2004 | |
| |
|
|
|
|
| |
| | £m | | £m | | £m | |
|
|
|
|
|
| |
| Deferred tax liabilities: | | | | | | |
| Property, plant and equipment | (457.9 | ) | (481.1 | ) | (469.4 | ) |
|
|
|
|
|
| |
| Pensions and other post-employment medical plans | – | | (167.5 | ) | (113.0 | ) |
|
|
|
|
|
| |
| Other | (14.5 | ) | (1.5 | ) | (78.5 | ) |
|
|
|
|
|
| |
| Total deferred tax liabilities | (472.4 | ) | (650.1 | ) | (660.9 | ) |
|
|
|
|
|
| |
| Deferred tax assets: | | | | | | |
| Asbestos | 82.2 | | 116.7 | | 87.9 | |
|
|
|
|
|
| |
| Pensions and other post-employment medical plans | 36.7 | | – | | – | |
|
|
|
|
|
| |
| Losses | 300.0 | | 190.2 | | 108.0 | |
|
|
|
|
|
| |
| Other | 106.9 | | 175.6 | | 137.2 | |
|
|
|
|
|
| |
| Valuation allowances | (228.6 | ) | (75.4 | ) | (108.0 | ) |
|
|
|
|
|
| |
| Total deferred tax assets | 297.2 | | 407.1 | | 225.1 | |
|
|
|
|
|
| |
| Net deferred tax liabilities | (175.2 | ) | (243.0 | ) | (435.8 | ) |
|
|
|
|
|
| |
The group has provisions for taxes that may become payable in future periods as a result of tax audits. It is the group’s policy to establish provisions for taxes that may become payable in future years as a result of an examination by tax authorities. The tax provisions are analysed at each balance sheet date and adjustments are made as events occur to warrant adjustment to the provisions. At any given time, the group is undergoing tax audits in several tax jurisdictions and covering multiple years. The provisions for taxes at December 31, 2006 were £93.5m (£103.0m, £108.5m) . The decrease is due to revisions to the best reasonable estimate of the tax exposures, cash paid on certain audits and foreign exchange movement on non UK provisions.
The group has not provided deferred tax liabilities related to differences of its overseas subsidiaries and joint-ventures under Accounting Principles Board Opinion (APB) 23, “Accounting for Income Taxes – Special Areas” as it is the group’s policy to permanently reinvest such earnings. Quantifying the amount of undistributed earnings and deferred tax liabilities is not practical.
“FASB Staff Position No 109-2” Accounting and Disclosure Guidance for the Foreign Earnings Repatriation Provision within the American Jobs Creation Act of 2004”, provides guidance under FASB Statement No. 109, “Accounting for Income Taxes,” with respect to recording any potential impact of the repatriation provisions of the American Jobs Creation Act of 2004. Hanson has determined that the benefits are immaterial to the financial statements at December 31, 2005.
| h) | Additional information required by US GAAP in respect of pensions and other post-employment medical plans |
|
|
A summary of the components of net periodic pension cost for Hanson’s pension plans is as follows:
|
|
|
|
|
| |
| | 2006 | | 2005 | | 2004 | |
| |
|
|
|
|
| |
| | £m | | £m | | £m | |
|
|
|
|
|
| |
| Defined benefit plans | 42.8 | | 52.5 | | 39.4 | |
|
|
|
|
|
| |
| Defined contribution plans | 15.5 | | 12.1 | | 7.6 | |
|
|
|
|
|
| |
| Multi-employer plans | 5.7 | | 3.8 | | 3.8 | |
|
|
|
|
|
| |
| Total pension expense under US GAAP | 64.0 | | 68.4 | | 50.8 | |
|
|
|
|
|
| |
The group has adopted SFAS 158 for pension and other post-employment medical plans reporting under US GAAP on December 31, 2006. The impact of adoption on the balance sheet line items is as follows:
|
|
|
|
|
| |
| | Before adoption | | | | After adoption | |
| | of SFAS 158 | | Adjustments | | of SFAS 158 | |
| |
|
|
|
|
| |
| Incremental effect of applying SFAS 158 on individual line items in the balance sheet at December 31, 2006 | £m | | £m | | £m | |
|
|
|
|
|
| |
| Pension surplus | 487.1 | | (468.8 | ) | 18.3 | |
|
|
|
|
|
| |
| Total assets | 7,313.3 | | (468.8 | ) | 6,844.5 | |
|
|
|
|
|
| |
| Pension deficit | (122.1 | ) | 14.0 | | (108.1 | ) |
|
|
|
|
|
| |
| Total liability | (4,077.0 | ) | 14.0 | | (4,063.0 | ) |
|
|
|
|
|
| |
| Deferred taxation | (326.0 | ) | 150.8 | | (175.2 | ) |
|
|
|
|
|
| |
| Accumulated other comprehensive income | – | | (304.0 | ) | (304.0 | ) |
|
|
|
|
|
| |
| Total equity | (2,477.5 | ) | (304.0 | ) | (2,781.5 | ) |
|
|
|
|
|
| |
Back to Contents
Notes to the accounts continued
for the 12 months ended December 31, 2006
| 32 | US accounting informationcontinued |
|
|
The net periodic pension costs for Hanson’s main pension and post-employment medical plans in the UK and US are as follows:
|
|
|
|
|
|
|
|
|
|
|
|
|
|
|
|
|
| |
| | 2006 | | 2006 | | 2006 | | 2005 | | 2005 | | 2005 | | 2004 | | 2004 | | 2004 | |
| |
|
|
|
|
|
|
|
|
|
|
|
|
|
|
|
|
| |
| | | | | | Post- | | | | | | Post- | | | | | | Post- | |
| | | | | | employment | | | | | | employment | | | | | | employment | |
| | | | | | medical | | | | | | medical | | | | | | medical | |
| | UK pensions | | US pensions | | plans | | UK pensions | | US pensions | | plans | | UK pensions | | US pensions | | plans | |
| |
|
|
|
|
|
|
|
|
|
|
|
|
|
|
|
|
| |
| | £m | | £m | | £m | | £m | | £m | | £m | | £m | | £m | | £m | |
|
|
|
|
|
|
|
|
|
|
|
|
|
|
|
|
|
| |
| Service cost | 22.7 | | 8.8 | | 0.7 | | 19.5 | | 10.2 | | 1.1 | | 26.9 | | 9.1 | | 3.7 | |
|
|
|
|
|
|
|
|
|
|
|
|
|
|
|
|
|
| |
| Interest cost | 65.3 | | 30.0 | | 5.1 | | 66.4 | | 31.1 | | 5.4 | | 63.8 | | 31.0 | | 4.3 | |
|
|
|
|
|
|
|
|
|
|
|
|
|
|
|
|
|
| |
| Expected return on plan assets | (78.0 | ) | (34.5 | ) | – | | (71.1 | ) | (36.2 | ) | – | | (67.5 | ) | (39.8 | ) | – | |
|
|
|
|
|
|
|
|
|
|
|
|
|
|
|
|
|
| |
| Amortisation of transition assets | – | | – | | – | | – | | – | | – | | (12.0 | ) | – | | – | |
|
|
|
|
|
|
|
|
|
|
|
|
|
|
|
|
|
| |
| Recognised prior service cost/(income) | 2.1 | | 0.4 | | (0.8 | ) | 2.1 | | 0.4 | | (0.8 | ) | 2.1 | | 0.4 | | (0.6 | ) |
|
|
|
|
|
|
|
|
|
|
|
|
|
|
|
|
|
| |
| Recognised net actuarial loss/(gain) | 12.2 | | 12.6 | | – | | 16.9 | | 12.4 | | 0.1 | | 16.1 | | 7.2 | | (2.9 | ) |
|
|
|
|
|
|
|
|
|
|
|
|
|
|
|
|
|
| |
| Net periodic benefit cost | 24.3 | | 17.3 | | 5.0 | | 33.8 | | 17.9 | | 5.8 | | 29.4 | | 7.9 | | 4.5 | |
|
|
|
|
|
|
|
|
|
|
|
|
|
|
|
|
|
| |
The following information shows the items that would be disclosed under US GAAP for Hanson’s main pension and post-employment medical plans in the UK and USA:
|
|
|
|
|
|
|
|
|
|
|
|
|
|
|
|
|
| |
| | 2006 | | 2006 | | 2006 | | 2005 | | 2005 | | 2005 | | 2004 | | 2004 | | 2004 | |
| |
|
|
|
|
|
|
|
|
|
|
|
|
|
|
|
|
| |
| | | | | | Post- | | | | | | Post- | | | | | | Post- | |
| | | | | | employment | | | | | | employment | | | | | | employment | |
| | | | | | medical | | | | | | medical | | | | | | medical | |
| | UK pensions | | US pensions | | plans | | UK pensions | | US pensions | | plans | | UK pensions | | US pensions | | plans | |
| |
|
|
|
|
|
|
|
|
|
|
|
|
|
|
|
|
| |
| | £m | | £m | | £m | | £m | | £m | | £m | | £m | | £m | | £m | |
|
|
|
|
|
|
|
|
|
|
|
|
|
|
|
|
|
| |
| Changes in plan obligations: | | | | | | | | | | | | | | | | | | |
| Benefit obligation at beginning of year | (1,380.9 | ) | (597.9 | ) | (103.3 | ) | (1,246.7 | ) | (515.3 | ) | (80.4 | ) | (1,188.0 | ) | (525.9 | ) | (87.9 | ) |
|
|
|
|
|
|
|
|
|
|
|
|
|
|
|
|
|
| |
| Service cost | (22.7 | ) | (8.8 | ) | (0.7 | ) | (19.5 | ) | (10.2 | ) | (1.1 | ) | (26.9 | ) | (9.1 | ) | (3.7 | ) |
|
|
|
|
|
|
|
|
|
|
|
|
|
|
|
|
|
| |
| Interest cost | (65.3 | ) | (30.0 | ) | (5.1 | ) | (66.4 | ) | (31.1 | ) | (5.4 | ) | (63.8 | ) | (31.0 | ) | (4.3 | ) |
|
|
|
|
|
|
|
|
|
|
|
|
|
|
|
|
|
| |
| Plan participants’ contributions | (5.7 | ) | – | | – | | (5.8 | ) | – | | – | | (6.9 | ) | – | | – | |
|
|
|
|
|
|
|
|
|
|
|
|
|
|
|
|
|
| |
| Actuarial (loss)/gain | (43.4 | ) | 0.1 | | 10.3 | | (82.5 | ) | (14.5 | ) | (15.8 | ) | (7.2 | ) | (24.7 | ) | (2.6 | ) |
|
|
|
|
|
|
|
|
|
|
|
|
|
|
|
|
|
| |
| Benefits paid | 58.2 | | 36.6 | | 10.4 | | 51.5 | | 35.9 | | 9.0 | | 46.1 | | 35.6 | | 8.5 | |
|
|
|
|
|
|
|
|
|
|
|
|
|
|
|
|
|
| |
| Plan amendments | – | | – | | – | | – | | (0.5 | ) | 0.3 | | – | | – | | 3.8 | |
|
|
|
|
|
|
|
|
|
|
|
|
|
|
|
|
|
| |
| Liabilities assumed in a business | | | | | | | | | | | | | | | | | | |
| combination | (21.6 | ) | – | | (0.3 | ) | (11.5 | ) | – | | – | | – | | – | | – | |
|
|
|
|
|
|
|
|
|
|
|
|
|
|
|
|
|
| |
| Exchange movements | – | | 73.5 | | 11.3 | | – | | (62.2 | ) | (9.9 | ) | – | | 39.8 | | 5.8 | |
|
|
|
|
|
|
|
|
|
|
|
|
|
|
|
|
|
| |
| Benefit obligation at end of year | (1,481.4 | ) | (526.5 | ) | (77.4 | ) | (1,380.9 | ) | (597.9 | ) | (103.3 | ) | (1,246.7 | ) | (515.3 | ) | (80.4 | ) |
|
|
|
|
|
|
|
|
|
|
|
|
|
|
|
|
|
| |
| Changes in plan assets: | | | | | | | | | | | | | | | | | | |
| Fair value of plan assets at beginning of | | | | | | | | | | | | | | | | | | |
| year | 1,396.8 | | 569.3 | | – | | 1,217.8 | | 499.7 | | – | | 1,150.8 | | 514.7 | | – | |
|
|
|
|
|
|
|
|
|
|
|
|
|
|
|
|
|
| |
| Actual return on plan assets | 85.9 | | 38.1 | | – | | 185.9 | | 32.4 | | – | | 72.4 | | 49.5 | | – | |
|
|
|
|
|
|
|
|
|
|
|
|
|
|
|
|
|
| |
| Employer contributions | 40.4 | | 11.1 | | 10.4 | | 28.2 | | 13.4 | | 9.0 | | 33.8 | | 10.1 | | 8.5 | |
|
|
|
|
|
|
|
|
|
|
|
|
|
|
|
|
|
| |
| Plan participants’ contributions | 5.7 | | – | | – | | 5.8 | | – | | – | | 6.9 | | – | | – | |
|
|
|
|
|
|
|
|
|
|
|
|
|
|
|
|
|
| |
| Benefits paid | (58.2 | ) | (36.6 | ) | (10.4 | ) | (51.5 | ) | (35.9 | ) | (9.0 | ) | (46.1 | ) | (35.6 | ) | (8.5 | ) |
|
|
|
|
|
|
|
|
|
|
|
|
|
|
|
|
|
| |
| Assets acquired in a business | | | | | | | | | | | | | | | | | | |
| combinations | 17.4 | | – | | – | | 10.6 | | – | | – | | – | | – | | – | |
|
|
|
|
|
|
|
|
|
|
|
|
|
|
|
|
|
| |
| Exchange movements | – | | (70.7 | ) | – | | – | | 59.7 | | – | | – | | (39.0 | ) | – | |
|
|
|
|
|
|
|
|
|
|
|
|
|
|
|
|
|
| |
| Fair value of plan assets at end of | | | | | | | | | | | | | | | | | | |
| year | 1,488.0 | | 511.2 | | – | | 1,396.8 | | 569.3 | | – | | 1,217.8 | | 499.7 | | – | |
|
|
|
|
|
|
|
|
|
|
|
|
|
|
|
|
|
| |
| Funded status: | | | | | | | | | | | | | | | | | | |
| Funded status of plans at December 31 | 6.6 | | (15.3 | ) | (77.4 | ) | 15.9 | | (28.6 | ) | (103.3 | ) | (28.9 | ) | (15.6 | ) | (80.4 | ) |
|
|
|
|
|
|
|
|
|
|
|
|
|
|
|
|
|
| |
| Unrecognised prior service cost/(income) | – | | – | | – | | 8.8 | | 2.8 | | (8.1 | ) | 10.9 | | 2.4 | | (7.6 | ) |
|
|
|
|
|
|
|
|
|
|
|
|
|
|
|
|
|
| |
| Unrecognised net actuarial loss/(gain) | – | | – | | – | | 266.1 | | 209.2 | | 6.8 | | 314.4 | | 181.4 | | (8.9 | ) |
|
|
|
|
|
|
|
|
|
|
|
|
|
|
|
|
|
| |
| Net amount recognised | 6.6 | | (15.3 | ) | (77.4 | ) | 290.8 | | 183.4 | | (104.6 | ) | 296.4 | | 168.2 | | (96.9 | ) |
|
|
|
|
|
|
|
|
|
|
|
|
|
|
|
|
|
| |
| | | | | | | | | | | | | | | | | | | |
| | 2006 | | 2006 | | 2006 | |
| |
|
|
|
|
| |
| | | | | | Post- | |
| | | | | | employment | |
| | | | | | medical | |
| | UK pensions | | US pensions | | plans | |
| |
|
|
|
|
| |
| | £m | | £m | | £m | |
|
|
|
|
|
| |
| Amounts recognised in the balance sheet for the main pension and post-employment | | | | | | |
| medical plans in the UK and US after the adoption of SFAS 158: | | | | | | |
| Non-current assets | 17.6 | | 0.7 | | – | |
|
|
|
|
|
| |
| Non-current liabilities | (11.0 | ) | (16.0 | ) | (77.4 | ) |
|
|
|
|
|
| |
| Net amount recognised | 6.6 | | (15.3 | ) | (77.4 | ) |
|
|
|
|
|
| |
| Hanson 2006 www.hanson.biz |
Back to Contents
| | | | |
| | | |
| | | |
| | 119 | |
|
|
|
|
| | | | |
| Notes to the accounts |
| 32 | US accounting informationcontinued |
|
|
| Amounts recognised in accumulated other comprehensive income consist of: |
|
| | 2006 | | 2006 | | 2006 | | 2005 | | 2005 | | 2005 | | 2004 | | 2004 | | 2004 | |
| |
|
|
|
|
|
|
|
|
|
|
|
|
|
|
|
|
| |
| | | | | | Post- | | | | | | Post- | | | | | | Post- | |
| | | | | | employment | | | | | | employment | | | | | | employment | |
| | | | | | medical | | | | | | medical | | | | | | medical | |
| | UK pensions | | US pensions | | plans | | UK pensions | | US pensions | | plans | | UK pensions | | US pensions | | plans | |
| |
|
|
|
|
|
|
|
|
|
|
|
|
|
|
|
|
| |
| | £m | | £m | | £m | | £m | | £m | | £m | | £m | | £m | | £m | |
|
|
|
|
|
|
|
|
|
|
|
|
|
|
|
|
|
| |
| Accumulated other comprehensive | | | | | | | | | | | | | | | | | | |
| income at December 31 before | | | | | | | | | | | | | | | | | | |
| adoption of funded status recognition of | | | | | | | | | | | | | | | | | | |
| SFAS 158 | – | | – | | – | | – | | 2.3 | | – | | – | | 6.9 | | – | |
|
|
|
|
|
|
|
|
|
|
|
|
|
|
|
|
|
| |
| Prior service cost/(credit) | 6.7 | | 2.1 | | (6.3 | ) | – | | – | | – | | – | | – | | – | |
|
|
|
|
|
|
|
|
|
|
|
|
|
|
|
|
|
| |
| Net loss/(gain) | 289.5 | | 168.1 | | (3.6 | ) | – | | – | | – | | – | | – | | – | |
|
|
|
|
|
|
|
|
|
|
|
|
|
|
|
|
|
| |
| Accumulated other comprehensive | | | | | | | | | | | | | | | | | | |
| income (AOCI) | 296.2 | | 170.2 | | (9.9 | ) | – | | 2.3 | | – | | – | | 6.9 | | – | |
|
|
|
|
|
|
|
|
|
|
|
|
|
|
|
|
|
| |
Changes recognised in other comprehensive income:
|
|
|
|
|
| |
| | 2006 | | 2006 | | 2006 | |
| |
|
|
|
|
| |
| | | | | | Post- | |
| | | | | | employment | |
| | | | | | medical | |
| | UK pensions | | US pensions | | plans | |
| |
|
|
|
|
| |
| | £m | | £m | | £m | |
|
|
|
|
|
| |
| Changes due to minimum liability and intangible asset recognition prior to adoption of SFAS 158: | | | | | | |
| Increase/(decrease) in additional minimum liability | – | | 3.5 | | – | |
|
|
|
|
|
| |
| Increase in intangible asset | – | | (1.0 | ) | – | |
|
|
|
|
|
| |
| Other comprehensive loss/(income) | – | | 2.5 | | – | |
|
|
|
|
|
| |
| Adjustment (before tax) to ending AOCI to reflect the adoption of SFAS 158 | 296.2 | | 167.7 | | (9.9 | ) |
|
|
|
|
|
| |
| Accumulated other comprehensive income | 296.2 | | 170.2 | | (9.9 | ) |
|
|
|
|
|
| |
Changes in plan assets and benefit obligations recognised in other comprehensive income:
|
|
|
|
|
| |
| | 2006 | | 2006 | | 2006 | |
| |
|
|
|
|
| |
| | | | | | Post- | |
| | | | | | employment | |
| | | | | | medical | |
| | UK pensions | | US pensions | | plans | |
| |
|
|
|
|
| |
| | £m | | £m | | £m | |
|
|
|
|
|
| |
| Net periodic benefit cost | 24.3 | | 17.3 | | 5.0 | |
|
|
|
|
|
| |
| Other comprehensive (loss)/income | – | | 2.5 | | – | |
|
|
|
|
|
| |
| Total recognised in net period benefit and other comprehensive income | 24.3 | | 19.8 | | 5.0 | |
|
|
|
|
|
| |
Estimated amounts that will be amortised from accumulated other comprehensive income over the next fiscal year:
|
|
|
|
|
| |
| | 2006 | | 2006 | | 2006 | |
| |
|
|
|
|
| |
| | | | | | Post- | |
| | | | | | employment | |
| | | | | | medical | |
| | UK pensions | | US pensions | | plans | |
| |
|
|
|
|
| |
| | £m | | £m | | £m | |
|
|
|
|
|
| |
| Prior service (credit)/cost | (2.1 | ) | (0.3 | ) | 0.7 | |
|
|
|
|
|
| |
| Net actuarial gain | (12.0 | ) | (11.5 | ) | – | |
|
|
|
|
|
| |
| Total estimated amortisation (gain)/loss in AOCI | (14.1 | ) | (11.8 | ) | 0.7 | |
|
|
|
|
|
| |
The accumulated benefit obligation for defined benefit pension plans was £1,888.6m (£1,850m, £1,617.4m) at December 31. The projected benefit obligation, accumulated benefit obligation and fair value of plan assets for the plans with accumulated benefit obligations in excess of plan assets were £18.8m (£31.8m, £18.5m), £16.4m (£30.6m, £18.2m) and £4.0m (£16.5m, £15.6m) .
Back to Contents
Notes to the accounts continued
for the 12 months ended December 31, 2006
| 32 | US accounting information continued |
|
|
| The following benefit payments, which reflect future service, as appropriate, are expected to be paid: | |
|
|
|
|
|
|
|
| | | | | | Post- | |
| | | | | | employment | |
| | Pensions | | Pensions | | medical | |
| | UK | | US | | plans | |
| |
|
|
|
|
| |
| | £m | | £m | | £m | |
|
|
|
|
|
| |
| 2007 | 59.9 | | 34.9 | | 8.6 | |
|
|
|
|
|
| |
| 2008 | 62.2 | | 34.9 | | 8.6 | |
|
|
|
|
|
| |
| 2009 | 64.7 | | 35.1 | | 8.6 | |
|
|
|
|
|
| |
| 2010 | 67.2 | | 35.3 | | 8.5 | |
|
|
|
|
|
| |
| 2011 | 69.9 | | 35.1 | | 7.5 | |
|
|
|
|
|
| |
| 2012-2016 | 392.9 | | 187.5 | | 33.3 | |
|
|
|
|
|
| |
The US plans’ assets are primarily included in the Hanson Building Materials America Inc. Pension Trust (“Trust“), which invests in listed stocks and bonds. At December 31, 2006, 2005 and 2004 the Trust had no investment in Hanson ordinary shares.
Within the UK, the fund assets are dealt with by several directly invested funds for the periods ended December 31, 2006, 2005 and 2004 where funds did not invest in the shares of the Company.
| i) | Additional information required by US GAAP in respect of accounting for the impairment of fixed assets and for fixed assets to be disposed of |
|
| A summary of the impairment charges that have been recognised under US GAAP is as follows: |
|
|
|
|
|
|
|
| | 2006 | | 2005 | | 2004 | |
| |
|
|
|
|
| |
| | £m | | £m | | £m | |
|
|
|
|
|
| |
| Assets to be disposed of | – | | – | | – | |
|
|
|
|
|
| |
| Assets to be held and used | 4.3 | | 8.1 | | 372.2 | |
|
|
|
|
|
| |
| | 4.3 | | 8.1 | | 372.2 | |
|
|
|
|
|
| |
| Disclosed as: | | | | | | |
| Impairment charges recognised under IFRS: | | | | | | |
| Operating impairment charges | 4.3 | | 23.6 | | 29.8 | |
|
|
|
|
|
| |
| Discontinued operations’ impairments | – | | – | | 21.9 | |
|
|
|
|
|
| |
| Operating impairment reversals | (0.2 | ) | (19.6 | ) | (0.5 | ) |
|
|
|
|
|
| |
| Charge for the year under IFRS | 4.1 | | 4.0 | | 51.2 | |
|
|
|
|
|
| |
| Less: Adjustment to goodwill impairment recognised under US GAAP | – | | (15.5 | ) | 321.0 | |
|
|
|
|
|
| |
| Plus: Adjustment to property, plant and equipment impairment under US GAAP | 0.2 | | 19.6 | | – | |
|
|
|
|
|
| |
| Total charge under US GAAP | 4.3 | | 8.1 | | 372.2 | |
|
|
|
|
|
| |
| Charged against: | | | | | | |
| Intangible assets – goodwill | – | | 2.1 | | 324.8 | |
|
|
|
|
|
| |
| Property, plant and equipment | 4.2 | | 5.9 | | 25.4 | |
|
|
|
|
|
| |
| Investment in joint-ventures | – | | – | | 20.5 | |
|
|
|
|
|
| |
| Other assets | 0.1 | | 0.1 | | 1.5 | |
|
|
|
|
|
| |
| | 4.3 | | 8.1 | | 372.2 | |
|
|
|
|
|
| |
| Hanson 2006 www.hanson.biz |
Back to Contents
| | | | |
| | | |
| | | |
| | 121 | |
|
|
|
|
| | | | |
| Notes to the accounts |
| 32 | US accounting information continued |
|
|
In 2006, £0.2m of impairment charges against property, plant and equipment at individual sites within UK Aggregates have been reversed. Under US GAAP the reversal of such impairments is not permitted.
In 2005, previously recognised impairment charges against property, plant and equipment in North America of £19.6m have been reversed. The reversal of such impairments is not permitted under US GAAP. In addition, an impairment of goodwill of £17.6m has been recognised under IFRS. Under US GAAP, £15.5m of this impairment has been recognised previously and therefore the IFRS impairment has been reversed.
Of the amounts charged as impairments in 2004 under IFRS, £nil had been charged in prior years as amortisation under US GAAP or previously impaired under IFRS, and is therefore shown as a reduction in the difference between the charge under IFRS and US GAAP. The operating impairment charge of £29.3m in 2004 under IFRS relates to various operations within North America, the UK and Asia Pacific, where it has been necessary to make an impairment provision for the difference in these operations’ carrying values compared with the higher of their value in use or net realisable value.
| j) | Additional information required by US GAAP in respect of accounting for intangible assets subject to amortisation |
|
| Other intangible assets subject to amortisation primarily consisting of purchase options, order backlogs and non-compete agreements capitalised since 2003, that have a cost of £33.5m (£35.0m, £12.9m) and an accumulated amortisation charge of £5.6m (£5.5m, £3.4m) . The estimated aggregate amortisation expense for each of the next five years is £3.1m, £2.7m, £2.7m, £2.5m and £2.0m. |
| |
| k) | Additional information required by US GAAP in regards to goodwill |
|
| An analysis of goodwill of group companies by reporting segment is given below: |
|
| | | | North America | | | | | | | | | | | | | |
| | North America | | Building | | | | UK Building | | | | | | Continental | | | |
| | Aggregates | | Products | | UK Aggregates | | Products | | Australia | | Asia Pacific | | Europe | | Total | |
| |
|
|
|
|
|
|
|
|
|
|
|
|
|
|
| |
| | £m | | £m | | £m | | £m | | £m | | £m | | £m | | £m | |
|
|
|
|
|
|
|
|
|
|
|
|
|
|
|
| |
| As at January 1, 2004 | 144.2 | | 265.2 | | 308.9 | | 36.0 | | 206.1 | | 61.7 | | 19.5 | | 1,041.6 | |
|
|
|
|
|
|
|
|
|
|
|
|
|
|
|
| |
| Currency retranslation | (16.0 | ) | (12.1 | ) | – | | – | | 3.3 | | (7.6 | ) | 3.8 | | (28.6 | ) |
|
|
|
|
|
|
|
|
|
|
|
|
|
|
|
| |
| Impairments | – | | – | | (320.8 | ) | – | | – | | (4.0 | ) | – | | (324.8 | ) |
|
|
|
|
|
|
|
|
|
|
|
|
|
|
|
| |
| Reallocations | (12.9 | ) | – | | – | | – | | 3.0 | | – | | – | | (9.9 | ) |
|
|
|
|
|
|
|
|
|
|
|
|
|
|
|
| |
| Acquisitions | 0.3 | | 21.3 | | 12.6 | | 1.1 | | 0.5 | | 0.1 | | – | | 35.9 | |
|
|
|
|
|
|
|
|
|
|
|
|
|
|
|
| |
| Disposals | (1.6 | ) | – | | (0.7 | ) | – | | – | | (37.9 | ) | – | | (40.2 | ) |
|
|
|
|
|
|
|
|
|
|
|
|
|
|
|
| |
| At December 31, 2004 | 114.0 | | 274.4 | | – | | 37.1 | | 212.9 | | 12.3 | | 23.3 | | 674.0 | |
|
|
|
|
|
|
|
|
|
|
|
|
|
|
|
| |
| Currency retranslation | 23.6 | | 29.5 | | – | | – | | 7.7 | | 2.3 | | (1.4 | ) | 61.7 | |
|
|
|
|
|
|
|
|
|
|
|
|
|
|
|
| |
| Impairments | (1.6 | ) | – | | – | | – | | – | | – | | (0.5 | ) | (2.1 | ) |
|
|
|
|
|
|
|
|
|
|
|
|
|
|
|
| |
| Reallocations | – | | – | | – | | – | | (10.0 | ) | – | | (17.0 | ) | (27.0 | ) |
|
|
|
|
|
|
|
|
|
|
|
|
|
|
|
| |
| Acquisitions | 34.0 | | 42.4 | | – | | 111.9 | | 1.5 | | – | | 0.3 | | 190.1 | |
|
|
|
|
|
|
|
|
|
|
|
|
|
|
|
| |
| Disposals | (4.6 | ) | – | | – | | (0.5 | ) | – | | – | | (3.9 | ) | (9.0 | ) |
|
|
|
|
|
|
|
|
|
|
|
|
|
|
|
| |
| At December 31, 2005 | 165.4 | | 346.3 | | – | | 148.5 | | 212.1 | | 14.6 | | 0.8 | | 887.7 | |
|
|
|
|
|
|
|
|
|
|
|
|
|
|
|
| |
| Currency retranslation | (32.5 | ) | (35.7 | ) | – | | – | | (10.6 | ) | (1.3 | ) | (0.5 | ) | (80.6 | ) |
|
|
|
|
|
|
|
|
|
|
|
|
|
|
|
| |
| Acquisitions | 50.6 | | 41.0 | | 157.6 | | 16.5 | | – | | – | | 19.6 | | 285.3 | |
|
|
|
|
|
|
|
|
|
|
|
|
|
|
|
| |
| At December 31, 2006 | 183.5 | | 351.6 | | 157.6 | | 165.0 | | 201.5 | | 13.3 | | 19.9 | | 1,092.4 | |
|
|
|
|
|
|
|
|
|
|
|
|
|
|
|
| |
| | | | | | | | | | | | | | | | | |
| l) | Additional information required by US GAAP in regards to share-based payments |
|
| Hanson has various share-based payment transactions under the Long Term Incentive Plan, Share Option Plan and Sharesave Scheme. A description of the plans is included in note 5 in the Notes to the accounts and where applicable in the Remuneration Report. The fair value of options granted and the fair value of options vested in the years ended 2006, 2005 and 2004 are as follows: |
|
|
|
|
|
|
|
| | Long Term | | Sharesave | | Share Option | |
| | Incentive Plan | | Scheme | | Plan | |
| |
|
|
|
|
| |
| Fair value of options granted during the years ended: | pence | | pence | | pence | |
|
|
|
|
|
| |
| December 31, 2006 | 501.5 | | 181.5 | | – | |
|
|
|
|
|
| |
| December 31, 2005 | 307.7 | | 133.7 | | 76.2 | |
|
|
|
|
|
| |
| December 31, 2004 | – | | 116.1 | | 81.5 | |
|
|
|
|
|
| |
| | | | | | | |
|
|
|
|
|
|
|
| | Long Term | | Sharesave | | Share Option | |
| | Incentive Plan | | Scheme | | Plan | |
| |
|
|
|
|
| |
| Total fair value of options vested during the years ended: | £m | | £m | | £m | |
|
|
|
|
|
| |
| December 31, 2006 | 10.8 | | 0.3 | | 0.6 | |
|
|
|
|
|
| |
| December 31, 2005 | 3.1 | | 1.4 | | 0.6 | |
|
|
|
|
|
| |
| December 31, 2004 | 4.5 | | 0.7 | | – | |
|
|
|
|
|
| |
In 2004 and 2003, the group applied historical volatility as its basis to estimate expected volatility for the proforma disclosure required by SFAS 123. In light of guidance provided by IFRS and in conjunction with external advisors, the group has re-evaluated its process for estimating volatility in 2005 resulting in volatility assumptions which are more reflective of market conditions. This process has been applied prospectively for SFAS 123 reporting purposes in 2005. The changes did not have a material impact on the group’s proforma net income or related per share amounts.
In 2006, the group adopted SFAS 123 (Revised) “Share-based payments” (SFAS 123R) using the modified prospective method. The impact of changing from the intrinsic value method under APB 25 “Accounting for stock issued to employees” to the fair value method under SFAS 123(R) in 2006 is to increase income before taxes and net income by £14.7m and £9.7m respectively. The impact on both basic and diluted earnings per share in 2006 is 1.4p per share.
Back to Contents
Notes to the accounts continued
for the 12 months ended December 31, 2006
| 32 | US accounting information continued |
|
|
| The intrinsic value method of APB 25, as permitted under SFAS 123, continues to be applied to periods prior to January 1, 2006 and as a result the group continues to provide proforma disclosure of the impact of applying SFAS 123 in prior periods as follows: |
| | | | | |
|
|
|
|
|
| | 2005 | | 2004 | |
| |
|
|
| |
| | £m | | £m | |
|
|
|
| |
| Net income/(loss) as adjusted to accord with US GAAP | 463.7 | | (26.9 | ) |
|
|
|
| |
| Add back: Compensation expense under APB 25 | 18.8 | | 7.0 | |
|
|
|
| |
| Deduct: Proforma SFAS 123 charge | (8.4 | ) | (8.0 | ) |
|
|
|
| |
| Proforma net income/(loss) | 474.1 | | (27.9 | ) |
|
|
|
| |
The proforma disclosure of the impact of applying SFAS 123 in prior periods on earnings per share is as follows:
|
|
|
|
|
|
|
|
|
| | 2005 | | 2005 | | 2004 | | 2004 | |
| | Per share | | Per ADS | | Per share | | Per ADS | |
| |
|
|
|
|
|
|
| |
| | pence | | pence | | pence | | pence | |
|
|
|
|
|
|
|
| |
| Basic | | | | | | | | |
| Net income/(loss) as adjusted to accord with US GAAP | 63.7 | | 318.3 | | (3.6 | ) | (18.3 | ) |
|
|
|
|
|
|
|
| |
| Add back: Compensation expense under APB 25 | 2.5 | | 12.9 | | 0.9 | | 4.8 | |
|
|
|
|
|
|
|
| |
| Deduct: Proforma SFAS 123 charge | (1.1 | ) | (5.7 | ) | (1.1 | ) | (5.4 | ) |
|
|
|
|
|
|
|
| |
| Proforma net income/(loss) | 65.1 | | 325.5 | | (3.8 | ) | (18.9 | ) |
|
|
|
|
|
|
|
| |
| Diluted | | | | | | | | |
| Net income/(loss) as adjusted to accord with US GAAP | 63.0 | | 315.1 | | (3.6 | ) | (18.1 | ) |
|
|
|
|
|
|
|
| |
| Add back: Compensation expense under APB 25 | 2.5 | | 12.8 | | 0.9 | | 4.7 | |
|
|
|
|
|
|
|
| |
| Deduct: Proforma SFAS 123 charge | (1.1 | ) | (5.7 | ) | (1.1 | ) | (5.4 | ) |
|
|
|
|
|
|
|
| |
| Proforma net income/(loss) | 64.4 | | 322.2 | | (3.8 | ) | (18.8 | ) |
|
|
|
|
|
|
|
| |
| | | | | | | | | |
| m) | Additional information required by US GAAP in regards to movement in valuation allowances |
|
|
|
|
|
|
|
|
|
|
|
| | Balance at | | | | | | | | Balance at | |
| | January 1 | | Exchange | | Additions# | | Deductions* | | December 31 | |
| |
|
|
|
|
|
|
|
|
| |
| Provision for doubtful debts | £m | | £m | | £m | | £m | | £m | |
|
|
|
|
|
|
|
|
|
| |
| 2004 | 31.5 | | (2.0 | ) | 14.6 | | (11.7 | ) | 32.4 | |
|
|
|
|
|
|
|
|
|
| |
| 2005 | 32.4 | | 1.9 | | 6.7 | | (11.1 | ) | 29.9 | |
|
|
|
|
|
|
|
|
|
| |
| 2006 | 29.9 | | (1.5 | ) | 7.7 | | (10.7 | ) | 25.4 | |
|
|
|
|
|
|
|
|
|
| |
| #Includes balances acquired through business combinations and amounts charged to costs and overheads |
| *Includes balances disposed of with subsidiaries and the excess of amounts written off, over recoveries |
Provisions for doubtful debts are recorded based on management’s assessment of prior experience and knowledge of the customer and local economic conditions.
| n) | Additional information required by US GAAP in respect of listed securities |
|
| Hanson has unconditionally guaranteed the listed debt securities of Hanson Australia Funding Limited which is a 100% owned finance subsidiary of Hanson. The financial statements of this subsidiary are not appended to this document, in accordance with Rule 3-10(b) of Regulations S-X, as Hanson’s consolidated financial statements are contained within the Annual Report and Form 20-F. |
Hanson does not believe that at the current time there are any significant restrictions on the ability of the above mentioned finance subsidiary to make its funds available to other group companies.
| o) | Remuneration of auditors |
| |
|
|
|
|
|
|
| | 2006 | | 2005 | | 2004 | |
| |
|
|
|
|
| |
| | £m | | £m | | £m | |
|
|
|
|
|
| |
| Audit fees: | | | | | | |
| Group audit and subsidiary statutory audits | 4.0 | | 4.2 | | 4.4 | |
|
|
|
|
|
| |
| Other regulatory reporting | – | | 0.2 | | 0.2 | |
|
|
|
|
|
| |
| | 4.0 | | 4.4 | | 4.6 | |
| |
|
|
|
|
| |
| Non-audit fees: | | | | | | |
| Audit related fees | 0.1 | | 0.5 | | 0.7 | |
|
|
|
|
|
| |
| Tax fees | 0.3 | | 0.2 | | 0.9 | |
|
|
|
|
|
| |
| | 0.4 | | 0.7 | | 1.6 | |
| |
|
|
|
|
| |
| Total payments to auditors | 4.4 | | 5.1 | | 6.2 | |
|
|
|
|
|
| |
| Hanson 2006 www.hanson.biz |
Back to Contents
| | | | |
| | | |
| | | |
| 123 | |
|
|
|
|
| | | | |
| IFRS selected financial data |
IFRS selected financial data
Summary Income statement
|
|
|
|
|
|
|
| | 2006 | | 2005 | | 2004 | |
| |
|
|
|
|
| |
| | £m | | £m | | £m | |
|
|
|
|
|
| |
| Continuing operations: | | | | | | |
| Group turnover | | | | | | |
| North America | | | | | | |
| Aggregates | 1,131.3 | | 980.6 | | 897.3 | |
|
|
|
|
|
| |
| Building Products | 869.1 | | 753.7 | | 647.4 | |
|
|
|
|
|
| |
| UK | | | | | | |
| Aggregates | 867.0 | | 811.5 | | 771.9 | |
|
|
|
|
|
| |
| Building Products | 382.8 | | 368.2 | | 300.7 | |
|
|
|
|
|
| |
| Australia | 489.1 | | 464.6 | | 413.2 | |
|
|
|
|
|
| |
| Asia Pacific | 119.6 | | 108.4 | | 124.5 | |
|
|
|
|
|
| |
| Continental Europe | 273.8 | | 228.7 | | 228.0 | |
|
|
|
|
|
| |
| | 4,132.7 | | 3,715.7 | | 3,383.0 | |
| |
|
|
|
|
| |
| Operating profit before impairments | | | | | | |
| North America | | | | | | |
| Aggregates | 180.9 | | 138.4 | | 127.6 | |
|
|
|
|
|
| |
| Building Products | 141.8 | | 125.7 | | 111.2 | |
|
|
|
|
|
| |
| UK | | | | | | |
| Aggregates | 123.2 | | 108.8 | | 74.5 | |
|
|
|
|
|
| |
| Building Products | 43.0 | | 37.8 | | 36.8 | |
|
|
|
|
|
| |
| Australia | 77.6 | | 81.6 | | 66.5 | |
|
|
|
|
|
| |
| Asia Pacific | 10.9 | | 8.1 | | 5.6 | |
|
|
|
|
|
| |
| Continental Europe | 21.8 | | 19.9 | | 23.9 | |
|
|
|
|
|
| |
| Central | (36.5 | ) | (31.5 | ) | (22.7 | ) |
|
|
|
|
|
| |
| | 562.7 | | 488.8 | | 423.4 | |
| |
|
|
|
|
| |
| Operating impairments | (4.1 | ) | (4.0 | ) | (29.3 | ) |
|
|
|
|
|
| |
| Operating profit | 558.6 | | 484.8 | | 394.1 | |
|
|
|
|
|
| |
| Net finance costs | (77.8 | ) | (55.5 | ) | (46.8 | ) |
|
|
|
|
|
| |
| Profit before taxation | 480.8 | | 429.3 | | 347.3 | |
|
|
|
|
|
| |
| Tax on continuing operations | (79.7 | ) | (34.4 | ) | (27.1 | ) |
|
|
|
|
|
| |
| Profit after taxation – continuing operations | 401.1 | | 394.9 | | 320.2 | |
|
|
|
|
|
| |
| Discontinued operations | 0.4 | | (7.3 | ) | (56.0 | ) |
|
|
|
|
|
| |
| Profit for the year | 401.5 | | 387.6 | | 264.2 | |
|
|
|
|
|
| |
| Less amounts attributable to minority interest | (1.1 | ) | (0.3 | ) | 0.1 | |
|
|
|
|
|
| |
| Profit attributable to equity holders of the Company | 400.4 | | 387.3 | | 264.3 | |
|
|
|
|
|
| |
| | | | | | | |
| Operating profit before impairments includes the profit after tax of joint-ventures and associates of £33.7m (£40.5m, £23.2m) . |
| | | | | | | |
| Dividends | | | | | | |
| Paid in the year (pence per ordinary share) | 20.60 | p | 18.65 | p | 17.30 | p |
|
|
|
|
|
| |
| Earnings per ordinary share (pence) | | | | | | |
| Basic | 56.0 | p | 53.2 | p | 36.0 | p |
|
|
|
|
|
| |
| Basic – continuing operations | 55.9 | p | 54.2 | p | 43.6 | p |
|
|
|
|
|
| |
| Diluted | 55.3 | p | 52.6 | p | 35.6 | p |
|
|
|
|
|
| |
| Diluted – continuing operations | 55.2 | p | 53.6 | p | 43.2 | p |
|
|
|
|
|
| |
| Weighted average number of shares (m) | | | | | | |
| Basic | 715.3 | | 728.3 | | 734.3 | |
|
|
|
|
|
| |
| Diluted | 723.6 | | 735.7 | | 741.1 | |
|
|
|
|
|
| |
Summary balance sheet
|
|
|
|
|
|
|
| | 2006 | | 2005 | | 2004 | |
| |
|
|
|
|
| |
| | £m | | £m | | £m | |
|
|
|
|
|
| |
| Non-current assets | 4,582.4 | | 4,221.7 | | 3,663.7 | |
|
|
|
|
|
| |
| Current assets | 2,034.6 | | 2,246.5 | | 2,484.3 | |
|
|
|
|
|
| |
| Assets held for sale | 3.0 | | 8.5 | | 12.6 | |
|
|
|
|
|
| |
| Total assets | 6,620.0 | | 6,476.7 | | 6,160.6 | |
|
|
|
|
|
| |
| Non-current liabilities | (2,332.7 | ) | (2,202.8 | ) | (2,023.7 | ) |
|
|
|
|
|
| |
| Current liabilities | (1,558.5 | ) | (1,601.6 | ) | (1,725.9 | ) |
|
|
|
|
|
| |
| Total liabilities | (3,891.2 | ) | (3,804.4 | ) | (3,749.6 | ) |
|
|
|
|
|
| |
| Net Assets | 2,728.8 | | 2,672.3 | | 2,411.0 | |
|
|
|
|
|
| |
| Equity | | | | | | |
| Called-up share capital | 73.7 | | 73.7 | | 73.7 | |
|
|
|
|
|
| |
| Own shares | (138.4 | ) | (73.3 | ) | (30.1 | ) |
|
|
|
|
|
| |
| Reserves | 2,788.0 | | 2,669.6 | | 2,365.3 | |
|
|
|
|
|
| |
| Attributable to equity holders of the Company | 2,723.3 | | 2,670.0 | | 2,408.9 | |
|
|
|
|
|
| |
| Minority interests | 5.5 | | 2.3 | | 2.1 | |
|
|
|
|
|
| |
| Total equity | 2,728.8 | | 2,672.3 | | 2,411.0 | |
|
|
|
|
|
| |
| Number of allotted, called-up and fully paid shares (m) | 737.0 | | 737.0 | | 737.0 | |
|
|
|
|
|
| |
Back to Contents
US GAAP selected financial data
consolidated income statement data
|
|
|
|
|
|
|
|
|
| |
| | 2006 | | 2005 | | 2004 | | 2003 | | 2002 | |
| |
|
|
|
|
|
|
|
|
| |
| | £m | | £m | | £m | | £m | | £m | |
|
|
|
|
|
|
|
|
|
| |
| Turnover | 4,136.9 | | 3,717.9 | | 3,383.9 | | 3,440.0 | | 3,348.3 | |
|
|
|
|
|
|
|
|
|
| |
| Operating profit including joint-ventures and associates | 532.6 | | 429.3 | | 82.2 | | 430.1 | | 500.3 | |
|
|
|
|
|
|
|
|
|
| |
| | | | | | | | | | | |
| Continuing operations – net income | 335.6 | | 473.2 | | 3.4 | | 297.7 | | 282.5 | |
|
|
|
|
|
|
|
|
|
| |
| Discontinued operations – profit from operations | 22.5 | | 14.5 | | 18.2 | | 7.9 | | 14.9 | |
|
|
|
|
|
|
|
|
|
| |
| Discontinued operations – profit/(loss) on disposals | 5.3 | | (24.0 | ) | (48.5 | ) | (73.9 | ) | (25.6 | ) |
|
|
|
|
|
|
|
|
|
| |
| Income/(loss) before cumulative effect of change in accounting principle | 363.4 | | 463.7 | | (26.9 | ) | 231.7 | | 271.8 | |
|
|
|
|
|
|
|
|
|
| |
| Cumulative effect of change in accounting principle | – | | – | | – | | – | | (900.4 | ) |
|
|
|
|
|
|
|
|
|
| |
| Net income/(loss) available for appropriation | 363.4 | | 463.7 | | (26.9 | ) | 231.7 | | (628.6 | ) |
|
|
|
|
|
|
|
|
|
| |
| | | | | | | | | | | |
| | 2006 | | 2005 | | 2004 | | 2003 | | 2002 | |
| |
|
|
|
|
|
|
|
|
| |
| | pence | | pence | | pence | | pence | | pence | |
|
|
|
|
|
|
|
|
|
| |
| Adjusted weighted average basic number of ordinary shares (millions) | 715.3 | | 728.3 | | 734.3 | | 733.9 | | 735.0 | |
|
|
|
|
|
|
|
|
|
| |
| Basic – income from continuing operations | 46.9 | | 65.0 | | 0.5 | | 40.5 | | 38.4 | |
|
|
|
|
|
|
|
|
|
| |
| Basic – income/(loss) from discontinued operations | 3.9 | | (1.3 | ) | (4.1 | ) | (9.0 | ) | (1.4 | ) |
|
|
|
|
|
|
|
|
|
| |
| Basic – income/(loss) before cumulative effect of change in accounting principle | 50.8 | | 63.7 | | (3.6 | ) | 31.5 | | 37.0 | |
|
|
|
|
|
|
|
|
|
| |
| Basic – cumulative effect of change in accounting principle | – | | – | | – | | – | | (122.5 | ) |
|
|
|
|
|
|
|
|
|
| |
| Basic – net income/(loss) | 50.8 | | 63.7 | | (3.6 | ) | 31.5 | | (85.5 | ) |
|
|
|
|
|
|
|
|
|
| |
| | | | | | | | | | | |
| Adjusted weighted average diluted number of ordinary shares (millions) | 720.2 | | 735.7 | | 741.1 | | 740.4 | | 740.9 | |
|
|
|
|
|
|
|
|
|
| |
| Diluted – income from continuing operations | 46.7 | | 64.3 | | 0.5 | | 40.2 | | 38.1 | |
|
|
|
|
|
|
|
|
|
| |
| Diluted – income/(loss) from discontinued operations | 3.8 | | (1.3 | ) | (4.1 | ) | (8.9 | ) | (1.4 | ) |
|
|
|
|
|
|
|
|
|
| |
| Diluted – income/(loss) before cumulative effect of change in accounting principle | 50.5 | | 63.0 | | (3.6 | ) | 31.3 | | 36.7 | |
|
|
|
|
|
|
|
|
|
| |
| Diluted – cumulative effect of change in accounting principle | – | | – | | – | | – | | (121.5 | ) |
|
|
|
|
|
|
|
|
|
| |
| Diluted – net income/(loss) | 50.5 | | 63.0 | | (3.6 | ) | 31.3 | | (84.8 | ) |
|
|
|
|
|
|
|
|
|
| |
Consolidated balance sheet data
|
|
|
|
|
|
|
|
|
| |
| | 2006 | | 2005 | | 2004 | | 2003 | | 2002 | |
| |
|
|
|
|
|
|
|
|
| |
| | £m | | £m | | £m | | £m | | £m | |
|
|
|
|
|
|
|
|
|
| |
| Total assets | 6,844.5 | | 7,269.5 | | 6,560.2 | | 7,210.9 | | 7,082.2 | |
|
|
|
|
|
|
|
|
|
| |
| Long-term debt | 1,339.8 | | 1,161.6 | | 1,058.3 | | 1,465.9 | | 972.3 | |
|
|
|
|
|
|
|
|
|
| |
| Share capital | 73.7 | | 73.7 | | 73.7 | | 73.7 | | 1,473.9 | |
|
|
|
|
|
|
|
|
|
| |
| Net assets and shareholders – equity | 2,781.5 | | 3,046.1 | | 2,683.8 | | 2,874.1 | | 2,605.8 | |
|
|
|
|
|
|
|
|
|
| |
| Number of shares | 737.0 | | 737.0 | | 737.0 | | 737.0 | | 737.0 | |
|
|
|
|
|
|
|
|
|
| |
In 2006, the group has adopted SFAS 123(R) “Share-based Payment” and SFAS 158 “Employers’ Accounting for Defined Benefit Pension and Other Post Post-retirement Plans”.
| Hanson 2006 www.hanson.biz |
Back to Contents
| Financial calendar | | | |
|
|
|
|
| | Ordinary | ADS | CDI |
| Final dividend for the year to December 31, 2006 | shareholders | holders | holders |
|
|
|
|
| Ex-dividend date | April 4, 2007 | April 5, 2007 | April 2, 2007 |
|
|
|
|
| Record date | April 10, 2007 | April 10, 2007 | April 10, 2007 |
|
|
|
|
| Payment date | May 4, 2007 | May 11, 2007 | May 11, 2007 |
|
|
|
|
(Subject to shareholder approval at the AGM)
|
|
|
| Interim dividend for the six months to June 30, 2007 | payable September 2007 (provisional) |
|
|
|
| | Interim 2007 | Full year 2007 |
| Results announcements (provisional) | August 1, 2007 | February 21, 2008 |
|
|
|
Dividends
Cash dividends are paid to shareholders as of record dates that are fixed in accordance with the dividend procedure timetable published by the London Stock Exchange. Hanson pays an interim dividend, normally in September, and a final dividend, subject to receiving shareholder approval at the AGM, normally at the end of April or early May following the end of the financial year. For the tax treatment of dividends paid to shareholders resident in the USA, please refer to the Ancillary Information section of this report.
Dividends in respect of the financial years ending December 31 were:
|
|
|
|
|
|
|
|
|
|
|
|
|
|
|
|
|
|
|
| | Per ordinary share | | Per ADS | | Per ADS | |
| |
|
|
|
|
|
|
|
|
|
|
|
|
|
|
|
|
| |
| | Interim | | Final | | Total | | Interim | | Final | | Total | | Interim | | Final | | Total | |
| |
|
|
|
|
|
|
|
|
|
|
|
|
|
|
|
|
| |
| | pence | | pence | | pence | | pence | | pence | | pence | | cents | | cents | | cents | |
| |
|
|
|
|
|
|
|
|
|
|
|
|
|
|
|
|
| |
| 2001 | 4.45 | | 9.55 | | 14.00 | | 22.25 | | 47.75 | | 70.00 | | 32.62 | | 69.60 | | 102.22 | |
|
|
|
|
|
|
|
|
|
|
|
|
|
|
|
|
|
| |
| 2002 | 4.55 | | 10.85 | | 15.40 | | 22.75 | | 54.25 | | 77.00 | | 35.24 | | 88.22 | | 123.46 | |
|
|
|
|
|
|
|
|
|
|
|
|
|
|
|
|
|
| |
| 2003 | 5.00 | | 11.95 | | 16.95 | | 25.00 | | 59.75 | | 84.75 | | 41.05 | | 105.27 | | 146.32 | |
|
|
|
|
|
|
|
|
|
|
|
|
|
|
|
|
|
| |
| 2004 | 5.35 | | 12.80 | | 18.15 | | 26.75 | | 64.00 | | 90.75 | | 47.74 | | 121.83 | | 169.57 | |
|
|
|
|
|
|
|
|
|
|
|
|
|
|
|
|
|
| |
| 2005 | 5.85 | | 14.15 | | 20.00 | | 29.25 | | 70.75 | | 100.00 | | 52.59 | | 131.11 | | 183.70 | |
|
|
|
|
|
|
|
|
|
|
|
|
|
|
|
|
|
| |
| 2006 | 6.45 | | 15.35 | * | 21.80 | * | 32.25 | | 76.75 | * | 109.00 | * | 60.44 | | | ‡ | | ‡ |
|
|
|
|
|
|
|
|
|
|
|
|
|
|
|
|
|
| |
| * | If approved by shareholders at the AGM to be held on April 24, 2007, the recommended final dividend of 15.35p per ordinary share for the year ended December 31, 2006 will be payable on May 4, 2007 to ordinary shareholders on the register at close of business (London time) on April 10, 2007. |
| ‡ | For holders of ADSs and CDIs, the dividend base rate is declared in pence and is converted to US dollars (for ADS holders) and Australian dollars (for CDI holders) on the UK dividend payment date using the prevailing exchange rates on that day. Payment of the final dividend for the year ended December 31, 2006 to holders of ADSs and CDIs will be on May 11, 2007. |
Ordinary shareholders who wish to have future dividends paid direct into their bank or building society account should contact Lloyds TSB Registrars at the address shown on the inside back cover. Payment to banks outside the UK is available to private shareholders subject to a small charge.
Dividend policy
The Board remains committed to a progressive dividend policy, although this will be subject to maintaining a reasonable level of dividend cover over the medium-term. The increase of 10.0% in the dividend for 2002, of 10.1% for 2003, of 7.1% for 2004, of 10.2% for 2005, followed by an increase of 9% for 2006 reflects our progressive approach to dividend payments. Future dividends will be dependent upon Hanson’s earnings, financial condition and other factors.
Major shareholders
To its knowledge, Hanson is not owned or controlled directly or indirectly by any government or by any other corporation. As of February 19, 2007, Hanson has been notified of the following persons who, directly or indirectly, are interested in 3% or more of the issued share capital, excluding shares held in treasury. The voting rights of the major shareholders listed below are the same as for the other holders of ordinary shares or ADSs.
|
|
|
|
| Number of | | % of issued share |
| Name | ordinary shares million | | capital at date of notification |
|
|
|
|
| Vanguard Windsor Funds – Vanguard Windsor II Fund | 39.1 | | 5.3 |
|
|
|
|
| Legal & General Investment Management | 36.9 | | 5.0 |
|
|
|
|
| Zurich Financial Services | 28.4 | | 4.0 |
|
|
|
|
| Prudential plc | 22.9 | | 3.2 |
|
|
|
|
| Standard Life Group | 22.4 | | 3.0 |
|
|
|
|
| Barclays Bank plc | 21.7 | | 3.0 |
|
|
|
|
Other than as identified above and interests held as bare nominee, Hanson has not been notified of any other interests in 5% or more of the ordinary shares (including ADSs) in the three years prior to the date of the Annual Report and Form 20-F.
As at February 19, 2007, 14.2m ADSs were held of record in the USA. The 70.8m ordinary shares (9.9% of the issued share capital, excluding shares held in treasury), representing those ADSs were registered in the name of National City Nominees Limited.
As of February 19, 2007, approximately 0.3m ordinary shares were held of record in the USA by approximately 250 record holders. Hanson believes that as of February 19, 2007, approximately 7.6% of its outstanding ordinary shares were also beneficially owned by US holders. Since certain of these securities are held by brokers or other nominees, the number of holders of record in the USA may not be representative of the number of beneficial owners or of where the beneficial owners are resident.
Ordinary shareholders
As at February 19, 2007 there were 736,968,849 ordinary shares in issue, of which 24,645,000 were held in treasury. There were 45,703 registered holders.
Back to Contents
| |
| Investor information continued |
|
Listings
Hanson ordinary shares are listed on the Official List of the UK Listing Authority (the “Official List”) and admitted to trading on the London Stock Exchange. The 7.875% notes due 2010 of the Company are also listed on the Official List and admitted to trading on the London Stock Exchange. |
In the USA, Hanson ordinary shares are listed on the New York Stock Exchange in the form of ADSs and trade under the symbol “HAN”. Each ADS represents five Hanson ordinary shares. Each ADS is evidenced by a direct-registered ADS unless an American Depositary Receipt is specifically requested by the holder. Citibank N.A. is the ADS Depositary under a Deposit Agreement, dated as of October 14, 2003. Hanson Building Materials America, Inc., whose office is at 300 East John Carpenter Freeway, Irving, TX 75062, USA, is Hanson’s agent in the USA in respect of ADSs. The 5.25% notes due 2013 of Hanson Australia Funding Limited and 6.125% unsecured notes due 2016 of the Company are also listed on the NYSE. Hanson is subject to the regulations of the SEC in the USA as they apply to foreign companies.
In Australia, Hanson ordinary shares are listed on the Australian Stock Exchange in the form of CDIs. Each CDI represents one Hanson ordinary share. Hanson Australia Pty Limited, whose office is at Level 6, 35 Clarence Street, Sydney, NSW 2000, Australia, is Hanson’s agent in Australia in respect of CDIs.
The following table shows, for the periods indicated, (i) the reported high and low sales prices based on the Daily Official List of the London Stock Exchange for Hanson ordinary shares and (ii) the reported high and low sales prices on the NYSE for Hanson ADSs.
|
|
|
|
|
|
| | London Stock Exchange | | NYSE |
| |
|
|
|
| | pence per ordinary share | | US dollars per ADS |
| |
|
|
|
|
|
| | High | Low | | High | Low |
|
|
|
|
|
|
| Calendar 2002 | 539.50 | 264.50 | | 39.66 | 21.23 |
|
|
|
|
|
|
| Calendar 2003 | 436.75 | 256.75 | | 36.50 | 21.55 |
| | | | | |
|
|
|
|
|
|
| Calendar 2004 | 451.50 | 360.00 | | 43.30 | 33.71 |
| | | | | |
|
|
|
|
|
|
| Calendar 2005 | | | | | |
| | | | | |
|
|
|
|
|
|
| First quarter | 536.75 | 451.50 | | 50.52 | 42.35 |
| | | | | |
|
|
|
|
|
|
| Second quarter | 539.00 | 476.00 | | 49.08 | 44.09 |
| | | | | |
|
|
|
|
|
|
| Third quarter | 608.50 | 531.00 | | 55.99 | 46.55 |
| | | | | |
|
|
|
|
|
|
| Fourth quarter | 640.00 | 527.00 | | 55.62 | 46.72 |
| | | | | |
|
|
|
|
|
|
| Calendar 2006 | | | | | |
| | | | | |
|
|
|
|
|
|
| First quarter | 784.50 | 624.50 | | 68.36 | 54.95 |
| | | | | |
|
|
|
|
|
|
| Second quarter | 771.50 | 616.50 | | 69.47 | 56.17 |
| | | | | |
|
|
|
|
|
|
| Third quarter | 773.50 | 622.00 | | 72.05 | 56.90 |
| | | | | |
|
|
|
|
|
|
| Fourth quarter | 778.50 | 711.00 | | 75.69 | 69.35 |
| | | | | |
|
|
|
|
|
|
| Most recent six months | | | | | |
| | | | | |
|
|
|
|
|
|
| August 2006 | 683.50 | 651.00 | | 64.61 | 61.41 |
| | | | | |
|
|
|
|
|
|
| September 2006 | 773.50 | 645.50 | | 72.05 | 60.45 |
| | | | | |
|
|
|
|
|
|
| October 2006 | 754.00 | 711.00 | | 70.95 | 68.56 |
| | | | | |
|
|
|
|
|
|
| November 2006 | 765.00 | 719.50 | | 72.78 | 69.35 |
| | | | | |
|
|
|
|
|
|
| December 2006 | 778.50 | 719.00 | | 75.69 | 71.10 |
| | | | | |
|
|
|
|
|
|
| January 2007 | 799.50 | 773.00 | | 78.95 | 75.35 |
| | | | | |
|
|
|
|
|
|
| February 2007 (through February 19, 2007) | 816.50 | 786.50 | | 80.38 | 77.47 |
|
|
|
|
|
|
Annual General Meeting
The AGM will be held at 11.00am on April 24, 2007 at the Institution of Engineering and Technology, 2 Savoy Place, London WC2R 0BL. Shareholders being sent the Annual Report and Form 20-F have also received a separate notice of the AGM, incorporating explanatory notes of the resolutions to be proposed at the meeting.
Holders of ADSs and CDIs are not members of the Company but may instruct their respective depositary as to the exercise of voting rights at the AGM pertaining to the number of ordinary shares represented by their ADSs and CDIs.
Ordinary shareholders may submit their proxy electronically via the internet at www.sharevote.co.uk or, if they have already registered with Lloyds TSB Registrars on-line portfolio service, they may appoint their proxy by visiting www.shareview.co.uk. Ordinary shareholders who are CREST participants may use the CREST proxy voting service for submitting electronic proxy appointments and voting instructions for the AGM. Full instructions on using these electronic voting options are included on the separate notice of the AGM.
Hanson website: www.hanson.biz
Our website is a good source of information about Hanson. You can download corporate reports, news releases and investor presentations, consult frequently asked questions, check dividend information and use share price tools. It is also possible to sign up to our email distribution service for news releases and other corporate information through which you will receive a notification email two days prior to results announcements and reports being published.
Electronic shareholder communications
Hanson encourages shareholders to elect to receive shareholder documents electronically by downloading them from the Company’s website. The information you receive will be the same as the printed version but receiving electronically means you receive it quicker and reduces the number of bulky reports mailed which will help conserve environmental resources and will help save the Company money.
Shareholders choosing to take advantage of this option, which is free to shareholders, will receive an e-mail notification each time a shareholder publication is placed on the Company’s website. Please note that those so electing will be able to change their mind about receiving documents by electronic notification at any time and that it will be the responsibility of the shareholder to notify any change of e-mail address.
Ordinary shareholders who wish to register to receive future shareholder documents electronically should access the Shareview facility provided by Lloyds TSB Registrars at www.shareview.co.uk. To register, shareholders will need their shareholder reference number (which can be found on the share certificate or dividend voucher). Agreement to the terms and conditions applying will be sought at the end of the registration process. The registration facility is now open.
Lloyds TSB Registrars will be happy to answer any queries on 0870 600 0632 (if calling from the UK) or +44 121 415 7085 (if calling from overseas).
Hanson 2006 www.hanson.biz
Back to Contents
Shareholder facilities
Any enquiries relating to ordinary shareholdings should be addressed to Lloyds TSB Registrars. Up-to-date information on holdings, including balance movements and information on recent dividends, can be found on www.shareview.co.uk, where ordinary shareholders can also notify a change of address and set up or change dividend mandate instructions.
Investors in the UK may take advantage of a postal low-cost share dealing service to buy or sell Hanson ordinary shares, held in a certificated form, in a simple, economic manner. Basic commission is 1% with a minimum charge of £15. Purchases are subject to Stamp Duty Reserve Tax of 0.5% . Full details can be obtained from Hoare Govett Limited, 250 Bishopsgate, London EC2M 4AA. Tel 020 7678 8300.
Alternatively, Lloyds TSB Registrars offer Shareview Dealing, a service which allows UK resident shareholders to sell or purchase Hanson ordinary shares via the internet by logging on to www.shareview.co.uk/dealing or via telephone on 0870 850 0852.
Holders of Hanson CDIs with a value of less than A$15,000 can take advantage of a facility, offered by Link Market Services Limited, to sell all their shares in a cost-effective and efficient manner. Full details on this share sale facility can be obtained by contacting Link Market Services Limited on +61 (0)2 8280 7111.
There is a dividend reinvestment programme (“DRIP”) for registered holders of Hanson ADSs who reside in the USA or Canada. This programme provides holders with a convenient and economical method (lower brokerage commissions) of investing cash dividends and optional cash deposits in additional ADSs at the market price, by having their purchases combined with those of other participants. For more information or a copy of the Hanson DRIP booklet call Citibank Shareholder Services on (877) 248 4237 or write to Citibank at the address shown on the inside back cover.
Holders of ADSs and CDIs should address enquiries to Citibank Shareholder Services and Link Market Services Limited (details on the inside back cover), respectively.
ShareGift
Ordinary shareholders with only a small number of shares (including many overseas shareholders) whose value makes it uneconomic to sell them may wish to consider donating them to charity through ShareGift, an independent charity share donation scheme. Since inception ShareGift advise they have been able to donate millions of pounds to hundreds of UK charities. The relevant share transfer form may be obtained from Lloyds TSB Registrars. ShareGift is administered by the Orr Mackintosh Foundation, registered charity no. 1052686. Further information about ShareGift may be obtained on 020 7828 1151 or from www.ShareGift.org. There are no implications for capital gains tax purposes (no gain or loss) on gifts of shares to charity and it is now also possible to obtain income tax relief.
Unsolicited mail
As UK law obliges companies to make their share registers available to other organisations, shareholders may receive unsolicited mail. Shareholders in the UK who wish to limit the amount of unsolicited mail they receive should contact the mailing preference service either by telephone on 0845 703 4599, online at www.mpsonline.org.uk or by writing to Mailing Preference Service, FREEPOST 29 LON20771, London W1E 0ZT.
Back to Contents
Description of business
General development of business
Hanson became a business focused purely on building materials in 1997 following the demerger of the old Hanson conglomerate. The major building materials companies remaining within Hanson at the time were ARC, Hanson Brick and Cornerstone.
Hanson management transformed the business into a world leading building materials company through a series of disposals and acquisitions, the largest of which was the acquisition of the Australian construction materials business, Pioneer International, in May 2000.
Following a series of restructurings, Hanson now operates as four identifiable trading regions: North America (48.4% of 2006 continuing turnover), UK (30.3% of 2006 continuing turnover), Australia and Asia Pacific (14.7% of 2006 continuing turnover), and Continental Europe (6.6% of 2006 continuing turnover).
This structure reinforces a continued focus on our core values of cost and margin control, together with disciplined and proactive growth via capital expenditure and bolt-on acquisitions.
North America
Hanson’s North American operations are organised into two operating groups, Aggregates North America and Building Products North America, with a corporate office in Dallas, Texas.
(a) Aggregates North America
Aggregates North America, headquartered in Dallas, Texas produces aggregates, ready-mixed concrete, asphalt and cement.
(b) Building Products North America
Building Products North America, headquartered in Dallas, Texas, is divided into three sub-groups, Pipe & Precast, Brick & Tile and Concrete Paving. Pipe & Precast, also headquartered in Dallas, produces concrete pipes, and products and precast concrete for the US and Canadian markets. Brick & Tile, with its headquarters in Charlotte, North Carolina, produces bricks for the US and Canadian markets from its principal manufacturing factories in Canada, Texas, and the Carolinas, and roof tiles from its plants in Florida, California, Texas and Arizona. Concrete Paving has operations in Florida.
UK
Hanson reports as two groups in the UK, Aggregates UK and Buildings Products UK.
(a) Aggregates UK
Aggregates UK produces aggregates, slag cement, ready-mixed concrete and asphalt in the UK through its own operations and is a partner in a number of joint-venture companies, the most significant of which is Midland Quarry Products Limited, owned jointly with a member of the Tarmac group of companies.
Included within Aggregates UK are Hanson’s marine dredging operations which, through a wholly owned subsidiary and United Marine Holdings Limited, a joint-venture with a member of the Tarmac group of companies, supply sea-dredged aggregates to the UK, Belgium and Holland.
(b) Building Products UK
Building Products UK supplies bricks, blocks, concrete products, concrete flooring, precast concrete and packed aggregates products throughout the UK.
Australia and Asia Pacific
In Australia, we are a major supplier of construction materials to the Australian market. Its operations are divided into two operating groups: Construction Materials, which produces ready-mixed concrete and aggregates; and Building Products, which produces blocks, pavers, retaining walls and precast products. Its other major interests include (i) its 25% share in Cement Australia Holdings Pty Ltd, jointly owned with Rinker Group Ltd and Holcim Ltd, which operates cement plants in New South Wales, Tasmania and Queensland, and (ii) Pioneer Road Services Pty Ltd, jointly owned with Shell Australia Ltd, which operates as an asphalt and contracting business.
In Asia Pacific, we operate principally in Malaysia, Hong Kong and Singapore.
Continental Europe
In Continental Europe, we operate various aggregates, ready-mixed concrete and asphalt operations in Spain, the Czech Republic, The Netherlands, Belgium, Germany, Austria and Israel.
Additional information
Exchange rates
The following table sets forth for the periods indicated the average noon buying rates in US dollars per £1 (to the nearest cent), calculated by using the average of the exchange rates on the last day of each full calendar month during the period.
|
|
| | Average |
|
|
| Year ended December 31, 2002 | 1.51 |
|
|
| Year ended December 31, 2003 | 1.65 |
|
|
| Year ended December 31, 2004 | 1.84 |
|
|
| Year ended December 31, 2005 | 1.82 |
|
|
| Year ending December 31, 2006 | 1.86 |
|
|
| Year ending December 31, 2007 (through February 19, 2007) | 1.96 |
|
|
The following table sets forth the high and low noon buying rates for the last six months in US dollars per £1 (to the nearest cent).
|
|
|
| | High | Low |
|
|
|
| August 2006 | 1.91 | 1.87 |
|
|
|
| September 2006 | 1.91 | 1.86 |
|
|
|
| October 2006 | 1.91 | 1.85 |
|
|
|
| November 2006 | 1.97 | 1.89 |
|
|
|
| December 2006 | 1.98 | 1.95 |
|
|
|
| January 2007 | 1.98 | 1.93 |
|
|
|
| February 2007 (through February 19, 2007) | 1.97 | 1.94 |
|
|
|
Business overview
Seasonality
Seasonality is a significant factor affecting all of our operations. In our major markets in the USA, the UK and northern Continental Europe, activity is very much concentrated during the period between March and November, while the winter in Australia and the rainy season and Chinese New Year in Asia Pacific cause a material slow-down in operations during these periods. Unusual weather patterns, in particular heavy and sustained rainfall during peak construction periods, can cause significant delays and have an adverse impact on our businesses.
Sources and availability of raw materials
We generally own or lease the real estate on which the raw materials, namely aggregates and clay reserves/resources, essential to our main businesses are found, although in the case of the marine businesses of Aggregates UK and Aggregates North America, we operate under licences from the relevant national and local authorities.
We are also a significant purchaser of certain important materials such as cement, bitumen, steel, gas, fuel and other energy supplies, the cost of which can fluctuate by material amounts and consequently have an adverse impact on our businesses. We are not generally dependent on any one source for the supply of these products, other than in certain jurisdictions with regard to the supply of gas and electricity. Competitive markets generally exist in the jurisdictions in which we operate for the supply of cement, bitumen, steel and fuel.
Sales and marketing
Although sales and marketing activities are more important in connection with our brick business in both the USA and the UK, where branding of the product is a factor, in general the nature of the majority of our products, ie rock, sand, gravel, ready-mixed concrete, concrete products and slag cement, and the cost of transportation, means that marketing and selling is conducted on a more localised basis, with an emphasis on service and delivery. Sales and marketing costs tend to be relatively low in relation to the overall delivered price of our products.
Competitive position
Statements relating to Hanson’s position as one of the leading heavy building materials companies, one of the largest producers of aggregates and one of the largest producers of heavy building products are based on management estimates.
Governmental regulation (including environmental)
Many products produced by our operating units are subject to government regulation in various jurisdictions regarding production and sale. We believe that our operating units have taken, and continue to take, measures to comply with applicable laws and government regulations in the jurisdictions in which we operate so that the risk of sanctions does not represent a material threat to any of the operating units individually or to Hanson as a whole. We also believe that compliance with these regulations does not substantially affect the ability of our subsidiaries to compete with similarly situated companies.
In addition to the regulatory framework described above, our operating units are subject to extensive regulation by national, state and local agencies concerning such matters as planning, environmental and health and safety compliance. In addition, numerous governmental permits and approvals are required for our operations. We believe that our operating units are currently operating in substantial compliance with, or under approved variances from, various national, state and local regulations. We do not believe that such compliance will materially adversely affect our business or results of operations.
Hanson 2006 www.hanson.biz
Back to Contents
| | | |
| | |
| | |
| | |
| | |
| | |
| | |
| 129 | |
|
|
|
|
| | | |
| |
| Ancillary information |
| |
| Ancillary information continued |
|
In the past, our subsidiaries have made significant capital and maintenance expenditures to comply with planning, water, air and solid and hazardous waste regulations and these subsidiaries may be required to do so in the future. From time to time, various agencies may serve cease and desist orders or notices of violation on an operating unit or deny its applications for certain licences or permits, in each case alleging that the practices of the operating unit are not consistent with the regulations or ordinances. In some cases, the relevant operating unit may seek to meet with the agency to determine mutually acceptable methods of modifying or eliminating the practice in question. We believe that our operating units should be able to achieve compliance with the applicable regulations and ordinances in a manner which should not have a material adverse effect on our business, financial condition or results of operations.
Approximately, 100 present and former US operating sites, or portions thereof, currently or previously owned and/or leased by current or former companies acquired by Hanson (responsibility for which remains with a member of the Hanson group) are the subject of claims, investigations, monitoring or remediation under the US federal Comprehensive Environmental Response, Compensation and Liability Act (“CERCLA”), the US federal Resource Conservation and Recovery Act or comparable US state statutes or agreements with third parties. These proceedings are in various stages ranging from initial enquiries to active settlement negotiations to implementation of response actions. In addition, a number of present and former Hanson operating units (responsibility for which remains with a member of the Hanson group) have been named as Potentially Responsible Parties (“PRPs“) at approximately 40 off-site landfills under CERCLA or comparable state statutes. In each of these matters the Hanson operating unit is working with the governmental agencies involved and other PRPs to address environmental claims in a responsible and appropriate manner. A substantial majority of these operating and landfill sites are covered by the environmental insurance policy referred to under the heading “Material Contracts” referred to below.
We do not believe that any of the above proceedings relating to operating sites and off-site landfills not covered by the environmental insurance policy should materially adversely affect our business, financial condition or results of operations. At December 31, 2006, we had accrued £171.1m for environmental obligations, including legal and other costs, at such sites as are not covered by the above-mentioned environmental insurance policy. Costs associated with environmental assessments and remediation efforts are accrued when determined to represent a probable loss and to be capable of being reasonably estimated. There can be no assurance that the ultimate resolution of these matters will not differ materially from our estimates.
We cannot predict whether future developments in laws and regulations concerning environmental and health and safety protection will affect our earnings or cash flow in a materially adverse manner or whether our operating units will be successful in meeting future demands of regulatory agencies in a manner which will not materially adversely affect our business, financial condition or results of operations.
For other legal proceedings against Hanson, see note 26 of the Notes to the accounts.
Patents and trademarks
Our operating units have various patents, registered trademarks, trade names and trade secrets and applications for, or licences in respect of, the same that relate to various businesses. We believe that certain of these intellectual property rights are of material importance to the businesses to which they relate. We believe that the material patents, trademarks, trade names and trade secrets of our operating subsidiaries and divisions are adequately protected and that the expiration of patents and patent licences should not have a material adverse effect upon our business, financial condition or results of operations.
Employees
As at December 31, 2006, the group employed 25,900 employees, excluding joint-venture and associates. An analysis of employee numbers by business and geographical area is found in note 4 of the Notes to the accounts. We believe that in general our relationship with our employees and trade unions or other bodies representing our employees is good.
Property, plant and equipment
As of December 31, 2006, the net book value of property, plant and equipment is £2,901.5m, predominantly held by the operating divisions. None of the individual properties is considered to have a value that is of major significance in relation to our assets as a whole. For a description of certain environmental issues that may affect our utilisation of our assets, see under the heading “Governmental regulation (including environmental)” referred to above.
Material contracts
For details relating to the Deposit Agreement under which the Hanson ADSs were issued, the indentures under which the group’s public bonds were issued and various agreements and indemnities relating to the demergers, see under the heading “Exhibits” included in Hanson PLC’s 2006 Annual Report and Form 20-F filed with the Securities and Exchange Commission.
In August 1998, an agreement was reached under which, for a one-off premium and related transaction costs totalling $275m, insurance cover of $800m (after payment by the group of the first $100m of remediation costs arising since January 1, 1998) was available to meet the costs of remediating the environmental liabilities relating to the former Koppers’ company operations of Beazer plc (“Beazer”) (acquired by Hanson in 1991). The insurance cover is provided by the subsidiaries of two leading reinsurance companies, Centre Solutions (a member of the Zurich Group) and Swiss Re. Administration of the environmental remediation programme will continue to be carried out by Beazer.
In April 2005, we entered into a £500m multi-currency revolving credit facility arranged by Barclays Capital and J.P. Morgan plc with a syndicate of banks, £470m of which expires in April 2011 and £30m of which expires in April 2010. This facility contains a $947m swingline advance facility and a sub-limit of up to £300m for Australian dollar loan note advances. In addition, in July 2004, we entered into a five year $475m facility arranged by Banc of America Securities Limited and Citigroup Global Markets Limited with a syndicate of banks. This facility is available to be drawn as either cash advances or standby letters of credit.
In August 2006, we entered into an indenture with The Bank of New York as trustee. Under the indenture, we can issue an unlimited amount of debt securities. In August 2006, we issued $750m in aggregate principal amount of notes. The notes bear interest at the rate of 6.125% per year and will mature on August 15, 2016.
Exchange controls
There are no UK restrictions on the import or export of capital including foreign exchange controls that affect the remittances of dividends or other payments to non-resident holders of ordinary shares except as otherwise set forth in “Taxation information for US shareholders” below and except for certain restrictions imposed from time to time by HM Treasury pursuant to legislation such as The United Nations Act 1946 and the Emergency Laws Act 1964 against the government or residents of certain countries.
Except for the general limitations contained in the Company’s Memorandum and Articles of Association and in the Deposit Agreement governing the Company’s ADSs, and certain restrictions that may be imposed from time to time by HM Treasury under legislation as described above, under English law and Hanson’s Memorandum and Articles of Association, persons who are neither residents nor nationals of the UK may freely hold, vote and transfer ordinary shares in the same manner as UK residents or nationals.
Taxation information for US shareholders
The following paragraphs are intended as a general guide only and do not purport to be a complete technical analysis or listing of all potential tax effects relevant to the ADSs or the ordinary shares. The statements of US federal tax laws set forth below are based on provisions of the US Internal Revenue Code of 1986, as amended, current and proposed US Treasury regulations promulgated there under, and administrative and judicial decisions, all of which are subject to change, possibly on a retrospective basis.
This discussion addresses only US shareholders that beneficially own and hold ADSs or ordinary shares as capital assets and use the US dollar as their functional currency, and that are either a citizen or resident of the USA for US federal income tax purposes, or a corporation, or other entity treated as a corporation for US federal income tax purposes, created or organised under the laws of the USA or any political subdivision thereof, or an estate the income of which is subject to US federal income taxation regardless of its sources, or a trust, if a court within the USA is able to exercise primary supervision over the administration of the trust and one or more US persons have the authority to control all substantial decisions of the trust (each a “US shareholder” for the purposes of this discussion).
The discussion does not consider the tax treatment of beneficiaries of trusts or estates, partnerships or other pass-through entities or persons who hold ordinary shares or ADSs through a partnership or other pass-through entity.
This discussion does not address all aspects of US federal income taxation, such as US federal gift or estate tax, nor state or local taxation. It does not address the tax consequences for financial institutions, financial services entities, insurance companies, dealers in securities or foreign currencies, persons subject to the alternative minimum tax, persons owning directly, indirectly or by attribution 5% or more of the total combined voting power of the stock of Hanson, persons carrying on a trade or business in the UK through a permanent establishment, persons who acquired ordinary shares or ADSs as compensation, persons who elect mark-to-market accounting, tax-exempt entities or private foundations, persons that hold the ordinary shares or ADSs as part of a straddle, hedge, constructive sale or conversion transaction
Back to Contents
or other integrated transaction, persons whose functional currency is other than the US dollar, certain expatriates or former long-term residents of the USA or holders who elected to apply the provisions of the former income tax convention between the USA and the UK.
US shareholders and holders of Hanson ADSs should consult their tax advisors with regard to the application of the US federal income tax laws to their particular situation, as well as any tax consequences arising under the laws of any state, local or foreign taxing jurisdiction.
Considerations relevant to the ADSs and ordinary shares
US shareholders of ADSs are not members of the Company but may instruct Citibank N.A., the Depositary, as to the exercise of voting rights pertaining to the number of ordinary shares represented by their ADSs. However, US shareholders of ADSs are generally treated as the owners of the underlying ordinary shares for purposes of the US-UK double taxation conventions relating to income and gains (the “UK-US income tax treaty“) and to estate and gift taxes (the “Estate and Gift Tax Convention“), and generally for purposes of the US federal tax laws.
Taxation of dividends
A US shareholder will be required to include in gross income as ordinary income the amount of any dividend paid on the ordinary shares or ADSs on the date the dividend is received to the extent the dividend is paid out of our current or accumulated earnings and profits, as determined for US federal income tax purposes. Dividends in excess of these earnings and profits will be applied against, and will reduce, the US shareholder’s basis in the ADSs or ordinary shares and, to the extent in excess of such basis, will be treated as gain from the sale or exchange of such ADSs or ordinary shares. In addition, dividends of current or accumulated earnings and profits will be foreign source passive income for US foreign tax credit purposes and will not qualify for the dividends-received deduction otherwise available to corporations.
Dividends paid out of current or accumulated earnings in foreign currency to a US shareholder will be includable in the income of a US shareholder in a US dollar amount calculated by reference to the exchange rate on the date the dividend is received, regardless of whether the dividend is in fact converted into US dollars on such date. A US shareholder that receives a foreign currency dividend and converts the foreign currency into US dollars subsequent to receipt will have foreign exchange gain or loss based on any appreciation or depreciation in the value of the foreign currency against the US dollar, which will generally be US source ordinary income or loss.
An individual US shareholder’s “qualified dividend income” is subject to tax at a reduced rate of tax of 15%. For this purpose, qualified dividend income includes dividends from foreign corporations if (a) the stock of such corporation with respect to which such dividend is paid is readily tradable on an established securities market in the USA, including NASDAQ, or (b) such corporation is eligible for the benefits of a comprehensive tax treaty with the USA that includes an information exchange programme and is determined to be satisfactory to the US Secretary of the Treasury. The US Secretary of the Treasury has indicated that the UK-US income tax treaty which came into effect on March 31, 2003 (the “Treaty”) is satisfactory for this purpose. Dividends will not, however, qualify for the reduced rate if such corporation is treated for the tax year in which dividends are paid (or in the prior year) as a “passive foreign investment company” for US federal income tax purposes. Based on the nature of Hanson’s operations, Hanson does not believe that it would be treated as a passive foreign investment company. Accordingly, if Hanson’s beliefs are correct, dividend distributions with respect to its ordinary shares or ADSs should be treated as qualified dividend income and subject to the US shareholder’s satisfaction of the holding period requirements described below, should be eligible for the reduced 15% US federal income tax rate. A US shareholder will not be entitled to the reduced rate: (a) if the US shareholder has not held the ordinary shares or ADSs for at least 61 days of the 121 day period beginning on the date which is 60 days before the ex-dividend date; or (b) to the extent the US shareholder is under an obligation to make related payments on substantially similar or related property. Any days during which a US shareholder has diminished its risk of loss on the ordinary shares or ADSs are not counted towards meeting the 61 day holding period required by the statute. The UK does not currently apply a withholding tax on dividends under its internal laws. However, if such a withholding tax were introduced, the UK would be entitled, under the Treaty, in certain circumstances to impose a withholding tax at a rate of up to 15% on dividends paid to a US shareholder. Subject to applicable limitations, a US shareholder who was subject to any such withholding should be entitled to claim a deduction for withheld tax or, subject to the holding period requirements mentioned below, a credit for such withholding tax against such holder’s US federal income tax liability. The US foreign tax credit limitation may be reduced to the extent that dividends are eligible for the reduced rate described above.
Taxation of capital gains
Upon a sale or other disposition of ordinary shares or ADSs, a US shareholder will recognise gain or loss for US federal income tax purposes in an amount equal to the difference between the US dollar value of the amount realised and the US shareholder’s tax basis (determined in US dollars) in such ordinary shares or ADSs. Generally, such gain or loss will be capital gain or loss and
will be long-term capital gain or loss if the US shareholder’s holding period for such ordinary shares or ADSs exceeds one year. Any such gain or loss generally will be income or loss from sources within the US for foreign tax credit limitation purposes. Long-term capital gain of a non-corporate US shareholder is generally subject to a maximum tax rate of 15%. The deductibility of a capital loss recognised on the sale or exchange of ordinary shares or ADSs is subject to limitations.
If the ordinary shares or ADSs are publicly traded, a disposition of such ordinary shares or ADSs will be considered to occur on the “trade date”, regardless of the US shareholder’s method of accounting. A US shareholder that uses the cash method of accounting calculates the US dollar value of the proceeds received on the sale as of the date that the sale settles. However, a US shareholder that uses the accrual method of accounting is required to calculate the value of the proceeds of the sale as of the “trade date” and, therefore, may realise foreign currency gain or loss, unless such US shareholder has elected to use the settlement date to determine its proceeds of sale for purposes of calculating such foreign currency gain or loss. In addition, a US shareholder that receives foreign currency upon the sale or exchange of the ordinary shares or ADSs and converts the foreign currency into US dollars subsequent to receipt will have foreign exchange gain or loss based on an appreciation or depreciation in the value of the foreign currency against the US dollar. Foreign exchange gain or loss will generally be US source ordinary income or loss.
A US citizen who is resident (or in certain circumstance has been resident within the previous five UK years of assessment for tax) or ordinarily resident in the UK or a US corporation which is resident in the UK by reason of being managed and controlled in the UK or a US citizen who, or US corporation which, is trading in the UK through a branch or agency and has used, held or acquired ADSs or ordinary shares for the purposes of such trade, branch or agency, may be liable for both UK and US tax on any gain on the disposal of ADSs or ordinary shares. Subject to certain limitations, such a person will generally be entitled to a tax credit against any US federal tax liability for the amount of any UK tax (namely, capital gains tax in the case of an individual and corporation tax on chargeable gains in the case of a corporation) which is paid in respect of such gain.
US information reporting and backup withholding
A US shareholder is generally subject to information reporting requirements with respect to dividends paid in the USA on ADSs or ordinary shares. In addition, a US shareholder is subject to backup withholding (currently at a rate of 28%) on dividends paid in the USA on ADSs or ordinary shares unless the US shareholder provides an IRS Form W-9 or otherwise establishes an exemption. A US shareholder is subject to information reporting and backup withholding (currently at a rate of 28%) on proceeds paid from a sale, exchange, redemption or other disposition of ADSs or ordinary shares unless the US shareholder provides an IRS Form W-9 or otherwise establishes an exemption.
Backup withholding is not an additional tax. The amount of any backup withholding will be allowed as a credit against a US shareholder’s US federal income tax liability and may entitle such holder to a refund, provided that certain information is furnished on a timely basis to the IRS.
Inheritance tax
The United Kingdom imposes inheritance tax, broadly, on transfers of capital which occur on death and in the preceding seven years. HM Revenue & Customs is known to consider that the Estate and Gift Tax Convention applies to inheritance tax and it is understood that, in practice, both the HM Revenue & Customs and the US Internal Revenue Service apply the provisions of the Estate and Gift Tax Convention to inheritance tax. On this assumption, an ADS or ordinary share held by an individual who is domiciled in, or a citizen of, the United States and is not a national of or domiciled in the United Kingdom will not be subject to UK inheritance tax on the individual’s death or on a transfer of the ADS or ordinary share during the individual’s lifetime except in the exceptional case where the ADS or ordinary share is part of the business property of a UK permanent establishment or an enterprise or pertains to a UK fixed base of an individual used for the performance of independent personal services. Special rules apply where an ADS or ordinary share is held in trust. The Estate and Gift Tax Convention generally provides a credit for the amount of any tax paid in the United Kingdom against the US federal tax liability or for tax paid in the USA to be credited against the United Kingdom liability (according to rules set out in the Convention) in a case where the ADS or ordinary share is subject both to UK inheritance tax and to US federal gift or estate tax.
Stamp duty and stamp duty reserve tax
Stamp duty will, subject to certain exceptions, be payable at the rate of 1.5%, rounded up to the nearest £5, on any instrument transferring ordinary shares to the Custodian of the Depositary on the value of such ordinary shares. In accordance with the terms of the Deposit Agreement, any tax or duty payable by the Depositary or the Custodian of the Depositary on future deposits of ordinary shares may be charged by the Depositary to the party to whom ADRs are delivered against such deposits.
| Hanson 2006 www.hanson.biz |
Back to Contents
| | | | |
| | | |
| | | |
| | 131 | |
|
|
|
|
| | | | |
| Ancillary information |
No UK stamp duty will be payable on any transfer of an ADR evidencing an ADS, provided that the ADR (and any separate instrument of transfer) is executed and retained at all times outside the UK and is not required to be admitted in evidence in any proceedings in the United Kingdom. A transfer of an ADR evidencing an ADS in the United Kingdom could attract stamp duty at a rate of 0.5%, rounded up to the nearest £5. Any transfer (which will include a transfer from the Depositary to an ADS holder) of the underlying ordinary shares could result in a stamp duty liability at the rate of 0.5%, rounded up to the nearest £5. On a transfer from a nominee to the beneficial owner (the nominee having at all times held the ordinary shares on behalf of the beneficial owner) under which no beneficial interest passes and which is neither a sale nor arises under a contract of sale nor is in contemplation of sale, a fixed £5 stamp duty will be payable. The amount of stamp duty or stamp duty reserve tax payable is generally calculated at the applicable rate on the purchase price of the ordinary shares.
Stamp duty reserve tax at a rate of 0.5% will be payable on any agreement to transfer ordinary shares or any interest therein unless an instrument transferring the ordinary shares is executed and stamp duty at a rate of 0.5%, rounded up to the nearest £5 has been paid. Stamp duty reserve tax will not be payable on any agreement to transfer ADRs representing ADSs.
Incorporation of the Company
Hanson PLC is a public limited company incorporated on December 31, 2002 in England and Wales (No. 4626078).
Memorandum and Articles of Association
The Company’s Amended and Restated Memorandum and Articles of Association is included as Exhibit 1.1 to Hanson PLC’s 2005 Annual Report and Form 20-F filed with the Securities and Exchange Commission and is incorporated herein by reference. A summary description of certain provisions of the Deposit Agreement relating to the Company’s ADSs was included in the Report on Form 6-K dated November 11, 2003 which was filed with the SEC. The information set forth in the Report on Form 6-K dated November 11, 2003 (which was incorporated by reference in certain Registration Statements) is incorporated herein by reference.
Registered office
1 Grosvenor Place
London SW1X 7JH
Telephone + 44 (0) 20 7245 1245
Documents on display
Hanson furnishes annual and special reports and other information with the SEC. These documents may be read and copied at the SEC’s Public Reference Room at 100F Street, N.E., Washington, D.C., 20549-7010. Please call the SEC at 1-800-SEC-0330 for further information on the public reference rooms and their copy charges. Filings with the SEC are also available to the public from commercial document retrieval services and on the website maintained by the SEC at www.sec.gov.
Back to Contents
| In this document the following words and expressions shall, unless the context otherwise requires, have the following meanings: |
|
| Act/Companies Act | The Companies Act 1985 (as amended) |
| | ADR | American Depositary Receipt evidencing title to an ADS |
| | ADS | American Depositary Share representing five underlying Ordinary Shares of Hanson PLC |
| | AGM | Annual General Meeting |
| | ASX | Australian Stock Exchange Limited |
| | bn | Billion |
| | CDI | CHESS Depositary Interest |
| | Company or company | Hanson PLC, sometimes referred to as New Hanson |
| | Court | The High Court of Justice in England and Wales |
| | Demergers | The demergers of US Industries, Inc. in 1995, Imperial and Millennium in 1996 and The Energy Group in 1997 |
| | Depositary | Citibank, as depositary under the deposit agreement dated as of October 14, 2003 pursuant to which ADSs are issued |
| | Directors | The Directors of Hanson PLC |
| | EGM | Extraordinary General Meeting |
| | ESOP | Employee Share Ownership Plan |
| | Existing business/operations | Operations excluding acquisitions made in the current year |
| | Free cash flow | Operating cash flow after interest and taxation |
| | FRS | Financial Reporting Standard (UK) |
| | Hanson | Old Hanson and/or New Hanson as the case may be |
| | Hanson or the group | Hanson and its subsidiaries |
| | Hanson PLC | A company incorporated in England and Wales (No. 4626078) which was formerly named Hanson Building Materials PLC prior to October 14, 2003 |
| | Heritage | Operations owned by the group for more than 12 months |
| | IFRS | International Financial Reporting Standards |
| | LIBOR | The London inter-bank offered rate, the variable rate of interest charged by a bank when lending to other banks in the London inter-bank market |
| | LTIP | Long Term Incentive Plan |
| | London Stock Exchange | London Stock Exchange plc |
| | m | Million |
| | New Hanson | Hanson PLC |
| | NYSE | New York Stock Exchange, Inc. |
| | Old Hanson | Hanson Building Materials Limited, a company incorporated in England and Wales (No 488067), formerly named Hanson PLC prior to October 14, 2003 |
| | Ordinary shares/shares | Ordinary shares of £2 each or of 10p each in the capital of Old Hanson and New Hanson respectively |
| | Pioneer | Pioneer International Limited |
| | pound sterling, £, pence or p | Refers to units of UK currency |
| | ppts | Percentage points |
| | Property profits | Profit recognised in respect of surplus property and land disposals included within group operating profit before impairments |
| | SEC | Securities and Exchange Commission of the United States |
| | Scheme or Scheme of Arrangement | The scheme of arrangement under section 425 of the Act approved by the Court on October 13, 2003 |
| | Scheme Effective Date | October 14, 2003 |
| | SFAS | Statement of Financial Accounting Standards (United States) |
| | SOX | Sarbanes-Oxley Act of 2002 (United States) |
| | SSAP | Statements of Standard Accounting Practice (UK) |
| | The Energy Group | The Energy Group plc |
| | Total Shareholder Return or TSR | The aggregate share price growth and dividends paid, on the assumption that such dividends are re-invested in shares of the Company |
| | UITF | Urgent Issues Task Force (UK) |
| | UK or United Kingdom | United Kingdom of Great Britain and Northern Ireland |
| | UK GAAP | Generally accepted accounting principles applied in the UK |
| | US dollar, $, cents or c | Refers to units of US currency |
| | US GAAP | US generally accepted accounting principles |
| | USA, US or United States | United States of America |
| | Figures in parentheses in tables and financial statements are used to represent negative numbers. |
| Hanson 2006 www.hanson.biz |
Back to Contents
| | | | |
| | | |
| | | |
| | 133 | |
|
|
|
|
| | | | |
| Glossary of terms and US equivalents |
| |
Glossary of terms and US equivalents |
|
| Terms used in the Annual Report and Form 20-F | US equivalent or brief description^ |
|
|
| Accounts | Financial statements |
|
|
| Allotted | Issued |
|
|
| Associate | A business which is not a subsidiary or a joint-venture, but in which the group has a shareholding and exercises significant influence |
|
|
| Borrowings | Liabilities |
|
|
| Called-up share capital | Ordinary shares, issued and fully paid |
|
|
| Capital allowances | Tax depreciation |
|
|
| Consolidated statement of recognised income and expense | Statement of changes in stockholders’ equity |
|
|
| Finance lease | Capital lease |
|
|
| Financial year | Fiscal year |
|
|
| Freehold | Ownership with absolute rights in perpetuity |
|
|
| Gearing | Leverage |
|
|
| Group, or consolidated, accounts | Consolidated financial statements |
|
|
| Interest payable | Interest expense |
|
|
| Interest receivable | Interest income |
|
|
| Joint-venture | A business which is jointly controlled by the group and one or more external partners |
|
|
| Nominal value | Par value |
|
|
| Operating profit | Net operating income |
|
|
| Payables | Accounts payable and accrued liabilities |
|
|
| Pension scheme | Pension plan |
|
|
| Profit | Income (or earnings) |
|
|
| Profit attributable to equity holders of the Company | Net income attributable to ordinary shareholders |
|
|
| Reserves | Stockholders’ equity other than capital stock |
|
|
| Share capital | Ordinary shares, capital stock or common stock issued and fully paid |
|
|
| Share premium account | Additional paid-in capital relating to proceeds of sale of stock in excess of par value or paid-in surplus (not distributable) |
|
|
| Shares in issue | Shares outstanding |
|
|
| Total assets | Total identifiable assets |
|
|
| Total equity | Stockholders – equity |
|
|
| Turnover | Revenues/sales |
|
|
| ^ US equivalent refers to the most comparable US term to that used in the Annual Report and Form 20-F. It should not be assumed that the terms used in the Annual Report and Form 20-F and theUS equivalent are identical. |
Back to Contents
| |
| Cross reference to Form 20-F |
|
| The information in this document that is referenced in the following table is included in Hanson PLC’s 2006 Form 20-F and is filed with the Securities and Exchange Commission. |
| |
| Item | | | | Page |
|
|
|
|
|
| 1 | | Identity of Directors, senior management and advisors | | n/a |
|
|
|
|
|
| 2 | | Offer statistics and expected timetable | | n/a |
|
|
|
|
|
| 3 | | Key information | | |
| A | | Selected financial data | | |
| | | IFRS selected financial data | | 123 |
|
|
|
|
|
| | | US GAAP selected financial data | | 124 |
|
|
|
|
|
| A | | Exchange rates | | 128 |
|
|
|
|
|
| B | | Capitalisation and indebtedness | | n/a |
|
|
|
|
|
| C | | Reason for the offer and use of proceeds | | n/a |
|
|
|
|
|
| D | | Risk factors | | |
| | | Principal risks and uncertainties | | 52-54 |
|
|
|
|
|
| 4 | | Information on the Company | | |
| A | | History and development of the Company | | |
| | | Incorporation of the Company | | 131 |
|
|
|
|
|
| | | Registered office | | 131 |
|
|
|
|
|
| | | Description of business | | 128 |
|
|
|
|
|
| | | Note 9 – Discontinued operations | | 90-92 |
|
|
|
|
|
| | | Note 25 – Business combinations | | 103 |
|
|
|
|
|
| | | Capital expenditure | | 48 |
|
|
|
|
|
| B | | Business overview | | |
| | | Industry and markets | | 10-11 |
|
|
|
|
|
| | | Description of business | | 128 |
|
|
|
|
|
| | | Note 2 – Segmental analysis | | 77-81 |
|
|
|
|
|
| | | Seasonality | | 128 |
|
|
|
|
|
| | | Sources and availability of raw materials | | 128 |
|
|
|
|
|
| | | Sales and marketing | | 128 |
|
|
|
|
|
| | | Competitive position | | 128 |
|
|
|
|
|
| | | Patents and trademarks | | 129 |
|
|
|
|
|
| | | Government regulation (including environmental) | | 128-129 |
|
|
|
|
|
| C | | Organisational structure | | |
| | | Note 14 – Investments | | 94-95 |
|
|
|
|
|
| | | Description of business | | 128 |
|
|
|
|
|
| D | | Property, plant and equipment | | 129 |
| | | Government regulation (including environmental) | | 128-129 |
|
|
|
|
|
| | | Note 13 – Property, plant and equipment | | 93-94 |
|
|
|
|
|
| | | Our mineral reserves and resources | | 14 |
|
|
|
|
|
| 5 | | Operating and financial review and prospects | | |
| A | | Operating results | | |
| | | Operating and financial reviews | | 22-45 |
|
|
|
|
|
| | | Financial review | | 46-50 |
|
|
|
|
|
| B | | Liquidity and capital resources | | |
| | | Funding, liquidity and treasury management | | 51 |
|
|
|
|
|
| | | Capital expenditure | | 48 |
|
|
|
|
|
| | | Consolidated cash flow statement | | 72 |
|
|
|
|
|
| | | Note 24 – Reconciliation of changes in total equity | | 102-103 |
|
|
|
|
|
| | | Note 29 – Financial risk management | | 108-111 |
|
|
|
|
|
| C | | Research and development, patents and licences, etc | | |
| | | Note 3 – Groups operating profits before impairments: Costs and overheads of continuing operations | | 82 |
|
|
|
|
|
| | | Patents and trademarks | | 129 |
|
|
|
|
|
| D | | Trend information | | |
| | | Operating and financial review | | 22-45 |
|
|
|
|
|
| E | | Off balance sheet arrangements | | 50 |
|
|
|
|
|
| F | | Tabular disclosure of contractual obligations | | |
|
|
|
|
|
| | | Capital and financial obligations | | 50 |
|
|
|
|
|
| G | | Safeharbour | inside back cover |
|
|
|
|
|
| 6 | | Directors, senior management and employees | | |
| A | | Directors and senior management | | |
| | | Board of Directors | | 56-57 |
|
|
|
|
|
| B | | Compensation | | |
| | | Remuneration report | | 63-67 |
|
|
|
|
|
| C | | Board practices | | |
| | | The Board of Directors | | 56-57 |
|
|
|
|
|
| | | Service contracts | | 66 |
|
|
|
|
|
| | | Corporate governance | | 59-62 |
|
|
|
|
|
| | | Remuneration, Nominations and Audit Committees | | 60-61 |
|
|
|
|
|
| D | | Employees | | |
| | | Note 4 – Directors and employees | | 82-83 |
|
|
|
|
|
| E | | Share ownership | | |
| | | Remuneration report | | 63-67 |
|
|
|
|
|
| | | Note 32 (l) – Additional information required by | | |
| | | US GAAP in regards to share-based payments | | 121-122 |
|
|
|
|
|
| | | Share Option Plan | | 64-65 |
|
|
|
|
|
| | | Sharesave Scheme | | 65 |
|
|
|
|
|
| Item | | | | Page |
|
|
|
|
|
| 7 | | Major shareholders and related party transactions | | |
| A | | Major shareholders | | 125 |
|
|
|
|
|
| B | | Related party transactions | | |
| | Remuneration report | | 63-67 |
|
|
|
|
|
| | Note 30 – Related party transactions | | 111 |
|
|
|
|
|
| C | | Interests of experts and counsel | | n/a |
|
|
|
|
|
| 8 | | Financial information | | |
| A | | Consolidated financial statements | | See Item 18 |
| | Asbestos | | 47 |
|
|
|
|
|
| | Note 21 – Provisions | | 97-99 |
|
|
|
|
|
| | Note 26 – Contingent liabilities | | 104-105 |
|
|
|
|
|
| | Dividend policy | | 125 |
|
|
|
|
|
| B | | Significant changes | | |
| | Note 31 – Subsequent events | | 111 |
|
|
|
|
|
| 9 | | The offer and listing | | |
| A | | Share price history | | |
| | Listings | | 126 |
|
|
|
|
|
| B | | Plan of distribution | | n/a |
|
|
|
|
|
| C | | Markets | | |
| | Listings | | 126 |
|
|
|
|
|
| D | | Selling shareholders | | n/a |
|
|
|
|
|
| E | | Dilution | | n/a |
|
|
|
|
|
| F | | Expenses of the issue | | n/a |
|
|
|
|
|
| 10 | | Additional information | | |
|
|
|
|
|
| A | | Share capital | | n/a |
|
|
|
|
|
| B | | Memorandum and articles of association | | 131 |
|
|
|
|
|
| C | | Material contracts | | 129 |
|
|
|
|
|
| D | | Exchange controls | | 129 |
|
|
|
|
|
| E | | Taxation | | |
| | Taxation information for US shareholders | | 129-131 |
|
|
|
|
|
| F | | Dividends | | 125 |
|
|
|
|
|
| G | | Statement by experts | | n/a |
|
|
|
|
|
| H | | Documents on display | | 131 |
|
|
|
|
|
| I | | Subsidiary information | | |
| | Investments in subsidiaries | | 137 |
|
|
|
|
|
| 11 | | Quantitative and qualitative disclosures about market risk | | |
| | Funding, liquidity and treasury management | | 51 |
|
|
|
|
|
| | Note 29 – Financial risk management | | 108-111 |
|
|
|
|
|
| 12 | | Description of securities other than equity securities | | n/a |
|
|
|
|
|
| 13 | | Defaults, dividend arrearages and delinquencies | | n/a |
|
|
|
|
|
| 14 | | Material modifications to the rights of security holders | | n/a |
|
|
|
|
|
| 15 | | Controls and procedures | | |
| A | | Evaluation of disclosure controls and procedures | | |
| | Internal control | | 61 |
|
|
|
|
|
| B | | Management’s annual report on internal controls over | | |
| | financial reporting | | 61 |
|
|
|
|
|
| C | | Report of independent registered public accounting firm | | 69 |
|
|
|
|
|
| D | | Changes in internal controls over financial reporting | | 61 |
|
|
|
|
|
| 16 | | Reserved | | n/a |
| 16A | | Audit committee financial expert | | |
| | Audit Committee | | 60-61 |
|
|
|
|
|
| 16B | | Code of ethics | | |
|
|
|
|
|
| | Corporate governance | | 59 |
|
|
|
|
|
| 16C | | Principal accountants fees and services | | 59 |
|
|
|
|
|
| | Note 3 – Remuneration of auditors | | 82 |
|
|
|
|
|
| | Note 32 (o) – Additional information required by US | | |
| | GAAP in regards to remuneration of auditors | | 122 |
|
|
|
|
|
| | Audit committee | | 60-61 |
|
|
|
|
|
| 16D | | Exemptions from the listing standards for audit | | |
| | committees | | n/a |
|
|
|
|
|
| 16E | | Repurchase activity | | |
|
|
|
|
|
| | Note 24 – Reconciliation of changes in total equity | | 102 |
|
|
|
|
|
| 17 | | Financial statements | | n/a |
|
|
|
|
|
| 18 | | Financial statements | | |
| | Report of independent registered public accounting firm | | 69 |
|
|
|
|
|
| | Consolidated income statement | | 70 |
|
|
|
|
|
| | Consolidated balance sheet | | 71 |
|
|
|
|
|
| | Consolidated cash flow statement | | 72 |
| | | | |
| | Consolidated statement of recognised income | | |
| | and expense | | 73 |
|
|
|
|
|
| | Accounting policies | | 74-76 |
|
|
|
|
|
| | Notes to the accounts | | 74-122 |
|
|
|
|
|
| 19 | | Exhibits | | n/a |
|
|
|
|
|
| Hanson 2006 www.hanson.biz |
Back to Contents
| | | | |
| | | |
| | | |
| | 135 | |
|
|
|
|
| | | |
| Audit report for parent Company accounts |
| |
| Audit report for parent Company accounts |
|
Independent auditor’s report to the shareholders of Hanson PLC
We have audited the parent Company financial statements of Hanson PLC for the year ended December 31, 2006 which comprise the Balance Sheet and the related notes I to VIII. These parent Company financial statements have been prepared under the accounting policies set out therein. We have also audited the information in the Directors’ Remuneration report that is described as having been audited.
We have reported separately on the group financial statements of Hanson PLC for the year ended December 31, 2006.
This report is made solely to the Company’s members, as a body, in accordance with Section 235 of the Companies Act 1985. Our audit work has been undertaken so that we might state to the Company’s members those matters we are required to state to them in an auditors’ report and for no other purpose. To the fullest extent permitted by law, we do not accept or assume responsibility to anyone other than the Company and the Company’s members as a body, for our audit work, for this report, or for the opinions we have formed.
Respective responsibilities of Directors and auditors
The Directors are responsible for preparing the Annual Report and Form 20-F, the Directors’ Remuneration report and the parent Company financial statements in accordance with applicable United Kingdom law and Accounting Standards (United Kingdom Generally Accepted Accounting Practice) as set out in the Statement of Directors’ Responsibilities.
Our responsibility is to audit the parent Company financial statements and the part of the Directors’ Remuneration report to be audited in accordance with relevant legal and regulatory requirements and International Standards on Auditing (UK and Ireland).
We report to you our opinion as to whether the parent Company financial statements give a true and fair view and whether the parent Company financial statements and the part of the Directors’ Remuneration report to be audited have been properly prepared in accordance with the Companies Act 1985. We also report to you whether in our opinion the information given in the parent Company Report of the Directors is consistent with the financial statements.
In addition we report to you if, in our opinion, the Company has not kept proper accounting records, if we have not received all the information and explanations we require for the audit, or if information specified by law regarding Directors’ remuneration and other transactions is not disclosed.
We read other information contained in the Annual Report and Form 20 F and consider whether it is consistent with the audited parent Company financial statements. The other information comprises only the Report of the Directors’, the Chairman’s statement, the Chief Executive’s overview, A decade of delivery and beyond, the Operating and Financial Review, the Corporate governance statement, and the unaudited part of the Directors’ remuneration report. We consider the implications for our report if we become aware of any apparent misstatements or material inconsistencies with the parent Company financial statements. Our responsibilities do not extend to any other information.
Basis of audit opinion
We conducted our audit in accordance with International Standards on Auditing (UK and Ireland) issued by the Auditing Practices Board. An audit includes examination, on a test basis, of evidence relevant to the amounts and disclosures in the parent Company financial statements and the part of the Directors’ Remuneration report to be audited. It also includes an assessment of the significant estimates and judgments made by the Directors in the preparation of the parent Company financial statements, and of whether the accounting policies are appropriate to the Company’s circumstances, consistently applied and adequately disclosed.
We planned and performed our audit so as to obtain all the information and explanations which we considered necessary in order to provide us with sufficient evidence to give reasonable assurance that the parent Company financial statements and the part of the Directors’ Remuneration report to be audited are free from material misstatement, whether caused by fraud or other irregularity or error. In forming our opinion we also evaluated the overall adequacy of the presentation of information in the parent Company financial statements and the part of the Directors’ Remuneration report to be audited.
Opinion
In our opinion:
| – | the parent Company financial statements give a true and fair view, in accordance with United Kingdom Generally Accepted Accounting Practice, of the state of the Company’s affairs as at December 31, 2006; and |
| – | the parent Company financial statements and the part of the Directors’ Remuneration report to be audited have been properly prepared in accordance with the Companies Act 1985; and |
| – | the information given in the Directors’ report is consistent with the parentCompany financial statements. |
| | |
| | |
Ernst & Young LLP
Registered auditor
London
February 22, 2007 |
Back to Contents
| |
| Hanson PLC – Company |
|
Statement of Directors’ responsibilities in respect of the financial statements
Company law requires the Directors to prepare financial statements for each financial period which give a true and fair view of the state of affairs of the Company and of the profit or loss for that period. In preparing those financial statements, the Directors are required to: |
| | |
| – | select suitable accounting policies and then apply them consistently; |
| – | make judgements and estimates that are reasonable and prudent; |
| – | state whether applicable accounting standards have been followed, subject to any material departures disclosed and explained in the financial statements; and |
| – | prepare the financial statements on the going concern basis unless it is inappropriate to presume that the Company will continue in business. |
The Directors confirm that the financial statements comply with the above requirements.
The Directors are responsible for keeping proper accounting records which disclose with reasonable accuracy at any time the financial position of the Company and to enable them to ensure that the financial statements comply with the Companies Act 1985. They are also responsible for safeguarding the assets of the Company and hence for taking reasonable steps for the prevention and detection of fraud and other irregularities.
| Balance sheet as at December 31, 2006 | | | | | | |
|
|
|
|
|
|
|
| | | | 2006 | | 2005 | |
| | |
|
|
|
| |
| | Notes | | £m | | £m | |
|
|
|
|
|
| |
| Fixed assets | | | | | | |
| Investments in subsidiaries | (II) | | 8,590.7 | | 8,590.7 | |
| | | | 8,590.7 | | 8,590.7 | |
| | |
|
|
|
| |
| Current assets | | | | | | |
| Other debtors | | | – | | 0.1 | |
|
|
|
|
|
| |
| Amounts due in less than one year from subsidiary undertakings | | | 36.7 | | 14.9 | |
|
|
|
|
|
| |
| Amounts due in more than one year from subsidiary undertakings | | | 766.4 | | 436.9 | |
| | | | 803.1 | | 451.9 | |
| Creditors – due within one year | | | | | | |
| 7.875% notes 2010 interest payable | (III) | | (7.9 | ) | (9.0 | ) |
|
|
|
|
|
| |
| 6.125% notes 2016 interest payable | (III) | | (8.9 | ) | – | |
|
|
|
|
|
| |
| Amounts due to subsidiary undertakings | | | (6,806.5 | ) | (6,555.2 | ) |
|
|
|
|
|
| |
| Other creditors | | | – | | (1.6 | ) |
| | | | (6,823.3 | ) | (6,565.8 | ) |
| | |
|
|
|
| |
| Net current liabilities | | | (6,020.2 | ) | (6,113.9 | ) |
|
|
|
|
|
| |
| Total assets less current liabilities | | | 2,570.5 | | 2,476.8 | |
|
|
|
|
|
| |
| Creditors – due after one year | | | | | | |
| 7.875% notes 2010 | (III) | | (380.8 | ) | (433.7 | ) |
|
|
|
|
|
| |
| 6.125% notes 2016 | (III) | | (377.9 | ) | – | |
|
|
|
|
|
| |
| Total creditors due after one year | | | (758.7 | ) | (433.7 | ) |
|
|
|
|
|
| |
| Net assets | | | 1,811.8 | | 2,043.1 | |
|
|
|
|
|
| |
| Capital and reserves | | | | | | |
|
|
|
|
|
| |
| Called-up share capital | (IV) | | 73.7 | | 73.7 | |
|
|
|
|
|
| |
| Own shares | (IV) | | (136.9 | ) | (72.8 | ) |
|
|
|
|
|
| |
| Profit and loss account | (IV) | | 1,875.0 | | 2,042.2 | |
|
|
|
|
|
| |
| Equity shareholders’ funds | | | 1,811.8 | | 2,043.1 | |
|
|
|
|
|
| |
Approved by the Board of Directors on February 22, 2007
Alan Murray Chief Executive
Pavi Binning Finance Director
a) Basis of preparation
The financial statements are prepared on a going concern basis under the historical cost convention, except where noted below, in accordance with the Companies Act 1985 and UK accounting standards (UK GAAP).
By virtue of section 230 of the Companies Act 1985 the Company is exempt from presenting a profit and loss account. The Company has taken advantage of the exemption from preparing a cash flow statement under the provisions of FRS 1 (Revised 1996) and the exemption covered in FRS 8 and has not separately disclosed transactions with subsidiary undertakings.
The following paragraphs describe the significant accounting policies under UK GAAP, which have been consistently applied unless otherwise stated.
b) Profit and loss
As permitted by the exemption in Section 230 of the Companies Act 1985 the Company has not presented its own profit and loss account or the related notes. The loss for the year was £16.4m (loss of £11.2m) . After dividends of £147.5m (£136.2m) the retained loss for the year was £163.9m (loss of £147.4m) . There are no recognised gains or losses other than the loss of £163.9m for the year ended December 31, 2006 and employee share awards of £3.3m, which have been debited to reserves.
Fees for audit and non-audit services provided by Ernst and Young LLP to the Company have been borne by a group undertaking.
Hanson 2006 www.hanson.biz
Back to Contents
| | |
| I) | Accounting Policies continued |
|
c) Share-based payments
The cost of equity-settled transactions with employees, for awards granted after November 7, 2002, is measured at fair value on the date of grant and is recognised as an expense over the vesting period. Fair value is determined by an external valuer using an appropriate pricing model. In valuing equity-settled transactions, no account is taken of any vesting conditions, other than conditions linked to the price of the shares of the Company (market conditions). |
For awards evaluated on non-market conditions or no performance criteria, an expense is ultimately only recognised for awards which vest. Where an award is dependent upon a market condition, the cost of the award is recognised irrespective of whether the award vests unless the employee leaves during the vesting period. At each balance sheet date before vesting, the cumulative expense is calculated representing the extent to which the vesting period has expired and management’s best estimate of the number of equity instruments that will ultimately vest. The movement in cumulative expense since the previous balance sheet date is recognised in the income statement, with a corresponding entry in equity.
d) Dividends
Dividends attributable to the shareholders are taken directly to equity when declared. Interim dividends are recognised when paid. Details of the final dividend recommended by the Board are disclosed in note 10 of the group Annual Report and Form 20-F.
Dividends receivable are accounted for on a cash received basis.
e) Foreign currencies
Assets, liabilities, revenues and costs denominated in foreign currencies are recorded at the rate of exchange ruling at the date of the transactions. Monetary assets and liabilities at the balance sheet date are re-translated at year end rates of exchange. Exchange differences arising are taken to the profit and loss account.
f) Fixed asset investments
Fixed asset investments are stated at cost, except where it is required to reflect a provision for a permanent diminution in value.
The Company holds two investments, both at cost with no provisions for impairment:
|
|
|
|
|
|
|
|
|
| | Principal activity | | % owned | | Country | | Year ended | |
|
|
|
|
|
|
|
| |
| Houserate Ltd | Investment holding company | | 100 | | UK | | December | |
|
|
|
|
|
|
|
| |
| Hanson Holdings Limited | Investment holding company | | 100 | | UK | | December | |
|
|
|
|
|
|
|
| |
g) Interest bearing loans and borrowings
Loans are measured at amortised cost using the effective interest rate method.
h) Own shares
Own equity instruments which are reacquired (treasury shares) are deducted from shareholders’ funds. No gain or loss is recognised in profit or loss on the purchase, sale, issue or cancellation of the Company’s own equity instruments. The Company has purchased all its own shares using funding provided by its subsidiary undertakings.
i) Pensions and other post-retirement benefits
The Company accounts for pensions under FRS 17 “Retirement benefits”. Contributions to defined contribution schemes are charged to the operating profit as they become payable.
The employees of the Company participate in two defined benefit pension schemes and one defined contribution scheme. The Company is unable to identify separately the relevant portion of the defined benefit schemes’ assets and liabilities. Further details are given in note VIII to these accounts. Pension costs are accounted for under FRS 17 “Retirement benefits”.
| II) | Investments in subsidiaries |
|
|
The companies listed below are those whose results, in the opinion of the Directors, principally affected the profit or assets of the group. A full list of subsidiary and associated undertakings at December 31, 2006 will be annexed to the annual report of the Company to be delivered to the Registrar of Companies.
Principal subsidiary undertakings at December 31, 2006, none of which are held directly by the Company, are as follows:
|
|
|
|
|
|
|
|
|
| | Principal activity | | % owned | | Country | | Year ended | |
|
|
|
|
|
|
|
| |
| Hanson Quarry Products Europe Ltd | quarry operations | | 100 | | UK | | December | |
|
|
|
|
|
|
|
| |
| Hanson Building Products Ltd | building products manufacturer | | 100 | | UK | | December | |
|
|
|
|
|
|
|
| |
| Hanson Finance PLC | group financing company | | 100 | | UK | | December | |
|
|
|
|
|
|
|
| |
| Sinclair General Corporation | group holding company | | 100 | | Panama | | December | |
|
|
|
|
|
|
|
| |
| Hanson Australia Funding Limited | group financing company | | 100 | | Australia | | December | |
|
|
|
|
|
|
|
| |
| Hanson Construction Materials Pty Limited | quarry operations and supply of ready-mixed concrete | | 100 | | Australia | | December | |
|
|
|
|
|
|
|
| |
| Hanson Pipe and Precast, Inc | supply of pipe and products | | 100 | | USA | | December | |
|
|
|
|
|
|
|
| |
| | | | | | | | | |
The 2010 7.875% notes are wholly repayable in 2010 and the 2016 6.125% notes are wholly repayable in 2016. The notes are used to meet the group funding requirements. The consideration received for the 2016 loan notes was £392.1m. Further information on the financial risk management of the group can be found in note 29 of the group’s Annual Report and Form 20-F.
| | Share | | Own | | Profit and loss | | | |
| | capital | | shares | | account | | Total | |
| |
|
|
|
|
|
|
| |
| | £m | | £m | | £m | | £m | |
|
|
|
|
|
|
|
| |
| At January 1, 2006 | 73.7 | | (72.8 | ) | 2,042.2 | | 2,043.1 | |
|
|
|
|
|
|
|
| |
| Profit on ordinary activities for the year | – | | – | | (16.4 | ) | (16.4 | ) |
|
|
|
|
|
|
|
| |
| Employee share awards | – | | – | | (3.3 | ) | (3.3 | ) |
|
|
|
|
|
|
|
| |
| Dividend on ordinary shares | – | | – | | (147.5 | ) | (147.5 | ) |
|
|
|
|
|
|
|
| |
| Purchase of own shares | – | | (64.1 | ) | – | | (64.1 | ) |
|
|
|
|
|
|
|
| |
| At December 31, 2006 | 73.7 | | (136.9 | ) | 1,875.0 | | 1,811.8 | |
|
|
|
|
|
|
|
| |
Full details of the authorised and issued share capital, and the own shares held are provided within notes 23 and 24 of the group’s Annual Report and Form 20-F. Stamp duty of £0.3m is included within the £64.1m purchase of own shares above.
Back to Contents
| |
| Hanson PLC – Company continued |
|
As at December 31, 2006, contingent liabilities of the Company include £2,621.4m (£1,468.4m) of bond, commercial paper and bank facilities which are guaranteed on behalf of subsidiary undertakings. On February 12, 2007 the Company guaranteed an additional bond of £220m on behalf of a subsidiary undertaking. Hanson PLC has guaranteed the defined benefit pension obligations of the employing companies participating in the Hanson Industrial Pension scheme. Disclosure of the net assets and liabilities of the scheme has been provided in note VIII. In addition, the Company is party to a cross guarantee in respect of cash pooling arrangements that include certain other group companies. The maximum liability of the Company under the guarantee is limited to the value of the cash balance of the Company included within the cash pool. As at December 31, 2006 the cash balance was £nil.
Full details of Directors’ emoluments are provided in the Remuneration report on page 63 of the group’s Annual Report and Form-20-F.
Details of each of the employee share plans in place are given in note 5 of the group Annual Report and Form 20-F.
Long Term Incentive Plan
Conditional awards were made over 578,858 ordinary shares on May 1, 2006 which will vest, subject to the performance measurement targets being attained, on March 1, 2009. The weighted average fair value of each share award granted is £5.01 (£3.45, £3.01) .
The following table illustrates the number of, and movements in, share awards during the year under this plan:
|
|
|
|
|
| | 2006 | | 2005 | |
| |
|
|
| |
| | Number | | Number | |
| | outstanding | | outstanding | |
| |
|
|
| |
| | ‘000 | | ‘000 | |
|
|
|
| |
| At January 1 | 2,255.6 | | 2,185.4 | |
|
|
|
| |
| Awarded | 578.9 | | 799.1 | |
|
|
|
| |
| Forfeited | (291.9 | ) | (55.3 | ) |
|
|
|
| |
| Expired | (393.9 | ) | (505.2 | ) |
|
|
|
| |
| Vested | (511.8 | ) | (168.4 | ) |
|
|
|
| |
| At December 31 | 1,636.9 | | 2,255.6 | |
|
|
|
| |
Share Option Plan
No options were granted under the Share Option Plan during 2006.
The following table illustrates the number and weighted average exercise prices of, and movements in, shares under option during the year under the Share Option Plan.
|
|
|
|
|
|
|
|
|
| | 2006 | | 2006 | | 2005 | | 2005 | |
| |
|
|
|
|
|
|
| |
| | | | Weighted | | | | Weighted | |
| | Number | | average | | Number | | average | |
| | outstanding | | exercise price | | outstanding | | exercise price | |
| |
|
|
|
|
|
|
| |
| | ‘000 | | pence | | ‘000 | | pence | |
|
|
|
|
|
|
|
| |
| At January 1 | 1,899.3 | | 405.4 | | 1,800.4 | | 388.4 | |
|
|
|
|
|
|
|
| |
| Granted | – | | – | | 488.2 | | 514.3 | |
|
|
|
|
|
|
|
| |
| Forfeited | (167.7 | ) | 470.5 | | (298.6 | ) | 461.8 | |
|
|
|
|
|
|
|
| |
| Expired | (309.4 | ) | 290.4 | | (33.1 | ) | 473.3 | |
|
|
|
|
|
|
|
| |
| Exercised | (431.6 | ) | 357.7 | | (57.6 | ) | 466.7 | |
|
|
|
|
|
|
|
| |
| At December 31 | 990.6 | | 451.1 | | 1,899.3 | | 405.4 | |
|
|
|
|
|
|
|
| |
| Exercisable at December 31 | 135.8 | | 297.9 | | 165.2 | | 468.7 | |
|
|
|
|
|
|
|
| |
Range of exercise prices for the Share Option Plan (pence per share)
|
|
|
|
|
|
|
|
|
|
|
| | Options outstanding | | Options exercisable | |
|
|
|
|
|
|
|
|
|
| |
| | | Weighted | | | | | | | |
| | | average | | Weighted | | | | Weighted | |
| Number | | remaining | | average | | Number | | average | |
| outstanding | | contract life | | exercise price | | exercisable | | exercise price | |
|
|
|
|
|
|
|
|
|
| |
| ‘000 | | years | | pence | | ‘000 | | pence | |
|
|
|
|
|
|
|
|
|
| |
| 2006: | | | | | | | | | | |
| 290.4p-461.7p | 575.7 | | 6.9 | | 405.9 | | 130.2 | | 290.4 | |
|
|
|
|
|
|
|
|
|
| |
| 461.8p-514.3p | 414.9 | | 8.1 | | 513.7 | | 5.6 | | 473.3 | |
|
|
|
|
|
|
|
|
|
| |
| | 990.6 | | 7.4 | | 451.1 | | 135.8 | | 297.9 | |
|
|
|
|
|
|
|
|
|
| |
| 2005: | | | | | | | | | | |
| 290.4p-461.8p | 1,245.9 | | 7.5 | | 354.4 | | 66.5 | | 461.8 | |
|
|
|
|
|
|
|
|
|
| |
| 461.9p-514.3p | 653.4 | | 8.0 | | 502.8 | | 98.7 | | 473.3 | |
|
|
|
|
|
|
|
|
|
| |
| | 1,899.3 | | 7.7 | | 405.4 | | 165.2 | | 468.7 | |
|
|
|
|
|
|
|
|
|
| |
Sharesave Scheme
During 2006, options were granted over 19,028 shares which will ordinarily be exercisable at an exercise price of 611.0p per share during the period June 1 to November 30, 2009 for the three year Scheme; June 1 to November 30, 2011 for the five year Scheme; and June 1 to November 30, 2013 for the seven year scheme. The weighted average fair value of each share option granted is £1.81 (£1.34, £1.43) ..
Hanson 2006 www.hanson.biz
Back to Contents
| VII) | Share-based paymentscontinued |
|
|
The following table illustrates the number and weighted average exercise prices of, and movements in, shares under option during the year in the Sharesave Scheme:
|
|
|
|
|
|
|
|
|
| | 2006 | | 2006 | | 2005 | | 2005 | |
| |
|
|
|
|
|
|
| |
| | | | Weighted | | | | Weighted | |
| | Number | | average | | Number | | average | |
| | outstanding | | exercise price | | outstanding | | exercise price | |
| |
|
|
|
|
|
|
| |
| | ‘000 | | pence | | ‘000 | | pence | |
|
|
|
|
|
|
|
| |
| At January 1 | 72.4 | | 350.4 | | 89.3 | | 326.8 | |
|
|
|
|
|
|
|
| |
| Granted | 19.0 | | 611.0 | | 22.7 | | 395.0 | |
|
|
|
|
|
|
|
| |
| Forfeited | (4.2 | ) | 395.0 | | (2.7 | ) | 351.9 | |
|
|
|
|
|
|
|
| |
| Exercised | (2.6 | ) | 428.0 | | (36.9 | ) | 320.6 | |
|
|
|
|
|
|
|
| |
| At December 31 | 84.6 | | 398.2 | | 72.4 | | 350.4 | |
|
|
|
|
|
|
|
| |
| Exercisable at December 31 | – | | – | | – | | – | |
|
|
|
|
|
|
|
| |
Range of exercise prices for the Sharesave Scheme (pence per share)
|
|
|
|
|
|
|
|
|
|
|
| | | Options outstanding | | Options exercisable | |
|
|
|
|
|
|
|
|
|
| |
| | | Weighted | | | | | | | |
| | | average | | Weighted | | | | Weighted | |
| Number | | remaining | | average | | Number | | average | |
| outstanding | | contract life | | exercise price | | exercisable | | exercise price | |
|
|
|
|
|
|
|
|
|
| |
| ‘000 | | years | | pence | | ‘000 | | pence | |
|
|
|
|
|
|
|
|
|
| |
| 2006: | | | | | | | | | | |
| 318.0p-328.0p | 54.0 | | 1.6 | | 323.9 | | – | | – | |
|
|
|
|
|
|
|
|
|
| |
| 328.1p-611.0p | 30.6 | | 3.7 | | 529.1 | | – | | – | |
|
|
|
|
|
|
|
|
|
| |
| | 84.6 | | 2.4 | | 398.2 | | – | | – | |
| |
|
|
|
|
|
|
|
|
| |
| 2005 | | | | | | | | | | |
| 318.0p-323.0p | 20.0 | | 2.4 | | 318.0 | | – | | – | |
|
|
|
|
|
|
|
|
|
| |
| 323.1p-428.0p | 52.4 | | 1.8 | | 362.8 | | – | | – | |
|
|
|
|
|
|
|
|
|
| |
| | 72.4 | | 2.0 | | 350.4 | | – | | – | |
|
|
|
|
|
|
|
|
|
| |
The assumptions used to fair value the equity-settled options granted under the LTIP, Share Option Plan and Sharesave Scheme are included in note 5 of the group Annual Report and Form 20-F.
Other Schemes
At December 31, 2006 there were no options outstanding under Executive Share Option Schemes A and B.
The following tables illustrate the number and weighted average exercise prices of, and movements in, shares under option for the other schemes.
|
|
|
|
|
|
|
|
|
| | 2006 | | 2006 | | 2005 | | 2005 | |
| |
|
|
|
|
|
|
| |
| | | | Weighted | | | | Weighted | |
| | Number | | average | | Number | | average | |
| | outstanding | | exercise price | | outstanding | | exercise price | |
| |
|
|
|
|
|
|
| |
| | ‘000 | | pence | | ‘000 | | pence | |
|
|
|
|
|
|
|
| |
| Executive Share Option Scheme: | | | | | | | | |
| At January 1 | 11.0 | | 331.3 | | 24.0 | | 331.3 | |
|
|
|
|
|
|
|
| |
| Exercised | (3.0 | ) | 331.3 | | (13.0 | ) | 331.3 | |
|
|
|
|
|
|
|
| |
| At December 31 | 8.0 | | 331.1 | | 11.0 | | 331.3 | |
|
|
|
|
|
|
|
| |
| Exercisable at December 31 | 8.0 | | 331.1 | | 11.0 | | 331.3 | |
|
|
|
|
|
|
|
| |
| Executive Share Option Schemes A and B: | | | | | | | | |
| At January 1 | – | | – | | 157.9 | | 356.4 | |
|
|
|
|
|
|
|
| |
| Exercised | – | | – | | (157.9 | ) | 356.4 | |
|
|
|
|
|
|
|
| |
| At December 31 | – | | – | | – | | – | |
|
|
|
|
|
|
|
| |
| Exercisable at December 31 | – | | – | | – | | – | |
|
|
|
|
|
|
|
| |
| VIII) | Pensions and other post-employment medical plans |
|
|
The employees of the Company participate in three group pension plans: the Hanson No 2 Pension Scheme, a funded defined benefit plan which provides benefits to certain current and former employees of the Company; the Hanson Industrial Pension Scheme, another defined benefit pension plan and the Hanson Industrial Pension Scheme, a defined contribution plan.
As it is not possible to separately identify the Company’s share of the Hanson Industrial Pension Scheme defined benefit plan, the Company accounts for this scheme on a defined contribution basis. Details of the entire net FRS 17 deficit position are disclosed below. The Company also contributes to the Hanson No 2 Pension Scheme, the details of which are disclosed in the accounts of Hanson Building Materials Limited.
Total contributions to all schemes in respect of the employees of the Company are £1.1m (£1.4m) .
From March 31, 2006, the Company has guaranteed the obligations of the Hanson Industrial Pension scheme. The net pension deficit under FRS17 was as follows:
|
|
|
|
|
| | 2006 | | 2005 | |
| |
|
|
| |
| | £m | | £m | |
|
|
|
| |
| Market value of scheme assets | 1,179.3 | | 1,093.9 | |
|
|
|
| |
| Present value of scheme liabilities | (1,190.5 | ) | (1,107.4 | ) |
|
|
|
| |
| Pension deficit | (11.2 | ) | (13.5 | ) |
|
|
|
| |
| Deferred tax | 4.7 | | 4.1 | |
|
|
|
| |
| Net FRS 17 pension deficit | (6.5 | ) | (9.4 | ) |
|
|
|
| |
Back to Contents
Hanson – the key facts
as at December 31, 2006
| Operations* | Aggregates | | | | | Building
products | | | | | | Other | | | |
|
|
|
|
|
|
|
|
|
|
|
|
|
|
|
|
| | | | | | | | | | | | | | Rail | | |
| | | | | | | Concrete | Concrete | | | | | | depots/marine | | |
| | Crushed | Sand and | | | Ready-mixed | pipe and | flooring and | Packed | | | | | wharves/cement | | |
| | rock | gravel | Asphalt | Marine | concrete | products | precast | products | Roofing | | Brick | Cementitious | distribution | Recycling/ | |
| | quarries | quarries | plants | dredgers | plants | factories | concrete sites | sites | tile plants | Pavers | plants | products | terminals | landfill sites | Misc |
|
|
|
|
|
|
|
|
|
|
|
|
|
|
|
|
| North America | | | | | | | | | | | | | | | |
| Alabama (AL) | – | – | – | – | – | 10 | – | – | – | – | – | – | – | – | – |
|
|
|
|
|
|
|
|
|
|
|
|
|
|
|
|
| Arizona (AZ) | – | 7 | 3 | – | 14 | 3 | – | – | 1 | – | – | – | – | – | 1 |
|
|
|
|
|
|
|
|
|
|
|
|
|
|
|
|
| Arkansas (AR) | – | 1 | – | – | – | 4 | – | – | – | – | – | – | – | – | – |
|
|
|
|
|
|
|
|
|
|
|
|
|
|
|
|
| California (CA) | 8 | 8 | 9 | 4 | 20 | 6 | – | – | 2 | – | – | 1 | 9 | 13 | 3 |
|
|
|
|
|
|
|
|
|
|
|
|
|
|
|
|
| Conneticut (CT) | – | – | – | – | – | 1 | – | – | – | – | – | – | – | – | – |
|
|
|
|
|
|
|
|
|
|
|
|
|
|
|
|
| Florida (FL) | – | – | – | – | – | 10 | – | – | 5 | 3 | – | 1 | – | – | – |
|
|
|
|
|
|
|
|
|
|
|
|
|
|
|
|
| Georgia (GA) | 9 | – | – | – | – | 6 | – | – | – | – | – | – | – | – | 1 |
|
|
|
|
|
|
|
|
|
|
|
|
|
|
|
|
| Illinois (IL) | 7 | 3 | – | – | – | – | – | – | – | – | – | – | – | – | 1 |
|
|
|
|
|
|
|
|
|
|
|
|
|
|
|
|
| Indiana (IN) | 19 | 2 | – | – | – | – | – | – | – | – | – | – | – | – | – |
|
|
|
|
|
|
|
|
|
|
|
|
|
|
|
|
| Kentucky (KY) | 9 | – | – | – | – | – | – | – | – | – | 2 | – | – | – | – |
|
|
|
|
|
|
|
|
|
|
|
|
|
|
|
|
| Louisiana (LA) | – | – | – | – | – | 3 | – | – | – | – | 1 | – | 3 | – | – |
|
|
|
|
|
|
|
|
|
|
|
|
|
|
|
|
| Maryland (MD) | – | – | – | – | – | 2 | – | – | – | – | – | – | – | – | – |
|
|
|
|
|
|
|
|
|
|
|
|
|
|
|
|
| Michigan (MI) | – | – | – | – | – | – | – | – | – | – | 1 | – | – | – | 1 |
|
|
|
|
|
|
|
|
|
|
|
|
|
|
|
|
| Minnesota (MN) | – | – | – | – | – | 2 | – | – | – | – | – | – | – | – | – |
|
|
|
|
|
|
|
|
|
|
|
|
|
|
|
|
| Mississippi (MS) | – | – | – | – | – | 5 | – | – | – | – | – | – | – | – | – |
|
|
|
|
|
|
|
|
|
|
|
|
|
|
|
|
| New Jersey (NJ) | – | 4 | – | – | – | – | – | – | – | – | – | – | 1 | – | – |
|
|
|
|
|
|
|
|
|
|
|
|
|
|
|
|
| New Mexico (NM) | 1 | – | – | – | – | – | – | – | – | – | – | – | – | – | – |
|
|
|
|
|
|
|
|
|
|
|
|
|
|
|
|
| New York (NY) | 18 | 10 | 19 | – | 15 | – | – | – | – | – | – | – | – | – | 1 |
|
|
|
|
|
|
|
|
|
|
|
|
|
|
|
|
| North Carolina (NC) | 9 | 2 | – | – | – | – | – | – | – | – | 3 | – | – | – | 1 |
|
|
|
|
|
|
|
|
|
|
|
|
|
|
|
|
| Ohio (OH) | 10 | 3 | – | – | 7 | 6 | – | – | – | – | – | – | – | – | 7 |
|
|
|
|
|
|
|
|
|
|
|
|
|
|
|
|
| Oklahoma (OK) | 1 | – | – | – | – | 1 | – | – | – | – | – | – | – | – | – |
|
|
|
|
|
|
|
|
|
|
|
|
|
|
|
|
| Oregon (OR) | – | – | – | – | – | 3 | – | – | – | – | – | – | – | – | – |
|
|
|
|
|
|
|
|
|
|
|
|
|
|
|
|
| Pennsylvania (PA) | 18 | 4 | 10 | 1 | – | 1 | – | – | – | – | – | – | 2 | – | 1 |
|
|
|
|
|
|
|
|
|
|
|
|
|
|
|
|
| Rhode Island (RI) | – | – | – | – | – | 1 | – | – | – | – | – | – | – | – | – |
|
|
|
|
|
|
|
|
|
|
|
|
|
|
|
|
| South Carolina (SC) | 6 | 2 | – | – | – | 1 | – | – | – | – | 3 | – | – | – | – |
|
|
|
|
|
|
|
|
|
|
|
|
|
|
|
|
| South Dakota (SD) | – | – | – | – | – | 1 | – | – | – | – | – | – | – | – | – |
|
|
|
|
|
|
|
|
|
|
|
|
|
|
|
|
| Texas (TX) | 7 | 10 | – | – | – | 18 | – | – | 1 | – | 5 | – | 7 | – | – |
|
|
|
|
|
|
|
|
|
|
|
|
|
|
|
|
| Utah (UT) | – | – | – | – | – | 1 | – | – | – | – | – | – | – | – | – |
|
|
|
|
|
|
|
|
|
|
|
|
|
|
|
|
| Virginia (VA) | – | – | – | – | – | 10 | – | – | – | – | – | – | – | – | – |
|
|
|
|
|
|
|
|
|
|
|
|
|
|
|
|
| Washington (WA) | – | – | – | – | – | 1 | – | – | – | – | – | – | – | – | – |
|
|
|
|
|
|
|
|
|
|
|
|
|
|
|
|
| Ontario (Canada) | – | – | – | – | – | 4 | – | – | – | – | 3 | – | – | – | – |
|
|
|
|
|
|
|
|
|
|
|
|
|
|
|
|
| Quebec (Canada) | – | – | – | – | – | – | – | – | – | – | 1 | – | – | – | – |
|
|
|
|
|
|
|
|
|
|
|
|
|
|
|
|
| Mexico | 1 | 1 | – | – | – | – | – | – | – | – | – | – | 1 | – | – |
|
|
|
|
|
|
|
|
|
|
|
|
|
|
|
|
| Total | 123 | 57 | 41 | 5 | 56 | 100 | – | – | 9 | 3 | 19 | 2 | 23 | 13 | 17 |
|
|
|
|
|
|
|
|
|
|
|
|
|
|
|
|
| | | | | | | | | | | | | | | | |
| UK | 47 | 49 | 46 | 13 | 242 | 13 | 5 | 17 | – | 1 | 19 | 8 | 21 | – | 4 |
|
|
|
|
|
|
|
|
|
|
|
|
|
|
|
|
| | | | | | | | | | | | | | | | |
| Australia | | | | | | | | | | | | | | | |
| Canberra | 1 | – | – | – | 1 | – | – | – | – | – | – | – | – | – | – |
|
|
|
|
|
|
|
|
|
|
|
|
|
|
|
|
| New South Wales | 10 | 7 | 11 | – | 76 | 1 | 3 | – | – | – | – | 1 | 5 | – | – |
|
|
|
|
|
|
|
|
|
|
|
|
|
|
|
|
| Northern Territory | – | – | 2 | – | 3 | – | – | – | – | – | – | – | – | – | – |
|
|
|
|
|
|
|
|
|
|
|
|
|
|
|
|
| Queensland | 8 | 9 | 12 | – | 59 | 8 | – | – | – | – | – | 3 | 10 | – | 4 |
|
|
|
|
|
|
|
|
|
|
|
|
|
|
|
|
| South Australia | 2 | 2 | 1 | – | 9 | – | – | – | – | – | – | – | 1 | – | – |
|
|
|
|
|
|
|
|
|
|
|
|
|
|
|
|
| Western Australia | 6 | 1 | 2 | – | 26 | – | – | – | – | – | – | – | – | 1 | – |
|
|
|
|
|
|
|
|
|
|
|
|
|
|
|
|
| Tasmania | 1 | 1 | – | – | 11 | 2 | – | – | – | – | – | 1 | – | – | 2 |
|
|
|
|
|
|
|
|
|
|
|
|
|
|
|
|
| Victoria | 11 | 8 | 7 | – | 47 | – | – | – | – | – | – | – | 5 | 2 | 1 |
|
|
|
|
|
|
|
|
|
|
|
|
|
|
|
|
| Total | 39 | 28 | 35 | – | 232 | 11 | 3 | – | – | – | – | 5 | 21 | 3 | 7 |
|
|
|
|
|
|
|
|
|
|
|
|
|
|
|
|
| | | | | | | | | | | | | | | | |
| Asia Pacific | | | | | | | | | | | | | | | |
| Greater China | 5 | – | – | – | 6 | – | – | – | – | – | – | – | – | – | – |
|
|
|
|
|
|
|
|
|
|
|
|
|
|
|
|
| Malaysia | 20 | – | 17 | – | 49 | – | – | – | – | – | – | – | – | – | – |
|
|
|
|
|
|
|
|
|
|
|
|
|
|
|
|
| Singapore | – | – | 1 | – | – | – | 1 | – | – | – | – | – | – | – | – |
|
|
|
|
|
|
|
|
|
|
|
|
|
|
|
|
| Total | 25 | – | 18 | – | 55 | – | 1 | – | – | – | – | – | – | – | – |
|
|
|
|
|
|
|
|
|
|
|
|
|
|
|
|
| | | | | | | | | | | | | | | | |
| Continental Europe | | | | | | | | | | | | | | | |
| Austria | 1 | 3 | – | – | – | – | – | – | – | – | – | – | – | – | – |
|
|
|
|
|
|
|
|
|
|
|
|
|
|
|
|
| Belgium | – | – | – | – | 3 | – | – | – | – | – | – | – | 5 | – | – |
|
|
|
|
|
|
|
|
|
|
|
|
|
|
|
|
| Czech Republic | 4 | 4 | 1 | – | – | – | – | – | – | – | – | – | – | – | – |
|
|
|
|
|
|
|
|
|
|
|
|
|
|
|
|
| France | – | – | – | – | – | – | – | – | – | – | – | – | – | – | – |
|
|
|
|
|
|
|
|
|
|
|
|
|
|
|
|
| Germany | 3 | 4 | – | – | – | – | – | – | – | – | – | – | – | 1 | – |
|
|
|
|
|
|
|
|
|
|
|
|
|
|
|
|
| Spain | 8 | 7 | – | – | 27 | – | – | – | – | – | – | – | – | – | – |
|
|
|
|
|
|
|
|
|
|
|
|
|
|
|
|
| The Netherlands | – | – | – | – | 3 | – | – | – | – | – | – | – | 1 | – | – |
|
|
|
|
|
|
|
|
|
|
|
|
|
|
|
|
| Israel | 4 | – | 2 | – | 23 | – | – | – | – | – | – | – | – | – | – |
|
|
|
|
|
|
|
|
|
|
|
|
|
|
|
|
| Total | 20 | 18 | 3 | – | 56 | – | – | – | – | – | – | – | 6 | 1 | – |
|
|
|
|
|
|
|
|
|
|
|
|
|
|
|
|
| Group Total | 254 | 152 | 143 | 18 | 641 | 124 | 9 | 17 | 9 | 4 | 38 | 15 | 71 | 17 | 28 |
|
|
|
|
|
|
|
|
|
|
|
|
|
|
|
|
| * Excluding joint-ventures and associates |
| Hanson 2006 www.hanson.biz |
Back to Contents
A Scheme of Arrangement (the “Scheme”) was approved by shareholders of Old Hanson on September 19, 2003, subsequently approved by the Court on October 13, 2003 and became effective at the close of business on October 14, 2003 (the “Scheme Effective Date”). Under the Scheme, shareholders in Old Hanson received, in substitution for each of their ordinary shares of £2 in nominal value in Old Hanson, one ordinary share of 10p in nominal value in New Hanson, following a reduction in the nominal capital of New Hanson approved by the Court on October 20, 2003 and effective from October 21, 2003.
For the purposes of producing the Annual Report and Form 20-F of New Hanson, unless otherwise expressly specified (a) references to the Company and its subsidiaries or Hanson and its subsidiaries, or the group, refer to Old Hanson and its subsidiaries up to the close of business on the Scheme Effective Date and to New Hanson (including Old Hanson) and its subsidiaries as from that time and (b) references to Hanson or the Company are to Old Hanson up to the close of business on the Scheme Effective Date and to New Hanson as from that time. At the Scheme Effective Date New Hanson had no business assets.
Solely for the convenience of the reader, the Annual Report and Form 20-F contains translations of certain amounts in pounds sterling (“£”) or pence (“p”) into US dollars (“US dollars” or “$”) or cents (“c”). The translations of pounds sterling and pence to US dollars and cents appearing in the Annual Report and Form 20-F have been made at the noon buying rate in New York City for cable transfers in pounds sterling as certified for customs purposes by the Bank of New York (the “noon buying rate”) on the date of the information so translated. These translations should not be construed as representations that the pound sterling amounts actually represent such US dollar amounts or could be converted into US dollars at the rates indicated. On February 19, 2007 the noon buying rate was $1.9499 per £1. For additional information on exchange rates between the pound sterling and the US dollar, see “Exchange Rates” on page 128 of the Annual Report and Form 20-F.
Each of Hanson, Hanson Aggregates North America, Hanson Building Products North America, Hanson Aggregates UK, Hanson Building Products UK, Hanson Australia & Asia Pacific and Hanson Continental Europe (as such expressions are referred to in the Annual Report and Form 20-F) is either a holding company or divisional entity, and does not itself carry out any of the business activities described on page 58 of the Annual Report and Form 20-F. | | References to ‘we’, ‘our’ or ‘us’, unless the content otherwise requires, is, in the context of a description of the group’s businesses, operational activities or liabilities, a reference to those of the relevant subsidiary company. References to Hanson or the Company should, where appropriate, be construed as a reference to the group or one or more of the Company’s subsidiaries.
The market, industry and product segment data contained in the Annual Report and Form 20-F have been taken from industry and other sources available to Hanson in the relevant jurisdictions and, in some cases, adjusted based on relevant management’s knowledge of the industry. Hanson has not independently verified any third-party market information. Similarly, while Hanson believes its internal estimates are reliable, they have not been verified by independent sources.
Some of the information included in the Annual Report and Form 20-F, including documents incorporated by reference, are, or may be deemed to be, “forward-looking statements” within the meaning of the Private Securities Litigation Reform Act of 1995 (United States). Such forward-looking statements are subject to risks, uncertainties and other factors which could cause actual results and developments to differ materially from future results and developments expressed or implied by such forward-looking statements. An investor can identify these statements by the fact that they do not relate strictly to historical or current facts. They use words such as ‘anticipate’, ‘estimate’, ‘expect’, ‘intend’, ‘will’, ‘project’, ‘plan’, ‘believe’ and other words and terms of similar meanings in discussion of future operating or financial performance.
Such factors include, but are not limited to, changes in economic conditions, especially in the USA, the UK and Australia; changes in governmental policy or legislation relating to public works expenditure and housing; inclement weather conditions; the competitive market in which we operate; changes in governmental policy or legislation that could effect regulatory compliance and other operating costs; disruption to, or increased costs of, the supply of materials, energy and fuel to our business; pension and post-retirement healthcare costs; ineffective implementation of computer software systems; our inability to achieve success in our acquisition strategy; exchange rate fluctuations; potential liabilities, including asbestos, arising out of former businesses and activities; adequacy of Koppers’ environmental insurance and US litigation exposure. Hanson does not undertake any obligation to update or revise publicly such forward-looking statements. All written, oral or other tangible and electronic forward-looking statements attributable to Hanson or persons acting on behalf of Hanson are expressly qualified in their entirety by this cautionary statement. |
| | | |
| | | |
Front cover
Top left: Gary Bell
Top right: Thomas Matarazzo
Middle left: Myrna Wise
Middle centre: Frans Kooy
Middle right: Brendan Hambridge
Bottom left: Leroy Price
Bottom right: Ruth Coulson
| | |
| | | |
All paper used in the production of this report is recyclable and bio-degradable. The cover and
pages 1-56 were manufactured under ISO 9002 and ISO 14001 environmental accreditation.
Pages 57-140 were manufactured under ISO 9706 and ISO 14001 environmental accreditation.
Design by Black Sun plc www.blacksunplc.com
Main photography by Mike Abrahams
Printed by St Ives Westerham Press under ISO 14001 environmental accreditation |
|
|
| | Shareholder contact information
Ordinary shares:
Lloyds TSB Registrars
Shareholder Services
The Causeway
Worthing
West Sussex BN99 6DA
UK |
| | |
| | UK investors
Tel 0870 600 0632
Fax 0870 600 3980 |
| | |
| | Overseas investors
Tel +44 (0) 121 415 7085
Fax +44 (0) 1903 854 031
www.shareview.co.uk |
| | |
| | American Depositary Shares (ADSs):
Citibank Shareholder Services
PO Box 43077
Providence
RI 02940-3077
USA
Fax +1 201 324 3284
E-mail citibank@shareholders-online.com |
| | |
| | US investors
Tel +1 877 248 4237 |
| | |
| | Non-US investors
Tel +1 816 843 4281 |
| | |
| | CHESS Depositary Interests (CDIs):
Link Market Services Limited
Level 12
680 George Street
Sydney
NSW 2000
Australia
Tel +61 (0) 2 8280 7111
Fax +61 (0) 2 9287 0303
www.linkmarketservices.com.au |
| | |
| | UK Investor share dealing services
for Hanson ordinary shares:
Hoare Govett Limited
250 Bishopsgate
London EC2M 4AA
UK
Tel +44 (0) 20 7678 8300 |
| | |
| | Lloyds TSB Registrars
Shareview Dealing
The Causeway
Worthing
West Sussex BN99 6DA
UK
Tel 0870 850 0852
www.shareview.co.uk/dealing |
| | |
| | Hanson PLC contacts
Company Secretary
Paul Tunnacliffe
E-mail paul.tunnacliffe@hanson.biz |
| | |
| | Investor Relations
Nick Swift
E-mail nick.swift@hanson.biz |
| | |
| | www.hanson.biz |
| | |
| | |
Back to Contents
Hanson PLC
1 Grosvenor Place
London SW1X 7JH
Tel +44 (0) 20 7245 1245
Fax +44 (0) 20 7235 3455 |  | | www.hanson.biz
For the latest news and investor information on Hanson PLC, please visit our website. |
Back to Contents
SIGNATURES
The registrant hereby certifies that it meets all of the requirements for filing on Form 20-F and that is has duly caused and authorized the undersigned to sign this annual report on its behalf.
| | HANSON PLC |
| | | |
| | By: | /s/ Graham Dransfield |
| | Name: | Graham Dransfield |
| | Title: | Legal Director |
Date: March 1, 2007
Back to Contents
EXHIBIT INDEX
| 1.1 | Amended and Restated Memorandum and Articles of Association of Hanson PLC (incorporated by reference to Exhibit 1.1 to Hanson PLC’s Annual Report on Form 20-F for the year ended December 31, 2005). |
| |
| 2.1 | Deposit Agreement, dated as of October 14, 2004, among Hanson PLC, Citibank, N.A. as depositary and the holders from time to time of the ADRs issued thereunder (incorporated by reference to Exhibit 1 to Hanson PLC’s Report on Form 6-K filed on November 10, 2003). |
| |
| 2.2 | Indenture dated as of September 27, 2000 among Old Hanson and The Bank of New York, as Trustee (incorporated by reference to Exhibit 4.1 to Amendment No. 1 to Old Hanson’s Registration Statement No. 333-12510 on Form F-3). |
| |
| 2.3 | Indenture dated as of March 18, 2003 among Hanson Australia Funding Limited, Old Hanson and The Bank of New York, as Trustee (incorporated by reference to Exhibit 4.2 to Old Hanson’s Registration Statement No. 333-98517 on Form F-3). |
| |
| 2.4 | First Supplemental Indenture dated as of February 10, 2004 to the Indenture referred to in Exhibit 2.3 hereof, among Old Hanson, Hanson PLC and The Bank of New York, as Trustee (incorporated by reference to Exhibit 2.5 to Hanson PLC’s Annual Report on Form 20-F for the year ended December 31, 2003). |
| |
| 2.5 | Form of Indenture among Hanson Finance America, Inc., Old Hanson and The Bank of New York, as Trustee (incorporated by reference to Exhibit 4.3 to Old Hanson’s Registration Statement No. 333-98517 on Form F-3). |
| |
| 2.6 | First Supplemental Indenture dated as of February 10, 2004 to the Indenture referred to in Exhibit 2.5 hereof among Hanson Australia Funding Limited, Old Hanson, Hanson PLC and The Bank of New York, as Trustee (incorporated by reference to Exhibit 2.7 to Hanson PLC’s Annual Report on Form 20-F for the year ended December 31, 2003). |
| |
| 2.7 | Form of Indenture dated August 16, 2006 between Hanson PLC and The Bank of New York, as Trustee (incorporated by reference to Exhibit 4.1 to Hanson PLC’s Registration Statement No. 333-136396 on Form F-3). |
| |
| 2.8 | Hanson hereby agrees to furnish the Commission, upon its request, copies of any instruments that define the rights of holders of long-term debt of Hanson and its subsidiaries that are not filed as exhibits to the Annual Report and Form 20-F. |
| |
| 4.1 | Form of Demerger Agreement, between Old Hanson, Hanson Overseas Holdings Ltd. and Millennium (incorporated by reference to Exhibit 10.7 to Millennium’s Registration Statement on Form 10 (SEC File No. 1-12091)). |
| |
| 4.2 | Form of Indemnification Agreement, between Old Hanson and Millennium (incorporated by reference to Exhibit 10.8 to Millenium’s Registration Statement on Form 10 (SEC File No. 1-12091)). |
| |
| 4.3 | Form of Tax Sharing and Indemnification Agreement, between Old Hanson, Hanson Overseas Holdings Ltd. and Millenium (incorporated by reference to Exhibit 10.9(b) to Millenium’s Registration Statement on Form 10 (SEC File No. 1-12091)). |
| |
| 4.4 | Form of Deed of Tax Covenant, between Old Hanson, Hanson Overseas Holdings Ltd. and Millennium (incorporated by reference to Exhibit 10.9(b) to Millenium’s Registration Statement on Form 10 (SEC File No. 1-12091)). |
| |
| 4.5 | Amendment to the Deed of Tax Covenant, dated January 28, 1997 (incorporated by reference to Exhibit 3.1(e) to Old Hanson’s Annual Report on Form 20-F for the year ended December 31, 1998). |
| |
| 4.6 | Agreement, dated August 28, 1996 among Imperial, Old Hanson, J. Henry Schroder & Co. Ltd and certain other parties (incorporated by reference to Exhibit 3.2(a) to Old Hanson’s Annual Report on Form 20-F for the year ended December 31, 1997). |
| |
| 4.7 | Deed, dated August 28, 1996 between Old Hanson and Imperial (incorporated by reference to Exhibit 3.2(b) to Old Hanson’s Annual Report on Form 20-F for the year ended December 31, 1997). |
| |
| 4.8 | Demerger Agreement dated August 28, 1996 between Old Hanson and Imperial (incorporated by reference to Exhibit 3.2(c) to Old Hanson’s Annual Report on Form 20-F for the year ended December 31, 1997). |
| |
| 4.9 | Form of Demerger Agreement between Old Hanson and The Energy Group(incorporated by reference to Exhibit 3.2 to Energy’s Registration Statement on Form 20-F (SEC File No. 1-14576)). |
| |
| 4.10 | Form of Deed between Old Hanson and Rollalong Ltd (incorporated by reference to Exhibit 3.3 to Energy’s Registration Statement on Form 20-F (SEC File No. 1- 14576)). |
| |
| 4.11 | Form of Indemnification Agreement between Old Hanson and the Energy Group (incorporated by reference to Exhibit 3.4 to Energy’s Registration Statement on Form 20-F (SEC File No. 1-14576)). |
| |
| 4.12 | Form of Tax Sharing and Indemnification Agreement among Old Hanson, Cavenham, The Energy Group and Gold Fields American Corporation (incorporated by reference to Exhibit 3.5 to Energy’s Registration Statement on Form 20-F (SEC File No. 1- 14576)). |
| |
| 4.13 | Form of Peabody Acquisition Agreement among US Holdings, Inc., GFAC International Holdings Inc. ( GFAC ), Old Hanson and The Energy Group(incorporated by reference to Exhibit 3.6 to Energy’s Registration Statement on Form 20-F (SEC File No. 1-145476)). |
| |
| 8.1 | Principal subsidiary undertakings (incorporated by reference to list of principal subsidiary undertakings on page 137 in the Annual Report and Form 20-F). |
| |
| 12.1 | Certification of Alan J. Murray filed pursuant to 17 CFR 240.13a-14(a). |
| |
| 12.2 | Certification of Paviter S. Binning filed pursuant to 17 CFR 240.13a-14(a). |
| |