The insurance business is subject to extensive regulation and legislative changes, which impact the manner in which we operate our business.
Our insurance business is subject to extensive regulation by the applicable state agencies in the jurisdictions in which we operate, perhaps most significantly by the Illinois Department of Insurance and the California Department of Insurance. These state agencies have broad regulatory powers designed to protect policyholders, not stockholders or other investors. These powers include, among other things, the ability to:
Our ability to transact business with our affiliates and to enter into mergers, acquisitions and divestitures involving our insurance company subsidiary is limited by the requirements of the insurance holding company laws of Illinois and California. To comply with these laws, we are required to file notices with the Illinois Department of Insurance and the California Department of Insurance to seek their respective approvals at least 30 days before engaging in any intercompany transactions, such as sales, purchases, exchanges of assets, loans, extensions of credit, cost sharing arrangements and extraordinary dividends or other distributions to stockholders. Under these holding company laws, any change of control transaction also requires prior notification and approval. Because these governmental agencies may not take action or give approval within the 30 day period, these notification and approval requirements may subject us to business delays and additional business expense. If we fail to give these notifications, we may be subject to significant fines and penalties and damaged working relations with these governmental agencies.
In addition, workers’ compensation insurance is statutorily provided for in all of the states in which we do business. State laws and regulations provide for the form and content of policy coverage and the rights and benefits that are available to injured workers, their representatives and medical providers. For example, in California, on January 1, 2003, workers’ compensation legislation became effective that provided for increases in the benefits payable to injured workers. Also, in California, workers’ compensation legislation intended to reduce certain costs was enacted in September 2003 and April 2004. Among other things, this legislation established an independent medical review process for resolving medical disputes, tightened standards for determining impairment ratings by applying specific medical treatment guidelines, capped temporary total disability payments to 104 weeks from first payment and enabled injured workers to access immediate medical care up to $10,000 but required them to get medical care through a network of doctors chosen by the employer. The implementation of these reforms affects the manner in which we coordinate medical care costs with employers and the manner in which we oversee treatment plans. However, the reforms are subject to continuing opposition in the California legislature, in the courts and by ballot initiatives, any of which could overturn or substantially amend the reforms and regulatory rules applicable to the legislation. Since the passage of the 2003 and 2004 reforms, bills have been introduced to roll back many areas of significant reform. Some compromise measures have succeeded. In October 2011, the governor of California vetoed several workers’ compensation bills that would have increased costs in California’s workers’ compensation system. Legislative attempts to erode the 2003 and 2004 reforms are expected to continue. We cannot predict the ultimate impact of the reforms or of any amendments to them.
Our business is also affected by federal laws, including the USL&H Act, which is administered by the Department of Labor, and the Merchant Marine Act of 1920, or Jones Act. The USL&H Act contains various provisions affecting our business, including the nature of the liability of employers of longshoremen, the rate of compensation to an injured longshoreman, the selection of physicians, compensation for disability and death and the filing of claims.
In addition, we are impacted by the Terrorism Risk Act and by the Gramm-Leach-Bliley Act of 2002 related to disclosure of personal information. The Gramm-Leach-Bliley Act, which, among other things, protects consumers from the unauthorized dissemination of certain personal information, and various state laws and regulations addressing privacy issues, require us to maintain appropriate procedures for managing and protecting certain personal information of our customers and to fully disclose our privacy practices to our customers. The Terrorism Risk Act requires that commercial property and casualty insurance companies offer coverage for certain acts of terrorism and has established a federal assistance program through the end of 2014 to help insurers cover claims arising out of such acts. Although SeaBright Insurance Company is protected by federally funded terrorism reinsurance to the extent provided for in the Terrorism Risk Act, there are limitations and restrictions on this protection, including a substantial deductible that must be met, which could have an adverse effect on our financial condition or results of operations. Potential future changes to the Terrorism Risk Act could also adversely affect us by causing our reinsurers to increase prices or withdraw from certain markets where terrorism coverage is required. See the discussion under “Risks Related to Our Industry — The threat of terrorism and military and other actions may result in decreases in our net income, revenue and assets under management and may adversely affect our investment portfolio” in Part I, Item 1A of this annual report.
On July 21, 2010, the President signed into law the Dodd Frank Wall Street Reform and Consumer Protection Act (the “Dodd-Frank Act”), which has significant implications for the insurance industry. In addition to imposing a number of new compliance obligations on publicly traded companies, the Dodd-Frank Act established the Financial Services Oversight Council (“FSOC”), which is authorized to recommend that certain systemically significant non-bank financial companies, including insurance companies, be regulated by the Board of Governors of the Federal Reserve. The Dodd-Frank Act also created within the United States Department of the Treasury a new Federal Insurance Office (“FIO”) and authorizes the federal preemption of certain state insurance laws. The FSOC and the FIO are authorized to study, monitor and report to Congress on the U.S. insurance industry and the significance of global reinsurance to the U.S. insurance market. Many sections of the Dodd-Frank Act will become effective over time, and certain provisions of the Dodd-Frank Act require the implementation of regulations that have not yet been adopted. The potential impact of the Dodd-Frank Act on the U.S. insurance industry is not clear. However, our business could be affected by changes to the U.S. system of insurance regulation or our designation or the designation of insurers or reinsurers with which we do business as systemically significant non-bank financial companies.
For the past several years, the financial markets have experienced a period of extreme turmoil, including the bankruptcy, restructuring or sale of certain financial institutions, which resulted in unprecedented intervention by the U.S. federal government, including unprecedented levels of direct investment by the federal government in certain financial and insurance institutions. While the ultimate outcome of governmental initiatives intended to alleviate the recent financial crisis cannot be predicted, it is likely that governmental authorities may seek to exercise their supervisory or enforcement power in new or more robust ways, which could affect our business and the way we manage our capital, and may require us to satisfy increased capital requirements or impose additional restrictions on us.
This extensive regulation of our business may affect the cost or demand for our products and may limit our ability to obtain rate increases or to take other actions that we might desire to increase our profitability. In addition, we may be unable to maintain all required approvals or comply fully with the wide variety of applicable laws and regulations, which are continually undergoing revision, or the relevant authority’s interpretation of such laws and regulations.
Our geographic concentration ties our performance to the business, economic and regulatory conditions in California, Louisiana, Alaska and Texas. Any single catastrophe or other condition affecting losses in these states could adversely affect our results of operations.
Our business is concentrated in California (approximately 49.2% of direct premiums written for the year ended December 31, 2011), Louisiana (approximately 8.7% of direct premiums written for the same period), Texas (approximately 6.0% of direct premiums written for the same period) and Alaska (approximately 4.6% of direct premiums written for the same period). Accordingly, unfavorable business, economic or regulatory conditions in those states could negatively impact our business. For example, California, Louisiana, Texas and Alaska are states that are susceptible to severe natural perils, such as tsunamis, earthquakes, tornados and hurricanes, along with the possibility of terrorist acts. Accordingly, we could suffer losses as a result of catastrophic events in those states. Although geographic concentration has not adversely affected our business in the past, we may in the future be exposed to economic and regulatory risks or risks from natural perils that are greater than the risks faced by insurance companies that conduct business over a greater geographic area. This concentration of our business could have a material adverse effect on our financial condition or results of operations.
If we are unable to obtain or collect on our reinsurance protection, our business, financial condition and results of operations could be materially adversely affected.
The agreements for our current workers’ compensation excess of loss reinsurance treaty program expire on September 30, 2012. Any decrease in the amount of our reinsurance at the time of renewal, whether caused by the existence of more restrictive terms and conditions or decreased availability, will also increase our risk of loss and, as a result, could materially adversely affect our business, financial condition and results of operations. We have not experienced difficulty in qualifying for or obtaining sufficient reinsurance to appropriately cover our risks in the past. We currently have nine reinsurers participating in our excess of loss reinsurance treaty program, and believe that this is a sufficient number of reinsurers to provide us with reinsurance in the volume that we require. However, it is possible that one or more of our current reinsurers could cancel participation, or we could find it necessary to cancel the participation of one of our reinsurers, in our excess of loss reinsurance treaty program. In either of those events, if our reinsurance broker is unable to spread the cancelled or terminated reinsurance among the remaining reinsurers in the program, we estimate that it could take approximately one to three weeks or longer to identify and negotiate appropriate documentation with a replacement reinsurer. During this time, we could be exposed to an increased risk of loss, the extent of which would depend on the volume of cancelled reinsurance.
In addition, we are subject to credit risk with respect to our reinsurers. Reinsurance protection that we receive does not discharge our direct obligations under the policies we write. We remain liable to our policyholders, even if we are unable to make recoveries to which we believe we are entitled under our reinsurance contracts. Losses may not be recovered from our reinsurers until claims are paid, and, in the case of long-term workers’ compensation cases, the creditworthiness of our reinsurers may change before we can recover amounts to which we are entitled. Although we have not experienced problems in the past resulting from the failure of a reinsurer to pay our claims in a timely manner, if we experience this problem in the future, our costs would increase and our revenues would decline. As of December 31, 2011, we had $94.2 million of amounts recoverable from our reinsurers, excluding the receivable on our adverse development cover, that we would be obligated to pay if our reinsurers failed to pay us.
A downgrade in the A.M. Best rating of our insurance subsidiary could reduce the amount of business we are able to write.
Rating agencies rate insurance companies based on each company’s ability to pay claims. Our insurance company subsidiary currently has a rating of “A-” (Excellent) from A.M. Best. In August 2011, A.M. Best reviewed our rating and outlook and maintained our rating of “A-” (Excellent) with “Negative” outlook, indicating the possibility of a rating downgrade due to unfavorable financial/market trends relative to the current rating level. A.M. Best, is the rating agency that we believe has the most influence on our business. The ratings of A.M. Best are subject to periodic review using, among other things, proprietary capital adequacy models, and are subject to revision or withdrawal at any time. Insurance ratings are directed toward the concerns of policyholders and insurance agents and are not intended for the protection of investors or as a recommendation to buy, hold or sell any of our securities. Our competitive position relative to other companies is determined in part by our A.M. Best rating. We believe that our business is particularly sensitive to our A.M. Best rating because we focus on larger customers which tend to give substantial weight to the A.M. Best rating of their insurers. We expect that any reduction in our A.M. Best rating below “A-” would cause a reduction in the number of policies we write and could have a material adverse effect on our results of operations and our financial position.
The effects of emerging claim and coverage issues on our business are uncertain.
As industry practices and legal, judicial, social and other environmental conditions change, unexpected and unintended issues related to claims and coverage may emerge. These issues may adversely affect our business by either extending coverage beyond our underwriting intent or by increasing the number or size of claims. In some instances, these changes may not become apparent until some time after we have issued insurance contracts that are affected by the changes. As a result, the full extent of liability under our insurance contracts may not be known for many years after a contract is issued. For example, the number or nature of existing occupational diseases may expand beyond our expectation. In addition, medical claims costs associated with permanent and partial disabilities may inflate more rapidly or higher than we currently expect. Expansions of this nature may expose us to more claims than we anticipated when we wrote the underlying policy.
Intense competition could adversely affect our ability to sell policies at rates we deem adequate.
In most of the states in which we operate, we face significant competition which, at times, is intense. If we are unable to compete effectively, our business and financial condition could be materially adversely affected. Competition in our businesses is based on many factors, including premiums charged, services provided, financial strength ratings assigned by independent rating agencies, speed of claims payments, reputation, perceived financial strength and general experience. We compete with regional and national insurance companies and state-sponsored insurance funds, as well as potential insureds that have decided to self-insure. Our principal competitors include ALMA, Chartis (AIG), Hartford, Liberty Mutual, Old Republic, PMA Insurance, Signal Mutual, Travelers and Zurich. Many of our competitors have substantially greater financial and marketing resources than we do, and some of our competitors, including the State Compensation Insurance Fund of California, benefit financially by not being subject to federal income tax.
In addition, our competitive advantage may be limited due to the small number of insurance products we offer. Some of our competitors, such as Chartis (AIG) or Zurich, have additional competitive leverage because of the wide array of insurance products they offer. For example, a potential customer may consider it more convenient to purchase multiple types of insurance products from one insurance carrier. We do not offer a wide array of insurance products due to our targeted market niches, and we may lose potential customers to our larger, more diverse competitors as a result.
As explained under the heading “Regulation – Federal and State Legislative and Regulatory Changes” in Part I, Item 1 of this annual report, we have experienced significant changes in our premium rates since 2003. Most recently, we increased our premium rates for business written in California, our largest state by premiums volume, by an average of 5.0% effective January 1, 2009, 10.6% effective August 1, 2009, 15.3% effective September 1, 2010, and 10.9% effective January 1, 2012. We have also increased our premium rates in other states. If other insurers do not adopt rate changes similar to ours, we may be unable to compete effectively and our business, financial condition and results of operations could be materially adversely affected.
If we are unable to realize our investment objectives, our financial condition may be adversely affected.
Investment income is an important component of our revenues and net income. The ability to achieve our investment objectives is affected by factors that are beyond our control. For example, the significant downturn in the United States economy generally could cause our investment income to decrease. Interest rates are highly sensitive to many factors, including governmental monetary policies and domestic and international economic and political conditions. The United States’ participation in hostilities with other countries, acts of terrorism or large-scale natural disasters or catastrophic events may further adversely affect the economy generally. These and other factors also affect the capital markets, and, consequently, the value of the securities we own. The outlook for our investment income is dependent on the future direction of interest rates and the amount of cash flows from operations that are available for investment. The fair values of fixed maturity investments that are “available-for-sale” fluctuate with changes in interest rates and cause fluctuations in our stockholders’ equity. Any significant decline in our investment income as a result of rising interest rates or general market conditions would have an adverse effect on our net income and, as a result, on our stockholders’ equity and our policyholders’ surplus. See “Liquidity and Capital Resources” in Part II, Item 7 of this annual report for a discussion of the limited exposure in our investment portfolio at December 31, 2011 to sub-prime mortgages.
The capital markets in the United States and elsewhere experienced extreme volatility and disruption in 2008 and 2009, and, to a lesser extent, in 2010 and 2011. We are exposed to significant capital markets risk, including changes in interest rates, credit spreads, equity prices and foreign exchange rates. Our investment portfolio has been affected by these changes in the capital markets. For example, for the year ended December 31, 2008, we recorded an impairment charge of $13.4 million for other-than-temporary losses related principally to our preferred stock investments and holdings of equity indexed securities exchange-traded funds. In addition, changes in interest rates and credit quality may result in fluctuations in the income derived from, or the valuation of, our fixed income securities. Our investment portfolio is also subject to credit and cash flow risk, including risks associated with our investment in asset-backed and mortgage-backed securities, and the risk that issuers in our portfolio may cease operations or other events may cause our investments to become illiquid. Further adverse changes in the capital markets could result in other-than-temporary impairments in the future, which may affect our financial condition, or could reduce our investment income, which would adversely affect our results of operations.
As of December 31, 2011, our investment portfolio included approximately $351.0 million of debt securities issued by various states, counties, cities and other municipal issuers. Many of these issuers are operating under deficits or projected deficits due to many factors, including the impact of the prolonged economic recession and downturn. A continuation or worsening of current economic conditions could cause the value of these securities to decline or could cause some issuers of securities in our portfolio to default on their obligations. If issuers of municipal securities we hold default on, or delay payment of, their obligations, or if bond insurers default on their obligations or the amount of bond insurance is inadequate, our financial position and results of operations may suffer harm, which could be material.
See “Investments” in Part I, Item 1 of this annual report for a discussion of the exposure in our investment portfolio at December 31, 2011 to sub-prime mortgages and the European sovereign debt crisis.
We could be adversely affected by the loss of one or more principal employees or by an inability to attract and retain staff.
Our success will depend in substantial part upon our ability to attract and retain qualified executive officers, experienced underwriting talent and other skilled employees who are knowledgeable about our business. We rely substantially upon the services of our senior management team and key employees, consisting of John G. Pasqualetto, Chairman, President and Chief Executive Officer; Richard J. Gergasko, Chief Operating Officer; Neal A. Fuller, Senior Vice President, Chief Financial Officer and Assistant Secretary; D. Drue Wax, Senior Vice President, General Counsel and Corporate Secretary; Richard W. Seelinger, Senior Vice President — Policyholder Services; Marc B. Miller, M.D., Senior Vice President and Chief Medical Officer; Jeffrey C. Wanamaker, Senior Vice President — Underwriting; Christopher Desautel, Senior Vice President and Chief Information Officer — SeaBright Insurance Company; M. Philip Romney, Vice President — Finance, Principal Accounting Officer and Assistant Secretary; and Craig A. Pankow, President — PointSure. Although we are not aware of any planned departures or retirements, if we were to lose the services of members of our management team, our business could be adversely affected. Many of our principal employees possess skills and extensive experience relating to our market niches. Were we to lose any of these employees, it may be challenging for us to attract a replacement employee with comparable skills and experience in our market niches. We have employment agreements with some of our executive officers, which will be described in our proxy statement for the 2012 annual meeting of stockholders and incorporated by reference into Part III, Item 11 of this annual report. We do not currently maintain key man life insurance policies with respect to any member of our senior management team or other employees.
We may require additional capital in the future, which may not be available or only available on unfavorable terms.
Our future capital requirements depend on many factors, including our ability to write new business successfully and to establish premium rates and loss reserves at levels sufficient to cover losses. We believe that cash provided by operations will satisfy our capital requirements for the foreseeable future. However, because the timing and amount of our future needs for capital will depend on our growth and profitability, we cannot provide any assurance in this regard. If we had to raise additional capital, equity or debt financing may not be available at all or may be available only on terms that are not favorable to us. In the case of equity financings, dilution to our stockholders could result, and in any case such securities may have rights, preferences and privileges that are senior to those of the shares currently outstanding. If we cannot obtain adequate capital on favorable terms or at all, we may be unable to support future growth or operating requirements and, accordingly, our business, financial condition or results of operations could be materially adversely affected.
Our status as an insurance holding company with no direct operations could adversely affect our ability to pay dividends in the future.
We are a holding company that transacts our business through our operating subsidiaries, SeaBright Insurance Company, PointSure, and PMCS. Our primary assets are the stock of these operating subsidiaries. Our ability to pay expenses and dividends depends, in the long run, upon the surplus and earnings of our subsidiaries and the ability of our subsidiaries to pay dividends to us. Payment of dividends by SeaBright Insurance Company is restricted by state insurance laws, including laws establishing minimum solvency and liquidity thresholds, and could be subject to contractual restrictions in the future, including those imposed by indebtedness we may incur in the future. SeaBright Insurance Company is required to report any ordinary dividends to the Illinois Department of Insurance and the California Department of Insurance prior to the payment of the dividend. In addition, SeaBright Insurance Company is not authorized to pay any extraordinary dividends to us under Illinois or California insurance laws without prior regulatory approval from the Illinois Department of Insurance or the California Department of Insurance. See the discussion under the heading “Regulation — Dividend Limitations” in Part I, Item 1 of this annual report. As a result, at times, we may not be able to receive dividends from SeaBright Insurance Company and we may not receive dividends in amounts necessary to pay dividends on our capital stock. In addition, the payment of dividends by us is within the discretion of our Board of Directors and will depend on numerous factors, including our financial condition, our capital requirements and other factors that our Board of Directors considers relevant.
We rely on independent insurance brokers to distribute our products.
Our business depends in part on the efforts of independent insurance brokers to market our insurance programs successfully and produce business for us, as well as our ability to offer insurance programs and services that meet the requirements of the clients and customers of these brokers. The majority of the business in our workers’ compensation operations is produced by a group of licensed insurance brokers that totaled approximately 235 at December 31, 2011. Brokers are not obligated to promote our insurance programs and may sell competitors’ insurance programs. Several of our competitors, including Chartis (AIG) and Zurich, offer a broader array of insurance programs than we do. Accordingly, our brokers may find it easier to promote the broader range of programs of our competitors than to promote our niche selection of insurance products. If our brokers fail or choose not to market our insurance programs successfully or to produce business for us, our growth may be limited and our financial condition and results of operations may be negatively affected.
Assessments and other surcharges for guaranty funds and second injury funds and other mandatory pooling arrangements may reduce our profitability.
Virtually all states require insurers licensed to do business in their state to bear a portion of the unfunded obligations of impaired or insolvent insurance companies. These obligations are funded by assessments that are expected to continue in the future as a result of insolvencies. Assessments are levied by guaranty associations within the state, up to prescribed limits, on all member insurers in the state on the basis of the proportionate share of the premium written by member insurers in the lines of business in which the impaired, insolvent or failed insurer is engaged. See the discussion under the heading “Regulation” in Part I, Item 1 of this annual report. Accordingly, the assessments levied on us may increase as we increase our premiums written. Further, Washington state legislation enacted on April 20, 2005 created a separate account within the Guaranty Fund for USL&H Act claims and authorized prefunding of potential insolvencies in order to establish a cash balance. Many states also have laws that established second injury funds to provide compensation to injured employees for aggravation of a prior condition or injury, which are funded by either assessments based on paid losses or premium surcharge mechanisms. For example, Alaska requires insurers to contribute to its second injury fund annually an amount equal to the compensation the injured employee is owed multiplied by a contribution rate based on the fund’s reserve rate. In addition, as a condition of the ability to conduct business in some states, including California, insurance companies are required to participate in mandatory workers’ compensation shared market mechanisms or pooling arrangements, which provide workers’ compensation insurance coverage from private insurers. These pooling arrangements require us to assume a portion of the insurance written by a state-mandated pool. Although we price our products to account for the obligations that we may have under these pooling arrangements, we may not be successful in estimating our liability for these obligations. Accordingly, our prices may not fully account for our liabilities under pooling arrangements, which may cause a decrease in our profits. As we write policies in new states that have pooling arrangements, we will be required to participate in additional pooling arrangements. Further, the insolvency of other insurers in these pooling arrangements would likely increase the liability for other members remaining in the pool. The effect of these assessments and mandatory shared market mechanisms or changes in them could reduce our profitability in any given period or limit our ability to grow our business.
In the event LMC is placed into receivership, we could lose our rights to fee income and protective arrangements that were established in connection with the Acquisition, our reputation and credibility could be adversely affected and we could be subject to claims under applicable voidable preference and fraudulent transfer laws.
The assets that SeaBright acquired in the Acquisition were acquired from LMC and certain of its affiliates. LMC and its insurance company affiliates are currently operating under a voluntary “run-off” plan approved by the Illinois Department of Insurance. Under the run-off plan, LMC has instituted aggressive expense control measures to reduce its future loss exposure and allow it to meet its obligations to current policyholders. According to LMC’s statutory financial statements, as of and for the year ended December 31, 2011, LMC, and another company under common management with LMC, had a combined statutory surplus of $41.3 million (unaudited), a decrease of approximately $3.9 million from its surplus of $45.2 million (audited) as of December 31, 2010. In connection with the Acquisition, we established various arrangements with LMC and certain of its affiliates, including (1) servicing arrangements entitling us to fee income for providing claims administration services for Eagle and (2) other protective arrangements designed to minimize our exposure to any past business underwritten by KEIC, the shell entity that we acquired from LMC for its insurance licenses, and any adverse developments in KEIC’s loss reserves as they existed at the date of the Acquisition. See the discussion under the heading “Loss Reserves — KEIC Loss Reserves” in Part I, Item 1 of this annual report. In the event LMC is placed into receivership, our business could be adversely affected in the following ways:
We may pursue strategic mergers, acquisitions, and divestitures which could have an adverse impact on our business.
In December 2007, we acquired PMCS, a provider of medical bill review, utilization review, nurse case management and other related services, and in July 2008 we acquired BWNV, a privately held managing general agent and wholesale insurance broker. We may, from time to time, consider acquiring additional complementary companies or businesses. To do so, we would need to identify suitable acquisition candidates and negotiate acceptable acquisition terms. Pursuit of an acquisition may divert management’s attention and resources, and completion of an acquisition will require use of our capital and may require additional financing. If we complete additional acquisitions, we may have difficulty integrating acquired businesses into our existing businesses, which could adversely affect our operations, particularly in the fiscal quarters immediately following the acquisition as they are integrated into our operations.
If we are unable to collect future retrospective premium adjustments under our retrospectively rated policies, our financial position and results of operations may be adversely affected.
Retrospectively rated policies accounted for approximately 6.6% and 5.9% of direct premiums written in the years ended December 31, 2011 and 2010, respectively. Beginning six months after the expiration of the relevant insurance policy, and annually thereafter, we recalculate the premium during the policy term based on the current value of the known losses that occurred during the policy term. While the typical retrospectively rated policy has around five annual adjustment or measurement periods, premium adjustments continue until mutual agreement to cease future adjustments is reached with the policyholder. We bear credit risk with respect to retrospectively rated policies. Because of the long duration of our loss sensitive plans, there is a risk that the customer will fail to pay the additional premium. Accordingly, we obtain collateral in the form of letters of credit or deposits to mitigate credit risk associated with our loss sensitive plans. If we are unable to collect future retrospective premium adjustments from an insured, we would be required to write off the related amounts, which could impact our financial position and results of operations.
We may face substantial exposure to losses from terrorism for which we are required by law to provide coverage.
Under our workers’ compensation policies, we are required to provide workers’ compensation benefits for losses arising from acts of terrorism. The impact of any terrorist act is unpredictable, and the ultimate impact on us would depend upon the nature, extent, location and timing of such an act. Notwithstanding the protection provided by the reinsurance we have purchased and any protection provided by the Terrorism Risk Act, the risk of severe losses to us from acts of terrorism has not been eliminated because, as discussed above, our excess of loss reinsurance treaty program contains various sub-limits and exclusions limiting our reinsurers’ obligation to cover losses caused by acts of terrorism. Accordingly, events may not be covered by, or may exceed the capacity of, our reinsurance protection and any protection offered by the Terrorism Risk Act or any successor legislation. Thus, any acts of terrorism could materially adversely affect our business and financial condition.
The threat of terrorism and military and other actions may result in decreases in our net income, revenue and assets under management and may adversely affect our investment portfolio.
The threat of terrorism, both within the United States and abroad, and military and other actions and heightened security measures in response to these types of threats, may cause significant volatility and declines in the equity markets in the United States and abroad, as well as loss of life, property damage, additional disruptions to commerce and reduced economic activity. Actual terrorist attacks could cause a decrease in our stockholders’ equity, net income and/or revenue. The effects of these changes may result in a decrease in our stock price. In addition, some of the assets in our investment portfolio may be adversely affected by declines in the bond markets and declines in economic activity caused by the continued threat of terrorism, ongoing military and other actions and heightened security measures.
We cannot predict at this time whether and the extent to which industry sectors in which we maintain investments may suffer losses as a result of potential decreased commercial and economic activity, or how any such decrease might impact the ability of companies within the affected industry sectors to pay interest or principal on their securities, or how the value of any underlying collateral might be affected.
We can offer no assurances that terrorist attacks or the threat of future terrorist events in the United States and abroad or military actions by the United States will not have a material adverse effect on our business, financial condition or results of operations.
Our results of operations and revenues may fluctuate as a result of many factors, including cyclical changes in the insurance industry, which may cause the price of our common stock to be volatile.
The results of operations of companies in the insurance industry historically have been subject to significant fluctuations and uncertainties. Our profitability can be affected significantly by:
The availability of insurance is related to prevailing prices, the level of insured losses and the level of industry surplus which, in turn, may fluctuate in response to changes in rates of return on investments being earned in the insurance industry. As a result, the insurance business historically has been a cyclical industry characterized by periods of intense price competition due to excessive underwriting capacity as well as periods when shortages of capacity permitted favorable premium levels. During 1998, 1999 and 2000, the workers’ compensation insurance industry experienced substantial pricing competition, and this pricing competition greatly affected the ability of our predecessor to increase premiums. Beginning in 2001, our predecessor witnessed a decrease in pricing competition in the industry, which enabled them to raise their rates. Although rates for many products increased from 2000 to 2003, legislative reforms caused premium rates in certain states, including California, to decrease in 2004 through 2008, and rates may decrease again or may decrease in other states. In addition, the availability of insurance has and may continue to increase, either by capital provided by new entrants or by the commitment of additional capital by existing insurers, which may perpetuate rate decreases. Any of these factors could lead to a significant reduction in premium rates, less favorable policy terms and fewer submissions for our underwriting services. In addition to these considerations, changes in the frequency and severity of losses suffered by insureds and insurers may affect the cycles of the insurance business significantly, and we expect to experience the effects of such cyclicality. This cyclicality may cause the price of our securities to be volatile.
The price of our common stock may decrease.
The trading price of shares of our common stock has declined in recent years and may continue to decline for many reasons, some of which are beyond our control, including, among others:
In addition, the stock market has recently experienced substantial price and volume fluctuations that sometimes have been unrelated or disproportionate to the operating performance of companies whose shares are traded. The trading price of shares of our common stock may decrease if our future operating results fail to meet or exceed the expectations of market analysts and investors or current economic or market conditions persist or worsen.
Applicable insurance laws may make it difficult to effect a change of control of our company.
Our insurance company subsidiary is domiciled in the state of Illinois and commercially domiciled in the state of California. The insurance holding company laws of Illinois and California require advance approval by the Illinois Department of Insurance and the California Department of Insurance of any change in control of SeaBright Insurance Company. “Control” is generally presumed to exist through the direct or indirect ownership of 10% or more of the voting securities of a domestic insurance company or of any entity that controls a domestic insurance company. In addition, insurance laws in many states contain provisions that require prenotification to the insurance commissioners of a change in control of a non-domestic insurance company licensed in those states. Any future transactions that would constitute a change in control of SeaBright Insurance Company, including a change of control of us, would generally require the party acquiring control to obtain the prior approval of the Illinois Department of Insurance and the California Department of Insurance and may require pre-acquisition notification in applicable states that have adopted pre-acquisition notification provisions. Obtaining these approvals may result in a material delay of, or deter, any such transaction. See the discussion under the heading “Regulation” in Part I, Item 1 of this annual report.
These laws may discourage potential acquisition proposals and may delay, deter or prevent a change of control of us, including through transactions, and in particular unsolicited transactions, that some or all of our stockholders might consider to be desirable.
Anti-takeover provisions in our amended and restated certificate of incorporation and by-laws and under the laws of the State of Delaware could impede an attempt to replace or remove our directors or otherwise effect a change of control of our company, which could diminish the value of our common stock.
Our amended and restated certificate of incorporation and by-laws contain provisions that may make it more difficult for stockholders to replace directors even if the stockholders consider it beneficial to do so. In addition, these provisions could delay or prevent a change of control that a stockholder might consider favorable. For example, these provisions may prevent a stockholder from receiving the benefit from any premium over the market price of our common stock offered by a bidder in a potential takeover. Even in the absence of an attempt to effect a change in management or a takeover attempt, these provisions may adversely affect the prevailing market price of our common stock if they are viewed as discouraging takeover attempts in the future. In addition, Section 203 of the Delaware General Corporation Law may limit the ability of an “interested stockholder” to engage in business combinations with us. An interested stockholder is defined to include persons owning 15% or more of any class of our outstanding voting stock.
Our amended and restated certificate of incorporation and by-laws contain the following provisions that could have an anti-takeover effect:
These provisions may make it difficult for stockholders to replace management and could have the effect of discouraging a future takeover attempt which is not approved by our Board of Directors but which individual stockholders might consider favorable.
None.
Our principal executive offices are located in approximately 36,090 square feet of leased office space in Seattle, Washington. We also lease office space consisting of approximately 2,470 square feet in Anchorage, Alaska; 5,650 square feet in Chicago, Illinois; 4,640 square feet in Las Vegas, Nevada; 2,650 square feet in Honolulu, Hawaii; 3,280 square feet in Houston, Texas; 17,040 square feet in Orange, California; 6,260 square feet in Phoenix, Arizona; 3,910 square feet in Radnor, Pennsylvania; 8,830 square feet in Santa Ana, California; 400 square feet in Yucca Valley, California; and an executive suite in Benicia, California. We conduct claims and underwriting operations in our branch offices, with the exception of our Honolulu office, where we conduct only claims and loss control operations. We do not own any real property. We consider our leased facilities to be adequate for our current operations.
We are, from time to time, involved in various legal proceedings in the ordinary course of business. We believe we have sufficient loss reserves and reinsurance to cover claims under policies issued by us. Accordingly, we do not believe that the resolution of any currently pending legal proceedings, either individually or taken as a whole, will have a material adverse effect on our business, financial condition or results of operations.
None.
The information required by this item is incorporated by reference from the section captioned “Executive Officers and Key Employees” contained in our proxy statement for the 2012 annual meeting of stockholders, to be filed with the Commission pursuant to Regulation 14A not later than 120 days after December 31, 2011.
PART II
Item 5. Market for Registrant’s Common Equity, Related Stockholder Matters and Issuer Purchases of Equity Securities.
Our common stock is listed on the New York Stock Exchange under the symbol “SBX”. The following table sets forth, for the periods indicated, the high and low sales prices for our common stock as quoted on the New York Stock Exchange.
| | | High | | | Low | |
| 2011: | | | | | | |
First quarter | | $ | 10.55 | | | $ | 9.13 | |
Second quarter | | | 10.40 | | | | 9.19 | |
Third quarter | | | 11.11 | | | | 5.14 | |
Fourth quarter | | | 7.99 | | | | 5.97 | |
| | | | | | | | | |
| 2010: | | | | | | | | |
First quarter | | $ | 11.88 | | | $ | 9.58 | |
Second quarter | | | 11.52 | | | | 9.46 | |
Third quarter | | | 10.09 | | | | 6.53 | |
Fourth quarter | | | 9.46 | | | | 7.62 | |
As of March 2, 2012, there were 104 holders of record of our common stock.
Dividend Policy
In 2011, our Board of Directors declared quarterly cash dividends of $0.05 per common share on March 8, May 10, August 9 and November 8. In 2010, our Board of Directors declared quarterly cash dividends of $0.05 per common share on March 2, May 11, August 10 and November 9. Any future determination to pay cash dividends on our common stock will be at the discretion of our Board of Directors and will be dependent on our earnings, financial condition, operating results, capital requirements, any contractual restrictions, regulatory and other restrictions on the payment of dividends by our subsidiaries to us, and other factors that our Board of Directors deems relevant.
We are a holding company and have no direct operations. Our ability to pay dividends in the future depends on the ability of our operating subsidiaries to pay dividends to us. Our subsidiary, SeaBright Insurance Company, is a regulated insurance company and therefore is subject to significant regulatory restrictions limiting its ability to declare and pay dividends.
SeaBright Insurance Company’s ability to pay dividends is subject to restrictions contained in the insurance laws and related regulations of Illinois and California. The insurance holding company laws in these states require that ordinary dividends be reported to the Illinois Department of Insurance and the California Department of Insurance prior to payment of the dividend and that extraordinary dividends be submitted for prior approval. See “Regulation” in Part I, Item 1 of this annual report.
For information regarding restrictions on the payment of dividends by us and SeaBright Insurance Company, see the discussion under the heading “Liquidity and Capital Resources” in Part II, Item 7 and the discussion under the heading “Business — Regulation — Dividend Limitations” in Part I, Item 1 of this annual report.
Sales of Unregistered Securities
We did not sell any equity securities during 2011 that were not registered under the Securities Act of 1933, as amended.
Purchases of Equity Securities by the Issuer
No purchases of shares of our common stock were made by, or on behalf of, us or any affiliated purchaser during the three months ended December 31, 2011.
Performance Graph
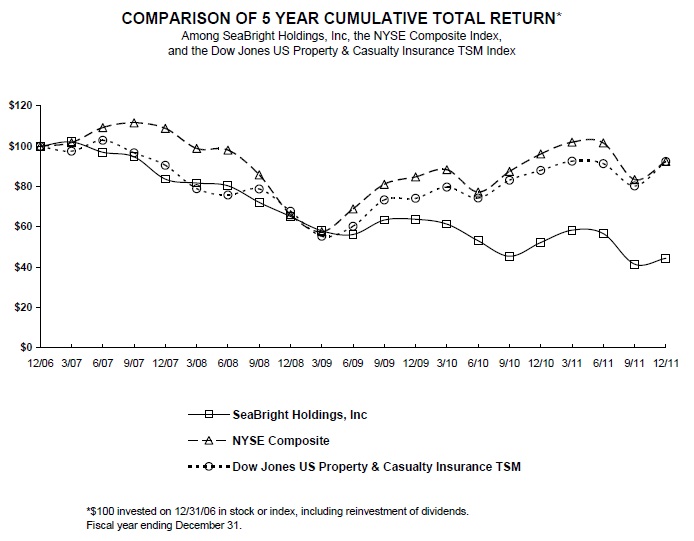
The following graph and table compare the total return on $100 invested in SeaBright common stock for the period commencing on December 31, 2006 and ending on December 31, 2011 with the total return on $100 invested in each of the New York Stock Exchange Composite Index and the Dow Jones U.S. Property & Casualty Insurance TSM Index. The closing market price for SeaBright common stock at the end of fiscal year 2011 was $7.65.
________________
| * | Based on $100 invested on December 31, 2006, the last trading day before the beginning of the fifth preceding fiscal year and, for purposes of the indexes, assumes the reinvestment of dividends. |
| | | Cumulative Total Return | |
| | | SeaBright Holdings, Inc. | | | NYSE Composite Index | | | Dow Jones U.S. Property & Casualty Insurance TSM Index | |
12/31/06 | | $ | 100.00 | | | $ | 100.00 | | | $ | 100.00 | |
3/31/07 | | | 102.17 | | | | 101.83 | | | | 97.58 | |
6/30/07 | | | 97.06 | | | | 109.30 | | | | 102.97 | |
9/30/07 | | | 94.78 | | | | 111.65 | | | | 96.73 | |
12/31/07 | | | 83.73 | | | | 108.87 | | | | 90.57 | |
3/31/08 | | | 81.79 | | | | 98.93 | | | | 78.96 | |
6/30/08 | | | 80.40 | | | | 98.10 | | | | 75.83 | |
9/30/08 | | | 72.18 | | | | 85.85 | | | | 78.81 | |
12/31/08 | | | 65.19 | | | | 66.13 | | | | 67.78 | |
3/31/09 | | | 58.08 | | | | 57.64 | | | | 55.37 | |
6/30/09 | | | 56.25 | | | | 68.95 | | | | 60.34 | |
9/30/09 | | | 63.41 | | | | 81.16 | | | | 73.40 | |
12/31/09 | | | 63.80 | | | | 84.83 | | | | 74.19 | |
3/31/10 | | | 61.40 | | | | 88.41 | | | | 79.75 | |
6/30/10 | | | 53.14 | | | | 77.31 | | | | 74.35 | |
9/30/10 | | | 45.46 | | | | 87.50 | | | | 83.18 | |
12/31/10 | | | 52.28 | | | | 96.19 | | | | 88.01 | |
3/31/11 | | | 58.41 | | | | 102.05 | | | | 92.61 | |
6/30/11 | | | 56.70 | | | | 101.67 | | | | 91.40 | |
9/30/11 | | | 41.54 | | | | 83.51 | | | | 80.31 | |
12/31/11 | | | 44.43 | | | | 92.50 | | | | 92.48 | |
The information in the graph and table above is not “soliciting material,” is not deemed “filed” with the SEC and is not to be incorporated by reference in any of our filings under the Securities Act of 1933, as amended, or the Securities Exchange Act of 1934, as amended (the “Exchange Act”), whether made before or after the date of this annual report and irrespective of any general incorporation language in any such filing, except to the extent that we specifically incorporate such information by reference.
Item 6. Selected Financial Data.
The following table sets forth our selected historical financial information for the periods ended and as of the dates indicated. This information comes from our consolidated financial statements. Certain reclassifications have been made to prior year financials statements to conform to classifications used in the current year. For further information, see Part II, Item 8, Note 2, “Summary of Significant Accounting Policies”. You should read the following selected financial information along with the information contained in this annual report, including Part II, Item 7 of this annual report entitled “Management’s Discussion and Analysis of Financial Condition and Results of Operations” and the combined and consolidated financial statements and related notes and the reports of the independent registered public accounting firm included in Part II, Item 8 and elsewhere in this annual report. These historical results are not necessarily indicative of results to be expected from any future period.
| | | Year Ended December 31, | |
| | | 2011 | | | 2010 | | | 2009 | | | 2008 | | | 2007 | |
| | | ($ in thousands, except share and per share data) | |
| Income Statement Data: | | | | | | | | | | | | | | | |
Gross premiums written | | $ | 261,392 | | | $ | 264,323 | | | $ | 290,002 | | | $ | 270,344 | | | $ | 282,658 | |
Ceded premiums written | | | (35,768 | ) | | | (24,109 | ) | | | (27,234 | ) | | | (14,520 | ) | | | (15,300 | ) |
Net premiums written | | $ | 225,624 | | | $ | 240,214 | | | $ | 262,768 | | | $ | 255,824 | | | $ | 267,358 | |
| | | | | | | | | | | | | | | | | | | | | |
Premiums earned | | $ | 249,551 | | | $ | 254,326 | | | $ | 244,427 | | | $ | 248,644 | | | $ | 227,995 | |
Claims service income | | | 1,261 | | | | 889 | | | | 1,011 | | | | 959 | | | | 1,711 | |
Net investment income | | | 21,041 | | | | 23,466 | | | | 23,132 | | | | 22,605 | | | | 20,307 | |
Other-than-temporary impairment losses | | | — | | | | — | | | | (258 | ) | | | (13,405 | ) | | | — | |
| Other net realized gains (losses) | | | 1,051 | | | | 15,425 | | | | (171 | ) | | | (476 | ) | �� | | (105 | ) |
Other income | | | 4,257 | | | | 4,253 | | | | 5,284 | | | | 5,207 | | | | 651 | |
Total revenues | | | 277,161 | | | | 298,359 | | | | 273,425 | | | | 263,534 | | | | 250,559 | |
| | | | | | | | | | | | | | | | | | | | | |
| Loss and loss adjustment expenses | | | 218,413 | | | | 223,050 | | | | 174,324 | | | | 141,935 | | | | 128,185 | |
| Underwriting, acquisition, and insurance expenses (1) | | | 75,521 | | | | 72,084 | | | | 72,837 | | | | 70,923 | | | | 58,784 | |
Interest expense | | | 525 | | | | 528 | | | | 599 | | | | 867 | | | | 1,139 | |
Goodwill impairment | | | — | | | | 1,527 | | | | — | | | | — | | | | — | |
Other expenses | | | 8,028 | | | | 7,509 | | | | 9,079 | | | | 7,668 | | | | 4,055 | |
Total expenses | | | 302,487 | | | | 304,698 | | | | 256,839 | | | | 221,393 | | | | 192,163 | |
Income (loss) before taxes | | | (25,326 | ) | | | (6,339 | ) | | | 16,586 | | | | 42,141 | | | | 58,396 | |
Income tax expense (benefit) | | | (10,800 | ) | | | (4,756 | ) | | | 3,051 | | | | 12,863 | | | | 18,484 | |
Net (loss) income | | $ | (14,526 | ) | | $ | (1,583 | ) | | $ | 13,535 | | | $ | 29,278 | | | $ | 39,912 | |
| | | | | | | | | | | | | | | | | | | | | |
Basic earnings (loss) per share | | $ | (0.69 | ) | | $ | (0.08 | ) | | $ | 0.65 | | | $ | 1.43 | | | $ | 1.96 | |
| Diluted earnings (loss) per share | | $ | (0.69 | ) | | $ | (0.08 | ) | | $ | 0.63 | | | $ | 1.38 | | | $ | 1.90 | |
| Weighted average basic shares outstanding | | | 21,118,711 | | | | 20,867,720 | | | | 20,702,572 | | | | 20,498,305 | | | | 20,341,931 | |
| Weighted average diluted shares outstanding | | | 21,118,711 | | | | 20,867,720 | | | | 21,515,153 | | | | 21,232,762 | | | | 20,976,525 | |
| Cash dividends declared per common share | | $ | 0.20 | | | $ | 0.20 | | | $ | — | | | $ | — | | | $ | — | |
| Selected Insurance Ratios: | | | | | | | | | | | | | | | | | | | | |
Current year loss ratio (2) | | | 75.0 | % | | | 74.8 | % | | | 71.0 | % | | | 67.4 | % | | | 70.3 | % |
Prior years’ loss ratio (3) | | | 12.0 | % | | | 12.6 | % | | | (0.1 | )% | | | (10.7 | )% | | | (14.8 | )% |
Net loss ratio | | | 87.0 | % | | | 87.4 | % | | | 70.9 | % | | | 56.7 | % | | | 55.5 | % |
| Net underwriting expense ratio (4) | | | 30.3 | % | | | 28.3 | % | | | 29.8 | % | | | 28.5 | % | | | 25.8 | % |
Net combined ratio (5) | | | 117.3 | % | | | 115.7 | % | | | 100.7 | % | | | 85.2 | % | | | 81.3 | % |
| | | As of December 31, | |
| | | 2011 | | | 2010 | | | 2009 | | | 2008 | | | 2007 | |
| | | ($ in thousands) | |
| Selected Balance Sheet Data: | | | | | | | | | | | | | | | |
| Investment securities available-for sale, at fair value | | $ | 700,346 | | | $ | 672,968 | | | $ | 626,608 | | | $ | 531,505 | | | $ | 494,437 | |
Cash and cash equivalents | | | 28,503 | | | | 15,958 | | | | 12,896 | | | | 22,872 | | | | 20,292 | |
Reinsurance recoverables | | | 94,173 | | | | 56,746 | | | | 34,339 | | | | 18,544 | | | | 14,210 | |
Deferred policy acquisition costs, net | | | 21,834 | | | | 25,574 | | | | 25,537 | | | | 23,175 | | | | 19,832 | |
Total assets | | | 1,078,838 | | | | 1,026,562 | | | | 964,861 | | | | 842,687 | | | | 755,569 | |
| Unpaid loss and loss adjustment expense | | | 518,044 | | | | 440,919 | | | | 351,890 | | | | 292,027 | | | | 250,085 | |
Unearned premiums | | | 130,300 | | | | 155,786 | | | | 175,766 | | | | 155,931 | | | | 147,033 | |
Total stockholders’ equity | | | 353,511 | | | | 351,017 | | | | 359,473 | | | | 324,813 | | | | 294,306 | |
____________
| (1) | Includes acquisition expenses such as commissions, premium taxes and other general administrative expenses related to underwriting operations in our insurance subsidiary and are included in the amortization of deferred policy acquisition costs. |
| | |
| (2) | The current year loss ratio is calculated by dividing loss and loss adjustment expenses for the current year less claims service income by the current year’s net premiums earned. |
| | |
| (3) | The prior years’ loss ratio is calculated by dividing the change in the loss and loss adjustment expenses for the prior years by the current year’s net premiums earned. |
| | |
| (4) | The underwriting expense ratio is calculated by dividing net underwriting expenses by the current year’s net premiums earned. |
| | |
| (5) | The net combined ratio is the sum of the net loss ratio and the net underwriting expense ratio. |
Item 7. Management’s Discussion and Analysis of Financial Condition and Results of Operations.
The following discussion of our financial condition and results of operations should be read in conjunction with our financial statements and the notes to those statements included elsewhere in this annual report. The discussion and analysis below includes forward-looking statements that are subject to risks, uncertainties and other factors described in Part I, Item 1A of this annual report that could cause our actual results of operations, performance and business prospects and opportunities in 2012 and beyond to differ materially from those expressed in, or implied by, those forward-looking statements. See “Note on Forward-Looking Statements” in Part I, Item 1 of this annual report.
Overview
We provide workers’ compensation insurance coverage for prescribed benefits that employers are required to provide to their employees who may be injured in the course of their employment. We currently provide workers’ compensation insurance to customers in the maritime, ADR and state act markets.
Principal Revenue and Expense Items
We derive our revenue from premiums earned, net investment income, net realized gains and losses from investments and service fee income. Our primary expense items are loss and loss adjustment expenses and underwriting, acquisition and insurance expenses.
Premiums Earned
Direct premiums written include all premiums charged for policies we issue during a fiscal period. Assumed premiums are premiums that we receive from an authorized state mandated pool. Gross premiums written is the sum of direct and assumed premiums written. Net premiums written represent gross premiums written less premiums ceded or paid to reinsurers (ceded premiums written).
Net premiums earned is the earned portion of our net premiums written. Premiums are earned over the terms of the related policies in proportion to the risks underwritten. Our policies typically have terms of 12 months. Thus, for example, for a policy that is written on July 1, 2011, approximately one-half of the premiums would be earned in 2011 and the other half would be earned in 2012. At the end of each accounting period, the portion of the premiums that are not yet earned is included in unearned premiums and is realized as revenue in the subsequent periods over the remaining term of the policies.
We earn our direct premiums written from our maritime, ADR and state act customers. We also earn a small portion of our direct premiums written from employers who participate in the Washington USL&H Plan. We immediately cede 100% of those premiums, net of our expenses, and 100% of the losses in connection with that business to the plan.
Net Investment Income and Realized Gains and Losses on Investments
We invest our statutory surplus and the funds supporting our insurance liabilities (including unearned premiums and unpaid loss and loss adjustment expenses) in cash, cash equivalents and fixed income securities. Our investment income includes interest and dividends earned on our invested assets. Realized gains and losses on invested assets are reported separately from net investment income. We earn realized gains when invested assets are sold for an amount greater than their amortized cost in the case of fixed maturity securities and recognize realized losses when investment securities are written down as a result of an other-than-temporary impairment or sold for an amount less than their carrying value.
Claims Service Income
We receive claims service income in return for providing claims administration services for other companies. The claims service income we receive for providing these services approximates our costs. For the years ended December 31, 2011, 2010, and 2009, approximately 23.6%, 26.0%, and 32.3% respectively, of our claims service income was generated by contracts we have with LMC to provide claims handling services for the policies written by the Eagle Entities prior to the Acquisition. We expect income from these contracts to continue to decrease over the next several years as transactions related to the Eagle Entities diminish. The next largest claims administration services customer represented approximately 25.0%, 20.9%, and 20.5% of claims service income for the years ended December 31, 2011, 2010 and 2009, respectively.
Loss and Loss Adjustment Expenses
Loss and loss adjustment expenses represent our largest expense item and include (1) claim payments made, (2) estimates for future claim payments and changes in those estimates for current and prior periods and (3) costs associated with investigating, defending and adjusting claims. For further information regarding our loss and loss adjustment expenses, including amounts paid and unpaid, see the discussion under the heading “Critical Accounting Policies, Estimates and Judgments — Unpaid Loss and Loss Adjustment Expense” in Part II, Item 7 of this annual report.
Underwriting, Acquisition and Insurance Expenses
In our insurance subsidiary, we refer to the expenses that we incur to underwrite risks as underwriting, acquisition and insurance expenses. Underwriting expenses consist of commission expenses, premium taxes and fees and other underwriting expenses incurred in writing and maintaining our business. We pay commission expense in our insurance subsidiary to our brokers for the premiums that they produce for us. We pay state and local taxes based on premiums; licenses and fees; assessments; and contributions to workers’ compensation security funds. Other underwriting expenses consist of general administrative expenses such as salaries and employee benefits, rent and all other operating expenses not otherwise classified separately, and boards, bureaus and assessments of statistical agencies for policy service and administration items such as rating manuals, rating plans and experience data. Certain of these costs that vary with and are primarily related to the acquisition of insurance contracts (“deferred acquisition costs”) are initially deferred and amortized over the typical policy term of 12 months. Therefore, with respect to deferred acquisition costs, there are timing differences between when the costs are incurred or paid and when the related expense is recognized in our statements of operations and comprehensive income (loss).
Results of Operations
Year Ended December 31, 2011 Compared to Year Ended December 31, 2010
Gross Premiums Written. Gross premiums written consists of direct premiums written and premiums assumed from the NCCI residual markets. The number of customers we service, in-force payrolls and in-force premiums represent some of the factors we consider when analyzing gross premiums written.
Gross premiums written totaled $261.4 million in 2011 compared to $264.3 million in 2010, representing a decrease of $2.9 million, or 1.1%. The change from 2010 resulted from premium declines primarily related to our “core” business, offset by business growth in our “Program Business.” Program Business, which includes alternative markets and small maritime programs, increased $13.8 million in 2011 compared to 2010. This increase was offset by a $15.4 million decrease in our core product lines, which include everything other than our Program Business (primarily energy, maritime and construction business). The decrease was primarily driven by declines in our construction business as a result of the continuing impact of the economic downturn. We have also experienced a reduction in our renewal retention rates as a result of rate increases and other underwriting actions we’ve taken in response to recent upward trends in medical and indemnity claims costs. Our overall renewal retention rate was 65% for the fourth quarter of 2011, compared to 74% for third quarter 2011 and 70% for fourth quarter 2010.
Excluding work we perform as the servicing carrier for the Washington USL&H Plan and business assumed from the NCCI residual market pools, the total number of customers we serviced decreased from approximately 1,640 at December 31, 2010 to approximately 1,510 at December 31, 2011. We experienced an increase of approximately 100 customers related to our Program Business, which was offset by a decrease of approximately 240 customers in our core business. By design, our Program Business will have a larger number of customers with a smaller average premium size than our core book of business. As of December 31, 2011, the average premium size in our Program Business was approximately $100,700 compared to approximately $262,200 in our core business, compared to approximately $100,400 for Program Business and $235,900 for core business at December 31, 2010. Total in-force payrolls, one of the factors used to determine premium charges, decreased 8.6% from $7.0 billion at December 31, 2010 to $6.4 billion at year end 2011. California continues to be our largest market, accounting for approximately $127.1 million, or 48.7% of our in-force premiums at December 31, 2011. This represents a decrease of $18.4 million, or 12.6%, from approximately $145.5 million of in-force premiums in California, or 49.9% of our in-force premiums, at December 31, 2010.
We expect our California concentration to decline significantly in 2012 as a result of previously announced changes in our underwriting standards for California construction business. Effective October 1, 2011, we offer California construction coverage only to contractors with estimated annual premiums greater than $500,000 and only on a loss sensitive basis. We no longer offer guaranteed cost plans to California contractors. Although these changes will reduce our premiums in the short term, we believe they will produce a stronger, more balanced book of business in the long term. We expect the reduction in California construction premiums will be partially offset by growth in California in other industries, such as healthcare and manufacturing, as well as growth in other states where we currently do business. We also expect to reduce the proportion of writings in California to 25 to 30% of our overall book, down from historical levels which have typically been approximately 50% or higher.
The following is a summary of our top five markets based on direct premiums written (excluding premiums written under the Washington USL&H Plan):
| | | Year Ended December 31, | |
| | | 2011 | | | 2010 | |
| | Direct Premiums Written | | | % | | | Direct Premiums Written | | | % | |
| | | (in thousands) | |
California | | $ | 124,731 | | | | 49.2 | % | | $ | 133,388 | | | | 51.8 | % |
Louisiana | | | 22,126 | | | | 8.7 | % | | | 27,900 | | | | 10.8 | % |
Texas | | | 15,216 | | | | 6.0 | % | | | 14,357 | | | | 5.6 | % |
Alaska | | | 11,662 | | | | 4.6 | % | | | 15,157 | | | | 5.9 | % |
Pennsylvania | | | 9,979 | | | | 3.9 | % | | | 8,497 | | | | 3.3 | % |
Total | | $ | 183,714 | | | | 72.4 | % | | $ | 199,299 | | | | 77.4 | % |
Premiums assumed from the NCCI residual markets in the twelve months ended December 31, 2011 totaled $3.7 million compared to $2.3 million for the same period in 2010, representing an increase of $1.4 million, or 60.9%. The increase was primarily attributable to adjustments in our prior policy year estimates.
We experienced significant reductions in our California premium rates from 2003 to 2008. Over that period, we filed, and the California Department of Insurance approved, eight rate reductions resulting in a net cumulative reduction of our California rates of approximately 54.8%. Beginning in 2008, we filed, and the California Department of Insurance approved, the following increases in our California rates: 5.0% increase effective January 1, 2009; 10.6% increase effective August 1, 2009; 15.3% increase effective September 1, 2010; and 10.9% increase effective January 1, 2012. These rate increases were filed following the completion of internal studies of our California loss costs and were primarily in response to increased projected medical costs and recent decisions by the Workers’ Compensation Appeals Board. If other insurers do not adopt similar rate increases, these rate increases may have a negative effect on our ability to compete in California. Rate changes have also been adopted in other states in which we operate. For additional information regarding recent rate change activity in California and other states, see the discussion under the heading “Regulation — Federal and State Legislative and Regulatory Changes” in Part I, Item 1 of this annual report.
Net Premiums Written. Net premiums written totaled $225.6 million in 2011 compared to $240.2 million in 2010, representing a decrease of $14.6 million, or 6.1%. The decrease was primarily attributable to an increase in ceded premiums resulting from higher ceding rates in our excess of loss reinsurance program effective October 1, 2010 through September 30, 2011. Our ceding rate under that program increased by approximately 141% as a result of lowering the attachment point from $0.5 million to $0.25 million and increasing maximum coverage from $85.0 million to $100.0 million. When we renewed our reinsurance program on October 1, 2011, we increased the attachment point to $0.5 million and reduced our maximum coverage to $75.0 million, which reduced our ceding rate to more historical levels.
Net Premiums Earned. Net premiums earned totaled $249.6 million in 2011 compared to $254.3 million in 2010, representing a decrease of $4.8 million, or 1.9%. We record the entire annual policy premium as unearned premium at inception and earn the premium over the life of the policy, which is generally twelve months, in proportion to the underlying exposure. Consequently, the amount of premiums earned in any given year depends on when the underlying policies were written and how the underlying payroll exposure is reported. Our direct premiums earned increased $4.5 million, or 1.6%, to $281.5 million in 2011 from $277.0 million in 2010. Net premiums earned in 2011 were reduced by net adjustments of approximately $2.7 million on retrospectively rated policies due to favorable loss results on those policies. Net premiums earned were also affected by premiums ceded under reinsurance treaties. Ceded earned premiums in 2011 totaled $36.3 million compared to $27.0 million in 2010, representing an increase of $9.3 million, or 34.6%.
Net Investment Income. Net investment income was $21.0 million in 2011 compared to $23.5 million in 2010, representing a decrease of $2.4 million, or 10.3%. Average invested assets increased $44.7 million, or 6.7%, from $664.2 million in 2010 to $708.9 million in 2011. This increase in our investment portfolio is due primarily to cash flow from operations of $27.6 million for the year ended December 31, 2011, which was invested primarily in fixed income securities. Net investment income as a percentage of average invested assets decreased slightly to 3.0% in 2011 from 3.5% in 2010 primarily due to reduced reinvestment interest rates.
Claims Service Income. Claims Service income totaled $1.3 million in 2011 and $0.9 million in 2010. Our claims service income resulted primarily from service arrangements we have with customers for claims processing services and policy administration services that we perform for them.
Other Net Realized Gains. Other net realized gains recognized in earnings totaled $1.1 million in 2011 and $15.4 million in 2010. The 2010 gains were realized in order to allow us to fully realize the approximately $15.0 million of tax capital loss carry forwards that existed at December 31, 2009.
Other Income. Other income totaled $4.3 million for the years ended December 31, 2011 and 2010. Other income is derived primarily from the operations of PointSure, our wholesale broker, and PMCS, our provider of medical bill review, utilization review, nurse case management and related services.
Loss and Loss Adjustment Expenses. Loss and loss adjustment expenses totaled $218.4 million in 2011 compared to $223.1 million in 2010, representing a decrease of $4.6 million, or 2.1%. Our net loss ratio, which is calculated by dividing loss and loss adjustment expenses less claims service income by premiums earned, was 87.0% in 2011 compared to 87.4% in 2010. The net loss ratio reflects unfavorable development of prior accident year loss reserves of $31.4 million in 2011 (offset by a $0.5 million favorable commutation gain), compared to unfavorable development of prior year accident year loss reserves of $32.6 million in 2010 (offset by a $0.6 million favorable commutation gain). Our net loss ratio was also impacted by an increase in the net current accident year expected loss ratio (“ELR”) from 64.5% in 2010 to 65.0% in 2011. Our direct loss reserves are net of reinsurance and exclude reserves associated with KEIC, whom we acquired from LMC in September 2003, and the business that we involuntarily assume from the NCCI.
For accident year 2011, an ELR of 62.5% was established initially, which took into consideration the higher ceding rates under our 2010-2011 reinsurance program and adverse reserve development experienced in recent accident years. The ELR was multiplied by the booked accident year earned premium to produce the ultimate loss to date. The ELR selections are reviewed quarterly with each internal IBNR study. Given the short experience period for the current accident year, the ELRs are usually maintained at least through the first 12 months of the accident year and revised as the underlying data matures. However, we increased the ELR for 2011 from 62.5% to 65.0% in the fourth quarter of 2011 after reviewing results for the 2011 accident year and considering the adverse development in recent accident years.
For accident year 2010, the ultimate loss estimates at December 31, 2011 were higher when compared to December 31, 2010 and resulted in net adverse development of our loss reserves of $9.7 million. The development was attributable to the following jurisdictions: $3.8 million for California state act, driven primarily by medical costs; $8.0 million for non-California state act, driven primarily by medical costs with additional impact due to indemnity costs; $0.2 million for our IBNR accrual for earned but unbilled premiums; offset by $2.3 million of favorable loss development for USL&H, driven primarily by favorable development in medical costs. This net adverse development was offset by net favorable development of $1.6 million related to ULAE, loss based assessments and NCCI.
For accident year 2009, the ultimate loss estimates at December 31, 2011 were higher when compared to December 31, 2010 and resulted in adverse development of our loss reserves of $8.5 million. The development was attributable to the following jurisdictions: $4.6 million for California state act, driven primarily by medical and indemnity costs; $3.3 million for non-California state act, driven primarily by indemnity costs; and $0.6 million for USL&H, driven primarily by indemnity costs. This adverse development was offset by favorable development of $1.4 million related to ULAE, loss based assessments and NCCI, as well as a $0.4 million favorable commutation gain.
For accident year 2008, the ultimate loss estimates at December 31, 2011 were higher when compared to December 31, 2010 and resulted in adverse development of our loss reserves of $9.0 million. The development was attributable to the following jurisdictions: $3.2 million for California state act, driven primarily by medical and indemnity costs; $5.3 million for non-California state act, driven primarily by indemnity costs; and $0.5 million for USL&H, driven primarily by indemnity costs. This adverse development was offset by net favorable development of $0.7 million related to ULAE, loss based assessments and NCCI, as well as a $0.1 million favorable commutation gain.
For accident year 2007, the ultimate loss estimates at December 31, 2011 were higher when compared to December 31, 2010 and resulted in adverse development of our loss reserves of $6.7 million. The development was attributable to the following jurisdictions: $3.0 million for California state act, driven primarily by medical and indemnity costs; $2.3 million for non-California state act, driven primarily by indemnity costs; and $1.4 million for USL&H, driven primarily by indemnity costs. This adverse development was offset by favorable development of $0.7 million related to ULAE, loss based assessments and NCCI.
For accident years 2006 and prior, the ultimate loss estimates at December 31, 2011 were higher when compared to December 31, 2010 and resulted in net adverse development of our loss reserves of $2.6 million. The development was attributable to the following jurisdictions: $2.8 million for California state act, driven primarily by medical and indemnity costs; $0.4 million for non-California state act, driven primarily by indemnity costs; offset by favorable development of $0.6 million for USL&H, driven primarily by indemnity and medical costs. This net adverse development was offset by net favorable development of $0.7 million related to ULAE, loss based assessments and NCCI.
We have observed an increase in severity estimates for accident years 2006 through 2010 in California following several years of decreasing trends. We have established loss reserves at December 31, 2011 that are based upon our current best estimate of ultimate loss costs, taking into consideration the recent paid loss claim data, incurred loss trends and uncertainty regarding the permanence of recent legislative reforms. We continue to monitor the impact of reforms and potential challenges to reforms in our loss data. See the discussion under the headings “Loss Reserves” in Part I, Item 1 and “Critical Accounting Policies, Estimates and Judgments — Unpaid Loss and Loss Adjustment Expense” in this Item 7 for a further discussion of our loss reserving process.
Our ability to adequately provide funds to pay claims comes from our disciplined underwriting and pricing standards and the purchase of reinsurance to protect us against severe claims and catastrophic events. Effective October 1, 2011, we entered into reinsurance agreements with nonaffiliated reinsurers wherein we retain the first $0.5 million of each loss occurrence and the next $0.5 million of losses per occurrence are 50% reinsured. Losses in excess of $1.0 million per loss occurrence are fully reinsured through the program limit of $75.0 million per loss occurrence, subject to various deductibles and exclusions. The new reinsurance program is effective through September 30, 2012. Our reinsurance program that was effective October 1, 2010 to September 30, 2011 provided us with reinsurance protection for each loss occurrence in excess of $0.25 million, up to $100.0 million, subject to various deductibles and exclusions. Given industry and predecessor trends, we believe we are sufficiently capitalized to cover our retained losses.
Provisions in the four lower layer treaties (covering losses from $0.5 million to $10.0 million) in our 2008-2009 reinsurance program allowed us the ability, at our sole discretion, to commute the contracts within 24 months of expiration in return for a contingent profit commission calculated in accordance with terms specified in the contracts. In accordance with these provisions, we commuted the $5.0 million excess $5.0 million layer of this treaty in 2011 in return for a contingent profit commission of approximately $0.5 million. The three lower layers (from $0.5 million to $5.0 million) were not commuted. As of December 31, 2011, there were no ceded losses associated with the $5.0 million excess $5.0 million layer and it is not expected that developed losses that would otherwise be covered by reinsurance will exceed the contingent profit commission. The contingent profit commission was recorded as a reduction of loss and loss adjustment expenses.
As of December 31, 2011, we had recorded a receivable of approximately $3.1 million for adverse loss development under the adverse development cover since the date of the Acquisition. We do not expect this receivable to have any material effect on our future cash flows if LMC fails to perform its obligations under the adverse development cover. At December 31, 2011, we had access to approximately $3.1 million under the collateralized reinsurance trust in the event that LMC fails to satisfy its obligations under the adverse development cover. See the discussion under the heading “Loss Reserves — KEIC Loss Reserves” in Part I, Item 1 of this annual report.
Underwriting, Acquisition and Insurance Expenses. Underwriting expenses totaled $75.5 million in 2011 compared to $72.1 million in 2010, representing an increase of $3.4 million, or 4.8%. Our net underwriting expense ratio, which is calculated by dividing underwriting, acquisition and insurance expenses by premiums earned, was 30.3% in 2011 compared to 28.3% in 2010. The increase in our expense ratio was primarily the result of increased underwriting expenses, driven primarily by commission costs, and decreased premiums earned as compared to the same period in 2010. We estimate that the office closures and staff reductions announced in October 2011 will reduce underwriting expense by approximately $3.2 million annually. Severance, transition services and office closure costs totaled approximately $1.0 million and were recognized in the fourth quarter of 2011.
Interest Expense. Interest expense related to the surplus notes issued by our insurance subsidiary in May 2004 totaled $0.5 million in 2011 and 2010. The surplus notes interest rate, which is calculated at the beginning of each interest payment period using the 3-month LIBOR plus 400 basis points, ranged between 4.26% and 4.51% in 2011, compared to 4.25% and 4.48% in 2010.
Other Expenses. Other expenses totaled $8.0 million in 2011, an increase of $0.5 million, or 6.9%, from $7.5 million in 2010. Other expenses result primarily from the operations of PointSure and PMCS. The increase in other expenses was largely attributable to the growth of these companies’ operations.
Income Tax Expense (Benefit). The effective tax rate for the year ended December 31, 2011 resulted in a benefit of 42.6% compared to a benefit of 75.0% for the same period in 2010. The effective tax rate for 2011 differed from the statutory tax rate of 35.0% primarily as a result of tax exempt interest income, which accounted for approximately 11.1 percentage points of the difference from the statutory rate. The increase in the effective rate was partially offset by $0.5 million, or 1.9 percentage points, due to the true-up of tax deductions relating to stock option and restricted stock awards that vested during the year. The effective rate for December 31, 2010 differed from the statutory rate of 35.0% primarily as a result of tax exempt interest income, which accounted for approximately 53.0 percentage points of the difference from the statutory rate. This increase in the effective rate was partially offset by $0.6 million, or 8.8 percentage points, due to the true-up of tax deductions relating to stock options and restricted stock awards that vested during the year.
Net Income (Loss). Net loss totaled $12.8 million in 2011 compared to a net loss of $1.6 million in 2010, representing an increase of $11.2 million, or 708.1%. The increase in net loss resulted primarily from a decrease in other net realized gains recognized in earnings in 2011 as compared to 2010.
Year Ended December 31, 2010 Compared to Year Ended December 31, 2009
Gross Premiums Written. Gross premiums written consists of direct premiums written and premiums assumed from the NCCI residual markets. The number of customers we service, in-force payrolls and in-force premiums represent some of the factors we consider when analyzing gross premiums written.
Gross premiums written totaled $264.3 million in 2010 compared to $290.0 million in 2009, representing a decrease of $25.7 million, or 8.9%. Much of the decrease in gross premiums written resulted from premium declines primarily related to our “core” business, offset by business growth in our “Program Business”. Program Business, which includes alternative markets and small maritime programs, increased $27.8 million in 2010 compared to 2009. This increase was offset by a $52.0 million decrease in our core product lines, which include everything other than our Program Business (primarily energy, maritime and construction business). The decrease was primarily driven by our construction business as a result of the continuing impact of the economic downturn. We have also experienced a reduction in our renewal retention rates as a result of rate increases and other underwriting actions we’ve taken in response to recent upward trends in medical and indemnity claims costs. Our overall renewal retention rate was 70% for the fourth quarter of 2010, compared to 73% for third quarter 2010 and 84% for fourth quarter 2009.
Excluding work we perform as the servicing carrier for the Washington USL&H Plan and business assumed from the NCCI residual market pools, the total number of customers we serviced increased from approximately 1,530 at December 31, 2009 to approximately 1,640 at December 31, 2010. We experienced an increase of approximately 300 customers related to our Program Business, which was offset by a decrease of approximately 200 customers in our core business. By design, our Program Business will have a larger number of customers with a smaller average premium size than our core book of business. As of December 31, 2010, the average premium size in our Program Business was approximately $100,400 compared to approximately $235,900 in our core business. These numbers were virtually unchanged from average premium sizes at December 31, 2009. Total in-force payrolls, one of the factors used to determine premium charges, decreased 2.8% from $7.2 billion at December 31, 2009 to $7.0 billion at year end 2010. California continues to be our largest market, accounting for approximately $145.5 million, or 49.9% of our in-force premiums at December 31, 2010. This represents an increase of $13.0 million, or 9.8%, from approximately $132.5 million, or 43.1%, of in-force premiums in California at December 31, 2009.
The following is a summary of our top five markets based on direct premiums written (excluding premiums written under the Washington USL&H Plan):
| | | Year Ended December 31, | |
| | | 2010 | | | 2009 | |
| | | Direct Premiums Written | | | % | | | Direct Premiums Written | | | % | |
| | | (in thousands) | |
California | | $ | 133,388 | | | | 51.8 | % | | $ | 123,856 | | | | 43.3 | % |
Louisiana | | | 27,900 | | | | 10.8 | % | | | 26,143 | | | | 9.1 | % |
Alaska | | | 15,157 | | | | 5.9 | % | | | 17,710 | | | | 6.2 | % |
Texas | | | 14,357 | | | | 5.6 | % | | | 16,032 | | | | 5.6 | % |
Pennsylvania | | | 8,497 | | | | 3.3 | % | | | 7,009 | | | | 2.5 | % |
Total | | $ | 199,299 | | | | 77.4 | % | | $ | 190,750 | | | | 66.7 | % |
Premiums assumed from the NCCI residual markets in the twelve months ended December 31, 2010 totaled $2.3 million compared to $4.0 million for the same period in 2009, representing a decrease of $1.7 million, or 42.5%. The decrease was primarily attributable to a reduction in our 2009 policy year estimates recorded in 2010.
We experienced significant reductions in our California premium rates from 2003 to 2008. Over that period, we filed, and the California Department of Insurance approved, eight rate reductions resulting in a net cumulative reduction of our California rates of approximately 54.8%. Beginning in 2008, we filed, and the California Department of Insurance approved, the following increases in our California rates: 5.0% increase effective January 1, 2009; 10.6% increase effective August 1, 2009; and 15.3% increase effective September 1, 2010. These rate increases were filed following the completion of internal studies of our California loss costs and were primarily in response to increased projected medical costs and recent decisions by the Workers’ Compensation Appeals Board. If other insurers do not adopt similar rate increases, these rate increases may have a negative effect on our ability to compete in California. Rate changes have also been adopted in other states in which we operate. For additional information regarding recent rate change activity in California and other states, see the discussion under the heading “Regulation — Federal and State Legislative and Regulatory Changes” in Part I, Item 1 of this annual report.
Net Premiums Written. Net premiums written totaled $240.2 million in 2010 compared to $262.8 million in 2009, representing a decrease of $22.6 million, or 8.6%. The decrease was primarily attributable to the decrease in gross written premiums, offset in part by a $3.1 million decrease in premiums ceded primarily resulting from residual market business. Premiums ceded were also impacted by our new excess of loss reinsurance program that became effective on October 1, 2010. Gross premiums written assumed from the NCCI residual market pools in 2010 decreased approximately $1.7 million (41.7%) from the prior year amount, resulting in a similar reduction in ceded premiums since the business assumed from the NCCI for policy years 2009 and 2010 is ceded to independent reinsurers. This reduction in ceded premiums was offset by a higher ceding rate in our excess of loss reinsurance program that renewed in October 2010. Our ceding rate increased by approximately 141% as a result of lowering the attachment point from $0.5 million to $0.25 million and increasing maximum coverage from $85.0 million to $100.0 million.
Net Premiums Earned. Net premiums earned totaled $254.3 million in 2010 compared to $244.4 million in 2009, representing an increase of $9.9 million, or 4.0%. We record the entire annual policy premium as unearned premium at inception and earn the premium over the life of the policy, which is generally twelve months, in proportion to the underlying exposure. Consequently, the amount of premiums earned in any given year depends on when the underlying policies were written and how the underlying payroll exposure is reported. Our direct premiums earned increased $13.5 million, or 5.1%, to $277.0 million in 2010 from $263.5 million in 2009. Net premiums earned in 2010 were reduced by net adjustments of approximately $1.8 million on retrospectively rated policies due to favorable loss results on those policies. Net premiums earned are also affected by premiums ceded under reinsurance treaties. Ceded earned premiums in 2010 totaled $27.0 million compared to $22.7 million in 2009, representing an increase of $4.3 million, or 18.9%.
Net Investment Income. Net investment income was $23.5 million in 2010 compared to $23.1 million in 2009, representing an increase of $0.3 million, or 1.4%. Average invested assets increased $67.2 million, or 11.3%, from $597.0 million in 2009 to $664.2 million in 2010. This increase in our investment portfolio is due primarily to cash flow from operations of $56.7 million for the year ended December 31, 2010, which was invested primarily in fixed income securities. Net investment income as a percentage of average invested assets decreased slightly to 3.5% in 2010 from 3.9% in 2009 primarily due to reduced reinvestment interest rates.
Claims Service Income. Claims Service income totaled $0.9 million in 2010 and $1.0 million in 2009. Our claims service income resulted primarily from service arrangements we have with customers for claims processing services and policy administration services that we perform for them.
Other-Than-Temporary Impairment Losses. We had no other-than-temporary impairment (“OTTI”) losses for the year ended December 31, 2010, compared to $0.3 million in 2009, which related to our investment in government-sponsored agency preferred stock. The 2009 charge followed a $10.2 million OTTI charge related to the same securities in 2008 and was recorded at the time management made the decision to liquidate the impaired securities.
Other Income. Other income totaled $4.3 million for the year ended December 31, 2010 compared to $5.3 million for the same period in 2009, representing a decrease of $1.0 million, or 19.5%. Other income is derived primarily from the operations of PointSure, our wholesale broker, and PMCS, our provider of medical bill review, utilization review, nurse care management and related services.
Loss and Loss Adjustment Expenses. Loss and loss adjustment expenses totaled $223.1 million in 2010 compared to $174.3 million in 2009, representing an increase of $48.7 million, or 28.0%. Our net loss ratio, which is calculated by dividing loss and loss adjustment expenses less claims service income by premiums earned, was 87.4% in 2010 compared to 70.9% in 2009. The increase in our net loss ratio was primarily attributable to unfavorable development of prior accident year loss reserves of $32.6 million in 2010 (offset by a $0.6 million favorable commutation gain), compared to unfavorable development of prior year accident year loss reserves of $0.4 million in 2009 (offset by a $0.6 million favorable commutation gain). Our net loss ratio was also impacted by an increase in the current accident year loss ratio from 60.0% in 2009 to 64.5% in 2010. Our direct loss reserves are net of reinsurance and exclude reserves associated with KEIC, whom we acquired from LMC in September 2003, and the business that we involuntarily assume from the NCCI.
For accident year 2010, an expected loss ratio was established for each jurisdiction and type of loss (indemnity, medical and allocated loss and loss adjustment expenses (“ALAE”)). The expected loss ratio was multiplied by the booked accident year earned premium to produce the ultimate loss to date. The expected loss ratio selections are reviewed quarterly with each internal IBNR study. Given the short experience period for the current accident year, the expected loss ratios are usually maintained at least through the first 12 months of the accident year and revised as the underlying data matures. However, we increased the expected loss ratio for 2010 from 61.5% to 64.5% in the second quarter of 2010 after reviewing results for the 2010 accident year and considering the adverse development of accident years 2008 and 2009.
For accident year 2009, the ultimate loss estimates at December 31, 2010 were higher when compared to December 31, 2009 and resulted in a net increase of our loss reserves of $14.0 million. The increase was attributable to the following jurisdictions: $7.1 million for California state act, driven primarily by medical costs; $3.5 million for non-California state act, driven by increased medical and indemnity costs; and $3.4 million for USL&H, driven primarily by increased indemnity costs. This adverse development was offset by favorable development of $0.2 million related to ULAE, loss based assessments and NCCI.
For accident year 2008, the ultimate loss estimates at December 31, 2010 were higher when compared to December 31, 2009 and resulted in a net increase of our loss reserves of $10.3 million. The increase was attributable to the following jurisdictions: $6.9 million for California state act, driven primarily by medical costs; $2.4 million for non-California state act, driven primarily by medical costs; and $1.0 million for USL&H, driven primarily by increased indemnity and ALAE costs. This adverse development was offset by favorable development of $0.5 million related to ULAE, loss based assessments and NCCI, as well as $0.5 million related to favorable commutation.
For accident year 2007, the ultimate loss estimates at December 31, 2010 were higher when compared to December 31, 2009 and resulted in a net increase of our loss reserves of $5.6 million. The increase was attributable to the following jurisdictions: $3.7 million for California state act, driven primarily by medical costs; $0.6 million for non-California state act, driven primarily by indemnity and ALAE costs; and $1.3 million for USL&H, driven primarily by increased indemnity and ALAE costs. This adverse development was offset by favorable development of $0.1 million related to ULAE, loss based assessments and NCCI, as well as $0.1 million related to favorable commutation.
For accident years 2006 and prior, the ultimate loss estimates at December 31, 2010 were higher when compared to December 31, 2009 and resulted in a net increase of our loss reserves of $3.5 million.
Our ability to adequately provide funds to pay claims comes from our disciplined underwriting and pricing standards and the purchase of reinsurance to protect us against severe claims and catastrophic events. Effective October 1, 2010, we entered into reinsurance agreements with nonaffiliated reinsurers wherein we retain the first $0.25 million of each loss occurrence and the next $0.25 million of losses per occurrence are 100% reinsured, subject to an aggregate deductible of $5.0 million. The next $0.5 million of losses per occurrence (from $0.5 million to $1.0 million per loss occurrence) are 75% reinsured. Losses in excess of $1.0 million per loss occurrence are fully reinsured through the program limit of $100.0 million per loss occurrence, subject to various deductibles and exclusions. The new reinsurance program is effective through September 30, 2011. Our reinsurance program that was effective October 1, 2009 to September 30, 2010 provided us with reinsurance protection for each loss occurrence in excess of $0.5 million, up to $85.0 million, subject to various deductibles and exclusions. Given industry and predecessor trends, we believe we are sufficiently capitalized to cover our retained losses.
We have recently observed an increase in severity estimates for accident years 2007 through 2009 in California following several years of decreasing trends. We have established loss reserves at December 31, 2010 that are based upon our current best estimate of ultimate loss costs, taking into consideration the recent paid loss claim data, incurred loss trends and uncertainty regarding the permanence of recent legislative reforms. We continue to monitor the impact of reforms and potential challenges to reforms in our loss data. See the discussion under the headings “Loss Reserves” in Part I, Item 1 and “Critical Accounting Policies, Estimates and Judgments — Unpaid Loss and Loss Adjustment Expense” in this Item 7 for a further discussion of our loss reserving process.
Provisions in the three lower layer treaties (covering losses from $1.0 million to $10.0 million) in our 2007-2008 reinsurance program allow us the ability, at our sole discretion, to commute the contracts within 24 months of expiration in return for a contingent profit commission calculated in accordance with terms specified in the contracts. In accordance with these provisions, we commuted the $5.0 million excess $5.0 million layer of this treaty in 2010 in return for a contingent profit commission of approximately $0.6 million. The two lower layers (from $1.0 million to $5.0 million) were not commuted. As of December 31, 2010, there were no ceded losses associated with the $5.0 million excess $5.0 million layer and it is not expected that developed losses that would otherwise be covered by reinsurance will exceed the contingent profit commission. The contingent profit commission was recorded as a reduction of loss and loss adjustment expenses.
As of December 31, 2010, we had recorded a receivable of approximately $3.0 million for adverse loss development under the adverse development cover since the date of the Acquisition. We do not expect this receivable to have any material effect on our future cash flows if LMC fails to perform its obligations under the adverse development cover. At December 31, 2010, we had access to approximately $ 3.8 million under the collateralized reinsurance trust in the event that LMC fails to satisfy its obligations under the adverse development cover. See the discussion under the heading “Loss Reserves — KEIC Loss Reserves” in Part I, Item 1 of this annual report.
Underwriting, Acquisition and Insurance Expenses. Underwriting expenses totaled $72.1 million in 2010 compared to $72.8 million in 2009, representing a decrease of $0.7 million, or 1.0%. Our net underwriting expense ratio, which is calculated by dividing underwriting, acquisition and insurance expenses less other service income by premiums earned, was 28.3% in 2010 compared to 29.8% in 2009. The decline in our expense ratio resulted from decreases in our underwriting expenses and increases in our net premiums earned from the same period of 2009.
Interest Expense. Interest expense related to the surplus notes issued by our insurance subsidiary in May 2004 totaled $0.5 million in 2010 and $0.6 million in 2009. The surplus notes interest rate, which is calculated at the beginning of each interest payment period using the 3-month LIBOR plus 400 basis points, ranged between 4.25% and 4.48% in 2010 down from 4.26% and 6.15% in 2009.
Other Expenses. Other expenses totaled $7.5 million in 2010, a decrease of $1.6 million, or 17.3%, from $9.1 million in 2009. Other expenses result primarily from the operations of PointSure and PMCS. The decrease in other expenses was largely attributable to reduced personnel costs and direct costs.
Income Tax Expense (Benefit). The effective tax rate for the year ended December 31, 2010 resulted in a benefit of 75.0% compared to an expense of 18.4% for the same period in 2009. The effective tax rate for 2010 differed from the statutory tax rate of 35.0% primarily as a result of tax exempt interest income, which accounted for approximately 53.0% percentage points of the difference from the statutory rate. The increase in the effective rate was partially offset by approximately $0.6 million, or 8.8 percentage points, due to a true-up of vesting expense related to restricted stock which vested during the year. The effective rate for December 31, 2009 was lower than the statutory rate of 35.0% primarily as a result of tax exempt interest income, which accounted for approximately 20.8 percentage points of the difference from the statutory rate. This decrease in the effective rate was partially offset by approximately $0.7 million, or 4.2 percentage points, due to state income taxes and other nondeductible expenses.
Net Income (Loss). Net loss totaled $1.6 million in 2010 compared to net income of $13.5 million in 2009, representing a decrease of $15.1 million, or 111.7%. The 2010 decrease in net income resulted primarily from an increase in loss and loss adjustment expenses, offset by an increase in other realized gains recognized in earnings.
Liquidity and Capital Resources
Our principal sources of funds are underwriting operations, investment income and proceeds from sales and maturities of investments. Our primary use of funds is to pay claims and operating expenses, to purchase investments and to pay declared common stock dividends.
Our investment portfolio is structured so that investments mature periodically over time in reasonable relation to current expectations of future claim payments. Since we have limited claims history, we have derived our expected future claim payments from industry and predecessor trends and included a provision for uncertainties. Our investment portfolio as of December 31, 2011 had an effective duration of 4.5 years with individual maturities extending to 29 years. Currently, we make claim payments from positive cash flows from operations and invest excess cash in securities with appropriate maturity dates to balance against anticipated future claim payments. As these securities mature, we intend to invest any excess funds with appropriate durations to match against expected future claim payments.
At December 31, 2011, our investment portfolio consisted of investment-grade fixed income securities with fair values subject to fluctuations in interest rates, as well as other factors such as credit. Our investment policy allows for investment in domestic and international equities up to 6% and 1.5%, respectively, of our statutory capital and surplus. All of the securities in our investment portfolio are accounted for as “available for sale” securities. While we have structured our investment portfolio to provide an appropriate matching of maturities with anticipated claim payments, if we decide or are required in the future to sell securities in a rising interest rate environment, we would expect to incur losses from such sales.
We had no direct sub-prime mortgage exposure in our investment portfolio and $10.0 million of indirect exposure to sub-prime mortgages as of December 31, 2011. As of December 31, 2011, our portfolio included $92.2 million of insured municipal bonds and $258.8 million of uninsured municipal bonds. See “Investments” in Part I, Item 1 of this annual report for a discussion of the limited exposure in our investment portfolio at December 31, 2011 to the European sovereign debt crisis.
The following table provides a breakdown of ratings on the bonds in our municipal portfolio as of December 31, 2011:
| | | Insured Bonds | | | | | | Total Municipal Portfolio (1) Based On | |
| | | Insured | | | Underlying | | | Uninsured Bonds | | | Overall | | | Underlying | |
| Rating | | Ratings | | | Ratings | | | Ratings | | | Ratings(2) | | | Ratings | |
| | | (In thousands) | |
AAA | | $ | 4,827 | | | $ | 4,827 | | | $ | 30,693 | | | $ | 35,520 | | | $ | 35,520 | |
AA+ | | | 14,014 | | | | 12,797 | | | | 63,850 | | | | 77,864 | | | | 76,647 | |
AA | | | 19,456 | | | | 19,109 | | | | 65,294 | | | | 84,750 | | | | 84,403 | |
AA- | | | 29,383 | | | | 26,414 | | | | 52,005 | | | | 81,388 | | | | 78,419 | |
A+ | | | 11,196 | | | | 15,615 | | | | 9,849 | | | | 21,045 | | | | 25,464 | |
A | | | 5,285 | | | | 5,285 | | | | 22,550 | | | | 27,835 | | | | 27,835 | |
A- | | | 2,073 | | | | 2,187 | | | | 2,976 | | | | 5,049 | | | | 5,163 | |
BBB+ | | | — | | | | — | | | | 1,304 | | | | 1,304 | | | | 1,304 | |
BBB | | | — | | | | — | | | | 2,954 | | | | 2,954 | | | | 2,954 | |
Pre-refunded (3) | | | 6,014 | | | | 6,014 | | | | 7,326 | | | | 13,340 | | | | 13,340 | |
Total | | $ | 92,248 | | | $ | 92,248 | | | $ | 258,801 | | | $ | 351,049 | | | $ | 351,049 | |
____________
| (1) | Consists of $326.9 million of tax-exempt municipal bonds and $24.2 million of taxable municipal bonds. |
| | |
| (2) | Represents insured ratings on insured bonds and ratings on uninsured bonds. |
| | |
| (3) | These bonds have been refunded by depositing highly rated government-issued securities into irrevocable trust funds established for payment of principal and interest. |
As of December 31, 2011, we had no direct investments in any bond insurer, and the following bond insurers insured more than 10% of the municipal bond investments in our portfolio:
| | | | | | Insurer Ratings | | | | |
Bond Insurer | | Fair Value | | | S&P | | | Moody’s | | | Rating | |
| | | (Millions) | | | | | | | | | | |
National Public Finance Guarantee Corporation | | $ | 42.1 | | | | BBB | | | | Baa2 | | | | AA- | |
We do not expect a material impact to our investment portfolio or financial position as a result of the problems currently facing monoline bond insurers.
Our ability to adequately provide funds to pay claims comes from our disciplined underwriting and pricing standards and the purchase of reinsurance to protect us against severe claims and catastrophic events. Effective October 1, 2011, our reinsurance program provides us with reinsurance protection for each loss occurrence in excess of $0.5 million, up to $75.0 million, subject to various deductibles and exclusions. Our reinsurance program that was effective October 1, 2010 to September 30, 2011, provides us with reinsurance protection for each loss occurrence in excess of $0.25 million, up to $100.0 million, subject to various deductibles and exclusions. See the discussion under the heading “Reinsurance” in Part I, Item 1 of this annual report. Given industry and predecessor trends, we believe we are sufficiently capitalized to cover our retained losses.
Our insurance subsidiary is required by law to maintain a certain minimum level of surplus on a statutory basis. Surplus is calculated by subtracting total liabilities from total admitted assets. The NAIC has a risk-based capital standard designed to identify property and casualty insurers that may be inadequately capitalized based on inherent risks of each insurer’s assets and liabilities and its mix of net premiums written. Insurers falling below a calculated threshold may be subject to varying degrees of regulatory action. As of December 31, 2011, the statutory surplus of our insurance subsidiary was in excess of the prescribed risk-based capital requirements that correspond to any level of regulatory action.
SeaBright is a holding company with minimal unconsolidated revenue. As SeaBright pays stockholder dividends and has other capital needs in the future, we anticipate that it will be necessary for our insurance subsidiary to pay dividends to SeaBright. In August 2010, SBIC declared and paid its first such dividend to SeaBright in the amount of $5.8 million. The payment of such dividends will be regulated as previously described.
Net cash provided by operating activities in 2011 totaled $27.6 million, a decrease of $29.1 million, or 51.4%, from $56.7 million in 2010, which decreased $11.6 million, or 16.9%, from $68.3 million in 2009. The decrease in 2011 was primarily attributable to a decrease in premiums collected of approximately $10.6 million and an increase in loss and loss adjustment expenses paid (net of reinsurance collected) of approximately $22.8 million. The decrease in 2010 was primarily attributable to an increase in loss and loss adjustment expenses paid (net of reinsurance collected) of approximately $28.7 million, partially offset by decreases in income taxes and underwriting expenses paid of approximately $9.1 million and $4.0 million, respectively.
We used net cash of $9.7 million for investing activities in 2011 compared to $49.8 million in 2010 and $77.8 million in 2009. The decrease in 2011 from 2010 and in 2010 from 2009 was driven by lower net investment purchase activity (purchases, net of sales and maturities).
Net cash used in financing activities totaled $5.3 million in 2011, an increase of $1.4 million from $3.9 million in 2010, which increased $3.4 million from $0.4 million in 2009. The increase in net cash used in financing activities in 2011 over 2010 and in 2010 over 2009 was primarily the result of quarterly cash dividends paid.
Contractual Obligations and Commitments
The following table identifies our contractual obligations by payment due period as of December 31, 2011:
| | | Payments Due by Period | |
| | Total | | | Less than 1 Year | | | 1-3 Years | | | 3-5 Years | | | More than 5 Years | |
| | | (In thousands) | |
| Long term debt obligations: | | | | | | | | | | | | | | | |
Surplus notes | | $ | 12,000 | | | $ | — | | | $ | — | | | $ | — | | | $ | 12,000 | |
Loss and loss adjustment expenses | | | 518,044 | | | | 156,028 | | | | 175,207 | | | | 75,114 | | | | 111,695 | |
Operating lease obligations | | | 12,388 | | | | 2,988 | | | | 5,471 | | | | 3,844 | | | | 85 | |
Total | | $ | 542,432 | | | $ | 159,016 | | | $ | 180,678 | | | $ | 78,958 | | | $ | 123,780 | |
The loss and loss adjustment expense payments due by period in the table above are based upon the loss and loss adjustment expense estimates as of December 31, 2011 and actuarial estimates of expected payout patterns and are not contractual liabilities as to time certain. Our contractual liability is to provide benefits under the policies we write. As a result, our calculation of loss and loss adjustment expense payments due by period is subject to the same uncertainties associated with determining the level of unpaid loss and loss adjustment expenses generally and to the additional uncertainties arising from the difficulty of predicting when claims (including claims that have not yet been reported to us) will be paid. For a discussion of our unpaid loss and loss adjustment expense process, see the heading “Loss Reserves” in Part I, Item 1 of this annual report and “Critical Accounting Policies, Estimates and Judgments — Unpaid Loss and Loss Adjustment Expense” in Part II, Item 7 of this annual report. Actual payments of loss and loss adjustment expenses by period will vary, perhaps materially, from the above table to the extent that current estimates of loss and loss adjustment expenses vary from actual ultimate claims amounts and as a result of variations between expected and actual payout patterns. See the discussion under the heading “Risks Related to our Business — Our loss reserves are based on estimates and may be inadequate to cover our actual losses” in Part I, Item 1A of this annual report for a discussion of the uncertainties associated with estimating unpaid loss and loss adjustment expenses.
Off-Balance Sheet Arrangements
As of December 31, 2011, we had no off-balance sheet arrangements that have or are reasonably likely to have a current or future effect on our financial condition, changes in financial condition, revenues or expenses, results of operations, liquidity, capital expenditures or capital resources.
Critical Accounting Policies, Estimates and Judgments
It is important to understand our accounting policies in order to understand our financial statements. Management considers some of these policies to be critical to the presentation of our financial results, since they require management to make estimates and assumptions. These estimates and assumptions affect the reported amounts of assets, liabilities, revenues, expenses and related disclosures at the financial reporting date and throughout the period being reported upon. Some of the estimates result from judgments that can be subjective and complex, and consequently, actual results reflected in future periods might differ from these estimates.
The most critical accounting policies involve the reporting of unpaid loss and loss adjustment expenses including losses that have occurred but were not reported to us by the financial reporting date, the amount and recoverability of reinsurance recoverable balances, deferred policy acquisition costs, income taxes, the valuation of goodwill, the impairment of investment securities, earned but unbilled premiums and retrospective premiums. The following should be read in conjunction with the notes to our consolidated financial statements.
Unpaid Loss and Loss Adjustment Expense
Unpaid loss and loss adjustment expense represents our estimate of the expected cost of the ultimate settlement and administration of losses, based on known facts and circumstances. Our policy is to record the liability for unpaid claims and claim adjustment expense equal to the best estimate we determine. Included in unpaid loss and loss adjustment expense are amounts for case-based reserves, including estimates of future developments on those claims, and claims incurred but not yet reported to us, second injury fund expenses, and allocated and unallocated claim adjustment expenses. Due to the inherent uncertainty associated with the cost of unsettled and unreported claims, the ultimate liability may differ, perhaps materially, from the original estimate. These estimates are regularly reviewed and updated and any resulting adjustments are included in the current period’s operating results.
Following is a summary of the gross loss and loss adjustment expense reserves by line of business as of December 31, 2011 and 2010. The workers’ compensation line of business comprises over 98% of our total loss reserves as of both dates.
| | | As of December 31, 2011 | | | As of December 31, 2010 | |
| Line of Business | | Case | | | IBNR | | | Total | | | Case | | | IBNR | | | Total | |
| | | (In thousands) | |
Workers’ Compensation | | $ | 298,187 | | | $ | 212,545 | | | $ | 510,732 | | | $ | 257,137 | | | $ | 176,229 | | | $ | 433,366 | |
Ocean Marine | | | 718 | | | | 5,306 | | | | 6,024 | | | | 1,668 | | | | 5,059 | | | | 6,727 | |
General Liability | | | 77 | | | | 1,211 | | | | 1,288 | | | | 77 | | | | 749 | | | | 826 | |
Total | | $ | 298,982 | | | $ | 219,062 | | | $ | 518,044 | | | $ | 258,882 | | | $ | 182,037 | | | $ | 440,919 | |
Actuarial Loss Reserve Estimation Methods
We use a variety of actuarial methodologies to assist us in establishing the reserve for unpaid loss and loss adjustment expense. We also make judgments relative to estimates of future claims severity and frequency, length of time to achieve ultimate resolution, judicial theories of liability and other third-party factors that are often beyond our control.
For the current accident year, we establish the initial reserve for claims incurred-but-not-reported (“IBNR”) using an expected loss ratio (“ELR”) method. The ELR method is based on an analysis of historical loss ratios adjusted for current pricing levels, exposure growth, anticipated trends in claim frequency and severity, the impact of reform activity and any other factors that may have an impact on the loss ratio. The actual paid and incurred loss data for the accident year is reviewed each quarter and changes to the ELR may be made based on the emerging data, although changes are typically not made until the end of the accident year when the loss data can be analyzed as a complete accident year. However, due to results experienced for the 2010 accident year and the adverse development of accident years 2008 and 2009, we increased our 2010 net ELR from 61.5% to 64.5% at June 30, 2010. In 2011, given the trend of the early actuarial indicated ultimate loss ratios for the 2011 accident year and considering the adverse development in recent accident years, we increased our 2011 net ELR from 62.5% to 65.0% in the fourth quarter of the year.
The ELR is multiplied by the year-to-date earned premium to determine the ultimate losses for the current accident year. The actual paid and case outstanding losses are subtracted from the ultimate losses to determine the IBNR for the accident year. As the accident year matures, we incorporate standard actuarial reserving methodologies, including the Bornhuetter-Ferguson method and the Berquist-Sherman Adjusted Incurred Loss Development method. These methods blend the loss development and expected loss ratio methods by assigning partial weight to the initial expected losses, calculated from the expected loss ratio method, with the remaining weight applied to the actual losses, either paid or incurred. The weights assigned to the initial expected losses decrease as the accident year matures. A reserve estimate implies a pattern of expected loss emergence. If this emergence does not occur as expected, it may cause us to revisit our previous assumptions. We may adjust loss development patterns, the various method weights or the expected loss ratios used in our analysis. Management employs judgment in each reserve valuation as to how to make these adjustments to reflect current information.
For all other accident years, the estimated ultimate losses are developed using a variety of actuarial techniques as described below. In reviewing this information, we consider the following factors to be especially important at this time because they increase the variability risk factors in our loss reserve estimates:
| | • | We wrote our first policy on October 1, 2003 and, as a result, our total reserve portfolio is relatively immature when compared to other industry data. |
| | • | We have grown significantly since we began operations and have entered into several new states that are not included in our predecessor’s historical data. |
| | • | At December 31, 2011, approximately $221.1 million, or 48.0%, of our direct loss reserves were related to business written in California. Over the last several years, four significant comprehensive legislative reforms were enacted in California: AB 749 was enacted in February 2002; AB 227 and SB 228 were enacted in September 2003; and SB 899 was enacted in April 2004. This reform activity has resulted in uncertainty regarding the impact of the reforms on loss payments, loss development and, ultimately, loss reserves, making historical data less reliable as an indicator of future loss. All four bills enacted structural changes to the benefit delivery system in California, in addition to changes in the indemnity and medical benefits afforded injured workers. In response to the reform legislation and a drop in the frequency of workers’ compensation claims, the pure premium rates approved by the California Insurance Commissioner effective January 1, 2012 were 49.3% lower than the pure premium rates in effect as of July 1, 2003. More recent data has indicated the need for an increase in rates in California. With the California Department of Insurance’s approval, we adopted a 5.0% increase in advisory pure premium rates effective January 1, 2009. In June 2009, we filed for a 10.6% rate increase effective August 1, 2009, which was also approved. In July 2010, we filed for a 15.3% average rate increase effective September 1, 2010, which was also approved. In November 2011, we filed for a 10.9% average rate increase, which was approved in December 2011 and became effective on January 1, 2012. The California Department of Insurance has more recently recognized pure premium deterioration for the market as a whole, approving in full the January 1, 2012 pure premium rate filing submitted by the WCIRB. Consequently, the bureau-approved pure premium rates are now 49.3% lower than the pure premium rates in effect as of July 1, 2003. |
Key elements of the reforms as they relate to indemnity and medical benefits were as follows:
Indemnity Benefits
AB 749 significantly increased most classes of workers’ compensation indemnity benefits over a four-year period beginning in 2003.
AB 227 and SB 228 repealed the mandatory vocational rehabilitation benefits and replaced them with a system of non-transferable education vouchers.
SB 899 required the Division of Workers’ Compensation (“DWC”) Administrative Director to adopt, on or before January 1, 2005, a new permanent disability rating schedule (“PDRS”) based in part on American Medical Association guidelines. Also, temporary disability was limited to a duration of two years. SB 899 also provided that, effective April 19, 2004, apportionment of disability for purposes of permanent disability determination must be based on causation.
Medical Benefits
AB 749 repealed the presumption given to the primary treating physician (except when the worker has pre-designated a personal physician), effective for injuries occurring on or after January 1, 2003. (SB 228 and SB 899 later extended this to all future medical treatment on earlier injuries.)
SB 228 required the DWC Administrative Director to establish, by December 1, 2004, an Official Medical Treatment Utilization Schedule meeting specific criteria. SB 228 also provided that beginning three months after the publication date of the updated American College of Occupational and Environmental Medical (“ACOEM”) Practice Guidelines and continuing until such time as the DWC Administrative Director establishes an Official Medical Treatment Utilization Schedule, the ACOEM standards will be presumed to be correct regarding the extent and scope of all medical treatment. The DWC Administrative Director has subsequently adopted the ACOEM Guidelines as the Official Medical Treatment Utilization Schedule.
SB 228 limited the number of chiropractic visits and the number of physical therapy visits to 24 each per claim.
SB 228 established a prescription medication fee schedule set at 100% of Medi-Cal Schedule amounts.
SB 228 provided that the maximum facility fee for services performed in an ambulatory surgical center may not exceed 120% of the Medicare fees for the same service performed in a hospital outpatient facility.
SB 899 provided that after January 1, 2005, an employer or insurer may establish medical provider networks meeting certain conditions and, with limited exceptions, medical treatment can be provided within those networks.
These reforms are a source of variability in the reserve estimates as legislative changes affecting benefit levels not only impact the cost of benefits but also the rate at which accident year benefits or losses develop over time. Ongoing efforts by some system stakeholders to challenge the reforms, either through legislative, administrative or judicial means, further adds to the variability.
In the last three years there have been ongoing challenges to the PDRS, one of the most significant reforms to emerge from the 2004-2005 legislation. The PDRS was revised effective January 1, 2005. The revised schedule has resulted in significantly reduced permanent disability awards, leading to concerns that injured workers may not be adequately compensated for their work related permanent injuries.
In February of 2009, the California Workers’ Compensation Appeals Board ( the “Appeals Board”) rendered an en banc decision on a series of cases, commonly referred to as Almarez, Guzman and Ogilvie. Allowing a rebuttal of the AMA Guides, the decision has a material impact on the value of permanent disability awards. The en banc decision led to considerable comment and debate in the Workers’ Compensation community. In September of 2009, the Appeals Board reaffirmed most aspects of its prior work, with some clarifications to its February decisions. Its decision is considered final with details to be determined by case law and through appeal. In November of 2010, the California Supreme Court declined to review the Guzman case. An appeal of the Almarez case to the Fifth Circuit Court of Appeals is pending.
Workers’ compensation is considered a long-tail line of business, as it takes a relatively long period of time to finalize claims from a given accident year. Management believes that it generally takes workers’ compensation losses approximately 48 to 60 months after the start of an accident year until the data is viewed as fully credible for paid and incurred reserve evaluation methods. Workers’ compensation losses can continue to develop beyond 60 months and in some cases claims can remain open more than 20 years. As indicated above, we wrote our first policy on October 1, 2003 so our first complete accident year is 2004. As of December 31, 2011, accident year 2004 was 96 months developed, accident year 2005 was 84 months developed, accident year 2006 was 72 months developed, accident year 2007 was 60 months developed, accident year 2008 was 48 months developed, accident year 2009 was 36 months developed, accident year 2010 was 24 months developed and accident year 2011 was 12 months developed. Our loss reserve estimates are subject to considerable variation due to the relative immaturity of the accident years from a development standpoint.
We review the following significant components of loss reserves on a quarterly basis:
| | • | IBNR reserves for losses — This includes amounts for the medical and indemnity components of the workers’ compensation claim payments, net of subrogation recoveries and deductibles; |
| | • | IBNR reserves for defense and cost containment expenses (“DCC”, also referred to as allocated loss adjustment expenses (“ALAE”)), net of subrogation recoveries and deductibles; |
| | • | reserve for adjusting and other expenses, also known as unallocated loss adjustment expenses (“ULAE”); and |
| | • | reserve for loss based assessments, also referred to as the “8F reserve” in reference to Section 8, Compensation for Disability, subsection (f), Injury increasing disability, of the United States Longshore and Harbor Workers’ Compensation Act (“USL&H”) Act. |
The reserves for losses and DCC are also reviewed gross and net of reinsurance (referred to as “net”). For gross losses, the claims for the Washington USL&H Plan, the KEIC claims assumed in the Acquisition and claims assumed from the NCCI residual market pools are excluded from this discussion.
IBNR reserves include a provision for future development on known claims, a reopened claims reserve, a provision for claims incurred but not reported and a provision for claims in transit (incurred and reported but not recorded).
Our analysis is done separately for the indemnity, medical and DCC components of the total loss reserves within each accident year. In addition, the analysis is completed separately for the following five categories: State Act, California (California); State Act, Alaska and Hawaii (Alaska & Hawaii); State Act, Illinois (Illinois); State Act, all other states (All Other); and USL&H claims. The business is divided into these categories for the determination of ultimate losses due to differences in the laws that cover each of these categories.
Workers’ compensation insurance is statutorily provided for in all of the states in which we do business. State laws and regulations provide for the form and content of policy coverage and the rights and benefits that are available to injured workers, their representatives and medical providers. Because the benefits are established by state statute, there can be significant variation in these benefits by state. We refer to this coverage as State Act.
Our business is also affected by federal laws including the USL&H Act, which is administered by the Department of Labor, and the Merchant Marine Act of 1920, or Jones Act. The USL&H Act contains various provisions affecting our business, including the nature of the liability of employers of longshoremen, the rate of compensation to an injured longshoreman, the selection of physicians, compensation for disability and death and the filing of claims. We refer to the business covered under the USL&H Act and the Jones Act as USL&H.
Because there are different laws and benefit levels that affect the State Act versus USL&H business, there is a strong likelihood that these categories will exhibit different loss development characteristics which will influence the ultimate loss calculations. Separating the data into the State Act and USL&H categories allows us to use actuarial methods that contemplate these differences.
Development factors, expected loss rates and expected loss ratios are derived from the combined experience of us and our predecessor.
Gross ultimate loss (indemnity, medical and ALAE separately) for each category is estimated using the following actuarial methods:
| | • | paid loss (or ALAE) development; |
| | • | incurred loss (or ALAE) development; |
| | • | Bornhuetter-Ferguson using ultimate premiums and paid loss (or ALAE); |
| | • | Bornhuetter-Ferguson using ultimate premiums and incurred loss (or ALAE); |
| | • | Berquist-Sherman adjusted incurred loss development; and |
| | • | Bornhuetter-Ferguson using ultimate premiums and adjusted incurred loss development. |
A gross ultimate value is selected by reviewing the various ultimate estimates and applying actuarial judgment to achieve a reasonable best estimate of the ultimate liability. The gross IBNR reserve equals the selected gross ultimate loss minus the gross paid losses and gross case reserves as of the valuation date. The selected gross ultimate loss and ALAE are reviewed and updated on a quarterly basis.
Variation in Ultimate Loss Estimates
In light of our short operating history and uncertainties concerning the effects of recent legislative reforms, specifically as they relate to our California workers’ compensation experience, the actuarial techniques discussed above use the historical experience of our predecessor as well as industry information in the analysis of loss reserves. We are able to effectively draw on the historical experience of our predecessor because most of the current members of our management and adjusting staff also served as the management and adjusting staff of our predecessor. Over time, we expect to place more reliance on our own developed loss experience and less on our predecessor’s and industry experience.
These techniques recognize, among other factors:
| | • | our claims experience and that of our predecessor; |
| | • | the industry’s claim experience; |
| | • | historical trends in reserving patterns and loss payments; |
| | • | the impact of claim inflation and/or deflation; |
| | • | the pending level of unpaid claims; |
| | • | the cost of claim settlements; |
| | • | legislative reforms affecting workers’ compensation, including pricing; |
| | • | the overall environment in which insurance companies operate; and |
| | • | trends in claim frequency and severity. |
In addition, there are loss and loss adjustment expense risk factors that affect workers’ compensation claims that can change over time and also cause our loss reserves to fluctuate. Some examples of these risk factors include, but are not limited to, the following:
| | • | availability of light duty for early return to work; |
| | • | recovery time from the injury; |
| | • | increased claim duration and its effect on treatment utilization and costs; |
| | • | changes in state or federal compensation benefit law; |
| | • | changes in case law affecting compensation guidelines; |
| | • | degree of patient responsiveness to treatment; |
| | • | use of pharmaceutical drugs; |
| | • | type and effectiveness of medical treatments; |
| | • | frequency of visits to healthcare providers; |
| | • | changes in costs of medical treatments; |
| | • | availability of new medical treatments and equipment; |
| | • | types of healthcare providers used; |
| | • | wage inflation in states that index benefits; and |
| | • | changes in administrative policies of second injury funds. |
Variation can also occur in the loss reserves due to factors that affect our book of business in general. Some examples of these risk factors include, but are not limited to, the following:
| | • | change in mix of business by state; |
| | • | change in mix of business by employer type; |
| | • | small volume of internal data; and |
| | • | significant exposure growth over recent data periods. |
Impact of Changes in Key Assumptions on Reserve Volatility
The most significant factor currently impacting our loss reserve estimates is the reliance on historical reserving patterns and loss payments from our predecessor and the industry, also referred to as loss development. This is due to our limited operating history as discussed above. The actuarial methods that we use depend at varying levels on loss development patterns based on past information. Development is defined as the difference, on successive valuation dates, between observed values of certain fundamental quantities that may be used in the loss reserve estimation process. For example, the data may be paid losses, case incurred losses and the change in case reserves or claim counts, including reported claims, closed claims or reopened claims. Development can be expected, meaning it is consistent with prior results; favorable (better than expected); or unfavorable (worse than expected). In all cases, we are comparing the actual development of the data in the current valuation with what was expected based on the historical patterns in the underlying data. Favorable development indicates a basis for reducing the estimated ultimate loss amounts while unfavorable development indicates a basis for increasing the estimated ultimate loss amounts. We reflect the favorable or unfavorable development in loss reserves in the results of operations in the period in which the ultimate loss estimates are changed.
Estimating loss reserves is an uncertain and complex process which involves actuarial techniques and management judgment. Actuarial analysis generally assumes that past patterns demonstrated in the data will repeat themselves and that the data provides a basis for estimating future loss reserves. However, since conditions and trends that have affected losses in the past may not occur in the future in the same manner, if at all, future results may not be reliably predicted by the prior data. Due to the relative immaturity of our book of business, the challenge has been to give the appropriate weight in the ultimate loss estimation process to the new data as it becomes available. As discussed above, management believes that it generally takes workers’ compensation losses approximately 48 to 60 months after the start of an accident year until the data is viewed as fully credible for paid and incurred reserve evaluation methods. Due to our limited operating history, we have eight complete accident years that were developed 96 months, 84 months, 72 months, 60 months, 48 months, 36 months, 24 months and 12 months (2004, 2005, 2006, 2007, 2008, 2009, 2010 and 2011, respectively) at December 31, 2011. At December 31, 2011, the analysis for accident years 2003 through 2010 utilizes a Bornhuetter-Ferguson approach, which blends the loss development and expected loss ratio methods, in addition to the paid and incurred loss development methods. See “Results of Operations – Year Ended December 31, 2011 Compared to Year Ended December 31, 2010 – Loss and Loss Adjustment Expenses” in this Item 7 for a discussion of the net unfavorable development in accident years 2006 through 2010 as well as the ELR for accident year 2011. For more information on the ELR method and selection see the related discussion under the heading “Actuarial Loss Reserve Estimation Methods” in this Item 7.
For accident years 2006 and prior, there was unfavorable development in the losses for California State Act which resulted in an increase of our net ultimate loss estimates of $2.8 million. For non-California State Act, there was unfavorable development in the losses for accident years 2006 and prior which resulted in an increase of our net ultimate loss estimates of $0.4 million. This was offset by favorable development in the USL&H losses for accident years 2006 and prior which resulted in a decrease of our net ultimate loss estimates of $0.6 million.
For accident year 2007, there was unfavorable development in the losses for California State Act which resulted in an increase of our net ultimate loss estimates of $3.0 million. For non-California State Act, there was unfavorable development in the losses for accident year 2007 which resulted in an increase of our net ultimate loss estimates of $2.3 million. For USL&H, there was unfavorable development in the losses for accident year 2007 which resulted in an increase of our net ultimate loss estimates of $1.4 million.
For accident year 2008, there was unfavorable development in the losses for California State Act which resulted in an increase of our net ultimate loss estimates of $3.2 million. For non-California State Act, there was unfavorable development in the losses for accident year 2008 which resulted in an increase of our net ultimate loss estimates of $5.3 million. For USL&H, there was unfavorable development in the losses for accident year 2008 which resulted in an increase of our net ultimate loss estimates of $0.5 million.
For accident year 2009, there was unfavorable development in the losses for California State Act which resulted in an increase of our net ultimate loss estimates of $4.6 million. For non-California State Act, there was unfavorable development in the losses for accident year 2009 which resulted in an increase of our net ultimate loss estimates of $3.3 million. For USL&H, there was unfavorable development in the losses for accident year 2009 which resulted in an increase of our net ultimate loss estimates of $0.6 million.
For accident year 2010, there was unfavorable development in the losses for California State Act which resulted in an increase of our net ultimate loss estimates of $3.8 million. For non-California State Act, there was unfavorable development in the losses for accident year 2009 which resulted in an increase of our net ultimate loss estimates of $8.0 million. In addition, our IBNR accrual for earned but unbilled premiums resulted in an increase of our net ultimate loss estimates of $0.2 million. This was offset by favorable development in the USL&H losses for accident year 2010 which resulted in a decrease of our net ultimate loss estimates of $2.3 million.
For accident year 2011, the ultimate losses were set by multiplying the selected ELR to the booking earned premium. We initially established a net ELR for accident year 2011 of 62.5%. However, after reviewing the 2011 results and considering the adverse development in recent accident years and the impact of lower ceding rates in our 2011-2012 reinsurance treaty, we increased the 2011 net ELR to 65.0% in the fourth quarter of the year. For more information on the ELR method and selection see the related discussion under the heading “Actuarial Loss Reserve Estimation Methods” in this Item 7.
Reserve Sensitivities
Although many factors influence the actual cost of claims and the corresponding unpaid loss and loss adjustment expense estimates, we do not measure and estimate values for all of these variables individually. This is due to the fact that many of the factors that are known to impact the cost of claims cannot be measured directly. This is the case for the impact of economic inflation on claim costs, coverage interpretations and jury determinations. In most instances, we rely on historical experience or industry information to estimate values for the variables that are explicitly used in the unpaid loss and loss adjustment expense analysis. We assume that the historical effect of these unmeasured factors, which is embedded in our experience or industry experience, is representative of future effects of these factors. It is important to note that actual claims costs will vary from our estimate of ultimate claim costs, perhaps by substantial amounts, due to the inherent variability of the business written, the potentially significant claim settlement lags and the fact that not all events affecting future claim costs can be estimated.
As discussed in the previous section, there are a number of variables that can impact, individually or in combination, the adequacy of our loss and loss adjustment expense liabilities. While the actuarial methods employed factor in amounts for these circumstances, the loss reserves may prove to be inadequate despite the actuarial methods used. Several examples are provided below to highlight the potential variability present in our loss reserves. Each of these examples represents scenarios that are reasonably likely to occur over time. For example, there may be a number of claims where the unpaid loss and loss adjustment expense associated with future medical treatment proves to be inadequate because the injured workers do not respond to medical treatment as expected by the claims examiner. If we assume this affects 10% of the open claims and, on average, the unpaid loss and loss adjustment expenses on these claims are 20% inadequate, this would result in our unpaid loss and loss adjustment expense liability being inadequate by approximately $10.4 million, or 2.0%, as of December 31, 2011. Another example is claim inflation. Claim inflation can result from medical cost inflation or wage inflation. As discussed above, the actuarial methods employed include an amount for claim inflation based on historical experience. We assume that the historical effect of this factor, which is embedded in our experience and industry experience, is representative of future effects for claim inflation. To the extent that the historical factors, and the actuarial methods utilized, are inadequate to recognize future inflationary trends, our unpaid loss and loss adjustment expense liabilities may be inadequate. If our estimate of future medical trend is two percentage points inadequate (e.g., if we estimate a 9% annual trend and the actual trend is 11%), our unpaid loss and loss adjustment expense liability could be inadequate. The amount of the inadequacy would depend on the mix of medical and indemnity payments and the length of time until the claims are paid. For example, if we assume that 50% of the unpaid loss and loss adjustment expense is associated with medical payments and an average payout period of 5 years, our unpaid loss and loss adjustment expense liabilities would be inadequate by approximately $25.9 million on a pre-tax basis, or 5%, as of December 31, 2011. Under these assumptions, the inadequacy of approximately $25.9 million represents approximately 7.3% of total stockholders’ equity at December 31, 2011. The impact of any reserve deficiencies, or redundancies, on our reported results and future earnings is discussed below.
In the event that our estimates of ultimate unpaid loss and loss adjustment expense liabilities prove to be greater or less than the ultimate liability, our future earnings and financial position could be positively or negatively impacted. Future earnings would be reduced by the amount of any deficiencies in the year(s) in which the claims are paid or the unpaid loss and loss adjustment expense liabilities are increased. For example, if we determined our unpaid loss and loss adjustment expense liability of $518.0 million as of December 31, 2011 to be 5% inadequate, we would experience a pre-tax reduction in future earnings of approximately $25.9 million. This reduction could be realized in one year or multiple years, depending on when the deficiency is identified. The deficiency would also impact our financial position because our statutory surplus would be reduced by an amount equivalent to the reduction in net income. Any deficiency is typically recognized in the unpaid loss and loss adjustment expense liability and, accordingly, it typically does not have a material effect on our liquidity because the claims have not been paid. Since the claims will typically be paid out over a multi-year period, we have generally been able to adjust our investments to match the anticipated future claim payments. Conversely, if our estimates of ultimate unpaid loss and loss adjustment expense liabilities prove to be redundant, our future earnings and financial position would be improved.
Reinsurance Recoverables
Reinsurance recoverables on paid and unpaid losses represent the portion of the loss and loss adjustment expenses that is assumed by reinsurers. These recoverables are reported on our balance sheet separately as assets, as reinsurance does not relieve us of our legal liability to policyholders and ceding companies. We are required to pay losses even if a reinsurer fails to meet its obligations under the applicable reinsurance agreement. Reinsurance recoverables are determined based in part on the terms and conditions of reinsurance contracts, which could be subject to interpretations that differ from ours based on judicial theories of liability. We calculate amounts recoverable from reinsurers based on our estimates of the underlying loss and loss adjustment expenses, which themselves are subject to significant judgments and uncertainties described above under the heading “Unpaid Loss and Loss Adjustment Expense.” Changes in the estimates and assumptions underlying the calculation of our loss reserves may have an impact on the balance of our reinsurance recoverables. In general, one would expect an increase in our underlying loss reserves on claims subject to reinsurance to have an upward impact on our reinsurance recoverables. The amount of the impact on reinsurance recoverables would depend on a number of considerations including, but not limited to, the terms and attachment points of our reinsurance contracts and the incurred amount on various claims subject to reinsurance. We also bear credit risk with respect to our reinsurers, which can be significant considering that some claims may remain open for an extended period of time.
We periodically evaluate our reinsurance recoverables, including the financial ratings of our reinsurers, and revise our estimates of such amounts as conditions and circumstances change. Changes in reinsurance recoverables are recorded in the period in which the estimate is revised. We assessed the collectability of our year-end receivables and believe that all amounts are collectible based on currently available information. Therefore, as of December 31, 2011 and 2010, we had no reserve for uncollectible reinsurance recoverables. As of December 31, 2011, the top ten companies, representing 95% of our reinsurance amounts recoverable, had A.M. Best ratings of “A” or higher.
Deferred Policy Acquisition Costs
We defer commissions, premium taxes and certain other costs that vary with and are primarily related to the acquisition of insurance contracts. These costs are capitalized and charged to expense in proportion to the recognition of premiums earned. The method followed in computing deferred policy acquisition costs limits the amount of these deferred costs to their estimated realizable value, which gives effect to the premium to be earned, related estimated investment income, anticipated losses and settlement expenses and certain other costs we expect to incur as the premium is earned. Judgments regarding the ultimate recoverability of these deferred costs are highly dependent upon the estimated future costs associated with our unearned premiums. If our expected claims and expenses, after considering investment income, exceed our unearned premiums, we would be required to write-off all or a portion of deferred policy acquisition costs.
Since inception, we have not needed to write-off any portion of our deferred acquisition costs. While we believe our estimate of anticipated loss and loss adjustment expenses as of December 31, 2011 was appropriate, if our estimate was 10% inadequate, our deferred acquisition costs as of that date would need to be reduced by approximately $9.4 million. We will continue to monitor the balance of deferred acquisition costs for recoverability. We expect that our deferred acquisition costs will decrease significantly in 2012 due to the adoption of FASB Accounting Standards Update (“ASU”) 2010-26, Accounting for Costs Associated with Acquiring or Renewing Insurance Contracts.
Income Taxes
We use the asset and liability method of accounting for income taxes. Under this method, deferred tax assets and liabilities are recognized for the future tax consequences attributable to differences between the financial statement carrying amounts of existing assets and liabilities and their respective tax bases and operating loss and tax credit carry-forwards. Deferred tax assets and liabilities are measured using tax rates expected to apply to taxable income in the years in which those temporary differences are expected to be recovered or settled. The effect on deferred tax assets and liabilities of a change in tax rates is recognized in the income statement in the period that includes the enactment date.
In assessing the realizability of deferred tax assets, management considers whether it is more likely than not that some portion or all of the deferred tax assets will not be realized. The ultimate realization of deferred tax assets is dependent upon the generation of future taxable income during the periods in which those temporary differences become deductible. This analysis requires management to make various estimates and assumptions, including the scheduled reversal of deferred tax liabilities, the consideration of operating versus capital items, projected future taxable income and the effect of tax planning strategies. If actual results differ from management’s estimates and assumptions, we may be required to establish a valuation allowance to reduce the deferred tax assets to the amounts more likely than not to be realized. The establishment of a valuation allowance could have a significant impact on our financial position and results of operations in the period in which it is deemed necessary. We reached a conclusion that, as of December 31, 2011, it is more likely than not that the deferred tax assets will be realized, and therefore no valuation allowance was recorded.
FASB ASC Topic 740, Income Taxes, prescribes a recognition threshold and measurement process for financial statement recognition and measurement of a tax position taken or expected to be taken in a tax return, and also provides guidance on the derecognition of previously recorded benefits and their classification, as well as the proper recording of interest and penalties, accounting in interim periods, disclosures and transition. As of December 31, 2011 and 2010, we had no unrecognized tax benefits. We do not anticipate that the amount of unrecognized tax benefits will significantly increase in the next 12 months. Our policy is to recognize interest and penalties on unrecognized tax benefits as an element of income tax expense (benefit) in our consolidated statements of operations and comprehensive income (loss). We file consolidated U.S. federal and state income tax returns. The tax years which remain subject to examination by the taxing authorities are the years ended December 31, 2008, 2009, 2010 and 2011.
The Valuation of Goodwill
We review our goodwill for potential impairment at least annually, and more frequently if a triggering event or other conditions indicate the possibility of impairment. Our analysis begins with a consideration of various qualitative factors to determine whether the existence of events or circumstances leads to a determination that it is more likely than not that the fair value of the reporting unit in question is less than its carrying amount. If such a determination is not reached, then performance of further impairment testing is not necessary. If the results of our qualitative analysis indicate a potential for impairment, then further impairment testing (consisting of discounted cash flow analysis and similar methodologies) is performed as required by ASC Topic 350, Intangibles – Goodwill and Other.
As previously reported, in the second quarter of 2010, we determined that a triggering event related to our insurance subsidiary had occurred, necessitating an update of the prior year’s impairment analysis. The fair value of the reporting unit was estimated using a discounted cash flow analysis, resulting in our recording a $1.5 million impairment charge against the goodwill resulting from the acquisition of SBIC in September 2003.
We performed our 2011 impairment analysis of the remaining goodwill related to the acquisitions of PMCS and BWNV in the fourth quarter of 2011 and concluded, on a more-likely-than-not basis, that no goodwill impairment existed. Among the qualitative factors considered in our analysis were the following: the substantial margins by which both reporting units passed our previous impairment analysis; the continued strong performance of both companies; the importance of both companies to our strategic plan; and a lack of the negative factors identified in ASU 2011-08, Intangibles—Goodwill and Other (Topic 350): Testing Goodwill for Impairment.
Impairment of Investment Securities
We regularly review our investment portfolio to evaluate the necessity of recording impairment losses for other-than-temporary declines in the fair value of investments. A number of criteria are considered during this process, including but not limited to the following: whether we intend to sell the security; the current fair value as compared to amortized cost or cost, as appropriate, of the security; the length of time the security’s fair value has been below amortized cost; objective information supporting recovery in a reasonable period of time; the likelihood that we will be required to sell the security before recovery of its cost basis; specific credit issues related to the issuer; and current economic conditions, including interest rates.
For debt securities that are considered OTTI and that we do not intend to sell and more likely than not would not be required to sell prior to recovery of the amortized cost basis, we recognize OTTI losses in accordance with the provisions of the ASC. The amount of the OTTI loss is separated into the amount that is credit related (credit loss component) and the amount due to all other factors. The credit loss component is recognized in earnings and is the difference between a security’s amortized cost basis and the present value of expected future cash flows discounted at the security’s effective interest rate. The amount due to all other factors is recognized in other comprehensive income.
We regularly review our investment portfolio for declines in value. In general, we review all securities that are impaired by 5% or more at the end of the period. We focus our review of securities with no stated maturity date on securities that were impaired by 20% or more at the end of the period or have been impaired 10% or more continuously for six months or longer as of the end of the period. We also analyze the entire portfolio for other factors that might indicate a risk of impairment, including credit ratings and interest rates. It is possible that we could recognize future impairment losses on some securities we owned at December 31, 2011 if future events, information and the passage of time result in a determination that a decline in value is other-than-temporary.
No other-than-temporary declines in the fair value of our securities were recorded in 2011 or 2010. In 2009, we recognized other-than-temporary impairment charges of $0.3 million related to our investments in preferred stocks issued by Fannie Mae and Freddie Mac that were sold in 2009. Please refer to the tables in Note 3, “Investments” of the consolidated financial statements in Part II, Item 8 of this annual report for additional information on unrealized losses on our investment securities. Please refer to Part II, Item 7A of this annual report for tables showing the sensitivity of the fair value of our fixed-income investments to selected hypothetical changes in interest rates. See “Liquidity and Capital Resources” in Part II, Item 7 of this annual report for a discussion of the limited exposure in our investment portfolio at December 31, 2011 to sub-prime mortgages.
Earned But Unbilled Premiums
Shortly following the expiration of an insurance policy, we perform a final payroll audit of each insured to determine the final premium to be billed and earned. These final audits generally result in an audit adjustment, either increasing or decreasing the estimated premium earned and billed to date. We estimate the amount of premiums that have been earned but are unbilled at the end of a reporting period by analyzing historical earned premium adjustments made at final audit for the preceding 12 months and applying the average adjustment percentage against our in-force earned premium for the period. These estimates are subject to changes in policyholders’ payrolls due to growth, economic conditions, seasonality and other factors, as well as fluctuations in our in-force premium. For example, the amount of our accrual for premiums earned but unbilled fluctuated between ($1.3) million and $0.7 million in 2011 and between ($1.0) million and ($0.1) million in 2010. The balance of our accrual for premiums earned but unbilled totaled approximately $0.3 million and ($0.6) million at December 31, 2011 and 2010, respectively. Although considerable variability is inherent in such estimates, management believes that the accrual for earned but unbilled premiums is reasonable. The estimates are reviewed quarterly and adjusted as necessary as experience develops or new information becomes known. Any such adjustments are included in current operations.
Retrospective Premiums
The premiums for our retrospectively rated loss sensitive plans are reflective of the customer’s loss experience because, beginning six months after the expiration of the relevant insurance policy, and annually thereafter, we recalculate the premium payable during the policy term based on the current value of the known losses that occurred during the policy term. While the typical retrospectively rated policy has around five annual adjustment or measurement periods, premium adjustments continue until mutual agreement to cease future adjustments is reached with the policyholder. Retrospective premiums for primary and reinsured risks are included in income as earned on a pro rata basis over the effective period of the respective policies. Earned premiums on retrospectively rated policies are based on our estimate of loss experience as of the measurement date. Unearned premiums are deferred and include that portion of premiums written that is applicable to the unexpired period of the policies in force and estimated adjustments of premiums on policies that have retrospective rating endorsements.
We bear credit risk with respect to retrospectively rated policies. Because of the long duration of our loss sensitive plans, there is a risk that the customer will fail to pay the additional premium. Accordingly, we obtain collateral in the form of letters of credit or deposits to mitigate credit risk associated with our loss sensitive plans. If we are unable to collect future retrospective premium adjustments from an insured, we would be required to write-off the related amounts, which could impact our financial position and results of operations. Since inception, there have been approximately $0.2 million in write-offs. Retrospectively rated policies accounted for approximately 6.6% of direct premiums written in 2011 and approximately 5.9% of direct premiums written in 2010.
Recent Accounting Pronouncements
In October 2010, the FASB issued ASU 2010-26, Accounting for Costs Associated with Acquiring or Renewing Insurance Contracts. This ASU allows insurance entities to defer costs related to the acquisition of new or renewal insurance contracts that are (1) incremental direct costs of the contract transaction (i.e., would not have occurred without the contract transaction), (2) a portion of an employee's compensation and fringe benefits related to certain activities for successful contract acquisitions, or (3) direct-response advertising costs as defined in ASC Subtopic 340-20, Other Assets and Deferred Costs - Capitalized Advertising Costs. All other costs related to the acquisition of new or renewal insurance contracts are required to be expensed as incurred. This ASU is effective for interim and annual periods beginning after December 15, 2011 with either prospective or retrospective application permitted. We will adopt this guidance retrospectively effective January 1, 2012. We currently estimate that adoption will reduce our December 31, 2011 retained earnings (the period immediately prior to adoption) by approximately $4.5 million, net of taxes.
In May 2011, the FASB issued ASU 2011-04, Fair Value Measurement (Topic 820): Amendments to Achieve Common Fair Value Measurement and Disclosure Requirements in U.S. GAAP and IFRSs, to provide largely identical guidance about fair value measurement and disclosure requirements. The new standards do not extend the use of fair value but, rather, provide guidance about how fair value should be applied where it already is required or permitted under International Financial Reporting Standards (“IFRS”) or U.S. GAAP. The new guidance is effective for interim and annual reporting periods beginning after December 15, 2011. Early adoption is not permitted. The adoption of ASU 2011-04 is not expected to have a material effect on our consolidated financial condition and results of operations.
In June 2011, the FASB issued ASU 2011-05, Comprehensive Income (Topic 220): Presentation of Comprehensive Income, to increase the prominence of other comprehensive income in the financial statements. An entity will have the option to present the components of net income and comprehensive income in either one or two consecutive financial statements. The new guidance is effective for interim and annual reporting periods beginning after December 15, 2011, with earlier adoption permitted. We adopted this guidance retrospectively effective September 30, 2011. The adoption of ASU 2011-05 did not have a material effect on our consolidated financial condition or results of operations.
In September 2011, the FASB issued ASU 2011-08, Intangibles—Goodwill and Other (Topic 350): Testing Goodwill for Impairment, to simplify the current two-step goodwill impairment test required under Topic 350. Under this update, an entity has the option to first assess qualitative factors to determine whether the existence of events or circumstances leads to a determination that it is more likely than not that the fair value of a reporting unit is less than its carrying amount. If such a determination is not reached, then performance of further impairment testing is not necessary. The new guidance is effective for annual and interim goodwill tests performed for fiscal years beginning after December 15, 2011. However, early adoption is permitted. We adopted ASU 2011-08 in the fourth quarter of 2011, which did not have a material effect on our consolidated financial condition or results of operations.
Item 7A. Quantitative and Qualitative Disclosures About Market Risk.
In 2008 and 2009, a series of crises occurred in the U.S. financial and capital markets, as well as in housing and global credit markets. These conditions accelerated into a global economic recession. The declining economic conditions worsened over the last half of 2008 and continued into the first half of 2009. However, the equity and debt markets began to show improvement in mid-2009 going forward. For example, the net unrealized gain on our investment portfolio increased from $1.4 million at March 31, 2009 to $18.4 million at December 31, 2009, $29.8 million at September 30, 2010, decreased to $7.2 million at December 31, 2010, and increased to $34.4 million at December 31, 2011.
Our consolidated balance sheets include a substantial amount of assets and liabilities whose fair values are subject to market risks, including credit and interest rate risks. Market risk is the potential economic loss principally arising from adverse changes in the fair value of financial instruments. In 2008 and 2009, we recognized, on a pre-tax basis, approximately $13.7 million of other-than-temporary impairment charges related to our investments in government-sponsored-entity preferred stock and exchange-traded funds. In 2010 and 2011, we recognized no other-than-temporary impairments. The impact of actions taken by governmental bodies in response to the current economic conditions is difficult to predict, particularly over the short term, and we cannot predict the timing or magnitude of a recovery. The fair value of our investment portfolio remains subject to considerable volatility, particularly over the short term. The following sections address the significant market risks associated with our business activities.
Credit Risk
Credit risk is the potential economic loss principally arising from adverse changes in the financial condition of a specific debt issuer. We address this risk by investing generally in fixed-income securities which are rated “A” or higher by Standard & Poor’s or another major rating agency. We also independently, and through our outside investment manager, monitor the financial condition of all of the issuers of fixed-income securities in our portfolio. To limit our exposure to risk, we employ stringent diversification rules that limit the credit exposure to any single issuer or business sector. See “Investments” in Part I, Item 1 of this annual report for a discussion of the limited exposure in our investment portfolio at December 31, 2011 to sub-prime mortgages and the European sovereign debt crisis.
Interest Rate Risk
We had fixed-income investments with a fair value of $700.3 million at December 31, 2011 that are subject to interest rate risk compared with $673.0 million at December 31, 2010. We manage the exposure to interest rate risk through a disciplined asset/liability matching and capital management process. In the management of this risk, the characteristics of duration, credit and variability of cash flows are critical elements. These risks are assessed regularly and balanced within the context of the liability and capital position.
The table below summarizes the interest rate risk in our investment portfolio as of December 31, 2011 and December 31, 2010. It illustrates the sensitivity of the fair value of fixed-income investments to selected hypothetical changes in interest rates as of December 31, 2011 and December 31, 2010. The selected scenarios are not predictions of future events, but rather illustrate the effect that such events may have on the fair value of our fixed-income portfolio and stockholders’ equity.
Interest Rate Risk as of December 31, 2011:
| Hypothetical Change in Interest Rates | | Estimated Change in Fair Value | | | Fair Value | | | Hypothetical Percentage Increase (Decrease) in Portfolio Value | |
| | | ($ in thousands) | | | | |
200 basis point increase | | $ | (57,217 | ) | | $ | 643,129 | | | | (8.2 | )% |
100 basis point increase | | | (28,475 | ) | | | 671,871 | | | | (4.1 | )% |
No change | | | — | | | | 700,346 | | | | — | |
100 basis point decrease | | | 28,209 | | | | 728,555 | | | | 4.0 | % |
200 basis point decrease | | | 56,152 | | | | 756,498 | | | | 8.0 | % |
Interest Rate Risk as of December 31, 2010:
| Hypothetical Change in Interest Rates | | Estimated Change in Fair Value | | | Fair Value | | | Hypothetical Percentage Increase (Decrease) in Portfolio Value | |
| | | ($ in thousands) | | | | |
200 basis point increase | | $ | (59,313 | ) | | $ | 613,655 | | | | (8.8 | )% |
100 basis point increase | | | (30,031 | ) | | | 642,937 | | | | (4.5 | )% |
No change | | | — | | | | 672,968 | | | | — | |
100 basis point decrease | | | 30,781 | | | | 703,749 | | | | 4.6 | % |
200 basis point decrease | | | 62,310 | | | | 735,278 | | | | 9.3 | % |
Item 8. Financial Statements and Supplementary Data.
Index to Financial Statements
| | Page |
| SeaBright Holdings, Inc. and Subsidiaries Consolidated Financial Statements | |
Report of Independent Registered Public Accounting Firm | 75 |
Consolidated Balance Sheets | 76 |
Consolidated Statements of Operations and Comprehensive Income (Loss) | 77 |
Consolidated Statements of Changes in Stockholders’ Equity | 78 |
Consolidated Statements of Cash Flows | 79 |
Notes to Consolidated Financial Statements | 80 |
Report of Independent Registered Public Accounting Firm
The Board of Directors and Stockholders
SeaBright Holdings, Inc.:
We have audited the accompanying consolidated balance sheets of SeaBright Holdings, Inc. and subsidiaries as of December 31, 2011 and 2010, and the related consolidated statements of operations and comprehensive income (loss), changes in stockholders’ equity, and cash flows for each of the years in the three-year period ended December 31, 2011. These consolidated financial statements are the responsibility of SeaBright Holdings, Inc.’s management. Our responsibility is to express an opinion on these consolidated financial statements based on our audits.
We conducted our audits in accordance with the standards of the Public Company Accounting Oversight Board (United States). Those standards require that we plan and perform the audit to obtain reasonable assurance about whether the financial statements are free of material misstatement. An audit includes examining, on a test basis, evidence supporting the amounts and disclosures in the financial statements. An audit also includes assessing the accounting principles used and significant estimates made by management, as well as evaluating the overall financial statement presentation. We believe that our audits provide a reasonable basis for our opinion.
In our opinion, the consolidated financial statements referred to above present fairly, in all material respects, the financial position of SeaBright Holdings, Inc. and subsidiaries as of December 31, 2011 and 2010, and the results of their operations and their cash flows for each of the years in the three-year period ended December 31, 2011, in conformity with U.S. generally accepted accounting principles.
We also have audited, in accordance with the standards of the Public Company Accounting Oversight Board (United States), SeaBright Holdings, Inc.’s internal control over financial reporting as of December 31, 2011, based on criteria established in Internal Control — Integrated Framework issued by the Committee of Sponsoring Organizations of the Treadway Commission (COSO), and our report dated March 5, 2012 expressed an unqualified opinion on the effectiveness of SeaBright Holdings, Inc. and subsidiaries’ internal control over financial reporting.
/s/ KPMG LLP
Seattle, Washington
March 5, 2012
SEABRIGHT HOLDINGS, INC. AND SUBSIDIARIES
CONSOLIDATED BALANCE SHEETS
| | | December 31, | |
| | | 2011 | | | 2010 | |
| | | (In thousands, except share and per share information) | |
| ASSETS | |
| Fixed income securities available-for-sale, at fair value (amortized cost $665,891 in 2011 and $665,761 in 2010) | | $ | 700,346 | | | $ | 672,968 | |
Cash and cash equivalents | | | 28,503 | | | | 15,958 | |
Accrued investment income | | | 6,987 | | | | 7,085 | |
Premiums receivable, net of allowance | | | 18,332 | | | | 15,023 | |
Deferred premiums | | | 142,486 | | | | 168,842 | |
Reinsurance recoverables | | | 94,173 | | | | 56,746 | |
Due from reinsurer | | | 4,814 | | | | 4,420 | |
Receivable under adverse development cover | | | 3,117 | | | | 2,965 | |
Prepaid reinsurance | | | 4,424 | | | | 4,288 | |
Property and equipment, net | | | 6,337 | | | | 6,277 | |
Federal income tax recoverable | | | 12,823 | | | | 11,749 | |
Deferred income taxes, net | | | 19,233 | | | | 23,458 | |
Deferred policy acquisition costs, net | | | 21,834 | | | | 25,574 | |
Intangible assets, net | | | 1,244 | | | | 1,330 | |
Goodwill | | | 2,794 | | | | 2,794 | |
Other assets | | | 11,391 | | | | 7,085 | |
Total assets | | $ | 1,078,838 | | | $ | 1,026,562 | |
| | |
| LIABILITIES AND STOCKHOLDERS’ EQUITY | |
| Liabilities: | | | | | | | | |
Unpaid loss and loss adjustment expense | | $ | 518,044 | | | $ | 440,919 | |
Unearned premiums | | | 130,300 | | | | 155,786 | |
Reinsurance funds withheld and balances payable | | | 7,079 | | | | 6,739 | |
Premiums payable | | | 6,351 | | | | 8,645 | |
Accrued expenses and other liabilities | | | 51,553 | | | | 51,456 | |
Surplus notes | | | 12,000 | | | | 12,000 | |
Total liabilities | | | 725,327 | | | | 675,545 | |
| | | | | | | | | |
| Commitments and contingencies (Notes 13 and 15) | | | | | | | | |
| | | | | | | | | |
| Stockholders’ equity: | | | | | | | | |
| Series A preferred stock, $0.01 par value; 750,000 shares authorized; no shares issued and outstanding | | | — | | | | — | |
| Undesignated preferred stock, $0.01 par value; 10,000,000 shares authorized; no shares issued and outstanding | | | — | | | | — | |
| Common stock, $0.01 par value; 75,000,000 shares authorized; issued and outstanding — 22,327,749 shares at December 31, 2011 and 22,025,450 shares at December 31, 2010 | | | 223 | | | | 220 | |
Paid-in capital | | | 213,746 | | | | 209,941 | |
Accumulated other comprehensive income | | | 23,269 | | | | 5,591 | |
Retained earnings | | | 116,273 | | | | 135,265 | |
Total stockholders’ equity | | | 353,511 | | | | 351,017 | |
Total liabilities and stockholders’ equity | | $ | 1,078,838 | | | $ | 1,026,562 | |
See accompanying notes to consolidated financial statements.
SEABRIGHT HOLDINGS, INC. AND SUBSIDIARIES
CONSOLIDATED STATEMENTS OF OPERATIONS
AND COMPREHENSIVE INCOME (LOSS)
| | | Year Ended December 31, | |
| | | 2011 | | | 2010 | | | 2009 | |
| | | (In thousands, except share and per share information) | |
| Revenue: | | | | | | | | | |
Premiums earned | | $ | 249,551 | | | $ | 254,326 | | | $ | 244,427 | |
Claims service income | | | 1,261 | | | | 889 | | | | 1,011 | |
Net investment income | | | 21,041 | | | | 23,466 | | | | 23,132 | |
Other-than-temporary impairment losses: | | | | | | | | | | | | |
Total other-than-temporary impairment losses | | | — | | | | — | | | | (258 | ) |
Less portion of losses recognized in accumulated other comprehensive income (loss) | | | — | | | | — | | | | — | |
Net impairment losses recognized in earnings | | | — | | | | — | | | | (258 | ) |
| Other net realized gains (losses) recognized in earnings | | | 1,051 | | | | 15,425 | | | | (171 | ) |
Other income | | | 4,257 | | | | 4,253 | | | | 5,284 | |
| | | | 277,161 | | | | 298,359 | | | | 273,425 | |
| Losses and expenses: | | | | | | | | | | | | |
Loss and loss adjustment expenses | | | 218,413 | | | | 223,050 | | | | 174,324 | |
Underwriting, acquisition and insurance expenses | | | 75,521 | | | | 72,084 | | | | 72,837 | |
Interest expense | | | 525 | | | | 528 | | | | 599 | |
Goodwill impairment | | | — | | | | 1,527 | | | | — | |
Other expenses | | | 8,028 | | | | 7,509 | | | | 9,079 | |
| | | | 302,487 | | | | 304,698 | | | | 256,839 | |
Income (loss) before taxes | | | (25,326 | ) | | | (6,339 | ) | | | 16,586 | |
| Income tax expense (benefit): | | | | | | | | | | | | |
Current | | | (5,454 | ) | | | (7,015 | ) | | | 5,805 | |
Deferred | | | (5,346 | ) | | | 2,259 | | | | (2,754 | ) |
| | | | (10,800 | ) | | | (4,756 | ) | | | 3,051 | |
Net income (loss) | | | (14,526 | ) | | | (1,583 | ) | | | 13,535 | |
| | | | | | | | | | | | | |
| Other comprehensive income (loss): | | | | | | | | | | | | |
Increase in net unrealized gains on investment securities available for sale | | | 28,319 | | | | 4,227 | | | | 22,527 | |
Less: Reclassification adjustment for net realized losses (gains) recorded into net income | | | (1,051 | ) | | | (15,425 | ) | | | 429 | |
Income tax benefit (expense) related to items of other comprehensive income (loss) | | | (9,590 | ) | | | 3,862 | | | | (6,020 | ) |
Other comprehensive income (loss) | | | 17,678 | | | | (7,336 | ) | | | 16,936 | |
Comprehensive income (loss) | | $ | 3,152 | | | $ | (8,919 | ) | | $ | 30,471 | |
| | | | | | | | | | | | | |
Basic earnings (loss) per share | | $ | (0.69 | ) | | $ | (0.08 | ) | | $ | 0.65 | |
Diluted earnings (loss) per share | | $ | (0.69 | ) | | $ | (0.08 | ) | | $ | 0.63 | |
| | | | | | | | | | | | | |
| Weighted average basic shares outstanding | | | 21,118,711 | | | | 20,867,720 | | | | 20,702,572 | |
| Weighted average diluted shares outstanding | | | 21,118,711 | | | | 20,867,720 | | | | 21,515,153 | |
See accompanying notes to consolidated financial statements.
SEABRIGHT HOLDINGS, INC. AND SUBSIDIARIES
CONSOLIDATED STATEMENTS OF CHANGES IN STOCKHOLDERS’ EQUITY
| | Outstanding Common Shares | | | Common Stock | | | Paid-in Capital | | | Accumulated Other Comprehensive Income (Loss) | | | Retained Earnings | | | Total Stockholders’ Equity | |
| | | (In thousands, except per share information) | |
Balance at December 31, 2008 | | | 21,393 | | | $ | 214 | | | $ | 200,893 | | | $ | (4,009 | ) | | $ | 127,715 | | | $ | 324,813 | |
Net income | | | — | | | | — | | | | — | | | | — | | | | 13,535 | | | | 13,535 | |
Other comprehensive income | | | — | | | | — | | | | — | | | | 16,936 | | | | — | | | | 16,936 | |
| Stock based compensation, net of taxes of $192 | | | — | | | | — | | | | 4,611 | | | | — | | | | — | | | | 4,611 | |
Restricted stock grants | | | 320 | | | | 4 | | | | — | | | | — | | | | — | | | | 4 | |
Exercise of stock options | | | 7 | | | | — | | | | 47 | | | | — | | | | — | | | | 47 | |
| Minimum tax withholdings on restricted stock vestings | | | (44 | ) | | | (1 | ) | | | (472 | ) | | | — | | | | — | | | | (473 | ) |
Balance at December 31, 2009 | | | 21,676 | | | | 217 | | | | 205,079 | | | | 12,927 | | | | 141,250 | | | | 359,473 | |
Net loss | | | — | | | | — | | | | — | | | | — | | | | (1,583 | ) | | | (1,583 | ) |
Other comprehensive loss | | | — | | | | — | | | | — | | | | (7,336 | ) | | | — | | | | (7,336 | ) |
Dividends declared ($0.20 per share) | | | — | | | | — | | | | — | | | | — | | | | (4,402 | ) | | | (4,402 | ) |
Stock based compensation | | | — | | | | — | | | | 5,424 | | | | — | | | | — | | | | 5,424 | |
Restricted stock grants | | | 400 | | | | 3 | | | | — | | | | — | | | | — | | | | 3 | |
Exercise of stock options | | | 4 | | | | — | | | | 26 | | | | — | | | | — | | | | 26 | |
| Minimum tax withholdings on restricted stock vestings | | | (55 | ) | | | — | | | | (588 | ) | | | — | | | | — | | | | (588 | ) |
Balance at December 31, 2010 | | | 22,025 | | | | 220 | | | | 209,941 | | | | 5,591 | | | | 135,265 | | | | 351,017 | |
Net loss | | | — | | | | — | | | | — | | | | — | | | | (14,526 | ) | | | (14,526 | ) |
Other comprehensive income | | | — | | | | — | | | | — | | | | 17,678 | | | | — | | | | 17,678 | |
Dividends declared ($0.20 per share) | | | — | | | | — | | | | — | | | | — | | | | (4,466 | ) | | | (4,466 | ) |
Stock based compensation | | | — | | | | — | | | | 4,701 | | | | — | | | | — | | | | 4,701 | |
Restricted stock grants | | | 438 | | | | 4 | | | | 1 | | | | — | | | | — | | | | 5 | |
| Minimum tax withholdings on restricted stock vestings | | | (135 | ) | | | (1 | ) | | | (897 | ) | | | — | | | | — | | | | (898 | ) |
Balance at December 31, 2011 | | | 22,328 | | | $ | 223 | | | $ | 213,746 | | | $ | 23,269 | | | $ | 116,273 | | | $ | 353,511 | |
See accompanying notes to consolidated financial statements.
SEABRIGHT HOLDINGS, INC. AND SUBSIDIARIES
CONSOLIDATED STATEMENTS OF CASH FLOWS
| | | Year Ended December 31, | |
| | | 2011 | | | 2010 | | | 2009 | |
| | | (In thousands) | |
| Cash flows from operating activities: | | | | | | | | | |
Net income (loss) | | $ | (14,526 | ) | | $ | (1,583 | ) | | $ | 13,535 | |
Adjustments to reconcile net income (loss) to cash provided by operating activities: | | | | | | | | | | | | |
Amortization of deferred policy acquisition costs | | | 52,200 | | | | 48,633 | | | | 44,653 | |
Policy acquisition costs deferred | | | (48,460 | ) | | | (48,670 | ) | | | (47,015 | ) |
Provision for depreciation and amortization | | | 8,634 | | | | 6,901 | | | | 5,277 | |
Loss on disposal of fixed assets | | | 16 | | | | — | | | | — | |
| Compensation cost on restricted shares of common stock | | | 4,036 | | | | 4,532 | | | | 4,117 | |
Compensation cost on stock options | | | 665 | | | | 892 | | | | 686 | |
Net realized (gain) loss on investments | | | (1,051 | ) | | | (15,425 | ) | | | 429 | |
Expense (benefit) for deferred income taxes | | | (5,346 | ) | | | 2,259 | | | | (2,736 | ) |
Goodwill impairment | | | — | | | | 1,527 | | | | — | |
Changes in certain assets and liabilities: | | | | | | | | | | | | |
Unpaid loss and loss adjustment expense | | | 77,125 | | | | 89,029 | | | | 59,863 | |
Other assets and other liabilities | | | (4,544 | ) | | | 1,227 | | | | 2,230 | |
| Reinsurance recoverables, net of reinsurance withheld | | | (37,768 | ) | | | (18,176 | ) | | | (11,652 | ) |
Income taxes recoverable | | | (1,074 | ) | | | (6,975 | ) | | | (3,273 | ) |
Accrued investment income | | | 98 | | | | (351 | ) | | | (680 | ) |
| Unearned premiums, net of deferred premiums and premiums receivable | | | (2,439 | ) | | | (7,130 | ) | | | 2,816 | |
Net cash provided by operating activities | | | 27,566 | | | | 56,690 | | | | 68,250 | |
| | | | | | | | | | | | | |
| Cash flows from investing activities: | | | | | | | | | | | | |
Purchases of investments | | | (154,171 | ) | | | (489,598 | ) | | | (182,483 | ) |
Sales of investments | | | 90,030 | | | | 388,237 | | | | 54,934 | |
Maturities and redemptions of investments | | | 56,022 | | | | 54,248 | | | | 51,828 | |
Purchases of property and equipment | | | (1,558 | ) | | | (2,657 | ) | | | (2,083 | ) |
Net cash used in investing activities | | | (9,677 | ) | | | (49,770 | ) | | | (77,804 | ) |
| | | | | | | | | | | | | |
| Cash flows from financing activities: | | | | | | | | | | | | |
Proceeds from exercise of stock options | | | — | | | | 26 | | | | 47 | |
Minimum tax withholdings on restricted stock vestings | | | (898 | ) | | | (588 | ) | | | (473 | ) |
Stockholder dividends paid | | | (4,451 | ) | | | (3,300 | ) | | | — | |
| Proceeds from grants of restricted shares of common stock | | | 5 | | | | 4 | | | | 4 | |
Net cash used in financing activities | | | (5,344 | ) | | | (3,858 | ) | | | (422 | ) |
| Net increase (decrease) in cash and cash equivalents | | | 12,545 | | | | 3,062 | | | | (9,976 | ) |
Cash and cash equivalents at beginning of period | | | 15,958 | | | | 12,896 | | | | 22,872 | |
Cash and cash equivalents at end of period | | $ | 28,503 | | | $ | 15,958 | | | $ | 12,896 | |
| | | | | | | | | | | | | |
| Supplemental disclosure of cash flow activities: | | | | | | | | | | | | |
Federal income taxes paid (recovered) | | $ | (4,470 | ) | | $ | — | | | $ | 8,500 | |
Receivable from sales of investments | | | 2,000 | | | | — | | | | — | |
Interest paid on surplus notes | | | 523 | | | | 527 | | | | 623 | |
See accompanying notes to consolidated financial statements.
SEABRIGHT HOLDINGS, INC. AND SUBSIDIARIES
NOTES TO CONSOLIDATED FINANCIAL STATEMENTS
1. Organization
SeaBright Insurance Holdings, Inc. (“SeaBright”), a Delaware corporation, was formed in June 2003. In May 2010, SeaBright changed its corporate name to SeaBright Holdings, Inc. On July 14, 2003, SeaBright entered into a purchase agreement, effective September 30, 2003, with Kemper Employers Group, Inc. (“KEG”), Eagle Pacific Insurance Company and Pacific Eagle Insurance Company (“Eagle”), and Lumbermens Mutual Casualty Company (“LMC”), the ultimate owner of KEG and Eagle (the “Acquisition”). Under this agreement, SeaBright acquired Kemper Employers Insurance Company (“KEIC”), PointSure Insurance Services, Inc. (“PointSure”), and certain assets of Eagle, primarily renewal rights. KEG, LMC and Eagle are no longer writing new business and, as of December 31, 2011, were operating under a voluntary run-off plan which has been approved by the Illinois Department of Insurance.
At the time of the Acquisition, KEIC was licensed to write workers’ compensation insurance in 43 states and the District of Columbia. Domiciled in the State of Illinois and commercially domiciled in the State of California, it wrote both state act workers’ compensation insurance and United States Longshore and Harbor Workers’ Compensation Act (“USL&H”) insurance. Prior to the Acquisition, beginning in 2000, KEIC wrote business only in California. In May 2002, KEIC ceased writing business and by December 31, 2003, all premiums related to business prior to the Acquisition were 100% earned. As further discussed in Note 8.a., “Reinsurance Ceded”, in connection with the Acquisition, KEIC and LMC entered into an agreement whereby LMC agreed to indemnify KEIC in the event of adverse development of the reserves stated on KEIC’s balance sheet at the Acquisition date, for a period of approximately eight years. In addition, KEIC agreed to share with LMC any positive development of those reserves. December 31, 2011 is the date to which the parties will look to determine whether the loss and loss adjustment expenses with respect to KEIC’s insurance policies in effect at the date of the Acquisition have increased or decreased from the amount existing at the date of the Acquisition.
KEIC resumed writing business effective October 1, 2003, primarily targeting policy renewals for former Eagle business in the States of California, Hawaii and Alaska. In November 2003, permission was granted by the Illinois Department of Insurance for KEIC to change its name to SeaBright Insurance Company (“SBIC”).
PointSure is a wholesale insurance broker and acts as an in-house distribution platform for SeaBright Insurance Company, and also offers insurance products from nonaffiliated insurers.
In December 2007, the Company completed the acquisition of Total HealthCare Management, Inc. (“THM”), a privately held California provider of medical bill review, utilization review, nurse case management and related services, for a purchase price of $1.2 million. Following the acquisition, THM became a wholly owned subsidiary of SeaBright. In May 2011, THM was renamed Paladin Managed Care Services, Inc. (“PMCS”). PMCS offers managed care services to SBIC and non-affiliated entities.
In July 2008, PointSure acquired 100% of the outstanding common stock of Black/White and Associates, Inc., Black/White and Associates of Nevada and Black/White Rockridge Insurance Services, Inc. (referred to collectively as “BWNV”), a privately held managing general agent and wholesale insurance broker. Also included in the transaction were a covenant not to compete from key principals of BWNV and other intangible assets. The preliminary purchase price paid at closing was $1.7 million, of which $0.5 million was allocated to the purchase of BWNV capital stock. PointSure paid approximately $159,000 as additional purchase consideration upon resolution of a contingency period in 2009. Following the acquisition, BWNV became a wholly owned subsidiary of PointSure. In November 2010, PointSure reorganized its corporate structure and directly assumed the business and operations of BWNV. The BWNV legal entities were subsequently dissolved.
2. Summary of Significant Accounting Policies
a. Basis of Presentation
The accompanying consolidated financial statements include the accounts of SeaBright and its wholly owned subsidiaries, SBIC, PointSure, and PMCS (collectively, the “Company”). All significant intercompany transactions among these affiliated entities have been eliminated in consolidation.
SEABRIGHT HOLDINGS, INC. AND SUBSIDIARIES
NOTES TO CONSOLIDATED FINANCIAL STATEMENTS – (Continued)
The consolidated financial statements of the Company have been prepared in accordance with U.S. generally accepted accounting principles (“GAAP”) and include amounts based on the best estimates and judgments of management. Such estimates and judgments could change in the future as more information becomes known, which could impact the amounts reported and disclosed herein.
In accordance with Financial Accounting Standards Board (“FASB”) Accounting Standards Codification (“ASC”) Topic 280, Segment Reporting, the Company considers an operating segment to be any component of its business whose operating results are regularly reviewed by the Company’s chief operating decision maker to make decisions about resources to be allocated to the segment and assess its performance. Currently, the Company has one operating segment, workers’ compensation insurance and related services.
Certain reclassifications have been made to prior year financial statements to conform to classifications used in the current year.
b. Investment Securities
Investment securities are classified as available-for-sale and are carried at fair value. The estimated fair value of investments in available-for-sale securities is generally based on quoted market prices for securities traded in the public marketplace. If a quoted market price is not available, fair value is generally estimated using quoted market prices for similar securities.
The Company regularly reviews its investment portfolio to evaluate the necessity of recording impairment losses for other-than-temporary declines in the fair value of its investments. A number of criteria are considered during this process including, but not limited to: whether the Company intends to sell the security; the current fair value as compared to amortized cost or cost, as appropriate, of the security; the length of time the security’s fair value has been below amortized cost or cost; the likelihood that the Company will be required to sell the security before recovery of its cost basis; objective information supporting recovery in a reasonable period of time; specific credit issues related to the issuer; and current economic conditions.
For debt securities that are considered other-than-temporarily impaired (“OTTI”) and that the Company does not intend to sell and more likely than not would not be required to sell prior to recovery of the amortized cost basis, the Company recognizes OTTI losses in accordance with the provisions of the ASC Topic 325, Investments - Other. The amount of the OTTI loss is separated into the amount that is credit related (credit loss component) and the amount due to all other factors. The credit loss component is recognized in earnings and is the difference between a security’s amortized cost basis and the present value of expected future cash flows discounted at the security’s effective interest rate. The amount due to all other factors is recognized in other comprehensive income.
In general, the Company reviews all securities that are impaired by 5% or more at the end of the period. For securities with no stated maturity date, the review focuses on securities that were impaired by 20% or more at the end of the period or had been impaired 10% or more continuously for six months or longer as of the end of the period. The Company also analyzes the entire portfolio for other factors that might indicate a risk of impairment, including credit ratings, liquidity of the issuer and interest rates. Other-than-temporary impairment losses result in a permanent reduction of the carrying amount of the underlying investment. Significant changes in the factors considered when evaluating investments for impairment losses could result in a significant change in impairment losses reported in the consolidated financial statements.
Mortgage-backed securities represent participating interests in pools of first mortgage loans originated and serviced by the issuers of securities. These securities are carried at fair value. Premiums and discounts are amortized using a method that approximates the level yield method over the remaining period to contractual maturity, adjusted for anticipated prepayments. To the extent that the estimated lives of such securities change as a result of changes in prepayment rates, the adjustment is also included in net investment income. Prepayment assumptions used for mortgage-backed and asset-backed securities were obtained from an external securities information service and are consistent with the current interest rate and economic environment.
Although no impairment losses were recognized over the value of the Company’s investment portfolio in 2011, it is possible that the Company could recognize future impairment losses on some securities it owned at December 31, 2011 if future events, information or the passage of time result in a determination that a decline in value is other-than-temporary.
SEABRIGHT HOLDINGS, INC. AND SUBSIDIARIES
NOTES TO CONSOLIDATED FINANCIAL STATEMENTS – (Continued)
Investment income is recorded when earned. For the purpose of determining realized gains and losses, which arise principally from the sale of investments, the cost of securities sold is based on specific-identification as of the trade date.
c. Cash and Cash Equivalents
Cash and cash equivalents, which consist primarily of amounts deposited in banks and financial institutions, and all highly liquid investments with maturities of 90 days or less when purchased, are stated at cost. Cash in excess of daily requirements is invested in short-term, highly liquid bank funds and are deemed to be cash equivalents for purposes of the consolidated balance sheets and statements of cash flows.
d. Use of Estimates
The preparation of the consolidated financial statements in conformity with GAAP requires management of the Company to make a number of estimates and assumptions relating to the reported amount of assets and liabilities and the disclosure of contingent assets and liabilities at the date of the consolidated financial statements and the reported amounts of revenues and expenses during the period. Actual results could differ from those estimates. The Company has used significant estimates in determining unpaid loss and loss adjustment expense, including losses that have occurred but were not reported to us by the financial reporting date; the amount and recoverability of reinsurance recoverable balances; goodwill and other intangibles; retrospective premiums; earned but unbilled premiums; deferred policy acquisition costs; income taxes; and the valuation and other-than-temporary impairments of investment securities.
e. Premiums Receivable
Deferred premiums receivable consist of the unbilled portion of total policy premiums. For a typical policy, the entire premium is recorded as deferred premium receivable at inception and is billed over the policy period according to the terms of the policy. Premiums receivable consist of amounts that have been billed to policyholders. The allowance for doubtful accounts, which represents the Company’s best estimate of the amount of uncollectible premium in the Company’s existing premiums receivable balance, is based on historical account write-offs and takes into consideration the current economic environment. Account balances are charged off against the allowance after all means of collection have been exhausted and the potential for recovery is considered remote.
f. Deferred Policy Acquisition Costs
Acquisition costs related to premiums written are deferred and amortized over the periods in which the premiums are earned. Such acquisition costs vary with and are primarily related to the acquisition of insurance contracts and include commissions, premium taxes, and certain underwriting and policy issuance costs. Deferred policy acquisition costs are limited to amounts recoverable from unearned premiums and anticipated investment income.
g. Property and Equipment
Furniture and equipment are recorded at cost and depreciated using the straight-line method over their estimated useful lives, which range from three to five years. Leasehold improvements are depreciated on a straight-line basis over periods ranging from approximately two to seven years, which is the shorter of their estimated useful lives or the remaining term of the respective lease. Depreciation expense totaled $1.5 million, $1.7 million and $1.9 million for the years ended December 31, 2011, 2010, and 2009, respectively.
h. Goodwill and Other Intangible Assets
Goodwill balances are reviewed for impairment at least annually or more frequently if events occur or circumstances change that would more likely than not reduce the fair value of the reporting unit below its carrying value. A reporting unit is defined as an operating segment or one level below an operating segment.
The goodwill impairment test follows a three step process. The first step consists of consideration of various qualitative factors to determine whether the existence of events or circumstances leads to a determination that it is more likely than not that the fair value of the reporting unit in question is less than its carrying amount. If such a determination is not reached, then performance of further impairment testing is not necessary.
SEABRIGHT HOLDINGS, INC. AND SUBSIDIARIES
NOTES TO CONSOLIDATED FINANCIAL STATEMENTS – (Continued)
In the second step (if necessary), the fair value of a reporting unit is compared to its carrying value. If the carrying value of a reporting unit exceeds its fair value, the third step of the impairment test is performed for purposes of measuring the impairment. In the third step, the fair value of the reporting unit is allocated to all of the assets and liabilities of the reporting unit to determine an implied goodwill value. If the carrying amount of the reporting unit goodwill exceeds the implied goodwill value, an impairment loss would be recognized in an amount equal to that excess, and the charge could have a material adverse effect on the Company’s results of operations and financial position.
Management’s determination of the fair value of each reporting unit incorporates multiple inputs including various qualitative considerations, discounted cash flow calculations and, as appropriate, the level of the Company’s own share price and assumptions that market participants would make in valuing the reporting unit. Other assumptions include levels of economic capital, future business growth, earnings projections, assets under management and the discount rate utilized.
i. Revenue Recognition
Premiums for primary and reinsured risks are included in revenue over the life of the contract in proportion to the amount of insurance protection provided (i.e., ratably over the policy period). The portion of the premium that is applicable to the unexpired period of a policy in-force is not included in revenue but is deferred and recorded as unearned premium in the liability section of the balance sheet. Deferred premiums represent the unbilled portion of annual premiums.
Earned premiums on retrospectively rated policies are based on the Company’s estimate of loss experience as of the measurement date. Loss experience includes known losses specifically identifiable to a retrospective policy as well as provisions for future development of known losses and for losses incurred but not yet reported. Future loss development is projected using actuarial loss development factors, assumptions and methodologies that are consistent with how the Company projects losses in general. For retrospectively rated policies, the governing contractual minimum and maximum premiums are established at policy inception and are made a part of the insurance contract. While the typical retrospectively rated policy has five annual adjustment or measurement periods, premium adjustments continue until mutual agreement to cease future adjustments is reached with the policyholder.
The Company estimates the amount of premiums that have been earned but are unbilled at the end of the period by analyzing historical earned premium adjustments made at final audit and applying an adjustment percentage against premiums earned for the period. Final audit adjustments may result in increasing or decreasing the estimated premium earned and billed to date. Included in deferred premiums at December 31, 2011, 2010 and 2009 and premiums earned for the years then ended were accruals for earned but unbilled premiums of $0.3 million, ($0.6) million, and ($0.1) million, respectively.
Service income generated from various underwriting and claims service agreements with third parties is recognized as income in the period in which services are performed.
j. Unpaid Loss and Loss Adjustment Expense
Unpaid loss and loss adjustment expense represents an estimate of the ultimate net cost of all unpaid losses incurred through the specified period. Loss adjustment expenses are estimates of unpaid expenses to be incurred in settlement of the claims included in the liability for unpaid losses. These liabilities, which anticipate salvage and subrogation recoveries and are presented gross of amounts recoverable from reinsurers, include estimates of future trends in claim severity and frequency and other factors that could vary as the losses are ultimately settled. Liabilities for unpaid loss and loss adjustment expenses are not discounted to account for the time value of money.
In light of the Company’s short operating history, and uncertainties concerning the effects of legislative reform specifically as it relates to the Company’s California workers compensation class of business, actuarial techniques are applied that use the historical experience of the Company and the Company’s predecessor as well as industry information in the analysis of unpaid loss and loss adjustment expense. These techniques consider, among other factors:
SEABRIGHT HOLDINGS, INC. AND SUBSIDIARIES
NOTES TO CONSOLIDATED FINANCIAL STATEMENTS – (Continued)
| | • | the Company’s claims experience and that of its predecessor; |
| | • | the industry’s claims experience; |
| | • | historical trends in reserving patterns and loss payments; |
| | • | the impact of claim inflation and/or deflation; |
| | • | the pending level of unpaid claims; |
| | • | the cost of claim settlements; |
| | • | legislative reforms affecting workers’ compensation, including pricing levels; |
| | • | the environment in which insurance companies operate; and |
| | • | trends in claim frequency and severity. |
Although it is not possible to measure the degree of variability inherent in such estimates, management believes that the liability for unpaid loss and loss adjustment expense is reasonable. The estimates are reviewed periodically and any necessary adjustments are included in the results of operations of the period in which the adjustment is determined.
k. Reinsurance
The Company protects itself from excessive losses by reinsuring certain levels of risk in various areas of exposure with nonaffiliated reinsurers. Regardless of type, reinsurance does not legally discharge the ceding insurer from primary liability for the full amount due under the reinsured policies. Reinsurance premiums, commissions, expense reimbursements and reserves related to ceded business are accounted for on a basis consistent with the accounting for the original policies issued and the terms of reinsurance contracts. Amounts are shown net in the statements of operations and comprehensive income (loss). Premiums ceded to other companies are reported as a reduction of premiums written and earned. Reinsurance recoverables are determined based on the terms and conditions of the reinsurance contracts.
Balances due from reinsurers on unpaid loss and loss adjustment expenses, including an estimate of such recoverables related to reserves for IBNR losses, are reported as assets and are included in reinsurance recoverables even though amounts due on unpaid loss and loss adjustment expenses are not recoverable from the reinsurer until such losses are paid. The Company monitors the financial condition of its reinsurers and does not believe that it is currently exposed to any material credit risk through its reinsurance treaties because most of its reinsurance is recoverable from large, well-capitalized reinsurance companies. Historically, no amounts from reinsurers have been written-off as uncollectible.
The unpaid loss and loss adjustment expense subject to the adverse development cover with LMC is calculated on a quarterly basis using generally accepted actuarial methodologies for estimating unpaid loss and loss adjustment expense liabilities, including incurred loss and paid loss development methods. The minimum amount that must be maintained in the trust account is equal to the greater of (a) $1.6 million or (b) 102% of the then existing quarterly estimate of LMC’s total obligations under the adverse development cover. Amounts recoverable in excess of acquired reserves at September 30, 2003 are recorded gross in unpaid loss and loss adjustment expense in accordance with ASC Topic 805, Business Combinations, with a corresponding amount receivable from the seller.
SEABRIGHT HOLDINGS, INC. AND SUBSIDIARIES
NOTES TO CONSOLIDATED FINANCIAL STATEMENTS – (Continued)
l. Income Taxes
The Company uses the asset and liability method of accounting for income taxes. Under this method, deferred tax assets and liabilities are recognized for the future tax consequences attributable to differences between the financial statement carrying amounts of existing assets and liabilities and their respective tax bases and operating loss and tax credit carry-forwards. Deferred tax assets and liabilities are measured using tax rates expected to apply to taxable income in the years in which those temporary differences are expected to be recovered or settled. The effect on deferred tax assets and liabilities of a change in tax rates is recognized in the income statement in the period that includes the enactment date.
In assessing the realizability of deferred tax assets, the Company considers whether it is more likely than not that some portion or all of the deferred tax assets will not be realized. The ultimate realization of deferred tax assets is dependent upon the generation of future taxable income during the periods in which those temporary differences become deductible. This analysis requires the Company to make various estimates and assumptions, including the scheduled reversal of deferred tax liabilities, the consideration of operating versus capital items, projected future taxable income and the effect of tax planning strategies. Based on this analysis, the Company may be required to establish a valuation allowance to reduce the deferred tax assets to the amounts more likely than not to be realized. As of December 31, 2011 and 2010, the Company had no valuation allowance against its deferred tax assets.
FASB ASC Topic 740, Income Taxes, prescribes a recognition threshold and measurement process for financial statement recognition and measurement of a tax position taken or expected to be taken in a tax return, and also provides guidance on the derecognition of previously recorded benefits and their classification, as well as the proper recording of interest and penalties, accounting in interim periods, disclosures and transition. As of December 31, 2011 and 2010, the Company had no unrecognized tax benefits. The Company’s policy is to recognize interest and penalties on unrecognized tax benefits as an element of income tax expense (benefit) in the consolidated statements of operations and comprehensive income (loss).
m. Earnings (Loss) Per Share
The following table provides the reconciliation of weighted average common share equivalents outstanding used in calculating earnings (loss) per share for the years ended December 31, 2011, 2010, and 2009:
| | | Year Ended December 31, | |
| | | 2011 | | | 2010 | | | 2009 | |
Basic weighted average shares outstanding | | | 21,118,711 | | | | 20,867,720 | | | | 20,702,572 | |
| Weighted average shares issuable upon exercise of dilutive outstanding stock options and vesting of dilutive nonvested restricted stock | | | — | | | | — | | | | 812,581 | |
Diluted weighted average shares outstanding | | | 21,118,711 | | | | 20,867,720 | | | | 21,515,153 | |
The effect of including shares issuable upon the exercise of outstanding stock options and the vesting of nonvested restricted stock is antidilutive for the years ended December 31, 2011 and 2010. Therefore, such shares have been excluded from the calculation of diluted weighted average shares outstanding. The numbers of such shares excluded for the years ended December 31, 2011 and 2010 were approximately 615,000 and 577,000, respectively.
n. Recent Accounting Pronouncements
In October 2010, the FASB issued Accounting Standards Update (“ASU”) 2010-26, Accounting for Costs Associated with Acquiring or Renewing Insurance Contracts. This ASU allows insurance entities to defer costs related to the acquisition of new or renewal insurance contracts that are (1) incremental direct costs of the contract transaction (i.e., would not have occurred without the contract transaction), (2) a portion of an employee's compensation and fringe benefits related to certain activities for successful contract acquisitions, or (3) direct-response advertising costs as defined in ASC Subtopic 340-20, Other Assets and Deferred Costs - Capitalized Advertising Costs. All other costs related to the acquisition of new or renewal insurance contracts are required to be expensed as incurred. This ASU is effective for interim and annual periods beginning after December 15, 2011 with either prospective or retrospective application permitted. The Company will adopt this guidance retrospectively effective January 1, 2012. The Company currently estimates that adoption will reduce its December 31, 2011 retained earnings (the period immediately prior to adoption) by approximately $4.5 million, net of taxes.
SEABRIGHT HOLDINGS, INC. AND SUBSIDIARIES
NOTES TO CONSOLIDATED FINANCIAL STATEMENTS – (Continued)
In May 2011, the FASB issued ASU 2011-04, Fair Value Measurement (Topic 820): Amendments to Achieve Common Fair Value Measurement and Disclosure Requirements in U.S. GAAP and IFRSs, to provide largely identical guidance about fair value measurement and disclosure requirements. The new standards do not extend the use of fair value but, rather, provide guidance about how fair value should be applied where it already is required or permitted under International Financial Reporting Standards (“IFRS”) or U.S. GAAP. The new guidance is effective for interim and annual reporting periods beginning after December 15, 2011. Early adoption is not permitted. The adoption of ASU 2011-04 is not expected to have a material effect on the Company’s consolidated financial condition and results of operations.
In June 2011, the FASB issued ASU 2011-05, Comprehensive Income (Topic 220): Presentation of Comprehensive Income, to increase the prominence of other comprehensive income in the financial statements. An entity will have the option to present the components of net income and comprehensive income in either one or two consecutive financial statements. The new guidance is effective for interim and annual reporting periods beginning after December 15, 2011, with earlier adoption permitted. The Company adopted this guidance retrospectively effective September 30, 2011. The adoption of ASU 2011-05 did not have a material effect on the Company’s consolidated financial condition or results of operations.
In September 2011, the FASB issued ASU 2011-08, Intangibles—Goodwill and Other (Topic 350): Testing Goodwill for Impairment, to simplify the current two-step goodwill impairment test required under Topic 350. Under this update, an entity has the option to first assess qualitative factors to determine whether the existence of events or circumstances leads to a determination that it is more likely than not that the fair value of a reporting unit is less than its carrying amount. If such a determination is not reached, then performance of further impairment testing is not necessary. The new guidance is effective for annual and interim goodwill tests performed for fiscal years beginning after December 15, 2011. However, early adoption is permitted. The Company adopted ASU 2011-08 in the fourth quarter of 2011, which did not have a material effect on the Company’s consolidated financial condition or results of operations.
SEABRIGHT HOLDINGS, INC. AND SUBSIDIARIES
NOTES TO CONSOLIDATED FINANCIAL STATEMENTS – (Continued)
3. Investments
The consolidated cost or amortized cost, gross unrealized gains and losses, estimated fair value and carrying value of investment securities available for sale at December 31, 2011 and 2010 were as follows:
| | | Cost or Amortized Cost | | | Gross Unrealized Gains | | | Gross Unrealized Losses | | | Estimated Fair Value | | | Carrying Value | |
| | | (In thousands) | |
| 2011: | | | | | | | | | | | | | | | |
U.S. Treasury securities | | $ | 24,989 | | | $ | 1,579 | | | $ | — | | | $ | 26,568 | | | $ | 26,568 | |
Government sponsored agency securities | | | 15,567 | | | | 1,330 | | | | — | | | | 16,897 | | | | 16,897 | |
Corporate securities | | | 167,125 | | | | 9,682 | | | | (578 | ) | | | 176,229 | | | | 176,229 | |
Tax-exempt municipal securities | | | 308,953 | | | | 17,903 | | | | (1 | ) | | | 326,855 | | | | 326,855 | |
Mortgage pass-through securities | | | 77,532 | | | | 3,399 | | | | — | | | | 80,931 | | | | 80,931 | |
Collateralized mortgage obligations | | | 14,546 | | | | 168 | | | | (54 | ) | | | 14,660 | | | | 14,660 | |
Asset-backed securities | | | 57,179 | | | | 1,052 | | | | (25 | ) | | | 58,206 | | | | 58,206 | |
| Total investment securities available for sale | | $ | 665,891 | | | $ | 35,113 | | | $ | (658 | ) | | $ | 700,346 | | | $ | 700,346 | |
| | | | | | | | | | | | | | | | | | | | | |
| 2010: | | | | | | | | | | | | | | | | | | | | |
U.S. Treasury securities | | $ | 26,514 | | | $ | 635 | | | $ | (172 | ) | | $ | 26,977 | | | $ | 26,977 | |
Government sponsored agency securities | | | 23,159 | | | | 943 | | | | (31 | ) | | | 24,071 | | | | 24,071 | |
Corporate securities | | | 154,652 | | | | 3,532 | | | | (1,915 | ) | | | 156,269 | | | | 156,269 | |
Tax-exempt municipal securities | | | 309,935 | | | | 5,555 | | | | (4,778 | ) | | | 310,712 | | | | 310,712 | |
Mortgage pass-through securities | | | 73,501 | | | | 2,548 | | | | (745 | ) | | | 75,304 | | | | 75,304 | |
Collateralized mortgage obligations | | | 17,260 | | | | 233 | | | | (28 | ) | | | 17,465 | | | | 17,465 | |
Asset-backed securities | | | 60,740 | | | | 1,577 | | | | (147 | ) | | | 62,170 | | | | 62,170 | |
| Total investment securities available for sale | | $ | 665,761 | | | $ | 15,023 | | | $ | (7,816 | ) | | $ | 672,968 | | | $ | 672,968 | |
The following tables present information about investment securities with unrealized losses at December 31, 2011 and 2010.
Unrealized losses at December 31, 2011:
| | | Less Than 12 Months | | | 12 Months or More | | | Total | |
| Investment Category | | Aggregate Fair Value | | | Aggregate Unrealized Loss | | | Aggregate Fair Value | | | Aggregate Unrealized Loss | | | Aggregate Fair Value | | | Aggregate Unrealized Loss | |
| | | (In thousands) | |
U.S. Treasury Securities | | $ | — | | | $ | — | | | $ | — | | | $ | — | | | $ | — | | | $ | — | |
| Government sponsored agency securities (1) | | | — | | | | — | | | | — | | | | — | | | | — | | | | — | |
Corporate securities | | | 15,153 | | | | (578 | ) | | | — | | | | — | | | | 15,153 | | | | (578 | ) |
| Tax-exempt municipal securities | | | 1,267 | | | | (1 | ) | | | — | | | | — | | | | 1,267 | | | | (1 | ) |
| Mortgage pass-through securities | | | — | | | | — | | | | — | | | | — | | | | — | | | | — | |
| Collateralized mortgage obligations | | | 3,748 | | | | (6 | ) | | | 131 | | | | (48 | ) | | | 3,879 | | | | (54 | ) |
Asset-backed securities | | | 2,645 | | | | (16 | ) | | | 2,760 | | | | (9 | ) | | | 5,405 | | | | (25 | ) |
Total | | $ | 22,813 | | | $ | (601 | ) | | $ | 2,891 | | | $ | (57 | ) | | $ | 25,704 | | | $ | (658 | ) |
____________
| (1) | Government sponsored agency securities are not backed by the full faith and credit of the U.S. Government. |
SEABRIGHT HOLDINGS, INC. AND SUBSIDIARIES
NOTES TO CONSOLIDATED FINANCIAL STATEMENTS – (Continued)
Unrealized losses at December 31, 2010:
| | | Less Than 12 Months | | | 12 Months or More | | | Total | |
| Investment Category | | Aggregate Fair Value | | | Aggregate Unrealized Loss | | | Aggregate Fair Value | | | Aggregate Unrealized Loss | | | Aggregate Fair Value | | | Aggregate Unrealized Loss | |
| | | (In thousands) | |
U.S. Treasury Securities | | $ | 6,371 | | | $ | (172 | ) | | $ | — | | | $ | — | | | $ | 6,371 | | | $ | (172 | ) |
| Government sponsored agency securities (1) | | | 2,083 | | | | (31 | ) | | | — | | | | — | | | | 2,083 | | | | (31 | ) |
Corporate securities | | | 52,044 | | | | (1,915 | ) | | | — | | | | — | | | | 52,044 | | | | (1,915 | ) |
| Tax-exempt municipal securities | | | 163,019 | | | | (4,778 | ) | | | — | | | | — | | | | 163,019 | | | | (4,778 | ) |
| Mortgage pass-through securities | | | 28,213 | | | | (745 | ) | | | — | | | | — | | | | 28,213 | | | | (745 | ) |
| Collateralized mortgage obligations | | | 814 | | | | (1 | ) | | | 172 | | | | (27 | ) | | | 986 | | | | (28 | ) |
Asset-backed securities | | | 10,764 | | | | (147 | ) | | | — | | | | — | | | | 10,764 | | | | (147 | ) |
Total | | $ | 263,308 | | | $ | (7,789 | ) | | $ | 172 | | | $ | (27 | ) | | $ | 263,480 | | | $ | (7,816 | ) |
____________
| (1) | Government sponsored agency securities are not backed by the full faith and credit of the U.S. Government. |
The $2.9 million of securities with unrealized losses of 12 months or longer at December 31, 2011 in the above table consist of two securities whose amortized cost at December 31, 2011 was approximately $2.9 million. One of these securities had an unrealized loss that exceeded 20% of the related security’s book value at December 31, 2011. As of December 31, 2011, all payments were current on these debt securities and the Company expects to fully recover its investment in these securities no later than their scheduled maturities. The Company has no current intent to sell these securities nor is it more likely than not that the Company would be required to sell these securities. Therefore, based on management’s review of the financial strength of these debt securities and the Company’s expectation regarding future receipt of principal and interest, management concluded these debt securities were temporarily impaired as of December 31, 2011. The Company recognized no OTTI losses in 2011 or 2010. In 2009, the Company recognized OTTI losses of approximately $0.3 million, which were related to its investment in preferred stock issued by Fannie Mae and Freddie Mac.
Significant changes in the factors considered when evaluating investments for impairment losses could result in a significant change in impairment losses reported in the financial statements. At December 31, 2011 and 2010, the Company evaluated investment securities with fair values less than amortized cost and determined that the declines in value were temporary and were related primarily to the change in market rates since purchase or to other market anomalies that are expected to correct themselves. Furthermore, the Company has the ability and intent to hold the impaired investments to maturity or for a period of time sufficient for recovery of their carrying amount.
The Company had no direct sub-prime mortgage exposure in its investment portfolio and $10.0 million of indirect exposure to sub-prime mortgages as of December 31, 2011. As of December 31, 2011, the Company’s portfolio included $92.2 million of insured municipal bonds and $258.8 million of uninsured municipal bonds.
The Company had no direct exposure in our investment portfolio to the European sovereign debt crisis as of December 31, 2011. The Company did own, as of that date, approximately $13.1 million of securities issued by domestic and foreign banks that have indirect European sovereign debt exposure through their global financial dealings. The Company believes the risks of these exposures are well contained and managed. Each of the banks whose securities the Company holds has been deemed Globally Systemically Important Financial Institutions (“G-SIFI”) by the Financial Stability Board. The list of G-SIFIs is updated annually and included 29 large financial institutions as of December 31, 2011. At December 31, 2011, The Company also owned a $1.5 million debt security issued by a domestic broker dealer that has acknowledged some exposure to European sovereign debt.
SEABRIGHT HOLDINGS, INC. AND SUBSIDIARIES
NOTES TO CONSOLIDATED FINANCIAL STATEMENTS – (Continued)
The following table provides a breakdown of fair value by ratings on the bonds in the Company’s municipal portfolio as of December 31, 2011:
| | | | | | Uninsured | | | Total Municipal | |
| | | Insured Bonds | | | Bonds | | | Portfolio (1) Based on | |
| | | Insured | | | Underlying | | | | | | Overall | | | Underlying | |
| Rating | | Ratings | | | Ratings | | | Ratings | | | Ratings (2) | | | Ratings | |
| | | (In thousands) | |
AAA | | $ | 4,827 | | | $ | 4,827 | | | $ | 30,693 | | | $ | 35,520 | | | $ | 35,520 | |
AA+ | | | 14,014 | | | | 12,797 | | | | 63,850 | | | | 77,864 | | | | 76,647 | |
AA | | | 19,456 | | | | 19,109 | | | | 65,294 | | | | 84,750 | | | | 84,403 | |
AA- | | | 29,383 | | | | 26,414 | | | | 52,005 | | | | 81,388 | | | | 78,419 | |
A+ | | | 11,196 | | | | 15,615 | | | | 9,849 | | | | 21,045 | | | | 25,464 | |
A | | | 5,285 | | | | 5,285 | | | | 22,550 | | | | 27,835 | | | | 27,835 | |
A- | | | 2,073 | | | | 2,187 | | | | 2,976 | | | | 5,049 | | | | 5,163 | |
BBB+ | | | — | | | | — | | | | 1,304 | | | | 1,304 | | | | 1,304 | |
BBB | | | — | | | | — | | | | 2,954 | | | | 2,954 | | | | 2,954 | |
Pre-refunded (3) | | | 6,014 | | | | 6,014 | | | | 7,326 | | | | 13,340 | | | | 13,340 | |
Total | | $ | 92,248 | | | $ | 92,248 | | | $ | 258,801 | | | $ | 351,049 | | | $ | 351,049 | |
____________
| (1) | Consists of $326.9 million of tax-exempt municipal bonds and $24.2 million of taxable municipal bonds. |
| | |
| (2) | Represents insured ratings on insured bonds and ratings on uninsured bonds. |
| | |
| (3) | These bonds have been pre-refunded by depositing highly rated government-issued securities into irrevocable trust funds established for payment of principal and interest. |
As of December 31, 2011, the Company had no direct investments in any bond insurer, and the following bond insurer insured more than 10% of the municipal bond investments in the Company’s portfolio:
| | | | | | Insurer Ratings | | | | |
Bond Insurer | | Fair Value | | | S&P | | | Moody’s | | | Rating | |
| | | (Millions) | | | | | | | | | | |
National Public Finance Guarantee Corporation | | $ | 42.1 | | | | BBB | | | | Baa2 | | | | AA- | |
The Company does not expect a material impact to its investment portfolio or financial position as a result of the problems currently facing monoline bond insurers.
The amortized cost and estimated fair value of fixed income securities available for sale at December 31, 2011, by contractual maturity, are set forth below. Actual maturities may differ from contractual maturities because certain borrowers have the right to call or prepay obligations with or without call or prepayment penalties.
Maturity | | Cost or Amortized Cost | | | Estimated Fair Value | |
| | | (In thousands) | |
Due in one year or less | | $ | 32,461 | | | $ | 32,941 | |
Due after one year through five years | | | 179,129 | | | | 186,370 | |
Due after five years through ten years | | | 281,215 | | | | 301,729 | |
Due after ten years | | | 23,829 | | | | 25,510 | |
Securities not due at a single maturity date | | | 149,257 | | | | 153,796 | |
Total fixed income securities | | $ | 665,891 | | | $ | 700,346 | |
The consolidated amortized cost of fixed income securities available for sale deposited with various regulatory authorities was $260.9 million and $216.7 million at December 31, 2011 and 2010, respectively.
SEABRIGHT HOLDINGS, INC. AND SUBSIDIARIES
NOTES TO CONSOLIDATED FINANCIAL STATEMENTS – (Continued)
Major categories of consolidated net investment income are summarized as follows for the years ended December 31, 2011, 2010, and 2009:
| | | Year Ended December 31, | |
| | | 2011 | | | 2010 | | | 2009 | |
| | | (In thousands) | |
Fixed income securities | | $ | 21,956 | | | $ | 24,333 | | | $ | 23,696 | |
Equity securities | | | — | | | | — | | | | 161 | |
Cash and short-term investments | | | 19 | | | | 34 | | | | 157 | |
Total gross investment income | | | 21,975 | | | | 24,367 | | | | 24,014 | |
Less investment expenses | | | (934 | ) | | | (901 | ) | | | (882 | ) |
Net investment income | | $ | 21,041 | | | $ | 23,466 | | | $ | 23,132 | |
Proceeds from the sales of fixed income and equity securities, related realized gains and losses and changes in unrealized gains (losses), excluding other-than-temporary impairments, were as follows:
| | Proceeds | | | Realized Gains | | | Realized Losses | | | Change in Unrealized Gains (Losses) | |
| | | (In thousands) | |
| Year Ended December 31, 2011: | | | | | | | | | | | | |
Fixed income securities | | $ | 146,052 | | | $ | 1,522 | | | $ | (455 | ) | | $ | 27,248 | |
| Year Ended December 31, 2010: | | | | | | | | | | | | | | | | |
Fixed income securities | | | 442,485 | | | | 16,364 | | | | (939 | ) | | | (11,179 | ) |
| Year Ended December 31, 2009: | | | | | | | | | | | | | | | | |
Fixed income securities and preferred stock | | | 95,976 | | | | 737 | | | | (361 | ) | | | 20,480 | |
Equity securities | | | 10,786 | | | | — | | | | (547 | ) | | | 2,477 | |
The 2010 gains were realized in order to allow the Company to fully realize the approximately $15.0 million of tax capital loss carry forwards that existed at December 31, 2009.
4. Fair Value of Financial Instruments
Estimated fair value amounts, defined as the exit price of willing market participants, have been determined using available market information and other appropriate valuation methodologies. However, considerable judgment is required in developing the estimates of fair value. Accordingly, these estimates are not necessarily indicative of the amounts that could be realized in a current market exchange. The use of different market assumptions or estimating methodologies may have an effect on the estimated fair value amounts.
The following methods and assumptions were used by the Company in estimating the fair value disclosures for financial instruments in the accompanying consolidated financial statements and notes:
| | • | Cash and cash equivalents, premiums receivable, accrued expenses, other liabilities and surplus notes: The carrying amounts for these financial instruments as reported in the accompanying consolidated balance sheets approximate their fair values. |
| | • | Investment securities: The Company measures and reports its financial assets and liabilities, including investment securities, in accordance with ASC Topic 820, Fair Value Measurements and Disclosures. The estimated fair values for available-for-sale securities are generally based on quoted market value prices for securities traded in the public marketplace. The Company also considers the impact of a significant decrease in volume and level of activity for an asset or liability when compared with normal activity. Additional information with respect to fair values of the Company’s investment securities is disclosed in Note 3, “Investments”. |
Other financial instruments qualify as insurance-related products and are specifically exempted from fair value disclosure requirements.
SEABRIGHT HOLDINGS, INC. AND SUBSIDIARIES
NOTES TO CONSOLIDATED FINANCIAL STATEMENTS – (Continued)
The Company groups its financial assets and financial liabilities measured at fair value in three levels, based on the markets in which the assets and liabilities are traded and the reliability of the assumptions used to determine fair value. These levels are:
| | • | Level 1 — Valuations for assets and liabilities traded in active exchange markets, such as the New York Stock Exchange. Level 1 includes U.S. Treasury securities that are traded by dealers or brokers in active markets. Valuations are obtained from readily available pricing sources for market transactions involving identical assets or liabilities. |
| | • | Level 2 — Valuations for assets and liabilities traded in less active dealer or broker markets. Level 2 valuations are based upon quoted prices for similar instruments in active markets, quoted prices for identical or similar instruments in markets that are not active, and model-based valuation techniques for which all significant assumptions are observable in the market. Level 2 includes government sponsored agency securities, corporate fixed-income securities, municipal bonds, mortgage pass-through securities, collateralized mortgage obligations and asset-backed securities. |
| | • | Level 3 — Valuations for assets and liabilities that are derived from other valuation methodologies, including discounted cash flow models and similar techniques, and not based on market exchange, dealer, or broker traded transactions. Level 3 valuations incorporate certain assumptions and projections in determining the fair value assigned to such assets or liabilities. As of December 31, 2011, the Company had no Level 3 financial assets or liabilities. |
The tables below present balances of assets measured at fair value on a recurring basis.
December 31, 2011:
| | | Total | | | Level 1 | | | Level 2 | | | Level 3 | |
| | | (In thousands) | |
U.S. Treasury securities | | $ | 26,568 | | | $ | 26,568 | | | $ | — | | | $ | — | |
Government sponsored agency securities | | | 16,897 | | | | — | | | | 16,897 | | | | — | |
Corporate securities | | | 176,229 | | | | — | | | | 176,229 | | | | — | |
Tax-exempt municipal securities | | | 326,855 | | | | — | | | | 326,855 | | | | — | |
Mortgage pass-through securities | | | 80,931 | | | | — | | | | 80,931 | | | | — | |
Collateralized mortgage obligations | | | 14,660 | | | | — | | | | 14,660 | | | | — | |
Asset-backed securities | | | 58,206 | | | | — | | | | 58,206 | | | | — | |
Total | | $ | 700,346 | | | $ | 26,568 | | | $ | 673,778 | | | $ | — | |
December 31, 2010:
| | | Total | | | Level 1 | | | Level 2 | | | Level 3 | |
| | | (In thousands) | |
U.S. Treasury securities | | $ | 26,977 | | | $ | 26,977 | | | $ | — | | | $ | — | |
Government sponsored agency securities | | | 24,071 | | | | — | | | | 24,071 | | | | — | |
Corporate securities | | | 156,269 | | | | — | | | | 156,269 | | | | — | |
Tax-exempt municipal securities | | | 310,712 | | | | — | | | | 310,712 | | | | — | |
Mortgage pass-through securities | | | 75,304 | | | | — | | | | 75,304 | | | | — | |
Collateralized mortgage obligations | | | 17,465 | | | | — | | | | 17,465 | | | | — | |
Asset-backed securities | | | 62,170 | | | | — | | | | 62,170 | | | | — | |
Total | | $ | 672,968 | | | $ | 26,977 | | | $ | 645,991 | | | $ | — | |
At December 31, 2011, there were no liabilities measured at fair value on a recurring basis.
Active markets are those in which transactions occur with sufficient frequency and volume to provide reliable pricing information on an ongoing basis. Inactive markets are those in which there are few transactions for the asset, prices are not current, or price quotations vary substantially either over time or among market makers, or in which little information is released publicly. When the market for an investment is judged to be inactive, appropriate adjustments must be made to observable inputs to account for such inactivity. As of December 31, 2011, the Company’s investment portfolio consisted of securities that it considered to be traded in active markets. Therefore, no adjustment for market inactivity or illiquidity was necessary. There were no transfers between levels during the year ended December 31, 2011.
SEABRIGHT HOLDINGS, INC. AND SUBSIDIARIES
NOTES TO CONSOLIDATED FINANCIAL STATEMENTS – (Continued)
The Company obtains fair value inputs for securities in its investment portfolio from independent, nationally recognized pricing services. The Company obtains one price per instrument from these pricing services. The pricing services utilize multidimensional pricing models that vary by asset class and incorporate relevant inputs such as available trade, bid and quote market data for identical or similar instruments, model-based valuation techniques for which significant assumptions were observable and other market information to arrive at a fair value price for each security. This process takes into consideration the relevance of observable inputs based on factors such as the level of trading activity and the volume and currency of available prices and includes appropriate adjustments for nonperformance and liquidity risks. The Company did not obtain any broker quotes as part of the portfolio valuation process at December 31, 2011. When broker quotes are obtained, they are usually non-binding.
The Company also seeks input from independent portfolio managers engaged by the Company to assist in the management and oversight of its investment portfolio. The Company and an independent portfolio manager engaged by the Company review such amounts for reasonableness in relation to the following considerations, among others: recent trades of a particular security; the Company’s independent observations of recent developments affecting the economy in general and certain issuers in particular; and fair values from other sources, such as statements from the Company’s custodial banks. When other evidence indicates a fair value that is significantly different from that provided by an independent pricing service, the Company may challenge the fair value and request further validation and support from the independent pricing service, which may result in a revised fair value from the independent pricing service. If the Company has independent evidence indicating that a security’s fair value is significantly different from the final value provided by an independent pricing service, it may adjust the fair value accordingly. The Company did not adjust any of the values it obtained from independent pricing services and used those values in developing the fair value measurements in the Company’s consolidated financial statements as of December 31, 2011 and 2010.
The Company holds a limited amount ($20.1 million at December 31, 2011) of privately placed corporate bonds and estimates the fair value of these bonds using an internal matrix that is based in part on market information regarding interest rates, credit spreads and liquidity. The pricing matrix begins with current U.S. Treasury rates and uses credit spreads received from third-party sources to estimate fair value. The Company includes the fair value estimates of these corporate bonds in Level 2, since all significant inputs are market observable. As some of these securities are issued by public companies, the Company compares the estimates of fair value to the fair values of these companies’ publicly traded debt to test the validity of the internal pricing matrix.
The Company may be required, from time to time, to measure certain other financial assets, such as goodwill, fixed assets and other long-lived assets, at fair value on a non-recurring basis in accordance with GAAP. These adjustments to fair value usually result from write-downs of individual assets. In 2010, the Company adjusted to fair value the goodwill resulting from the Acquisition of SBIC in September 2003. For further discussion of the considerations and methodology relating to the goodwill adjustment, see the related discussion at Note 17, “Intangible Assets and Goodwill”.
5. Premiums
Direct premiums written totaled $257.7 million, $262.0 million, and $286.0 million for the years ended December 31, 2011, 2010 and 2009, respectively.
Premiums receivable consisted of the following at December 31, 2011 and 2010:
| | | December 31, | |
| Current: | | 2011 | | | 2010 | |
| | | (In thousands) | |
Premiums receivable | | $ | 19,362 | | | $ | 15,673 | |
Allowance for doubtful accounts | | | (1,030 | ) | | | (650 | ) |
Premiums receivable, net of allowance | | $ | 18,332 | | | $ | 15,023 | |
SEABRIGHT HOLDINGS, INC. AND SUBSIDIARIES
NOTES TO CONSOLIDATED FINANCIAL STATEMENTS – (Continued)
| | | December 31, | |
| Deferred: | | 2011 | | | 2010 | |
| | | (In thousands) | |
Premiums receivable | | $ | 142,713 | | | $ | 169,128 | |
Allowance for doubtful accounts | | | (227 | ) | | | (286 | ) |
Premiums receivable, net of allowance | | $ | 142,486 | | | $ | 168,842 | |
The activity in the allowance for doubtful accounts for the years ended December 31, 2011, 2010, and 2009 is as follows (in thousands):
Balance at December 31, 2008 | | $ | (490 | ) |
Additions charged to bad debt expense | | | (91 | ) |
Write offs charged against allowance | | | 1 | |
Balance at December 31, 2009 | | | (580 | ) |
Additions charged to bad debt expense | | | (508 | ) |
Write offs charged against allowance | | | 152 | |
Balance at December 31, 2010 | | | (936 | ) |
Additions charged to bad debt expense | | | (435 | ) |
Write offs charged against allowance | | | 114 | |
Balance at December 31, 2011 | | $ | (1,257 | ) |
6. Property and Equipment
Property and equipment consisted of the following at December 31, 2011 and 2010:
| | | December 31, | |
| | | 2011 | | | 2010 | |
| | | (In thousands) | |
Computer equipment and software | | $ | 5,038 | | | $ | 4,716 | |
Furniture and equipment | | | 3,020 | | | | 2,964 | |
Leasehold improvements | | | 3,121 | | | | 3,183 | |
Capital projects | | | 3,514 | | | | 2,372 | |
| | | | 14,693 | | | | 13,235 | |
Less accumulated depreciation and amortization | | | (8,356 | ) | | | (6,958 | ) |
Property and equipment, net | | $ | 6,337 | | | $ | 6,277 | |
7. Deferred Policy Acquisition costs
The following reflects the amounts of policy acquisition costs deferred and amortized for the years ended December 31, 2011, 2010, and 2009:
| | | Year Ended December 31, | |
| | | 2011 | | | 2010 | | | 2009 | |
| | | (In thousands) | |
Beginning balance | | $ | 25,574 | | | $ | 25,537 | | | $ | 23,175 | |
Policy acquisition costs deferred | | | 48,460 | | | | 48,670 | | | | 47,015 | |
Amortization of deferred policy acquisition costs | | | (52,200 | ) | | | (48,633 | ) | | | (44,653 | ) |
Ending balance | | $ | 21,834 | | | $ | 25,574 | | | $ | 25,537 | |
8. Reinsurance
a. Reinsurance Ceded
Under reinsurance treaties, the Company cedes various amounts of risk to nonaffiliated insurance companies for the purpose of limiting the maximum potential loss arising from the underlying insurance risks. These reinsurance treaties do not relieve the Company from its obligations to policyholders.
SEABRIGHT HOLDINGS, INC. AND SUBSIDIARIES
NOTES TO CONSOLIDATED FINANCIAL STATEMENTS – (Continued)
On October 1, 2011, the Company entered into new reinsurance treaties with nonaffiliated reinsurers wherein it retains the first $0.5 million of each loss occurrence. The next $0.5 million of losses per occurrence (excess of the first $0.5 million of losses per occurrence retained by the Company) are 50% reinsured. The new reinsurance program, which is effective through September 30, 2012, provides coverage up to $75.0 million per loss occurrence. The following table summarizes the new program as well as the prior reinsurance that was in place from October 1, 2010 through September 30, 2011:
| 2011/2012 Reinsurance Program | | 2010/2011 Reinsurance Program |
| $0.5 million SeaBright Retention | | $0.25 million SeaBright Retention |
| | | $0.25 million in excess of $0.25 million for each loss occurrence. Fully reinsured, subject to an aggregate deductible limit of $5.0 million and an annual aggregate recovery limit of $30.0 million. |
| $0.5 million in excess of $0.5 million for each loss occurrence. 50% reinsured, subject to an annual aggregate recovery limit of $17.0 million. | | $0.5 million in excess of $0.5 million for each loss occurrence. 75% reinsured, subject to an annual aggregate recovery limit of $17.0 million. |
| $1.0 million in excess of $1.0 million for each loss occurrence. Fully reinsured, subject to an annual aggregate recovery limit of $10.0 million. Includes General Liability coverage (limit $1.0 million per occurrence). | | $1.0 million in excess of $1.0 million for each loss occurrence. Fully reinsured, subject to an annual aggregate recovery limit of $10.0 million. Includes General Liability coverage (limit $1.0 million per occurrence). |
| $3.0 million in excess of $2.0 million for each loss occurrence. Fully reinsured, subject to an annual aggregate recovery limit of $12.0 million. Includes General Liability coverage (limit $2.0 million per occurrence). | | $3.0 million in excess of $2.0 million for each loss occurrence. Fully reinsured, subject to an annual aggregate recovery limit of $12.0 million. Includes General Liability coverage (limit $2.0 million per occurrence). |
| $5.0 million in excess of $5.0 million for each loss occurrence. Fully reinsured, subject to an annual aggregate recovery limit of $15.0 million. Includes General Liability coverage (limit $2.0 million per occurrence). | | $5.0 million in excess of $5.0 million for each loss occurrence. Fully reinsured, subject to an annual aggregate recovery limit of $15.0 million. Includes General Liability coverage (limit $2.0 million per occurrence). |
| $10.0 million in excess of $10.0 million for each loss occurrence. Fully reinsured, subject to an annual aggregate recovery limit of $20.0 million and a limit of $10.0 million maximum for any one employee in any one loss occurrence. | | $10.0 million in excess of $10.0 million for each loss occurrence. Fully reinsured, subject to an annual aggregate recovery limit of $20.0 million and a limit of $10.0 million maximum for any one employee in any one loss occurrence. |
| $30.0 million in excess of $20.0 million for each loss occurrence. Fully reinsured, subject to an annual aggregate recovery limit of $60.0 million and a limit of $10.0 million maximum for any one employee in any one loss occurrence. | | $30.0 million in excess of $20.0 million for each loss occurrence. Fully reinsured, subject to an annual aggregate recovery limit of $60.0 million and a limit of $10.0 million maximum for any one employee in any one loss occurrence. |
| $25.0 million in excess of $50.0 million for each loss occurrence. Fully reinsured, subject to an annual aggregate recovery limit of $50.0 million and a limit of $10.0 million maximum for any one employee in any one loss occurrence. | | $50.0 million in excess of $50.0 million for each loss occurrence. Fully reinsured, subject to an annual aggregate recovery limit of $100.0 million and a limit of $10.0 million maximum for any one employee in any one loss occurrence. |
As of December 31, 2011, the Company’s current excess of loss reinsurance treaties were placed with the following reinsurers:
| Reinsurer | A.M. Best Rating |
Allied World Assurance Company Ltd. | “A” (Excellent) |
Aspen Insurance UK Limited | “A” (Excellent) |
Catlin Underwriting (US) o/b/o Lloyd’s Syndicate 2003 (SJC) | “A” (Excellent) |
Hannover Rueckversicherung AG | “A” (Excellent) |
Hannover Re (Bermuda) Limited | “A” (Excellent) |
Lloyd’s of London (Various syndicates) | “A” (Excellent) |
Alterra Insurance (Formerly Max Bermuda) | “A” (Excellent) |
Safety National Casualty Corp | “A” (Excellent) |
Tokio Millennium Reinsurance Limited | “A++” (Excellent) |
Effective January 1, 2012, the Company renewed its quota-share reinsurance agreement with a nonaffiliated reinsurer wherein it cedes 100% of its residual market business assumed from the National Council on Compensation Insurance (the “NCCI”) for policy years 2009, 2010, 2011 and 2012.
SEABRIGHT HOLDINGS, INC. AND SUBSIDIARIES
NOTES TO CONSOLIDATED FINANCIAL STATEMENTS – (Continued)
As part of the Acquisition, SeaBright and LMC entered into an adverse development excess of loss reinsurance agreement (the “Agreement”). The Agreement, after taking into account any recoveries from third party reinsurers, calls for LMC to reimburse SBIC 100% of the excess of the actual loss at December 31, 2011 over the initial loss reserves at September 30, 2003. The Agreement also calls for SBIC to reimburse LMC 100% of the excess of the initial loss reserves at September 30, 2003 over the actual loss results at December 31, 2011. The amount of adverse loss development under the Agreement was $3.1 and $3.0 million at December 31, 2011 and 2010, respectively. Any change in the amount receivable from LMC is netted against loss and loss adjustment expense in the accompanying consolidated statements of operations and comprehensive income (loss).
As part of the Agreement, LMC placed into trust (the “Trust”) $1.6 million, equal to 10% of the balance sheet reserves of SBIC at the date of the Acquisition. Thereafter, the Trust is adjusted each quarter, if warranted, to an amount equal to the greater of (a) $1.6 million or (b) 102% of LMC’s obligations under the Agreement. The balance of the Trust, including accumulated interest, was $3.1 and $3.8 million at December 31, 2011 and 2010, respectively.
b. Reinsurance Assumed
The Company involuntarily assumes residual market business either directly from various states that operate their own residual market programs or indirectly from the National Council for Compensation Insurance, which operates residual market programs on behalf of some states. The states in which the Company assumed residual market business in 2011 and 2010 include the following: Alabama, Alaska, Arizona, Arkansas, Connecticut, Delaware, the District of Columbia, Georgia, Idaho, Illinois, Iowa, Kansas, Massachusetts, Michigan, Nevada, New Hampshire, New Jersey, New Mexico, North Carolina, Oregon, South Carolina, South Dakota, Vermont, Virginia and West Virginia.
c. Reinsurance Recoverables and Income Statement Effects
Balances affected by reinsurance transactions are reported gross of reinsurance in the balance sheets. Reinsurance recoverables are comprised of the following amounts at December 31, 2011 and 2010:
| | | December 31, | |
| | | 2011 | | | 2010 | |
| | | (In thousands) | |
| Reinsurance recoverables on unpaid loss and loss adjustment expenses | | $ | 93,710 | | | $ | 56,350 | |
Reinsurance recoverables on paid losses | | | 463 | | | | 396 | |
Total reinsurance recoverables | | $ | 94,173 | | | $ | 56,746 | |
The Company evaluates the financial condition of its reinsurers and monitors concentrations of credit risk arising from activities or economic characteristics of the reinsurers to minimize its exposure to losses from reinsurer insolvencies. In the event a reinsurer is unable to meet its obligations, the Company would be liable for the losses under the agreement.
SEABRIGHT HOLDINGS, INC. AND SUBSIDIARIES
NOTES TO CONSOLIDATED FINANCIAL STATEMENTS – (Continued)
The following table summarizes the Company’s top ten reinsurers, based on net amount recoverable, as of December 31, 2011:
| Reinsurer | | A.M. Best Rating | | | Net Amount Recoverable as of December 31, 2011 | |
| | | (In thousands) | |
Hannover Rueckversicherung AG* | | | A | | | $ | 49,121 | |
Alterra Insurance (Formerly Max Bermuda)* | | | A | | | | 16,284 | |
Catlin UW o/b/o Lloyds Syndicate 2003 (SJC) * | | | A | | | | 8,421 | |
Swiss Reinsurance America Corp. | | | A+ | | | | 4,398 | |
Platinum Underwriters Reinsurance, Inc. | | | A | | | | 3,078 | |
Safety National Casualty Corporation * | | | A | | | | 2,555 | |
Lloyds Underwriter Syndicate – 2987 BRT * | | | A | | | | 1,875 | |
Allied World Reinsurance Company | | | A | | | | 1,612 | |
Argonaut Insurance Company | | | A | | | | 1,168 | |
Lloyds Underwriter Syndicate – 0566 QBE* | | | A | | | | 913 | |
Total | | | | | | $ | 89,425 | |
___________
| * | Participant in current excess of loss reinsurance treaty program or individual risk reinsurance placements. |
The Company recorded no write-offs of uncollectible reinsurance recoverables in the years ended December 31, 2011, 2010, and 2009.
The effects of reinsurance were as follows for the years ended December 31, 2011, 2010, and 2009:
| | | Year Ended December 31, | |
| | | 2011 | | | 2010 | | | 2009 | |
| | | (In thousands) | |
| Reinsurance assumed: | | | | | | | | | |
Written premiums | | $ | 3,695 | | | $ | 2,318 | | | $ | 3,978 | |
Earned premiums | | | 4,341 | | | | 4,276 | | | | 3,625 | |
Losses and loss adjustment expenses incurred | | | 3,182 | | | | 3,150 | | | | 693 | |
Commission expenses incurred | | | 1,801 | | | | 1,896 | | | | 1,475 | |
| Reinsurance ceded: | | | | | | | | | | | | |
Written premiums | | $ | 35,768 | | | $ | 24,109 | | | $ | 27,234 | |
Earned premiums | | | 36,329 | | | | 26,983 | | | | 22,685 | |
Losses and loss adjustment expenses incurred | | | 44,635 | | | | 27,379 | | | | 17,981 | |
Commissions earned | | | 2,636 | | | | 2,590 | | | | 2,589 | |
Provisions in the lower layer treaties of the Company’s excess of loss reinsurance programs since 2005 allow the Company the ability, at its sole discretion, to commute the contracts within 24 months of expiration in return for a contingent profit commission calculated in accordance with terms specified in the contracts. In accordance with those provisions, the Company commuted the following layers in its reinsurance programs:
| | | Layers | | Year | | Contingent Profit | |
| Reinsurance Program Period | | Commuted | | Commuted | | Commission | |
| | | | | | | (In thousands) | |
| October 1, 2006 to September 30, 2007 | | $5.0 million xs $5.0 million | | 2009 | | $ | 656 | |
| October 1, 2007 to September 30, 2008 | | $5.0 million xs $5.0 million | | 2010 | | | 569 | |
| October 1, 2006 to September 30, 2009 | | $5.0 million xs $5.0 million | | 2011 | | | 535 | |
The contingent profit commissions were recorded as reductions of loss and loss adjustment expenses. As of December 31, 2011, there were no ceded losses associated with the commuted layers and it is not expected that developed losses that would otherwise be covered by reinsurance will exceed the contingent profit commission.
SEABRIGHT HOLDINGS, INC. AND SUBSIDIARIES
NOTES TO CONSOLIDATED FINANCIAL STATEMENTS – (Continued)
9. Unpaid Loss and Loss Adjustment Expense
The following table summarizes the activity in unpaid loss and loss adjustment expense for the years ended December 31, 2011, 2010 and 2009:
| | | Year Ended December 31, | |
| | | 2011 | | | 2010 | | | 2009 | |
| | | (In thousands) | |
| Beginning balance: | | | | | | | | | |
Unpaid loss and loss adjustment expense | | $ | 440,919 | | | $ | 351,890 | | | $ | 292,027 | |
Reinsurance recoverables | | | (56,350 | ) | | | (34,080 | ) | | | (18,231 | ) |
Net balance, beginning of year | | | 384,569 | | | | 317,810 | | | | 273,796 | |
| Incurred related to: | | | | | | | | | | | | |
Current year | | | 187,549 | | | | 191,034 | | | | 174,566 | |
Prior years | | | 31,016 | | | | 31,971 | | | | (1,411 | ) |
Total incurred | | | 218,565 | | | | 223,005 | | | | 173,155 | |
Change in receivable under adverse development cover | | | (152 | ) | | | 45 | | | | 1,169 | |
Total incurred | | | 218,413 | | | | 223,050 | | | | 174,324 | |
| Paid related to: | | | | | | | | | | | | |
Current year | | | (43,460 | ) | | | (47,803 | ) | | | (45,331 | ) |
Prior years | | | (135,340 | ) | | | (108,443 | ) | | | (83,810 | ) |
Total paid | | | (178,800 | ) | | | (156,246 | ) | | | (129,141 | ) |
| Change in receivable under adverse development cover | | | 152 | | | | (45 | ) | | | (1,169 | ) |
Net balance, end of year | | | 424,334 | | | | 384,569 | | | | 317,810 | |
Reinsurance recoverables | | | 93,710 | | | | 56,350 | | | | 34,080 | |
Unpaid loss and loss adjustment expense | | $ | 518,044 | | | $ | 440,919 | | | $ | 351,890 | |
As a result of changes in estimates of insured events in prior periods, unpaid loss and loss adjustment expenses increased by a net amount of $30.9 million in 2011. Net adverse development of prior year loss reserves totaled $36.4 million and related to the following accident years: $9.7 million in 2010, $8.5 million in 2009, $9.0 million in 2008, $6.7 million in 2007, and $2.5 million in accident years 2006 and prior. The net adverse development on loss reserves was offset by $5.0 million of net favorable development of other amounts such as ULAE, loss based assessments and losses assumed from the NCCI pools, as well as a $0.5 million favorable commutation gain.
As a result of changes in estimates of insured events in prior periods, unpaid loss and loss adjustment expenses increased by a net amount of $32.0 million in 2010. Net adverse development of prior year loss reserves totaled $33.4 million and related to the following accident years: $14.0 million in 2009, $10.3 million in 2008, $5.6 million in 2007, $2.1 million in 2006, and $1.4 million in accident years 2005 and prior. The net adverse development on loss reserves was offset by $0.8 million of net favorable development of other amounts such as ULAE, loss based assessments and losses assumed from the NCCI pools, as well as a $0.6 million favorable commutation gain.
As a result of changes in estimates of insured events in prior periods, unpaid loss and loss adjustment expenses decreased by a net amount of $0.2 million in 2009. Adverse development of prior year loss reserves totaled $14.7 million and related to the following accident years: $8.8 million in 2008, $5.0 million in 2007, and $0.9 million in 2006. This adverse development was offset by $0.3 million of net favorable development of loss reserves related to accident years 2005 and prior. The net adverse development on loss reserves was offset by $14.0 million of net favorable development of other amounts such as ULAE, loss based assessments and losses assumed from the NCCI pools, as well as a $0.6 million favorable commutation gain. The $14.0 million related to the following accident years: $4.4 million in 2008, $3.7 million in 2007, $3.3 million in 2006, and $2.6 million in 2005 and prior.
At December 31, 2011 and 2010, the Company reduced unpaid loss and loss adjustment expense by $10.3 million and $10.2 million, respectively, for anticipated salvage and subrogation recoveries.
SEABRIGHT HOLDINGS, INC. AND SUBSIDIARIES
NOTES TO CONSOLIDATED FINANCIAL STATEMENTS – (Continued)
10. Surplus Notes
On May 26, 2004, SBIC issued in a private placement $12.0 million in subordinated floating rate Surplus Notes due in 2034. The note holder is ICONS, Ltd. and Wilmington Trust Company acts as Trustee. Interest, paid quarterly in arrears, is calculated at the beginning of the interest payment period using the 3-month LIBOR plus 400 basis points. The quarterly interest rate cannot exceed the initial interest rate by more than 10% per year, cannot exceed the corporate base (prime) rate by more than 2% and cannot exceed the highest rate permitted by New York law. The rate or amount of interest required to be paid in any quarter is also subject to limitations imposed by the Illinois Insurance Code. Interest amounts not paid as a result of these limitations become “Excess Interest,” which the Company may be required to pay in the future, subject to the same limitations and all other provisions of the Surplus Notes Indenture. To date, there has been no Excess Interest. The interest rates at December 31, 2011 and 2010 were 4.5% and 4.3%, respectively. Interest and principal may be paid only upon the prior approval of the Illinois Department of Insurance. In the event of default, as defined, or failure to pay interest due to lack of Illinois Department of Insurance approval, the Company cannot pay dividends on its capital stock, is limited in its ability to redeem, purchase or acquire any of its capital stock and cannot make payments of interest or principal on any debt issued by the Company which ranks equal with or junior to the Surplus Notes. If an event of default occurs and is continuing, the principal and accrued interest can become immediately due and payable. Interest expense for the years ended December 31, 2011, 2010, and 2009 was $0.5 million, $0.5 million, and $0.6 million, respectively.
The notes are redeemable prior to 2034 by the Company, in whole or in part, on any interest payment date.
Issuance costs of $591,000 incurred in connection with the Surplus Notes and included within other assets on the consolidated balance sheets are being amortized over the life of the notes using the effective interest method. Amortization expense for the years ended December 31, 2011, 2010, and 2009 was $26,000, $26,000 and $29,000, respectively.
11. Income Taxes
The operations of SeaBright and its subsidiaries are included in a consolidated federal income tax return.
The following is a reconciliation of the difference between the “expected” federal income tax computed by applying the statutory income tax rate of 35% to income (loss) before taxes and the actual total income taxes reflected on the books for the years ended December 31, 2011, 2010, and 2009:
| | | Year Ended December 31, | |
| | | 2011 | | | 2010 | | | 2009 | |
| | | (In thousands) | |
| Expected federal income tax expense (benefit) at statutory rate | | $ | (8,864 | ) | | $ | (2,219 | ) | | $ | 5,805 | |
State income tax benefit (expense) | | | (74 | ) | | | 12 | | | | (68 | ) |
Tax exempt bond interest income exclusion | | | (2,805 | ) | | | (3,360 | ) | | | (3,446 | ) |
Other | | | 733 | | | | 846 | | | | 558 | |
Federal income tax (benefit) expense per books | | | (11,010 | ) | | | (4,721 | ) | | | 2,849 | |
State income tax (benefit) expense | | | 210 | | | | (35 | ) | | | 202 | |
Total combined income tax (benefit) expense | | $ | (10,800 | ) | | $ | (4,756 | ) | | $ | 3,051 | |
SEABRIGHT HOLDINGS, INC. AND SUBSIDIARIES
NOTES TO CONSOLIDATED FINANCIAL STATEMENTS – (Continued)
Deferred income taxes reflect the net tax effect of temporary differences between the carrying amounts of assets and liabilities for financial reporting purposes and those amounts used for income tax reporting purposes. The significant components of the deferred tax assets and liabilities at December 31, 2011 and 2010 were as follows:
| | | December 31, | |
| | | 2011 | | | 2010 | |
| | | (In thousands) | |
| Federal deferred tax assets: | | | | | | |
Unpaid loss and loss adjustment expenses | | $ | 22,525 | | | $ | 20,682 | |
Unearned premium | | | 7,917 | | | | 9,824 | |
Allowance for bad debts | | | 360 | | | | 228 | |
Restricted stock grants | | | 2,359 | | | | 2,722 | |
Amortizable assets | | | 557 | | | | 607 | |
Accrued vacation and bonus | | | 661 | | | | 733 | |
Guaranty fund payable | | | 399 | | | | 281 | |
Net operating loss and tax credit carryovers | | | 4,579 | | | | — | |
Other | | | 984 | | | | 979 | |
| | | | 40,341 | | | | 36,056 | |
| Federal deferred tax liabilities: | | | | | | | | |
Prepaid expenses | | | (435 | ) | | | (404 | ) |
Unrealized net gain on investment securities | | | (12,162 | ) | | | (2,573 | ) |
State insurance licenses | | | (420 | ) | | | (420 | ) |
Deferred acquisition costs | | | (7,642 | ) | | | (8,951 | ) |
Other | | | (864 | ) | | | (984 | ) |
| | | | (21,523 | ) | | | (13,332 | ) |
Federal net deferred tax assets | | | 18,818 | | | | 22,724 | |
State deferred tax assets | | | 415 | | | | 734 | |
Federal and state net deferred tax assets | | $ | 19,233 | | | $ | 23,458 | |
In assessing the realizability of deferred tax assets, management considers whether it is more likely than not that some portion or all of the deferred tax assets will not be realized. The ultimate realization of deferred tax assets is dependent upon the generation of future taxable income during the periods in which those temporary differences become deductible. Management considers the taxes paid in prior years, the scheduled reversal of deferred tax liabilities, projected future taxable income and tax planning strategies in making this assessment. Based upon the level of historic taxable income and projections of future taxable income over the periods in which the deferred tax assets are deductible, management expects to realize the benefits of these deductible differences.
As of December 31, 2011, the Company had $11.7 million of net operating loss carryovers and $0.5 million of alternative minimum tax credit carryovers, both relating to federal income tax. The $11.7 million of net operating loss carryovers expires in 2031. The $0.5 million of alternative minimum tax credit carryovers has no expiration date. The Company had no carryovers as of December 31, 2010.
As of December 31, 2011 and 2010, the Company had no unrecognized tax benefits, and the Company does not expect to have any unrecognized tax benefits in the next 12 months. The Company files consolidated U.S. federal and state income tax returns, as well as separate company state income tax returns. The tax years that remain subject to examination by the Internal Revenue Service are the years ended December 31, 2008, 2009, 2010 and 2011.
12. Statutory Net Income and Stockholders’ Equity
SBIC is required to file annually with state regulatory insurance authorities financial statements prepared on an accounting basis as prescribed or permitted by such authorities (statutory basis accounting or “SAP”). Statutory net income and capital and surplus (stockholders’ equity) differ from amounts reported in accordance with GAAP, primarily because of the following accounting treatments prescribed by SAP: policy acquisition costs are expensed when incurred; certain assets designated as “nonadmitted” for statutory purposes are charged to surplus; fixed-income securities are reported primarily at amortized cost or fair value based on their rating by the National Association of Insurance Commissioners (“NAIC”); policyholders’ dividends are expensed as declared rather than accrued as incurred; deferred income taxes are charged or credited directly to unassigned surplus; and any change in the admitted net deferred tax asset is offset to equity. Following is a summary of SBIC’s statutory net gain for the years ended December 31, 2011, 2010, and 2009 and statutory capital and surplus as of December 31, 2011, 2010 and 2009:
SEABRIGHT HOLDINGS, INC. AND SUBSIDIARIES
NOTES TO CONSOLIDATED FINANCIAL STATEMENTS – (Continued)
| | | December 31, | |
| | | 2011 | | | 2010 | | | 2009 | |
| | | (Unaudited) | | | (Audited) | |
| | | (In thousands) | |
Statutory net gain (loss) | | $ | (10,522 | ) | | $ | 5,958 | | | $ | 12,565 | |
Statutory capital and surplus | | | 291,530 | | | | 301,333 | | | | 306,911 | |
The maximum amount of dividends that can be paid to stockholders by insurance companies domiciled in the State of Illinois without prior approval of regulatory authorities is restricted if such dividend, together with other distributions during the 12 preceding months, would exceed the greater of 10% of the insurer’s statutory surplus as of the preceding December 31 or the statutorily adjusted net income for the preceding calendar year. If the limitation is exceeded, then such proposed dividend must be reported to the Illinois Department of Insurance at least 30 days prior to the proposed payment date and may be paid only if not disapproved. The Illinois insurance laws also permit payment of dividends only out of statutory earned surplus. At December 31, 2011, SBIC had statutory earned surplus of $96.5 million (unaudited). Consequently, SBIC would be able to pay up to $29.2 million of stockholder dividends in 2012 without the prior approval of regulators.
The State of Illinois imposes minimum risk-based capital requirements that were developed by the NAIC. The formulas for determining the amount of risk-based capital specify various weighting factors that are applied to financial balances or various levels of activity based on the perceived degree of risk. Regulatory compliance is determined by a ratio of the enterprise’s regulatory total adjusted capital to certain minimum capital amounts as defined by the NAIC. Enterprises below specified trigger points or ratios are classified within certain levels, each of which requires specified corrective action. SBIC exceeded the minimum risk-based capital requirements at December 31, 2011 and 2010.
13. Commitments
The Company leases certain office space for its headquarters and regional offices under agreements that are accounted for as operating leases. Lease expense totaled $3.5 million, $3.5 million and $3.4 million for the years ended December 31, 2011, 2010, and 2009, respectively. Total rent, including the effect of rent increases and concessions, is expensed on a straight-line basis over the respective lease terms.
As of December 31, 2011, future minimum payments required under the agreements were as follows:
| | Operating leases | |
| | | (In thousands) | |
2012 | | $ | 2,988 | |
2013 | | | 2,907 | |
2014 | | | 2,564 | |
2015 | | | 2,560 | |
2016 | | | 1,284 | |
Thereafter | | | 85 | |
| | | $ | 12,388 | |
14. Retirement Plan
The Company maintains a defined contribution 401(k) retirement savings plan covering substantially all of its employees. In 2011, 2010 and 2009, the Company matched 100% of the first five percent of eligible compensation contributed to the plan on a pre-tax basis. Employees are 100% vested in all matching contributions when they are made. Contribution expense for the years ended December 31, 2011, 2010, and 2009 was $1.3 million, $1.1 million and $1.1 million, respectively.
SEABRIGHT HOLDINGS, INC. AND SUBSIDIARIES
NOTES TO CONSOLIDATED FINANCIAL STATEMENTS – (Continued)
15. Contingencies
a. SBIC is subject to guaranty fund and other assessments by the states in which it writes business. Guaranty fund assessments are accrued at the time premiums are written. Other assessments are accrued either at the time of assessment or in the case of premium-based assessments, at the time the premiums are written, or in the case of loss-based assessments, at the time the losses are incurred. As of December 31, 2011 and 2010, SBIC had accrued liabilities for guaranty fund and other assessments of $6.5 million and $6.2 million, respectively, and had recorded related assets for premium tax offset and policy surcharges of $5.1 million and $4.2 million as of those dates, respectively. These amounts represent management’s best estimate based on information received from the states in which it writes business and may change due to many factors including the Company’s share of the ultimate cost of current insolvencies. Most assessments are paid out in the year following the year in which the premium is written or the losses are paid. Guaranty fund receivables and other surcharge items are generally realized by a charge to new and renewing policyholders in the year following the year in which the related assessments were paid.
b. The Company is involved in various claims and lawsuits arising in the ordinary course of business. Management believes the outcome of these matters will not have a material adverse effect on the Company’s financial position or results of operations.
16. Retrospectively Rated Contracts
On October 1, 2003, the Company began selling workers’ compensation insurance policies for which the premiums vary based on loss experience. Accrued retrospective premiums are determined based upon the loss experience of business subject to such experience rating adjustment. Accrued retrospectively rated premiums are determined by and allocated to individual policyholder accounts. Accrued retrospective premiums are recorded as additions to written or earned premium, and return retrospective premiums are recorded as reductions from written or earned premium. Approximately 6.6%, 5.9% and 7.2% of the Company’s direct premiums written for the years ended December 31, 2011, 2010 and 2009, respectively, related to retrospectively rated contracts. The Company accrued $9.2 million for retrospective premiums receivable (included in deferred premiums on the balance sheet) and $23.3 million for return retrospective premiums (included in accrued expenses and other liabilities on the balance sheet) at December 31, 2011 and $11.1 million for retrospective premiums receivable and $22.6 million for return retrospective premiums at December 31, 2010.
17. Intangible Assets and Goodwill
The unamortized balances of intangible assets, other than goodwill, consist of the following at December 31, 2011 and 2010:
| | | | | | | Gross Carrying | | | | |
| | | Amortization | | | Amount | | | Accumulated Amortization | |
| | | Period (years) | | | at December 31, | | | at December 31, | |
| | | | | | 2011 | | | 2010 | | | 2011 | | | 2010 | |
| | | (In thousands) | |
| Intangible assets: | | | | | | | | | | | | | | | | |
State insurance licenses | | | — | | | | $ | 1,200 | | | $ | 1,200 | | | $ | — | | | $ | — | |
State business licenses | | | — | | | | | 25 | | | | 25 | | | | — | | | | — | |
Domain name | | | 15 | | | | | 10 | | | | 10 | | | | 1 | | | | 1 | |
Accreditations | | | 3 | | | | | 30 | | | | 30 | | | | 19 | | | | 10 | |
| Black/White Nevada Non-Compete Agreement | | | 3 | | | | | 390 | | | | 390 | | | | 390 | | | | 314 | |
| | | | | | | | $ | 1,655 | | | $ | 1,655 | | | $ | 410 | | | $ | 325 | |
The weighted average amortization period for all intangible assets subject to amortization is 6.1 years. Aggregate amortization expense was $11,000, $141,000 and $184,000 for the years ended December 31, 2011, 2010, and 2009, respectively.
SEABRIGHT HOLDINGS, INC. AND SUBSIDIARIES
NOTES TO CONSOLIDATED FINANCIAL STATEMENTS – (Continued)
The following table summarizes the amounts of goodwill related to previous acquisitions:
| | | SBIC | | | PMCS | | | PointSure | | | Total | |
| | | (in thousands) | |
| Balance as of December 31, 2010: | | | | | | | | | | | | |
Goodwill | | $ | 1,527 | | | $ | 1,355 | | | $ | 1,439 | | | $ | 4,321 | |
Accumulated impairment losses | | | (1,527 | ) | | | — | | | | — | | | | (1,527 | ) |
| | | | — | | | | 1,355 | | | | 1,439 | | | | 2,794 | |
Goodwill acquired during the year | | | — | | | | — | | | | — | | | | — | |
Impairment losses | | | — | | | | — | | | | — | | | | — | |
| Balance as of December 31, 2011: | | | | | | | | | | | | | | | | |
Goodwill | | | 1,527 | | | | 1,355 | | | | 1,439 | | | | 4,321 | |
Accumulated impairment losses | | | (1,527 | ) | | | — | | | | — | | | | (1,527 | ) |
| | | $ | — | | | $ | 1,355 | | | $ | 1,439 | | | $ | 2,794 | |
The Company tests for goodwill impairment in the fourth quarter of each year. At the end of each subsequent quarter, management considers the results of the previous analysis as well as any recent developments that may constitute triggering events requiring the impairment analysis to be updated. In 2011, the Company completed its impairment assessment by performing a qualitative analysis as permitted by ASU 2011-08, Intangibles – Goodwill and Other (Topic 350): Testing Goodwill for Impairment, which the Company early adopted in the fourth quarter of 2011. Among the qualitative factors considered were the following: the substantial margins by which both reporting units (PMCS and PointSure) passed the previous impairment analysis; the continued strong performance of both reporting units; the importance of both reporting units to the Company’s strategic plan; and a lack of the negative factors identified in ASU 2011-08. The Company concluded, on a more-likely-than-not basis, that no goodwill impairment existed at December 31, 2011. In June 2010, the Company recorded a $1.5 million impairment charge against the goodwill resulting from the acquisition of SBIC in September 2003.
If current difficult market conditions persist during 2012 or if the Company’s actions to limit risk associated with its products or investments causes a significant change in any one reporting unit’s fair value, subsequent reviews of goodwill could result in an impairment of goodwill during 2012 or later.
18. Share-Based Payment Arrangements
At December 31, 2011, the Company had outstanding stock options and nonvested stock granted according to the terms of two equity incentive plans. The stockholders and Board of Directors approved the 2003 Stock Option Plan (the “2003 Plan”) in September 2003, and amended and restated the 2003 Plan in February 2004, and approved the 2005 Long-Term Equity Incentive Plan (the “2005 Plan” and, together with the 2003 Plan, the “Stock Option Plans”) in December 2004. In April 2007, the Board of Directors further amended the 2003 Plan and amended the 2005 Plan and in May 2010, the Board of Directors further amended the 2005 Plan. The current amended and restated 2005 Plan was approved by shareholders on May 18, 2010.
The Board of Directors reserved an initial total of 776,458 shares of common stock under the 2003 Plan and 1,047,755 shares of common stock under the 2005 Plan, plus an automatic annual increase on the first day of each fiscal year beginning in 2006 and ending in 2015 equal to the lesser of: (i) 2% of the shares of common stock outstanding on the last day of the immediately preceding fiscal year or (ii) such lesser number of shares as determined by the Board of Directors. At December 31, 2011, the Company reserved 776,458 shares of common stock for issuance under the 2003 Plan, of which options to purchase 479,946 shares had been granted, and 3,505,550 shares for issuance under the 2005 Plan, of which 3,043,536 shares had been granted. In January 2006, the Compensation Committee of the Board of Directors terminated the ability to grant future stock options awards under the 2003 Plan. Therefore, the Company anticipates that all future awards will be made under the 2005 Plan.
The 2005 Plan provides for the grant of incentive or non-qualified stock options, restricted stock, restricted stock units, deferred stock units, performance awards, or any combination of the foregoing. The Board of Directors has the authority to determine all matters relating to awards granted under the Stock Option Plans, including designation as incentive or nonqualified stock options, the selection of individuals to be granted options, the number of shares subject to each grant, the exercise price, the term and the vesting period, if any. Options to purchase the Company’s common stock are granted at prices at or above the fair value of the common stock on the date of grant, generally vest 25% per year on each of the first four anniversaries of the vesting start date, and expire 10 years from the date of grant. Options granted to non-employee directors generally vest 25% on the first anniversary of the grant date and the remaining 75% in equal monthly installments over the following 36 months. Nonvested stock issued to employees and directors generally vests on the third anniversary of the grant date, assuming the holder is still employed by or providing service to the Company and satisfies all other conditions of the grant. Generally, stock options granted to employees are incentive stock options, while options granted to non-employee directors are non-qualified stock options.
SEABRIGHT HOLDINGS, INC. AND SUBSIDIARIES
NOTES TO CONSOLIDATED FINANCIAL STATEMENTS – (Continued)
The Company has only issued new shares of common stock upon exercise of stock options or award of nonvested shares.
Total stock-based compensation expense recognized in the consolidated statements of operations and comprehensive income (loss) for the years ended December 31, 2011, 2010 and 2009 is shown in the following table. No stock-based compensation cost was capitalized during years ended December 31, 2011, 2010 and 2009.
| | | Year Ended December 31, | |
| | | 2011 | | | 2010 | | | 2009 | |
| | | (In thousands) | |
| Stock-based compensation expense related to: | | | | | | | | | |
Nonvested restricted stock | | $ | 4,036 | | | $ | 4,532 | | | $ | 4,117 | |
Stock options | | | 665 | | | | 892 | | | | 686 | |
Total | | $ | 4,701 | | | $ | 5,424 | | | $ | 4,803 | |
Total related tax benefit | | $ | 282 | | | $ | 262 | | | $ | 377 | |
a. Stock Options
The fair values of stock options granted during the years ended December 31, 2011, 2010 and 2009 were determined on the dates of grant using the Black-Scholes-Merton option valuation model with the following weighted average assumptions:
| | | Year Ended December 31, | |
| | | 2011 | | | 2010 | | | 2009 | |
Expected term (years) | | | 6.3 | | | | 6.3 | | | | 6.3 | |
Expected stock price volatility | | | 39.8 | % | | | 40.7 | % | | | 34.0 | % |
Risk-free interest rate | | | 2.40 | % | | | 1.54 | % | | | 2.31 | % |
Expected dividend yield | | | 2.03 | % | | | 2.25 | % | | | — | |
Estimated fair value per option | | $ | 3.40 | | | $ | 3.57 | | | $ | 3.73 | |
The expected term of options was determined using the “simplified method,” which averages an award’s weighted average vesting period. The expected stock price volatility in the above years was based on the Company’s historical stock price volatility since the public offering of its common stock in January 2005. The risk-free interest rate is based on the yield of U.S. Treasury securities with an equivalent remaining term.
The assumptions used to calculate the fair value of options granted are evaluated and revised, as necessary, to reflect market conditions and the Company’s historical experience and future expectations. The calculated fair value is recognized as compensation cost in the Company’s financial statements over the requisite service period of the entire award. Compensation cost is recognized only for those options expected to vest, with forfeitures estimated at the date of grant and evaluated and adjusted over the requisite service period to reflect the Company’s historical experience and future expectations. Any change in the forfeiture assumption is accounted for as a change in estimate, with the cumulative effect of the change on periods previously reported being reflected in the financial statements of the period in which the change is made.
SEABRIGHT HOLDINGS, INC. AND SUBSIDIARIES
NOTES TO CONSOLIDATED FINANCIAL STATEMENTS – (Continued)
The following table summarizes stock option activity for the years ended December 31, 2011 and 2010:
| | | Shares Subject to Options | | | Weighted Average Exercise Price per Share | | | Weighted Average Remaining Contractual Life (years) | | | Aggregate Intrinsic Value | |
| | | | | | | | | | | | (In thousands) | |
Outstanding at December 31, 2009 | | | 1,225,660 | | | $ | 11.19 | | | | 6.2 | | | $ | 368 | |
Granted | | | 175,113 | | | | 10.88 | | | | — | | | | — | |
Forfeited | | | (20,078 | ) | | | 13.06 | | | | — | | | | — | |
Exercised | | | (4,000 | ) | | | 6.54 | | | | — | | | | — | |
Cancelled | | | (22,253 | ) | | | 13.69 | | | | — | | | | — | |
Outstanding at December 31, 2010 | | | 1,354,442 | | | | 11.09 | | | | 5.7 | | | | 1,002 | |
Granted | | | 167,338 | | | | 9.95 | | | | — | | | | — | |
Forfeited | | | (29,760 | ) | | | 10.44 | | | | — | | | | — | |
Exercised | | | — | | | | | | | | — | | | | — | |
Cancelled | | | (17,980 | ) | | | 13.83 | | | | — | | | | — | |
Outstanding at December 31, 2011 | | | 1,474,040 | | | | 10.94 | | | | 5.1 | | | | 404 | |
Exercisable at December, 2011 | | | 1,088,786 | | | | 11.05 | | | | 4.0 | | | | 403 | |
Exercisable at December, 2010 | | | 946,232 | | | | 10.82 | | | | 4.5 | | | | 984 | |
The aggregate intrinsic values in the table above are before applicable income taxes and are based on the Company’s closing stock price of $7.65 and $9.22 at December 31, 2011 and 2010, respectively. As of December 31, 2011, total unrecognized stock-based compensation cost related to nonvested stock options was approximately $1.0 million, which is expected to be recognized over a weighted average period of approximately 2.37 years. No stock options were exercised in 2011 and proceeds from the exercise of stock options totaled approximately $26,000 in 2010. The total intrinsic value of stock options exercised in 2010 was approximately $17,260.
As of December 31, 2011, there were 462,014 shares of common stock available for issuance of future share-based awards. In accordance with the provisions of the 2005 Plan, the number of shares authorized for issuance under the 2005 Plan was automatically increased by 446,555 shares on January 1, 2012, resulting in 908,569 shares available for issuance as of that date. The following table presents additional information regarding options outstanding as of December 31, 2011:
| | | Options Outstanding | | | Options Exercisable | |
| | | | | | Weighted- | | | | | | | |
| | | | | | Average | | | | | | | |
| | | | | | Remaining | | | Weighted- | | | | | | Weighted- | |
| | | Number | | | Contractual | | | Average | | | Number | | | Average | |
| Range of Exercise Prices | | Outstanding | | | Life (years) | | | Exercise Price | | | Outstanding | | | Exercise Price | |
$6.54 – 8.92 | | | 438,436 | | | | 2.8 | | | $ | 6.93 | | | | 413,596 | | | $ | 6.83 | |
8.93 – 10.28 | | | 196,436 | | | | 8.8 | | | | 9.94 | | | | 22,698 | | | | 9.91 | |
10.29 – 12.54 | | | 469,952 | | | | 5.5 | | | | 10.73 | | | | 317,612 | | | | 10.66 | |
12.55 – 15.96 | | | 170,266 | | | | 6.1 | | | | 14.70 | | | | 135,930 | | | | 14.74 | |
15.97 – 18.68 | | | 198,950 | | | | 4.8 | | | | 18.06 | | | | 198,950 | | | | 18.06 | |
| | | | 1,474,040 | | | | 5.1 | | | | 10.94 | | | | 1,088,786 | | | | 11.05 | |
SEABRIGHT HOLDINGS, INC. AND SUBSIDIARIES
NOTES TO CONSOLIDATED FINANCIAL STATEMENTS – (Continued)
b. Restricted Stock
The following table summarizes restricted stock activity for the years ended December 31, 2011 and 2010:
| | | Number of Shares | | | Weighted Average Grant Date Fair Value | |
Outstanding at December 31, 2009 | | | 936,020 | | | $ | 13.78 | |
Granted | | | 428,770 | | | | 10.91 | |
Vested | | | (231,165 | ) | | | 17.90 | |
Forfeited | | | (28,500 | ) | | | 12.44 | |
Outstanding at December 31, 2010 | | | 1,105,125 | | | | 11.84 | |
Granted | | | 567,401 | | | | 9.55 | |
Vested | | | (382,199 | ) | | | 14.06 | |
Forfeited | | | (129,771 | ) | | | 10.36 | |
Outstanding at December 31, 2011 | | | 1,160,556 | | | | 10.15 | |
As of December 31, 2011, there was $5.3 million of total unrecognized compensation cost related to restricted stock granted under the 2005 Plan. That cost is expected to be recognized over a weighted-average period of 1.89 years.
19. Quarterly Financial Information (unaudited)
The following table summarizes selected unaudited quarterly financial data for each quarter of the years ended December 31, 2011, 2010 and 2009.
| | | Quarter Ended | |
| | | March 31 | | | June 30 | | | September 30 | | | December 31 | |
| | | (In thousands, except earnings per share) | |
| 2011: | | | | | | | | | | | | |
Premiums earned | | $ | 56,730 | | | $ | 62,088 | | | $ | 63,994 | | | $ | 66,739 | |
Loss and loss adjustment expenses | | | 43,266 | | | | 72,657 | (1) | | | 48,636 | | | | 53,854 | |
| Underwriting, acquisition and insurance expenses | | | 18,414 | | | | 19,328 | | | | 18,261 | | | | 19,518 | |
Net income (loss) | | | 248 | | | | (15,812 | ) | | | 1,629 | | | | (591 | ) |
Diluted earnings (loss) per share | | $ | 0.01 | | | $ | (0.75 | ) | | $ | 0.08 | | | $ | (0.03 | ) |
| 2010: | | | | | | | | | | | | | | | | |
Premiums earned | | $ | 60,630 | | | $ | 65,621 | | | $ | 65,108 | | | $ | 62,967 | |
Loss and loss adjustment expenses | | | 43,577 | | | | 80,547 | (1) | | | 49,002 | | | | 49,924 | |
| Underwriting, acquisition and insurance expenses | | | 18,724 | | | | 17,007 | | | | 17,603 | | | | 18,750 | |
Net income (loss) | | | 7,587 | | | | (15,530 | ) | | | 5,428 | | | | 932 | |
Diluted earnings (loss) per share | | $ | 0.35 | | | $ | (0.74 | ) | | $ | 0.25 | | | $ | 0.04 | |
| 2009: | | | | | | | | | | | | | | | | |
Premiums earned | | $ | 58,004 | | | $ | 60,029 | | | $ | 64,427 | | | $ | 61,967 | |
Loss and loss adjustment expenses | | | 38,564 | | | | 41,760 | | | | 43,103 | | | | 50,897 | |
| Underwriting, acquisition and insurance expenses | | | 19,730 | | | | 16,043 | | | | 18,119 | | | | 18,945 | |
Net income | | | 3,988 | | | | 4,302 | | | | 6,665 | | | | (1,420 | ) |
Diluted earnings per share | | $ | 0.19 | | | $ | 0.20 | | | $ | 0.31 | | | $ | (0.07 | ) |
| (1) | Includes adjustment to reflect adverse development of prior years’ loss reserves. See Note 9, “Unpaid Loss and Loss Adjustment Expense”. |
Item 9. Changes in and Disagreements with Accountants on Accounting and Financial Disclosure.
None.
Item 9A. Controls and Procedures.
Disclosure Controls and Procedures
Under the supervision and with the participation of management, including our Chief Executive Officer and our Chief Financial Officer, we carried out an evaluation of our disclosure controls and procedures (as defined in Rule 13a-15(e) under the Exchange Act). Based on that evaluation, our Chief Executive Officer and our Chief Financial Officer concluded that our disclosure controls and procedures were effective as of the end of the period covered by this annual report to ensure that information we are required to disclose in reports that are filed or submitted under the Exchange Act is recorded, processed, summarized and reported within the time periods specified in the rules and forms specified by the SEC and is accumulated and communicated to our management, including our Chief Executive Officer and our Chief Financial Officer, as appropriate to allow timely decisions regarding required disclosure.
Management’s Report on Internal Control Over Financial Reporting
The management of SeaBright Holdings, Inc. is responsible for establishing and maintaining adequate internal control over financial reporting as required by the Sarbanes-Oxley Act of 2002 and as defined in Exchange Act Rule 13a-15(f). Our system of internal control over financial reporting is designed to provide reasonable assurance to our management and Board of Directors regarding the preparation and fair presentation of published financial statements. A system of internal control can provide only reasonable, not absolute, assurance that the objectives of the control system are met. Our management, including our Chief Executive Officer and Chief Financial Officer, conducted an assessment of the design and operating effectiveness of our internal control over financial reporting based on the framework in “Internal Control — Integrated Framework” issued by the Committee of Sponsoring Organizations of the Treadway Commission. Based on this assessment, our management has concluded that, as of December 31, 2011, our internal control over financial reporting was effective.
KPMG LLP, an independent registered public accounting firm, has issued their report regarding the audit of the effectiveness of our internal control over financial reporting as of December 31, 2011, which is included in this Item 9A.
Changes in Internal Controls
There have not been any changes in our internal controls over financial reporting during our fourth fiscal quarter of 2011 that have materially affected, or are reasonably likely to materially affect, our internal controls over financial reporting.
Report of Independent Registered Public Accounting Firm
The Board of Directors and Stockholders
SeaBright Holdings, Inc.:
We have audited SeaBright Holdings, Inc.’s internal control over financial reporting as of December 31, 2011, based on criteria established in Internal Control — Integrated Framework issued by the Committee of Sponsoring Organizations of the Treadway Commission (COSO). SeaBright Holdings, Inc.’s management is responsible for maintaining effective internal control over financial reporting and for its assessment of the effectiveness of internal control over financial reporting, included in the accompanying Management’s Report on Internal Control over Financial Reporting. Our responsibility is to express an opinion on SeaBright Holdings, Inc.’s internal control over financial reporting based on our audit.
We conducted our audit in accordance with the standards of the Public Company Accounting Oversight Board (United States). Those standards require that we plan and perform the audit to obtain reasonable assurance about whether effective internal control over financial reporting was maintained in all material respects. Our audit included obtaining an understanding of internal control over financial reporting, assessing the risk that a material weakness exists, and testing and evaluating the design and operating effectiveness of internal control based on the assessed risk. Our audit also included performing such other procedures as we considered necessary in the circumstances. We believe that our audit provides a reasonable basis for our opinion.
A company’s internal control over financial reporting is a process designed to provide reasonable assurance regarding the reliability of financial reporting and the preparation of financial statements for external purposes in accordance with generally accepted accounting principles. A company’s internal control over financial reporting includes those policies and procedures that (1) pertain to the maintenance of records that, in reasonable detail, accurately and fairly reflect the transactions and dispositions of the assets of the company; (2) provide reasonable assurance that transactions are recorded as necessary to permit preparation of financial statements in accordance with generally accepted accounting principles, and that receipts and expenditures of the company are being made only in accordance with authorizations of management and directors of the company; and (3) provide reasonable assurance regarding prevention or timely detection of unauthorized acquisition, use, or disposition of the company’s assets that could have a material effect on the financial statements.
Because of its inherent limitations, internal control over financial reporting may not prevent or detect misstatements. Also, projections of any evaluation of effectiveness to future periods are subject to the risk that controls may become inadequate because of changes in conditions, or that the degree of compliance with the policies or procedures may deteriorate.
In our opinion, SeaBright Holdings, Inc. maintained, in all material respects, effective internal control over financial reporting as of December 31, 2011, based on criteria established in Internal Control — Integrated Framework issued by the Committee of Sponsoring Organizations of the Treadway Commission.
We also have audited, in accordance with the standards of the Public Company Accounting Oversight Board (United States), the consolidated balance sheets of SeaBright Holdings, Inc. and subsidiaries as of December 31, 2011 and 2010, and the related consolidated statements of operations and comprehensive income (loss), changes in stockholders’ equity, and cash flows for each of the years in the three-year period ended December 31, 2011, and our report dated March 5, 2012 expressed an unqualified opinion on those consolidated financial statements.
/s/ KPMG LLP
Seattle, Washington
March 5, 2012
Item 9B. Other Information.
None.
PART III
Item 10. Directors, Executive Officers and Corporate Governance.
The information required by this item is incorporated by reference from the sections captioned “Board of Directors and Corporate Governance”, “Executive Officers and Key Employees”, “Common Stock Ownership” and “Section 16(a) Beneficial Ownership Reporting Compliance” contained in our proxy statement for the 2012 annual meeting of stockholders, to be filed with the Commission pursuant to Regulation 14A not later than 120 days after December 31, 2011.
Item 11. Executive Compensation.
The information required by this item is incorporated by reference from the sections captioned “Executive Compensation” and “Director Compensation” contained in our proxy statement for the 2012 annual meeting of stockholders, to be filed with the Commission pursuant to Regulation 14A not later than 120 days after December 31, 2011.
Item 12. Security Ownership of Certain Beneficial Owners and Management and Related Stockholder Matters.
The information required by this item is incorporated by reference from the sections captioned “Beneficial Ownership Table” and “Executive Compensation” contained in our proxy statement for the 2012 annual meeting of stockholders, to be filed with the Commission pursuant to Regulation 14A not later than 120 days after December 31, 2011.
Item 13. Certain Relationships and Related Transactions, and Director Independence.
The information required by this item is incorporated by reference from the sections captioned “Certain Relationships and Related Transactions” and “Board of Directors and Corporate Governance” contained in our proxy statement for the 2012 annual meeting of stockholders, to be filed with the Commission pursuant to Regulation 14A not later than 120 days after December 31, 2011.
Item 14. Principal Accounting Fees and Services.
The information required by this item is incorporated by reference from the sections captioned “Principal Accounting Fees and Services” contained in our proxy statement for the 2012 annual meeting of stockholders, to be filed with the Commission pursuant to Regulation 14A not later than 120 days after December 31, 2011.
PART IV
Item 15. Exhibits, Financial Statement Schedules.
The following documents are being filed as part of this annual report.
(a) (1) Financial Statements. The following financial statements and notes are filed under Part II, Item 8 of this annual report.
| | Page |
| SeaBright Holdings, Inc. | |
Report of Independent Registered Public Accounting Firm | 75 |
Consolidated Balance Sheets | 76 |
Consolidated Statements of Operations and Comprehensive Income (Loss) | 77 |
Consolidated Statements of Changes in Stockholders’ Equity | 78 |
Consolidated Statements of Cash Flows | 79 |
(2) Financial Statement Schedules.
SeaBright Holdings, Inc.
Schedule II — Condensed Financial Information of Registrant
Schedule IV — Reinsurance
Schedule VI — Supplemental Information Concerning Insurance Operations
All other schedules for which provision is made in the applicable accounting requirements of the Securities and Exchange Commission are not required or the required information has been included within the financial statements or the notes thereto.
(3) Exhibits. The list of exhibits in the Exhibit Index to this annual report is incorporated herein by reference.
SIGNATURES
Pursuant to the requirements of Section 13 or 15(d) of the Securities Exchange Act of 1934, the registrant has duly caused this report to be signed on its behalf by the undersigned, thereunto duly authorized.
| | SEABRIGHT HOLDINGS, INC. | |
| | | | |
| | By: | /s/ John G. Pasqualetto | |
| | | John G. Pasqualetto, Chairman, President and Chief Executive Officer | |
| | | | |
Pursuant to the requirements of the Securities Exchange Act of 1934, this report has been signed below by the following persons on behalf of the registrant and in the capacities indicated below on March 5, 2012.
Signature | | Title | |
| | | | |
/s/ John G. Pasqualetto
John G. Pasqualetto | | Chairman, President and Chief Executive Officer (Principal Executive Officer) | |
| | | | |
/s/ Neal A. Fuller
Neal A. Fuller | | Senior Vice President and Chief Financial Officer and Assistant Secretary (Principal Financial Officer) | |
| | | | |
/s/ M. Philip Romney
M. Philip Romney | | Vice President — Finance and Assistant Secretary (Principal Accounting Officer) | |
| | | | |
/s/ Joseph A. Edwards
Joseph A. Edwards | | Director | |
| | | | |
/s/ William M. Feldman
William M. Feldman | | Director | |
| | | | |
/s/ Mural R. Josephson
Mural R. Josephson | | Director | |
| | | | |
/s/ George M. Morvis
George M. Morvis | | Director | |
| | | | |
/s/ Clifford Press
Clifford Press | | Director | |
| | | | |
/s/ Michael D. Rice
Michael D. Rice | | Director | |
REPORT OF INDEPENDENT REGISTERED PUBLIC ACCOUNTING FIRM
The Board of Directors and Stockholders
SeaBright Holdings, Inc.:
Under date of March 5, 2012, we reported on the consolidated balance sheets of SeaBright Holdings, Inc. and subsidiaries as of December 31, 2011 and 2010, and the related consolidated statements of operations and comprehensive income (loss), changes in stockholders’ equity, and cash flows for each of the years in the three-year period ended December 31, 2011, as contained in this annual report on Form 10-K for the year 2011. In connection with our audits of the aforementioned consolidated financial statements, we also audited the related consolidated financial statement schedules as listed in the accompanying index. These financial statement schedules are the responsibility of the Company’s management. Our responsibility is to express an opinion on these financial statement schedules based on our audits.
In our opinion, such financial statement schedules, when considered in relation to the basic consolidated financial statements taken as a whole, present fairly, in all material respects, the information set forth therein.
/s/ KPMG LLP
Seattle, Washington
March 5, 2012
SCHEDULE II — CONDENSED FINANCIAL INFORMATION OF REGISTRANT
SEABRIGHT HOLDINGS, INC.
CONDENSED BALANCE SHEETS
| | | December 31, | |
| | | 2011 | | | 2010 | |
| | | (In thousands, except share and per share information) | |
| ASSETS | |
Cash and cash equivalents | | $ | 7,437 | | | $ | 10,827 | |
Federal income tax recoverable | | | 12,335 | | | | 11,479 | |
Other assets | | | 9,333 | | | | 7,885 | |
Investment in subsidiaries | | | 337,298 | | | | 329,753 | |
Total assets | | $ | 366,403 | | | $ | 359,944 | |
| | |
| LIABILITIES AND STOCKHOLDERS’ EQUITY | |
| Liabilities: | | | | | | | | |
Accrued expenses and other liabilities | | $ | 12,892 | | | $ | 8,927 | |
Total liabilities | | | 12,892 | | | | 8,927 | |
| | | | | | | | | |
| Commitments and contingencies | | | | | | | | |
| | | | | | | | | |
| Stockholders’ equity: | | | | | | | | |
| Common stock, $0.01 par value; 75,000,000 authorized; issued and outstanding — 22,327,749 shares at December 31, 2011 and 22,025,450 shares at December 31, 2010 | | | 223 | | | | 220 | |
Paid-in capital | | | 213,746 | | | | 209,941 | |
Accumulated other comprehensive income | | | 23,269 | | | | 5,591 | |
Retained earnings | | | 116,273 | | | | 135,265 | |
Total stockholders’ equity | | | 353,511 | | | | 351,017 | |
Total liabilities and stockholders’ equity | | $ | 366,403 | | | $ | 359,944 | |
See report of independent registered public accounting firm.
SEABRIGHT HOLDINGS, INC.
CONDENSED STATEMENTS OF OPERATIONS
AND COMPREHENSIVE INCOME (LOSS)
| | | Year Ended December 31, | |
| | | 2011 | | | 2010 | | | 2009 | |
| | | (In thousands, except share and earnings per share information) | |
| Revenue: | | | | | | | | | |
Income (loss) from subsidiaries | | $ | (10,131 | ) | | $ | 4,033 | | | $ | 17,451 | |
Net investment income | | | 131 | | | | 150 | | | | 205 | |
| | | | (10,000 | ) | | | 4,183 | | | | 17,656 | |
Losses and expenses | | | 5,805 | | | | 7,657 | | | | 5,594 | |
Income (loss) before income taxes | | | (15,805 | ) | | | (3,474 | ) | | | 12,062 | |
| Income tax benefit: | | | | | | | | | | | | |
Current | | | 532 | | | | (1,192 | ) | | | (1,173 | ) |
Deferred | | | (1,811 | ) | | | (699 | ) | | | (300 | ) |
| | | | (1,279 | ) | | | (1,891 | ) | | | (1,473 | ) |
Net income (loss) | | | (14,526 | ) | | | (1,583 | ) | | | 13,535 | |
| | | | | | | | | | | | | |
Other comprehensive income (loss): | | | | | | | | | | | | |
| Increase in net unrealized gains on investment | | | | | | | | | | | | |
securities available for sale | | | 28,319 | | | | 4,227 | | | | 22,527 | |
| Less: Reclassification adjustment for net realized | | | | | | | | | | | | |
losses (gains) recorded into net income | | | (1,051 | ) | | | (15,425 | ) | | | 429 | |
| Income tax benefit (expense) related to items of | | | | | | | | | | | | |
other comprehensive income (loss) | | | (9,590 | ) | | | 3,862 | | | | (6,020 | ) |
Other comprehensive income (loss) | | | 17,678 | | | | (7,336 | ) | | | 16,936 | |
Comprehensive income (loss) | | $ | 3,152 | | | $ | (8,919 | ) | | $ | 30,471 | |
| | | | | | | | | | | | | |
Basic earnings per share | | $ | (0.69 | ) | | $ | (0.08 | ) | | $ | 0.65 | |
Diluted earnings per share | | $ | (0.69 | ) | | $ | (0.08 | ) | | $ | 0.63 | |
| | | | | | | | | | | | | |
| Weighted average basic shares outstanding | | | 21,118,711 | | | | 20,867,720 | | | | 20,702,572 | |
| Weighted average diluted shares outstanding | | | 21,118,711 | | | | 20,867,720 | | | | 21,515,153 | |
See report of independent registered public accounting firm.
SEABRIGHT HOLDINGS, INC.
CONDENSED STATEMENTS OF CHANGES IN STOCKHOLDERS’ EQUITY
| | Outstanding Common Shares | | | Common Stock | | | Paid-in Capital | | | Accumulated Other Comprehensive Income (Loss) | | | Retained Earnings | | | Total Stockholders’ Equity | |
| | | | | | | | | | | | | | | | | | | |
Balance at December 31, 2008 | | | 21,393 | | | $ | 214 | | | $ | 200,893 | | | $ | (4,009 | ) | | $ | 127,715 | | | $ | 324,813 | |
Net income | | | — | | | | — | | | | — | | | | — | | | | 13,535 | | | | 13,535 | |
Other comprehensive income | | | — | | | | — | | | | — | | | | 16,936 | | | | — | | | | 16,936 | |
Stock based compensation, net of taxes of $192 | | | — | | | | — | | | | 4,611 | | | | — | | | | — | | | | 4,611 | |
Restricted stock grants | | | 320 | | | | 4 | | | | — | | | | — | | | | — | | | | 4 | |
Exercise of stock options | | | 7 | | | | — | | | | 47 | | | | — | | | | — | | | | 47 | |
| Minimum tax withholdings on restricted stock vestings | | | (44 | ) | | | (1 | ) | | | (472 | ) | | | — | | | | — | | | | (473 | ) |
Balance at December 31, 2009 | | | 21,676 | | | | 217 | | | | 205,079 | | | | 12,927 | | | | 141,250 | | | | 359,473 | |
Net loss | | | — | | | | — | | | | — | | | | — | | | | (1,583 | ) | | | (1,583 | ) |
Other comprehensive loss | | | — | | | | — | | | | — | | | | (7,336 | ) | | | — | | | | (7,336 | ) |
Dividends declared | | | — | | | | — | | | | — | | | | — | | | | (4,402 | ) | | | (4,402 | ) |
Stock based compensation | | | — | | | | — | | | | 5,424 | | | | — | | | | — | | | | 5,424 | |
Restricted stock grants | | | 400 | | | | 3 | | | | — | | | | — | | | | — | | | | 3 | |
Exercise of stock options | | | 4 | | | | | | | | 26 | | | | — | | | | — | | | | 26 | |
| Minimum tax withholdings on restricted stock vestings | | | (55 | ) | | | — | | | | (588 | ) | | | — | | | | — | | | | (588 | ) |
Balance at December 31, 2010 | | | 22,025 | | | | 220 | | | | 209,941 | | | | 5,591 | | | | 135,265 | | | | 351,017 | |
Net loss | | | — | | | | — | | | | — | | | | — | | | | (14,526 | ) | | | (14,526 | ) |
Other comprehensive income | | | — | | | | — | | | | — | | | | 17,678 | | | | — | | | | 17,678 | |
Dividends declared | | | — | | | | — | | | | — | | | | — | | | | (4,466 | ) | | | (4,466 | ) |
Stock based compensation | | | — | | | | — | | | | 4,701 | | | | — | | | | — | | | | 4,701 | |
Restricted stock grants | | | 438 | | | | 4 | | | | 1 | | | | — | | | | — | | | | 5 | |
Exercise of stock options | | | — | | | | — | | | | — | | | | — | | | | — | | | | — | |
| Minimum tax withholdings on restricted stock vestings | | | (135 | ) | | | (1 | ) | | | (897 | ) | | | — | | | | — | | | | (898 | ) |
Balance at December 31, 2011 | | | 22,328 | | | $ | 223 | | | $ | 213,746 | | | $ | 23,269 | | | $ | 116,273 | | | $ | 353,511 | |
See report of independent registered public accounting firm.
SEABRIGHT HOLDINGS, INC.
CONDENSED STATEMENTS OF CASH FLOWS
| | | Year Ended December 31, | |
| | | 2011 | | | 2010 | | | 2009 | |
| | | (In thousands) | |
| Cash flows from operating activities: | | | | | | | | | |
Net income (loss) | | $ | (14,526 | ) | | $ | (1,583 | ) | | $ | 13,535 | |
| Adjustment to reconcile net income (loss) to net cash used in operating activities: | | | | | | | | | | | | |
Equity in earnings (loss) of subsidiaries | | | 10,131 | | | | (4,033 | ) | | | (17,451 | ) |
Benefit for deferred income taxes | | | (1,811 | ) | | | (699 | ) | | | (300 | ) |
Amortization of intangible assets | | | 1 | | | | 1 | | | | — | |
Compensation cost on stock options | | | 665 | | | | 892 | | | | 686 | |
| Compensation cost for restricted shares of common stock | | | 4,036 | | | | 4,532 | | | | 4,117 | |
Goodwill impairment | | | — | | | | 1,527 | | | | — | |
Changes in certain assets and liabilities: | | | | | | | | | | | | |
Receivable from subsidiaries | | | 368 | | | | 389 | | | | (165 | ) |
Federal income tax recoverable | | | (856 | ) | | | (7,037 | ) | | | (2,962 | ) |
Other assets and liabilities | | | 3,947 | | | | 5,822 | | | | 1,945 | |
Net cash provided by (used in) operating activities | | | 1,955 | | | | (189 | ) | | | (595 | ) |
| | | | | | | | | | | | | |
| Cash flows from investing activities: | | | | | | | | | | | | |
Dividends from subsidiaries | | | — | | | | 5,758 | | | | — | |
Net cash provided by investing activities | | | — | | | | 5,758 | | | | — | |
| | | | | | | | | | | | | |
| Cash flows from financing activities: | | | | | | | | | | | | |
Proceeds from exercise of stock options | | | — | | | | 26 | | | | 47 | |
Minimum tax withholdings on restricted stock vestings | | | (898 | ) | | | (588 | ) | | | (473 | ) |
Stockholder dividends paid | | | (4,451 | ) | | | (3,300 | ) | | | — | |
Grant of restricted stock | | | 5 | | | | 4 | | | | 4 | |
Net cash used in financing activities | | | (5,344 | ) | | | (3,858 | ) | | | (422 | ) |
Net increase (decrease) in cash and cash equivalents | | | (3,389 | ) | | | 1,711 | | | | (1,017 | ) |
Cash and cash equivalents at beginning of period | | | 10,827 | | | | 9,116 | | | | 10,133 | |
Cash and cash equivalents at end of period | | $ | 7,438 | | | $ | 10,827 | | | $ | 9,116 | |
See report of independent registered public accounting firm.
SCHEDULE IV – REINSURANCE
SEABRIGHT HOLDINGS, INC.
| | Direct | | | Ceded to Other Companies | | | Assumed from Other Companies | | | Net | | | Percent of Amount Assumed to Net | |
| | | (In thousands) | |
| Year ended December 31, 2011: | | | | | | | | | | | | | | | |
Premiums Earned | | $ | 281,539 | | | $ | 36,329 | | | $ | 4,341 | | | $ | 249,551 | | | | 1.7 | % |
| Year ended December 31, 2010: | | | | | | | | | | | | | | | | | | | | |
Premiums Earned | | | 277,033 | | | | 26,983 | | | | 4,276 | | | | 254,326 | | | | 1.7 | % |
| Year ended December 31, 2009: | | | | | | | | | | | | | | | | | | | | |
Premiums Earned | | | 263,486 | | | | 22,685 | | | | 3,626 | | | | 244,427 | | | | 1.5 | % |
See report of independent registered public accounting firm.
SCHEDULE VI — SUPPLEMENTAL INFORMATION CONCERNING INSURANCE OPERATIONS
SEABRIGHT HOLDINGS, INC.
| | | | | | | | | | | | | | | | | | Loss and Loss | | | | | | | | | | |
| | | | | | Unpaid | | | | | | | | | | | | Adjustment | | | Amortization | | | | | | | |
| | | Deferred | | | Loss and | | | | | | | | | | | | Expenses Incurred | | | of Deferred | | | Paid Loss | | | | |
| | | Policy | | | Loss | | | Net | | | Net | | | Net | | | Related to | | | Policy | | | and Loss | | | Gross | |
| | | Acquisition | | | Adjustment | | | Unearned | | | Earned | | | Investment | | | Current | | | Prior | | | Acquisition | | | Adjustment | | | Premiums | |
| | | Costs, Net | | | Expense | | | Premium(1) | | | Premium | | | Income | | | Year | | | Years | | | Costs | | | Expenses | | | Written | |
| | | (In thousands) | |
| Year ended December 31, 2011 | | $ | 21,834 | | | $ | 518,044 | | | $ | 125,876 | | | $ | 249,551 | | | $ | 21,041 | | | $ | 187,549 | | | $ | 30,864 | | | $ | 52,200 | | | $ | 178,800 | | | $ | 261,392 | |
| Year ended December 31, 2010 | | | 25,574 | | | | 440,919 | | | | 151,498 | | | | 254,326 | | | | 23,466 | | | | 191,034 | | | | 32,016 | | | | 48,633 | | | | 156,246 | | | | 264,323 | |
| Year ended December 31, 2009 | | | 25,537 | | | | 351,890 | | | | 169,006 | | | | 244,427 | | | | 23,132 | | | | 174,566 | | | | (242 | ) | | | 44,653 | | | | 129,141 | | | | 290,002 | |
____________
| (1) | Net unearned premium represents unearned premiums minus prepaid reinsurance. |
See report of independent registered public accounting firm.
EXHIBIT INDEX
The list of exhibits in the Exhibit Index to this annual report is incorporated herein by reference.
Exhibit Number | Description |
| 3.1 | | Amended and Restated Certificate of Incorporation of SeaBright Insurance Holdings, Inc. (incorporated by reference to the Company’s Form S-8 Registration Statement (File No. 333-123319), filed March 15, 2005) |
| 3.2 | | Amendment to the Company’s Amended and Restated Certificate of Incorporation (incorporated by reference to the Company’s Current Report on Form 8-K (File No. 001-34204), filed May 24, 2010) |
| 3.3 | | Amended and Restated By-laws of SeaBright Insurance Holdings, Inc. (incorporated by reference to the Company’s Current Report on Form 8-K (File No. 001-34204), filed December 30, 2010) |
| 4.1 | | Specimen Common Stock Certificate (incorporated by reference to Amendment No. 2 to the Company’s Registration Statement on Form S-1 (File No. 333-119111), filed November 22, 2004) |
| 4.2 | | Indenture dated as of May 26, 2004 by and between SeaBright Insurance Company and Wilmington Trust Company (incorporated by reference to the Company’s Registration Statement on Form S-1 (File No. 333-119111), filed September 17, 2004) |
| 10.1† | | Employment Agreement, dated as of September 30, 2003, by and between SeaBright Insurance Company and John G. Pasqualetto (incorporated by reference to Amendment No. 1 to the Company’s Registration Statement on Form S-1 (File No. 333-119111), filed November 1, 2004) |
| 10.2† | | Employment Agreement, dated as of September 30, 2003, by and between SeaBright Insurance Company and Richard J. Gergasko (incorporated by reference to the Company’s Registration Statement on Form S-1 (File No. 333-119111), filed September 17, 2004) |
| 10.3† | | Employment Agreement, dated as of September 30, 2003, by and between SeaBright Insurance Company and Richard W. Seelinger (incorporated by reference to the Company’s Registration Statement on Form S-1 (File No. 333-119111), filed September 17, 2004) |
| 10.4† | | Employment Agreement, dated as of September 30, 2003, by and between SeaBright Insurance Company and Jeffrey C. Wanamaker (incorporated by reference to the Company’s Registration Statement on Form S-1 (File No. 333-119111), filed September 17, 2004) |
| 10.5† | | Employment Agreement, dated as of March 31, 2005, by and between SeaBright Insurance Company and Debra Drue Wax (incorporated by reference to the Company’s Current Report on Form 8-K, filed April 5, 2005) |
| 10.6 | | Purchase Agreement, dated as of July 14, 2003, by and among Insurance Holdings, Inc., Kemper Employers Group, Inc., Lumbermens Mutual Casualty Company and Pacific Eagle Insurance Company (incorporated by reference to the Company’s Registration Statement on Form S-1 (File No. 333-119111), filed September 17, 2004) |
| 10.7 | | Amendment Letter to Purchase Agreement, dated as of July 30, 2003, by and among Insurance Holdings, Inc., Kemper Employers Group, Inc., Lumbermens Mutual Casualty Company, Eagle Pacific Insurance Company and Pacific Eagle Insurance Company (incorporated by reference to the Company’s Registration Statement on Form S-1 (File No. 333-119111), filed September 17, 2004) |
| 10.8 | | Amendment Letter to Purchase Agreement, dated as of September 15, 2003, by and among SeaBright Insurance Holdings, Inc., Kemper Employers Group, Inc., Lumbermens Mutual Casualty Company, Eagle Pacific Insurance Company and Pacific Eagle Insurance Company (incorporated by reference to the Company’s Registration Statement on Form S-1 (File No. 333-119111), filed September 17, 2004) |
| 10.9 | | Escrow Agreement, dated as of September 30, 2003, by and among Wells Fargo Bank Minnesota, National Association, SeaBright Insurance Holdings, Inc. and Kemper Employers Group, Inc. (incorporated by reference to the Company’s Registration Statement on Form S-1 (File No. 333-119111), filed September 17, 2004) |
| 10.10 | | Adverse Development Excess of Loss Reinsurance Agreement, dated as of September 30, 2004, between Lumbermens Mutual Casualty Company and Kemper Employers Insurance Company (incorporated by reference to the Company’s Registration Statement on Form S-1 (File No. 333-119111), filed September 17, 2004) |
| 10.11 | | Amended and Restated Reinsurance Trust Agreement, dated as of February 29, 2004, by and among Lumbermens Mutual Casualty Company and SeaBright Insurance Company (incorporated by reference to Amendment No. 1 to the Company’s Registration Statement on Form S-1 (File No. 333-119111), filed November 1, 2004) |
| 10.12 | | Commutation Agreement, dated as of September 30, 2003, by and between Kemper Employers Insurance Company and Lumbermens Mutual Casualty Company (incorporated by reference to the Company’s Registration Statement on Form S-1 (File No. 333-119111), filed September 17, 2004) |
| 10.13 | | Administrative Services Agreement, dated as of September 30, 2003, by and among Kemper Employers Insurance Company, Eagle Pacific Insurance Company and Pacific Eagle Insurance Company (incorporated by reference to the Company’s Registration Statement on Form S-1 (File No. 333-119111), filed September 17, 2004) |
| 10.14 | | Administrative Services Agreement, dated as of September 30, 2003, by and among Kemper Employers Insurance Company and Lumbermens Mutual Casualty Company (incorporated by reference to the Company’s Registration Statement on Form S-1 (File No. 333-119111), filed September 17, 2004) |
| 10.15 | | Claims Administration Services Agreement, dated as of September 30, 2003, by and among Kemper Employers Insurance Company, Eagle Pacific Insurance Company and Pacific Eagle Insurance Company (incorporated by reference to the Company’s Registration Statement on Form S-1 (File No. 333-119111), filed September 17, 2004) |
| 10.16 | | Side Letter, dated as of September 29, 2003, by and among SeaBright Insurance Holdings, Inc., Kemper Employers Group, Inc., Lumbermens Mutual Casualty Company, Eagle Pacific Insurance Company and Pacific Eagle Insurance Company (incorporated by reference to the Company’s Registration Statement on Form S-1 (File No. 333-119111), filed September 17, 2004) |
| 10.17† | | Amendment to Employment Agreement by and between SeaBright Insurance Company and John G. Pasqualetto (incorporated by reference to Amendment No. 2 to the Company’s Registration Statement on Form S-1 (File No. 333-119111), filed November 22, 2004) |
| 10.18 | | Executive Stock Agreement, dated as of September 30, 2003, by and between SeaBright Insurance Holdings, Inc. and John Pasqualetto (incorporated by reference to the Company’s Registration Statement on Form S-1 (File No. 333-119111), filed September 17, 2004) |
| 10.19 | | Executive Stock Agreement, dated as of September 30, 2003, by and between SeaBright Insurance Holdings, Inc. and Richard J. Gergasko (incorporated by reference to the Company’s Registration Statement on Form S-1 (File No. 333-119111), filed September 17, 2004) |
| 10.20 | | Executive Stock Agreement, dated as of September 30, 2003, by and between SeaBright Insurance Holdings, Inc. and Richard Seelinger (incorporated by reference to the Company’s Registration Statement on Form S-1 (File No. 333-119111), filed September 17, 2004) |
| 10.21 | | Executive Stock Agreement, dated as of September 30, 2003, by and between SeaBright Insurance Holdings, Inc. and Jeffrey C. Wanamaker (incorporated by reference to the Company’s Registration Statement on Form S-1 (File No. 333-119111), filed September 17, 2004) |
| 10.22 | | Stock Purchase Agreement, dated as of June 30, 2004, by and between SeaBright Insurance Holdings, Inc. and each of the purchasers named therein (incorporated by reference to the Company’s Registration Statement on Form S-1 (File No. 333-119111), filed September 17, 2004) |
| 10.23† | | Form of Incentive Stock Option Agreement (incorporated by reference to the Company’s Registration Statement on Form S-1 (File No. 333-119111), filed September 17, 2004) |
| 10.24 | | Tax and Expense Sharing Agreement, dated as of March 12, 2004, by and among SeaBright Insurance Holdings, Inc., SeaBright Insurance Company and PointSure Insurance Services, Inc. (incorporated by reference to Amendment No. 1 to the Company’s Registration Statement on Form S-1 (File No. 333-119111), filed November 1, 2004) |
| 10.25 | | Agency Services Agreement, effective as of October 1, 2003, by and between SeaBright Insurance Company and PointSure Insurance Services, Inc. (incorporated by reference to Amendment No. 1 to the Company’s Registration Statement on Form S-1 (File No. 333-119111), filed November 1, 2004) |
| 10.26 | | Floating Rate Surplus Note, dated May 26, 2004, from SeaBright Insurance Company to Wilmington Trust Company, as trustee, for $12,000,000 (incorporated by reference to the Company’s Registration Statement on Form S-1 (File No. 333-119111), filed September 17, 2004) |
| 10.27 | | Side Letter, dated as of September 28, 2004, by and among SeaBright Insurance Holdings, Inc., SeaBright Insurance Company and Lumbermens Mutual Casualty Company (incorporated by reference to Amendment No. 1 to the Company’s Registration Statement on Form S-1 (File No. 333-119111), filed November 1, 2004) |
| 10.28† | | Form of Stock Option Award Agreement for awards granted under 2005 Long-Term Equity Incentive Plan (incorporated by reference to Amendment No. 4 to the Company’s Registration Statement on Form S-1 (File No. 333-119111), filed January 3, 2005) |
| 10.29† | | Form of Restricted Stock Grant Agreement for grants to directors under the 2005 Long-Term Equity Incentive Plan (incorporated by reference to the Company’s Annual Report on Form 10-K, filed March 28, 2005) |
| 10.30† | | Form of Restricted Stock Grant Agreement for grants to officers under the 2005 Long-Term Equity Incentive Plan (incorporated by reference to the Company’s Annual Report on Form 10-K (File No. 000-51124), filed March 29, 2006) |
| 10.31† | | Employment Agreement, dated as of August 15, 2006, by and between SeaBright Insurance Company and Marc B. Miller, M.D. (incorporated by reference to the Company’s Current Report on Form 8-K (File No. 000-51124), filed August 17, 2006) |
| 10.32† | | Second Amended and Restated 2003 Stock Option Plan (incorporated by reference to the Company’s Current Report on Form 8-K (File No. 000-51124), filed April 3, 2007) |
| 10.33† | | Amended and Restated 2005 Long-Term Equity Incentive Plan (incorporated by reference to Exhibit 10.1 of the Company’s Current Report on Form 8-K (File No. 001-34204), filed May 24, 2010) |
| 10.34† | | Employment Agreement with M. Philip Romney, dated November 3, 2009 (incorporated by reference to Exhibit 10.1 of the Company’s Current Report on Form 8-K (File No. 001-34204), filed November 6, 2009) |
| 10.35† | | Revised Offer Letter to Mr. Scott H. Maw (incorporated by reference to Exhibit 10.1 of the Company’s Current Report on Form 8-K (File No. 001-34204), filed February 9, 2010) |
| 10.36† | | SeaBright Holdings, Inc. 2010 Bonus Plan (incorporated by reference to Exhibit 10.2 of the Company’s Current Report on Form 8-K (File No. 001-34204), filed May 24, 2010) |
| 10.37† | | Amended Employment Agreement with Scott H. Maw, dated February 3, 2011 (incorporated by reference to Exhibit 10.1 of the Company’s Current Report on Form 8-K (File No. 001-34204), filed on February 9, 2011) |
| 10.38† | | SeaBright Holdings, Inc. 2011 Bonus Plan for Section 16 Officers and Key Employees (incorporated by reference to the Company’s current report on Form 8-K (file no. 001-34204) filed on March 23, 2011) |
| 10.39† | | Employment offer letter, dated as of August 25, 2011, between SeaBright Insurance Company and Neal A. Fuller (incorporated by reference to the Company’s current report on Form 8-K (file no. 001-34204), filed on September 13, 2011) |
| 10.40† | | Amendment, dated as of August 3, 2011, to Section 3(e) of the Amended Employment Agreement between Scott H. Maw and SeaBright Insurance Company (incorporated by reference to the Company’s current report on Form 8-K (file no. 001-34204), filed on August 5, 2011) |
| 10.41 | | Agreement, dated as of December 23, 2011, among SeaBright Holdings, Inc., Oliver Press Partners, LLC and certain of its affiliates party thereto (incorporated by reference to the Company’s current report on Form 8-K (file no. 001-34204), filed on December 28, 2011) |
| 10.42† | | SeaBright Holdings, Inc. 2012 Bonus Plan (incorporated by reference to the Company’s current report on Form 8-K (file no. 001-34204), filed on February 23, 2012) |
| 10.43*† | | Second amendment to Employment Agreement by and between SeaBright Insurance Company and John G. Pasqualetto, dated February 21, 2012 |
| 10.44*† | | Amendment to Employment Agreement by and between SeaBright Insurance Company and Richard J. Gergasko, dated February 21, 2012 |
| 10.45*† | | Amendment to Employment Offer Letter Agreement by and between SeaBright Insurance Company and Neal A. Fuller, dated February 21, 2012 |
| 10.46*† | | Amendment to Employment Agreement by and between SeaBright Insurance Company and Richard W. Seelinger, dated February 28, 2012 |
| 10.47*† | | Amendment to Employment Agreement by and between SeaBright Insurance Company and Jeffrey C. Wanamaker, dated February 27, 2012 |
| 10.48*† | | Amendment to Employment Agreement by and between SeaBright Insurance Company and D. Drue Wax, dated February 21, 2012 |
| 10.49*† | | Amendment to Employment Agreement by and between SeaBright Insurance Company and Marc B. Miller, M.D., dated August 13, 2007 |
| 10.50*† | | Second amendment to Employment Agreement by and between SeaBright Insurance Company and Marc B. Miller, M.D., dated February 23, 2012 |
| 21.1* | | Subsidiaries of the registrant |
| 23.1* | | Consent of KPMG LLP |
| 31.1* | | Rule 13a-14(a)/15d-14(a) Certification (Chief Executive Officer) |
| 31.2* | | Rule 13a-14(a)/15d-14(a) Certification (Chief Financial Officer) |
| 32.1* | | Section 1350 Certification (Chief Executive Officer) |
| 32.2* | | Section 1350 Certification (Chief Financial Officer) |
| 101 | | Interactive Data Files |
____________
| * | Filed herewith. |
| | |
| † | Indicates a management contract, compensatory plan, contract or arrangement required to be filed pursuant to Item 601 of Regulation S-K. |
121