Exhibit 99.2

Assurant, Inc. (AIZ)
REVISED Financial Supplement as of December 31, 2018
Note: Starting first quarter 2019, Assurant will be revising its key metrics to align with the financial objectives announced at Investor Day in March 2019.
This revised financial supplement as of December 31, 2018 provides historical data for new or revised metrics prior to publication of Assurant’s first quarter 2019 results. New or revised metrics are shaded throughout.
ASSURANT, INC.
FINANCIAL SUPPLEMENT
(UNAUDITED)
AS OF DECEMBER 31, 2018
INDEX TO FINANCIAL SUPPLEMENT | ||||
| Page: | ||||
SUMMARY FINANCIAL HIGHLIGHTS | 1 | |||
RECONCILIATION OF NET OPERATING INCOME TO NET INCOME ATTRIBUTABLE TO COMMON STOCKHOLDERS | 3 | |||
CONDENSED STATEMENTS OF OPERATIONS AND SELECTED DATA | 4 | |||
SEGMENT CONDENSED BALANCE SHEETS | 11 | |||
INVESTMENTS | 12 | |||
INVESTMENT RESULTS BY ASSET CATEGORY AND ANNUALIZED YIELDS | 14 | |||
SUMMARY OF NET OPERATING INCOME DISCLOSED ITEMS | 15 | |||
RATINGS SUMMARY | 16 | |||
REGULATION G – NON GAAP FINANCIAL MEASURES | 17 | |||
| CONTACT INFORMATION | ||||
| Corporate Headquarters Address: | Investor Inquiries: | |||
| 28 Liberty Street, 41st Floor | Suzanne Shepherd | Sean Moshier | ||
| New York, NY 10005 | Senior Vice President | Director | ||
| 212-859-7000 | Investor Relations | Investor Relations | ||
| 212-859-7062 | 212-859-5831 | |||
| Website Address: | suzanne.shepherd@assurant.com | sean.moshier@assurant.com | ||
| www.assurant.com | ||||
Assurant, Inc. (NYSE: AIZ) is a global provider of risk management solutions, protecting where consumers live and the goods they buy. A Fortune 500 company, Assurant focuses on the housing and lifestyle markets, and is among the market leaders in mobile device protection and related services; extended service contracts; vehicle protection products;pre-funded funeral insurance; renters insurance; and lender-placed homeowners insurance. With approximately $41 billion in assets as of December 31, 2018 and over $7 billion in 2018 revenue, Assurant has a market presence in 21 countries, while its Assurant Foundation works to support and improve communities. Learn more at assurant.com or on Twitter @AssurantNews.
Assurant, Inc.
Summary Financial Highlights
(Unaudited)
| 2018 | Twelve Months | 12M18-12M17 | ||||||||||||||||||||||||||
($ in millions, except per share amounts and closing stock price) | 4Q | 3Q | 2Q | 1Q | 2018 | 2017 | % Change | |||||||||||||||||||||
KEY FINANCIAL METRICS | ||||||||||||||||||||||||||||
Segment net earned premiums, fees and other income(1) | $ | 2,171.4 | $ | 2,111.2 | $ | 1,691.6 | $ | 1,487.8 | $ | 7,462.0 | $ | 5,752.2 | 29.7 | % | ||||||||||||||
Total segment revenues(1) | $ | 2,339.2 | $ | 2,253.1 | $ | 1,812.0 | $ | 1,605.9 | $ | 8,010.2 | $ | 6,204.4 | 29.1 | % | ||||||||||||||
Net income attributable to common stockholders | $ | 20.3 | $ | 48.3 | $ | 62.2 | $ | 106.0 | $ | 236.8 | $ | 519.6 | (54.4 | )% | ||||||||||||||
Net operating income(2) | $ | 48.9 | $ | 67.4 | $ | 121.9 | $ | 107.2 | $ | 345.4 | $ | 220.0 | 57.0 | % | ||||||||||||||
Net operating income, excluding reportable catastrophes(2)(3) | $ | 144.5 | $ | 135.1 | $ | 120.9 | $ | 114.6 | $ | 515.1 | $ | 412.5 | 24.9 | % | ||||||||||||||
Per share(4): | ||||||||||||||||||||||||||||
Net income attributable to common stockholders, per diluted share | $ | 0.32 | $ | 0.76 | $ | 1.09 | $ | 1.96 | $ | 3.98 | $ | 9.39 | (57.6 | )% | ||||||||||||||
Net operating income per diluted share(2) | $ | 0.77 | $ | 1.06 | $ | 2.13 | $ | 2.00 | $ | 5.80 | $ | 3.98 | 45.7 | % | ||||||||||||||
Net operating income, excluding reportable catastrophes, per diluted share(2)(3) | $ | 2.29 | $ | 2.12 | $ | 2.11 | $ | 2.14 | $ | 8.65 | $ | 7.46 | 16.0 | % | ||||||||||||||
Return on Average Common Stockholders’ Equity (“ROE”)(4): | ||||||||||||||||||||||||||||
Annualized GAAP ROE | 1.7 | % | 3.9 | % | 5.6 | % | 10.0 | % | 5.1 | % | 12.4 | % | (730 | )bps | ||||||||||||||
Annualized operating ROE, excluding accumulated other comprehensive income (AOCI)(2) | 3.9 | % | 5.3 | % | 10.8 | % | 10.5 | % | 7.5 | % | 5.5 | % | 200 | bps | ||||||||||||||
Annualized operating ROE, excluding AOCI and reportable catastrophes(2)(3) | 11.5 | % | 10.6 | % | 10.7 | % | 11.2 | % | 11.2 | % | 10.4 | % | 80 | bps | ||||||||||||||
Debt to total capital ratio | 28.2 | % | 27.8 | % | 27.4 | % | 30.9 | % | 28.2 | % | 20.0 | % | 820 | bps | ||||||||||||||
Debt to total capital ratio, excluding AOCI(2) | 27.6 | % | 27.4 | % | 26.9 | % | 31.1 | % | 27.6 | % | 20.9 | % | 670 | bps | ||||||||||||||
Dividends from subsidiaries, net of capital infusions | $ | 122.0 | $ | 139.0 | $ | 296.0 | $ | 182.0 | $ | 739.0 | $ | 374.0 | 97.6 | % | ||||||||||||||
Share repurchases: | ||||||||||||||||||||||||||||
Shares repurchased | 486,073 | 783,610 | — | — | 1,269,683 | 3,933,209 | (67.7 | )% | ||||||||||||||||||||
Average repurchase price per share | $ | 101.16 | $ | 106.13 | $ | — | $ | — | $ | 104.23 | $ | 99.04 | 5.2 | % | ||||||||||||||
Total cost of share repurchase(5) | $ | 49.1 | $ | 83.2 | $ | — | $ | — | $ | 132.3 | $ | 389.5 | (66.0 | )% | ||||||||||||||
Common stock dividends: | ||||||||||||||||||||||||||||
Dividend per share | $ | 0.60 | $ | 0.56 | $ | 0.56 | $ | 0.56 | $ | 2.28 | $ | 2.15 | 6.0 | % | ||||||||||||||
Total paid | $ | 37.7 | $ | 35.5 | $ | 30.9 | $ | 29.7 | $ | 133.8 | $ | 119.0 | 12.4 | % | ||||||||||||||
Yield(6) | 2.68 | % | 2.08 | % | 2.16 | % | 2.45 | % | 2.55 | % | 2.13 | % | 42 | bps | ||||||||||||||
AIZ closing stock price (NYSE) | $ | 89.44 | $ | 107.95 | $ | 103.49 | $ | 91.41 | $ | 89.44 | $ | 100.84 | (11.3 | )% | ||||||||||||||
| (1) | Includes Global Housing, Global Lifestyle and Global Preneed. |
| (2) | Refer to the Footnotes in Regulation G - Non GAAP Financial Measures for reconciliations ofnon-GAAP measures to the most comparable GAAP measure. |
| (3) | Represents reportable catastrophe losses net of reinsurance and client profit sharing adjustments and including reinstatement and other premiums. Reportable catastrophes include individual Insurance Services Office (“ISO”) events greater than $5 million(pre-tax). |
| (4) | Refer to page 2 for additional information on the shares used in the per share calculations and the average common stockholders’ equity used in the ROE calculations. |
| (5) | As of December 31, 2018, there was $761.2 million remaining under the total repurchase authorization. |
| (6) | Common stock dividend yield is calculated by annualizing the quarterly common stock dividend per share and dividing by the quarter’s closing stock price. |
Assurant, Inc.
Summary Financial Highlights (continued)
(Unaudited)
| 2018 | Twelve Months | 12M18-12M17 | ||||||||||||||||||||||||||
($ in millions, except per share amounts) | 4Q | 3Q | 2Q | 1Q | 2018 | 2017 | % Change | |||||||||||||||||||||
Book value per diluted share | $ | 77.11 | $ | 78.92 | $ | 79.38 | $ | 78.92 | $ | 77.11 | $ | 79.96 | (3.6 | )% | ||||||||||||||
Book value per diluted share, excluding AOCI(1) | $ | 79.45 | $ | 80.40 | $ | 81.44 | $ | 78.01 | $ | 79.45 | $ | 75.58 | 5.1 | % | ||||||||||||||
Shares outstanding for book value per diluted share calculation(2) | 66,295,852 | 66,133,967 | 66,927,254 | 56,888,191 | 66,295,852 | 53,411,540 | 24.1 | % | ||||||||||||||||||||
SHARE DATA: | ||||||||||||||||||||||||||||
Weighted average basic common shares outstanding | 62,928,096 | 63,621,184 | 57,060,313 | 53,169,358 | 59,239,608 | 54,986,654 | 7.7 | % | ||||||||||||||||||||
Incremental common shares from: | ||||||||||||||||||||||||||||
Performance share units and employee stock purchase plan | 304,389 | 179,163 | 204,095 | 308,418 | 305,916 | 324,378 | (5.7 | )% | ||||||||||||||||||||
Mandatory convertible preferred stock(3) | — | — | — | 711,722 | — | — | N/A | |||||||||||||||||||||
|
|
|
|
|
|
|
|
|
|
|
| |||||||||||||||||
Weighted average diluted common shares outstanding for net income attributable to common stockholders | 63,232,485 | 63,800,347 | 57,264,408 | 54,189,498 | 59,545,524 | 55,311,032 | 7.7 | % | ||||||||||||||||||||
Less:pre-close dilution from mandatory convertible preferred stock(4) | — | — | — | (711,722 | ) | — | — | N/A | ||||||||||||||||||||
|
|
|
|
|
|
|
|
|
|
|
| |||||||||||||||||
Weighted average diluted common shares outstanding for net operating income | 63,232,485 | 63,800,347 | 57,264,408 | 53,477,776 | 59,545,524 | 55,311,032 | 7.7 | % | ||||||||||||||||||||
|
|
|
|
|
|
|
|
|
|
|
| |||||||||||||||||
Anti-dilutive incremental common shares from mandatory convertible preferred stock(3) | 2,939,400 | 2,715,438 | 3,056,700 | — | 2,357,090 | — | N/A | |||||||||||||||||||||
AVERAGE COMMON STOCKHOLDERS’ EQUITY: | ||||||||||||||||||||||||||||
Total common stockholders’ equity(5) | $ | 4,835.6 | $ | 4,943.0 | $ | 5,036.1 | $ | 4,213.4 | $ | 4,835.6 | $ | 4,270.6 | 13.2 | % | ||||||||||||||
Average common stockholders’ equity, including AOCI(5) | $ | 4,889.3 | $ | 4,989.5 | $ | 4,462.1 | $ | 4,242.0 | $ | 4,634.4 | $ | 4,184.4 | 10.8 | % | ||||||||||||||
Less: Average AOCI | 126.5 | 117.8 | 43.1 | (142.8 | ) | (39.3 | ) | (164.3 | ) | 76.1 | % | |||||||||||||||||
Less: Average Assurant Health runoff operations | — | — | (1.1 | ) | (4.7 | ) | (3.6 | ) | (49.8 | ) | 92.8 | % | ||||||||||||||||
|
|
|
|
|
|
|
|
|
|
|
| |||||||||||||||||
Average common stockholders’ equity, excl. AOCI and Assurant Health runoff | $ | 5,015.8 | $ | 5,107.3 | $ | 4,504.1 | $ | 4,094.5 | $ | 4,591.5 | $ | 3,970.3 | 15.6 | % | ||||||||||||||
|
|
|
|
|
|
|
|
|
|
|
|
|
| |||||||||||||||
| (1) | Refer to the Footnotes in Regulation G—Non GAAP Financial Measures for reconciliations ofnon-GAAP measures to the most comparable GAAP measure. |
| (2) | Includes dilution for the mandatory convertible preferred stock for the periods outstanding, which is calculated based on the assumed conversion of the outstanding mandatory convertible preferred stock. |
| (3) | Dilution for the mandatory convertible preferred stock is calculated based on the assumed conversion of the outstanding mandatory convertible preferred stock, using the average closing stock price for the period the shares were outstanding. Net income attributable to common stockholders per diluted share excludes the effect of shares of potentially dilutive securities which were anti-dilutive for the period and, accordingly, the numerator has not been increased by the amount of the preferred stock dividends. |
| (4) | Thepre-close impact of dilutive securities from the assumed conversion of the outstanding mandatory convertible preferred stock was excluded from the net operating income per diluted share calculation. For 2Q 2018 and Twelve Months 2018, 1,041,293 and 639,211 shares ofpre-close potentially dilutive securities, respectively, were anti-dilutive for the period and not included in the net operating income per diluted share calculation. |
| (5) | Common stockholders’ equity excludes $276.4 million of preferred stock in 2018. In addition, 2Q 2018 and Twelve Months 2018 average common stockholders’ equity reflect the impact of the 10.4 million common shares issued in connection with the TWG acquisition for the period that they were outstanding. |
2
Assurant, Inc.
Reconciliation of Net Operating Income to Net Income Attributable to Common Stockholders(1)
(Unaudited)
| 2018 | Twelve Months | 12M18-12M17 | ||||||||||||||||||||||||||
($ in millions, net of tax) | 4Q | 3Q | 2Q | 1Q | 2018 | 2017 | % Change | |||||||||||||||||||||
Global Housing | $ | (12.4) | $ | 19.4 | $ | 72.6 | $ | 71.2 | $ | 150.8 | $ | 97.4 | 54.8 | % | ||||||||||||||
Global Lifestyle | 97.9 | 75.9 | 68.1 | 55.8 | 297.7 | 178.0 | 67.2 | % | ||||||||||||||||||||
Global Preneed | 16.4 | 16.8 | 14.7 | 9.8 | 57.7 | 39.6 | 45.7 | % | ||||||||||||||||||||
Corporate and other(1) | (27.5 | ) | (19.0 | ) | (17.5 | ) | (20.0 | ) | (84.0 | ) | (62.8 | ) | (33.8 | )% | ||||||||||||||
Interest expense | (20.8 | ) | (21.0 | ) | (14.4 | ) | (9.6 | ) | (65.8 | ) | (32.2 | ) | (104.3 | )% | ||||||||||||||
Preferred stock dividends | (4.7 | ) | (4.7 | ) | (1.6 | ) | — | (11.0 | ) | — | N/A | |||||||||||||||||
|
|
|
|
|
|
|
|
|
|
|
| |||||||||||||||||
Net operating income(1) | 48.9 | 67.4 | 121.9 | 107.2 | 345.4 | 220.0 | 57.0 | % | ||||||||||||||||||||
|
|
|
|
|
|
|
|
|
|
|
| |||||||||||||||||
Adjustments, net of tax: | ||||||||||||||||||||||||||||
Assurant Health runoff operations | 0.2 | 0.2 | 0.2 | 2.0 | 2.6 | 10.6 | (75.5 | )% | ||||||||||||||||||||
Net realized (losses) gains on investments | (36.2 | ) | (4.6 | ) | (9.0 | ) | 0.4 | (49.4 | ) | 19.6 | (352.0 | )% | ||||||||||||||||
Amortization of deferred gains on disposal of businesses | 8.4 | 10.0 | 11.9 | 14.6 | 44.9 | 67.5 | (33.5 | )% | ||||||||||||||||||||
Impact of TCJA at enactment | — | (1.5 | ) | — | — | (1.5 | ) | 177.0 | (100.8 | )% | ||||||||||||||||||
Net TWG acquisition related charges(2) | (5.9 | ) | (8.0 | ) | (32.5 | ) | (20.5 | ) | (66.9 | ) | (8.1 | ) | (725.9 | )% | ||||||||||||||
Change in tax liabilities | — | — | — | — | — | 27.1 | (100.0 | )% | ||||||||||||||||||||
Loss on sale of Mortgage Solutions | 0.5 | 2.0 | (34.4 | ) | — | (31.9 | ) | — | N/A | |||||||||||||||||||
Foreign exchange related (losses) gains | (0.2 | ) | (18.3 | ) | 3.8 | — | (14.7 | ) | — | N/A | ||||||||||||||||||
Other adjustments | 4.6 | 1.1 | 0.3 | 2.3 | 8.3 | 5.9 | 40.7 | % | ||||||||||||||||||||
|
|
|
|
|
|
|
|
|
|
|
| |||||||||||||||||
Net income attributable to common stockholders | $ | 20.3 | $ | 48.3 | $ | 62.2 | $ | 106.0 | $ | 236.8 | $ | 519.6 | (54.4 | )% | ||||||||||||||
|
|
|
|
|
|
|
|
|
|
|
| |||||||||||||||||
|
|
|
|
|
|
|
|
|
|
|
| |||||||||||||||||
Segment net operating income(3) | $ | 101.9 | $ | 112.1 | $ | 155.4 | $ | 136.8 | $ | 506.2 | $ | 315.0 | 60.7 | % | ||||||||||||||
Segment net earned premiums, fees and other income(4) | ||||||||||||||||||||||||||||
Global Housing | $ | 502.0 | $ | 521.6 | $ | 542.5 | $ | 523.1 | $ | 2,089.2 | $ | 2,175.0 | (3.9 | )% | ||||||||||||||
Global Lifestyle | 1,621.1 | 1,541.5 | 1,102.2 | 918.5 | 5,183.3 | 3,396.2 | 52.6 | % | ||||||||||||||||||||
Global Preneed | 48.3 | 48.1 | 46.9 | 46.2 | 189.5 | 181.0 | 4.7 | % | ||||||||||||||||||||
|
|
|
|
|
|
|
|
|
|
|
| |||||||||||||||||
Total | $ | 2,171.4 | $ | 2,111.2 | $ | 1,691.6 | $ | 1,487.8 | $ | 7,462.0 | $ | 5,752.2 | 29.7 | % | ||||||||||||||
|
|
|
|
|
|
|
|
|
|
|
| |||||||||||||||||
Segment net operating margin(5) | 4.7 | % | 5.3 | % | 9.2 | % | 9.2 | % | 6.8 | % | 5.5 | % | 130 | bps | ||||||||||||||
| (1) | Refer to the Footnotes in Regulation G - Non GAAP Financial Measures for reconciliations ofnon-GAAP measures to the most comparable GAAP measure. |
| (2) | Refer to page 10 for additional details about the components of net TWG acquisition related charges. |
| (3) | Includes net operating income (loss) of the Global Housing, Global Lifestyle and Global Preneed operating segments. Segment net operating income (loss) of the Global Housing, Global Lifestyle and Global Preneed operating segments is equal to GAAP segment net income. |
| (4) | Includes net earned premiums, fees and other income of the Global Housing, Global Lifestyle and Global Preneed operating segments. |
| (5) | Equals segment net operating income (loss) divided by segment net earned premiums, fees and other income. |
3
Assurant, Inc.
Consolidated Condensed Statements of Operations
(Unaudited)
| 2018 | Twelve Months | 12M18-12M17 | ||||||||||||||||||||||||||
($ in millions) | 4Q | 3Q | 2Q | 1Q | 2018 | 2017 | % Change | |||||||||||||||||||||
Revenues: | ||||||||||||||||||||||||||||
Net earned premiums | $ | 1,840.1 | $ | 1,853.6 | $ | 1,338.3 | $ | 1,124.9 | $ | 6,156.9 | $ | 4,404.1 | 39.8 | % | ||||||||||||||
Fees and other income | 331.5 | 257.9 | 354.2 | 364.5 | 1,308.1 | 1,383.1 | (5.4 | )% | ||||||||||||||||||||
|
|
|
|
|
|
|
|
|
|
|
| |||||||||||||||||
Total net earned premiums, fees and other income | 2,171.6 | 2,111.5 | 1,692.5 | 1,489.4 | 7,465.0 | 5,787.2 | 29.0 | % | ||||||||||||||||||||
Net investment income | 180.8 | 151.8 | 135.6 | 130.2 | 598.4 | 493.8 | 21.2 | % | ||||||||||||||||||||
Net realized (losses) gains on investments | (46.1 | ) | (5.7 | ) | (11.4 | ) | 0.5 | (62.7 | ) | 30.1 | (308.3 | )% | ||||||||||||||||
Amortization of deferred gains on disposal of businesses | 10.7 | 12.7 | 15.0 | 18.5 | 56.9 | 103.9 | (45.2 | )% | ||||||||||||||||||||
|
|
|
|
|
|
|
|
|
|
|
| |||||||||||||||||
| 2,317.0 | 2,270.3 | 1,831.7 | 1,638.6 | 8,057.6 | 6,415.0 | 25.6 | % | |||||||||||||||||||||
|
|
|
|
|
|
|
|
|
|
|
| |||||||||||||||||
Benefits, losses and expenses: | ||||||||||||||||||||||||||||
Policyholder benefits | 756.5 | 680.9 | 490.6 | 414.6 | 2,342.6 | 1,870.6 | 25.2 | % | ||||||||||||||||||||
Selling, underwriting, general and administrative expenses | 1,491.3 | 1,487.1 | 1,236.8 | 1,066.0 | 5,281.2 | 4,050.4 | 30.4 | % | ||||||||||||||||||||
Interest expense | 26.3 | 26.5 | 26.0 | 21.5 | 100.3 | 49.5 | 102.6 | % | ||||||||||||||||||||
|
|
|
|
|
|
|
|
|
|
|
| |||||||||||||||||
Total benefits, losses and expenses | 2,274.1 | 2,194.5 | 1,753.4 | 1,502.1 | 7,724.1 | 5,970.5 | 29.4 | % | ||||||||||||||||||||
|
|
|
|
|
|
|
|
|
|
|
| |||||||||||||||||
Income before provision (benefit) for income taxes | 42.9 | 75.8 | 78.3 | 136.5 | 333.5 | 444.5 | (25.0 | )% | ||||||||||||||||||||
Provision (benefit) for income taxes | 16.3 | 22.8 | 11.3 | 30.5 | 80.9 | (75.1 | ) | 207.7 | % | |||||||||||||||||||
|
|
|
|
|
|
|
|
|
|
|
| |||||||||||||||||
Net income | 26.6 | 53.0 | 67.0 | 106.0 | 252.6 | 519.6 | (51.4 | )% | ||||||||||||||||||||
Less: Net income attributable tonon-controlling interests | (1.6 | ) | — | — | — | (1.6 | ) | — | N/A | |||||||||||||||||||
|
|
|
|
|
|
|
|
|
|
|
| |||||||||||||||||
Net income attributable to stockholders | 25.0 | 53.0 | 67.0 | 106.0 | 251.0 | 519.6 | (51.7 | )% | ||||||||||||||||||||
Less: Preferred stock dividends | (4.7 | ) | (4.7 | ) | (4.8 | ) | — | (14.2 | ) | — | N/A | |||||||||||||||||
|
|
|
|
|
|
|
|
|
|
|
| |||||||||||||||||
Net income attributable to common stockholders | $ | 20.3 | $ | 48.3 | $ | 62.2 | $ | 106.0 | $ | 236.8 | $ | 519.6 | (54.4 | )% | ||||||||||||||
|
|
|
|
|
|
|
|
|
|
|
| |||||||||||||||||
Pre-tax income margin(1) | 2.0 | % | 3.6 | % | 4.6 | % | 9.2 | % | 4.5 | % | 7.7 | % | (320 | )bps | ||||||||||||||
Net income attibutable to common stockholders margin(2) | 0.9 | % | 2.3 | % | 3.7 | % | 7.1 | % | 3.2 | % | 9.0 | % | (580 | )bps | ||||||||||||||
Effective tax rate | 38.0 | % | 30.1 | % | 14.4 | % | 22.3 | % | 24.3 | % | (16.9 | )% | 4120 | bps | ||||||||||||||
Acquisition-related intangible asset amortization,after-tax | $ | 10.4 | $ | 10.7 | $ | 11.7 | $ | 11.0 | $ | 43.8 | $ | 37.1 | 18.1 | % | ||||||||||||||
Investment yield(3) | 4.94 | % | 4.21 | % | 4.10 | % | 4.24 | % | 4.34 | % | 4.23 | % | 11 | bps | ||||||||||||||
Real estate joint venture partnerships income from sales and depreciation expense,pre-tax(3) | $ | 14.3 | $ | (2.7) | $ | (2.9) | $ | 0.4 | $ | 9.1 | $ | (1.2) | 858.3 | % | ||||||||||||||
| (1) | Equals income before provision (benefit) for income taxes divided by total net earned premiums, fees and other income. |
| (2) | Equals net income attibutable to common stockholders divided by total net earned premiums, fees and other income. |
| (3) | Excludes investment income attributable tonon-controlling interests. |
4
Global Housing
Condensed Statements of Operations and Selected Data
(Unaudited)
| 2018 | Twelve Months | 12M18-12M17 | ||||||||||||||||||||||||||
($ in millions) | 4Q | 3Q | 2Q | 1Q | 2018 | 2017 | % Change | |||||||||||||||||||||
Revenues: | ||||||||||||||||||||||||||||
Net earned premiums | $ | 457.1 | $ | 463.0 | $ | 449.7 | $ | 436.4 | $ | 1,806.2 | $ | 1,761.4 | 2.5 | % | ||||||||||||||
Fees and other income | 44.9 | 58.6 | 92.8 | 86.7 | 283.0 | 413.6 | (31.6 | )% | ||||||||||||||||||||
|
|
|
|
|
|
|
|
|
|
|
| |||||||||||||||||
Total net earned premiums, fees and other income | 502.0 | 521.6 | 542.5 | 523.1 | 2,089.2 | 2,175.0 | (3.9 | )% | ||||||||||||||||||||
Net investment income | 27.6 | 17.1 | 15.9 | 20.2 | 80.8 | 75.6 | 6.9 | % | ||||||||||||||||||||
|
|
|
|
|
|
|
|
|
|
|
| |||||||||||||||||
| 529.6 | 538.7 | 558.4 | 543.3 | 2,170.0 | 2,250.6 | (3.6 | )% | |||||||||||||||||||||
|
|
|
|
|
|
|
|
|
|
|
| |||||||||||||||||
Benefits, losses and expenses: | ||||||||||||||||||||||||||||
Policyholder benefits | 317.3 | 264.8 | 187.2 | 169.1 | 938.4 | 958.4 | (2.1 | )% | ||||||||||||||||||||
Selling, underwriting, general and administrative expenses | 227.5 | 249.9 | 279.7 | 284.5 | 1,041.6 | 1,147.9 | (9.3 | )% | ||||||||||||||||||||
|
|
|
|
|
|
|
|
|
|
|
| |||||||||||||||||
Total benefits, losses and expenses | 544.8 | 514.7 | 466.9 | 453.6 | 1,980.0 | 2,106.3 | (6.0 | )% | ||||||||||||||||||||
|
|
|
|
|
|
|
|
|
|
|
| |||||||||||||||||
(Loss) income before (benefit) provision for income taxes | (15.2 | ) | 24.0 | 91.5 | 89.7 | 190.0 | 144.3 | 31.7 | % | |||||||||||||||||||
(Benefit) provision for income taxes | (2.8 | ) | 4.6 | 18.9 | 18.5 | 39.2 | 46.9 | (16.4 | )% | |||||||||||||||||||
|
|
|
|
|
|
|
|
|
|
|
| |||||||||||||||||
Net operating (loss) income | (12.4 | ) | 19.4 | 72.6 | 71.2 | 150.8 | 97.4 | 54.8 | % | |||||||||||||||||||
|
|
|
|
|
|
|
|
|
|
|
| |||||||||||||||||
Reportable catastrophes, after tax(1) | 95.4 | 66.6 | (1.0 | ) | 8.7 | 169.7 | 190.5 | (10.9 | )% | |||||||||||||||||||
|
|
|
|
|
|
|
|
|
|
|
| |||||||||||||||||
Net operating income, excluding reportable catastrophes | $ | 83.0 | $ | 86.0 | $ | 71.6 | $ | 79.9 | $ | 320.5 | $ | 287.9 | 11.3 | % | ||||||||||||||
|
|
|
|
|
|
|
|
|
|
|
| |||||||||||||||||
Pre-tax (loss) income margin(2) | (3.0 | )% | 4.6 | % | 16.9 | % | 17.1 | % | 9.1 | % | 6.6 | % | 250 | bps | ||||||||||||||
Net operating (loss) income margin(3) | (2.5 | )% | 3.7 | % | 13.4 | % | 13.6 | % | 7.2 | % | 4.5 | % | 270 | bps | ||||||||||||||
Effective tax rate | 18.4 | % | 19.2 | % | 20.7 | % | 20.6 | % | 20.6 | % | 32.5 | % | (1190 | )bps | ||||||||||||||
Net earned premiums, fees and other: | ||||||||||||||||||||||||||||
Lender-placed Insurance | $ | 282.6 | $ | 288.9 | $ | 288.5 | $ | 289.7 | $ | 1,149.7 | $ | 1,224.9 | (6.1 | )% | ||||||||||||||
Multifamily Housing | 105.2 | 103.4 | 100.3 | 97.2 | 406.1 | 366.3 | 10.9 | % | ||||||||||||||||||||
Mortgage Solutions | — | 17.3 | 53.3 | 45.5 | 116.1 | 257.7 | (54.9 | )% | ||||||||||||||||||||
Specialty and other (formerly, Manufactured Housing and Other) | 114.2 | 112.0 | 100.4 | 90.7 | 417.3 | 326.1 | 28.0 | % | ||||||||||||||||||||
|
|
|
|
|
|
|
|
|
|
|
| |||||||||||||||||
Total | $ | 502.0 | $ | 521.6 | $ | 542.5 | $ | 523.1 | $ | 2,089.2 | $ | 2,175.0 | (3.9 | )% | ||||||||||||||
|
|
|
|
|
|
|
|
|
|
|
| |||||||||||||||||
Gross earned premiums | $ | 702.5 | $ | 696.3 | $ | 683.7 | $ | 666.6 | $ | 2,749.1 | $ | 2,731.7 | 0.6 | % | ||||||||||||||
Gross written premiums | $ | 698.2 | $ | 782.9 | $ | 725.7 | $ | 580.3 | $ | 2,787.1 | $ | 2,749.9 | 1.4 | % | ||||||||||||||
Reconciliation of gross earned premiums to net earned premiums: | ||||||||||||||||||||||||||||
Gross earned premiums | $ | 702.5 | $ | 696.3 | $ | 683.7 | $ | 666.6 | $ | 2,749.1 | $ | 2,731.7 | 0.6 | % | ||||||||||||||
Ceded catastrophe reinsurance(4) | (42.7 | ) | (30.6 | ) | (29.5 | ) | (30.9 | ) | (133.7 | ) | (145.5 | ) | 8.1 | % | ||||||||||||||
Ceded to U.S. Government | (128.9 | ) | (129.7 | ) | (131.8 | ) | (126.3 | ) | (516.7 | ) | (505.9 | ) | (2.1 | )% | ||||||||||||||
Ceded to clients | (73.8 | ) | (73.0 | ) | (72.7 | ) | (73.0 | ) | (292.5 | ) | (318.9 | ) | 8.3 | % | ||||||||||||||
|
|
|
|
|
|
|
|
|
|
|
| |||||||||||||||||
Net earned premiums | $ | 457.1 | $ | 463.0 | $ | 449.7 | $ | 436.4 | $ | 1,806.2 | $ | 1,761.4 | 2.5 | % | ||||||||||||||
|
|
|
|
|
|
|
|
|
|
|
| |||||||||||||||||
Acquisition-related intangible asset amortization,after-tax | $ | 2.9 | $ | 3.8 | $ | 5.8 | $ | 6.4 | $ | 18.9 | $ | 19.4 | (2.6 | )% | ||||||||||||||
Real estate joint venture partnerships income from sales and depreciation expense,pre-tax | $ | 2.3 | $ | (0.9) | $ | (0.9) | $ | 1.5 | $ | 2.0 | $ | 3.4 | (41.2 | )% | ||||||||||||||
Key Metrics: | ||||||||||||||||||||||||||||
Global Housing loss ratio(5) | 69.4 | % | 57.2 | % | 41.6 | % | 38.7 | % | 52.0 | % | 54.4 | % | (250 | )bps | ||||||||||||||
Global Housing expense ratio(6) | 45.3 | % | 47.9 | % | 51.6 | % | 54.4 | % | 49.9 | % | 52.8 | % | (290 | )bps | ||||||||||||||
Global Housing combined ratio(7) | 108.5 | % | 98.7 | % | 86.1 | % | 86.7 | % | 94.8 | % | 96.8 | % | (210 | )bps | ||||||||||||||
Global Housing annualized ROE(8) | (3.3 | )% | 5.0 | % | 18.7 | % | 18.4 | % | 9.9 | % | 6.6 | % | 330 | bps | ||||||||||||||
Investment yield | 5.08 | % | 3.22 | % | 3.20 | % | 3.98 | % | 3.87 | % | 3.61 | % | 26 | bps | ||||||||||||||
| (1) | Represents reportable catastrophe losses net of reinsurance and client profit sharing adjustments and including reinstatement and other premiums. Reportable catastrophes include ISO events greater than $5 million(pre-tax). |
| (2) | Equals (loss) income before (benefit) provision for income taxes divided by total net earned premiums, fees and other income. |
| (3) | Equals net operating income divided by total net earned premiums, fees and other income. |
| (4) | All periods reflect catastrophe reinsurance premiums. 4Q 2018 includes $7.9 million ($6.2 millionafter-tax) increase in 2018 reinsurance premiums to align with full-year catastrophe exposure. |
| (5) | Equals policyholder benefits divided by net earned premiums. |
| (6) | Equals selling, underwriting, general and administrative expenses divided by net earned premiums, fees and other income. |
| (7) | Equals total benefits, losses and expenses, divided by net earned premiums, fees and other income. Income from processing NFIP claims is reported as a reduction in expenses and is included in the combined ratio. |
| (8) | Equals Global Housing net operating income (including reportable catastrophes) divided by average stockholders’ equity. |
5
Global Housing (continued)
Condensed Statements of Operations and Selected Data
(Unaudited)
| 2018 | Twelve Months | 12M18-12M17 | ||||||||||||||||||||||||||
($ in millions) | 4Q | 3Q | 2Q | 1Q | 2018 | 2017 | % Change | |||||||||||||||||||||
Renters policies (in millions)(1) | 2.014 | 1.981 | 1.882 | 1.821 | 2.014 | 1.773 | 13.6 | % | ||||||||||||||||||||
Lender-placed Insurance: | ||||||||||||||||||||||||||||
Loans tracked(in millions) | 34.9 | 35.1 | 35.4 | 35.5 | 34.9 | 35.5 | (1.7 | )% | ||||||||||||||||||||
Average placement rates(2) | 1.63 | % | 1.67 | % | 1.70 | % | 1.74 | % | 1.63 | % | 1.78 | % | (15 | )bps | ||||||||||||||
Average insured value (AIV)(in thousands): | $ | 183 | $ | 182 | $ | 180 | $ | 178 | $ | 183 | $ | 177 | 3.4 | % | ||||||||||||||
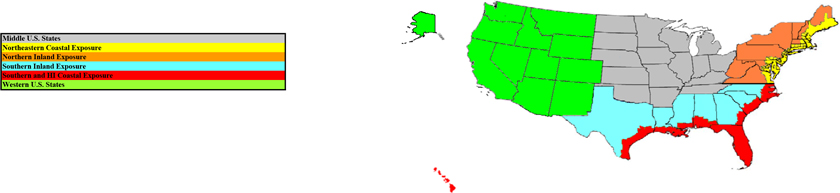
% Spread of exposure(3) | ||||||||||||||||||||||||||||
Region Name | ||||||||||||||||||||||||||||
Middle U.S. states | 13.4 | % | 13.6 | % | 13.8 | % | 13.8 | % | 13.4 | % | 13.9 | % | (50 | )bps | ||||||||||||||
Northeastern coastal exposure | 18.3 | % | 18.7 | % | 19.5 | % | 19.9 | % | 18.3 | % | 20.3 | % | (200 | )bps | ||||||||||||||
Northern inland exposure | 7.9 | % | 8.4 | % | 8.2 | % | 8.5 | % | 7.9 | % | 8.7 | % | (80 | )bps | ||||||||||||||
Southern inland exposure | 13.6 | % | 13.3 | % | 13.4 | % | 13.3 | % | 13.6 | % | 13.0 | % | 60 | bps | ||||||||||||||
Southern and HI coastal exposure | 25.0 | % | 24.6 | % | 23.7 | % | 23.0 | % | 25.0 | % | 22.7 | % | 230 | bps | ||||||||||||||
Western U.S. states | 21.8 | % | 21.4 | % | 21.4 | % | 21.5 | % | 21.8 | % | 21.4 | % | 40 | bps | ||||||||||||||
|
|
|
|
|
|
|
|
|
|
|
| |||||||||||||||||
Total | 100.0 | % | 100.0 | % | 100.0 | % | 100.0 | % | 100.0 | % | 100.0 | % | ||||||||||||||||
|
|
|
|
|
|
|
|
|
|
|
| |||||||||||||||||
| (1) | Renters policies account for the total number of policies related to all liability, personal property and other supplemental coverages. |
| (2) | Does not include real estate owned policies. |
| (3) | Geographical spread of exposure is based on the Company’s assessment of total insured value for all of Global Housing. |
6
Global Lifestyle
Condensed Statements of Operations and Selected Data
(Unaudited)
| 2018 | Twelve Months | 12M18-12M17 | ||||||||||||||||||||||||||
($ in millions) | 4Q | 3Q | 2Q | 1Q | 2018 | 2017 | % Change | |||||||||||||||||||||
Revenues: | ||||||||||||||||||||||||||||
Net earned premiums | $ | 1,367.9 | $ | 1,376.0 | $ | 874.3 | $ | 673.6 | $ | 4,291.8 | $ | 2,576.5 | 66.6 | % | ||||||||||||||
Fees and other income | 253.2 | 165.5 | 227.9 | 244.9 | 891.5 | 819.7 | 8.8 | % | ||||||||||||||||||||
|
|
|
|
|
|
|
|
|
|
|
| |||||||||||||||||
Total net earned premiums, fees and other | 1,621.1 | 1,541.5 | 1,102.2 | 918.5 | 5,183.3 | 3,396.2 | 52.6 | % | ||||||||||||||||||||
Net investment income | 66.0 | 54.7 | 36.6 | 32.1 | 189.4 | 114.6 | 65.3 | % | ||||||||||||||||||||
|
|
|
|
|
|
|
|
|
|
|
| |||||||||||||||||
| 1,687.1 | 1,596.2 | 1,138.8 | 950.6 | 5,372.7 | 3,510.8 | 53.0 | % | |||||||||||||||||||||
|
|
|
|
|
|
|
|
|
|
|
| |||||||||||||||||
Benefits, losses and expenses: | ||||||||||||||||||||||||||||
Policyholder benefits | 372.5 | 352.2 | 239.3 | 181.6 | 1,145.6 | 700.4 | 63.6 | % | ||||||||||||||||||||
Selling, underwriting, general and administrative expenses | 1,182.6 | 1,144.5 | 815.2 | 696.1 | 3,838.4 | 2,564.1 | 49.7 | % | ||||||||||||||||||||
|
|
|
|
|
|
|
|
|
|
|
| |||||||||||||||||
Total benefits, losses and expenses | 1,555.1 | 1,496.7 | 1,054.5 | 877.7 | 4,984.0 | 3,264.5 | 52.7 | % | ||||||||||||||||||||
|
|
|
|
|
|
|
|
|
|
|
| |||||||||||||||||
Income before provision for income taxes | 132.0 | 99.5 | 84.3 | 72.9 | 388.7 | 246.3 | 57.8 | % | ||||||||||||||||||||
Provision for income taxes(2) | 34.1 | 23.6 | 16.2 | 17.1 | 91.0 | 68.3 | 33.2 | % | ||||||||||||||||||||
|
|
|
|
|
|
|
|
|
|
|
| |||||||||||||||||
Net operating income(1)(3) | $ | 97.9 | $ | 75.9 | $ | 68.1 | $ | 55.8 | $ | 297.7 | $ | 178.0 | 67.2 | % | ||||||||||||||
|
|
|
|
|
|
|
|
|
|
|
| |||||||||||||||||
Pre-tax income margin(4) | 8.1 | % | 6.5 | % | 7.6 | % | 7.9 | % | 7.5 | % | 7.3 | % | 20 | bps | ||||||||||||||
Net operating income margin(5) | 6.0 | % | 4.9 | % | 6.2 | % | 6.1 | % | 5.7 | % | 5.2 | % | 50 | bps | ||||||||||||||
Effective tax rate(2) | 25.8 | % | 23.7 | % | 19.2 | % | 23.5 | % | 23.4 | % | 27.7 | % | (430 | )bps | ||||||||||||||
Acquisition-related intangible asset amortization,after-tax | $ | 7.5 | $ | 6.9 | $ | 5.9 | $ | 4.6 | $ | 24.9 | $ | 17.7 | 40.7 | % | ||||||||||||||
Real estate joint venture partnerships income from sales and depreciation expense,pre-tax | $ | 5.9 | $ | (2.1 | ) | $ | (1.4 | ) | $ | 0.2 | $ | 2.6 | $ | — | N/A | |||||||||||||
Key Metrics: | ||||||||||||||||||||||||||||
Global Covered Mobile Devices (in millions)(6) | 46.1 | 44.1 | 43.5 | 37.6 | 46.1 | 36.4 | 26.6 | % | ||||||||||||||||||||
Global Protected Vehicles (in millions)(7) | 47.9 | 47.2 | 46.5 | 15.0 | 47.9 | 14.7 | 225.9 | % | ||||||||||||||||||||
Global Lifestyle annualized ROE(8) | 9.6 | % | 7.4 | % | 10.4 | % | 11.5 | % | 9.2 | % | 10.0 | % | (80 | )bps | ||||||||||||||
Investment yield | 4.55 | % | 3.80 | % | 3.70 | % | 4.06 | % | 3.93 | % | 3.82 | % | 11 | bps | ||||||||||||||
| (1) | 4Q 2018, 3Q 2018 and 2Q 2018 include $645.1 million, $625.9 million and $202.6 million of net earned premium, fees and other income, as well as $44.7 million, $29.9 million and $9.4 million of net operating income from TWG, respectively. |
| (2) | 2Q 2018 and Twelve Months 2017 include $3.9 million and $9.6 million, respectively, of net tax benefits. |
| (3) | 4Q 2018, 3Q 2018, 1Q 2018 and Twelve Months 2017 include reportable catastrophes which represent catastrophe losses net of reinsurance and client profit sharing adjustments and including reinstatement and other premiums. Reportable catastrophes include individual ISO events greater than $5 million(pre-tax). NOI excluding the impact of reportable catastrophes was $98.1 million, $77.0 million, $54.5 million and $180.0 million for 4Q 2018, 3Q 2018, 1Q 2018 and Twelve Months 2017, respectively. |
| (4) | Equals income before provision (benefit) for income taxes divided by total net earned premiums, fees and other income. |
| (5) | Equals net operating income divided by total net earned premiums, fees and other income. |
| (6) | Global Covered Mobile Devices includes insurance and upgrade contracts inforce for mobile phones, tablets,e-readers and accessories. |
| (7) | Global Protected Vehicles includes insurance and service contracts inforce for vehicles, RVs, powersports and ancillary products. |
| (8) | Global Lifestyle annualized ROE equals Global Lifestyle net operating income divided by average stockholders’ equity. 2Q 2018 and Twelve Months 2018 average stockholders’ equity reflect the TWG related equity from the acquisition date of May 31, 2018. |
7
Global Lifestyle (continued)
Condensed Statements of Operations and Selected Data
(Unaudited)
| 2018 | Twelve Months | 12M18-12M17 | ||||||||||||||||||||||||||
($ in millions) | 4Q | 3Q | 2Q | 1Q | 2018 | 2017 | % Change | |||||||||||||||||||||
Net written premiums: | ||||||||||||||||||||||||||||
Connected Living | $ | 701.9 | $ | 574.7 | $ | 435.6 | $ | 347.9 | $ | 2,060.1 | $ | 1,431.5 | 43.9 | % | ||||||||||||||
Global Automotive | 698.2 | 890.4 | 493.6 | 245.3 | 2,327.5 | 1,003.4 | 132.0 | % | ||||||||||||||||||||
Global Financial Services and Other | 109.7 | 135.6 | 100.4 | 85.5 | 431.2 | 426.2 | 1.2 | % | ||||||||||||||||||||
|
|
|
|
|
|
|
|
|
|
|
| |||||||||||||||||
Total | $ | 1,509.8 | $ | 1,600.7 | $ | 1,029.6 | $ | 678.7 | $ | 4,818.8 | $ | 2,861.1 | 68.4 | % | ||||||||||||||
|
|
|
|
|
|
|
|
|
|
|
| |||||||||||||||||
Net earned premiums, fees and other income: | ||||||||||||||||||||||||||||
Connected Living | $ | 833.9 | $ | 735.3 | $ | 629.3 | $ | 602.1 | $ | 2,800.6 | $ | 2,156.0 | 29.9 | % | ||||||||||||||
Global Automotive | 665.9 | 679.6 | 361.2 | 202.5 | 1,909.2 | 782.8 | 143.9 | % | ||||||||||||||||||||
Global Financial Services and Other | 121.3 | 126.6 | 111.7 | 113.9 | 473.5 | 457.4 | 3.5 | % | ||||||||||||||||||||
|
|
|
|
|
|
|
|
|
|
|
| |||||||||||||||||
Total | $ | 1,621.1 | $ | 1,541.5 | $ | 1,102.2 | $ | 918.5 | $ | 5,183.3 | $ | 3,396.2 | 52.6 | % | ||||||||||||||
|
|
|
|
|
|
|
|
|
|
|
| |||||||||||||||||
Net operating income: | ||||||||||||||||||||||||||||
Connected Living | $ | 45.4 | $ | 29.9 | $ | 34.0 | $ | 38.1 | $ | 147.4 | $ | 85.9 | 71.6 | % | ||||||||||||||
Global Automotive | 46.8 | 36.0 | 24.6 | 7.9 | 115.3 | 44.3 | 160.3 | % | ||||||||||||||||||||
Global Financial Services and Other | 5.7 | 10.0 | 9.5 | 9.8 | 35.0 | 47.8 | (26.8 | )% | ||||||||||||||||||||
|
|
|
|
|
|
|
|
|
|
|
| |||||||||||||||||
Total | $ | 97.9 | $ | 75.9 | $ | 68.1 | $ | 55.8 | $ | 297.7 | $ | 178.0 | 67.2 | % | ||||||||||||||
|
|
|
|
|
|
|
|
|
|
|
| |||||||||||||||||
Foreign currency translation (FX) impact(1): | ||||||||||||||||||||||||||||
Net earned premiums, fees and other income: | ||||||||||||||||||||||||||||
Including FX impact | 77.4 | % | 83.1 | % | 31.8 | % | 14.1 | % | 52.6 | % | (8.4 | )% | 6100 | bps | ||||||||||||||
FX impact | (3.6 | )% | (3.4 | )% | (0.6 | )% | 0.9 | % | (1.8 | )% | (0.3 | )% | (150 | )bps | ||||||||||||||
|
|
|
|
|
|
|
|
|
|
|
| |||||||||||||||||
Excluding FX impact | 81.1 | % | 86.5 | % | 32.4 | % | 13.3 | % | 54.4 | % | (8.1 | )% | 6240 | bps | ||||||||||||||
Net operating income: | ||||||||||||||||||||||||||||
Including FX impact | 128.7 | % | 78.2 | % | 69.4 | % | 6.4 | % | 67.3 | % | 15.3 | % | 5200 | bps | ||||||||||||||
FX impact | (7.8 | )% | (6.4 | )% | (2.7 | )% | (1.6 | )% | (4.4 | )% | (0.2 | )% | (430 | )bps | ||||||||||||||
|
|
|
|
|
|
|
|
|
|
|
| |||||||||||||||||
Excluding FX impact | 136.5 | % | 84.5 | % | 72.1 | % | 8.0 | % | 71.7 | % | 15.4 | % | 5630 | bps | ||||||||||||||
Net earned premiums, fees and other income: | ||||||||||||||||||||||||||||
Domestic | $ | 1,146.4 | $ | 1,098.8 | $ | 736.2 | $ | 579.5 | $ | 3,560.9 | $ | 2,159.8 | 64.9 | % | ||||||||||||||
International | 474.7 | 442.7 | 366.0 | 339.0 | 1,622.4 | 1,236.4 | 31.2 | % | ||||||||||||||||||||
|
|
|
|
|
|
|
|
|
|
|
| |||||||||||||||||
Total | $ | 1,621.1 | $ | 1,541.5 | $ | 1,102.2 | $ | 918.5 | $ | 5,183.3 | $ | 3,396.2 | 52.6 | % | ||||||||||||||
|
|
|
|
|
|
|
|
|
|
|
| |||||||||||||||||
| (1) | Represents the FX impact on the percentage change in segment net earned premiums and segment net operating income that is attributed to changes in weighted average foreign currency exchange rates used in the translation of the income statement. Excludes the impact of foreign exchange transaction gains (losses) associated with the remeasurement ofnon-functional currencies. |
8
Global Preneed
Condensed Statements of Operations and Selected Data
(Unaudited)
| 2018 | Twelve Months | 12M18-12M17 | ||||||||||||||||||||||||||
($ in millions) | 4Q | 3Q | 2Q | 1Q | 2018 | 2017 | % Change | |||||||||||||||||||||
Revenues: | ||||||||||||||||||||||||||||
Net earned premiums | $ | 15.0 | $ | 14.6 | $ | 14.2 | $ | 14.6 | $ | 58.4 | $ | 59.5 | (1.8 | )% | ||||||||||||||
Fees and other income: | ||||||||||||||||||||||||||||
Change in value of CPI Caps(1) | — | (0.1 | ) | — | — | (0.1 | ) | (0.1 | ) | 0.0 | % | |||||||||||||||||
Other | 33.3 | 33.6 | 32.7 | 31.6 | 131.2 | 121.6 | 7.9 | % | ||||||||||||||||||||
|
|
|
|
|
|
|
|
|
|
|
| |||||||||||||||||
Total fees and other income | 33.3 | 33.5 | 32.7 | 31.6 | 131.1 | 121.5 | 7.9 | % | ||||||||||||||||||||
|
|
|
|
|
|
|
|
|
|
|
| |||||||||||||||||
Total net earned premiums, fees and other income | 48.3 | 48.1 | 46.9 | 46.2 | 189.5 | 181.0 | 4.7 | % | ||||||||||||||||||||
Net investment income | 74.2 | 70.1 | 67.9 | 65.8 | 278.0 | 262.0 | 6.1 | % | ||||||||||||||||||||
|
|
|
|
|
|
|
|
|
|
|
| |||||||||||||||||
| 122.5 | 118.2 | 114.8 | 112.0 | 467.5 | 443.0 | 5.5 | % | |||||||||||||||||||||
|
|
|
|
|
|
|
|
|
|
|
| |||||||||||||||||
Benefits, losses and expenses: | ||||||||||||||||||||||||||||
Policyholder benefits | 67.1 | 64.5 | 65.0 | 66.7 | 263.3 | 259.1 | 1.6 | % | ||||||||||||||||||||
Selling, underwriting, general and administrative expenses | 34.6 | 32.3 | 31.0 | 32.7 | 130.6 | 124.9 | 4.6 | % | ||||||||||||||||||||
|
|
|
|
|
|
|
|
|
|
|
| |||||||||||||||||
Total benefits, losses and expenses | 101.7 | 96.8 | 96.0 | 99.4 | 393.9 | 384.0 | 2.6 | % | ||||||||||||||||||||
|
|
|
|
|
|
|
|
|
|
|
| |||||||||||||||||
Income before provision for income taxes | 20.8 | 21.4 | 18.8 | 12.6 | 73.6 | 59.0 | 24.7 | % | ||||||||||||||||||||
Provision for income taxes | 4.4 | 4.6 | 4.1 | 2.8 | 15.9 | 19.4 | (18.0 | )% | ||||||||||||||||||||
|
|
|
|
|
|
|
|
|
|
|
| |||||||||||||||||
Net operating income | $ | 16.4 | $ | 16.8 | $ | 14.7 | $ | 9.8 | $ | 57.7 | $ | 39.6 | 45.7 | % | ||||||||||||||
|
|
|
|
|
|
|
|
|
|
|
| |||||||||||||||||
Pre-tax income margin(2) | 43.1 | % | 44.5 | % | 40.1 | % | 27.3 | % | 38.8 | % | 32.6 | % | 620 | bps | ||||||||||||||
Net operating income margin(3) | 34.0 | % | 34.9 | % | 31.3 | % | 21.2 | % | 30.4 | % | 21.9 | % | 850 | bps | ||||||||||||||
Effective tax rate | 21.2 | % | 21.5 | % | 21.8 | % | 22.2 | % | 21.6 | % | 32.9 | % | (1130 | )bps | ||||||||||||||
CPI Cap value | $ | 0.1 | $ | 0.1 | $ | 0.2 | $ | 0.2 | $ | 0.1 | $ | 0.2 | (50.0 | )% | ||||||||||||||
Foreign currency translation (FX) impact(4): | ||||||||||||||||||||||||||||
Net earned premiums, fees and other income: | ||||||||||||||||||||||||||||
Including FX impact | 5.2 | % | 7.8 | % | 1.2 | % | 4.7 | % | 4.7 | % | 5.7 | % | (100 | )bps | ||||||||||||||
FX impact | (0.9 | )% | (0.9 | )% | 1.1 | % | 1.1 | % | 0.1 | % | 0.4 | % | (30 | )bps | ||||||||||||||
|
|
|
|
|
|
|
|
|
|
|
| |||||||||||||||||
Excluding FX impact | 6.1 | % | 8.7 | % | 0.1 | % | 3.6 | % | 4.6 | % | 5.3 | % | (70 | )bps | ||||||||||||||
Net operating income: | ||||||||||||||||||||||||||||
Including FX impact | 256.5 | % | 36.6 | % | 14.6 | % | (0.4 | )% | 45.7 | % | (6.4 | )% | 5210 | bps | ||||||||||||||
FX impact | (0.9 | )% | (0.9 | )% | 1.3 | % | 1.2 | % | 0.4 | % | 0.2 | % | 20 | bps | ||||||||||||||
|
|
|
|
|
|
|
|
|
|
|
| |||||||||||||||||
Excluding FX impact | 257.4 | % | 37.5 | % | 13.3 | % | (1.6 | )% | 45.3 | % | (6.6 | )% | 5190 | bps | ||||||||||||||
Net earned premiums, fees and other income: | ||||||||||||||||||||||||||||
Domestic | $ | 37.4 | $ | 37.4 | $ | 36.5 | $ | 35.8 | $ | 147.1 | $ | 139.1 | 5.8 | % | ||||||||||||||
International | 10.9 | 10.7 | 10.4 | 10.4 | 42.4 | 41.9 | 1.2 | % | ||||||||||||||||||||
|
|
|
|
|
|
|
|
|
|
|
| |||||||||||||||||
Total | $ | 48.3 | $ | 48.1 | $ | 46.9 | $ | 46.2 | $ | 189.5 | $ | 181.0 | 4.7 | % | ||||||||||||||
|
|
|
|
|
|
|
|
|
|
|
| |||||||||||||||||
Real estate joint venture partnerships income from sales and depreciation expense,pre-tax | $ | 4.3 | $ | (0.5 | ) | $ | (0.6 | ) | $ | (1.3 | ) | $ | 1.9 | $ | (2.7 | ) | 170.4 | % | ||||||||||
Key Metrics: | ||||||||||||||||||||||||||||
Global Preneed annualized ROE(5) | 15.2 | % | 15.4 | % | 13.6 | % | 9.3 | % | 13.6 | % | 9.1 | % | 450 | bps | ||||||||||||||
Face sales | $ | 228.5 | $ | 249.1 | $ | 257.0 | $ | 224.1 | $ | 958.7 | $ | 915.9 | 4.7 | % | ||||||||||||||
Investment yield | 5.37 | % | 5.11 | % | 5.02 | % | 4.89 | % | 5.10 | % | 4.94 | % | 16 | bps | ||||||||||||||
Preneed average invested assets | $ | 5,527.6 | $ | 5,490.7 | $ | 5,411.6 | $ | 5,380.0 | $ | 5,450.4 | $ | 5,302.7 | 2.8 | % | ||||||||||||||
| (1) | The Company utilizes derivative instruments, Consumer Price Index Caps (“CPI Caps”), in managing thepre-funded funeral business exposure to inflation risk on certain policies. The CPI Caps do not qualify under GAAP as effective hedges; therefore, they aremarked-to-market on a quarterly basis and the accumulated gain or loss is recognized in the statement of operations in fees and other income. |
| (2) | Equals income before provision for income taxes divided by total net earned premiums, fees and other income. |
| (3) | Equals net operating income divided by total net earned premiums, fees and other income. |
| (4) | Represents the FX impact on the percentage change in net earned premiums and net operating income that is attributed to changes in weighted average foreign currency exchange rates used in the translation of the income statement. Excludes the impact of foreign exchange transaction gains (losses) associated with the remeasurement ofnon-functional currencies. |
| (5) | Equals Global Preneed net operating income divided by average stockholders’ equity. |
9
Total Corporate and Other
Condensed Statements of Operations and Selected Data
(Unaudited)
| 2018 | Twelve Months | 12M18-12M17 | ||||||||||||||||||||||||
($ in millions) | 4Q | 3Q | 2Q | 1Q | 2018 | 2017 | % Change | |||||||||||||||||||
Revenues: | ||||||||||||||||||||||||||
Net earned premiums | $ | 0.1 | $ | — | $ | 0.1 | $ | 0.3 | 0.5 | $ | 6.7 | (92.5)% | ||||||||||||||
Fees and other income | 0.1 | 0.3 | 0.8 | 1.3 | 2.5 | 28.3 | (91.2)% | |||||||||||||||||||
Net investment income | 13.0 | 9.9 | 15.2 | 12.1 | 50.2 | 41.6 | 20.7% | |||||||||||||||||||
Net realized (losses) gains on investments | (46.1 | ) | (5.7 | ) | (11.4 | ) | 0.5 | (62.7 | ) | 30.1 | (308.3)% | |||||||||||||||
Amortization of deferred gains on disposal of businesses | 10.7 | 12.7 | 15.0 | 18.5 | 56.9 | 103.9 | (45.2)% | |||||||||||||||||||
|
|
|
|
|
|
|
|
|
|
|
| |||||||||||||||
| (22.2 | ) | 17.2 | 19.7 | 32.7 | 47.4 | 210.6 | (77.5)% | |||||||||||||||||||
|
|
|
|
|
|
|
|
|
|
|
| |||||||||||||||
Benefits, losses and expenses: | ||||||||||||||||||||||||||
Policyholder benefits | (0.4 | ) | (0.6 | ) | (0.9 | ) | (2.8 | ) | (4.7 | ) | (47.3 | ) | 90.1% | |||||||||||||
Selling, underwriting, general and administrative expenses | 46.6 | 60.4 | 110.9 | 52.7 | 270.6 | 213.5 | 26.7% | |||||||||||||||||||
Interest expense | 26.3 | 26.5 | 26.0 | 21.5 | 100.3 | 49.5 | 102.6% | |||||||||||||||||||
|
|
|
|
|
|
|
|
|
|
|
| |||||||||||||||
Total benefits, losses and expenses | 72.5 | 86.3 | 136.0 | 71.4 | 366.2 | 215.7 | 69.8% | |||||||||||||||||||
|
|
|
|
|
|
|
|
|
|
|
| |||||||||||||||
(Loss) income before (benefit) provision for income taxes | (94.7 | ) | (69.1 | ) | (116.3 | ) | (38.7 | ) | (318.8 | ) | (5.1 | ) | (6151.0)% | |||||||||||||
(Benefit) provision for income taxes | (19.4 | ) | (10.0 | ) | (27.9 | ) | (7.9 | ) | (65.2 | ) | (209.7 | ) | 68.9% | |||||||||||||
|
|
|
|
|
|
|
|
|
|
|
| |||||||||||||||
Net (loss) income | (75.3 | ) | (59.1 | ) | (88.4 | ) | (30.8 | ) | (253.6 | ) | 204.6 | (223.9)% | ||||||||||||||
Less: Net income (loss) attributable tonon-controlling interests | (1.6 | ) | — | — | — | (1.6 | ) | — | N/A | |||||||||||||||||
Net (loss) income attributable to stockholders | (76.9 | ) | (59.1 | ) | (88.4 | ) | (30.8 | ) | (255.2 | ) | 204.6 | (223.9)% | ||||||||||||||
Less: Preferred stock dividends | (4.7 | ) | (4.7 | ) | (4.8 | ) | — | (14.2 | ) | — | N/A | |||||||||||||||
|
|
|
|
|
|
|
|
|
|
|
| |||||||||||||||
Net (loss) income attributable to common stockholders | $ | (81.6 | ) | $ | (63.8 | ) | $ | (93.2 | ) | $ | (30.8 | ) | $ | (269.4 | ) | $ | 204.6 | (231.7)% | ||||||||
|
|
|
|
|
|
|
|
|
|
|
|
| ||||||||||||||
Corporate and Other Net Operating Loss Reconciliation(1) | ||||||||||||||||||||||||||
Total Corporate and Other net (loss) income attibutable to common stockholders | $ | (81.6 | ) | $ | (63.8 | ) | $ | (93.2 | ) | $ | (30.8 | ) | $ | (269.4 | ) | $ | 204.6 | (231.7)% | ||||||||
Adjustments, net of tax: | ||||||||||||||||||||||||||
Assurant Health runoff operations | (0.2 | ) | (0.2 | ) | (0.2 | ) | (2.0 | ) | (2.6 | ) | (10.6 | ) | 75.5% | |||||||||||||
Amortization of deferred gains on disposal of businesses | (8.4 | ) | (10.0 | ) | (11.9 | ) | (14.6 | ) | (44.9 | ) | (67.5 | ) | 33.5% | |||||||||||||
Impact of TCJA at enactment | — | 1.5 | — | — | 1.5 | (177.0 | ) | 100.8% | ||||||||||||||||||
Net TWG acquisition related charges(2) | 5.9 | 8.0 | 32.5 | 20.5 | 66.9 | 8.1 | 725.9% | |||||||||||||||||||
Change in tax liabilities | — | — | — | — | — | (27.1 | ) | 100.0% | ||||||||||||||||||
Interest expense | 20.8 | 21.0 | 14.4 | 9.6 | 65.8 | 32.2 | 104.3% | |||||||||||||||||||
Net realized losses (gains) on investments | 36.2 | 4.6 | 9.0 | (0.4 | ) | 49.4 | (19.6 | ) | 352.0% | |||||||||||||||||
Loss on sale of Mortgage Solutions | (0.5 | ) | (2.0 | ) | 34.4 | — | 31.9 | — | N/A | |||||||||||||||||
Foreign exchange related (losses) gains | 0.2 | 18.3 | (3.8 | ) | — | 14.7 | — | N/A | ||||||||||||||||||
Other adjustments(3) | (4.6 | ) | (1.1 | ) | (0.3 | ) | (2.3 | ) | (8.3 | ) | (5.9 | ) | (40.7)% | |||||||||||||
Preferred stock dividends(4) | 4.7 | 4.7 | 1.6 | — | 11.0 | — | N/A | |||||||||||||||||||
|
|
|
|
|
|
|
|
|
|
|
| |||||||||||||||
Corporate and other net operating loss | $ | (27.5 | ) | $ | (19.0 | ) | $ | (17.5 | ) | $ | (20.0 | ) | $ | (84.0 | ) | $ | (62.8 | ) | (33.8)% | |||||||
|
|
|
|
|
|
|
|
|
|
|
| |||||||||||||||
| (1) | See Footnote (7) in Regulation G—Non GAAP Financial Measures. |
| (2) | Additional details about the components of net TWG acquisition related charges are included in the table below: |
| Inception To Date | Twelve Months | 2018 | 2017 | |||||||||||||||||||||||||||||
($ in millions) | 2018 | 4Q | 3Q | 2Q | 1Q | 4Q | 3Q | |||||||||||||||||||||||||
Transaction expenses | $ | 39.9 | $ | 30.6 | $ | 0.4 | $ | 0.2 | $ | 24.8 | $ | 5.2 | $ | 5.6 | $ | 3.7 | ||||||||||||||||
Financing expenses | 12.3 | 9.8 | — | 0.3 | 0.3 | 9.2 | 2.5 | — | ||||||||||||||||||||||||
Integration expenses | 30.5 | 29.8 | 6.9 | 10.1 | 10.5 | 2.3 | 0.7 | — | ||||||||||||||||||||||||
Pre-close investment income | (2.4 | ) | (2.4 | ) | — | — | (2.4 | ) | — | — | — | |||||||||||||||||||||
Pre-close interest expense | 17.1 | 17.1 | — | — | 7.8 | 9.3 | — | — | ||||||||||||||||||||||||
|
|
|
|
|
|
|
|
|
|
|
|
|
|
|
| |||||||||||||||||
Total expenses,pre-tax | 97.4 | 84.9 | 7.3 | 10.6 | 41.0 | 26.0 | 8.8 | 3.7 | ||||||||||||||||||||||||
Tax on expenses | (19.9 | ) | (15.5 | ) | (1.4 | ) | (2.6 | ) | (6.0 | ) | (5.5 | ) | (3.1 | ) | (1.3 | ) | ||||||||||||||||
|
|
|
|
|
|
|
|
|
|
|
|
|
|
|
| |||||||||||||||||
Total expenses,after-tax | 77.5 | 69.4 | 5.9 | 8.0 | 35.0 | 20.5 | 5.7 | 2.4 | ||||||||||||||||||||||||
Pre-close preferred dividends | 3.2 | 3.2 | — | — | 3.2 | — | — | — | ||||||||||||||||||||||||
Tax credit | (5.7 | ) | (5.7 | ) | — | — | (5.7 | ) | — | — | — | |||||||||||||||||||||
|
|
|
|
|
|
|
|
|
|
|
|
|
|
|
| |||||||||||||||||
Total net TWG acquisition related charges | $ | 75.0 | $ | 66.9 | $ | 5.9 | $ | 8.0 | $ | 32.5 | $ | 20.5 | $ | 5.7 | $ | 2.4 | ||||||||||||||||
|
|
|
|
|
|
|
|
|
|
|
|
|
|
|
| |||||||||||||||||
| (3) | Refer to the Regulation G—Non GAAP Financial Measures for a list of Other adjustments. |
| (4) | Twelve Months 2018 and 2Q 2018 net operating income exclude $3.2 million of the preferred stock dividends related to the period prior to the acquisition of The Warranty Group and is included below in the net TWG acquisition related charges. |
10
Assurant, Inc.
Segment Condensed Balance Sheets
(Unaudited)
| As of December 31, 2018 | ||||||||||||||||||||
| ($ in millions) | Global Housing | Global Lifestyle | Global Preneed | Total Corporate and Other(1) | Consolidated | |||||||||||||||
Assets | ||||||||||||||||||||
Investments and cash and cash equivalents | $ | 2,139.0 | $ | 5,844.0 | $ | 5,510.4 | $ | 1,164.5 | $ | 14,657.9 | ||||||||||
Reinsurance recoverables(2) | 711.1 | 3,888.9 | 74.6 | 4,491.4 | 9,166.0 | |||||||||||||||
Deferred acquisition costs | 128.6 | 4,075.1 | 1,051.9 | (152.6 | ) | 5,103.0 | ||||||||||||||
Goodwill | 379.5 | 1,804.7 | 137.6 | — | 2,321.8 | |||||||||||||||
Value of business acquired | — | 3,140.8 | 17.0 | — | 3,157.8 | |||||||||||||||
Assets held in separate accounts | — | — | 154.1 | 1,455.6 | 1,609.7 | |||||||||||||||
Other assets | 591.7 | 2,501.0 | 29.6 | 265.4 | 3,387.7 | |||||||||||||||
Assets of consolidated investment entities | — | — | — | 1,685.4 | 1,685.4 | |||||||||||||||
|
|
|
|
|
|
|
|
|
| |||||||||||
Total assets | $ | 3,949.9 | $ | 21,254.5 | $ | 6,975.2 | $ | 8,909.7 | $ | 41,089.3 | ||||||||||
|
|
|
|
|
|
|
|
|
| |||||||||||
Liabilities | ||||||||||||||||||||
Policyholder benefits and claims payable(2) | $ | 651.3 | $ | 822.0 | $ | 5,971.3 | $ | 4,610.0 | $ | 12,054.6 | ||||||||||
Unearned premiums | 1,472.5 | 13,819.9 | 437.3 | (81.7 | ) | 15,648.0 | ||||||||||||||
Debt | — | — | — | 2,006.0 | 2,006.0 | |||||||||||||||
Liabilities related to separate accounts | — | — | 154.1 | 1,455.6 | 1,609.7 | |||||||||||||||
Deferred gain on disposal of businesses | — | — | — | 53.1 | 53.1 | |||||||||||||||
Accounts payable and other liabilities | 320.8 | 2,539.4 | (11.2 | ) | 279.9 | 3,128.9 | ||||||||||||||
Liabilities of consolidated investment entities | — | — | — | 1,455.1 | 1,455.1 | |||||||||||||||
|
|
|
|
|
|
|
|
|
| |||||||||||
Total liabilities | 2,444.6 | 17,181.3 | 6,551.5 | 9,778.0 | 35,955.4 | |||||||||||||||
|
|
|
|
|
|
|
|
|
| |||||||||||
Stockholders’ equity | ||||||||||||||||||||
Equity, excluding accumulated other comprehensive income | 1,505.3 | 4,073.2 | 423.7 | (734.8 | ) | 5,267.4 | ||||||||||||||
Accumulated other comprehensive income | — | — | — | (155.4 | ) | (155.4 | ) | |||||||||||||
|
|
|
|
|
|
|
|
|
| |||||||||||
Total Assurant, Inc. stockholders’ equity | 1,505.3 | 4,073.2 | 423.7 | (890.2 | ) | 5,112.0 | ||||||||||||||
|
|
|
|
|
|
|
|
|
| |||||||||||
Non-controlling interest | — | — | — | 21.9 | 21.9 | |||||||||||||||
Total equity | 1,505.3 | 4,073.2 | 423.7 | (868.3 | ) | 5,133.9 | ||||||||||||||
|
|
|
|
|
|
|
|
|
| |||||||||||
Total liabilities and equity | $ | 3,949.9 | $ | 21,254.5 | $ | 6,975.2 | $ | 8,909.7 | $ | 41,089.3 | ||||||||||
|
|
|
|
|
|
|
|
|
| |||||||||||
| As of December 31, 2017 | ||||||||||||||||||||
| ($ in millions) | Global Housing | Global Lifestyle | Global Preneed | Total Corporate and Other(1) | Consolidated | |||||||||||||||
Assets | ||||||||||||||||||||
Investments and cash and cash equivalents | $ | 2,109.6 | $ | 3,186.3 | $ | 5,373.4 | $ | 1,881.0 | $ | 12,550.3 | ||||||||||
Reinsurance recoverables(2) | 1,450.3 | 1,668.0 | 77.6 | 6,594.3 | 9,790.2 | |||||||||||||||
Deferred acquisition costs | 114.4 | 2,843.7 | 949.9 | (423.5 | ) | 3,484.5 | ||||||||||||||
Goodwill | 386.7 | 392.8 | 138.2 | — | 917.7 | |||||||||||||||
Value of business acquired | — | 0.7 | 23.7 | — | 24.4 | |||||||||||||||
Assets held in separate accounts | — | — | 181.5 | 1,655.6 | 1,837.1 | |||||||||||||||
Other assets | 748.6 | 1,406.1 | 82.8 | 254.8 | 2,492.3 | |||||||||||||||
Assets of consolidated investment entities | — | — | — | 746.5 | 746.5 | |||||||||||||||
|
|
|
|
|
|
|
|
|
| |||||||||||
Total assets | $ | 4,809.6 | $ | 9,497.6 | $ | 6,827.1 | $ | 10,708.7 | $ | 31,843.0 | ||||||||||
|
|
|
|
|
|
|
|
|
| |||||||||||
Liabilities | ||||||||||||||||||||
Policyholder benefits and claims payable(2) | $ | 1,258.8 | $ | 405.0 | $ | 5,807.0 | $ | 6,708.8 | $ | 14,179.6 | ||||||||||
Unearned premiums | 1,434.9 | 5,518.8 | 380.6 | (295.7 | ) | 7,038.6 | ||||||||||||||
Debt | — | — | — | 1,068.2 | 1,068.2 | |||||||||||||||
Liabilities related to separate accounts | — | — | 181.5 | 1,655.6 | 1,837.1 | |||||||||||||||
Deferred gain on disposal of businesses | — | — | — | 128.1 | 128.1 | |||||||||||||||
Accounts payable and other liabilities | 579.0 | 1,606.5 | 30.4 | 520.6 | 2,736.5 | |||||||||||||||
Liabilities of consolidated investment entities | — | — | — | 573.4 | 573.4 | |||||||||||||||
|
|
|
|
|
|
|
|
|
| |||||||||||
Total liabilities | 3,272.7 | 7,530.3 | 6,399.5 | 10,359.0 | 27,561.5 | |||||||||||||||
|
|
|
|
|
|
|
|
|
| |||||||||||
Stockholders’ equity | ||||||||||||||||||||
Equity, excluding accumulated other comprehensive income | 1,536.9 | 1,967.3 | 427.6 | 104.8 | 4,036.6 | |||||||||||||||
Accumulated other comprehensive income | — | — | — | 234.0 | 234.0 | |||||||||||||||
|
|
|
|
|
|
|
|
|
| |||||||||||
Total Assurant, Inc. stockholders’ equity(3) | 1,536.9 | 1,967.3 | 427.6 | 338.8 | 4,270.6 | |||||||||||||||
|
|
|
|
|
|
|
|
|
| |||||||||||
Non-controlling interest | — | — | — | 10.9 | 10.9 | |||||||||||||||
|
|
|
|
|
|
|
|
|
| |||||||||||
Total equity | 1,536.9 | 1,967.3 | 427.6 | 349.7 | 4,281.5 | |||||||||||||||
|
|
|
|
|
|
|
|
|
| |||||||||||
Total liabilities and equity | $ | 4,809.6 | $ | 9,497.6 | $ | 6,827.1 | $ | 10,708.7 | $ | 31,843.0 | ||||||||||
|
|
|
|
|
|
|
|
|
| |||||||||||
| (1) | Total Corporate and Other includes all accumulated other comprehensive income, reinsurance recoverables and separate accounts related to the sale of businesses by reinsurance. Additionally, the Total Corporate and Other segment includes amounts related to the Assurant Health business, which is in runoff. |
| (2) | Global Housing’s reinsurance recoverables and policyholder benefits and claims payable as of December 31, 2018 and 2017 include $120 million and $555 million, respectively, of balances ceded to the U.S. government. Assurant acts as an administrator for the U.S. government under the voluntary National Flood Insurance Program. For Total Corporate and Other, the decrease in these balances was due to the sale of Time Insurance Company. |
| (3) | The Equity, excluding accumulated other comprehensive income, as of December 31, 2017 includes the $177 million benefit from the Tax Cuts and Jobs Act allocated to the respective impacted segments. |
11
Assurant, Inc.
Investments
(Unaudited)
| As of December 31, | As of December 31, | |||||||||||||||
($ in millions) | 2018 | 2017 | ||||||||||||||
Investments by type | ||||||||||||||||
Fixed maturity securities available for sale, at fair value | $ | 11,257.1 | 76.8 | % | $ | 9,662.6 | 77.0 | % | ||||||||
Equity securities, at fair value | ||||||||||||||||
Preferred stock | 308.3 | 2.1 | % | 350.3 | 2.8 | % | ||||||||||
Common stock | 15.3 | 0.1 | % | 17.7 | 0.1 | % | ||||||||||
Mutual Funds | 55.2 | 0.4 | % | |||||||||||||
Commercial mortgage whole loans on real estate, at amortized cost | 759.6 | 5.2 | % | 670.2 | 5.4 | % | ||||||||||
Short-term investments | 373.2 | 2.5 | % | 284.1 | 2.3 | % | ||||||||||
Other investments(1) | 635.2 | 4.3 | % | 568.6 | 4.5 | % | ||||||||||
|
|
|
|
|
|
|
| |||||||||
Total investments | 13,403.9 | 91.4 | % | 11,553.5 | 92.1 | % | ||||||||||
Cash and cash equivalents | 1,254.0 | 8.6 | % | 996.8 | 7.9 | % | ||||||||||
|
|
|
|
|
|
|
| |||||||||
Total investments and cash and cash equivalents | $ | 14,657.9 | 100.0 | % | $ | 12,550.3 | 100.0 | % | ||||||||
|
|
|
|
|
|
|
| |||||||||
Fixed Maturity Securities by Credit Quality (Fair Value) | ||||||||||||||||
Aaa / Aa / A | $ | 7,329.8 | 65.1 | % | $ | 6,155.4 | 63.7 | % | ||||||||
Baa | 3,322.7 | 29.5 | % | 2,982.5 | 30.9 | % | ||||||||||
Ba | 447.9 | 4.0 | % | 400.8 | 4.1 | % | ||||||||||
B and lower | 156.7 | 1.4 | % | 123.9 | 1.3 | % | ||||||||||
|
|
|
|
|
|
|
| |||||||||
Total | $ | 11,257.1 | 100.0 | % | $ | 9,662.6 | 100.0 | % | ||||||||
|
|
|
|
|
|
|
| |||||||||
| (1) | Excludes the Company’s direct investments in consolidated investment entities of $207.7 million and $161.9 million as of December 31, 2018 and 2017, which were included in the assets of consolidated investment entities in the consolidated balance sheets. Refer to Note 8 to the Consolidated Financial Statements in the 2018 Form10-K for further detail. |
12
Assurant, Inc.
Investments (continued)
(Unaudited)
| As of December 31, 2018 | As of December 31, 2017 | |||||||||||||||||||||||||||||||
($ in millions) | Book Value | Fair Value | % of Fair Value | Net Unrealized Gain (Loss) | Book Value | Fair Value | % of Fair Value | Net Unrealized Gain (Loss) | ||||||||||||||||||||||||
Fixed Maturity Securities by Issuer Type: | ||||||||||||||||||||||||||||||||
Government: | ||||||||||||||||||||||||||||||||
U.S. Government and government agencies | $ | 381.4 | $ | 384.6 | 3.4 | % | $ | 3.2 | $ | 180.6 | $ | 182.6 | 1.9 | % | $ | 2.0 | ||||||||||||||||
States, municipalities and political subdivisions | 238.9 | 256.2 | 2.3 | % | 17.3 | 302.3 | 326.2 | 3.4 | % | 23.9 | ||||||||||||||||||||||
Foreign governments | 856.3 | 912.1 | 8.1 | % | 55.8 | 524.8 | 596.8 | 6.2 | % | 72.0 | ||||||||||||||||||||||
Corporate(1): | ||||||||||||||||||||||||||||||||
Canadian municipals | 89.6 | 98.8 | 0.9 | % | 9.2 | 96.1 | 110.6 | 1.1 | % | 14.5 | ||||||||||||||||||||||
Consumer cyclical | 638.4 | 670.2 | 6.0 | % | 31.8 | 558.7 | 632.9 | 6.5 | % | 74.2 | ||||||||||||||||||||||
Consumernon-cyclical | 438.1 | 461.9 | 4.1 | % | 23.8 | 485.7 | 544.7 | 5.6 | % | 59.0 | ||||||||||||||||||||||
Energy | 683.2 | 708.5 | 6.3 | % | 25.3 | 599.2 | 671.3 | 6.9 | % | 72.1 | ||||||||||||||||||||||
Financials | 2,247.3 | 2,340.5 | 20.8 | % | 93.2 | 1,835.2 | 2,030.9 | 21.0 | % | 195.7 | ||||||||||||||||||||||
Health care | 462.6 | 476.0 | 4.2 | % | 13.4 | 371.2 | 405.4 | 4.2 | % | 34.2 | ||||||||||||||||||||||
Industrials | 921.3 | 969.6 | 8.6 | % | 48.3 | 791.2 | 904.2 | 9.4 | % | 113.0 | ||||||||||||||||||||||
Materials | 283.9 | 285.1 | 2.5 | % | 1.2 | 190.7 | 207.9 | 2.2 | % | 17.2 | ||||||||||||||||||||||
Other | 25.8 | 25.4 | 0.2 | % | (0.4 | ) | ||||||||||||||||||||||||||
Technology | 323.8 | 327.2 | 2.9 | % | 3.4 | 314.4 | 333.1 | 3.4 | % | 18.7 | ||||||||||||||||||||||
Telecommunications | 281.8 | 304.1 | 2.7 | % | 22.3 | 293.3 | 338.3 | 3.5 | % | 45.0 | ||||||||||||||||||||||
Utilities | 969.8 | 1,046.9 | 9.3 | % | 77.1 | 901.9 | 1,040.0 | 10.8 | % | 138.1 | ||||||||||||||||||||||
Asset-backed securities | 513.6 | 504.5 | 4.5 | % | (9.1 | ) | 188.4 | 190.2 | 2.0 | % | 1.8 | |||||||||||||||||||||
Commercial mortgage-backed securities | 79.1 | 79.7 | 0.7 | % | 0.6 | 38.6 | 38.1 | 0.4 | % | (0.5 | ) | |||||||||||||||||||||
Residential mortgage-backed securities (RMBS): | 1,399.1 | 1,405.8 | 12.5 | % | 6.7 | 1,084.2 | 1,109.4 | 11.5 | % | 25.2 | ||||||||||||||||||||||
|
|
|
|
|
|
|
|
|
|
|
|
|
|
|
| |||||||||||||||||
Total fixed maturity securities | $ | 10,834.0 | $ | 11,257.1 | 100.0 | % | $ | 423.1 | $ | 8,756.5 | $ | 9,662.6 | 100.0 | % | $ | 906.1 | ||||||||||||||||
|
|
|
|
|
|
|
|
|
|
|
|
|
|
|
| |||||||||||||||||
| (1) | Industry classifications are based on a combination of published index classifications as well as Assurant’s view of underlying issuer risk. These resulting classifications are then mapped to the Global Industry Classification Standard (GICS®). |
13
Assurant, Inc.
Investment Results by Asset Category and Annualized Yields
(Unaudited)
| Quarter Ended December 31 | Quarter Ended December 31 | |||||||||||||||||||||||
| 2018 | 2017 | |||||||||||||||||||||||
($ in millions) | Yield(1) | Investment Income | Net realized gain (loss) | Yield | Investment Income | Net realized gain (loss) | ||||||||||||||||||
Fixed maturity securities, available for sale | 4.37 | % | $ | 117.6 | $ | (25.0 | ) | 4.57 | % | $ | 100.9 | $ | 5.2 | |||||||||||
Equity securities | 6.64 | % | 5.9 | (19.6 | ) | 6.48 | % | 5.4 | 0.9 | |||||||||||||||
Commercial mortgage loans on real estate | 4.53 | % | 8.6 | 0.6 | 4.67 | % | 7.7 | 1.3 | ||||||||||||||||
Cash and short-term investments | 3.19 | % | 14.1 | — | 2.24 | % | 7.1 | — | ||||||||||||||||
Other investments(2) | 21.12 | % | 41.0 | (2.1 | ) | 2.09 | % | 3.3 | (2.4 | ) | ||||||||||||||
|
|
|
|
|
|
|
| |||||||||||||||||
Total | 187.2 | $ | (46.1 | ) | 124.4 | $ | 5.0 | |||||||||||||||||
|
|
|
| |||||||||||||||||||||
Investment expenses | (6.4 | ) | (5.5 | ) | ||||||||||||||||||||
|
|
|
| |||||||||||||||||||||
Net investment income | $ | 180.8 | $ | 118.9 | ||||||||||||||||||||
|
|
|
| |||||||||||||||||||||
Gross realized gains | $ | 10.8 | $ | 13.1 | ||||||||||||||||||||
Gross realized losses | (56.8 | ) | (8.1 | ) | ||||||||||||||||||||
Other-than-temporary impairments | (0.1 | ) | — | |||||||||||||||||||||
|
|
|
| |||||||||||||||||||||
Net realized (losses) gains on investments | $ | (46.1 | ) | $ | 5.0 | |||||||||||||||||||
|
|
|
| |||||||||||||||||||||
| Twelve Months Ended December 31 | Twelve Months Ended December 31 | |||||||||||||||||||||||
| 2018 | 2017 | |||||||||||||||||||||||
| Yield(1) | Investment Income | Net realized gain (loss) | Yield | Investment Income | Net realized gain (loss) | |||||||||||||||||||
Fixed maturity securities, available for sale | 4.46 | % | $ | 451.6 | $ | (42.9 | ) | 4.68 | % | $ | 411.8 | $ | 21.6 | |||||||||||
Equity securities | 6.38 | % | 21.5 | (31.8 | ) | 6.42 | % | 22.8 | 7.7 | |||||||||||||||
Commercial mortgage loans on real estate | 4.65 | % | 33.4 | 0.6 | 4.97 | % | 31.5 | 1.3 | ||||||||||||||||
Cash and short-term investments | 2.78 | % | 47.7 | 0.1 | 1.93 | % | 23.0 | — | ||||||||||||||||
Other investments(2) | 9.35 | % | 67.5 | 11.3 | 3.88 | % | 26.6 | (0.5 | ) | |||||||||||||||
|
|
|
|
|
|
|
| |||||||||||||||||
Total | 621.7 | $ | (62.7 | ) | 515.7 | $ | 30.1 | |||||||||||||||||
|
|
|
| |||||||||||||||||||||
Investment expenses | (23.3 | ) | (21.9 | ) | ||||||||||||||||||||
|
|
|
| |||||||||||||||||||||
Net investment income | $ | 598.4 | $ | 493.8 | ||||||||||||||||||||
|
|
|
| |||||||||||||||||||||
Gross realized gains | $ | 66.5 | $ | 53.6 | ||||||||||||||||||||
Gross realized losses | (128.6 | ) | (22.6 | ) | ||||||||||||||||||||
Other-than-temporary impairments | (0.6 | ) | (0.9 | ) | ||||||||||||||||||||
|
|
|
| |||||||||||||||||||||
Net realized (losses) gains on investments | $ | (62.7 | ) | $ | 30.1 | |||||||||||||||||||
|
|
|
| |||||||||||||||||||||
| (1) | Yield calculation utilitzed an annualized, weighted average approach due to the acquisition of TWG on May 31, 2018. |
| (2) | Consists primarily of investments in joint venture partnerships, invested assets associated with a modified coinsurance agreement, invested assets associated with deferred compensation, policy loans and the Company’s direct investments in consolidated investment entities (“CIEs”). The net revenues and expenses of the CIEs attributed to third-party investors has been excluded. |
14
Assurant, Inc.
Summary of Net Operating Income (Loss)(1) Disclosed Items(2)
Income / (Expense) Items
(Unaudited)
| 2018 | 2017 | |||||||||||||||||||||||||||||||||||||||||||||||||||||||||||||||||
($ in millions, after-tax) | 4Q | 3Q | 2Q | 1Q | 4Q | 3Q | 2Q | 1Q | ||||||||||||||||||||||||||||||||||||||||||||||||||||||||||
| $ | Diluted EPS | $ | Diluted EPS | $ | Diluted EPS | $ | Diluted EPS | $ | Diluted EPS | $ | Diluted EPS | $ | Diluted EPS | $ | Diluted EPS | |||||||||||||||||||||||||||||||||||||||||||||||||||
Global Housing: | ||||||||||||||||||||||||||||||||||||||||||||||||||||||||||||||||||
Reportable catastrophes(3) | (a)(c)(e) | (95.4 | ) | (1.51 | ) | (66.6 | ) | (1.04 | ) | 1.0 | 0.02 | (8.7 | ) | (0.16 | ) | (3.1 | ) | (0.06 | ) | (186.8 | ) | (3.43 | ) | — | — | (0.6 | ) | (0.01 | ) | |||||||||||||||||||||||||||||||||||||
Catastrophe reinsurance premiums(4) | (e) | (6.2 | ) | (0.10 | ) | — | — | — | — | — | — | — | — | — | — | — | — | — | — | |||||||||||||||||||||||||||||||||||||||||||||||
Global Lifestyle: | ||||||||||||||||||||||||||||||||||||||||||||||||||||||||||||||||||
Client recoverables | (d) | 9.3 | 0.15 | — | — | — | — | — | — | 5.0 | 0.09 | — | — | — | — | 7.5 | 0.13 | |||||||||||||||||||||||||||||||||||||||||||||||||
Benefit/provision for income taxes | (b) | — | — | — | — | 3.9 | 0.07 | — | — | — | — | 9.6 | 0.18 | — | — | — | — | |||||||||||||||||||||||||||||||||||||||||||||||||
Reportable catastrophes(3) | (a)(c)(e) | (0.2 | ) | — | (1.1 | ) | (0.02 | ) | — | — | 1.3 | 0.02 | 3.0 | 0.06 | (5.0 | ) | (0.09 | ) | — | — | — | — | ||||||||||||||||||||||||||||||||||||||||||||
Global Preneed: | ||||||||||||||||||||||||||||||||||||||||||||||||||||||||||||||||||
Software impairment | (c) | — | — | — | — | — | — | — | — | (5.0 | ) | (0.09 | ) | — | — | — | — | — | — | |||||||||||||||||||||||||||||||||||||||||||||||
Corporate: | ||||||||||||||||||||||||||||||||||||||||||||||||||||||||||||||||||
Workforce reduction | (c) | — | — | — | — | | — | | — | — | — | (4.6 | ) | (0.08 | ) | — | — | — | — | — | — | |||||||||||||||||||||||||||||||||||||||||||||
Statement of Operations line impact:
| (a) | Policyholder benefits |
| (b) | Provision (benefit) for income taxes |
| (c) | Selling, underwriting, general and administrative expenses |
| (d) | Fees and other income |
| (e) | Net earned premiums, for 4Q 2018, 3Q 2018, 2Q 2018, 1Q 2018, 4Q 2017 and 3Q 2017 |
| (1) | See Footnote (1) Regulation G - Non GAAP Financial Measures. |
| (2) | The table presents items that have been disclosed because, although they are part of the operations of the Company, they are unusual or highly variable and had a significant impact on net operating income for one or more quarters. These items generally consist of reportable catastrophes and other unusual or highly variable items. |
| (3) | Represents reportable catastrophe losses net of reinsurance and client profit sharing adjustments and including reinstatement and other premiums. Reportable catastrophes include individual ISO events greater than $5 million(pre-tax). |
| (4) | Represents an increase in 2018 reinsurance premiums to align with full-year catastrophe exposure. |
15
Assurant, Inc.
Ratings Summary*
(Unaudited)
| As of December 31, 2018 | ||||||
| A.M. Best | Moody’s | Standard & Poor’s | ||||
Company | ||||||
American Bankers Insurance Company of Florida | A | A3 | A | |||
American Bankers Life Assurance Company of Florida | A- | Baa1 | A | |||
American Memorial Life Insurance Company | A- | N/A | A | |||
American Security Insurance Company | A | A3 | A | |||
Assurant Life of Canada | A- | N/A | N/A | |||
Caribbean American Life Assurance Company | A- | N/A | N/A | |||
Caribbean American Property Insurance Company | A | N/A | N/A | |||
London General Insurance Company Ltd | A | N/A | N/A | |||
Reliable Lloyds Insurance Company | A | N/A | N/A | |||
Standard Guaranty Insurance Company | A | N/A | N/A | |||
Union Security Insurance Company(1) | A- | Baa1 | A | |||
Union Security Life Insurance Company of New York(1) | A- | N/A | N/A | |||
Virginia Surety Insurance Company | A | N/A | N/A | |||
Voyager Indemnity Insurance Company | A | N/A | N/A | |||
Commercial Paper | AMB-1 | P-3 | A-2 | |||
Senior Debt | bbb+ | Baa3 | BBB | |||
Subordinated Debt | bbb | Ba1 | BB+ | |||
| * | Additional information on Assurant’s ratings is available in the Investor Relations section on Assurant’s website www.assurant.com. |
| (1) | A.M. Best ratings of Union Security Insurance Company and Union Security Life Insurance Company of New York currently have negative outlooks. |
16
Regulation G - Non GAAP Financial Measures
Assurant uses the followingnon-GAAP financial measures to analyze the Company’s operating performance. Because Assurant’s calculation of these measures may differ from similar measures used by other companies, investors should be careful when comparing Assurant’snon-GAAP financial measures to those of other companies.
(1) Net Operating Income:Assurant uses net operating income as an important measure of the Company’s operating performance. Net operating income equals net income attributable to common stockholders excluding Assurant Health runoff operations, net realized (losses) gains on investments, amortization of deferred gains (including Assurant Employee Benefits), net charges relating to the acquisition of The Warranty Group (TWG), foreign exchange gains (losses) from remeasurement of monetary assets and liabilities, loss on sale of Mortgage Solutions and other highly variable or unusual items. Additionally, the calculation for Twelve Months 2017 excludes aone-time estimated benefit related to the enactment of the Tax Cuts and Jobs Act (TCJA) which was signed into law on December 22, 2017. The Company believes net operating income provides investors a valuable measure of the performance of the Company’s ongoing business because the excluded items do not represent the ongoing operations of the Company. The comparable GAAP measure is net income attributable to common stockholders.
| 2018 | Twelve Months Ended December 31, | |||||||||||||||||||||||
| ($ in millions) | 4Q | 3Q | 2Q | 1Q | 2018 | 2017 | ||||||||||||||||||
Global Housing | $ | (12.4 | ) | $ | 19.4 | $ | 72.6 | $ | 71.2 | $ | 150.8 | $ | 97.4 | |||||||||||
Global Lifestyle | 97.9 | 75.9 | 68.1 | 55.8 | 297.7 | 178.0 | ||||||||||||||||||
Global Preneed | 16.4 | 16.8 | 14.7 | 9.8 | 57.7 | 39.6 | ||||||||||||||||||
Corporate and other | (27.5 | ) | (19.0 | ) | (17.5 | ) | (20.0 | ) | (84.0 | ) | (62.8 | ) | ||||||||||||
Interest expense | (20.8 | ) | (21.0 | ) | (14.4 | ) | (9.6 | ) | (65.8 | ) | (32.2 | ) | ||||||||||||
Preferred stock dividends(1) | (4.7 | ) | (4.7 | ) | (1.6 | ) | — | (11.0 | ) | — | ||||||||||||||
|
|
|
|
|
|
|
|
|
|
|
| |||||||||||||
Net operating income | 48.9 | 67.4 | 121.9 | 107.2 | 345.4 | 220.0 | ||||||||||||||||||
|
|
|
|
|
|
|
|
|
|
|
| |||||||||||||
Adjustments, net of tax: | ||||||||||||||||||||||||
Assurant Health runoff operations | 0.2 | 0.2 | 0.2 | 2.0 | 2.6 | 10.6 | ||||||||||||||||||
Net realized (losses) gains on investments | (36.2 | ) | (4.6 | ) | (9.0 | ) | 0.4 | (49.4 | ) | 19.6 | ||||||||||||||
Amortization of deferred gains on disposal of businesses | 8.4 | 10.0 | 11.9 | 14.6 | 44.9 | 67.5 | ||||||||||||||||||
Impact of TCJA at enactment | — | (1.5 | ) | — | — | (1.5 | ) | 177.0 | ||||||||||||||||
Net TWG acquisition related charges(2) | (5.9 | ) | (8.0 | ) | (32.5 | ) | (20.5 | ) | (66.9 | ) | (8.1 | ) | ||||||||||||
Change in tax liabilities | — | — | — | — | — | 27.1 | ||||||||||||||||||
Loss on sale of Mortgage Solutions | 0.5 | 2.0 | (34.4 | ) | — | (31.9 | ) | — | ||||||||||||||||
Foreign exchange related (losses) gains(3) | (0.2 | ) | (18.3 | ) | 3.8 | — | (14.7 | ) | — | |||||||||||||||
Other Adjustments: | ||||||||||||||||||||||||
Gain related to benefit plan activity | 1.0 | 0.8 | 1.4 | 1.2 | 4.4 | 13.5 | ||||||||||||||||||
Gain on sale of Time Insurance Company | 14.5 | — | — | — | 14.5 | — | ||||||||||||||||||
Net charge related to Green Tree Insurance Agency acquisition(4) | (11.6 | ) | — | — | — | (11.6 | ) | — | ||||||||||||||||
Gain on sale of buildings | — | — | — | — | — | 3.7 | ||||||||||||||||||
Post-close cont. liab. on prev. disposition | — | — | — | (0.9 | ) | (0.9 | ) | (11.3 | ) | |||||||||||||||
Change in fair value of derivative investment | 0.7 | 0.3 | (1.1 | ) | 2.0 | 1.9 | — | |||||||||||||||||
|
|
|
|
|
|
|
|
|
|
|
| |||||||||||||
Net income attributable to common stockholders | $ | 20.3 | $ | 48.3 | $ | 62.2 | $ | 106.0 | $ | 236.8 | $ | 519.6 | ||||||||||||
|
|
|
|
|
|
|
|
|
|
|
| |||||||||||||
| ($ in millions) | 2018 | Twelve Months Ended December 31, | ||||||||||||||||||||||
| 4Q | 3Q | 2Q | 1Q | 2018 | 2017 | |||||||||||||||||||
Global Housing | $ | (12.4 | ) | $ | 19.4 | $ | 72.6 | $ | 71.2 | $ | 150.8 | $ | 97.4 | |||||||||||
Global Lifestyle | 97.9 | 75.9 | 68.1 | 55.8 | 297.7 | 178.0 | ||||||||||||||||||
Global Preneed | 16.4 | 16.8 | 14.7 | 9.8 | 57.7 | 39.6 | ||||||||||||||||||
Corporate and other | (27.5 | ) | (19.0 | ) | (17.5 | ) | (20.0 | ) | (84.0 | ) | (62.8 | ) | ||||||||||||
Interest expense | (20.8 | ) | (21.0 | ) | (14.4 | ) | (9.6 | ) | (65.8 | ) | (32.2 | ) | ||||||||||||
Preferred stock dividends(1) | (4.7 | ) | (4.7 | ) | (1.6 | ) | — | (11.0 | ) | — | ||||||||||||||
|
|
|
|
|
|
|
|
|
|
|
| |||||||||||||
Net operating income | 48.9 | 67.4 | 121.9 | 107.2 | 345.4 | 220.0 | ||||||||||||||||||
|
|
|
|
|
|
|
|
|
|
|
| |||||||||||||
Adjustments,pre-tax: | ||||||||||||||||||||||||
Assurant Health runoff operations | 0.3 | — | 0.3 | 2.6 | 3.2 | 16.0 | ||||||||||||||||||
Net realized (losses) gains on investments | (46.8 | ) | (5.7 | ) | (11.4 | ) | 0.5 | (63.4 | ) | 30.1 | ||||||||||||||
Amortization of deferred gains on disposal of businesses | 10.7 | 12.7 | 15.0 | 18.5 | 56.9 | 103.9 | ||||||||||||||||||
Impact of TCJA at enactment | — | (1.5 | ) | — | — | (1.5 | ) | 177.0 | ||||||||||||||||
Net TWG acquisition related charges(2) | (7.3 | ) | (10.6 | ) | (38.5 | ) | (26.0 | ) | (82.4 | ) | (12.5 | ) | ||||||||||||
Change in tax liabilities | — | — | — | — | — | 27.1 | ||||||||||||||||||
Loss on sale of Mortgage Solutions | 0.7 | 2.5 | (43.5 | ) | — | (40.3 | ) | — | ||||||||||||||||
Foreign exchange related (losses) gains(3) | (1.6 | ) | (18.3 | ) | 5.1 | — | (14.8 | ) | — | |||||||||||||||
Other Adjustments: | ||||||||||||||||||||||||
Gain related to benefit plan activity | 1.2 | 1.0 | 1.8 | 1.6 | 5.6 | 20.8 | ||||||||||||||||||
Gain on sale of Time Insurance Company | 18.4 | — | — | — | 18.4 | — | ||||||||||||||||||
Net charge related to Green Tree Insurance Agency acquisition(4) | (16.0 | ) | — | — | — | (16.0 | ) | — | ||||||||||||||||
Gain on sale of buildings | — | — | — | — | — | 5.7 | ||||||||||||||||||
Post-close cont. liab. on prev. disposition | — | — | — | (1.1 | ) | (1.1 | ) | (17.4 | ) | |||||||||||||||
Change in fair value of derivative investment | 1.2 | 0.8 | (1.7 | ) | 2.7 | 3.0 | — | |||||||||||||||||
Benefit (provision) for income taxes | 10.6 | — | 13.3 | — | 23.9 | (51.1 | ) | |||||||||||||||||
|
|
|
|
|
|
|
|
|
|
|
| |||||||||||||
Net income attributable to common stockholders | $ | 20.3 | $ | 48.3 | $ | 62.2 | $ | 106.0 | $ | 236.8 | $ | 519.6 | ||||||||||||
|
|
|
|
|
|
|
|
|
|
|
| |||||||||||||
| (1) | Twelve Months 2018 and 2Q 2018 net operating income exclude $3.2 million of the preferred stock dividends related to the period prior to the acquisition of The Warranty Group and is included below in the net TWG acquisition related charges. |
| (2) | Refer to page 10 for additional details about the components of net TWG acquisition related charges. |
| (3) | 3Q and 4Q 2018 include a total of $17.2 million of net losses from foreign exchange related to the remeasurement of net monetary assets in Argentina as a result of the classification of Argentina’s economy as highly inflationary beginning July 1, 2018. |
| (4) | Includes a $16.4 millionafter-tax ($20.8 millionpre-tax) impairment of certain intangible assets acquired through the acquisition of Green Tree due to the financial difficulty of a business partner providing new and renewal business to Green Tree. Additionally, the Company eliminated a $4.8 million after-tax ($4.8 millionpre-tax) contingentearn-out liability based on post-acquisition performance. As of December 31, 2018, the Company does not expect to pay any of the potentialearn-out related to the acquisition of Green Tree. |
17
Regulation G - Non GAAP Financial Measures (continued)
(2) Net Operating Income, Excluding Reportable Catastrophes:Assurant uses net operating income (defined above), excluding reportable catastrophes as another important measure of the Company’s operating performance. Reportable catastrophes represent reportable catastrophe losses net of reinsurance and client profit sharing adjustments and including reinstatement and other premiums. Reportable catastrophe losses include ISO events greater than $5 million(pre-tax). The Company believes this metric provides investors a valuable measure of the performance of the Company’s ongoing business because it excludes reportable catastrophes, which can be volatile. The comparable GAAP measure is net income attributable to common stockholders.
| 2018 | Twelve Months Ended December 31, | |||||||||||||||||||||||
| ($ in millions) | 4Q | 3Q | 2Q | 1Q | 2018 | 2017 | ||||||||||||||||||
Global Housing, excluding reportable catastrophes | $ | 83.0 | $ | 86.0 | $ | 71.6 | $ | 79.9 | $ | 320.5 | $ | 287.9 | ||||||||||||
Global Lifestyle(1) | 98.1 | 77.0 | 68.1 | 54.5 | 297.7 | 180.0 | ||||||||||||||||||
Global Preneed | 16.4 | 16.8 | 14.7 | 9.8 | 57.7 | 39.6 | ||||||||||||||||||
Corporate and other | (27.5 | ) | (19.0 | ) | (17.5 | ) | (20.0 | ) | (84.0 | ) | (62.8 | ) | ||||||||||||
Interest expense | (20.8 | ) | (21.0 | ) | (14.4 | ) | (9.6 | ) | (65.8 | ) | (32.2 | ) | ||||||||||||
Preferred stock dividends | (4.7 | ) | (4.7 | ) | (1.6 | ) | — | (11.0 | ) | — | ||||||||||||||
|
|
|
|
|
|
|
|
|
|
|
| |||||||||||||
Net operating income, excluding reportable catastrophes | 144.5 | 135.1 | 120.9 | 114.6 | 515.1 | 412.5 | ||||||||||||||||||
|
|
|
|
|
|
|
|
|
|
|
| |||||||||||||
Adjustments, net of tax: | ||||||||||||||||||||||||
Assurant Health runoff operations | 0.2 | 0.2 | 0.2 | 2.0 | 2.6 | 10.6 | ||||||||||||||||||
Net realized (losses) gains on investments | (36.2 | ) | (4.6 | ) | (9.0 | ) | 0.4 | (49.4 | ) | 19.6 | ||||||||||||||
Reportable catastrophes | (95.6 | ) | (67.7 | ) | 1.0 | (7.4 | ) | (169.7 | ) | (192.5 | ) | |||||||||||||
Amortization of deferred gains on disposal of businesses | 8.4 | 10.0 | 11.9 | 14.6 | 44.9 | 67.5 | ||||||||||||||||||
Impact of TCJA at enactment | — | (1.5 | ) | — | — | (1.5 | ) | 177.0 | ||||||||||||||||
Net TWG acquisition related charges(2) | (5.9 | ) | (8.0 | ) | (32.5 | ) | (20.5 | ) | (66.9 | ) | (8.1 | ) | ||||||||||||
Change in tax liabilities | — | — | — | — | — | 27.1 | ||||||||||||||||||
Loss on sale of Mortgage Solutions | 0.5 | 2.0 | (34.4 | ) | — | (31.9 | ) | — | ||||||||||||||||
Foreign exchange related (losses) gains | (0.2 | ) | (18.3 | ) | 3.8 | — | (14.7 | ) | — | |||||||||||||||
Other Adjustments: | ||||||||||||||||||||||||
Gain related to benefit plan activity | 1.0 | 0.8 | 1.4 | 1.2 | 4.4 | 13.5 | ||||||||||||||||||
Gain on sale of Time Insurance Company | 14.5 | — | — | — | 14.5 | — | ||||||||||||||||||
Net charge related to Green Tree Insurance Agency acquisition(4) | (11.6 | ) | — | — | — | (11.6 | ) | — | ||||||||||||||||
Gain on sale of buildings | — | — | — | — | — | 3.7 | ||||||||||||||||||
Post-close cont. liab. on prev. disposition | — | — | — | (0.9 | ) | (0.9 | ) | (11.3 | ) | |||||||||||||||
Change in fair value of derivative investment | 0.7 | 0.3 | (1.1 | ) | 2.0 | 1.9 | — | |||||||||||||||||
|
|
|
|
|
|
|
|
|
|
|
| |||||||||||||
Net income attributable to common stockholders | $ | 20.3 | $ | 48.3 | $ | 62.2 | $ | 106.0 | $ | 236.8 | $ | 519.6 | ||||||||||||
|
|
|
|
|
|
|
|
|
|
|
| |||||||||||||
| ($ in millions) | 2018 | Twelve Months Ended December 31, | ||||||||||||||||||||||
| 4Q | 3Q | 2Q | 1Q | 2018 | 2017 | |||||||||||||||||||
Global Housing, excluding reportable catastrophes | $ | 83.0 | $ | 86.0 | $ | 71.6 | $ | 79.9 | $ | 320.5 | $ | 287.9 | ||||||||||||
Global Lifestyle(1) | 98.1 | 77.0 | 68.1 | 54.5 | 297.7 | 180.0 | ||||||||||||||||||
Global Preneed | 16.4 | 16.8 | 14.7 | 9.8 | 57.7 | 39.6 | ||||||||||||||||||
Corporate and other | (27.5 | ) | (19.0 | ) | (17.5 | ) | (20.0 | ) | (84.0 | ) | (62.8 | ) | ||||||||||||
Interest expense | (20.8 | ) | (21.0 | ) | (14.4 | ) | (9.6 | ) | (65.8 | ) | (32.2 | ) | ||||||||||||
Preferred stock dividends | (4.7 | ) | (4.7 | ) | (1.6 | ) | — | (11.0 | ) | — | ||||||||||||||
|
|
|
|
|
|
|
|
|
|
|
| |||||||||||||
Net operating income, excluding reportable catastrophes | 144.5 | 135.1 | 120.9 | 114.6 | 515.1 | 412.5 | ||||||||||||||||||
|
|
|
|
|
|
|
|
|
|
|
| |||||||||||||
Adjustments,pre-tax: | ||||||||||||||||||||||||
Assurant Health runoff operations | 0.3 | — | 0.3 | 2.6 | 3.2 | 16.0 | ||||||||||||||||||
Net realized (losses) gains on investments | (46.8 | ) | (5.7 | ) | (11.4 | ) | 0.5 | (63.4 | ) | 30.1 | ||||||||||||||
Reportable catastrophes | (121.0 | ) | (85.7 | ) | 1.3 | (9.4 | ) | (214.8 | ) | (295.7 | ) | |||||||||||||
Amortization of deferred gains on disposal of businesses | 10.7 | 12.7 | 15.0 | 18.5 | 56.9 | 103.9 | ||||||||||||||||||
Impact of TCJA at enactment | — | (1.5 | ) | — | — | (1.5 | ) | 177.0 | ||||||||||||||||
Net TWG acquisition related charges(2) | (7.3 | ) | (10.6 | ) | (38.5 | ) | (26.0 | ) | (82.4 | ) | (12.5 | ) | ||||||||||||
Change in tax liabilities | — | — | — | — | — | 27.1 | ||||||||||||||||||
Loss on sale of Mortgage Solutions | 0.7 | 2.5 | (43.5 | ) | — | (40.3 | ) | — | ||||||||||||||||
Foreign exchange related (losses) gains | (1.6 | ) | (18.3 | ) | 5.1 | — | (14.8 | ) | — | |||||||||||||||
Other Adjustments: | ||||||||||||||||||||||||
Gain related to benefit plan activity | 1.2 | 1.0 | 1.8 | 1.6 | 5.6 | 20.8 | ||||||||||||||||||
Gain on sale of Time Insurance Company | 18.4 | — | — | — | 18.4 | — | ||||||||||||||||||
Net charge related to Green Tree Insurance Agency acquisition(4) | (16.0 | ) | — | — | — | (16.0 | ) | — | ||||||||||||||||
Gain on sale of buildings | — | — | — | — | — | 5.7 | ||||||||||||||||||
Post-close cont. liab. on prev. disposition | — | — | — | (1.1 | ) | (1.1 | ) | (17.4 | ) | |||||||||||||||
Change in fair value of derivative investment | 1.2 | 0.8 | (1.7 | ) | 2.7 | 3.0 | — | |||||||||||||||||
Benefit for income taxes | 36.0 | 18.0 | 13.0 | 2.0 | 69.0 | 52.1 | ||||||||||||||||||
|
|
|
|
|
|
|
|
|
|
|
| |||||||||||||
Net income attributable to common stockholders | $ | 20.3 | $ | 48.3 | $ | 62.2 | $ | 106.0 | $ | 236.8 | $ | 519.6 | ||||||||||||
|
|
|
|
|
|
|
|
|
|
|
| |||||||||||||
| (1) | As a result of significant catastrophes, primarily Hurricane Harvey in 2017, Global Lifestyle excludes the impact of reportable catastrophes. Refer to page 15 for details. |
| (2) | Refer to page 10 for additional details about the components of net TWG acquisition related charges. |
| (3) | 3Q and 4Q 2018 include a total of $17.2 million of net losses from foreign exchange related to the remeasurement of net monetary assets in Argentina as a result of the classification of Argentina’s economy as highly inflationary beginning July 1, 2018. |
| (4) | Includes a $16.4 millionafter-tax ($20.8 millionpre-tax) impairment of certain intangible assets acquired through the acquisition of Green Tree due to the financial difficulty of a business partner providing new and renewal business to Green Tree. Additionally, the Company eliminated a $4.8 millionafter-tax ($4.8 millionpre-tax) contingentearn-out liability based on post-acquisition performance. As of December 31, 2018, the Company does not expect to pay any of the potentialearn-out related to the acquisition of Green Tree. |
18
Regulation G - Non GAAP Financial Measures (continued)
(3) Net Operating Income per Diluted Share: Assurant uses net operating income per diluted share as an important measure of the Company’s stockholder value. Net operating income per diluted share equals net operating income (defined above) divided by weighted average diluted shares outstanding, excluding any dilutive effect from the assumed conversion of the mandatory convertible preferred stock prior to the acquisition date. The Company believes this metric provides investors a valuable measure of stockholder value because it excludes items that do not represent the ongoing operations of the Company. In addition, it excludes the effect of the mandatory convertible preferred stock, which was used to finance the acquisition, prior to the acquisition date. The comparable GAAP measure is net income attributable to common stockholders per diluted share, defined as net income attributable to common stockholders plus any dilutive preferred stock dividends divided by weighted average diluted shares outstanding.
| 2018 | Twelve Months Ended December 31, | |||||||||||||||||||||||
| ($ per share) | 4Q | 3Q | 2Q | 1Q | 2018 | 2017 | ||||||||||||||||||
Net operating income per diluted share(1) | $ | 0.77 | $ | 1.06 | $ | 2.13 | $ | 2.00 | $ | 5.80 | $ | 3.98 | ||||||||||||
Adjustments per diluted share, net of tax: | ||||||||||||||||||||||||
Dilutive effect from mandatory convertible preferred stock | — | — | — | (0.02 | ) | — | — | |||||||||||||||||
Assurant Health runoff operations | — | — | — | 0.04 | 0.04 | 0.19 | ||||||||||||||||||
Net realized (losses) gains on investments | (0.57 | ) | (0.07 | ) | (0.16 | ) | 0.01 | (0.83 | ) | 0.35 | ||||||||||||||
Amortization of deferred gains on disposal of businesses | 0.13 | 0.16 | 0.21 | 0.27 | 0.75 | 1.22 | ||||||||||||||||||
Impact of TCJA at enactment | — | (0.02 | ) | — | — | (0.02 | ) | 3.20 | ||||||||||||||||
Net TWG acquisition related charges | (0.09 | ) | (0.13 | ) | (0.56 | ) | (0.38 | ) | (1.12 | ) | (0.15 | ) | ||||||||||||
Change in tax liabilities | — | — | — | — | — | 0.49 | ||||||||||||||||||
Loss on sale of Mortgage Solutions | 0.01 | 0.03 | (0.60 | ) | — | (0.54 | ) | — | ||||||||||||||||
Foreign exchange related (losses) gains | — | (0.28 | ) | 0.07 | — | (0.24 | ) | — | ||||||||||||||||
Other Adjustments: | ||||||||||||||||||||||||
Gain related to benefit plan activity | 0.01 | 0.01 | 0.02 | 0.02 | 0.07 | 0.24 | ||||||||||||||||||
Gain on sale of Time Insurance Company | 0.23 | — | — | — | 0.24 | — | ||||||||||||||||||
Net charge related to Green Tree Insurance Agency acquisition | (0.18 | ) | — | — | — | (0.19 | ) | — | ||||||||||||||||
Gain on sale of buildings | — | — | — | — | — | 0.07 | ||||||||||||||||||
Post-close cont. liab. on prev. disposition | — | — | — | (0.02 | ) | (0.01 | ) | (0.20 | ) | |||||||||||||||
Change in fair value of derivative investment | 0.01 | — | (0.02 | ) | 0.04 | 0.03 | — | |||||||||||||||||
|
|
|
|
|
|
|
|
|
|
|
| |||||||||||||
Net income attributable to common stockholders per diluted share(1) | $ | 0.32 | $ | 0.76 | $ | 1.09 | $ | 1.96 | $ | 3.98 | $ | 9.39 | ||||||||||||
|
|
|
|
|
|
|
|
|
|
|
| |||||||||||||
| ($ per share) | 2018 | Twelve Months Ended December 31, | ||||||||||||||||||||||
| 4Q | 3Q | 2Q | 1Q | 2018 | 2017 | |||||||||||||||||||
Net operating income per diluted share(1) | $ | 0.77 | $ | 1.06 | $ | 2.13 | $ | 2.00 | $ | 5.80 | $ | 3.98 | ||||||||||||
Adjustments per diluted share,pre-tax: | ||||||||||||||||||||||||
Dilutive effect from mandatory convertible preferred stock | — | — | — | (0.02 | ) | — | — | |||||||||||||||||
Assurant Health runoff operations | — | — | — | 0.05 | 0.05 | 0.29 | ||||||||||||||||||
Net realized (losses) gains on investments | (0.74 | ) | (0.09 | ) | (0.20 | ) | 0.01 | (1.06 | ) | 0.54 | ||||||||||||||
Amortization of deferred gains on disposal of businesses | 0.17 | 0.20 | 0.26 | 0.33 | 0.97 | 1.87 | ||||||||||||||||||
Impact of TCJA at enactment | — | (0.02 | ) | — | — | (0.03 | ) | 3.20 | ||||||||||||||||
Net TWG acquisition related charges | (0.12 | ) | (0.17 | ) | (0.66 | ) | (0.47 | ) | (1.38 | ) | (0.23 | ) | ||||||||||||
Change in tax liabilities | — | — | — | — | — | 0.49 | ||||||||||||||||||
Loss on sale of Mortgage Solutions | 0.02 | 0.04 | (0.76 | ) | — | (0.68 | ) | — | ||||||||||||||||
Foreign exchange related (losses) gains | (0.03 | ) | (0.29 | ) | 0.09 | — | (0.25 | ) | — | |||||||||||||||
Other Adjustments: | ||||||||||||||||||||||||
Gain related to benefit plan activity | 0.02 | 0.02 | 0.03 | 0.03 | 0.09 | 0.38 | ||||||||||||||||||
Gain on sale of Time Insurance Company | 0.29 | — | — | — | 0.31 | — | ||||||||||||||||||
Net charge related to Green Tree Insurance Agency acquisition | (0.25 | ) | — | — | — | (0.27 | ) | — | ||||||||||||||||
Gain on sale of buildings | — | — | — | — | — | 0.10 | ||||||||||||||||||
Post-close cont. liab. on prev. disposition | — | — | — | (0.02 | ) | (0.02 | ) | (0.31 | ) | |||||||||||||||
Change in fair value of derivative investment | 0.02 | 0.01 | (0.03 | ) | 0.05 | 0.05 | — | |||||||||||||||||
Benefit (provision) for income taxes | 0.17 | — | 0.23 | — | 0.40 | (0.92 | ) | |||||||||||||||||
|
|
|
|
|
|
|
|
|
|
|
| |||||||||||||
Net income attributable to common stockholders per diluted share(1) | $ | 0.32 | $ | 0.76 | $ | 1.09 | $ | 1.96 | $ | 3.98 | $ | 9.39 | ||||||||||||
|
|
|
|
|
|
|
|
|
|
|
| |||||||||||||
| (1) | Refer to page 2 for additional information on the share counts used in the per share calculations. |
19
Regulation G - Non GAAP Financial Measures (continued)
(4) Net Operating Income, Excluding Reportable Catastrophes, per Diluted Share: Assurant uses net operating income per diluted share, excluding reportable catastrophes, as another important measure of the Company’s stockholder value. The Company believes this metric provides investors a valuable measure of stockholder value because it excludes reportable catastrophes, which can be volatile. The comparable GAAP measure is net income attributable to common stockholders per diluted share, defined as net income attributable to common stockholders plus any dilutive preferred stock dividends divided by weighted average diluted shares outstanding.
| 2018 | Twelve Months Ended December 31, | |||||||||||||||||||||||
| ($ per share) | 4Q | 3Q | 2Q | 1Q | 2018 | 2017 | ||||||||||||||||||
Net operating income,excluding reportable catastrophes, per diluted share(1) | $ | 2.29 | $ | 2.12 | $ | 2.11 | $ | 2.14 | $ | 8.65 | $ | 7.46 | ||||||||||||
Adjustments, net of tax: | ||||||||||||||||||||||||
Dilutive effect from mandatory convertible preferred stock | — | — | — | (0.03 | ) | — | — | |||||||||||||||||
Assurant Health runoff operations | — | — | — | 0.04 | 0.04 | 0.19 | ||||||||||||||||||
Net realized (losses) gains on investments | (0.57 | ) | (0.07 | ) | (0.16 | ) | 0.01 | (0.83 | ) | 0.35 | ||||||||||||||
Reportable catastrophes | (1.52 | ) | (1.06 | ) | 0.02 | (0.13 | ) | (2.85 | ) | (3.48 | ) | |||||||||||||
Amortization of deferred gains on disposal of businesses | 0.13 | 0.16 | 0.21 | 0.27 | 0.75 | 1.22 | ||||||||||||||||||
Impact of TCJA at enactment | — | (0.02 | ) | — | — | (0.02 | ) | 3.20 | ||||||||||||||||
Net TWG acquisition related charges | (0.09 | ) | (0.13 | ) | (0.56 | ) | (0.38 | ) | (1.12 | ) | (0.15 | ) | ||||||||||||
Change in tax liabilities | — | — | — | — | — | 0.49 | ||||||||||||||||||
Loss on sale of Mortgage Solutions | 0.01 | 0.03 | (0.60 | ) | — | (0.54 | ) | — | ||||||||||||||||
Foreign exchange related (losses) gains | — | (0.28 | ) | 0.07 | — | (0.24 | ) | — | ||||||||||||||||
Other Adjustments: | ||||||||||||||||||||||||
Gain related to benefit plan activity | 0.01 | 0.01 | 0.02 | 0.02 | 0.07 | 0.24 | ||||||||||||||||||
Gain on sale of Time Insurance Company | 0.23 | — | — | — | 0.24 | — | ||||||||||||||||||
Net charge related to Green Tree Insurance Agency acquisition | (0.18 | ) | — | — | — | (0.19 | ) | — | ||||||||||||||||
Gain on sale of buildings | — | — | — | — | — | 0.07 | ||||||||||||||||||
Post-close cont. liab. on prev. disposition | — | — | — | (0.02 | ) | (0.01 | ) | (0.20 | ) | |||||||||||||||
Change in fair value of derivative investment | 0.01 | — | (0.02 | ) | 0.04 | 0.03 | — | |||||||||||||||||
|
|
|
|
|
|
|
|
|
|
|
| |||||||||||||
Net income attributable to common stockholders per diluted share(1) | $ | 0.32 | $ | 0.76 | $ | 1.09 | $ | 1.96 | $ | 3.98 | $ | 9.39 | ||||||||||||
|
|
|
|
|
|
|
|
|
|
|
| |||||||||||||
| 2018 | Twelve Months Ended December 31, | |||||||||||||||||||||||
| ($ per share) | 4Q | 3Q | 2Q | 1Q | 2018 | 2017 | ||||||||||||||||||
Net operating income,excluding reportable catastrophes, per diluted share(1) | $ | 2.29 | $ | 2.12 | $ | 2.11 | $ | 2.14 | $ | 8.65 | $ | 7.46 | ||||||||||||
Adjustments,pre-tax: | ||||||||||||||||||||||||
Dilutive effect from mandatory convertible preferred stock | — | — | — | (0.03 | ) | — | — | |||||||||||||||||
Assurant Health runoff operations | — | — | — | 0.05 | 0.05 | 0.29 | ||||||||||||||||||
Net realized (losses) gains on investments | (0.74 | ) | (0.09 | ) | (0.20 | ) | 0.01 | (1.06 | ) | 0.54 | ||||||||||||||
Reportable catastrophes | (1.91 | ) | (1.34 | ) | 0.02 | (0.17 | ) | (3.61 | ) | (5.35 | ) | |||||||||||||
Amortization of deferred gains on disposal of businesses | 0.17 | 0.20 | 0.26 | 0.33 | 0.97 | 1.87 | ||||||||||||||||||
Impact of TCJA at enactment | — | (0.02 | ) | — | — | (0.03 | ) | 3.20 | ||||||||||||||||
Net TWG acquisition related charges | (0.12 | ) | (0.17 | ) | (0.66 | ) | (0.47 | ) | (1.38 | ) | (0.23 | ) | ||||||||||||
Change in tax liabilities | — | — | — | — | — | 0.49 | ||||||||||||||||||
Loss on sale of Mortgage Solutions | 0.02 | 0.04 | (0.76 | ) | — | (0.68 | ) | — | ||||||||||||||||
Foreign exchange related (losses) gains | (0.03 | ) | (0.29 | ) | 0.09 | — | (0.25 | ) | — | |||||||||||||||
Other Adjustments: | ||||||||||||||||||||||||
Gain related to benefit plan activity | 0.02 | 0.02 | 0.03 | 0.03 | 0.09 | 0.38 | ||||||||||||||||||
Gain on sale of Time Insurance Company | 0.29 | — | — | — | 0.31 | — | ||||||||||||||||||
Net charge related to Green Tree Insurance Agency acquisition | (0.25 | ) | — | — | — | (0.27 | ) | — | ||||||||||||||||
Gain on sale of buildings | — | — | — | — | — | 0.10 | ||||||||||||||||||
Post-close cont. liab. on prev. disposition | — | — | — | (0.02 | ) | (0.02 | ) | (0.31 | ) | |||||||||||||||
Change in fair value of derivative investment | 0.02 | 0.01 | (0.03 | ) | 0.05 | 0.05 | — | |||||||||||||||||
Benefit for income taxes | 0.56 | 0.28 | 0.23 | 0.04 | 1.16 | 0.95 | ||||||||||||||||||
|
|
|
|
|
|
|
|
|
|
|
| |||||||||||||
Net income attributable to common stockholders per diluted share(1) | $ | 0.32 | $ | 0.76 | $ | 1.09 | $ | 1.96 | $ | 3.98 | $ | 9.39 | ||||||||||||
|
|
|
|
|
|
|
|
|
|
|
| |||||||||||||
| (1) | Refer to page 2 for additional information on the share counts used in the per share calculations. |
20
Regulation G - Non GAAP Financial Measures (continued)
(5) Annualized Operating Return On Common Stockholders’ Equity, Excluding AOCI: Assurant uses operating return on common stockholders’ equity (“Operating ROE”), excluding AOCI, as an important measure of the Company’s operating performance. Operating ROE, excluding AOCI, equals net operating income (loss) (defined above) for the periods presented divided by average common stockholders’ equity, excluding AOCI, for the year to date period. The Company believes Operating ROE provides investors a valuable measure of the performance of the Company’s ongoing business, because it excludes the effect of items that do not represent the ongoing operations of the Company. The comparable GAAP measure is GAAP return on common stockholders’ equity, defined as net income (loss) attributable to common stockholders, for the period presented, divided by average common stockholders’ equity for the year to date period.
| 2018 | Twelve Months Ended December 31, | |||||||||||||||||||||||
| 4Q | 3Q | 2Q | 1Q | 2018 | 2017 | |||||||||||||||||||
Annualized operating return on average common stockholders’ equity, excluding AOCI(1) | 3.9 | % | 5.3 | % | 10.8 | % | 10.5 | % | 7.5 | % | 5.5 | % | ||||||||||||
Assurant Health runoff operations | — | — | — | 0.2 | % | 0.1 | % | 0.3 | % | |||||||||||||||
Net realized (losses) gains on investments | (2.9 | )% | (0.4 | )% | (0.8 | )% | — | (1.1 | )% | 0.5 | % | |||||||||||||
Amortization of deferred gains on disposal of businesses | 0.7 | % | 0.8 | % | 1.1 | % | 1.4 | % | 1.0 | % | 1.7 | % | ||||||||||||
Impact of TCJA at enactment | — | (0.1 | )% | — | — | — | 4.5 | % | ||||||||||||||||
Net TWG acquisition related charges | (0.5 | )% | (0.6 | )% | (2.9 | )% | (2.0 | )% | (1.5 | )% | (0.2 | )% | ||||||||||||
Change in tax liabilities | — | — | — | — | — | 0.7 | % | |||||||||||||||||
Loss on sale of Mortgage Solutions | — | 0.2 | % | (3.1 | )% | — | (0.7 | )% | — | |||||||||||||||
Foreign exchange related (losses) gains | — | (1.4 | )% | 0.4 | % | — | (0.3 | )% | — | |||||||||||||||
Other Adjustments: | ||||||||||||||||||||||||
Gain related to benefit plan activity | 0.1 | % | 0.1 | % | 0.1 | % | 0.1 | % | 0.1 | % | 0.3 | % | ||||||||||||
Gain on sale of Time Insurance Company | 1.2 | % | — | — | — | 0.3 | % | — | ||||||||||||||||
Net charge related to Green Tree Insurance Agency acquisition | (1.0 | )% | — | — | — | (0.2 | )% | — | ||||||||||||||||
Gain on sale of buildings | — | — | — | — | — | 0.1 | % | |||||||||||||||||
Post-close cont. liab. on prev. disposition | — | — | — | (0.1 | )% | — | (0.3 | )% | ||||||||||||||||
Change in fair value of derivative investment | 0.1 | % | — | (0.1 | )% | 0.2 | % | — | — | |||||||||||||||
Change due to effect of including AOCI & other | 0.1 | % | — | 0.1 | % | (0.3 | )% | (0.1 | )% | (0.7 | )% | |||||||||||||
|
|
|
|
|
|
|
|
|
|
| �� | |||||||||||||
Annualized GAAP return on average common stockholders’ equity(1) | 1.7 | % | 3.9 | % | 5.6 | % | 10.0 | % | 5.1 | % | 12.4 | % | ||||||||||||
|
|
|
|
|
|
|
|
|
|
|
| |||||||||||||
| (6)Annualized Operating Return On Common Stockholders’ Equity, Excluding AOCI and Reportable Catastrophes: Assurant uses Operating ROE, excluding AOCI (defined above) and reportable catastrophes (defined above), as another important measure of the Company’s operating performance. The Company believes this metric provides investors a valuable measure of the performance of the Company’s ongoing business because it excludes the effect of reportable catastrophes, which can be volatile. The comparable GAAP measure is GAAP ROE (defined above). |
| |||||||||||||||||||||||
| 2018 | Twelve Months Ended December 31, | |||||||||||||||||||||||
| 4Q | 3Q | 2Q | 1Q | 2018 | 2017 | |||||||||||||||||||
Annualized operating return on average common stockholders’ equity, excluding AOCI and reportable catastrophes(1) | 11.5 | % | 10.6 | % | 10.7 | % | 11.2 | % | 11.2 | % | 10.4 | % | ||||||||||||
Assurant Health runoff operations | — | — | — | 0.2 | % | 0.1 | % | 0.3 | % | |||||||||||||||
Net realized (losses) gains on investments | (2.9 | )% | (0.4 | )% | (0.8 | )% | — | (1.1 | )% | 0.5 | % | |||||||||||||
Amortization of deferred gains on disposal of businesses | 0.7 | % | 0.8 | % | 1.1 | % | 1.4 | % | 1.0 | % | 1.7 | % | ||||||||||||
Impact of TCJA at enactment | — | (0.1 | )% | — | — | — | 4.5 | % | ||||||||||||||||
Net TWG acquisition related charges | (0.5 | )% | (0.6 | )% | (2.9 | )% | (2.0 | )% | (1.5 | )% | (0.2 | )% | ||||||||||||
Change in tax liabilities | — | — | — | — | — | 0.7 | % | |||||||||||||||||
Reportable catastrophes | (7.6 | )% | (5.3 | )% | 0.1 | % | (0.7 | )% | (3.7 | )% | (4.9 | )% | ||||||||||||
Loss on sale of Mortgage Solutions | — | 0.2 | % | (3.1 | )% | — | (0.7 | )% | — | |||||||||||||||
Foreign exchange related (losses) gains | — | (1.4 | )% | 0.4 | % | — | (0.3 | )% | — | |||||||||||||||
Other Adjustments: | ||||||||||||||||||||||||
Gain related to benefit plan activity | 0.1 | % | 0.1 | % | 0.1 | % | 0.1 | % | 0.1 | % | 0.3 | % | ||||||||||||
Gain on sale of Time Insurance Company | 1.2 | % | — | — | — | 0.3 | % | — | ||||||||||||||||
Net charge related to Green Tree Insurance Agency acquisition | (1.0 | )% | — | — | — | (0.2 | )% | — | ||||||||||||||||
Gain on sale of buildings | — | — | — | — | — | 0.1 | % | |||||||||||||||||
Post-close cont. liab. on prev. disposition | — | — | — | (0.1 | )% | — | (0.3 | )% | ||||||||||||||||
Change in fair value of derivative investment | 0.1 | % | — | (0.1 | )% | 0.2 | % | — | — | |||||||||||||||
Change due to effect of including AOCI & other | 0.1 | % | — | 0.1 | % | (0.3 | )% | (0.1 | )% | (0.7 | )% | |||||||||||||
|
|
|
|
|
|
|
|
|
|
|
| |||||||||||||
Annualized GAAP return on average common stockholders’ equity(1) | 1.7 | % | 3.9 | % | 5.6 | % | 10.0 | % | 5.1 | % | 12.4 | % | ||||||||||||
|
|
|
|
|
|
|
|
|
|
|
| |||||||||||||
| (1) | Refer to page 2 for additional information on the average common stockholders’ equity used in the ROE calculations. |
21
Regulation G - Non GAAP Financial Measures (continued)
(7) Corporate and Other Net Operating Loss:Assurant uses Corporate and Other net operating loss as an important measure of the corporate segment’s performance. Corporate and Other net operating loss equals Total Corporate and Other segment net (loss) income attributable to common stockholders excluding Assurant Health runoff operations, net TWG acquisition related charges, foreign exchange gains (losses) from remeasurement of monetary assets and liabilities, amortization of deferred gains on disposal of businesses, net realized (losses) gains on investments, interest expense, loss on sale of Mortgage Solutions and other highly variable or unusual items. Additionally, the calculation for the full year 2017 excludes aone-time estimated benefit related to the enactment of the TCJA. The Company believes Corporate and Other net operating loss provides investors a valuable measure of the performance of the Company’s corporate segment because it excludes highly variable items that do not represent the ongoing results of the Company’s corporate segment. The comparable GAAP measure is Total Corporate and Other segment net (loss) income attributable to common stockholders.
| 2018 | Twelve Months Ended December 31, | |||||||||||||||||||||||
| ($ in millions) | 4Q | 3Q | 2Q | 1Q | 2018 | 2017 | ||||||||||||||||||
GAAP Total Corporate and Other segment net (loss) income attributable to common stockholders | $ | (81.6 | ) | $ | (63.8 | ) | $ | (93.2 | ) | $ | (30.8 | ) | $ | (269.4 | ) | $ | 204.6 | |||||||
Adjustments,pre-tax: | ||||||||||||||||||||||||
Assurant Health runoff operations | (0.3 | ) | — | (0.3 | ) | (2.6 | ) | (3.2 | ) | (16.0 | ) | |||||||||||||
Amortization of deferred gains on disposal of businesses | (10.7 | ) | (12.7 | ) | (15.0 | ) | (18.5 | ) | (56.9 | ) | (103.9 | ) | ||||||||||||
Impact of TCJA at enactment | — | 1.5 | — | — | 1.5 | (177.0 | ) | |||||||||||||||||
Net TWG acquisition related charges(1) | 7.3 | 10.6 | 38.5 | 26.0 | 82.4 | 12.5 | ||||||||||||||||||
Change in tax liabilities | — | — | — | — | — | (27.1 | ) | |||||||||||||||||
Interest expense | 26.3 | 26.5 | 18.2 | 12.2 | 83.2 | 49.5 | ||||||||||||||||||
Net realized losses (gains) on investments | 46.8 | 5.7 | 11.4 | (0.5 | ) | 63.4 | (30.1 | ) | ||||||||||||||||
Loss on sale of Mortgage Solutions | (0.7 | ) | (2.5 | ) | 43.5 | — | 40.3 | — | ||||||||||||||||
Foreign exchange related losses (gains) | 1.6 | 18.3 | (5.1 | ) | — | 14.8 | — | |||||||||||||||||
Other adjustments | (4.8 | ) | (1.8 | ) | (0.1 | ) | (3.2 | ) | (9.9 | ) | (9.1 | ) | ||||||||||||
(Benefit) provision for income taxes | (16.1 | ) | (5.5 | ) | (17.0 | ) | (2.6 | ) | (41.2 | ) | 33.8 | |||||||||||||
Preferred stock dividends | 4.7 | 4.7 | 1.6 | — | 11.0 | — | ||||||||||||||||||
|
|
|
|
|
|
|
|
|
|
|
| |||||||||||||
Corporate and other net operating loss | $ | (27.5 | ) | $ | (19.0 | ) | $ | (17.5 | ) | $ | (20.0 | ) | $ | (84.0 | ) | $ | (62.8 | ) | ||||||
|
|
|
|
|
|
|
|
|
|
|
| |||||||||||||
| (1) | Refer to page 10 for additional details about the components of net TWG acquisition related charges. |
(8)Debt to Total Capital Ratio, Excluding AOCI: Assurant uses a ratio of debt to total capital, excluding AOCI, as an important measure of the Company’s financial leverage. Assurant’s debt to total capital ratio, excluding AOCI, equals debt divided by the sum of debt and total stockholders’ equity, excluding AOCI. The Company believes that the debt to total capital ratio, excluding AOCI, provides investors a valuable measure of financial leverage, because it excludes the effect of unrealized gains (losses) on investments, which do not represent the operations of the Company and tend to be highly variable fromperiod-to-period, and other AOCI items. The comparable GAAP measure is the ratio of debt to total capital.
| 2018 | As of December 31, | |||||||||||||||||||||||
| 4Q | 3Q | 2Q | 1Q | 2018 | 2017 | |||||||||||||||||||
Debt to total capital ratio, excluding AOCI | 27.6 | % | 27.4 | % | 26.9 | % | 31.1 | % | 27.6 | % | 20.9 | % | ||||||||||||
Change due to effect of including AOCI | 0.6 | % | 0.4 | % | 0.5 | % | (0.2 | )% | 0.6 | % | (0.9 | )% | ||||||||||||
|
|
|
|
|
|
|
|
|
|
|
| |||||||||||||
Debt to total capital ratio | 28.2 | % | 27.8 | % | 27.4 | % | 30.9 | % | 28.2 | % | 20.0 | % | ||||||||||||
|
|
|
|
|
|
|
|
|
|
|
| |||||||||||||
(9) Book Value per Diluted Share, Excluding AOCI: Assurant uses book value per diluted share, excluding AOCI, as a measure of the Company’s stockholder value. Book value per diluted share, excluding AOCI, equals total stockholders’ equity, excluding AOCI, divided by diluted shares outstanding. The Company believes book value per diluted share, excluding AOCI, provides investors a valuable measure of stockholder value because it excludes the effect of unrealized gains (losses) on investments which are highly variable and do not represent the ongoing operations of the Company, and other AOCI items. The comparable GAAP measure is book value per diluted share defined as total stockholders’ equity divided by diluted shares outstanding.
| 2018 | As of December 31, | |||||||||||||||||||||||
| ($ per share) | 4Q | 3Q | 2Q | 1Q | 2018 | 2017 | ||||||||||||||||||
Book value per diluted share, excluding AOCI | $ | 79.45 | $ | 80.40 | $ | 81.44 | $ | 78.01 | $ | 79.45 | $ | 75.58 | ||||||||||||
Change due to effect of including AOCI | (2.34 | ) | (1.48 | ) | (2.06 | ) | 0.91 | (2.34 | ) | 4.38 | ||||||||||||||
|
|
|
|
|
|
|
|
|
|
|
| |||||||||||||
Book value per diluted share | $ | 77.11 | $ | 78.92 | $ | 79.38 | $ | 78.92 | $ | 77.11 | $ | 79.96 | ||||||||||||
|
|
|
|
|
|
|
|
|
|
|
| |||||||||||||
22