Exhibit 99.2
Investor Assurant Day 2022 ASSURANT® © 2022 Assurant, Inc. All rights reserved. 1
Cautionary Statement Some of the statements included in this presentation, including our business and financial plans and any statements regarding the company’s anticipated future financial performance, business prospects, growth and operating strategies and similar matters, including performance outlook, financial objectives, business drivers, our ability to gain market share, and the strength, diversity, predictability and resiliency of enterprise and segment earnings, cash flows and other results, may constitute forward-looking statements within the meaning of the U.S. Private Securities Litigation Reform Act of 1995. Please refer to Exhibit 1 of this presentation for factors that could cause our actual results to differ materially from those currently estimated by management, including those projected in the company outlook and financial objectives, and information on where you can find a more detailed discussion of these factors in our SEC filings. Assurant uses non-GAAP financial measures to analyze the company’s operating performance. Assurant’s non-GAAP financial measures should not be considered in isolation or as a substitute for GAAP financial measures. Because Assurant’s calculation of these measures may differ from similar measures used by other companies, investors should be careful when comparing Assurant’s non-GAAP financial measures to those of other companies. Refer to Exhibit 2 of this presentation for a reconciliation of non-GAAP financial measures to the most comparable GAAP financial measures.
Thriving in the Connected World Keith Demmings President & Chief Executive Officer © 2022 Assurant, Inc. All rights reserved. 3
Our Vision To be the leading global business services company supporting the advancement of the connected world
Vision Sustained Propels Outperformance Us Forward Towards Track record of Leadership positions Compelling strong profitable Total at scale valuation growth addressable Superior cash market in Purpose-driven flow generation mobile, auto culture and with disciplined and home commitment to deployment continues to sustainability grow
Track Record of Delivering on Commitments TSR Outperformance(1) AIZ = 107% S&P 500 = 80% Enterprise Financial Objectives Set in 2019(2,3) 12% average annual operating EPS growth over 2020-2021 Double-digit average annual growth in net operating income Capital return of $1.35 billion to shareholders through 2021 Results Delivered through 2021(2,3) 17% average annual growth 14% average annual growth(4) Returned $1.35 billion to shareholders + began returning Preneed sale proceeds (1) Total shareholder return assumes dividends are reinvested. Data listed as of 12/31/2018 through 3/15/2022. (2) Net operating income per diluted share (also referred to as operating EPS) and net operating income objectives and results exclude reportable catastrophes, which throughout this presentation, refers to reportable catastrophes as defined in Exhibit 2 in the Appendix. (3) Refer to Exhibit 2 in the Appendix for information regarding non-GAAP financial measures, including reconciliations to the most directly comparable GAAP measures. (4) Represents average annual growth since year-end 2018 and 2019. Results exclude the disposed Global Preneed business.
Expect Adjusted to EPS Sustain with Growth Superior in Cash Adjusted Flow EBITDA Generation and 2021 2022 2023 – 2024 Baseline Outlook Financial Objectives Adjusted 10% average (1,2) $1.1 billion 8 – 10% growth EBITDA annual growth (1,2) 12%+ average Adjusted EPS $12.12 16—20% growth annual growth Segment Cash (3) (2,4) $729 million ~$2.9 billion Generation (1) Adjusted EBITDA and Adjusted earnings per diluted share (also referred to as Adjusted EPS) exclude reportable catastrophes. (2) Refer to Exhibit 2 in the Appendix for information regarding non-GAAP financial measures, including reconciliations to the most directly comparable GAAP measures. (3) Represents dividends paid to the holding company. (4) 2022-2024 segment cash generation to approximate 75% of segment Adjusted EBITDA, including a $120M annual catastrophe load, which represents average actual losses over the last three years.
Aligned Portfolio Focused on Advantaged Businesses Simplified and growing portfolio—Assurant segment Adjusted EBITDA CAGR of 11% since 2016(1,2) - Capital-light businesses represent 77% of 2021 segment Adjusted EBITDA(2,3) Relatively insulated from major macroeconomic risks Declining catastrophe exposure now estimated <25% of segment Adjusted EBITDA(4) Segment Adjusted EBITDA(1,2) 2016(5) 2021 (1) Segment Adjusted EBITDA excludes reportable catastrophes and Corporate and Other. (2) Refer to Exhibit 2 in the Appendix for information regarding non-GAAP financial measures, including reconciliations to the most directly comparable GAAP measures. (3) Refer to slide 20 for definition of capital-light and risk-based businesses. (4) Estimate based on internal management data. (5) 2016 segment Adjusted EBITDA is calculated using an estimate of 2019 depreciation expense that would have been allocated to each line of business based on its proportionate share of assets being depreciated.
Business Common Create Unifying Clear Characteristics Competitive Across Advantages Our Lines of B2B2C model aligned with Demonstrated industry leaders ability to and long-term innovate and winners Leadership differentiate positions with scale advantages in attractive, growing markets
B2B2C Model Aligned with Leaders and Long-term Winners 15 of Top 50 most 20+ year High client retention valuable global brands partnerships across all LOBs Mobile carriers Auto dealers Property managers P&C insurers, Banks Cable operators OEMs Affinity partners agents and Mortgage Client brokers servicers partnerships… Retailers Third-party administrators Affinity partners Credit card companies (TPAs) On-demand delivery providers 8 of top 10 global 4 of top 5 7 of top 10 U.S. 9 of top 10 7 of top 10 …with leading telecommunications dealer groups property P&C insurance mortgage global brands brands management agencies servicers companies Refer to Exhibit 3 in the Appendix for list of sources. Information listed as of December 31, 2021.
Mobile Growing Positioned Market with to Outperform Tailwinds in a 300M global device 250M global refurbished Key Industry Statistics protection customers annual device units 63M mobile devices protected Assurant Scale (1) 26M mobile devices serviced 5G adoption & upgrade promotions Rising device prices Industry Tailwinds Consumer dependence Refer to Exhibit 3 in the Appendix for list of sources. Information listed as of or for the year ended December 31, 2021. 1. Global mobile devices serviced includes number of devices for which we provide value to our consumers and partners, through trade-ins and upgrades, technology, claims fulfillment, repair capabilities, logistics, and asset disposition. 2020 includes one month (December) of HYLA Mobile acquisition.
Auto Growing Positioned Market to with Outperform Tailwinds in a 400M global vehicle Key Industry Statistics service contracts Assurant Scale 54M vehicles protected Rising car prices Industry Tailwinds Increasing repair costs Improving auto supply / demand imbalance Refer to Exhibit 3 in the Appendix for list of sources. Information listed as of or for the year ended December 31, 2021.
Renters Growing Positioned Market with to Tailwinds Outperform in a Key Industry Statistics 20M U.S. renters’ policies Assurant Scale 2.6M renters policies Rising attachment rates Industry Tailwinds Untapped segments Increasing residential construction and occupancy Refer to Exhibit 3 in the Appendix for list of sources. Information listed as of or for the year ended December 31, 2021.
Strong Lender -Returns Placed Insurance and Cash Well Flow-positioned for Continued Key Industry Statistics 53M U.S. mortgages Assurant Scale 30M mortgages tracked New housing construction Higher home values Industry Tailwinds Moderate placement rate growth End of forbearance programs Refer to Exhibit 3 in the Appendix for list of sources. Information listed as of or for the year ended December 31, 2021.
Purpose-driven Culture and Commitment to Sustainability Great Place to Work across 10 markets, including U.S. Electric vehicle product rolled out in 12 countries Integrating environmental commitment into business operations Key Goals Ensure workforce and leadership reflect the diversity of our consumers and communities Talent Sustain strong engagement through career growth, fair and equitable total rewards and wellbeing Double 2020 new diverse supplier spend by 2025 Reinforce value of offerings to support connected lifestyle Products Accelerate the rollout of sustainability offerings Help consumers invest in products to enhance their wellbeing Track emissions globally and implement carbon reduction target Climate Improve energy efficiency Optimize global real estate footprint Integrate ESG commitment into investment portfolio Refer to Exhibit 3 in the Appendix for list of sources. Information listed as of December 31, 2021, unless otherwise noted.
Majority of Profit Derived from Capital-light Businesses 2021 Segment Adjusted EBITDA $1.2B(1,2) Key Characteristics Capital-light Businesses(2) Risk-based Businesses(2) Global Lifestyle 36% Connected Living 24% Global Automotive Global Housing 12% Multifamily Housing 5% Specialty(3) Global Housing 18% Lender-placed 5% Specialty(3) Fee-for-service products More predictable and stable revenue/earnings streams Limited-to-no catastrophe exposure Specialty P&C products with strong returns & cash flow Ability to adjust rates to reflect loss experience(4) (1) Segment Adjusted EBITDA excludes reportable catastrophes and Corporate and Other. (2) Refer to Exhibit 2 in the Appendix for information regarding non-GAAP financial measures, including reconciliations to the most directly comparable GAAP measures. (3) Specialty capital-light business lines include Leased and Financed, NFIP Flood administration and Shipping Insurance; Specialty risk-based business lines include Manufactured Housing and Sharing Economy. (4) Subject to regulatory approval.
Services Assurant’s and Relevant Other Fee Peer -based Groups Companies Now Include Business Relevant peer groups How they trade (median)(1) Assurant Advantages Capital-Light Home Warranty Diversified Business Services Insurance Brokers EV/EBITDA: 13.2x P/E: 24.1x Leadership positions Large, diversified TAMs with significant whitespace Attractive growth profile Limited macro sensitivity Global platform Risk-Based Specialty Homeowners P&C Personal Lines P/B: 1.4x P/E: 13.3x Leadership positions Unique distribution Countercyclical benefit Well capitalized (1) Refer to Exhibit 3 in the Appendix for list of companies within our relevant peer groups. Data represents median consensus multiples of such companies for full-year 2022. Data sourced from Factset.
Compelling Valuation Given Growth and Return Profile Historical Performance Valuation (1) Assurant Adjusted earnings per share includes reportable catastrophes and excludes the disposed Global Preneed business. (2) Refer to Exhibit 2 in the Appendix for information regarding non-GAAP financial measures, including reconciliations to the most directly comparable GAAP measures. (3) Data sourced from Factset using historical and consensus future estimates. (4) Forward price-to-earnings equals stock price, divided by analysts’ next 12-month forecasted earnings. Data listed as of 3/15/2022.
Delivering Shareholder Value Leadership Strong profitable positions Compelling Total growth at scale valuation addressable Superior cash market in Purpose-driven flow generation mobile, auto culture and with disciplined and home commitment to deployment continues to sustainability grow
Innovation Value Creation in the through Connected World Bob Lonergan EVP, Chief Strategy & Risk Officer
Continued Innovation Growth and Disciplined Momentum Strategic through Investments We have demonstrated an ability to innovate and differentiate We have a clear focus on where we want to go and what we want to be Evolving needs for the connected consumer are increasing demand for our services Our foundation is stronger than ever
Dedicated to Drive Our Teams Growth Identifying and Innovation New Trends Pipeline and Insights Industry Trends 225+ Enterprise Research & Strategy Team Companies monitored for insights Consumer Needs 75+ Primary Research Team Research studies per year Market Disruption 400+ Assurant Ventures Annual startup and VC firm discussions Ops Technology 40+ Ops Transformation Team Operational pilots over the last 5 years
Well Tailwinds -positioned Across to our Benefit Businesses from Working & Sustainable
Vehicles to Drive Innovation and Create Value Building Organic investments in new products, ops transformation, digital and CX improvements Acquiring M&A to broaden our capabilities and scale our businesses Early-stage Investing Investments in early-stage technology companies through Assurant Ventures
Driving Growth Through New Products and Services Connected Living Tech Support (Personal TechPro) 31M+ customers with access to Personal TechPro across 7 countries 98% resolution rate with average 4.8 star rating Multifamily Housing Policy Tracking (Cover 360) Doubled the number of policies from Cover360 in the last 2 years Significantly higher attach rates with some clients seeing up to 2x increase Global Automotive Client Portal (The Digital Hub) On-demand access to critical data and information Expected to reduce cost to serve and create best-in-class experience Information listed as of or for the year ended December 31, 2021.
Driving More Choice, Operational, Less Effort, Digital Happier and CX Customers Transformation: Digital self-serve 25%+ increase in usage with mobile client 10%+ increase in Net Promoter Score (“NPS”) Dynamic Fulfillment: complete mobile claims in channel of choice 25%+ increase in NPS IVR to web routing 25%+ higher NPS vs. phone with mobile client Auto-adjudication 35%+ faster authorization for housing claims Significant cost savings 25%+ reduction in calls per claim Adjusters can close 30%+ more claims per day with digital self-service and auto adjudication Information listed as of or for the year ended December 31, 2021.
M&A and Value Remains Creation a Key Driver of Growth Strong M&A Capability Dedicated team Disciplined approach Since 2018, – $3B+ deployed – 3 $100M+ acquisitions: TWG, HYLA, AFAS – 13 critical acquisitions that added key capabilities Excellent Financial Results Since 2019, M&A has contributed an estimated 20% of Segment Adjusted EBITDA growth(1) Overall, transactions have met or surpassed our commitments and internal deal models Key Growth Lever M&A will continue to accelerate our vision for Assurant Areas of focus: – Scaling our core – Logical adjacencies – Broaden offerings – Enhanced capabilities (1) Segment Adjusted EBITDA excludes reportable catastrophes and Corporate and Other. Refer to Exhibit 2 in the Appendix for information regarding non-GAAP financial measures, including reconciliations to the most directly comparable GAAP measures. The estimate of M&A-driven Segment Adjusted EBITDA growth is based on internal management data for acquisitions made since 2019 through year-end 2021.
M&A Our Auto Has Businesses Strategically Transformed Pre-Transactions 2017 No direct sales with primarily TPA distribution Limited international presence Post-Transactions 2021 Scaled leader protecting 54 million vehicles Direct sales force along with extensive set of clients Differentiated platform leveraging “best of” capabilities Protected Vehicles (M) 54 15 2017 2021
M&A Position Has of Enhanced our Mobile the Business Competitive Global Mobile Pre- Post-Devices Transactions Transactions (1) Serviced 2018 2021 (M) Buy/sell spread-based trade-in model with AIZ protection clients Advanced exchange claims model serving protection customers Software-based fee-for-service trade-in model supporting diversified set of global clients Enhanced mobile claims experience with multiple service delivery options & larger addressable market (1) Global mobile devices serviced includes number of devices for which we provide value to our consumers and partners, through trade-ins and upgrades, technology, claims fulfillment, repair capabilities, logistics, and asset disposition. 2020 includes one month (December) of HYLA Mobile acquisition.
Assurant Financial Returns Ventures and Delivers Strategic Both Value Invests in early-stage, high-growth technology businesses $125M+ in 25+ companies since inception 7 exits to date: 50%+ IRR 4 SPACs & unicorns (>$1B valuation) All data listed as of 3/15/2022. Assurant Ventures investments are allocated to the Corporate segment.
Driving Targeted Shareholder Investments Value and through Innovation Demonstrated track record to drive Total growth and addressable innovation Great market in Well-positioned foundation mobile, auto to capitalize with strong and home on evolving momentum continues to connected grow consumer needs
Financial & Capital Strategy Richard Dziadzio EVP, Chief Financial Officer
Flows Business with Strategy Disciplined to Drive Capital Strong Deployment Earnings and Cash Robust & Total Diverse addressable Cash Flows market in Earnings mobile, auto Disciplined Strength & and home Capital Resiliency continues to Deployment grow
Enterprise Consistent Financial Growth Through Objectives 2024 to Deliver Strong, 2021 2022 Annual 2023 – 2024 Baseline Outlook Financial Objectives Adjusted 10% average (1,2) $1.1 billion 8 – 10% growth EBITDA annual growth Segment (3) (2,4) $729 million ~$2.9 billion Cash Generation (1,2) 12%+ average Adjusted EPS $12.12 16—20% growth annual growth (1) Adjusted EBITDA and Adjusted earnings per diluted share (also referred to as Adjusted EPS) results exclude reportable catastrophes. (2) Refer to Exhibit 2 in the Appendix for information regarding non-GAAP financial measures, including reconciliations to the most directly comparable GAAP measures. (3) Represents dividends paid to the holding company. (4) 2022-2024 segment cash generation to approximate 75% of segment Adjusted EBITDA, including a $120M annual catastrophe load, which represents average actual losses over the last three years.
Segment Attractive Financial Adjusted Objectives EBITDA Growth to Deliver Results Through Segment Adjusted 2021 2022 2023 – 2024 EBITDA Baseline Outlook Financial Objectives Low double-digit 10% average Global Lifestyle $714 million growth annual growth Global (1,2) $486 million Mid to high single-digit growth Housing Corporate Loss of $93 million Loss of ~$105 million and Other (1) Global Housing’s Adjusted EBITDA excludes reportable catastrophes. (2) Refer to Exhibit 2 in the Appendix for information regarding non-GAAP financial measures, including reconciliations to the most directly comparable GAAP measures.
Opportunities Global Lifestyle: to Leading Drive Profitable Positions Growth & Globally Expected Business Drivers Connected Living growth led by mobile—Organic growth—Trade-in & upgrade growth—International expansion Automotive strong prior period sales, supported by product & service expansion Investments support long-term growth, including both organic & inorganic
Continue Global Housing: as Specialty Attractive P&C Returns Businesses Expected Grow to Expected Business Drivers Lender-Placed growth from placement rate increase and REO recovery—Ongoing operational efficiencies Continued path to Multifamily Housing long-term growth—Short-term growth muted by new investments Focused Specialty product growth Disciplined CAT risk management (1) Refer to Exhibit 2 in the Appendix for information regarding non-GAAP financial measures, including reconciliations to the most directly comparable GAAP measures. (2) Combined ratio equals total benefits, losses and expenses, divided by net earned premiums, fees and other income. Income from the processing of National Flood Insurance Program claims is reported as a reduction in expenses and is included in the combined ratio. The combined ratio also includes reportable catastrophe impacts, which are included in the projections as past 3-year average.
Foundational Investments and Expense Financial Discipline Performance Supports Business Expense Discipline Prioritization aligned with growth Self-fund investments Commitment to deliver value Strong Financial Performance Expense leverage with Adjusted EBITDA growth Realized expense efficiencies Value realization of investments
Continued Provides Significant Strong Cash Flexibility Generation Robust cash flows available for investments & shareholder returns High level of segment dividends for distribution (roughly 75% of segment Adjusted EBITDA)(1) Diversified cash flows expected to provide stability Continued growth in capital-light businesses (1) 2022-2024 segment cash generation to approximate 75% of segment Adjusted EBITDA, including a $120M annual catastrophe load, which represents average actual losses over the last three years. Business segment dividends represent the amount of cash paid to the holding company that is available for investment purposes, shareholder distributions and Corporate operating expenses, including interest costs on outstanding debt.
Resilient Performance Business Through Model a Variety Demonstrated of Market by Cycles Strong Diversity of Earnings Broad business mix Geographical distribution Countercyclical business Built-in Adaptability Risk sharing with clients Flexible solutions Ability to adjust rates(1) (1) Subject to regulatory approval.
Capital a Strong Management Foundation is Supported by Debt Management Investment Portfolio Ratings Risk Management Maintain leverage ratio target of <30% Continued disciplined income-oriented approach Investment grade fixed assets comprising majority of portfolio Commitment to maintain investment grade ratings Robust data, systems and processes Deep regulatory and compliance expertise
Balanced Capital Allocation to Drive Shareholder Value Acquisitions & Organic Investments Share Repurchases(1) Common Stock Dividends(1) Disciplined investment approach to drive business growth and maximize returns Maintain a high level of capital stewardship Consistent with historical practice, increasing each year (1) Capital return includes share repurchases and common stock dividends, subject to Board approval and other factors, including those referenced in Exhibit 1 in the Appendix.
Cash Business Flows Strategy with Disciplined to Drive Strong Capital Earnings Deployment and Robust & Total Diverse addressable Cash Flows Earnings market in Disciplined Strength & mobile, auto Capital Resiliency and home Deployment continues to grow
Opportunity Global Connected Living Biju Nair EVP, President of Global Connected Living
Connected Customers Living Across Serves Multiple Over Channels 200 Million Deep relationships with leading distribution partners – Mobile carriers – OEMs – Retailers – Financial institutions Globally scaled operations Digitized customer experience Automated processes AI & machine learning Financial Mobile Services 63 million 57 Million Mobile Protected Devices Credit Card and Extended Travel Protection Contracts Service 102 million Home Appliances and Electronics Information listed as of December 31, 2021. Subxcscription learning products Total & economy @ home addressable services market in mobile, auto Omni-channel 5G and home sales and service continues to grow
AdjustedEBITDA Growth Connected Living: Strong Track Record of Key drivers of growth: Connected Living Adjusted EBITDA ($M) Expanded and diversified client relationships, 15% including new distribution channels $430 CAGR Global market expansion Strengthened and added new fee-based $283 services Focused execution including automation and digitized customer experience 2018(1) 2021 Organic growth and disciplined M&A (1) 2018 segment Adjusted EBITDA is calculated using an estimate of 2019 depreciation expense that would have been allocated to Connected Living based on its proportionate share of assets being depreciated. © 2022 Assurant, Inc. All rights reserved. 46
Aligned with Leading Brands in the Connected Ecosystem 15of the top50most valuable global brands are Assurant clients 8of Top 10 Top 3 Top 2 7of Top 15 Top 3 global telecommunications U.S wireless global smartphone global retailers U.S. credit card brands carriers OEMs issuers Refer to Exhibit 3 in the Appendix for list of sources. Information listed as of December 31, 2021. © 2022 Assurant, Inc. All rights reserved. 47
Diversified Earnings Base Disciplined Global Expansion and 2021 Connected Living Adjusted EBITDA (%) Presence in 21 countries Global technology platforms Asia Pacific Scale advantage with global supply 21% chain operations Latin $430M Strong momentum in North America, 9% America Total APAC, and Europe 64% North 6% America Europe © 2022 Assurant, Inc. All rights reserved. 48
Capabilities in the Mobile Industry Assurant’s Leading Breadth and Depth of Mobile Trade-In & Service Customer Protection Upgrade & Repair Support In-house underwriting Proprietary and integrated Nearly 2,000 retail and Omni–channel service software platforms partner locations Digital claims process Technical support for all globally Bespokeanalytics and AI connected devices Dynamic fraud Customer choice of management Scale and technology driven On-device triage and repair device operations diagnostics Sales optimization Come-to-you service Unmatched secondary Privacy protection Patented filing structure market distribution Automated depots and ID management Dynamic Fulfillment © 2022 Assurant, Inc. All rights reserved. 49
Connected Living Ecosystem Macro Trends Accelerating Growth in 5G Mobile seeking new operators Aging digital streams revenue population 60% of demand forIncreased Digital revenues Home as hub 74 million U.S. smartphone now 22% of mobile for Connected adults 65+ shipments in 2022 pre-owneddevices operators’ revenue Lifestyle years by 2030 350M pre-owned 53% of U.S. smartphone workforce will sales by 2024 beremote in 2022 Refer to Exhibit 3 in the Appendix for list of sources. Information listed as of December 31, 2021, unless otherwise noted. © 2022 Assurant, Inc. All rights reserved. 50
Growth Led By Connected Living Global Lifestyle Future Adjusted EBITDA Multi-dimensional growth strategy Global client expansion of mobile and Connected Living retail programs Adjusted EBITDA Increased trade-in volume expected to grow Continued growth in fee-based service double-digits over and repair next 3 years Increased efficiency from automation and digitization Strategic M&A © 2022 Assurant, Inc. All rights reserved. 51
Mobile Protection © 2022 Assurant, Inc. All rights reserved. 52
Mobile Protection – Our Flagship Offering An industry leader, including strong Global Devices Protected(2) program attachment rates (M) “Excellent” NPS of 63(1) 63 Best-in-class fraud/risk management 45 Automated claims and digitized customer experience 20 new mobile protection programs globally since 2015 Growth potential from increased market share and favorable consumer trends 2018 2021 (1) Represents 2021 U.S. Connected Living. (2) Global covered mobile devices includes insurance and upgrade contracts inforcefor mobile phones, tablets, e-readers and accessories.In 1Q 2021, we reduced the global covered mobile device count, reflecting an adjustment to the data for certain countries. Prior periods were revised to reflect this adjustment. © 2022 Assurant, Inc. All rights reserved. 53
Successful Conversion of ~10 Assurant Gains Market Share with Million Sprint Subscribers Largest portfolio conversion ever Expertise in regulatory filings and customer notifications Ramped operations in 120 days Minimal churn and excellent customer experience Converted ~10 Million Subscribers © 2022 Assurant, Inc. All rights reserved. 54
Tailwinds for Future Growth Consumer and Market Trends Create Increased consumer dependence on Average Selling Price devices for life, work and play $665 of New Smartphone in North America Consumers want protection for expensive devices and repairs North America Sales of Premium Devices (>$500) (%) Strong device sales create ongoing opportunity for mobile protection 60% Premium devices now account for 60% 46% of sales in North America, 25% globally Aligned with clients that are positioned to take share 2016 2021 Refer to Exhibit 3 in the Appendix for list of sources. Information listed as of December 31, 2021. © 2022 Assurant, Inc. All rights reserved. 55
Trade-in © 2022 Assurant, Inc. All rights reserved. 56
Leading Provider of Device Carriers, OEMs and Retailers Globally Trade-in Solutions to Global Mobile Devices Serviced(1) Best-in-class software, data analytics and (M) supply chain operations 26 Extensive client roster and scale; 30+ trade-in and upgrade programs globally Software and services revenue model drives strong margins with low invested capital 10 Strong fit with growing global emphasis on sustainability and re-use Global growth potential from market expansion, 5G promotions and new 2020 2021 connected device categories (1) Global mobile devices serviced includes number of devices for which we provide value to our consumers and partners, through trade-ins and upgrades, technology, claims fulfillment, repair capabilities, logistics, and asset disposition. 2020 includes one month (December) of HYLA Mobile acquisition. © 2022 Assurant, Inc. All rights reserved. 57
Best Practices Drive Organic Program Growth Omni-channel Focus and Deployment of Global Assurant Trade-in Rates for New and Mature Programs(1) Focus on recapturing and monetizing (Illustrative) devices displaced when new device 45% purchased 40% Recaptured value offsets customer 25-35% 35% acquisition and retention program costs % 30% Rate 15-25% Omni-channel solutions maximize reach 25% and drive consistent customer experience Trade-in 20% Growth in trade-in rates drives growth 15% Industry Average in program volumes,revenues and 10% margins 5% New Trade-in Program Mature Trade-in First 12 months Program (1) For illustrative purposes based on internal data and program performance. © 2022 Assurant, Inc. All rights reserved. 58
Multi-faceted Strategy for Trade-in Growth Global Expansion More Solutions More Devices Beyond U.S. Beyond Trade-in Beyond Smartphones Illustrative Example of Mature Trade-in Program Trade-In Smart Watches 98% 67% Other Returns of Assurant Trade-in Volume from U.S. 33% Headphones & Speakers Buyer’s Remorse Return Recent Wins Early Upgrade Tablets / Laptops Device Protection Claim Warranty Exchange Gaming © 2022 Assurant, Inc. All rights reserved. 59
Our Automation Drive Differentiation and Cost Focus on Technology Driven Innovation and Advantages VISION TUNNEL RECEIVING SORT ROBOTIC FUNCTIONAL ON DEVICE DIAGNOSTIC COSMETIC GRADING TEST SOLUTIONS CELLULAR TESTING RECONDITION POLISHING FINAL SORT RETAIL SELF SERVICE SOLUTIONS © 2022 Assurant, Inc. All rights reserved. 60
Service & Repair © 2022 Assurant, Inc. All rights reserved. 61
Expand Our Service Delivery Assurant Investing to Digitize and Network, Prioritizing Same Unit Repair Consumer preference for service options, T-Mobile particularly same unit repair Retail We believe Assurant has the largest, most FULFILLMENT DYNAMIC Advance PLATFORM Retail diverse fulfillment options in the industry Exchange Repair Dynamic Fulfillment platform gives clients control and customers more choice Cost—Customer data to Experience—Risk Machine Learning and algorithms use model customer, device, location, history and Apple Store incorporate fraud controls Come-to-You Certified Ongoing monitoring of performance to Independent optimize customer experience, cost and risk Repair © 2022 Assurant, Inc. All rights reserved. 62
Convenient Service and Repair Network We Believe Assurant Has the Largest and Most 4 highly automated depot facilities in the U.S. and U.K. 13 additional facilitiesglobally Nearly 2,000 retail locations globallyincluding CPR, carrier locations and strategic partners Customer facing “Come-To-You” platform enabling a first-class experience of in-home repairs 3 Assurant Depot Facilities Total sq ft: 350K Total Headcount: 2,200 © 2022 Assurant, Inc. All rights reserved. 63
Assurant’s Launch of T In-store Repair -Mobile Rolled out the largest in-store carrier repair program in 5 months: Recruited and trained more than 1,500 repair technicians Rolled out to ~500 T-Mobile stores 10-point increase in NPS from Advanced Exchange to In-Store Repair Human resources, systems, and supply chain infrastructure leverageable for market expansion to other clients Customer Quote “This is the best experience being able to have it repaired in the T-Mobile store!! The staff were outstanding!!! Thank you!!” © 2022 Assurant, Inc. All rights reserved. 64
Omni-Channel Support © 2022 Assurant, Inc. All rights reserved. 65
Integrated Omni-Channel Customer Experience While Lowering Costs Support Driving Improved Customer choice of how they Consistently excellent customer experience want to interact with year-over-year improvement 210 Million U.S. Connected Living Event NPS Customer Touches Annually(1) 63 NPS of 50 Assurant or better exceeds considered 61 industry ‘Excellent’ average for PORTAL NPS across MOBILE APP 23 categories 58 tracked MESSAGING VOICE SCREEN/CAMERA SHARE 86% of Assurant customer interactions viadigital channels 2019 2020 2021 (1) Represents number of customer touchpoints throughout all ofConnected Living. © 2022 Assurant, Inc. All rights reserved. 66
Where and How They Want Personal TechProSupporting Connected Consumers Premium tech support via chatbot, live chat, push to talk, remote in and remote camera Support for all connected devices Jonathan Fully digital policy management and Personal TechPro claims experience NPS of 85(1)`1) Key enabler for Connected Home solution (1) Represents Personal TechProthrough September 2021. © 2022 Assurant, Inc. All rights reserved. 67
Connected Home Opportunity © 2022 Assurant, Inc. All rights reserved. 68
Consumers are Overwhelmed by IncreasingTechnology is Critical to Everyday Life, but Number of Connected Devices 72% report frustration with their Connected devices 25 connected electronics per household and/or appliances 39% of smart home device returns are due to setup 18 problems 21% of smart device owners haven’t connected their product simply because they don’t know how 2021 2025 Refer to Exhibit 3 in the Appendix for list of sources. Information listed as of December 31, 2021. © 2022 Assurant, Inc. All rights reserved. 69
Assurant Connected Home Solution Our omni-channel solution delivers multi-device protection, tech support, services, and fulfillment options across the entire customer journey. Technical Value Added Service & Protection Support Services Repair Connected devices Installation Privacy and identity In-home Mobile phones Setup management In-Store / CPR Appliances Troubleshooting Cloud services Advance exchange Reimbursement © 2022 Assurant, Inc. All rights reserved. 70
with Our Partners Across Opportunity to Reach 2.8 BillionConnected Home DevicesMultiple Consumer Touchpoints Where What How They Consumers Buy They Buy Connect 7of Top 10 Top 2 Top 3 global consumer global smartphone and U.S. cable operators electronics retailers consumer electronics OEMs 2of Top 3 2of Top 5 8of Top 10 global home global appliance OEMs global communications brands appliance retailers (increasingly focused on Home) Refer to Exhibit 3 in the Appendix for list of sources. Information listed as of December 31, 2021. © 2022 Assurant, Inc. All rights reserved. 71
StrongContinued Connected Living Positioned for Growth Strong growth Favorable Connected Home in fee-based consumer and Total growth trade-in and market trends add essable opportunity service delivery Deeper and market in Continued more diverse mobile, auto investment in globalclient and home capabilities and relationships continues to strategic M&A grow © 2022 Assurant, Inc. All rights reserved. 72
Appendix © 2022 Assurant, Inc. All rights reserved. 73
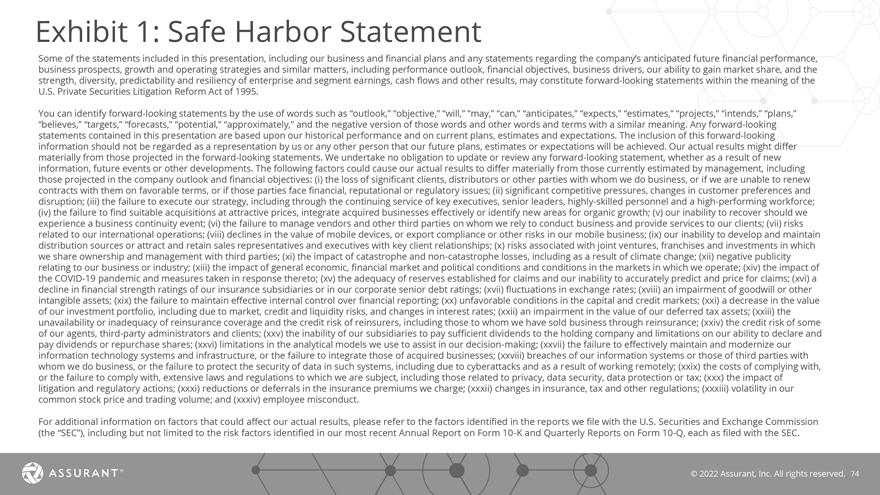
Exhibit 1: Safe Harbor Statement Some of the statements included in this presentation, including our business and financial plans and any statements regarding the company’s anticipated future financial performance, business prospects, growth and operating strategies and similar matters, including performance outlook, financial objectives, business drivers, our ability to gain market share, and the strength, diversity, predictability and resiliency of enterprise and segment earnings, cash flows and other results, may constitute forward-looking statements within the meaning of the U.S. Private Securities Litigation Reform Act of 1995. You can identify forward-looking statements by the use of words such as “outlook,” “objective,” “will,” “may,” “can,” “anticipates,” “expects,” “estimates,” “projects,” “intends,” “plans,” “believes,” “targets,” “forecasts,” “potential,” “approximately,” and the negative version of those words and other words and terms with a similar meaning. Any forward-looking statements contained in this presentation are based upon our historical performance and on current plans, estimates and expectations. The inclusion of this forward-looking information should not be regarded as a representation by us or any other person that our future plans, estimates or expectations will be achieved. Our actual results might differ materially from those projected in the forward-looking statements. We undertake no obligation to update or review any forward-looking statement, whether as a result of new information, future events or other developments. The following factors could cause our actual results to differ materially fromthose currently estimated by management, including those projected in the company outlook and financial objectives: (i) the loss of significant clients, distributors or other parties with whom we do business, or if we are unable to renew contracts with them on favorable terms, or if those parties face financial, reputational or regulatory issues; (ii) significant competitive pressures, changes in customer preferences and disruption; (iii) the failure to execute our strategy, including through the continuing service of key executives, senior leaders, highly-skilled personnel and a high-performing workforce; (iv) the failure to find suitable acquisitions at attractive prices, integrate acquired businesses effectively or identify new areas for organic growth; (v) our inability to recover should we experience a business continuity event; (vi) the failure to manage vendors and other third parties on whom we rely to conduct business and provide services to our clients; (vii) risks related to our international operations; (viii) declines in the value of mobile devices, or export compliance or other risks in our mobile business; (ix) our inability to develop and maintain distribution sources or attract and retain sales representatives and executives with key client relationships; (x) risks associated with joint ventures, franchises and investments in which we share ownership and management with third parties; (xi) the impact of catastrophe and non-catastrophe losses, including as a result of climate change; (xii) negative publicity relating to our business or industry; (xiii) the impact of general economic, financial market and political conditions and conditions in the markets in which we operate; (xiv) the impact of the COVID-19 pandemic and measures taken in response thereto; (xv) the adequacy of reserves established for claims and our inability to accurately predict and price for claims; (xvi) a decline in financial strength ratings of our insurance subsidiaries or in our corporate senior debt ratings; (xvii) fluctuationsin exchange rates; (xviii) an impairment of goodwill or other intangible assets; (xix) the failure to maintain effective internal control over financial reporting; (xx) unfavorable conditions in the capital and credit markets; (xxi) a decrease in the value of our investment portfolio, including due to market, credit and liquidity risks, and changes in interest rates; (xxii) an impairment in the value of our deferred tax assets; (xxiii) the unavailability or inadequacy of reinsurance coverage and the credit risk of reinsurers, including those to whom we have sold business through reinsurance; (xxiv) the credit risk of some of our agents, third-party administrators and clients; (xxv) the inability of our subsidiaries to pay sufficient dividends to the holding company and limitations on our ability to declare and pay dividends or repurchase shares; (xxvi) limitations in the analytical models we use to assist in our decision-making; (xxvii)the failure to effectively maintain and modernize our information technology systems and infrastructure, or the failure to integrate those of acquired businesses; (xxviii) breaches of our information systems or those of third parties with whom we do business, or the failure to protect the security of data in such systems, including due to cyberattacks and as a result of working remotely; (xxix) the costs of complying with, or the failure to comply with, extensive laws and regulations to which we are subject, including those related to privacy, data security, data protection or tax; (xxx) the impact of litigation and regulatory actions; (xxxi) reductions or deferrals in the insurance premiums we charge; (xxxii) changes in insurance, tax and other regulations; (xxxiii) volatility in our common stock price and trading volume; and (xxxiv) employee misconduct. For additional information on factors that could affect our actual results, please refer to the factors identified in the reports we file with the U.S. Securities and Exchange Commission (the “SEC”), including but not limited to the risk factors identified in our most recent Annual Report on Form 10-K and Quarterly Reports on Form 10-Q, each as filed with the SEC. © 2022 Assurant, Inc. All rights reserved. 74
Exhibit 2: Non-GAAP Financial Measures (1) Assurant uses Adjusted EBITDA, excluding reportable catastrophes, as an important measure of the company’s operating performance. Assurant defines Adjusted EBITDA, excluding reportable catastrophes, as net income from continuing operations, excluding net realized gains (losses) on investments and fair value changes to equity securities, COVID-19 direct and incremental expenses, loss on extinguishment of debt, net income (loss) attributable to non-controlling interests, interest expense, provision (benefit) for income taxes, depreciation expense, amortization of purchased intangible assets, restructuring costs related to strategic exit activities (outside of normal periodic restructuring and cost management activities) and reportable catastrophes (which represents individual catastrophic events that generate losses in excess of $5.0 million, pre-tax, net of reinsurance and client profit sharing adjustments and including reinstatement and other premiums), as well as other highly variable or unusual items. The company believes this metric provides investors with an important measure of the company’s operating performance because it excludes items that do not represent the ongoing operations of the company or can be volatile, and therefore (i) enhances management’s and investors’ ability to analyze the ongoing operations of its businesses and (ii) facilitates comparisons of its operating performance over multiple periods, including because the amortization expense associated with purchased intangible assets may fluctuate from period to period based on the timing, size, nature and number of acquisitions. Although the company excludes amortization of purchased intangible assets from Adjusted EBITDA, revenue generated from such intangible assets is included within the revenue in determining Adjusted EBITDA. The comparable GAAP measure is net income from continuing operations. (1) Additional details about the components of Other adjustments and other key financial metrics are included in the Financial Supplement located on Assurant’s Investor Relations website http://ir.assurant.com/investor/default.aspx © 2022 Assurant, Inc. All rights reserved. 75
Exhibit 2: Non-GAAP Financial Measures (Continued) (2) Assurant uses Adjusted earnings per diluted share as an important measure of the company’s stockholder value. Assurant defines Adjusted earnings per diluted share as net income from continuing operations, excluding net realized gains (losses) on investments and fair value changes to equity securities, amortization of purchased intangible assets, COVID-19 direct and incremental expenses, the CARES Act tax benefit, loss on extinguishment of debt, net income (loss) attributable to non-controlling interests and restructuring costs related to strategic exit activities (outside of normal periodic restructuring and cost management activities), as well as other highly variable or unusual items, plus any dilutive preferred stock dividends, divided by the weighted average diluted shares outstanding. The company believes this metric provides investors with an important measure of stockholder value because it excludes items that do not represent the ongoing operations of the company, and therefore (i) enhances management’s and investors’ ability to analyze the ongoing operations of its businesses and (ii) facilitates comparisons of its operating performance over multiple periods, including because the amortization expense associated with purchased intangible assets may fluctuate from period to period based on the timing, size, nature and number of acquisitions. Although the company excludes amortization of purchased intangible assets from Adjusted earnings, revenue generated from such intangible assets is included within the revenue in determining Adjusted earnings. The comparable GAAP measure is net income from continuing operations per diluted share, defined as net income from continuing operations plus any dilutive preferred stock dividends less net income from non-controlling interests, divided by the weighted average number of diluted shares outstanding. Assurant uses Adjusted earnings, excluding reportable catastrophes, per diluted share (each as defined above) as another important measure of the company’s (1) Information on the share counts used in the per share calculations are included in the Financial stockholder value. The company believes this metric provides investors with a Supplement located on Assurant’s Investor Relations website http://ir.assurant.com/investor/default.aspx valuable measure of stockholder value because it excludes reportable catastrophes, which can be volatile. The comparable GAAP measure is net income from continuing operations per diluted share, defined as net income from continuing operations plus (2) Additional details about the components of Other adjustments and other key financial metrics are any dilutive preferred stock dividends less net income from non-controlling interests, included in the Financial Supplement located on Assurant’s Investor Relations website divided by the weighted average diluted shares outstanding. http://ir.assurant.com/investor/default.aspx © 2022 Assurant, Inc. All rights reserved. 76
Exhibit 2: Non-GAAP Financial Measures (Continued) (3) Assurant uses Segment Adjusted EBITDA, excluding reportable catastrophes, as an important measure of Global Lifestyle and Global Housing’s combined operating performance. Assurant defines Segment Adjusted EBITDA, excluding reportable catastrophes, as Adjusted EBITDA for Global Lifestyle plus Adjusted EBITDA for Global Housing, which in each case is the company’s GAAP segment measure of profitability for its reportable segments effective January 1, 2022, excluding in each case reportable catastrophes (defined above). The company believes this metric provides investors with an important measure of Global Lifestyle and Global Housing’s combined operating performance because it excludes reportable catastrophes, which can be volatile. The comparable GAAP measure is Global Lifestyle Adjusted EBITDA. © 2022 Assurant, Inc. All rights reserved. 77
Exhibit 2: Non-GAAP Financial Measures (Continued) (4) Given its ongoing shift to more service-oriented, fee-based businesses, the company will use Adjusted EBITDA, excluding reportable catastrophes, as its performance metric for the enterprise and its reportable segments going forward and will no longer report net operating income and other related non-GAAP metrics beginning in first quarter 2022. Assurant defines net operating income, excluding reportable catastrophes (defined above), as net income from continuing operations, excluding net realized gains (losses) on investments and fair value changes to equity securities, COVID-19 direct and incremental expenses, the CARES Act tax benefit, loss on extinguishment of debt, net income (loss) attributable to non-controlling interests, restructuring costs related to strategic exit activities (outside of normal periodic restructuring and cost management activities) and reportable catastrophes, as well as other highly variable or unusual items. The comparable GAAP measure is net income from continuing operations. (1) Additional details about the components of Other adjustments and other key financial metrics are included in the Financial Supplement located on Assurant’s Investor Relations website http://ir.assurant.com/investor/default.aspx © 2022 Assurant, Inc. All rights reserved. 78
Exhibit 2: Non-GAAP Financial Measures (Continued) (5) Given its ongoing shift to more service-oriented, fee-based businesses, the company will use Adjusted EBITDA, excluding reportable catastrophes, as its performance metric for the enterprise and its reportable segments going forward and will no longer be using net operating income and other related non-GAAP metrics beginning in first quarter 2022. Assurant defines net operating income, excluding reportable catastrophes, per diluted share as net operating income, excluding reportable catastrophes (each defined above), plus any dilutive preferred stock dividends, divided by the weighted average number of diluted shares outstanding. The comparable GAAP measure is net income from continuing operations per diluted share, defined as net income from continuing operations plus any dilutive preferred stock dividends less net income from non-controlling interests, divided by the weighted average number of diluted shares outstanding. (1) Information on the share counts used in the per share calculations are included in the Financial Supplement located on Assurant’s Investor Relations website http://ir.assurant.com/investor/default.aspx (2) Additional details about the components of Other adjustments and other key financial metrics are included in the Financial Supplement located on Assurant’s Investor Relations website http://ir.assurant.com/investor/default.aspx © 2022 Assurant, Inc. All rights reserved. 79
Exhibit 2: Non-GAAP Financial Measures (Continued) (6) The company outlook and financial objectives for Adjusted earnings, excluding reportable catastrophes, per diluted share and Adjusted EBITDA, excluding reportable catastrophes, for Assurant and Global Housing and segment cash generation each constitute forward-looking information and the company believes that it cannot reconcile such forward-looking information to the most comparable GAAP measure without unreasonable efforts. Many of the GAAP components cannot be reliably quantified due to the combination of variability and volatility of such components and may, depending on the size of the components, have a significant impact on the reconciliation. For 2022, the company is able toquantify a full-year estimate of interest expense, depreciation expense and amortization of purchased intangible assets, each on a pre-tax basis, which are expected to be approximately $109 million, $85 million and $70 million, respectively. The interest expense estimate assumes no additional debt is incurred or extinguished in the forecast period and excludes after-tax interest expenses included in debt extinguishment and other related costs. © 2022 Assurant, Inc. All rights reserved. 80
Exhibit 3: Data Sources Assurant Global Lifestyle (continued) Source: World 100 Most Valuable Brands in 2021 by Top 3 U.S. wireless carriers Source: Public filings by subscribers 15 of Top 50 most Visual Capitalist valuable global brands Top 2 global smartphone OEMs Source: US News/IDC (2021) 7 of top 15 global retailers Source: Top 100 Retailers 2021 Edition – RIS News Global Lifestyle Top 3 U.S. credit card issuers Source: US News/NilsonReport (2021) 8 of the top 10 global Source: Telecoms 150 2021 Ranking by Brand Finance 7 of top 10 global consumer Source: DealerscopeTop 101 Retailers (2021) telecommunications brands electronics retailers 2 of top 3 global home appliance Source: Traqline.com (2021) and Industry 4 of the top 5 dealer groups Source: AutonewsTop 150 (2020), internal retailers analyst reports (2021) management estimates Key industry statistics: Top 2 global smartphone and Source: IDC Numbers by GSMArena 300M global device protection Source: Internal management estimates consumer electronics OEMs (2022) customers 2 of Top 5 global appliance OEMs Source: Statista report (2021) 250M global refurbished annual Source: IDC Top 3 U.S. cable operators Source: Cable and Satellite report (2021), device sales Industry research reports 400M global vehicle Source: HTF Market Intelligence, National 5G, Macro, Consumer and Market trends data sourced through IDC data, Mordor service contracts Automobile Dealers Association, internal Intelligence, Chetan Sharma Consulting, Gartner, Strategy Analytics, U.S. Census Bureau management estimates and industry analyst reports. Mobile Protection data sourced through IDC data and industry analyst reports. Connected Home Opportunity data sourced through Strategy Analytics (2021) , Assurant Research Whitepaper “The Connected Decade 2021” US-only, and Parks Associates (2021). © 2022 Assurant, Inc. All rights reserved. 81
Exhibit 3: Data Sources Global Housing 7 of the top 10 largest Source: 2021 NMHC 50 Largest multifamily housing PMCs in the Apartment Managers U.S. Key industry statistics: 20M U.S. renters’ policies Source: US Census Bureau, NAIC, IBIS World, Internal management estimates 53M U.S. mortgages Source: Black Knight © 2022 Assurant, Inc. All rights reserved. 82
Exhibit 3: Relevant Peer Groups Capital-light peers Risk-based peers Data sourced from Factset. © 2022 Assurant, Inc. All rights reserved. 83