Exhibit 99.1

| Aspen Insurance Holdings Limited Chris O'Kane Chief Executive Officer Richard Houghton Chief Financial Officer November/December 2009 Investor Presentation |
| 2 Safe Harbor Disclosure This slide presentation is for information purposes only. It should be read in conjunction with our financial supplement posted on our website on the Investor Relations page and with other documents filed by Aspen Insurance Holdings Limited (the "Company" or "Aspen") with the U.S. Securities and Exchange Commission. Non-GAAP Financial Measures In presenting Aspen's results, management has included and discussed certain "non-GAAP financial measures", as such term is defined in Regulation G. Management believes that these non-GAAP measures, which may be defined differently by other companies, better explain Aspen's results of operations in a manner that allows for a more complete understanding of the underlying trends in Aspen's business. However, these measures should not be viewed as a substitute for those determined in accordance with GAAP. The reconciliation of such non-GAAP financial measures to their respective most directly comparable GAAP financial measures in accordance with Regulation G is included herein or in the financial supplement, as applicable, which can be obtained from the Investor Relations section of Aspen's website at www.aspen.bm. All forward-looking statements address matters that involve risks and uncertainties. Accordingly, there are or will be important factors that could cause actual results to differ materially from those indicated in these statements. Aspen believes these factors include, but are not limited to: the continuing and uncertain impact of the current depressed credit environment, the banking crises and economic recessions in many of the countries in which we operate and of the measures being taken by governments to counter these issues; the risk of a material decline in the value or liquidity of all or parts of our investment portfolio; changes in insurance and reinsurance market conditions that could adversely impact execution of the business plan; changes in our ability to exercise capital management or strategic initiatives or to arrange banking facilities as a result of prevailing market changes or changes in our financial position; our ability to execute our business plan to enter new markets, introduce new products and develop new distribution channels, including their integration into our existing operations; increased counterparty risk due to the impairment of financial institutions; changes in the total industry losses, or our share of total industry losses, resulting from past events such as Hurricanes Ike and Gustav and, with respect to such events, our reliance on loss reports received from cedants and loss adjustors, our reliance on industry loss estimates and those generated by modelling techniques, changes in rulings on flood damage or other exclusions as a result of prevailing lawsuits and case law, any changes in our reinsurers' credit quality and the amount and timing of reinsurance recoverables; the impact of acts of terrorism and related legislation and acts of war; the possibility of greater frequency or severity of claims and loss activity, including as a result of natural or man-made (including economic and political risks) catastrophic events, than our underwriting, reserving, reinsurance purchasing or investment practices have anticipated; evolving interpretive issues with respect to coverage after major loss events; the level of inflation in repair costs due to limited availability of labor and materials after catastrophes; the effectiveness of our loss limitation methods; changes in the availability, cost or quality of reinsurance or retrocessional coverage; the reliability of, and changes in assumptions to, natural and man-made catastrophe pricing, accumulation and estimated loss models; loss of key personnel; a decline in our operating subsidiaries' ratings with Standard & Poor's ("S&P"), A.M. Best or Moody's Investors Service ("Moody's"); changes in general economic conditions, including inflation, foreign currency exchange rates, interest rates and other factors that could affect our investment portfolio; the number and type of insurance and reinsurance contracts that we wrote at the January 1st and other renewal periods in 2009 and the premium rates available at the time of such renewals within our targeted business lines; increased competition on the basis of pricing, capacity, coverage terms or other factors and the related demand and supply dynamics as contracts come up for renewal; decreased demand for our insurance or reinsurance products and cyclical changes in the insurance and reinsurance sectors; changes in government regulations or tax laws in jurisdictions where we conduct business; and Aspen or its Bermudian subsidiary becoming subject to income taxes in the United States or the United Kingdom; and the effect on insurance markets, business practices and relationships of ongoing litigation, investigations and regulatory activity by insurance regulators and prosecutors. For a more detailed description of these uncertainties and other factors, please see the "Risk Factors" section in Aspen's Annual Reports on Form 10-K as filed with the U.S. Securities and Exchange Commission on February 26, 2009. Aspen undertakes no obligation to publicly update or revise any forward-looking statements, whether as a result of new information, future events or otherwise. Readers are cautioned not to place undue reliance on these forward-looking statements, which speak only as of the dates on which they are made. |
| 3 Contents Introduction and Shareholder Value Drivers Review of Underwriting Platforms and Strategy Market Conditions Q3 2009 Results Highlights Liquidity and Capital Position Appendix |
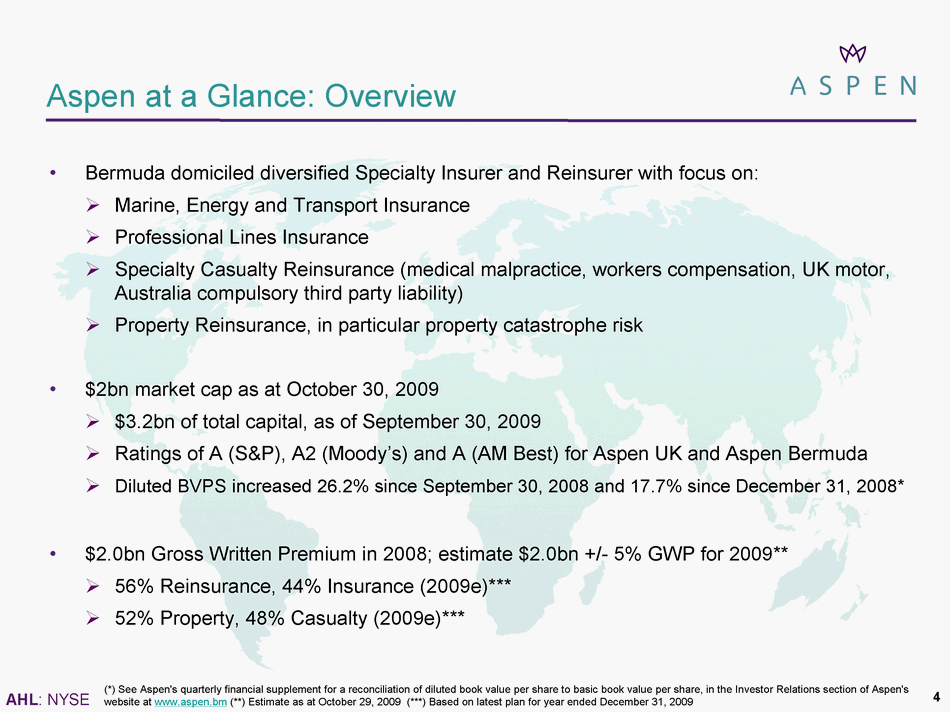
| 4 Aspen at a Glance: Overview Bermuda domiciled diversified Specialty Insurer and Reinsurer with focus on: ? Marine, Energy and Transport Insurance ? Professional Lines Insurance ? Specialty Casualty Reinsurance (medical malpractice, workers compensation, UK motor, Australia compulsory third party liability) ? Property Reinsurance, in particular property catastrophe risk $2bn market cap as at October 30, 2009 ? $3.2bn of total capital, as of September 30, 2009 ? Ratings of A (S&P), A2 (Moody's) and A (AM Best) for Aspen UK and Aspen Bermuda ? Diluted BVPS increased 26.2% since September 30, 2008 and 17.7% since December 31, 2008* $2.0bn Gross Written Premium in 2008; estimate $2.0bn +/- 5% GWP for 2009** ? 56% Reinsurance, 44% Insurance (2009e)*** ? 52% Property, 48% Casualty (2009e)*** (*) See Aspen's quarterly financial supplement for a reconciliation of diluted book value per share to basic book value per share, in the Investor Relations section of Aspen's website at www.aspen.bm (**) Estimate as at October 29, 2009 (***) Based on latest plan for year ended December 31, 2009 |
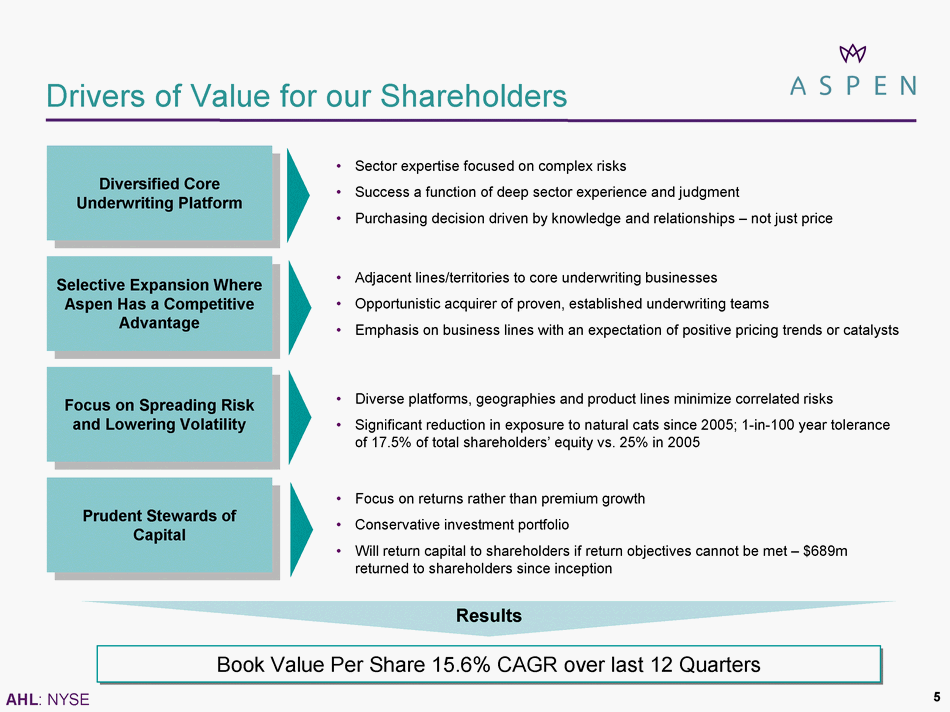
| Drivers of Value for our Shareholders Diversified Core Underwriting Platform Selective Expansion Where Aspen Has a Competitive Advantage Focus on Spreading Risk and Lowering Volatility Prudent Stewards of Capital Sector expertise focused on complex risks Success a function of deep sector experience and judgment Purchasing decision driven by knowledge and relationships - not just price Adjacent lines/territories to core underwriting businesses Opportunistic acquirer of proven, established underwriting teams Emphasis on business lines with an expectation of positive pricing trends or catalysts Diverse platforms, geographies and product lines minimize correlated risks Significant reduction in exposure to natural cats since 2005; 1-in-100 year tolerance of 17.5% of total shareholders' equity vs. 25% in 2005 Focus on returns rather than premium growth Conservative investment portfolio Will return capital to shareholders if return objectives cannot be met - $689m returned to shareholders since inception Results Book Value Per Share 15.6% CAGR over last 12 Quarters 5 |
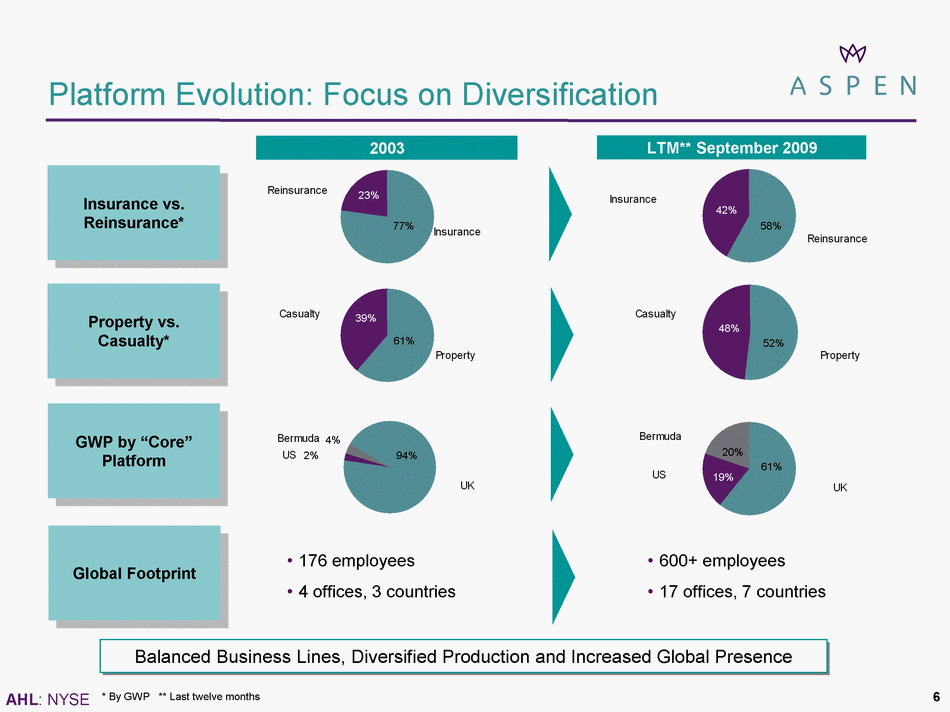
| 6 Platform Evolution: Focus on Diversification Insurance vs. Reinsurance* Property vs. Casualty* GWP by "Core" Platform Global Footprint 2003 176 employees 4 offices, 3 countries 600+ employees 17 offices, 7 countries Balanced Business Lines, Diversified Production and Increased Global Presence LTM** September 2009 * By GWP ** Last twelve months 23% 77% 39% 61% 4% 2% 94% 42% 58% 19% 20% 48% 52% 61% |
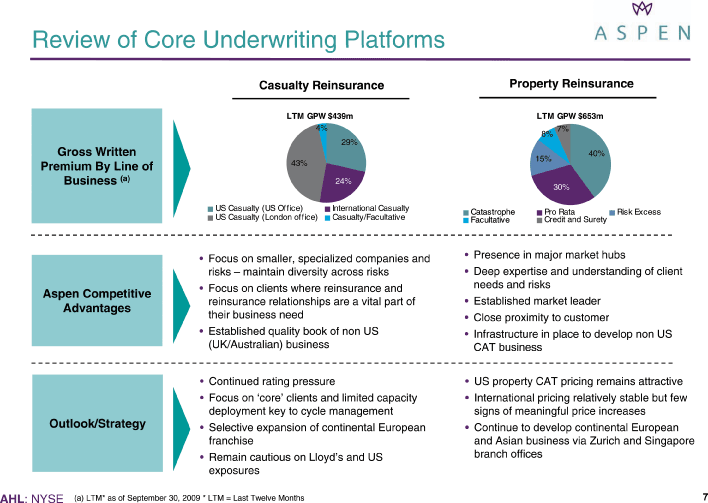
| 7 Review of Core Underwriting Platforms 30 Gross Written Premium By Line of Business (a) Aspen Competitive Advantages Outlook/Strategy (a) LTM* as of September 30, 2009 * LTM = Last Twelve Months Focus on smaller, specialized companies and risks - maintain diversity across risks Focus on clients where reinsurance and reinsurance relationships are a vital part of their business need Established quality book of non US (UK/Australian) business Continued rating pressure Focus on 'core' clients and limited capacity deployment key to cycle management Selective expansion of continental European franchise Remain cautious on Lloyd's and US exposures Presence in major market hubs Deep expertise and understanding of client needs and risks Established market leader Close proximity to customer Infrastructure in place to develop non US CAT business US property CAT pricing remains attractive International pricing relatively stable but few signs of meaningful price increases Continue to develop continental European and Asian business via Zurich and Singapore branch offices 40% 28% Casualty Reinsurance Property Reinsurance |
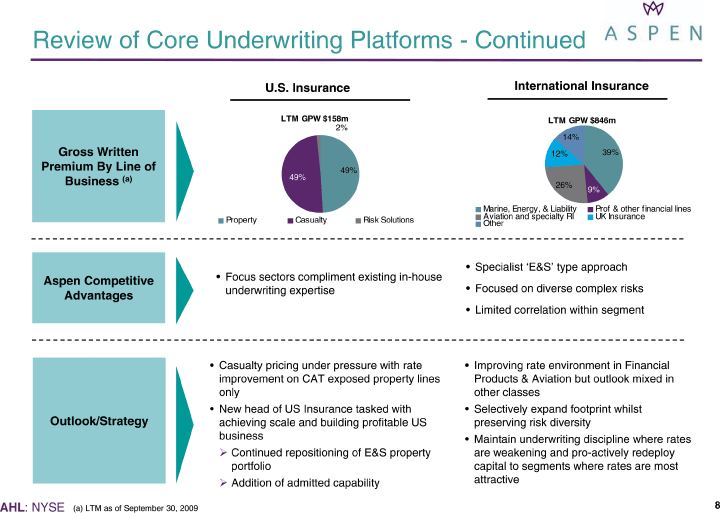
| 8 Review of Core Underwriting Platforms - Continued 30 (a) LTM as of September 30, 2009 Specialist 'E&S' type approach Focused on diverse complex risks Limited correlation within segment Improving rate environment in Financial Products & Aviation but outlook mixed in other classes Selectively expand footprint whilst preserving risk diversity Maintain underwriting discipline where rates are weakening and pro-actively redeploy capital to segments where rates are most attractive Focus sectors compliment existing in-house underwriting expertise Casualty pricing under pressure with rate improvement on CAT exposed property lines only New head of US Insurance tasked with achieving scale and building profitable US business ? Continued repositioning of E&S property portfolio ? Addition of admitted capability Gross Written Premium By Line of Business (a) Aspen Competitive Advantages Outlook/Strategy International Insurance U.S. Insurance |
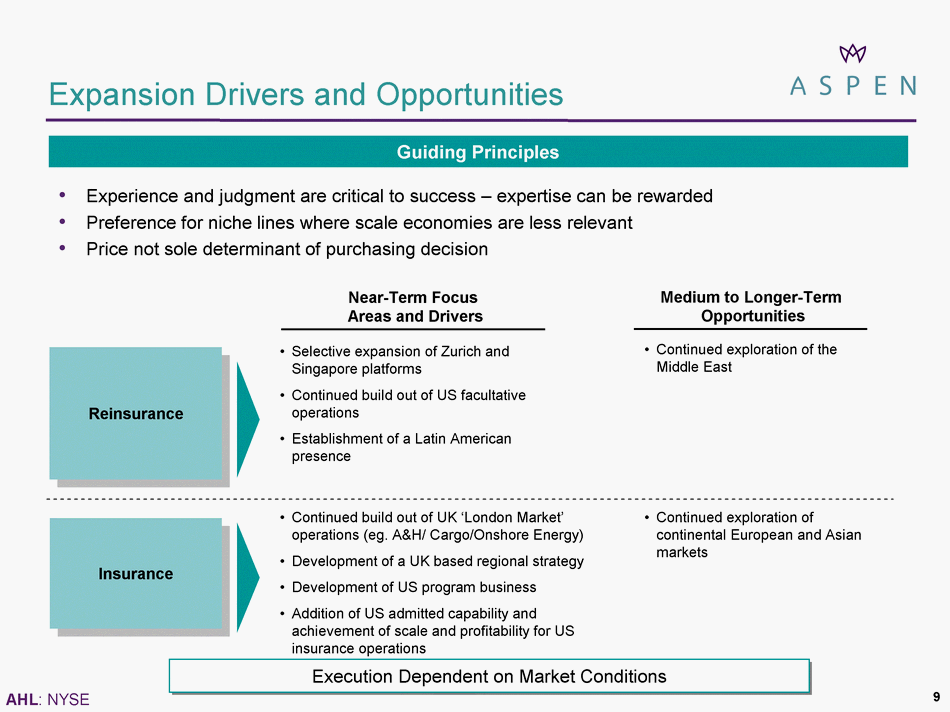
| 9 Expansion Drivers and Opportunities Near-Term Focus Areas and Drivers Medium to Longer-Term Opportunities Continued build out of UK 'London Market' operations (eg. A&H/ Cargo/Onshore Energy) Development of a UK based regional strategy Development of US program business Addition of US admitted capability and achievement of scale and profitability for US insurance operations Continued exploration of continental European and Asian markets Reinsurance Insurance Selective expansion of Zurich and Singapore platforms Continued build out of US facultative operations Establishment of a Latin American presence Continued exploration of the Middle East Guiding Principles Experience and judgment are critical to success - expertise can be rewarded Preference for niche lines where scale economies are less relevant Price not sole determinant of purchasing decision Execution Dependent on Market Conditions |
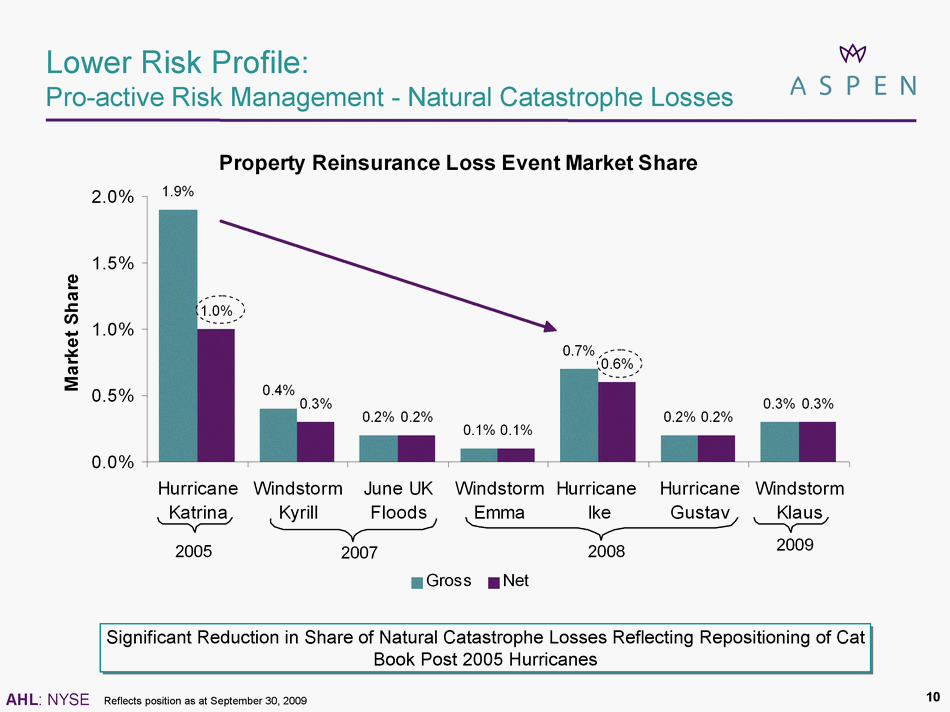
| Lower Risk Profile: Pro-active Risk Management - Natural Catastrophe Losses Reflects position as at September 30, 2009 Significant Reduction in Share of Natural Catastrophe Losses Reflecting Repositioning of Cat Book Post 2005 Hurricanes 10 |
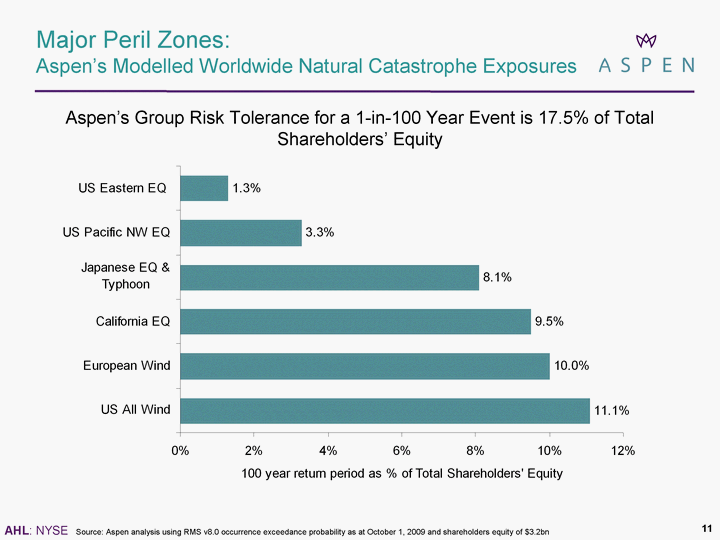
| Major Peril Zones: Aspen's Modelled Worldwide Natural Catastrophe Exposures Source: Aspen analysis using RMS v8.0 occurrence exceedance probability as at 1 October 2009 Aspen's Group Risk Tolerance for a 1-in-100 Year Event is 17.5% of Total Shareholders' Equity 11 |
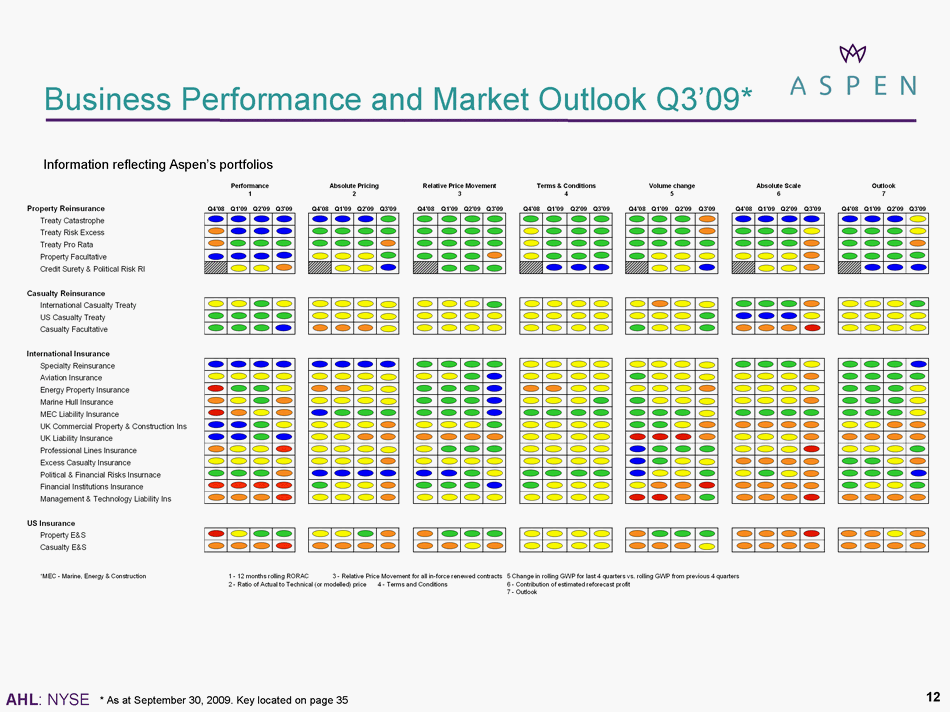
| Business Performance and Market Outlook Q3'09* Information reflecting Aspen's portfolios * As at September 30, 2009. Key located on page 35 12 |
| 13 2009 Q3 Results Highlights Key Industry Themes Aspen Performance Hard market in cat exposed property lines with modest hardening in other property business Energy related liability, marine hull, aviation and financial institutions lines have seen prices increase Turn for casualty rates has not yet materialized Industry reserve releases have remained strong but are expected to taper off Balance sheets have been fortified by recovering financial markets Increase in diluted BVPS of 8.9% during Q3 2009 and 26.2% over Q3 2008 against a backdrop of market turmoil* Annualized total return on investments for the quarter of 11.4% Overall combined ratio for the quarter of 80.3% Increase in GWP of 11.1% compared to Q3 08 reflecting benefits of increasing diversification (product and platform) Annualized Operating ROE of 19.2%* Strong Performance Given Continued Challenging Market Conditions (*) See Aspen's quarterly financial supplement for a reconciliation of operating income to net income, diluted book value per share to basic book value per share and reconciliation of average equity to closing shareholders' equity in the Investor Relations section of Aspen's website at www.aspen.bm |
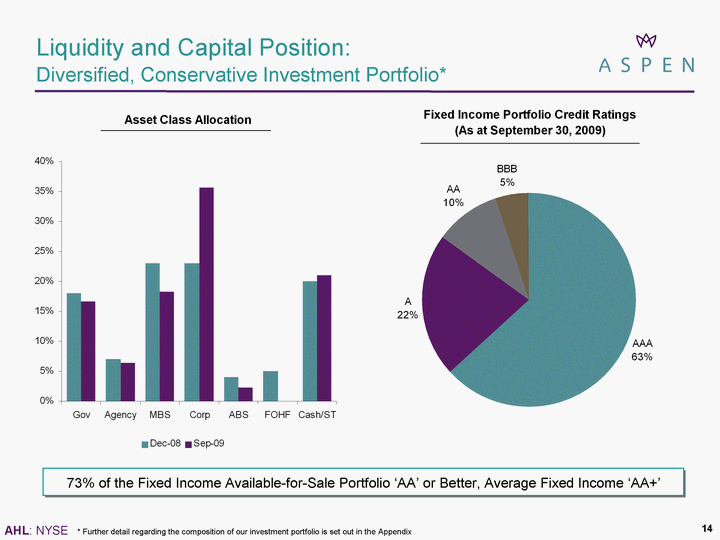
| 14 Liquidity and Capital Position: Diversified, Conservative Investment Portfolio* 73% of The Fixed Income Available-for-Sale Portfolio 'AA' or Better, Average Fixed Income 'AA+' * Further detail regarding the composition of our investment portfolio is set out in the Appendix |
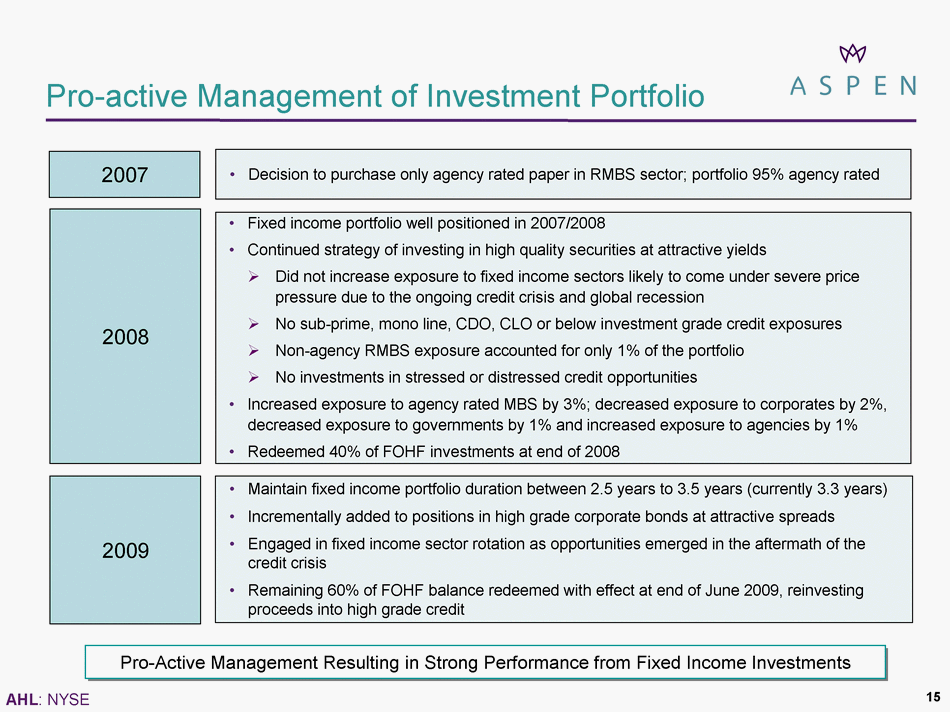
| 15 Pro-active Management of Investment Portfolio Decision to purchase only agency rated paper in RMBS sector; portfolio 95% agency rated 2007 Pro-Active Management Resulting in Strong Performance from Fixed Income Investments Fixed income portfolio well positioned in 2007/2008 Continued strategy of investing in high quality securities at attractive yields ? Did not increase exposure to fixed income sectors likely to come under severe price pressure due to the ongoing credit crisis and global recession ? No sub-prime, mono line, CDO, CLO or below investment grade credit exposures ? Non-agency RMBS exposure accounted for only 1% of the portfolio ? No investments in stressed or distressed credit opportunities Increased exposure to agency rated MBS by 3%; decreased exposure to corporates by 2%, decreased exposure to governments by 1% and increased exposure to agencies by 1% Redeemed 40% of FOHF investments at end of 2008 2008 2009 Maintain fixed income portfolio duration between 2.5 years to 3.5 years (currently 3.3 years) Incrementally added to positions in high grade corporate bonds at attractive spreads Engaged in fixed income sector rotation as opportunities emerged in the aftermath of the credit crisis Remaining 60% of FOHF balance redeemed with effect at end of June 2009, reinvesting proceeds into high grade credit |
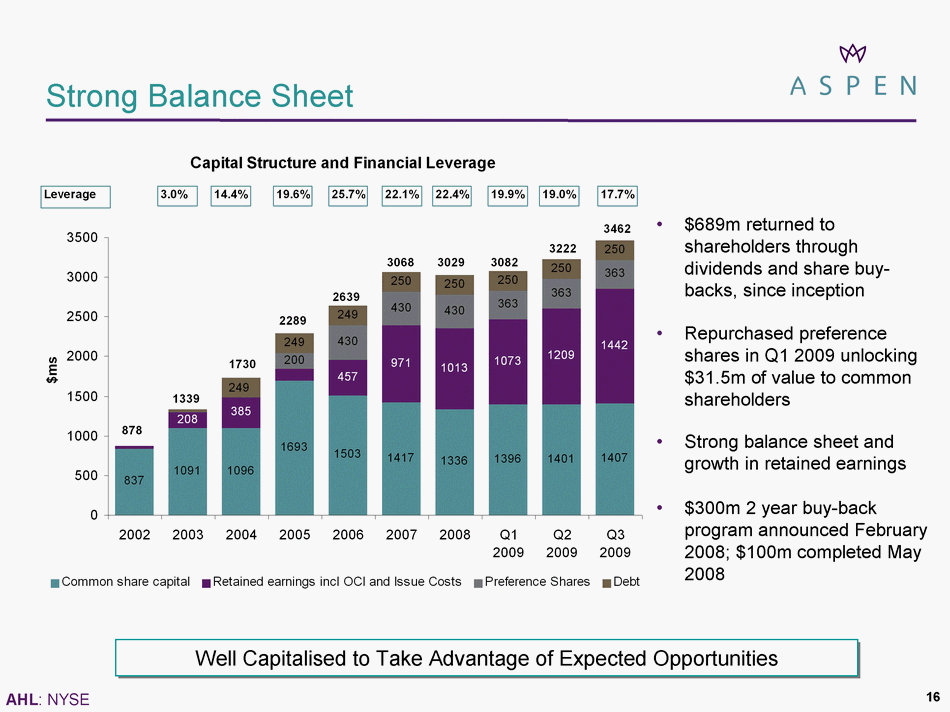
| 16 Strong Balance Sheet $689m returned to shareholders through dividends and share buy- backs, since inception Repurchased preference shares in Q1 2009 unlocking $31.5m of value to common shareholders Strong balance sheet and growth in retained earnings $300m 2 year buy-back program announced February 2008; $100m completed May 2008 Well Capitalised to Take Advantage of Expected Opportunities |
| Capital Management: Approach A highly cyclical business requires active capital management Capital requirements based on ? Business needs & opportunities ? Rating Agencies ? Regulatory Requirements Strategy of diversification through addition of non-correlating product lines and an expanding geographic footprint when market conditions are right Return of capital to shareholders can present an attractive alternative Continuing to assess opportunities and capital requirements for 2010 17 We Do Not Intend to Trade on an Over-Capitalized Basis |
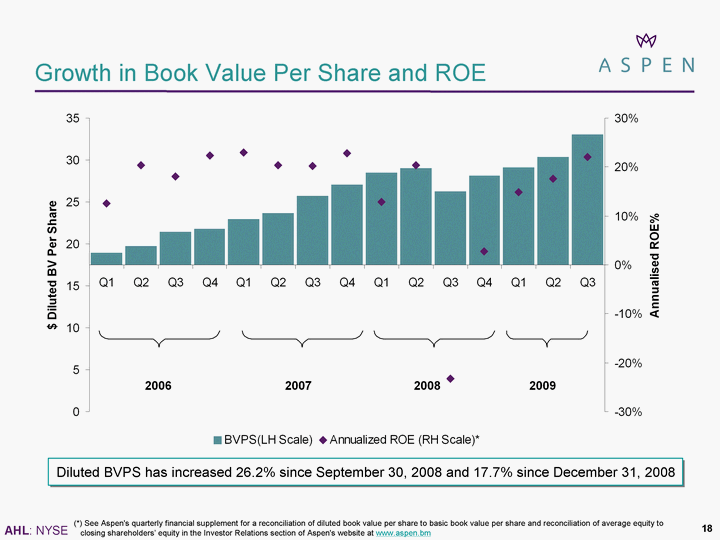
| Growth in Book Value Per Share and ROE (*) See Aspen's quarterly financial supplement for a reconciliation of diluted book value per share to basic book value per share, reconciliation of average equity to closing shareholders' equity in the Investor Relations section of Aspen's website at www.aspen.bm Diluted BVPS has increased 26.2% since September 30, 2008 and 17.7% since December 31, 2008 18 |
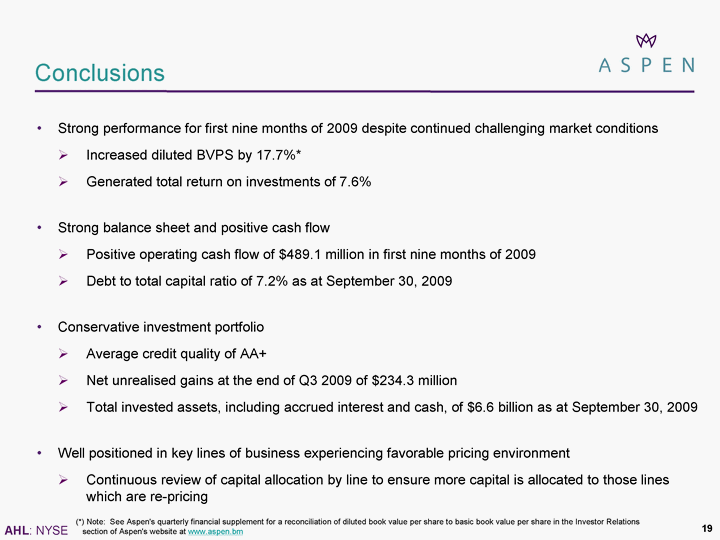
| Strong performance for first nine months of 2009 despite continued challenging market conditions ? Increased diluted BVPS by 17.7%* ? Generated total return on investments of 6.7% Strong balance sheet and positive cash flow ? Positive operating cash flow of $489.1 million in first nine months of 2009 ? Debt to total capital ratio of 7.2% as at September 30, 2009 Conservative investment portfolio ? Average credit quality of AA+ ? Net unrealised gains at the end of Q3 of $234.3 million ? Total invested assets, including accrued interest and cash, of $6.6 billion as at September 30, 2009 Well positioned in key lines of business experiencing favourable pricing environment ? Continuous review of capital allocation by line to ensure more capital is allocated to those lines which are re-pricing 19 Conclusions (*) Note: See Aspen's quarterly financial supplement for a reconciliation of diluted book value per share to basic book value per share in the Investor Relations section of Aspen's website at www.aspen.bm |
| 20 Appendix Investment Portfolio ? Fixed Income Portfolio by Asset Type ? Portfolio Ratings ? Gross Unrealised Gains and Losses ? Corporate Sector Allocations Lower Risk Profile Financials ? Financial Highlights Q3 & YTD 2009 |
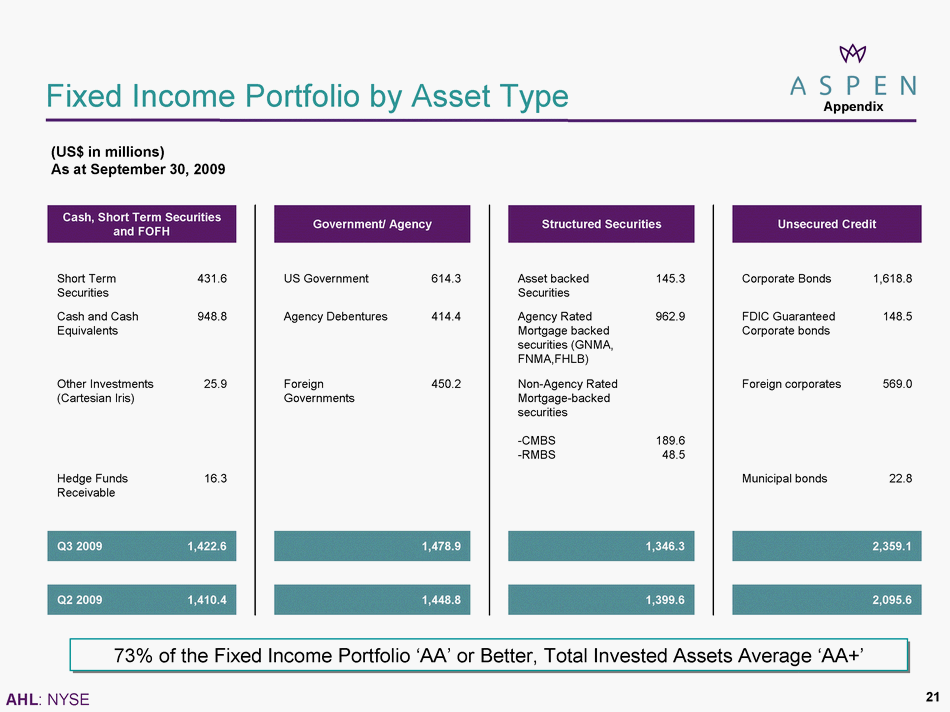
| Fixed Income Portfolio by Asset Type (US$ in millions) As at September 30, 2009 73% of the Fixed Income Portfolio 'AA' or Better, Total Invested Assets Average 'AA+' Appendix 21 Cash, Short Term Securities and FOFH Cash, Short Term Securities and FOFH Government/ Agency Government/ Agency Structured Securities Structured Securities Unsecured Credit Unsecured Credit Short Term Securities 431.6 US Government 614.3 Asset backed Securities 145.3 Corporate Bonds 1,618.8 Cash and Cash Equivalents 948.8 Agency Debentures 414.4 Agency Rated Mortgage backed securities (GNMA, FNMA,FHLB) 962.9 FDIC Guaranteed Corporate bonds 148.5 Other Investments (Cartesian Iris) 25.9 Foreign Governments 450.2 Non-Agency Rated Mortgage-backed securities CMBS RMBS 189.6 48.5 Foreign corporates 569.0 Hedge Funds Receivable 16.3 Municipal bonds 22.8 Q3 2009 1,422.6 1,478.9 1,346.3 2,359.1 Q2 2009 1,410.4 1,448.8 1,399.6 2,095.6 |
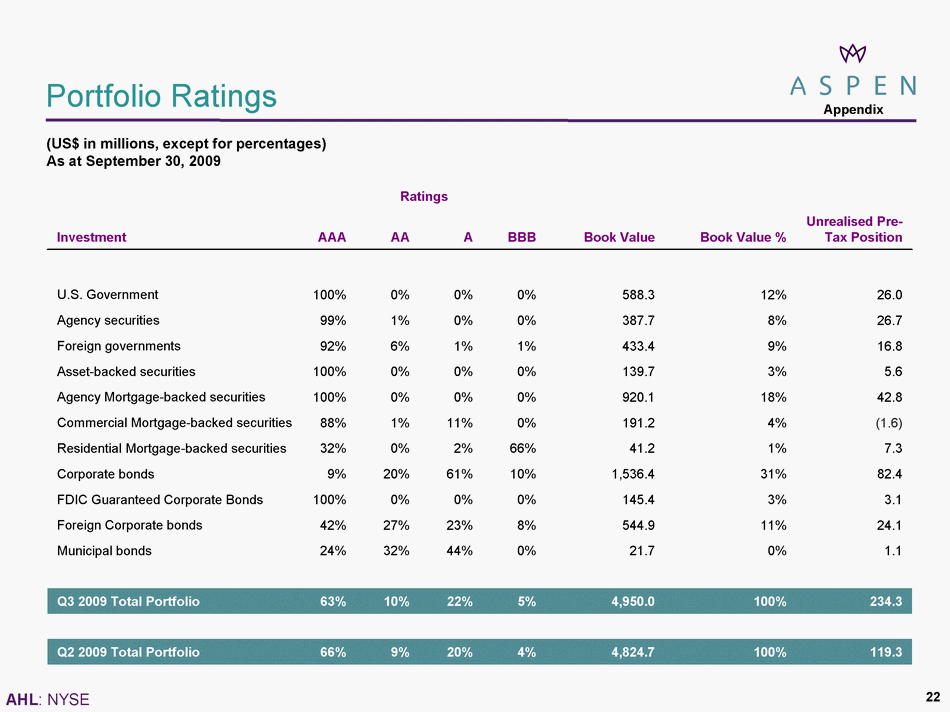
| 22 Portfolio Ratings Appendix Ratings Ratings Ratings Ratings Investment AAA AA A BBB Book Value Book Value % Unrealised Pre-Tax Position U.S. Government 100% 0% 0% 0% 588.3 12% 26.0 Agency securities 99% 1% 0% 0% 387.7 8% 26.7 Foreign governments 92% 6% 1% 1% 433.4 9% 16.8 Asset-backed securities 100% 0% 0% 0% 139.7 3% 5.6 Agency Mortgage-backed securities 100% 0% 0% 0% 920.1 18% 42.8 Commercial Mortgage-backed securities 88% 1% 11% 0% 191.2 4% (1.6) Residential Mortgage-backed securities 32% 0% 2% 66% 41.2 1% 7.3 Corporate bonds 9% 20% 61% 10% 1,536.4 31% 82.4 FDIC Guaranteed Corporate Bonds 100% 0% 0% 0% 145.4 3% 3.1 Foreign Corporate bonds 42% 27% 23% 8% 544.9 11% 24.1 Municipal bonds 24% 32% 44% 0% 21.7 0% 1.1 Q3 2009 Total Portfolio 63% 10% 22% 5% 4,950.0 100% 234.3 Q2 2009 Total Portfolio 66% 9% 20% 4% 4,824.7 100% 119.3 (US$ in millions, except for percentages) As at September 30, 2009 |
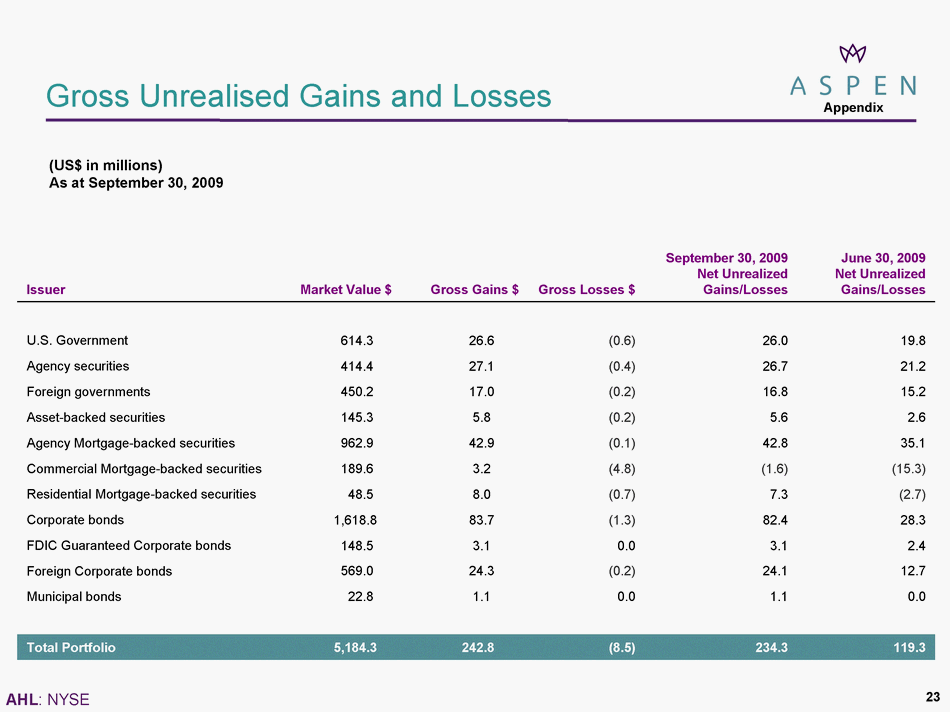
| 23 Gross Unrealised Gains and Losses Appendix (US$ in millions) As at September 30, 2009 Issuer Market Value $ Gross Gains $ Gross Losses $ September 30, 2009 Net Unrealized Gains/Losses June 30, 2009 Net Unrealized Gains/Losses U.S. Government 614.3 26.6 (0.6) 26.0 19.8 Agency securities 414.4 27.1 (0.4) 26.7 21.2 Foreign governments 450.2 17.0 (0.2) 16.8 15.2 Asset-backed securities 145.3 5.8 (0.2) 5.6 2.6 Agency Mortgage-backed securities 962.9 42.9 (0.1) 42.8 35.1 Commercial Mortgage-backed securities 189.6 3.2 (4.8) (1.6) (15.3) Residential Mortgage-backed securities 48.5 8.0 (0.7) 7.3 (2.7) Corporate bonds 1,618.8 83.7 (1.3) 82.4 28.3 FDIC Guaranteed Corporate bonds 148.5 3.1 0.0 3.1 2.4 Foreign Corporate bonds 569.0 24.3 (0.2) 24.1 12.7 Municipal bonds 22.8 1.1 0.0 1.1 0.0 Total Portfolio 5,184.3 242.8 (8.5) 234.3 119.3 |
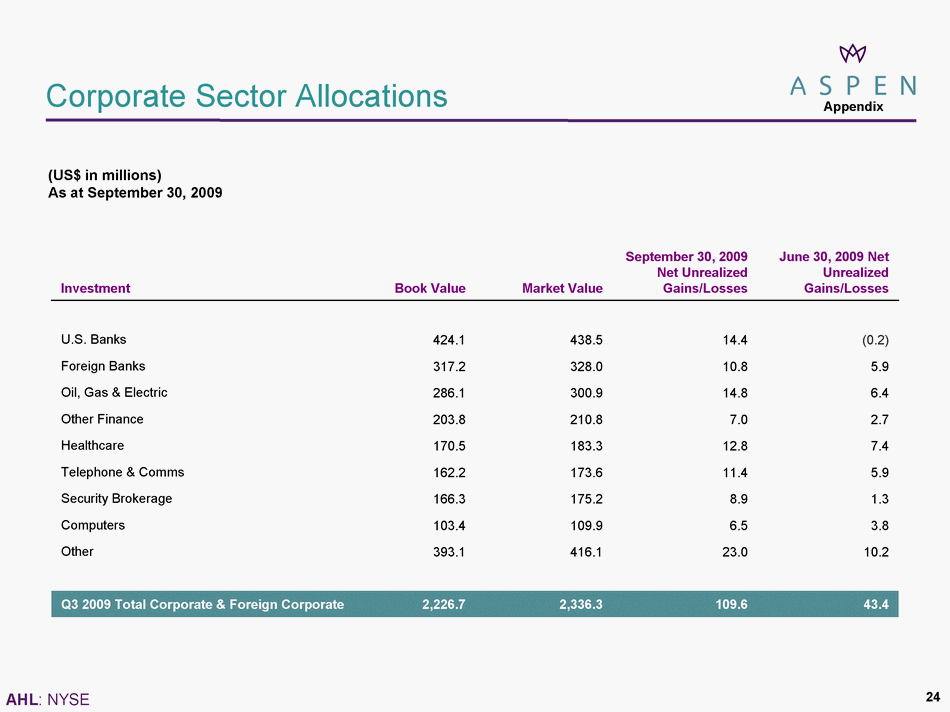
| 24 Corporate Sector Allocations Appendix (US$ in millions) As at September 30, 2009 Investment Book Value Market Value September 30, 2009 Net Unrealized Gains/Losses June 30, 2009 Net Unrealized Gains/Losses U.S. Banks 424.1 438.5 14.4 (0.2) Foreign Banks 317.2 328.0 10.8 5.9 Oil, Gas & Electric 286.1 300.9 14.8 6.4 Other Finance 203.8 210.8 7.0 2.7 Healthcare 170.5 183.3 12.8 7.4 Telephone & Comms 162.2 173.6 11.4 5.9 Security Brokerage 166.3 175.2 8.9 1.3 Computers 103.4 109.9 6.5 3.8 Other 393.1 416.1 23.0 10.2 Q3 2009 Total Corporate & Foreign Corporate 2,226.7 2,336.3 109.6 43.4 |
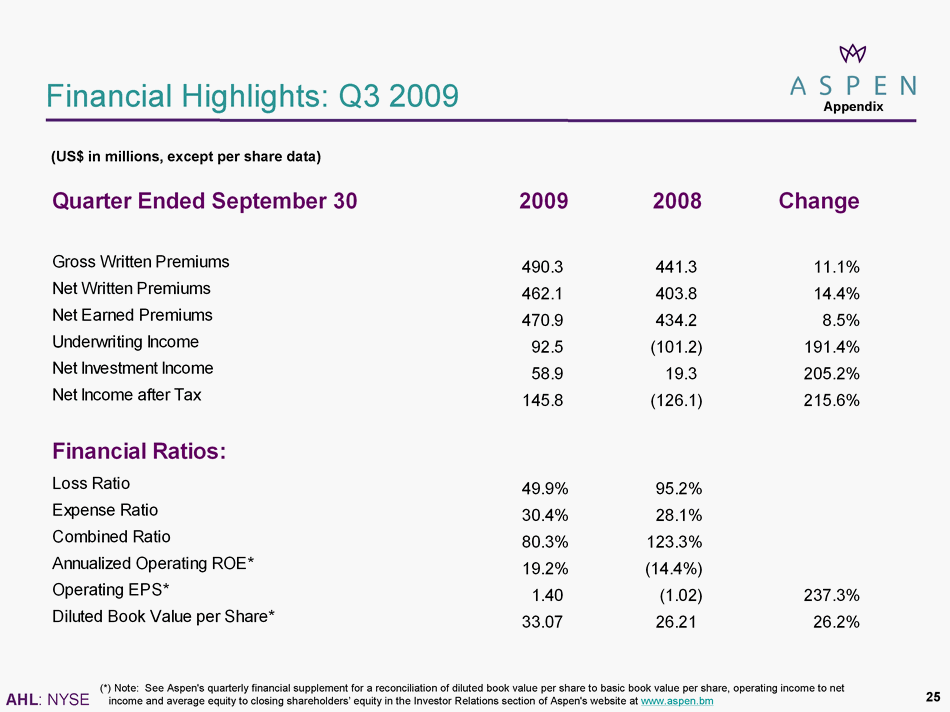
| Financial Highlights: Q3 2009 (US$ in millions, except per share data) (*) Note: See Aspen's quarterly financial supplement for a reconciliation of diluted book value per share to basic book value per share, operating income to net income and average equity to closing shareholders' equity in the Investor Relations section of Aspen's website at www.aspen.bm Appendix 25 |
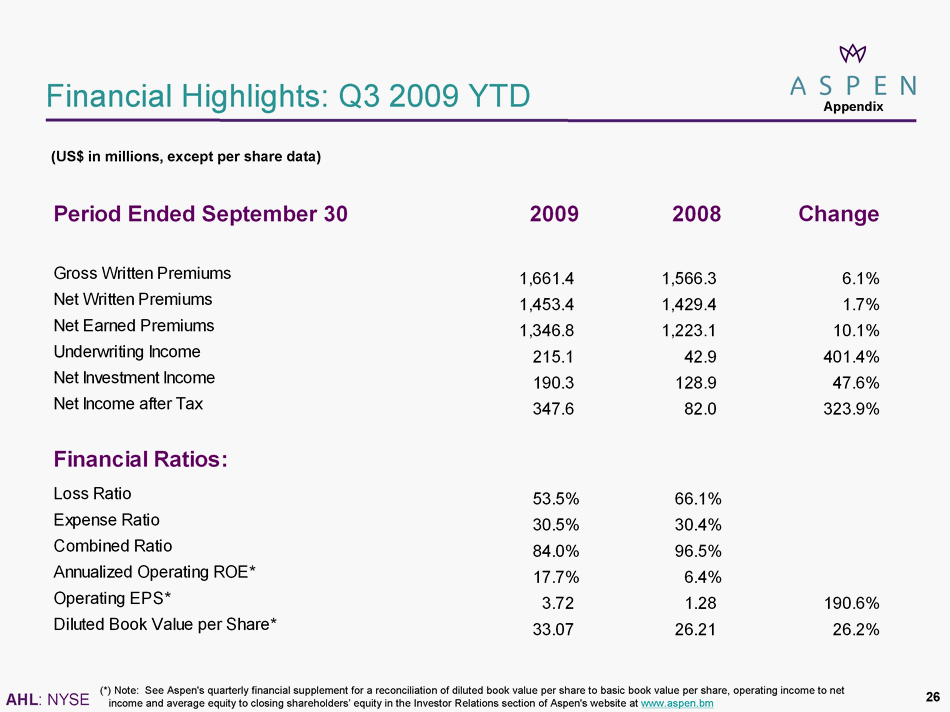
| Financial Highlights: Q3 2009 YTD (US$ in millions, except per share data) Appendix 26 (*) Note: See Aspen's quarterly financial supplement for a reconciliation of diluted book value per share to basic book value per share, operating income to net income and average equity to closing shareholders' equity in the Investor Relations section of Aspen's website at www.aspen.bm |
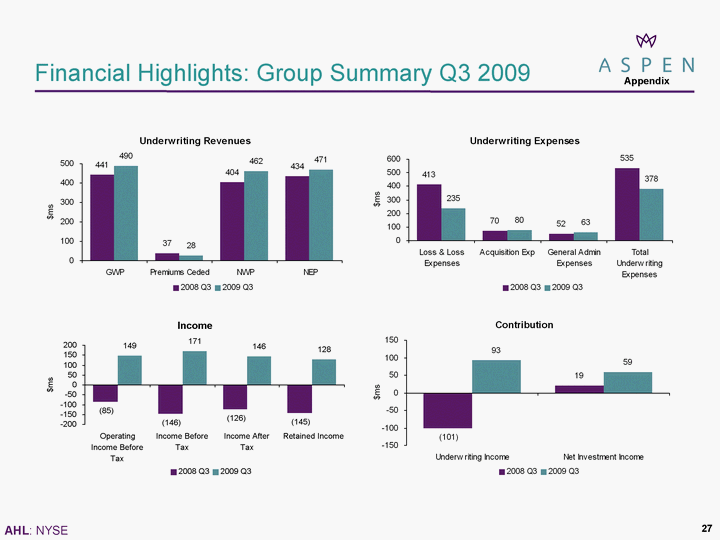
| Financial Highlights: Group Summary Q3 2009 Appendix Appendix Appendix Appendix Appendix 27 |
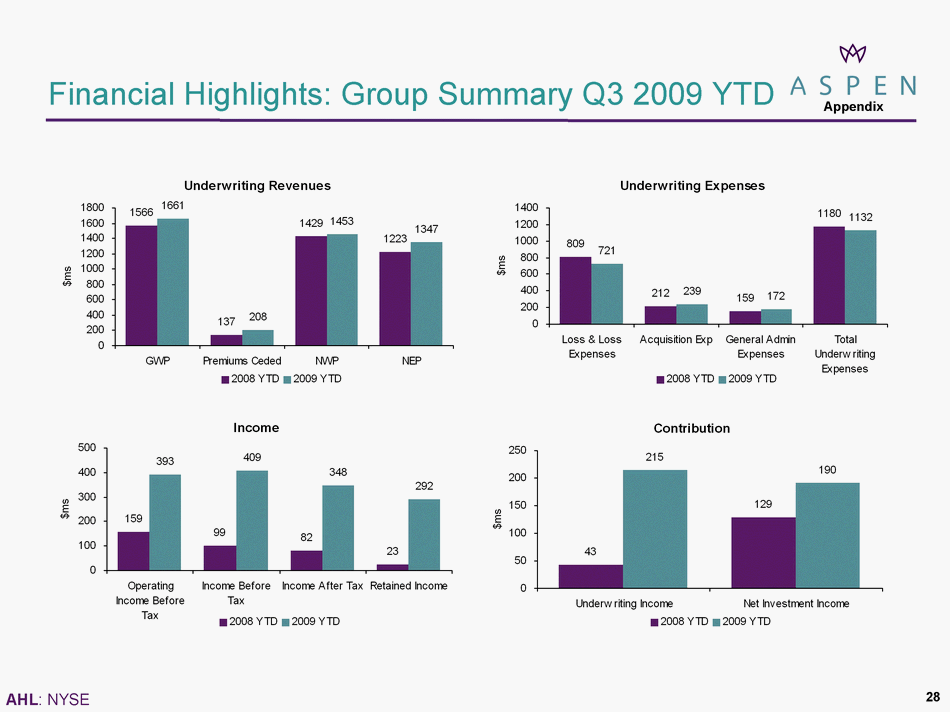
| Financial Highlights: Group Summary Q3 2009 YTD Financial Highlights: Group Summary Q3 2009 YTD Financial Highlights: Group Summary Q3 2009 YTD Financial Highlights: Group Summary Q3 2009 YTD 28 Appendix |
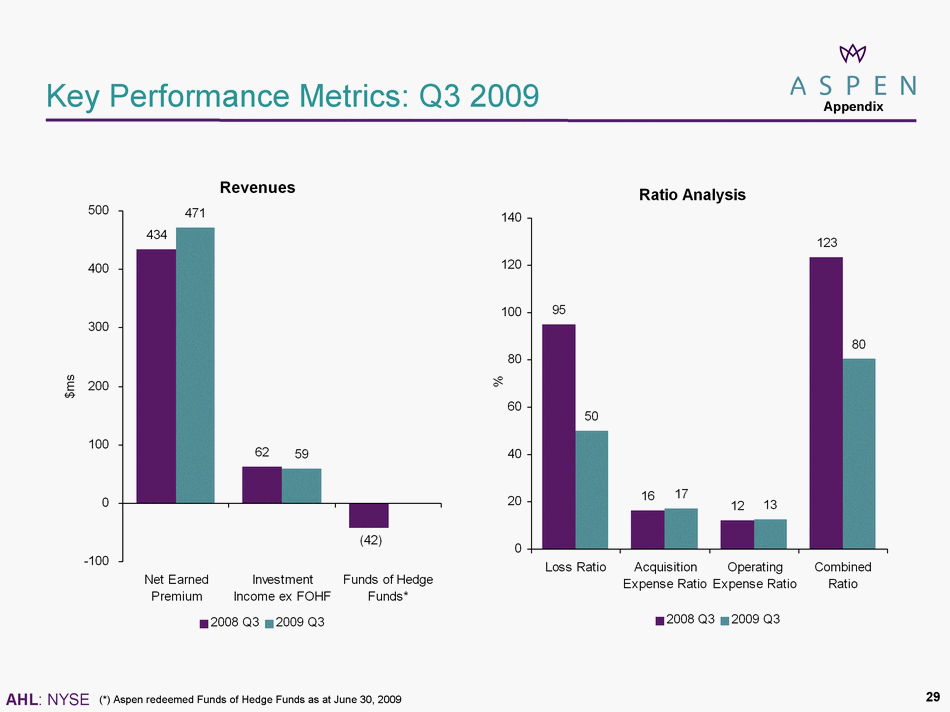
| Key Performance Metrics: Q3 2009 * (*) Aspen redeemed Funds of Hedge Funds as at June 30, 2009 Appendix Appendix 29 |
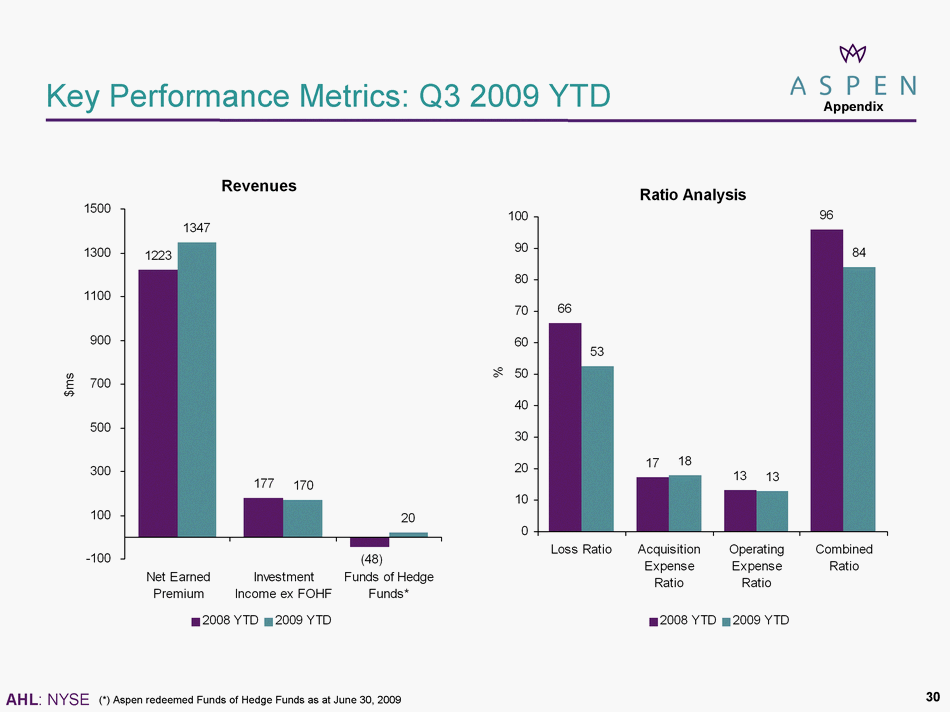
| Key Performance Metrics: Q3 2009 YTD * (*) Aspen redeemed Funds of Hedge Funds as at June 30, 2009 Appendix Appendix 30 30 |
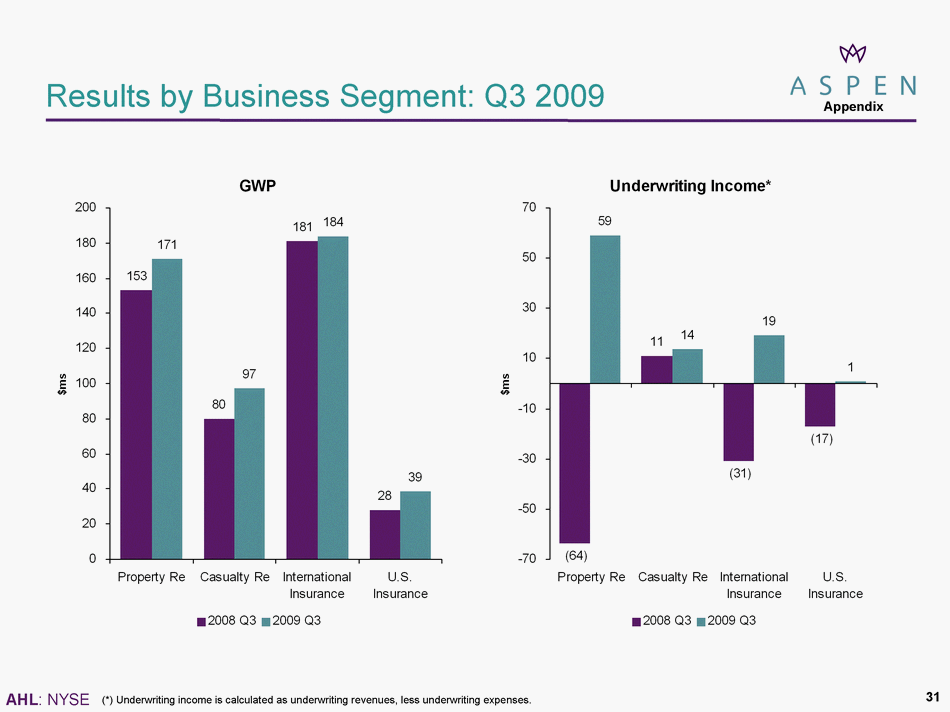
| Results by Business Segment: Q3 2009 (*) Underwriting income is calculated as underwriting revenues, less underwriting expenses. * Appendix Appendix Appendix 31 |
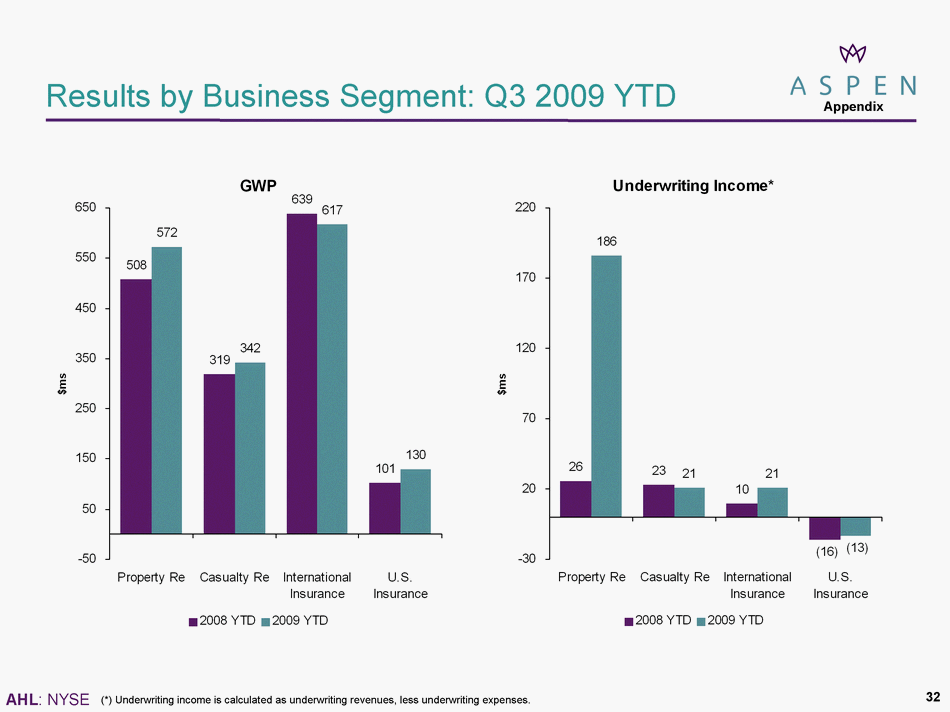
| Results by Business Segment: Q3 2009 YTD (*) Underwriting income is calculated as underwriting revenues, less underwriting expenses. * Appendix Appendix Appendix 32 |
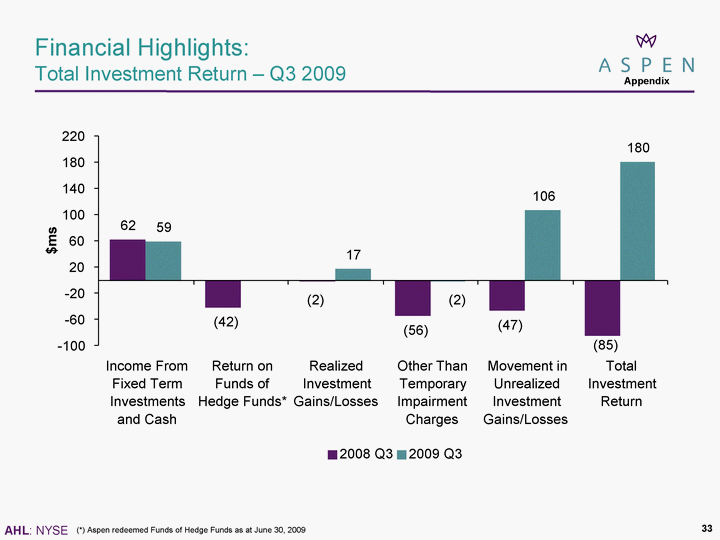
| Financial Highlights: Total Investment Return - Q3 2009 (*) Aspen redeemed Funds of Hedge Funds as at June 30, 2009 Appendix 33 |
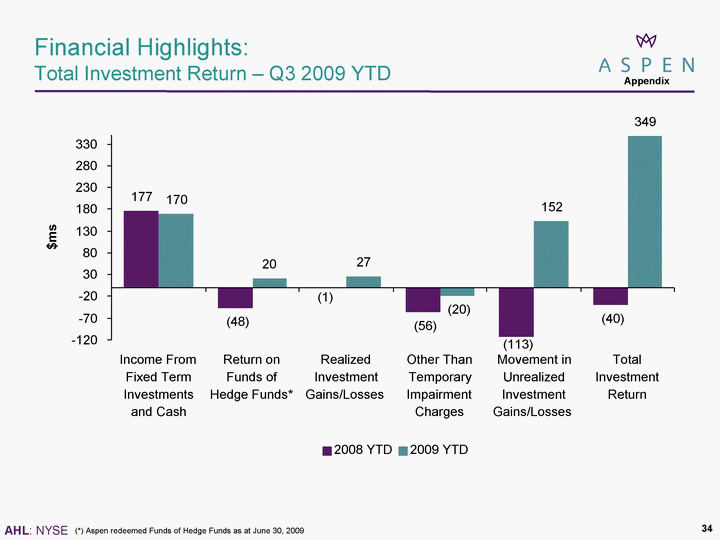
| Financial Highlights: Total Investment Return - Q3 2009 YTD (*) Aspen redeemed Funds of Hedge Funds as at June 30, 2009 Appendix 34 |
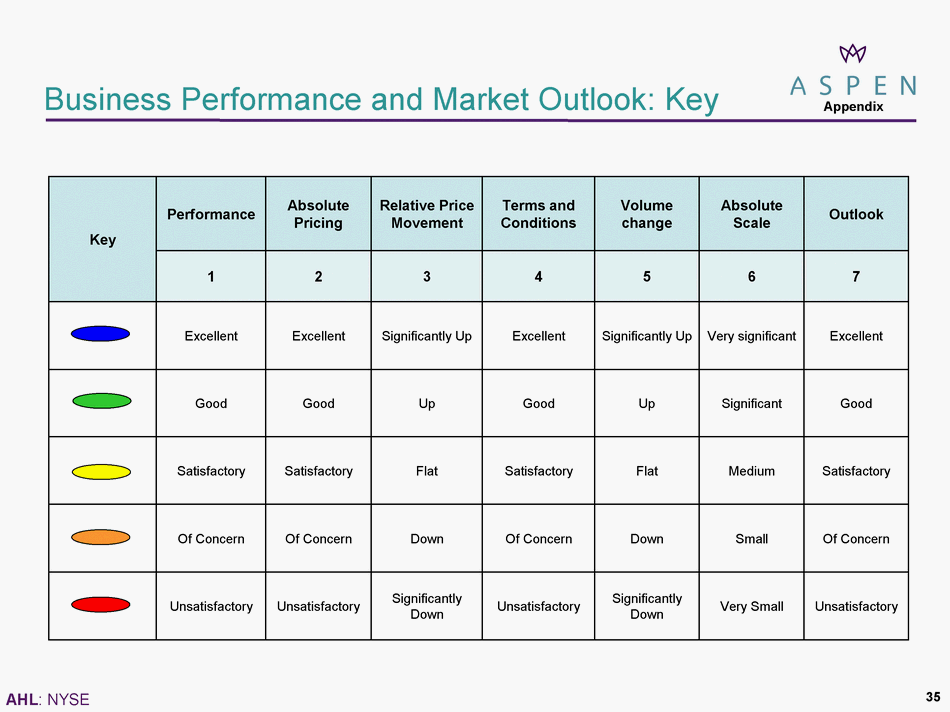
| Business Performance and Market Outlook: Key Key Performance Absolute Pricing Relative Price Movement Terms and Conditions Volume change Absolute Scale Outlook Key 1 2 3 4 5 6 7 Excellent Excellent Significantly Up Excellent Significantly Up Very significant Excellent Good Good Up Good Up Significant Good Satisfactory Satisfactory Flat Satisfactory Flat Medium Satisfactory Of Concern Of Concern Down Of Concern Down Small Of Concern Unsatisfactory Unsatisfactory Significantly Down Unsatisfactory Significantly Down Very Small Unsatisfactory Appendix 35 |