
Aspen Insurance Holdings Limited
Chris O’Kane, Chief Executive Officer
Julian Cusack, Chief Financial Officer
May 2006

Safe Harbor Disclosure
Application of the Safe Harbor of the Private Securities Litigation Reform Act of 1995:
This presentation contains written or oral “forward-looking statements” within the meaning of the U.S. federal securities laws. These statements are made
pursuant to the safe harbor provisions of the Private Securities Litigation Reform Act of 1995. Forward-looking statements include all statements that do not
relate solely to historical or current facts, and can be identified by the use of words such as “expect,” “intend,” “plan,” “believe,” “project,” “anticipate,” “seek,”
“will,” “estimate,” “may,” “continue,” and similar expressions of a future or forward-looking nature.
All forward-looking statements address matters that involve risks and uncertainties. Accordingly, there are or will be important factors that could cause actual
results to differ materially from those indicated in these statements. The Company believes these factors include, but are not limited to: the impact of acts of
terrorism and related legislation and acts of war; the possibility of greater frequency or severity of claims and loss activity, including as a result of natural or
man-made catastrophic events such as Hurricanes Katrina, Rita and Wilma, than our underwriting, reserving or investment practices have anticipated; evolving
interpretive issues with respect to coverage as a result of Hurricanes Katrina, Rita and Wilma; the level of inflation in repair costs due to limited availability of
labor and materials after catastrophes; the effectiveness of the Company's loss limitation methods; changes in the availability, cost or quality of reinsurance or
retrocessional coverage; the reliability of, and changes in assumptions to, catastrophe pricing, accumulation and estimated loss models; loss of key personnel;
a decline in our operating subsidiaries' ratings with Standard & Poor's, A.M. Best Company or Moody's Investors Service; changes in general economic
conditions including inflation, foreign currency exchange rates, interest rates and other factors that could affect our investment portfolio; increased competition
on the basis of pricing, capacity, coverage terms or other factors; decreased demand for the Company's insurance or reinsurance products and cyclical
downturn of the industry; changes in governmental regulations or tax laws in jurisdictions where the Company conducts business; Aspen or its Bermudian
subsidiary becoming subject to income taxes in the United States or the United Kingdom; the effect on insurance markets, business practices and relationships
of ongoing litigation, investigations and regulatory activity by the New York State Attorney General's office and other authorities concerning contingent
commission arrangements with brokers and bid solicitation activities; the total industry losses resulting from Hurricanes Katrina, Rita and Wilma and the actual
number of the Company's insureds incurring losses from these storms; and with respect to Hurricanes Katrina, Rita and Wilma, the limited actual loss reports
received from the Company's insureds to date, the preliminary nature of possible loss information received by brokers to date on behalf of cedants, the
Company's reliance on industry loss estimates and those generated by modeling techniques, the impact of these storms on the Company's reinsurers, any
changes in the Company's reinsurers' credit quality, the amount and timing of reinsurance recoverables and reimbursements actually received by the Company
from its reinsurers and the overall level of competition and the related demand and supply dynamics as contracts come up for renewal. For a more detailed
description of these uncertainties and other factors, please see the "Risk Factors" section in Aspen's Annual Report on Form 10-K for the year ended
December 31, 2005, filed with the U.S. Securities and Exchange Commission on March 6, 2006. Aspen undertakes no obligation to publicly update or revise
any forward-looking statements, whether as a result of new information, future events or otherwise. Readers are cautioned not to place undue reliance on
these forward-looking statements, which speak only as of the dates on which they are made.
2
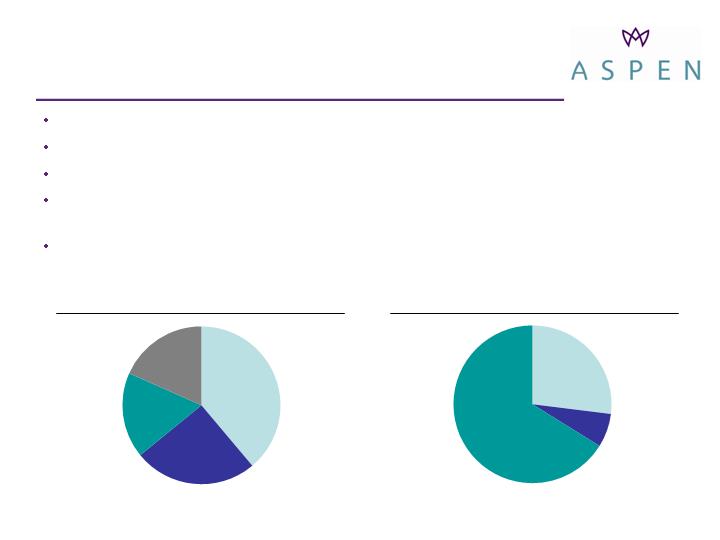
Who We Are
Property
Reinsurance
39%
Casualty
Reinsurance
25%
Specialty
18%
Insurance
18%
2005 Underwriting by Segment (GWP)
2005 Underwriting by Subsidiary (GWP)
* Shareholders’ equity (including preference shares, ex-AOCI) plus long-term debt
** Bermuda balance excludes premiums received from Aspen UK and Aspen Specialty under group quota share
UK
66%
Bermuda**
27%
US
7%
$2.3bn market cap
$1.9bn common equity (ex-AOCI) and $2.4bn total capital* as of 31-Mar-2006
~370 employees in Bermuda, London and US (as of 31-Mar-2006)
Ratings of A (S&P), A2 (Moody’s) and A / A- (AM Best, for Aspen UK and Aspen
Bermuda)
$2.1bn Gross Written Premium (GWP) in 2005; 27% GWP Compound Annual
Growth Rate since 2003
100% = $2.1bn
100% = $2.1bn
3

Investment Highlights
Leading specialty reinsurer and insurer
Diverse underwriting skills
Growing breadth of product and market presence
Proven ability and willingness to allocate capital based on market
opportunities
Meaningful exposure to hardening property pricing cycle
Material reduction in risk profile in 2006 and upgraded modeling
capabilities
Expected to result in reduced earnings volatility
Continued earnings momentum
Continued diversification of underwriting
Opportunity to increase investment yield
Capital flexibility
4

Strategic Vision
Offer specialized insurance and reinsurance to clients where price is not
the key determinant
Niche based products with a bias towards the more complex risks
Products where experience and judgment are critical to success
Products where Aspen will be compensated for its expertise and
service
Core differentiators: Underwriting, service & talent management
Maintain flexibility to opportunistically expand into new markets
Anticipate and respond quickly to events and new information
Rigorous soft cycle and portfolio management
Compete in commodity type products only when Aspen has better
knowledge and execution than the competition, or if market conditions
provide attractive returns
5

Selective Business
Line Expansion
Progressive diversification of strategic footprint through incremental expansion into
adjacent business lines*
Key enabling factors:
Consistency with Aspen’s core competencies
Appropriate timing
Availability of proven, successful underwriting teams
2003
2004
2005
2006 +
Specialty
Reinsurance
Aviation
Marine
US Casualty
US Surplus
lines
Aviation
Insurance
Marine
Insurance
Energy
Insurance
Continuing
diversification
Decrease of Property
Reinsurance
contribution to overall
portfolio
Increased emphasis
on Specialty lines
* Businesses shown for first year of meaningful premium contribution
6
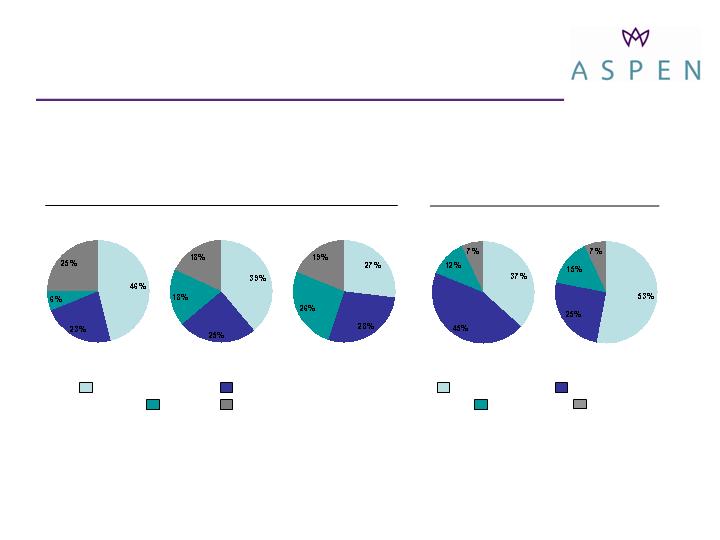
Business Mix
By Segment
By Geography
* 2003 Specialty lines excludes QQS of Wellington Syndicate 2020
** Worldwide includes policies where risks are across the world; includes policies both specifically including and excluding the United States
100% = $1.3bn
Gross Written Premiums
*
100% = $2.1bn
100% = $1.3bn
100% = $2.1bn
2003
2005
2006E
2003
2005
Property Reinsurance Casualty Reinsurance
Specialty Insurance
US and Canada UK and Europe
Worldwide** Other
7
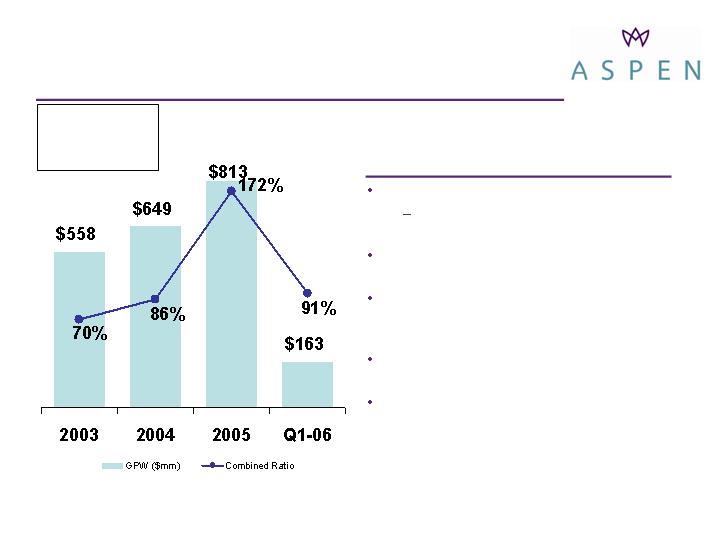
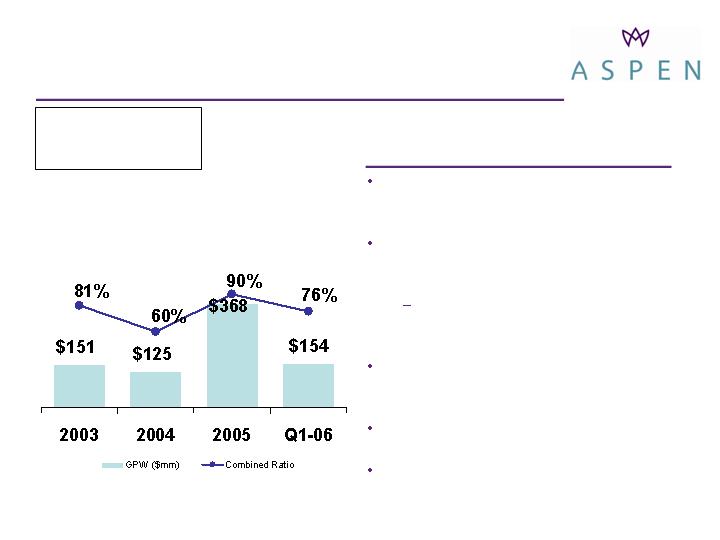
Property Reinsurance
Comments
Broad re-underwriting in 2006
Sharply reduced aggregate exposure
limits in Florida, California, Europe
US seeing better increases than the
international account
Low production in Q1-06 reflects relatively
modest pricing improvement at January
renewals
Observed much more attractive
conditions in April renewal season
Expect further hardening as year
advances
* Includes 39 points from hurricane and windstorm related losses
** Includes 104 points from hurricane and windstorm related losses
*
**
8
GWP Breakdown – 2005
Catastrophe
46 %
Risk Excess
32
Pro Rata
21
Facultative
1
Casualty Reinsurance
Comments
Rates remain adequate but have been flat
US Casualty experienced nominal rate
increases across the portfolio
Partially offset by Casualty claims
inflation
Primary rates on Medical Malpractice and
Workers’ Compensation catastrophe
experienced little change in rates
Upward trend in combined ratio reflects
increasing contribution from US business
with higher acquisition costs and loss
ratios
9
GWP Breakdown – 2005
US Treaty
58 %
Non-US Treaty
37
Facultative
5
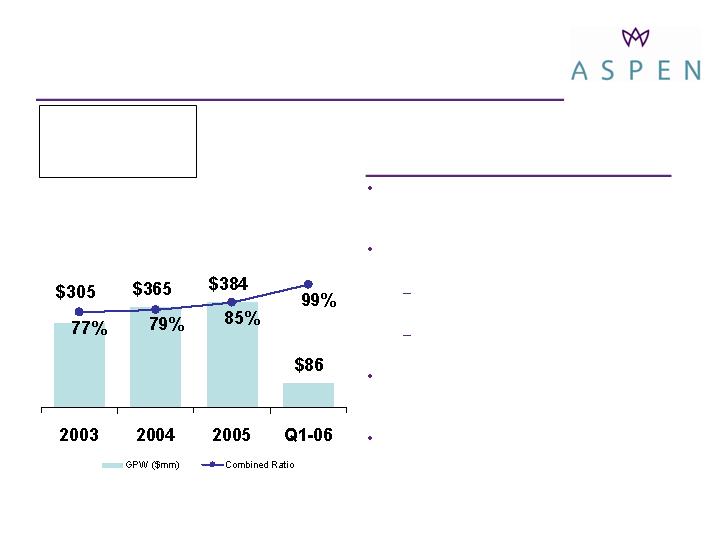
Specialty Lines
Comments
Premium growth driven by attractive rate
increases with terms and conditions
stable or improving
Marine Liability rates, terms and
conditions continuing to improve after five
years of tightening
Rate increases of approximately 26%
due partially to hurricanes and cost of
reinsurance
Offshore Energy - Physical Damage
component - is showing the highest level
of increase
Gulf of Mexico exposures may experience
capacity shortages in 2Q renewal season
Specialty Reinsurance experiencing
favorable conditions driven by supply /
demand imbalances
* Includes 3 points from hurricane and windstorm related losses
** Includes 12 points from hurricane and windstorm related losses
*
**
10
GWP Breakdown – 2005
Marine/Specialty Liability
33 %
Marine and Energy Property
30
Aviation
14
Specialty Reinsurance
23
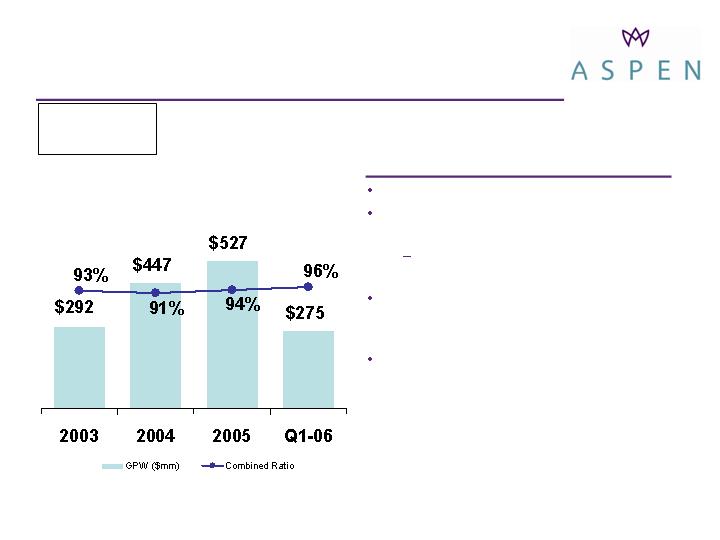
Property & Casualty Insurance
Comments
New competitors entering the UK Liability
and Property market have put downward
pressure on pricing
Reduced top line to ensure sufficient rate
adequacy in UK business
UK liability GWP down 40% from
peak 3 years ago
Offered modest reductions of 10% for
continuing customers in UK Property
US Surplus lines rate levels continue to
be acceptable despite signs of modest
competition
Rebalancing US business by
geographically diversifying risk and
targeting non-coastal exposures
* Includes 5 points from hurricane and windstorm related losses
** Includes 9 points from hurricane and windstorm related losses
*
**
11
GWP Breakdown – 2005
UK Commercial Property
16 %
US Commercial Property
17
Worldwide Property
3
UK Commercial Liability
45
US Commercial Liability
19
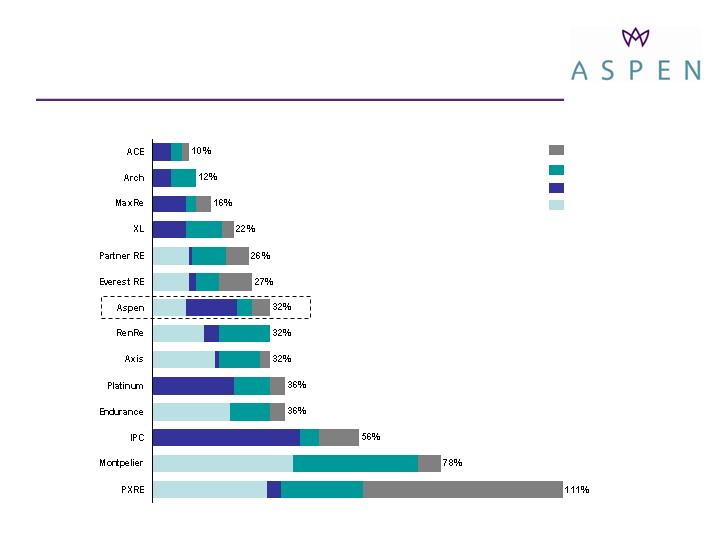
Hurricane Losses in Context
29 March 2006
24th Nov 2005
10th Oct 2005
14th Sep 2005
2005 Hurricane Losses, % of Jun-05 Equity
Source: Financial reports, press releases and Aspen analysis
12
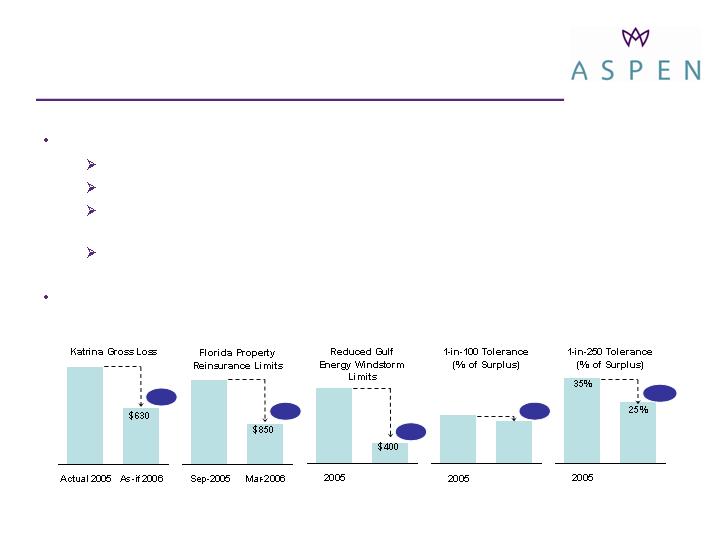
Risk Profile Reduction
Reduction in our risk tolerance overall
Modelling refinements
Reduced proportion of business exposed to risks from peak zones
Reduced business exposed to accumulating high severity catastrophe contracts
where there are too many “unknowns”
Re-underwriting: re-pricing, accumulation management and sub-limits in energy
business
Continued focus on developing non-correlated risks via our diversified underwriting
platform
($ in millions)
$1,100
-43%
-51%
$1,726
$1,400
-71%
-1000bp
20.0%
17.5%
Projected
2006
Projected
2006
Projected
2006
-250bp
13
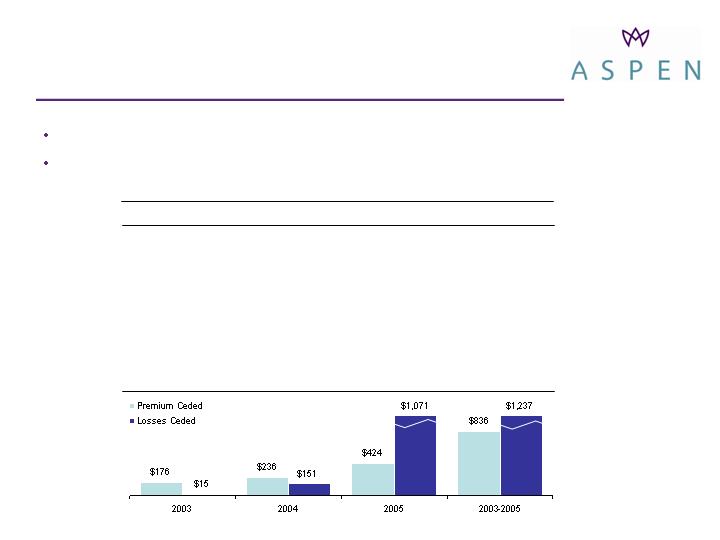
Historical Experience
Outwards Reinsurance
Mostly renewed in January
Limited exposure to further rate hardening in the retro market in 2006
($ in millions)
Review of Reinsurance Coverage
* Includes recovery under cat swap which applies only to Californian earthquake and windstorms causing damage in Florida
14
2005
2006
Property / Casualty / Marine
US Earthquake Cover
$788*
$655*
US Wind Cover
763*
573*
Retention
90
149
Property Only
US Earthquake Cover
$698*
575*
US Wind Cover
673*
493*
Retention
90
139
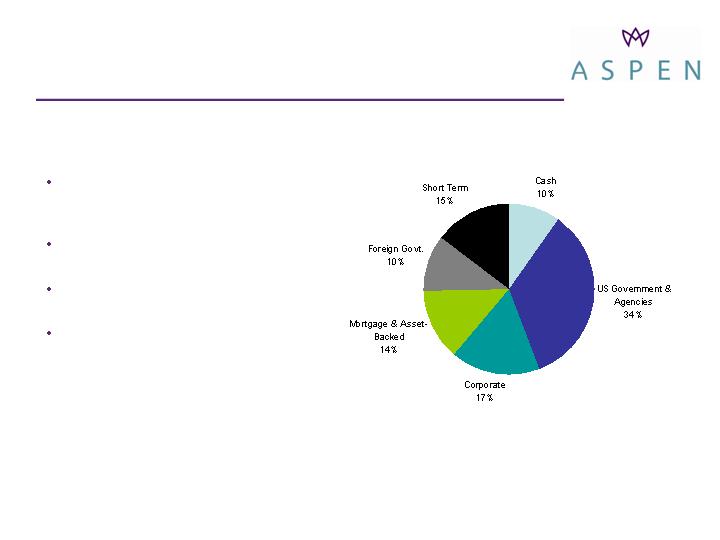
Portfolio designed to provide limited
book value volatility in a rising rate
environment
Diversified, highly-rated, liquid fixed
income portfolio. AAA rating
Strict guidelines on overall portfolio
concentration, credit and duration
Fixed Income duration of 2.91 years
and book yield of 4.18%, at Mar-
2006 (vs. 2.16 years and 3.30% at
Dec-2004)
Investment portfolio sector
allocations as of 3/31/06
$4.5 billion
Investment Strategy:
Current
15
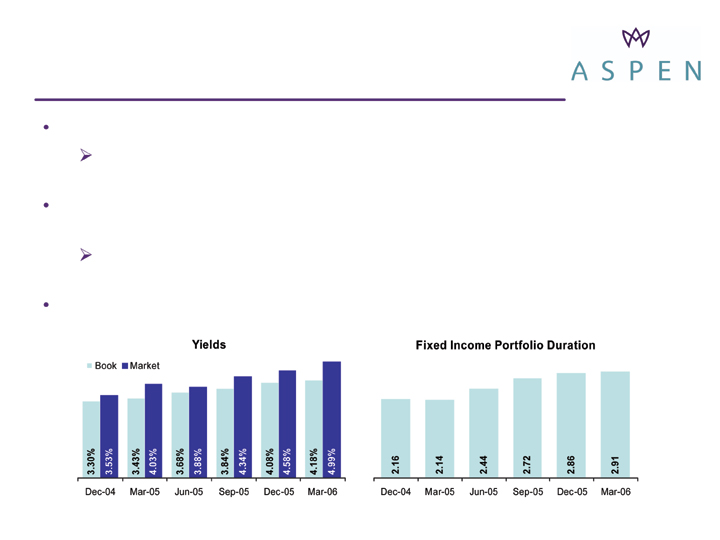
Continued extension of asset duration in line with growing liability duration
Fixed income portfolio duration of 1.1 years in late 2003 to 2.91 years at
Mar-2006
Two-year plan to invest up to 15% of investment portfolio in non-fixed
income securities
As of 1-Apr-2006, invested $150mm (3% of portfolio) in two low-
volatility, diversified hedge fund-of-funds
Continue to monitor credit spreads to diversify credit risk when appropriate
Investment Strategy:
Growth Opportunities
16
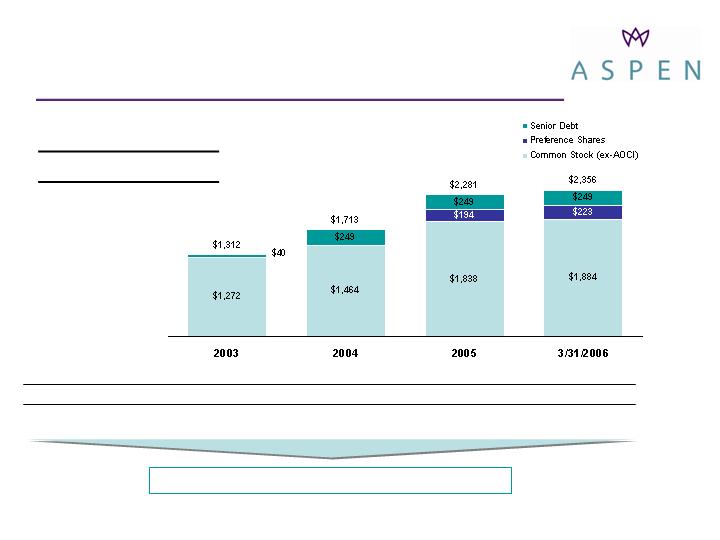
Capital Structure Overview
Ratings
* Credit ratings of Aspen Insurance UK Limited
** Common equity excludes AOCI
*** Preference shares given 50% equity credit, per Moody’s guidance; common equity excludes AOCI; end of period
($ in millions)
Opportunity for Further Financial Leverage
17
S&P
A*
BBB+
BBB-
Moody’s
A*
Baa2
BB+
Best
A2*
N/A
N/A
FSR/
Senior
Preference
Counter
Debt
Shares
Debt / Capital**
3.0
%
14.5
%
10.9
%
10.6
%
Preference Shares / Capital**
-
-
8.5
9.5
Adjusted Debt / Capital***
3.0
14.5
15.2
15.3
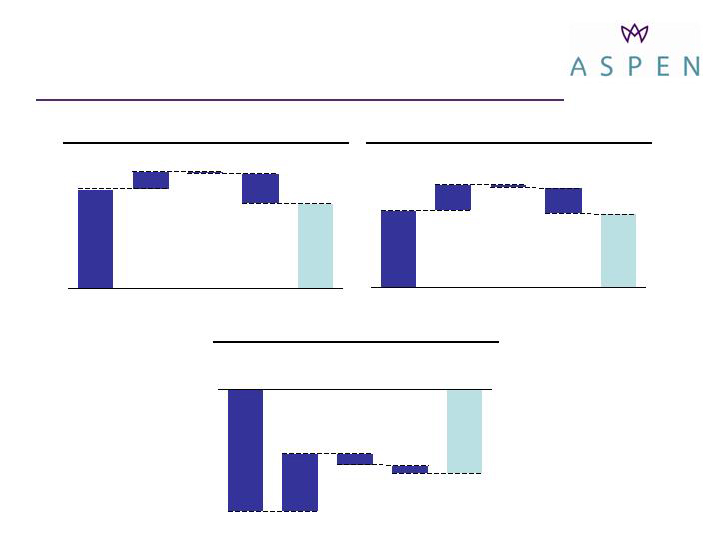
Breakdown of ROAE*
2004
2003
* ROAE – return on average common shareholders’ equity (see slide 26)
14.6%
4.9%
(4.9)%
14.0%
(0.7)%
Under-
writing
Investment
Income
Other
Taxes
ROAE
2005
(17.2)%
8.0%
(1.2)%
(11.8)%
(1.5)%
Under-
writing
Investment
Income
Other
Taxes
ROAE
18.7%
3.1%
(5.7)%
15.9%
(0.1)%
Under-
writing
Investment
Income
Other
Taxes
ROAE
18

Implied 2006 ROAE Based on
Previous Public Guidance
Lower Upper Comments
* Assumes no adjustments to prior year reserves
Based on growth estimates
Based on 15% premium ceding
guidance
Based on 85-95% combined ratio
and assumes NWP=NEP
Midpoint of guidance ($180-200)
Based on dividends per share
from 10-K and assumes no
change in AOCI
19
Gross Written Premiums ($mm)
$2,100
$2,200
Net Written Premiums ($mm)
1,785
1,870
Underwriting Profit ($mm)
89
281
Investment Income ($mm)
190
190
Net Income* ($mm)
$200
$353
Average Common Equity ($bn)
1.9
2.0
ROAE
10
%
18
%
ROAE Components
Underwriting
5
%
14
%
Investment Income
10
10
Interest and Preferred Dividends
(2
)
(2
)
Income Before Tax
13
22
Taxes
(3
)
(4
)
Total ROAE
10
18

Appendix

First Quarter Update
Three Months
Ended March 31,
($ in millions)
21
Percent
Full Year
2006
2005
Change
2005
Gross Premiums Written
$678.7
$804.1
(15.6
)%
$2,092.5
Net Premiums Written
451.9
632.4
(28.5
)%
1,651.6
Net Premiums Earned
402.6
378.7
6.3
%
1,508.4
Loss Ratio
57.7
%
54.8
%
90.1
%
Expense Ratio
32.7
26.3
27.1
Combined Ratio
90.4
81.1
117.2
Underwriting Income
$38.7
$71.7
(46.0
)%
$(259.2
)
Investment Income
44.5
25.5
74.5
121.3
Other
(5.9
)
(7.3
)
(19.2)
(22.5
)
Income Before Tax
77.3
89.9
(14.0)
(160.4
)
After-Tax Income
to Common Shareholders
$57.9
$70.1
(17.4)
%
$(177.8)

Q1 Expense Ratio Detail
($ in millions)
22
2005
Q1-2005
Q1- 2006
Gross Premiums Earned
$1,932.6
$433.7
$493.5
Acquisition Expenses
283.2
70.2
93.3
G&A Expenses
125.9
29.4
38.2
Acquisition Expense / GPE
14.7
%
16.2
%
18.9
%
G&A Expense / GPE
6.5
6.8
7.7
Acquisition and G&A
Expenses / GPE
21.2
23.0
26.6

Income Statement
* Results from inception on June 22, 2002 through December 31, 2002
($ in millions)
23
2002*
2003
2004
2005
Gross Premiums Written
$375
$1,307
$1,586
$2,093
Net Premiums Written
313
1,093
1,358
1,652
Net Premiums Earned
120
812
1,233
1,508
Underwriting Profit
14
178
204
(259
)
Net Investment Income
9
30
68
121
Net Income
29
152
195
(178
)
GAAP Ratios:
Loss Ratio
64
%
53
%
59
%
90
%
Expense Ratio
25
25
25
27
Combined Ratio
89
%
78
%
84
%
117
%
ROAE
6%
16
%
14
%
NA
Effective Tax Rate
NA
26
%
26
%
NA

Balance Sheet
($ in millions)
* Reinsurance recoverables; excludes ceded unearned premiums
24
Cash and Investments
$932
$1,847
$3,021
$4,437
$4,475
Recoverables*
13
44
198
1,193
1,191
Total Assets
1,212
2,579
3,943
6,517
6,859
Long Term Debt
-
40
249
249
249
Preference Shares
-
-
-
194
223
Common Equity
(ex-AOCI)
878
1,272
1,464
1,838
1,884
Book Value Per
Ordinary Share
$15.44
$18.77
$21.37
$19.39
$19.49
2002
2003
2004
2005
2006 YTD

2.0%
1,931,874
Officers, Directors & Employees as a Group **
Shares Outstanding (3/31/06) = 95,250,401
64.2%
61,165,268
Public Float
35.8%
34,085,133
Total Founder/Management Ownership
0.5%
465,873
Others ***
4.0%
3,800,412
Wellington Investment Holdings (Jersey) Ltd. *
6.4%
6,074,493
Candover Investments plc
6.5%
6,149,417
Credit Suisse
16.4%
15,663,064
The Blackstone Group
% of Shares
Outstanding
Shares
Currently Held
Founder/Management Shareholders
* Wellington Underwriting plc transferred its shares and options to this affiliate in December 2005;
Does not include Wellington Underwriting plc's exercisable options to purchase 3,781,120 non-voting shares
** Includes exercisable vested options for Aspen’s Officers, Directors and Employees as a group as of February 15, 2006
*** Other includes Appleby Names Trust and Mourant & Co. Trustees Limited
Founder / Management Share
Ownership and Public Float
25

Reconciliation of Shareholders’
Equity to Average Common Equity*
*
Average equity is a “non-GAAP financial measure,” as such term is defined in Regulation G, which management believes
better explains the Company’s results in a manner that allows for a more complete understanding of the underlying trends
in the Company’s business. Average common shareholders’ equity is calculated as the arithmetic average of common
equity on a monthly basis for the stated periods.
26
2003
2004
2005
Closing Shareholders’ Equity
$1,298.7
$1,481.5
$2,039.8
Less: Preference Shares
0.0
0.0
193.8
Common Shareholders’ Equity
1,298.7
1,481.5
1,846.0
Less: Average Adjustment
343.0
87.0
338.0
Average Common
Shareholders’ Equity
$955.7
$1,394.5
$1,508.0