
Aspen Insurance Holdings Limited
July 27, 2006
July 27, 2006
Safe Harbor Disclosure
This presentation is given in the context of the quarterly earnings conference call and contains non-GAAP measures.
This presentation is given in the context of the quarterly earnings conference call and contains non-GAAP measures.
Non-GAAP Financial Measures
In presenting Aspen’s results, management has included and discussed certain "non-GAAP financial measures", as such term is defined in Regulation G. Management believes that these non-GAAP measures, which may be defined differently by other companies, better explain Aspen’s results of operations in a manner that allows for a more complete understanding of the underlying trends in Aspen’s business. However, these measures should not be viewed as a substitute for those determined in accordance with GAAP. The reconciliation of such non-GAAP financial measures to their respective most directly comparable GAAP financial measures in accordance with Regulation G is included in the financial supplement, which can be obtained from the Investor Relations section of Aspen’s website at www.aspen.bm.
Application of the Safe Harbor of the Private Securities Litigation Reform Act of 1995:
This presentation contains written or oral “forward-looking statements” within the meaning of the U.S. federal securities laws. These statements are made pursuant to the safe harbor provisions of the Private Securities Litigation Reform Act of 1995. Forward-looking statements include all statements that do not relate solely to historical or current facts, and can be identified by the use of words such as “expect,” “intend,” “plan,” “believe,” “project,” “anticipate,” “seek,” “will,” “estimate,” “may,” “continue,” and similar expressions of a future or forward-looking nature.
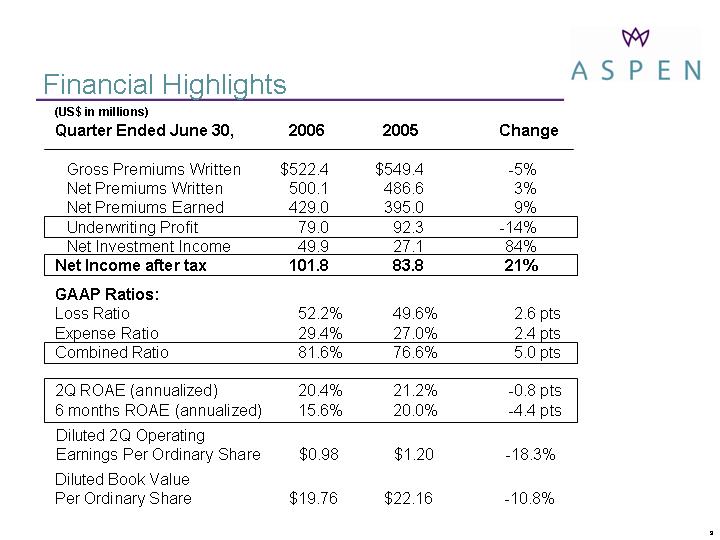
Financial Highlights
(US$ in millions)
(US$ in millions)
Gross Premiums Written $522.4 $549.4 -5%
Gross Premiums Written $522.4 $549.4 -5%
Net Premiums Written 500.1 486.6 3%
Net Premiums Earned 429.0 395.0 9%
Underwriting Profit 79.0 92.3 -14%
Net Investment Income 49.9 27.1 84%
Net Income after tax 101.8 83.8 21%
GAAP Ratios:
Loss Ratio 52.2% 49.6% 2.6 pts
Expense Ratio 29.4% 27.0% 2.4 pts
Combined Ratio 81.6% 76.6% 5.0 pts
2Q ROAE (annualized) 20.4% 21.2% -0.8 pts
Diluted Book Value
Diluted Book Value
Diluted 2Q Operating
Diluted 2Q Operating
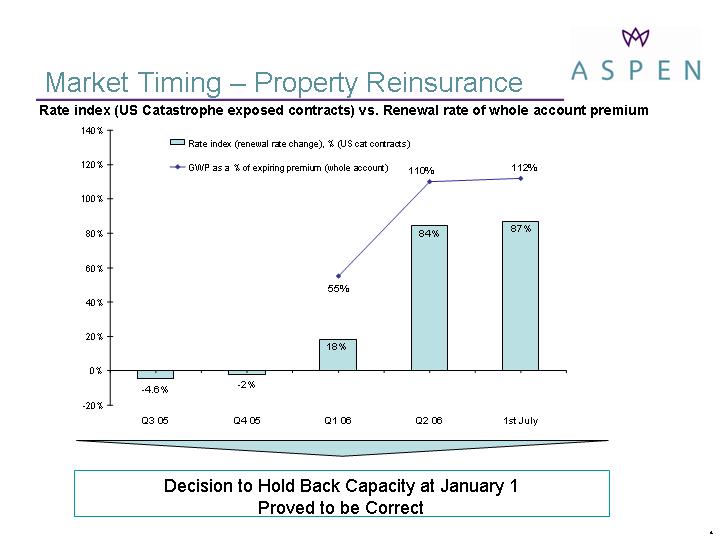
Market Timing – Property Reinsurance
Decision to Hold Back Capacity at January 1
Decision to Hold Back Capacity at January 1
Rate index (US Catastrophe exposed contracts) vs. Renewal rate of whole account premium

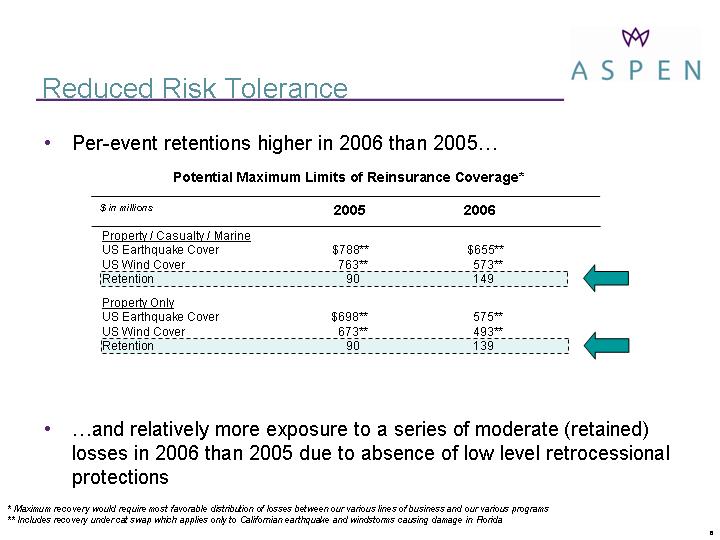
Reduced Risk Tolerance
Significant reduction in gross exposures consistent with reduced risk tolerances
$ in millions
$1,100
- -43%
- -56%
$1,726
$1,400
- -71%
Projected
Projected
* Pre-tax and reinstatement premiums
- -51%
$1,726
Property / Casualty / Marine
Property / Casualty / Marine
US Earthquake Cover $788** $655**
US Wind Cover 763** 573**
Retention 90 149
Property Only
US Earthquake Cover $698** 575**
US Wind Cover 673** 493**
Reduced Risk Tolerance
Per-event retentions higher in 2006 than 2005?
* Maximum recovery would require most favorable distribution of losses between our various lines of business and our various programs
* Maximum recovery would require most favorable distribution of losses between our various lines of business and our various programs
2005 2006
Potential Maximum Limits of Reinsurance Coverage*
$ in millions
?and relatively more exposure to a series of moderate (retained) losses in 2006 than 2005 due to absence of low level retrocessional protections
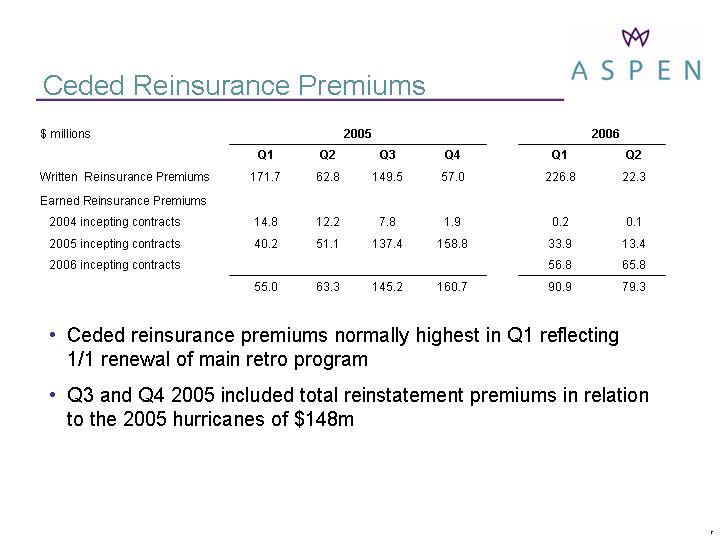
Ceded reinsurance premiums normally highest in Q1 reflecting 1/1 renewal of main retro program
Ceded reinsurance premiums normally highest in Q1 reflecting 1/1 renewal of main retro program
Ceded Reinsurance Premiums
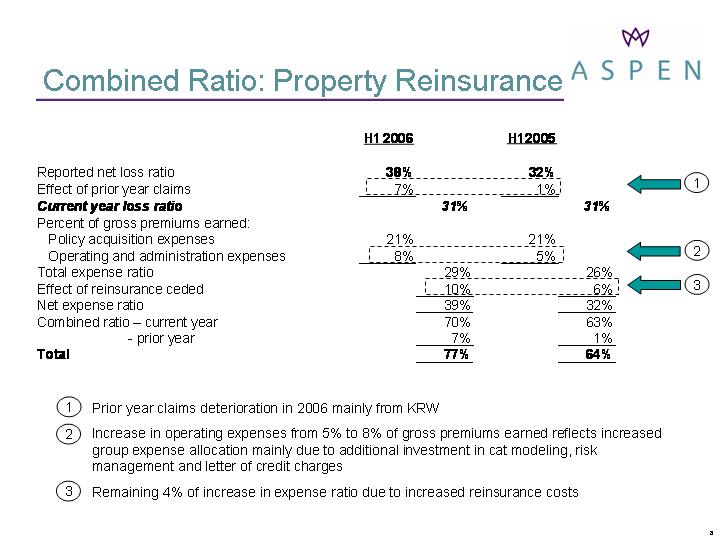
Combined Ratio: Property Reinsurance
Prior year claims deterioration in 2006 mainly from KRW
Prior year claims deterioration in 2006 mainly from KRW
Increase in operating expenses from 5% to 8% of gross premiums earned reflects increased group expense allocation mainly due to additional investment in cat modeling, risk management and letter of credit charges
1
2
3
1
2
3
H1
H1
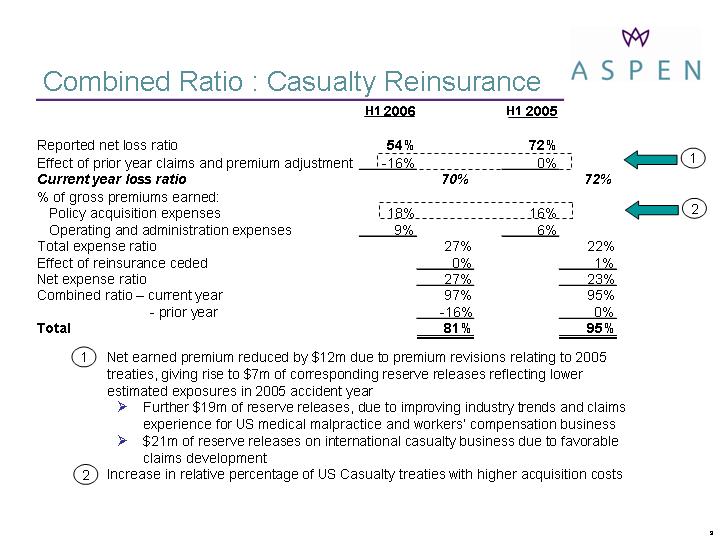
Combined Ratio : Casualty Reinsurance
Net earned premium reduced by $12m due to premium revisions relating to 2005 treaties, giving rise to $7m of corresponding reserve releases reflecting lower estimated exposures in 2005 accident year
Net earned premium reduced by $12m due to premium revisions relating to 2005 treaties, giving rise to $7m of corresponding reserve releases reflecting lower estimated exposures in 2005 accident year
Further $19m of reserve releases, due to improving industry trends and claims experience for US medical malpractice and workers’ compensation business
$21m of reserve releases on international casualty business due to favorable claims development
1
2
2
1
H1
H1
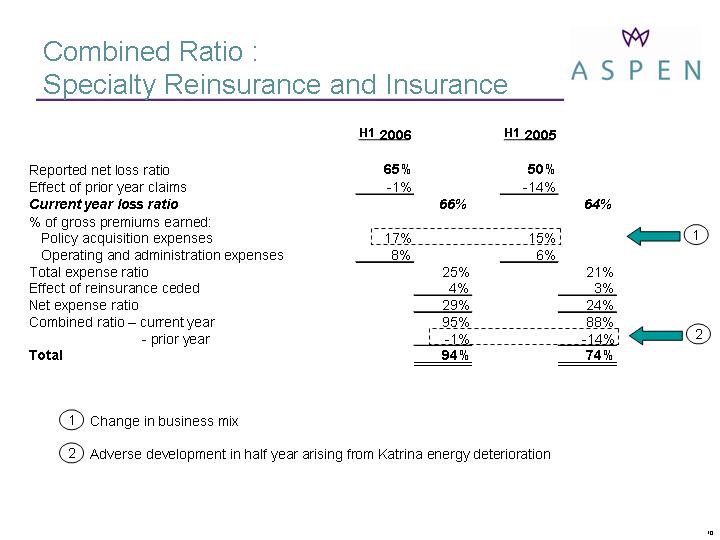
Combined Ratio : <br/>Specialty Reinsurance and Insurance
Change in business mix
Change in business mix
2
1
1
2
H1
H1
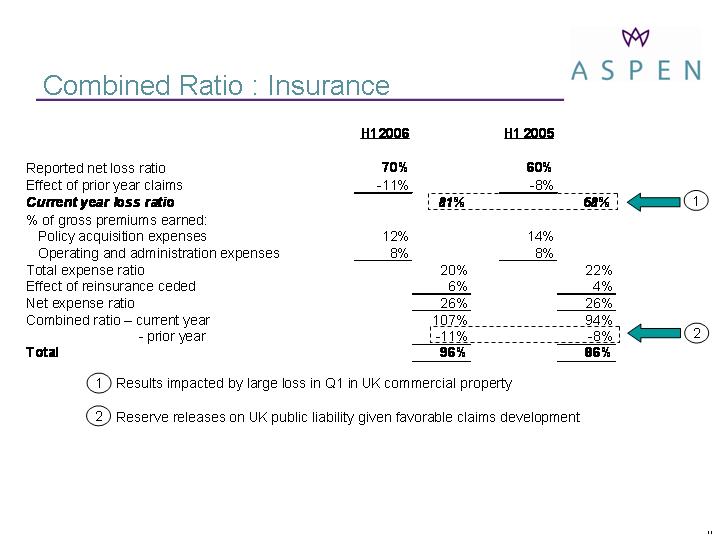
Combined Ratio : Insurance
Results impacted by large loss in Q1 in UK commercial property
Results impacted by large loss in Q1 in UK commercial property
Reserve releases on UK public liability given favorable claims development
2
1
1
2
H1
H1
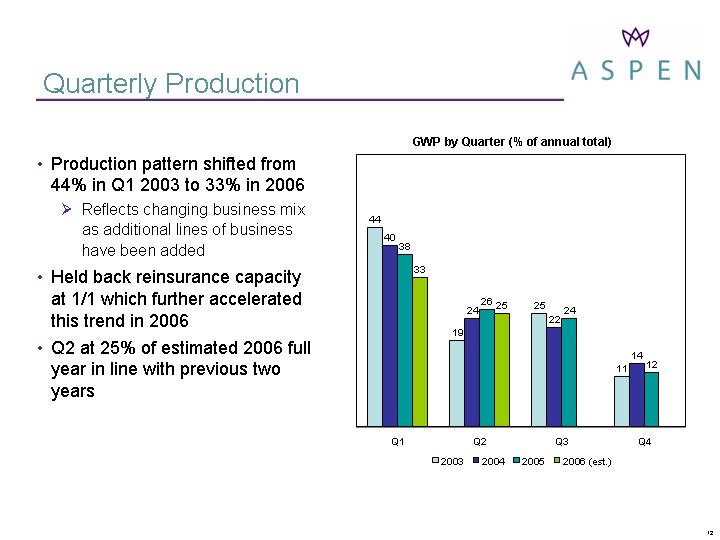
Quarterly Production
Production pattern shifted from 44% in Q1 2003 to 33% in 2006
Reflects changing business mix as additional lines of business have been added
Held back reinsurance capacity at 1/1 which further accelerated this trend in 2006
GWP by Quarter (% of annual total)