Exhibit 99.1
| Aspen Insurance Holdings Limited Fox-Pitt Kelton, Cochran Caronia Waller Bermuda in Boston Conference Chris O'Kane, Chief Executive Officer September 16, 2008 |
| Safe Harbor Disclosure This slide presentation is for information purposes only. It should be read in conjunction with our financial supplement posted on our website on the Investor Relations page and with other documents filed by Aspen Insurance Holdings Limited (the "Company" or "Aspen") with the U.S. Securities and Exchange Commission. Non-GAAP Financial Measures In presenting Aspen's results, management has included and discussed certain "non-GAAP financial measures", as such term is defined in Regulation G. Management believes that these non-GAAP measures, which may be defined differently by other companies, better explain Aspen's results of operations in a manner that allows for a more complete understanding of the underlying trends in Aspen's business. However, these measures should not be viewed as a substitute for those determined in accordance with GAAP. The reconciliation of such non-GAAP financial measures to their respective most directly comparable GAAP financial measures in accordance with Regulation G is included herein or in the financial supplement, as applicable, which can be obtained from the Investor Relations section of Aspen's website at www.aspen.bm. Note: Aspen defines ROE as Return on Average Equity. Application of the Safe Harbor of the Private Securities Litigation Reform Act of 1995: This presentation contains written or oral "forward-looking statements" within the meaning of the U.S. federal securities laws. These statements are made pursuant to the safe harbor provisions of the Private Securities Litigation Reform Act of 1995. Forward-looking statements include all statements that do not relate solely to historical or current facts, and can be identified by the use of words such as "expect," "intend," "plan," "believe," "project," "anticipate," "seek," "will," "estimate," "may," "continue," "guidance," and similar expressions of a future or forward-looking nature. In addition, any estimates relating to loss events involve the exercise of considerable judgment and reflect a combination of ground-up evaluations, information available to date from brokers and cedants, market intelligence, initial tentative loss reports and other sources. Due to the complexity of factors contributing to the losses and the preliminary nature of the information used to prepare these estimates, there can be no assurance that Aspen's ultimate losses will remain within the stated amount. All forward-looking statements address matters that involve risks and uncertainties. Accordingly, there are or will be important factors that could cause actual results to differ materially from those indicated in these statements. Aspen believes these factors include, but are not limited to: the impact of deteriorating credit environment created by the sub- prime crisis and global credit crunch; a decline in the value of our investment portfolio or a rating downgrade of the securities in our portfolio; Aspen's reliance on loss reports received from cedants and loss adjustors; Aspen's reliance on industry loss estimates and those generated by modelling techniques; any changes in Aspen's reinsurers' credit quality; changes in assumptions on flood damage exclusions as a result of prevailing lawsuits and case law; the amount and timing of reinsurance recoverables and reimbursements actually received by Aspen from its reinsurers; the impact that our future operating results, capital position and rating agency and other considerations have on the execution of any capital management initiatives; our ability to execute our business plan to enter new markets, introduce new products and develop new distribution channels, including their integration into our existing operations; the impact of any capital management activities on our financial condition; the impact of acts of terrorism and related legislation and acts of war; the possibility of greater frequency or severity of claims and loss activity, including as a result of natural or man-made catastrophic events than our underwriting, reserving or investment practices have anticipated; evolving interpretive issues with respect to coverage after major loss events; the level of inflation in repair costs due to limited availability of labor and materials after catastrophes; the effectiveness of Aspen's loss limitation methods; changes in the availability, cost or quality of reinsurance or retrocessional coverage, which may affect our decision to purchase such coverage; the reliability of, and changes in assumptions to, catastrophe pricing, accumulation and estimated loss models; loss of key personnel; a decline in our operating subsidiaries' ratings with Standard & Poor's, A.M. Best Company or Moody's Investors Service; changes in general economic conditions including inflation, foreign currency exchange rates, interest rates and other factors that could affect our investment portfolio; the number and type of insurance and reinsurance contracts that we wrote at the January 1st and other renewal periods in 2008 and the premium rates available at the time of such renewals within our targeted business lines; increased competition on the basis of pricing, capacity, coverage terms or other factors; decreased demand for Aspen's insurance or reinsurance products and cyclical downturn of the industry; changes in governmental regulations, interpretations or tax laws in jurisdictions where Aspen conducts business; proposed and future changes to insurance laws and regulations, including with respect to U.S. state- and other government-sponsored reinsurance funds and primary insurers; Aspen or its Bermudian subsidiary becoming subject to income taxes in the United States or the United Kingdom; the effect on insurance markets, business practices and relationships of ongoing litigation, investigations and regulatory activity by insurance regulators and prosecutors. For a more detailed description of these uncertainties and other factors, please see the "Risk Factors" section in Aspen's Annual Reports on Form 10-K as filed with the U.S. Securities and Exchange Commission on February 29, 2008. Aspen undertakes no obligation to publicly update or revise any forward-looking statements, whether as a result of new information, future events or otherwise. Readers are cautioned not to place undue reliance on these forward-looking statements, which speak only as of the dates on which they are made. |
| Probability Distributions of 2008 ROE Equity: Disclaimers This presentation includes slides relating to the probability distributions of the 2008 ROE based on model outputs only and are not, and should not be construed as guidance for 2008. The Company relies on the outputs of its Dynamic Financial Analysis ("DFA") model in addition to other considerations in the establishment of its public guidance. No new 2008 guidance is given in this presentation. No representation or warranty of any kind is or can be made with respect to the accuracy or completeness of, and no representation or warranty should be inferred from, the probability distributions of the 2008 ROE in these slides or the assumptions underlying them or their suitability. No representation or warranty is or can be made as to the future operations or the amount of any future income or loss. The figures shown are the result of numerous assumptions made within our DFA model, many of which are subject to uncertainty which could lead actual results to vary considerably from those indicated by the model, including our estimates of catastrophe and non- catastrophe losses, our estimates of reserve movements and our estimates of investment income. No explicit allowance has been made within the modeling for the possibility that the model could be wrong or assumptions within the model incorrect. This includes the possibility that catastrophe models are incorrect. Changes in market conditions and variations from expected underwriting and investment strategy may lead to results varying considerably from those indicated by the model. No reliance should be placed on the accuracy of our DFA probability distributions of the 2008 ROE as they are based on (i) assumptions and other factors made at the time of modeling which may be subject to uncertainty or which may change subsequently, (ii) currently available information derived from modeling techniques, which may be incorrect, and (iii) modeling assumptions that may be inaccurate or incorrect. Therefore, the results of the model are illustrative and not to be viewed as facts or forecasts, and should not be relied upon as a representation of the future value of an investment in Aspen shares. See Slide 2 - Safe Harbor Disclosure for reference to important factors that could cause actual results to differ from the probability distribution of 2008 ROE provided in the following slides. Changes in market conditions and variations from expected underwriting and investment strategy may lead to results varying considerably from those indicated by the model. For a more detailed description of these uncertainties and other factors, please see the "Risk Factors" section in Aspen's Annual Report on Form 10-K as filed with the U.S. Securities and Exchange Commission on February 29, 2008. Aspen undertakes no obligation to publicly update or revise any forward-looking statements, whether as a result of new information, future events or otherwise. Readers are cautioned not to place undue reliance on these forward-looking statements, which speak only as of the dates on which they were made. |
| Contents Aspen at a Glance Strategy: Key Elements Competitive Landscape Aspen: Future Evolution Current Performance and Outlook |
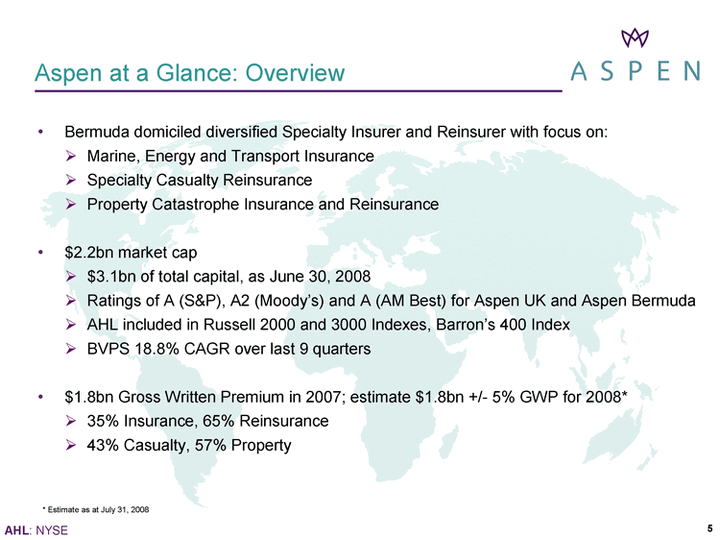
| Aspen at a Glance: Overview Bermuda domiciled diversified Specialty Insurer and Reinsurer with focus on: ? Marine, Energy and Transport Insurance ? Specialty Casualty Reinsurance ? Property Catastrophe Insurance and Reinsurance $2.2bn market cap ? $3.1bn of total capital, as June 30, 2008 ? Ratings of A (S&P), A2 (Moody's) and A (AM Best) for Aspen UK and Aspen Bermuda ? AHL included in Russell 2000 and 3000 Indexes, Barron's 400 Index ? BVPS 18.8% CAGR over last 9 quarters $1.8bn Gross Written Premium in 2007; estimate $1.8bn +/- 5% GWP for 2008* ? 35% Insurance, 65% Reinsurance ? 43% Casualty, 57% Property * Estimate as at July 31, 2008 |
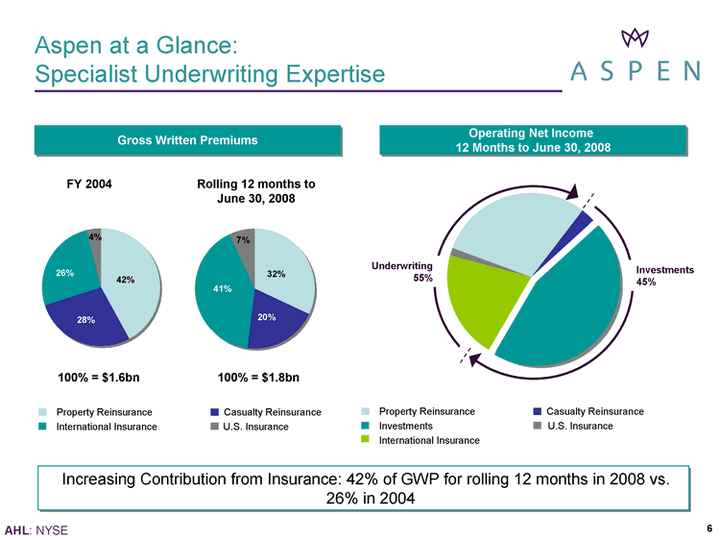
| 100% = $1.6bn FY 2004 100% = $1.8bn Rolling 12 months to June 30, 2008 Property Reinsurance Casualty Reinsurance International Insurance U.S. Insurance Aspen at a Glance: Specialist Underwriting Expertise Gross Written Premiums Increasing Contribution from Insurance: 42% of GWP for rolling 12 months in 2008 vs. 26% in 2004 Operating Net Income 12 Months to June 30, 2008 Property Reinsurance Casualty Reinsurance Investments U.S. Insurance International Insurance Underwriting 55% Investments 45% 42% 26% 4% 28% 20% 41% 7% 32% |
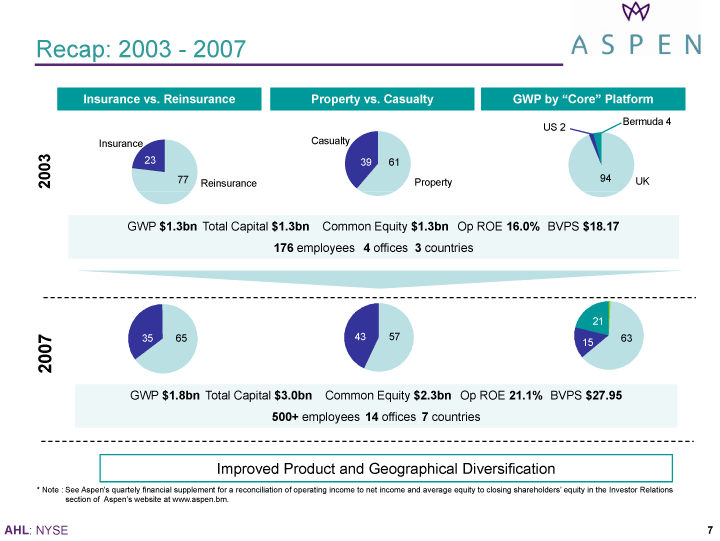
| Recap: 2003 - 2007 Slice 2 0 15 21 1 63 25 Insurance Reinsurance 40 5 35 65 67 30 Property Casualty UK Bermuda 4 2007 Insurance vs. Reinsurance Property vs. Casualty GWP by "Core" Platform 16 2003 67 US 2 94 39 61 23 77 43 57 GWP $1.8bn Total Capital $3.0bn Common Equity $2.3bn Op ROE 21.1% BVPS $27.95 500+ employees 14 offices 7 countries GWP $1.3bn Total Capital $1.3bn Common Equity $1.3bn Op ROE 16.0% BVPS $18.17 176 employees 4 offices 3 countries 63 15 21 Improved Product and Geographical Diversification |
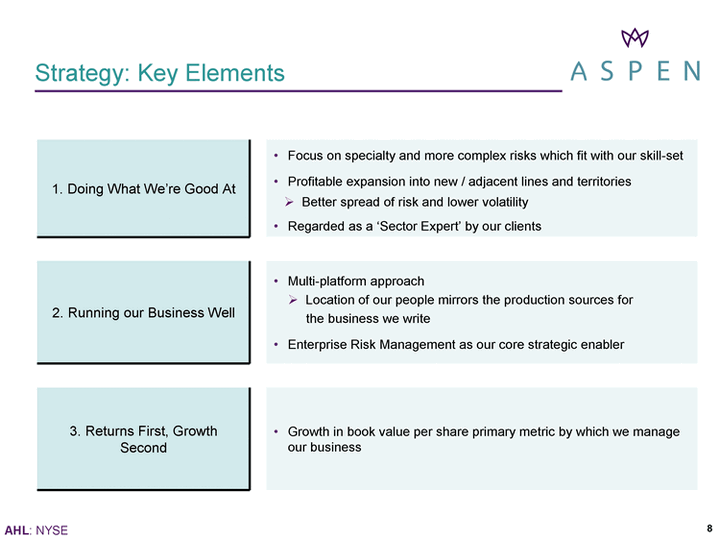
| Strategy: Key Elements 1. Doing What We're Good At Focus on specialty and more complex risks which fit with our skill-set 1. Doing What We're Good At Profitable expansion into new / adjacent lines and territories ? Better spread of risk and lower volatility Regarded as a 'Sector Expert' by our clients 2. Running our Business Well Multi-platform approach ? Location of our people mirrors the production sources for the business we write Enterprise Risk Management as our core strategic enabler 3. Returns First, Growth Second Growth in book value per share primary metric by which we manage our business |
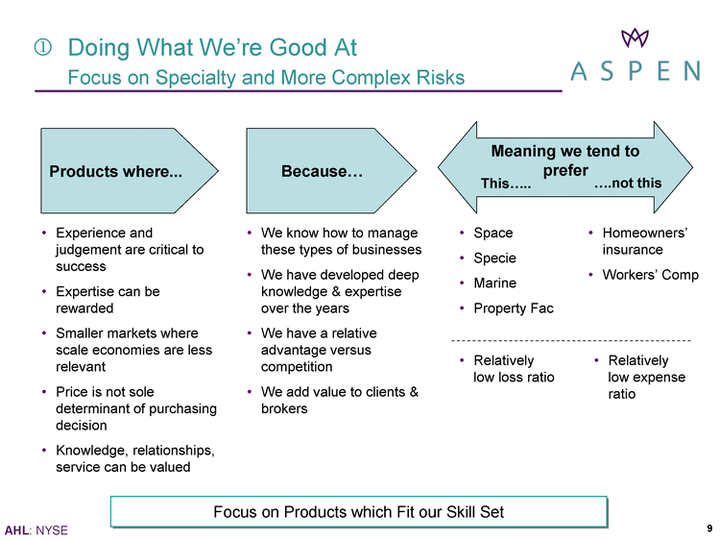
| Products where... Because... Meaning we tend to prefer Experience and judgement are critical to success Expertise can be rewarded Smaller markets where scale economies are less relevant Price is not sole determinant of purchasing decision Knowledge, relationships, service can be valued We know how to manage these types of businesses We have developed deep knowledge & expertise over the years We have a relative advantage versus competition We add value to clients & brokers Space Specie Marine Property Fac Homeowners' insurance Workers' Comp This..... .....not this Relatively low loss ratio Relatively low expense ratio Doing What We're Good At Focus on Specialty and More Complex Risks Focus on Products which Fit our Skill Set |
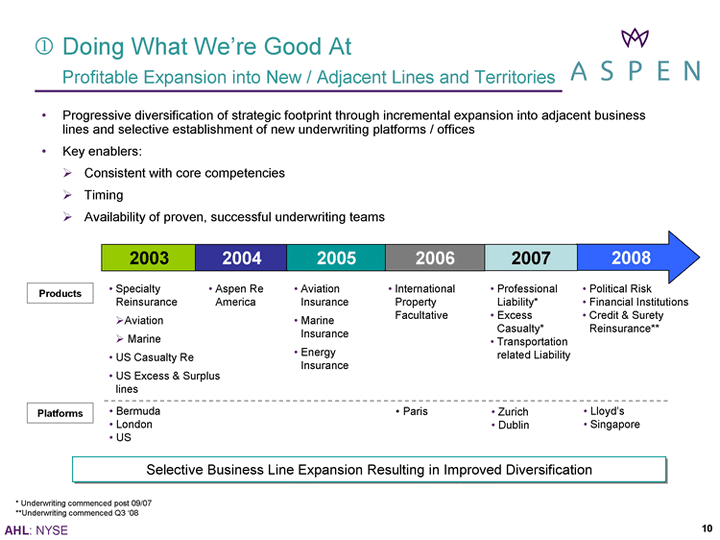
| Progressive diversification of strategic footprint through incremental expansion into adjacent business lines and selective establishment of new underwriting platforms / offices Key enablers: ? Consistent with core competencies ? Timing ? Availability of proven, successful underwriting teams Selective Business Line Expansion Resulting in Improved Diversification 2003 2004 2005 2008 Specialty Reinsurance ?Aviation ? Marine US Casualty Re US Excess & Surplus lines Aspen Re America Aviation Insurance Marine Insurance Energy Insurance International Property Facultative * Underwriting commenced post 09/07 **Underwriting commenced Q3 '08 2006 Professional Liability* Excess Casualty* Transportation related Liability 2007 Political Risk Financial Institutions Credit & Surety Reinsurance** Products Platforms Bermuda London US Zurich Dublin Lloyd's Singapore Doing What We're Good At Profitable Expansion into New / Adjacent Lines and Territories Paris |
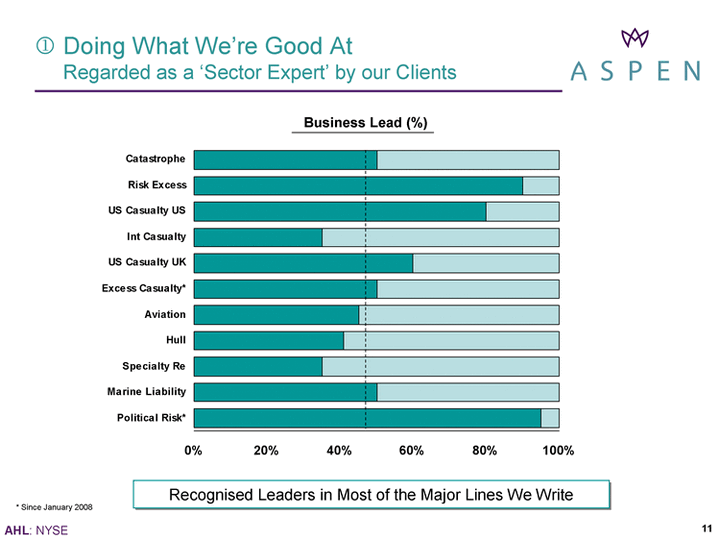
| Political Risk* Marine Liability Energy Specialty Re Hull Aviation Excess Casualty* US Casualty UK Int Casualty US Casualty US Risk Excess Catastrophe Lead 0.95 0.5 0.06 0.35 0.41 0.45 0.5 0.6 0.35 0.8 0.9 0.5 Follow 0.05 0.5 0.84 0.65 0.59 0.55 0.5 0.4 0.65 0.2 0.1 0.5 ? Doing What We're Good At Regarded as a 'Sector Expert' by our Clients Business Lead (%) Recognised Leaders in Most of the Major Lines We Write * Since January 2008 |
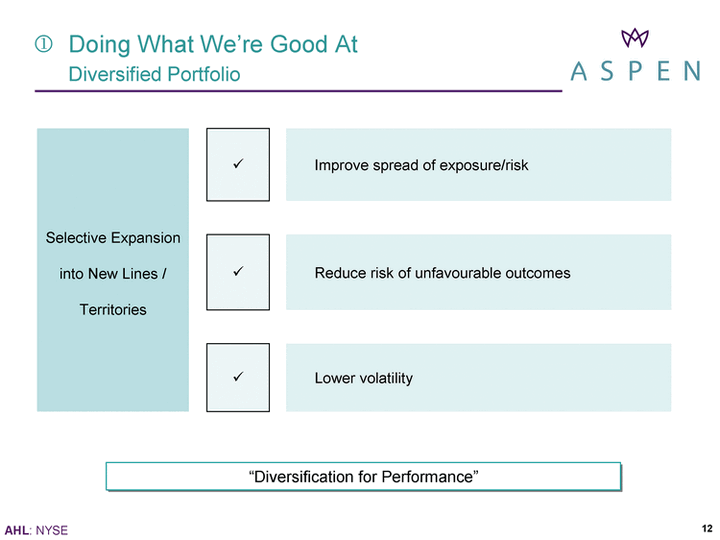
| ? Doing What We're Good At Diversified Portfolio "Diversification for Performance" Selective Expansion into New Lines / Territories ? Improve spread of exposure/risk Selective Expansion into New Lines / Territories Selective Expansion into New Lines / Territories ? Reduce risk of unfavourable outcomes Selective Expansion into New Lines / Territories Selective Expansion into New Lines / Territories ? Lower volatility |
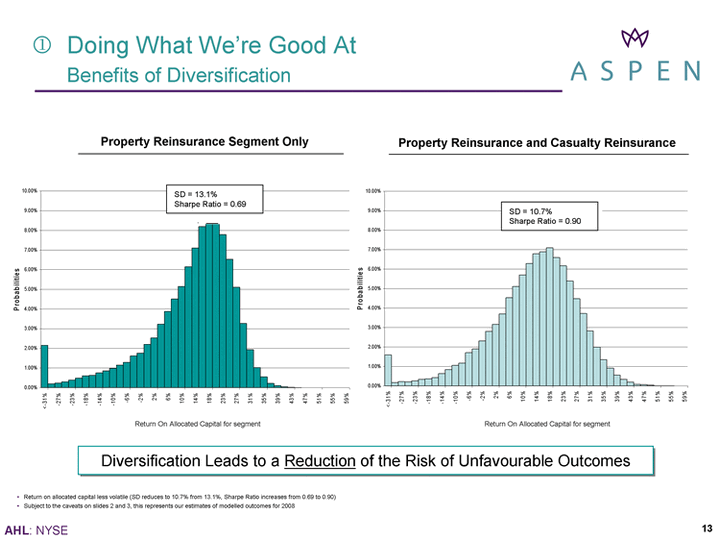
| Property Reinsurance and Casualty Reinsurance Property Reinsurance Segment Only Return on allocated capital less volatile (SD reduces to 10.7% from 13.1%, Sharpe Ratio increases from 0.69 to 0.90) Subject to the caveats on slides 2 and 3, this represents our estimates of modelled outcomes for 2008 Diversification Leads to a Reduction of the Risk of Unfavourable Outcomes Return On Allocated Capital for segment Return On Allocated Capital for segment SD = 10.7% Sharpe Ratio = 0.90 ? Doing What We're Good At Benefits of Diversification SD = 13.1% Sharpe Ratio = 0.69 0.00% 1.00% 2.00% 3.00% 4.00% 5.00% 6.00% 7.00% 8.00% 9.00% 10.00% 59% 55% 51% 47% 43% 39% 35% 31% 27% 23% 18% 14% 10% 6% 2% - -2% - -6% - -10% - -14% - -18% - -23% - -27% <-31% Return On Allocated Equity (ROAE for segment) Probabilities SD = 10.7% Sharpe Ratio = 0.90 0.00% 1.00% 2.00% 3.00% 4.00% 5.00% 6.00% 7.00% 8.00% 9.00% 10.00% 59% 55% 51% 47% 43% 39% 35% 31% 27% 23% 18% 14% 10% 6% 2% - -2% - -6% - -10% - -14% - -18% - -23% - -27% <-31% Return On Allocated Equity (ROAE for segment) Probabilities SD = 13.1% Sharpe Ratio = 0.69 |
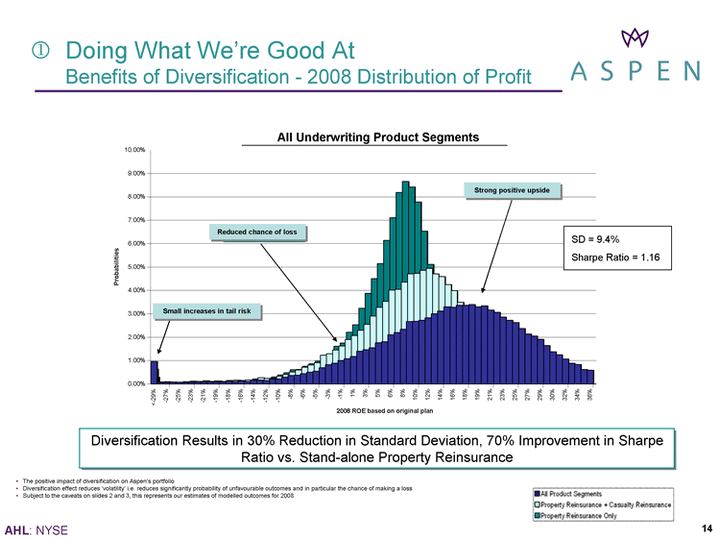
| The positive impact of diversification on Aspen's portfolio Diversification effect reduces 'volatility' i.e. reduces significantly probability of unfavourable outcomes and in particular the chance of making a loss Subject to the caveats on slides 2 and 3, this represents our estimates of modelled outcomes for 2008 Diversification Results in 30% Reduction in Standard Deviation, 70% Improvement in Sharpe Ratio vs. Stand-alone Property Reinsurance All Underwriting Product Segments ? Doing What We're Good At Benefits of Diversification - 2008 Distribution of Profit SD = 9.4% Sharpe Ratio = 1.16 0.00% 1.00% 2.00% 3.00% 4.00% 5.00% 6.00% 7.00% 8.00% 9.00% 10.00% Probabilities 2008 ROE based on original plan All Underwriting Product Segments All Product Segments Property Reinsurance + Casualty Reinsurance Property Reinsurance Only Reduced chance of loss Small increases in tail risk Strong positive upside Small increases in tail risk Small increases in tail risk Reduced chance of loss Reduced chance of loss Strong positive upside Strong positive upside 0.00% 1.00% 2.00% 3.00% 4.00% 5.00% 6.00% 7.00% 8.00% 9.00% 10.00% Probabilities 2008 ROE based on original plan All Underwriting Product Segments All Product Segments Property Reinsurance + Casualty Reinsurance Property Reinsurance Only Reduced chance of loss Small increases in tail risk Strong positive upside Small increases in tail risk Small increases in tail risk Reduced chance of loss Reduced chance of loss Strong positive upside Strong positive upside |
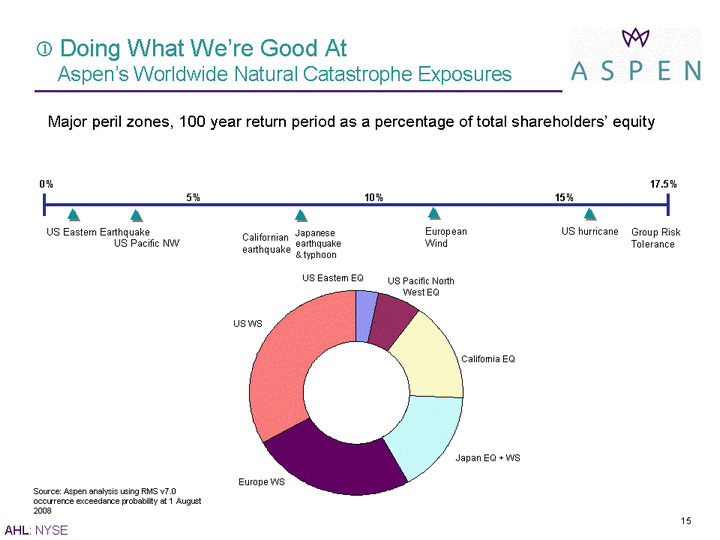
| ? Doing What We're Good At Aspen's Worldwide Natural Catastrophe Exposures Source: Aspen analysis using RMS v7.0 occurrence exceedance probability at 1 August 2008 Japanese earthquake & typhoon 0% 17.5% US Eastern Earthquake US Pacific NW Californian earthquake European Wind US hurricane Group Risk Tolerance 5% 10% 15% Major peril zones, 100 year return period as a percentage of total shareholders' equity California EQ US Pacific North West EQ US Eastern EQ US WS Europe WS Japan EQ + WS |
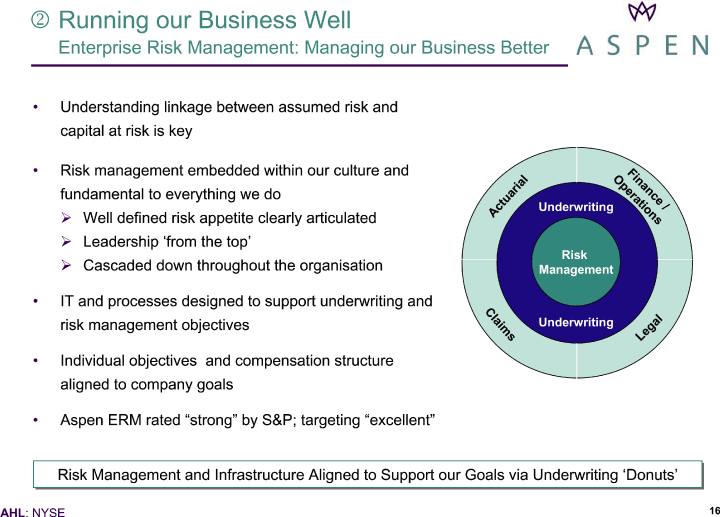
| Running our Business Well Enterprise Risk Management: Managing our Business Better Understanding linkage between assumed risk and capital at risk is key Risk management embedded within our culture and fundamental to everything we do ? Well defined risk appetite clearly articulated ? Leadership 'from the top' ? Cascaded down throughout the organisation IT and processes designed to support underwriting and risk management objectives Individual objectives and compensation structure aligned to company goals Aspen ERM rated "strong" by S&P; targeting "excellent" Risk Management Underwriting Underwriting Actuarial Claims Legal Finance / Operations Risk Management and Infrastructure Aligned to Support our Goals via Underwriting 'Donuts' |
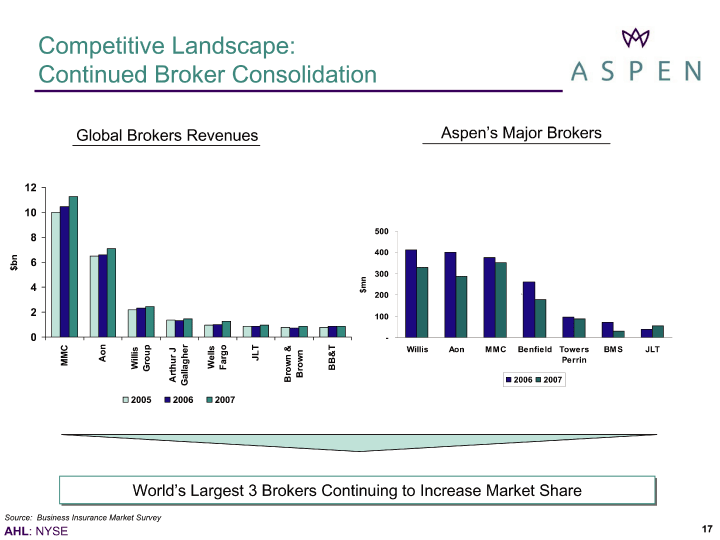
| Competitive Landscape: Continued Broker Consolidation Source: Business Insurance Market Survey World's Largest 3 Brokers Continuing to Increase Market Share Global Brokers Revenues Aspen's Major Brokers 0 2 4 6 8 10 12 MMC Aon Willis Group Arthur J Gallagher Wells Fargo JLT Brown & Brown BB&T $bn 2005 2006 2007 - - 100 200 300 400 500 Willis Aon MMC Benfield Towers Perrin BMS JLT $mn 2006 2007 ' |
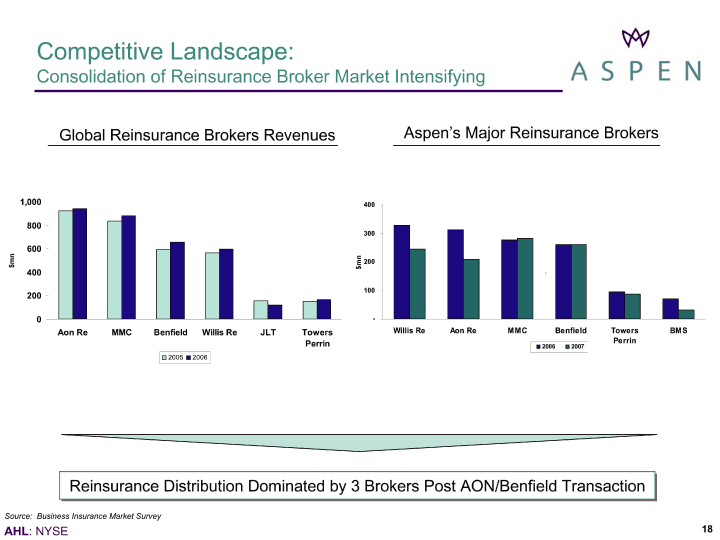
| Competitive Landscape: Consolidation of Reinsurance Broker Market Intensifying Source: Business Insurance Market Survey Reinsurance Distribution Dominated by 3 Brokers Post AON/Benfield Transaction Global Reinsurance Brokers Revenues Aspen's Major Reinsurance Brokers - - 100 200 300 400 Willis Re Aon Re MMC Benfield Towers Perrin BMS $mn 2006 2007 ' 0 200 400 600 800 1,000 Aon Re MMC Benfield Willis Re JLT Towers Perrin $mn 2005 2006 |
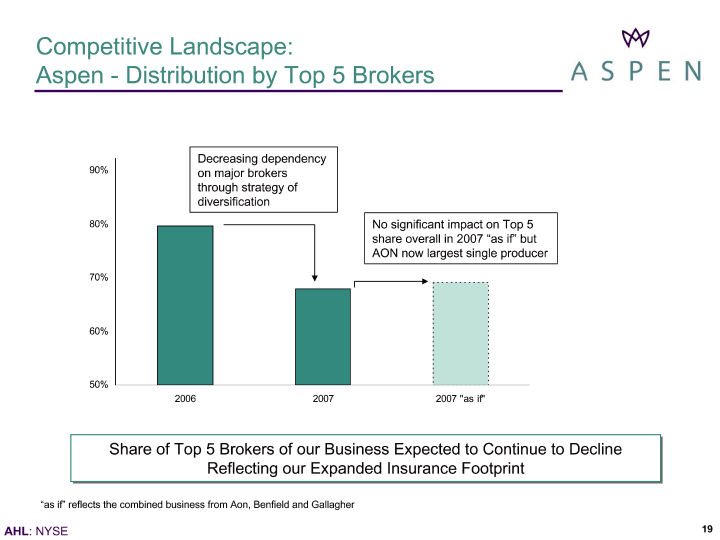
| Competitive Landscape: Aspen - Distribution by Top 5 Brokers Decreasing dependency on major brokers through strategy of diversification No significant impact on Top 5 share overall in 2007 "as if" but AON now largest single producer "as if" reflects the combined business from Aon, Benfield and Gallagher Share of Top 5 Brokers of our Business Expected to Continue to Decline Reflecting our Expanded Insurance Footprint 50% 60% 70% 80% 90% 2006 2007 2007 "as if" |
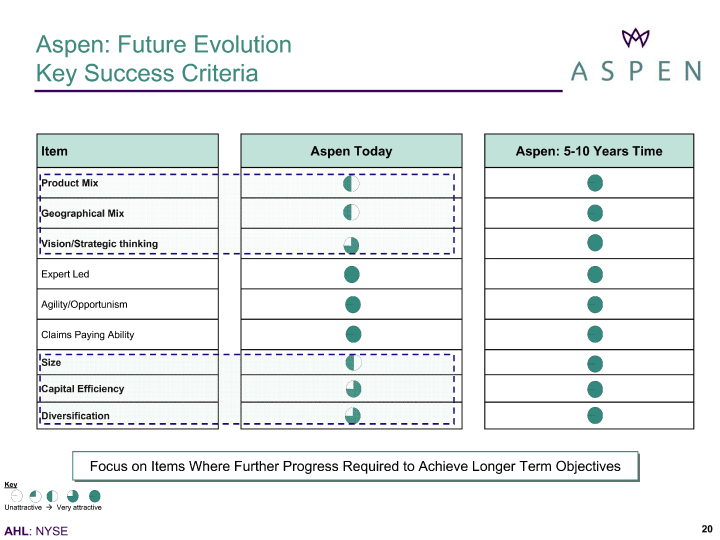
| 1st Qtr 2nd Qtr 3rd Qtr 4th Qtr East 50 50 90 20.4 West 30.6 38.6 34.6 31.6 North 45.9 46.9 45 43.9 Aspen: Future Evolution Key Success Criteria Item Aspen Today Aspen: 5-10 Years Time Product Mix Geographical Mix Vision/Strategic thinking Expert Led Agility/Opportunism Claims Paying Ability Size Capital Efficiency Diversification 1st Qtr 2nd Qtr 3rd Qtr 4th Qtr East 25 75 90 20.4 West 30.6 38.6 34.6 31.6 North 45.9 46.9 45 43.9 1st Qtr 2nd Qtr 3rd Qtr 4th Qtr East 50 50 90 20.4 West 30.6 38.6 34.6 31.6 North 45.9 46.9 45 43.9 Key Unattractive ? Very attractive 1st Qtr 2nd Qtr 3rd Qtr 4th Qtr East 100 0 90 20.4 West 30.6 38.6 34.6 31.6 North 45.9 46.9 45 43.9 1st Qtr 2nd Qtr 3rd Qtr 4th Qtr East 75 25 90 20.4 West 30.6 38.6 34.6 31.6 North 45.9 46.9 45 43.9 1st Qtr 2nd Qtr 3rd Qtr 4th Qtr East 50 50 90 20.4 West 30.6 38.6 34.6 31.6 North 45.9 46.9 45 43.9 1st Qtr 2nd Qtr 3rd Qtr 4th Qtr East 25 75 90 20.4 West 30.6 38.6 34.6 31.6 North 45.9 46.9 45 43.9 1st Qtr 2nd Qtr 3rd Qtr 4th Qtr East 0 75 90 20.4 West 30.6 38.6 34.6 31.6 North 45.9 46.9 45 43.9 1st Qtr 2nd Qtr 3rd Qtr 4th Qtr East 50 50 90 20.4 West 30.6 38.6 34.6 31.6 North 45.9 46.9 45 43.9 0 2nd Qtr 3rd Qtr 4th Qtr East 0 100 90 20.4 West 30.6 38.6 34.6 31.6 North 45.9 46.9 45 43.9 0 2nd Qtr 3rd Qtr 4th Qtr East 0 100 90 20.4 West 30.6 38.6 34.6 31.6 North 45.9 46.9 45 43.9 0 2nd Qtr 3rd Qtr 4th Qtr East 0 100 90 20.4 West 30.6 38.6 34.6 31.6 North 45.9 46.9 45 43.9 1st Qtr 2nd Qtr 3rd Qtr 4th Qtr East 25 75 90 20.4 West 30.6 38.6 34.6 31.6 North 45.9 46.9 45 43.9 0 2nd Qtr 3rd Qtr 4th Qtr East 0 100 90 20.4 West 30.6 38.6 34.6 31.6 North 45.9 46.9 45 43.9 0 2nd Qtr 3rd Qtr 4th Qtr East 0 100 90 20.4 West 30.6 38.6 34.6 31.6 North 45.9 46.9 45 43.9 0 2nd Qtr 3rd Qtr 4th Qtr East 0 100 90 20.4 West 30.6 38.6 34.6 31.6 North 45.9 46.9 45 43.9 0 2nd Qtr 3rd Qtr 4th Qtr East 0 100 90 20.4 West 30.6 38.6 34.6 31.6 North 45.9 46.9 45 43.9 0 2nd Qtr 3rd Qtr 4th Qtr East 0 100 90 20.4 West 30.6 38.6 34.6 31.6 North 45.9 46.9 45 43.9 0 2nd Qtr 3rd Qtr 4th Qtr East 0 100 90 20.4 West 30.6 38.6 34.6 31.6 North 45.9 46.9 45 43.9 0 2nd Qtr 3rd Qtr 4th Qtr East 0 100 90 20.4 West 30.6 38.6 34.6 31.6 North 45.9 46.9 45 43.9 0 2nd Qtr 3rd Qtr 4th Qtr East 0 100 90 20.4 West 30.6 38.6 34.6 31.6 North 45.9 46.9 45 43.9 0 2nd Qtr 3rd Qtr 4th Qtr East 0 100 90 20.4 West 30.6 38.6 34.6 31.6 North 45.9 46.9 45 43.9 Focus on Items Where Further Progress Required to Achieve Longer Term Objectives 1st Qtr 2nd Qtr 3rd Qtr 4th Qtr East 25 75 90 20.4 West 30.6 38.6 34.6 31.6 North 45.9 46.9 45 43.9 |
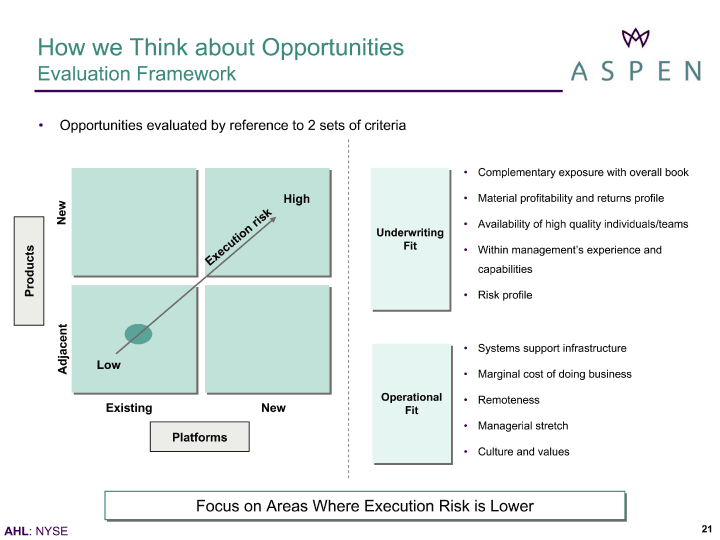
| How we Think about Opportunities Evaluation Framework Adjacent New Products Existing New Platforms Low High Execution risk Complementary exposure with overall book Material profitability and returns profile Availability of high quality individuals/teams Within management's experience and capabilities Risk profile Underwriting Fit Operational Fit Systems support infrastructure Marginal cost of doing business Remoteness Managerial stretch Culture and values Opportunities evaluated by reference to 2 sets of criteria Focus on Areas Where Execution Risk is Lower |
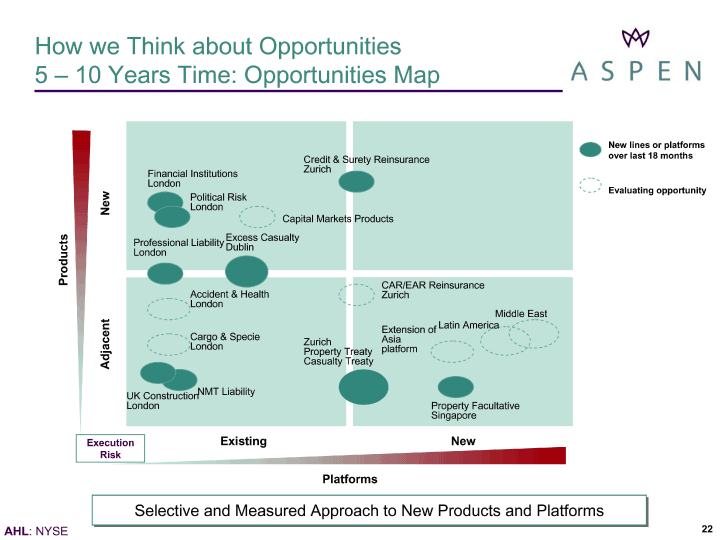
| How we Think about Opportunities 5 - 10 Years Time: Opportunities Map Adjacent New Existing New Products Platforms Excess Casualty Dublin Zurich Property Treaty Casualty Treaty Credit & Surety Reinsurance Zurich Financial Institutions London Political Risk London Professional Liability London Property Facultative Singapore Latin America Middle East Extension of Asia platform Cargo & Specie London UK Construction London NMT Liability Accident & Health London New lines or platforms over last 18 months Evaluating opportunity CAR/EAR Reinsurance Zurich Selective and Measured Approach to New Products and Platforms Capital Markets Products Execution Risk |
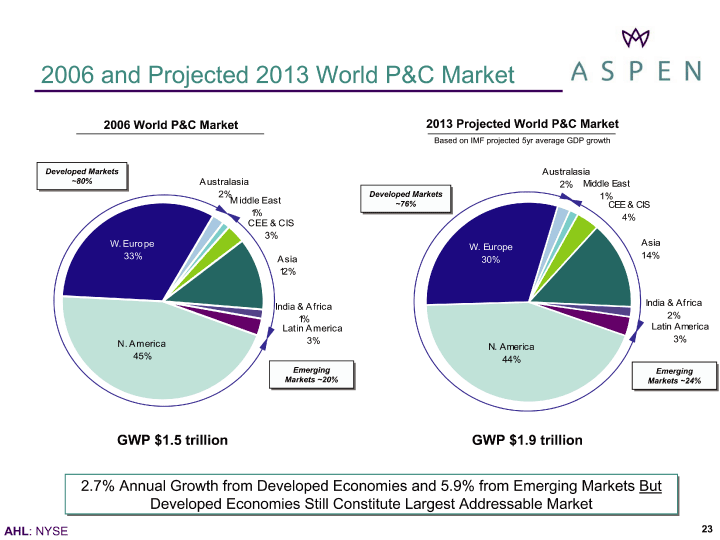
| 2006 and Projected 2013 World P&C Market 2.7% Annual Growth from Developed Economies and 5.9% from Emerging Markets But Developed Economies Still Constitute Largest Addressable Market 2006 World P&C Market 2013 Projected World P&C Market Based on IMF projected 5yr average GDP growth GWP $1.5 trillion GWP $1.9 trillion Developed Markets ~80% Emerging Markets ~20% Developed Markets ~76% Emerging Markets ~24% India & Africa 1% Latin America 3% Asia 12% N. America 45% W. Europe 33% Australasia 2% CEE & CIS 3% Middle East 1% India & Africa 2% Latin America 3% Middle East 1% CEE & CIS 4% Australasia 2% W. Europe 30% N. America 44% Asia 14% |
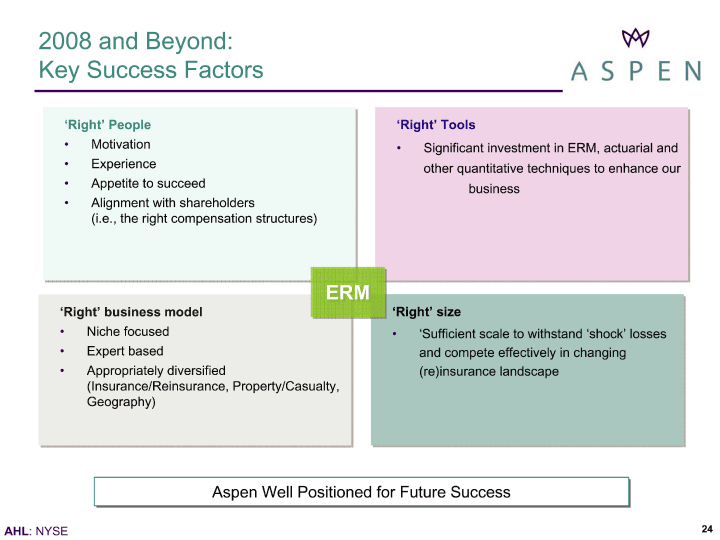
| 2008 and Beyond: Key Success Factors Aspen Well Positioned for Future Success 'Right' People Motivation Experience Appetite to succeed Alignment with shareholders (i.e., the right compensation structures) 'Right' Tools Significant investment in ERM, actuarial and other quantitative techniques to enhance our business 'Right' business model Niche focused Expert based Appropriately diversified (Insurance/Reinsurance, Property/Casualty, Geography) 'Right' size 'Sufficient scale to withstand 'shock' losses and compete effectively in changing (re)insurance landscape ERM |
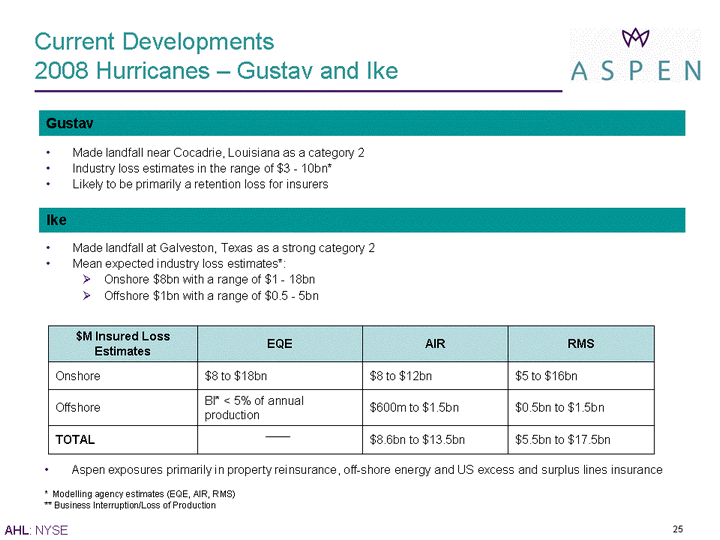
| Current Developments 2008 Hurricanes - Gustav and Ike Made landfall near Cocadrie, Louisiana as a category 2 Industry loss estimates in the range of $3 - 10bn* Likely to be primarily a retention loss for insurers Made landfall at Galveston, Texas as a strong category 2 Mean expected industry loss estimates*: Onshore $8bn with a range of $1 - 18bn Offshore $1bn with a range of $0.5 - 5bn $M Insured Loss Estimates EQE AIR RMS Onshore $8 to $18bn $8 to $12bn $5 to $16bn Offshore BI* < 5% of annual production $600m to $1.5bn $0.5bn to $1.5bn TOTAL $8.6bn to $13.5bn $5.5bn to $17.5bn Aspen exposures primarily in property reinsurance, off-shore energy and US excess and surplus lines insurance Gustav Ike * Modelling agency estimates (EQE, AIR, RMS) ** Business Interruption/Loss of Production |
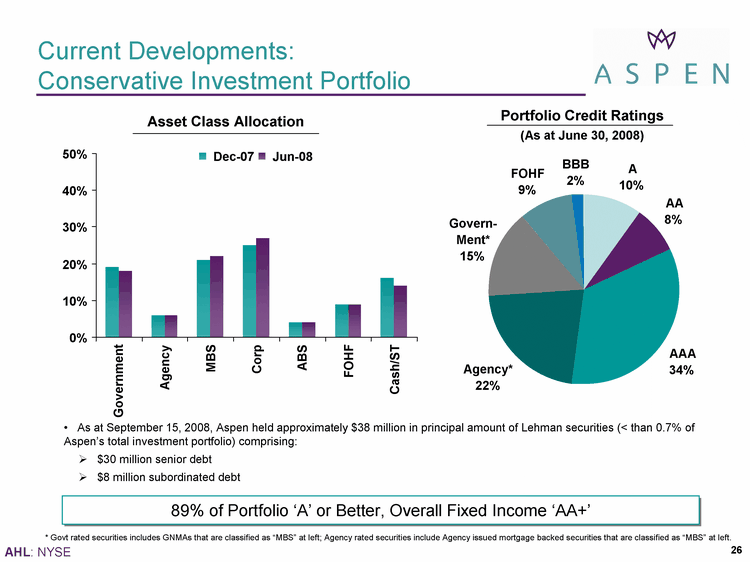
| 0% 10% 20% 30% 40% 50% Government Agency MBS Corp ABS FOHF Cash/ST Dec-07 Jun-08 Current Developments: Conservative Investment Portfolio 89% of Portfolio 'A' or Better, Overall Fixed Income 'AA+' * Govt rated securities includes GNMAs that are classified as "MBS" at left; Agency rated securities include Agency issued mortgage backed securities that are classified as "MBS" at left. Asset Class Allocation Portfolio Credit Ratings (As at June 30, 2008) As at September 15, 2008, Aspen held approximately $38 million in principal amount of Lehman securities (< than 0.7% of Aspen's total investment portfolio) comprising: $30 million senior debt $8 million subordinated debt A 10% AA 8% AAA 34% Agency* 22% Govern- Ment* 15% FOHF 9% BBB 2% |
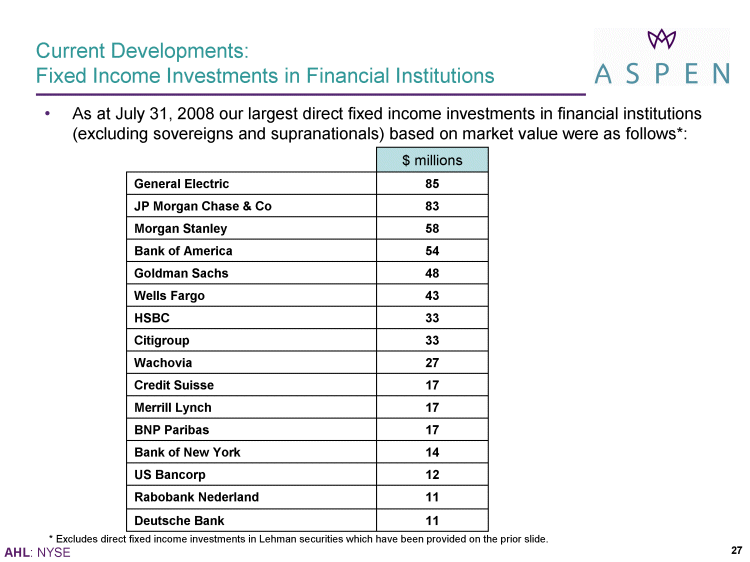
| Current Developments: Fixed Income Investments in Financial Institutions As at July 31, 2008 our largest direct fixed income investments in financial institutions (excluding sovereigns and supranationals) based on market value were as follows*: $ millions General Electric 85 JP Morgan Chase & Co 83 Morgan Stanley 58 Bank of America 54 Goldman Sachs 48 Wells Fargo 43 HSBC 33 Citigroup 33 Wachovia 27 Credit Suisse 17 Merrill Lynch 17 BNP Paribas 17 Bank of New York 14 US Bancorp 12 Rabobank Nederland 11 Deutsche Bank 11 * Excludes direct fixed income investments in Lehman securities which have been provided on the prior slide. |
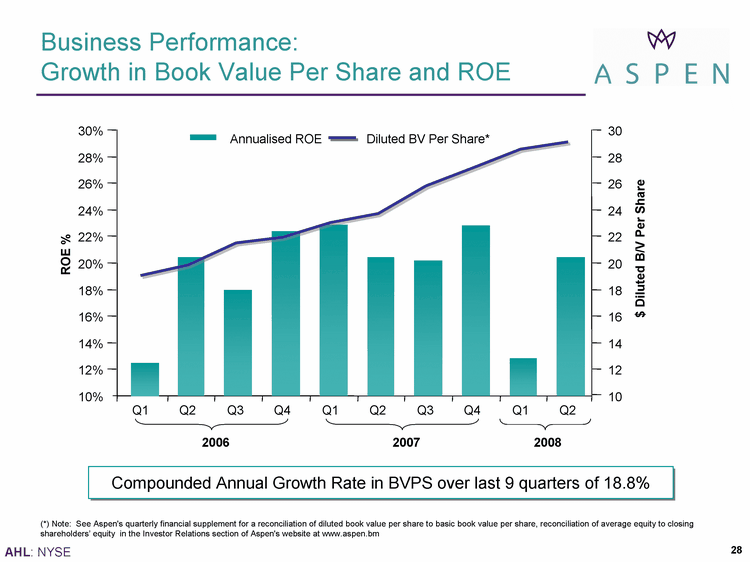
| Business Performance: Growth in Book Value Per Share and ROE Compounded Annual Growth Rate in BVPS over last 9 quarters of 18.8% (*) Note: See Aspen's quarterly financial supplement for a reconciliation of diluted book value per share to basic book value per share, reconciliation of average equity to closing shareholders' equity in the Investor Relations section of Aspen's website at www.aspen.bm 2007 10% 12% 14% 16% 18% 20% 22% 24% 26% 28% 30% Q1 Q2 Q3 Q4 Q1 Q2 Q3 Q4 Q1 Q2 ROE % 10 12 14 16 18 20 22 24 26 28 30 $ Diluted B/V Per Share Annualised ROE Diluted BV Per Share* 12.5% 20.4% 18.0% 22.4% 22.9% 20.4% 20.2% 22.8% 12.8% 20.4% 2006 2008 |
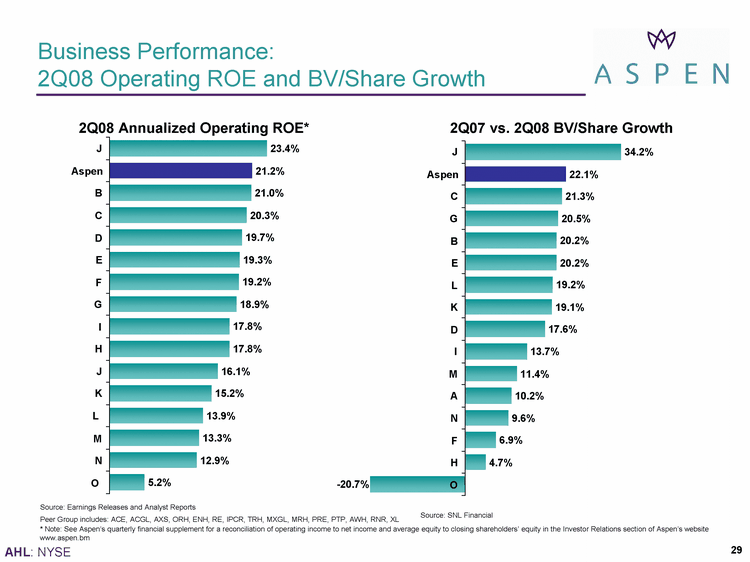
| 2Q08 Annualized Operating ROE* 2Q07 vs. 2Q08 BV/Share Growth Source: Earnings Releases and Analyst Reports Source: SNL Financial Peer Group includes: ACE, ACGL, AXS, ORH, ENH, RE, IPCR, TRH, MXGL, MRH, PRE, PTP, AWH, RNR, XL Business Performance: 2Q08 Operating ROE and BV/Share Growth * Note: See Aspen's quarterly financial supplement for a reconciliation of operating income to net income and average equity to closing shareholders' equity in the Investor Relations section of Aspen's website www.aspen.bm 5.2% 12.9% 13.3% 13.9% 15.2% 16.1% 17.8% 17.8% 18.9% 19.2% 19.3% 19.7% 20.3% 21.0% 21.2% 23.4% O N M L K J H I G F E D C B Aspen J - -20.7% 4.7% 6.9% 9.6% 10.2% 11.4% 13.7% 17.6% 19.1% 19.2% 20.2% 20.2% 20.5% 21.3% 22.1% 34.2% O H F N A M I D K L E B G C Aspen J |
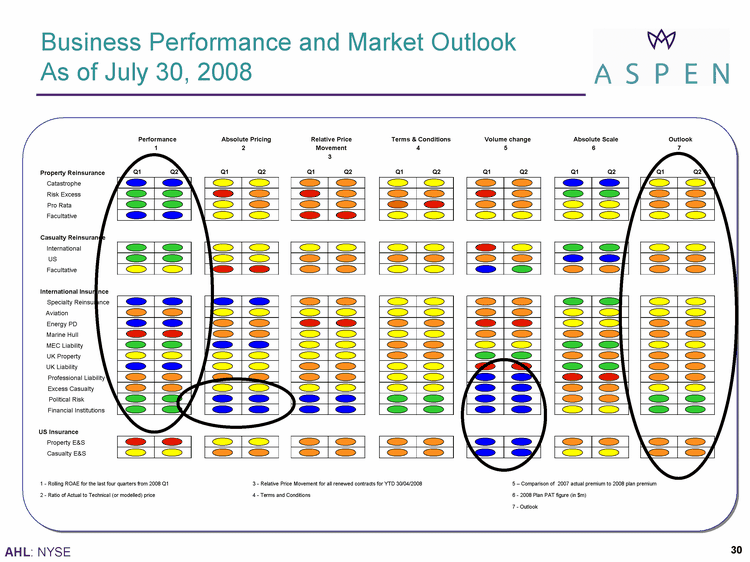
| Business Performance and Market Outlook As of July 30, 2008 1 - Rolling ROAE for the last four quarters from 2008 Q1 3 - Relative Price Movement for all renewed contracts for YTD 30/04/2008 5 - Comparison of 2007 actual premium to 2008 plan premium 2 - Ratio of Actual to Technical (or modelled) price 4 - Terms and Conditions 6 - 2008 Plan PAT figure (in $m) 7 - Outlook Property Reinsurance Q1 Q2 Q1 Q2 Q1 Q2 Q1 Q2 Q1 Q2 Q1 Q2 Q1 Q2 Catastrophe Risk Excess Pro Rata Facultative International US Facultative International Insurance Specialty Reinsurance Aviation Energy PD Marine Hull MEC Liability UK Property UK Liability Professional Liability Excess Casualty Political Risk Financial Institutions US Insurance Property E&S Casualty E&S Casualty Reinsurance Volume change 5 Absolute Scale 6 Outlook 7 Performance 1 Absolute Pricing 2 Relative Price Movement 3 Terms & Conditions 4 |
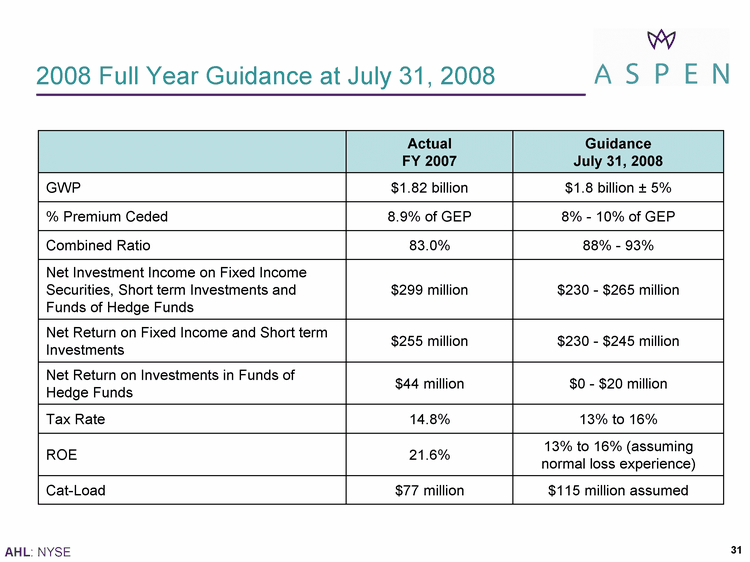
| 2008 Full Year Guidance at July 31, 2008 Actual FY 2007 Guidance July 31, 2008 GWP $1.82 billion $1.8 billion +- 5% % Premium Ceded 8.9% of GEP 8% - 10% of GEP Combined Ratio 83.0% 88% - 93% Net Investment Income on Fixed Income Securities, Short term Investments and Funds of Hedge Funds $299 million $230 - $265 million Net Return on Fixed Income and Short term Investments $255 million $230 - $245 million Net Return on Investments in Funds of Hedge Funds $44 million $0 - $20 million Tax Rate 14.8% 13% to 16% ROE 21.6% 13% to 16% (assuming normal loss experience) Cat-Load $77 million $115 million assumed |
| Summary Disciplined and proactive diversification is producing quality returns Evolutionary expansion of product lines and platforms is core to our current and future business model Holistic risk management underscores everything we do Depth of experience and bottom line focus preserves and grows value in current soft markets |
| Appendix |
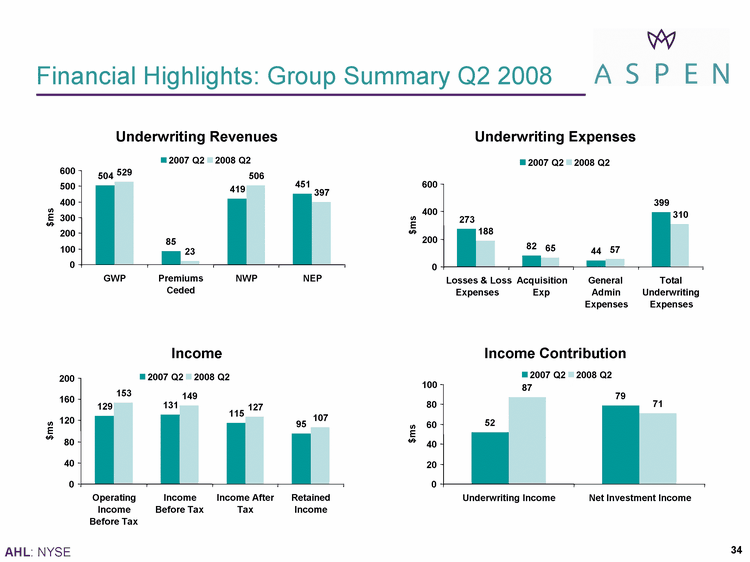
| Financial Highlights: Group Summary Q2 2008 Underwriting Revenues Underwriting Expenses Income Income Contribution 129 131 115 95 153 149 127 107 0 40 80 120 160 200 Operating Income Before Tax Income Before Tax Income After Tax Retained Income $ms 2007 Q2 2008 Q2 52 79 87 71 0 20 40 60 80 100 Underwriting Income Net Investment Income $ms 2007 Q2 2008 Q2 273 82 44 399 188 65 57 310 0 200 400 600 Losses & Loss Expenses Acquisition Exp General Admin Expenses Total Underwriting Expenses $ms 2007 Q2 2008 Q2 504 85 419 451 529 23 506 397 0 100 200 300 400 500 600 GWP Premiums Ceded NWP NEP $ms 2007 Q2 2008 Q2 |
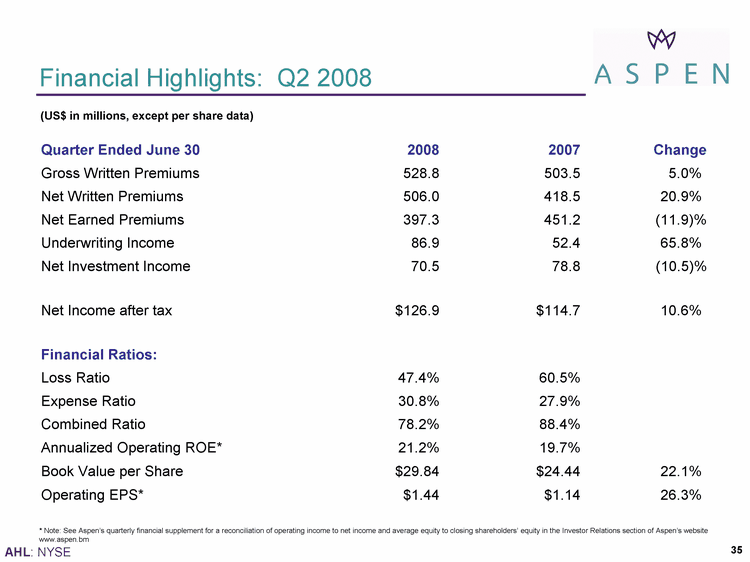
| Financial Highlights: Q2 2008 Quarter Ended June 30 2008 2007 Change Gross Written Premiums 528.8 503.5 5.0%) Net Written Premiums 506.0 418.5 20.9%) Net Earned Premiums 397.3 451.2 (11.9)% Underwriting Income 86.9 52.4 65.8%) Net Investment Income 70.5 78.8 (10.5)% Net Income after tax $126.9 $114.7 10.6%) Financial Ratios: Loss Ratio 47.4% 60.5% Expense Ratio 30.8% 27.9% Combined Ratio 78.2% 88.4% Annualized Operating ROE* 21.2% 19.7% Book Value per Share $29.84 $24.44 22.1%) Operating EPS* $1.44 $1.14 26.3%) (US$ in millions, except per share data) * Note: See Aspen's quarterly financial supplement for a reconciliation of operating income to net income and average equity to closing shareholders' equity in the Investor Relations section of Aspen's website www.aspen.bm |
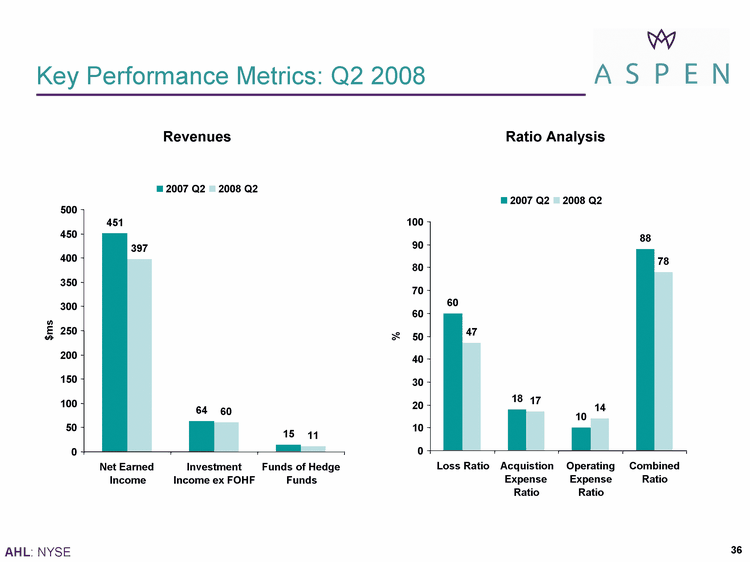
| Key Performance Metrics: Q2 2008 Revenues Ratio Analysis 60 18 10 88 47 17 14 78 0 10 20 30 40 50 60 70 80 90 100 Loss Ratio Acquistion Expense Ratio Operating Expense Ratio Combined Ratio % 2007 Q2 2008 Q2 451 64 15 397 60 11 0 50 100 150 200 250 300 350 400 450 500 Net Earned Income Investment Income ex FOHF Funds of Hedge Funds $ms 2007 Q2 2008 Q2 |
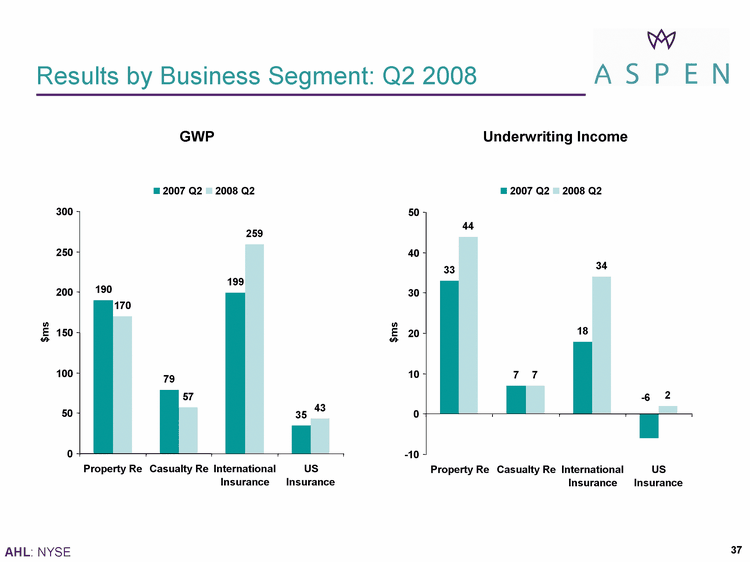
| Results by Business Segment: Q2 2008 GWP Underwriting Income 33 7 18 44 7 34 2 - -6 - -10 0 10 20 30 40 50 Property Re Casualty Re International Insurance US Insurance $ms 2007 Q2 2008 Q2 190 79 199 35 170 57 259 43 0 50 100 150 200 250 300 Property Re Casualty Re International Insurance US Insurance $ms 2007 Q2 2008 Q2 |
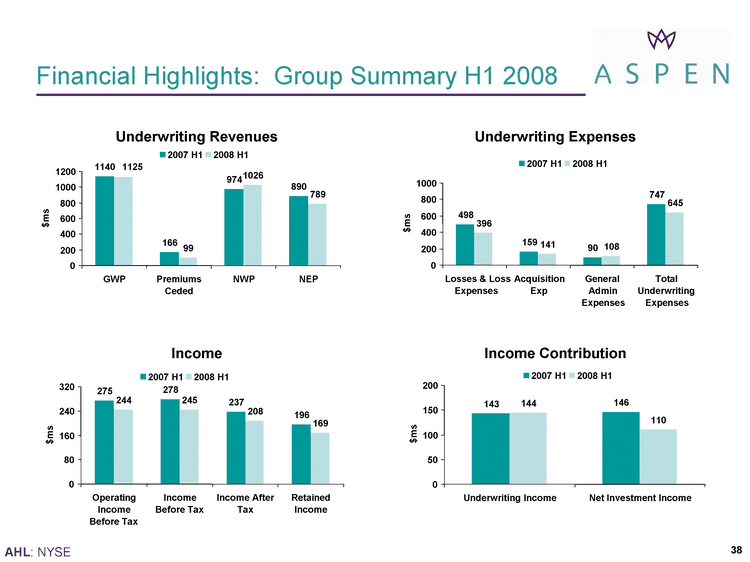
| Financial Highlights: Group Summary H1 2008 Underwriting Revenues Underwriting Expenses Income Income Contribution 275 278 237 196 244 245 208 169 0 80 160 240 320 Operating Income Before Tax Income Before Tax Income After Tax Retained Income $ms 2007 H1 2008 H1 143 146 144 110 0 50 100 150 200 Underwriting Income Net Investment Income $ms 2007 H1 2008 H1 498 159 90 747 396 141 108 645 0 200 400 600 800 1000 Losses & Loss Expenses Acquisition Exp General Admin Expenses Total Underwriting Expenses $ms 2007 H1 2008 H1 1140 166 974 890 99 1026 789 1125 0 200 400 600 800 1000 1200 GWP Premiums Ceded NWP NEP $ms 2007 H1 2008 H1 |
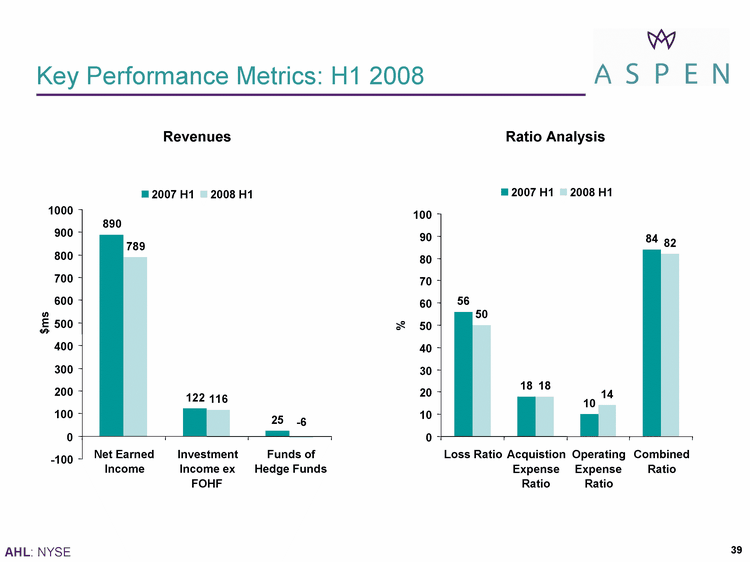
| Key Performance Metrics: H1 2008 Revenues Ratio Analysis 56 18 10 84 50 18 14 82 0 10 20 30 40 50 60 70 80 90 100 Loss Ratio Acquistion Expense Ratio Operating Expense Ratio Combined Ratio % 2007 H1 2008 H1 890 122 25 789 116 - -6 - -100 0 100 200 300 400 500 600 700 800 900 1000 Net Earned Income Investment Income ex FOHF Funds of Hedge Funds $ms 2007 H1 2008 H1 |
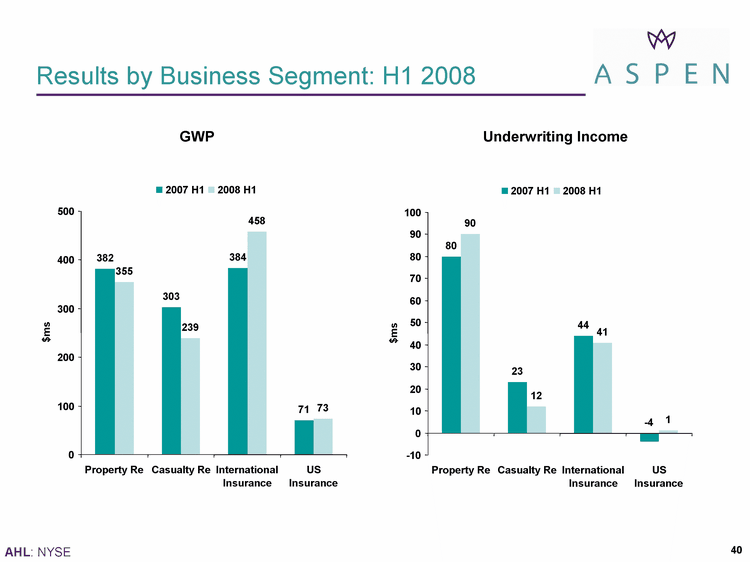
| Results by Business Segment: H1 2008 GWP Underwriting Income 80 23 44 90 12 41 1 - -4 - -10 0 10 20 30 40 50 60 70 80 90 100 Property Re Casualty Re International Insurance US Insurance $ms 2007 H1 2008 H1 382 303 384 71 355 239 458 73 0 100 200 300 400 500 Property Re Casualty Re International Insurance US Insurance $ms 2007 H1 2008 H1 |
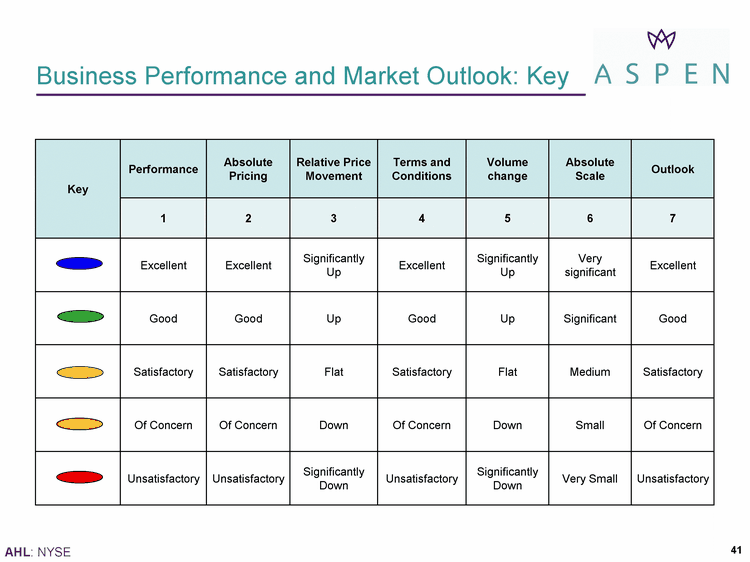
| Business Performance and Market Outlook: Key Key Performance Absolute Pricing Relative Price Movement Terms and Conditions Volume change Absolute Scale Outlook Key 1 2 3 4 5 6 7 Excellent Excellent Significantly Up Excellent Significantly Up Very significant Excellent Good Good Up Good Up Significant Good Satisfactory Satisfactory Flat Satisfactory Flat Medium Satisfactory Of Concern Of Concern Down Of Concern Down Small Of Concern Unsatisfactory Unsatisfactory Significantly Down Unsatisfactory Significantly Down Very Small Unsatisfactory |