Exhibit 99.1

| Aspen Insurance Holdings Limited Chris O'Kane Chief Executive Officer February 2009 V0.16 |
| Safe Harbor Disclosure This slide presentation is for information purposes only. It should be read in conjunction with our financial supplement posted on our website on the Investor Relations page and with other documents filed or to be filed shortly by Aspen Insurance Holdings Limited (the "Company" or "Aspen") with the U.S. Securities and Exchange Commission. Non-GAAP Financial Measures In presenting Aspen's results, management has included and discussed certain "non-GAAP financial measures", as such term is defined in Regulation G. Management believes that these non-GAAP measures, which may be defined differently by other companies, better explain Aspen's results of operations in a manner that allows for a more complete understanding of the underlying trends in Aspen's business. However, these measures should not be viewed as a substitute for those determined in accordance with GAAP. The reconciliation of such non-GAAP financial measures to their respective most directly comparable GAAP financial measures in accordance with Regulation G is included herein or in the financial supplement, as applicable, which can be obtained from the Investor Relations section of Aspen's website at www.aspen.bm. Application of the Safe Harbor of the Private Securities Litigation Reform Act of 1995: This presentation contains, and Aspen's earnings conference call may contain, written or oral "forward-looking statements" within the meaning of the U.S. federal securities laws. These statements are made pursuant to the safe harbor provisions of the Private Securities Litigation Reform Act of 1995. Forward-looking statements include all statements that do not relate solely to historical or current facts, and can be identified by the use of words such as "expect," "intend," "plan," "believe," "project," "anticipate," "seek," "aim," "will," "estimate," "may," "continue," and similar expressions of a future or forward-looking nature. All forward-looking statements address matters that involve risks and uncertainties. Accordingly, there are or will be important factors that could cause actual results to differ materially from those indicated in these statements. Aspen believes these factors include, but are not limited to: the continuing and uncertain impact of the current depressed credit environment, the banking crises and economic recessions in many of the countries in which we operate and of the measures being taken by governments to counter these issues; the risk of a material decline in the value or liquidity of all or parts of our investment portfolio; changes in insurance and reinsurance market conditions; changes in our ability to exercise capital management initiatives or to arrange banking facilities as a result of prevailing market changes or changes in our financial position; our ability to execute our business plan to enter new markets, introduce new products and develop new distribution channels, including their integration into our existing operations; changes in the total industry losses, or our share of total industry losses, resulting from past events such as Hurricanes Ike and Gustav and, with respect to such events, our reliance on loss reports received from cedants and loss adjustors, our reliance on industry loss estimates and those generated by modeling techniques, changes in rulings on flood damage or other exclusions as a result of prevailing lawsuits and case law, any changes in our reinsurers' credit quality and the amount and timing of reinsurance recoverables; the impact of acts of terrorism and related legislation and acts of war; the possibility of greater frequency or severity of claims and loss activity, including as a result of natural or man-made catastrophic events, than our underwriting, reserving, reinsurance purchasing or investment practices have anticipated; evolving interpretive issues with respect to coverage after major loss events; the level of inflation in repair costs due to limited availability of labor and materials after catastrophes; the effectiveness of our loss limitation methods; changes in the availability, cost or quality of reinsurance or retrocessional coverage; the reliability of, and changes in assumptions to, catastrophe pricing, accumulation and estimated loss models; loss of key personnel; a decline in our operating subsidiaries' ratings with Standard & Poor's ("S&P"), A.M. Best or Moody's Investors Service ("Moody's"); changes in general economic conditions, including inflation, foreign currency exchange rates, interest rates and other factors that could affect our investment portfolio; increased competition on the basis of pricing, capacity, coverage terms or other factors and the related demand and supply dynamics as contracts come up for renewal; decreased demand for our insurance or reinsurance products and cyclical changes in the insurance and reinsurance sectors; changes in government regulations or tax laws in jurisdictions where we conduct business; and Aspen Holdings or Aspen Bermuda becoming subject to income taxes in the United States or the United Kingdom. In addition, any estimates relating to loss events involve the exercise of considerable judgment and reflect a combination of ground-up evaluations, information available to date from brokers and cedants, market intelligence, initial tentative loss reports and other sources. Due to the complexity of factors contributing to the losses and the preliminary nature of the information used to prepare these estimates, there can be no assurance that Aspen's ultimate losses will remain within the stated amount. For a more detailed description of these uncertainties and other factors, please see the "Risk Factors" section in Aspen's Annual Reports on Form 10-K as filed, and to be filed, with the U.S. Securities and Exchange Commission on February 29, 2008 and in early 2009. Aspen undertakes no obligation to publicly update or revise any forward-looking statements, whether as a result of new information, future events or otherwise. Readers are cautioned not to place undue reliance on these forward-looking statements, which speak only as of the dates on which they are made. |
| Contents Introduction and Strategy 2008 Results Highlights 2008 Hurricanes Market Conditions / January 1 Renewals Liquidity and Capital Position Investment Strategy and Performance Appendix |
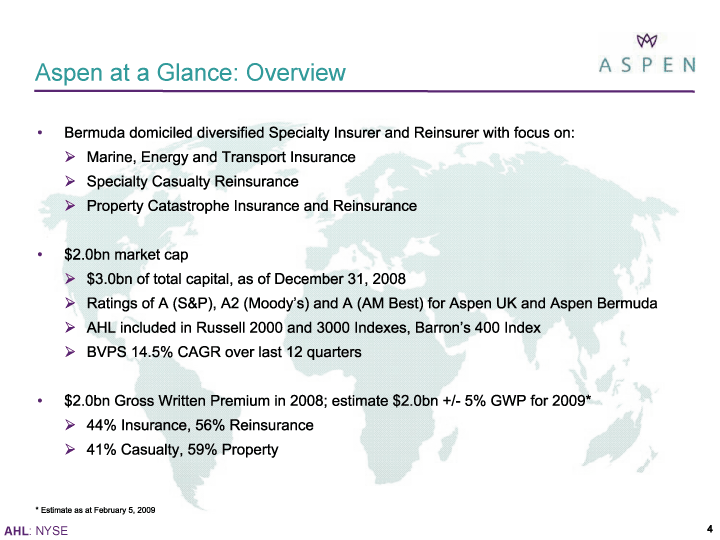
| Aspen at a Glance: Overview Bermuda domiciled diversified Specialty Insurer and Reinsurer with focus on: ? Marine, Energy and Transport Insurance ? Specialty Casualty Reinsurance ? Property Catastrophe Insurance and Reinsurance $2.0bn market cap ? $3.0bn of total capital, as of December 31, 2008 ? Ratings of A (S&P), A2 (Moody's) and A (AM Best) for Aspen UK and Aspen Bermuda ? AHL included in Russell 2000 and 3000 Indexes, Barron's 400 Index ? BVPS 14.5% CAGR over last 12 quarters $2.0bn Gross Written Premium in 2008; estimate $2.0bn +/- 5% GWP for 2009* ? 44% Insurance, 56% Reinsurance ? 41% Casualty, 59% Property * Estimate as at February 5, 2009 |
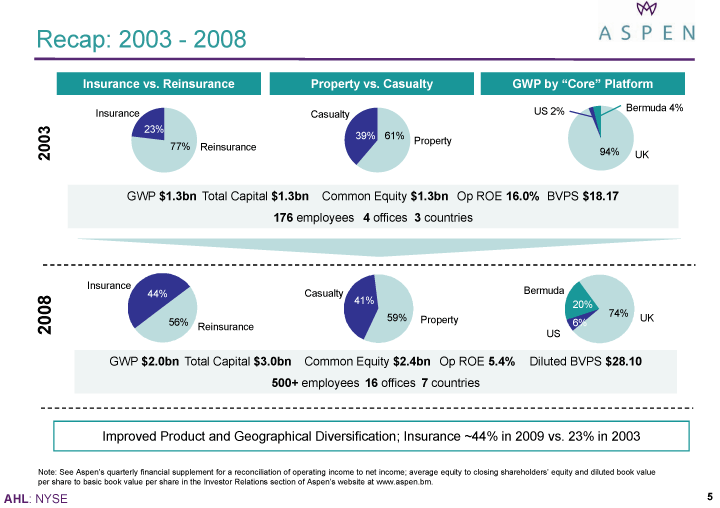
| Recap: 2003 - 2008 Slice 2 0 6 20 0 74 25 Insurance Reinsurance 40 5 44% 56% 67 30 Property Casualty UK Bermuda 4% 2008 Insurance vs. Reinsurance Property vs. Casualty GWP by "Core" Platform 16 2003 67 US 2% 94% 39% 61% 23% 77% 41% 59% GWP $2.0bn Total Capital $3.0bn Common Equity $2.4bn Op ROE 5.4% Diluted BVPS $28.10 500+ employees 16 offices 7 countries GWP $1.3bn Total Capital $1.3bn Common Equity $1.3bn Op ROE 16.0% BVPS $18.17 176 employees 4 offices 3 countries 74% 6% 20% Improved Product and Geographical Diversification; Insurance ~44% in 2009 vs. 23% in 2003 Note: See Aspen's quarterly financial supplement for a reconciliation of operating income to net income; average equity to closing shareholders' equity and diluted book value per share to basic book value per share in the Investor Relations section of Aspen's website at www.aspen.bm. Insurance Reinsurance Property Casualty US Bermuda UK |
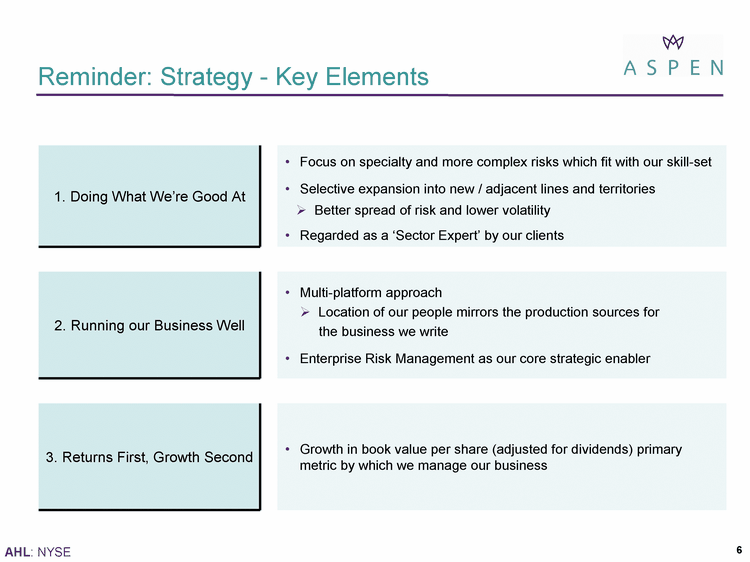
| Reminder: Strategy - Key Elements 1. Doing What We're Good At Focus on specialty and more complex risks which fit with our skill-set 1. Doing What We're Good At Selective expansion into new / adjacent lines and territories ? Better spread of risk and lower volatility Regarded as a 'Sector Expert' by our clients 2. Running our Business Well Multi-platform approach ? Location of our people mirrors the production sources for the business we write Enterprise Risk Management as our core strategic enabler 3. Returns First, Growth Second Growth in book value per share (adjusted for dividends) primary metric by which we manage our business |
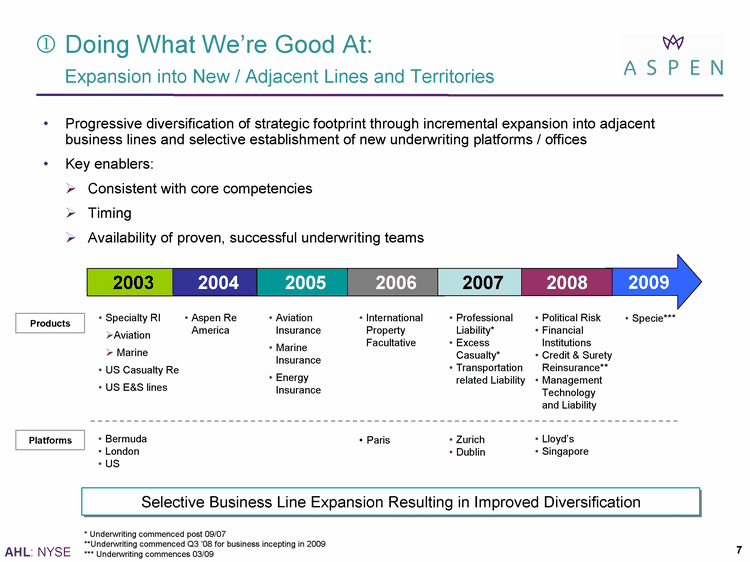
| Progressive diversification of strategic footprint through incremental expansion into adjacent business lines and selective establishment of new underwriting platforms / offices Key enablers: ? Consistent with core competencies ? Timing ? Availability of proven, successful underwriting teams Selective Business Line Expansion Resulting in Improved Diversification 2003 2004 2005 2009 Specialty RI ?Aviation ? Marine US Casualty Re US E&S lines Aspen Re America Aviation Insurance Marine Insurance Energy Insurance International Property Facultative * Underwriting commenced post 09/07 **Underwriting commenced Q3 '08 for business incepting in 2009 *** Underwriting commences 03/09 2006 Professional Liability* Excess Casualty* Transportation related Liability 2007 Political Risk Financial Institutions Credit & Surety Reinsurance** Management Technology and Liability Products Platforms Bermuda London US Zurich Dublin Lloyd's Singapore Doing What We're Good At: Expansion into New / Adjacent Lines and Territories Paris 2008 Specie*** |
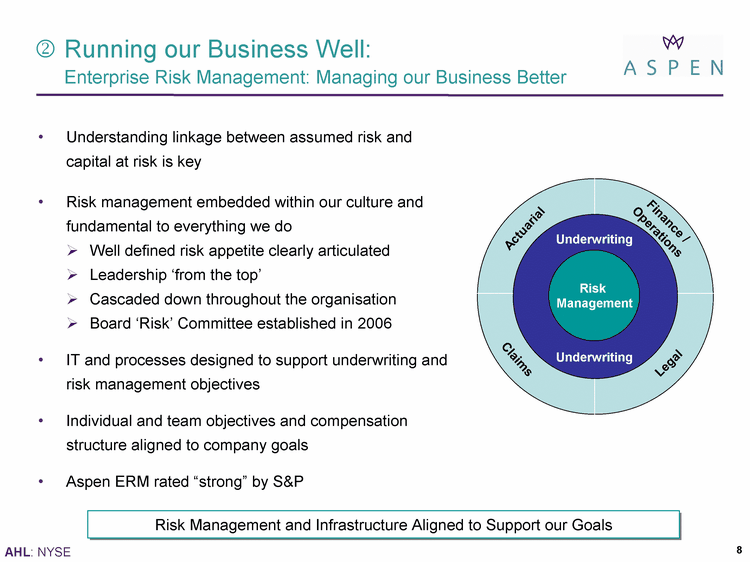
| Running our Business Well: Enterprise Risk Management: Managing our Business Better Understanding linkage between assumed risk and capital at risk is key Risk management embedded within our culture and fundamental to everything we do ? Well defined risk appetite clearly articulated ? Leadership 'from the top' ? Cascaded down throughout the organisation ? Board 'Risk' Committee established in 2006 IT and processes designed to support underwriting and risk management objectives Individual and team objectives and compensation structure aligned to company goals Aspen ERM rated "strong" by S&P Risk Management Underwriting Underwriting Actuarial Claims Legal Finance / Operations Risk Management and Infrastructure Aligned to Support our Goals |
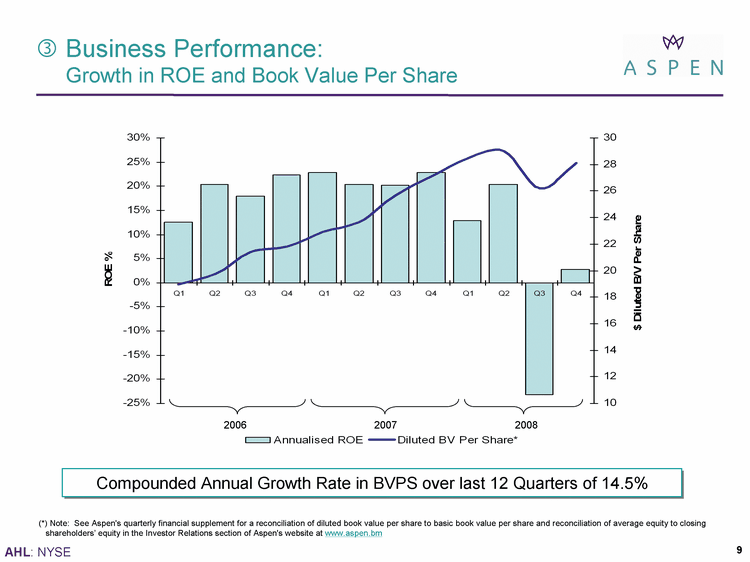
| Q1 Q2 Q3 Q4 Q1 Q2 Q3 Q4 Q1 Q2 Q3 Q4 Annualised ROE 0.125 0.204 0.18 0.224 0.229 0.204 0.202 0.228 0.128 0.204 -0.232 0.028 Diluted BV Per Share* 18.95 19.76 21.41 21.83 22.93 23.63 25.68 27.08 28.48 28.99 26.21 28.1 Compounded Annual Growth Rate in BVPS over last 12 Quarters of 14.5% (*) Note: See Aspen's quarterly financial supplement for a reconciliation of diluted book value per share to basic book value per share and reconciliation of average equity to closing shareholders' equity in the Investor Relations section of Aspen's website at www.aspen.bm 2006 2007 2008 ? Business Performance: Growth in ROE and Book Value Per Share |
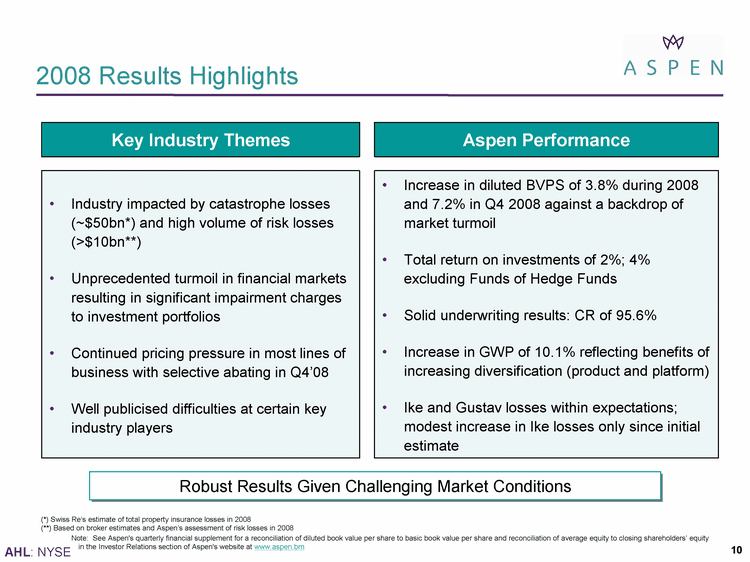
| 2008 Results Highlights Key Industry Themes Aspen Performance Industry impacted by catastrophe losses (~$50bn*) and high volume of risk losses (>$10bn**) Unprecedented turmoil in financial markets resulting in significant impairment charges to investment portfolios Continued pricing pressure in most lines of business with selective abating in Q4'08 Well publicised difficulties at certain key industry players Increase in diluted BVPS of 3.8% during 2008 and 7.2% in Q4 2008 against a backdrop of market turmoil Total return on investments of 2%; 4% excluding Funds of Hedge Funds Solid underwriting results: CR of 95.6% Increase in GWP of 10.1% reflecting benefits of increasing diversification (product and platform) Ike and Gustav losses within expectations; modest increase in Ike losses only since initial estimate Robust Results Given Challenging Market Conditions (*) Swiss Re's estimate of total property insurance losses in 2008 (**) Based on broker estimates and Aspen's assessment of risk losses in 2008 Note: See Aspen's quarterly financial supplement for a reconciliation of diluted book value per share to basic book value per share and reconciliation of average equity to closing shareholders' equity in the Investor Relations section of Aspen's website at www.aspen.bm |
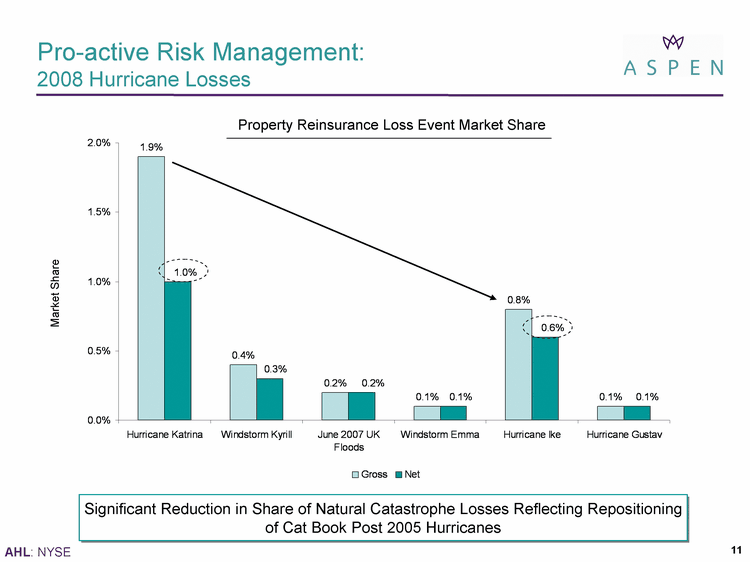
| Pro-active Risk Management: 2008 Hurricane Losses 2008 Hurricane Losses 2008 Hurricane Losses Property Reinsurance Loss Event Market Share Market Share Significant Reduction in Share of Natural Catastrophe Losses Reflecting Repositioning of Cat Book Post 2005 Hurricanes |
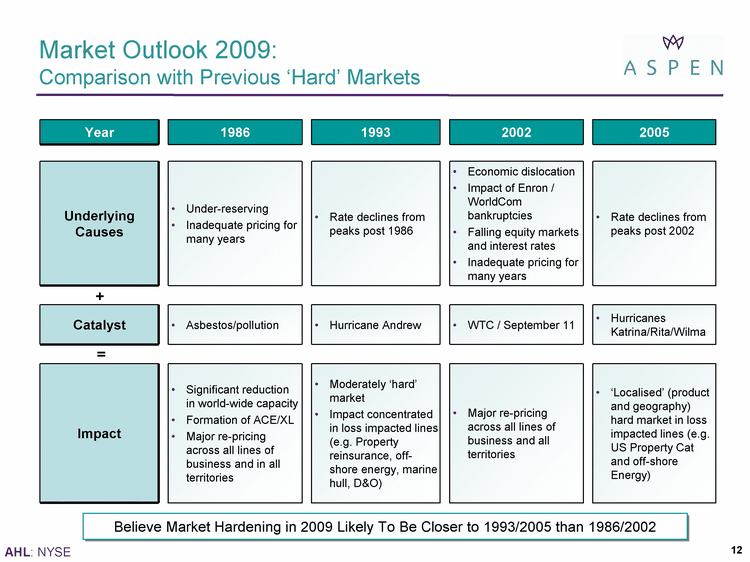
| Market Outlook 2009: Comparison with Previous 'Hard' Markets Year 1986 1993 2002 2005 Underlying Causes Under-reserving Inadequate pricing for many years Rate declines from peaks post 1986 Economic dislocation Impact of Enron / WorldCom bankruptcies Falling equity markets and interest rates Inadequate pricing for many years Rate declines from peaks post 2002 Catalyst Asbestos/pollution Hurricane Andrew WTC / September 11 Hurricanes Katrina/Rita/Wilma Impact Significant reduction in world-wide capacity Formation of ACE/XL Major re-pricing across all lines of business and in all territories Moderately 'hard' market Impact concentrated in loss impacted lines (e.g. Property reinsurance, off-shore energy, marine hull, D&O) Major re-pricing across all lines of business and all territories 'Localised' (product and geography) hard market in loss impacted lines (e.g. US Property Cat and off-shore Energy) + = Believe Market Hardening in 2009 Likely To Be Closer to 1993/2005 than 1986/2002 |
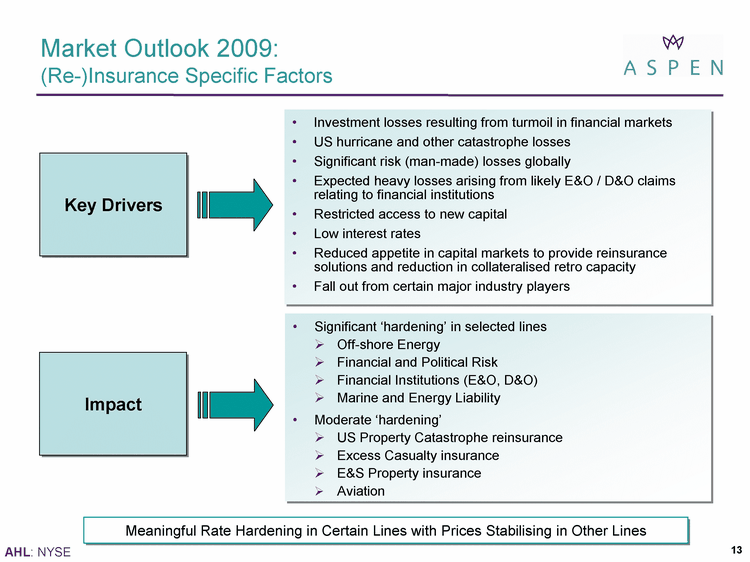
| Market Outlook 2009: (Re-)Insurance Specific Factors Key Drivers Impact Investment losses resulting from turmoil in financial markets US hurricane and other catastrophe losses Significant risk (man-made) losses globally Expected heavy losses arising from likely E&O / D&O claims relating to financial institutions Restricted access to new capital Low interest rates Reduced appetite in capital markets to provide reinsurance solutions and reduction in collateralised retro capacity Fall out from certain major industry players Significant 'hardening' in selected lines ? Off-shore Energy ? Financial and Political Risk ? Financial Institutions (E&O, D&O) ? Marine and Energy Liability Moderate 'hardening' ? US Property Catastrophe reinsurance ? Excess Casualty insurance ? E&S Property insurance ? Aviation Meaningful Rate Hardening in Certain Lines with Prices Stabilising in Other Lines |
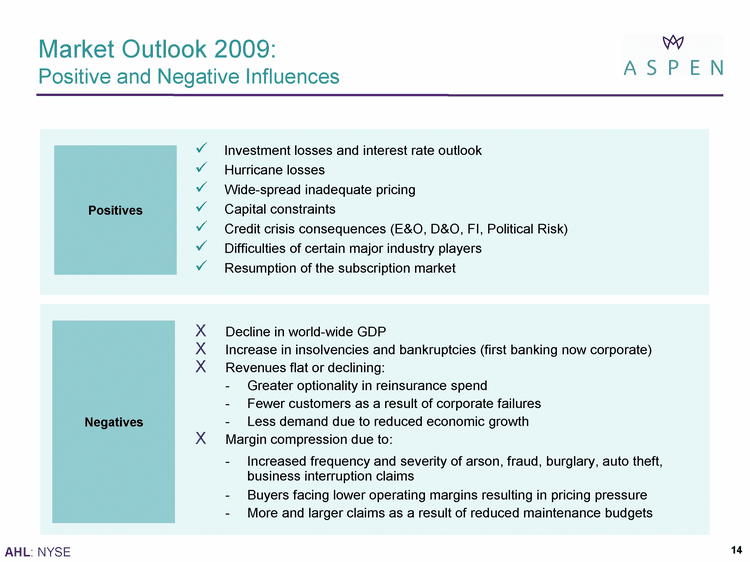
| Market Outlook 2009: Positive and Negative Influences Decline in world-wide GDP Increase in insolvencies and bankruptcies (first banking now corporate) Revenues flat or declining: - Greater optionality in reinsurance spend - Fewer customers as a result of corporate failures - Less demand due to reduced economic growth Margin compression due to: - Increased frequency and severity of arson, fraud, burglary, auto theft, business interruption claims - Buyers facing lower operating margins resulting in pricing pressure - More and larger claims as a result of reduced maintenance budgets Investment losses and interest rate outlook Hurricane losses Wide-spread inadequate pricing Capital constraints Credit crisis consequences (E&O, D&O, FI, Political Risk) Difficulties of certain major industry players Resumption of the subscription market Positives Negatives |
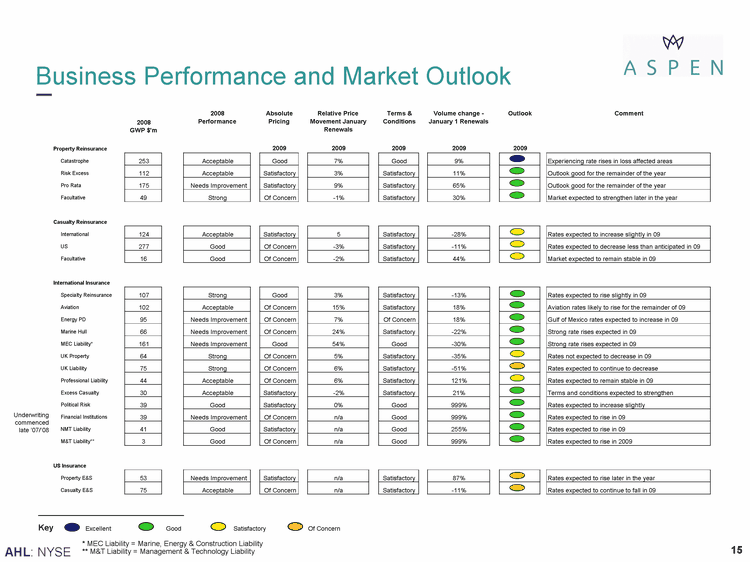
| Business Performance and Market Outlook Excellent Good Satisfactory Of Concern Key Underwriting commenced late '07/'08 * MEC Liability = Marine, Energy & Construction Liability ** M&T Liability = Management & Technology Liability 2008 GWP $'m 2008 Performance Absolute Pricing Relative Price Movement January Renewals Terms & Conditions Volume change - January 1 Renewals Outlook Comment Property Reinsurance 2009 2009 2009 2009 2009 Catastrophe 253 Acceptable Good 7% Good 9% Experiencing rate rises in loss affected areas Risk Excess 112 Acceptable Satisfactory 3% Satisfactory 11% Outlook good for the remainder of the year Pro Rata 175 Needs Improvement Satisfactory 9% Satisfactory 65% Outlook good for the remainder of the year Facultative 49 Strong Of Concern - -1% Satisfactory 30% Market expected to strengthen later in the year International 124 Acceptable Satisfactory 5 Satisfactory - -28% Rates expected to increase slightly in 09 US 277 Good Of Concern - -3% Satisfactory - -11% Rates expected to decrease less than anticipated in 09 Facultative 16 Good Of Concern - -2% Satisfactory 44% Market expected to remain stable in 09 International Insurance Specialty Reinsurance 107 Strong Good 3% Satisfactory - -13% Rates expected to rise slightly in 09 Aviation 102 Acceptable Of Concern 15% Satisfactory 18% Aviation rates likely to rise for the remainder of 09 Energy PD 95 Needs Improvement Of Concern 7% Of Concern 18% Gulf of Mexico rates expected to increase in 09 Marine Hull 66 Needs Improvement Of Concern 24% Satisfactory - -22% Strong rate rises expected in 09 MEC Liability* 161 Needs Improvement Good 54% Good - -30% Strong rate rises expected in 09 UK Property 64 Strong Of Concern 5% Satisfactory - -35% Rates not expected to decrease in 09 UK Liability 75 Strong Of Concern 6% Satisfactory - -51% Rates expected to continue to decrease Professional Liability 44 Acceptable Of Concern 6% Satisfactory 121% Rates expected to remain stable in 09 Excess Casualty 30 Acceptable Satisfactory - -2% Satisfactory 21% Terms and conditions expected to strengthen Political Risk 39 Good Satisfactory 0% Good 999% Rates expected to increase slightly Financial Institutions 39 Needs Improvement Of Concern n/a Good 999% Rates expected to rise in 09 NMT Liability 41 Good Satisfactory n/a Good 255% Rates expected to rise in 09 M&T Liability** 3 Good Of Concern n/a Good 999% Rates expected to rise in 2009 Property E&S 53 Needs Improvement Satisfactory n/a Satisfactory 87% Rates expected to rise later in the year Casualty E&S 75 Acceptable Of Concern n/a Satisfactory - -11% Rates expected to continue to fall in 09 US Insurance Casualty Reinsurance |
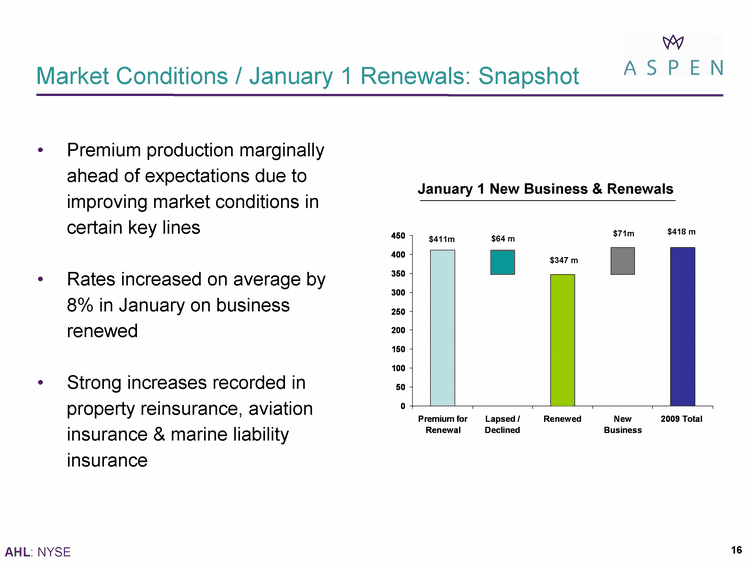
| Market Conditions / January 1 Renewals: Snapshot Premium for Renewal Lapsed / Declined Renewed New Business 2009 Total 411.31 347.1 347.093 0 64.226 347.093 70.857 417.95 $64 m $347 m $71m $418 m January New Business & Renewals $411m Premium production marginally ahead of expectations due to improving market conditions in certain key lines Rates increased on average by 8% in January on business renewed Strong increases recorded in Property reinsurance, Aviation insurance & Marine liability insurance |
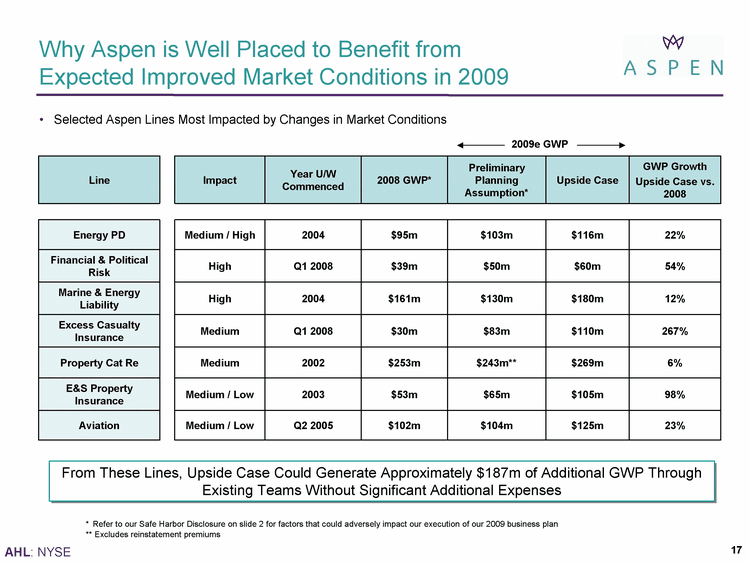
| Why Aspen is Well Placed to Benefit from Expected Improved Market Conditions in 2009 Line Impact Year U/W Commenced 2008 GWP* Preliminary Planning Assumption* Upside Case GWP Growth Upside Case vs. 2008 Energy PD Medium / High 2004 $95m $103m $116m 22% Financial & Political Risk High Q1 2008 $39m $50m $60m 54% Marine & Energy Liability High 2004 $161m $130m $180m 12% Excess Casualty Insurance Medium Q1 2008 $30m $83m $110m 267% Property Cat Re Medium 2002 $253m $243m** $269m 6% E&S Property Insurance Medium / Low 2003 $53m $65m $105m 98% Aviation Medium / Low Q2 2005 $102m $104m $125m 23% From These Lines, Upside Case Could Generate Approximately $187m of Additional GWP Through Existing Teams Without Significant Additional Expenses 2009e GWP * Refer to our Safe Harbor Disclosure on slide 2 for factors that could adversely impact our execution of our 2009 business plan ** Excludes reinstatement premiums Selected Aspen Lines Most Impacted by Changes in Market Conditions |
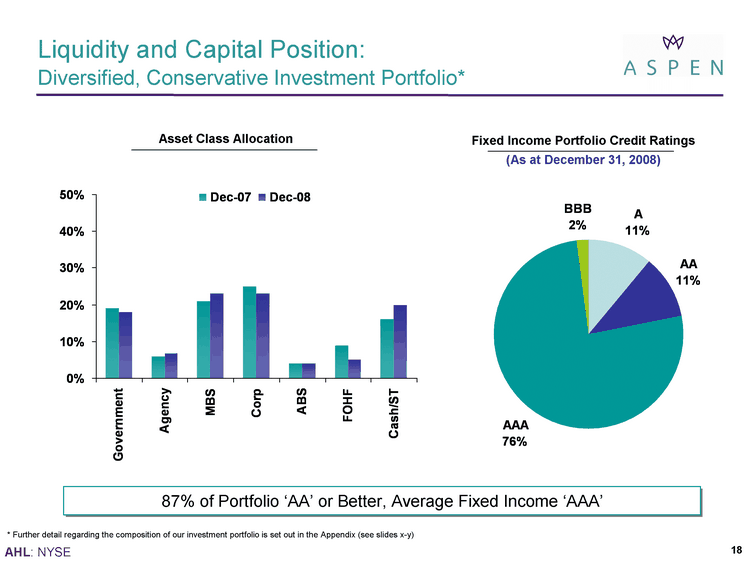
| Liquidity and Capital Position: Diversified, Conservative Investment Portfolio* 87% of Portfolio 'AA' or Better, Average Fixed Income 'AAA' Asset Class Allocation Fixed Income Portfolio Credit Ratings (As at December 31, 2008) Government Agency MBS Corp ABS FOHF Cash/ST 12/1/2007 0.19 0.06 0.21 0.25 0.04 0.09 0.16 12/31/2008 0.18 0.068 0.23 0.23 0.04 0.05 0.2 A AA AAA BBB East 0.11 0.11 0.76 0.02 * Further detail regarding the composition of our investment portfolio is set out in the Appendix (see slides x-y) |
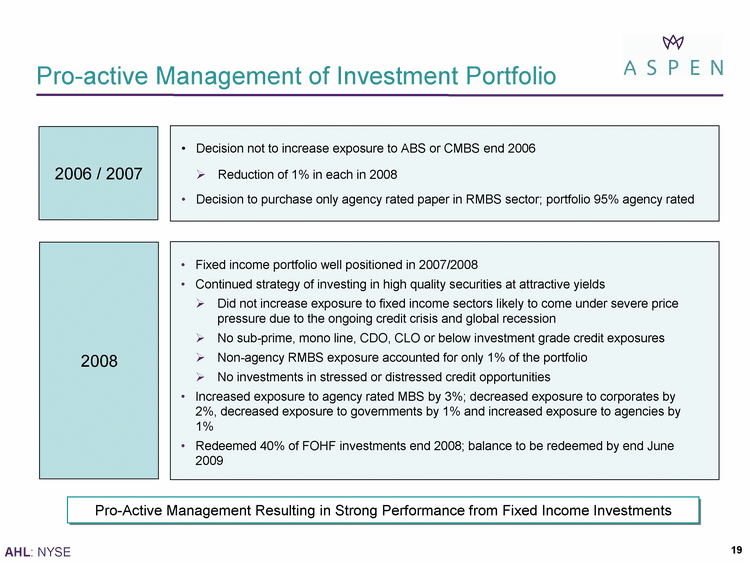
| Pro-active Management of Investment Portfolio Decision not to increase exposure to ABS or CMBS end 2006 ? Reduction of 1% in each in 2008 Decision to purchase only agency rated paper in RMBS sector; portfolio 95% agency rated Fixed income portfolio well positioned in 2007/2008 Continued strategy of investing in high quality securities at attractive yields ? Did not increase exposure to fixed income sectors likely to come under severe price pressure due to the ongoing credit crisis and global recession ? No sub-prime, mono line, CDO, CLO or below investment grade credit exposures ? Non-agency RMBS exposure accounted for only 1% of the portfolio ? No investments in stressed or distressed credit opportunities Increased exposure to agency rated MBS by 3%; decreased exposure to corporates by 2%, decreased exposure to governments by 1% and increased exposure to agencies by 1% Redeemed 40% of FOHF investments end 2008; balance to be redeemed by end June 2009 2006 / 2007 2008 Pro-Active Management Resulting in Strong Performance from Fixed Income Investments |
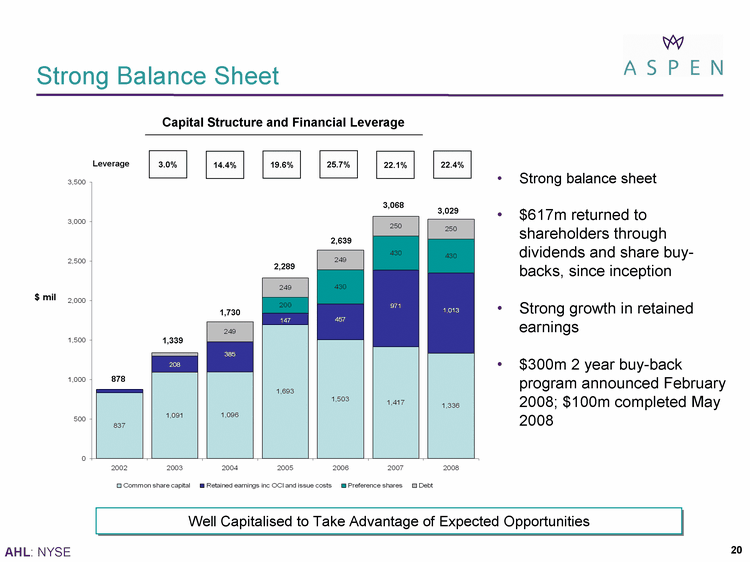
| Strong Balance Sheet Capital Structure and Financial Leverage $617m returned to shareholders through dividends and share buy- backs, since inception Strong growth in retained earnings Strong balance sheet with potential for further leverage $300m 2 year buy-back program announced February 2008; $100m completed May 2008 3.0% 14.4% 19.6% 25.7% 22.1% 22.4% Leverage Well Capitalised to Take Advantage of Expected Opportunities 878 1,339 1,730 2,289 2,639 3,068 3,029 |
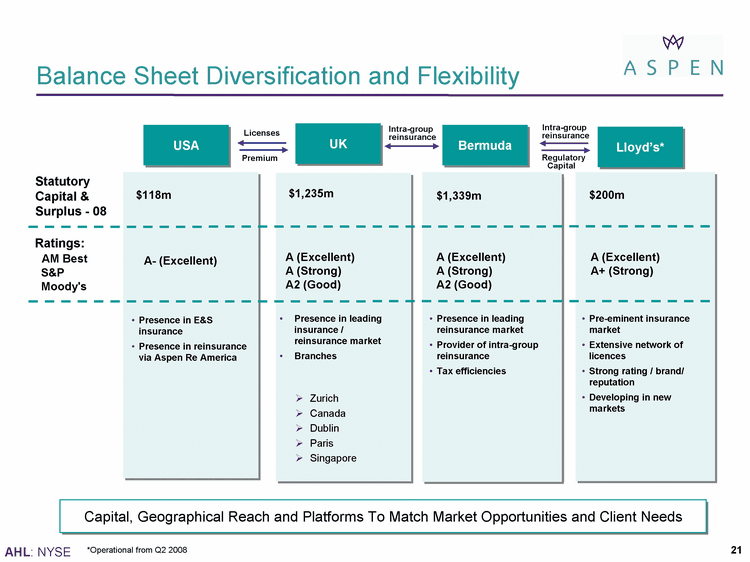
| USA Bermuda Intra-group reinsurance Licenses Regulatory Capital Balance Sheet Diversification and Flexibility Capital, Geographical Reach and Platforms To Match Market Opportunities and Client Needs *Operational from Q2 2008 Statutory Capital & Surplus - 08 $1,339m Presence in leading reinsurance market Provider of intra-group reinsurance Tax efficiencies Ratings: AM Best S&P Moody's UK $1,235m A (Excellent) A (Strong) A2 (Good) A (Excellent) A (Strong) A2 (Good) Lloyd's* $200m Pre-eminent insurance market Extensive network of licences Strong rating / brand/ reputation Developing in new markets A (Excellent) A+ (Strong) Intra-group reinsurance Premium $118m Presence in E&S insurance Presence in reinsurance via Aspen Re America Presence in leading insurance / reinsurance market Branches Zurich Canada Dublin Paris Singapore A- (Excellent) |
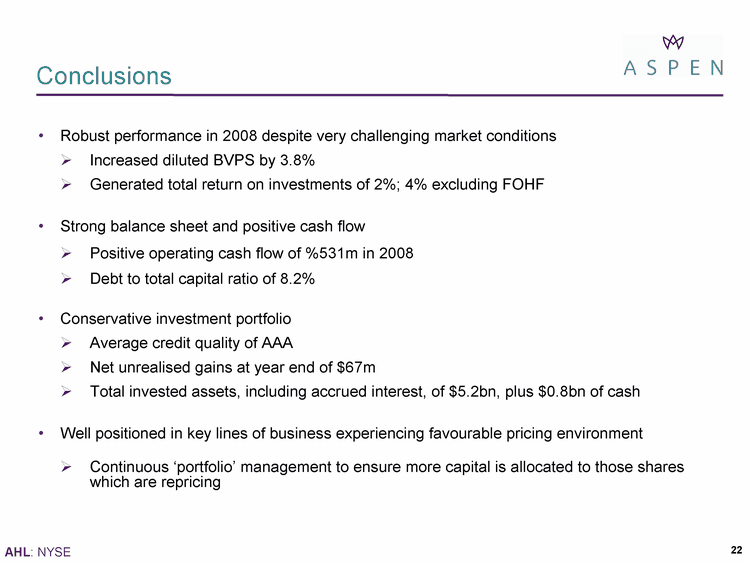
| Conclusions Robust performance in 2008 despite very challenging market conditions ? Increased diluted BVPS by 3.8% ? Generated total return on investments of 2%; 4% excluding FOHF Strong balance sheet and positive cash flow ? Positive operating cash flow of %531m in 2008 ? Debt to total capital ratio of 8.2% Conservative investment portfolio ? Average credit quality of AAA ? Net unrealised gains at year end of $67m ? Total invested assets, including accrued interest, of $5.2bn, plus $0.8bn of cash Well positioned in key lines of business experiencing favourable pricing environment ? Continuous 'portfolio' management to ensure more capital is allocated to those shares which are repricing |
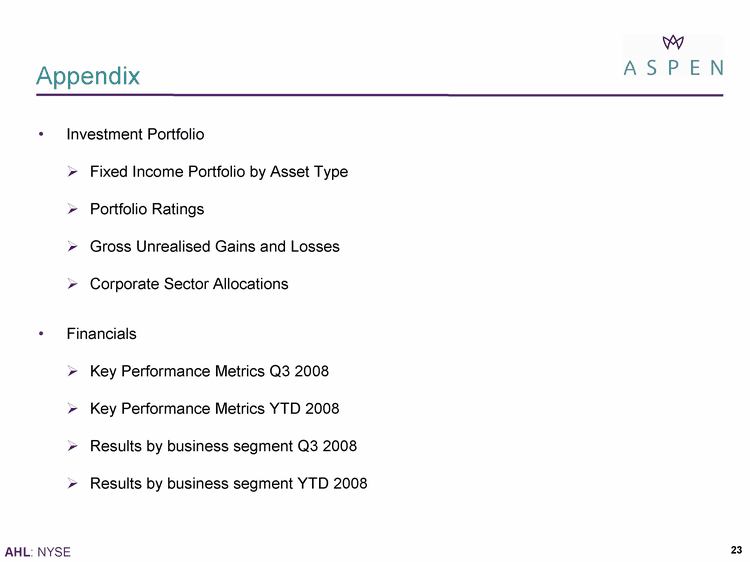
| Appendix Investment Portfolio ? Fixed Income Portfolio by Asset Type ? Portfolio Ratings ? Gross Unrealised Gains and Losses ? Corporate Sector Allocations Financials ? Key Performance Metrics Q3 2008 ? Key Performance Metrics YTD 2008 ? Results by business segment Q3 2008 ? Results by business segment YTD 2008 |
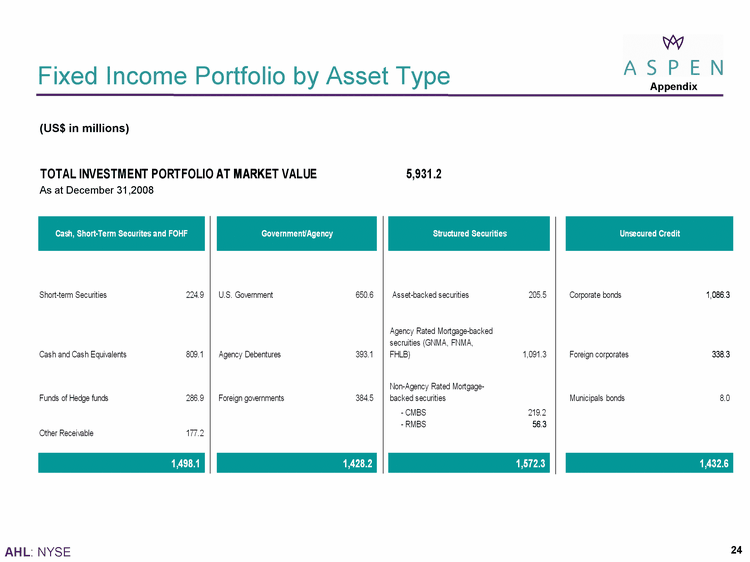
| Fixed Income Portfolio by Asset Type (US$ in millions) Appendix As at December 31,2008 |
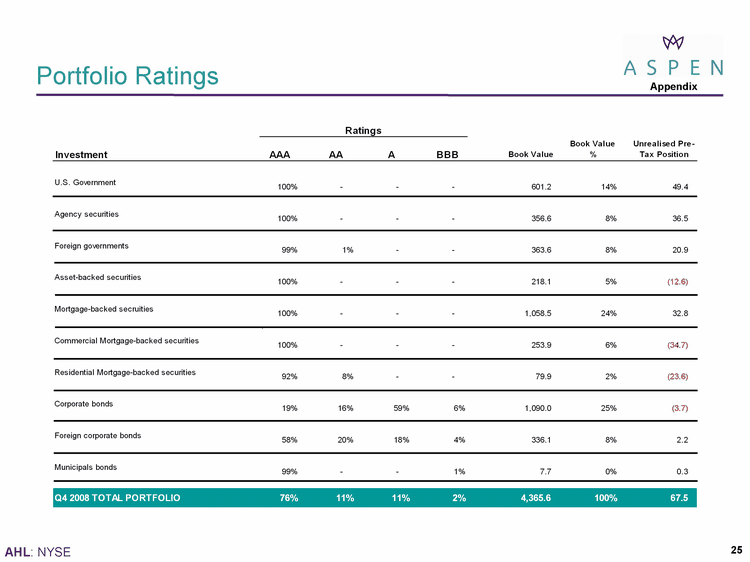
| Portfolio Ratings Appendix |
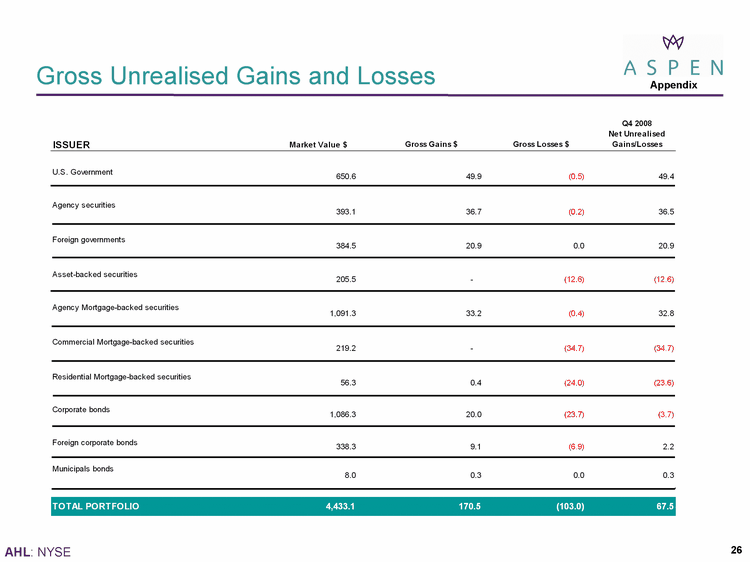
| Gross Unrealised Gains and Losses Appendix |
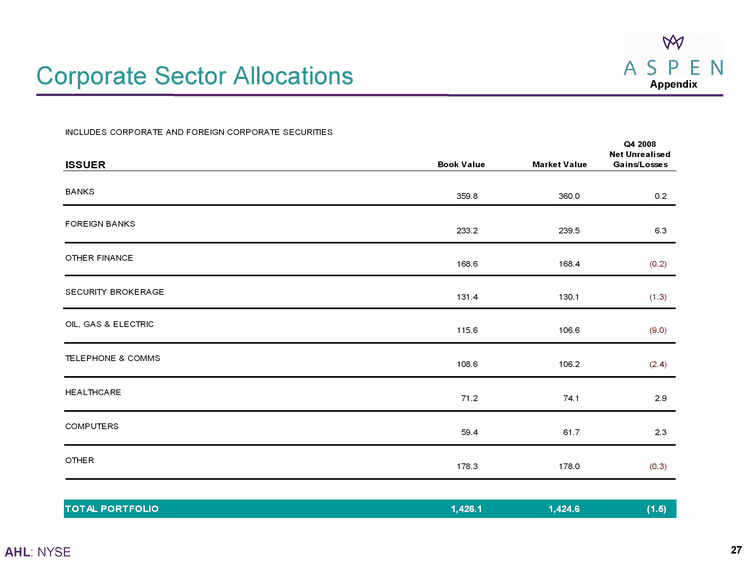
| Corporate Sector Allocations Appendix |
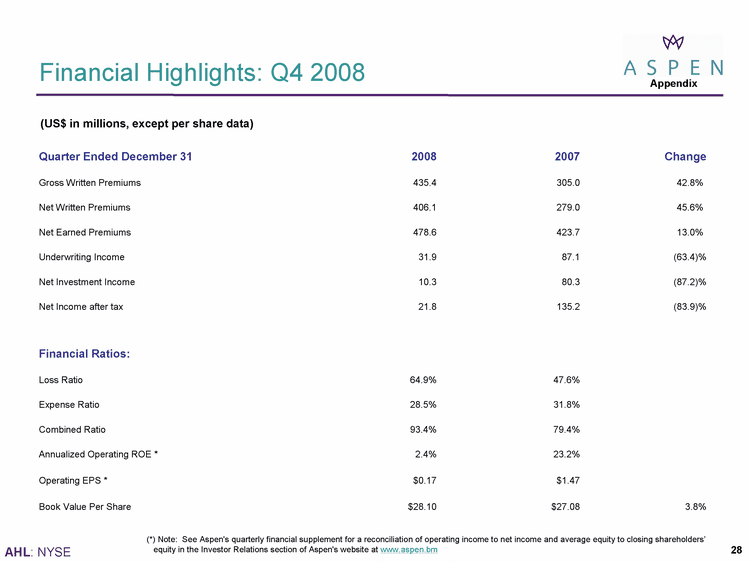
| Financial Highlights: Q4 2008 Quarter Ended December 31 2008 2007 Change Gross Written Premiums 435.4 305.0 42.8%) Net Written Premiums 406.1 279.0 45.6%) Net Earned Premiums 478.6 423.7 13.0%) Underwriting Income 31.9 87.1 (63.4)% Net Investment Income 10.3 80.3 (87.2)% Net Income after tax 21.8 135.2 (83.9)% Financial Ratios: Loss Ratio 64.9% 47.6% Expense Ratio 28.5% 31.8% Combined Ratio 93.4% 79.4% Annualized Operating ROE * 2.4% 23.2% Operating EPS * $0.17 $1.47 Book Value Per Share $28.10 $27.08 3.8% (US$ in millions, except per share data) (*) Note: See Aspen's quarterly financial supplement for a reconciliation of operating income to net income and average equity to closing shareholders' equity in the Investor Relations section of Aspen's website at www.aspen.bm Appendix |
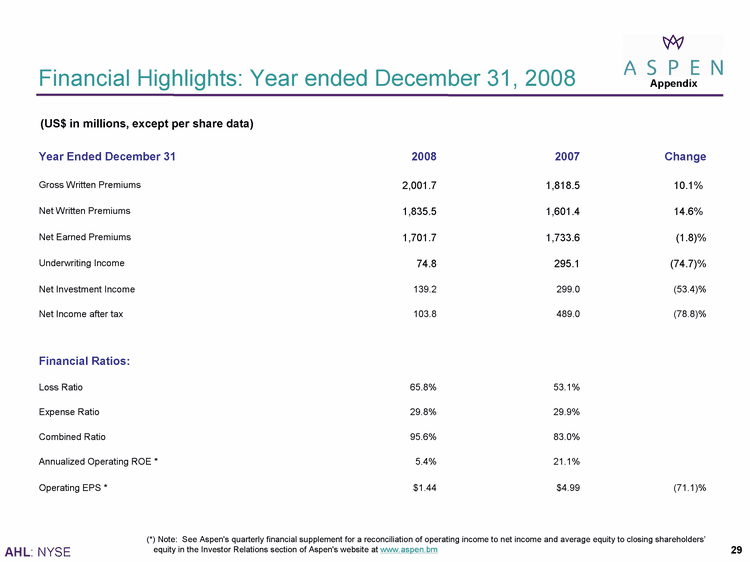
| Financial Highlights: Year ended December 31, 2008 Year Ended December 31 2008 2007 Change Gross Written Premiums 2,001.7 1,818.5 10.1%) Net Written Premiums 1,835.5 1,601.4 14.6%) Net Earned Premiums 1,701.7 1,733.6 (1.8)% Underwriting Income 74.8 295.1 (74.7)% Net Investment Income 139.2 299.0 (53.4)% Net Income after tax 103.8 489.0 (78.8)% Financial Ratios: Loss Ratio 65.8% 53.1% Expense Ratio 29.8% 29.9% Combined Ratio 95.6% 83.0% Annualized Operating ROE * 5.4% 21.1% Operating EPS * $1.44 $4.99 (71.1)% (US$ in millions, except per share data) (*) Note: See Aspen's quarterly financial supplement for a reconciliation of operating income to net income and average equity to closing shareholders' equity in the Investor Relations section of Aspen's website at www.aspen.bm Appendix |
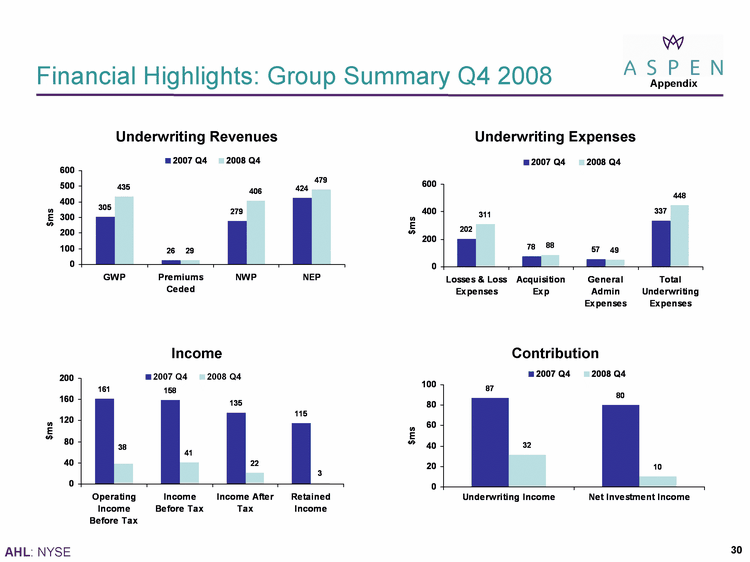
| Financial Highlights: Group Summary Q4 2008 Underwriting Revenues GWP Premiums Ceded NWP NEP 2007 Q4 305 26 279 423.7 2008 Q4 435.4 29.1 406.3 478.8 North 45.9 46.9 45 43.9 Underwriting Expenses Losses & Loss Expenses Acquisition Exp General Admin Expenses Total Underwriting Expenses 2007 Q4 201.7 78.4 56.5 336.6 2008 Q4 310.7 87.5 48.8 448 North 45.9 46.9 45 43.9 Income Underwriting Income Net Investment Income 2007 Q4 87.1 80.3 2008 Q4 31.8 10.3 North 45.9 46.9 Contribution Operating Income Before Tax Income Before Tax Income After Tax Retained Income 2007 Q4 161.3 158.3 135.2 115 2008 Q4 37.8 41.3 21.7 2.5 North 45.9 46.9 45 43.9 Appendix |
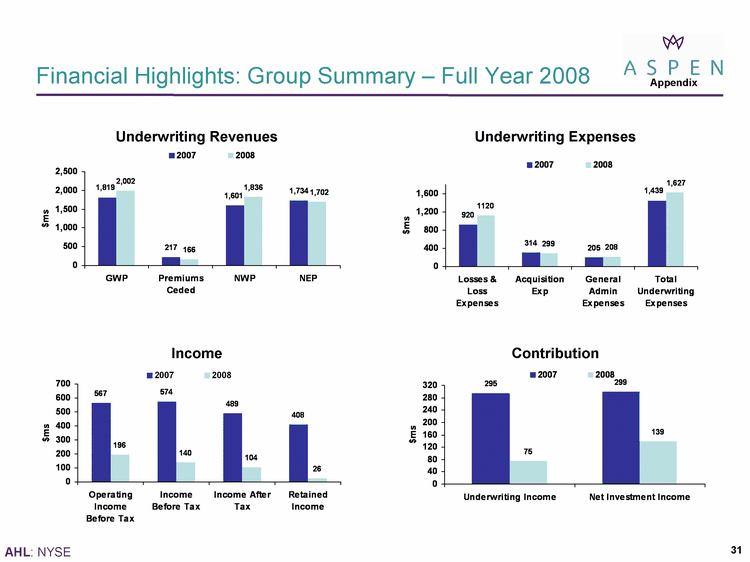
| Financial Highlights: Group Summary - Full Year 2008 GWP Premiums Ceded NWP NEP 2007 1818.5 217.1 1601.4 1733.6 2008 2001.7 166.2 1835.5 1701.8 North 45.9 99 45 43.9 Losses & Loss Expenses Acquisition Exp General Admin Expenses Total Underwriting Expenses 2007 919.8 313.9 204.8 1438.5 2008 1119.5 299.3 208 1626.8 North 45.9 46.9 45 43.9 Underwriting Income Net Investment Income 2007 295.1 299 2008 75 139.2 North 45.9 46.9 Operating Income Before Tax Income Before Tax Income After Tax Retained Income 2007 567 574 489 408.2 2008 196.3 140.4 104 26.1 North 45.9 46.9 45 43.9 Underwriting Revenues Underwriting Expenses Income Contribution Appendix |