 Aspen Insurance Holdings Limited INVESTOR PRESENTATION FIRST QUARTER 2013 EXHIBIT 99.1 |
 SAFE HARBOR DISCLOSURE AHL: NYSE 2 This presentation contains, written or oral "forward-looking statements" within the meaning of the US federal securities laws. These statements are made pursuant to the safe harbor provisions of the Private Securities Litigation Reform Act of 1995. Forward-looking statements include all statements that do not relate solely to historical or current facts, and can be All forward-looking statements address matters that involve risks and uncertainties. Accordingly, there are or will be important factors that could cause actual results to differ materially from those indicated in these statements. Aspen believes these factors include, but are not limited to: the possibility of greater frequency or severity of claims and loss activity, including as a result of natural or man-made (including economic and political risks) catastrophic or material loss events, than our underwriting, reserving, reinsurance purchasing or investment practices have anticipated; the reliability of, and changes in assumptions to, natural and man-made catastrophe pricing, accumulation and estimated loss models; evolving issues with respect to interpretation of coverage after major loss events and any intervening legislative or governmental action and changing judicial interpretation and judgments on insurers’ liability to various risks; the effectiveness of our loss limitation methods; changes in the total industry losses, or our share of total industry losses, resulting from past events and, with respect to such events, our reliance on loss reports received from cedants and loss adjustors, our reliance on industry loss estimates and those generated by modeling techniques, changes in rulings on flood damage or other exclusions as a result of prevailing lawsuits and case law; the impact of one or more large losses from events other than natural catastrophes or by an unexpected accumulation of attritional losses; the impact of acts of terrorism and acts of war and related legislation; decreased demand for our insurance or reinsurance products and cyclical changes in the insurance and reinsurance sectors; any changes in our reinsurers’ credit quality and the amount and timing of reinsurance recoverables; changes in the availability, cost or quality of reinsurance or retrocessional coverage; the continuing and uncertain impact of the current depressed economic environment in many of the countries in which we operate; the persistence of the global financial crisis and the Eurozone debt crisis; the level of inflation in repair costs due to limited availability of labor and materials after catastrophes; changes in insurance and reinsurance market conditions; increased competition on the basis of pricing, capacity, coverage terms or other factors and the related demand and supply dynamics as contracts come up for renewal; a decline in our operating subsidiaries’ ratings with Standard & Poor’s (“S&P”), A.M. Best Company, Inc. (“A.M. Best”) or Moody’s Investor Service (“Moody’s”); the failure of our reinsurers, policyholders, brokers or other intermediaries to honor their payment obligations; our ability to execute our business plan to enter new markets, introduce new products and develop new distribution channels, including their integration into our existing operations; our reliance on the assessment and pricing of individual risks by third parties; our dependence on a few brokers for a large portion of our revenues; the persistence of heightened financial risks, including excess sovereign debt, the banking system and the Eurozone debt crisis; changes in general economic conditions, including inflation, foreign currency exchange rates, interest rates and other factors that could affect our financial results; the risk of a material decline in the value or liquidity of all or parts of our investment portfolio; changes in our ability to exercise capital management initiatives or to arrange banking facilities as a result of prevailing market changes or changes in our financial position; changes in government regulations or tax laws in jurisdictions where we conduct business; Aspen Holdings or Aspen Bermuda becoming subject to income taxes in the United States or the United Kingdom; our reliance on information technology and third party service providers for our operations and systems; loss of one or more of our senior underwriters or key personnel; and increased counterparty risk due to the credit impairment of financial institutions. For a more detailed description of these uncertainties and other factors, please see the "Risk Factors" section in Aspen's Annual Report on Form 10-K as filed with the U.S. Securities and Exchange Commission on February 26, 2013. Aspen undertakes no obligation to publicly update or revise any forward-looking statements, whether as a result of new information, future events or otherwise. Readers are cautioned not to place undue reliance on these forward-looking statements, which speak only as of the dates on which they are made. In addition, any estimates relating to loss events involve the exercise of considerable judgment and reflect a combination of ground-up evaluations, information available to date from brokers and cedants, market intelligence, initial tentative loss reports and other sources. The actuarial range of reserves and management's best estimate represents a distribution from our internal capital model for reserving risk based on our then current state of knowledge and explicit and implicit assumptions relating to the incurred pattern of claims, the expected ultimate settlement amount, inflation and dependencies between lines of business. Due to the complexity of factors contributing to the losses and the preliminary nature of the information used to prepare these estimates, there can be no assurance that Aspen’s ultimate losses will remain within the stated amounts. In presenting Aspen's results, management has included and discussed certain "non-GAAP financial measures", as such term is defined in Regulation G. Management believes that these non-GAAP financial measures, which may be defined differently by other companies, better explain Aspen's results of operations in a manner that allows for a more complete understanding of the underlying trends in Aspen's business. However, these measures should not be viewed as a substitute for those determined in accordance with GAAP. The reconciliation of such non-GAAP financial measures to their respective most directly comparable GAAP financial measures in accordance with Regulation G is included herein or in the financial supplement, as applicable, which can be obtained from the Investor Relations section of Aspen's website at www.aspen.co. Non-GAAP Financial Measures This slide presentation is for information purposes only. It should be read in conjunction with our financial supplement posted on our website on the Investor Relations page and with other documents filed or to be filed shortly by Aspen Insurance Holdings Limited (the “Company” or “Aspen”) with the US Securities and Exchange Commission. Application of the Safe Harbor of the Private Securities Litigation Reform Act of 1995: identified by the use of words such as "expect," "intend," "plan," "believe," “do not believe,” “aim,” "project," "anticipate," "seek," "will," “likely,” "estimate," "may," "continue," “guidance,” and similar expressions of a future or forward-looking nature. |
 CONTENTS • Framework for Creating Shareholder Value • Who We Are & What We Do • Financial Highlights Q1 2013 and Full Year 2012 • Strong Historical Performance • Creating Shareholder Value - The Aspen Approach - Building a Specialty Niche Business in the U.S. - Proactive Management of Capital - Delivering Strong Investment Returns with High Quality Portfolio • Appendix AHL: NYSE 3 |
 ASPEN GROUP FRAMEWORK FOR CREATING SHAREHOLDER VALUE • Deep underwriting expertise and understanding of client needs and risks • Executing plan to achieve 10% Operating ROE in 2014 (1) through: 1. Optimization of business portfolio: Improving risk-adjusted returns and reducing volatility through significant, controlled reduction of wind and quake exposure in U.S. property insurance 2. Capital efficiency - Estimated $200 million of excess capital at March 31, 2013 - $500 million share repurchase authorization, with expected repurchases of at least $300 million in 2013 - Longer term, we expect to use most of comprehensive earnings to repurchase shares after dividends and amount needed for organic growth 3. Enhancing investment return within acceptable risk parameters AHL: NYSE 4 (1) As at April 24, 2013: Given the interest rate and pricing environments, assuming normal loss experience and including a pretax cat load of $190 million per annum |
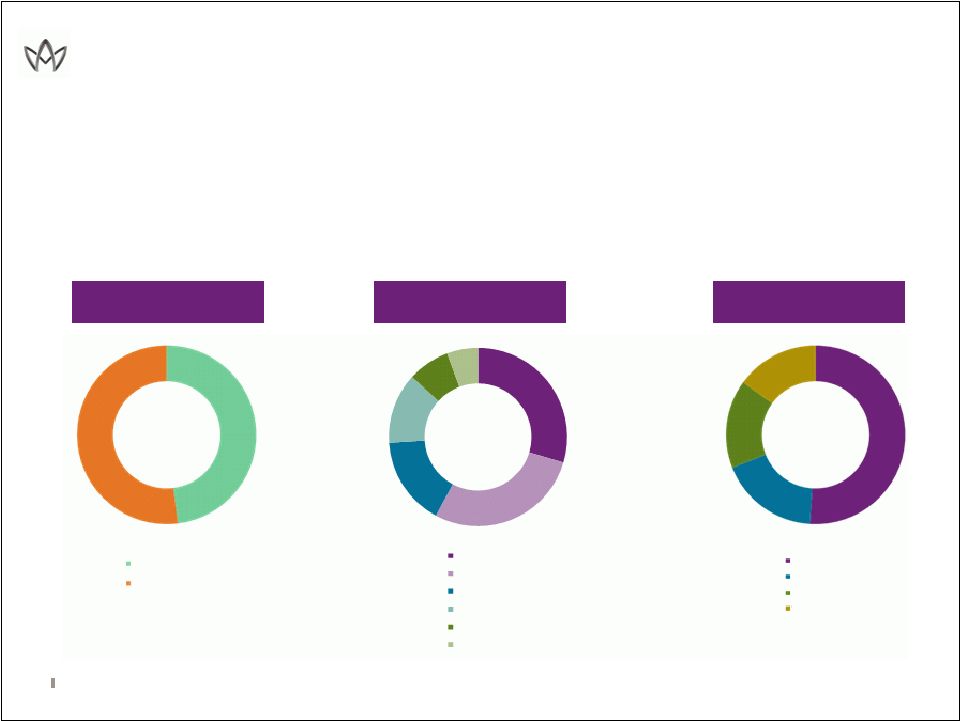 WHO WE ARE ASPEN GROUP • Bermuda-domiciled Specialty Insurer and Reinsurer • $2.6bn gross written premiums in 2012 • Industry-leading underwriting expertise AHL: NYSE 5 Figures for twelve months ended December 31, 2012 . GWP BY SEGMENT GWP BY BRANCH GWP BY BROKER 48% REINSURANCE 52% INSURANCE 29.6 % LONDON 28.2 % US 16.2 % LLOYDS 12.8 % BERMUDA 7.6 % ZURICH 5.6 % OTHER 51% OTHERS 18% AON 16% MARSH 15% WILLIS |
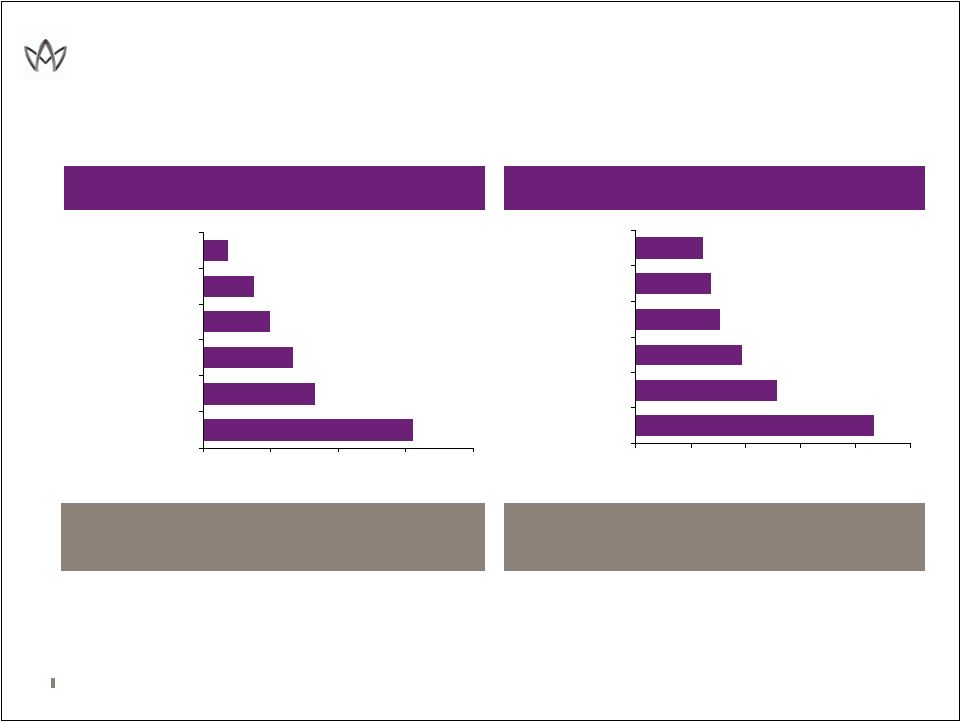
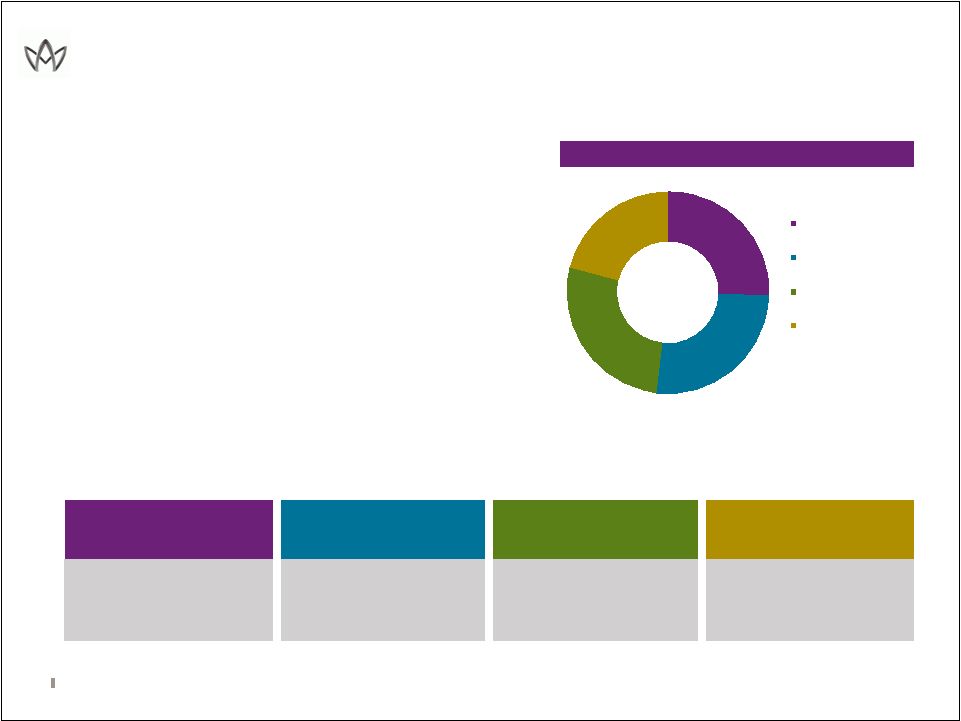 WHAT WE DO: REINSURANCE ESTABLISHED LEADER, POSITIONED FOR CONTINUED PROFITABLE GROWTH • STRATEGY: - Leverage deep expertise and understanding of client needs and risks - Local market strategy with hubs in: Zurich (Continental Europe), Singapore (Asia), Miami (Latin America) - Continue to diversify by product and geography • PRIORITIES: - Ensure rate adequacy by product and territory - Cross-sell between Property, Casualty and Specialty Lines - Established a new division, Aspen Capital Markets, in recognition of developments in the reinsurance market as the influence of alternative capital has increased - Aspen Capital Markets intends to develop an asset management business that leverages Aspen Re’s existing underwriting and technical expertise into managing reinsurance risks on behalf of third-party investors AHL: NYSE 6 GWP BY BUSINESS LINE (1) PROPERTY CATASTROPHE REINSURANCE OTHER PROPERTY REINSURANCE CASUALTY REINSURANCE SPECIALTY REINSURANCE • Treaty Catastrophe • Treaty Risk Excess • Treaty Pro Rata • Global Property Facultative • U.S. Casualty Treaty • International Casualty Treaty • Global Casualty Facultative • Credit & Surety • Agriculture • Other Specialty including Aviation, Energy and Marine (1) Gross Written Premium for the last twelve months through March 31, 2013 25% 26% 27% 21% Property Catastrophe Reinsurance Other Property Reinsurance Casualty Reinsurance Specialty Reinsurance |
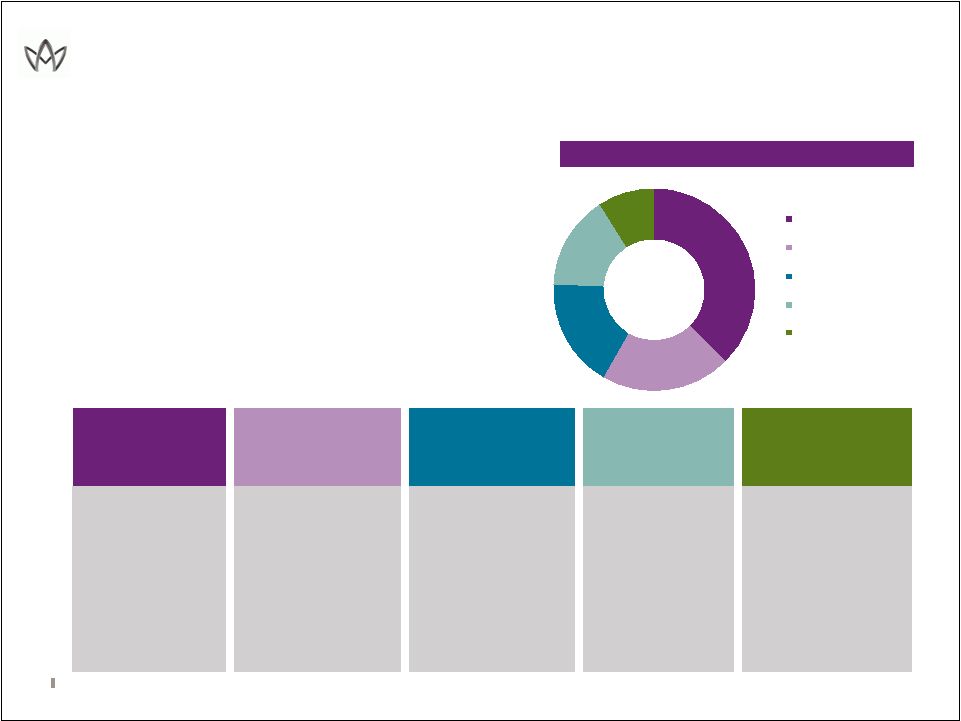 WHAT WE DO: INSURANCE INNOVATIVE SPECIALIST, BESPOKE UNDERWRITING APPROACH • STRATEGY: - Focus on complex, specialized risks and maintain portfolio diversification • PRIORITIES: - International: Further develop UK regional platform and continue to build presence in Switzerland; capitalize on strong demand for Marine, Energy, Political Risk and Kidnap & Ransom - U.S.: Drive towards profitability by building scale in attractive lines; Announced the formation of a specialty Marine, Energy and Construction unit in the U.S. to underwrite onshore energy and construction sector classes of business; complements our global Marine and Energy product offering and enables us to offer a full array of upstream and downstream insurance products across the global energy market AHL: NYSE 7 MARINE, ENERGY AND TRANSPORTATION FINANCIAL AND PROFESSIONAL LINES PROPERTY INSURANCE CASUALTY INSURANCE PROGRAMS • Marine, Energy and Construction (Property and Liability) • Energy Physical Damage • Marine Hull • Specie • Inland Marine and Ocean Risks • Aviation • Financial Institutions • UK Professional Liability • UK Management Liability • U.S. Professional Liability • U.S. Management Liability • Credit, Political & Terrorism • Kidnap & Ransom • Technology Liability • Surety • U.S. Property • UK Property • UK Regional Property • Global Casualty • UK Liability • UK Regional Liability • Environmental Liability • U.S. Primary Casualty • U.S. Excess Casualty • U.S. Property and Casualty • Habitation • Commercial Property • Self Storage • Retail • Light manufacturing (1) Gross Written Premium for the last twelve months through March 31, 2103 GWP BY BUSINESS LINE (1) 38% 21% 18% 15% 9% Marine, Energy and Transportation Financial and Professional Lines Property Insurance Casualty Insurance Programs |
 FINANCIAL HIGHLIGHTS: FIRST QUARTER 2013 8 Q1 2013 Q1 2012 Comments Optimization of Business Portfolio Gross Premiums Written $773.4 $782.1 • Increase primarily driven by Insurance segment, led by U.S. • Offset by reductions in Reinsurance Net Premiums Written $597.0 $633.5 Combined Ratio 90.1% 93.8% • Combined ratio ex catastrophes: 90.1% (2013) vs. 90.1% (2012) Annualized Operating ROE (1) 10.8% 9.2% • Positive result due to absence of catastrophe losses and limited attritional losses Diluted Operating EPS (1) $1.06 $0.88 Capital Efficiency Share Repurchases $208.2 $0 • $500M authorization in 1Q2013; expect at least $300M repurchases in 2013 • $150M ASR initiated in 1Q2013 Diluted BVPS $40.68 $38.58 • 5% increase • 7%+ increase after adding back dividends Enhancing Investment Return Book Yield on Fixed Income portfolio 2.80% 3.31% • Seeking to mitigate impact of continuing low rates through increased allocation to equities and BB-rated securities Avg Duration – Fixed Income portfolio 3.2 years 3.0 years ($ in millions, except per share data) AHL: NYSE (1) See Aspen's quarterly financial supplement for a reconciliation of operating income to net income, average equity to closing shareholders’ equity diluted book value per share to basic book value per share in the Investor Relations section of Aspen's website at www.aspen.co. |
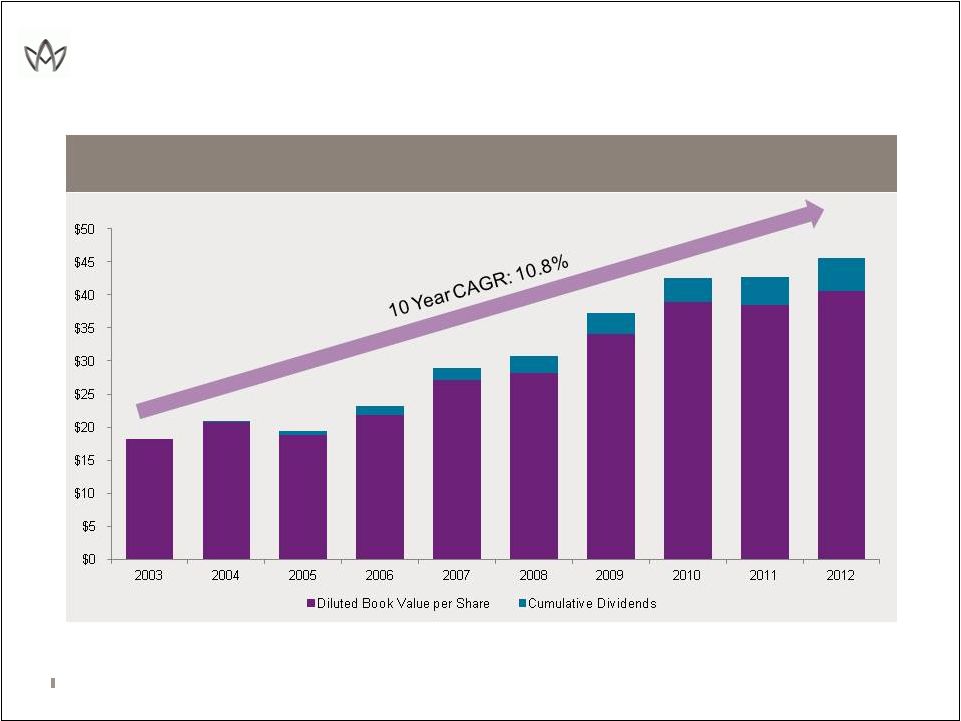 STRONG HISTORICAL PERFORMANCE SOLID VALUE CREATION SINCE IPO AHL: NYSE 9 (1) See Aspen's quarterly financial supplement for a reconciliation of operating income to net income, average equity to closing shareholders’ equity, diluted book value per share to basic book value per share in the Investor Relations section of Aspen's website at www.aspen.co. GROWTH IN DILUTED BOOK VALUE PER COMMON SHARE (1) AND CUMULATIVE DIVIDENDS FROM DECEMBER 31, 2003 – DECEMBER 31, 2012 |
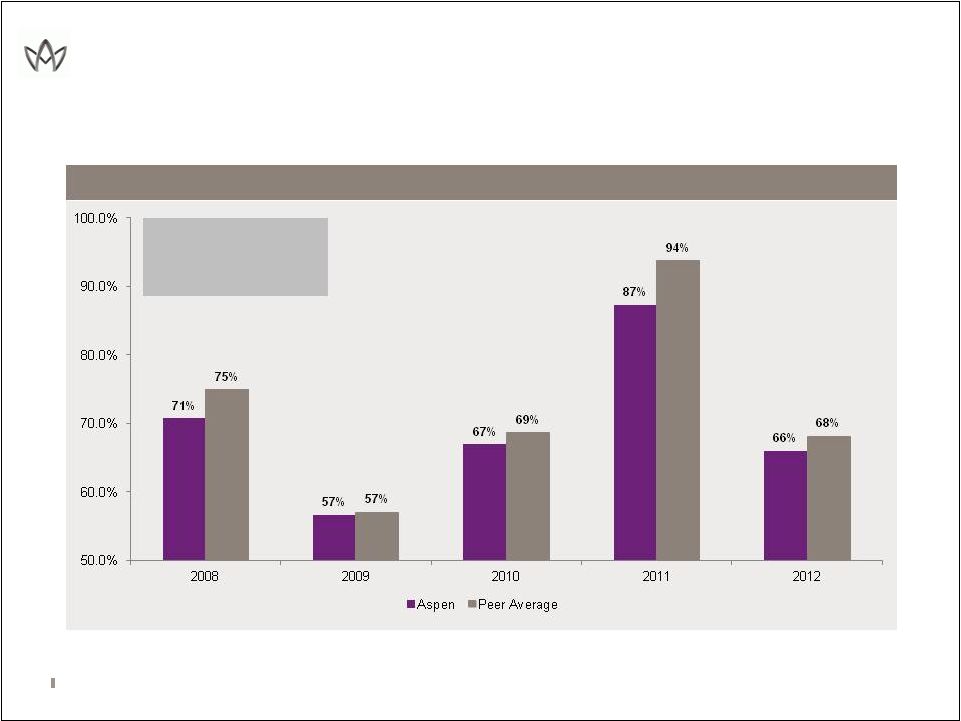 STRONG HISTORICAL PERFORMANCE: UNDERWRITING EXPERTISE REFLECTED IN SUPERIOR ACCIDENT YEAR LOSS RATIOS AHL: NYSE 10 Peers include AWH, ACGL, AXS, ENH, MRH, PRE, RE, RNR, PTP, VR and XL Source: company filings ACCIDENT YEAR LOSS RATIO 5-Year Average Aspen: 69.5% Peers: 72.5% |
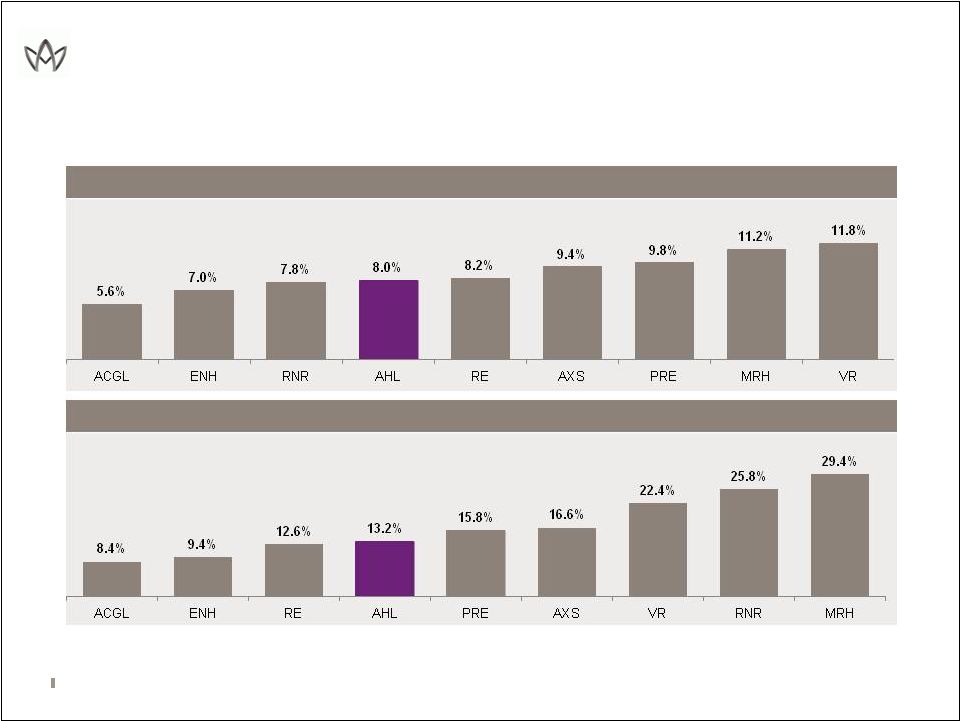 STRONG HISTORICAL PERFORMANCE: MODEST CATASTROPHE EXPOSURE LIMITS VOLATILITY AHL: NYSE 11 Source: Credit Suisse report March 11, 2013 CATASTROPHE LOSSES/NET PREMIUMS EARNED AVERAGE 2008-2012 CATASTROPHE LOSSES/SHAREHOLDERS EQUITY AVERAGE 2008-2012 |
 CREATING SHAREHOLDER VALUE THE ASPEN APPROACH 1. Optimization of business portfolio Focus on profitable growth markets and lines delivering attractive risk-adjusted returns Ongoing process of evaluating business line return, risk and volatility Reducing volatility through significant, controlled reduction of wind and quake exposure in U.S. property insurance 2. Capital efficiency First priority: underwrite profitable business Return excess capital to shareholders Current repurchase authorization: $500 million 3. Enhancing investment return Constantly evaluating ways to increase return on assets within our risk tolerance Invested a further $200 million in equities in Q1 2013 Tactically adding to positions in BB Bank Loans and High Yield AHL: NYSE 12 Enhanced focus on ROE Expect to achieve 10% ROE in 2014 (1) (1) As at April 24, 2013 : Given the interest rate and pricing environments, assuming normal loss experience and including a pretax cat load of $190 million per annum - - - - - - - - - |
 CREATING SHAREHOLDER VALUE OPTIMIZATION OF BUSINESS PORTFOLIO • Regular review of returns, risk and volatility for each of our product lines • In last 3 years, we have stopped or scaled back underwriting of several lines: Structured reinsurance UK motor reinsurance New or contracted liability insurance Primary pharmaceuticals products liability • Overwhelming majority of product lines have been validated by latest review process • Review resulted in decision to initiate a significant, controlled reduction of wind and quake exposure in U.S. property insurance Expected to free up $140 million of capital within 2 years and ultimately $200 million AHL: NYSE 13 - - - - - |
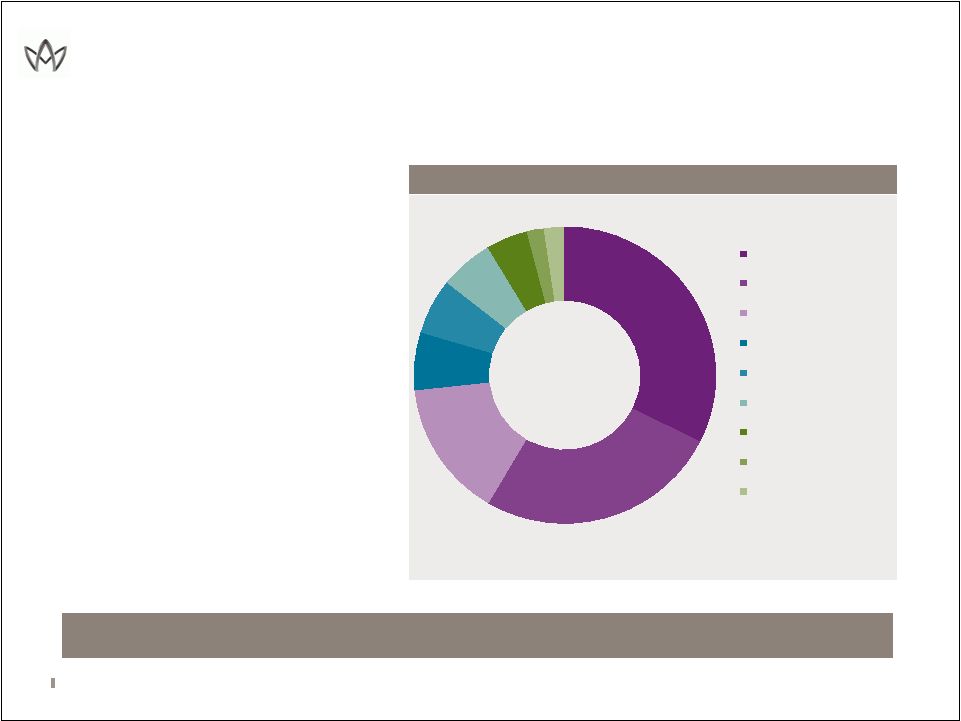 LTM U.S. INSURANCE TEAMS GWP: $483 MILLION (1) CREATING SHAREHOLDER VALUE BUILDING A SPECIALTY NICHE BUSINESS IN THE U.S. AHL: NYSE 14 Property: reduce volatility and rebalance U.S. insurance portfolio by reducing wind and earthquake exposure Programs: targets premier program business on a direct basis or through a reinsurance intermediary; classes of business written include habitation, commercial property, self storage, retail and light manufacturing; will continue to build out and diversify product offering Financial and Professional lines: continue development of this established line; rates stable to improving Casualty Lines: focus on organic growth in improving rate environment Marine, Energy and Transportation: provides creative risk management solutions for the marine, energy, and transportation industries Moving towards scale and profitability 31% Property 25% Programs 14% Professional Lines 11% Casualty 6% Marine 5% Environmental 4% Management Liability 2% Excess Casualty 2% Surety (1) Gross Written Premium for the last twelve months through March 31, 2013 • U.S. INSURANCE STRATEGY: • • • • |
 CREATING SHAREHOLDER VALUE PROACTIVE MANAGEMENT OF CAPITAL • Maintain strong balance sheet with capital at levels that satisfy all regulatory and rating agency requirements as well as internal metrics - Ratings of A/Stable (S&P), A2/Stable (Moody’s) and A/Stable (A.M. Best) • Competitive dividend yield; quarterly dividend increased 6% in Q1 2013 • Return capital to shareholders through share repurchases - In Q1 2013, announced new $500 million share repurchase authorization, including $150 million Accelerated Share Repurchase - Expect to repurchase at least $300 million in 2013 (~11% of current market capitalization), assuming normal loss experience, using: - Excess capital (approximately $200 million as of March 31, 2013) - Capital released from reduction in U.S. property insurance wind and quake exposure - YTD 2013 repurchases: $208 million (1) - Longer term, we expect to use most of comprehensive earnings to repurchase shares after dividends and amount needed for organic growth AHL: NYSE 15 CAPITAL MANAGEMENT STRATEGY (1) For the quarter ended March 31, 2013. |
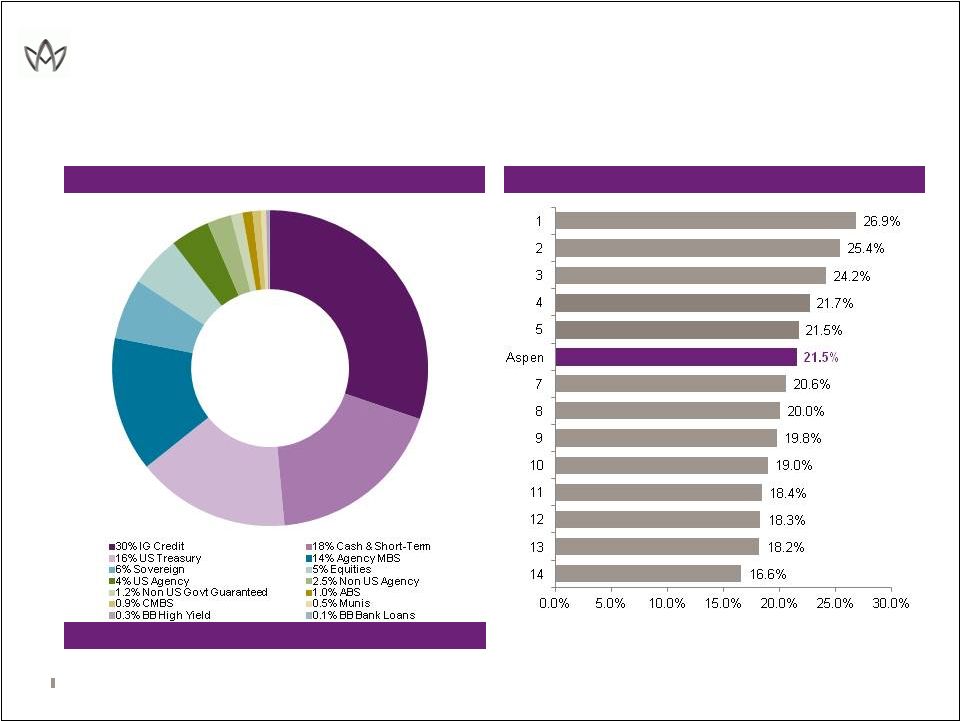 CREATING SHAREHOLDER VALUE: DELIVERING STRONG INVESTMENT RETURNS WITH HIGH QUALITY PORTFOLIO AHL: NYSE 16 PORTFOLIO ALLOCATIONS AT 03/31/13 5 YEAR TOTAL RETURN 1 (1) 5 year cumulative performance as at December 31 , 2012. Peers include ACE, ACGL, AWH, AXS, ENH, MKL, MRH, PRE, PTP, RE, RNR, WRB, XL – VR data not available for 5 years Source: company filings $7.9 BILLION AS AT 03/31/13 st |
 THE ASPEN APPROACH: CONCLUSION FOCUSED ON SHAREHOLDER VALUE • Deep underwriting expertise and understanding of client needs and risks • Executing plan to drive higher ROE and BVPS growth - Optimizing business portfolio to free up capital and improve risk-adjusted returns - Improving capital efficiency - Enhancing investment return within acceptable risk parameters • Pursuing selective, profitable growth in exposures we know and understand, subject to market conditions - Diversified platform allows us to take advantage of areas where rates are improving - Significant portion of growth expected to be in diversifying lines - Longer term, we expect to use most of comprehensive earnings to repurchase shares after dividends and amount needed for organic growth AHL: NYSE 17 Goal: 10% ROE in 2014 (1) (1) As at April 24, 2013: Given the interest rate and pricing environments, assuming normal loss experience and including a pretax cat load of $190 million per annum |
 APPENDIX |
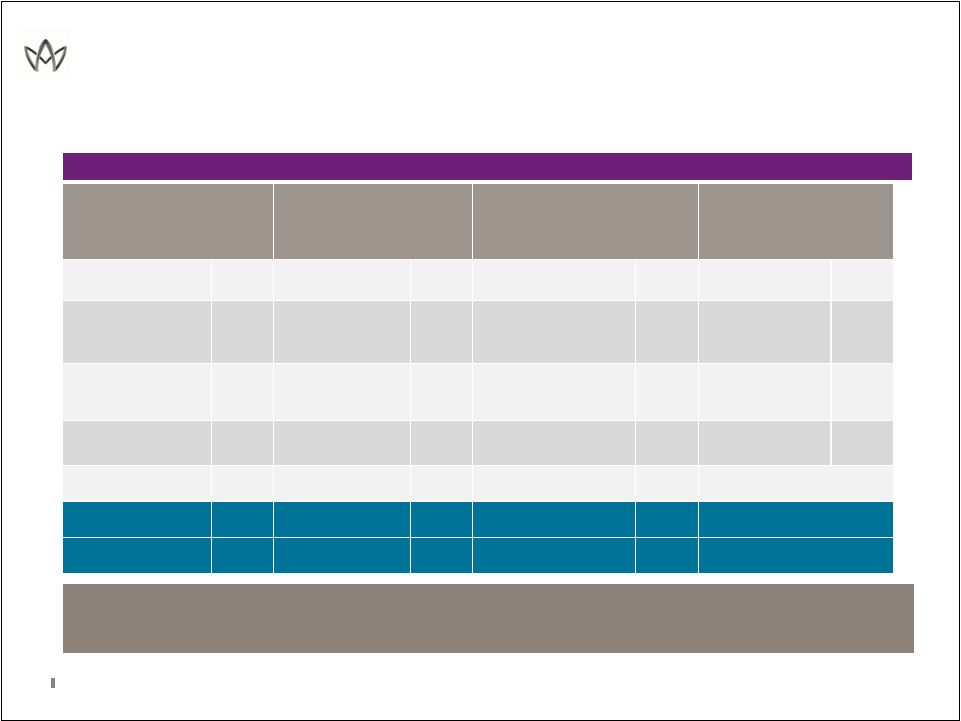
 CREATING SHAREHOLDER VALUE IMPROVING RATE ENVIRONMENT AHL: NYSE 19 LINE % 2012 GPW 2012 RATE CHANGE COMMENTS Reinsurance 48% 5% Property 25% 9% • Hardening in U.S. market due to Sandy losses Casualty 13% 1% • Up to 5% increases in U.S. General & Professional E&S Specialty 10% -2% • Marine rates up 30% at 1/1/13 due to Sandy and Concordia muted by continued soft rate environment in Credit and Surety Insurance 52% 3% Property 19% 5% • U.S. property up 6%; further increases expected in 2013 Casualty 7% 3% • 8% increase in U.S. Primary Casualty Marine, Energy & Transportation 21% 2% • Marine, energy and construction liability up 9% • Aviation down 9% Financial & Professional Lines 10% 1% • Financial Institutions up 7% • U.S. management liability up 5% • UK management liability and prof. indemnity rates remain pressured U.S. Programs 5% 3% • Expect further increases in 2013 due to Sandy losses Grand Total 100% 4% |
 ASPEN’S NATURAL CATASTROPHE EXPOSURES: MAJOR PERIL ZONES 100 YEAR RETURN PERIOD AS % OF TOTAL SHAREHOLDERS’ EQUITY 250 YEAR RETURN PERIOD AS % OF TOTAL SHAREHOLDERS’ EQUITY 1 in 100 year tolerance: 17.5% of total shareholders’ equity 1 in 250 year tolerance: 25.0% of total shareholders’ equity AHL: NYSE 20 Based on shareholders' equity of $3,339.6 million at March 31, 2013. The estimates reflect Aspen's own view of the modeled maximum losses at the return periods shown which include input from various third party vendor models and our own proprietary adjustments to these models. Catastrophe loss experience may materially differ from the modeled PML’s due to limitations in one or more of the models or uncertainties in the application of policy terms and limits. 15.5% 8.3% 6.7% 5.0% 3.7% 1.8% 0% 5% 10% 15% 20% U.S. All Wind California EQ European Wind Japan All Perils U.S. Pacific NW EQ U.S. Eastern Quake 21.7% 12.9% 9.7% 7.7% 6.9% 6.1% 0% 5% 10% 15% 20% 25% U.S. All Wind California EQ European Wind Japan All Perils U.S. Pacific NW EQ U.S. Eastern Quake |
 INVESTMENT PORTFOLIO BY ASSET TYPE AHL: NYSE 21 CASH, SHORT-TERM SECURITIES AND EQUITY SECURITIES GOVERNMENT / AGENCY STRUCTURED SECURITIES CREDIT SECURITIES Short-term securities 353.1 U.S. government 1,203.0 Asset-backed 80.3 Corporate bonds 1,930.4 Equities 414.1 U.S. Agency 314.2 Agency rated mortgage- backed (GNMA, FINMA, FHLB) 1,087.8 Foreign corporates 471.5 Cash and cash equivalents 1,212.7 Foreign governments 671.9 Non-agency Commercial Mortgage-backed 67.6 Bonds backed by foreign government 85.3 Other Investments 45.0 Municipal bonds 40.8 Bank loans 9.1 Q1 2013 2,024.9 Q1 2013 2,189.1 Q1 2013 1,235.7 Q1 2013 2,537.1 Q4 2012 2,142.6 Q4 2012 2,111.8 Q4 2012 1,305.0 Q4 2012 2,596.6 Increased portfolio allocation to equities by $200 million in Q1 2013 (1) As at March 31, 2013, including cash and cash equivalents TOTAL INVESTMENT PORTFOLIO AT MARKET VALUE ($ MILLIONS) 1 : $7,986.8 |
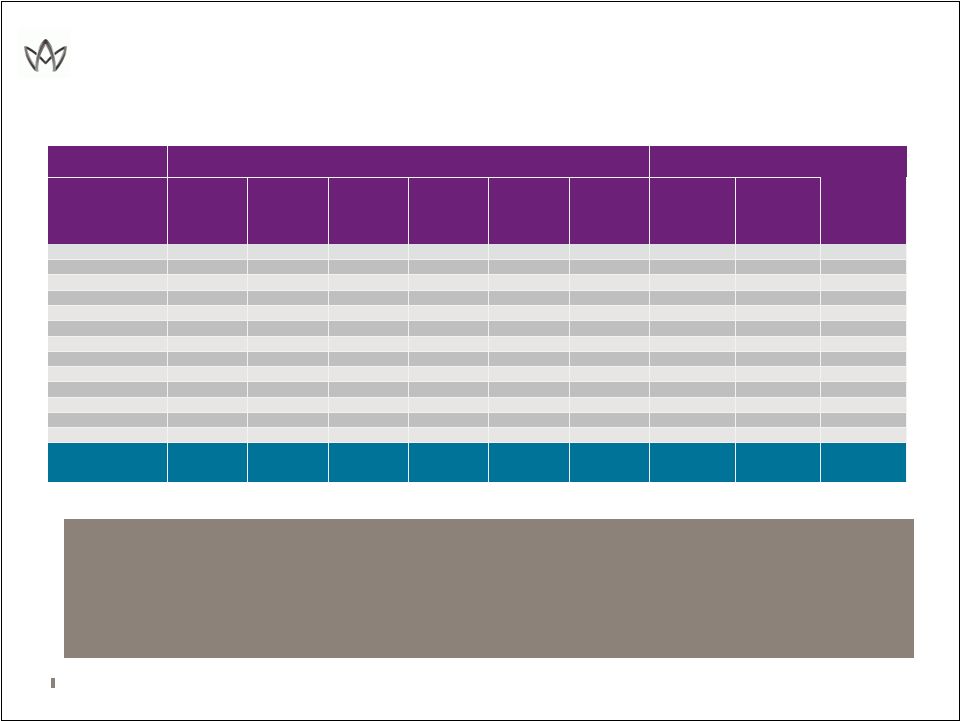 22 AHL: NYSE Note - Aspen takes the lower of the Moody’s and S&P ratings EUROPEAN INVESTMENT EXPOSURE ($ IN MILLIONS EXCEPT FOR PERCENTAGES) • Eurozone exposures consist of sovereigns, equities, and high quality corporates with 82% having a rating of “A” or higher, with de minimus exposure to Italian and Spanish corporate bonds • Not Rated “NR” consists of equity investments • Eurozone exposure is approximately 4.7% of Aspen’s aggregate investment portfolio • Aspen has no exposure to the sovereign debt of the European peripherals (Greece, Ireland, Italy, Portugal, or Spain) RATINGS COUNTRY AAA AA A BBB BB NR MARKET VALUE UNREALISED PRE-TAX GAIN % TOTAL INVESTMENT PORTFOLIO AUSTRIA - 6.7 - - - - 6.7 0.0 0.1% BELGIUM - - 19.5 - - 9.9 29.4 2.6 0.4% FINLAND 14.5 - - - - 4.5 19.0 1.0 0.2% FRANCE 4.0 56.3 19.5 2.7 - 28.0 110.6 6.9 1.4% GERMANY 63.2 13.2 28.4 2.4 0.6 - 107.8 3.7 1.3% ITALY - - - 0.7 - 4.0 4.8 0.0 0.1% LUXEMBOURG - - - 0.3 - - 0.3 0.0 0.0% NETHERLANDS 41.3 30.2 9.5 0.8 - - 81.8 2.5 1.0% NORWAY 13.1 18.0 - - - - 31.1 1.7 0.4% SPAIN - - - 2.2 - - 2.2 0.0 0.0% SWEDEN - 20.3 - 2.5 - 20.2 43.0 2.9 0.5% SWITZERLAND 11.2 29.8 44.9 1.5 - 42.0 129.4 13.5 1.6% UNITED KINGDOM 19.5 229.0 70.3 12.4 - 88.4 419.5 24.9 5.3% TOTAL EUROPEAN EXPOSURE 166.9 403.5 192.1 25.5 0.6 197.0 985.6 59.6 12.3% |
 Aspen Insurance Holdings Limited INVESTOR PRESENTATION FIRST QUARTER 2013 |