
Aspen Insurance Holdings Limited
October 26, 2006
3Q06 Earnings Conference Call

Safe Harbor Disclosure
This presentation is given in the context of the quarterly earnings conference call and contains non-GAAP measures. This slide presentation is for information purposes only. It should
be read in conjunction with our financial supplement posted on our website on the Investor Relations page and with other documents filed or to be filed shortly by Aspen Insurance
Holdings Limited (the “Company” or “Aspen”) with the U.S. Securities and Exchange Commission.
Non-GAAP Financial Measures
In presenting Aspen's results, management has included and discussed certain "non-GAAP financial measures", as such term is defined in Regulation G. Management believes that
these non-GAAP measures, which may be defined differently by other companies, better explain Aspen's results of operations in a manner that allows for a more complete
understanding of the underlying trends in Aspen's business. However, these measures should not be viewed as a substitute for those determined in accordance with GAAP. The
reconciliation of such non-GAAP financial measures to their respective most directly comparable GAAP financial measures in accordance with Regulation G is included herein or in the financial
supplement, as applicable, which can be obtained from the Investor Relations section of Aspen's website atwww.aspen.bm.Underlying premiums, accident year loss ratios excluding Hurricanes Katrina, Rita and Wilma losses and prior year adjustments and net loss ratios excluding the impact of Hurricanes Katrina, Rita and Wilma are non-GAAP financial measures. They exclude the effect of Hurricanes Katrina, Rita and Wilma and where applicable, prior year reserve releases, from the GAAP-based ratios and other measures. Aspen believes that excluding these significant catastrophic events in 2005 which were significantly above historical average provides investors and analysts an alternate means to assess the underlying underwriting performance supplementing the GAAP measures.
Application of the Safe Harbor of the Private Securities Litigation Reform Act of 1995:
This presentation contains written, and the Company’s earnings conference call will contain oral, “forward-looking statements” within the meaning of the U.S. federal securities laws.
These statements are made pursuant to the safe harbor provisions of the Private Securities Litigation Reform Act of 1995. Forward-looking statements include all statements that do
not relate solely to historical or current facts, and can be identified by the use of words such as “expect,” “intend,” “plan,” “believe,” “project,” “anticipate,” “seek,” “will,” “estimate,”
“may,” “continue,” and similar expressions of a future or forward-looking nature.
All forward-looking statements address matters that involve risks and uncertainties. Accordingly, there are or will be important factors that could cause actual results
to differ materially from those indicated in these statements. The Company believes these factors include, but are not limited to: the impact that our future operating
results, capital position and rating agency and other considerations have on the execution of any capital management initiatives, the impact of any capital
management initiatives on our financial condition, the impact of acts of terrorism and related legislation and acts of war; the possibility of greater frequency or
severity of claims and loss activity, including as a result of natural or man-made catastrophic events such as Hurricanes Katrina, Rita and Wilma, than our
underwriting, reserving or investment practices have anticipated; evolving interpretive issues with respect to coverage as a result of Hurricanes Katrina, Rita and
Wilma; the level of inflation in repair costs due to limited availability of labor and materials after catastrophes; the effectiveness of the Company's loss limitation
methods; changes in the availability, cost or quality of reinsurance or retrocessional coverage; the reliability of, and changes in assumptions to, catastrophe pricing,
accumulation and estimated loss models; loss of key personnel; a decline in our operating subsidiaries' ratings with Standard & Poor's, A.M. Best Company or
Moody's Investors Service; changes in general economic conditions including inflation, foreign currency exchange rates, interest rates and other factors that could
affect our investment portfolio; increased competition on the basis of pricing, capacity, coverage terms or other factors; decreased demand for the Company's
insurance or reinsurance products and cyclical downturn of the industry; changes in governmental regulations or tax laws in jurisdictions where the Company
conducts business; the Company or its Bermudian subsidiary becoming subject to income taxes in the United States or the United Kingdom; the effect on insurance
markets, business practices and relationships of ongoing litigation, investigations and regulatory activity by the New York State Attorney General's office and other
authorities concerning contingent commission arrangements with brokers and bid solicitation activities; the total industry losses resulting from Hurricanes Katrina,
Rita and Wilma and the actual number of the Company's insureds incurring losses from these storms; and with respect to Hurricanes Katrina, Rita and Wilma, the
Company’s reliance on loss reports received from cedants and loss adjusters, the Company's reliance on industry loss estimates and those generated by modeling
techniques, the impact of these storms on the Company's reinsurers, any changes in the Company's reinsurers' credit quality, the amount and timing of reinsurance
recoverables and reimbursements actually received by the Company from its reinsurers and the overall level of competition and the related demand and supply
dynamics as contracts come up for renewal. For a more detailed description of these uncertainties and other factors, please see the "Risk Factors" section in the
Company's Annual Report on Form 10-K for the year ended December 31, 2005, filed with the U.S. Securities and Exchange Commission on March 6, 2006. The
Company undertakes no obligation to publicly update or revise any forward-looking statements, whether as a result of new information, future events or otherwise.
Readers are cautioned not to place undue reliance on these forward-looking statements, which speak only as of the dates on which they are made.
2

Financial Highlights
(US$ in millions)
Quarter Ended September 30, 2006 2005 Change
Gross Premiums Written $457.5 $494.0 (7%)
Net Premiums Written 433.5 344.5 26%
Net Premiums Earned 429.3 379.4 13%
Underwriting Income (Loss) 81.6 (406.2) NM*
Net Investment Income 47.3 29.4 61%
Net Income after tax 95.0 (362.0) NM*
GAAP Ratios:
Loss Ratio 54.0% 180.0% (126.0%) pts
Expense Ratio 27.0% 27.1% (0.1%) pts
Combined Ratio 81.0% 207.1% (126.1%) pts
3Q ROAE (annualized) 18.0% (107.2%) 125.2% pts
9 months ROAE (annualized) 16.3% (19.2%) 35% pts
Diluted Book Value
Per Ordinary Share $21.41 $17.53 22.1%
Diluted 3Q Operating
Earnings Per Ordinary Share $0.93 ($5.15) NM*
(*) = Percentage ratio not meaningful comparison due to loss in 3Q05
3
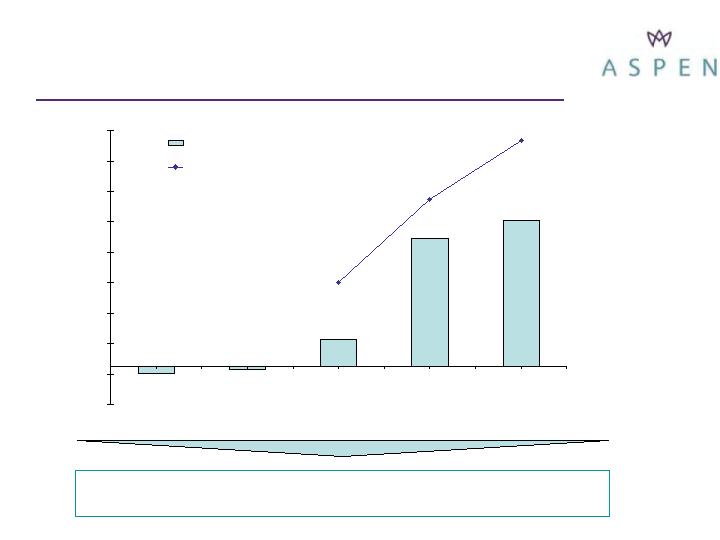
Market Timing – Property Reinsurance
Decision to Hold Back Capacity at January 1
Proved to be Correct
Rate index (US Catastrophe exposed contracts) vs. Renewal rate of whole account premium
-4.6%
-2%
84%
18%
96%
149%
110%
55%
-25%
-5%
15%
35%
55%
75%
95%
115%
135%
155%
Q3 05
Q4 05
Q1 06
Q2 06
Q3 06
Rate index (renewal rate change), % (US cat contracts)
GWP as a % of expiring premium (whole account)
4
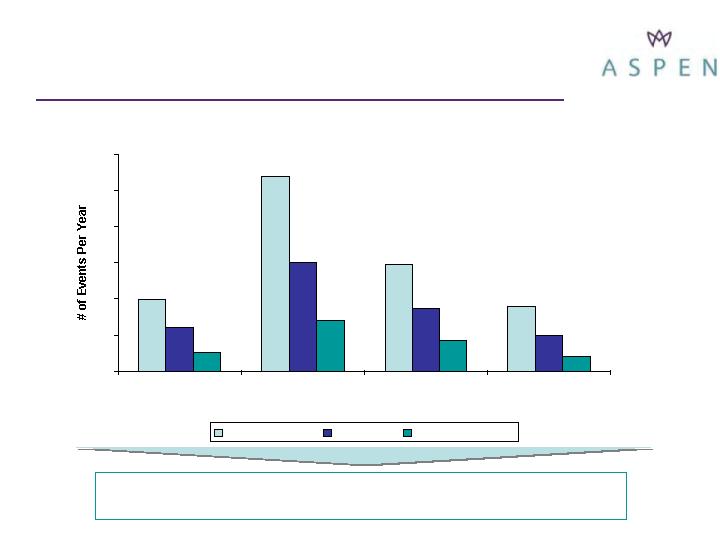
Hurricane Frequency – 2005/2006
(*) Accurate Environmental Forecasting
9.9
27
14.7
9
15
8.7
5
2.6
7
4.2
6
2
0
5
10
15
20
25
30
Historical Long-
Term Average
2005 Actual
AEF* Current 2006
Forecast
2006 Year-to-Date
Tropical Storms
Hurricanes
Major Hurricanes
Hurricane Activity in ’06 Significantly Below Forecast and
Marginally Below Historical Average
5

3Q GWP
(*) KRW = Hurricanes Katrina, Rita and Wilma
(12.5%)
40.2%
18.5%
(1.5%)
4.7%
% Change in underlying premiums
99.2
51.2
81.5
198.3
$430.2
Underlying premiums
0.0
6.1
0.0
57.7
$63.8
Less: KRW* related premiums
99.2
57.3
81.5
256.0
$494.0
Gross Premiums Written
Insurance
Specialty
Casualty
Property
Total
3Q05
86.8
71.8
96.6
195.3
$450.5
Underlying premiums
0.0
5.9
0.0
1.1
$7.0
Less: KRW* related premiums
86.8
77.7
96.6
196.4
$457.5
Gross Premiums Written
Insurance
Specialty
Casualty
Property
Total
3Q06
(in $ millions)
6

Specialty Lines GWP
57.3
6.2
15.6
11.3
15.7
8.5
3Q05
77.7
8.7
21.3
7.6
17.4
22.7
3Q06
301.7
399.9
Total
87.4
83.8
Reinsurance assumed
20.4
80.7
Aviation insurance
41.2
83.0
Marine hull
45.4
45.8
Energy property insurance
107.3
106.6
Marine and specialty liability
insurance
9 months ended
Sept 05
9 months ended
Sept 06
(in $ millions)
7

3Q 2006 3Q 2005
Total loss ratio 54.0% 180.0%
Less impact of KRW* (2.5%) (117.4%)
Net loss ratio ex. KRW 51.5% 62.6%
Prior year release ex. KRW 6.2% 2.9%
Accident year loss ratio ex. KRW 57.8% 65.5%
&nb sp; Accident Year Loss Ratio Ex
2006 Total Loss Ratio KRW & Prior Year Adjustment KRW and Prior Year Adjustments
Property 46.0% (11.7%) 34.3%
Casualty 63.9% 5.6% 69.5%
Specialty 42.2% 2.7% 44.9%
Insurance 68.5% 24.6% 93.1%
Total 54.0% 3.8% 57.8%
2005
Property 411.8% (346.8%) 65.0%
Casualty 68.5% 0.0% 68.5%
Specialty 99.2% (33.3%) 65.9%
Insurance 88.6% (41.5%) 47.1%
Total 180.0% (114.5%) 65.5%
3Q Loss Ratio Analysis
(*) KRW = Hurricanes Katrina, Rita and Wilma
8

Improvement in Expense Ratio
29.4%
4.5%
24.9%
8.5%
16.4%
2Q06
27.0%
4.4%
22.6%
7.2%
15.4%
3Q06
32.7%
Net expense ratio
6.1%
Effect of reinsurance
26.6%
Total gross expense ratio
7.7%
General and administrative expenses
18.9%
Acquisition expenses
1Q06
% of Gross Earned Premium
9

Improvement in Investment Yield
4.36%
4.44%
September 30, 2006
4.29%
4.40%
June 30, 2006
4.18%
4.19%
March 31, 2006
4.08%
4.08%
December 31, 2005
3.85%
3.84%
September 30, 2005
3.72%
3.68%
June 30, 2005
3.43%
3.49%
March 31, 2005
3.50%
3.53%
December 31, 2004
Aggregate portfolio book yield
(including cash and cash
equivalents)
Fixed income portfolio
book yield
Date
10