Exhibit 99.1

Aspen Insurance Holdings Limited
Chris O’Kane, Chief Executive Officer
Julian Cusack, Chief Financial Officer
February 2007
AHL: NYSE

This presentation contains non-GAAP measures and is for information purposes only. It should be read in conjunction with our financial supplement posted on our website on the Investor Relations page and with other documents filed or to be filed shortly by Aspen Insurance Holdings Limited (the “Company” or “Aspen”) with the U.S. Securities and Exchange Commission.
Non-GAAP Financial Measures
In presenting Aspen's results, management has included and discussed certain "non-GAAP financial measures", as such term is defined in Regulation G. Management believes that these non-GAAP measures, which may be defined differently by other companies, better explain Aspen's results of operations in a manner that allows for a more complete understanding of the underlying trends in Aspen's business. However, these measures should not be viewed as a substitute for those determined in accordance with GAAP. The reconciliation of such non-GAAP financial measures to their respective most directly comparable GAAP financial measures in accordance with Regulation G is included herein or in the financial supplement, as applicable, which can be obtained from the Investor Relations section of Aspen's website atwww.aspen.bm.
Application of the Safe Harbor of the Private Securities Litigation Reform Act of 1995:
This presentation contains written or oral "forward-looking statements" within the meaning of the U.S. federal securities laws. These statements are made pursuant to the safe harbor provisions of the Private Securities Litigation Reform Act of 1995. Forward-looking statements include all statements that do not relate solely to historical or current facts, and can be identified by the use of words such as "expect," "intend," "plan," "believe," "project," "anticipate," "seek," "will," "estimate," "may," "continue," and similar expressions of a future or forward-looking nature.
All forward-looking statements address matters that involve risks and uncertainties. Accordingly, there are or will be important factors that could cause actual results to differ materially from those indicated in these statements. Aspen believes these factors include, but are not limited to: the impact that our future operating results, capital position and rating agency and other considerations have on the execution of any capital management initiatives; the impact of any capital management activities on our financial condition; the impact of acts of terrorism and related legislation and acts of war; the possibility of greater frequency or severity of claims and loss activity, including as a result of natural or man-made catastrophic events such as Hurricanes Katrina, Rita and Wilma, than our underwriting, reserving or investment practices have anticipated; evolving interpretive issues with respect to coverage as a result of Hurricanes Katrina, Rita and Wilma; the level of inflation in repair costs due to limited availability of labor and materials after catastrophes; the effectiveness of Aspen's loss limitation methods; changes in the availability, cost or quality of reinsurance or retrocessional coverage, which may affect our decision to purchase such coverage; the reliability of, and changes in assumptions to, catastrophe pricing, accumulation and estimated loss models; loss of key personnel; a decline in our operating subsidiaries' ratings with Standard & Poor's, A.M. Best Company or Moody's Investors Service; changes in general economic conditions including inflation, foreign currency exchange rates, interest rates and other factors that could affect our investment portfolio; the number and type of insurance and reinsurance contracts that we wrote at the January 1st and other renewal periods in 2007 and the premium rates available at the time of such renewals within our targeted business lines; increased competition on the basis of pricing, capacity, coverage terms or other factors; decreased demand for Aspen’s insurance or reinsurance products and cyclical downturn of the industry; changes in governmental regulations, interpretations or tax laws in jurisdictions where Aspen conducts business; proposed and future changes to insurance laws and regulations, including with respect to U.S. state- and other government-sponsored reinsurance funds and primary insurers; Aspen or its Bermudian subsidiary becoming subject to income taxes in the United States or the United Kingdom; the effect on insurance markets, business practices and relationships of ongoing litigation, investigations and regulatory activity by the New York State Attorney General's office and other authorities concerning contingent commission arrangements with brokers and bid solicitation activities; the total industry losses resulting from Hurricanes Katrina, Rita and Wilma and the actual number of Aspen's insureds incurring losses from these storms; and with respect to Hurricanes Katrina, Rita and Wilma, Aspen’s continued reliance on loss reports received from cedants and loss adjustors, Aspen's reliance on industry loss estimates and those generated by modeling techniques, the impact of these storms on Aspen's reinsurers, any changes in Aspen's reinsurers' credit quality, the amount and timing of reinsurance recoverables and reimbursements actually received by Aspen from its reinsurers and the overall level of competition and the related demand and supply dynamics as contracts come up for renewal. For a more detailed description of these uncertainties and other factors, please see the "Risk Factors" section in Aspen's Annual Reports on Form 10-K as filed with the U.S. Securities and Exchange Commission. Aspen undertakes no obligation to publicly update or revise any forward-looking statements, whether as a result of new information, future events or otherwise. Readers are cautioned not to place undue reliance on these forward-looking statements, which speak only as of the dates on which they are made.
Safe Harbor Disclosure
2
AHL: NYSE

Key Topics
2006 Performance
Current Market Conditions, 2007 Outlook
Florida: risks and opportunities
Capital Management
2007 Guidance
3
AHL: NYSE

Performance Highlights
Diversified Operating platform delivering results
Improving Absolute Returns
2003 ROAE* 15.9% 2006 ROAE* 18.5%
Focus on Book Value growth not top line
2004 BV $19.30 2006 BV $ 22.35
Increasing contribution from Investment Income and Capital
Management
ERM core enabler reducing volatility and risk tolerance
17.5% at 1:100; 25% at 1:250
$1,663.6 m
$378.1 m
82.4%
2006
$278 m
$119.5 m
76.8%
4Q ‘06
NWP
Net Income
Combined Ratio
4
* Reconciliation of Average Equity to closing shareholders’ equity is provided in our quarterly financial supplements available in the Financial Results section of the
Investor Relations page of Aspen website at www.aspen.bm
AHL: NYSE

Strategy: Key Components
Our strategy has 4 key components
1.
‘Specialty’ insurer and reinsurer
2.
Diversified operating platform
3.
Focus on book value growth per share,not top line
4.
Enterprise Risk Management is our core strategic enabler
A Robust and Sustainable Business Model to Deliver Consistent ROE
5
AHL: NYSE
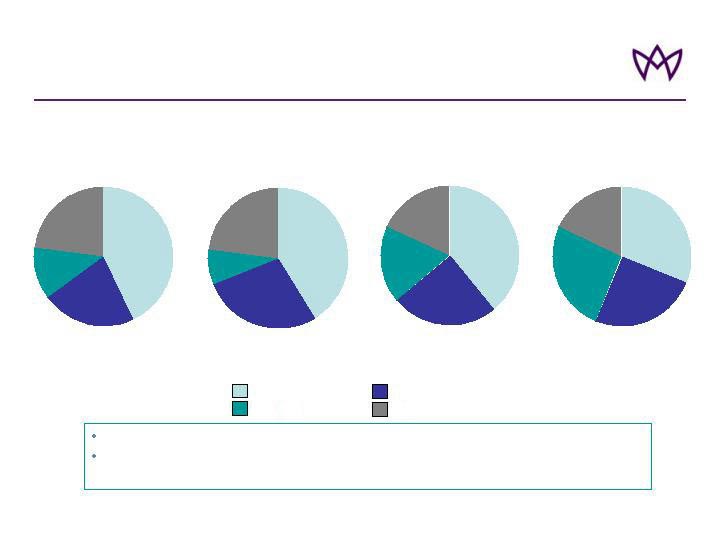
Increased Diversification
* 2003 Specialty lines excludes QQS of Wellington Syndicate 2020
Improved Spread of Risk
Specialty insurance and reinsurance has grown from 7.9% of GWP in
2004 to 26.3% in 2006
43%
12%
23%
22%
*
2005
Property Reinsurance Casualty Reinsurance
Specialty Lines Insurance
100% = $1.3bn
41%
8%
23%
28%
39%
18%
18%
25%
31%
26%
18%
25%
2004
2003
2006
100% = $1.6bn
100% = $2.1bn
100% = $1.9bn
Gross Written Premiums
6
AHL: NYSE
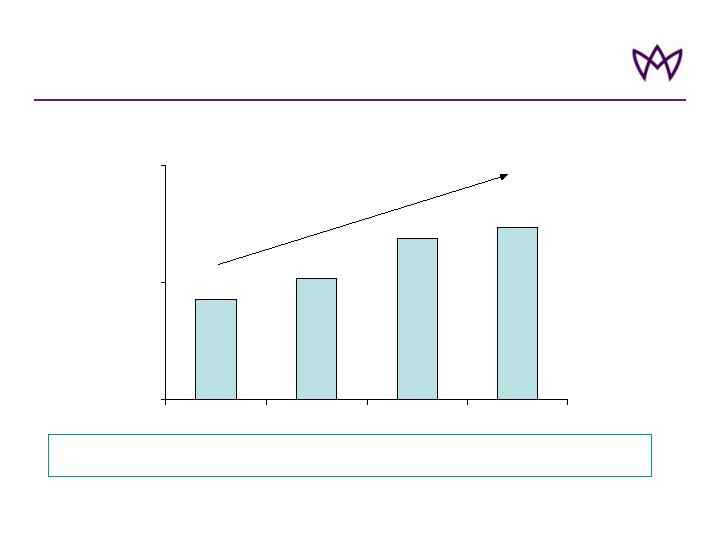
Book value per share at end of period in US$
Book Value per Share
$19.3
$20.2
$21.9
$22.4
$15
$20
$25
2005 Q4
2006 Q2
2006 Q3
2006 Q4
16%
Focus on Growing Book Value
7
AHL: NYSE

Book Value Growth Drivers
Disciplined approach to underwriting opportunities
margin stability, selective margin expansion
Capital management
Tax efficiency
ERM, no surprises
8
AHL: NYSE

Market Conditions 2007 Outlook:
Property and Specialty Lines
Risk Excess
Treaty
Pro Rata
Catastrophe
Treaty
Trend
Outlook ’07
Line
Specialty
Reinsurance
Marine & Energy
Liability
Offshore Energy
Physical Damage
Marine Hull
Aviation
Trend
Outlook ’07
Line
International
Property Fac.
E&S Property
UK Property
Trend
Outlook ’07
Line
Property Reinsurance
Specialty lines
Insurance
= Absolute rate levels attractive
= Absolute rate levels mixed
= Absolute rate levels very challenging
= 12 month rate trend positive
= 12 month rate trend neutral
= 12 month rate trend slightly downwards
= 12 month rate trend downwards
9
AHL: NYSE

Market Conditions 2007 Outlook:
Casualty Lines
Casualty
Facultative
US Casualty
International
Casualty
Trend
Outlook ’07
Line
E&S Casualty
UK Liability
Trend
Outlook ’07
Line
Casualty Reinsurance
Insurance
Pricing Under Pressure but still Adequate
= Absolute rate levels attractive
= Absolute rate levels mixed
= Absolute rate levels very challenging
= 12 month rate trend positive
= 12 month rate trend neutral
= 12 month rate trend downwards
10
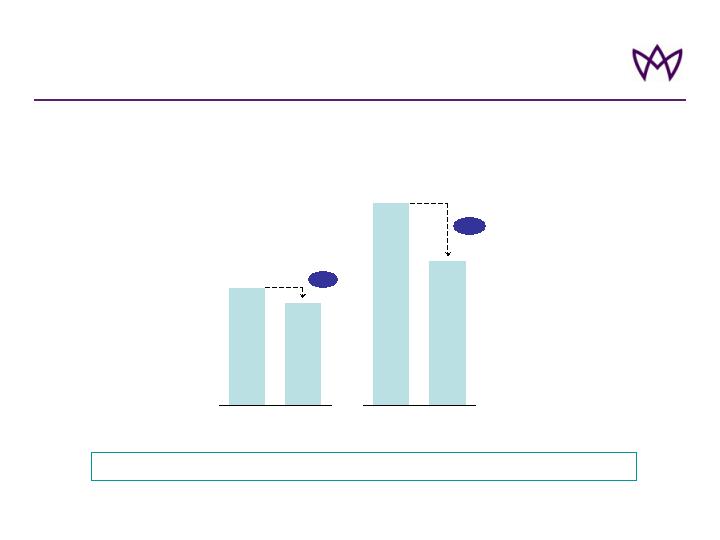
AHL: NYSE

80%
Target Combined Ratios:
Across Cycles, 2007 Outlook
E2007
E2007
95%
100%
105%
90%
85%
75%
95%
100%
105%
90%
85%
80%
75%
95%
100%
105%
90%
85%
80%
75%
78%-82%
81%-
85%
Cycle
Range
83%-88%
92%-
97%
Cycle
Range
Property and
Specialty Lines
Casualty Lines
Overall
E2007
92%-97%
85%-
92%
Cycle
Range
Expected Market Conditions in 2007 Supportive of Continuing
Strong Underwriting Performance
Note: Assuming no major losses or prior year reserve movements
11
AHL: NYSE

Strengthening Risk Management:
Managing Volatility of Results
Group / regulatory / reputational
Operational
Liquidity
Minimize risk
Non – core risks
Credit
Strategic
Investment
Optimize risk- return
Core risks
Underwriting
Risk Type
Risk management policy
Risk Type
12
AHL: NYSE
Reduce Volatility, Lower Risk Tolerance
1-in-100 Tolerance
(% of Surplus)
2005
1-in-250 Tolerance
(% of Surplus)
25%
35%
2005
-1000bp
20.0%
17.5%
2007
2007
-250bp
Significant Reduction in Risk Tolerances
Single Zone Risk Tolerance Per Peril Net of Reinsurance, Post Tax
13
AHL: NYSE

Focus is on Growth in Book Value Per Share,Not Top Line
Core Beliefs about Growth
GWP and / or capital may shrink before we grow,
according to market conditions
Growth must be profitable and increase book value per
share
Growth in new lines should meet two overarching sets of
criteria
Underwriting fit
Operational fit
14
AHL: NYSE

Approach to Growth - ‘Palette’
(lines we do not currently write)
Focus on Opportunities which Offer Best Fit with Our Underwriting
and Operational Capabilities
Financial
Institutions
Personal
Accident
UK D&O
UK PI
Operational fit
Underwriting fit
Medical
Expenses
Property
fac
Bloodstock
Cargo and
Specie
Credit and
surety
Homeowners
Standard
Auto
US D&O
in US
High Net
Worths
Agriculture
Political
risk
US Airlines
Binder
Business
US
Products
Liability
War and
Terrorism
UK SMEs
Primary
Japanese
Property
HIGH
LOW
15
AHL: NYSE

2007 Impact of Florida Legislation
Aspen direct exposure
to Florida
$3 million estimated 2007 premium loss from
Florida domiciled clients (maximum)
Aspen indirect exposure
to Florida
$10 million estimated premium loss
from non-Florida domiciled business
Other indirect Impact
Estimated 2.5% reduction in worldwide property
reinsurance premium due to increased competition
16
AHL: NYSE

Financial Highlights – Full Year
Year Ended December 31
2006
2005
Change
(US$ in millions, except per share data)
(*) = Percentage ratio not meaningful comparison
17
AHL: NYSE
Gross Premiums Written
$1,945.5
$2,092.5
(7.0%)
Net Premiums Written
1,663.6
1,651.6
0.7%
Net Premiums Earned
1,676.2
1,508.4
11.1%
Underwriting Income
295.6
(259.2)
NM*
Net Investment Income
204.4
121.3
68.5%
Net Income after tax
378.1
(177.8)
NM*
GAAP Ratios:
Loss Ratio
53.1%
90.1%
(37.0%) pts
Expense Ratio
29.3%
27.1%
2.2% pts
Combined Ratio
82.4%
117.2%
(34.8%) pts
Full Year ROAE
18.5%
(11.7%)
NM*
Diluted Operating
Earnings Per Ordinary Share
$3.72
($2.11)
NM*

2006 Performance
Good performance in ongoing
business
GWP $158 million
Attritional losses from non-renewed
Risk Excess
XOL Treaty
Disappointing performance in
Bermuda book
Good performance in Japan and
Aspen Re America portfolios
GWP $119 million
Pro Rata
Strong performance
GWP $315 million
Catastrophe
Treaty
Comment
Result
Line
Good results
GWP $82 million
E&S
Casualty
Loss making in 2006
Taking steps to rectify
difficulties
GWP $72 million
E&S Property
Strong performance
GWP $125 million
UK Liability
Strong performance
GWP $51 million
UK Property
Comment
Result
Line
/
Property Reinsurance
Retro cost in '06 not necessary in '07
Property & Casualty Insurance
x
x
18
AHL: NYSE
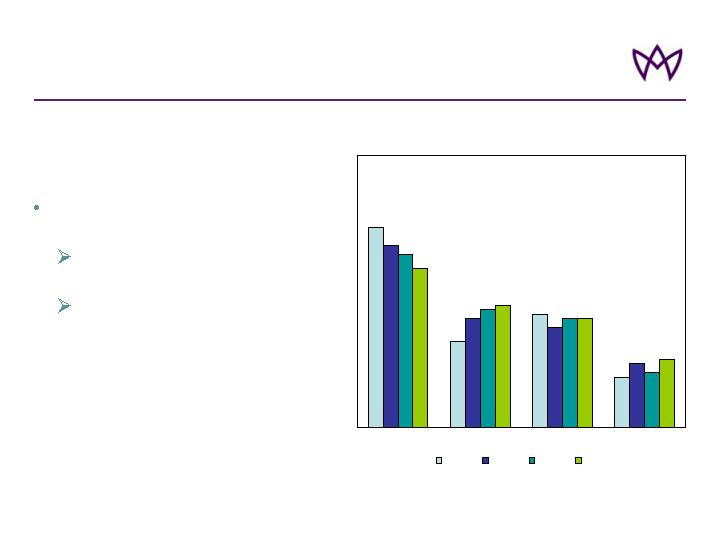
GWP Underwriting Pattern
44
19
25
11
40
24
22
14
38
26
24
12
35
27
24
15
Q1
Q2
Q3
Q4
2003
2004
2005
2006
Production pattern shifted from
44% in Q1 2003 to 35% in 2006
Diversification strategy
results coming through
Reflects changing business
mix as additional lines of
business have been added
GWP by Quarter (% of annual total)
19
AHL: NYSE

Improving Absolute Returns
Pick-up in yield
Investment Return
$200m hybrid offering and $200m buy-back completed;
authorisation for an additional $100m share buy-back
Financial Leverage
Re-distribution of income between operating companies
will result in reduced average tax rate
Tax Rate
Increase due to growth in reserves
Investment
leverage
Market conditions expected to remain attractive in most
lines
Combined Ratio
Reduction in GWP offset by reduction in ceded premium
Operating leverage
Significant reduction in retrocession purchased; risk
tolerances unchanged
Ceded premium
Expected impact
on ROAE
Outlook 2007
Lever
Targeted Management of Underlying Levers of ROE
20
AHL: NYSE
0%
5%
10%
15%
20%
25%
30%
35%
U/W Profit
Earned RI
Costs
Invest
Income
Other inc
pref divs
Tax
Total
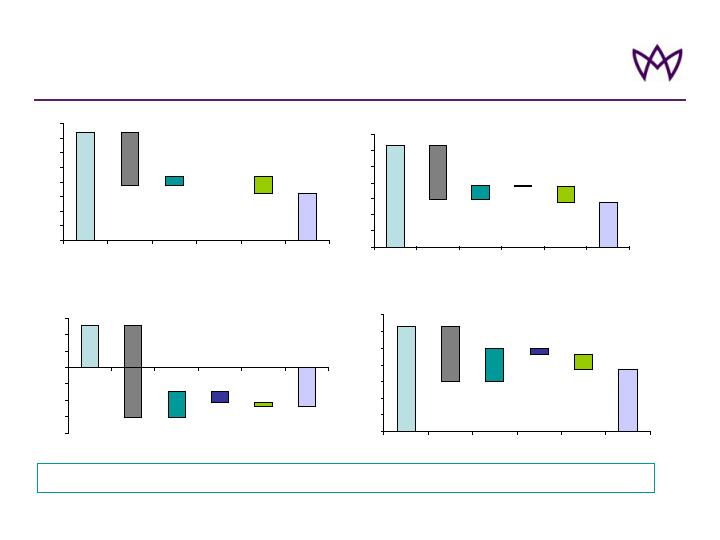
Decomposition of Historical ROAE*
Increasing Contribution from Investment Income
2004
2006
2005
0%
5%
10%
15%
20%
25%
30%
35%
U/W Profit
Earned RI
Costs
Invest
Income
Other
Tax
Total
32%
-17%
5%
-0.4%
-5%
-20%
-15%
-10%
-5%
0%
5%
10%
15%
U/W Profit
Earned RI
Costs
Invest
Income
Other
Tax
Total
-28%
13%
8%
-1%
-11%
32%
-17%
10%
-2%
19%
2003
0%
5%
10%
15%
20%
25%
30%
35%
40%
U/W Profit
Earned RI
Costs
Invest
Income
Other
Tax
Total
37%
-18%
3%
-6%
16%
14%
-3%
-5%
21
* Reconciliation of Average Equity to closing shareholders’ equity is provided in our quarterly financial supplements available in the Financial Results section of the
Investor Relations page of Aspen website at www.aspen.bm
AHL: NYSE

(1)
Reconciliations of Average Equity to closing shareholders’ equity and operating income to net income are provided in our 4Q06 financial supplement available on the Aspen website at www.aspen.bm
(2)
Pro forma Average Equity is reduced by $167 million from average equity assuming that our $200 million share repurchase program occurred on January 1, 2006.
(3)
Pro forma net income and operating income reduces net income and operating income by the additional preference share dividends payable assuming the $200 million share
repurchase program occurred on January 1, 2006.
Calculation of Pro Forma ROAE
AHL:NYSE
2006
FY
Average Equity reported in earnings release (1)
$1,955
Pro forma Average Equity (2)
$1,788
Net Income adjusted for preference share dividend
$363
Operating Income adjusted for preference share dividend (1)
$360
Pro forma net income adjusted for preference share dividend (3)
$351
Pro forma operating income adjusted for preference share dividend (3)
$349
ROAE: Net Income adjusted for preference share dividend
18.5%
ROAE: Operating Income adjusted for preference share dividend
18.4%
Pro forma ROAE: Net Income adjusted for preference share dividend
19.7%
Pro forma ROAE: Operating Income adjusted for preference share dividend
19.5%
AHL: NYSE
22
(US$ in millions)
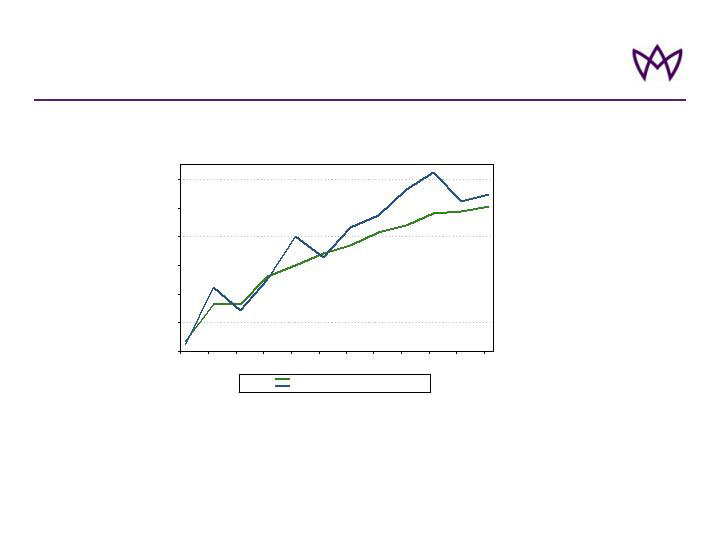
Improvement in Investment Yield
2.00%
2.50%
3.00%
3.50%
4.00%
4.50%
5.00%
Mar-04
Jun-04
Sep-04
Dec-04
Mar-05
Jun-05
Sep-05
Dec-05
Mar-06
Jun-06
Sep-06
Dec-06
Aspen Book Yield
3-Year Treasury Market Yield
Fixed income management has kept the improvement in our book yield
in-line with the 3 year Treasury market yield.
In recognition that the Fed was to begin a period of increasing the Federal Funds Rate in
2004, Aspen embarked on an incremental duration extension program to capture book
yield as the Fed raised rates. Aspen also recognized the value of extending duration into
the steep yield curve during 2004. The result has been a pick up in book yield of
approximately 235 basis points.
23
AHL: NYSE
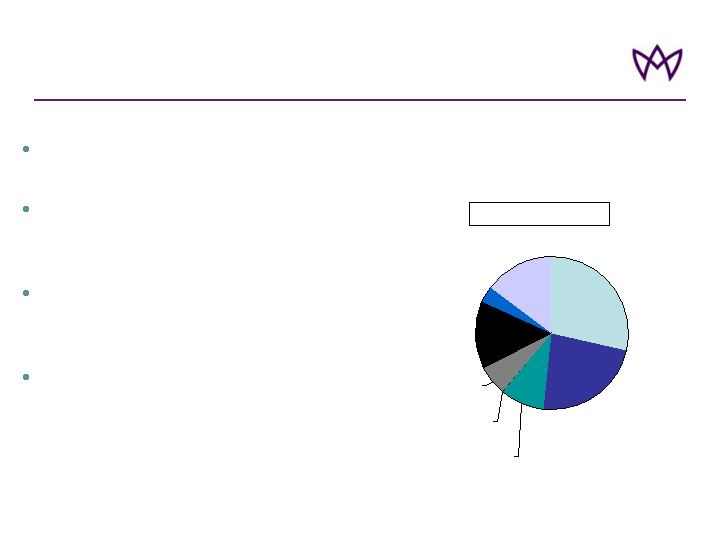
U.S. government
and agency
securities
28.7%
Corporate
securities
23.0%
Foreign
government
9.4%
Asset-backed
securities
6.2%
Mortgage-backed
securities
14.4%
Hedge funds
3.4%
Short-term
investments
14.9%
Municipals
0.03%
Portfolio investments to limit book
value volatility
Diversified, highly-rated, liquid
fixed income portfolio. AAA rating
capture yield curve opportunities
Strict guidelines on overall
portfolio concentration, credit and
duration
Fixed Income duration of 3.01
years and book yield of 4.52%, at
December 2006 (vs. 2.86 years
and 4.08% at December 2005)
Investment portfolio sector allocations
(Excluding Cash and Cash Equivalents)
As of December 31, 2006
100% = $4.7 billion
Investment Strategy
24
AHL: NYSE

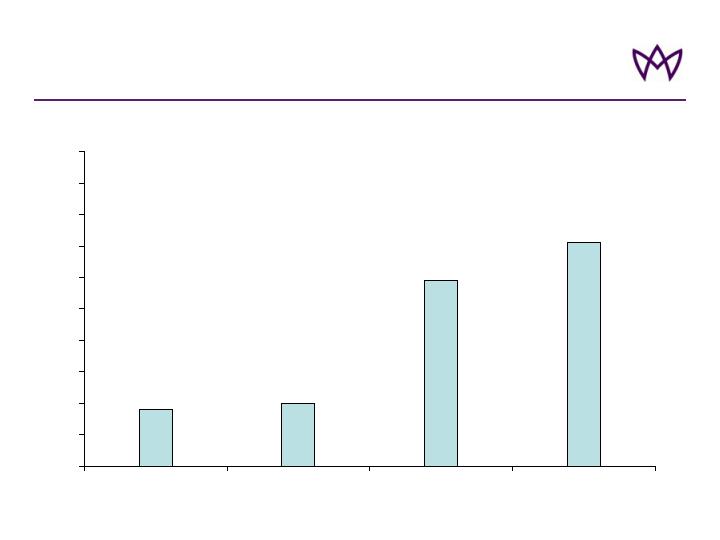
Continued extension of fixed income portfolio
duration in-line with liability duration and long-term
yield curve and interest rate outlook
Fixed income portfolio duration of 1.1 years in
late 2003 to 3.00 years at December 31, 2006
Strategy of incrementally diversifying investment
portfolio away from 100% fixed income securities
April 1, 2006 invested 3% of assets in two low-
volatility, diversified hedge funds-of-funds
February 1, 2007 invested an additional 3% of
assets in low-volatility, diversified hedge funds-
of-funds
Continue to actively monitor credit spreads and
sector allocations and effect changes when
appropriate
Fixed Income Portfolio Duration
Investment Strategy: Growth Opportunities
25
Dec-
04
Mar-
05
Jun-
05
Sep-
05
Dec-
05
Mar-
06
Jun-
06
Sep-
06
Dec-
06
Dec-
04
Mar-
05
Jun-
05
Sep-
05
Dec-
05
Mar-
06
Jun-
06
Sep-
06
Dec-
06
Yield
Book
Market
AHL: NYSE

2007 Guidance
(*) Assumes no major losses or prior year reserve movements
As provided on February 9, 2007 earnings conference call
16% to 19%
Tax Rate
$135 million
Assumed Average Cat-Load
$230 – $250 million
Investment Income
83% – 88%*
Combined Ratio
6% – 8% of GWP
% Premium Ceded
$1.9 billion+ 5%
GWP
Implied ROE of 16% – 20%
26
AHL: NYSE
Float as a % of shares outstanding
Improved Share Trading Liquidity
18%
20%
59%
71%
0%
10%
20%
30%
40%
50%
60%
70%
80%
90%
100%
12/31/03
12/31/04
12/31/05
12/31/06
27
AHL: NYSE

Conclusions
Robust business model — enhanced returns with reduced volatility
Market conditions remain attractive in 2007
Strong risk management and ROAE
Focused management of underlying ROAE drivers to improve
returns
Selective organic growth opportunities
Enhanced Returns with Lower Volatility
28
AHL: NYSE

Standard & Poor’s on the Aspen Group
“…Aspen’s proven management team, strong ERM, strong earnings, strong competitive position, and strong capitalization… will be reflected in reduced earnings volatility prospectively.”
-- November 27, 2006
29
AHL: NYSE