
Aspen Insurance Holdings Limited
May 2007
Non-Deal Roadshow
Exhibit 99.1

Safe Harbor Disclosure
This slide presentation is for information purposes only. It should be read in conjunction with our financial supplement posted on our website on the Investor Relations page and with other documents filed or to
be filed shortly by Aspen Insurance Holdings Limited (the “Company” or “Aspen”) with the U.S. Securities and Exchange Commission.
Non-GAAP Financial Measures
In presenting Aspen's results, management has included and discussed certain "non-GAAP financial measures", as such term is defined in Regulation G. Management believes that these non-GAAP measures,
which may be defined differently by other companies, better explain Aspen's results of operations in a manner that allows for a more complete understanding of the underlying trends in Aspen's business.
However, these measures should not be viewed as a substitute for those determined in accordance with GAAP. The reconciliation of such non-GAAP financial measures to their respective most directly
comparable GAAP financial measures in accordance with Regulation G is included herein or in the financial supplement, as applicable, which can be obtained from the Investor Relations section of Aspen's
website at www.aspen.bm.
Application of the Safe Harbor of the Private Securities Litigation Reform Act of 1995:
This presentation contains, and Aspen's earnings conference call may contain, written or oral "forward-looking statements" within the meaning of the U.S. federal securities laws. These statements are made
pursuant to the safe harbor provisions of the Private Securities Litigation Reform Act of 1995. Forward-looking statements include all statements that do not relate solely to historical or current facts, and can be
identified by the use of words such as "expect," "intend," "plan," "believe," "project," "anticipate," "seek," "will," "estimate," "may," "continue," and similar expressions of a future or forward-looking nature.
All forward-looking statements address matters that involve risks and uncertainties. Accordingly, there are or will be important factors that could cause actual results to differ materially from those indicated in
these statements. Aspen believes these factors include, but are not limited to: the impact that our future operating results, capital position and rating agency and other considerations have on the execution of
any capital management initiatives; the impact of any capital management activities on our financial condition; the impact of acts of terrorism and related legislation and acts of war; the possibility of greater
frequency or severity of claims and loss activity, including as a result of natural or man-made catastrophic events such as Hurricanes Katrina, Rita and Wilma, than our underwriting, reserving or investment
practices have anticipated; evolving interpretive issues with respect to coverage as a result of Hurricanes Katrina, Rita and Wilma; the level of inflation in repair costs due to limited availability of labor and
materials after catastrophes; the effectiveness of Aspen's loss limitation methods; changes in the availability, cost or quality of reinsurance or retrocessional coverage, which may affect our decision to purchase
such coverage; the reliability of, and changes in assumptions to, catastrophe pricing, accumulation and estimated loss models; loss of key personnel; a decline in our operating subsidiaries' ratings with
Standard & Poor's, A.M. Best Company or Moody's Investors Service; changes in general economic conditions including inflation, foreign currency exchange rates, interest rates and other factors that could
affect our investment portfolio; the number and type of insurance and reinsurance contracts that we wrote at the January 1st and other renewal periods in 2007 and the premium rates available at the time of
such renewals within our targeted business lines; increased competition on the basis of pricing, capacity, coverage terms or other factors; decreased demand for Aspen’s insurance or reinsurance products and
cyclical downturn of the industry; changes in governmental regulations, interpretations or tax laws in jurisdictions where Aspen conducts business; proposed and future changes to insurance laws and
regulations, including with respect to U.S. state- and other government-sponsored reinsurance funds and primary insurers; Aspen or its Bermudian subsidiary becoming subject to income taxes in the United
States or the United Kingdom; the effect on insurance markets, business practices and relationships of ongoing litigation, investigations and regulatory activity by the New York State Attorney General's office
and other authorities concerning contingent commission arrangements with brokers and bid solicitation activities; the total industry losses resulting from Hurricanes Katrina, Rita and Wilma and the actual
number of Aspen's insureds incurring losses from these storms; and with respect to Hurricanes Katrina, Rita and Wilma, Aspen’s continued reliance on loss reports received from cedants and loss adjustors,
Aspen's reliance on industry loss estimates and those generated by modeling techniques, the impact of these storms on Aspen's reinsurers, any changes in Aspen's reinsurers' credit quality, the amount and
timing of reinsurance recoverables and reimbursements actually received by Aspen from its reinsurers and the overall level of competition and the related demand and supply dynamics as contracts come up for
renewal. For a more detailed description of these uncertainties and other factors, please see the "Risk Factors" section in Aspen's Annual Report on Form 10-K for the fiscal year ended December 31, 2006 as
filed with the U.S. Securities and Exchange Commission on February 22, 2007. Aspen undertakes no obligation to publicly update or revise any forward-looking statements, whether as a result of new
information, future events or otherwise. Readers are cautioned not to place undue reliance on these forward-looking statements, which speak only as of the dates on which they are made.
2

Contents
Strategy and Approach
2007 Q1 Financial Performance
Key Themes
Market Conditions
Florida Legislative Changes
2007 Outlook
3

Strategy: Key Components
Our strategy has 3 key components
1.
‘Specialty’ insurer and reinsurer
2.
Diversified operating platform
3.
Focus on book value growth per share, not top line
Robust and Sustainable Business Model to Deliver Consistent ROEs
4
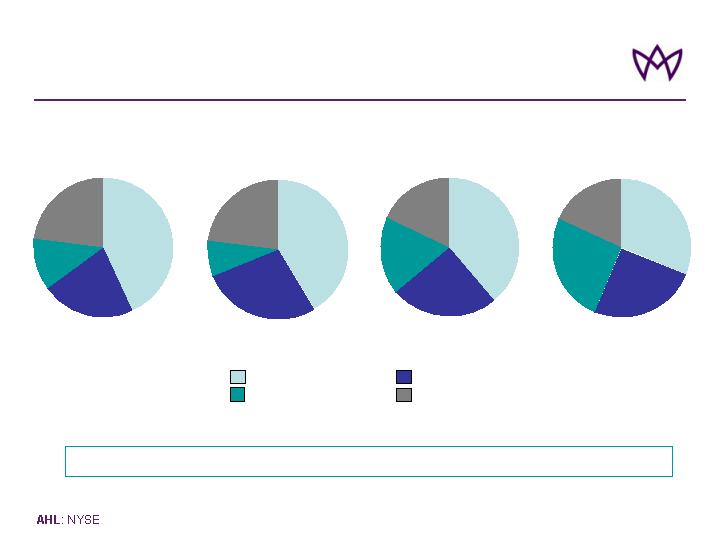
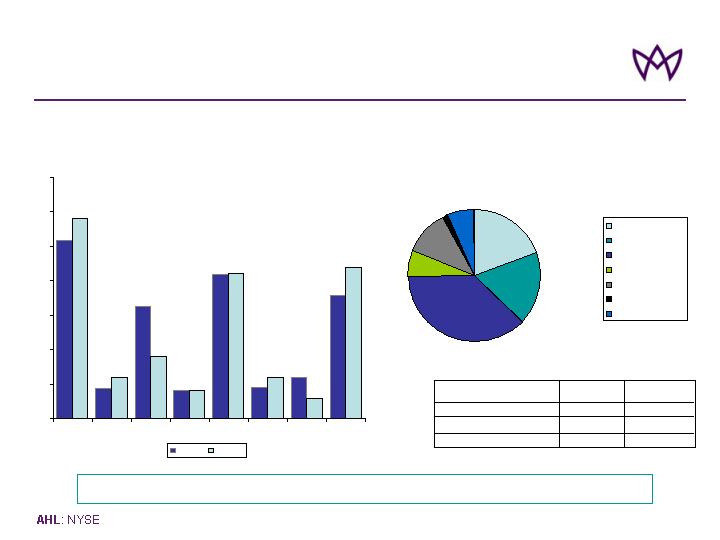
Increased Diversification
* 2003 Specialty lines includes QQS of Wellington Syndicate 2020
Significant Growth in Specialty Lines And Improved Spread of Risk
*
2005
Property Reinsurance Casualty Reinsurance
Specialty Lines Insurance
100% = $1.3bn
2004
2003
2006
100% = $1.6bn
100% = $2.1bn
100% = $1.9bn
Gross Written Premiums
5
31%
26%
18%
25%
39%
18%
18%
25%
41%
8%
23%
28%
43%
12%
23%
22%

Focus is on Growth in Book Value Per Share, Not Top Line
Core Beliefs about Growth
GWP and / or capital may shrink before we grow, according to market
conditions
Growth must be profitable and increase book value per share
Growth in new lines should meet two overarching sets of criteria
Underwriting fit
Operational fit
6
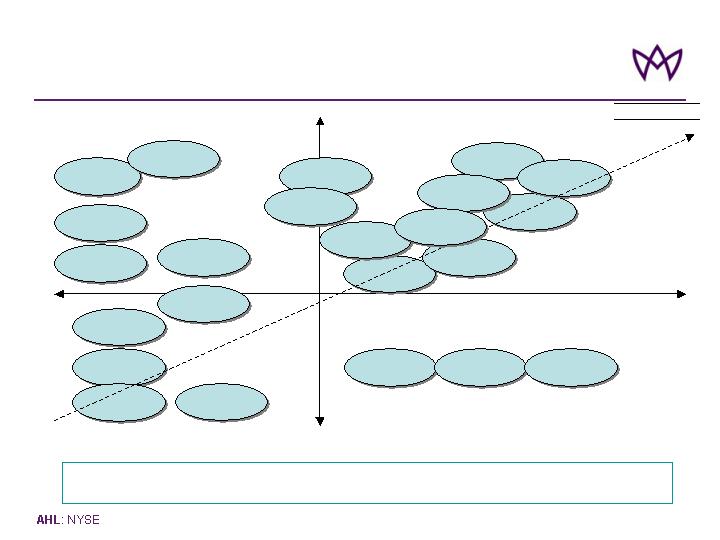
Approach to Growth - ‘Palette’
(lines we do not currently write)
Focus on Opportunities which Offer Best Fit with Our Underwriting and Operational
Capabilities
Financial
Institutions
Personal
Accident
UK D&O
UK PI
Operational fit
Underwriting fit
Medical
Expenses
Excess
Casualty
Bloodstock
Cargo and
Specie
Credit and
surety
Homeowners
Standard
Auto
US D&O
in US
High Net
Worths
Agriculture
Political
risk
US Airlines
Binder
Business
US
Products
Liability
War and
Terrorism
UK SMEs
Primary
Japanese
Property
HIGH
LOW
7
ILLUSTRATIVE
Construction
Liability
General
Liability

Contents
Strategy and Approach
2007 Q1 Financial Performance
Key Themes
Market Conditions
Florida Legislative Changes
2007 Outlook
8

Financial Highlights - Q1 2007
(US$ in millions, except per share data)
Period Ended March 31
2007
2006
o Gross Written Premiums
$636.5
$678.7
o Net Written Premiums
555.1
451.9
o Net Earned Premiums
439.0
402.6
o Underwriting Income
90.5
38.7
o Net Investment Income
67.5
44.5
Net Income after tax
121.9
61.8
GAAP Ratios:
Loss Ratio
51.4%
57.7%
Expense Ratio
28.0%
32.7%
Combined Ratio
79.4%
90.4%
Full Year ROAE ¹
22.9%*
12.5%*
Diluted Operating
Earnings Per Ordinary Share
$1.26
$0.59
97% Increase in NI and Annualised ROAE of 22.9%
•Annualised
¹ Reconciliation of Average Equity to closing shareholders’ equity is provided in our quarterly financial supplements available in the Financial Results section
of the Investor Relations page of Aspen’s website at www.aspen.bm
9
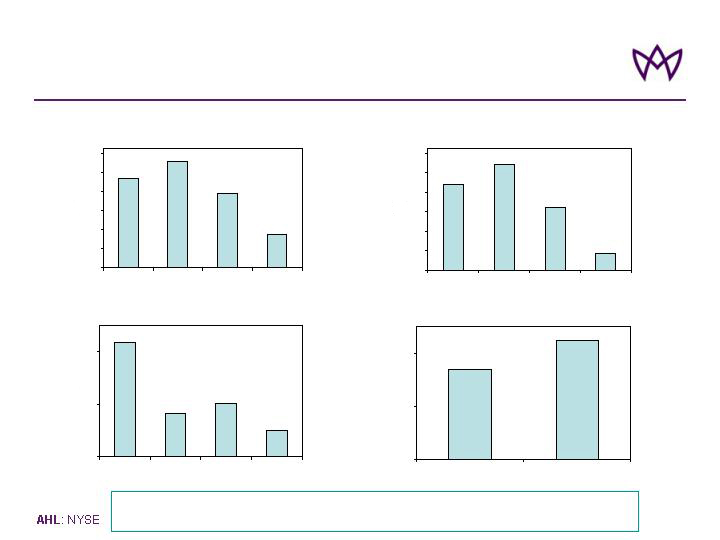
Results by Business Line – Q1 2007
Strong Performance From Each Product Segment and Significant
Contribution from Investments
10
Income Contribution
68
90
0
40
80
Net Investment Income
Underwriting Profit
Underwriting Profit
44
16
20
10
0
20
40
Property Re
Casualty Re
Specialty
Lines
Insurance
NWP
176
217
127
35
0
40
80
120
160
200
240
Property Re
Casualty Re
Specialty
Lines
Insurance
GWP
187
223
156
70
0
40
80
120
160
200
240
$ms
$ms
$ms
$ms
Property Re
Casualty Re
Specialty
Lines
Insurance
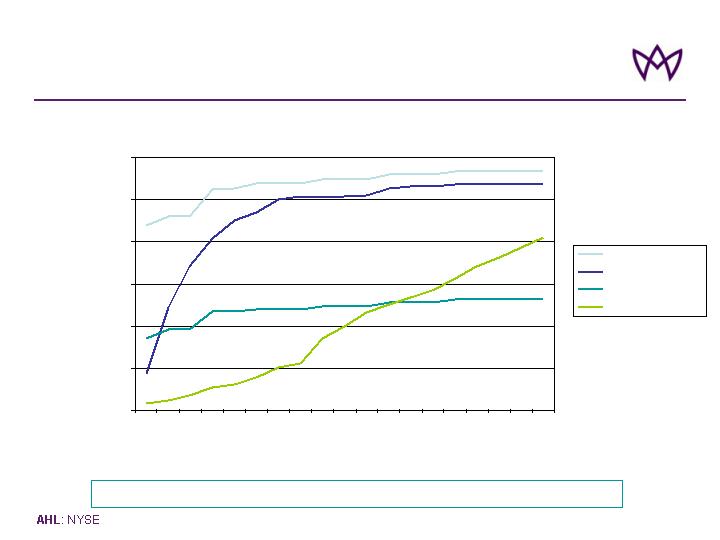
Katrina Loss Development
(in $ millions)
Gross Incurred Claims Stabilized
11
0
200
400
600
800
1,000
1,200
Gross Ultimate
Gross Incurred
Net Ultimate
Gross Paid
Sep-05
Oct-05
Nov-05
Dec-05
Feb-06
Jan-06
Mar-06
Apr-06
May-06
Jun-06
Aug-06
Sep-06
Oct-06
Jul-06
Dec-06
Jan-07
Nov-06
Feb-07
Mar-07

Improvement in Expense Ratio
28.0%
2.0%
26.0%
9.6%
16.4%
Q1 2007
28.2%
4.0%
24.2%
10.3%
13.9%
Q4 2006
29.4%
4.5%
24.9%
8.5%
16.4%
Q2 2006
27.0%
4.4%
22.6%
7.2%
15.4%
Q3 2006
32.7%
Net expense ratio
6.1%
Effect of reinsurance
26.6%
Total gross expense ratio
7.7%
General and administrative expenses
18.9%
Acquisition expenses
Q1 2006
% of Gross Earned Premium
470 bps Improvement in Net Expense Ratio Q107 vs. Q106
12
19%
18%
37%
7%
11%
2%
6%
Govt
Agency
AAA
AA+/AA/AA-
A+/A/A-
BBB+/BBB/BBB-
NR
Investment Portfolio
Asset Class Allocation
Portfolio Credit Ratings
(as at March 31, 2007)
AAA
AA+
Overall Fixed Income Rating
AAA
3%
Actual as at
December 31, 2006
AAA
Overall Portfolio Rating
6%
Fund of Hedge Funds
Actual as at
March 31, 2007
Indicator (S&P Ratings)
91% of Portfolio ‘A’ or Better
13
26%
4%
16%
5%
6%
18%
6%
9%
4%
21%
6%
3%
21%
4%
23%
28%
0%
5%
10%
15%
20%
25%
30%
35%
Govt
Agency
MBS
CMBS
Corp
ABS
FOHF
Cash/ST
Mar 07
Dec 06
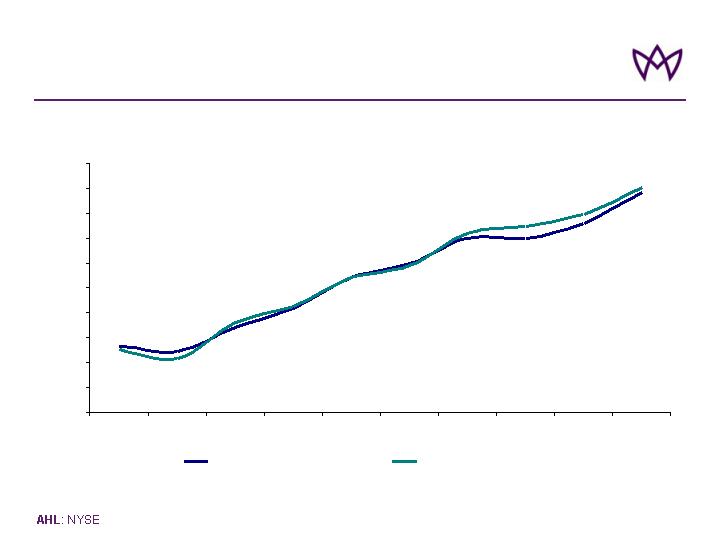
Improvement in Investment Yield
(*) including cash and cash equivalents but excluding FoHF - Initial investments in Fund of Hedge Funds were made on April 1, 2006 with
subsequent investment on February 1, 2007.
*
14
3.0%
3.2%
3.4%
3.6%
3.8%
4.0%
4.2%
4.4%
4.6%
4.8%
5.0%
Q404
Q105
Q205
Q305
Q405
Q106
Q206
Q306
Q406
Q107
Fixed Income portfolio book yield
Aggregate portfolio book yield

Contents
15
Strategy and Approach
2007 Q1 Financial Performance
Key Themes
Market Conditions
Florida Legislative Changes
2007 Outlook

Key Themes: 2006/2007
4 Key Themes in 2006 / 2007
1.
Reducing volatility
2.
Strengthening risk management
3.
Build-out of management team
4.
Improving absolute returns
16
Ongoing
2005
2006
2007
2005
2006
2007
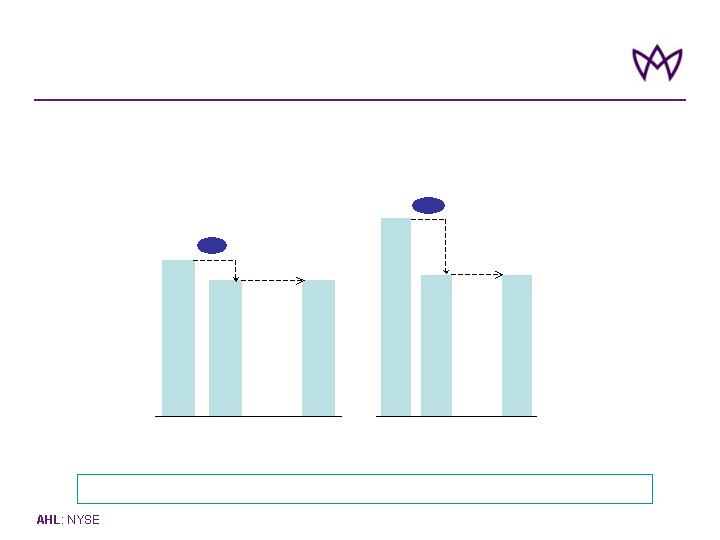
Reducing Volatility – Reduced Risk Tolerance
Significant Reduction in Risk Tolerances…
Single Zone Risk Tolerance Per Peril Net of Reinsurance, Post Tax
-1000bp
20.0%
17.5%
-250bp
17
17.5%
1-in-250 Tolerance
(% of Surplus)
1-in-100 Tolerance
(% of Surplus)
35%
25%
25%
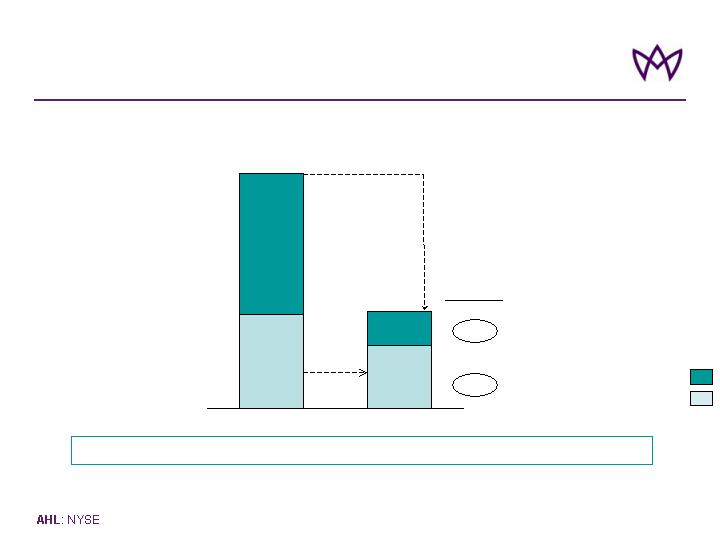
Reducing Volatility – Improved Risk Profile
Recoveries
2005 Hurricanes*: Actual Losses vs. As if @ May’07 - Gross Loss and Net of Recoveries**
$ millions and % change
Net loss***
Notes:
(*) Katrina, Rita, Wilma
(**) Losses and recoveries: after inwards and outwards reinstatement premium, additional premium (AP) and tax
(***) Hurricane Katrina: Actual recoveries include $21m recoveries from the Cat Swap. As-if recoveries include no recoveries from the Cat Swap, but if Katrina
happened prior to August 18 , there will be an additional $9m of recoveries
$1,573m
$647m
-58%
-33%
% change
Gross
Net
…Resulting in Significant Reduction in Gross and Net Exposure
th
18
628
418
945
229
Actual
As-if@May 07

Strengthening Risk Management
Group / regulatory / reputational
Operational
Liquidity
Minimize risk
Non – core risks
Credit
Strategic
Investment
Optimize risk- return
Core risks
Underwriting
Risk Type
Risk management policy
Risk Type
Managing Volatility of Results
19

Build-out of Management Team
Announced 4 new significant appointments YTD 2007
Glyn Jones
Chairman
Nathan Warde
President of US Insurance
Matt Yeldham*
Head of International Insurance
Richard Houghton
CFO
Focus on re-positioning US E&S operation
Focus on Non-US Insurance and Specialty Lines businesses
Continued focus on strengthening / streamlining operational
infrastructure and capabilities
Management Team Build-out Completed
* Joins October 2007
Strategic evolution and enhanced performance
20

Improving Absolute Returns
* Reconciliation of Average Equity to closing shareholders’ equity is provided in our quarterly financial supplements available in the Financial Results section of the
Investor Relations page of Aspen’s website at www.aspen.bm
Annualized ROAE* of 22.9% in 1Q07
$200m share-buy back program
completed Q4 2006; authorisation for a
further $100m
Capital Management
35.0% of net income (2004) 55.4% of
net income (1Q07)
Increasing Contribution from
Investment Income
BVPS $19.30 (2005) $23.62 (1Q07)
Book Value Growth
Financial leverage ratio increased from
14.4% (2004) to 24.2% (1Q07)
Improved Balance Sheet
Efficiency
21

Strategy and Approach
2007 Q1 Financial Performance
Key Themes
Market Conditions
Florida Legislative Changes
2007 Outlook
Contents
22
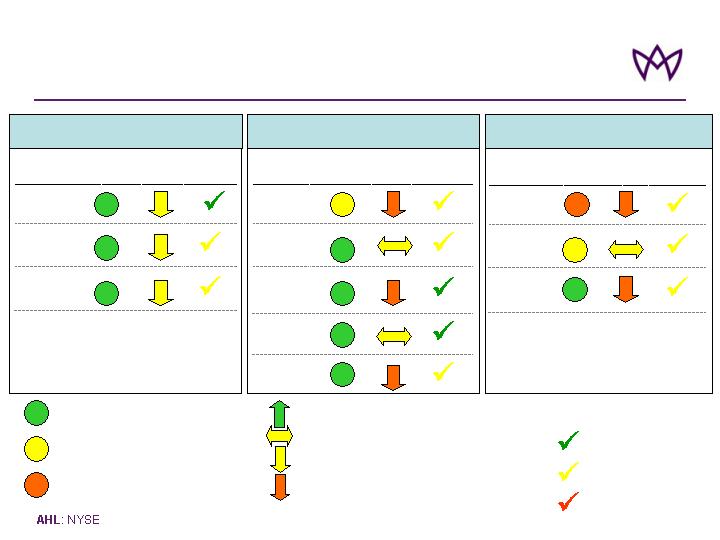
Market Conditions
2007 Outlook: Property and Specialty Lines
Market
Trend
Risk Excess
Treaty
Pro Rata
Catastrophe
Treaty
Aspen 1Q07
Performance
Market
Conditions
Line
Market
Trend
Specialty
Reinsurance
Marine &
Energy Liability
Offshore
Energy
Physical
Damage
Marine Hull
Aviation
Aspen 1Q07
Performance
Market
Conditions
Line
Market
Trend
International
Property Fac.
E&S Property
UK Property
Aspen 1Q07
Performance
Market
Conditions
Line
Property Reinsurance
Specialty Lines
Property Insurance
= Absolute rate levels attractive
= Absolute rate levels mixed
= Absolute rate levels very challenging
= 12 month rate trend positive
= 12 month rate trend neutral
= 12 month rate trend slightly downwards
= 12 month rate trend downwards
23
Strong
Good
Improvement Required
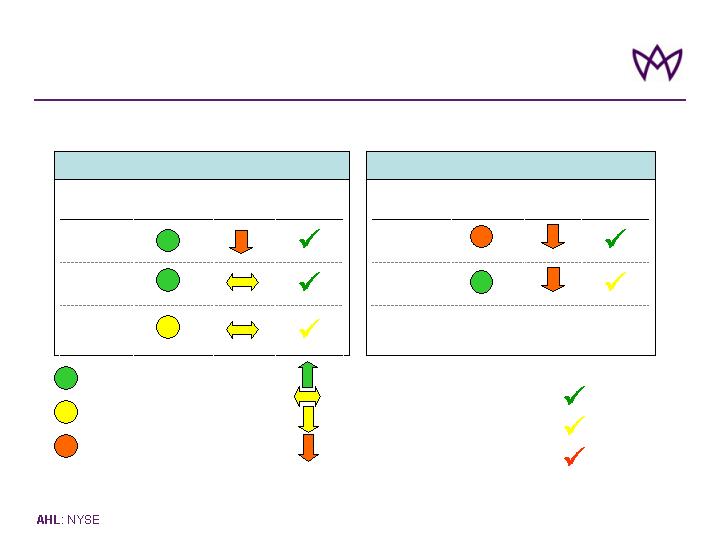
Market Conditions 2007 Outlook: Casualty Lines
Market
Trend
Casualty
Facultative
US Casualty
International
Casualty
Aspen 1Q07
Performance
Market
Conditions
Line
Market
Trend
E&S Casualty
UK Liability
Aspen 1Q07
Performance
Market
Conditions
Line
Casualty Reinsurance
Casualty Insurance
= Absolute rate levels attractive
= Absolute rate levels mixed
= Absolute rate levels very challenging
24
Strong
Good
Improvement Required
= 12 month rate trend positive
= 12 month rate trend neutral
= 12 month rate trend slightly downwards
= 12 month rate trend downwards

Strategy and Approach
2007 Q1 Financial Performance
Key Themes
Market Conditions
Florida Legislative Changes
2007 Outlook
Contents
25
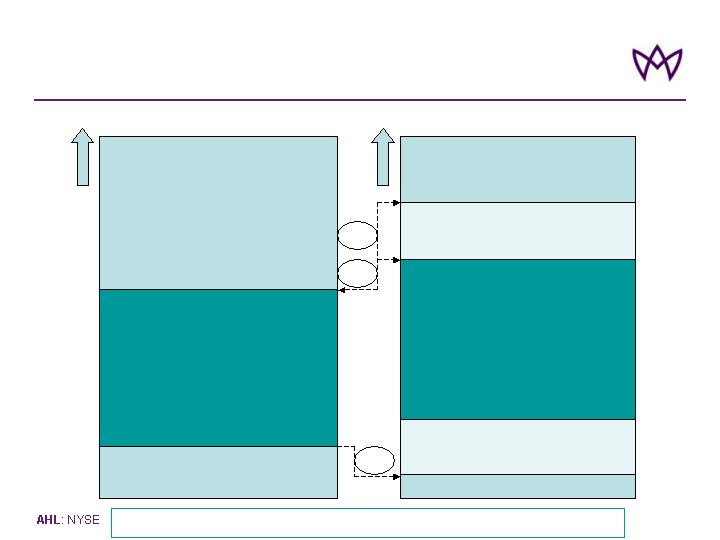
Florida Hurricane Catastrophe Fund (“FHCF”):
2006 vs. 2007
2006 2007
PRIVATE MARKET
LAYERS
$16.7bn xs $5.3bn
FHCF
$21bn
$5.3bn
PRIVATE MARKET
LAYERS
$12bn TICL LAYER
- OPTIONAL
$18bn xs $6bn
FHCF
$3bn xs $3bn TEACO
LAYER - OPTIONAL
$36bn
$24bn
$6bn
$3bn
PRIVATE MARKET
LAYERS
PRIVATE MARKET
LAYERS
$2.3bn
$12bn
$2.3bn
Capacity Offered by FHCF Increased by up to $16.6 bn
0
0
26

Impact of Florida Legislation
Buying requirement increased significantly due to model change = circa +$28bn
$61bn
$54bn
$22bn
RMS v5
$89bn
Combined
$70bn
Personal
$39bn
Commercial
RMS v6
Limitations on cover offered by FHCF
Sold for named hurricane only
90% of each limit provided only
No reinstatement of cover
Opportunity to offer cover ‘below, above
and behind’ FHCF
Impact Less Dramatic than First Perceived
27
Florida 100 year PMLs*
* Probable Maximum Loss
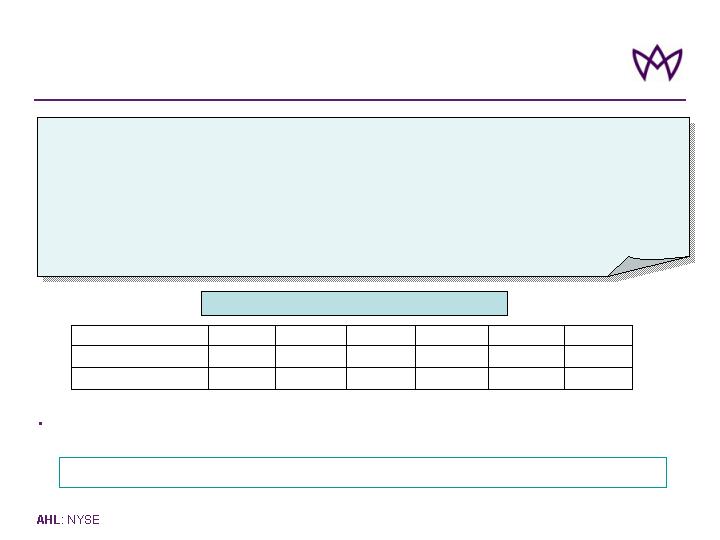
Hurricane Risk
“As we know our climate is changing, the average temperature of the earth is rising, and greenhouse
gas emissions are increasing. We also know that climate remains an extraordinary complex area of
scientific study. While our understanding of the science continues to evolve and improve, there is still
much that we do not know and cannot fully recognize in efforts to model and predict future climate
system behaviour”.
Rex W Tillerson
Chairman and CEO, Exxon Mobil Corporation, Texas
Excerpt from his Keynote Speech at CERA Week 2007 (February 13 2007)
5.0
8.9
2006
8.3
7.5
7.7
7.8
7.5
Consensus Forecast*
?
15.0
9.0
7.0
4.0
Actual
2007
2005
2004
2003
2002
Year
Threat of Hurricane Risk Remains Very Acute and Hard to Predict
* Average of CPC, CSU, WRC, AEF, TSR
¹ Accurate Environmental Forecasting
Hurricane Forecasts vs. Actual 2002 - 2006
AEF¹ estimated 52% chance of no mainland USA strikes in 2006!
28

Strategy and Approach
2007 Q1 Financial Performance
Key Themes
Market Conditions
Florida Legislative Changes
2007 Outlook
Contents
29
80%
Target Combined Ratios: Across Cycles
E2007
E2007
95%
100%
105%
90%
85%
75%
95%
100%
105%
90%
85%
80%
75%
95%
100%
105%
90%
85%
80%
75%
78%-82%
81%-
85%
Cycle
Range
83%-88%
92%-
97%
Cycle
Range
Property and
Specialty Lines
Casualty Lines
Overall
E2007
92%-97%
85%-
92%
Cycle
Range
Market Conditions in 2007 Supportive of Continuing
Strong Underwriting Performance
Note: Assuming no major losses or prior year reserve movements
30

Improving Absolute Returns
Pick-up in yield
Investment Return
$200m hybrid offering and $200m buy-back completed;
authorisation for an additional $100m share buy-back
Financial Leverage
Re-distribution of income between operating companies
will result in reduced average tax rate
Tax Rate
Increase due to growth in reserves
Investment
leverage
Market conditions expected to remain attractive in most
lines
Combined Ratio
Reduction in GWP offset by reduction in ceded premium
Operating leverage
Significant reduction in retrocession purchased; risk
tolerances unchanged
Ceded premium
Expected impact
on ROAE
Outlook 2007
Lever
Targeted Management of Underlying Levers of ROAE
31

2007 Guidance
* Assumes no major losses or prior year reserve movements
Full 2007 Year Outlook
May 3, 2007
February 9, 2007
$135 million
16% to 19%
$230 – $250 million
83% – 88%*
6% – 8% of GWP
$1.9 billion + 5%
$115 million
(remainder of year)
16% to 19%
$250 – $270 million
83% – 88%*
6% – 8% of GWP
$1.8 billion + 5%
Tax Rate
Assumed Average Cat-Load
Investment Income
Combined Ratio
% Premium Ceded
GWP
Implied ROE of 16% – 20%
32

Aspen Insurance Holdings Limited
May 2007
Non-Deal Roadshow