
Aspen Insurance Holdings Limited
Exhibit 99.1
Chris O’Kane, Chief Executive Officer
Richard Houghton, Chief Financial Officer
Investor Presentation
August 2007
AHL: NYSE

Safe Harbor Disclosure
This slide presentation is for information purposes only. It should be read in conjunction with our financial supplement posted on our website on the Investor Relations page and with other documents filed or to be filed shortly by Aspen Insurance Holdings Limited (the “Company” or “Aspen”) with the U.S. Securities and Exchange Commission.
Non-GAAP Financial Measures
In presenting Aspen's results, management has included and discussed certain "non-GAAP financial measures", as such term is defined in Regulation G. Management believes that these non-GAAP measures, which may be defined differently by other companies, better explain Aspen's results of operations in a manner that allows for a more complete understanding of the underlying trends in Aspen's business. However, these measures should not be viewed as a substitute for those determined in accordance with GAAP. The reconciliation of such non-GAAP financial measures to their respective most directly comparable GAAP financial measures in accordance with Regulation G is included herein or in the financial supplement, as applicable, which can be obtained from the Investor Relations section of Aspen's website at www.aspen.bm.
Application of the Safe Harbor of the Private Securities Litigation Reform Act of 1995:
This presentation contains written or oral "forward-looking statements" within the meaning of the U.S. federal securities laws. These statements are made pursuant to the safe harbor provisions of the Private Securities Litigation Reform Act of 1995. Forward-looking statements include all statements that do not relate solely to historical or current facts, and can be identified by the use of words such as "expect," "intend," "plan," "believe," "project," "anticipate," "seek," "will," "estimate," "may," "continue," and similar expressions of a future or forward-looking nature.
In addition, any estimates relating to loss events involve the exercise of considerable judgment and reflect a combination of ground-up evaluations, information available to date from brokers and cedants, market intelligence, initial tentative loss reports and other sources. Due to the complexity of factors contributing to the losses and the preliminary nature of the information used to prepare estimates relating to the UK floods, there can be no assurance that Aspen's ultimate losses associated with these floods will remain within the stated amount.
All forward-looking statements address matters that involve risks and uncertainties. Accordingly, there are or will be important factors that could cause actual results to differ materially from those indicated in these statements. Aspen believes these factors include, but are not limited to: changes in the total industry losses resulting from the UK and Australian floods and Hurricanes Katrina, Rita and Wilma and the actual number of Aspen's insureds incurring losses from these events; with respect to the UK and Australian floods and Hurricanes Katrina, Rita and Wilma, Aspen’s reliance on loss reports received from cedants and loss adjustors, Aspen's reliance on industry loss estimates and those generated by modeling techniques, the impact of these events on Aspen's reinsurers, any changes in Aspen's reinsurers' credit quality, the amount and timing of reinsurance recoverables and reimbursements actually received by Aspen from its reinsurers and the overall level of competition and the related demand and supply dynamics as contracts come up for renewal; the impact that our future operating results, capital position and rating agency and other considerations have on the execution of any capital management initiatives; the impact of any capital management activities on our financial condition; the impact of acts of terrorism and related legislation and acts of war; the possibility of greater frequency or severity of claims and loss activity, including as a result of natural or man-made catastrophic events than our underwriting, reserving or investment practices have anticipated; evolving interpretive issues with respect to coverage as a result of Hurricanes Katrina, Rita and Wilma and any other events such as the UK floods; the level of inflation in repair costs due to limited availability of labor and materials after catastrophes; the effectiveness of Aspen's loss limitation methods; changes in the availability, cost or quality of reinsurance or retrocessional coverage, which may affect our decision to purchase such coverage; the reliability of, and changes in assumptions to, catastrophe pricing, accumulation and estimated loss models; loss of key personnel; a decline in our operating subsidiaries' ratings with Standard & Poor's, A.M. Best Company or Moody's Investors Service; changes in general economic conditions including inflation, foreign currency exchange rates, interest rates and other factors that could affect our investment portfolio; the number and type of insurance and reinsurance contracts that we wrote at the January 1st and other renewal periods in 2007 and the premium rates available at the time of such renewals within our targeted business lines; increased competition on the basis of pricing, capacity, coverage terms or other factors; decreased demand for Aspen’s insurance or reinsurance products and cyclical downturn of the industry; changes in governmental regulations, interpretations or tax laws in jurisdictions where Aspen conducts business; proposed and future changes to insurance laws and regulations, including with respect to U.S. state- and other government-sponsored reinsurance funds and primary insurers; Aspen or its Bermudian subsidiary becoming subject to income taxes in the United States or the United Kingdom; the effect on insurance markets, business practices and relationships of ongoing litigation, investigations and regulatory activity by the New York State Attorney General's office and other authorities concerning contingent commission arrangements with brokers and bid solicitation activities. For a more detailed description of these uncertainties and other factors, please see the "Risk Factors" section in Aspen's Annual Reports on Form 10-K as filed with the U.S. Securities and Exchange Commission on February 22, 2007. Aspen undertakes no obligation to publicly update or revise any forward-looking statements, whether as a result of new information, future events or otherwise. Readers are cautioned not to place undue reliance on these forward-looking statements, which speak only as of the dates on which they are made.
2
AHL: NYSE

Contents
Aspen at a Glance
Key Investment Considerations
Strategy and Approach
Financial Performance
Enhancing Returns
Cycle Management
UK Flood Losses
Market Conditions
2007 Guidance
Appendix
3
AHL: NYSE
Contents
Aspen at a Glance
Key Investment Considerations
Strategy and Approach
Financial Performance
Enhancing Returns
Cycle Management
UK Flood Losses
Market Conditions
2007 Guidance
Appendix
4
AHL: NYSE
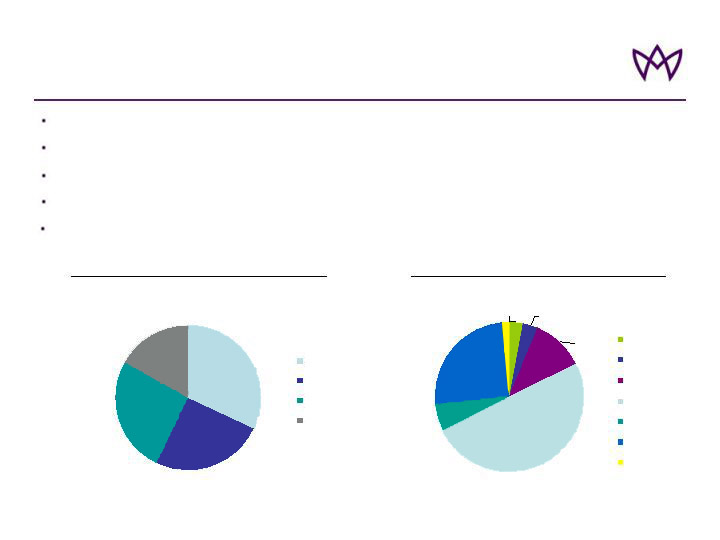
3%
3%
11%
51%
1%
25%
6%
Asia & Australia
Europe
UK
US & Canada
Worldwide Ex US
Worldwide inc US
Other
Aspen at a Glance
24%
26%
17%
33%
Prop Re
Casualty Re
Specialty Lines
Insurance
Underwriting Segment (GWP)
Geographical split of GWP
* Shareholders’ equity plus long-term debt
$2.25bn market cap (July 30, 2007)
$2.2bn common equity and $2.8bn total capital* (June 30, 2007)
Over 450 employees in Bermuda, UK, US, France and Switzerland
Ratings of A (S&P), A2 (Moody’s) and A / A- (AM Best, for Aspen UK and Aspen Bermuda)
$1.9bn Gross Written Premium (GWP) in 2006
100% = $1.8bn
5
100% = $1.8bn
12 months: July 1, 2006 – June 30, 2007
12 months: July 1, 2006 – June 30, 2007
[by location of cedant]
AHL: NYSE

Contents
Aspen at a Glance
Key Investment Considerations
Strategy and Approach
Financial Performance
Enhancing Returns
Cycle Management
UK Flood Losses
Market Conditions
2007 Guidance
Appendix
6
AHL: NYSE

Key Investment Considerations
Solid balance sheet
Diversified book of business
Strong underwriting results augmented by investment income growth
Tax rate reducing
Active capital management program
Established platforms from which we can grow; proven ability to add new
teams/lines
7
AHL: NYSE

Contents
Aspen at a Glance
Key Investment Considerations
Strategy and Approach
Financial Performance
Enhancing Returns
Cycle Management
UK Flood Losses
Market Conditions
2007 Guidance
Appendix
8
AHL: NYSE

Strategy: Key Components
Our strategy has 4 key components
1.
‘Specialty’ insurer and reinsurer
2.
Diversified operating platform: US, Bermuda, UK, France and Switzerland
3.
Enterprise Risk Management is our core strategic enabler
4.
Focus on book value growth per share, not top line
BVPS growth of 58.7% since Q4 2002, BVPS growth of 26.6% since
Jan 1, 2006
Objective: Deliver Consistent Above Average ROEs
9
AHL: NYSE

‘Specialty’ Insurer and Reinsurer
Selection of well chosen lines that match our core competencies
Mix of broad-based commercial and specialty lines
Choose businesses that reward us for specialized knowledge, not for scale
Future growth focused on specialty lines and more complex risks
Proven skill with lines that are complex, unpopular or have high barriers to entry
Effective differentiated risk management
Awarded ERM rating of “Strong”, 2nd highest level by S&P, placing Aspen in
top 14% in Europe
Well-chosen Businesses, Well-managed
10
AHL: NYSE
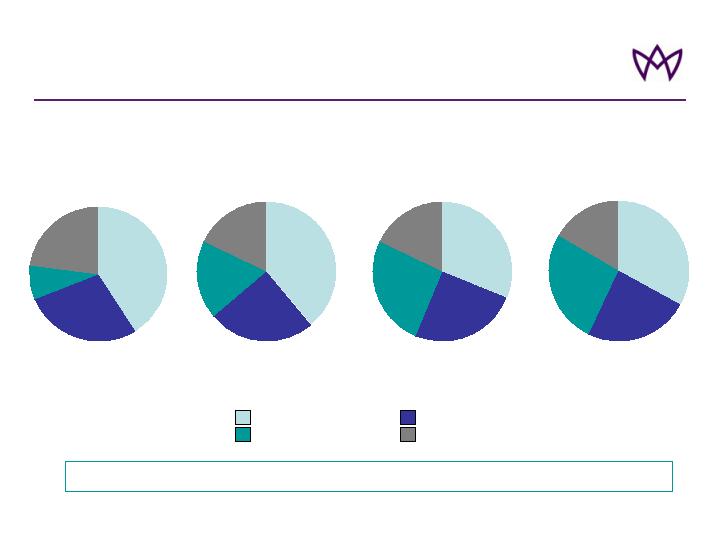
Well-managed Diversification
* 2003 Specialty lines includes QQS of Wellington Syndicate 2020
Targeted Growth in Specialty Lines And Improved Spread of Risk
Gross Written Premiums
11
FY 2005
Property Reinsurance
Casualty Reinsurance
Specialty Lines
Insurance
100% = $1.6bn
41%
8%
23%
28%
FY 2004
FY 2006
100% = $2.1bn
100% = $1.9bn
39%
18%
18%
25%
31%
26%
18%
25%
24%
26%
17%
33%
100% = $1.8bn
12 months: July 1, 2006 –
June 30, 2007
AHL: NYSE
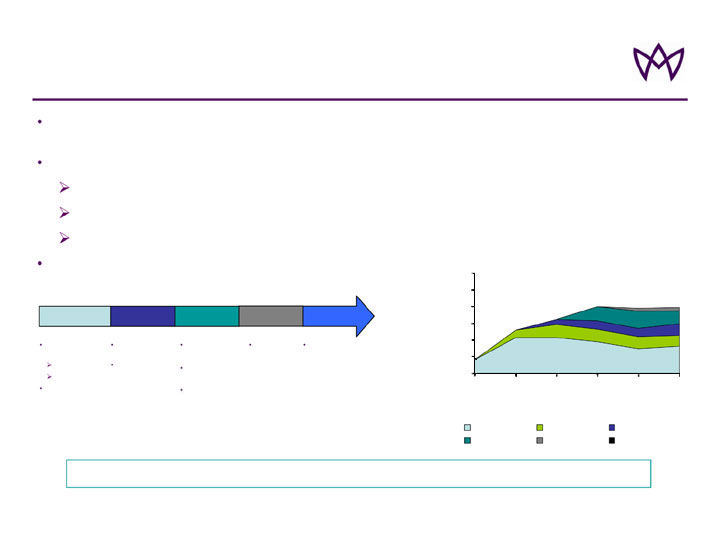
Profitable Expansion into New / Adjacent Lines
Progressive diversification of strategic footprint through incremental expansion into
adjacent business lines*
Key enablers:
Consistent with core competencies
Timing
Availability of proven, successful underwriting teams
Focus on non-correlating lines
2003
2004
2005
2007
Specialty
Reinsurance
Aviation
Marine
US Casualty Re
US Excess &
Surplus lines
Aspen Re
America
Aviation
Insurance
Marine
Insurance
Energy
Insurance
International
Property
Facultative
* Businesses shown for first year of meaningful premium contribution
** Projected for 2007
*** Underwriting commences 09/07
Diversification has Added over $1,070m** GWP in New Lines Since 2004
Development of Aspen’s GWP
0
500
1000
1500
GWP $m
2000
2500
3000
2002
2003
2004
2005
2006
2007
Year
Original Lines
2003 Lines
2004 Lines
2005 Lines
2006 Line
2007 Lines **
2006
Professional
Indemnity***
12
AHL: NYSE

Focus is on Growth in Book Value Per Share, Not Top Line
Core Beliefs about Growth
GWP and / or capital may shrink before we grow, according to market
conditions
Growth must be profitable and increase book value per share
Growth in new lines should meet two overarching sets of criteria
Underwriting fit
Operational fit
13
AHL: NYSE
UK
Commercial
Auto
War and
Terrorism
Cargo and
Specie
Excess
Casualty
US Retailer
Property
Accident &
Health/ Medical
Expenses
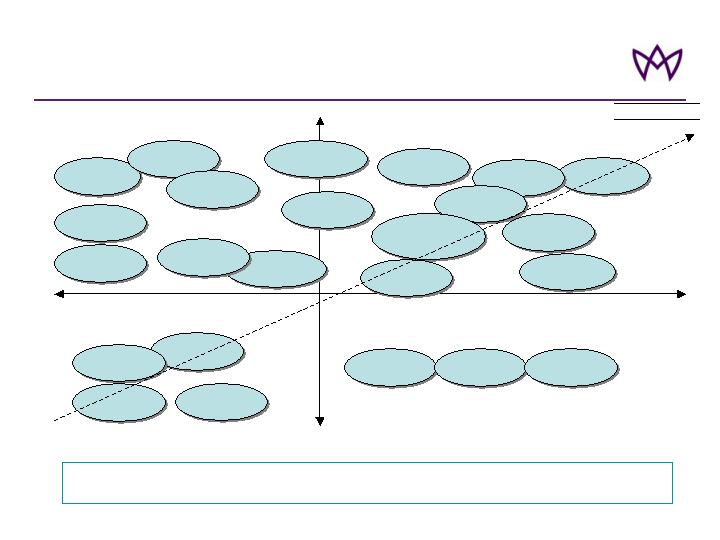
Approach to Growth - ‘Palette’
(lines we do not currently write)
Financial
Institutions
UK D&O
Operational fit
Underwriting fit
Bloodstock
Credit and
surety
Homeowners
Standard
Auto
US D&O
in US
High Net
Worths
Agriculture
US Airlines
Binder
Business
UK SMEs
Primary
Japanese
Property
HIGH
LOW
14
ILLUSTRATIVE
Political
risk
Nuclear
Contingency
US Onshore
Technical
Risk
Construction
/Engineering
Focus on Opportunities which Offer Best Fit with Our Underwriting and Operational
Capabilities
AHL: NYSE

Contents
Aspen at a Glance
Key Investment Considerations
Strategy and Approach
Financial Performance
Enhancing Returns
Cycle Management
UK Flood Losses
Market Conditions
2007 Guidance
Appendix
15
AHL: NYSE
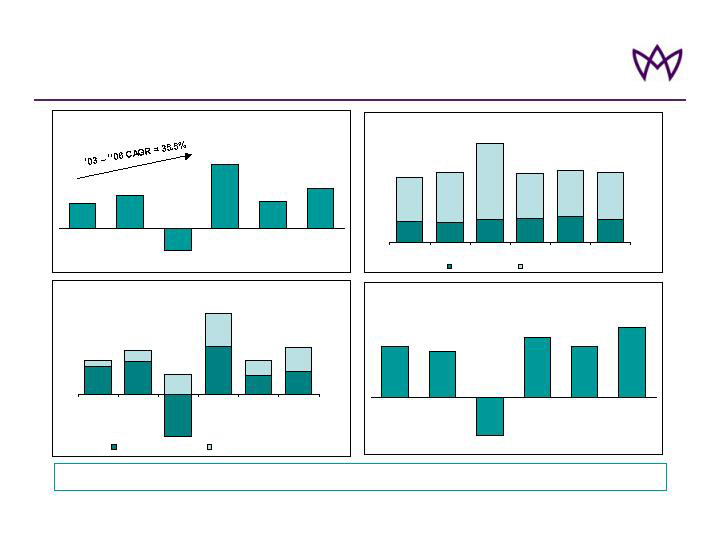
As well as increasing investment income
contribution...
$178
$204
-$259
$296
$118
$143
$68
$121
$94
$30
$204
$146
2003
2004
2005
2006
1H 2006
1H 2007
Underwriting Income
Investment Income
Financial Performance
Resulting in Improved ROAE
15.9%
14.0%
18.5%
15.6%
21.7%
-11.7%
2003
2004
2005
2006
1H 2006
1H 2007
Profitability increased substantially...
$152
$195
$378
$164
$237
($178)
2003
2004
2005
2006
1H 2006
1H 2007
Due to strong underwriting...
25%
25%
27%
29%
31%
28%
53%
59%
90%
55%
53%
56%
2003
2004
2005
2006
1H 2006
1H 2007
Expense Ratio
Loss Ratio
($ in millions)
16
Delivering Results
($ in millions – Net Income)
Note: Reconciliation of average equity to closing shareholders’ equity is provided in our quarterly financial supplements available in the Financial Results
section of the Investor Relations page of Aspen’s website, www.aspen.bm
AHL: NYSE
Financial Performance
Total Assets are increasing...
$2,579
$3,943
$6,538
$6,640
$7,103
2003
2004
2005
2006
1H 2007
...As well as total investments
$1,616
$2,736
$3,689
$4,681
$5,058
2003
2004
2005
2006
1H 2007
Total Reserves
$1,098
$1,992
$3,910
$3,661
$3,883
2003
2004
2005
2006
1H 2007
($ in millions)
($ in millions)
($ in millions)
Shareholders’ Equity
$1,299
$1,482
$2,040
$2,389
$2,591
2003
2004
2005
2006
1H 2007
($ in millions)
Strong Balance Sheet
17
AHL: NYSE
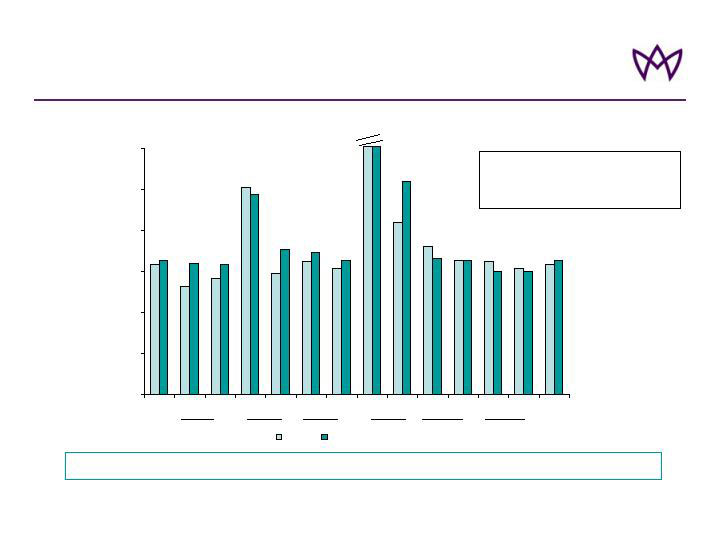
Underwriting Performance* vs. Peers
Underwriting Performance* Exceeds Industry 75% of the time
* Measured by combined ratio
** 05 Aspen -207%, 05 Peer Group average -199%
*** ACE, AWH, ACGL, AXS, ENH, RE, IPCR, MXGL, MRH, ORH, PRE, PTP, RNR, TRH, XL
0%
25%
50%
75%
Combined Ratio
100%
125%
150%
Q4
Q1
Q2
Q3
Q4
Q1
Q2
Q3
Q4
Q1
Q2
Q3
Q4
Q1
Aspen
Peer Group Average***
Aspen average*: 92%
Peer group average*: 96%
04
03
05
06
07
**
18
AHL: NYSE
Growth in ROAE* and Book Value Per Share
12.5%
20.4%
18.0%
18.5%
22.9%
20.4%
0%
5%
10%
15%
ROAE %
20%
25%
30%
Q1
Q2
Q3
Q4
Q1
Q2
0.00
5.00
10.00
15.00
$ Diluted B/V Per Share
20.00
25.00
30.00
Annualised ROAE
Diluted BV Per Share**
06
07
Annualised ROAE >18% Over Last 6 Quarters, 26.6% Growth in BVPS
19
* Reconciliation of average equity to closing shareholders’ equity is provided in our quarterly financial supplements available in the Financial Results section of the Investor Relations
page of Aspen’s website, www.aspen.bm
** See Aspen’s quarterly financial supplement for a reconciliation of diluted book value per share to basic book value per share. Aspen’s financial supplement can be obtained from
the Investor Relations section of Aspen’s website at www.aspen.bm
AHL: NYSE

Contents
Aspen at a Glance
Key Investment Considerations
Strategy and Approach
Financial Performance
Enhancing Returns
Cycle Management
UK Flood Losses
Market Conditions
2007 Guidance
Appendix
20
AHL: NYSE
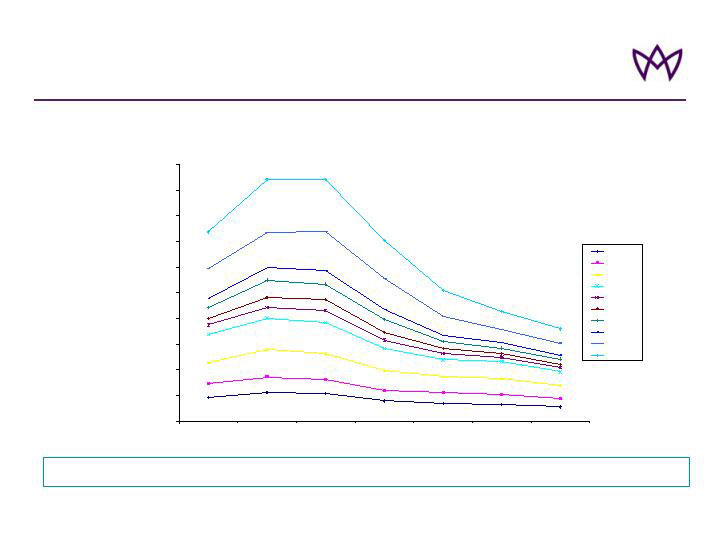
Reduced Exposure to Natural Catastrophes
Significant Reduction in Exposure to Natural Catastrophes At All Return Periods
Group Net AEP* Combined All Perils
“As-If” to RMS v6
* Aggregate Exceedance Probability (excludes inwards reinstatement premiums, includes outwards reinstatement premiums, net of tax)
Note: For net figures we have applied the current 2007 reinsurance / retro program to reflect what our previous exposure would have been versus our current structure
21
0
200,000
400,000
600,000
800,000
1,000,000
1,200,000
Annual Cat
Loss in USD 000
1,400,000
1,600,000
1,800,000
2,000,000
Mean
1 in 5
1 in 10
1 in 20
1 in 25
1 in 30
1 in 40
1 in 50
1 in 100
1 in 250
’08/2004
’02/2005
’08/2005
’02/2006
’08/2006
’02/2007
’06/2007
Event Frequency in
years
AHL: NYSE

Reduced Exposure to Natural Catastrophes
22
n/a
n/a
0.7%
0.3%
0.9%
0.8%
‘As-if’ loss (Gross)***
0.8%
0.5%
1.8%
1.5%
2.3%
1.7%
Actual loss (Gross)
Aspen Market share
3.0**
5.5**
89.6
12.9*
10.4*
66.3*
Selected market loss
June UK
Floods
Kyrill
Total KRW
Wilma
Rita
Katrina
US$ in billions
* Source: Sigma
** Reflects market estimates
*** ‘As-if’ is calculated by modelling the same event through our current portfolio
As of July 30, 2007
Reduced Share of Recent Cat Losses
Share of Recent Cat Losses
AHL: NYSE
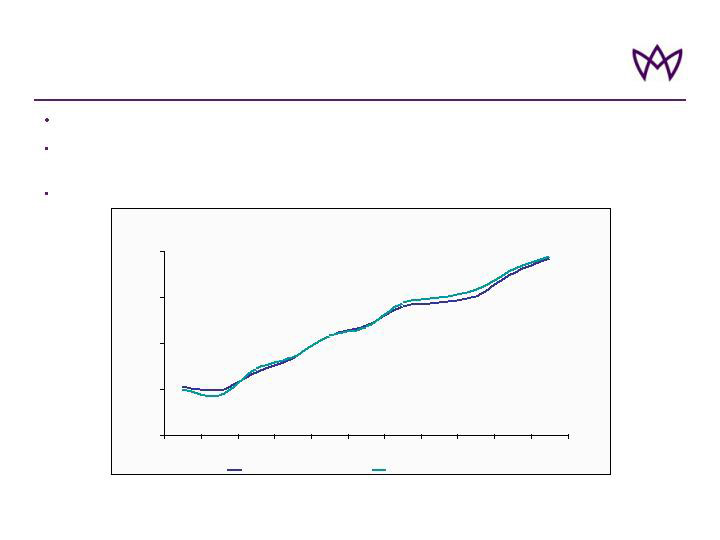
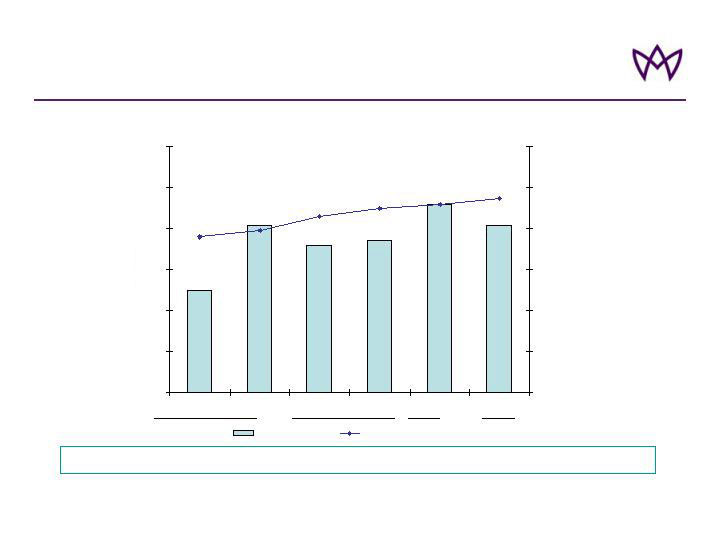
Increasing Contribution from Investment Income
3.0%
3.5%
4.0%
4.5%
5.0%
Q404
Q105
Q205
Q305
Q405
Q106
Q206
Q306
Q406
Q107
Q207
Fixed Income portfolio book yield
Aggregate portfolio book yield*
23
* Including cash and cash equivalents but excluding Fund of Hedge Funds - Initial investments in Fund of Hedge Funds were made on April 1, 2006 with subsequent investment on February 1 and
June 1, 2007
Fixed income yield improved from 3.53% in Q4 04 to 4.94% in Q2 07
Invested 3% ($150m) in Funds of Hedge Funds in April ’06; now 8.8% ($481.6m); annualised
return of 17% in Q2 07
Investment leverage of 251% at Q2 07, up 23% from Q4 04
AHL: NYSE
22%
17%
32%
8%
10%
2%
9%
Govt
Agency
AAA
AA+/AA/AA-
A+/A/A-
BBB+/BBB/BBB-
NR
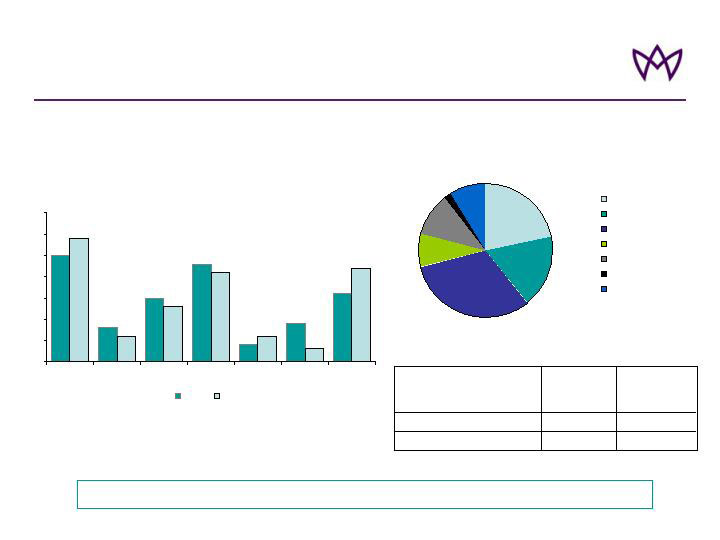
Investment Portfolio
Asset Class Allocation
25%
8%
15%
9%
16%
6%
13%
21%
6%
3%
22%
4%
23%
28%
0%
5%
10%
15%
20%
25%
30%
35%
Govt
Agency
MBS
Corp
ABS
FOHF
Cash/ST
Jun 07
Dec 06
Diversification with Performance
24
AAA
AAA
Overall Fixed Income Rating
3%
Actual as at
December 31,
2006
9%
Fund of Hedge Funds
Actual as at
June 30,
2007
Indicator (S&P Ratings)
Portfolio Credit Ratings
(as at June 30, 2007)
(As of June 30, 2007)
AHL: NYSE

Contents
Aspen at a Glance
Key Investment Considerations
Strategy and Approach
Financial Performance
Enhancing Returns
Cycle Management
UK Flood Losses
Market Conditions
2007 Guidance
Appendix
25
AHL: NYSE
Approach to Cycle Management
Growth = growth in BVPS, not top line per se
Business pricing must meet or exceed adequacy levels
Key components
Underwriting integrity
Optimizing business mix
Strong risk management
Efficient use of reinsurance / retrocession purchasing
Expense control
Improving investment contribution
Return Excess Capital to Shareholders When Appropriate
26
Profitability not volume paramount
AHL: NYSE

Managing the Underwriting Cycle
Board of Directors
CEO / Management Team
Annual planning process Target RORAC* and risk appetite
Monthly performance reviews
Underwriting quality reviews
Rate movement analysis
Technical pricing benchmarks
Peer review
Group Underwriting Committee review
Tactical level
Portfolio Level
Proactive Cycle Management
27
* RORAC = return on risk adjusted capital
AHL: NYSE
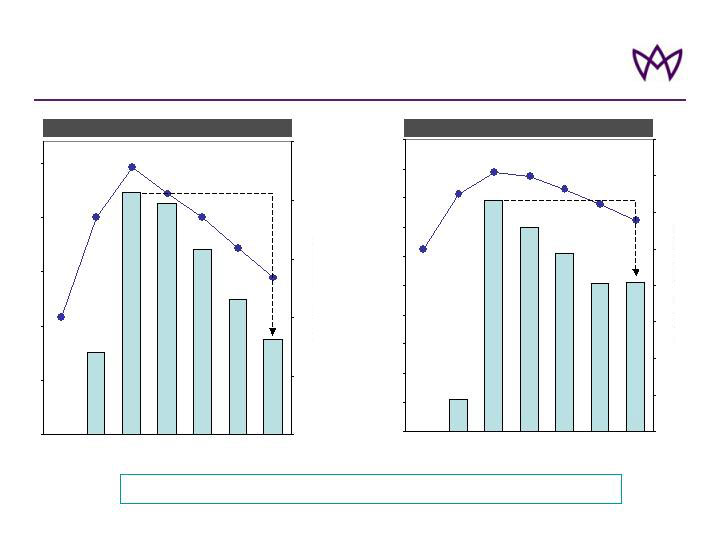
76
223
213
171
125
88
0
50
100
150
200
GWP
$millions
250
2001
2002*
2003
2004
2005
2006
2007**
0
50
100
150
Rate Index, 2001=100%
200
250
RRV
(right scale)
GWP
(left scale)
GWP and rate index
11
79
70
61
51
51
0
10
20
30
40
50
60
70
GWP
$millions
80
90
100
2001
2002*
2003
2004
2005
2006
2007**
0
20
40
60
80
Rate Index,
2001=100%
100
120
140
160
RRV
(right scale)
GWP
(left scale)
UK Liability
UK Commercial Property
Proactive Cycle Management
% change ‘03-’07
Rates: -19%
GWP: -35%
% change ‘03-’07
Rates: -41%
GWP: -60%
Disciplined Underwriting and Cycle Management
* Since inception June 2002
** Projected year end 2007
AHL: NYSE

Contents
Aspen at a Glance
Key Investment Considerations
Strategy and Approach
Financial Performance
Enhancing Returns
Cycle Management
UK Flood Losses
Market Conditions
2007 Guidance
Appendix
29
AHL: NYSE

June/July UK Flood Losses
June 2007 UK Floods
Impacted Northern England
Q2 07 reserved $23.5 million
- $17.0 million from property reinsurance
- $6.5 million UK commercial property insurance
Estimate consistent with a market loss of GBP1.5 billion or $3 billion
July 2007 UK Floods
Impacted areas of Central and Southern England
Majority of UK flood exposures emanate from property catastrophe
reinsurance account; designed to respond to events of much greater
severity than the June floods
RMS and ABI indicate July floods will be less severe than June floods
30
AHL: NYSE

Contents
Aspen at a Glance
Key Investment Considerations
Strategy and Approach
Financial Performance
Enhancing Returns
Cycle Management
UK Flood Losses
Market Conditions
2007 Guidance
Appendix
31
AHL: NYSE
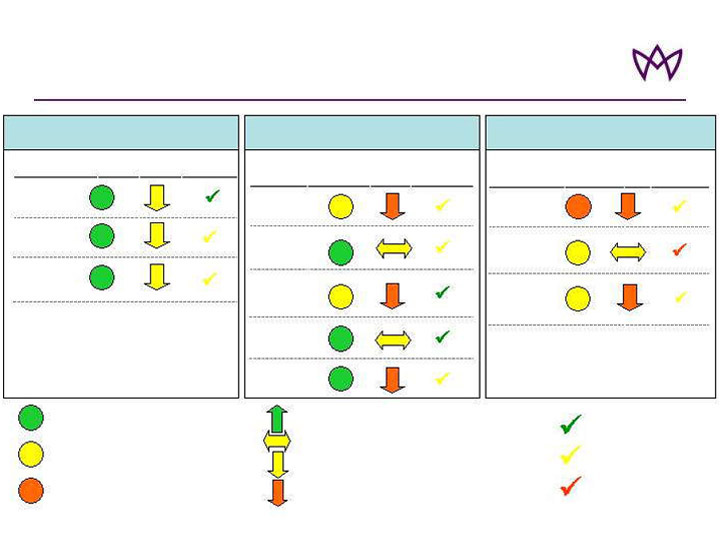
Market Conditions 2007 Outlook:
Property and Specialty Lines
Pro Rata
Market Trend
Risk Excess
Treaty
Catastrophe
Treaty
Aspen 1H07
Performance
Market Conditions
Line
Market
Trend
Specialty
Reinsurance
Marine &
Energy Liability
Offshore
Energy
Physical
Damage
Marine Hull
Aviation
Aspen 1H07
Performance
Market Conditions
Line
International
Property Fac.
E&S Property
Market Trend
UK Property
Aspen 1H07
Performance
Market
Conditions
Line
Property Reinsurance
Specialty Lines
Property Insurance
= Absolute rate levels attractive
= Absolute rate levels mixed
= Absolute rate levels very challenging
= 12 month rate trend positive
= 12 month rate trend neutral
= 12 month rate trend slightly downwards
= 12 month rate trend downwards
32
Strong
Good
Improvement Required
Updated July 27, 2007
AHL: NYSE
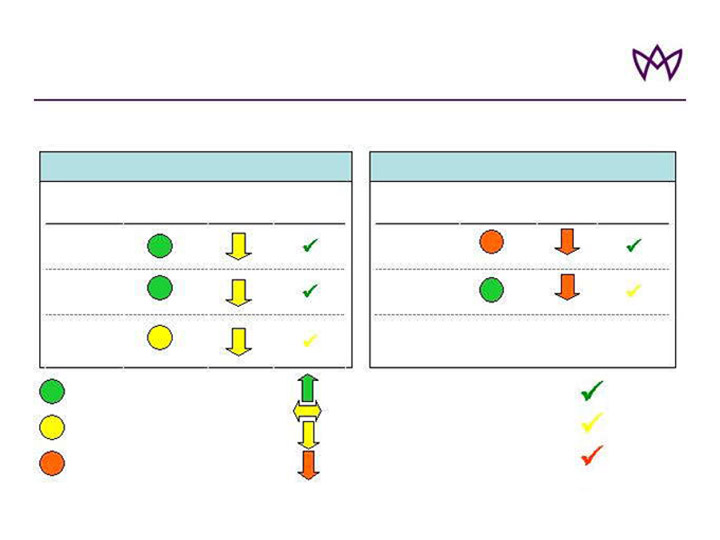
Market Conditions 2007 Outlook: Casualty Lines
Market Trend
Casualty
Facultative
US Casualty
International
Casualty
Aspen 1H07
Performance
Market Conditions
Line
Market Trend
E&S Casualty
UK Liability
Aspen 1H07
Performance
Market Conditions
Line
Casualty Reinsurance
Casualty Insurance
= Absolute rate levels attractive
= Absolute rate levels mixed
= Absolute rate levels very challenging
33
Strong
Good
Improvement Required
= 12 month rate trend positive
= 12 month rate trend neutral
= 12 month rate trend slightly downwards
= 12 month rate trend downwards
Updated July 27, 2007
AHL: NYSE

Contents
Aspen at a Glance
Key Investment Considerations
Strategy and Approach
Financial Performance
Enhancing Returns
Cycle Management
UK Flood Losses
Market Conditions
2007 Guidance
Appendix
34
AHL: NYSE

2007 Guidance
Full 2007 Year Outlook
$145 million
(full year)
16% to 19%
$250 – $270 million
83% – 88%
Approx 9% of GEP*
$1.8 billion + 5%
August 7, 2007
$145 million
(full year)
16% to 19%
$250 – $270 million
83% – 88%
6% – 8% of GWP
$1.8 billion + 5%
Q2 07 Earnings Call
Q4 06 Earnings Call
$135 million
(full year)
16% to 19%
$230 – $250 million
83% – 88%
6% – 8% of GWP
$1.9 billion + 5%
Tax Rate
Assumed Average Cat-
Load
Investment Income
Combined Ratio
% Premium Ceded
GWP
Implied ROE of 16% - 20%
35
* Metric changed from percent of GWP to percent of GEP to reflect that the company has purchased multi year retrocessional policies and believes that a comparison with earned premiums is more appropriate than written premium for guidance purposes. This change in the ceded premium metric does not impact our current ROE guidance.
AHL: NYSE

Contents
Aspen at a Glance
Key Investment Considerations
Strategy and Approach
Financial Performance
Enhancing Returns
Cycle Management
UK Flood Losses
Market Conditions
2007 Guidance
Appendix
36
AHL: NYSE

Financial Highlights – Q2 2007
37
* Annualised
¹ Reconciliation of Average Equity to closing shareholders’ equity and operating income to net income is provided in our quarterly financial supplements
available in the Financial Results section of the Investor Relations page of Aspen’s website at www.aspen.bm
Appendix
AHL: NYSE
(US$ in millions, except per share data)
Quarter Ended June 30
2007
2006
% Change
Gross Written Premiums
503.5
522.4
(3.6)
Net Written Premiums
418.5
500.1
(16.3)
Net Earned Premiums
451.2
429.0
5.2
Underwriting Income
52.4
79.0
(33.7)
Net Investment Income
78.8
49.9
57.9
Net Income after tax
$114.7
$101.8
12.7%
GAAP Ratios:
Loss Ratio
60.5%
52.2%
Expense Ratio
27.9%
29.4%
Combined Ratio
88.4%
81.6%
Full Year ROAE
20.4%*
20.4%*
Diluted Income Per Ordinary Share:
Net Income
$1.19
$1.01
17.8%
Operating Income¹
$1.14
$0.98
16.3%

Financial Highlights – Half Year 2007
(US$ in millions, except per share data)
Six Months Ended June 30 2007 2006 % Change
* Annualised
¹ Reconciliation of Average Equity to closing shareholders’ equity and operating income to net income is provided in our quarterly financial supplements
available in the Financial Results section of the Investor Relations page of Aspen’s website at www.aspen.bm
38
Appendix
AHL: NYSE
Gross Written Premiums
1,140.0
1,201.1
(5.1)
Net Written Premiums
973.6
952.0
2.3
Net Earned Premiums
890.2
831.6
7.0
Underwriting Income
142.9
117.7
21.4
Net Investment Income
146.3
94.4
55.0
Net Income after tax
$236.6
$163.6
44.6%
GAAP Ratios:
Loss Ratio
55.9%
54.8%
Expense Ratio
28.0%
31.0%
Combined Ratio
83.9%
85.8%
Full Year ROAE
21.7%*
15.6%*
Book Value Per Ordinary Share
$24.44
$20.19
21.1%
Diluted Income Per Ordinary Share:
Net Income
$2.46
$1.61
52.8%
Operating Income¹
$2.40
$1.57
52.9%
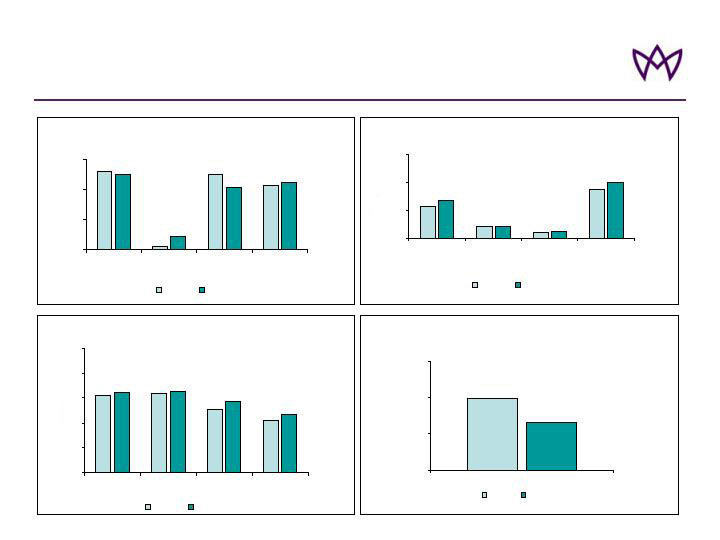
Financial Highlights – Group Summary Q2
Underwriting Revenues
522
22
500
429
504
85
419
451
0
200
400
$ms
600
GWP
Premiums
Ceded
NWP
NEP
2006 Q2
2007 Q2
Income
124
127
102
84
129
131
115
95
0
40
80
120
$ms
160
200
Operating
Income
Before Tax
Income
Before Tax
Income After
Tax
Retained
Income
2006 Q2
2007 Q2
Underwriting Income
79
52
0
40
$ms
80
120
Underwriting Income
2006 Q2
2007 Q2
Underwriting Expenses
224
83
43
350
82
44
399
273
0
200
400
$ms
600
Losses &
Loss
Expenses
Acquisition
Exp
General &
Admin
Expenses
Total
Underwriting
Expenses
2006 Q2
2007 Q2
39
Appendix
AHL: NYSE
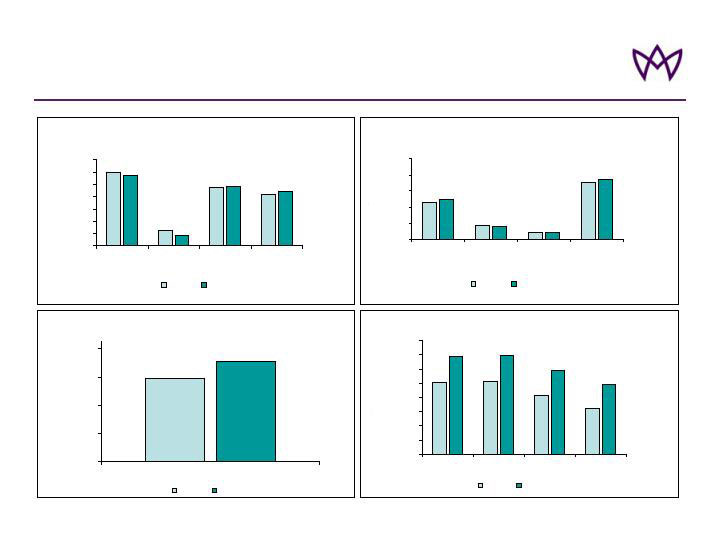
Financial Highlights – Group Summary - Half Year
Underwriting Revenues
1201
249
952
832
1140
166
974
890
0
200
400
600
800
1,000
1,200
1,400
GWP
Premiums
Ceded
NWP
NEP
2006 H1
2007 H1
Income
202
205
164
128
275
278
237
196
0
40
80
120
160
200
240
280
320
Operating
Income
Before Tax
Income
Before Tax
Income After
Tax
Retained
Income
2006 H1
2007 H1
Underwriting Income
118
143
0
40
80
$ms
$ms
$ms
$ms
120
160
Underwriting Income
2006 H1
2007 H1
Underwriting Expenses
456
177
81
714
159
90
747
498
0
200
400
600
800
1000
Losses &
Loss
Expenses
Acquisition
Exp
General &
Admin
Expenses
Total
Underwriting
Expenses
2006 H1
2007 H1
40
Appendix
AHL: NYSE
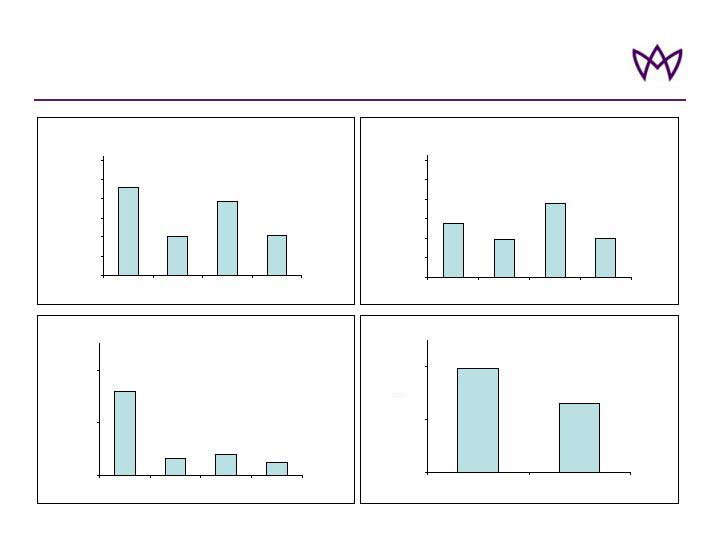
Results by Business Segment – Q2 2007
GWP
185
80
155
84
0
40
80
120
160
200
240
Property Re
Casualty Re
Specialty
Lines
P&C
Insurance
NWP
110
78
152
79
0
40
80
120
160
200
240
Property Re
Casualty Re
Specialty
Lines
P&C
Insurance
Underwriting Profit
32
7
8
5
0
20
$ms
$ms
$ms
$ms
40
Property Re
Casualty Re
Specialty
Lines
P&C
Insurance
Income Contribution
79
52
0
40
80
Net Investment Income
Underwriting Profit
41
Appendix
AHL: NYSE
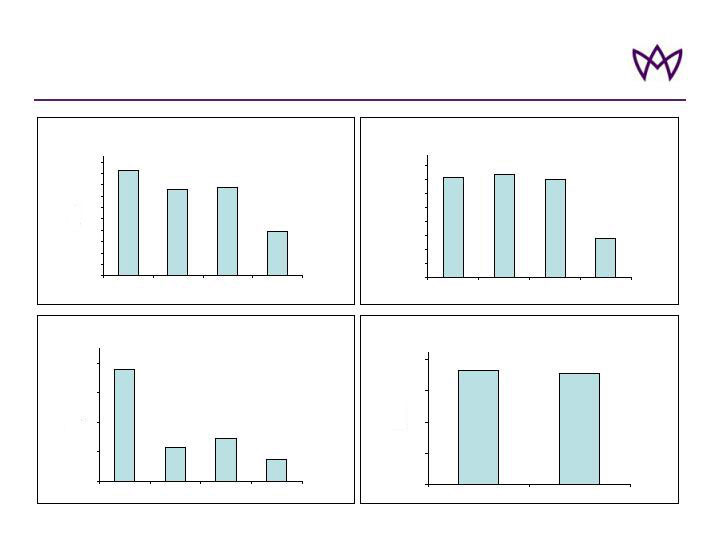
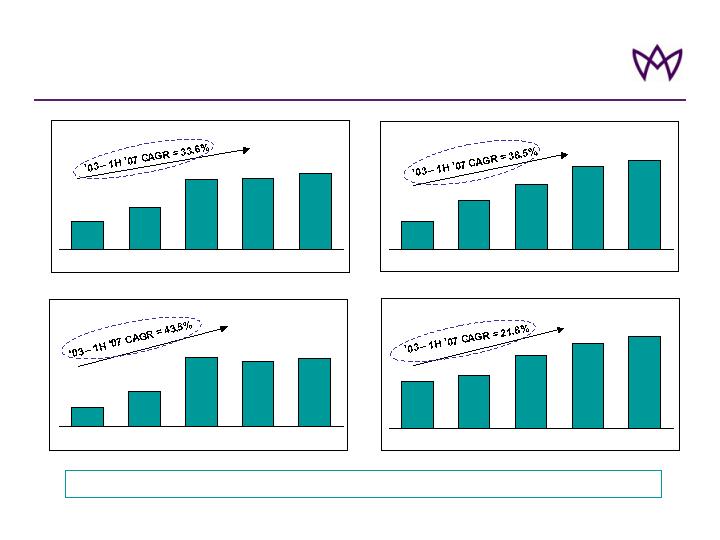
Results by Business Segment – Half Year 2007
GWP
372
303
311
154
0
40
80
120
160
200
240
280
320
360
400
Property Re
Casualty Re
Specialty
Lines
P&C
Insurance
NWP
287
295
279
113
0
40
80
120
160
200
240
280
320
Property Re
Casualty Re
Specialty
Lines
P&C
Insurance
Underwriting Profit
76
23
29
15
0
20
40
$ms
$ms
$ms
$ms
60
80
Property Re
Casualty Re
Specialty
Lines
P&C
Insurance
Income Contribution
146
143
0
40
80
120
160
Net Investment Income
Underwriting Profit
42
Appendix
AHL: NYSE