
Aspen Insurance Holdings Limited
Chris O’Kane
Chief Executive Officer
Richard Houghton
Chief Financial Officer
February 2008
EXHIBIT 99.1
AHL: NYSE

Safe Harbor Disclosure
This slide presentation is for information purposes only. It should be read in conjunction with our financial supplement posted on our website on the Investor Relations page and with other documents filed or to be filed shortly by Aspen Insurance Holdings Limited (the “Company” or “Aspen”) with the U.S. Securities and Exchange Commission.
Non-GAAP Financial Measures
In presenting Aspen’s results, management has included and discussed certain “non-GAAP financial measures”, as such term is defined in Regulation G. Management believes that these non-GAAP measures, which may be defined differently by other companies, better explain Aspen's results of operations in a manner that allows for a more complete understanding of the underlying trends in Aspen's business. However, these measures should not be viewed as a substitute for those determined in accordance with GAAP. The reconciliation of such non-GAAP financial measures to their respective most directly comparable GAAP financial measures in accordance with Regulation G is included herein or in the financial supplement, as applicable, which can be obtained from the Investor Relations section of Aspen's website at www.aspen.bm.
Application of the Safe Harbor of the Private Securities Litigation Reform Act of 1995:
This presentation contains written or oral "forward-looking statements" within the meaning of the U.S. federal securities laws. These statements are made pursuant to the safe harbor provisions of the Private Securities Litigation Reform Act of 1995. Forward-looking statements include all statements that do not relate solely to historical or current facts, and can be identified by the use of words such as “expect,” “intend,” “plan,” “believe,” “project,” “anticipate,” “seek,” “will,” “estimate,” “may,” “continue,” “guidance,” and similar expressions of a future or forward-looking nature.
In addition, any estimates relating to loss events involve the exercise of considerable judgment and reflect a combination of ground-up evaluations, information available to date from brokers and cedants, market intelligence, initial tentative loss reports and other sources. Due to the complexity of factors contributing to the losses and the preliminary nature of the information used to prepare these estimates, there can be no assurance that Aspen's ultimate losses will remain within the stated amount.
All forward-looking statements address matters that involve risks and uncertainties. Accordingly, there are or will be important factors that could cause actual results to differ materially from those indicated in these statements. Aspen believes these factors include, but are not limited to: the impact of deteriorating credit environment created by the sub-prime crisis; a decline in the value of our investment portfolio or a rating downgrade of the securities in our portfolio; changes in the total industry losses resulting from Hurricanes Katrina, Rita and Wilma and any other events, and the actual number of Aspen's insureds incurring losses from these events; with respect to events such as Hurricanes Katrina, Rita and Wilma, Aspen’s reliance on loss reports received from cedants and loss adjustors, Aspen's reliance on industry loss estimates and those generated by modeling techniques, the impact of these events on Aspen's reinsurers, any changes in Aspen's reinsurers' credit quality, the amount and timing of reinsurance recoverables and reimbursements actually received by Aspen from its reinsurers and the overall level of competition and the related demand and supply dynamics as contracts come up for renewal; the impact that our future operating results, capital position and rating agency and other considerations have on the execution of any capital management initiatives; the impact of any capital management activities on our financial condition; the impact of acts of terrorism and related legislation and acts of war; the possibility of greater frequency or severity of claims and loss activity, including as a result of natural or man-made catastrophic events than our underwriting, reserving or investment practices have anticipated; evolving interpretive issues with respect to coverage as a result of Hurricanes Katrina, Rita and Wilma and any other events such as the UK floods; the level of inflation in repair costs due to limited availability of labor and materials after catastrophes; the effectiveness of Aspen's loss limitation methods; changes in the availability, cost or quality of reinsurance or retrocessional coverage, which may affect our decision to purchase such coverage; the reliability of, and changes in assumptions to, catastrophe pricing, accumulation and estimated loss models; loss of key personnel; a decline in our operating subsidiaries' ratings with Standard & Poor's, A.M. Best Company or Moody's Investors Service; changes in general economic conditions including inflation, foreign currency exchange rates, interest rates and other factors that could affect our investment portfolio; the number and type of insurance and reinsurance contracts that we wrote at the January 1st and other renewal periods in 2008 and the premium rates available at the time of such renewals within our targeted business lines; increased competition on the basis of pricing, capacity, coverage terms or other factors; decreased demand for Aspen’s insurance or reinsurance products and cyclical downturn of the industry; changes in governmental regulations, interpretations or tax laws in jurisdictions where Aspen conducts business; proposed and future changes to insurance laws and regulations, including with respect to U.S. state- and other government-sponsored reinsurance funds and primary insurers; Aspen or its Bermudian subsidiary becoming subject to income taxes in the United States or the United Kingdom; the effect on insurance markets, business practices and relationships of ongoing litigation, investigations and regulatory activity by the New York State Attorney General's office and other authorities concerning contingent commission arrangements with brokers and bid solicitation activities. For a more detailed description of these uncertainties and other factors, please see the "Risk Factors" section in Aspen's Annual Reports on Form 10-K as filed with the U.S. Securities and Exchange Commission on February 22, 2007. Aspen undertakes no obligation to publicly update or revise any forward-looking statements, whether as a result of new information, future events or otherwise. Readers are cautioned not to place undue reliance on these forward-looking statements, which speak only as of the dates on which they are made.
2
AHL: NYSE

Probability Distributions of 2008 ROAE and Return
on Allocated Equity: Disclaimers
3
This presentation includes slides relating to the probability distributions of the 2008 ROAE and Return on Allocated Equity based on model outputs only and are not, and should not be construed as guidance for 2008. The Company relies on the outputs of its Dynamic Financial Analysis (“DFA”) model in addition to other considerations in the establishment of its public guidance. No 2008 guidance is given in this presentation.
No representation or warranty of any kind is or can be made with respect to the accuracy or completeness of, and no representation or warranty should be inferred from, the probability distributions of the 2008 ROAE and Return on Allocated Equity in these slides or the assumptions underlying them or their suitability. No representation or warranty is or can be made as to the future operations or the amount of any future income or loss.
The figures shown are the result of numerous assumptions made within our DFA model, many of which are subject to uncertainty which could lead actual results to vary considerably from those indicated by the model, including our estimates of catastrophe and non-catastrophe losses, our estimates of reserve movements and our estimates of investment income.
No explicit allowance has been made within the modelling for the possibility that the model could be wrong or assumptions within the model incorrect. This includes the possibility that catastrophe models are incorrect.
Changes in market conditions and variations from expected underwriting and investment strategy may lead to results varying considerably from those indicated by the model.
No reliance should be placed on the accuracy of our DFA probability distributions of the 2008 ROAE and Return on Allocated Equity as they are based on (i) assumptions and other factors made at the time of modeling which may be subject to uncertainty or which may change subsequently, (ii) currently available information derived from modeling techniques, which may be incorrect, and (iii) modeling assumptions that may be inaccurate or incorrect. Therefore, the results of the model are illustrative and not to be viewed as facts or forecasts, and should not be relied upon as a representation of the future value of an investment in Aspen shares.
See Slide 2 – Safe Harbor Disclosure for reference to important factors that could cause actual results to differ from the probability distribution of 2008 ROAE and Return on Allocated Equity provided in the previous slides. Changes in market conditions and variations from expected underwriting and investment strategy may lead to results varying considerably from those indicated by the model.
For a more detailed description of these uncertainties and other factors, please see the “Risk Factors” section in Aspen’s Annual Reports on Form 10-K as filed with the U.S. Securities and Exchange Commission on February 22, 2007. Aspen undertakes no obligation to publicly update or revise any forward-looking statements, whether as a result of new information, future events or otherwise. Readers are cautioned not to place undue reliance on these forward-looking statements, which speak only as of the dates on which they were made.
AHL: NYSE

Discussion Topics
Aspen at a Glance
Cycle Management
Benefits of Diversification
Market Conditions
Investment Portfolio
Key Performance Drivers
Previous Guidance
Conclusions
Appendix
4
AHL: NYSE

Aspen at a Glance
5
Bermuda based diversified Specialty Insurer and Reinsurer with focus on:
Marine, Energy and Transport Insurance
Specialty and Casualty Reinsurance
Property Catastrophe Insurance and Reinsurance
$2.5bn market cap
$2.3bn common equity and $3.0bn total capital, as of December 31, 2007
500 employees in 12 offices in 6 countries
Ratings of A (S&P), A2 (Moody’s) and A (AM Best, for Aspen UK and Aspen Bermuda)
$1.8bn Gross Written Premium (GWP) in 2007, estimate $1.8bn +/- 5% GWP for 2008
(as of February 7, 2008 conference call)
35% Insurance, 65% Reinsurance
43% Casualty, 57% Property
AHL: NYSE
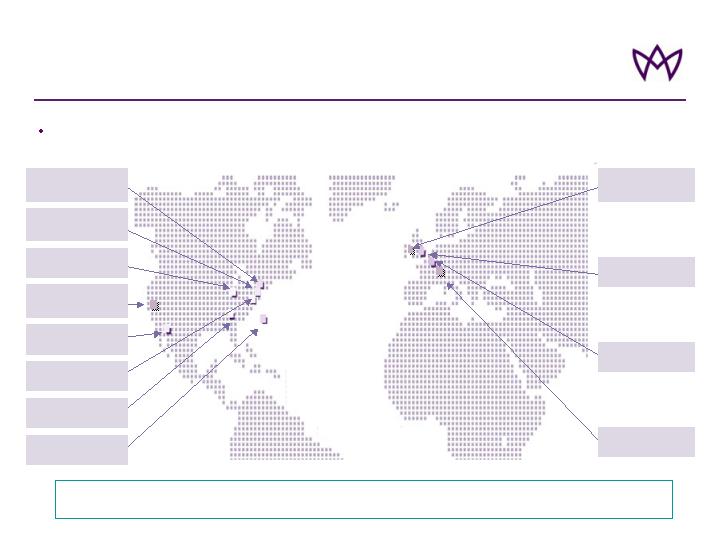
Aspen at a Glance:
Widespread Distribution - Efficient Infrastructure
500 Employees Across Twelve Offices
129 Underwriters, 25 Actuaries and 29 Risk Management professionals
London
(294)
Paris
(3)
Zurich
(7)
Dublin
(6)
Bermuda
(56)
Atlanta
(18)
Connecticut
(34)
Arizona
(9)
Illinois
(2)
California
(6)
New York
(1)
Massachusetts
(63)
Key platforms in London, Bermuda and US with seven additional distribution centres
6
AHL: NYSE

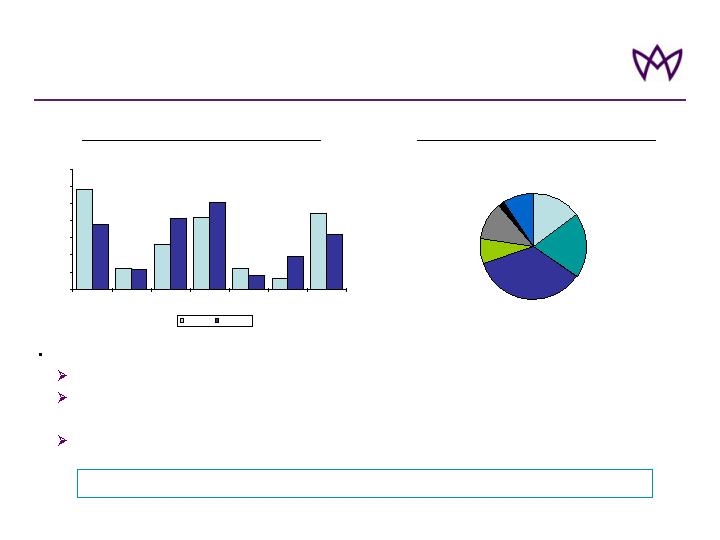
Diversified Portfolio
Targeted Growth in Specialty Lines And Improved Spread of Risk
$1.6bn split by Product Line
12 months to December 2004
$1.8bn split by Product Line
12 months to December 2007
7
16%
7%
8%
15%
8%
1%
5%
4%
3%
2%
1%
6%
8%
1%
6%
6%
3%
Catastrophe
Risk XS
Pro Rata Treaty
US Casualty
International Casualty
Casualty Facultative
UK Liability
US Liability
UK Commercial Property
US Commercial
Property
International Property
Facultative
Specialty RI
Marine Liability
Property Facultative
Aviation
Energy
Marine Hull
16%
18%
8%
14%
11%
3%
13%
2%
4%
2%
1%
6%
2%
Catastrophe
Risk XS
Pro Rata Treaty
US Casualty
International Casualty
Casualty Facultative
UK Liability
US Liability
UK Commercial
Property
US Commercial
Property
Worldwide Property
Specialty RI
Marine Liability
AHL: NYSE
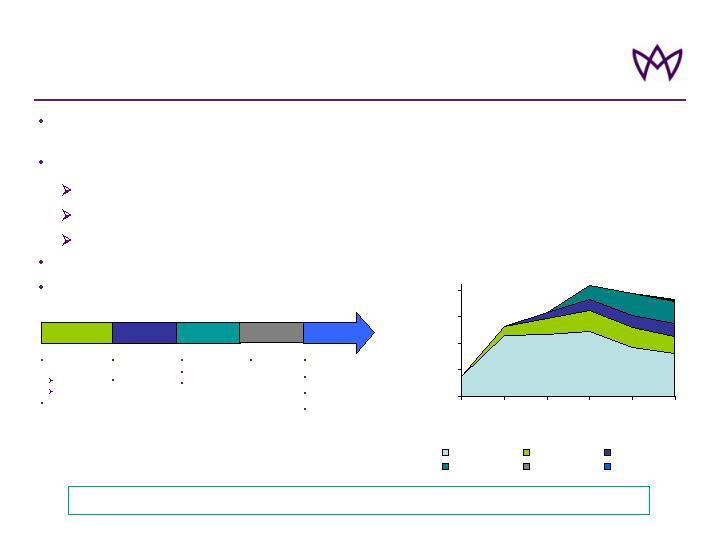
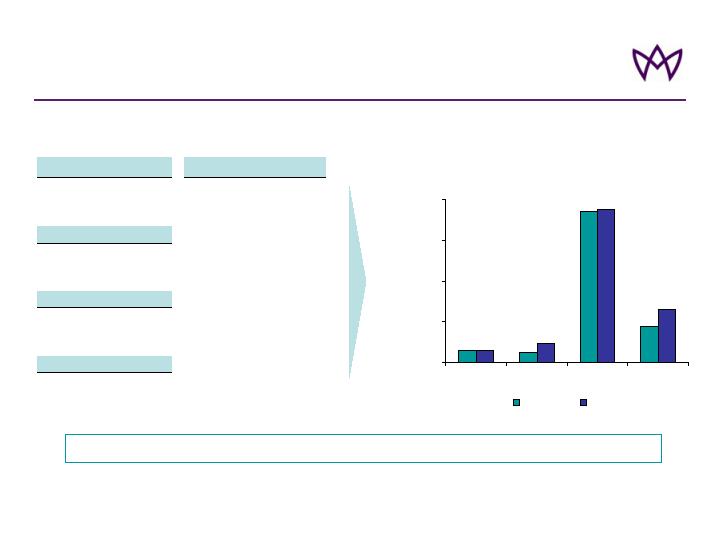
Profitable Expansion into New / Adjacent Lines
Progressive diversification of strategic footprint through incremental expansion into
adjacent business lines*
Key enablers:
Consistent with core competencies
Timing
Availability of proven, successful underwriting teams
Focus on non-correlating lines
Financial Institutions, announced February 2008
2003
2004
2005
2007
Specialty
Reinsurance
Aviation
Marine
US Casualty Re
US Excess &
Surplus lines
Aspen Re America
Aviation Insurance
Marine Insurance
Energy Insurance
International Property
Facultative
* Businesses shown for first year of meaningful premium contribution
** Underwriting after 09/07
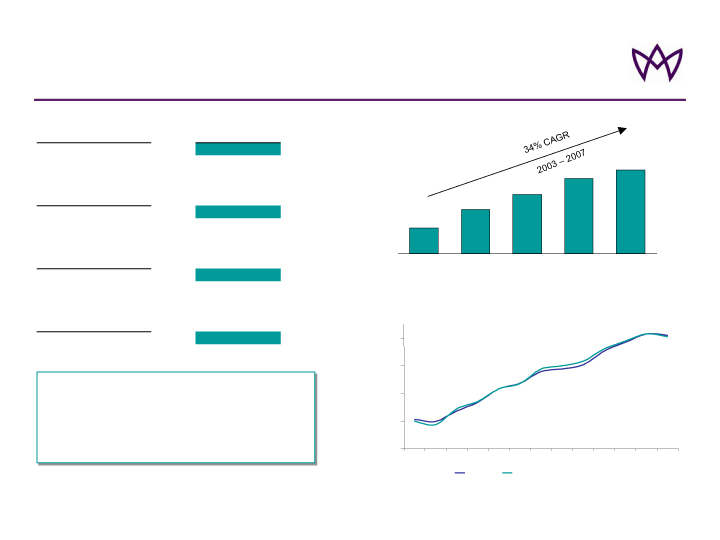
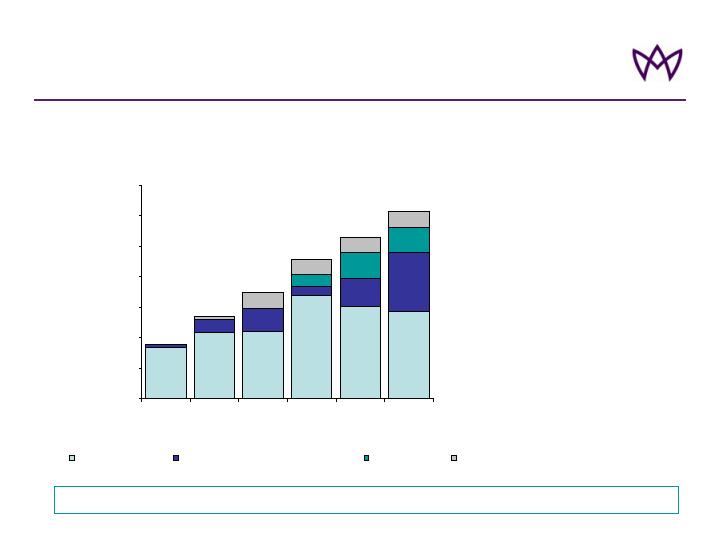
Diversification has Added over $1,135m GWP in New Lines Since 2004
Development of Aspen’s GWP
2006
Professional Liability**
Excess Casualty**
Non-Marine Liability**
Political Risk**
8
0
500
1000
1500
2000
2002
2003
2004
2005
2006
2007
Year
GWP $m
Original Lines
2003 Lines
2004 Lines
2005 Lines
2006 Line
2007 Lines
AHL: NYSE
UK
Commercial
Auto
War and
Terrorism
Cargo and
Specie
US Retailer
Property
Accident &
Health/ Medical
Expenses
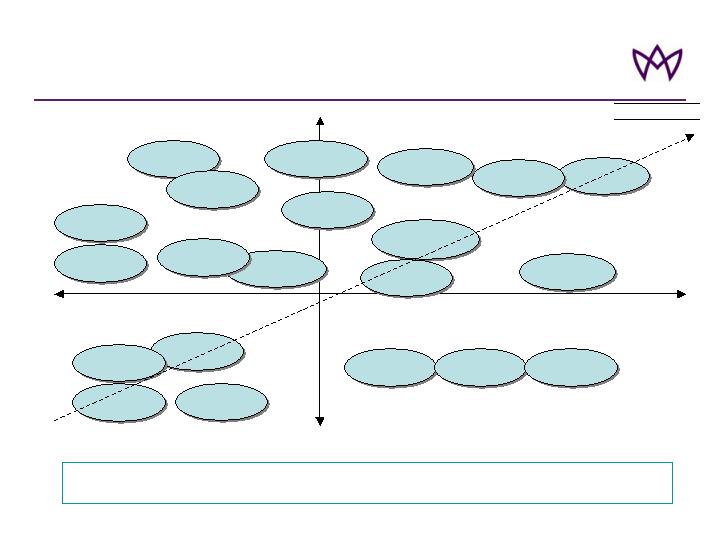
Approach to Growth - ‘Palette’
(lines we do not currently write)
UK D&O
Operational fit
Underwriting fit
Bloodstock
Credit and
surety
Homeowners
Standard
Auto
US D&O
in US
High Net
Worths
Agriculture
US Airlines
Binder
Business
UK SMEs
Primary
Japanese
Property
HIGH
LOW
AHL: NYSE
9
ILLUSTRATIVE
Nuclear
Contingency
US Onshore
Technical
Risk
Construction
/Engineering
Focus on Opportunities which Offer Best Fit with Our Underwriting and Operational
Capabilities

Approach to Cycle Management
Business pricing must meet or exceed adequacy levels
Key components
Underwriting integrity
Optimizing business mix
Strong risk management
Efficient use of reinsurance / retrocession purchasing
Expense control
Improving investment contribution
Return Excess Capital to Shareholders when Appropriate
10
AHL: NYSE
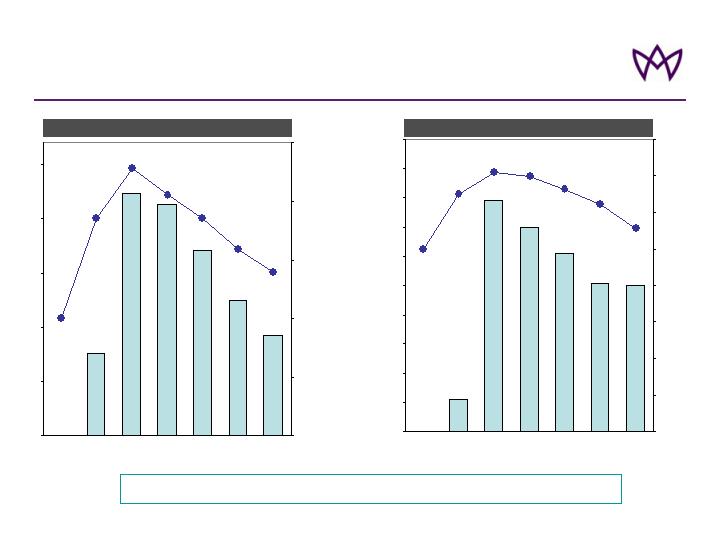
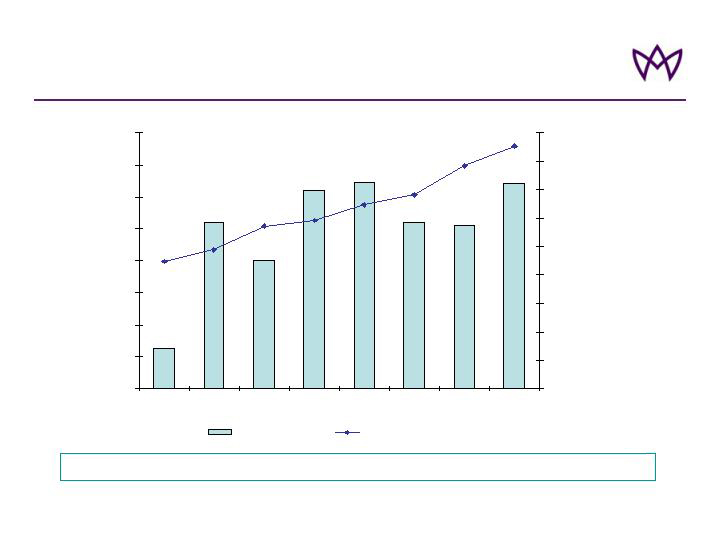
GWP and rate index
UK Liability
UK Commercial Property
Proactive Cycle Management
Disciplined Underwriting and Cycle Management
* Since inception June 2002
11
11
79
70
61
51
50
0
10
20
GWP
(Left
Scale)
30
40
50
60
70
80
90
RRV
(Right
Scale)
100
2001
2002*
2003
2004
2005
2006
2007
GWP
$millions
0
20
40
60
80
100
120
140
160
% change ‘03-‘07
Rates: -22%
GWP: -37%
Rate
Index ,
2001=100%
76
GWP
(Left
Scale)
223
% change ‘03-‘07
Rates: -39%
GWP: -59%
213
171
125
92
0
50
100
150
200
250
RRV
(Right
Scale)
2001
2002*
2003
2004
2005
2006
2007
GWP
$millions
0
50
100
150
200
250
Rate
Index ,
2001=100%
AHL: NYSE
Lapsed business approximately 24%* of GWP in 07
Lapsed business expected to be approximately
18%* of GWP in 08
(*) As percentage of that year’s business
New lines include Non-Marine Transportation Liability, Professional Lines, Excess Casualty Insurance, Political Risk and Financial Institutions
(**) Mid-point of 2008 Guidance as shown on page 28.
Renewal business expected to decline by 8% in 2008 vs 2007
New business lines introduced in 2007 to account for approximately 8% of expected GWP
Steady Top-Line Supported by Disciplined Entrance
into New Lines
$1,334m
$321m
$145m
$1,800m**
$1,819m
$1,458m
$348m
$13m
2007 New Business & Renewals
2008 Expected New Business & Renewals
12
0%
20%
40%
60%
80%
100%
120%
Existing
Renewals
Existing Lines
New Lines
Total
0%
20%
40%
60%
80%
100%
120%
Existing
Renewals
Existing Lines
New Lines
Total
AHL: NYSE
Business Enablement: Understanding Catastrophe Risk
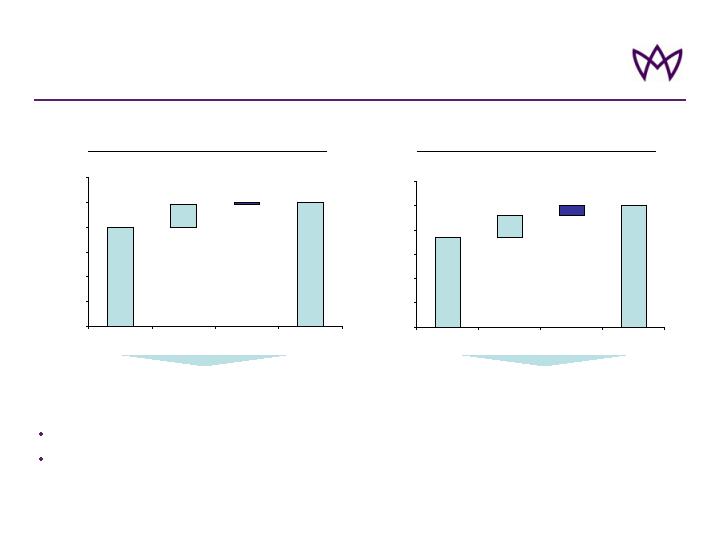
Significant Reduction in Exposure to Natural Catastrophes Post 2005 At All Return Periods
* Aggregate Exceedance Probability (excludes inwards reinstatement premiums, includes outwards reinstatement premiums, net of tax)
Note: For net figures applied 2007 reinsurance / retro program to reflect our previous exposure versus our current structure
Note that assumptions have been made to bring prior periods, modelled in old RMS versions, in line with RMS version 6.
Group Net AEP, Combined All Perils
“As-If” to RMS v6
13
200
400
600
800
1,000
1,200
1,400
1,600
1,800
2,000
2004-08
2005-02
2005-08
2006-02
2006-08
2007-03
2007-06
2007-09
2008-01
Date
Annual Cat Loss in USD m
Mean
1 in 10
1 in 25
1 in 50
1 in 100
1 in 250
AHL: NYSE
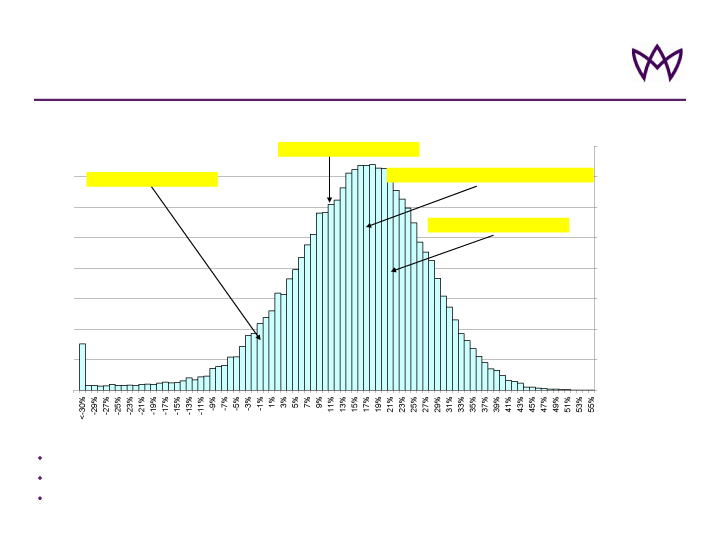
Business Enablement: Understanding Risk
Result of 50,000 simulations of the 2008 year net income using Aspen DFA model
Risks modelled include underwriting (cat and non cat), reserving, market, credit and operational
Subject to the caveats on slides 2 and 3, this represents our estimates of modelled outcomes for 2008
14
ROAE Distribution all Risks: 2008 Plan
0.00%
0.50%
1.00%
1.50%
2.00%
2.50%
3.00%
3.50%
4.00%
Chance of an ROAE < 0 = 9.2%
Chance of an ROAE > 10% =
71%
Chance of an ROAE between 14% and 20% = 25%
Chance of an ROAE > 20% = 37%
ROAE
Probability
AHL: NYSE
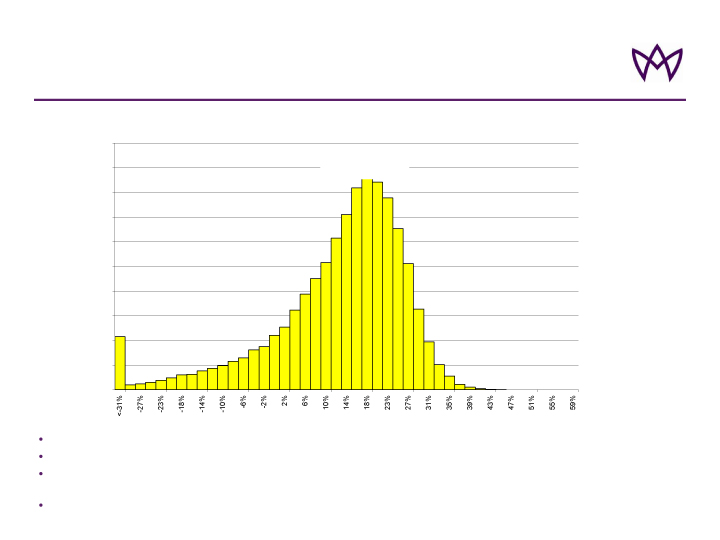
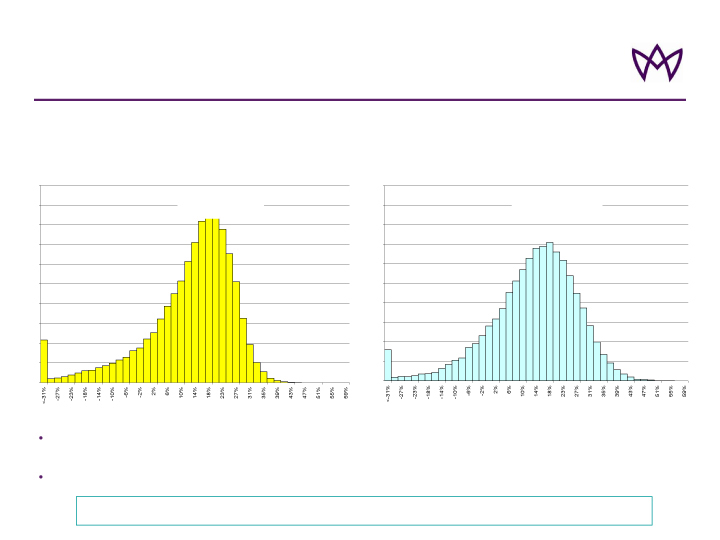
Business Enablement: Benefits of Diversification
Property Reinsurance product segment only
No diversification with other product segments
Relatively large tail and high volatility as measured by the Standard Deviation (“SD”) and the Sharpe Ratio
(calculated using return on allocated shareholders’ common equity)
Subject to the caveats on slides 2 and 3, this represents our estimates of modelled outcomes for 2008
15
Return on Allocated Equity – Property Reinsurance Only
0.00%
1.00%
2.00%
3.00%
4.00%
5.00%
6.00%
7.00%
8.00%
9.00%
10.00%
Return On Allocated Equity (ROAE for segment)
Probabilities
SD = 13.1%
Sharpe Ratio = 0.69
AHL: NYSE
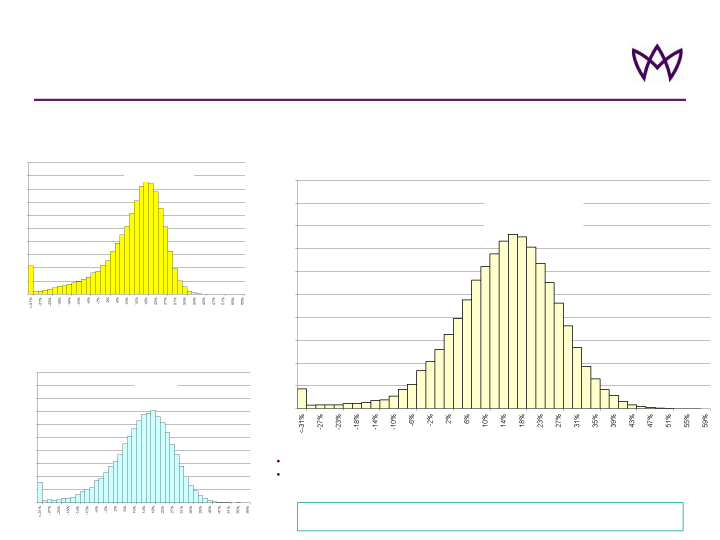
Business Enablement: Benefits of Diversification
16
Property Reinsurance and Casualty
Reinsurance
Property Reinsurance product
segment only
Return on allocated equity less volatile (SD reduces to 10.7% from 13.1%, Sharpe Ratio increases from 0.69 to
0.90)
Subject to the caveats on slides 2 and 3, this represents our estimates of modelled outcomes for 2008
0.00%
1.00%
2.00%
3.00%
4.00%
5.00%
6.00%
7.00%
8.00%
9.00%
10.00%
Return On Allocated Equity (ROAE for segment)
Probabilities
SD = 13.1%
Sharpe Ratio = 0.69
0.00%
1.00%
2.00%
3.00%
4.00%
5.00%
6.00%
7.00%
8.00%
9.00%
10.00%
Return On Allocated Equity (ROAE for segment)
Probabilities
SD = 10.7%
Sharpe Ratio = 0.90
Diversification Leads to a Reduction of the Risk of Unfavourable Outcomes
AHL: NYSE
Business Enablement: Benefits of Diversification
17
Property Reinsurance and Casualty Reinsurance
Property Reinsurance product segment only
Reinsurance and Insurance Combined
SD reduces further to 9.4% and Sharpe Ratio increases to 1.16
Subject to the caveats on slides 2 and 3, this represents our estimates of modelled
outcomes for 2008
0.00%
1.00%
2.00%
3.00%
4.00%
5.00%
6.00%
7.00%
8.00%
9.00%
10.00%
Return On Allocated Equity (ROAE for segment)
Probabilities
SD = 13.1%
Sharpe Ratio = 0.69
0.00%
1.00%
2.00%
3.00%
4.00%
5.00%
6.00%
7.00%
8.00%
9.00%
10.00%
Return On Allocated Equity (ROAE for segment)
Probabilities
SD = 10.7%
Sharpe Ratio = 0.90
0.00%
1.00%
2.00%
3.00%
4.00%
5.00%
6.00%
7.00%
8.00%
9.00%
10.00%
Total ROAE
Probabilities
SD = 9.4%
Sharpe Ratio = 1.16
Diversification reduces volatility and gives better risk / return balance
AHL: NYSE
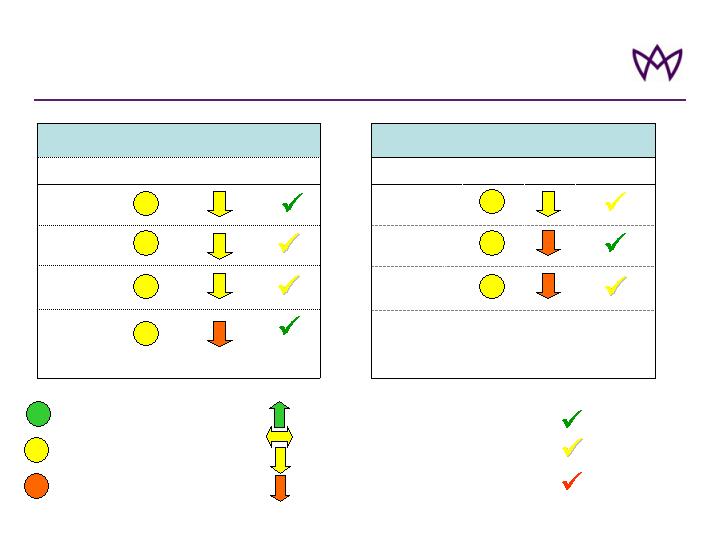
Market Conditions
2008 Outlook: Property Reinsurance and Casualty Reinsurance
Market
Trend
Casualty
Facultative
US Casualty
Intl. Casualty
Aspen 2007
Performance
Market
Conditions
Line
Casualty Reinsurance
Property Reinsurance
Property & nbsp;
Facultative
Pro Rata
Market Trend
Risk Excess
Treaty
Catastrophe
Treaty
Aspen 2007
Performance
Market Conditions
Line
= Absolute rate levels attractive
= Absolute rate levels mixed
= Absolute rate levels very challenging
= 12 month rate trend positive
= 12 month rate trend neutral
= 12 month rate trend slightly downwards
= 12 month rate trend downwards
Strong
Satisfactory
Improvement Required
18
As of February 7, 2008
AHL: NYSE
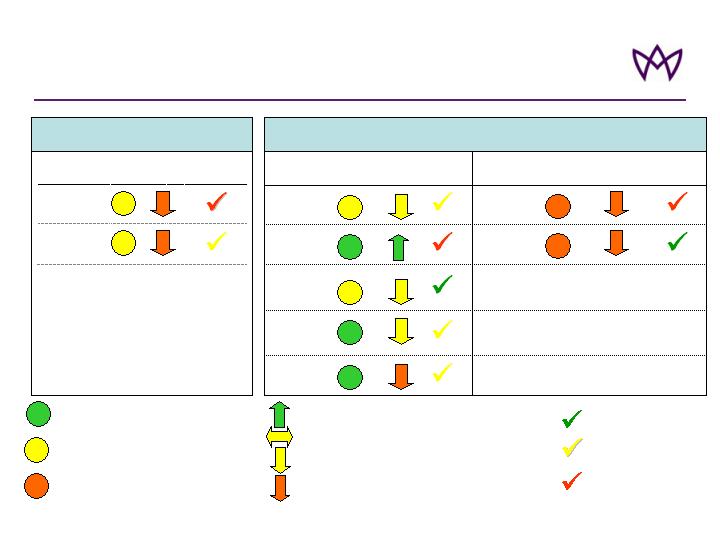
Market Conditions
2008 Outlook: US Insurance and International Insurance
Aspen 2007
Performance
UK Liability
UK
Property
Line
Market
Conditions
Market
Trend
Market
Trend
Specialty
Reinsurance
Marine &
Energy
Liability
Offshore
Energy
Physical
Damage
Marine Hull
Aviation
Aspen 2007
Performance
Market
Conditions
Line
International Insurance
= Absolute rate levels attractive
= Absolute rate levels mixed
= Absolute rate levels very challenging
= 12 month rate trend positive
= 12 month rate trend neutral
= 12 month rate trend slightly downwards
= 12 month rate trend downwards
19
Improvement Required
US Insurance
E&S Casualty
Market
Trend
E&S Property
Aspen 2007
Performance
Market
Conditions
Line
As of February 7, 2008
AHL: NYSE
Strong
Satisfactory
Portfolio Credit Ratings
(as at December 31, 2007)
Aggregate Investment Portfolio
Asset Class Allocation
89% of Portfolio ‘A’ or Better, Overall Fixed Income ‘AA+’
20
* Govt rated securities include GNMAs that are classified as “MBS” at left; Agency rated securities include Agency issued mortgage backed securities that are classified as “MBS” at left.
Sub-Prime and related exposure
No direct sub-prime exposure
Currently have less than $51,000 (fifty-one thousand dollars) of fixed income investments that
are wrapped by financial guarantors
No investment losses requiring an impairment charge at the year end
6%
13%
21%
6%
3%
22%
19%
6%
21%
25%
4%
9%
16%
29%
0%
5%
10%
15%
20%
25%
30%
35%
Govt
Agency
MBS
Corp
ABS
FOHF
Cash/ST
Dec 06
Dec 07
Govt*(incl. GNMAs),
15%
AAA, 34%
AA, 8%
A, 12%
BBB, 2%
Agency* (incl. Agency
MBS), 20%
FOHF, 9%
AHL: NYSE
Key Performance Driver: Strong Underwriting Results
93.0%
Peer Median
117.6%
Peer Median
84.6%
Peer Median
83.0%
Peer Median
Average: 2003 – 2007
88.8%
ASPEN
117.2%
ASPEN
2005
82.4%
ASPEN
2006
83.0%
ASPEN
Combined Ratio (GAAP)
2007
* Without taking into account variance in other performance measures
Source: SNL Financial, company press releases
Peers include ACE, ACGL, AXS, ENH, RE, IPCR, TRH, MXGL, PRE, AWH, RNR, XL , ORH, PTP and MRH (2007 calculation uses 9 month Combined Ratio
for ORH, IPCR, PTP, MRH as these companies had not reported as of the finalisation of this presentation)
21
Combined
Ratio
%
Require a Combined Ratio of 90% in 2008 to Achieve an ROAE of 15%*
80
90
100
110
120
2007
2006
2005
2003-2007
Aspen
Median
AHL: NYSE
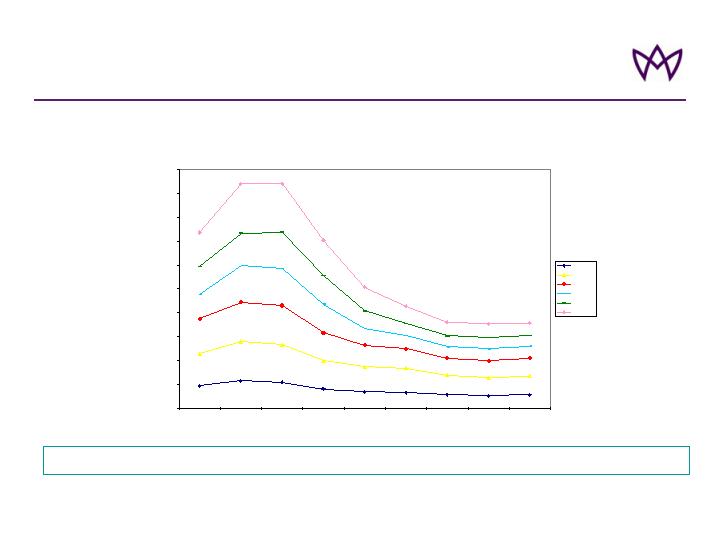
Key Performance Driver: Growing Investment Income
Average: 2005 – 2007
4.7%
Peer Group Average
4.4%
ASPEN
4.0%
Peer Group Average
3.5%
ASPEN
2005
4.9%
Peer Group Average
4.4%
ASPEN
2006
5.2%
Peer Group Average
5.4%
ASPEN
Net Investment
Income Return¹
2007
Peers include ACE, ACGL, AXS, ENH, RE, IPCR, TRH, MXGL, PRE, AWH, RNR, XL , ORH, PTP and MRH (2007 calculation uses annualized nine month data for ORH, IPCR, PTP, MRH as these companies had not reported as of the finalisation of this presentation)
Source: Company Filings
1. Net Investment Income Return is computed by dividing pre-tax Net investment income for the period by average Investments and Cash and cash equivalents for the applicable period, annualized.
22
Total Investments have increased
Book Yield improving
Increasing Investment Yield;
Investment Income Increasing
Component of Total Return
$1,616
$2,736
$3,689
$4,681
$5,227
2003
2004
2005
2006
2007
3.0%
3.5%
4.0%
4.5%
5.0%
Q404
Q105
Q205
Q305
Q405
Q106
Q206
Q306
Q406
Q107
Q207
Q307
Q407
Fixed Income
Fixed income and cash and cash equivalents
AHL: NYSE
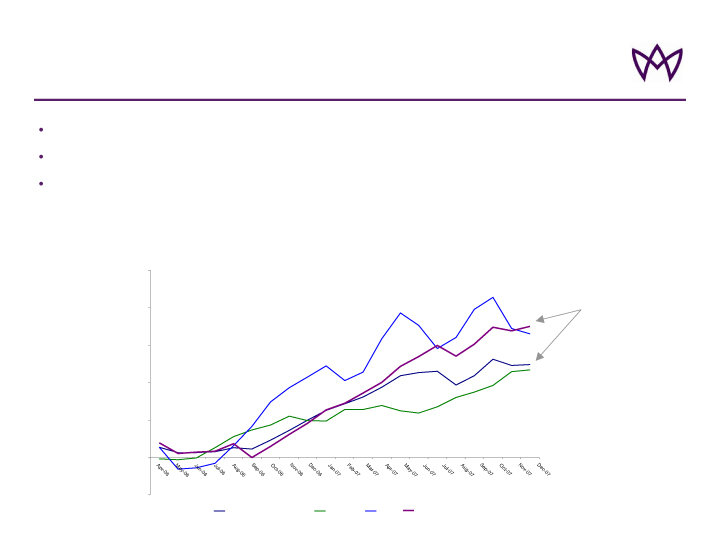
Key Performance Driver:
Funds of Hedge Funds, Enhancing Net Investment Income
Multi manager, multi strategy approach
$561m investment: 9.4% of investable assets at 31 December 2007
Internal rate of return for Aspen in 2007: 11.4%
23
Enhancing fixed
income returns
Cumulative returns
-5.00%
0.00%
5.00%
10.00%
15.00%
20.00%
25.00%
HFRI FOF: Conservative Index
Lehman Agg
S&P500
Aspen FOHF weighted
AHL: NYSE
Key Performance Driver: Increasing Tax Efficiency
* In 2005 Aspen Insurance Holdings Limited reported a loss before tax of $160.4 million. In addition to the loss, the group incurred a tax charge of $17.4 million in relation to profits earned by Aspen Insurance UK Limited
24
0%
5%
10%
15%
20%
25%
30%
2003
2004
2005*
2006
2007
Effective Tax rate
AHL: NYSE
Key Performance Driver:
Capital Management and Financial Leverage
Capital Structure and Financial Leverage
25
Share buy back: completed
$300m program, final $50m on
November 9
Preference shares: issued
$200m Q4 2006
Strong balance sheet with
some opportunity for further
leverage
Active Balance Sheet Management to Deliver Consistent, Quality ROAE
837
878
1,091
1,096
1,693
1,503
1,427
208
385
147
457
961
200
430
430
249
1,731
249
2,289
249
2,639
249
3,067
41
40
1,339
0
500
1,000
1,500
2,000
2,500
3,000
3,500
2002
3.0%
14.4%
19.6%
25.7%
22.1%
2003
2004
2005
2006
2007
$ m
Common share capital
Retained earnings inc OCI and issue costs
Preference shares
Debt
AHL: NYSE
Leverage

Sub-Prime and Related Exposure
Reserves
$35 million reserves (Q4 2007) made up of:
- $20 million of additional reserves ($7.5m in Q3, $12.5m in Q4)
- $15 million expected loss reserves
Exposures limited to two areas:
- A small number of Lloyd’s syndicates
- One casualty clash contract
Investments
No direct sub-prime exposure
Currently have less than $51,000 (fifty-one thousand dollars) of fixed
income investments that are wrapped by financial guarantors
No investment losses requiring an impairment charge at the year end
26
AHL: NYSE
Growth in ROAE and Book Value Per Share
CAGR in BVPS over last 8 quarters of 20%
27
(*) Note: See Aspen’s quarterly financial supplement for a reconciliation of diluted book value per share to basic book value per share and reconciliation of average equity to closing
shareholders’ equity in the Investor Relations section of Aspen's website at www.aspen.bm
12.5%
18.0%
22.4%
22.9%
20.4%
20.2%
22.8%
20.4%
10.0%
12.0%
14.0%
16.0%
18.0%
20.0%
22.0%
24.0%
26.0%
Q1
Q2
Q3
Q4
Q1
Q2
Q3
Q4
ROAE %
10.0
12.0
14.0
16.0
18.0
20.0
22.0
24.0
26.0
28.0
$ Diluted B/V Per Share
Annualized ROAE
Diluted BV Per Share*
AHL: NYSE

2008 Guidance
ROE of 14% - 17% assuming normal loss experience
28
$135 million
13% to 16%
$290 - $320 million
88% - 93%
8% - 10% of GEP
$1.8 billion ± 5%
February 7, 2008
$77 million
Cat-Load
14.8%
Tax Rate
$299 million
Investment Income
83.0%
Combined Ratio
8.9%
% Earned Premium Ceded
$1.82 billion
GWP
Actual 2007
AHL: NYSE

Conclusions
Strong underwriting performance
Improving investment contribution
Efficient use of capital
High quality, diversified underwriting portfolio designed with the benefit of
sophisticated capital allocation models
Strong, quality, improving returns
BVPS 20% CAGR over last 8 quarters
Annualised ROAE >18% over last 6 quarters
29
Well Positioned to Manage the Cycle and Generate Attractive Returns
AHL: NYSE

Appendix
30
AHL: NYSE

Financial Highlights – Q4 2007
31
* Annualized
¹ Reconciliation of Average Equity to closing shareholders’ equity and operating income to net income is provided in our quarterly financial supplements
available in the Financial Results section of the Investor Relations page of Aspen’s website at www.aspen.bm
20.5%
$1.22
$1.47
Diluted Operating EPS 1
20.0%
$1.20
$1.44
Diluted EPS
22.8%
23.2%
Full Year Operating *ROAE 1
76.8%
79.4%
Combined Ratio
28.2%
31.8%
Expense Ratio
48.6%
47.6%
Loss Ratio
GAAP Ratios:
13.1%
$119.5
$135.2
Net Income after tax
28.1%
62.7
80.3
Net Investment Income
(9.6)%
96.3
87.1
Underwriting Income
2.0%
415.3
423.7
Net Earned Premiums
0.3%
278.1
279.0
Net Written Premiums
6.3%
286.9
305.0
Gross Written Premiums
Change
2006
2007
Quarter Ended December 31
(US$ in millions, except per share data and percentages)
AHL: NYSE

Financial Highlights – 12 months ended December 2007
¹ Reconciliation of Average Equity to closing shareholders’ equity and operating income to net income is provided in our quarterly financial supplements
available in the Financial Results section of the Investor Relations page of Aspen’s website at www.aspen.bm
32
25.1%
$22.35
$27.95
BV Per Ordinary Share
34.1%
$3.72
$4.99
Diluted Operating EPS
36.3%
$3.75
$5.11
Diluted EPS
18.4%
21.1%
Full Year Operating ROAE ¹
82.4%
83.0%
Combined Ratio
29.3%
29.9%
Expense Ratio
53.1%
53.1%
Loss Ratio
GAAP Ratios:
29.3%
$378.1
$489.0
Net Income after tax
46.3%
204.4
299.0
Net Investment Income
(0.2)%
295.6
295.1
Underwriting Income
3.4%
1,676.2
1,733.6
Net Earned Premiums
(3.7)%
1,663.6
1,601.4
Net Written Premiums
(6.5)%
1, 945.5
1,818.5
Gross Written Premiums
Change
2006
2007
12 months ended December 31
(US$ in millions, except per share data and percentages)
AHL: NYSE
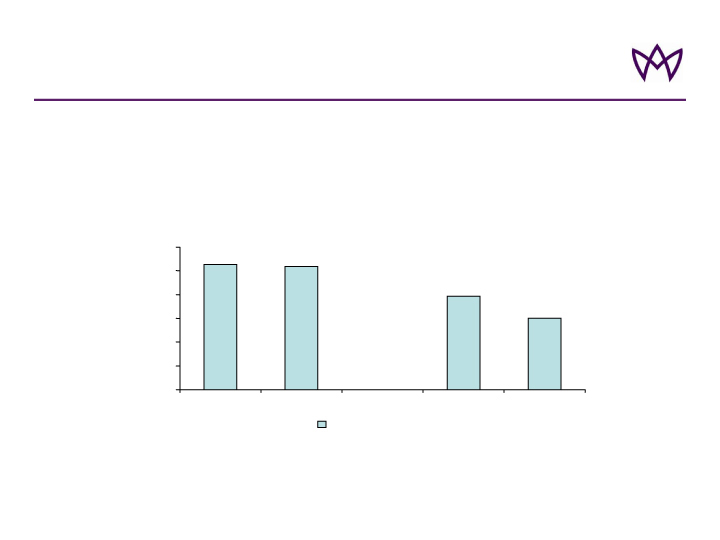
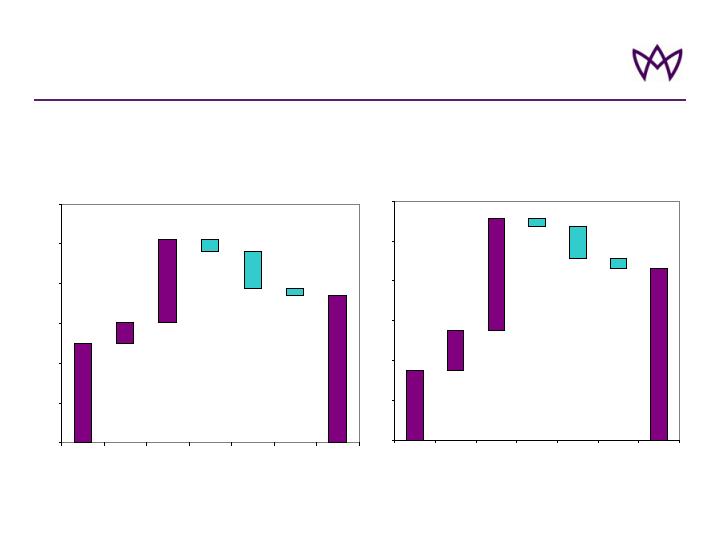
Financial Performance
33
Delivering Results
($ in millions – Net Income)
Note: Reconciliation of average equity to closing shareholders’ equity is provided in our quarterly financial supplements available in the Financial Results section of the Investor
Relations page of Aspen’s website, www.aspen.bm
Profitability has increased substantially...
$152
$195
$378
$489
$119
$135
($178)
2003
2004
2005
2006
2007
4Q 2006
4Q 2007
Due to strong underwriting...
25%
25%
27%
29%
30%
28%
32%
53%
59%
90%
53%
48%
49%
53%
2003
2004
2005
2006
2007
4Q 2006
4Q 2007
Expense Ratio
Loss Ratio
Resulting in improving ROAE
15.9%
14.0%
18.5%
21.6%
22.4%
22.8%
-11.7%
2003
2004
2005
2006
2007
4Q 2006
4Q 2007
With increasing investment income contribution...
$178
$204
-$259
$296
$295
$96
$87
$68
$121
$299
$80
$30
$204
$63
2003
2004
2005
2006
2007
4Q 2006
4Q 2007
Underwriting Income
Investment Income
AHL: NYSE
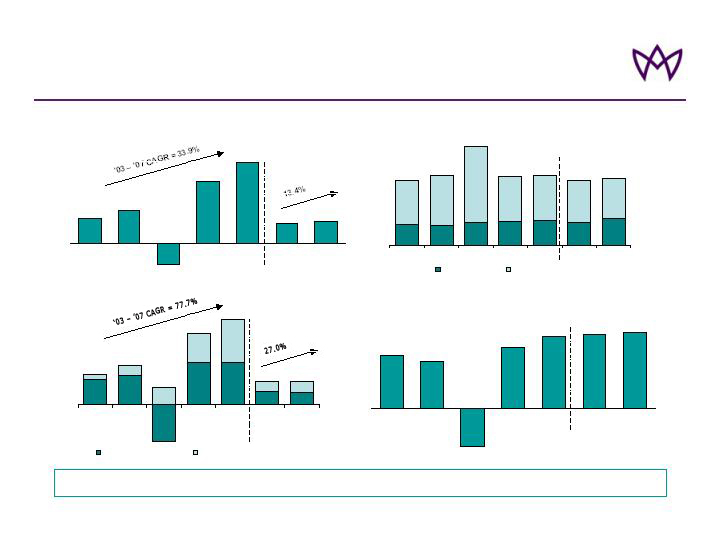
($ in millions)
Decomposition of ROAE
Decomposition of ROAE - 2006
Decomposition of ROAE - 2007
34
5.0%
14.0%
21.6%
-1.3%
-4.0%
-0.9%
8.8%
0%
5%
10%
15%
20%
25%
30%
Net
technical
result - AY
Net
technical
result - PY
Investment
income
Other
Tax
Pref
Dividends
Total
18.5%
-0.8%
-4.7%
-1.5%
12.5%
10.4%
2.6%
0%
5%
10%
15%
20%
25%
30%
Net
technical
result - AY
Net
technical
result - PY
Investment
income
Other
Tax
Pref
Dividends
Total
AHL: NYSE
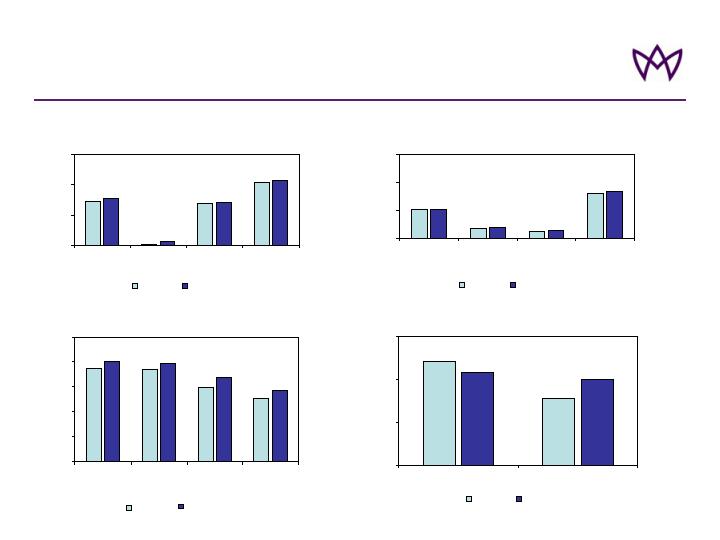
Financial Highlights – Group Summary Q4
35
Underwriting Expenses
202
67
50
319
78
57
337
202
0
200
400
600
Losses &
Loss
Expenses
Acquisition
Exp
General &
Admin
Expenses
Total
Underwriting
Expenses
$ms
2006 Q4
2007 Q4
Income Contribution
96
63
87
80
0
40
80
120
Underwriting Income
Net Investment Income
$ms
2006 Q4
2007 Q4
Income
150
147
120
101
161
158
135
115
0
40
80
120
160
200
Operating
Income
Before Tax
Income
Before Tax
Income After
Tax
Retained
Income
$ms
2006 Q4
2007 Q4
Underwriting Revenues
287
9
278
415
305
26
279
424
0
200
400
600
GWP
Premiums
Ceded
NWP
NEP
$ms
2006 Q4
2007 Q4
AHL: NYSE
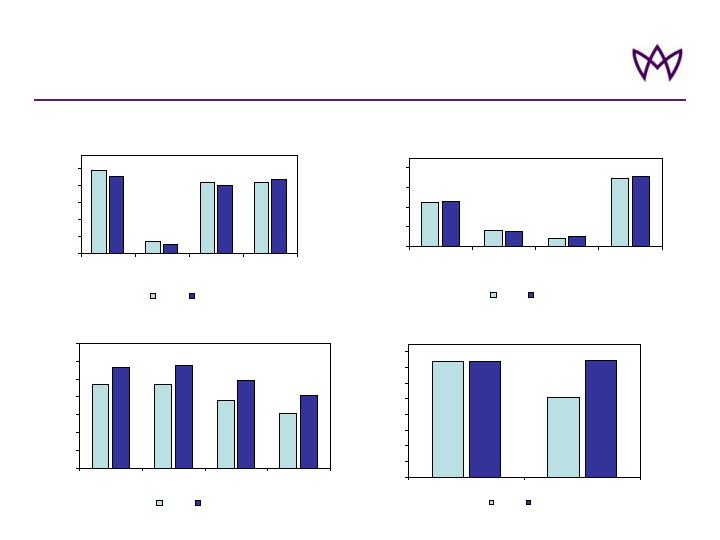
Financial Highlights – Group Summary – 12 months
36
Underwriting Revenues
Underwriting Expenses
Income
Income Contribution
469
470
378
306
567
574
489
408
0
100
200
300
400
500
600
700
Operating
Income
Before Tax
Income
Before Tax
Income After
Tax
Retained
Income
$ms
2006
2007
890
323
168
1381
314
205
1439
920
0
400
800
1200
1600
Losses &
Loss
Expenses
Acquisition
Exp
General &
Admin
Expenses
Total
Underwriting
Expenses
$ms
2006
2007
296
204
295
299
0
40
80
120
160
200
240
280
320
Underwriting Income
Net Investment Income
$ms
2006
2007
1946
282
1664
1676
1819
217
1601
1734
0
400
800
1,200
1,600
2,000
GWP
Premiums
Ceded
NWP
NEP
$ms
2006
2007
AHL: NYSE
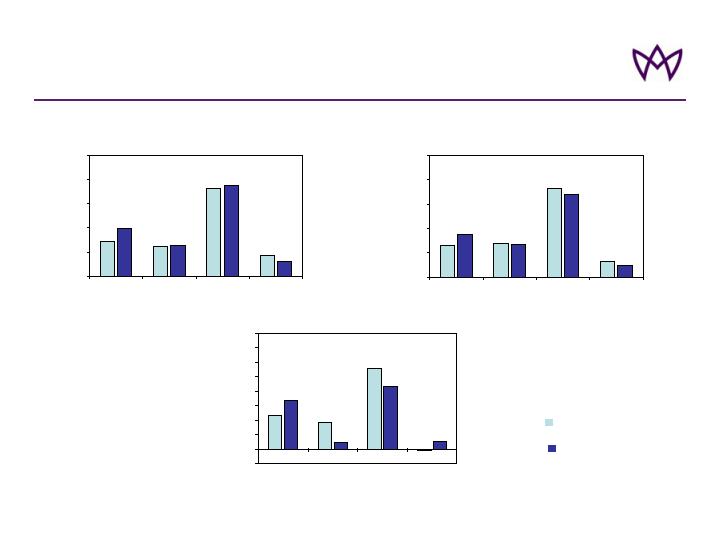
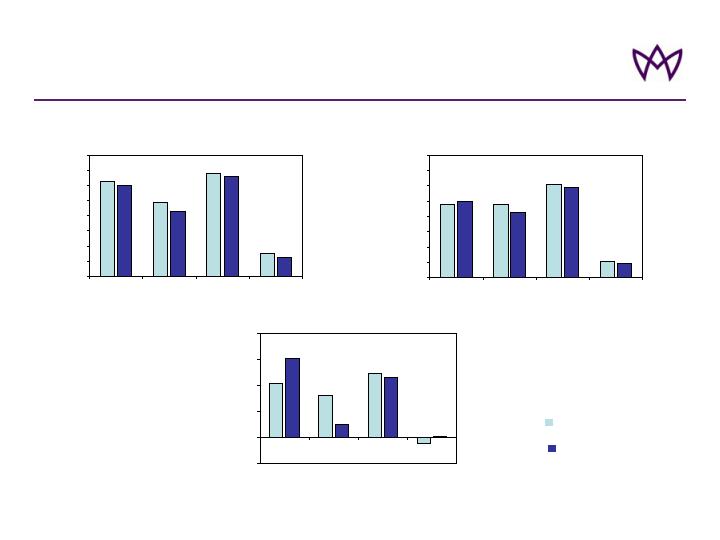
Results by Business Segment – Q4
37
GWP
58
50
145
34
80
51
150
24
0
40
80
120
160
200
Property Re
Casualty Re
International
Insurance
US Insurance
$ms
Underwriting Income
23
18
56
-1
33
5
44
6
-10
0
10
20
30
40
50
60
70
80
Property Re
Casualty Re
International
Insurance
US Insurance
$ms
NWP
53
55
145
26
71
53
135
20
0
40
80
120
160
200
Property Re
Casualty Re
International
Insurance
US Insurance
$ms
AHL: NYSE
2006
2007
Results by Business Segment – 12 Months
38
GWP
623
486
683
154
602
432
663
123
0
100
200
300
400
500
600
700
800
Property Re
Casualty Re
International
Insurance
US Insurance
$ms
Underwriting Income
103
81
123
-12
152
26
115
2
-50
0
50
100
150
200
Property Re
Casualty Re
International
Insurance
US Insurance
$ms
NWP
477
474
607
106
495
425
590
91
0
100
200
300
400
500
600
700
800
Property Re
Casualty Re
International
Insurance
US Insurance
$ms
AHL: NYSE
2006
2007
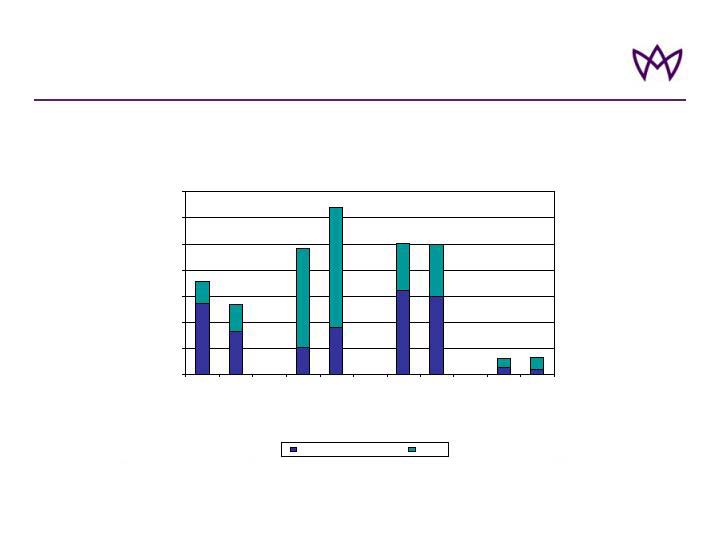
Gross Reserves By Segment
Gross Reserves By Segment
0
200
400
600
800
1000
1200
1400
2006
2007
2006
2007
2006
2007
2006
2007
US$m
Gross Outstandings
IBNR
AHL: NYSE
AHL: NYSE
39
69%
31%
57%
43%
40%
60%
36%
64%
72%
28%
79%
21%
38%
62%
24%
76%
U.S. Insurance
International
Insurance
Casualty
Reinsurance
Property
Reinsurance