
Aspen Insurance Holdings Limited
May 1, 2008
Q1 2008 Earnings Conference Call
AHL:NYSE
A S P E N

Safe Harbor Disclosure
This slide presentation is for information purposes only. It should be read in conjunction with our financial supplement posted on our website on the Investor Relations page and with other documents filed or to be filed shortly by Aspen Insurance Holdings Limited (the “Company” or “Aspen”) with the U.S. Securities and Exchange Commission.
Non-GAAP Financial Measures
In presenting Aspen's results, management has included and discussed certain “non-GAAP financial measures”, as such term is defined in Regulation G. Management believes that these non-GAAP measures, which may be defined differently by other companies, better explain Aspen's results of operations in a manner that allows for a more complete understanding of the underlying trends in Aspen's business. However, these measures should not be viewed as a substitute for those determined in accordance with GAAP. The reconciliation of such non-GAAP financial measures to their respective most directly comparable GAAP financial measures in accordance with Regulation G is included herein or in the financial supplement, as applicable, which can be obtained from the Investor Relations section of Aspen's website at www.aspen.bm.
Application of the Safe Harbor of the Private Securities Litigation Reform Act of 1995:
This presentation contains, and Aspen's earnings conference call will contain, written or oral “forward-looking statements” within the meaning of the U.S. federal securities laws. These statements are made pursuant to the safe harbor provisions of the Private Securities Litigation Reform Act of 1995. Forward-looking statements include all statements that do not relate solely to historical or current facts, and can be identified by the use of words such as “expect,” “intend,” “plan,” “believe,” “project,” “anticipate,” “seek,” “will,” “estimate,” “may,” “continue,” “guidance,” and similar expressions of a future or forward-looking nature.
In addition, any estimates relating to loss events involve the exercise of considerable judgment and reflect a combination of ground-up evaluations, information available to date from brokers and cedants, market intelligence, initial tentative loss reports and other sources. Due to the complexity of factors contributing to the losses and the preliminary nature of the information used to prepare these estimates, there can be no assurance that Aspen's ultimate losses will remain within the stated amount.
All forward-looking statements address matters that involve risks and uncertainties. Accordingly, there are or will be important factors that could cause actual results to differ materially from those indicated in these statements. Aspen believes these factors include, but are not limited to: the impact of deteriorating credit environment created by the sub-prime crisis and global Credit Crunch a decline in the value of our investment portfolio or a rating downgrade of the securities in our portfolio; changes in the total industry losses resulting from Hurricanes Katrina, Rita and Wilma and any other events, and the actual number of Aspen's insureds incurring losses from these events; with respect to events such as Hurricanes Katrina, Rita and Wilma, Aspen’s reliance on loss reports received from cedants and loss adjustors, Aspen's reliance on industry loss estimates and those generated by modeling techniques, the impact of these events on Aspen's reinsurers, any changes in Aspen's reinsurers' credit quality, the amount and timing of reinsurance recoverables and reimbursements actually received by Aspen from its reinsurers and the overall level of competition and the related demand and supply dynamics as contracts come up for renewal; the impact that our future operating results, capital position and rating agency and other considerations have on the execution of any capital management initiatives; the impact of any capital management activities on our financial condition; the impact of acts of terrorism and related legislation and acts of war; the possibility of greater frequency or severity of claims and loss activity, including as a result of natural or man-made catastrophic events than our underwriting, reserving or investment practices have anticipated; evolving interpretive issues with respect to coverage as a result of Hurricanes Katrina, Rita and Wilma and any other events such as the UK floods; the level of inflation in repair costs due to limited availability of labor and materials after catastrophes; the effectiveness of Aspen's loss limitation methods; changes in the availability, cost or quality of reinsurance or retrocessional coverage, which may affect our decision to purchase such coverage; the reliability of, and changes in assumptions to, catastrophe pricing, accumulation and estimated loss models; loss of key personnel; a decline in our operating subsidiaries' ratings with Standard & Poor's, A.M. Best Company or Moody's Investors Service; changes in general economic conditions including inflation, foreign currency exchange rates, interest rates and other factors that could affect our investment portfolio; the number and type of insurance and reinsurance contracts that we wrote at the January 1st and other renewal periods in 2008 and the premium rates available at the time of such renewals within our targeted business lines; increased competition on the basis of pricing, capacity, coverage terms or other factors; decreased demand for Aspen’s insurance or reinsurance products and cyclical downturn of the industry; changes in governmental regulations, interpretations or tax laws in jurisdictions where Aspen conducts business; proposed and future changes to insurance laws and regulations, including with respect to U.S. state- and other government-sponsored reinsurance funds and primary insurers; Aspen or its Bermudian subsidiary becoming subject to income taxes in the United States or the United Kingdom; the effect on insurance markets, business practices and relationships of ongoing litigation, investigations and regulatory activity by the New York State Attorney General's office and other authorities concerning contingent commission arrangements with brokers and bid solicitation activities. For a more detailed description of these uncertainties and other factors, please see the “Risk Factors” section in Aspen's Annual Reports on Form 10-K as filed with the U.S. Securities and Exchange Commission on February 29, 2008. Aspen undertakes no obligation to publicly update or revise any forward-looking statements, whether as a result of new information, future events or otherwise. Readers are cautioned not to place undue reliance on these forward-looking statements, which speak only as of the dates on which they are made.
2

Financial Highlights – Q1 2008
3
(33.1)%
23.7%
$1.27
$23.62
$0.85
$29.22
Diluted EPS
Book Value Per Share
22.9%
12.8%
Annualized ROE
79.4%
85.4%
Combined Ratio
28.0%
32.5%
Expense Ratio
51.4%
52.9%
Loss Ratio
Financial Ratios:
(33.4)%
$121.9
$81.2
Net Income after tax
(42.1)%
67.5
39.1
Net Investment Income
(36.8)%
90.5
57.2
Underwriting Income
(10.8)%
439.0
391.6
Net Earned Premiums
(6.4)%
555.1
519.6
Net Written Premiums
(6.3)%
636.5
596.2
Gross Written Premiums
Change
2007
2008
Quarter Ended March 31
(US$ in millions, except per share data)

Financial Highlights – Group Summary Q1
Underwriting Revenues
637
81
555
439
596
77
520
392
0
200
400
600
800
GWP
Premiums
Ceded
NWP
NEP
$ms
2007 Q1
2008 Q1
Income
147
147
122
102
90
96
81
61
0
40
80
120
160
200
Operating
Income
Before Tax
Income
Before Tax
Income After
Tax
Retained
Income
$ms
2007 Q1
2008 Q1
Income Contribution
91
68
57
39
0
40
80
120
Underwriting Income
Net Investment Income
$ms
2007 Q1
2008 Q1
Underwriting Expenses
226
78
45
349
76
51
334
207
0
200
400
600
Losses &
Loss
Expenses
Acquisition
Exp
General &
Admin
Expenses
Total
Underwriting
Expenses
$ms
2007 Q1
2008 Q1
4
Key Performance Metrics – 1Q 2008
Revenues
439
58
10
392
56
-17
-100
0
100
200
300
400
500
Net Earned
Premium
Investment Income
ex FOHF
Funds of Hedge
Funds
$millions
2007 Q1
2008 Q1
Ratio Anlaysis
51
18
10
79
19
13
85
53
0
20
40
60
80
100
Loss Ratio
Acquisition
Expense
Ratio
Operating
Expense
Ratio
Combined
Ratio
%
2007 Q1
2008 Q1
5
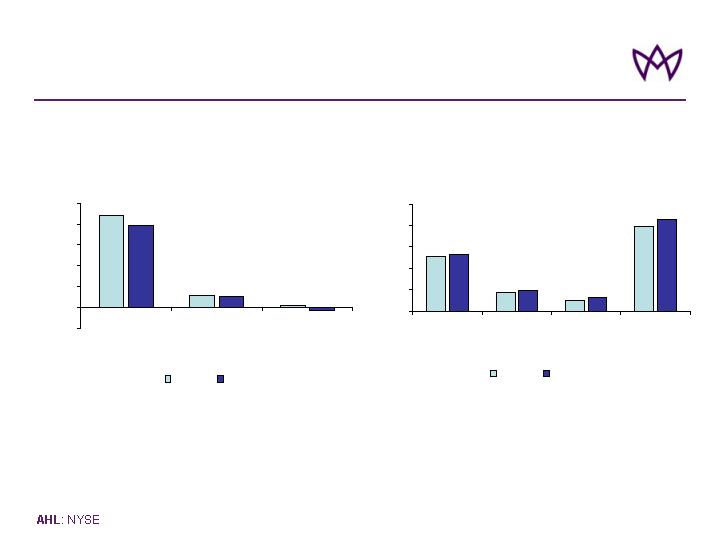
Results by Business Segment – Q1
NWP
177
217
140
22
175
180
142
22
0
40
80
120
160
200
240
Property Re
Casualty Re
International
Insurance
US Insurance
$ms
Underwriting Income
47
16
25
1
47
5
7
-1
-10
0
10
20
30
40
50
60
Property Re
Casualty Re
International
Insurance
US Insurance
$ms
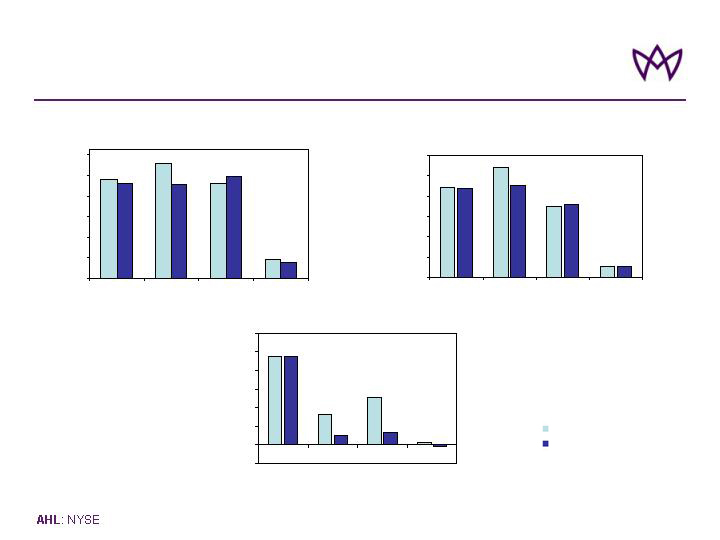
6
GWP
192
223
185
36
184
182
199
31
0
40
80
120
160
200
240
Property Re
Casualty Re
International
Insurance
US Insurance
$ms
2007 Q1
2008 Q1
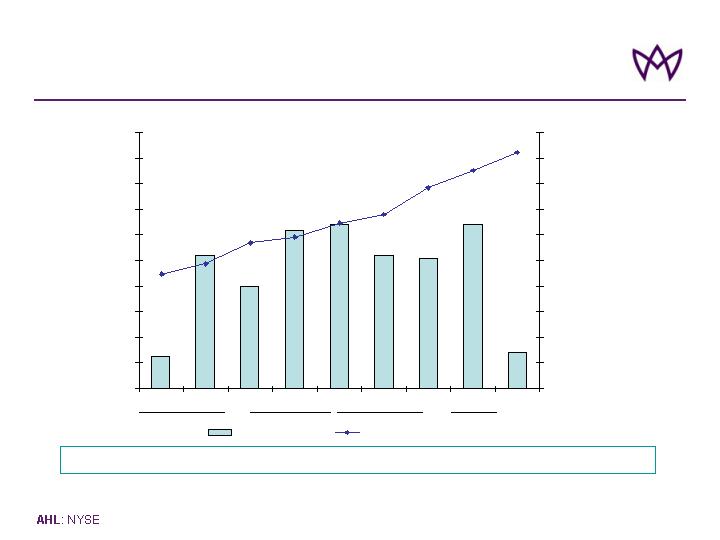
Growth in ROAE and Book Value Per Share
12.5%
20.4%
18.0%
22.4%
22.9%
20.4%
20.2%
22.8%
12.8%
10.0%
12.0%
14.0%
16.0%
18.0%
20.0%
22.0%
24.0%
26.0%
28.0%
30.0%
Q1
Q2
Q3
Q4
Q1
Q2
Q3
Q4
Q1
ROAE %
10.0
12.0
14.0
16.0
18.0
20.0
22.0
24.0
26.0
28.0
30.0
$ Diluted B/V Per Share
Annualised ROAE
Diluted BV Per Share*
Compounded Annual Growth Rate in BVPS over last 8 quarters of 22.6%
7
(*) Note: See Aspen's quarterly financial supplement for a reconciliation of diluted book value per share to basic book value per share, reconciliation of average
equity to closing shareholders’ equity in the Investor Relations section of Aspen's website at www.aspen.bm
2006
2007
2008

1Q 2008 Property Large Risk Loss Market Share
0.35%
Floods (Mainly Mines in Australia and South Africa)
0.28%
Other (Earthquake, Mechanical Failure and Utility Hazard)
0.05%
Tornado (USA)
0.68%
Fire/Explosion (Various losses)
Aspen’s Market Share
Of Industry Insured Loss
Cause of Loss
Aspen had less than 0.50% Industry Insured Loss
Estimated industry insured large property risk losses exceeded $4
billion in 1Q08
Aspen’s loss estimate is approximately $16 million gross
Aspen sustained no losses from its US and International facultative
units due to stringent risk selection
8
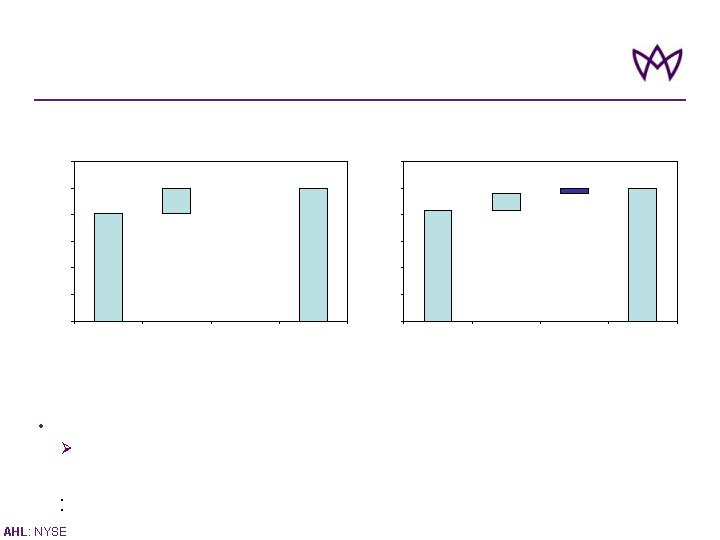
0%
20%
40%
60%
80%
100%
120%
Renewals on
Existing Lines
New Business on
Existing Lines
New Lines
Total
0%
20%
40%
60%
80%
100%
120%
Renewals on
Existing Lines
New Business on
Existing Lines
New Lines
Total
2007 Q1 New Business & Renewals
2008 Q1 New Business & Renewals
Lapsed business approximately 12%* of GWP in Q1 07
Lapsed business approximately 19%* of GWP in Q1 08
(*) As percentage of that year’s business
New lines include Non-Marine Transportation Liability, Professional Lines, Excess Casualty Insurance, Political Risk and Financial Institutions
9
Prudent investment in new underwriting teams offsetting reduction in “existing business”
New business lines introduced in 2007 to account for ~8% of expected 2008 GWP
Steady Top-Line Supported by Disciplined Entrance
into New Lines
$497m
$75m
$24m
$596m
$637m
$515m
$122m
$0m

Performance of Aspen’s Funds of Hedge Funds
(2.73)%
Aspen Funds of Hedge Funds
(4.27)%
HFRI Fund of Fund Composite Index
(10.19)%
Russell 2000 Index
(9.91)%
S&P 500 Index
1st Quarter 2008
Aspen’s FOHF’s Outperformed Benchmarks in Q1 2008
10
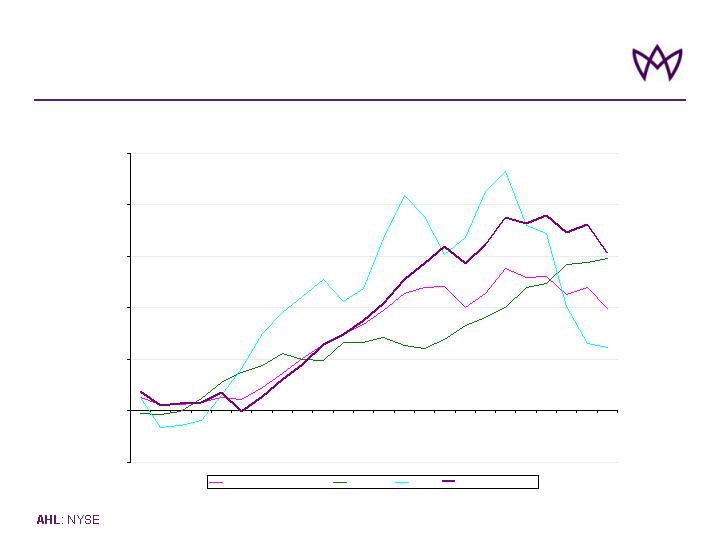
Cumulative Return for Aspen’s Funds of Hedge Funds
Cumulative returns
-5.00%
0.00%
5.00%
10.00%
15.00%
20.00%
25.00%
Apr-
06
May-
06
Jun-
06
Jul-
06
Aug-
06
Sep-
06
Oct-
06
Nov-
06
Dec-
06
Jan-
07
Feb-
07
Mar-
07
Apr-
07
May-
07
Jun-
07
Jul-
07
Aug-
07
Sep-
07
Oct-
07
Nov-
07
Dec-
07
Jan-
08
Feb-
08
Mar-
08
HFRI FOF: Conservative Index
Lehman Agg
S&P500
Aspen FOHF weighted
11
Aspen FOHF
Lehman Agg
HFRI FOF
S&P 500
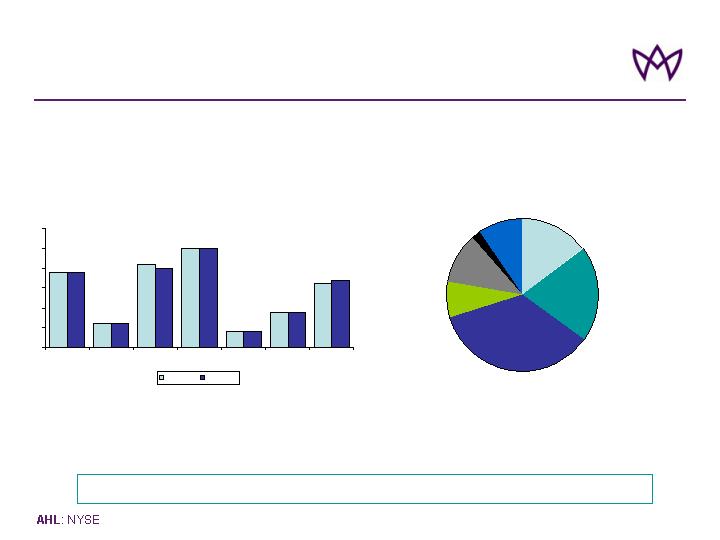
Govt*, 15%
Agency*, 20%
AAA, 35%
AA, 8%
A, 11%
BBB, 2%
FOHF, 9%
Portfolio Credit Ratings (as at March 31, 2008)
Aggregate Investment Portfolio
Asset Class Allocation
6%
21%
25%
4%
9%
16%
19%
6%
20%
25%
4%
9%
17%
19%
0%
5%
10%
15%
20%
25%
30%
Govt
Agency
MBS
Corp
ABS
FOHF
Cash/ST
Dec 2007
Mar 2008
89% of Portfolio ‘A’ or Better, Overall Fixed Income ‘AA+’
12
* Govt rated securities includes GNMAs that are classified as “MBS” at left; Agency rated securities include Agency issued mortgage backed securities that are classified as “MBS” at left.
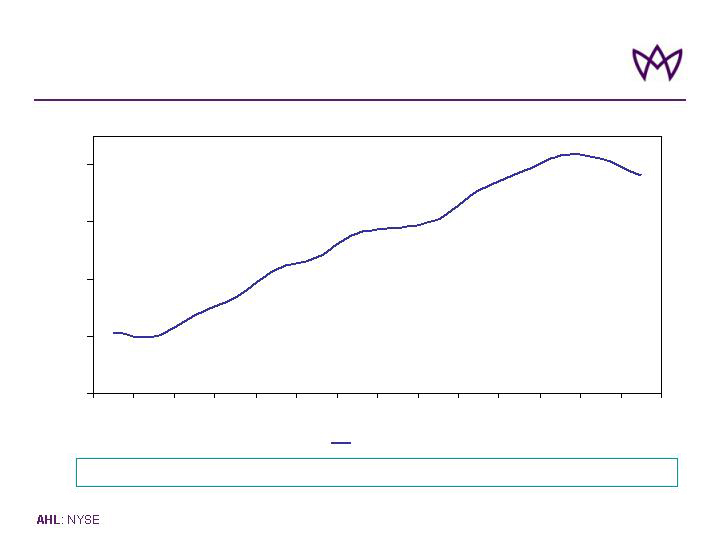
Fixed Income Book Yield
3.0%
3.5%
4.0%
4.5%
5.0%
Q404
Q105
Q205
Q305
Q405
Q106
Q206
Q306
Q406
Q107
Q207
Q307
Q407
Q108
Fixed Income
Active management of interest rate cycle resulting in stable fixed income book yield
13

2008 Guidance
ROE of 13% - 16% (assuming normal loss experience)
(Initial 2008 Guidance for ROE of 14% - 17% provided in February 7, 2008)
14
$240 - $255 million
Net Return on Fixed Income and Short term
Investments
$10 - $30 million
Net Return on Investments in Funds of Hedge
Funds
$135 million
13% to 16%
$290 - $320 million
88% - 93%
8% - 10% of GEP
$1.8 billion ± 5%
Initial Guidance
February 7, 2008
$135 million
13% to 16%
$250 - $285 million
88% - 93%
8% - 10% of GEP
$1.8 billion ± 5%
Revised Guidance
May 1, 2008
Assumed Cat-Load
Tax Rate
Net Investment Income on Fixed Income
Securities, Short term Investments and Funds
of Hedge Funds
Combined Ratio
% Premium Ceded
GWP
Market Conditions
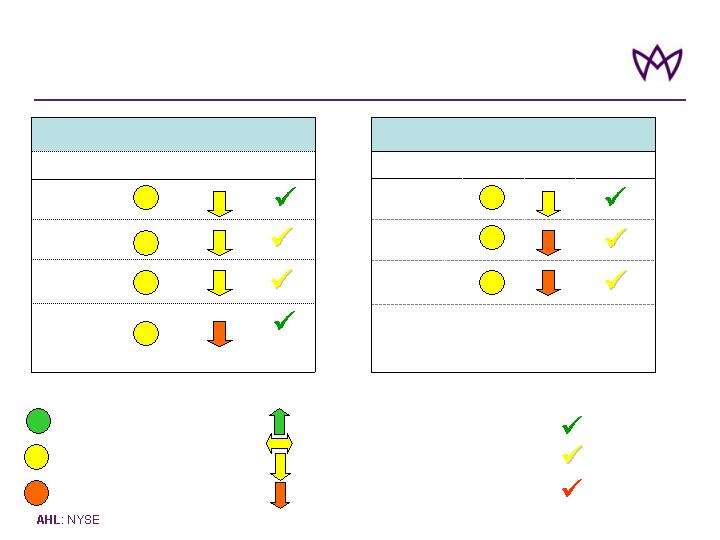
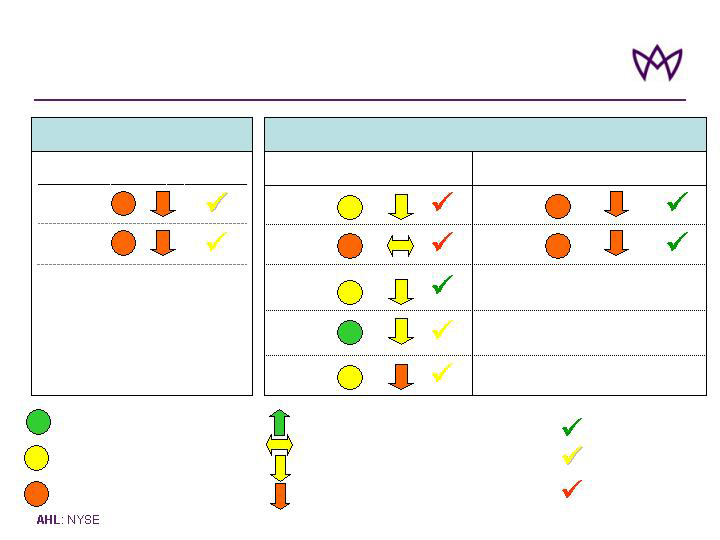
2008 Outlook: Property Reinsurance
and Casualty Reinsurance
Market
Trend
Casualty
Facultative
US Casualty
Intl. Casualty
Aspen 2008
Performance
Market
Conditions
Line
Casualty Reinsurance
Property Reinsurance
Property
Facultative
Pro Rata
Market Trend
Risk Excess
Treaty
Catastrophe
Treaty
Aspen 2008
Performance
Market Conditions
Line
= Absolute rate levels attractive
= Absolute rate levels mixed
= Absolute rate levels very challenging
= 12 month rate trend positive
= 12 month rate trend neutral
= 12 month rate trend slightly downwards
= 12 month rate trend downwards
Strong
Good
Improvement Required
15
Market Conditions
2008 Outlook: US Insurance and International
Insurance
Aspen 2008
Performance
UK Liability
UK
Property
Line
Market
Conditions
Market
Trend
Market
Trend
Specialty
Reinsurance
Marine &
Energy Liability
Offshore
Energy
Physical
Damage
Marine Hull
Aviation
Aspen 2008
Performance
Market
Conditions
Line
International Insurance
= Absolute rate levels attractive
= Absolute rate levels mixed
= Absolute rate levels very challenging
= 12 month rate trend positive
= 12 month rate trend neutral
= 12 month rate trend slightly downwards
= 12 month rate trend downwards
16
Strong
Good
Improvement Required
US Insurance
E&S Casualty
Market
Trend
E&S Property
Aspen 2008
Performance
Market
Conditions
Line