UNITED STATES
SECURITIES AND EXCHANGE COMMISSION
Washington, D.C. 20549
FORM N-CSR
CERTIFIED SHAREHOLDER REPORT OF REGISTERED
MANAGEMENT INVESTMENT COMPANIES
Investment Company Act file number 811-21465
|
| CBRE Clarion Global Real Estate Income Fund |
(Exact name of registrant as specified in charter)
|
| 201 King of Prussia Road, Suite 600 Radnor, PA 19087 |
(Address of principal executive offices) (Zip code)
|
T. Ritson Ferguson, President and Chief Executive Officer CBRE Clarion Global Real Estate Income Fund 201 King of Prussia Road, Suite 600 Radnor, PA 19087 |
(Name and address of agent for service)
Registrant’s telephone number, including area code: 1-888-711-4272
Date of fiscal year end: December 31
Date of reporting period: December 31, 2012
Form N-CSR is to be used by management investment companies to file reports with the Commission not later than 10 days after the transmission to stockholders of any report that is required to be transmitted to stockholders under Rule 30e-1 under the Investment Company Act of 1940 (17 CFR 270.30e-1). The Commission may use the information provided on Form N-CSR in its regulatory, disclosure review, inspection, and policymaking roles.
A registrant is required to disclose the information specified by Form N-CSR, and the Commission will make this information public. A registrant is not required to respond to the collection of information contained in Form N-CSR unless the Form displays a currently valid Office of Management and Budget (“OMB”) control number. Please direct comments concerning the accuracy of the information collection burden estimate and any suggestions for reducing the burden to Secretary, Securities and Exchange Commission, 450 Fifth Street, NW, Washington, DC 20549-0609. The OMB has reviewed this collection of information under the clearance requirements of 44 U.S.C. § 3507.
| Item 1. | Report(s) to Stockholders. |
The Annual Report of CBRE Clarion Global Real Estate Income Fund (the “Trust”) transmitted to shareholders pursuant to Rule 30e-1 under the Investment Company Act of 1940 is as follows:

CBRE CLARION GLOBAL REAL ESTATE
INCOME FUND
Annual Report for the Year Ended December 31, 2012

CBRE Clarion Global Real Estate Income Fund (the “Trust”), acting in accordance with an exemptive order received from the Securities and Exchange Commission (“SEC”) and with approval of its Board of Trustees (the “Board”), has adopted a managed distribution policy (the “Policy”) with the purpose of distributing over the course of each year, through periodic distributions as nearly equal as practicable and any required special distributions, an amount closely approximating the total taxable income of the Trust during such year and all of the returns of capital paid by portfolio companies to the Trust during such year. In accordance with its Policy, the Trust distributes a fixed amount per common share, currently $0.045, each month to its common shareholders. This amount is subject to change from time to time in the discretion of the Board. Although the level of distributions is independent of fund performance, the Trust expects such distributions to correlate with its performance over time. Each monthly distribution to shareholders is expected to be at the fixed amount established by the Board, except for extraordinary distributions and potential increases or decreases in the final dividend periods for each year in light of the Trust’s performance for the entire calendar year and to enable the Trust to comply with the distribution requirements imposed by the Internal Revenue Code. Over time, the Trust expects that the distribution rate in relation to the Trust’s Net Asset Value (“NAV”) will approximately equal the Trust’s total return on NAV.
The fixed amount of distributions will be reviewed and amended as necessary by the Board at regular intervals with consideration of the level of investment income and realized gains. The Board strives to establish a level regular distribution that will meet the Trust’s requirement to pay out all taxable income (including amounts representing return of capital paid by portfolio companies) with a minimum of special distributions. The Trust’s total return in relation to changes in NAV is presented in the financial highlights table. Shareholders should not draw any conclusions about the Trust’s investment performance from the amount of the current distribution or from the terms of the Trust’s managed distribution policy. The Board may amend or terminate the managed distribution policy without prior notice to Trust shareholders.
Shareholders should note that the Trust’s Policy is subject to change or termination as a result of many factors. The Trust is subject to risks through ownership of its portfolio company holdings including, but not limited to, declines in the value of real estate held by the portfolio company, risks related to general and local economic conditions, and portfolio company losses. Moreover, an economic downturn could have a material adverse effect on the real estate markets and on real estate companies in which the Trust invests, which in turn could result in the Trust not achieving its investment or distribution objectives thereby jeopardizing the continuance of the Policy. Please refer to the prospectus for a fuller description of the Trust’s risks.
Table of Contents
CBRE CLARION GLOBAL REAL ESTATE INCOME FUND ANNUAL REPORT 2012
Letter to Shareholders

T. Ritson Ferguson

Steven D. Burton
Dear Shareholder:
We are pleased to present the 2012 Annual Report for the CBRE Clarion Global Real Estate Income Fund (the “Trust”).
Performance Review
Global real estate stocks, as measured by the S&P Developed Property Index (S&PDPI) (1), delivered strong positive returns in 2012 (+29%). Approximately half of the 2012 return for real estate stocks can be attributed to dividends (of 3-5%) and earnings growth (of 7-8%). A large part of the balance of the impressive property share performance for the year occurred as the result of improving real estate values. In 2012, we estimate real estate values for properties owned by public real estate companies have increased globally by approximately 12% on a weighted average basis as a result of the combination of improving underlying earnings growth as well as investors’ willingness to accept lower initial yields on their real estate investments.
During the 2012 calendar year, the S&PDPI rose 29% and the MSCI REIT Preferred Index (MSRPI) (2) rose 9.6%. The Trust’s Net Asset Value Return (“NAV Return” i.e., NAV gain plus dividends) was 24.2% during 2012, which was modestly behind the 25% return of a blended index comprised of 80% S&PDPI and 20% MSRPI (3). On average in 2012, 14% of the Trust’s portfolio was invested in preferred stock, and the Trust’s preferred stock holdings outperformed the MSRPI for the year. The Trust’s common stock holdings, which comprised 85% of the Trust’s portfolio on average during the year, slightly underperformed the S&PDPI. The Trust’s market price return of 38.8% (i.e., stock price appreciation plus reinvested dividends) exceeded the NAV Return due to the significant narrowing of the discount of the Trust’s share price to NAV (from a 16% discount at the end of last year to a 6.5% discount at December 31, 2012). The Trust continues to employ little leverage in an effort to reduce volatility.
The Trust paid total dividends of $0.582 per share in 2012: twelve regular monthly dividends of $0.045 per share and one special dividend of $0.042 in December, which was necessary to ensure that the Trust distributed all of its estimated income for the year. The total dividends paid in 2012 ($0.582 per share) represents a 6.6% yield on the $8.86 share price and a 6.1% yield on the $9.48 NAV per share as of December 31, 2012.
The Board continues to review the sustainability of the Trust’s regular monthly dividend in light of the current market environment and the dividends that have been paid out over the life of the Trust (which amount to $12.23 per share since inception in 2004). Based on anticipated income and expected gains in global property company stocks in 2013, the Board has decided to maintain the monthly dividend at the current level rate of $0.045 per share. The Trust’s dividend is established by the Board at regular intervals with consideration of the portfolio’s level of investment income, potential capital appreciation and market conditions. The Board strives to establish a level monthly dividend that, by the end of the year, satisfies the requirement (under applicable tax regulations) to distribute all income and realized gains, with a minimum of special distributions.
| (1) | The S&P Developed Property Index is an unmanaged market-weighted total return index which consists of over 350 real estate companies from 22 developed markets with a free float total market capitalization of at least U.S. $100 million that derive more than 60% of their revenue from real estate development, management, rental and/or direct investment in physical property. |
| (2) | The MSCI REIT Preferred Index is a preferred stock market capitalization weighted index of all exchange traded preferred securities of equity REITs. |
| (3) | We include the return of this “blended index” as a reference point, since the Trust invests in both common and preferred stocks issued by listed property companies. The Trust does not have a formal performance benchmark. |
| | |
| 2 | | CBRE CLARION GLOBAL REAL ESTATE INCOME FUND |
Portfolio Review
The Trust’s portfolio remains well-diversified by property type and geography as shown in the pie charts below. The geographic mix of the portfolio changed during the past twelve months. The Trust’s holdings of preferred stock (issued by US real estate companies) has been reduced to 12% of its portfolio (versus 20% at the beginning of the year) resulting in an 8% reduction in exposure to North America. At December 31, the Trust’s portfolio was 48% invested in common stock and 12% in preferred stock issued by property companies in North America. The reduction in exposure to North America gave rise to increased exposure to the Asia-Pacific region (which now comprises 28% of the portfolio compared to 23% at the start of the year) as well as to Europe (which increased to 12% from 10% a year ago). Retail continues to be the largest property type represented in the portfolio at 45%. We continue to favor retail properties, particularly top-quality malls (because historically these properties have shown more stable cash flows during economic slow-downs than other types of commercial property). The second largest property type exposure is diversified which reflects the portfolio’s increased exposure to the Asia-Pacific region, where many companies specialize by geography and own a mix of high quality office, retail and residential properties. The Trust also has meaningful positions in the industrial, apartment and office sectors.
| | |
Geographic Diversification | | Sector Diversification |
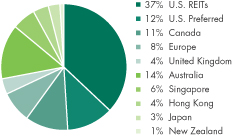 | | 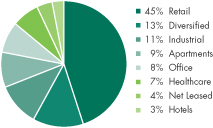 |
Source CBRE Clarion. Geographic and Sector diversification are unaudited. Percentages presented are based on managed trust assets, which includes borrowings. The percentages in the pie charts will differ from those on the Portfolio of Investments because the figures on the Portfolio of Investments are calculated using net assets of the Trust.
Market Commentary
Listed real estate companies delivered impressive returns in 2012 generating strong double-digit returns in every region. Returns were good in absolute terms and in relative terms as regional real estate stock indices outperformed local equity market indices in 2012. Returns were strongest in the Asia-Pacific region, followed by Europe and then North America. Property companies performed well due to a high and growing dividend, strong earnings growth, and rising property values due to gradually improving economic conditions, evidence of continued improving real estate fundamentals, and accommodative capital markets.
| | | | | | | | |
| Global Real Estate Returns By Region | | | | | | | | |
| Region/ Country | | 2012 | | | 2011 | |
World | | | 28.9 | % | | | -5.6 | % |
North America | | | 18.5 | | | | 8.1 | |
Canada | | | 20.4 | | | | 11.5 | |
United States | | | 18.4 | | | | 7.9 | |
Europe | | | 30.7 | | | | -13.5 | |
Continental Europe | | | 28.2 | | | | -15.6 | |
United Kingdom | | | 35.7 | | | | -9.2 | |
Asia-Pacific | | | 43.3 | | | | -16.5 | |
Australia | | | 34.4 | | | | -2.5 | |
Hong Kong | | | 38.2 | | | | -22.7 | |
Japan | | | 46.4 | | | | -17.0 | |
Singapore | | | 62.6 | | | | -23.8 | |
Source: S&P Developed Property Index in USD. Not all countries displayed. An index is unmanaged and not available for direct investment. Past performance is no guarantee of future results.
Performance leadership changed in 2012. As in past years, performance for real estate stocks varied significantly across regions last year. After two consecutive years as the best performing region, property stocks in North America underperformed in 2012. However, total returns for both U.S. and Canadian REITs were still impressive at +18% and +20%, respectively. Asia-Pacific returns were strongest as all four of its major constituent geographies delivered very good performance, including Singapore 63%, Japan 46%, Hong Kong 38%, and Australia 34%. European property companies generated strong total returns in both the U.K. and Continental Europe as investors increasingly realized that the euro zone debt crisis had stabilized and the political crisis had begun to wane. Investors were also attracted to the 4-5% dividends of European property companies, which were above the global average for real estate stocks and were also superior to many fixed income alternatives in the region. The U.S. dollar (USD) generally weakened during the year versus other major currencies with the exception of the Japanese yen. All-in, however, the currency effect for the year for a USD-based investor was negligible.
Strong returns were driven by significant increase in real estate values. In 2012, we estimate real estate values for properties owned by public real estate companies to have increased globally by approximately 12%, on a weighted average basis. Real estate values improved as a result of the combination of improving underlying earnings growth as well as investors’ willingness to accept lower initial yields on their real estate investments. Using real estate terminology, we experienced “cap rate compression” during the year. Our underwritten increases in real estate value or net asset value (NAV) by region for 2012 are reflected in the following chart:
Changes in NAV Estimates
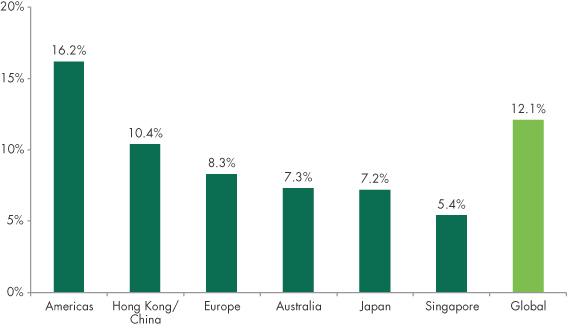
Information is the opinion of CBRE Clarion as of 12/31/12, is subject to change and is not intended to be a forecast of future events, or a guarantee of future results, or investment advice. Forecasts and any factors discussed are not indicative of future investment performance.
Strong growth in dividends was fueled by strong earnings growth. Dividend growth in 2012 was in the high single-digit range, exceeding our predictions at the beginning of the year. We project dividend growth will continue in 2013 growing 5-8%, driven by a combination of improving company cash flows as well as an expansion of dividend payout policies which remain conservative. Dividend increases among U.S. REITs were particularly strong in 2012 with 105 increases versus 79 increases during 2011. Seventeen companies increased their dividend multiple times during the year. The weighted average increase for those U.S. companies increasing their dividends was approximately 20% which translated to a 15% increase for the entire U.S. REIT universe. For example, Simon Property Group, a large mall company, has increased its dividend in each of the past four quarters for an aggregate increase of 22%. The average dividend yield for global real estate stocks remains in the 3-5% range and is growing.
| | |
| 4 | | CBRE CLARION GLOBAL REAL ESTATE INCOME FUND |
The case for investment in listed property remains robust. The investment case for property companies remains very much intact despite strong performance last year. The investment thesis remains favorable based on: (1) improving earnings, which have generally consistently met or exceeded expectations and are underpinned by contractual lease obligations; (2) attractive absolute and relative level of the dividend yield which is growing; (3) valuations that remain attractive relative to our estimate of inherent private market real estate values; (4) continued access to attractively priced capital, which has provided a competitive advantage versus many private owners of real estate; and (5) a robust commercial property sales transaction market in which listed property companies are actively involved.
We expect global property stocks to deliver a total return of 10-12% in 2013. Our return forecast is based on a well-supported dividend yield of approximately 4%, cash flow per share growth of 6-7%, and stable to improving earnings multiples. We make this projection with full knowledge that predictions often go wrong and that assumptions will likely change over the course of the year. In a “new normal” world of low returns and economic uncertainty, listed real estate trading at discounted valuations should, in our view, offer investors attractive total return potential.
We estimate earnings will grow again in 2013, in the 6-7% range. The “bottom-up” view of listed property companies appears to validate a thesis of continued improvement in cash flows despite sluggish, but improving economic growth. We expect property companies to generate earnings growth in 2013 of approximately 6-7% as the gradual economic recovery begins to gain traction which will positively affect real estate cash flows. This outlook follows earnings growth of approximately 7-8% in 2012. Our earnings growth forecasts are positive as a result of a combination of improving operating trends, improving occupancies, and positive “mark-to-market” of rental rates for newly signed leases. Other positive factors include improved balance sheets, access to attractively priced capital (both equity and debt) and an active transactions market.
Regional Earnings Growth Forecast
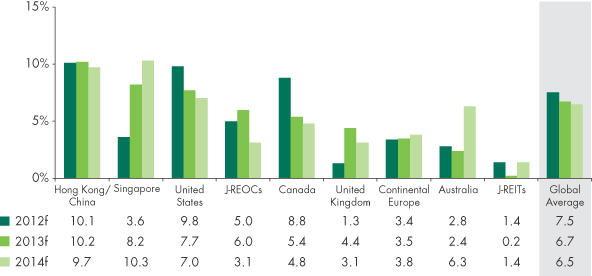
Source: CBRE Clarion as of 12/31/2012. Information is the opinion of CBRE Clarion and is subject to change and is not intended to be a forecast of future events, a guarantee of future results, or investment advice. “f” refers to “forecasts”. Forecasts and the factors noted are not indicative of future investment performance.
We expect dividend growth will be strong again in 2013. Current income generated by listed property’s dividend yield remains a defining investment characteristic of the sector. Listed property companies’ currently offer dividend yields of 3-5% globally and are growing at a very healthy clip. We project average dividend growth to be in the 5-8% range in 2013, driven by a combination of improving company cash flows as well as an expansion of dividend payout policies which remain conservative. The spread between dividend yields and bonds also continues to be above-average. For example, the spread between the average dividend yield on U.S. REITs at year-end of approximately 170 basis points (3.5% dividend yield versus 1.8% yield on 10-year Treasuries) compares favorably to a long-term average of approximately 110 basis points. This above-average spread is common in many of the world’s REIT markets. Dividend yields for the major geographic markets are reflected in the chart below:
Global Dividend Yield
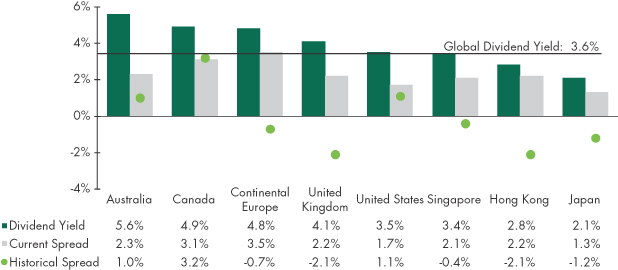
Source: CBRE Clarion, FactSet and Bloomberg as of 12/31/2012. Not all countries included. This information is subject to change and should not be construed as investment advice. Yields fluctuate and are not guaranteed. Past performance is no guarantee of future results.
Valuations remain reasonable despite outperformance. Listed property companies continue to trade at discounts to our estimate of the companies’ underlying real estate values (NAV). The discount has narrowed somewhat (to 3% from the 11% discount observed at the start of 2012), but valuations remain reasonable. Said differently, we believe that the price-earnings multiples on property stocks are generally well supported by the estimated private market value of their properties, and could expand further in 2013. The current valuations equates to a 5.7% implied unleveraged cash flow yield which is also appealing in today’s investment market given an interest rate environment which remains at historical lows. We believe the unleveraged implied yield of listed property companies comfortably meets institutional underwriting requirements for compounded rates of return (i.e., IRR’s in the 6-8% range). After growth from other sources like acquisitions and balance sheet refinancing are taken into account, prospective returns of listed real estate companies remain attractive.
We continue to believe that global property stocks offer investors an attractive investment option, anchored by current yield via the dividend and underpinned by increasing real estate cash flows derived from improving fundamentals.
We appreciate your continued faith and confidence.
Sincerely,
| | |
 | |  |
| T. Ritson Ferguson | | Steven D. Burton |
| President & Chief Executive Officer | | Co-Portfolio Manager |
| Co-Portfolio Manager | | |
| | |
| 6 | | CBRE CLARION GLOBAL REAL ESTATE INCOME FUND |
The views expressed represent the opinion of CBRE Clarion Securities which are subject to change and are not intended as a forecast or guarantee of future results. This material is for informational purposes only. It does not constitute investment advice and is not intended as an endorsement of any specific investment. Stated information is derived from proprietary and non-proprietary sources which have not been independently verified for accuracy or completeness. While CBRE Clarion Securities believes the information to be accurate and reliable, we do not claim or have responsibility for its completeness, accuracy, or reliability. Statements of future expectations, estimate, projections, and other forward-looking statements are based on available information and management’s view as of the time of these statements. Accordingly, such statements are inherently speculative as they are based on assumptions which may involve known and unknown risks and uncertainties. The securities discussed herein should not be perceived as a recommendation to purchase or sell any particular security. It should not be assumed that investments in any of the securities discussed were or will be profitable. Actual results, performance or events may differ materially from those expressed or implied in such statements. Investing in real estate securities involves risks including the potential loss of principal. Real estate equities are subject to risks similar to those associated with the direct ownership of real estate. Portfolios concentrated in real estate securities may experience price volatility and other risks associated with non-diversification. While equities may offer the potential for greater long-term growth than most debt securities, they generally have higher volatility. International investments may involve risk of capital loss from unfavorable fluctuation in currency values, from differences in generally accepted accounting principles, or from economic or political instability in other nations. Past performance is no guarantee of future results.
Portfolio of Investments
December 31, 2012
| | | | | | | | | | | | |
| Shares | | | | | | | | | Market
Value ($) | |
| | | | | | Real Estate Securities* – 101.4% | | | | | | |
| | | | | | Common Stock – 89.6% | | | | | | |
| | | | | | Australia – 14.8% | | | | | | |
| | 5,453,037 | | | | | CFS Retail Property Trust Group | | | | $ | 10,841,467 | |
| | 2,776,835 | | | | | Charter Hall Retail Real Estate Investment Trust | | | | | 10,839,737 | |
| | 38,529,000 | | | | | Dexus Property Group | | | | | 40,600,801 | |
| | 1,410,723 | | | | | Goodman Group | | | | | 6,341,770 | |
| | 4,469,500 | | | | | GPT Group | | | | | 17,076,056 | |
| | 4,102,827 | | | | | Westfield Group | | | | | 44,980,879 | |
| | 10,284,262 | | | | | Westfield Retail Trust | | | | | 32,244,890 | |
| | | | | | | | | | | 162,925,600 | |
| | | | | | | | | | | | |
| | | | | | Canada – 11.3% | | | | | | |
| | 200,100 | | | | | Calloway Real Estate Investment Trust | | | | | 5,817,912 | |
| | 500,000 | | | | | Crombie Real Estate Investment Trust (a) | | | | | 7,411,871 | |
| | 1,039,800 | | | | | H&R Real Estate Investment Trust | | | | | 25,167,400 | |
| | 2,082,900 | | | | | InnVest Real Estate Investment Trust | | | | | 8,639,527 | |
| | 440,000 | | | | | InnVest Real Estate Investment Trust (a) | | | | | 1,825,048 | |
| | 700,000 | | | | | Primaris Retail Real Estate Investment Trust (a) | | | | | 18,911,319 | |
| | 2,078,800 | | | | | RioCan Real Estate Investment Trust | | | | | 57,539,146 | |
| | | | | | | | | | | 125,312,223 | |
| | | | | | | | | | | | |
| | | | | | France – 5.1% | | | | | | |
| | 65,700 | | | | | Altarea | | | | | 10,134,411 | |
| | 351,122 | | | | | Societe de la Tour Eiffel | | | | | 20,599,911 | |
| | 106,820 | | | | | Unibail-Rodamco SE | | | | | 25,624,294 | |
| | | | | | | | | | | 56,358,616 | |
| | | | | | | | | | | | |
| | | | | | Germany – 0.6% | | | | | | |
| | 167,161 | | | | | GSW Immobilien AG | | | | | 7,052,323 | |
| | | | | | Hong Kong – 4.0% | | | | | | |
| | 8,913,000 | | | | | Link REIT (The) | | | | | 44,502,616 | |
| | | | | | Japan – 3.1% | | | | | | |
| | 840 | | | | | Activia Properties, Inc. | | | | | 5,265,483 | |
| | 620 | | | | | Frontier Real Estate Investment Corp. | | | | | 5,413,751 | |
| | 12,852 | | | | | Japan Retail Fund Investment Corp. | | | | | 23,574,015 | |
| | | | | | | | | | | 34,253,249 | |
| | | | | | | | | | | | |
| | | | | | | | | | | | |
| Shares | | | | | | | | | Market
Value ($) | |
| | | | | | Netherlands – 2.9% | | | | | | |
| | 118,455 | | | | | Corio NV | | | | $ | 5,359,011 | |
| | 357,401 | | | | | Eurocommercial Properties NV | | | | | 14,201,895 | |
| | 277,161 | | | | | Vastned Retail NV | | | | | 11,967,149 | |
| | | | | | | | | | | 31,528,055 | |
| | | | | | | | | | | | |
| | | | | | New Zealand – 0.7% | | | | | | |
| | 9,050,000 | | | | | Goodman Property Trust | | | | | 7,540,914 | |
| | | | | | Singapore - 5.8% | | | | | | |
| | 6,735,000 | | | | | Ascendas Real Estate Investment Trust | | | | | 13,067,499 | |
| | 16,748,000 | | | | | CapitaMall Trust | | | | | 29,204,453 | |
| | 6,761,600 | | | | | Global Logistic Properties Ltd. | | | | | 15,388,660 | |
| | 4,757,000 | | | | | Suntec Real Estate Investment Trust | | | | | 6,523,107 | |
| | | | | | | | | | | 64,183,719 | |
| | | | | | | | | | | | |
| | | | | | United Kingdom – 3.8% | | | | | | |
| | 1,939,300 | | | | | Land Securities Group Plc | | | | | 25,644,236 | |
| | 4,045,110 | | | | | Segro Plc | | | | | 16,214,763 | |
| | | | | | | | | | | 41,858,999 | |
| | | | | | | | | | | | |
| | | | | | United States – 37.5% | | | | | | |
| | 666,667 | | | | | American Homes 4 Rent (a)(b)(d) | | | | | 10,000,005 | |
| | 795,353 | | | | | Brandywine Realty Trust | | | | | 9,695,353 | |
| | 826,200 | | | | | Camden Property Trust | | | | | 56,355,102 | |
| | 666,632 | | | | | CBL & Associates Properties, Inc. | | | | | 14,139,265 | |
| | 327,769 | | | | | General Growth Properties, Inc. | | | | | 6,506,215 | |
| | 418,515 | | | | | Health Care REIT, Inc. (c) | | | | | 25,650,784 | |
| | 648,600 | | | | | Highwoods Properties, Inc. | | | | | 21,695,670 | |
| | 1,533,200 | | | | | Liberty Property Trust | | | | | 54,842,564 | |
| | 1,183,385 | | | | | Macerich Co. (The) | | | | | 68,991,345 | |
| | 1,847,070 | | | | | OMEGA Healthcare Investors, Inc. | | | | | 44,052,619 | |
| | 364,731 | | | | | ProLogis, Inc. | | | | | 13,309,034 | |
| | 100,000 | | | | | Regency Centers Corp. | | | | | 4,712,000 | |
| | 1,040,500 | | | | | Retail Properties of America, Inc., Class A | | | | | 12,454,785 | |
| | 94,219 | | | | | Simon Property Group, Inc. (c) | | | | | 14,895,082 | |
| | 789,000 | | | | | Spirit Realty Capital, Inc. | | | | | 14,028,420 | |
| | 1,211,534 | | | | | UDR, Inc. | | | | | 28,810,279 | |
| | 63,760 | | | | | Ventas, Inc. | | | | | 4,126,547 | |
| | 712,120 | | | | | Verde Realty (b)(d) | | | | | 9,791,650 | |
| | | | | | | | | | | | 414,056,719 | |
| | | | | | Total Common Stock | | | | | | |
| | | | | | | (cost $798,302,413) | | | | | 989,573,033 | |
See notes to financial statements.
| | |
| 8 | | CBRE CLARION GLOBAL REAL ESTATE INCOME FUND |
Portfolio of Investments concluded
| | | | | | | | | | | | |
| Shares | | | | | | | | | Market Value ($) | |
| | | | | | Preferred Stock - 11.8% | | | | | | |
| | | | | | United States - 11.8% | | | | | | |
| | 480,000 | | | | | BioMed Realty Trust, Inc., Series A | | | | $ | 12,235,200 | |
| | 100,000 | | | | | CBL & Associates Properties, Inc., Series D | | | | | 2,505,000 | |
| | 61,125 | | | | | Cedar Realty Trust, Inc., Series A | | | | | 1,558,687 | |
| | 171,300 | | | | | Corporate Office Properties Trust SBI MD, Series J | | | | | 4,284,213 | |
| | 320,000 | | | | | Digital Realty Trust, Inc., Series E | | | | | 8,534,400 | |
| | 25,700 | | | | | Eagle Hospitality Properties Trust, Inc., Series A(b) | | | | | 1,658 | |
| | 1,050,000 | | | | | EPR Properties, Series F | | | | | 25,830,000 | |
| | 564,128 | | | | | Glimcher Realty Trust, Series G | | | | | 14,199,102 | |
| | 150,000 | | | | | iStar Financial, Inc., Series F | | | | | 3,270,000 | |
| | 765,000 | | | | | iStar Financial, Inc., Series I | | | | | 16,646,400 | |
| | 520,000 | | | | | LaSalle Hotel Properties, Series G | | | | | 13,083,200 | |
| | 268,000 | | | | | Pebblebrook Hotel Trust, Series A | | | | | 6,943,880 | |
| | 272,000 | | | | | Pennsylvania Real Estate Investment Trust, Series B | | | | | 6,884,320 | |
| | 291,217 | | | | | SL Green Realty Corp., Series C | | | | | 7,306,634 | |
| | 280,000 | | | | | Urstadt Biddle Properties, Inc., Series F (b) | | | | | 7,277,200 | |
| | | | | | | Total Preferred Stock
(cost $123,661,288) | | | | | 130,559,894 | |
| | | | | | | Total Investments - 101.4%
(cost $921,963,701) | | | | | 1,120,132,927 | |
| | | | | | | Liabilities in Excess of Other Assets - (1.4)% | | | | | (15,136,275 | ) |
| | | | |
| | | | | | | Net Assets - 100.0% | | | | $ | 1,104,996,652 | |
| * | Includes U.S. Real Estate Investment Trusts (“REIT”) and Real Estate Operating Companies (“REOC”) as well as entities similarly formed under the laws of non-U.S. Countries. |
| (a) | Securities are exempt from registration under Rule 144A of the Securities Act of 1933. These securities may be resold in transactions that are exempt from registration, normally to qualified institutional buyers. At December 31, 2012, the securities amounted to $38,148,243 or 3.5% of net assets. |
| (b) | Non-income producing security. |
| (c) | All or a portion of these securities have been physically segregated in connection with written option contracts. |
| (d) | Fair valued pursuant to guidelines approved by the board. |
| | | | | | | | | | | | | | | | | | |
Number of
Contracts | | | | Call Options Written (b) | | Expiration
Date | | | Exercise
Price | | | | | Market
Value | |
| 1,500 | | | | Health Care REIT, Inc. | | | January 2013 | | | $ | 63 | | | | | $ | 30,000 | |
| 500 | | | | Simon Property Group, Inc. | | | January 2013 | | | | 155 | | | | | | 197,500 | |
| | | | | Total Call Options Written (Premiums received $110,607) | | | | | | | | | | | | $ | 227,500 | |
See notes to financial statements.
Statement of Assets and Liabilities
| | | | | | |
| | | | | December 31, 2012 | |
| | |
Assets | | | | | | |
Investments, at value (cost $921,963,701) | | | | | $1,120,132,927 | |
Cash and cash equivalents (including foreign currency of $92,825
with a cost of $92,823) | | | | | 182,044 | |
Dividends and interest receivable | | | | | 7,312,204 | |
Dividend withholding reclaims receivable | | | | | 34,226 | |
Other assets | | | | | 124,844 | |
Total Assets | | | | | 1,127,786,245 | |
| | |
Liabilities | | | | | | |
Line of credit payable | | | | | 21,438,800 | |
Written options (premiums received $110,607) | | | | | 227,500 | |
Unrealized depreciation on spot contracts | | | | | 65 | |
Management fee payable | | | | | 760,588 | |
Accrued expenses | | | | | 362,640 | |
Total Liabilities | | | | | 22,789,593 | |
| | |
Net Assets | | | | | $1,104,996,652 | |
| | |
Composition of Net Assets | | | | | | |
$0.001 par value per share;
unlimited number of shares authorized,
116,590,494 shares issued and outstanding | | | | | $ 116,590 | |
Additional paid-in capital | | | | | 1,363,136,178 | |
Distributions in excess of net investment income | | | | | (80,867,885 | ) |
Accumulated net realized loss on investments, written options, swap contracts and foreign currency transactions | | | | | (375,425,954 | ) |
Net unrealized appreciation on investments, written options and foreign currency denominated assets and liabilities | | | | | 198,037,723 | |
| | |
Net Assets | | | | | $1,104,996,652 | |
| | |
Net Asset Value
(based on 116,590,494 shares outstanding) | | | | | $9.48 | |
See notes to financial statements.
| | |
| 10 | | CBRE CLARION GLOBAL REAL ESTATE INCOME FUND |
Statement of Operations
| | | | | | |
| | | | | For the Year Ended
December 31, 2012 | |
Investment Income | | | | | | |
Dividends (net of foreign withholding taxes of $2,650,336) | | | | | $48,916,116 | |
Interest | | | | | 1,040 | |
Total Investment Income | | | | | 48,917,156 | |
| | |
Expenses | | | | | | |
Management fees | | | | | 9,026,544 | |
Printing and mailing fees | | | | | 705,492 | |
Administration fees | | | | | 233,676 | |
Insurance fees | | | | | 175,745 | |
Trustees’ fees and expenses | | | | | 154,112 | |
Custodian fees | | | | | 151,814 | |
Legal fees | | | | | 137,525 | |
Interest expense on line of credit | | | | | 130,919 | |
NYSE listing fee | | | | | 108,430 | |
Audit and tax fees | | | | | 75,080 | |
Transfer agent fees | | | | | 39,435 | |
Miscellaneous expenses | | | | | 34,963 | |
Total Expenses | | | | | 10,973,735 | |
Management fee waived | | | | | (615,238 | ) |
Net Expenses | | | | | 10,358,497 | |
| | |
Net Investment Income | | | | | 38,558,659 | |
| | |
Net Realized and Unrealized Gain (Loss) on Investments, Written Options and Foreign Currency Transactions | | | | | | |
Net realized gain on: | | | | | | |
Investments | | | | | 48,020,214 | |
Written options | | | | | 1,029,247 | |
Foreign currency transactions | | | | | 61,508 | |
Total Net Realized Gain | | | | | 49,110,969 | |
Net change in unrealized appreciation (depreciation) on: | | | | | | |
Investments | | | | | 135,760,376 | |
Written options | | | | | (116,893 | ) |
Foreign currency denominated assets and liabilities | | | | | (36,969 | ) |
Total Net Change in Unrealized Appreciation (Depreciation) | | | | | 135,606,514 | |
| | |
Net Gain on Investments, Written Options and Foreign Currency Transactions | | | | | 184,717,483 | |
| | |
Net Increase in Net Assets | | | | | $223,276,142 | |
See notes to financial statements.
Statements of Changes in Net Assets
| | | | | | | | | | | | |
| | | | | For the Year Ended
December 31, 2012 | | | | | For the Year Ended
December 31, 2011 | |
Change in Net Assets Resulting from Operations | | | | | | | | | | | | |
| | | | |
Net investment income | | | | | $38,558,659 | | | | | | $39,879,687 | |
| | | | |
Net realized gain (loss) on investments, written options and foreign currency transactions | | | | | 49,110,969 | | | | | | (5,923,615 | ) |
| | | | |
Net change in unrealized appreciation (depreciation) on investments, written options and foreign currency denominated assets and liabilities | | | | | 135,606,514 | | | | | | (21,658,681 | ) |
| | | | |
Net increase in net assets resulting from operations | | | | | 223,276,142 | | | | | | 12,297,391 | |
| | | | |
Dividends and Distributions on Common Shares | | | | | | | | | | | | |
| | | | |
Distribution of net investment income | | | | | (67,855,667 | ) | | | | | (38,608,248 | ) |
| | | | |
Distribution of return of capital | | | | | — | | | | | | (24,350,619 | ) |
| | | | |
Total dividends and distributions on Common Shares | | | | | (67,855,667 | ) | | | | | (62,958,867 | ) |
| | | | |
Net Increase (Decrease) in Net Assets | | | | | 155,420,475 | | | | | | (50,661,476 | ) |
| | | | |
Net Assets | | | | | | | | | | | | |
| | | | |
Beginning of year | | | | | 949,576,177 | | | | | | 1,000,237,653 | |
| | | | |
End of year (net of distributions in excess of net investment income of $80,867,885 and $47,658,353, respectively) | | | | | $1,104,996,652 | | | | | | $949,576,177 | |
See notes to financial statements.
| | |
| 12 | | CBRE CLARION GLOBAL REAL ESTATE INCOME FUND |
Statement of Cash Flows
| | | | | | |
| | | | | For the Year Ended
December 31, 2012 | |
| | |
Cash Flows from Operating Activities: | | | | | | |
| | |
Net increase in net assets resulting from operations | | | | | $223,276,142 | |
| | |
Adjustments to Reconcile Net Increase in Net Assets Resulting from Operations to Net Cash Provided by Operating Activities: | | | | | | |
| | |
Net change in unrealized appreciation/depreciation on investments | | | | | (135,760,376 | ) |
| | |
Net change in unrealized appreciation/depreciation on written options | | | | | 116,893 | |
| | |
Net realized gain on investments | | | | | (48,020,214 | ) |
| | |
Cost of securities purchased | | | | | (152,498,079 | ) |
| | |
Cost of options exercised | | | | | 203,934 | |
| | |
Proceeds from sale of securities | | | | | 200,963,608 | |
| | |
Premiums on written options | | | | | 110,607 | |
| | |
Decrease in receivable for investment securities sold | | | | | 3,875 | |
| | |
Decrease in dividends and interest receivable | | | | | 261,813 | |
| | |
Increase in dividend withholding reclaims receivable | | | | | (34,226 | ) |
| | |
Increase in other assets | | | | | (7 | ) |
| | |
Increase in unrealized depreciation on spot contracts | | | | | 65 | |
| | |
Increase in management fee payable | | | | | 137,200 | |
| | |
Decrease in accrued expenses | | | | | (57,140 | ) |
| | |
Net Cash Provided by Operating Activities | | | | | 88,704,095 | |
| | |
Cash Flows From Financing Activities: | | | | | | |
| | |
Cash distributions paid on common shares | | | | | (67,855,667 | ) |
| | |
Proceeds from borrowing on line of credit | | | | | 95,033,700 | |
| | |
Payments on line of credit | | | | | (115,764,800 | ) |
| | |
Net Cash Used in Financing Activities | | | | | (88,586,767 | ) |
| | |
Net increase in cash | | | | | 117,328 | |
| | |
Cash and Cash Equivalents at Beginning of Year | | | | | 64,716 | |
| | |
Cash and Cash Equivalents at End of Year | | | | | $182,044 | |
| | |
Supplemental disclosure | | | | | | |
| | |
Interest paid on line of credit | | | | | $143,434 | |
See notes to financial statements.
Financial Highlights
| | | | | | | | | | | | | | | | | | | | | | | | | | | | | | |
Per share operating performance for a share outstanding throughout the year | | | | For the
Year Ended
December 31,
2012 | | | | | For the
Year Ended
December 31,
2011 | | | | | For the
Year Ended
December 31,
2010 | | | | | For the
Year Ended
December 31,
2009 | | | | | For the
Year Ended
December 31,
2008 | |
| | | | | | | | | | |
Net asset value, beginning of year | | | | | $8.14 | | | | | | $8.58 | | | | | | $7.51 | | | | | | $5.63 | | | | | | $16.16 | |
| | | | | | | | | | |
Income from investment operations | | | | | | | | | | | | | | | | | | | | | | | | | | | | | | |
Net investment income (1) | | | | | 0.33 | | | | | | 0.34 | | | | | | 0.36 | | | | | | 0.39 | | | | | | 1.11 | |
Net realized and unrealized gain (loss) on investments, written options, swap contracts and foreign currency transactions | | | | | 1.59 | | | | | | (0.24 | ) | | | | | 1.25 | | | | | | 2.03 | | | | | | (10.15 | ) |
Dividends and distributions on Preferred Shares from net investment income (common stock equivalent basis) | | | | | — | | | | | | — | | | | | | — | | | | | | — | | | | | | (0.25 | ) |
Total from investment operations | | | | | 1.92 | | | | | | 0.10 | | | | | | 1.61 | | | | | | 2.42 | | | | | | (9.29 | ) |
Dividends and distributions on Common Shares | | | | | | | | | | | | | | | | | | | | | | | | | | | | | | |
Net investment income | | | | | (0.58 | ) | | | | | (0.33 | ) | | | | | (0.54 | ) | | | | | (0.54 | ) | | | | | — | |
Capital gains | | | | | — | | | | | | — | | | | | | — | | | | | | — | | | | | | (0.68 | ) |
Return of capital | | | | | — | | | | | | (0.21 | ) | | | | | — | | | | | | — | | | | | | (0.56 | ) |
Total dividends and distributions to Common Shareholders | | | | | (0.58 | ) | | | | | (0.54 | ) | | | | | (0.54 | ) | | | | | (0.54 | ) | | | | | (1.24 | ) |
Net asset value, end of year | | | | | $9.48 | | | | | | $8.14 | | | | | | $8.58 | | | | | | $7.51 | | | | | | $5.63 | |
Market value, end of year | | | | | $8.86 | | | | | | $6.84 | | | | | | $7.75 | | | | | | $6.37 | | | | | | $3.98 | |
Total investment return (2) | | | | | | | | | | | | | | | | | | | | | | | | | | | | | | |
Net asset value | | | | | 24.15 | % | | | | | 0.94 | % | | | | | 22.41 | % | | | | | 46.79 | % | | | | | (61.14 | )% |
Market value | | | | | 38.77 | % | | | | | (5.38 | )% | | | | | 31.06 | % | | | | | 79.09 | % | | | | | (67.38 | )% |
Ratios and supplemental data | | | | | | | | | | | | | | | | | | | | | | | | | | | | | | |
Net assets, applicable to Common Shares, end of year (thousands) | | | | | $1,104,997 | | | | | | $949,576 | | | | | | $1,000,238 | | | | | | $875,448 | | | | | | $586,525 | |
Ratios to average net assets applicable to Common Shares of:
Net expenses, after fee waiver + | | | | | 0.99 | % | | | | | 1.03 | % | | | | | 0.94 | % | | | | | 1.14 | % | | | | | 1.28 | % |
Net expenses, before fee waiver + | | | | | 1.05 | % | | | | | 1.14 | % | | | | | 1.11 | % | | | | | 1.38 | % | | | | | 1.67 | % |
Net expenses, after the fee waiver excluding interest on line of credit + | | | | | 0.98 | % | | | | | 0.97 | % | | | | | 0.90 | % | | | | | 1.12 | % | | | | | 1.28 | % |
Net expenses, before fee waiver excluding interest on line of credit + | | | | | 1.04 | % | | | | | 1.09 | % | | | | | 1.07 | % | | | | | 1.35 | % | | | | | 1.67 | % |
Net investment income, after preferred share dividends | | | | | 3.68 | % | | | | | 3.98 | % | | | | | 4.60 | % | | | | | 6.75 | % | | | | | 7.10 | % |
Preferred share dividends | | | | | N/A | | | | | | N/A | | | | | | N/A | | | | | | 0.04 | % | | | | | 2.08 | % |
Net investment income, before preferred share dividends + | | | | | 3.68 | % | | | | | 3.98 | % | | | | | 4.60 | % | | | | | 6.79 | % | | | | | 9.18 | % |
Portfolio turnover rate | | | | | 14.42 | % | | | | | 1.53 | % | | | | | 12.91 | % | | | | | 28.04 | % | | | | | 7.32 | % |
Leverage analysis: | | | | | | | | | | | | | | | | | | | | | | | | | | | | | | |
Preferred shares, at redemption value, ($25,000 per share liquidation preference) (thousands) | | | | | N/A | | | | | | N/A | | | | | | N/A | | | | | | N/A | | | | | | $370,000 | |
Net asset coverage per share of preferred shares | | | | | N/A | | | | | | N/A | | | | | | N/A | | | | | | N/A | | | | | | $64,630 | |
| (1) | Based on average shares outstanding. |
| (2) | Total investment return does not reflect brokerage commissions. Dividends and distributions are assumed to be reinvested at the prices obtained under the Trust’s Dividend Reinvestment Plan. Net Asset Value (“NAV”) total return is calculated assuming reinvestment of distributions at NAV on the date of the distribution. |
| + | Does not reflect the effects of dividends to Preferred Shareholders. |
See notes to financial statements.
| | |
| 14 | | CBRE CLARION GLOBAL REAL ESTATE INCOME FUND |
Notes to Financial Statements
CBRE Clarion Global Real Estate Income Fund (the “Trust”) is a diversified, closed-end management investment company that was organized as a Delaware statutory trust on November 6, 2003 under the Investment Company Act of 1940, as amended. CBRE Clarion Securities LLC (the “Advisor”) is the Trust’s investment advisor. The Advisor is a majority-owned subsidiary of CBRE Group, Inc. and is partially owned by its senior management team. The Trust commenced operations on February 18, 2004.
| 2. | Significant Accounting Policies |
The following accounting policies are in accordance with U.S. general accepted accounting principles (“GAAP”) and are consistently followed by the Trust.
Securities Valuation – The net asset value of the common shares of the Trust will be computed based upon the value of the Trust’s portfolio securities and other assets. The Trust calculates net asset value per common share by subtracting the Trust’s liabilities (including accrued expenses, dividends payable and any borrowings of the Trust) and the liquidation value of any outstanding preferred shares from the Trust’s total assets (the value of the securities the Trust holds, plus cash and/or other assets, including interest accrued but not yet received) and dividing the result by the total number of common shares of the Trust outstanding. Net asset value per common share will be determined as of the close of the regular trading session (usually 4:00 p.m., EST) on the New York Stock Exchange (“NYSE”) on each business day on which the NYSE is open for trading.
For purposes of determining the net asset value of the Trust, readily marketable portfolio assets traded principally on an exchange, or on a similar regulated market reporting contemporaneous transaction prices, are valued, except as indicated below, at the last sale price for such assets on such principal markets on the business day on which such value is being determined. If there has been no sale on such day, the securities are valued at the mean of the closing bid and asked prices on such day. Foreign securities are valued based upon quotations from the primary market in which they are traded and are translated from the local currency into U.S. dollars using current exchange rates. Securities and other assets for which market quotations are not readily available or for which the above valuation procedures are deemed not to reflect fair value are valued in a manner that is intended to reflect their fair value as determined in accordance with procedures approved by the Trust’s Board of Trustees (the “Board”).
Short-term securities which mature in more than 60 days are valued at current market quotations. Short-term securities, which mature in 60 days or less are valued at amortized cost, which approximates market value.
GAAP provides guidance on fair value measurements. In accordance with the standard, fair value is defined as the price that the Trust would receive to sell an investment or pay to transfer a liability in a timely transaction with an independent buyer in the principal market, or in the absence of a principal market the most advantageous market for the investment or liability. It establishes a single definition of fair value, creates a three-tier hierarchy as a framework for measuring fair value based on inputs used to value the Trust’s investments, and requires additional disclosure about fair value. The hierarchy of inputs is summarized below:
| • | | Level 1 — unadjusted quoted prices in active markets for identical investments |
| • | | Level 2 — other significant observable inputs (including quoted prices for similar investments, interest rates, prepayment speeds, credit risk, etc.) |
| • | | Level 3 — significant unobservable inputs (including the Trust’s own assumptions in determining the fair value of investments) |
For Level 1 inputs, the Trust uses unadjusted quoted prices in active markets for assets or liabilities with sufficient frequency and volume to provide pricing information as the most reliable evidence of fair value.
The Trust’s Level 2 valuation techniques include inputs other than quoted prices within Level 1 that are observable for an asset or liability, either directly or indirectly. Level 2 observable inputs may include quoted prices for similar assets and liabilities in active markets or quoted prices for identical or similar assets or liabilities in markets that are not active in which there are few transactions, the prices are not current, or price quotations vary substantially over time or among market participants. Inputs that are observable for the asset or liability in Level 2 include such factors as interest rates, yield curves, volatility prepayment speeds, credit risk, and default rates for similar liabilities.
For Level 3 valuation techniques, the Trust uses unobservable inputs that reflect assumptions market participants would be expected to use in pricing the asset or liability. Unobservable inputs are used to measure fair value to the extent that observable inputs are not available and are developed based on the best information available under the circumstances. In developing unobservable inputs, market participant assumptions are used if they are reasonably available without undue cost and effort.
Notes to Financial Statements continued
The inputs or methodology used for valuing securities are not necessarily an indication of the risk associated with investing in those securities. The following is a summary of the inputs used as of December 31, 2012 in valuing the Trust’s investments carried at fair value:
| | | | | | | | | | | | | | | | |
| | | Level 1 | | | Level 2 | | | Level 3 | | | Total | |
Investments in Real Estate Securities | | | | | | | | | | | | | | | | |
Common Stocks | | | | | | | | | | | | | | | | |
| | | | |
Australia | | $ | 162,925,600 | | | $ | — | | | $ | — | | | $ | 162,925,600 | |
| | | | |
Canada | | | 125,312,223 | | | | — | | | | — | | | | 125,312,223 | |
| | | | |
France | | | 56,358,616 | | | | — | | | | — | | | | 56,358,616 | |
| | | | |
Germany | | | 7,052,323 | | | | — | | | | — | | | | 7,052,323 | |
| | | | |
Hong Kong | | | 44,502,616 | | | | — | | | | — | | | | 44,502,616 | |
| | | | |
Japan | | | 34,253,249 | | | | — | | | | — | | | | 34,253,249 | |
| | | | |
Netherlands | | | 31,528,055 | | | | — | | | | — | | | | 31,528,055 | |
| | | | |
New Zealand | | | 7,540,914 | | | | — | | | | — | | | | 7,540,914 | |
| | | | |
Singapore | | | 64,183,719 | | | | — | | | | — | | | | 64,183,719 | |
| | | | |
United Kingdom | | | 41,858,999 | | | | — | | | | — | | | | 41,858,999 | |
| | | | |
United States | | | 394,265,064 | | | | — | | | | 19,791,655 | | | | 414,056,719 | |
| | | | |
Total Common Stocks | | | 969,781,378 | | | | — | | | | 19,791,655 | | | | 989,573,033 | |
Preferred Stocks | | | | | | | | | | | | | | | | |
| | | | |
United States | | | 128,999,549 | | | | 1,560,345 | | | | — | | | | 130,559,894 | |
| | | | |
Total Investments in Real Estate Securities | | | 1,098,780,927 | | | | 1,560,345 | | | | 19,791,655 | | | | 1,120,132,927 | |
| | | | |
Call Options Written | | | | | | | | | | | | | | | | |
| | | | |
United States | | | (227,500 | ) | | | — | | | | — | | | | (227,500 | ) |
The primary third party pricing vendor for the Trust’s listed preferred stock investments is FT Interactive Data (“IDC”). When available, the Trust will obtain a closing exchange price to value the preferred stock investments and, in such instances, the investment will be classified as Level 1 since an unadjusted quoted price was utilized. When a closing price is not available for the listed preferred stock investments, IDC will produce an evaluated mean price (midpoint between the bid and the ask evaluation) and such investments will be classified as Level 2 since other observable inputs were used in the valuation. Factors used in the IDC evaluation include trading activity, the presence of a two-sided market, and other relevant market data.
The Trust’s policy is to recognize transfers in and transfers out at the fair value as of the beginning of the period. The portfolio may hold securities which are periodically fair valued in accordance with the Trust’s fair value procedures. This may result in movements between Levels 1, 2 and 3 throughout the period. The fair value of Level 2 and Level 1 investments at December 31, 2011 was $5,065,001 and $969,274,999,
respectively. $6,482,079 was transferred out of Level 1 into Level 2 during the period ended December 31, 2012 as a result of exchange closing prices not being available. With regard to the transfers from Level 1 into Level 2, an evaluated mean price was still obtained from the Trust’s third party pricing vendor. Pursuant to the Trust’s fair value procedures noted previously, equity securities (including exchange traded securities and open-end regulated investment companies) exchange traded derivatives (i.e. futures contracts and options) are generally categorized as Level 1 securities in the fair value hierarchy. Fixed income securities, non-exchange traded derivatives and money market instruments are generally categorized as Level 2 securities in the fair value hierarchy. Investments for which there are no such quotations, or for which quotations do not appear reliable, are valued at fair value as determined in accordance with procedures established by and under the general supervision of the Trustees. These valuations are typically categorized as Level 2 or Level 3 securities in the fair value hierarchy.
The Trust has two investments in private equity securities which are classified as Level 3 because no market quotations are readily available. In determining the fair value of these investments, the following factors may be evaluated: balance sheet, income statement, the portfolio of real estate investments held, economic factors and conditions in which the company operates, and comparable public company valuations and trading prices.
The first Level 3 investment is Verde Realty, which is fair valued with a market value of $9,791,650 or $13.75 per share at December 31, 2012. On July 26, 2012, Verde Realty and Brookfield Asset Management issued a joint press release stating that there was a proposed merger between Verde Realty and a fund sponsored by Brookfield Asset Management Inc.’s Brookfield Property Group. The announced merger closed on December 21, 2012. The acquisition price announced was $13.85 per share subject to a portion of the price being contingent. The cash at closing is $13.48 per share with the remaining $0.37 per share held in escrow for a period of 90-days post-closing (March 21, 2013). At the completion of the 90-day period, the remaining cash held in the escrow fund will be distributed to shareholders. Based on the Advisor’s good faith judgment and understanding of the due diligence process, an estimate of $0.10 per share of the reserve will be retained by Brookfield resulting in a net price to shareholders of $13.75 per share. The Advisor expects the cash proceeds at closing of $13.48 per share to be received in February 2013 at which time the investment will be removed from the Portfolio of Investments.
| | |
| 16 | | CBRE CLARION GLOBAL REAL ESTATE INCOME FUND |
Notes to Financial Statements continued
The second Level 3 investment is American Homes 4 Rent (“AH4R”). On November 14, 2012, the Trust acquired 666,667 shares in American Homes 4 Rent (“AH4R”) under a private placement 144A for $15.00 per share, or $10,000,005. For the December 31, 2012 NAV of the Trust, the investment in AH4R was fair valued at $15.00 consistent with the purchase price. From the purchase date until 12/31/2012, there was no additional issuance of shares from the AH4R nor any market trade. Additionally, the investment was only acquired in November and the Advisor is not aware of any market metrics or data which suggest the price should be moved from cost. Therefore, the purchase price approximates fair value at 12/31/2012. A brokerage firm named FBR, who acted as placement agent, has a portal established for parties to trade and exchange this stock. This will not be open market activity but it will be an exchange of the stock between two independent parties at arm’s length. Any trades will be captured on this portal, which can be accessed via Bloomberg. Once the Advisor observes trading activity, the security will be priced via the data observed on this portal.
The following is a reconciliation of assets in which significant unobservable inputs (Level 3) were used in determining fair value:
| | | | |
| | | United States
Common Stocks | |
Balance as of December 31, 2011 | | $ | 10,681,800 | |
| |
Realized gain (loss) | | | — | |
| |
Change in unrealized appreciation (depreciation) | | | (890,150 | ) |
| |
Purchases | | | 10,000,005 | |
| |
Sales | | | — | |
| |
Transfers in and/or out of Level 3 | | | — | |
Balance as of December 31, 2012 | | $ | 19,791,655 | |
For the year ended December 31, 2012, there have been no significant changes to the Trust’s fair valuation methodology.
Derivatives and Hedging Disclosure — Codification Topic 815 (“ASC 815”), Derivatives and Hedging, requires qualitative disclosures about objectives and strategies for using derivatives, quantitative disclosures about fair value amounts of gains and losses on derivative instruments, and disclosures about credit-risk-related contingent features in derivative agreements. The Trust has invested in derivatives, specifically written options for the year ended December 31, 2012 which are detailed in the table herein. The Trust’s derivative agreements contain credit-risk related contingent features which include, but are not limited to, a percentage decline in the Trust’s NAV or net assets over a specified time period. If an event occurred that triggered
a contingent feature, the counterparty to the agreement may require the Trust to post additional collateral or terminate the derivative positions and demand payment. Any collateral posted with respect to the derivative positions would be used to offset or reduce the payment. The maximum exposure to derivatives agreements with credit-risk related contingent features would be the total value of derivatives in net liability positions for the Trust.
The Trust has invested in derivatives, specifically written options for the year ended December 31, 2012, which are detailed in the table herein. The derivative instruments disclosed and described herein are subject to credit risk. Credit risk is where the financial condition of an issuer of a security or instrument may cause it to default or become unable to pay interest or principal due on the security. The counterparty to a derivative contract might default on its obligations. The effect of such derivative instruments on the Trust’s financial position and financial performance as reflected in the Statement of Assets and Liabilities and Statement of Operations are presented in the summary below.
| | | | | | | | |
Derivatives not designated as hedging instruments, carried at fair value | | | | Liability Derivatives | |
| | | | Balance Sheet Location | | Fair Value | |
| | | |
Equity contracts | | | | Written options | | $ | 227,500 | |
Gain or (loss) associated with derivatives outstanding throughout the year ended December 31, 2012 is as follows:
| | | | |
| Amount of Realized Gain on Derivatives Recognized in Income | |
| Derivatives not designated as hedging instruments, carried at fair value | | Written Options | |
| |
Equity contracts | | $ | 1,029,247 | |
|
| Change in Unrealized Appreciation on Derivatives Recognized in Income | |
Derivatives not designated as hedging instruments, carried at fair value | | Written Options | |
| |
Equity contracts | | $ | (116,893 | ) |
For the fiscal year ended December 31, 2012, the Trust’s average premiums received for written options was $341,789.
Foreign Currency Translation – The books and records of the Trust are maintained in U.S. dollars. Foreign currency amounts are translated into U.S. dollars on the following basis:
| (i) | market value of investment securities, other assets and liabilities – at the current rates of exchange; |
| (ii) | purchases and sales of investment securities, income and expenses – at the rate of exchange prevailing on the respective dates of such transactions. |
Although the net assets of the Trust are presented at the foreign exchange rates and market values at the close of each fiscal
Notes to Financial Statements continued
period, the Trust does not isolate that portion of the results of operations arising as a result of changes in the foreign exchange rates from the fluctuations arising from changes in the market prices of long-term securities held at the end of the fiscal period. Similarly, the Trust does not isolate the effect of changes in foreign exchange rates from the fluctuations arising from changes in the market prices of portfolio securities sold during the fiscal period. Accordingly, realized foreign currency gains or losses will be included in the reported net realized gains or losses on investment transactions.
Net realized gains or losses on foreign currency transactions represent net foreign exchange gains or losses from the holding of foreign currencies, currency gains or losses realized between the trade date and settlement date on securities transactions, and the difference between the amounts of dividends, interest and foreign withholding taxes recorded on the Trust’s books and the U.S. dollar equivalent amounts actually received or paid. Net unrealized currency gains or losses from valuing foreign currency denominated assets or liabilities (other than investments) at period end exchange rates are reflected as a component of net unrealized appreciation or depreciation on investments and foreign currencies.
Foreign security and currency transactions may involve certain considerations and risks not typically associated with those of domestic origin as a result of, among other factors, the possibility of political or economic instability, or the level of governmental supervision and regulation of foreign securities markets.
Forward Exchange Currency Contracts – The Trust may enter into forward exchange currency contracts in order to hedge its exposure to changes in foreign currency exchange rates on its foreign portfolio holdings, to hedge certain Trust purchase and sales commitments denominated in foreign currencies and for investment purposes. A forward exchange currency contract is a commitment to purchase or sell a foreign currency on a future date at a negotiated forward rate. The gain or loss arising from the difference between the original contracts and the closing of such contracts would be included in net realized gain or loss on foreign currency transactions.
Fluctuations in the value of open forward exchange currency contracts are recorded for financial reporting purposes as unrealized appreciation and depreciation by the Trust.
The Trust’s custodian will place and maintain cash not available for investment or other liquid assets in a separate account of the Trust having a value at least equal to the aggregate amount of the Trust’s commitments under forward exchange currency contracts entered into with respect to position hedges.
Risks may arise from the potential inability of a counterparty to meet the terms of a contract and from unanticipated movements in the value of a foreign currency relative to the U.S. dollar. The face or contract amount, in U.S. dollars, reflects the total exposure the Trust has in that particular currency contract. As of December 31, 2012, the Trust did not hold any forward exchange currency contracts.
Options - The Fund may purchase or sell (write) options on securities and securities indices which are listed on a national securities exchange or in the over-the-counter (“OTC”) market as a means of achieving additional return or of hedging the value of the Trust’s portfolio.
An option on a security is a contract that gives the holder of the option, in return for a premium, the right to buy from (in the case of a call) or sell to (in the case of a put) the writer of the option the security underlying the option at a specified exercise or “strike” price. The writer of an option on a security has an obligation upon exercise of the option to deliver the underlying security upon payment of the exercise price (in the case of a call) or to pay the exercise price upon delivery of the underlying security (in the case of a put).
There are several risks associated with transactions in options on securities. As the writer of a covered call option, the Trust forgoes, during the option’s life, the opportunity to profit from increases in the market value of the security covering the call option above the sum of the premium and the strike price of the call but has retained the risk of loss should the price of the underlying security decline. The writer of an option has no control over the time when it may be required to fill its obligation as writer of the option. Once an option writer has received an exercise notice, it cannot effect a closing purchase transaction in order to terminate its obligation under the option and must deliver the underlying security at the exercise price.
Transactions in written options during the fiscal year ended December 31, 2012 were as follows:
| | | | | | | | |
| | | Number of Contracts | | | Premiums Received | |
Options outstanding, beginning of period | | | — | | | $ | — | |
Options closed during the period | | | (12,499 | ) | | | (771,997 | ) |
Options exercised during the period | | | (4,672 | ) | | | (203,934 | ) |
Options expired during the period | | | (32,457 | ) | | | (1,565,322 | ) |
Options written during the period | | | 51,628 | | | | 2,651,860 | |
Options outstanding, end of period | | | 2,000 | | | $ | 110,607 | |
Securities Transactions and Investment Income – Securities transactions are recorded on a trade date basis. Realized gains and losses from securities transactions are recorded on the basis of identified cost. Dividend income is recorded on the
| | |
| 18 | | CBRE CLARION GLOBAL REAL ESTATE INCOME FUND |
Notes to Financial Statements continued
ex-dividend date. Distributions received from investments in REITs are recorded as dividend income on ex-dividend date, subject to reclassification upon notice of the character of such distributions by the issuer. The portion of dividend attributable to the return of capital is recorded against the cost basis of the security. Withholding taxes on foreign dividends are recorded net of reclaimable amounts, at the time the related income is earned. Non-cash dividends included in dividend income, if any, are recorded at the fair market value of the securities received. Interest income, including accretion of original issue discount, where applicable, and accretion of discount on short-term investments, is recorded on the accrual basis. Realized gains and losses from securities transactions are recorded on the basis of identified cost.
Dividends and Distributions to Shareholders – Dividends from net investment income, if any, are declared and paid on a monthly basis. Income dividends and capital gain distributions to common shareholders are recorded on the ex-dividend date. To the extent the Trust’s net realized capital gains, if any, can be offset by capital loss carryforwards, it is the policy of the Trust not to distribute such gains.
On August 5, 2008, the Trust acting in accordance with an exemptive order received from the Securities and Exchange Commission and with approval of the Board, adopted a managed distribution policy under which the Trust intends to make regular monthly cash distributions to common shareholders, stated in terms of a fixed amount per common share. With this policy the Trust can include long-term capital gains in its distribution as frequently as twelve times a year. In practice, the Board views their approval of this policy as a potential means of further supporting the market price of the Trust through the payment of a steady and predictable level of cash distributions to shareholders.
The current monthly distribution rate is $0.045 per share. The Trust continues to evaluate its monthly distribution policy in light of ongoing economic and market conditions and may change the amount of the monthly distributions in the future.
Use of Estimates – The preparation of financial statements, in conformity with GAAP, requires management to make estimates and assumptions that affect the reported amounts of assets and liabilities at the date of the financial statements and the reported amounts of expenses during the reporting period. Actual results could differ from those estimates.
Under normal market conditions, the Trust’s investments will be concentrated in income-producing common equity securities, preferred securities, convertible securities and non-convertible
debt securities issued by companies deriving the majority of their revenue from the ownership, construction, financing, management and/or sale of commercial, industrial, and/or residential real estate. Values of the securities of such companies may fluctuate due to economic, legal, cultural, geopolitical or technological developments affecting various global real estate industries.
| 4. | Investment Management Agreement and Other Agreements |
Pursuant to an investment management agreement between the Advisor and the Trust, the Advisor is responsible for the daily management of the Trust’s portfolio of investments, which includes buying and selling securities for the Trust, as well as investment research. The Trust pays for investment advisory services and facilities through a fee payable monthly in arrears at an annual rate equal to 0.85% of the average daily value of the Trust’s managed assets plus certain direct and allocated expenses of the Advisor incurred on the Trust’s behalf. The Advisor has agreed to waive a portion of its management fee in the amount of 0.25% of the average daily values of the Trust’s managed assets for the first five years of the Trust’s operations (through February, 2009), and for a declining amount for an additional four years (through February, 2013). During the year ended December 31, 2012, the Trust incurred management fees of $8,411,306 which are net of $615,238 in management fees waived by the Advisor.
The Trust has multiple service agreements with The Bank of New York Mellon (“BNYM”). Under the servicing agreements, BNYM will perform custodial, fund accounting, certain administrative services, and transfer agency services for the Trust. As custodian, BNYM is responsible for the custody of the Trust’s assets. As administrator, BNYM is responsible for maintaining the books and records of the Trust’s securities and cash. As transfer agent, BNYM is responsible for performing transfer agency services for the Trust.
For the year ended December 31, 2012, there were purchases and sales transactions (excluding short-term securities and options) of $152,498,079 and $200,963,608, respectively.
The Trust intends to elect to be, and qualify for treatment as, a regulated investment company under Subchapter M of the Internal Revenue Code of 1986, as amended (the “Code”). A regulated investment company generally pays no federal income tax on the income and gains that it distributes. The Trust intends to meet the calendar year distribution requirements imposed by the Code to avoid the imposition of a 4% excise tax.
Notes to Financial Statements continued
The Trust is required to evaluate tax positions taken or expected to be taken in the course of preparing the Trust’s tax returns to determine whether the tax positions are “more-likely-than-not” of being sustained by the applicable tax authority. Income tax and related interest and penalties would be recognized by the Trust as tax expense in the Statement of Operations if the tax positions were deemed to not meet the more-likely-than-not threshold. For the year ended December 31, 2012, the Trust did not incur any income tax, interest, or penalties. As of December 31, 2012, the Advisor has reviewed all open tax years and concluded that there was no impact to the Trust’s net assets or results of operations. Tax years ended December 31, 2009, through December 31, 2012, remain subject to examination by the Internal Revenue Service and state taxing authorities. On an ongoing basis, the Advisor will monitor its tax positions to determine if adjustments to this conclusion are necessary.
The Trust distinguishes between dividends on a tax basis and on a financial reporting basis and only distributions in excess of tax basis earnings and profits are reported in the financial statements as a tax return of capital. Differences in the recognition or classification of income between the financial statements and tax earnings and profits which result in temporary over-distributions for financial statement purposes are classified as distributions in excess of net investment income or accumulated net realized losses in the components of net assets on the Statement of Assets and Liabilities.
In order to present paid-in capital in excess of par and accumulated net realized gains or losses on the Statement of Assets and Liabilities that more closely represent their tax character, certain adjustments have been made to additional paid-in capital, undistributed net investment income and accumulated net realized gains or losses on investments. For the year ended December 31, 2012, the adjustments were to increase additional paid-in capital by $85,481 decrease accumulated net realized loss on investments by $3,827,043 and increase distributions in excess of net investment loss by $3,912,524 due to the difference in the treatment for book and tax purposes of certain investments. Results of operations and net assets were not affected by these reclassifications.
At December 31, 2012, the Trust had capital loss carryforwards which will reduce the Trust’s taxable income arising from future net realized gain on investments, if any, to the extent permitted by the code and thus will reduce the amount of distributions to shareholders which would otherwise be necessary to relieve the Trust of any liability for federal income tax. Pursuant to the code, such capital loss carryforwards, if unused, will expire, $15,851,894, $333,092,227 and $26,711,743 in 2016, 2017 and 2018,
respectively. The Trust utilized $52,199,130 capital loss carryforward during the current year.
The Regulated Investment Company Modernization Act of 2010 (the “Act”) eliminated the eight-year carryover period for capital losses that arise in taxable years beginning after its enactment date of December 22, 2010. Consequently, these capital losses can be carried forward for an unlimited period. However, capital losses with an expiration period may not be used to offset capital gains until all net capital losses without an expiration date have been utilized. Additionally, post-enactment capital loss carryovers will retain their character as either short-term or long-term capital losses instead of as short-term capital losses as under prior law. The Trust does not have capital losses with no expiration.
Certain capital and qualified late year losses incurred after October 31 and within the current taxable year, are deemed to arise on the first business day of the Trust’s following taxable year. The Trust did not incur any qualified late year or capital losses during 2012.
For the year ended December 31, 2012, the tax character of distributions paid, as reflected in the Statements of Changes in Net Assets, was $67,855,667 of ordinary income. For the year ended December 31, 2011, the tax character of distributions paid, as reflected in the Statements of Changes in Net Assets, was $38,608,248 of ordinary income and $24,350,619 of return of capital, respectively.
Information on the tax components of net assets as of December 31, 2012 is as follows:
| | | | | | | | | | | | | | | | |
Cost of
Investments
for Tax
Purposes | | Gross Tax
Unrealized
Appreciation | | Gross Tax
Unrealized
Depreciation | | Net Tax
Unrealized
Appreciation
on
Investments | | Net Tax
Unrealized
Depreciation
on Foreign
Currency | | Net Tax
Unrealized
Depreciation
on Options | | Undistributed
Ordinary
Income | | Other
Temporary
Differences | | Accumulated
Capital Loss |
| $1,008,446,207 | | $208,012,689 | | $(96,325,969) | | $111,686,720 | | $(14,545) | | $(116,893) | | $5,985,884 | | $(141,418) | | $(375,655,864) |
The Trust has access to a secured line of credit up to $300,000,000 from BNYM for borrowing purposes. Borrowings under this arrangement bear interest at the Federal funds rate plus 75 basis points. At December 31, 2012, there were borrowings in the amount of $21,438,800 on the Trust’s line of credit.
The average daily amount of borrowings during the year ended December 31, 2012 was $23,629,222 with a related weighted average interest rate of 0.89%. The maximum amount outstanding for the year ended December 31, 2012, was $42,169,900. The Trust had borrowings under the line of credit for 228 days during 2012.
| | |
| 20 | | CBRE CLARION GLOBAL REAL ESTATE INCOME FUND |
Notes to Financial Statements concluded
During 2004, the Trust issued 101,000,000 shares of common stock at $15.00. In connection with the Trust’s Dividend Reinvestment Plan, the Trust issued no common shares for the year ended December 31, 2012 and 2011, respectively. At December 31, 2012, the Trust had outstanding common shares of 116,590,494 with a par value of $0.001 per share. The Advisor owned 12,741 shares of the common shares outstanding.
At December 31, 2012, the Trust had no shares of auction rate preferred securities outstanding.
The Trust enters into contracts that contain a variety of indemnifications. The Trust’s exposure under these arrangements is unknown. However, the Trust has not had prior claims or losses or current claims or losses pursuant to these contracts.
| 10. | New Accounting Pronouncements |
In December 2011, the FASB issued ASU No. 2011-11 regarding “Disclosures about Offsetting Assets and Liabilities”. The amendments, which will be effective for annual reporting periods beginning on or after January 1, 2013 and interim periods within those annual periods, require an entity to disclose information about offsetting and related arrangements for assets and liabilities, financial instruments and derivatives that are either currently offset in accordance with current requirements or are subject to enforceable master netting arrangements or similar agreements. At this time, management is evaluating the implications of ASU No. 2011-11 and its impact on the financial statements has not yet been determined.
Events or transactions that occur after the balance sheet date but before the financial statements are issued are categorized as recognized or non-recognized for financial statement purposes. The Advisor has evaluated subsequent events and has determined there were no events that required recognition or disclosure in the Trust’s financial statements, other than as noted below.
On February 1, 2013, cash of $13.48 per share or $9,600,512 was received as closing proceeds for the investment in Verde Realty. Additionally, in the February 1st NAV of the Trust, a receivable of $191,139 was recorded for the sales proceeds held in escrow (Reference Note 2).
As referenced in Note 2 regarding the investment in AH4R, a brokerage firm named FBR, who acted as placement agent, has a portal established for parties to trade and exchange this
stock. On January 18, 2013, there were 50,000 shares traded in the portal at a price of $15.50 between holders of the AH4R. On January 29, 2013, there were 300,000 shares traded at a price of $15.50 and on February 1, 2013 there were 50,000 shares traded at a price of $16.00. The Trust did not participate in this trading activity and the position in AH4R remains at 666,667 shares.
The Trust owns 25,700 shares of Eagle Hospitality Properties Trust, Inc., Series A preferred stock with a market value of $1,658 at December 31, 2012. The Investment Manager has instructed effective with the February 1, 2013 NAV of the Trust, to write down the value to zero. Eagle Hospitality’s secured lender has taken ownership of its properties and Eagle expects that no distributions will be made now or in the future. The limited assets of Eagle will be used to wind up its affairs.
Report of Independent Registered Public Accounting Firm
To the Shareholders and Board of Trustees of
CBRE Clarion Global Real Estate Income Fund
We have audited the accompanying statement of assets and liabilities of the CBRE Clarion Global Real Estate Income Fund (the “Trust”), including the portfolio of investments, as of December 31, 2012, and the related statements of operations and cash flows for the year then ended, the statements of changes in net assets for each of the two years in the period then ended, and the financial highlights for each of the five years in the period then ended. These financial statements and financial highlights are the responsibility of the Trust’s management. Our responsibility is to express an opinion on these financial statements and financial highlights based on our audits.
We conducted our audits in accordance with the standards of the Public Company Accounting Oversight Board (United States). Those standards require that we plan and perform the audit to obtain reasonable assurance about whether the financial statements and financial highlights are free of material misstatement. We were not engaged to perform an audit of the Trust’s internal control over financial reporting. Our audit included consideration of internal control over financial reporting as a basis for designing audit procedures that are appropriate in the circumstances, but not for the purpose of expressing an opinion on the effectiveness of the Trust’s internal control over financial reporting. Accordingly, we express no such opinion. An audit also includes examining, on a test basis, evidence supporting the amounts and disclosures in the financial statements and financial highlights, assessing the accounting principles used and significant estimates made by management, and evaluating the overall financial statement presentation. Our procedures included confirmation of securities owned as of December 31, 2012, by correspondence with the Trust’s custodian and brokers. We believe that our audit provide a reasonable basis for our opinion.
In our opinion, the financial statements and financial highlights referred to above present fairly, in all material respects, the financial position of CBRE Clarion Global Real Estate Income Fund at December 31, 2012, the results of its operations and its cash flows for the year then ended, the changes in its net assets for each of the two years in the period then ended and financial highlights for each of the five years in the period then ended, in conformity with U.S. generally accepted accounting principles.

Philadelphia, Pennsylvania
February 25, 2013
| | |
| 22 | | CBRE CLARION GLOBAL REAL ESTATE INCOME FUND |
Supplemental Information (unaudited)
Federal Income Tax Information
Qualified dividend income of as much as $12,357,603 was received by the Trust through December 31, 2012. The Trust intends to designate the maximum amount of dividends that qualify for the reduced tax rate pursuant to the Jobs and Growth Tax Relief Reconciliation Act of 2003.
The Fund intends to elect to pass through to shareholders the credit for taxes paid of $1,652,304 during the year ended December 31, 2012. The gross foreign income for the year ended December 31, 2012 is $26,230,240.
For corporate shareholders, 0.40% of ordinary income distributions for the year ended December 31, 2012 qualified for the corporate dividends-received deduction.
In January 2013, you will be advised on IRS Form 1099 DIV or substitute 1099 DIV as to the federal tax status of the distributions received by you in the calendar year 2012.
Corporate Governance
The Fund submitted its Annual CEO certification for 2012 to the New York Stock Exchange (“NYSE”) on November 6, 2012 stating that the CEO was not aware of any violation by the Fund of the NYSE’s corporate governance listing standards. In addition, the Fund had filed the required CEO/CFO certifications regarding the quality of the Fund’s public disclosure as exhibits to the Forms N-CSR and Forms N-Q filed by the Fund over the past fiscal year. The Fund’s Form N-CSR and Form N-Q filings are available on the Commission’s website at www.sec.gov.
Result of Shareholder Votes
The Annual Meeting of Shareholders of the Fund was held on October 9, 2012.
With regard to the election of the following Trustee of the Fund:
| | | | | | | | | | |
| | | | | Number of
Shares In Favor | | | | Number of
Shares Withheld | |
Asuka Nakahara | | | | 106,786,790.159 | | | | | 2,226,089.367 | |
The other Trustees of the Fund whose terms did not expire in 2012 are T. Ritson Ferguson, Frederick Hammer, Richard L. Sutton and John Bartholdson.
Supplemental Information (unaudited) continued
Trustees
The Trustees of the CBRE Clarion Global Real Estate Income Fund and their principal occupations during the past five years:
| | | | | | | | | | |
Name, Address and Age | | Term of Office and
Length of Time Served (1) | | Title | | Principal Occupations During The Past Five Years | | Number of
Portfolios in
the Fund
Complex
Overseen
by Trustee | | Other Directorships Held by Trustee |
| Interested Trustees: | | | | | | | | | | |
T. Ritson Ferguson* 201 King of Prussia
Road, Suite 600 Radnor, PA 19087 Age: 53 | | 3 years/
since inception | | Trustee, President and Chief Executive Officer | | Chief Executive Officer and Co-Chief Investment Officer of CBRE Clarion Securities LLC | | 1 | | |
Asuka Nakahara 201 King of Prussia
Road, Suite 600 Radnor, PA 19087 Age: 57 | | 3 years/ since inception | | Trustee | | Associate Director of the Zell-Lurie Real Estate Center at the Wharton School, University of Pennsylvania (since 1999); Lecturer of Real Estate at the Wharton School, University of Pennsylvania (since 1999); Partner of Triton Atlantic Partners (since 2009). | | 1 | | |
Frederick S. Hammer 201 King of Prussia
Road, Suite 600 Radnor, PA 19087 Age: 76 | | 3 years/ since inception | | Trustee | | Co-Chairman of Inter-Atlantic Group (since 1994) and a member of its investment committee. | | 1 | | Serves on the Boards of Universal Business Payment Solutions Corp. (since 2011); Inter-Atlantic Financial, Inc. (2007 - 2011); E-Duction, Inc. (2005 - 2008), Avalon Insurance Holdings, Inc. (2006 - 2009) and Homeowners Insurance Corp. (since 2006); Director of US Fiduciary Corp. (2006 - 2009); Chairman of the Board of Annuity and Life Re (Holdings), Ltd. (1998 -2005). |
Richard L. Sutton 201 King of Prussia
Road, Suite 600 Radnor, PA 19087 Age: 77 | | 3 years/ since inception | | Trustee | | Partner, Morris, Nichols, Arsht & Tunnel (1966 - 2000). | | 1 | | Board of Directors of Investors in Global Real Estate Ltd. (since 2006). |
John Bartholdson 201 King of Prussia
Road, Suite 600 Radnor, PA 19087 Age: 68 | | 3 years/
9 years | | Trustee/Audit Committee Financial Expert | | Senior Vice President, CFO and Treasurer, and a Director of Triumph Group, Inc. (1993 -2007). | | 1 | | Board of Old Mutual Advisor Funds, Old Mutual Funds II and Old Mutual Insurance Series Fund (2004 - 2012), and Old Mutual Funds III (2008 - 2009). |
| (1) | After a Trustee’s initial term, each Trustee is expected to serve a three-year term concurrent with the class of Trustees for which he serves. Messrs. Ferguson and Hammer, as Class I Trustees, are expected to stand for re-election at the Trust’s 2014 annual meeting of shareholders; Mr. Nakahara, as Class II Trustee, is expected to stand for re-election at the Trust’s 2015 annual meeting of shareholders; Messrs. Sutton and Bartholdson, as Class III Trustees, are expected to stand for re-election at the Trust’s 2013 annual meeting of shareholders. |
| * | Mr. Ferguson is deemed to be an interested person of the Trust as defined in the Investment Company Act of 1940 (the “1940 ACT”), as amended, due to his position with the Advisor. |
| | |
| 24 | | CBRE CLARION GLOBAL REAL ESTATE INCOME FUND |
Supplemental Information (unaudited) continued
Officers
The Officers of the CBRE Clarion Global Real Estate Income Fund and their principal occupations during the past five years:
| | | | |
Name, Address, Age
and Position(s) Held
with Registrant | | Length of Time
Served | | Principal Occupations During
the Past Five Years and
Other Affiliations |
| Officers: | | | | |
Jonathan A. Blome 201 King of Prussia Road, Suite 600 Radnor, PA 19087 Age: 35 Chief Financial Officer | | since 2006 | | Chief Financial Officer and Director of Operations of CBRE Clarion Securities LLC (since 2011); Director and Head of Operations of CBRE Clarion Securities LLC (since 2010); Senior Vice President of CBRE Clarion Securities LLC (2005 - 2010). |
William E. Zitelli 201 King of Prussia Road, Suite 600 Radnor, PA 19087 Age: 44 Chief Compliance Officer and Secretary | | since 2007 | | General Counsel of CBRE Clarion Securities LLC (since 2007), Chief Compliance Officer of CBRE Clarion Securities LLC (2007 - 2010). |
Supplemental Information (unaudited) continued
Board Considerations in Approving the Advisory Agreement
At a meeting of the Board held on December 5, 2012, the Board, including all of those Trustees of the Trust who are not “interested persons” of the Trust within the meaning of the Investment Company Act of 1940, approved the continuation of the investment management agreement (the “Advisory Agreement”) between the Advisor and the Trust through December 31, 2013. Overall, the Board concluded that continuation of the Advisory Agreement was in the best interests of the Trust and consistent with shareholder expectations. During the course of its deliberations, the Board received information relating to other closed-end equity funds, including those whose investment objectives and policies are similar to the Trust (the “peer group”), as well as information relating to other accounts managed by the Advisor whose investment objectives and policies are similar to the Trust. In determining to approve the continuation of the Advisory Agreement, the Board took into account a number of factors, without assigning relative weight to any factor or identifying any factor as determinative. Rather, the Board based its finding on the specific facts and circumstances of the Trust.
In approving the continuation of the Advisory Agreement, the Board reviewed the nature, extent and quality of advisory services and administrative services provided by the Advisor during the period following the acquisition of the Advisor by CBRE Group, Inc. (“CBRE”) on July 1, 2011, including the performance achieved by the Advisor for the Trust during volatile market conditions, the consistency of the Advisor’s investment decision process, the experience of the Advisor’s personnel, including additional research capability and other resources available to the Advisor, in part, as a the result of its affiliation with CBRE. The Board also considered the administrative resources devoted by the Advisor to oversight of the Trust’s operations, noting that administrative and related compliance oversight services are provided to the Trust under the terms of the Advisory Agreement and without (unlike some funds in the “peer group”) separate charge to the Trust. The Board also considered the Trust’s strategic focus on providing income to its shareholders and current economic trends and conditions, as well as the performance and expenses of comparable closed-end equity funds, including “peer group” funds. The Board concluded that the quality of the services provided to the Trust by the Advisor was satisfactory and supported the continued retention of the Advisor by the Trust.
During its deliberations, the Board also considered information provided to it by the Advisor with respect to CBRE, including management representations to the effect that the Advisor’s senior management continued to be focused on the continuation of the Advisor’s core business.
The Board also considered the level of compensation to which the Advisor is entitled under the Advisory Agreement. Among other things, the Board considered the upcoming expiration of the Advisor’s fee waiver, and the rate at which the Advisor’s fee is calculated. The Board reviewed information provided by the Advisor with respect to the profits realized by the Advisor as a result of its services to the Trust and as compared to the Advisor’s profitability as a result of its management of other advisory accounts, as well as information about the fees and expenses of comparable closed-end equity funds, including the Trust’s “peer group.” The Board concluded that the Advisor’s fees continue to be within the range of fees of other closed-end equity funds, including the “peer group,” and that the Trust’s expense ratio has remained at levels at or below the “peer group” funds. The Board concluded that fees paid to the Adviser by the Trust were not excessive and that the advisory fee rate is reasonable under the circumstances of the Trust, notwithstanding the fact that the fee waiver afforded to the Trust by the Adviser since the commencement of the Trust’s operations in February 2004, is set to expire in February 2013. Although reviewed by the Board, the potential for realization of economies of scale was not a factor in the Board’s conclusions, because the Trust is a closed-end vehicle with limited potential for asset growth.
| | |
| 26 | | CBRE CLARION GLOBAL REAL ESTATE INCOME FUND |
Supplemental Information (unaudited) concluded
Additional Information
Statement of Additional Information includes additional information regarding the Trustees. This information is available upon request, without charge, by calling the following toll-free telephone number: 1-888-711-4272.
The Trust has delegated the voting of the Trust’s voting securities to the Trust’s advisor pursuant to the proxy voting policies and procedures of the advisor. You may obtain a copy of these policies and procedures by calling 1-888-711-4272. The policies may also be found on the website of the Securities and Exchange Commission (http://www.sec.gov).
Information regarding how the Trust voted proxies for portfolio securities, if applicable, during the most recent 12-month period ended June 30, is also available, without charge and upon request by calling the Trust at 1-888-711-4272 or by accessing the Trust’s Form N-PX on the Commission’s website at http://www.sec.gov.
The Trust files its complete schedule of portfolio holdings with the Securities and Exchange Commission for the first and third quarters of each fiscal year on Form N-Q. The Trust’s Form N-Qs are available on the SEC website at http://www.sec.gov. The Trust’s Form N-Qs may also be viewed and copied at the Commission’s Public Reference Room in Washington, DC; information on the operation of the Public Reference Room may be obtained by calling (800) SEC-0330.
Dividend Reinvestment Plan (unaudited)
Pursuant to the Trust’s Dividend Reinvestment Plan (the “Plan”), shareholders of the Trust are automatically enrolled, to have all distributions of dividends and capital gains reinvested by The Bank of New York Mellon (the “Plan Agent”) in the Trust’s shares pursuant to the Plan. You may elect not to participate in the Plan and to receive all dividends in cash by sending written instructions or by contacting The Bank of New York Mellon, as dividend disbursing agent, at the address set forth below. Participation in the Plan is completely voluntary and may be terminated or resumed at any time without penalty by contacting the Plan Agent before the dividend record date; otherwise such termination or resumption will be effective with respect to any subsequently declared dividend or other distribution. Shareholders who do not participate in the Plan will receive all distributions in cash paid by check and mailed directly to the shareholders of record (or if the shares are held in street or other nominee name, then to the nominee) by the Plan Agent, which serves as agent for the shareholders in administering the Plan.
After the Trust declares a dividend or determines to make a capital gain distribution, the Plan Agent will acquire shares for the participants’ account, depending upon the circumstances described below, either (i) through receipt of unissued but authorized shares from the Trust (“newly issued shares”) or (ii) by open market purchases. If, on the dividend payment date, the NAV is equal to or less than the market price per share plus estimated brokerage commissions (such condition being referred to herein as “market premium”), the Plan Agent will invest the dividend amount in newly issued shares on behalf of the participants. The number of newly issued shares to be credited to each participant’s account will be determined by dividing the dollar amount of the dividend by the NAV on the date the shares are issued. However, if the NAV is less than 95% of the market price on the payment date, the dollar amount of the dividend will be divided by 95% of the market price on the payment date. If, on the dividend payment date, the NAV is greater than the market value per share plus estimated brokerage commissions (such condition being referred to herein as “market discount”), the Plan Agent will invest the dividend amount in shares acquired on behalf of the participants in open-market purchases.
The Plan Agent’s fees for the handling of the reinvestment of dividends and distributions will be paid by the Trust. However, each participant will pay a pro rata share of brokerage commissions incurred with respect to the Plan Agent’s open market purchases in connection with the reinvestment of dividends and distributions. The automatic reinvestment of dividends and distributions will not relieve participants of any Federal income tax that may be payable on such dividends or distributions.
The Trust reserves the right to amend or terminate the Plan. There is no direct service charge to participants in the Plan; however, the Trust reserves the right to amend the Plan to include a service charge payable by the participants. Participants that request a sale of shares through the Plan Agent are subject to a $2.50 sales fee and a $0.15 per share sold brokerage commission. All correspondence concerning the Plan should be directed to the Plan Agent at Computershare Shareowner Services LLC, P.O. Box 358035, Pittsburgh, PA 15252-8035, Phone Number: (866) 221-1580.
CBRE CLARION GLOBAL REAL ESTATE INCOME FUND
BOARD OF TRUSTEES
T. RITSON FERGUSON
ASUKA NAKAHARA
FREDERICK S. HAMMER
RICHARD L. SUTTON
JOHN BARTHOLDSON
OFFICERS
T. RITSON FERGUSON
PRESIDENT AND
CHIEF EXECUTIVE OFFICER
JONATHAN A. BLOME
CHIEF FINANCIAL OFFICER
WILLIAM E. ZITELLI
CHIEF COMPLIANCE OFFICER
AND SECRETARY
INVESTMENT ADVISOR
CBRE CLARION SECURITIES LLC
201 KING OF PRUSSIA ROAD, SUITE 600
RADNOR, PA 19087
888-711-4272
ADMINISTRATOR AND CUSTODIAN
THE BANK OF NEW YORK MELLON
NEW YORK, NEW YORK
TRANSFER AGENT
COMPUTERSHARE
JERSEY CITY, NEW JERSEY
LEGAL COUNSEL
BINGHAM MCCUTCHEN LLP
WASHINGTON, DC
INDEPENDENT REGISTERED PUBLIC ACCOUNTING FIRM
ERNST & YOUNG LLP
PHILADELPHIA, PENNSYLVANIA
(a) The Trust has adopted a Code of Ethics for Senior Financial Officers (the “Financial Officer Code of Ethics”) that applies to its principal executive officer, principal financial officer, principal accounting officer or controller, or persons performing similar functions.
(b) Not applicable.
(c) The Trust has not amended its Financial Officer Code of Ethics during the period covered by the shareholder report presented in Item 1 hereto.
(d) The Trust has not granted a waiver or an implicit waiver from a provision of its Financial Officer Code of Ethics.
(e) Not applicable.
(f) The Trust’s Financial Officer Code of Ethics is attached hereto as an exhibit.
| Item 3. | Audit Committee Financial Expert. |
All of the members of the audit committee have the business and financial experience necessary to understand the fundamental financial statements of a closed-end, registered investment company; further, each member of the committee is financially literate, as such qualification is interpreted by the Board of Trustees in its business judgment. In addition, the Board has determined that John R. Bartholdson is an “audit committee financial expert” and “independent” as those terms are defined in Item 3 of Form N-CSR.
| Item 4. | Principal Accountant Fees and Services. |
(a) Audit Fees. The aggregate fees billed from the Trust’s fiscal year ended December 31, 2011 and fiscal year ended December 31, 2012, for professional services rendered by the principal accountant for the audit of the Trust’s annual financial statements or services that are normally provided by the accountant in connection with statutory and regulatory filings or engagements are as follows:
2012: $48,000
2011: $47,000
(b) Audit-Related Fees. The aggregate fees billed from the Trust’s fiscal year ended December 31, 2011 and fiscal year ended December 31, 2012 for assurance and related services by the principal accountant that are reasonably related to the performance of the audit of the Trust’s financial statements and are not reported above in Item 4(a) are as follows:
2012: $0
2011: $0
(c) Tax Fees. The aggregate fees billed from the Trust’s fiscal year ended December 31, 2011 and fiscal year ended December 31, 2012 for professional services rendered by the principal accountant for tax compliance, tax advice and tax planning are as follows:
2012: $24,500
2011: $24,500
(d) All Other Fees. The aggregate fees billed from the Trust’s fiscal year ended December 31, 2011 and fiscal year ended December 31, 2012 for products and services provided by the principal accountant, other than the services reported above in Items 4(a) through (c) are as follows:
2012: $0
2011: $0
| (e) | Audit Committee Pre-Approval Policies and Procedures. |
(i) The Trust has an Audit Committee Charter in place (the “Charter”) that governs the pre-approval by the Trust’s Audit Committee of all engagements for audit services and all Covered Non-Audit Engagements (as defined in the Charter) provided by the Trust’s independent auditor (the “Independent Auditor”) to the Trust and other “Related Entities” (as defined below). Each calendar year, the Audit Committee will review and re-approve the Charter, together with any changes deemed necessary or desirable by the Audit Committee. The Audit Committee may, from time to time, modify the nature of the services pre-approved, the aggregate level of fees pre-approved, or both.
“Related Entities” means (i) CBRE Clarion Securities LLC (the “Advisor”) or (ii) any entity controlling, controlled by or under common control with the Advisor.
Pre-approval shall be required only with respect to non-audit services (i) related directly to the operations and financial reporting of the Trust and (ii) provided to a Related Entity that furnishes ongoing services to the Trust. Such pre-approval shall not apply to non-audit services provided to any sub-adviser whose role is primarily portfolio management and is subcontracted with or overseen by another investment adviser. Pre-approval by the Audit Committee of such non-audit services shall be effected pursuant to the pre-approval procedures described in the Charter. The Charter shall not be violated if pre-approval of any such non-audit service is not obtained in circumstances in which the pre-approval requirement is waived under applicable rules promulgated by the Securities and Exchange Commission (“SEC”) or the NYSE, in accordance with the Sarbanes Oxley Act.
Requests for pre-approval of Covered Non-Audit Engagements are submitted to the Audit Committee by the Independent Auditor and by the chief financial officer of the Related Entity for which the non-audit services are to be performed. Such requests must include a statement as to whether, in the view of the Independent Auditor and such officer, (a) the request is consistent with the SEC’s rules on auditor independence and (b) the requested service is or is not a non-audit service prohibited by the SEC. A request submitted between scheduled meetings of the Audit Committee should state the reason that approval is being sought prior to the next regularly scheduled meeting of the Audit Committee.
Between regularly scheduled meetings of the Audit Committee, the Committee Chairman or Audit Committee Financial Expert shall have the authority to pre-approve Covered Non-Audit Engagements, provided that fees associated with such engagement do not exceed $10,000 and the services to be provided do not involve provision of any of the following services by the Independent Auditor: (i) bookkeeping or other services related to the accounting records or financial statements of the audit client; (ii) financial information systems design and implementation; (iii) appraisal or valuation services, fairness opinions, or contribution-in-kind reports; (iv) actuarial services; (v) internal audit outsourcing services; (vi) management functions; (vii) human resources; (vii) broker dealer, investment advisor or investment banking services; (ix) legal services; or (x) expert services unrelated to the audit.
Fee levels for all Covered Services to be provided by the Independent Auditor and pre-approved under this Policy will be established annually by the Audit Committee. Any increase in pre-approved fee levels will require specific pre-approval by the Audit Committee.
The terms and fees of the annual Audit services engagement for the Trust are subject to the specific pre-approval of the Audit Committee. The Audit Committee will approve, if necessary, any changes in terms, conditions or fees resulting from changes in audit scope, Trust structure or other matters.
(ii) 100% of the services described in each of Items 4(b) through (d) were approved by the Trust’s audit committee pursuant to paragraph (c)(7)(i)(C) of Rule 2-01 of Regulation S-X.
(f) The percentage of hours expended on the principal accountant’s engagement to audit the Trust’s financial statements for the most recent fiscal year attributable to work performed by persons other than the principal accountant’s full-time, permanent employees was 0%.
(g) The aggregate non-audit fees billed by the Trust’s accountant for services rendered to the Trust, the Advisor or any entity controlling, controlled by, or under common control with the Advisor that provides ongoing services to the Trust (except for any sub-advisor whose role is primarily portfolio management and is subcontracted with or overseen by another investment advisor) for the fiscal year ended December 31, 2011 and fiscal year ended December 31, 2012 are as follows:
2012: $307,000
2011: $324,200
(h) Not applicable.
| Item 5. | Audit Committee of Listed Registrants. |
(a) The Trust has a separately designated standing audit committee established in accordance with Section 3(a)(58)(A) of the Securities Exchange Act of 1934. The audit committee of the Trust is comprised of: Frederick S. Hammer, Asuka Nakahara, Richard L. Sutton and John R. Bartholdson.
(b) Not applicable.
(a) The schedule of investments is included as part of the report to shareholders filed under Item 1 of this form.
(b) Not applicable.
| Item 7. | Disclosure of Proxy Voting Policies and Procedures for Closed-End Management Investment Companies. |
The Trust has delegated the voting of proxies relating to its voting securities to the Advisor, pursuant to the proxy voting procedures of the Advisor. The Advisor’s Proxy Voting Policies and Procedures are included as an exhibit hereto.
| Item 8. | Portfolio Managers of Closed-End Management Investment Companies. |
| (a) | As of February 25, 2013: |
T. Ritson Ferguson
Chief Executive Officer and Co-Chief Investment Officer, CBRE Clarion Securities LLC since 1991
Steven D. Burton
Managing Director and Co-Chief Investment Officer, CBRE Clarion Securities LLC since 1995
Joseph P. Smith
Managing Director and Co-Chief Investment Officer, CBRE Clarion Securities LLC since 1997
Other Accounts Managed (as of December 31, 2012). The Portfolio Managers are also collectively responsible for the day-to-day management of the Advisor’s other accounts, as indicated by the following table.
| | | | | | | | | | | | | | | | | | | | |
Name of Portfolio Managers | | | | Type of Accounts | | Number of
Accounts Managed | | | | | Total Assets
in the Accounts | | | Managed with
Advisory Fee Based
on Performance | | Managed with
Advisory Fee Based
on Performance | |
T. Ritson Ferguson | | | | Registered Investment Companies | | | 14 | | | | | $ | 11,862,808,472.67 | | | 0 | | $ | 0 | |
| | | | | | | |
| | | | Other Pooled Investment Vehicles | | | 38 | | | | | $ | 5,561,416,503.26 | | | 4 | | $ | 280,624,869.00 | |
| | | | | | | |
| | | | Other Accounts | | | 71 | | | | | $ | 6,222,787,922.32 | | | 7 | | $ | 2,155,053,662.41 | |
| | | | | | | |
Steven D. Burton | | | | Registered Investment Companies | | | 12 | | | | | $ | 10,053,606,661.84 | | | 0 | | $ | 0 | |
| | | | | | | |
| | | | Other Pooled Investment Vehicles | | | 37 | | | | | $ | 5,400,378,393.65 | | | 4 | | $ | 280,624,869.00 | |
| | | | | | | |
| | | | Other Accounts | | | 54 | | | | | $ | 5,532,093,200.51 | | | 7 | | $ | 2,155,053,662.41 | |
| | | | | | | |
Joseph P. Smith | | | | Registered Investment Companies | | | 14 | | | | | $ | 11,862,808,472.67 | | | 0 | | $ | 0 | |
| | | | | | | |
| | | | Other Pooled Investment Vehicles | | | 36 | | | | | $ | 5,490,621,715.52 | | | 4 | | $ | 280,624,869.00 | |
| | | | | | | |
| | | | Other Accounts | | | 70 | | | | | $ | 5,423,036,617.91 | | | 7 | | $ | 2,155,053,662.41 | |
Potential Material Conflicts of Interest
A portfolio manager may be subject to potential conflicts of interest because the portfolio manager is responsible for other accounts in addition to the Trust. These other accounts may include, among others, other closed-end funds, mutual funds, separately managed advisory accounts, commingled trust accounts, insurance separate accounts, wrap fee programs, and hedge Trusts. Potential conflicts may arise out of the implementation of differing investment strategies for a portfolio manager’s various accounts, the allocation of investment opportunities among those accounts or differences in the advisory fees paid by the portfolio manager’s accounts.
A potential conflict of interest may arise as a result of a portfolio manager’s responsibility for multiple accounts with similar investment guidelines. Under these circumstances, a potential investment may be suitable for more than one of the portfolio manager’s accounts, but the quantity of the investment available for purchase is less than the aggregate amount the accounts would ideally devote to the opportunity. Similar conflicts may arise when multiple accounts seek to dispose of the same investment.
A portfolio manager may also manage accounts whose objectives and policies differ from those of the Trust. These differences may be such that under certain circumstances, trading activity appropriate for one account managed by the portfolio manager may have adverse consequences for another account managed by the portfolio manager. For example, if an account were to sell a significant position in a security, which could cause the market price of that security to decrease while the Trust maintained its position in that security.
A potential conflict may arise when a portfolio manager is responsible for accounts that have different advisory fees – the difference in the fees may create an incentive for the portfolio manager to favor one account over another, for example, in terms of access to particularly appealing investment opportunities. This conflict may be heightened where an account is subject to a performance-based fee.
CBRE Clarion recognizes the duty of loyalty it owes to its clients and has established and implemented certain policies and procedures designed to control and mitigate conflicts of interest arising from the execution of a variety of portfolio management and trading strategies across the firm’s diverse client base. Such policies and procedures include, but are not limited to: (i) investment process, portfolio management, and trade allocation procedures; (ii) procedures regarding short sales in securities recommended for other clients; and (iii) procedures regarding personal trading by the firm’s employees (contained in the Code of Ethics).
Compensation
There are five pieces of compensation for CBRE Clarion portfolio managers:
Base Salary— Portfolio manager salaries are reviewed annually and fixed for each year at competitive market levels.
Profit Participation— Senior management, including the portfolio managers primarily responsible for the Trust, owns a minority interest in CBRE Clarion. Ownership entitles senior management to an increasing share of the firm’s profit over time, although an owner’s equity interest may be forfeited if the individual resigns voluntarily in the first several years.
Bonus— Portfolio manager bonuses are drawn from an incentive compensation pool into which a significant percentage of CBRE Clarion’s pre-tax profits is set aside. Bonuses are based upon the measurement of performance in the portfolio manager’s respective area of coverage. Performance is quantified through a proprietary “scorecard” graded by the CEO and CIOs. In order to avoid the pitfalls of relying solely upon a rigid performance format, however, the overall bonus takes into account other important factors such as the portfolio manager’s contribution to the team, firm, and overall process.
Deferred Compensation— A portion of the incentive compensation pool is set aside each year as deferred compensation for a large number of senior employees in the firm, including the portfolio managers. These awards have vesting and payout features, which encourage long-term stability of our senior staff.
Other Compensation— Portfolio managers may also participate in benefit plans and programs available generally to all employees, such as CBRE Clarion’s 401(k) plan.
Portfolio manager compensation is not based on the performance of any particular account, including the Trust, nor is compensation based on the level of Trust assets.
Ownership of Trust Shares
The following table indicates the dollar range of securities of the Trust beneficially owned by the Portfolio Managers as of December 31, 2012.
| | |
Name of Portfolio Managers | | Dollar Value of Trust Shares Beneficially Owned |
T. Ritson Ferguson | | $500,001-$1,000,000 |
Steven D. Burton | | $100,001-$500,000 |
Joseph P. Smith | | $10,001-$50,000 |
(b) Not applicable.
| Item 9. | Purchases of Equity Securities by Closed-End Management Investment Company and Affiliated Purchasers. |
None.
| Item 10. | Submission of Matters to a Vote of Security Holders. |
Not applicable.
| Item 11. | Controls and Procedures. |
(a) The Trust’s principal executive officer and principal financial officer have evaluated the Trust’s disclosure controls and procedures within 90 days of this filing and have concluded that the Trust’s disclosure controls and procedures were effective, as of that date, in ensuring that information required to be disclosed by the Trust in this Form N-CSR was recorded, processed, summarized, and reported timely.
(b) The Trust’s principal executive officer and principal financial officer are aware of no changes in the Trust’s internal control over financial reporting that occurred during the Trust’s second fiscal quarter of the period covered by this report that has materially affected, or is reasonably likely to materially affect, the Trust’s internal control over financial reporting.
(a)(1) Fund Officer Code of Ethics.
(a)(2) Certification of chief executive officer and chief financial officer pursuant to Section 302 of the Sarbanes-Oxley Act of 2002.
(b) Certification of chief executive officer and chief financial officer pursuant to Section 906 of the Sarbanes-Oxley Act of 2002.
(c) Proxy Voting Policies and Procedures.
(d) Notices to Trust’s common shareholders in accordance with Investment Company Act Section 19(a) and Rule 19a-1.(1)
| (1) | The Trust has received exemptive relief from the Securities and Exchange Commission permitting it to make periodic distributions of long-term capital gains with respect to its outstanding common stock as frequently as twelve times each year. This relief is conditioned, in part, on an undertaking by the Trust to make the disclosures to the holders of the Trust’s common shares, in addition to the information required by Section 19(a) of the Investment Company Act and Rule 19a-1 thereunder. The Trust is likewise obligated to file with the Commission the information contained in any such notice to shareholders and, in that regard, has attached hereto copies of each such notice made during the period. |
SIGNATURES
Pursuant to the requirements of the Securities Exchange Act of 1934 and the Investment Company Act of 1940, the registrant has duly caused this report to be signed on its behalf by the undersigned, thereunto duly authorized.
(Registrant) CBRE Clarion Global Real Estate Income Fund
| | |
| |
| By: | | /s/ T. Ritson Ferguson |
| |
| Name: | | T. Ritson Ferguson |
| |
| Title: | | President and Chief Executive Officer |
| |
| Date: | | April 26, 2013 |
Pursuant to the requirements of the Securities Exchange Act of 1934 and the Investment Company Act of 1940, this report has been signed by the following persons on behalf of the registrant and in the capacities and on the dates indicated.
| | |
| By: | | /s/ T. Ritson Ferguson |
| |
| Name: | | T. Ritson Ferguson |
| |
| Title: | | President and Chief Executive Officer |
| |
| Date: | | April 26, 2013 |
| | |
| By: | | /s/ Jonathan A. Blome |
| |
| Name: | | Jonathan A. Blome |
| |
| Title: | | Chief Financial Officer |
| |
| Date: | | April 26, 2013 |