UNITED STATES
SECURITIES AND EXCHANGE COMMISSION
Washington, D.C. 20549
FORM N-CSR
CERTIFIED SHAREHOLDER REPORT OF REGISTERED
MANAGEMENT INVESTMENT COMPANIES
Investment Company Act file number 811-21465
CBRE Clarion Global Real Estate Income Fund
(Exact name of registrant as specified in charter)
201 King of Prussia Road, Suite 600 Radnor, PA 19087
(Address of principal executive offices) (Zip code)
T. Ritson Ferguson, President and Chief Executive Officer
CBRE Clarion Global Real Estate Income Fund
201 King of Prussia Road, Suite 600
Radnor, PA 19087
(Name and address of agent for service)
Registrant’s telephone number, including area code: 1-888-711-4272
Date of fiscal year end: December 31
Date of reporting period: June 30, 2013
Form N-CSR is to be used by management investment companies to file reports with the Commission not later than 10 days after the transmission to stockholders of any report that is required to be transmitted to stockholders under Rule 30e-1 under the Investment Company Act of 1940 (17 CFR 270.30e-1). The Commission may use the information provided on Form N-CSR in its regulatory, disclosure review, inspection, and policymaking roles.
A registrant is required to disclose the information specified by Form N-CSR, and the Commission will make this information public. A registrant is not required to respond to the collection of information contained in Form N-CSR unless the Form displays a currently valid Office of Management and Budget (“OMB”) control number. Please direct comments concerning the accuracy of the information collection burden estimate and any suggestions for reducing the burden to Secretary, Securities and Exchange Commission, 450 Fifth Street, NW, Washington, DC 20549-0609. The OMB has reviewed this collection of information under the clearance requirements of 44 U.S.C. § 3507.
| Item 1. | Report(s) to Stockholders. |
The semi-annual Report of CBRE Clarion Global Real Estate Income Fund (the “Trust”) transmitted to shareholders pursuant to Rule 30e-1 under the Investment Company Act of 1940 is as follows:

CBRE CLARION GLOBAL REAL ESTATE
INCOME FUND
Semi-Annual Report for the Six Months Ended June 30, 2013

CBRE Clarion Global Real Estate Income Fund (the “Trust”), acting in accordance with an exemptive order received from the Securities and Exchange Commission (“SEC”) and with approval of its Board of Trustees (the “Board”), has adopted a managed distribution policy (the “Policy”) with the purpose of distributing over the course of each year, through periodic distributions as nearly equal as practicable and any required special distributions, an amount closely approximating the total taxable income of the Trust during such year and all of the returns of capital paid by portfolio companies to the Trust during such year. In accordance with its Policy, the Trust distributes a fixed amount per common share, currently $0.045, each month to its common shareholders. This amount is subject to change from time to time in the discretion of the Board. Although the level of distributions is independent of fund performance, the Trust expects such distributions to correlate with its performance over time. Each monthly distribution to shareholders is expected to be at the fixed amount established by the Board, except for extraordinary distributions and potential increases or decreases in the final dividend periods for each year in light of the Trust’s performance for the entire calendar year and to enable the Trust to comply with the distribution requirements imposed by the Internal Revenue Code. Over time, the Trust expects that the distribution rate in relation to the Trust’s Net Asset Value (“NAV”) will approximately equal the Trust’s total return on NAV.
The fixed amount of distributions will be reviewed and amended as necessary by the Board at regular intervals with consideration of the level of investment income and realized gains. The Board strives to establish a level regular distribution that will meet the Trust’s requirement to pay out all taxable income (including amounts representing return of capital paid by portfolio companies) with a minimum of special distributions. The Trust’s total return in relation to changes in NAV is presented in the financial highlights table. Shareholders should not draw any conclusions about the Trust’s investment performance from the amount of the current distribution or from the terms of the Trust’s managed distribution policy. The Board may amend or terminate the managed distribution policy without prior notice to Trust shareholders.
Shareholders should note that the Trust’s Policy is subject to change or termination as a result of many factors. The Trust is subject to risks through ownership of its portfolio company holdings including, but not limited to, declines in the value of real estate held by the portfolio company, risks related to general and local economic conditions, and portfolio company losses. Moreover, an economic downturn could have a material adverse effect on the real estate markets and on real estate companies in which the Trust invests, which in turn could result in the Trust not achieving its investment or distribution objectives thereby jeopardizing the continuance of the Policy. Please refer to the prospectus for a fuller description of the Trust’s risks.
Table of Contents
CBRE CLARION GLOBAL REAL ESTATE INCOME FUND SEMI-ANNUAL REPORT 2013 (unaudited)
Investors should consider a fund’s investment objectives, risks, charges and expenses carefully before investing. A copy of the prospectus that contains this and other information about the Fund may be obtained by calling 888-711-4272. Please read the prospectus carefully before investing. Investing in closed-end funds involves risk, including possible loss of principal. Past performance does not guarantee future results.
Real Estate investments are subject to changes in economic conditions, credit risk, and interest rate fluctuations. International investments may involve risk of capital loss from unfavorable fluctuation in currency values, from differences in generally accepted accounting principles or from economic or political instability in other nations. Because real estate funds concentrate their investments in the real estate industry, the portfolio may experience more volatility and be exposed to greater risk than the portfolios of other funds.
Closed-end funds are traded on the secondary market through one of the stock exchanges. The Fund’s investment return and principal value will fluctuate so that an investor’s shares may be worth more or less than the original cost. Shares of closed-end funds may trade above (a premium) or below (a discount) the net asset value (NAV) of the fund’s portfolio. There is no assurance that the Fund will achieve its investment objective.
| | |
| SEMI-ANNUAL REPORT 2013 | | 1 |
Letter to Shareholders

T. Ritson Ferguson

Steven D. Burton
Dear Shareholder:
We are pleased to present the 2013 Semi-Annual Report for the CBRE Clarion Global Real Estate Income Fund (the “Trust”).
Performance Review
Global real estate stocks, as measured by the S&P Developed Property Index (S&PDPI) (1), delivered positive returns during the first half of the year. Performance was particularly strong during the first quarter (+7.0%) as encouraging economic news, further evidence of stable to improving real estate fundamentals, and accommodative central bank monetary policies around the globe provided a healthy context for property share performance. However, property shares retreated during the second quarter of 2013 as mixed economic results and news outlining the U.S. Federal Reserve’s intention to begin scaling back its quantitative easing program weighed on global markets. Despite the resulting pullback, year-to-date results remain in positive territory through June.
During the first six months of 2013, the S&PDPI rose 3.1% and the MSCI REIT Preferred Index (MSRPI) (2) rose 0.8%. The Trust’s Net Asset Value Return (“NAV Return” i.e., NAV gain plus dividends) was 1.6%, which was modestly behind the 2.7% return of a blended index comprised of 80% S&PDPI and 20% MSRPI (3). The Trust’s market price return of 4.8% (i.e., stock price appreciation plus reinvested dividends) exceeded the NAV Return due to the narrowing of the discount of the Trust’s share price to NAV from 6.5% at year-end to 3.7% at June 30, 2013. Despite strong relative performance of the securities owned in most regions (including preferred stocks), NAV performance was negatively impacted by the Trust’s relatively small exposure to Japan (just 4% of the portfolio), which had the best performance in the first half of the year (+15%), and its relatively large weightings to Canada (10%) and Australia (14%), two markets which experienced declines in property stocks (-5% and -10%, respectively) in the first 6 months of 2013. The Trust continues to employ minimal leverage in an effort to reduce volatility. Leverage stood at just under 5% at the end of the period.
The Trust paid total dividends of $0.27 per share for the first six months of 2013, consisting of six regular monthly dividends of $0.045 per share. The annualized dividend of $0.54 per share represents a 6.0% yield on the $9.02 share price and a 5.8% yield on the $9.37 NAV as of June 30.
Based on income, realized gains, and expected returns for global property company stocks for the balance of this year, the Board has thus far seen fit to maintain the Trust’s monthly dividend at the current monthly rate of $0.045 per share. The Trust’s dividend is established by the Board at regular intervals with consideration of the portfolio’s level of investment income and potential capital appreciation, as well as prevailing market conditions. The Board strives to establish a level monthly dividend that, by the end of each year, will satisfy the requirement (under applicable tax regulations) to distribute all income and realized gains, with a minimum of special distributions. The Board continues to review the sustainability of the Trust’s regular monthly dividend in light of the current market environment and the dividends that have been paid out over the life of the Trust (which amount to $12.50 per share since inception in 2004).
| (1) | The S&P Developed Property Index is an unmanaged market-weighted total return index which consists of over 350 real estate companies from 22 developed markets with a free float total market capitalization of at least U.S. $100 million that derive more than 60% of their revenue from real estate development, management, rental and/or direct investment in physical property. |
| (2) | The MSCI REIT Preferred Index is a preferred stock market capitalization weighted index of all exchange traded preferred securities of equity REITs. |
| (3) | We include the return of this “blended index” as a reference point, since the Trust invests in both common and preferred stocks issued by listed property companies. The Trust does not have a formal performance benchmark. |
| | |
| 2 | | CBRE CLARION GLOBAL REAL ESTATE INCOME FUND |
Portfolio Review
The Trust’s investments remain well-diversified by property type and geography as shown in the charts below. The geographic mix of the portfolio experienced modest changes over the past 6 months. At June 30, the Trust’s portfolio was 48% invested in common stock within the Americas region, 14% in Europe, 28% in Asia-Pacific, with 10% invested in preferred stock of US real estate companies. The Trust’s preferred stock weighting dropped by about 2% during the period, continuing the trend of the last two years. Since the start of the year, exposure to U.S. common stocks (+2%), Europe/UK (+2%) and Japan has been increased. Conversely, exposure to Canada and Australia has been reduced, although both remain important parts of the overall portfolio. By property type, the Trust continues to favor retail properties, particularly top-quality malls (because we believe such properties generate enduring and growing cash flows during most economic cycles). A number of the Trust’s investments in owners of high-quality properties in the Asia-Pacific region show up under the “diversified” property type because of the tendency for companies in that region to own a mix of high quality office, retail and residential properties. The Trust also has meaningful positions in the industrial, apartment and office sectors, which stand to benefit from the acceleration in economic activity we expect, particularly in the U.S.
| | |
Geographic Diversification | | Sector Diversification |
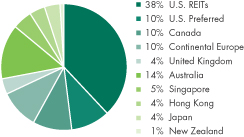 | | 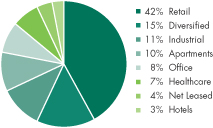 |
Source CBRE Clarion. Geographic and Sector diversification are unaudited. Percentages presented are based on managed trust assets, which includes borrowings. The percentages in the pie charts will differ from those on the Portfolio of Investments because the figures on the Portfolio of Investments are calculated using net assets of the Trust.
Market Commentary
After a strong start to the year, equities, including global property stocks, declined during the second quarter. The triggering event for the pull-back in stocks (and bonds) seemed to be public comments made by U.S. Federal Reserve Bank Chairman Ben Bernanke in May describing the criteria that the “Fed” would use to scale back its quantitative easing program in response to encouraging economic trends potentially as early as this Fall. This news had an unsettling effect on the world’s financial markets, as bond yields moved sharply higher in response to Mr. Bernanke’s comments. Yields on 10-year sovereign bonds in major global markets were generally 0.6-0.7% higher by the end of June compared to the levels prior to Mr. Bernanke’s comments. However, in late June, equity prices rebounded as investors appeared to become more comfortable with the balance between the state of economic recovery and Fed policy. For the first half of the year, performance of global property stocks was strongest in Japan (+15.2%) and the U.S. (+6.7%). Performance was weakest in Canada (-9.2%) and Asia-Pacific ex-Japan, including Singapore (-7.8%), Hong Kong (-7.7%) and Australia (-4.9%). Property stocks in Europe were modest underperformers in the first half of 2013 including Continental Europe (-2.4%) and the U.K. (+1.9%). Currency movements tempered returns on the Trust’s international investments, as the U.S. dollar generally strengthened versus most other major currencies.
Real estate companies can perform well in the face of rising rates. A short-term move higher in interest rates can cause stock prices to fall, but history suggests that property company shares ultimately benefit from the underlying forces that often cause interest rates to move higher, namely positive economic growth. In the table below, we have identified five periods during which U.S. interest rates rose unexpectedly causing a market correction for U.S. REITs of (approximately) 10% or more (measured by the FTSE NAREIT Equity Index). In each of these periods, which varied from 2 weeks to 5 months, the U.S. REIT market fell and underperformed the broader U.S. equity market (measured by the S&P 500 Index). However, in the period (6 months to a year) following each U.S. REIT market correction, U.S. REIT returns rebounded strongly and generally outperformed the broader U.S. equity market.
| | |
| SEMI-ANNUAL REPORT 2013 | | 3 |
U.S. REIT Returns During and After Periods of Rising Interest Rates
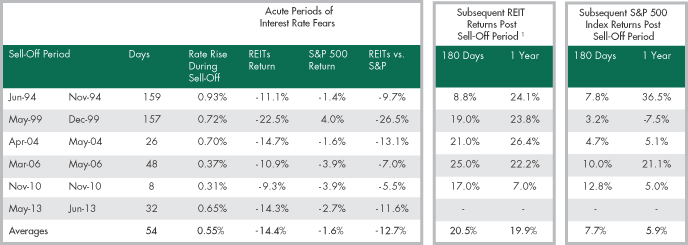
1 FTSE NAREIT Equity REIT Index
Source: FactSet, S&P 500 Index and FTSE NAREIT Equity Index as of 06/30/2013. An index is unmanaged and not available for direct investment. Past performance is no guarantee of future results.
A steepening yield curve, such as we are seeing now, has been historically positive for listed property company performance over time, since this shift reflects the expectation of improving economic conditions which are ultimately good for commercial property fundamentals and listed property company returns.
We remain in a world of slowly improving economic growth. Global economic growth prospects are about where they were a year ago for 2013 and 2014: at 2.2% and 2.9%, respectively. Economic growth in the important U.S. market is projected at 2.2% for 2013, accelerating to 3.4% in 2014. Recent employment releases have been increasingly encouraging. Projections for economic growth in Japan have also ticked higher on the back of aggressive fiscal and monetary stimulus and talk of structural economic reform being encouraged by Prime Minister Shinzo Abe’s domestic economic renaissance plan. Despite the Fed’s recent “tapering” comments, central banks globally have generally maintained extremely accommodative monetary policy during the year with policy rates at or near zero for most major countries. This has generally supported an outlook for stable to rising equity markets.
Earnings growth projections remain in the 6-7% range. Real estate cash flows are notable for their durability, owing to the contractual nature of longer-term leases. Real estate cash flows continue to grow with a high degree of visibility. Our latest earnings projections for 2013 indicate a weighted average growth rate of cash flow per share in the 6-7% range. The bulk of the projected growth is from “internal” sources (i.e., generated by companies’ existing portfolios), although there are increasing opportunities for companies to bolster earnings growth “externally” through accretive acquisitions and capital recycling activities. Commercial property sales transaction volumes have recovered from the lows of the global financial crisis in 2008, but are still well below the peak volumes of 2006-2007. According to data provided by Real Capital Analytics, global transaction volume has been approximately $800 billion in each of 2011 and 2012. The U.S. is an important component of the global numbers and is emblematic of global trends. Commercial property transaction volumes in the U.S. reached approximately $285 billion in 2012, over twice the volume from 2010, and transaction volumes continue to be elevated in 2013. Listed property companies have been active participants in this the transactions market, as both sellers and buyers. On the buy side, listed property companies have been able to successfully access attractively priced capital to fund acquisitions. We have revised our earnings growth estimates for 2014 upward slightly to 7.5% (global weighted average growth rate of cash flow per share), reflecting a more optimistic growth outlook for the next 12-18 months considering companies’ internal and external growth prospects.
Property companies continue to offer attractive yields and growing dividends. The weighted average global yield for property stocks is 3.6% (with yields over 5% in Canada, Australia and Continental Europe). We project that dividends will continue to grow by approximately 7% in both 2013 and 2014, driven by a combination of improving company cash flows and an expansion of dividend pay-out policies, which remain conservative. Dividend increases among U.S. REITs remain particularly strong, with over 105 dividend increases observed in 2012.
| | |
| 4 | | CBRE CLARION GLOBAL REAL ESTATE INCOME FUND |
Indicated Dividend Yields by Country
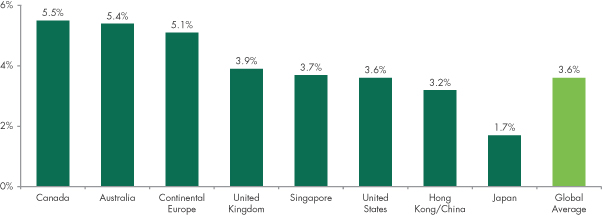
Source: CBRE Clarion as of 06/30/2013. Not all countries included.
Dividend yields fluctuate and are not necessarily indicative of present or future investment performance. Information is subject to change and should not be construed as investment advice. Past performance is no guarantee of future results.
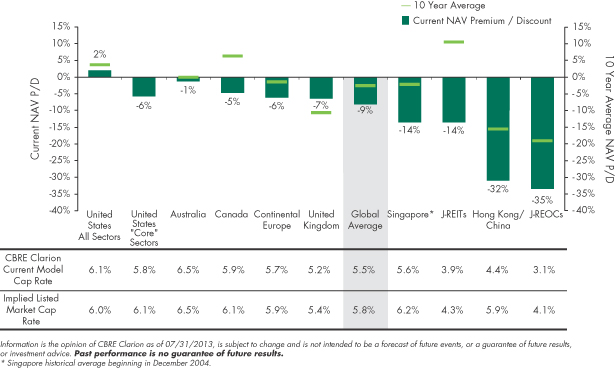
Valuations are attractive. Listed property companies are trading, on average, at a 9% discount to our estimates of the companies’ underlying real estate net asset values (NAV). Despite the modest positive performance of real estate stocks in the first half of the year, we do not believe the price to NAV relationship has changed much. NAVs have been stable or rising, supporting our contention that real estate shares are not overvalued. Our current valuations indicate implied unleveraged cash flow yields (i.e., cap rates) of just under 6%, although implied cap rates vary by country as shown in the table below. The implied cap rates remain attractive compared to the cost of capital and relevant private market property cap rates in today’s interest rate environment, even taking into account recent increases in longer-term interest rates.
NAV Premium/Discount by Region
| | |
| SEMI-ANNUAL REPORT 2013 | | 5 |
We continue to believe that global property stocks offer investors an attractive investment option, with an attractive and growing dividend and appreciation potential from increasing earnings derived from improving economic and commercial property conditions.
We appreciate your continued faith and confidence.
Sincerely,
CBRE CLARION SECURITIES LLC
| | |

| |  |
| T. Ritson Ferguson, CFA | | Steven D. Burton, CFA |
| President & CEO | | Co-Portfolio Manager |
| Co-Portfolio Manager | | |
The views expressed represent the opinion of CBRE Clarion Securities which are subject to change and are not intended as a forecast or guarantee of future results. This material is for informational purposes only. It does not constitute investment advice and is not intended as an endorsement of any specific investment. Stated information is derived from proprietary and non-proprietary sources which have not been independently verified for accuracy or completeness. While CBRE Clarion Securities believes the information to be accurate and reliable, we do not claim or have responsibility for its completeness, accuracy, or reliability. Statements of future expectations, estimate, projections, and other forward-looking statements are based on available information and management’s view as of the time of these statements. Accordingly, such statements are inherently speculative as they are based on assumptions which may involve known and unknown risks and uncertainties. The securities discussed herein should not be perceived as a recommendation to purchase or sell any particular security. It should not be assumed that investments in any of the securities discussed were or will be profitable. Actual results, performance or events may differ materially from those expressed or implied in such statements. Investing in real estate securities involves risks including the potential loss of principal. Real estate equities are subject to risks similar to those associated with the direct ownership of real estate. Portfolios concentrated in real estate securities may experience price volatility and other risks associated with non-diversification. While equities may offer the potential for greater long-term growth than most debt securities, they generally have higher volatility. International investments may involve risk of capital loss from unfavorable fluctuation in currency values, from differences in generally accepted accounting principles, or from economic or political instability in other nations. Past performance is no guarantee of future results.
| | |
| 6 | | CBRE CLARION GLOBAL REAL ESTATE INCOME FUND |
Portfolio of Investments (unaudited)
June 30, 2013
| | | | | | | | | | | | |
| Shares | | | | | | | | | Market
Value ($) | |
| | | | | | Real Estate Securities* – 105.0% | | | | | | |
| | | | | | Common Stock – 94.8% | | | | | | |
| | | | | | Australia – 14.3% | | | | | | |
| | 5,453,037 | | | | | CFS Retail Property Trust Group | | | | $ | 9,982,877 | |
| �� | 2,776,835 | | | | | Charter Hall Retail Real Estate Investment Trust | | | | | 9,684,169 | |
| | 38,529,000 | | | | | Dexus Property Group | | | | | 37,736,256 | |
| | 1,410,723 | | | | | Goodman Group | | | | | 6,301,572 | |
| | 4,469,500 | | | | | GPT Group | | | | | 15,710,046 | |
| | 4,102,827 | | | | | Westfield Group | | | | | 42,963,191 | |
| | 11,784,262 | | | | | Westfield Retail Trust | | | | | 33,438,854 | |
| | | | | | | | | | | 155,816,965 | |
| | | | | | | | | | | | |
| | | | | | Canada – 10.1% | | | | | | |
| | 200,100 | | | | | Calloway Real Estate Investment Trust | | | | | 4,876,602 | |
| | 500,000 | | | | | Crombie Real Estate Investment Trust (a) | | | | | 6,493,199 | |
| | 1,856,000 | | | | | H&R Real Estate Investment Trust | | | | | 38,775,525 | |
| | 2,082,900 | | | | | InnVest Real Estate Investment Trust | | | | | 8,351,739 | |
| | 440,000 | | | | | InnVest Real Estate Investment Trust (a) | | | | | 1,764,254 | |
| | 2,078,800 | | | | | RioCan Real Estate Investment Trust | | | | | 49,795,038 | |
| | | | | | | | | | | 110,056,357 | |
| | | | | | | | | | | | |
| | | | | | France – 6.2% | | | | | | |
| | 65,700 | | | | | Altarea | | | | | 10,675,012 | |
| | 351,122 | | | | | Societe de la Tour Eiffel | | | | | 20,679,740 | |
| | 158,851 | | | | | Unibail-Rodamco SE | | | | | 36,960,340 | |
| | | | | | | | | | | 68,315,092 | |
| | | | | | | | | | | | |
| | | | | | Germany – 0.9% | | | | | | |
| | 247,161 | | | | | GSW Immobilien AG | | | | | 9,549,811 | |
| | | | | | Hong Kong – 4.0% | | | | | | |
| | 8,913,000 | | | | | Link REIT (The) | | | | | 43,839,042 | |
| | | | | | Japan – 4.6% | | | | | | |
| | 840 | | | | | Activia Properties, Inc. | | | | | 6,604,319 | |
| | 620 | | | | | Frontier Real Estate Investment Corp. | | | | | 5,679,770 | |
| | 12,852 | | | | | Japan Retail Fund Investment Corp. | | | | | 26,807,615 | |
| | 189,800 | | | | | Mitsui Fudosan Co., Ltd. | | | | | 5,573,530 | |
| | 139,400 | | | | | Sumitomo Realty & Development Co., Ltd. | | | | | 5,550,179 | |
| | | | | | | | | | | 50,215,413 | |
| | | | | | | | | | | | |
| | | | | | Netherlands – 3.2% | | | | | | |
| | 218,455 | | | | | Corio NV | | | | | 8,679,194 | |
| | 403,885 | | | | | Eurocommercial Properties NV | | | | | 14,804,707 | |
| | 277,161 | | | | | Vastned | | | | | 11,341,221 | |
| | | | | | | | | | | 34,825,122 | |
| | | | | | | | | | | | |
| | | | | | | | | | | | |
| Shares | | | | | | | | | Market
Value ($) | |
| | | | | | New Zealand – 0.7% | | | | | | |
| | 9,050,000 | | | | | Goodman Property Trust | | | | $ | 7,198,992 | |
| | | | | | Singapore – 5.9% | | | | | | |
| | 6,735,000 | | | | | Ascendas Real Estate Investment Trust | | | | | 11,841,875 | |
| | 16,748,000 | | | | | CapitaMall Trust | | | | | 26,344,130 | |
| | 6,761,600 | | | | | Global Logistic Properties Ltd. | | | | | 14,660,885 | |
| | 7,804,400 | | | | | Mapletree Greater China Commercial Trust (b) | | | | | 5,814,995 | |
| | 4,757,000 | | | | | Suntec Real Estate Investment Trust | | | | | 5,907,336 | |
| | | | | | | | | | | 64,569,221 | |
| | | | | | | | | | | | |
| | | | | | United Kingdom – 4.4% | | | | | | |
| | 2,339,300 | | | | | Land Securities Group Plc | | | | | 31,364,472 | |
| | 4,045,110 | | | | | Segro Plc | | | | | 17,129,534 | |
| | | | | | | | | | | 48,494,006 | |
| | | | | | | | | | | | |
| | | | | | United States – 40.5% | | | | | | |
| | 979,167 | | | | | American Homes 4 Rent (a)(b)(c) | | | | | 14,883,338 | |
| | 995,353 | | | | | Brandywine Realty Trust | | | | | 13,457,173 | |
| | 826,200 | | | | | Camden Property Trust | | | | | 57,123,468 | |
| | 666,632 | | | | | CBL & Associates Properties, Inc. | | | | | 14,279,257 | |
| | 327,769 | | | | | General Growth Properties, Inc. | | | | | 6,512,770 | |
| | 343,515 | | | | | Health Care REIT, Inc. | | | | | 23,025,811 | |
| | 748,600 | | | | | Highwoods Properties, Inc. | | | | | 26,657,646 | |
| | 1,633,200 | | | | | Liberty Property Trust | | | | | 60,363,072 | |
| | 1,183,385 | | | | | Macerich Co. (The) | | | | | 72,150,983 | |
| | 1,847,070 | | | | | OMEGA Healthcare Investors, Inc. | | | | | 57,296,111 | |
| | 464,731 | | | | | ProLogis, Inc. | | | | | 17,529,653 | |
| | 100,000 | | | | | Regency Centers Corp. | | | | | 5,081,000 | |
| | 1,040,500 | | | | | Retail Properties of America, Inc., Class A | | | | | 14,858,340 | |
| | 44,219 | | | | | Simon Property Group, Inc. | | | | | 6,983,065 | |
| | 789,000 | | | | | Spirit Realty Capital, Inc. | | | | | 13,981,080 | |
| | 1,341,534 | | | | | UDR, Inc. | | | | | 34,195,702 | |
| | 63,760 | | | | | Ventas, Inc. | | | | | 4,428,770 | |
| | | | | | | | | | | | 442,807,239 | |
| | | | | | Total Common Stock | | | | | | |
| | | | | | | (cost $838,717,292) | | | | | 1,035,687,260 | |
See notes to financial statements.
| | |
| SEMI-ANNUAL REPORT 2013 | | 7 |
Portfolio of Investments concluded
| | | | | | | | | | | | |
| Shares | | | | | | | | | Market
Value ($) | |
| | | | | | Preferred Stock – 10.2% | | | | | | |
| | | | | | United States – 10.2% | | | | | | |
| | 100,000 | | | | | CBL & Associates Properties, Inc., Series D | | | | $ | 2,530,000 | |
| | 320,000 | | | | | Digital Realty Trust, Inc., Series E | | | | | 8,192,000 | |
| | 1,050,000 | | | | | EPR Properties, Series F | | | | | 25,830,000 | |
| | 444,300 | | | | | General Growth Properties, Inc., Series A | | | | | 10,298,874 | |
| | 319,479 | | | | | Glimcher Realty Trust, Series G | | | | | 8,006,144 | |
| | 150,000 | | | | | iStar Financial, Inc., Series F | | | | | 3,610,500 | |
| | 765,000 | | | | | iStar Financial, Inc., Series I | | | | | 17,770,950 | |
| | 192,468 | | | | | LaSalle Hotel Properties, Series G | | | | | 4,780,905 | |
| | 400,000 | | | | | LaSalle Hotel Properties, Series I | | | | | 9,188,000 | |
| | 268,000 | | | | | Pebblebrook Hotel Trust, Series A | | | | | 6,925,120 | |
| | 272,000 | | | | | Pennsylvania Real Estate Investment Trust, Series B | | | | | 6,965,920 | |
| | 280,000 | | | | | Urstadt Biddle Properties, Inc., Series F | | | | | 7,249,200 | |
| | | | | | | Total Preferred Stock
(cost $105,249,400) | | | | | 111,347,613 | |
| | | | | | | Total Investments – 105.0%
(cost $943,966,692) | | | | | 1,147,034,873 | |
| | | | | | | Liabilities in Excess of Other Assets – (5.0)% | | | | | (54,574,896 | ) |
| | | | |
| | | | | | | Net Assets – 100.0% | | | | $ | 1,092,459,977 | |
| * | Include U.S. Real Estate Investment Trusts (“REIT”) and Real Estate Operating Companies (“REOC”) as well as entities similarly formed under the laws of non-U.S. Countries. |
| (a) | Securities are exempt from registration under Rule 144A of the Securities Act of 1933. These securities may be resold in transactions that are exempt from registration, normally to qualified institutional buyers. At June 30, 2013, the securities amounted to $23,140,791 or 2.1% of net assets. |
| (b) | Non-income producing security. |
| (c) | Fair valued pursuant to guidelines approved by the Board. |
| | |
| 8 | | CBRE CLARION GLOBAL REAL ESTATE INCOME FUND |
See notes to financial statements.
Statement of Assets and Liabilities (unaudited)
| | | | | | |
| | | | | June 30, 2013 | |
| | |
Assets | | | | | | |
Investments, at value (cost $943,966,692) | | | | | $1,147,034,873 | |
Cash and cash equivalents (including foreign currency of $1,070,181
with a cost of $1,071,347) | | | | | 3,530,145 | |
Unrealized appreciation on spot contracts | | | | | 874 | |
Receivable for investment securities sold | | | | | 36,843,540 | |
Dividends and interest receivable | | | | | 6,564,472 | |
Dividend withholding reclaims receivable | | | | | 85,741 | |
Other assets | | | | | 91,543 | |
Total Assets | | | | | 1,194,151,188 | |
| | |
Liabilities | | | | | | |
Payable for investment securities purchased | | | | | 100,522,326 | |
Unrealized depreciation on spot contracts | | | | | 21,907 | |
Management fee payable | | | | | 774,245 | |
Accrued expenses | | | | | 372,733 | |
Total Liabilities | | | | | 101,691,211 | |
| | |
Net Assets | | | | | $1,092,459,977 | |
| | |
Composition of Net Assets | | | | | | |
$0.001 par value per share;
unlimited number of shares authorized,
116,590,494 shares issued and outstanding | | | | | $116,590 | |
Additional paid-in capital | | | | | 1,363,136,178 | |
Distributions in excess of net investment income | | | | | (90,965,734 | ) |
Accumulated net realized loss on investments, written options, swap contracts and foreign currency transactions | | | | | (382,813,132 | ) |
Net unrealized appreciation on investments, written options and foreign currency denominated assets and liabilities | | | | | 202,986,075 | |
| | |
Net Assets | | | | | $1,092,459,977 | |
| | |
Net Asset Value
(based on 116,590,494 shares outstanding) | | | | | $9.37 | |
See notes to financial statements.
| | |
| SEMI-ANNUAL REPORT 2013 | | 9 |
Statement of Operations (unaudited)
| | | | | | |
| | | | | For the
Six Months Ended
June 30, 2013 | |
Investment Income | | | | | | |
Dividends (net of foreign withholding taxes of $1,780,965) | | | | | $27,155,126 | |
Interest | | | | | 170 | |
Total Investment Income | | | | | 27,155,296 | |
| | |
Expenses | | | | | | |
Management fees | | | | | 4,910,969 | |
Printing and mailing fees | | | | | 302,078 | |
Administration fees | | | | | 117,973 | |
Custodian fees | | | | | 94,304 | |
Insurance fees | | | | | 86,578 | |
Transfer agent fees | | | | | 83,023 | |
Trustees’ fees and expenses | | | | | 77,806 | |
NYSE listing fee | | | | | 54,051 | |
Legal fees | | | | | 50,317 | |
Interest expense on line of credit | | | | | 40,198 | |
Audit and tax fees | | | | | 36,692 | |
Miscellaneous expenses | | | | | 12,206 | |
Total Expenses | | | | | 5,866,195 | |
Management fee waived | | | | | (92,484 | ) |
Net Expenses | | | | | 5,773,711 | |
| | |
Net Investment Income | | | | | 21,381,585 | |
| | |
Net Realized and Unrealized Gain (Loss) on Investments, Written Options and Foreign Currency Transactions | | | | | | |
Net realized gain (loss) on: | | | | | | |
Investments | | | | | (7,306,130 | ) |
Written options | | | | | 77,072 | |
Foreign currency transactions | | | | | (158,120 | ) |
Total Net Realized Loss | | | | | (7,387,178 | ) |
Net change in unrealized appreciation (depreciation) on: | | | | | | |
Investments | | | | | 4,898,955 | |
Written options | | | | | 116,893 | |
Foreign currency denominated assets and liabilities | | | | | (67,496 | ) |
Total Net Change in Unrealized Appreciation (Depreciation) | | | | | 4,948,352 | |
| | |
Net Loss on Investments, Written Options and Foreign Currency Transactions | | | | | (2,438,826 | ) |
| | |
Net Increase in Net Assets | | | | | $18,942,759 | |
See notes to financial statements.
| | |
| 10 | | CBRE CLARION GLOBAL REAL ESTATE INCOME FUND |
Statements of Changes in Net Assets
| | | | | | | | | | | | |
| | | | | For the
Six Months Ended
June 30, 2013
(unaudited) | | | | | For the
Year Ended
December 31, 2012 | |
Change in Net Assets Resulting from Operations | | | | | | | | | | | | |
| | | | |
Net investment income | | | | | $21,381,585 | | | | | | $38,558,659 | |
| | | | |
Net realized gain (loss) on investments, written options and foreign currency transactions | | | | | (7,387,178 | ) | | | | | 49,110,969 | |
| | | | |
Net change in unrealized appreciation (depreciation) on investments, written options and foreign currency denominated assets and liabilities | | | | | 4,948,352 | | | | | | 135,606,514 | |
| | | | |
Net increase in net assets resulting from operations | | | | | 18,942,759 | | | | | | 223,276,142 | |
| | | | |
Dividends and Distributions on Common Shares* | | | | | | | | | | | | |
| | | | |
Distribution of net investment income | | | | | (31,479,434 | ) | | | | | (67,855,667 | ) |
| | | | |
Net Increase (Decrease) in Net Assets | | | | | (12,536,675 | ) | | | | | 155,420,475 | |
| | | | |
Net Assets | | | | | | | | | | | | |
| | | | |
Beginning of period | | | | | 1,104,996,652 | | | | | | 949,576,177 | |
| | | | |
End of period (net of distributions in excess of net investment income of $90,965,734 and $80,867,885, respectively) | | | | | $1,092,459,977 | | | | | | $1,104,996,652 | |
| * | The final determination of the source of the 2013 distributions for tax purposes will be made after the Trust’s fiscal year. |
See notes to financial statements.
| | |
| SEMI-ANNUAL REPORT 2013 | | 11 |
Statement of Cash Flows (unaudited)
| | | | | | |
| | | | | For the
Six Months Ended
June 30, 2013 | |
| | |
Cash Flows from Operating Activities: | | | | | | |
| | |
Net increase in net assets resulting from operations | | | | | $18,942,759 | |
| | |
Adjustments to Reconcile Net Increase in Net Assets Resulting from Operations to Net Cash Provided by Operating Activities: | | | | | | |
| | |
Net change in unrealized appreciation/depreciation on investments | | | | | (4,898,955 | ) |
| | |
Net change in unrealized appreciation/depreciation on written options | | | | | (116,893 | ) |
| | |
Net realized gain on investments | | | | | 7,306,130 | |
| | |
Cost of securities purchased | | | | | (102,128,327 | ) |
| | |
Cost of options exercised | | | | | 173,356 | |
| | |
Proceeds from sale of securities | | | | | 72,645,851 | |
| | |
Premiums on written options | | | | | (110,608 | ) |
| | |
Increase in receivable for investment securities sold | | | | | (36,843,540 | ) |
| | |
Decrease in dividends and interest receivable | | | | | 747,732 | |
| | |
Increase in dividend withholding reclaims receivable | | | | | (51,515 | ) |
| | |
Increase in unrealized appreciation on spot contracts | | | | | (874 | ) |
| | |
Decrease in other assets | | | | | 33,301 | |
| | |
Increase in unrealized depreciation on spot contracts | | | | | 21,842 | |
| | |
Increase in payable for investment securities purchased | | | | | 100,522,326 | |
| | |
Increase in management fee payable | | | | | 13,657 | |
| | |
Increase in accrued expenses | | | | | 10,093 | |
| | |
Net Cash Provided by Operating Activities | | | | | 56,266,335 | |
| | |
Cash Flows From Financing Activities: | | | | | | |
| | |
Cash distributions paid on common shares | | | | | (31,479,434 | ) |
| | |
Proceeds from borrowing on line of credit | | | | | 47,259,200 | |
| | |
Payments on line of credit | | | | | (68,698,000 | ) |
| | |
Net Cash Used in Financing Activities | | | | | (52,918,234 | ) |
| | |
Net increase in cash | | | | | 3,348,101 | |
| | |
Cash and Cash Equivalents at Beginning of Period | | | | | 182,044 | |
| | |
Cash and Cash Equivalents at End of Period | | | | | $3,530,145 | |
| | |
Supplemental disclosure | | | | | | |
| | |
Interest paid on line of credit | | | | | $58,306 | |
See notes to financial statements.
| | |
| 12 | | CBRE CLARION GLOBAL REAL ESTATE INCOME FUND |
Financial Highlights
| | | | | | | | | | | | | | | | | | | | | | | | | | | | | | | | | | | | |
Per share operating performance for a
share outstanding throughout the period | | | | For the Six
Months Ended
June 30, 2013
(unaudited) | | | | | For the
Year Ended
December 31,
2012 | | | | | For the
Year Ended
December 31,
2011 | | | | | For the
Year Ended
December 31,
2010 | | | | | For the
Year Ended
December 31,
2009 | | | | | For the
Year Ended
December 31,
2008 | |
| | | | | | | | | | | | |
Net asset value, beginning of period | | | | | $9.48 | | | | | | $8.14 | | | | | | $8.58 | | | | | | $7.51 | | | | | | $5.63 | | | | | | $16.16 | |
Income from investment operations | | | | | | | | | | | | | | | | | | | | | | | | | | | | | | | | | | | | |
Net investment income (1) | | | | | 0.18 | | | | | | 0.33 | | | | | | 0.34 | | | | | | 0.36 | | | | | | 0.39 | | | | | | 1.11 | |
Net realized and unrealized gain (loss) on investments, written options, swap contracts and foreign currency transactions | | | | | (0.02 | ) | | | | | 1.59 | | | | | | (0.24 | ) | | | | | 1.25 | | | | | | 2.03 | | | | | | (10.15 | ) |
Dividends and distributions on Preferred Shares from net investment income (common stock equivalent basis) | | | | | — | | | | | | — | | | | | | — | | | | | | — | | | | | | — | | | | | | (0.25 | ) |
Total from investment operations | | | | | 0.16 | | | | | | 1.92 | | | | | | 0.10 | | | | | | 1.61 | | | | | | 2.42 | | | | | | (9.29 | ) |
Dividends and distributions on Common Shares | | | | | | | | | | | | | | | | | | | | | | | | | | | | | | | | | | | | |
Net investment income | | | | | (0.27 | ) | | | | | (0.58 | ) | | | | | (0.33 | ) | | | | | (0.54 | ) | | | | | (0.54 | ) | | | | | — | |
Capital gains | | | | | — | | | | | | — | | | | | | — | | | | | | — | | | | | | — | | | | | | (0.68 | ) |
Return of capital | | | | | — | | | | | | — | | | | | | (0.21 | ) | | | | | — | | | | | | — | | | | | | (0.56 | ) |
Total dividends and distributions to Common Shareholders | | | | | (0.27 | ) | | | | | (0.58 | ) | | | | | (0.54 | ) | | | | | (0.54 | ) | | | | | (0.54 | ) | | | | | (1.24 | ) |
Net asset value, end of period | | | | | $9.37 | | | | | | $9.48 | | | | | | $8.14 | | | | | | $8.58 | | | | | | $7.51 | | | | | | $5.63 | |
Market value, end of period | | | | | $9.02 | | | | | | $8.86 | | | | | | $6.84 | | | | | | $7.75 | | | | | | $6.37 | | | | | | $3.98 | |
Total investment return (2) | | | | | | | | | | | | | | | | | | | | | | | | | | | | | | | | | | | | |
Net asset value | | | | | 1.57 | % | | | | | 24.15 | % | | | | | 0.94 | % | | | | | 22.41 | % | | | | | 46.79 | % | | | | | (61.14 | )% |
Market value | | | | | 4.75 | % | | | | | 38.77 | % | | | | | (5.38 | )% | | | | | 31.06 | % | | | | | 79.09 | % | | | | | (67.38 | )% |
Ratios and supplemental data | | | | | | | | | | | | | | | | | | | | | | | | | | | | | | | | | | | | |
Net assets, applicable to Common Shares, end of period (thousands) | | | | | $1,092,460 | | | | | | $1,104,997 | | | | | | $949,576 | | | | | | $1,000,238 | | | | | | $875,448 | | | | | | $586,525 | |
Ratios to average net assets applicable to Common Shares of: | | | | | | | | | | | | | | | | | | | | | | | | | | | | | | | | | | | | |
Net expenses, after fee waiver + | | | | | 1.01 | % (3) | | | | | 0.99 | % | | | | | 1.03 | % | | | | | 0.94 | % | | | | | 1.14 | % | | | | | 1.28 | % |
Net expenses, before fee waiver + | | | | | 1.02 | % (3) | | | | | 1.05 | % | | | | | 1.14 | % | | | | | 1.11 | % | | | | | 1.38 | % | | | | | 1.67 | % |
Net expenses, after the fee waiver excluding interest on line of credit + | | | | | 1.00 | % (3) | | | | | 0.98 | % | | | | | 0.97 | % | | | | | 0.90 | % | | | | | 1.12 | % | | | | | 1.28 | % |
Net expenses, before fee waiver excluding interest on line of credit + | | | | | 1.02 | % (3) | | | | | 1.04 | % | | | | | 1.09 | % | | | | | 1.07 | % | | | | | 1.35 | % | | | | | 1.67 | % |
Net investment income, after preferred share dividends | | | | | 3.73 | % (3) | | | | | 3.68 | % | | | | | 3.98 | % | | | | | 4.60 | % | | | | | 6.75 | % | | | | | 7.10 | % |
Preferred share dividends | | | | | N/A | | | | | | N/A | | | | | | N/A | | | | | | N/A | | | | | | 0.04 | % | | | | | 2.08 | % |
Net investment income, before preferred share dividends + | | | | | 3.73 | % (3) | | | | | 3.68 | % | | | | | 3.98 | % | | | | | 4.60 | % | | | | | 6.79 | % | | | | | 9.18 | % |
Portfolio turnover rate | | | | | 5.72 | % | | | | | 14.42 | % | | | | | 1.53 | % | | | | | 12.91 | % | | | | | 28.04 | % | | | | | 7.32 | % |
Leverage analysis: | | | | | | | | | | | | | | | | | | | | | | | | | | | | | | | | | | | | |
Preferred shares, at redemption value, ($25,000 per share liquidation preference) (thousands) | | | | | N/A | | | | | | N/A | | | | | | N/A | | | | | | N/A | | | | | | N/A | | | | | | $370,000 | |
Net asset coverage per share of preferred shares | | | | | N/A | | | | | | N/A | | | | | | N/A | | | | | | N/A | | | | | | N/A | | | | | | $64,630 | |
| (1) | Based on average shares outstanding. |
| (2) | Total investment return does not reflect brokerage commissions. A return calculated for a period of less than one year is not annualized. Dividends and distributions are assumed to be reinvested at the prices obtained under the Trust’s Dividend Reinvestment Plan. Net Asset Value (“NAV”) total return is calculated assuming reinvestment of distributions at NAV on the date of the distribution. |
| + | Does not reflect the effects of dividends to Preferred Shareholders. |
See notes to financial statements.
| | |
| SEMI-ANNUAL REPORT 2013 | | 13 |
Notes to Financial Statements (unaudited)
CBRE Clarion Global Real Estate Income Fund (the “Trust”) is a diversified, closed-end management investment company that was organized as a Delaware statutory trust on November 6, 2003 under the Investment Company Act of 1940, as amended. CBRE Clarion Securities LLC (the “Advisor”) is the Trust’s investment advisor. The Advisor is a majority-owned subsidiary of CBRE Group, Inc. and is partially owned by its senior management team. The Trust commenced operations on February 18, 2004.
| 2. | Significant Accounting Policies |
The following accounting policies are in accordance with U.S. general accepted accounting principles (“GAAP”) and are consistently followed by the Trust.
Securities Valuation – The net asset value of the common shares of the Trust will be computed based upon the value of the Trust’s portfolio securities and other assets. The Trust calculates net asset value per common share by subtracting the Trust’s liabilities (including accrued expenses, dividends payable and any borrowings of the Trust) and the liquidation value of any outstanding preferred shares from the Trust’s total assets (the value of the securities the Trust holds, plus cash and/or other assets, including interest accrued but not yet received) and dividing the result by the total number of common shares of the Trust outstanding. Net asset value per common share will be determined as of the close of the regular trading session (usually 4:00 p.m., EST) on the New York Stock Exchange (“NYSE”) on each business day on which the NYSE is open for trading.
For purposes of determining the net asset value of the Trust, readily marketable portfolio assets traded principally on an exchange, or on a similar regulated market reporting contemporaneous transaction prices, are valued, except as indicated below, at the last sale price for such assets on such principal markets on the business day on which such value is being determined. If there has been no sale on such day, the securities are valued at the mean of the closing bid and asked prices on such day. Foreign securities are valued based upon quotations from the primary market in which they are traded and are translated from the local currency into U.S. dollars using current exchange rates. Securities and other assets for which market quotations are not readily available or for which the above valuation procedures are deemed not to reflect fair value are valued in a manner that is intended to reflect their fair value as determined in accordance with procedures approved by the Trust’s Board of Trustees (the “Board”).
Short-term securities which mature in more than 60 days are valued at current market quotations. Short-term securities, which mature in 60 days or less are valued at, amortized cost, which approximates market value.
GAAP provides guidance on fair value measurements. In accordance with the standard, fair value is defined as the price that the Trust would receive to sell an investment or pay to transfer a liability in a timely transaction with an independent buyer in the principal market, or in the absence of a principal market the most advantageous market for the investment or liability. It establishes a single definition of fair value, creates a three-tier hierarchy as a framework for measuring fair value based on inputs used to value the Trust’s investments, and requires additional disclosure about fair value. The hierarchy of inputs is summarized below:
| • | | Level 1 — unadjusted quoted prices in active markets for identical investments |
| • | | Level 2 — other significant observable inputs (including quoted prices for similar investments, interest rates, prepayment speeds, credit risk, etc.) |
| • | | Level 3 — significant unobservable inputs (including the Trust’s own assumptions in determining the fair value of investments) |
For Level 1 inputs, the Trust uses unadjusted quoted prices in active markets for assets or liabilities with sufficient frequency and volume to provide pricing information as the most reliable evidence of fair value.
The Trust’s Level 2 valuation techniques include inputs other than quoted prices within Level 1 that are observable for an asset or liability, either directly or indirectly. Level 2 observable inputs may include quoted prices for similar assets and liabilities in active markets or quoted prices for identical or similar assets or liabilities in markets that are not active in which there are few transactions, the prices are not current, or price quotations vary substantially over time or among market participants. Inputs that are observable for the asset or liability in Level 2 include such factors as interest rates, yield curves, prepayment speeds, credit risk, and default rates for similar liabilities.
For Level 3 valuation techniques, the Trust uses unobservable inputs that reflect assumptions market participants would be expected to use in pricing the asset or liability. Unobservable inputs are used to measure fair value to the extent that observable inputs are not available and are developed based on the best information available under the circumstances. In
| | |
| 14 | | CBRE CLARION GLOBAL REAL ESTATE INCOME FUND |
Notes to Financial Statements continued
developing unobservable inputs, market participant assumptions are used if they are reasonably available without undue cost and effort.
The inputs or methodology used for valuing securities are not necessarily an indication of the risk associated with investing in those securities. The following is a summary of the inputs used as of June 30, 2013 in valuing the Trust’s investments carried at fair value:
| | | | | | | | | | | | | | | | |
| | | Level 1 | | | Level 2 | | | Level 3 | | | Total | |
Investments in Real Estate Securities | | | | | | | | | | | | | | | | |
Common Stock | | | | | | | | | | | | | | | | |
| | | | |
Australia | | $ | 155,816,965 | | | $ | — | | | $ | — | | | $ | 155,816,965 | |
| | | | |
Canada | | | 110,056,357 | | | | — | | | | — | | | | 110,056,357 | |
| | | | |
France | | | 68,315,092 | | | | — | | | | — | | | | 68,315,092 | |
| | | | |
Germany | | | 9,549,811 | | | | — | | | | — | | | | 9,549,811 | |
| | | | |
Hong Kong | | | 43,839,042 | | | | — | | | | — | | | | 43,839,042 | |
| | | | |
Japan | | | 50,215,413 | | | | — | | | | — | | | | 50,215,413 | |
| | | | |
Netherlands | | | 34,825,122 | | | | — | | | | — | | | | 34,825,122 | |
| | | | |
New Zealand | | | 7,198,992 | | | | — | | | | — | | | | 7,198,992 | |
| | | | |
Singapore | | | 64,569,221 | | | | — | | | | — | | | | 64,569,221 | |
| | | | |
United Kingdom | | | 48,494,006 | | | | — | | | | — | | | | 48,494,006 | |
| | | | |
United States | | | 427,923,901 | | | | — | | | | 14,883,338 | | | | 442,807,239 | |
| | | | |
Total Common Stock | | | 1,020,803,922 | | | | — | | | | 14,883,338 | | | | 1,035,687,260 | |
Preferred Stock | | | | | | | | | | | | | | | | |
| | | | |
United States | | | 111,347,613 | | | | — | | | | — | | | | 111,347,613 | |
| | | | |
Total Investments in Real Estate Securities | | $ | 1,132,151,535 | | | $ | — | | | $ | 14,883,338 | | | $ | 1,147,034,873 | |
The primary third party pricing vendor for the Trust’s listed preferred stock investments is FT Interactive Data (“IDC”). When available, the Trust will obtain a closing exchange price to value the preferred stock investments and, in such instances, the investment will be classified as Level 1 since an unadjusted quoted price was utilized. When a closing price is not available for the listed preferred stock investments, IDC will produce an evaluated mean price (midpoint between the bid and the ask evaluation) and such investments will be classified as Level 2 since other observable inputs were used in the valuation. Factors used in the IDC evaluation include trading activity, the presence of a two-sided market, and other relevant market data.
The Trust’s policy is to recognize transfers in and transfers out at the fair value as of the beginning of the period. The portfolio may hold securities which are periodically fair valued in accordance with the Trust’s fair value procedures. This may result in movements between Levels 1, 2 and 3 throughout the period. The fair value of Level 2 and Level 1 investments at
December 31, 2012 was $1,560,345 and $1,098,780,927, respectively. There were no transfers during the period. Pursuant to the Trust’s fair value procedures noted previously, equity securities (including exchange traded securities and open-end regulated investment companies) exchange traded derivatives (i.e. futures contracts and options) are generally categorized as Level 1 securities in the fair value hierarchy. Fixed income securities, non-exchange traded derivatives and money market instruments are generally categorized as Level 2 securities in the fair value hierarchy. Investments for which there are no such quotations, or for which quotations do not appear reliable, are valued at fair value as determined in accordance with procedures established by and under the general supervision of the Trustees. These valuations are typically categorized as Level 2 or Level 3 securities in the fair value hierarchy.
The Trust has one investment in a private equity security which is classified as Level 3 because no market quotations are readily available. In determining the fair value of this investment, the following factors may be evaluated: balance sheet, income statement, the portfolio of real estate investments held, economic factors and conditions in which the company operates, and comparable public company valuations and trading prices.
The following is a reconciliation of assets in which significant unobservable inputs (Level 3) were used in determining fair value:
| | | | |
| | | United States
Common Stock | |
Balance as of December 31, 2012 | | $ | 19,791,655 | |
| |
Realized gain (loss) | | | (13,637,098 | ) |
| |
Change in unrealized appreciation (depreciation) | | | 13,591,643 | |
| |
Purchases | | | 5,000,000 | |
| |
Sales | | | (9,862,862 | ) |
| |
Transfers in and/or out of Level 3 | | | — | |
Balance as of June 30, 2013 | | $ | 14,883,338 | |
For the six months ended June 30, 2013, there have been no significant changes to the Trust’s fair valuation methodology.
Derivatives and Hedging Disclosure – Codification Topic 815 (“ASC 815”), Derivatives and Hedging, requires qualitative disclosures about objectives and strategies for using derivatives, quantitative disclosures about fair value amounts of gains and losses on derivative instruments, and disclosures about credit-risk related contingent features in derivative agreements. The Trust has invested in derivatives, specifically written options for the six months ended June 30, 2013 which are detailed in the
| | |
| SEMI-ANNUAL REPORT 2013 | | 15 |
Notes to Financial Statements continued
table herein. The Trust’s derivative agreements contain credit-risk related contingent features which include, but are not limited to, a percentage decline in the Trust’s NAV or net assets over a specified time period. If an event occurred that triggered a contingent feature, the counterparty to the agreement may require the Trust to post additional collateral or terminate the derivative positions and demand payment. Any collateral posted with respect to the derivative positions would be used to offset or reduce the payment. The maximum exposure to derivatives agreements with credit-risk related contingent features would be the total value of derivatives in net liability positions for the Trust.
The Trust has invested in derivatives, specifically written options for the six months ended June 30, 2013, which are detailed in the table herein. The derivative instruments disclosed and described herein are subject to credit risk. Credit risk is where the financial condition of an issuer of a security or instrument may cause it to default or become unable to pay interest or principal due on the security. The counterparty to a derivative contract might default on its obligations. The effect of such derivative instruments on the Trust’s financial position and financial performance as reflected in the Statement of Assets and Liabilities and Statement of Operations are presented in the summary below.
| | | | | | | | | | | | | | |
Derivatives not
designated as hedging instruments,
carried at fair value | | Asset Derivatives | | | | | Liability Derivatives | |
| | Balance
Sheet Location | | Fair Value | | | | | Balance
Sheet Location | | Fair Value | |
| | | | | |
Equity contracts | | | | $ | — | | | | | Written options | | $ | — | |
Gain or (loss) associated with derivatives outstanding throughout the six months ended June 30, 2013 is as follows:
| | | | |
| Amount of Realized Gain on Derivatives Recognized in Income | |
| Derivatives not designated as hedging instruments, carried at fair value | | Written Options | |
| |
Equity contracts | | $ | 77,072 | |
|
| Change in Unrealized Appreciation on Derivatives Recognized in Income | |
| Derivatives not designated as hedging instruments, carried at fair value | | Written Options | |
| |
Equity contracts | | $ | 116,893 | |
For the six months ended, the Trust’s average premiums received for written options was $36,869.
Foreign Currency Translation – The books and records of the Trust are maintained in U.S. dollars. Foreign currency amounts are translated into U.S. dollars on the following basis:
| (i) | market value of investment securities, other assets and liabilities – at the current rates of exchange; |
| (ii) | purchases and sales of investment securities, income and expenses – at the rate of exchange prevailing on the respective dates of such transactions. |
Although the net assets of the Trust are presented at the foreign exchange rates and market values at the close of each fiscal period, the Trust does not isolate that portion of the results of operations arising as a result of changes in the foreign exchange rates from the fluctuations arising from changes in the market prices of long-term securities held at the end of the fiscal period. Similarly, the Trust does not isolate the effect of changes in foreign exchange rates from the fluctuations arising from changes in the market prices of portfolio securities sold during the fiscal period. Accordingly, realized foreign currency gains or losses will be included in the reported net realized gains or losses on investment transactions.
Net realized gains or losses on foreign currency transactions represent net foreign exchange gains or losses from the holding of foreign currencies, currency gains or losses realized between the trade date and settlement date on securities transactions, and the difference between the amounts of dividends, interest and foreign withholding taxes recorded on the Trust’s books and the U.S. dollar equivalent amounts actually received or paid. Net unrealized currency gains or losses from valuing foreign currency denominated assets or liabilities (other than investments) at period end exchange rates are reflected as a component of net unrealized appreciation or depreciation on investments and foreign currencies.
Foreign security and currency transactions may involve certain considerations and risks not typically associated with those of domestic origin as a result of, among other factors, the possibility of political or economic instability, or the level of governmental supervision and regulation of foreign securities markets.
Forward Exchange Currency Contracts – The Trust may enter into forward exchange currency contracts in order to hedge its exposure to changes in foreign currency exchange rates on its foreign portfolio holdings, to hedge certain Trust purchase and sales commitments denominated in foreign currencies and for investment purposes. A forward exchange currency contract is a commitment to purchase or sell a foreign currency on a future date at a negotiated forward rate. The gain or loss arising from the difference between the original contracts and the closing of such contracts would be included in net realized gain or loss on foreign currency transactions.
Fluctuations in the value of open forward exchange currency contracts are recorded for financial reporting purposes as unrealized appreciation and depreciation by the Trust.
| | |
| 16 | | CBRE CLARION GLOBAL REAL ESTATE INCOME FUND |
Notes to Financial Statements continued
The Trust’s custodian will place and maintain cash not available for investment or other liquid assets in a separate account of the Trust having a value at least equal to the aggregate amount of the Trust’s commitments under forward exchange currency contracts entered into with respect to position hedges.
Risks may arise from the potential inability of a counterparty to meet the terms of a contract and from unanticipated movements in the value of a foreign currency relative to the U.S. dollar. The face or contract amount, in U.S. dollars, reflects the total exposure the Trust has in that particular currency contract. As of June 30, 2013, the Trust did not hold any forward exchange currency contracts.
Options – The Fund may purchase or sell (write) options on securities and securities indices which are listed on a national securities exchange or in the over-the-counter (“OTC”) market as a means of achieving additional return or of hedging the value of the Trust’s portfolio.
An option on a security is a contract that gives the holder of the option, in return for a premium, the right to buy from (in the case of a call) or sell to (in the case of a put) the writer of the option the security underlying the option at a specified exercise or “strike” price. The writer of an option on a security has an obligation upon exercise of the option to deliver the underlying security upon payment of the exercise price (in the case of a call) or to pay the exercise price upon delivery of the underlying security (in the case of a put).
There are several risks associated with transactions in options on securities. As the writer of a covered call option, the Trust forgoes, during the option’s life, the opportunity to profit from increases in the market value of the security covering the call option above the sum of the premium and the strike price of the call but has retained the risk of loss should the price of the underlying security decline. The writer of an option has no control over the time when it may be required to fill its obligation as writer of the option. Once an option writer has received an exercise notice, it cannot effect a closing purchase transaction in order to terminate its obligation under the option and must deliver the underlying security at the exercise price.
Transactions in written options during the six months ended June 30, 2013 were as follows:
| | | | | | | | |
| | | Number
of Contracts | | | Premiums
Received | |
Options outstanding, beginning of period | | | 2,000 | | | $ | 110,607 | |
Options closed during the period | | | (2,650 | ) | | | (120,597 | ) |
Options exercised during the period | | | (2,000 | ) | | | (173,356 | ) |
Options written during the period | | | 2,650 | | | | 183,346 | |
Options outstanding, end of period | | | — | | | $ | — | |
Securities Transactions and Investment Income – Securities transactions are recorded on a trade date basis. Realized gains and losses from securities transactions are recorded on the basis of identified cost. Dividend income is recorded on the ex-dividend date. Distributions received from investments in REITs are recorded as dividend income on ex-dividend date, subject to reclassification upon notice of the character of such distributions by the issuer. The portion of dividend attributable to the return of capital is recorded against the cost basis of the security. Withholding taxes on foreign dividends are recorded net of reclaimable amounts, at the time the related income is earned. Non-cash dividends included in dividend income, if any, are recorded at the fair market value of the securities received. Interest income, including accretion of original issue discount, where applicable, and accretion of discount on short-term investments, is recorded on the accrual basis. Realized gains and losses from securities transactions are recorded on the basis of identified cost.
Dividends and Distributions to Shareholders – Dividends from net investment income, if any, are declared and paid on a monthly basis. Income dividends and capital gain distributions to common shareholders are recorded on the ex-dividend date. To the extent the Trust’s net realized capital gains, if any, can be offset by capital loss carryforwards, it is the policy of the Trust not to distribute such gains.
On August 5, 2008, the Trust acting in accordance with an exemptive order received from the Securities and Exchange Commission and with approval of the Board, adopted a managed distribution policy under which the Trust intends to make regular monthly cash distributions to common shareholders, stated in terms of a fixed amount per common share. With this policy the Trust can include long-term capital gains in its distribution as frequently as twelve times a year. In practice, the Board views their approval of this policy as a potential means of further supporting the market price of the Trust through the payment of a steady and predictable level of cash distributions to shareholders.
The current monthly distribution rate is $0.045 per share. The Trust continues to evaluate its monthly distribution policy in light of ongoing economic and market conditions and may change the amount of the monthly distributions in the future.
Use of Estimates – The preparation of financial statements, in conformity with GAAP, requires management to make estimates and assumptions that affect the reported amounts of assets and liabilities at the date of the financial statements and the reported amounts of expenses during the reporting period. Actual results could differ from those estimates.
| | |
| SEMI-ANNUAL REPORT 2013 | | 17 |
Notes to Financial Statements continued
Under normal market conditions, the Trust’s investments will be concentrated in income-producing common equity securities, preferred securities, convertible securities and non-convertible debt securities issued by companies deriving the majority of their revenue from the ownership, construction, financing, management and/or sale of commercial, industrial, and/or residential real estate. Values of the securities of such companies may fluctuate due to economic, legal, cultural, geopolitical or technological developments affecting various global real estate industries.
| 4. | Investment Management Agreement and Other Agreements |
Pursuant to an investment management agreement between the Advisor and the Trust, the Advisor is responsible for the daily management of the Trust’s portfolio of investments, which includes buying and selling securities for the Trust, as well as investment research. The Trust pays for investment advisory services and facilities through a fee payable monthly in arrears at an annual rate equal to 0.85% of the average daily value of the Trust’s managed assets plus certain direct and allocated expenses of the Advisor incurred on the Trust’s behalf. The Advisor has agreed to waive a portion of its management fee in the amount of 0.25% of the average daily values of the Trust’s managed assets for the first five years of the Trust’s operations (through February, 2009), and for a declining amount for an additional four years (through February, 2013). During the six months ended June 30, 2013, the Trust incurred management fees of $4,818,485 which are net of $92,484 in management fees waived by the Advisor.
The Trust has multiple service agreements with The Bank of New York Mellon (“BNYM”). Under the servicing agreements, BNYM will perform custodial, fund accounting, certain administrative services, and transfer agency services for the Trust. As custodian, BNYM is responsible for the custody of the Trust’s assets. As administrator, BNYM is responsible for maintaining the books and records of the Trust’s securities and cash. As transfer agent, BNYM is responsible for performing transfer agency services for the Trust.
For the six months ended June 30, 2013, there were purchases and sales transactions (excluding short-term securities and options) of $102,128,327 and $72,645,851, respectively.
The Trust intends to elect to be, and qualify for treatment as, a regulated investment company under Subchapter M of the
Internal Revenue Code of 1986, as amended (the “Code”). A regulated investment company generally pays no federal income tax on the income and gains that it distributes. The Trust intends to meet the calendar year distribution requirements imposed by the Code to avoid the imposition of a 4% excise tax.
The Trust is required to evaluate tax positions taken or expected to be taken in the course of preparing the Trust’s tax returns to determine whether the tax positions are “more-likely-than-not” of being sustained by the applicable tax authority. Income tax and related interest and penalties would be recognized by the Trust as tax expense in the Statement of Operations if the tax positions were deemed to not meet the more-likely-than-not threshold. For the six months ended June 30, 2013, the Trust did not incur any income tax, interest, or penalties. As of June 30, 2013, the Advisor has reviewed all open tax years and concluded that there was no impact to the Trust’s net assets or results of operations. Tax years ended December 31, 2009, through December 31, 2012, remain subject to examination by the Internal Revenue Service and state taxing authorities. On an ongoing basis, the Advisor will monitor its tax positions to determine if adjustments to this conclusion are necessary.
The Trust distinguishes between dividends on a tax basis and on a financial reporting basis and only distributions in excess of tax basis earnings and profits are reported in the financial statements as a tax return of capital. Differences in the recognition or classification of income between the financial statements and tax earnings and profits which result in temporary over-distributions for financial statement purposes are classified as distributions in excess of net investment income or accumulated net realized losses in the components of net assets on the Statement of Assets and Liabilities.
In order to present paid-in capital in excess of par and accumulated net realized gains or losses on the Statement of Assets and Liabilities that more closely represent their tax character, certain adjustments have been made to additional paid-in capital, undistributed net investment income and accumulated net realized gains or losses on investments. For the year ended December 31, 2012, the adjustments were to increase additional paid-in capital by $85,481 increase accumulated net realized loss on investments by $3,827,043 and decrease distributions in excess of net investment income by $3,912,524 due to the difference in the treatment for book and tax purposes of certain investments. Results of operations and net assets were not affected by these reclassifications.
At December 31, 2012, the Trust had capital loss carryforwards which will reduce the Trust’s taxable income arising from future net realized gain on investments, if any, to
| | |
| 18 | | CBRE CLARION GLOBAL REAL ESTATE INCOME FUND |
Notes to Financial Statements concluded
the extent permitted by the code and thus will reduce the amount of distributions to shareholders which would otherwise be necessary to relieve the Trust of any liability for federal income tax. Pursuant to the code, such capital loss carryforwards, if unused, will expire, $15,851,894, $333,092,227 and $26,711,743 in 2016, 2017 and 2018, respectively.
The Regulated Investment Company Modernization Act of 2010 (the “Act”) eliminated the eight-year carryover period for capital losses that arise in taxable years beginning after its enactment date of December 22, 2010. Consequently, these capital losses can be carried forward for an unlimited period. However, capital losses with an expiration period may not be used to offset capital gains until all net capital losses without an expiration date have been utilized. Additionally, post-enactment capital loss carryovers will retain their character as either short-term or long-term capital losses instead of as short-term capital losses as under prior law. The Trust does not have capital losses with no expiration.
The final determination of the source of the 2013 distributions for tax purposes will be made after the end of the Trust’s fiscal year and will be reported to shareholders in February 2014 on Form 1099-DIV.
For the year ended December 31, 2012, the tax character of distributions paid, as reflected in the Statements of Changes in Net Assets, was $67,855,667 of ordinary income.
Information on the components of net assets as of June 30, 2013 is as follows:
| | | | | | |
Cost of
Investments | | Gross
Unrealized
Appreciation | | Gross
Unrealized
Depreciation | | Net
Unrealized
Appreciation
on Investments |
| $943,966,692 | | $265,111,427 | | $(62,043,246) | | $203,068,181 |
The Trust has access to a secured line of credit up to $300,000,000 from BNYM for borrowing purposes. Borrowings under this arrangement bear interest at the Federal funds rate plus 75 basis points. At June 30, 2013, there were no borrowings on the Trust’s line of credit.
The average daily amount of borrowings during the six months ended June 30, 2013 was $12,820,690 with a related weighted average interest rate of 0.91%. The maximum amount outstanding for the six months ended June 30, 2013, was $31,125,600. The Trust had borrowings under the line of credit for 126 days during 2013.
During 2004, the Trust issued 101,000,000 shares of common stock at $15.00. In connection with the Trust’s Dividend Reinvestment Plan, the Trust issued no common shares for the six months ended June 30, 2013 and year ended 2012, respectively. At June 30, 2013, the Trust had outstanding common shares of 116,590,494 with a par value of $0.001 per share. The Advisor owned 12,741 shares of the common shares outstanding.
At June 30, 2013, the Trust had no shares of auction rate preferred securities outstanding.
The Trust enters into contracts that contain a variety of indemnifications. The Trust’s exposure under these arrangements is unknown. However, the Trust has not had prior claims or losses or current claims or losses pursuant to these contracts.
Events or transactions that occur after the balance sheet date but before the financial statements are issued are categorized as recognized or non-recognized for financial statement purposes. The Advisor has evaluated subsequent events and has determined there were no events that required recognition or disclosure in the Trust’s financial statements, other than as noted below.
| | |
| SEMI-ANNUAL REPORT 2013 | | 19 |
Supplemental Information (unaudited)
Trustees
The Trustees of the CBRE Clarion Global Real Estate Income Fund and their principal occupations during the past five years:
| | | | | | | | | | |
Name, Address and Age | | Term of Office and
Length of Time
Served (1) | | Title | | Principal Occupations
During The Past Five Years | | Number of
Portfolios in
the Fund
Complex
Overseen
by Trustee | | Other
Directorships
Held by
Trustee |
| Interested Trustees: | | | | | | | | | | |
T. Ritson Ferguson* 201 King of Prussia
Road, Suite 600 Radnor, PA 19087 Age: 54 | | 3 years/
since inception | | Trustee, President and Chief Executive Officer | | Chief Executive Officer and
Co-Chief Investment Officer
of CBRE Clarion Securities LLC | | 1 | | |
Asuka Nakahara 201 King of Prussia
Road, Suite 600 Radnor, PA 19087 Age: 57 | | 3 years/
since inception | | Trustee | | Associate Director of the Zell-Lurie Real Estate Center at the Wharton School, University of Pennsylvania (since 1999); Lecturer of Real Estate at the Wharton School, University of Pennsylvania (since 1999); Partner of Triton Atlantic Partners (since 2009). | | 1 | | |
Frederick S. Hammer 201 King of Prussia
Road, Suite 600 Radnor, PA 19087 Age: 77 | | 3 years/
since inception | | Trustee | | Co-Chairman of Inter-Atlantic Group (since 1994) and a member of its investment committee. | | 1 | | Serves on the Boards of Universal Business Payment Solutions Corp. (since 2011); Inter-Atlantic Financial, Inc. (2007 - 2011); E-Duction, Inc. (2005 - 2008), Avalon Insurance Holdings, Inc. (2006 - 2009) and Homeowners Insurance Corp. (since 2006); Director of US Fiduciary Corp. (2006 - 2009); Chairman of the Board of Annuity and Life Re (Holdings), Ltd. (1998 - 2005). |
Richard L. Sutton 201 King of Prussia
Road, Suite 600 Radnor, PA 19087 Age: 78 | | 3 years/
since inception | | Trustee | | Partner, Morris, Nichols, Arsht & Tunnel (1966 - 2000). | | 1
| | Board of Directors of Investors in Global Real Estate Ltd. (since 2006). |
| | |
| 20 | | CBRE CLARION GLOBAL REAL ESTATE INCOME FUND |
Supplemental Information(unaudited) continued
| | | | | | | | | | |
Name, Address and Age | | Term of Office and
Length of Time
Served (1) | | Title | | Principal Occupations
During The Past Five Years | | Number of
Portfolios in
the Fund
Complex
Overseen
by Trustee | | Other
Directorships
Held by
Trustee |
| Interested Trustees: | | | | | | | | | | |
John R. Bartholdson 201 King of Prussia
Road, Suite 600 Radnor, PA 19087 Age: 68 | | 3 years/
10 years | | Trustee/Audit Committee Financial Expert | | Senior Vice President, CFO and Treasurer, and a Director of Triumph Group, Inc. (1993 -2007). | | 1
| | Board of Old Mutual Advisor Funds, Old Mutual Funds II and Old Mutual Insurance Series Fund (2004 - 2012), and Old Mutual Funds III (2008 - 2009), The Berwyn Fund (since 2013), The Berwyn Income Fund (since 2013), and The Berwyn Cornerstone Fund (since 2013). |
| (1) | After a Trustee’s initial term, each Trustee is expected to serve a three-year term concurrent with the class of Trustees for which he serves. Messrs. Ferguson and Hammer, as Class I Trustees, are expected to stand for re-election at the Trust’s 2014 annual meeting of shareholders; Mr. Nakahara, as Class II Trustee, is expected to stand for re-election at the Trust’s 2015 annual meeting of shareholders; Messrs. Sutton and Bartholdson, as Class III Trustees, are expected to stand for re-election at the Trust’s 2013 annual meeting of shareholders. |
| * | Mr. Ferguson is deemed to be an interested person of the Trust as defined in the Investment Company Act of 1940 (the “1940 ACT”), as amended, due to his position with the Advisor. |
| | |
| SEMI-ANNUAL REPORT 2013 | | 21 |
Supplemental Information(unaudited) continued
Officers
The Officers of the CBRE Clarion Global Real Estate Income Fund and their principal occupations during the past five years:
| | | | |
Name, Address, Age
and Position(s) Held
with Registrant | | Length of Time
Served | | Principal Occupations During
the Past Five Years and
Other Affiliations |
| Officers: | | | | |
Jonathan A. Blome 201 King of Prussia Road, Suite 600 Radnor, PA 19087 Age: 36 Chief Financial Officer | | since 2006 | | Chief Financial Officer and Director of Operations of CBRE Clarion Securities LLC (since 2011); Director and Head of Operations of CBRE Clarion Securities LLC (since 2010); Senior Vice President of CBRE Clarion Securities LLC (2005 - 2010). |
William E. Zitelli 201 King of Prussia Road, Suite 600 Radnor, PA 19087 Age: 45 Chief Compliance Officer and Secretary | | since 2007 | | General Counsel of CBRE Clarion Securities LLC (since 2007), Chief Compliance Officer of CBRE Clarion Securities LLC (2007 - 2010). |
| | |
| 22 | | CBRE CLARION GLOBAL REAL ESTATE INCOME FUND |
Supplemental Information(unaudited) concluded
Additional Information
Statement of Additional Information includes additional information regarding the Trustees. This information is available upon request, without charge, by calling the following toll-free telephone number: 1-888-711-4272.
The Trust has delegated the voting of the Trust’s voting securities to the Trust’s advisor pursuant to the proxy voting policies and procedures of the advisor. You may obtain a copy of these policies and procedures by calling 1-888-711-4272. The policies may also be found on the website of the Securities and Exchange Commission (http://www.sec.gov).
Information regarding how the Trust voted proxies for portfolio securities, if applicable, during the most recent 12-month period ended June 30, is also available, without charge and upon request by calling the Trust at 1-888-711-4272 or by accessing the Trust’s Form N-PX on the Commission’s website at http://www.sec.gov.
The Trust files its complete schedule of portfolio holdings with the Securities and Exchange Commission for the first and third quarters of each fiscal year on Form N-Q. The Trust’s Form N-Qs are available on the SEC website at http://www.sec.gov. The Trust’s Form N-Qs may also be viewed and copied at the Commission’s Public Reference Room in Washington, DC; information on the operation of the Public Reference Room may be obtained by calling (800) SEC-0330.
Dividend Reinvestment Plan (unaudited)
Pursuant to the Trust’s Dividend Reinvestment Plan (the “Plan”), shareholders of the Trust are automatically enrolled, to have all distributions of dividends and capital gains reinvested by The Bank of New York Mellon (the “Plan Agent”) in the Trust’s shares pursuant to the Plan. You may elect not to participate in the Plan and to receive all dividends in cash by sending written instructions or by contacting The Bank of New York Mellon, as dividend disbursing agent, at the address set forth below. Participation in the Plan is completely voluntary and may be terminated or resumed at any time without penalty by contacting the Plan Agent before the dividend record date; otherwise such termination or resumption will be effective with respect to any subsequently declared dividend or other distribution. Shareholders who do not participate in the Plan will receive all distributions in cash paid by check and mailed directly to the shareholders of record (or if the shares are held in street or other nominee name, then to the nominee) by the Plan Agent, which serves as agent for the shareholders in administering the Plan.
After the Trust declares a dividend or determines to make a capital gain distribution, the Plan Agent will acquire shares for the participants’ account, depending upon the circumstances described below, either (i) through receipt of unissued but authorized shares from the Trust (“newly issued shares”) or (ii) by open market purchases. If, on the dividend payment date, the NAV is equal to or less than the market price per share plus estimated brokerage commissions (such condition being referred to herein as “market premium”), the Plan Agent will invest the dividend amount in newly issued shares on behalf of the participants. The number of newly issued shares to be credited to each participant’s account will be determined by dividing the dollar amount of the dividend by the NAV on the date the shares are issued. However, if the NAV is less than 95% of the market price on the payment date, the dollar amount of the dividend will be divided by 95% of the market price on the payment date. If, on the dividend payment date, the NAV is greater than the market value per share plus estimated brokerage commissions (such condition being referred to herein as “market discount”), the Plan Agent will invest the dividend amount in shares acquired on behalf of the participants in open-market purchases.
The Plan Agent’s fees for the handling of the reinvestment of dividends and distributions will be paid by the Trust. However, each participant will pay a pro rata share of brokerage commissions incurred with respect to the Plan Agent’s open market purchases in connection with the reinvestment of dividends and distributions. The automatic reinvestment of dividends and distributions will not relieve participants of any Federal income tax that may be payable on such dividends or distributions.
The Trust reserves the right to amend or terminate the Plan. There is no direct service charge to participants in the Plan; however, the Trust reserves the right to amend the Plan to include a service charge payable by the participants. Participants that request a sale of shares through the Plan Agent are subject to a $2.50 sales fee and a $0.15 per share sold brokerage commission. All correspondence concerning the Plan should be directed to the Plan Agent at Computershare, P.O. Box 43006, Providence, RI 02940-3006, Phone Number: (866) 221-1580.
| | |
| SEMI-ANNUAL REPORT 2013 | | 23 |
CBRE CLARION GLOBAL REAL ESTATE INCOME FUND
BOARD OF TRUSTEES
T. RITSON FERGUSON
ASUKA NAKAHARA
FREDERICK S. HAMMER
RICHARD L. SUTTON
JOHN R. BARTHOLDSON
OFFICERS
T. RITSON FERGUSON
PRESIDENT AND
CHIEF EXECUTIVE OFFICER
JONATHAN A. BLOME
CHIEF FINANCIAL OFFICER
WILLIAM E. ZITELLI
CHIEF COMPLIANCE OFFICER
AND SECRETARY
INVESTMENT ADVISOR
CBRE CLARION SECURITIES LLC
201 KING OF PRUSSIA ROAD, SUITE 600
RADNOR, PA 19087
888-711-4272
ADMINISTRATOR AND CUSTODIAN
THE BANK OF NEW YORK MELLON
NEW YORK, NEW YORK
TRANSFER AGENT
COMPUTERSHARE
JERSEY CITY, NEW JERSEY
LEGAL COUNSEL
BINGHAM MCCUTCHEN LLP
WASHINGTON, DC
INDEPENDENT REGISTERED PUBLIC ACCOUNTING FIRM
ERNST & YOUNG LLP
PHILADELPHIA, PENNSYLVANIA
Not applicable for semi-annual reporting period.
| Item 3. | Audit Committee Financial Expert. |
Not applicable for semi-annual reporting period.
| Item 4. | Principal Accountant Fees and Services. |
Not applicable for semi-annual reporting period.
| Item 5. | Audit Committee of Listed Registrants. |
Not applicable for semi-annual reporting period.
(a) The schedule of investments is included as part of the report to shareholders filed under Item 1 of this form.
(b) Not applicable.
| Item 7. | Disclosure of Proxy Voting Policies and Procedures for Closed-End Management Investment Companies. |
Not applicable for semi-annual reporting period.
| Item 8. | Portfolio Managers of Closed-End Management Investment Companies. |
Not applicable for semi-annual reporting period.
| Item 9. | Purchases of Equity Securities by Closed-End Management Investment Company and Affiliated Purchasers. |
None.
| Item 10. | Submission of Matters to a Vote of Security Holders. |
Not applicable.
| Item 11. | Controls and Procedures. |
(a) The Trust’s principal executive officer and principal financial officer have evaluated the Trust’s disclosure controls and procedures within 90 days of this filing and have concluded that the Trust’s disclosure controls and procedures were effective, as of that date, in ensuring that information required to be disclosed by the Trust in this Form N-CSR was recorded, processed, summarized, and reported timely.
(b) The Trust’s principal executive officer and principal financial officer are aware of no changes in the Trust’s internal control over financial reporting that occurred during the Trust’s second fiscal quarter of the period covered by this report that has materially affected, or is reasonably likely to materially affect, the Trust’s internal control over financial reporting.
| | |
| (a)(1) | | Not applicable. |
| |
| (a)(2) | | Certification of chief executive officer and chief financial officer pursuant to Section 302 of the Sarbanes-Oxley Act of 2002. |
| |
| (b) | | Certification of chief executive officer and chief financial officer pursuant to Section 906 of the Sarbanes-Oxley Act of 2002. |
| |
| (c) | | Notices to Trust’s common shareholders in accordance with Investment Company Act Section 19(a) and Rule 19a-1.(1) |
| (1) | The Trust has received exemptive relief from the Securities and Exchange Commission permitting it to make periodic distributions of long-term capital gains with respect to its outstanding common stock as frequently as twelve times each year. This relief is conditioned, in part, on an undertaking by the Trust to make the disclosures to the holders of the Trust’s common shares, in addition to the information required by Section 19(a) of the Investment Company Act and Rule 19a-1 thereunder. The Trust is likewise obligated to file with the Commission the information contained in any such notice to shareholders and, in that regard, has attached hereto copies of each such notice made during the period. |
SIGNATURES
Pursuant to the requirements of the Securities Exchange Act of 1934 and the Investment Company Act of 1940, the registrant has duly caused this report to be signed on its behalf by the undersigned, thereunto duly authorized.
(Registrant) CBRE Clarion Global Real Estate Income Fund
| | |
| By: | | /s/ T. Ritson Ferguson |
| Name: | | T. Ritson Ferguson |
| Title: | | President and Chief Executive Officer |
| Date: | | August 28, 2013 |
Pursuant to the requirements of the Securities Exchange Act of 1934 and the Investment Company Act of 1940, this report has been signed by the following persons on behalf of the registrant and in the capacities and on the dates indicated.
| | |
| By: | | /s/ T. Ritson Ferguson |
| Name: | | T. Ritson Ferguson |
| Title: | | President and Chief Executive Officer |
| Date: | | August 28, 2013 |
| |
| By: | | /s/ Jonathan A. Blome |
| Name: | | Jonathan A. Blome |
| Title: | | Chief Financial Officer |
| Date: | | August 28, 2013 |