Table of Contents
UNITED STATES
SECURITIES AND EXCHANGE COMMISSION
Washington, D.C. 20549
FORMN-CSR
CERTIFIED SHAREHOLDER REPORT OF REGISTERED
MANAGEMENT INVESTMENT COMPANIES
Investment Company Act file number811-21465
CBRE Clarion Global Real Estate Income Fund
(Exact name of registrant as specified in charter)
201 King of Prussia Road, Suite 600
Radnor, PA 19087
(Address of principal executive offices) (Zip code)
T. Ritson Ferguson, President and Chief Executive Officer
CBRE Clarion Global Real Estate Income Fund
201 King of Prussia Road, Suite 600
Radnor, PA 19087
(Name and address of agent for service)
Registrant’s telephone number, including area code:1-877-711-4272
Date of fiscal year end: December 31
Date of reporting period: December 31, 2019
FormN-CSR is to be used by management investment companies to file reports with the Commission not later than 10 days after the transmission to stockholders of any report that is required to be transmitted to stockholders under Rule30e-1 under the Investment Company Act of 1940 (17 CFR270.30e-1). The Commission may use the information provided on FormN-CSR in its regulatory, disclosure review, inspection, and policymaking roles.
A registrant is required to disclose the information specified by FormN-CSR, and the Commission will make this information public. A registrant is not required to respond to the collection of information contained in FormN-CSR unless the Form displays a currently valid Office of Management and Budget (“OMB”) control number. Please direct comments concerning the accuracy of the information collection burden estimate and any suggestions for reducing the burden to Secretary, Securities and Exchange Commission, 450 Fifth Street, NW, Washington, DC 20549-0609. The OMB has reviewed this collection of information under the clearance requirements of 44 U.S.C. § 3507.
Table of Contents
| Item 1. | Reports to Stockholders. |
The Report to Shareholders of CBRE Clarion Global Real Estate Income Fund (the “Trust”) is attached herewith.
Table of Contents

CBRE CLARION GLOBAL REAL ESTATE
INCOME FUND
Annual Report for the Year Ended December 31, 2019

Table of Contents
CBRE Clarion Global Real Estate Income Fund (the “Trust”), acting in accordance with an exemptive order received from the Securities and Exchange Commission and with approval of its Board of Trustees (the “Board”), has adopted a managed distribution policy with the purpose of distributing over the course of each year, through periodic distributions as nearly equal as practicable and any required special distributions, an amount closely approximating the total taxable income of the Trust during such year plus, if so desired by the Board, all or a portion of the capital gains and returns of capital from portfolio companies received by the Trust during the year.
In furtherance of its policy, the Trust distributes a fixed amount per common share, currently $0.05, each month to its common shareholders. This amount is subject to change from time to time in the discretion of the Board. In an effort to maintain the Trust’s monthly distribution at a stable level, the Board recognizes that a portion of the Trust’s distributions may be characterized as a return of capital, particularly in periods when the Trust incurs losses on its portfolio securities. Under such circumstances, the Board will not necessarily reduce the Trust’s distribution, but will closely monitor its sustainability, recognizing that losses may be reversed and that, in subsequent periods, gains on portfolio securities may give rise to the need for a supplemental distribution, which the Trust seeks to minimize. In considering sustainability, the Board may consider realized gains that have been offset, for the purposes of calculating taxable income, by capital loss carryforwards. Thus, the level of the Trust’s distributions will be independent of its performance for a particular period, but the Trust expects its distributions to correlate to its performance over time. In particular, the Trust expects that its distribution rate in relation to its net asset value (“NAV”) will correlate to its total return on NAV over time. The Trust’s total return on NAV is presented in the financial highlights table.
Shareholders should not draw any conclusions about the Trust’s investment performance from the amount of the current distribution or from the terms of the Trust’s managed distribution policy. The Board may amend or terminate the policy without prior notice to shareholders. Shareholders should note that the managed distribution policy is subject to change or termination for a variety of reasons. Through its ownership of portfolio securities, the Trust is subject to risks including, but not limited to, declines in the value of real estate held by portfolio companies, risks related to general and local economic conditions, and portfolio company losses. An economic downturn might have a material adverse effect on the real estate markets and the real estate companies in which the Trust invests, which could result in the Trust failing to achieve its investment objectives and jeopardizing the continuance of the managed distribution policy. Please refer to the Trust’s Prospectus for a fuller description of the risks associated with investing in the Trust.
Table of Contents
CBRE CLARION GLOBAL REAL ESTATE INCOME FUND ANNUAL REPORT 2019
| 2 | ||||
| 7 | ||||
| 10 | ||||
| 15 | ||||
| 21 | ||||
| 22 | ||||
Investors should consider a fund’s investment objectives, risks, charges and expenses carefully before investing. A copy of the prospectus that contains this and other information about the Fund may be obtained by calling 888-711-4272. Please read the prospectus carefully before investing. Investing in closed-end funds involves risk, including possible loss of principal. Past performance does not guarantee future results.
Real Estate investments are subject to changes in economic conditions, credit risk, and interest rate fluctuations. International investments may involve risk of capital loss from unfavorable fluctuation in currency values, from differences in generally accepted accounting principles or from economic or political instability in other nations. Because real estate funds concentrate their investments in the real estate industry, the portfolio may experience more volatility and be exposed to greater risk than the portfolios of other funds.
Closed-end funds are traded on the secondary market through one of the stock exchanges. The Fund’s investment return and principal value will fluctuate so that an investor’s shares may be worth more or less than the original cost. Shares of closed-end funds may trade above (a premium) or below (a discount) the net asset value (NAV) of the fund’s portfolio. There is no assurance that the Fund will achieve its investment objective.
| ANNUAL REPORT 2019 | 1 |
Table of Contents

T. Ritson Ferguson

Steven D. Burton

Kenneth S. Weinberg
Dear Shareholder:
We are pleased to present the 2019 Annual Report for the CBRE Clarion Global Real Estate Income Fund (the “Trust”).
Performance Review
Real estate securities generated strong returns in 2019.After several lackluster performance years, real estate securities had an impressive year in 2019. Performance was broad-based, led by Europe and North America. Overall, returns were driven by stock specific attributes (such as attractive valuations, stable earnings, and well-covered dividends) and a favorable macro backdrop including continued accommodative central bank policies around the world, a possible trade deal between the U.S. and China, and a U.K. election in December 2019 that brings some clarity to the direction of the Brexit process. We expect 2020 to be another attractive total return year for real estate stocks.
Europe performed the best during the year propelled by a strong final quarter, followed by North America and the Asia-Pacific region. All regions had strong absolute total returns in 2019. Returns for preferred securities were also strong, but slightly lower than global common stock returns.
Global Real Estate Market Performance
Performance as of December 31, 2019
| Region | 1H19 | 2H19 | 2019 | |||||||||
North America (1) | 16.1 | % | 6.0 | % | 23.0 | % | ||||||
Europe (1) | 8.5 | % | 16.5 | % | 26.4 | % | ||||||
Asia- Pacific (1) | 15.2 | % | 1.3 | % | 16.6 | % | ||||||
Global Common Stock (1) | 14.5 | % | 6.5 | % | 21.9 | % | ||||||
U.S. Preferred (2) | 14.7 | % | 4.6 | % | 19.9 | % | ||||||
80/20 Blend of Global Common Stock & U.S. Preferred Stock | 14.6 | % | 6.1 | % | 21.6 | % | ||||||
The Trust’s net asset value (“NAV”) return was +25.8% during 2019, outperforming the 21.6% return for an 80/20 mix of indices of global common stock and preferred securities as referenced in the table above. Investments in U.S. residential, data centers, towers, office, industrial and net lease sectors were particularly strong performers. The laggard investments in the U.S. were in retail and hotels. Performance in Europe was also strong. Positions in U.K. industrial and student housing companies were very strong performers. On the Continent, positioning emphasized industrial, residential, the Nordic region, and Spain. During the course of the year, the Trust decreased its holdings in the German residential sector as regulatory risk increased with the introduction of rent control legislation. In the Asia-Pacific region, the Trust’s
| (1) | Represented by the FTSE EPRA Nareit Developed Index – Net. The Index is an unmanaged market-weighted index consisting of real estate companies from developed markets, where greater than 75% of constituents’ EBITDA (earnings before interest, taxes, depreciation, and amortization) is derived from relevant real estate activities, and is calculated net of withholding taxes.Investors cannot invest directly in an index. |
| (2) | Represented by the MSCI REIT Preferred Index, a preferred stock market capitalization weighted index of certain exchange traded preferred securities issued by U.S. equity and U.S. hybrid REITs.Investors cannot invest directly in an index. |
| 2 | CBRE CLARION GLOBAL REAL ESTATE INCOME FUND |
Table of Contents
best investments were in Singapore, Australia and Japan. The poorest performers in the region were in Hong Kong, due to factors which include ongoing geopolitical risks and protests in Hong Kong.
The Trust made total distributions of $0.60 per share during 2019, maintaining a level monthly distribution of $0.05 per share. The annualized distribution represents a 7.5% distribution rate on the $8.02 share price and a 6.8% distribution rate on the $8.86 NAV as of December 31st. (3) Due to the favorable effects of capital loss carryforwards, as well as the tax characteristics of distributions received from the Trust’s investments, a substantial portion of the distributions are estimated to be characterized as return of capital rather than income or capital gains. The Board continues to regularly review the level of the Trust’s distribution and the ability to sustain it in light of market conditions.
The Trust continues to maintain a flexible and relatively low level of portfolio leverage. The Trust’s leverage position was 10% as of December 31st.
Portfolio Review
The Trust’s investments remain well-diversified by property type and geography. During the year, we harvested some gains from our U.S. preferred stock positions. We also reduced our exposure to Hong Kong. We used the proceeds of these two allocation changes to add to our common stock holdings in U.S. and European property companies. At December 31st, the Trust’s portfolio was approximately 84% invested in equity securities (52% in the Americas, 17% in Asia-Pacific, and 15% in Europe). Sixteen percent (16%) of the portfolio is invested in preferred stock of U.S. real estate companies which continue to offer stable, well-covered dividends.
| Geographic Diversification | Sector Diversification | |
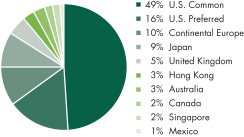 | 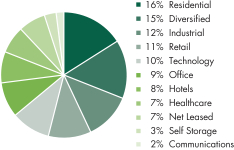 | |
Source: CBRE Clarion Securities as of 12/31/2019.
Geographic and Sector diversification are unaudited. Percentages presented are based on managed trust assets, which include borrowings. The percentages in the pie charts will differ from those on the Portfolio of Investments because the figures on the Portfolio of Investments are calculated using net assets of the Trust.
Market Outlook
We believe the outlook for moderate global economic growth is good for real estate stocks.The economic expansion is expected to continue in 2020. We acknowledge the risks to continued economic expansion (which is the longest in generations); including geopolitical risks such as Britain’s exit from the European Union, U.S. trade policy uncertainty, and a slowing/bottoming Chinese economy. In part, because of these risks, we expect central banks around the world to remain accommodative and for interest rates to be relatively stable in 2020. Despite a slowing pace of growth, labor markets remain tight at this stage of the economic cycle, but inflationary pressures are minimal.
Against this backdrop and after several years of lagging performance relative to the broader stock market, we believe that real estate companies’ consistent earnings growth, attractive dividend yields, conservative debt levels, and attractive valuations should be more appealing to investors. The capital markets also remain receptive to companies that need attractively priced debt to finance new investments.
| (3) | The Fund is currently paying distributions in excess of its net investment income, which may result in a return of capital. Absent this, the distribution rate would have been lower. The estimated composition of each distribution, including any return of capital, will be provided to shareholders of record and is also available at www.cbreclarion.com. |
| ANNUAL REPORT 2019 | 3 |
Table of Contents
We expect that real estate companies will generate earnings growth of4-5% again in 2020.With earnings of real estate companies generated by contractual leases, the stability of earnings and quality of earnings growth is high. This contrasts with earnings estimates for broad equities, which have been sharply decelerating sincemid-2018.
Regional Earnings Growth Forecast
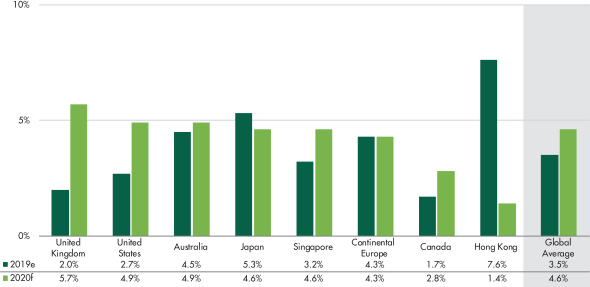
Source: CBRE Clarion as of 12/31/2019.
“f” refers to “forecasts” “e” refers to “estimates”. Forecasts are the opinion of CBRE Clarion, which is subject to change and is not intended to be a guarantee of future results or investment advice. Forecasts are not indicative of future investment performance.
Real estate dividend yield remains attractive and we anticipate that dividends will grow again in 2020.Current income generated by listed property’s dividend yields remains a defining investment characteristic of the sector. Dividend yield for real estate stocks remains attractive in the3-4% range. We project dividend growth to match earnings growth in 2020, driven by a combination of growing cash flows and an expansion of dividend payout policies which remain conservative. Increasing dividends are emblematic of healthy companies in improving markets. Real estate companies will likely provide nearly a third to a half of their total return to shareholders in the form of dividends in 2020.
Current Dividend Yield
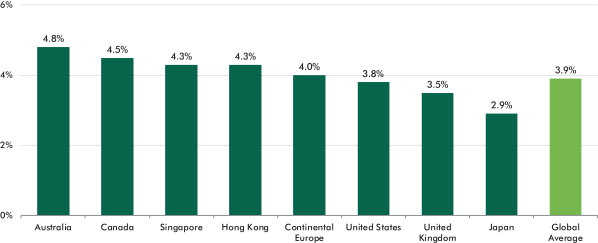
Source: CBRE Clarion as of 12/31/2019. Not all countries included.
Dividend yields fluctuate and are not necessarily indicative of present or future investment performance.
Information is subject to change and should not be construed as investment advice. Past performance is no guarantee of future results.
| 4 | CBRE CLARION GLOBAL REAL ESTATE INCOME FUND |
Table of Contents
Increasing M&A could support the valuations of listed property companies. On average, global real estate companies are trading at approximately our estimate of their inherent real estate value, with an implied unleveraged cash flow yield of 5.3%. Despite the strong 2019 returns, real estate stocks remain attractively priced relative to private real estate and other asset classes. Given the significant amount of private capital which has been raised by private equity real estate funds, it is highly likely that some of this capital will find its way into the listed real estate market via further mergers and acquisitions.
NAV Premium/Discount by Region
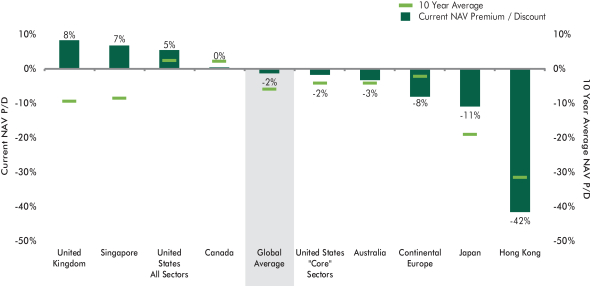
Source: CBRE Clarion as of 12/31/2019.
“f” refers to “forecasts” “e” refers to “estimates”. Forecasts are the opinion of CBRE Clarion, which is subject to change and is not intended to be a guarantee of future results or investment advice. Forecasts are not indicative of future investment performance.
We see good total return potential for property types with good fundamentals and companies with valuations that are attractive relative to their growth. In the U.S., we favor data centers, cell towers, residential, West Coast office, medical office, life science, and gaming REITs. In the Asia-Pacific region, we favor Japanese logistics REITs and companies that have the potential for corporate governance enhancements. In Australia, we like diversified real estate companies with an emphasis on office and residential properties as well as companies that can leverage their operating expertise and capital as asset managers. In Hong Kong, we remain cautious as the geopolitical uncertainly is weighing on property fundamentals. In Europe, we still see value in the U.K. (especially in the student housing, office, and industrial sectors). In Continental Europe, we prefer property companies in the residential and industrial sectors and prefer markets with superior growth, including the Nordic region. We have selectively added some deeply discounted names in the retail and office sectors.
We appreciate your continued faith and confidence.
Sincerely,
CBRE CLARION SECURITIES LLC
 |  |  | ||
| T. Ritson Ferguson, CFA | Steven D. Burton, CFA | Kenneth S. Weinberg, CFA | ||
| President & CEO | Co-Portfolio Manager | Senior Portfolio Manager | ||
| Co-Portfolio Manager |
| ANNUAL REPORT 2019 | 5 |
Table of Contents
IMPORTANT DISCLOSURES AND RISK INFORMATION
The views expressed represent the opinion of CBRE Clarion Securities (“CBRE Clarion”), which are subject to change and are not intended as investment advice or a guarantee of future results. This material is for informational purposes only. It is not intended as an endorsement of any specific investment. Stated information is derived from proprietary andnon-proprietary sources which have not been independently verified for accuracy or completeness. While CBRE Clarion believes the information to be accurate and reliable, we do not claim or accept responsibility for its completeness, accuracy, or reliability. Statements of future expectations, forecasts, estimates, projections, and other forward-looking statements are based on CBRE Clarion’s view at the time such statements were made. Accordingly, such statements are inherently speculative, as they are based on assumptions which may involve known and unknown risks and uncertainties. Any discussion of particular securities herein should not be perceived as a recommendation to purchase or sell any of those securities. It should not be assumed that investments in any securities discussed were or will be profitable. Actual results, performance or events may differ materially from those expressed or implied in such statements. Investing in real estate securities involves risks including the potential loss of principal. Real estate equities are subject to risks similar to those associated with the direct ownership of real estate. Portfolios concentrated in real estate securities may experience price volatility and other risks associated with non-diversification. While equities may offer the potential for greater long-term growth than most debt securities, they generally have higher volatility. International(non-US) investments may involve risk of capital loss from unfavorable fluctuation in currency values, from differences in generally accepted accounting principles, or from economic or political instability in other nations.Past performance is no guarantee of future results.
| 6 | CBRE CLARION GLOBAL REAL ESTATE INCOME FUND |
Table of Contents
December 31, 2019
| Shares | Market Value | |||||||||||||||
| Real Estate Securities* – 116.9% | ||||||||||||||||
| Common Stock – 98.4% | ||||||||||||||||
| Australia – 3.5% | ||||||||||||||||
| 715,098 | Dexus | $ | 5,881,335 | |||||||||||||
| 374,634 | Goodman Group | 3,520,977 | ||||||||||||||
| 12,172,094 | Mirvac Group | 27,209,273 | ||||||||||||||
| 36,611,585 | ||||||||||||||||
| Belgium – 1.6% | ||||||||||||||||
| 140,586 | Shurgard Self Storage SA | 5,365,462 | ||||||||||||||
| 60,283 | Warehouses De Pauw CVA | 10,975,691 | ||||||||||||||
| 16,341,153 | ||||||||||||||||
| Canada – 2.2% | ||||||||||||||||
| 450,203 | Canadian Apartment Properties REIT | 18,403,903 | ||||||||||||||
| 385,400 | Chartwell Retirement Residences | 4,131,143 | ||||||||||||||
| 22,535,046 | ||||||||||||||||
| France – 0.8% | ||||||||||||||||
| 55,397 | Unibail – Rodamco-Westfield | 8,746,054 | ||||||||||||||
| Germany – 5.1% | ||||||||||||||||
| 343,468 | alstria officeREIT-AG | 6,457,839 | ||||||||||||||
| 1,399,480 | Aroundtown SA | 12,542,190 | ||||||||||||||
| 191,784 | Deutsche EuroShop AG | 5,687,630 | ||||||||||||||
| 396,322 | Grand City Properties SA | 9,511,347 | ||||||||||||||
| 124,704 | LEG Immobilien AG | 14,774,908 | ||||||||||||||
| 67,103 | Vonovia SE | 3,615,508 | ||||||||||||||
| 52,589,422 | ||||||||||||||||
| Hong Kong – 3.8% | ||||||||||||||||
| 2,214,000 | Link REIT | 23,441,952 | ||||||||||||||
| 11,158,000 | New World Development Co., Ltd. | 15,293,955 | ||||||||||||||
| 38,735,907 | ||||||||||||||||
| Ireland – 1.1% | ||||||||||||||||
| 7,073,713 | Hibernia REIT PLC | 11,338,662 | ||||||||||||||
| Japan – 10.9% | ||||||||||||||||
| 6,794 | AEON REIT Investment Corp. | 9,296,230 | ||||||||||||||
| 12,384 | GLP J-Reit | 15,372,456 | ||||||||||||||
| 15,770 | Japan Hotel REIT Investment Corp. | 11,783,060 | ||||||||||||||
| 1,098 | Kenedix Office Investment Corp. | 8,466,749 | ||||||||||||||
| 492,400 | Mitsubishi Estate Co. Ltd. | 9,467,401 | ||||||||||||||
| 932,200 | Mitsui Fudosan Co., Ltd. | 22,920,068 | ||||||||||||||
| 2,516 | Nippon Prologis REIT, Inc. | 6,399,102 | ||||||||||||||
| 282,000 | Nomura Real Estate Holdings, Inc. | 6,798,620 | ||||||||||||||
| Shares | Market Value | |||||||||||||||
| 10,382 | Orix JREIT, Inc. | $ | 22,478,809 | |||||||||||||
| 112,982,495 | ||||||||||||||||
| Mexico – 1.2% | ||||||||||||||||
| 5,724,245 | Prologis Property Mexico SA de CV | 12,731,322 | ||||||||||||||
| Singapore – 2.2% | ||||||||||||||||
| 2,334,300 | CapitaLand Ltd. | 6,509,965 | ||||||||||||||
| 5,184,000 | CapitaLand Retail China Trust | 6,206,998 | ||||||||||||||
| 1,247,100 | City Developments Ltd. | 10,155,613 | ||||||||||||||
| 22,872,576 | ||||||||||||||||
| Spain – 0.4% | ||||||||||||||||
| 359,298 | Inmobiliaria Colonial Socimi SA | 4,581,622 | ||||||||||||||
| Sweden – 3.1% | ||||||||||||||||
| 714,599 | Castellum AB | 16,794,246 | ||||||||||||||
| 894,380 | Fabege AB | 14,875,999 | ||||||||||||||
| 31,670,245 | ||||||||||||||||
| United Kingdom – 5.2% | ||||||||||||||||
| 711,778 | Land Securities Group PLC | 9,334,991 | ||||||||||||||
| 2,265,054 | Segro PLC | 26,921,670 | ||||||||||||||
| 1,014,051 | UNITE Group PLC (The) | 16,926,396 | ||||||||||||||
| 53,183,057 | ||||||||||||||||
| United States – 57.3% | ||||||||||||||||
| 100,440 | Alexandria Real Estate Equities, Inc. | 16,229,095 | ||||||||||||||
| 277,004 | American Campus Communities, Inc. | 13,027,498 | ||||||||||||||
| 122,600 | American Tower Corp. | 28,175,932 | ||||||||||||||
| 50,740 | AvalonBay Communities, Inc. | 10,640,178 | ||||||||||||||
| 438,193 | Brixmor Property Group, Inc. | 9,469,351 | ||||||||||||||
| 191,161 | Camden Property Trust | 20,282,182 | ||||||||||||||
| 628,318 | Columbia Property Trust, Inc. | 13,138,129 | ||||||||||||||
| 242,623 | Cousins Properties, Inc. | 9,996,068 | ||||||||||||||
| 372,271 | Crown Castle International Corp. | 52,918,323 | ||||||||||||||
| 611,888 | CubeSmart | 19,262,234 | ||||||||||||||
| 249,229 | CyrusOne, Inc. | 16,307,053 | ||||||||||||||
| 644,947 | Duke Realty Corp. | 22,360,312 | ||||||||||||||
| 45,104 | Equinix, Inc. | 26,327,205 | ||||||||||||||
| 386,298 | Equity Residential | 31,259,234 | ||||||||||||||
| 25,558 | Extra Space Storage, Inc. | 2,699,436 | ||||||||||||||
| 96,201 | Federal Realty Investment Trust | 12,383,955 | ||||||||||||||
| 742,042 | Healthcare Trust of America, Inc., Class A | 22,469,032 | ||||||||||||||
| 546,015 | Healthpeak Properties, Inc. | 18,821,137 | ||||||||||||||
See notes to financial statements.
| ANNUAL REPORT 2019 | 7 |
Table of Contents
Portfolio of Investments continued
| Shares | Market Value | |||||||||||||||
| 617,730 | Host Hotels & Resorts, Inc. | $ | 11,458,891 | |||||||||||||
| 516,622 | Hudson Pacific Properties, Inc. | 19,450,818 | ||||||||||||||
| 868,164 | Invitation Homes, Inc. | 26,018,875 | ||||||||||||||
| 194,907 | Liberty Property Trust | 11,704,165 | ||||||||||||||
| 457,235 | MGM Growth Properties LLC, Class A | 14,160,568 | ||||||||||||||
| 599,092 | Piedmont Office Realty Trust, Inc., Class A | 13,323,806 | ||||||||||||||
| 392,900 | Prologis, Inc. | 35,023,106 | ||||||||||||||
| 131,575 | Regency Centers Corp. | 8,301,067 | ||||||||||||||
| 106,887 | Simon Property Group, Inc. | 15,921,888 | ||||||||||||||
| 465,857 | STORE Capital Corp. | 17,348,515 | ||||||||||||||
| 62,196 | Sun Communities, Inc. | 9,335,620 | ||||||||||||||
| 218,206 | Taubman Centers, Inc. | 6,784,025 | ||||||||||||||
| 2,187,561 | VEREIT, Inc. | 20,213,064 | ||||||||||||||
| 772,409 | VICI Properties, Inc. | 19,735,050 | ||||||||||||||
| 212,363 | Welltower, Inc. | 17,367,046 | ||||||||||||||
| 591,912,858 | ||||||||||||||||
| Total Common Stock (cost $911,529,196) | 1,016,832,004 | |||||||||||||||
| Preferred Stock – 18.5% | ||||||||||||||||
| United States – 18.5% | ||||||||||||||||
| 525,265 | American Homes 4 Rent, Series D, 6.500% | 13,756,690 | ||||||||||||||
| 460,478 | Brookfield Property REIT, Inc., Series A, 6.375% | 11,562,603 | ||||||||||||||
| 500,302 | Digital Realty Trust, Inc., Series C, 6.625% | 13,177,955 | ||||||||||||||
| 245,403 | Digital Realty Trust, Inc., Series J, 5.250% | 6,324,035 | ||||||||||||||
| 301,100 | Digital Realty Trust, Inc., Series L, 5.200% | 7,771,391 | ||||||||||||||
| 280,000 | EPR Properties, Series G, 5.750% | 7,229,600 | ||||||||||||||
| 282,200 | Federal Realty Investment Trust, Series C, 5.000% | 7,263,828 | ||||||||||||||
| 658,731 | iStar, Inc., Series I, 7.500% | 16,797,641 | ||||||||||||||
| Shares | Market Value | |||||||||||||||
| 405,900 | National Storage Affiliates Trust, Series A, 6.000% | $ | 10,805,058 | |||||||||||||
| 500,000 | Pebblebrook Hotel Trust, Series D, 6.375% | 12,920,000 | ||||||||||||||
| 400,000 | Pebblebrook Hotel Trust, Series E, 6.375% | 10,160,000 | ||||||||||||||
| 500,000 | Pebblebrook Hotel Trust, Series F, 6.300% | 12,850,000 | ||||||||||||||
| 259,647 | Pennsylvania Real Estate Investment Trust, Series B, 7.375% | 5,208,519 | ||||||||||||||
| 293,218 | Pennsylvania Real Estate Investment Trust, Series C, 7.200% | 5,462,651 | ||||||||||||||
| 143,517 | Rexford Industrial Realty, Inc., Series B, 5.875% | 3,736,465 | ||||||||||||||
| 150,000 | STAG Industrial, Inc., Series C, 6.875% | 4,002,000 | ||||||||||||||
| 225,000 | Summit Hotel Properties, Inc., Series D, 6.450% | 5,804,550 | ||||||||||||||
| 287,077 | Summit Hotel Properties, Inc., Series E, 6.250% | 7,334,817 | ||||||||||||||
| 600,000 | Sunstone Hotel Investors, Inc., Series E, 6.950% | 15,606,000 | ||||||||||||||
| 379,377 | Sunstone Hotel Investors, Inc., Series F, 6.450% | 9,829,658 | ||||||||||||||
| 120,000 | Taubman Centers, Inc., Series K, 6.250% | 3,109,200 | ||||||||||||||
| Total Preferred Stock (cost $188,387,297) | 190,712,661 | |||||||||||||||
| Total Investments – 116.9% (cost $1,099,916,493) | 1,207,544,665 | |||||||||||||||
| Liabilities in Excess of Other Assets – (16.9)% | (174,655,063 | ) | ||||||||||||||
| Net Assets – 100.0% | $ | 1,032,889,602 | ||||||||||||||
| * | Includes U.S. Real Estate Investment Trusts (“REIT”) and Real Estate Operating Companies (“REOC”) as well as entities similarly formed under the laws ofnon-U.S. countries. |
See notes to financial statements.
| 8 | CBRE CLARION GLOBAL REAL ESTATE INCOME FUND |
Table of Contents
Portfolio of Investments concluded
Securities Valuation
The following is a summary of various inputs used in determining the value of the Trust’s investments. These inputs are summarized in three broad levels. Level 1 includes quoted prices in active markets for identical investments. Level 2 includes other significant observable inputs (including quoted prices for similar investments, interest rates, prepayment speeds, credit risk, etc.). Level 3 includes significant unobservable inputs (including the Trust’s own assumptions in determining the fair value of investments). The level assigned to the securities valuations may not be an indication of the risk or liquidity associated with investing in those securities.
The following is a summary of inputs used as of December 31, 2019. For information on the Trust’s policy regarding the valuation of investments, please refer to the Security Valuation section of Note 2 in the accompanying Notes to Financial Statements.
| Assets | Level 1 | Level 2 | Level 3 | Total | ||||||||||||
Investments in Real Estate Securities | ||||||||||||||||
Common Stock | ||||||||||||||||
Australia | $ | 36,611,585 | $ | — | $ | — | $ | 36,611,585 | ||||||||
Belgium | 16,341,153 | — | — | 16,341,153 | ||||||||||||
Canada | 22,535,046 | — | — | 22,535,046 | ||||||||||||
France | 8,746,054 | — | — | 8,746,054 | ||||||||||||
Germany | 52,589,422 | — | — | 52,589,422 | ||||||||||||
Hong Kong | 38,735,907 | — | — | 38,735,907 | ||||||||||||
Ireland | 11,338,662 | — | — | 11,338,662 | ||||||||||||
Japan | 112,982,495 | — | — | 112,982,495 | ||||||||||||
Mexico | 12,731,322 | — | — | 12,731,322 | ||||||||||||
Singapore | 22,872,576 | — | — | 22,872,576 | ||||||||||||
Spain | 4,581,622 | — | — | 4,581,622 | ||||||||||||
Sweden | 31,670,245 | — | — | 31,670,245 | ||||||||||||
United Kingdom | 53,183,057 | — | — | 53,183,057 | ||||||||||||
United States | 591,912,858 | — | — | 591,912,858 | ||||||||||||
Total Common Stock | 1,016,832,004 | — | — | 1,016,832,004 | ||||||||||||
Preferred Stock | ||||||||||||||||
United States | 177,146,538 | 13,566,123 | — | 190,712,661 | ||||||||||||
Total Investment in Real Estate Securities | $ | 1,193,978,542 | $ | 13,566,123 | $ | — | $ | 1,207,544,665 | ||||||||
See notes to financial statements.
| ANNUAL REPORT 2019 | 9 |
Table of Contents
Statement of Assets and Liabilities
| December 31, 2019 | ||||||||
Assets | ||||||||
Investments, at value (cost $1,099,916,493) | $1,207,544,665 | |||||||
Cash and cash equivalents | 1,644,030 | |||||||
Receivable for investment securities sold | 21,525,719 | |||||||
Dividends and interest receivable | 5,669,911 | |||||||
Dividend withholding reclaims receivable | 294,729 | |||||||
Other assets | 109,246 | |||||||
Total Assets | 1,236,788,300 | |||||||
Liabilities | ||||||||
Line of credit payable | 121,019,500 | |||||||
Payable for investment securities purchased | 81,151,820 | |||||||
Management fees payable | 837,755 | |||||||
Line of credit interest payable | 279,755 | |||||||
Dividend and distributions payable | 171,633 | |||||||
Unrealized depreciation on spot contracts | 16,728 | |||||||
Accrued expenses | 421,507 | |||||||
Total Liabilities | 203,898,698 | |||||||
Net Assets | $1,032,889,602 | |||||||
Composition of Net Assets | ||||||||
$0.001 par value per share; | $116,590 | |||||||
Additionalpaid-in capital | 985,679,167 | |||||||
Distributable earnings / (accumulated loss) | 47,093,845 | |||||||
Net Assets | $1,032,889,602 | |||||||
Net Asset Value |
| $8.86 |
| |||||
See notes to financial statements.
| 10 | CBRE CLARION GLOBAL REAL ESTATE INCOME FUND |
Table of Contents
Statement of Operations
| For the Year Ended December 31, 2019 | ||||||||
Investment Income | ||||||||
Dividends (net of foreign withholding taxes of $1,436,886) | $34,707,040 | |||||||
Other Income | 2,961 | |||||||
Interest | 739 | |||||||
Total Investment Income | 34,710,740 | |||||||
Expenses: | ||||||||
Management fees | 9,717,156 | |||||||
Interest expense on line of credit | 4,093,873 | |||||||
Printing and mailing fees | 471,988 | |||||||
Trustees’ fees and expenses | 288,988 | |||||||
Administration fees | 238,640 | |||||||
Custodian fees | 195,897 | |||||||
Transfer agent fees | 168,871 | |||||||
Legal fees | 158,091 | |||||||
Insurance fees | 152,902 | |||||||
NYSE listing fee | 119,510 | |||||||
Audit and tax fees | 78,766 | |||||||
Miscellaneous expenses | 90,475 | |||||||
Total Expenses | 15,775,157 | |||||||
Net Investment Income | 18,935,583 | |||||||
Net Realized and Unrealized Gain (Loss) on Investments, Written Options, and Foreign Currency Transactions | ||||||||
Net realized gain (loss) on: | ||||||||
Investments | 26,812,459 | |||||||
Written options | 1,510,234 | |||||||
Foreign currency transactions | (138,936 | ) | ||||||
Total Net Realized Gain | 28,183,757 | |||||||
Net change in unrealized appreciation (depreciation) on: | ||||||||
Investments | 175,086,398 | |||||||
Foreign currency denominated assets and liabilities | 2,588 | |||||||
Total Net Change in Unrealized Appreciation | 175,088,986 | |||||||
Net Realized and Unrealized Gain on Investments, Written Options, and Foreign Currency Transactions | 203,272,743 | |||||||
Net Increase in Net Assets Resulting from Operations | $222,208,326 | |||||||
See notes to financial statements.
| ANNUAL REPORT 2019 | 11 |
Table of Contents
Statements of Changes in Net Assets
| For the Year Ended December 31, 2019 | For the Year Ended December 31, 2018 | |||||||||||||||
Change in Net Assets Resulting from Operations | ||||||||||||||||
Net investment income | $18,935,583 | $22,378,295 | ||||||||||||||
Net realized gain (loss) on investments, written options, and foreign currency transactions | 28,183,757 | (36,176,260 | ) | |||||||||||||
Net change in unrealized appreciation (depreciation) on investments, and foreign currency denominated assets and liabilities | 175,088,986 | (84,044,215 | ) | |||||||||||||
Net increase (decrease) in net assets resulting from operations | 222,208,326 | (97,842,180 | ) | |||||||||||||
Distributions on Common Shares | ||||||||||||||||
Distributions from distributable earnings | (34,394,639 | ) | (19,584,966 | ) | ||||||||||||
Distribution of return of capital | (35,559,657 | ) | (50,369,330 | ) | ||||||||||||
Total distributions on Common Shares | (69,954,296 | ) | (69,954,296 | ) | ||||||||||||
Net Increase (Decrease) in Net Assets | 152,254,030 | (167,796,476 | ) | |||||||||||||
Net Assets | ||||||||||||||||
Beginning of year | 880,635,572 | 1,048,432,048 | ||||||||||||||
End of year | $1,032,889,602 | $880,635,572 | ||||||||||||||
See notes to financial statements.
| 12 | CBRE CLARION GLOBAL REAL ESTATE INCOME FUND |
Table of Contents
Statement of Cash Flows
| For the Year Ended December 31, 2019 | ||||||||
Cash Flows from Operating Activities: | ||||||||
Net Increase in Net Assets Resulting from Operations | $222,208,326 | |||||||
Adjustments to Reconcile Net Increase in Net Assets Resulting from Operations to Net Cash Provided by Operating Activities: | ||||||||
Net change in unrealized appreciation/depreciation on investments | (175,086,398 | ) | ||||||
Net realized gain on investments | (26,812,459 | ) | ||||||
Net realized gain on written options | (1,510,234 | ) | ||||||
Cost of securities purchased | (567,937,385 | ) | ||||||
Proceeds from sale of securities | 521,045,828 | |||||||
Premiums received on written options | 2,079,160 | |||||||
Payments to close written options | (37,504 | ) | ||||||
Increase in receivable for investment securities sold | (21,447,275 | ) | ||||||
Increase in dividends and interest receivable | (18,334 | ) | ||||||
Increase in dividend withholding reclaims receivable | (197,448 | ) | ||||||
Decrease in unrealized appreciation on spot contracts | 32 | |||||||
Decrease in other assets | 130 | |||||||
Increase in payable for investment securities purchased | 72,025,798 | |||||||
Increase in management fees payable | 136,116 | |||||||
Increase in line of credit interest payable | 100,797 | |||||||
Increase in unrealized depreciation on spot contracts | 16,728 | |||||||
Decrease in accrued expenses | (47,953 | ) | ||||||
Net Cash Provided by Operating Activities | 24,517,925 | |||||||
Cash Flows From Financing Activities: | ||||||||
Cash distributions paid on common shares | (69,960,166 | ) | ||||||
Proceeds from borrowing on line of credit | 343,124,000 | |||||||
Payments on line of credit borrowings | (296,215,300 | ) | ||||||
Net Cash Used in Financing Activities | (23,051,466 | ) | ||||||
Net Increase in cash | 1,466,459 | |||||||
Cash and Cash Equivalents at Beginning of Year | 177,571 | |||||||
Cash and Cash Equivalents at End of Year | $1,644,030 | |||||||
Supplemental disclosure | ||||||||
Interest paid on line of credit borrowings | $3,993,076 | |||||||
See notes to financial statements.
| ANNUAL REPORT 2019 | 13 |
Table of Contents
Financial Highlights
| Per share operating performance for a share outstanding throughout the year | For the Year Ended December 31, 2019 | For the Year Ended December 31, 2018 | For the Year Ended December 31, 2017 | For the Year Ended December 31, 2016 | For the Year Ended December 31, 2015 | |||||||||||||||||||||||||||||||||||
Net asset value, beginning of year | $7.55 | $8.99 | $8.65 | $9.04 | $10.16 | |||||||||||||||||||||||||||||||||||
Income from investment operations | ||||||||||||||||||||||||||||||||||||||||
Net investment income (1) | 0.16 | 0.19 | 0.27 | 0.26 | 0.27 | |||||||||||||||||||||||||||||||||||
Net realized and unrealized gain (loss) on investments and foreign currency transactions | 1.75 | (1.03 | ) | 0.67 | (0.05 | ) | (0.82 | ) | ||||||||||||||||||||||||||||||||
Total from investment operations | 1.91 | (0.84 | ) | 0.94 | 0.21 | (0.55 | ) | |||||||||||||||||||||||||||||||||
Distributions on Common Shares | ||||||||||||||||||||||||||||||||||||||||
Net investment income | (0.30 | ) | (0.17 | ) | (0.60 | ) | (0.34 | ) | (0.57 | ) | ||||||||||||||||||||||||||||||
Return of capital | (0.30 | ) | (0.43 | ) | — | (0.26 | ) | — | ||||||||||||||||||||||||||||||||
Total distributions to Common Shareholders | (0.60 | ) | (0.60 | ) | (0.60 | ) | (0.60 | ) | (0.57 | ) | ||||||||||||||||||||||||||||||
Net asset value, end of year | $8.86 | $7.55 | $8.99 | $8.65 | $9.04 | |||||||||||||||||||||||||||||||||||
Market value, end of year | $8.02 | $6.16 | $7.92 | $7.30 | $7.64 | |||||||||||||||||||||||||||||||||||
Total investment return(2) | ||||||||||||||||||||||||||||||||||||||||
Net asset value | 25.74 | % | (9.75 | )% | 11.28 | % | 2.17 | % | (5.57 | )% | ||||||||||||||||||||||||||||||
Market value | 40.87 | % | (15.52 | )% | 17.22 | % | 3.17 | % | (8.89 | )% | ||||||||||||||||||||||||||||||
Ratios and supplemental data | ||||||||||||||||||||||||||||||||||||||||
Net assets, applicable to Common Shares, end of year (thousands) | $1,032,890 | $880,636 | $1,048,432 | $1,008,918 | $1,053,863 | |||||||||||||||||||||||||||||||||||
Ratios to average net assets applicable to Common Shares of: | ||||||||||||||||||||||||||||||||||||||||
Net expenses | 1.57 | % | 1.54 | % | 1.43 | % | 1.18 | % | 1.19 | % | ||||||||||||||||||||||||||||||
Net expenses, excluding interest on line of credit | 1.16 | % | 1.17 | % | 1.16 | % | 1.09 | % | 1.10 | % | ||||||||||||||||||||||||||||||
Net investment income | 1.89 | % | 2.30 | % | 3.02 | % | 2.86 | % | 2.79 | % | ||||||||||||||||||||||||||||||
Portfolio turnover rate | 44.97 | % | 70.38 | % | 124.07 | % | 67.36 | % | 76.54 | % | ||||||||||||||||||||||||||||||
(1) Based on average shares outstanding.
(2) Total investment return does not reflect brokerage commissions. Dividends and distributions are assumed to be reinvested at the prices obtained under the Trust’s Dividend Reinvestment Plan. Net Asset Value (“NAV”) total return is calculated assuming reinvestment of distributions at NAV on the date of the distribution. | ||
See notes to financial statements.
| 14 | CBRE CLARION GLOBAL REAL ESTATE INCOME FUND |
Table of Contents
| 1. | Fund Organization |
CBRE Clarion Global Real Estate Income Fund (the “Trust”) is a diversified,closed-end management investment company that was organized as a Delaware statutory trust on November 6, 2003 and registered with the Securities and Exchange Commission (“SEC”) under the Investment Company Act of 1940, as amended. The Trust is an investment company and accordingly follows the investment company accounting and reporting guidance of the Financial Accounting Standards Board (“FASB”) Accounting Standards Codification Topic 946 Financial Services-Investment Companies. CBRE Clarion Securities LLC (the “Advisor”) is the Trust’s investment advisor. The Advisor is a majority-owned subsidiary of CBRE Group, Inc. and is partially owned by its senior management team. The Trust commenced operations on February 18, 2004.
| 2. | Significant Accounting Policies |
The following accounting policies are in accordance with U.S. generally accepted accounting principles (“U.S. GAAP”) and are consistently followed by the Trust.
Securities Valuation – The net asset value of the common shares of the Trust will be computed based upon the value of the Trust’s portfolio securities and other assets. The Trust calculates net asset value per common share by subtracting the Trust’s liabilities (including accrued expenses, dividends payable and any borrowings of the Trust) and the liquidation value of any outstanding preferred shares from the Trust’s total assets (the value of the securities the Trust holds, plus cash and/or other assets, including dividends accrued but not yet received) and dividing the result by the total number of common shares of the Trust outstanding. Net asset value per common share will be determined as of the close of the regular trading session (usually 4:00 p.m., EST) on the New York Stock Exchange (“NYSE”) on each business day on which the NYSE is open for trading.
For purposes of determining the net asset value of the Trust, readily marketable portfolio assets (including common stock, preferred stock, and options) traded principally on an exchange, or on a similar regulated market reporting contemporaneous transaction prices, are valued, except as indicated below, at the last sale price for such assets on such principal markets on the business day on which such value is being determined. If there has been no sale on such day, the securities are valued at the mean of the closing bid and asked prices on such day. Foreign securities are valued based upon quotations from the primary market in which they are traded and are translated from the local currency into U.S. dollars using current exchange rates. During the period that a forward foreign currency contract is open, changes in the value of the contract are recognized as unrealized appreciation or depreciation by marking to market such contract on a daily basis to reflect the market value of the contract at the end of each day’s trading. Securities and other assets for which market quotations are not readily available or for which the above valuation procedures are deemed not to reflect fair value are valued in a manner that is intended to reflect their fair value as determined in accordance with procedures approved by the Trust’s Board of Trustees (the “Board”).
Short-term securities which mature in more than 60 days are valued at current market quotations. Short-term securities, which mature in 60 days or less, are valued at amortized cost, which approximates market value.
U.S. GAAP provides guidance on fair value measurements. In accordance with the standard, fair value is defined as the price that the Trust would receive to sell an investment or pay to transfer a liability in a timely transaction with an independent buyer in the principal market, or in the absence of a principal market the most advantageous market for the investment or liability. It establishes a single definition of fair value, creates a three-tier hierarchy as a framework for measuring fair value based on inputs used to value the Trust’s investments, and requires additional disclosure about fair value.
For Level 1 inputs, the Trust uses unadjusted quoted prices in active markets for assets or liabilities with sufficient frequency and volume to provide pricing information as the most reliable evidence of fair value.
The Trust’s Level 2 valuation techniques include inputs other than quoted prices within Level 1 that are observable for an asset or liability, either directly or indirectly. Level 2 observable inputs may include quoted prices for similar assets and liabilities in active markets or quoted prices for identical or similar assets or liabilities in markets that are not active in which there are few transactions, the prices are not current, or price quotations vary substantially over time or among market participants. Inputs that are observable for the asset or liability in Level 2 include such factors as interest rates, yield curves, prepayment speeds, credit risk, and default rates for similar liabilities.
| ANNUAL REPORT 2019 | 15 |
Table of Contents
Notes to Financial Statements continued
For Level 3 valuation techniques, the Trust uses unobservable inputs that reflect assumptions market participants would be expected to use in pricing the asset or liability. Unobservable inputs are used to measure fair value to the extent that observable inputs are not available and are developed based on the best information available under the circumstances. In developing unobservable inputs, market participant assumptions are used if they are reasonably available without undue cost and effort.
The primary third party pricing vendor for the Trust’s listed preferred stock investments is FT Interactive Data (“IDC”). When available, the Trust will obtain a closing exchange price to value the preferred stock investments and, in such instances, the investment will be classified as Level 1 since an unadjusted quoted price was utilized. When a closing price is not available for the listed preferred stock investments, IDC will produce an evaluated mean price (midpoint between the bid and the ask evaluation) and such investments will be classified as Level 2 since other observable inputs were used in the valuation. Factors used in the IDC evaluation include trading activity, the presence of atwo-sided market, and other relevant market data.
Pursuant to the Trust’s fair value procedures noted previously, equity securities (including exchange traded securities andopen-end regulated investment companies) and exchange traded derivatives (i.e. futures contracts and options) are generally categorized as Level 1 securities in the fair value hierarchy. Fixed income securities,non-exchange traded derivatives and money market instruments are generally categorized as Level 2 securities in the fair value hierarchy. Investments for which there are no such quotations, or for which quotations do not appear reliable, are valued at fair value as determined in accordance with procedures established by and under the general supervision of the Trustees. These valuations are typically categorized as Level 2 or Level 3 securities in the fair value hierarchy.
For the year ended December 31, 2019, there have been no significant changes to the Trust’s fair valuation methodology.
Foreign Currency Translation – The books and records of the Trust are maintained in U.S. dollars. Foreign currency amounts are translated into U.S. dollars on the following basis:
| (i) | market value of investment securities, other assets and liabilities – at the current rates of exchange; |
| (ii) | purchases and sales of investment securities, income and expenses – at the rate of exchange prevailing on the respective dates of such transactions. |
Although the net assets of the Trust are presented at the foreign exchange rates and market values at the close of each fiscal year, the Trust does not isolate that portion of the results of operations arising as a result of changes in the foreign exchange rates from the fluctuations arising from changes in the market prices of long-term securities held at the end of the fiscal year. Similarly, the Trust does not isolate the effect of changes in foreign exchange rates from the fluctuations arising from changes in the market prices of portfolio securities sold during the fiscal year. Accordingly, realized foreign currency gains or losses will be included in the reported net realized gains or losses on investment transactions.
Net realized gains or losses on foreign currency transactions represent net foreign exchange gains or losses from the holding of foreign currencies, currency gains or losses realized between the trade date and settlement date on securities transactions, and the difference between the amounts of dividends, interest and foreign withholding taxes recorded on the Trust’s books and the U.S. dollar equivalent amounts actually received or paid. Net unrealized currency gains or losses from valuing foreign currency denominated assets or liabilities (other than investments) at year end exchange rates are reflected as a component of net unrealized appreciation or depreciation on investments and foreign currencies.
Foreign security and currency transactions may involve certain considerations and risks not typically associated with those of domestic origin as a result of, among other factors, the possibility of political or economic instability, or the level of governmental supervision and regulation of foreign securities markets.
Forward Foreign Currency Contracts – The Trust enters into forward foreign currency contracts in order to hedge its exposure to changes in foreign currency exchange rates on its foreign portfolio holdings, to hedge certain Trust purchase and sales commitments denominated in foreign currencies and for investment purposes. A forward foreign currency contract is a commitment to purchase or sell a foreign currency on a future date at a negotiated forward rate. The gain or loss arising from the difference between the original contracts and the closing of such contracts would be included in net realized gain or loss on foreign currency transactions.
Fluctuations in the value of open forward foreign currency contracts are recorded for financial reporting purposes as unrealized appreciation and depreciation by the Trust.
| 16 | CBRE CLARION GLOBAL REAL ESTATE INCOME FUND |
Table of Contents
Notes to Financial Statements continued
The Trust’s custodian will place and maintain cash not available for investment or other liquid assets in a separate account of the Trust having a value at least equal to the aggregate amount of the Trust’s commitments under forward foreign currency contracts entered into with respect to position hedges.
Risks may arise from the potential inability of a counterparty to meet the terms of a contract and from unanticipated movements in the value of a foreign currency relative to the U.S. dollar. The face or contract amount, in U.S. dollars, reflects the total exposure the Trust has in that particular currency contract. As of December 31, 2019, the Trust did not hold any forward foreign currency contracts.
Options – The Trust may purchase or sell (write) options on securities and securities indices which are listed on a national securities exchange or in theover-the-counter (“OTC”) market as a means of achieving additional return or of hedging the value of the Trust’s portfolio.
An option on a security is a contract that gives the holder of the option, in return for a premium, the right to buy from (in the case of a call) or sell to (in the case of a put) the writer of the option the security underlying the option at a specified exercise or “strike” price. The writer of an option on a security has an obligation upon exercise of the option to deliver the underlying security upon payment of the exercise price (in the case of a call) or to pay the exercise price upon delivery of the underlying security (in the case of a put).
There are several risks associated with transactions in options on securities. As the writer of a covered call option, the Trust forgoes, during the option’s life, the opportunity to profit from increases in the market value of the security covering the call option above the sum of the premium and the strike price of the call but has retained the risk of loss should the price of the underlying security decline. The writer of an option has no control over the time when it may be required to fulfill its obligation as writer of the option. Once an option writer has received an exercise notice, it cannot effect a closing purchase transaction in order to terminate its obligation under the option and must deliver the underlying security at the exercise price. As of December 31, 2019, the Trust did not hold any options contracts.
Securities Transactions and Investment Income –Securities transactions are recorded on a trade date basis. Realized gains and losses from securities transactions are recorded on the basis of identified cost. Dividend income is recorded on theex-dividend date. Distributions received from investments in REITs are recorded as dividend income onex-dividend date, subject to reclassification upon notice of the character of such distributions by the issuer. The portion of dividend attributable to the return of capital is recorded against the cost basis of the security. Withholding taxes on foreign dividends are recorded net of reclaimable amounts, at the time the related income is earned.Non-cash dividends included in dividend income, if any, are recorded at the fair market value of the securities received. Interest income, including accretion of original issue discount, where applicable, and accretion of discount on short-term investments, is recorded on the accrual basis.
Dividends and Distributions to Shareholders –Dividends from net investment income, if any, are declared and paid on a monthly basis. Income dividends and capital gain distributions to common shareholders are recorded on theex-dividend date. To the extent the Trust’s net realized capital gains, if any, can be offset by capital loss carryforwards, it is the policy of the Trust not to distribute such gains.
On August 5, 2008, the Trust acting in accordance with an exemptive order received from the SEC and with approval of the Board, adopted a managed distribution policy under which the Trust intends to make regular monthly cash distributions to common shareholders, stated in terms of a fixed amount per common share. This managed distribution policy permits the Trust to include long-term capital gains in its distribution as frequently as twelve times a year. In practice, the Board views this policy as a potential means of further supporting the market price of the Trust’s shares through the payment of a steady and predictable level of cash distributions to shareholders.
The current monthly distribution rate is $0.05 per share. The Trust continues to evaluate its monthly distribution policy in light of ongoing economic and market conditions and may change the amount of the monthly distributions in the future.
Use of Estimates –The preparation of financial statements, in conformity with U.S. GAAP, requires management to make estimates and assumptions that affect the reported amounts of assets and liabilities at the date of the financial statements and the reported amounts of expenses during the reporting year. Actual results could differ from those estimates.
| ANNUAL REPORT 2019 | 17 |
Table of Contents
Notes to Financial Statements continued
| 3. | Derivative Instruments |
The effect of derivative instruments on the Trust’s Statement of Operations for the year ended December 31, 2019 was as follows:
| Derivatives not accounted for as hedging instruments | Realized gain (loss) | |
Equity Risk | ||
Written options | $1,510,234 | |
For the year ended December 31, 2019, the averagemonth-end notional value of written options was $31,330,433.
4.Concentration of Risk
Under normal market conditions, the Trust’s investments will be concentrated in income-producing common equity securities, preferred securities, convertible securities andnon-convertible debt securities issued by companies deriving the majority of their revenue from the ownership, construction, financing, management and/or sale of commercial, industrial, and/or residential real estate. Values of the securities of such companies may fluctuate due to economic, legal, cultural, geopolitical or technological developments affecting various global real estate industries.
| 5. | Investment Management Agreement and Other Agreements |
Pursuant to an investment management agreement between the Advisor and the Trust, the Advisor is responsible for the daily management of the Trust’s portfolio of investments, which includes buying and selling securities for the Trust, as well as investment research. The Trust pays for investment advisory services and facilities through a fee payable monthly in arrears at an annual rate equal to 0.85% of the average daily value of the Trust’s managed assets plus certain direct and allocated expenses of the Advisor incurred on the Trust’s behalf. During the year ended December 31, 2019, the Trust incurred management fees of $9,717,156, of which $837,755 is payable as ofyear-end.
The Trust has multiple service agreements with the Bank of New York Mellon (“BNYM”). Under the servicing agreements, BNYM will perform custodial, fund accounting, and certain administrative services for the Trust. As custodian, BNYM is responsible for the custody of the Trust’s assets. As administrator, BNYM is responsible for maintaining the books and records of the Trust’s securities and cash.
Computershare is the Trust’s transfer agent and as such is responsible for performing transfer agency services for the Trust.
| 6. | Portfolio Securities |
For the year ended December 31, 2019, there were purchases and sales transactions (excluding short-term securities) of $572,309,233 and $513,494,918, respectively. These purchases and sales transaction amounts differ from the amounts disclosed on the Statement of Cash Flows primarily due to there-characterization of dividends from ordinary income to return of capital and capital gain.
7.Federal Income Taxes
The Trust intends to elect to be, and qualify for treatment as, a regulated investment company under Subchapter M of the Internal Revenue Code of 1986, as amended (the “Code”). A regulated investment company generally pays no federal income tax on the income and gains that it distributes. The Trust intends to meet the calendar year distribution requirements imposed by the Code to avoid the imposition of a 4% excise tax.
The Trust is required to evaluate tax positions taken or expected to be taken in the course of preparing the Trust’s tax returns to determine whether the tax positions are“more-likely-than-not” of being sustained by the applicable tax authority. Income tax and related interest and penalties would be recognized by the Trust as tax expense in the Statement of Operations if the tax positions were deemed to not meet themore-likely-than-not threshold. For the year ended December 31, 2019, the Trust did not incur any income tax, interest, or penalties. Management has analyzed the Trust’s tax positions taken on federal, state and local income tax returns for all open tax years (since inception) and has concluded that no provisions for federal, state and local income tax are required in the Trust’s financial statements.
| 18 | CBRE CLARION GLOBAL REAL ESTATE INCOME FUND |
Table of Contents
Notes to Financial Statements continued
The Trust distinguishes between dividends on a tax basis and on a financial reporting basis and only distributions in excess of tax basis earnings and profits are reported in the financial statements as a tax return of capital. Differences in the recognition or classification of income between the financial statements and tax earnings and profits which result in temporary over-distributions for financial statement purposes are classified as distributable earnings or accumulated losses in the composition of net assets on the Statement of Assets and Liabilities.
In order to presentpaid-in capital in excess of par and total distributable earnings /(Accumulated Loss) on the Statement of Assets and Liabilities that more closely represent their tax character, certain adjustments have been made to additionalpaid-in capital, and total distributable earnings. For the year ended December 31, 2019, the adjustments were to increase additionalpaid-in capital by $308,075 and decrease distributable earnings by $308,075 due to the difference in the treatment for book and tax purposes of passive foreign investment company(“PFIC”) investments and recognition of foreign currency gain(loss) as ordinary income(loss) and distribution reclasses. Results of operations and net assets were not affected by these reclassifications.
At December 31, 2019, the Trust had capital loss carryforwards which will reduce the Trust’s taxable income arising from future net realized gain on investments, if any, to the extent permitted by the code and thus will reduce the amount of distributions to shareholders which would otherwise be necessary to relieve the Trust of any liability for federal income tax.
The Regulated Investment Company Modernization Act of 2010 (the “Act”) eliminated the eight-year carryover period for capital losses that arise in taxable years beginning after its enactment date of December 22, 2010. Consequently, these capital losses can be carried forward for an unlimited period. However, capital losses with an expiration period may not be used to offset capital gains until all net capital losses without an expiration date have been utilized. Additionally, post-enactment capital loss carryovers will retain their character as either short-term or long-term capital losses instead of as short-term capital losses as under prior law. At December 31, 2019, the Trust had no expiring capital losses. The Trust had short-term capital losses of $21,624,969, with no expiration and long-term capital losses of $20,913,185, with no expiration.
Certain capital and qualified late year losses incurred after October 31 and within the current taxable year, are deemed to arise on the first business day of the Trust’s following taxable year. The Trust incurred and will defer qualified late ordinary year losses of $2,621,093 during 2019. There were no post-October losses incurred that will be deferred.
For the year ended December 31, 2019, the tax character of distributions paid, as reflected in the Statements of Changes in Net Assets, was $34,394,639 of ordinary income (reflected in the Statement of Changes in Net Assets as distributions from distributable earnings) and $35,559,657 of return of capital, respectively. For the year ended December 31, 2018, the tax character of distributions paid, as reflected in the Statements of Changes in Net Assets, was $19,584,966 of ordinary income and $50,369,330 of return of capital, respectively.
Information on the tax components of net assets as of December 31, 2019 is as follows:
| Cost of Investments for Tax Purposes | Gross Tax Unrealized Appreciation | Gross Tax Unrealized Depreciation | Net Tax Unrealized Depreciation on Investments | Net Tax Unrealized Appreciation on Foreign Currency | Qualified Late Year Ordinary Losses | Qualified Post- October Capital Deferral | Undistributed Long-Term Capital Gains/ (Accumulated Capital Loss) | |||||||
$1,115,295,931 | $115,336,116 | $(23,087,382) | $92,248,734 | $4,621 | $2,621,093 | $0 | $(42,538,417) |
| 8. | Borrowings |
The Trust has access to a secured line of credit up to $300,000,000 from BNYM for borrowing purposes. Borrowings under this arrangement bear interest at the Federal funds rate plus 75 basis points. At December 31, 2019, there were borrowings in the amount of $121,019,500 on the Trust’s line of credit.
The average daily amount of borrowings during the year ended December 31, 2019 was $139,593,877 with an average interest rate of 2.91%. The maximum amount outstanding for the year ended December 31, 2019, was $179,104,000. The Trust had borrowings under the line of credit for all 365 days during 2019.
| ANNUAL REPORT 2019 | 19 |
Table of Contents
Notes to Financial Statements concluded
| 9. | Capital |
During 2004, the Trust issued 101,000,000 shares of common stock at $15.00. In connection with the Trust’s Dividend Reinvestment Plan (“DRIP”), the Trust issued no common shares for the year ended December 31, 2019 and the year ended December 31, 2018, respectively. At December 31, 2019, the Trust had outstanding common shares of 116,590,494 with a par value of $0.001 per share. The Advisor owned none of the common shares outstanding as of December 31, 2019.
At December 31, 2019, the Trust had no shares of auction rate preferred securities outstanding.
| 10. | Indemnifications |
The Trust enters into contracts that contain a variety of indemnifications. The Trust’s exposure under these arrangements is unknown. However, the Trust has not had prior claims or losses or current claims or losses pursuant to these contracts.
| 11. | Subsequent Events |
Events or transactions that occur after the balance sheet date but before the financial statements are issued are categorized as recognized ornon-recognized for financial statement purposes. Since December 31, 2019, the Trust paid a dividend on January 31, 2020 of $0.05 per share for the month of January 2020. No other notable events have occurred betweenyear-end and the issuance of these financial statements.
| 20 | CBRE CLARION GLOBAL REAL ESTATE INCOME FUND |
Table of Contents
Registered Public Accounting Firm
To the Shareholders and Board of Trustees
CBRE Clarion Global Real Estate Income Fund:
Opinion on the Financial Statements
We have audited the accompanying statement of assets and liabilities of CBRE Clarion Global Real Estate Income Fund (the Trust), including the portfolio of investments, as of December 31, 2019, the related statements of operations and cash flows for the year then ended, the statements of changes in net assets for each of the years in thetwo-year period then ended, and the related notes (collectively, the financial statements) and the financial highlights for each of the years in thefive-year period then ended. In our opinion, the financial statements and financial highlights present fairly, in all material respects, the financial position of the Trust as of December 31, 2019, the results of its operations and its cash flows for the year then ended, the changes in its net assets for each of the years in thetwo-year period then ended, and the financial highlights for each of the years in thefive-year period then ended, in conformity with U.S. generally accepted accounting principles.
Basis for Opinion
These financial statements and financial highlights are the responsibility of the Trust’s management. Our responsibility is to express an opinion on these financial statements and financial highlights based on our audits. We are a public accounting firm registered with the Public Company Accounting Oversight Board (United States) (PCAOB) and are required to be independent with respect to the Trust in accordance with the U.S. federal securities laws and the applicable rules and regulations of the Securities and Exchange Commission and the PCAOB.
We conducted our audits in accordance with the standards of the PCAOB. Those standards require that we plan and perform the audit to obtain reasonable assurance about whether the financial statements and financial highlights are free of material misstatement, whether due to error or fraud. Our audits included performing procedures to assess the risks of material misstatement of the financial statements and financial highlights, whether due to error or fraud, and performing procedures that respond to those risks. Such procedures included examining, on a test basis, evidence regarding the amounts and disclosures in the financial statements and financial highlights. Such procedures also included confirmation of securities owned as of December 31, 2019, by correspondence with the custodian and brokers, or other appropriate procedures where replies were not received. Our audits also included evaluating the accounting principles used and significant estimates made by management, as well as evaluating the overall presentation of the financial statements and financial highlights. We believe that our audits provide a reasonable basis for our opinion.

We have served as the Trust’s auditor since 2014.
Philadelphia, Pennsylvania
February 25, 2020
| ANNUAL REPORT 2019 | 21 |
Table of Contents
Supplemental Information (unaudited)
Change to Portfolio Management Team
Kenneth S. Weinberg was added to the Fund’s portfolio management team in August 2019. Mr. Weinberg is a Principal and Senior Portfolio Manager of the Advisor. Mr. Weinberg joined CBRE Clarion Securities’ predecessor firm in 2004. Prior to that, Mr. Weinberg worked in various management and analyst positions in the real estate industry including positions with Legg Mason Wood Walker, Inc. and Prudential Real Estate Investors. Mr. Weinberg has over 28 years of real estate investment management experience.
Federal Income Tax Information
Qualified dividend income of as much as $10,939,504 was received by the Trust through December 31, 2019. The Trust intends to designate the maximum amount of dividends that qualify for the reduced tax rate pursuant to the Jobs and Growth Tax Relief Reconciliation Act of 2003.
For corporate shareholders, 1.09% of ordinary income distributions for the year ended December 31, 2019 qualified for the corporate dividends-received deduction.
In February 2020, you will be advised on IRS Form 1099 DIV or substitute 1099 DIV as to the federal tax status of the distributions received by you in the calendar year 2019.
Corporate Governance
The Fund submitted its Annual CEO certification for 2019 to the New York Stock Exchange (“NYSE”) on October 15, 2019 stating that the CEO was not aware of any violation by the Fund of the NYSE’s corporate governance listing standards. In addition, the Fund had filed the required CEO/CFO certifications regarding the quality of the Fund’s public disclosure as exhibits to theForms N-CSR andForms N-PORT filed by the Fund over the past fiscal year. The Fund’s FormN-CSR and FormN-PORT filings are available on the Commission’s website at www.sec.gov.
Result of Shareholder Votes
The Annual Meeting of Shareholders of the Fund was held on October 8, 2019.
With regard to the election of the following Trustees of the Fund, the voting results were as follows:
| Number of Shares In Favor | Number of Shares Withheld | |||||||
John R. Bartholdson | 94,167,940.968 | 8,219,404.406 | ||||||
Leslie E. Greis | 100,178,720.761 | 2,208,624.613 | ||||||
The other Trustees of the Fund whose terms did not expire in 2019 are Asuka Nakahara, T. Ritson Ferguson and Frederick S. Hammer. Richard L. Sutton, a former Trustee of the Fund, retired from the Board at the conclusion of his term in 2019.
| 22 | CBRE CLARION GLOBAL REAL ESTATE INCOME FUND |
Table of Contents
Supplemental Information (unaudited) continued
Trustees
The Trustees of the CBRE Clarion Global Real Estate Income Fund and their principal occupations during the past five years:
Name, Address and Age | Term of Office and Length of Time Served (1) | Title | Principal Occupations Five Years | Number of Portfolios in the Fund Complex Overseen by Trustee | Other Directorships Held by Trustee | |||||
| Trustees: | ||||||||||
T. Ritson Ferguson* 201 King of Prussia Road, Suite 600 Radnor, PA 19087 Age: 60 | 3 years/ since inception | Trustee, President and Chief Executive Officer | Chief Executive Officer and Co-Chief Investment Officer of CBRE Clarion Securities LLC (since 1995); Chief Executive Officer, Chief Investment Officer and Global Chief Investment Officer of CBRE Global Investors (2015 - 2019) | 1 | Duke Management Company (DUMAC) (since 2018) | |||||
Asuka Nakahara 201 King of Prussia Radnor, PA 19087 Age: 64 | 3 years/ since inception | Trustee | Associate Director of the Zell-Lurie Real Estate Center at the Wharton School, University of Pennsylvania (since 1999); Lecturer of Real Estate at the Wharton School, University of Pennsylvania (since 1999); Partner of Triton Atlantic Partners (since 2009) | 1 | Comcast Corporation (since 2017) | |||||
Frederick S. Hammer 201 King of Prussia Road, Suite 600 Radnor, PA 19087 Age: 83 | 3 years/ since inception | Trustee | Co-Chairman of IA Capital Group and a member of its investment committee (1994 - 2018) | 1 | Payall, Inc. (since 2018); Homeowners Insurance Corp. (since 2006); JetPay Corporation (2011 - 2016) | |||||
John R. Bartholdson 201 King of Prussia Road, Suite 600 Radnor, PA 19087 Age: 75 | 3 years/ 16 years | Trustee/Audit Committee Financial Expert | Senior Vice President, CFO and Treasurer, and a Director of Triumph Group, Inc. (1993 - 2007)(Retired) | 1 | Berwyn Cornerstone Fund, Berwyn Income Fund, and Berwyn Fund (2013 - 2016) | |||||
Leslie E. Greis 201 King of Prussia Road, Suite 600 Radnor, PA 19087 Age: 61 | 3 years/ 1 year | Trustee | Managing Member, Perennial Capital Advisors, LLC (2003 - present) | 1 | AIM Mutual, Inc. (2016 - present), Kinefac Corporation (2009 - present) | |||||
| (1) | Each Trustee is elected to serve a three-year term concurrent with the class of Trustees to which he or she belongs. Messrs. Ferguson and Hammer, as Class I Trustees, are currently serving a term expiring at the Trust’s 2020 annual meeting of shareholders. Mr. Hammer has informed the Board that he intends to retire from the Board upon the conclusion of his term and, therefore, will not stand forre-election at the 2020 annual meeting of shareholders. Mr. Nakahara, as Class II Trustee, is currently serving a term expiring at the Trust’s 2021 annual meeting of shareholders. Mr Bartholdson and Ms. Greis, as Class III Trustees, are each currently serving a term expiring at the Trust’s 2022 annual meeting of shareholders. |
| * | Mr. Ferguson is deemed to be an interested person of the Trust as defined in the Investment Company Act of 1940 (the “1940 ACT”), as amended, due to his position with the Advisor. |
| ANNUAL REPORT 2019 | 23 |
Table of Contents
Supplemental Information (unaudited) continued
Officers
The Officers of the CBRE Clarion Global Real Estate Income Fund and their principal occupations during the past five years:
Name, Address, Age and Position(s) Held with Registrant | Length of Time Served | Principal Occupations During the Past Five Years and Other Affiliations | ||
| Officers: | ||||
Jonathan A. Blome 201 King of Prussia Road, Suite 600 Radnor, PA 19087 Age: 42 Chief Financial Officer | since 2006 | Chief Financial Officer and Director of Operations of CBRE Clarion Securities LLC (since 2011) | ||
Robert S. Tull III 201 King of Prussia Road, Suite 600 Radnor, PA 19087 Age: 42 Chief Compliance Officer and Secretary | since 2019 | Chief Compliance Officer of CBRE Clarion Securities LLC (since 2008); Global Chief Compliance Officer for CBRE Global Investors (2017 - 2018) | ||
| 24 | CBRE CLARION GLOBAL REAL ESTATE INCOME FUND |
Table of Contents
Supplemental Information (unaudited) continued
Board Considerations in Approving the Advisory Agreement
At a meeting of the Board held on December 3, 2019, the Board approved the continuation of the investment management agreement (the “Advisory Agreement”) between the Advisor and the Trust through December 31, 2020. Overall, the Board concluded that continuation of the Advisory Agreement was in the best interests of the Trust and consistent with the expectations of its shareholders. In determining to approve the continuation of the Advisory Agreement, the Board took into account a number of factors, in each case in the context of the specific facts and circumstances of the Trust and without assigning relative weight to any factor or identifying any factor as determinative.
In approving the continuation of the Advisory Agreement, the Board reviewed the nature, extent and quality of advisory services and administrative services provided by the Advisor, including the performance achieved by the Advisor for the Trust in varying market environments. The Board considered the consistency of the Advisor’s investment decision-making process, the experience of the Advisor’s personnel, the stability of the Advisor and its parent company, and the continuing commitment of the Advisor’s executive management team and management committee to the operation and management of the Trust, noting certain recent and upcoming changes to the executive management team and management committee. The Board also considered the administrative resources devoted by the Advisor to oversight of the Trust’s operations, without separate charge to the Trust. The Board noted the Trust’s strategic focus on providing income to its shareholders and discussed current industry and economic trends and conditions. In reviewing the Trust’s performance, the Board considered information relating to the reported performance and fees and expenses of comparableclosed-end real estate funds (“peer group funds”) and the Advisor’s view as to the reasons for performance differences, including the Trust’s global investment mandate, its focus on providing income and minimal use of leverage as compared to certain of the peer group funds and the Trust’s overall risk profile. The Board also considered information relating to the reported performance and fees and expenses ofopen-end real estate funds, as a point of reference. The Board concluded that the quality of the services provided to the Trust by the Advisor, including the performance achieved for the Trust relative to its primary and secondary investment objectives, was satisfactory and supported the continued retention of the Advisor by the Trust.
The Board also considered the level of compensation to which the Advisor is entitled under the Advisory Agreement and concluded that fees paid to the Advisor by the Trust are not excessive and that the advisory fee rate is reasonable under the circumstances of the Trust. In reaching this conclusion, the Board considered the Trust’s advisory fee structure and the methodology with which the Advisor’s fee is calculated. The Board also considered information provided by the Advisor with respect to the profits realized by the Advisor as a result of its services to the Trust, including the factors considered by the Advisor in determining such profits, and the Advisor’s profitability in connection with its management of other advisory accounts and its services assub-advisor to certain funds and separate accounts. The Board also considered the fact that the Trust’s advisory fee had remained comparable to that of peer group funds (some of which funds are charged separately for administrative services provided by their investment managers) while its total expense ratio, both including and excluding interest on debt, was competitive with the average expense ratio of peer group funds. Additionally, the Board considered the extent to which the Advisor might benefit indirectly from its relationship with the Trust.
| ANNUAL REPORT 2019 | 25 |
Table of Contents
Supplemental Information (unaudited) concluded
Additional Information
Statement of Additional Information includes additional information regarding the Trustees. This information is available upon request, without charge, by calling the following toll-free telephone number:1-888-711-4272.
The Trust has delegated the voting of the Trust’s voting securities to the Trust’s advisor pursuant to the proxy voting policies and procedures of the advisor. You may obtain a copy of these policies and procedures by calling1-888-711-4272. The policies may also be found on the website of the SEC (http://www.sec.gov).
Information regarding how the Trust voted proxies for portfolio securities, if applicable, during the most recent12-month period ended December 31, is also available, without charge and upon request by calling the Trust at1-888-711-4272 or by accessing the Trust’sForm N-PX on the Commission’s website at http://www.sec.gov.
The Trust files its complete schedule of portfolio holdings with the SEC for the first and third quarters of each fiscal year on FormN-PORT. Copies of the filings are available by visiting the SEC website at www.sec.gov. The filed forms may also be viewed and copied at the Commission’s Public Reference Room in Washington, DC. Information regarding the operations of the Public Reference Room may be obtained by calling(800) SEC-0330.
Beginning on January 1, 2021, as permitted by regulations adopted by the Securities and Exchange Commission, paper copies of the Fund’s shareholder reports like this one will no longer be sent by mail, unless you specifically request paper copies. Instead, the reports will be made available on a website, and you will be notified by mail each time a report is posted and provided with a website link to access the report.
You may elect to receive all future reports in paper free of charge. If you hold your shares through a financial intermediary (like a broker), you can inform the intermediary that you wish to continue receiving paper copies of your shareholder reports. If you are the registered owner of your shares, you should contact the Fund’s transfer agent.
Dividend Reinvestment Plan (unaudited)
Pursuant to the Trust’s Dividend Reinvestment Plan (the “Plan”), shareholders of the Trust are automatically enrolled, to have all distributions of dividends and capital gains reinvested by The Bank of New York Mellon (the “Plan Agent”) in the Trust’s shares pursuant to the Plan. You may elect not to participate in the Plan and to receive all dividends in cash by sending written instructions or by contacting The Bank of New York Mellon, as dividend disbursing agent, at the address set forth below. Participation in the Plan is completely voluntary and may be terminated or resumed at any time without penalty by contacting the Plan Agent before the dividend record date; otherwise such termination or resumption will be effective with respect to any subsequently declared dividend or other distribution. Shareholders who do not participate in the Plan will receive all distributions in cash paid by check and mailed directly to the shareholders of record (or if the shares are held in street or other nominee name, then to the nominee) by the Plan Agent, which serves as agent for the shareholders in administering the Plan.
After the Trust declares a dividend or determines to make a capital gain distribution, the Plan Agent will acquire shares for the participants’ account, depending upon the circumstances described below, either (i) through receipt of unissued but authorized shares from the Trust (“newly issued shares”) or (ii) by open market purchases. If, on the dividend payment date, the NAV is equal to or less than the market price per share plus estimated brokerage commissions (such condition being referred to herein as “market premium”), the Plan Agent will invest the dividend amount in newly issued shares on behalf of the participants. The number of newly issued shares to be credited to each participant’s account will be determined by dividing the dollar amount of the dividend by the NAV on the date the shares are issued. However, if the NAV is less than 95% of the market price on the payment date, the dollar amount of the dividend will be divided by 95% of the market price on the payment date. If, on the dividend payment date, the NAV is greater than the market value per share plus estimated brokerage commissions (such condition being referred to herein as “market discount”), the Plan Agent will invest the dividend amount in shares acquired on behalf of the participants in open-market purchases.
The Plan Agent’s fees for the handling of the reinvestment of dividends and distributions will be paid by the Trust. However, each participant will pay a pro rata share of brokerage commissions incurred with respect to the Plan Agent’s open market purchases in connection with the reinvestment of dividends and distributions. The automatic reinvestment of dividends and distributions will not relieve participants of any Federal income tax that may be payable on such dividends or distributions.
The Trust reserves the right to amend or terminate the Plan. There is no direct service charge to participants in the Plan; however, the Trust reserves the right to amend the Plan to include a service charge payable by the participants. Participants that request a sale of shares through the Plan Agent are subject to a $2.50 sales fee and a $0.15 per share sold brokerage commission. All correspondence concerning the Plan should be directed to the Plan Agent at Computershare Shareowner Services LLC, P.O. Box 505000, Louisville, KY 40233, Phone Number:(866) 221-1580.
| 26 | CBRE CLARION GLOBAL REAL ESTATE INCOME FUND |
Table of Contents
CBRE CLARION GLOBAL REAL ESTATE INCOME FUND
BOARD OF TRUSTEES
T. RITSON FERGUSON
ASUKA NAKAHARA
FREDERICK S. HAMMER
JOHN R. BARTHOLDSON
LESLIE E. GREIS
OFFICERS
T. RITSON FERGUSON
PRESIDENT AND
CHIEF EXECUTIVE OFFICER
JONATHAN A. BLOME
CHIEF FINANCIAL OFFICER
ROBERT S. TULL III
CHIEF COMPLIANCE OFFICER
AND SECRETARY
INVESTMENT ADVISOR
CBRE CLARION SECURITIES LLC
201 KING OF PRUSSIA ROAD, SUITE 600
RADNOR, PA 19087
888-711-4272
ADMINISTRATOR AND CUSTODIAN
THE BANK OF NEW YORK MELLON
NEW YORK, NEW YORK
TRANSFER AGENT
COMPUTERSHARE
LOUISVILLE, KENTUCKY
LEGAL COUNSEL
MORGAN, LEWIS & BOCKIUS LLP
WASHINGTON, DC
INDEPENDENT REGISTERED PUBLIC ACCOUNTING FIRM
KPMG LLP
PHILADELPHIA, PENNSYLVANIA
Table of Contents
| Item 2. | Code of Ethics. |
| (a) | The Trust, as of the end of the period covered by this report, has adopted a Code of Ethics for Senior Financial Officers (the “Financial Officer Code of Ethics”) that applies to the Trust’s principal executive officer, principal financial officer, principal accounting officer or controller, or persons performing similar functions, regardless of whether these individuals are employed by the Trust or a third party. |
| (b) | Not applicable. |
| (c) | There have been no amendments, during the period covered by this report, to a provision of the Financial Officer Code of Ethics that applies to the Trust’s principal executive officer, principal financial officer, principal accounting officer or controller, or persons performing similar functions, regardless of whether these individuals are employed by the Trust or a third party, and that relates to any element of the code of ethics description. |
| (d) | The Trust has not granted any waivers, including an implicit waiver, from a provision of the Financial Officer Code of Ethics that applies to the Trust’s principal executive officer, principal financial officer, principal accounting officer or controller, or persons performing similar functions, regardless of whether these individuals are employed by the Trust or a third party, that relates to one or more of the items set forth in paragraph (b) of this item’s instructions. |
| (e) | Not applicable. |
| (f) | The Trust’s Financial Officer Code of Ethics is attached hereto as an exhibit. |
| Item 3. | Audit Committee Financial Expert. |
All of the members of the audit committee have the business and financial experience necessary to understand the fundamental financial statements of aclosed-end, registered investment company; further, each member of the committee is financially literate, as such qualification is interpreted by the Board of Trustees in its business judgment. In addition, the Board has determined that John R. Bartholdson is an “audit committee financial expert” and “independent” as those terms are defined in Item 3 of FormN-CSR.
| Item 4. | Principal Accountant Fees and Services. |
Audit Fees
| (a) | The aggregate fees billed for each of the last two fiscal years for professional services rendered by the principal accountant for the audit of the Trust’s annual financial statements or services that are normally provided by the accountant in connection with statutory and regulatory filings or engagements for those fiscal years are $50,000 for 2019 and $50,000 for 2018. |
Table of Contents
Audit-Related Fees
| (b) | The aggregate fees billed in each of the last two fiscal years for assurance and related services by the principal accountant that are reasonably related to the performance of the audit of the Trust’s financial statements and are not reported under paragraph (a) of this Item are $0 for 2019 and $0 for 2018. |
Tax Fees
| (c) | The aggregate fees billed in each of the last two fiscal years for professional services rendered by the principal accountant for tax compliance, tax advice, and tax planning are $24,000 for 2019 and $24,000 for 2018. Services include income tax return services including the review and signing of the Trust’s Form1120-RIC as prepared by the Trust’s administrator. |
All Other Fees
| (d) | The aggregate fees billed in each of the last two fiscal years for products and services provided by the principal accountant, other than the services reported in paragraphs (a) through (c) of this Item are $15,300 for 2019 and $13,200 for 2018. These services consisted of certain filings to reclaim taxes paid to European countries by the Trust. |
(e)(1) | (i) The Trust has an Audit Committee Charter in place (the “Charter”) that governs thepre-approval by the Trust’s Audit Committee of all engagements for audit services and all CoveredNon-Audit Engagements (as defined in the Charter) provided by the Trust’s independent auditor (the “Independent Auditor”) to the Trust and other “Related Entities” (as defined below). Each calendar year, the Audit Committee will review andre-approve the Charter, together with any changes deemed necessary or desirable by the Audit Committee. The Audit Committee may, from time to time, modify the nature of the servicespre-approved, the aggregate level of feespre-approved, or both. |
“Related Entities” means (i) CBRE Clarion Securities LLC (the “Advisor”) or (ii) any entity controlling, controlled by or under common control with the Advisor.
Pre-approval shall be required only with respect tonon-audit services (i) related directly to the operations and financial reporting of the Trust and (ii) provided to a Related Entity that furnishes ongoing services to the Trust. Suchpre-approval shall not apply tonon-audit services provided to anysub-adviser whose role is primarily portfolio management and is subcontracted with or overseen by another investment adviser.Pre-approval by the Audit Committee of suchnon-audit services shall be effected pursuant to thepre-approval procedures described in the Charter. The Charter shall not be violated ifpre-approval of any suchnon-audit service is not obtained in circumstances in which thepre-approval requirement is waived under applicable rules promulgated by the Securities and Exchange Commission (“SEC”) or the NYSE, in accordance with the Sarbanes Oxley Act.
Table of Contents
Requests forpre-approval of CoveredNon-Audit Engagements are submitted to the Audit Committee by the Independent Auditor and by the chief financial officer of the Related Entity for which thenon-audit services are to be performed. Such requests must include a statement as to whether, in the view of the Independent Auditor and such officer, (a) the request is consistent with the SEC’s rules on auditor independence and (b) the requested service is or is not anon-audit service prohibited by the SEC. A request submitted between scheduled meetings of the Audit Committee should state the reason that approval is being sought prior to the next regularly scheduled meeting of the Audit Committee.
Between regularly scheduled meetings of the Audit Committee, the Committee Chairman or Audit Committee Financial Expert shall have the authority topre-approve CoveredNon-Audit Engagements, provided that fees associated with such engagement do not exceed $10,000 and the services to be provided do not involve provision of any of the following services by the Independent Auditor: (i) bookkeeping or other services related to the accounting records or financial statements of the audit client; (ii) financial information systems design and implementation; (iii) appraisal or valuation services, fairness opinions, orcontribution-in-kind reports; (iv) actuarial services; (v) internal audit outsourcing services; (vi) management functions; (vii) human resources; (vii) broker dealer, investment advisor or investment banking services; (ix) legal services; or (x) expert services unrelated to the audit.
Fee levels for all Covered Services to be provided by the Independent Auditor andpre-approved under this Policy will be established annually by the Audit Committee. Any increase inpre-approved fee levels will require specificpre-approval by the Audit Committee.
The terms and fees of the annual Audit services engagement for the Trust are subject to the specificpre-approval of the Audit Committee. The Audit Committee will approve, if necessary, any changes in terms, conditions or fees resulting from changes in audit scope, Trust structure or other matters.
(e)(2) | 100% percent of services described in each of paragraphs (b) through (d) of this Item were approved by the Trust’s audit committee pursuant to paragraph (c)(7)(i)(C) of Rule2-01 of RegulationS-X. |
| (f) | The percentage of hours expended on the principal accountant’s engagement to audit the Trust’s financial statements for the most recent fiscal year that were attributed to work performed by persons other than the principal accountant’s full-time, permanent employees was less than fifty percent. |
| (g) | The aggregatenon-audit fees billed by the Trust’s accountant for services rendered to the Trust, and rendered to the Trust’s investment adviser (not including anysub-adviser whose role is primarily portfolio management and is subcontracted with or overseen by another investment adviser), and any entity controlling, controlled by, or under common control with the adviser that provides ongoing services to the Trust for each of the last two fiscal years of the Trust was $407,950 for 2019 and $396,600 for 2018. |
| (h) | The registrant’s audit committee of the board of trustees has considered whether the provision ofnon-audit services that were rendered to the registrant’s investment adviser (not including anysub-adviser whose role is primarily portfolio management and is subcontracted with or overseen by another investment adviser), and any entity controlling, controlled by, or under common control with the investment adviser that provides ongoing services to the registrant that were notpre-approved pursuant to paragraph (c)(7)(ii) of Rule2-01 of RegulationS-X is compatible with maintaining the principal accountant’s independence. |
Table of Contents
| Item 5. | Audit Committee of Listed Registrants. |
| (a) | The Trust has a separately designated audit committee consisting of all the independent trustees of the Trust. The members of the audit committee are: Frederick S. Hammer, Asuka Nakahara, John R. Bartholdson and Leslie Greis. |
| (b) | Not applicable. |
| Item 6. | Investments. |
| (a) | Schedule of Investments in securities of unaffiliated issuers as of the close of the reporting period is included as part of the report to shareholders filed under Item 1 of this form. |
| (b) | Not applicable. |
| Item 7. | Disclosure of Proxy Voting Policies and Procedures forClosed-End Management Investment Companies. |
The Trust has delegated the voting of proxies relating to its voting securities to the Advisor, pursuant to the proxy voting procedures of the Advisor. The Trust’s and the Advisor’s Proxy Voting Policies and Procedures are included as an exhibit hereto.
| Item 8. | Portfolio Managers ofClosed-End Management Investment Companies. |
(a)(1)
As ofMarch 4, 2020:
T. Ritson Ferguson
Principal, Chief Executive Officer and Global Chief Investment Officer, CBRE Clarion Securities LLC since1992
Steven D. Burton
Principal, andCo-Chief Investment Officer, CBRE Clarion Securities LLC since 1995
Joseph P. Smith
Principal, President andCo-Chief Investment Officer, CBRE Clarion Securities LLC since 1997
Kenneth S, Weinberg
Principal and Portfolio Manager, CBRE Clarion Securities LLC since 2004
Table of Contents
(a)(2) Other AccountsManaged (as of December 31, 2019).
The Portfolio Managers are also collectively responsible for theday-to-day management of the Advisor’s other accounts, as indicated by the following table.
Name of Portfolio Managers | Type of Accounts | Number of Accounts Managed | Total Assets in the Accounts | Managed with Advisory Fee Based on Performance | Managed with Advisory Fee Based on Performance | |||||||||
T. Ritson Ferguson | Registered Investment Companies | 7 | $ | 4,035,592,861 | 0 | $ | 0 | |||||||
| Other Pooled Investment Vehicles | 17 | $ | 1,462,576,971 | 1 | $ | 89,928,003 | ||||||||
| Other Accounts | 29 | $ | 2,425,539,466 | 3 | $ | 134,304,372 | ||||||||
Steven D. Burton | Registered Investment Companies | 4 | $ | 3,076,158,824 | 0 | $ | 0 | |||||||
| Other Pooled Investment Vehicles | 11 | $ | 1,231,457,746 | 1 | $ | 89,928,003 | ||||||||
Other Accounts | 19 | $ | 1,265,291,186 | 3 | $ | 134,304,372 | ||||||||
Joseph P. Smith | Registered Investment Companies | 6 | $ | 3,773,163,214 | 0 | $ | 0 | |||||||
| Other Pooled Investment Vehicles | 11 | $ | 1,122,656,572 | 1 | $ | 89,928,003 | ||||||||
| Other Accounts | 28 | $ | 2,413,510,181 | 3 | $ | 134,304,372 | ||||||||
Kenneth S. Weinberg | Registered Investment Companies | 6 | $ | 3,773,163,214 | 0 | $ | 0 | |||||||
| Other Pooled Investment Vehicles | 10 | $ | 1,114,727,573 | 1 | $ | 89,928,003 | ||||||||
Other Accounts | 28 | $ | 2,413,510,181 | 3 | $ | 134,304,372 | ||||||||
Table of Contents
Potential Conflicts of Interests
A portfolio manager may be subject to potential conflicts of interest because the portfolio manager is responsible for other accounts in addition to the Trust. These other accounts may include, among others, otherclosed-end funds, mutual funds, separately managed advisory accounts, commingled trust accounts, insurance separate accounts, wrap fee programs, and hedge funds. Potential conflicts may arise out of the implementation of differing investment strategies for a portfolio manager’s various accounts, the allocation of investment opportunities among those accounts or differences in the advisory fees paid by the portfolio manager’s accounts.
A potential conflict of interest may arise as a result of a portfolio manager’s responsibility for multiple accounts with similar investment guidelines. Under these circumstances, a potential investment may be suitable for more than one of the portfolio manager’s accounts, but the quantity of the investment available for purchase is less than the aggregate amount the accounts would ideally devote to the opportunity. Similar conflicts may arise when multiple accounts seek to dispose of the same investment.
A portfolio manager may also manage accounts whose objectives and policies differ from those of the Trust. These differences may be such that under certain circumstances, trading activity appropriate for one account managed by the portfolio manager may have adverse consequences for another account managed by the portfolio manager. For example, if an account were to sell a significant position in a security, which could cause the market price of that security to decrease while the Trust maintained its position in that security.
A potential conflict may arise when a portfolio manager is responsible for accounts that have different advisory fees – the difference in the fees may create an incentive for the portfolio manager to favor one account over another, for example, in terms of access to particularly appealing investment opportunities. This conflict may be heightened where an account is subject to a performance-based fee.
CBRE Clarion recognizes the duty of loyalty it owes to its clients and has established and implemented certain policies and procedures designed to control and mitigate conflicts of interest arising from the execution of a variety of portfolio management and trading strategies across the firm’s diverse client base. Such policies and procedures include, but are not limited to: (i) investment process, portfolio management, and trade allocation procedures; (ii) procedures regarding short sales in securities recommended for other clients; and (iii) procedures regarding personal trading by the firm’s employees (contained in the Code of Ethics).
(a)(3) Compensation Structure of Portfolio Manager(s) or Management Team Members
In principle, portfolio manager compensation is not based on the performance of any particular account, including the Fund, nor is compensation based on the level of Fund assets.
Table of Contents
Compensation for each portfolio manager is structured as follows:
Base Salary—Each portfolio manager receives a base salary. Base salaries have been established at a competitive market levels and are set forth in the portfolio manager’s employment agreement. An annual adjustment is made based on changes in the consumer price index. Base salaries are be reviewed periodically by the CBRE Clarion Compensation Committee and its Board of Directors, but adjustments are expected to be relatively infrequent.
Bonus—Portfolio manager bonuses are drawn from an incentive compensation pool into which a significant percentage of firm’spre-tax profits is set aside. Incentive compensation allocations are determined by the Compensation Committee based on a variety of factors, including the performance of particular investment strategies. To avoid the pitfalls of relying solely on a rigid performance format, however, incentive compensation decisions also take into account other important factors, such as the portfolio manager’s contribution to the team, firm, and overall investment process. Each of the portfolio managers is a member of the Committee. Incentive compensation allocations are reported to the Board of Directors, but the Board’s approval is not required.
Deferred Compensation—CBRE Clarion requires deferral of a percentage of incentive compensation exceeding a certain threshold in respect of a single fiscal year. The Compensation Committee may, in its discretion, require the deferral of additional amounts. Such deferred amounts are subject to the terms of a Deferred Bonus Plan adopted by the Board of Directors. The purpose of the Deferred Bonus Plan is to foster the retention of key employees, to focus plan participants on value creation and growth and to encourage continued cooperation among key employees in providing services to CBRE Clarion’s clients. The value of deferred bonus amounts is tied to the performance of CBRE Clarion investment funds chosen by the Compensation Committee; provided, that the Committee may elect to leave a portion of the assets uninvested. Deferred compensation vests incrementally,one-third after 2 years, 3 years and 4 years. The Deferred Bonus Plan provides for forfeiture upon voluntary termination of employment, termination for cause or conduct detrimental to the firm.
Profit Participation—Each of the portfolio managers is a principal and owns shares of the firm. The firm distributes its income to its owners each year, so each portfolio manager receives income distributions corresponding to his ownership share. Ownership is structured so that the firm’s principals receive an increasing share of the firm’s profit over time. In addition, a principal may forfeit a portion of his ownership if he resigns voluntarily.
Other Compensation—Portfolio managers may also participate in benefit plans and programs available generally to all employees, such as CBRE Group’s 401(k) plan.
Table of Contents
(a)(4) Disclosure of Securities Ownership
Name of Portfolio Managers | Dollar Value of Trust Shares Beneficially Owned | |
T. Ritson Ferguson | $100,001 to $500,000 | |
Steven D. Burton | $100,001 to $500,000 | |
Joseph P. Smith | $10,001-$50,000 | |
Kenneth S. Weinberg | none |
| (b) | Not applicable |
| Item 9. | Purchases of Equity Securities byClosed-End Management Investment Company and Affiliated Purchasers. |
Not applicable.
| Item 10. | Submission of Matters to a Vote of Security Holders. |
Not applicable.
| Item 11. | Controls and Procedures. |
| (a) | The Trust’s principal executive officer and principal financial officer have evaluated the Trust’s disclosure controls and procedures within a half-year of this filing and have concluded that the Trust’s disclosure controls and procedures were effective, as of that date, in ensuring that information required to be disclosed by the Trust in this FormN-CSR was recorded, processed, summarized, and reported timely. |
| (b) | The Trust’s principal executive officer and principal financial officer are aware of no changes in the Trust’s internal control over financial reporting that occurred during the period covered by this report that has materially affected, or is reasonably likely to materially affect, the Trust’s internal control over financial reporting. |
| Item 12. | Disclosure of Securities Lending Activities forClosed-End Management Investment Companies. |
Not applicable.
| Item 13. | Exhibits. |
| (a)(1) | Financial Officer Code of Ethics | |||
| (a)(2) | Certifications pursuant to Rule30a-2(a) under the 1940 Act and Section 302 of the Sarbanes-Oxley Act of 2002 are attached hereto. | |||
Table of Contents
| (a)(3) | Not applicable. | |||
| (a)(4) | Not applicable. | |||
| (b) | Certifications pursuant to Rule30a-2(b) under the 1940 Act and Section 906 of the Sarbanes-Oxley Act of 2002 are attached hereto. | |||
| (c) | Proxy Voting Policies and Procedures. | |||
| (d) | Notices to Trust’s common shareholders in accordance with Investment Company Act Section 19(a) and Rule19a-1.(1) | |||
The Trust has received exceptive relief from the Securities and Exchange Commission permitting it to make periodic distributions of long-term capital gains with respect to its outstanding common stock as frequently as twelve times each year. This relief is conditioned, in part, on an undertaking by the Trust to make the disclosures to the holders of the Trust’s common shares, in addition to the information required by Section 19(a) of the Investment Company Act and Rule19a-1 thereunder. The Trust is likewise obligated to file with the Commission the information contained in any such notice to shareholders and, in that regard, has attached hereto copies of each such notice made during the period.
Table of Contents
SIGNATURES
Pursuant to the requirements of the Securities Exchange Act of 1934 and the Investment Company Act of 1940, the registrant has duly caused this report to be signed on its behalf by the undersigned, thereunto duly authorized.
(Registrant) CBRE Clarion Global Real Estate Income Fund | ||
| By (Signature and Title)* /s/T. Ritson Ferguson | ||
| T. Ritson Ferguson | ||
| President and Chief Executive Officer | ||
| Date March 4, 2020 | ||
Pursuant to the requirements of the Securities Exchange Act of 1934 and the Investment Company Act of 1940, this report has been signed below by the following persons on behalf of the registrant and in the capacities and on the dates indicated.
| By (Signature and Title)*/s/T. Ritson Ferguson | ||
T. Ritson Ferguson | ||
| President and Chief Executive Officer | ||
| Date March 4, 2020 | ||
| By (Signature and Title)* /s/Jonathan A. Blome | ||
Jonathan A. Blome | ||
| Chief Financial Officer | ||
| Date March 4, 2020 | ||
| * | Print the name and title of each signing officer under his or her signature. |