Exhibit 99.1
China Life Insurance Company Limited Stock Code: 2628 INTERIM REPORT 2020
2
FINANCIAL SUMMARY
MAJOR FINANCIAL DATA AND INDICATORS
| RMB million | ||||||||||||
| As at 30 June 20201 | As at 31 December 2019 | Increase/ Decrease from the end of 2019 | ||||||||||
Total assets | 3,966,033 | 3,726,734 | 6.4 | % | ||||||||
Including: Investment assets2 | 3,781,024 | 3,573,154 | 5.8 | % | ||||||||
Equity holders’ equity | 415,906 | 403,764 | 3.0 | % | ||||||||
Ordinary share holders’ equity per share3 (RMB per share) | 14.44 | 14.01 | 3.1 | % | ||||||||
Ratio of assets and liabilities4 (%) | 89.36 | 89.02 | | An increase of 0.34 percentage point | | |||||||
| January to June 20201 | January to June 2019 | Increase/ Decrease from the corresponding period in 2019 | ||||||||||
Total revenues | 504,431 | 448,221 | 12.5 | % | ||||||||
Including: Net premiums earned | 407,936 | 361,297 | 12.9 | % | ||||||||
Profit before income tax | 35,564 | 38,893 | -8.6 | % | ||||||||
Net profit attributable to equity holders of the Company | 30,535 | 37,599 | -18.8 | % | ||||||||
Net profit attributable to ordinary share holders of the Company | 30,334 | 37,403 | -18.9 | % | ||||||||
Earnings per share (basic and diluted)3 (RMB per share) | 1.07 | 1.32 | -18.9 | % | ||||||||
Weighted average ROE (%) | 7.36 | 11.14 | | A decrease of 3.78 percentage points | | |||||||
Net cash inflow/(outflow) from operating activities | 182,792 | 150,290 | 21.6 | % | ||||||||
Net cash inflow/(outflow) from operating activities per share3 (RMB per share) | 6.47 | 5.32 | 21.6 | % | ||||||||
| Notes: |
| 1. | The interim financial results of the Company are unaudited. | |
| 2. | Investment assets = Cash and cash equivalents + Securities at fair value through profit or loss + Available-for-sale securities + Held-to-maturity securities + Term deposits + Derivative financial assets + Securities purchased under agreements to resell + Loans + Statutory deposits– restricted + Investment properties + Investments in associates and joint ventures | |
| 3. | In calculating the percentage changes of “Ordinary share holders’ equity per share”, “earnings per share (basic and diluted)”, and “Net cash inflow/(outflow) from operating activities per share”, the tail differences of the basic figures have been taken into account. | |
| 4. | Ratio of assets and liabilities = Total liabilities/Total assets |
3
MAJOR ITEMS OF THE CONSOLIDATED FINANCIAL STATEMENTS AND THE REASONS FOR CHANGE
| RMB million | ||||||||||||||
Major Items of the Consolidated Statement of Financial Position | As at 30 June 2020 | As at 31 December 2019 | Change | Main Reasons for Change | ||||||||||
Term deposits | 536,256 | 535,260 | 0.2 | % | — | |||||||||
Held-to-maturity securities | 1,001,314 | 928,751 | 7.8 | % | An increase in the allocation of government agency bonds | |||||||||
Available-for-sale securities | 1,052,029 | 1,058,957 | -0.7 | % | — | |||||||||
Securities at fair value through profit or loss | 150,399 | 141,608 | 6.2 | % | An increase in the scale and fair value of stocks in securities at fair value through profit or loss | |||||||||
Securities purchased under agreements to resell | 61,202 | 4,467 | 1,270.1 | % | The needs for liquidity management | |||||||||
Cash and cash equivalents | 80,889 | 53,306 | 51.7 | % | The needs for liquidity management | |||||||||
Loans | 651,388 | 608,920 | 7.0 | % | An increase in certificate of deposit and policy loans | |||||||||
Investment properties | 13,450 | 12,141 | 10.8 | % | New investments in investment properties | |||||||||
Investments in associates and joint ventures | 227,764 | 222,983 | 2.1 | % | New investments in associates and joint ventures and an increase in the equity of associates and joint ventures | |||||||||
Insurance contracts | 2,858,092 | 2,552,736 | 12.0 | % | The accumulation of insurance liabilities from new policies and renewal business | |||||||||
Investment contracts | 284,882 | 267,804 | 6.4 | % | An increase in the scale of universal insurance accounts | |||||||||
Securities sold under agreements to repurchase | 48,127 | 118,088 | -59.2 | % | The needs for liquidity management | |||||||||
Annuity and other insurance balances payable | 54,774 | 51,019 | 7.4 | % | An increase in maturities payable | |||||||||
Interest-bearing loans and other borrowingsNote | 20,361 | 20,045 | 1.6 | % | — | |||||||||
Equity holders’ equity | 415,906 | 403,764 | 3.0 | % | Due to the combined impact of total comprehensive income and profit distribution during the Reporting Period | |||||||||
| Note: | Interest-bearing loans and other borrowings include a five-year bank loan of GBP275 million with a maturity date on 25 June 2024, a five-year bank loan of USD860 million with a maturity date on 16 September 2024, a six-month bank loan of EUR127 million with a maturity date on 13 July 2020, which is automatically renewed upon maturity pursuant to the terms of the agreement, and a six-month bank loan of EUR78 million with a maturity date on 2 July 2020, which is automatically renewed upon maturity pursuant to the terms of the agreement. All the above are fixed rate loans. A five-year bank loan of USD970 million with a maturity date on 27 September 2024, a three-year loan of EUR400 million with a maturity date on 6 December 2020, and a one-year bank loan of USD28 million with a maturity date on 6 November 2020, which are floating rate loans. |
4
| RMB million | ||||||||||||||
Major Items of the Consolidated Statement of Comprehensive Income | January to June 2020 | January to June 2019 | Change | Main Reasons for Change | ||||||||||
Net premiums earned | 407,936 | 361,297 | 12.9 | % | — | |||||||||
Life insurance business | 345,591 | 307,009 | 12.6 | % | Due to the steady growth of life insurance business | |||||||||
Health insurance business | 54,693 | 46,989 | 16.4 | % | The expansion of health insurance business by the Company | |||||||||
Accident insurance business | 7,652 | 7,299 | 4.8 | % | — | |||||||||
Investment income | 72,706 | 66,345 | 9.6 | % | An increase in interest income from investment with fixed maturity dates | |||||||||
Net realised gains on financial assets | 10,807 | 3,786 | 185.4 | % | An increase in spread income of funds in available-for-sale securities | |||||||||
Net fair value gains through profit or loss | 8,606 | 13,107 | -34.3 | % | A decrease in profit or loss in fair value of stocks in securities at fair value through profit or loss | |||||||||
Net gains on investments of associates and joint ventures | 4,020 | 5,665 | -29.0 | % | A decrease in the profits of certain associates and the impact of impairment | |||||||||
Other income | 4,376 | 3,686 | 18.7 | % | An increase in commission fees from agency services for CLP&C | |||||||||
Insurance benefits and claims expenses | 371,950 | 330,049 | 12.7 | % | An increase in insurance contract liabilities | |||||||||
Investment contract benefits | 5,030 | 4,617 | 8.9 | % | An increase in the scale of universal insurance accounts | |||||||||
Policyholder dividends resulting from participation in profits | 14,507 | 10,836 | 33.9 | % | An increase in investment yield from the participating accounts | |||||||||
Underwriting and policy acquisition costs | 56,518 | 45,595 | 24.0 | % | An increase in commissions of regular business due to the growth of the Company’s business and the optimization of its business structure | |||||||||
Finance costs | 1,772 | 1,930 | -8.2 | % | A decrease in interest paid for securities sold under agreements to repurchase | |||||||||
Administrative expenses | 17,047 | 16,958 | 0.5 | % | Due to the growth of business | |||||||||
Income tax | 4,502 | 964 | 367.0 | % | Due to the impact of the adjustment of the pre-tax deduction policy of underwriting and policy acquisition costs adopted in the corresponding period of 2019 | |||||||||
Net profit attributable to equity holders of the Company | 30,535 | 37,599 | -18.8 | % | Due to the combined impact of the update of discount rate assumptions for reserves of traditional insurance contracts, the adjustment of the pre-tax deduction policy of underwriting and policy acquisition costs adopted in the corresponding period of 2019 and the change in gross investment income | |||||||||
5
CHAIRMAN’S STATEMENT

We strided forward to advance China Life Revitalization strategy, staying true to our original aspiration and shouldering our social responsibility.
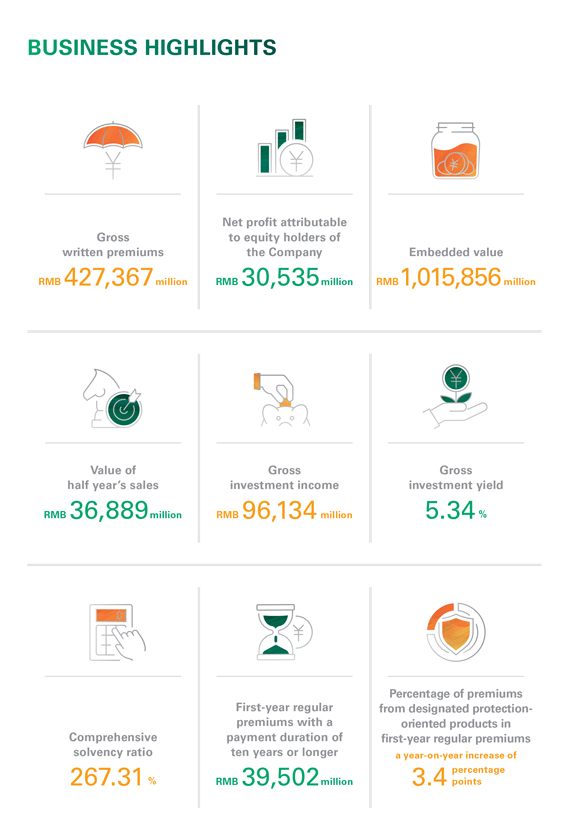
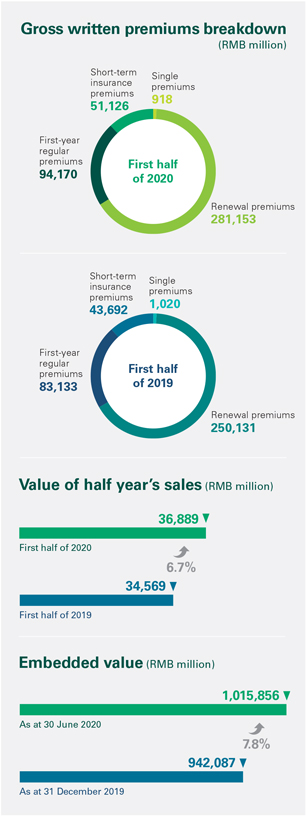
In the first half of 2020, the Company’s comprehensive strength was further enhanced and its leading position in the market was consolidated. During the Reporting Period, the Company’s gross written premiums amounted to RMB427,367 million, an increase of 13.1% year on year. The embedded value of the Company exceeded RMB1 trillion for the first time, reaching RMB1,015,856 million, an increase of 7.8% from the end of 2019. Total assets were RMB3,966,033 million, increasing by 6.4% from the end of 2019. Net profit attributable to equity holders of the Company was RMB30,535 million. As at the end of the Reporting Period, the core solvency ratio and the comprehensive solvency ratio were 258.24% and 267.31%, respectively.
Looking back to the first half of 2020, during our journey of revitalizing China Life, we firmly maintained our strategic focus, proceeded well with both the pandemic control and business development, and achieved a satisfactory operating performance, which reflected the time-tested experiences and strong development resilience of China Life. The high-quality development of the Company also demonstrated our commitment to shouldering social responsibilities in serving the overall national development plan and our efforts to guarding people’s wellbeing.
6
We took an active role in serving the overall national development and gave full support to the socio-economic development. In the face of the unexpected COVID-19 pandemic, we took an immediate action to offer complimentary insurance protection for medical workers fighting on the front line, and considered safeguarding the safety and health of customers and employees as our top priority. We proactively expanded the scope of insurance liability, upgraded claims settlement services, and provided support to the pandemic prevention and control as well as the resumption of work and production. To ensure stability on the six fronts and security in the six areas, we strived to support employment stability with the aid of insurance mechanism. We fully capitalized on our comprehensive financial strength to deeply integrate into the national and regional development, focused on new infrastructure and new urbanization constructions, and offered financial and insurance services, so as to give support to the development of real economy. We vigorously promoted the “Poverty Alleviation Insurance” project to target to the specific insurance needs of poverty-stricken people, and consistently built the network for protecting people’s wellbeing, thus leveraging China Life’s strengths for maintaining the socio-economic stability and development.
We adhered to the concept of “value-oriented” development and consistently advanced high-quality development. With emphasis on business value, profitability and development quality, we endeavoured to develop business with high value, so that the protection-oriented business grew significantly, with the percentage of premiums from designated protection-oriented products in the first-year regular premiums rising by 3.4 percentage points year on year, and the value of half year’s sales was RMB36,889 million, an increase of 6.7% year on year. Meanwhile, the size of our sales force remained stable with its quality being enhanced, and its foundation for value creation was further consolidated. A satisfactory performance was seen in our investment. As the interest rate rebounded after a sharp decline and the equity market fluctuated significantly, the gross investment income of the Company reached RMB96,134 million, an increase of 8.1% year on year, and the gross investment yield was 5.34%.
We firmly grasped the trend of technological advancement and accelerated digital transformation. As the COVID-19 pandemic around the world unleashed technology productivity at an accelerated speed, the Company sped up the application of achievements from “Technology- driven China Life” initiatives, which helped us to respond to the challenges brought by the pandemic from all aspects, such as remote office operations, online sales and online services, etc, and ensured the order and efficiency of the Company’s operation and management. By accelerating the application of technological strengths into operation and management, our technology empowerment reached to a new level. Adhering to the “customer-centric” principle, we committed ourselves to the construction of a corporate with excellent services, and upgraded our operations and services to be more integrated, intelligent and ecological. In the first half of the year, the Company’s capability in offering digital services was further strengthened. Nearly all of our individual insurance business could be applied online, and the speed and efficiency of our claims settlement led the industry.
We were committed to the transformation and upgrade through reform and constantly enhanced our development vitality. Under the “Dingxin Project”, the development layout of “Yi Ti Duo Yuan” was implemented, which gradually released the benefits from business restructuring. The general agent team and upsales team developed in a coordinated manner, with significant business value created by the individual agent business sector. The positioning of the diversified business sector was clearly defined, and the business transformation of the bancassurance channel kicked off smoothly, with its first-year regular premiums growing rapidly. The group insurance channel continued to enhance its specialization and capacity building, so that its profitability and business quality were further improved. Besides, we strengthened the market- oriented incentive and restraint reform and promoted market-oriented talents recruitment in key fields to fully activate our development vitality.
7
We firmly held on to the bottom line and carried out risk prevention and control in a practical manner. We proactively prevented and mitigated major financial risks, continued to keep track of the changes of domestic and international development and the impact on the financial and insurance industry, paid great attention to interest risk, market risk, credit risk and compliance risk, strengthened our efforts on risk monitoring and pre-warning, and well prepared stress tests and emergency response plans, so as to strictly prevent any external risk incidents from penetrating into the Company. We implemented regulatory requirements in a stringent and consistent manner, organized special governance on risks, and made preliminary achievements in the informationization of risk management, thus enhancing our overall capability in risk management and control.
We were determined to achieve high-quality development by responding to the changing environment, bringing about new progresses and turning crises into opportunities.
We are witnessing major changes unfolding in the world, something unseen in a century. The challenges brought by the “Black Swan”, namely the COVID-19 pandemic, further increased the uncertainty amid such major changes. Despite this, we saw an accelerated growth of emerging industries under the pandemic. Huge market size and domestic demand were still the favourable factors to support the economic development in China. Regulatory authorities rolled out a series of policies to correct irregular market practices and to optimize business environment, thus offering the new space for the high-quality development of the industry. With heightened awareness of the society on risks, the public demands for insurance protection rose significantly. New technological revolution evoluted more quickly and financial technology flourished, which greatly increased the service efficiency of the industry. To take a long-term perspective, we firmly believe that the Chinese economy will maintain its stable and sound development and its long-term positive growth fundamentals remain unchanged, and that the domestic insurance industry is still at an important stage full of strategic opportunities. I have full confidence in the prospect of the Chinese economy, the development of the domestic insurance industry, as well as the future of China Life.
The year of 2020 is a crucial year for us to make breakthroughs for “China Life Revitalization”. Despite instabilities and uncertainties in the external environment, we will remain steadfast to our strategic deployment of “China Life Revitalization”, seize the new development opportunities of the industry, properly carry out the regular pandemic control, enhance business value, and improve the quality of our business and sales force. We will deepen reform and innovation and carry out the “Dingxin Project” with great efforts, speed up digital transformation to reinforce technological and service empowerment, strengthen asset-liability management, attach great importance to the prevention and mitigation of major financial risk, and enhance our comprehensive governance capability.
We are setting sail to lead the trend and working hard to open the door of the opportunity. On the journey of building a world-class life insurance company, we will stick to our original aspiration and forge ahead, with a view to rewarding the shareholders and people from all walks of life with satisfactory operating performance.
| By Order of the Board | ||
| Wang Bin | ||
| Chairman | ||
| Beijing, China | ||
| 26 August 2020 | ||
8

REVIEW OF BUSINESS OPERATIONS IN THE FIRST HALF OF 2020
2020 is the crucial year when the strategic deployment of China Life Revitalization advanced to a critical stage of breakthrough. In the first half of the year, facing various challenges from the COVID-19 pandemic and economic downturn, the Company pursued the fundamental requirements of high-quality development, adhered to the strategic core of “centering on customers and basic operational units, focusing on business value and individual agent business sector” (“Dual Centers and Dual Focuses”), and concentrated on the operational guideline of “prioritizing business value, strengthening sales force, achieving stable growth, upgrading technology, optimizing customer services and guarding against risks”. The Company proceeded well with both the pandemic control and business development, and realized a stable growth of its core business, a continuous optimization of its business structure and a steady increase in its new business value. The Company accelerated optimization and adjustments in asset-liability management, technological innovation, operations and services, risk management and control, and withstood the tests by the pandemic. With steady and healthy development of the Company’s businesses in various aspects, its leading industry position was consolidated.
During the Reporting Period, the Company’s gross written premiums amounted to RMB427,367 million, an increase of 13.1% year on year. As at the end of the Reporting Period, the embedded value of the Company reached RMB1,015,856 million, an increase of 7.8% from the end of 2019. The value of half year’s sales was RMB36,889 million, an increase of 6.7% year on year. During the Reporting Period, the Company continued to enhance the asset-liability management, and its gross investment income reached RMB96,134 million, an increase of 8.1% from the corresponding period of 2019. Due to the combined impact of the update of discount rate assumptions for reserves of traditional insurance contracts, the adjustment of the pre-tax deduction policy of underwriting and policy acquisition costs adopted in the corresponding period of 2019 and the change in gross investment income, net profit attributable to equity holders of the Company was RMB30,535 million, a decrease of 18.8% year on year. As at the end of the Reporting Period, the core solvency ratio and the comprehensive solvency ratio were 258.24% and 267.31%, respectively.
9

From left to right: Mr. Zhao Guodong, Mr. Zhan Zhong, Ms. Huang Xiumei, Mr. Su Hengxuan, Mr. Li Mingguang, Mr. Ruan Qi, Ms. Yang Hong
Key Performance Indicators for the First Half of 2020
| RMB million | ||||||||
| January to June 2020 | January to June 2019 | |||||||
Gross written premiums | 427,367 | 377,976 | ||||||
Premiums from new policies | 146,214 | 127,845 | ||||||
Including: First-year regular premiums | 94,170 | 83,133 | ||||||
First-year regular premiums with a payment duration of ten years or longer | 39,502 | 38,082 | ||||||
Renewal premiums | 281,153 | 250,131 | ||||||
Gross investment income | 96,134 | 88,923 | ||||||
Net profit attributable to equity holders of the Company | 30,535 | 37,599 | ||||||
Value of half year’s sales | 36,889 | 34,569 | ||||||
Including: Individual agent business sector1 | 36,559 | 33,333 | ||||||
Policy Persistency Rate (14 months)2 (%) | 89.60 | 86.10 | ||||||
Policy Persistency Rate (26 months)2 (%) | 83.30 | 87.00 | ||||||
Surrender Rate3 (%) | 0.61 | 1.43 | ||||||
| As at 30 June 2020 | As at 31 December 2019 | |||||||
Embedded value | 1,015,856 | 942,087 | ||||||
Number of long-term in-force policies (hundred million) | 3.12 | 3.03 | ||||||
| Notes: | ||||
1. The corresponding results of individual agent business sector for the first half of 2019 have been restated to allow for new sector definitions on a pro forma basis. 2. The Persistency Rate for long-term individual life insurance policy is an important operating performance indicator for life insurance companies. It measures the ratio of in-force policies in a pool of policies after a certain period of time. It refers to the proportion of policies that are still effective during the designated month in the pool of policies whose issue date was 14 or 26 months ago. 3. Surrender Rate = Surrender payment/(Liability of long-term insurance contracts at the beginning of the period + Premiums of long-term insurance contracts) | ||||
10
During the Reporting Period, the Company maintained its strategic focus, concentrated on developing long-term regular business and achieved a continuous increase in its new business value. First-year regular premiums amounted to RMB94,170 million (a year-on-year increase of 13.3%), which accounted for 99.03% in long-term first-year premiums, increasing by 0.24 percentage point year on year. In particular, first-year regular premiums with a payment duration of ten years or longer were R MB 39, 502 million, an increase of 3.7% year on year. The Company adhered to the diversified product strategy and vigorously developed protection-oriented businesses. Out of the top ten insurance products by the first-year regular premiums, six were protection- oriented products. The percentage of premiums from designated protection-oriented products in the first- year regular premiums rose by 3.4 percentage points year on year, with an increase in both the number of protection-oriented insurance policies and average premiums per policy. The value of half year’s sales was RMB36,889 million, an increase of 6.7% year on year. As at the end of the Reporting Period, the embedded value of the Company reached RMB1,015,856 million, increasing by 7.8% from the end of 2019. The number of long-term in-force policies was 312 million, an increase of 3.0% from the end of 2019. During the Reporting Period, the surrender rate was 0.61%, a decrease of 0.82 percentage point year on year.
During the Reporting Period, the Company continued to enhance the asset-liability management and flexibly adjusted its investment allocation strategy, so as to actively address the pressure from both assets and liabilities. By closely following the market changes while flexibly adjusting the pace of asset allocation and investment tactics, the Company achieved a gross investment income of RMB96,134 million, an increase of 8.1% year on year. Due to the combined impact of the update of discount rate assumptions for reserves of traditional insurance contracts, the adjustment of the pre-tax deduction policy of underwriting and policy acquisition costs adopted in the corresponding period of 2019 and the change in gross investment income, net profit attributable to equity holders of the Company was RMB30,535 million, decreasing by 18.8% year on year.
11
In the first half of 2020, guided by the strategic deployment of “China Life Revitalization”, the Company further implemented the “Dingxin Project” to effectively strengthen capacity in various fields and boost high-quality development. In terms of sales management, the Company greatly pushed forward the development system of “Yi Ti Duo Yuan”, accelerated integration of two sales teams of the individual agent business sector, promoted standardized management of basic operational units, and further consolidated the foundation of sales management. The Company also advanced the transformation and upgrade in the diversified business sector. The bancassurance channel refocused on business transformation, and the group and health insurance channel emphasized specialization and capability building. In terms of investment management, the Company improved the investment management system with a market-oriented approach, coordinated asset allocation and entrusted investment management at account level, and
bolstered its investment capability through research of asset classes and optimization of investment strategies. In terms of operations and services, the Company continued to improve refined management, enhanced the entire Internet-based and intelligent operational process, increased operational efficiency through integration, and built a mechanism for continuous tracking and optimization of its customer experiences. In terms of technology support, the Company rebuilt the technical product development team according to the principle of flattening, greatly increasing the vitality and responsiveness of the team. In terms of risk control, the Company strengthened the informationization and intellectualization of risk management, and delved into a centralized risk management model to enhance the efficiency in risk management and control, and firmly held onto the bottom line of risks.
BUSINESS ANALYSIS
Insurance Business
Gross written premiums categorized by business
| RMB million | ||||||||||||
| January to June 2020 | January to June 2019 | Change | ||||||||||
Life Insurance Business | 346,137 | 307,461 | 12.6 | % | ||||||||
First-year business | 89,668 | 78,573 | 14.1 | % | ||||||||
First-year regular | 88,758 | 77,563 | 14.4 | % | ||||||||
Single | 910 | 1,010 | -9.9 | % | ||||||||
Renewal business | 256,469 | 228,888 | 12.0 | % | ||||||||
Health Insurance Business | 72,264 | 62,416 | 15.8 | % | ||||||||
First-year business | 47,875 | 41,444 | 15.5 | % | ||||||||
First-year regular | 5,403 | 5,523 | -2.2 | % | ||||||||
Single | 42,472 | 35,921 | 18.2 | % | ||||||||
Renewal business | 24,389 | 20,972 | 16.3 | % | ||||||||
Accident Insurance Business | 8,966 | 8,099 | 10.7 | % | ||||||||
First-year business | 8,671 | 7,828 | 10.8 | % | ||||||||
First-year regular | 9 | 47 | -80.9 | % | ||||||||
Single | 8,662 | 7,781 | 11.3 | % | ||||||||
Renewal business | 295 | 271 | 8.9 | % | ||||||||
|
|
|
|
|
| |||||||
Total | 427,367 | 377,976 | 13.1 | % | ||||||||
|
|
|
|
|
| |||||||
| Note: | Single premiums in the above table include premiums from short-term insurance business. |
During the Reporting Period, gross written premiums from the life insurance business of the Company amounted to RMB346,137 million, a year-on-year increase of 12.6%. Gross written premiums from the health insurance business amounted to RMB72,264 million, a year-on-year
increase of 15.8%. Gross written premiums from the accident insurance business amounted to RMB8,966 million, a year-on- year increase of 10.7%.
12
Gross written premiums categorized by channel
| RMB million | ||||||||
| January to June 2020 | January to June 20191 | |||||||
Individual Agent Business Sector2 | 356,075 | 323,393 | ||||||
First-year business of long-term insurance | 82,379 | 74,382 | ||||||
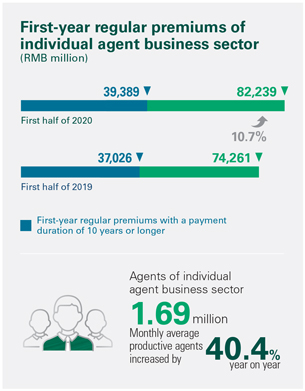
First-year regular | 82,239 | 74,261 | ||||||
Single | 140 | 121 | ||||||
Renewal business | 263,363 | 240,445 | ||||||
Short-term insurance business | 10,333 | 8,566 | ||||||
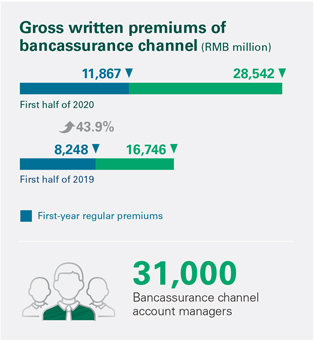
Bancassurance Channel | 28,542 | 16,746 | ||||||
First-year business of long-term insurance | 11,872 | 8,262 | ||||||
First-year regular | 11,867 | 8,248 | ||||||
Single | 5 | 14 | ||||||
Renewal business | 16,464 | 8,262 | ||||||
Short-term insurance business | 206 | 222 | ||||||
Group Insurance Channel | 16,500 | 16,798 | ||||||
First-year business of long-term insurance | 835 | 1,507 | ||||||
First-year regular | 62 | 622 | ||||||
Single | 773 | 885 | ||||||
Renewal business | 1,275 | 1,314 | ||||||
Short-term insurance business | 14,390 | 13,977 | ||||||
Other Channels3 | 26,250 | 21,039 | ||||||
First-year business of long-term insurance | 2 | 2 | ||||||
First-year regular | 2 | 2 | ||||||
Single | – | – | ||||||
Renewal business | 51 | 110 | ||||||
Short-term insurance business | 26,197 | 20,927 | ||||||
|
|
|
| |||||
Total | 427,367 | 377,976 | ||||||
|
|
|
| |||||
Notes:
| 1. | According to the development system of “Yi Ti Duo Yuan”, data for the corresponding period of 2019 were adjusted on a pro forma basis. |
| 2. | Premiums of the individual agent business sector included premiums of the general agent team and upsales team. |
| 3. | Premiums of other channels mainly included premiums of government-sponsored health insurance business and online sales, etc. |
In the first half of 2020, the Company focused on business value growth, and sped up transformation and upgrade. After the organizational restructuring of “Yi Ti Duo Yuan”, the individual agent business sector achieved a significant result in business value creation and the core business indicators saw a steady growth despite the unfavourable market conditions. The diversified business sector focused on business
transformation and its positioning was clearly defined. As at the end of the Reporting Period, the Company’s total sales force reached approximately 1.8 million, which remained stable with its quality being improved. The sales management was further transformed and upgraded.
13
Individual agent business sector
In the first half of the year, the individual agent business sector adhered to the priority of business value and the return to protection type of business, deepened transformation and upgrade of its sales management, and realized the continuous growth of both business value and scale despite the unfavourable market conditions. During the Reporting Period, gross written premiums from the sector amounted to RMB356,075 million, an increase of 10.1% year on year. First-year regular premiums were RMB82,239 million, an increase of 10.7% year on year. In particular, first-year regular premiums with a payment duration of ten years or longer were RMB39,389 million (a year-on- year increase of 6.4%), which accounted for 47.90% in the first-year regular premiums. The designated protection-oriented business grew rapidly, with an increase in both the number of protection-oriented insurance policies and average premiums per policy. Renewal premiums amounted to RMB263,363 million, an increase of 9.5% year on year. In the first half of the year, the capability of the individual agent business sector in value creation was prominent. The value of half year’s sales of the sector was RMB36,559 million, accounting for 99.11% of the value of half year’s sales as a whole. New business margin of half year’s sales of the sector reached 39.3%, which remained stable compared to the corresponding period of 2019.
In the first half of the year, the general agent team and upsales team of the individual agent business sector developed in a coordinated manner. The Company implemented the new Agent Management and Compensation System, through which the benefits from system upgrading were released, major day-to-day sales force management indicators were steadily improved, and the quality of the sales force enhanced with a stable size. As at the end of the Reporting Period, the number of agents of the individual agent business sector was 1.69 million, including 1,007,000 agents from the general agent team and 683,000 agents from the upsales team, and the monthly average productive agents increased by 40.4% year on year.
Diversified business sector
The transformation and upgrade under “Dingxin Project” was carried out in the diversified business sector in great depth. By concentrating on the development philosophy of “professional operation, enhancement of quality and efficiency, transformation and innovation, and legal compliance”, the diversified business sector coordinated well with the individual agent business sector, and focused on the development of bancassurance, group insurance and health insurance. During the Reporting Period, gross written premiums from the diversified business sector amounted to RMB71,292 million, an increase of 30.6% year on year.
14
Bancassurance Channel. The bancassurance channel repositioned to focus on bank agency business, with equal emphasis on business scale and value, and kicked off the business transformation smoothly. During the Reporting Period, gross written premiums from the channel amounted to RMB28,542 million, an increase of 70.4% year on year. First-year regular premiums were RMB11,867 million, an increase of 43.9% year on year. Renewal premiums amounted to RMB16,464 million (a year-on-year increase of 99.3%), accounting for 57.68% of the gross written premiums from the channel (a year-on-year increase of 8.34 percentage points). The bancassurance channel constantly strengthened sales team management, and the quality of the sales force was improved steadily. As at the end of the Reporting Period, the number of bancassurance channel account managers was 31,000 and the quarterly average active managers increased substantially.
Group Insurance Channel. The group insurance channel continued to deepen diversified development and improve business profitability, strengthened the expansion of key businesses, and achieved steady development. During the Reporting Period, gross written premiums from the channel were RMB16,500 million, a decrease of 1.8% year on year. Short-term insurance premiums from the channel were RMB14,390 million, an increase of 3.0% year on year. As at the end of the Reporting Period, the number of direct sales representatives was 53,000. In particular, the number of high-performance personnels increased by 15.9% from the end of 2019.

15
Other Channels. In the first half of 2020, gross written premiums from other channels reached RMB26,250 million, an increase of 24.8% year on year. The Company actively developed government-sponsored health insurance businesses, including supplementary major medical expenses insurance, supplementary medical insurance and long-term care insurance, and led the market consistently. As at the end of the Reporting Period, the Company carried out over 220 supplementary major medical expenses insurance programs, providing services to nearly 400 million people in 31 branches at the provincial level. It also provided supplementary medical insurance in 17 branches at the provincial level, serving more than 33 million people, undertook over 600 health protection entrusted programs, covering more than 100 million people, and offered long-term care insurance protection to more than 15 million people.
In the first half of the year, there were greater development opportunities for the online insurance business due to the impact of the COVID-19 pandemic, and a rapid growth was seen in the online sales business. The Company continued to diversify its online insurance product mix, offered various types of online insurance products during the pandemic, and consistently improved internet application functions such as China Life Insurance APP and China Life e-Store. A sales framework for the
Company’s online insurance business was established, with the integration of online and offline sales as the core, and direct sales on official website and sales by external platforms as supplement. The Company constantly reinforced its online insurance operations to provide more convenient, efficient and diversified online services to its customers.
The Company actively consolidated internal and external ecological resources, steadily pushed forward its coordinated business development with other subsidiaries of CLIC, and expanded the market and customer base under the strategy of “One Customer, One-stop Service”. In the first half of 2020, premiums from property insurance cross-sold by the Company increased by 24.6% year on year, whereas new bids of enterprise annuity funds and pension security products of Pension Company cross-sold by the Company grew by 22.1% year on year. Meanwhile, the Company entrusted CGB to sell bancassurance products, with first-year regular premiums for the first half of 2020 increasing by 18.7% year on year. The number of new debit cards and credit cards jointly issued by the Company and CGB during the first half of the year exceeded 500,000, thus fostering a sound environment for achieving coordinated development, positive interaction and mutual benefits.
16
Insurance contracts
| RMB million | ||||||||||||
| As at 30 June 2020 | As at 31 December 2019 | Change | ||||||||||
Life insurance | 2,653,725 | 2,385,407 | 11.2 | % | ||||||||
Health insurance | 194,368 | 158,800 | 22.4 | % | ||||||||
Accident insurance | 9,999 | 8,529 | 17.2 | % | ||||||||
|
|
|
|
|
| |||||||
Total of insurance contracts | 2,858,092 | 2,552,736 | 12.0 | % | ||||||||
|
|
|
|
|
| |||||||
Including: residual marginNote | 821,199 | 768,280 | 6.9 | % | ||||||||
| Note: | The residual margin is a component of insurance contract reserve, which results in no Day 1 gain at the initial recognition of an insurance contract. The residual margin is set to zero if it is negative. The growth of residual margin arises mainly from new business. |
As at the end of the Reporting Period, the reserves of insurance contracts of the Company increased by 12.0% from the end of 2019, which was primarily due to the accumulation of insurance liabilities from new
policies and renewal business. As at the date of the statement of financial position, the reserves of various insurance contracts of the Company passed the adequacy test.
Analysis of claims and policyholder benefits
| RMB million | ||||||||||||
| January to June 2020 | January to June 2019 | Change | ||||||||||
Insurance benefits and claims expenses | 371,950 | 330,049 | 12.7 | % | ||||||||
Life insurance business | 328,888 | 291,580 | 12.8 | % | ||||||||
Health insurance business | 39,350 | 35,474 | 10.9 | % | ||||||||
Accident insurance business | 3,712 | 2,995 | 23.9 | % | ||||||||
Investment contract benefits | 5,030 | 4,617 | 8.9 | % | ||||||||
Policyholder dividends resulting from participation in profits | 14,507 | 10,836 | 33.9 | % | ||||||||
During the Reporting Period, insurance benefits and claims expenses rose by 12.7% year on year due to an increase in insurance contract liabilities. In particular, life insurance business rose by 12.8% year on year and health insurance business rose by 10.9% year on year. Due to an increase in insurance contract liabilities and the fluctuation of claims payment of certain insurance business, accident insurance business rose
by 23.9% year on year. Investment contract benefits rose by 8.9% year on year due to an increase in the scale of the universal insurance accounts. Policyholder dividends resulting from participation in profits rose by 33.9% year on year due to an increase in investment yield from participating accounts.
17
Analysis of underwriting and policy acquisition costs and other expenses
| RMB million | ||||||||||||
| January to June 2020 | January to June 2019 | Change | ||||||||||
Underwriting and policy acquisition costs | 56,518 | 45,595 | 24.0 | % | ||||||||
Finance costs | 1,772 | 1,930 | -8.2 | % | ||||||||
Administrative expenses | 17,047 | 16,958 | 0.5 | % | ||||||||
Statutory insurance fund contribution | 803 | 737 | 9.0 | % | ||||||||
Other expenses | 5,260 | 4,271 | 23.2 | % | ||||||||
During the Reporting Period, underwriting and policy acquisition costs rose by 24.0% year on year due to an increase in commissions of regular business as a result of the growth of the Company’s business and the optimization of its business structure. Finance costs decreased by 8.2% year on year due to a decrease in interest paid for securities sold under agreements to repurchase. Administrative expenses rose by 0.5% year on year as a result of business growth.
Investment Business
In the first half of 2020, due to the impact of the pandemic, the global economy experienced a notable downturn, with the trend of deglobalisation being intensified. Despite a significant decline in China’s economic growth, recovery was seen in the second quarter of the year. The interest rate of the domestic bond market rebounded after a rapid decline, and the volatility of the stock market escalated. The Company
continued to enhance the asset-liability management, closely followed market movement, and flexibly adjusted its investment tactics. In respect of fixed income investment, the Company seized the opportunity of market fluctuation during the significant downturn of interest rate, timely adjusted allocation to government bonds with long duration, and controlled interest rate risk while maintaining the asset duration. In respect of open market equity investment, the Company adhered to its established allocation strategy and arrangement under the complicated market environment and continued to adjust internal asset structure, thus stabilizing its investment yield. As at the end of the Reporting Period, the Company’s investment assets reached RMB3,781,024 million, an increase of 5.8% from the end of 2019.
18
Investment Portfolios
As at the end of the Reporting Period, the Company’s investment assets categorized by investment object are set out as below:
| As at 30 June 2020 | RMB million | |||||||||||||||
Investment category | Amount | Percentage | Amount | Percentage | ||||||||||||
Fixed-maturity financial assets | 2,772,336 | 73.32 | % | 2,674,261 | 74.85 | % | ||||||||||
Term deposits | 536,256 | 14.18 | % | 535,260 | 14.98 | % | ||||||||||
Bonds | 1,456,870 | 38.53 | % | 1,410,564 | 39.48 | % | ||||||||||
Debt-type financial products1 | 428,613 | 11.34 | % | 415,024 | 11.62 | % | ||||||||||
Other fixed-maturity investments2 | 350,597 | 9.27 | % | 313,413 | 8.77 | % | ||||||||||
Equity financial assets | 625,383 | 16.54 | % | 605,996 | 16.95 | % | ||||||||||
Common stocks | 304,966 | 8.06 | % | 276,604 | 7.74 | % | ||||||||||
Funds3 | 99,026 | 2.62 | % | 118,450 | 3.31 | % | ||||||||||
Bank wealth management products | 38,396 | 1.02 | % | 32,640 | 0.91 | % | ||||||||||
Other equity investments4 | 182,995 | 4.84 | % | 178,302 | 4.99 | % | ||||||||||
Investment properties | 13,450 | 0.36 | % | 12,141 | 0.34 | % | ||||||||||
Cash and others5 | 142,091 | 3.76 | % | 57,773 | 1.62 | % | ||||||||||
Investments in associates and joint ventures | 227,764 | 6.02 | % | 222,983 | 6.24 | % | ||||||||||
|
|
|
|
|
|
|
| |||||||||
Total | 3,781,024 | 100.00 | % | 3,573,154 | 100.00 | % | ||||||||||
|
|
|
|
|
|
|
| |||||||||
Notes:
| 1. | Debt-type financial products include debt investment schemes, equity investment plans, trust schemes, project asset-backed plans, credit asset-backed securities, specialized asset management plans, and asset management products, etc. |
| 2. | Other fixed-maturity investments include policy loans, statutory deposits–restricted, and interbank certificates of deposits, etc. |
| 3. | Funds include equity funds, bond funds and money market funds, etc. In particular, the balances of money market funds as at 30 June 2020 and 31 December 2019 were RMB793 million and RMB1,829 million, respectively. |
| 4. | Other equity investments include private equity funds, unlisted equities, preference shares, and equity investment plans, etc. |
| 5. | Cash and others include cash, cash at banks, short-term bank deposits and securities purchased under agreements to resell, etc. |
As at the end of the Reporting Period, among the major types of investments, the percentage of investment in bonds changed to 38.53% from 39.48% as at the end of 2019, the percentage of term deposits changed to 14.18% from 14.98% as at the end of 2019, the percentage of investment in debt-type financial products changed to 11.34% from 11.62% as at the end of 2019, and the percentage of investment in stocks and funds (excluding money market funds) changed to 10.66% from 11.00% as at the end of 2019.
The Company’s debt-type financial products mainly concentrated on the sectors such as transportation, public utilities and energy, and the financing entities were primarily large central-owned enterprises and state-owned enterprises. As at the end of the Reporting Period, over 99% of the debt-type financial products were rated AAA or above by the external rating institutions. In general, the quality of the Company’s debt-type investment assets was in good condition and the debt risks were well controlled.
19
Investment Income
| RMB million | ||||||||
| January to June 2020 | January to June 2019 | |||||||
Gross investment income | 96,134 | 88,923 | ||||||
Net investment income | 77,391 | 72,030 | ||||||
Net income from fixed-maturity investments | 61,730 | 56,274 | ||||||
Net income from equity investments | 10,053 | 9,563 | ||||||
Net income from investment properties | (5 | ) | 20 | |||||
Investment income from cash and others | 923 | 508 | ||||||
Share of profit of associates and joint ventures | 4,690 | 5,665 | ||||||
Net realised gains on financial assets | 10,807 | 3,786 | ||||||
Net fair value gains through profit or loss | 8,606 | 13,107 | ||||||
Disposal gains and impairment loss of associates and joint ventures | (670 | ) | – | |||||
Net investment yield1 | 4.29 | % | 4.66 | % | ||||
Gross investment yield2 | 5.34 | % | 5.78 | % | ||||
Notes:
| 1. | Net investment yield = [(Net investment income – Interest paid for securities sold under agreements to repurchase)/((Investment assets at the end of the previous year – Securities sold under agreements to repurchase at the end of the previous year + Investment assets at the end of the period – Securities sold under agreements to repurchase at the end of the period)/2)]/182×366 |
| 2. | Gross investment yield = [(Gross investment income – Interest paid for securities sold under agreements to repurchase)/((Investment assets at the end of the previous year – Securities sold under agreements to repurchase at the end of the previous year – Derivative financial liabilities at the end of the previous year + Investment assets at the end of the period – Securities sold under agreements to repurchase at the end of the period – Derivative financial liabilities at the end of the period)/2)]/182×366 |
In the first half of 2020, the Company’s net investment income was RMB77,391 million, an increase of RMB5,361 million from the corresponding period of 2019, rising by 7.4% year on year. Due to the effect of a significant decline in interest rate and the delay in dividend payment from some listed stocks in the portfolio, the net investment yield was 4.29%, down by 37 basic points from the corresponding period of 2019. By grasping market opportunities, the Company optimized the structure of investment mix and portfolio strategy in its equity investment, rebalanced tactical allocations as appropriate, and controlled risk exposure in a prudent manner to maintain the stability of investment income. The gross investment income of the Company reached
RMB96,134 million, an increase of RMB7,211 million from the corresponding period of 2019. The gross investment yield was 5.34%, down by 44 basic points from the corresponding period of 2019. The comprehensive investment yield1 taking into account the current net fair value changes of available- for-sale securities recognized in other comprehensive income was 5.40%, down by 285 basic points from the corresponding period of 2019.
Major Investments
During the Reporting Period, there was no material equity investment or non-equity investment of the Company that was subject to disclosure requirements.
| 1 | Comprehensive investment yield = {[(Gross investment income – Interest paid for securities sold under agreements to repurchase + Current net fair value changes of available-for-sale securities recognized in other comprehensive income)/((Investment assets at the end of the previous year – Securities sold under agreements to repurchase at the end of the previous year – Derivative financial liabilities at the end of the previous year + Investment assets at the end of the period – Securities sold under agreements to repurchase at the end of the period – Derivative financial liabilities at the end of the period) /2)]/182}x366 |
20
ANALYSIS OF SPECIFIC ITEMS
Profit before Income Tax
| RMB million | ||||||||||||
| January to June 2020 | January to June 2019 | Change | ||||||||||
Profit before income tax | 35,564 | 38,893 | -8.6 | % | ||||||||
Life insurance business | 21,850 | 27,340 | -20.1 | % | ||||||||
Health insurance business | 7,388 | 4,506 | 64.0 | % | ||||||||
Accident insurance business | 112 | 459 | -75.6 | % | ||||||||
Other businesses | 6,214 | 6,588 | -5.7 | % | ||||||||
During the Reporting Period, profit before income tax from the life insurance business decreased by 20.1% year on year primarily due to the combined impact of the update of discount rate assumptions for reserves of traditional insurance contracts and the change in gross investment income. Profit before income tax from the health insurance business rose by 64.0% year on year primarily due to the growth of short-term health insurance business and its business quality improvement. Profit before income tax from the accident insurance business decreased by 75.6% year on year primarily due to the fluctuation of claims expenses for certain insurance business. Profit before income tax from other businesses decreased by 5.7% year on year primarily due to a decrease in the profits of certain associates and the impact of impairment.
Analysis of Cash Flows
Liquidity sources
The Company’s cash inflows mainly come from insurance premiums, income from non-insurance contracts, interest income, dividend and bonus, and proceeds from sale and maturity of investment assets. The primary liquidity risks with respect to these cash inflows are the risk of surrender by contract holders and policyholders, as well as the risks of default by debtors, interest rate fluctuations and other market volatilities. The Company closely monitors and manages these risks.
The Company’s cash and bank deposits can provide it with a source of liquidity to meet normal cash outflows. As at the end of the Reporting Period, the balance of cash and cash equivalents was RMB80,889 million. In addition, the vast majority of the Company’s term deposits in banks allow it to withdraw funds on deposits, subject to a penalty interest charge. As at the end of the Reporting Period, the amount of term deposits was RMB536,256 million.
The Company’s investment portfolio also provides it with a source of liquidity to meet unexpected cash outflows. The Company is also subject to market liquidity risk due to the large size of its investments in some of the markets in which the Company invests. In some circumstances, some of its holdings of investment securities may be large enough to have an influence on the market value. These factors may adversely affect its ability to sell these investments or sell them at a fair price.
Liquidity Uses
The Company’s principal cash outflows primarily relate to the payables for the liabilities associated with its various life insurance, annuity, accident insurance and health insurance products, operating expenses, income taxes and dividends that may be declared and paid to its equity holders. Cash outflows arising from the Company’s insurance activities primarily relate to benefit payments under these insurance products, as well as payments for policy surrenders, withdrawals and policy loans.
The Company believes that its sources of liquidity are sufficient to meet its current cash requirements.
21
Consolidated Cash Flows
The Company has established a cash flow testing system, and conducts regular tests to monitor the cash inflows and outflows under various scenarios and adjusts the asset portfolio accordingly to ensure sufficient sources of liquidity.
| RMB million | ||||||||||||||
| January to June 2020 | January to June 2019 | Change | Main Reasons for Change | |||||||||||
Net cash inflow/(outflow) from operating activities | 182,792 | 150,290 | 21.6 | % | An increase in premiums due to the steady growth of the Company’s business | |||||||||
Net cash inflow/(outflow) from investing activities | (88,639 | ) | (75,908 | ) | 16.8 | % | The needs for investment management | |||||||
Net cash inflow/(outflow) from financing activities | (66,682 | ) | (67,937 | ) | -1.8 | % | The needs for liquidity management | |||||||
Foreign exchange gains/(losses) on cash and cash equivalents | 112 | 5 | 2,140.0 | % | — | |||||||||
Net increase/(decrease) in cash and cash equivalents | 27,583 | 6,450 | 327.6 | % | — | |||||||||
Solvency Ratio
An insurance company shall have the capital commensurate with its risks and business scale. According to the nature and capacity of loss absorption by capital, the capital of an insurance company is classified into the core capital and the supplementary capital. The core solvency ratio is the ratio of core capital to minimum capital, which reflects the
adequacy of the core capital of an insurance company. The comprehensive solvency ratio is the ratio of the sum of core capital and supplementary capital to minimum capital, which reflects the overall capital adequacy of an insurance company. The following table shows the Company’s solvency ratios as at the end of the Reporting Period:
| RMB million | ||||||||
| As at 30 June 2020 (unaudited) | As at 31 December 2019 | |||||||
Core capital | 997,274 | 952,030 | ||||||
Actual capital | 1,032,310 | 987,067 | ||||||
Minimum capital | 386,181 | 356,953 | ||||||
Core solvency ratio | 258.24 | % | 266.71 | % | ||||
Comprehensive solvency ratio | 267.31 | % | 276.53 | % | ||||
| Note: | The China Risk Oriented Solvency System was formally implemented on 1 January 2016. This table is compiled according to the rules of the system. |
As at the end of the Reporting Period, the Company’s comprehensive solvency ratio decreased by 9.22 percentage points from the end of 2019, which was mainly due to the continuous growth of the scale of insurance
business and investment assets, dividend distribution, and the changes in the market environment such as the decline of interest rate.
22
Sale of Material Assets and Equity
During the Reporting Period, there was no sale of material assets and equity of the Company.
Major Subsidiaries and Associates of the Company
| �� | RMB million | |||||||||||||||||
Company Name | Major Business Scope | Registered Capital | Shareholding | Total Assets | Net Assets | Net Profit | ||||||||||||
China Life Asset Management Company Limited | Management and utilization of proprietary funds; acting as agent or trustee for asset management business; consulting business relevant to the above businesses; other asset management business permitted by applicable PRC laws and regulations | 4,000 | 60% | 12,373 | 10,924 | 913 | ||||||||||||
China Life Pension Company Limited | Group pension insurance and annuity; individual pension insurance and annuity; short-term health insurance; accident insurance; reinsurance of the above insurance businesses; business for the use of insurance funds that are permitted by applicable PRC laws and regulations; pension insurance asset management product business; management of funds in RMB or foreign currency as entrusted by entrusting parties for the retirement benefit purpose; other businesses permitted by the CBIRC | 3,400 | 70.74% is held by the Company, and 3.53% is held by AMC | 6,283 | 4,591 | 500 | ||||||||||||
China Life Property and Casualty Insurance Company Limited | Property loss insurance; liability insurance; credit insurance and bond insurance; short-term health insurance and accident insurance; reinsurance of the above insurance businesses; business for the use of insurance funds that are permitted by applicable PRC laws and regulations; other businesses permitted by the CBIRC | 18,800 | 40% | 103,113 | 25,713 | 1,895 | ||||||||||||
China Guangfa Bank Co., Ltd. | The businesses approved by the CBIRC include commercial banking businesses such as public and private deposits, loans, payment and settlement, and capital business | 19,687 | 43.686% | 2,808,459 | 214,916 | 6,486 | ||||||||||||
Note: For details, please refer to Note 18 in the Notes to the Interim Condensed Consolidated Financial Statements in this report.
Structured Entities Controlled by the Company
The details of structured entities controlled by the Company are set out in Note 18 in the Notes to the Interim Condensed Consolidated Financial Statements in this report.
Changes in Accounting Estimates
The changes in accounting estimates of the Company during the Reporting Period are set out in Note 3 in the Notes to the Interim Condensed Consolidated Financial Statements in this report.
Analysis of Core Competitiveness
During the Reporting Period, there was no material change in the Company’s core competitiveness.
23
TECHNOLOGY EMPOWERMENT, OPERATIONS AND SERVICES, RISK CONTROL AND MANAGEMENT
Technology Empowerment
In the first half of 2020, China Life pushed forward digital transformation in all aspects, accelerated technological innovation, proactively applied digital technologies to respond to the impact of the COVID-19 pandemic in a swift manner, and exerted the powerful function of technology empowerment to maintain business development, thus accelerating the application of technological strengths into operation and management.
Great leap in capability and further advancement of technological innovation
Technological development demonstrating the strength of China Life. By concentrating on the “ Technology-driven China Life ” strategy, the Company applied technology, as an important production element, throughout the whole process of operation and management, and made use of technology to integrate ecological resources and empower the operational units, so as to provide convenient and efficient digital services to customers. In the first half of 2020, the Company improved technological governance, reformed management mechanisms, established a management system based on technology products, and pushed forward the establishment of innovation incubation center and R&D sub-centers, thus enhancing its technology- empowered ability of value creation, diversification of supply and innovative development.
Technology research activating innovation vitality. The Company established four technological innovation-themed laboratories, namely insurance technology, cloud computing and infrastructures, cyber security and block chain, and carried out more than 30 research projects. It developed six AI models, and applied them to the business fields, such as sales, operation and risk control, and commenced the intelligent risk detection and control for the individual agents, promoted online intelligent risk control of illegal fund raising, and achieved the full process automation for the management and control of anti-money laundering, and the efficiency of processing a single suspicious transaction increased by 30% on average. The technological innovation facilitated the Company’s operation and management to become more digital and intelligent.
Digital ecosystem bringing about the synergy effect. With the continued expansion of the FinTech ecosystem based on the digital platform, the Company released 295 additional standardized services and created more than 570 micro-applications in the first half of the year. It also provided insurance coverage review for the family-based customers, online premiums collection and payment, and supported the branches at all levels to make local innovations. The Company seamlessly cooperated with 19,000 medical institutions, and carried out over 90,000 activities with different types of collaborated institutions, which consistently enriched the Company’s insurance- centered ecosystem services.
Empowerment upgrade and acceleration of digital transformation in all aspects
Digital sales creating new driving forces for development. The Company adopted technologies such as mobile internet, big data and AI to facilitate its online sales force recruitment, online agent training, online business development and online day-to-day management, thus effectively ensuring the business development during the pandemic. In the first half of the year, the Company launched the full process online sales force recruitment and applied AI human-machine dialogue in its training sessions for agents, with over 10 million person-times participation, and more than 20.13 million hours were spent on online training sessions for the new agents. The Company created the model of live video streaming of morning assembly, micro-innovation meeting and cloud innovation meeting, etc., which recorded a daily average number of 2,200 meetings at the peak period of live streaming during the pandemic.
Digital field offices creating new intelligent bases. The application of the “Internet of Things” and AI technology diversified the digital scenarios for field offices and ultimately strengthened online and offline interaction. The Company added new electronic equipment on the selected branches, such as the self-service terminals for business processing, intelligent sensing equipment and intelligent visualization screen, and realized digital training, multi-dimensional and visualized performance tracking, and brand promotion, etc. The Company also launched the AI real-time performance reporting and extended digital services to front-line operational units and sales teams, which became the digital bases for its further service extension.
24
Digital services enhancing the new experience at fingertip. The Company promptly responded to the demands for health services from customers during the pandemic and accelerated the innovation of online services. The intelligent application made the Company’s services within close reach. As the Company pushed forward the establishment of China Life Hybrid Cloud in great depth and leveraged the advantages of flexible, convenient, reliable and un interrupted proprietary Cloud, its capability of service offering increased by 6 to 8 times during the pandemic, which enabled it to flexibly address the explosive demands for online applications.
Operations and Services
In the first half of 2020, by adhering to the “customer-centric” principle and the operation objective of “strengthening efficiency, promoting technology-driven development, achieving value improvements and offering first-class customer experience”, the Company continued to improve its product development and management, pushed forward the high-quality development of operations and services, implemented the three-year action plan for excellent services in a conscientious manner, and further promoted the upgrade of operations and services to be more Internet-based, intelligent and ecological.
Products were more diversified. In the first half of 2020, the Company took active actions in product development and upgrading to satisfy the demands of its customers. There were a total of 194 products (including new products and upgraded products), including 10 life insurance products, 177 health insurance products, 4 accident insurance products and 3 annuity insurance products. Out of these products, 184 were protection-oriented products and 10 were long-term savings products.
Services were more convenient and efficient. The Company’s online policy services saw a notable improvement. The paperless insurance application rate of individual long-term insurance business and group insurance business reached 99.8% and 96%, respectively, and the online process rate of individual insurance policy administration and claims settlement for medical insurance rose by 20 percentage points year on year and 44.5 percentage points year on year, respectively. The efficiency of the Company’s claims settlement was further enhanced. The direct claims payment services were available in nearly 20,000 medical institutions, which increased by 46.2% year
on year. The pass rate of the whole process automatic claims settlement service rose by 12 percentage points year on year, and the time required for making claims payment was shortened by 13.2% year on year.
Services became more intelligent. As the application of AI technology accelerated, the Company’s operation management and control became more refined. The whole process intelligent underwriting system was optimized and the underwriting model was upgraded. As a result, the automated approval rate of intelligent underwriting increased by 3.2 percentage points year on year. With the application of an automatic detection and risk control system, the pass rate of automatic policy review reached to 98.2%. The intelligent application in the Company’s contacting services developed at a high speed. In the first half of 2020, services provided by the intelligent online customer service robot and the intelligent outbound-call robot increased by 78.9% year on year.
Services were more diversified. The Company consistently improved high-quality service provision system to satisfy the diversified needs of customers. The inter-linked services were available in China Life Insurance APP and CGB’s credit card services. The accumulative number of registered users of China Life Insurance APP rose by 21.6% year on year and the monthly average number of active users rose by 55.6% year on year. The Company organized Internet-based scenario customer festival with the number of participants reaching 120 million person-times. The Company also created an “online + offline” model to provide value-added customer services and organized a variety of activities, such as the Famous Doctors Lecture and the Joyful Life for Women.
Services became more considerate. The Company applied the “Zero Contact Services” in great depth, providing customers with insurance protection for pandemic prevention and control. To satisfy the needs of its customers, the Company launched the service of “Online Customer Service Agent”, promoted electronic insurance policy for the long-term individual business, carried out remote and non-touch investigation, and launched a series of services, including the information services on pandemic prevention and control, fitness and healthcare, etc. To address customers’ urgent needs, the Company streamlined its claims settlement process and realized quick processing and payment for the claims relating to COVID-19.
25
Constantly implementing the strategy of “Inclusive Healthcare” and “Integrated Aged-care”. By consolidating the resources of healthcare and medical services, the Company established a healthcare ecosystem covering full life cycles and promoted the construction of the online and offline platforms. During the COVID-19 pandemic, the Company established the “Healthcare Service Zone” especially for the prevention and control of COVID-19. The Company also created an innovative model for the cooperation between medical and insurance entities and promoted application of the claims settlement model that integrated government and businesses in the form of “basic medical insurance + supplementary major medical expenses insurance + commercial insurance”. The Company pushed forward investment in the China Life Integrated Aged Care Fund and Jiangsu China Life Jiequan Equity Investment Center (Limited Partnership) (Inclusive Healthcare Fund II), focusing on companies or funds engaging in inclusive healthcare- related sectors such as healthcare, elderly care, health information management, pharmaceutical production and services, and medical apparatus and instruments production, with a view to further promoting the strategic layout in the aged-care and healthcare industry.
Risk Control and Management
During the Reporting Period, the Company consistently strengthened its internal control and risk management in strict compliance with the laws and regulations of its listed jurisdictions, as well as the regulatory requirements of the industry. With enhanced ability to manage risks, the Company maintained its integrated risk rating at Class A. The Company paid constant attention to the risks related to the COVID-19 pandemic, actively conducted various tasks on risk investigation and governance, and identified hidden risks in a timely manner, so as to enhance its ability to address risks in all aspects. It constantly optimized the Enterprise-wide Risk Management System of “China Risk Oriented Solvency System” (C-ROSS), and improved the relevant work mechanisms. The Company also continuously improved the system for the management and control of investment risks for the purpose of gradually creating a framework for the analysis of investment risks in the whole chain. It strengthened the system for the management and control of sales risks by taking an active role to conduct sales risk pre-warning and investigation, cultivate integrity culture among sales agents, and
introduce the credit rating for them, etc. The Company fully implemented the regulatory requirements on anti-money laundering, and actively performed its anti-money laundering obligations such as customer identification, which further improved the effectiveness of its anti-money laundering management and control. It constantly developed the internal control assessment system to enhance the effectiveness of the internal control mechanism. With the purpose to strengthen the source governance of customer complaints as well as risk management and control, the Company created an atmosphere of sales with integrity and in compliance with laws and offering high quality services. The Company further strengthened disciplined operation, management and assessment and stepped up efforts in the management of administrative punishment, with a view to enhancing its ability in legal compliance as well as risk prevention and control.
During the Reporting Period, the Company carried out various audit projects and put more efforts on the application of audit results. It also carried out the economic responsibility audit on managers and the audit on senior management in order to regulate its operation and management in a practical manner. The Company conducted risk-based special audits in great depth to improve its operation and management. The Company actively conducted regular audits, seriously implemented regulatory requirements, and put more efforts in rectifying any problems identified in audits, which fully performed the supervisory role of audit.
PERFORMANCE OF THE CORPORATE SOCIAL RESPONSIBILITY
The Company adhered to its culture philosophy of “Success for You, Success by You”, upheld the original aspiration of and fulfilled the mission as a state-owned financial enterprise, and attached great importance to fulfilling its social responsibility. It actively probed into a business mode that balanced the development of itself and the society, and made contributions to the overall economic and social development in aspects of aged care, medical services, social assistance and education, thereby demonstrating its strong commitment in protecting environment, serving the national economy and people’s livelihood, and shouldering its due responsibilities.
26
Leveraging its advantages as a professional insurance company to fight against the COVID-19 pandemic
After the outbreak of the COVID-19 pandemic, the Company took positive actions in donating insurance policies as well as pandemic prevention supplies and funds, upgrading claims settlement services, participating in volunteering actions and offering complimentary healthcare services, thus providing the professional support of the insurance industry to fight against the COVID-19 pandemic. As at the end of the Reporting Period, the Company offered complimentary insurance protection for over 2.5 million medical workers fighting on the front line of the pandemic in 35 provinces and cities nationwide, and extended the coverage of 31 long-term critical illness insurance products to include any insurance liabilities in connection with COVID-19. It completed a total of 550 cases of claims settlement related to the COVID-19 pandemic, making claims payment totaling RMB37 million. In order to address the pandemic, the Company proactively upgraded eight services and measures, including 7x24 online claims settlement services, active search for clients, launch of fast-track claims settlement, cancellation of paper application materials for claims settlement, cancellation of restrictions on designated hospitals, cancellation of restrictions on cooling off period, cancellation of restrictions on drugs, diagnosis and treatment, and cancellation of deductible. In the meanwhile, the Company established the “Healthcare Service Zone” for the provision of eight services such as online consultation, early screening of COVID-19 and traditional Chinese medicine (TCM) video. As at 30 June 2020, there were over 410,000 page views.
Protecting the health of people for enhancement of social welfare and people’s wellbeing
By giving full play to the functions of insurance as an economic “shock absorber” and social “stabilizer”, the Company made its contributions to charitable and public welfare programs and safeguarded people with a better life through its concrete actions. In the first half of 2020, the Company handled 6.7 million cases of claims and made the claims payment of over RMB21 billion, with a daily average amount of nearly RMB120 million in claims payment to customers. The Company underwrote an additional insured sum of RMB307 trillion, taking an
active role to provide insurance protection for people from all walks of life. As at the end of the Reporting Period, the Company provided the old-age accident insurance protection for 41.52 million aged people, with a risk coverage of approximately RMB1.88 trillion. The Company also provided the supplementary major medical insurance protection for nearly 400 million urban and rural residents, making the claims payment of RMB10,229 million for 5,996,200 person-times in the first half of 2020. A donation of RMB9.99 million was made on a cumulative basis to “China Life Caring for Life Poverty Alleviation Project” through China Life Foundation.
Implementing the ecological civilization and adhering to green business operations and development
The Company, as a non-manufacturing insurance company with low energy consumption and light pollution, carries out its major business activities in a manner that does not pose any material adverse effect on eco-environment and natural resources, and has always made its best endeavor to mitigate any negative impact of its operations on environment to the greatest extent. The Company kept on improving its electronic service system and reducing its consumption on energy and paper, with a view to integrating low-carbon and environmental-friendly concept into its daily office operations, as well as the whole process of operations and services, including policy underwriting, policy administration and claims settlement. In the first half of 2020, the Company advanced the “Zero Contact Services” in all aspects, achieving 99.80% of the rate of online paperless application in the long-term individual insurance business and 95.99% of the rate of paperless application in the group insurance business. Paperless insurance application resulted in saving approximately 214.53 tons of paper. The Company continued to increase the application of internet and launched a new model of live streaming for its morning assembly, which significantly reduced the frequency of sales agents commuting to and from the Company and put low-carbon operation into practice. In the first half of 2020, the Company convened 98,000 meetings through its own internet-based video platform, with an accumulated time duration of over 12 million minutes.
27
Targeted poverty alleviation
Targeted poverty alleviation plan
During the Reporting Period, the Company upheld a strong sense of social responsibility, surmounted the impacts of the COVID-19 pandemic, actively fulfilled its social responsibilities, and leveraged advantages of insurance protection function to fully support poverty alleviation, so as to make contributions to the battle against poverty.
Summary of targeted poverty alleviation activities during the Reporting Period
During the Reporting Period, the Company shouldered its social responsibilities by stepping up its efforts in poverty alleviation and actively playing the due role of insurance protection. It pushed forward the poverty alleviation projects for deeply impoverished areas such as the “Three Regions and Three Prefectures” for the purposes of resolving the difficulties in selling agricultural products of poverty-stricken areas and carrying out poverty alleviation in full swing. As at the end of the Reporting Period, the branches of the Company at all levels actively offered assistance to 1,364 poverty alleviation points and three impoverished villages supervised by the PRC government, with a view to contributing China Life’s strength to the battle against poverty.
The Company actively performed its obligation to offer assistance in poverty alleviation and pushed forward donation projects for poverty alleviation in deeply impoverished areas such as the “Three Regions and Three Prefectures”. It planned to make a charitable donation of RMB20 million, with an aim to ensure the implementation of 114 key poverty alleviation projects in 80 poverty alleviation points. In the first half of 2020, the Company motivated the employees of China Life to purchase agricultural products with a total amount of RMB27,045,200 from poverty alleviation points and the deeply impoverished areas such as the “Three Regions and Three Prefectures”, which assisted the peasant households in poverty-stricken areas to resolve the difficulties in selling agricultural products. During the period of pandemic prevention and control, the Company showed care and concern about the health of impoverished people and cadres for poverty alleviation and donated 100,000 insurance policies and pandemic prevention equipment and supplies worth RMB382,000 to them.
28
Achievements of targeted poverty alleviation activities during the Reporting Period
Indicators | Data and Details | |||||||||
I. | Overall situation | |||||||||
| Including: 1. | Funds (the insurance claims payment | RMB1,949 million | ||||||||
| related to the poverty alleviation)Note | ||||||||||
| 2. | Funds (contribution to the targeted poverty | RMB55.27 million | ||||||||
| alleviation areas (including the contribution | ||||||||||
| from e-commerce consumption) | ||||||||||
| �� | + contribution to poverty-stricken students) | |||||||||
| 3. | Materials (contribution to the targeted | RMB3.80 million | ||||||||
| poverty alleviation areas + contribution | ||||||||||
| to education resources in poverty-stricken areas) | ||||||||||
| 4. | Number of beneficiaries in recorded | 22,144 | ||||||||
| poverty-stricken families (person) | ||||||||||
II. | Contributions breakdown | |||||||||
1. Poverty alleviation by industrial development | ||||||||||
| Including: | 1.1 Type of industrial poverty alleviation | Ö | Poverty alleviation through agricultural and forestry | |||||||
projects | industry | |||||||||
| Ö | Poverty alleviation through tourism | |||||||||
| Ö | Poverty alleviation through e-commerce | |||||||||
| ☐ | Poverty alleviation through asset incomes | |||||||||
| Ö | Poverty alleviation through technology | |||||||||
| ☐ | Others | |||||||||
1.2 Number of industrial poverty | 212 | |||||||||
alleviation projects (unit) | ||||||||||
1.3 Contribution to industrial poverty | RMB6.63 million | |||||||||
alleviation projects | ||||||||||
1.4. Number of beneficiaries in recorded | 11,531 | |||||||||
poverty-stricken families (person) | ||||||||||
2. Poverty alleviation by transfer of employment | ||||||||||
| Including: | 2.1 Contribution to training courses on | RMB0.17 million | ||||||||
occupational skills | ||||||||||
2.2 Number of persons receiving training | 1,621 | |||||||||
courses on occupational skills (person/time) | ||||||||||
2.3 Number of beneficiaries getting jobs | 932 | |||||||||
in recorded poverty-stricken families | ||||||||||
(person) | ||||||||||
3. Poverty transfer by relocation | ||||||||||
| Including: | 3.1 Number of relocated beneficiaries | |||||||||
getting jobs (person) | 198 | |||||||||
4. Poverty alleviation by education | ||||||||||
| Including: | 4.1 Contribution to subsidize poverty- | RMB1.33 million | ||||||||
stricken students | ||||||||||
4.2 Number of poverty-stricken students | 1,167 | |||||||||
who received subsidies (person) | ||||||||||
4.3 Contribution to improve education | RMB1.58 million | |||||||||
resources in poverty-stricken areas | ||||||||||
5. Poverty alleviation by healthcare | ||||||||||
| Including: | 5.1 Contribution to medical and health | RMB0.13 million | ||||||||
resources in poverty-stricken areas | ||||||||||
29
Indicators | Data and Details | |||||||
6. | Poverty alleviation by ecological protection | |||||||
| Including: | 6.1 Project name | ☐ | Conduct ecological protection and construction | |||||
| Ö | Establish compensation method for ecological protection | |||||||
| ☐ | Set up non-profit positions for ecology | |||||||
| ☐ | Others | |||||||
6.2 Amount of contribution | RMB0.03 million | |||||||
7. | Basic guarantee | |||||||
| Including: | 7.1 Contribution to help left behind children, women and the elderly | RMB0.28 million | ||||||
7.2 Number of left behind children, women and the elderly helped (person) | 95 | |||||||
7.3 Contribution to help physically disabled people in poverty | RMB0.13 million | |||||||
7.4 Number of physically disabled people in poverty helped (person) | 259 | |||||||
8. | Social poverty alleviation | |||||||
| Including: | 8.1 Contribution to poverty alleviation cooperation between the east and west | RMB0.60 million | ||||||
8.2 Contribution to targeted poverty alleviation work | RMB7.03 million | |||||||
8.3 Poverty alleviation charity fund | RMB1.32 million | |||||||
9. | Other projects | |||||||
Including: | 9.1. Number of projects (unit) | 134 | ||||||
9.2. Amount of contribution | RMB39.84 million | |||||||
9.3. Number of beneficiaries in recorded poverty-stricken families (person) | 8,114 | |||||||
9.4. Description of other projects | — | |||||||
| Note: | Including the claims payment of RMB564 million for poverty alleviation from the group insurance channel, claims payment of RMB1,235 million for poverty alleviation from the supplementary major medical expenses insurance business, and claims payment of RMB150 million from the targeted poverty alleviation product, namely the “Well-being Insurance” series. |
Progressive achievements in performing the social responsibilities of targeted poverty alleviation
In the first half of 2020, the Company further stepped up its efforts in promoting poverty alleviation insurance to expand its scope of beneficiaries covered. In the first half of 2020, the claims payment for poverty alleviation insurance business amounted to approximately RMB1,949 million. With the commitment to constantly developing insurance products for poverty alleviation, the Company developed three exclusive poverty alleviation insurance products including the “China Life Group Comprehensive Accidental Injury Insurance for Impoverished People in the Three Regions and Three Prefectures”, the “China Life Group Term Life Insurance for Cadres for Poverty Alleviation” and the “China Life Group Comprehensive Accidental Injury Insurance for Cadres for Poverty Alleviation” with people in the deeply impoverished areas such as the “Three Regions and Three Prefectures” and cadres for poverty alleviation as the targets, thus offering China Life’s proposals for and injecting China Life’s wisdom into poverty alleviation.
Subsequent targeted poverty alleviation plans
The Company will concentrate on the principal business of insurance, actively promote the “Poverty Alleviation Insurance” series, focus on the deeply impoverished areas such as the “Three Regions and Three Prefectures”, and expand the protection coverage of poverty alleviation insurance. The Company will consistently and vigorously carry out supplementary major medical expenses insurance and medical insurance administration to promote poverty alleviation by healthcare, with a view to enhancing the risk-resistant ability of impoverished people in a practical manner. The Company will accomplish its mission to make due contributions to the poverty alleviation and the establishment of a well-off society.
30
FUTURE PROSPECT
Industry Landscape and Development Trends
With the current economic downturn around the world and the global market contraction, instabilities and uncertainties are growing and China’s economic operation is under greater pressure. Despite the above circumstances, China’s long-term positive economic fundamentals remain unchanged and the economic operation shows trends of restorative growth and steady recovery, which will continue to provide a healthy and favourable external environment for the development of the insurance industry. The rollout of a series of measures by insurance regulatory authorities has offered support to the pandemic prevention and control as well as economic and social development, prevented and mitigated financial risks, and deepened the reform and opening-up of the financial sector, thus helping promote the steady development of the insurance industry and achieve the goal of high- quality development. The COVID-19 pandemic strengthened the public’s awareness of social risks and insurance and deepened their recognition of insurance functions, which promoted the public’s demands for insurance protection. The pandemic also facilitated the transformation to new business models, enhanced the application of technologies in insurance sales, management and services, and accelerated the online operation of insurance companies and online customer migration. As a result, new insurance concepts and insurance purchase models will gradually emerge, and the insurance industry will further accelerate digital transformation.
Development Strategies and Business Plans of the Company
For the second half of 2020, the Company will take high-quality development as its fundamental requirement, fulfill the strategic core of “Dual Centers and Dual Focuses”, and uphold the operational guideline of “prioritizing business value, strengthening sales force, achieving stable growth, upgrading technology, optimizing services, and guarding against risks”. The Company will make progress while maintaining stability, improve quality and efficiency, push forward transformation and upgrade, and strengthen business value creation. It will also facilitate the development of sales force in a healthy and efficient manner, push forward reform and innovation in great depth, strengthen technological and service empowerment, firmly maintain the bottom line of risk
management and control, accelerate the modernization of corporate governance, and promote “China Life Revitalization” to a new stage, so as to lay a solid foundation for building a world-class life insurance company.
Potential Risks
We are currently witnessing rising protectionism, sagging world economy and global market contraction, and China is going through a critical stage in transforming the development model of its economy, optimizing economic structure and switching the driving force for growth. With a positive outlook of its economic development, China is also facing difficulties and challenges arising from the intert wining of structural, institutional and cyclical problems. Coupled with the impact of the COVID-19 pandemic, China’s economic operation is under greater pressure. The long-term and profound impacts of the pandemic on domestic economy and society remain to be seen. On one hand, people tend to be more prudent in spending and it is probable that the precautionary demand of potential customers for cash will increase. As a result, the development of savings-oriented insurance business will come under pressure in short term. On the other hand, with the long-term downward trend of market interest rates and greater volatility in the capital market, the credit risk will be increasingly severe.
The Company has taken a variety of measures, such as diversifying its product mix and optimizing insurance services, to satisfy the demands of customers. Moreover, the Company has paid close attention to the macro-economic development, enhanced asset-liability management and flexibly adjusted asset allocation for the purpose of stabilizing investment returns. The Company will continue to stay alert and actively respond to any impacts associated with the regular pandemic control, enhance its analysis on complex risk factors, ensure its steady and healthy operation and strive to push forward its high-quality development.
The Company expects that it will have sufficient capital to meet its insurance business expenditures and new general investment needs in the second half of 2020. At the same time, the Company will make corresponding financing arrangements based on capital market conditions to further implement its future business development strategies.
31

BACKGROUND
China Life Insurance Company Limited prepares financial statements to public investors in accordance with the relevant accounting standards. An alternative measure of the value and profitability of a life insurance company can be provided by the embedded value method. Embedded value is an actuarially determined estimate of the economic value of the life insurance business of an insurance company based on a particular set of assumptions about future experience, excluding the economic value of future new business. In addition, the value of half year’s sales represents an actuarially determined estimate of the economic value arising from new life insurance business issued in half year based on a particular set of assumptions about future experience.
China Life Insurance Company Limited believes that reporting the Company’s embedded value and value of half year’s sales provides useful information to investors in two respects. First, the value of the Company’s in-force business represents the total amount of shareholders’ interest in distributable earnings, in present value terms, which can be expected to emerge over time, in accordance with the assumptions used. Second, the value of half year’s sales provides an indication of the value created for investors by new business activity based on the assumptions used and hence the potential of the business.
However, the information on embedded value and value of half year’s sales should not be viewed as a substitute of financial measures under the relevant accounting basis. Investors should not make investment decisions based solely on embedded value information and the value of half year’s sales.
It is important to note that actuarial standards with respect to the calculation of embedded value are still evolving. There is still no universal standard which defines the form, calculation methodology or presentation format of the embedded value of an insurance company. Hence, differences in definition, methodology, assumptions, accounting basis and disclosures may cause inconsistency when comparing the results of different companies.
Also, the calculation of embedded value and value of half year’s sales involves substantial technical complexity and estimates can vary materially as key assumptions are changed. Therefore, special care is advised when interpreting embedded value results.
The values shown below do not consider the future financial impact of transactions between the Company and CLIC, CLI, AMC, Pension Company, CLP&C, and etc.
32
DEFINITIONS OF EMBEDDED VALUE AND VALUE OF HALF YEAR’S SALES
The embedded value of a life insurer is defined as the sum of the adjusted net worth and the value of in-force business allowing for the cost of required capital. “Adjusted net worth” is equal to the sum of:
| • | Net assets, defined as assets less corresponding policy liabilities and other liabilities valued; and |
| • | Net-of-tax adjustments for relevant differences between the market value and the book value of assets, together with relevant net-of-tax adjustments to certain liabilities. |
The market value of assets can fluctuate significantly over time due to the impact of the prevailing market environment. Hence the adjusted net worth can fluctuate significantly between valuation dates.
The “value of in-force business” and the “value of half year’s sales” are defined here as the discounted value of the projected stream of future shareholders’ interest in distributable earnings for existing in-force business at the valuation date and for half year’s sales in the 6 months immediately preceding the valuation date.
The value of in-force business and the value of half year’s sales have been determined using a traditional deterministic discounted cash flow methodology. This methodology makes implicit allowance for the cost of investment guarantees and policyholder options, asset/ liability mismatch risk, credit risk, the risk of operating experience’s fluctuation and the economic cost of capital through the use of a risk-adjusted discount rate.
PREPARATION AND REVIEW
The embedded value and the value of half year’s sales were prepared by China Life Insurance Company Limited in accordance with the “CAA Standards of Actuarial Practice: Appraisal of Embedded Value” issued by the China Association of Actuaries (“CAA”) in November 2016. Willis Towers Watson, an international firm of consultants, performed a review of China Life’s embedded value. The review statement from Willis Towers Watson is contained in the “Willis Towers Watson’s review opinion report on embedded value” section.
ASSUMPTIONS
The valuation assumptions used as at 30 June 2020 are consistent with those used as at 31 December 2019.
SUMMARY OF RESULTS
The embedded value as at 30 June 2020 and the corresponding results as at 31 December 2019 are shown below:
| Components of Embedded Value | RMB million | |||||||||
ITEM | 30 June 2020 | 31 December 2019 | ||||||||
A | Adjusted Net Worth | 520,153 | 482,793 | |||||||
B | Value of In-Force Business before Cost of Required Capital | 552,486 | 509,515 | |||||||
C | Cost of Required Capital | (56,782 | ) | (50,220 | ) | |||||
D | Value of In-Force Business after Cost of Required Capital (B + C) | 495,704 | 459,295 | |||||||
E | Embedded Value (A + D) | 1,015,856 | 942,087 | |||||||
Note: Numbers may not be additive due to rounding.
33
SUMMARY OF RESULTS (continued)
The value of half year’s sales for the 6 months ended 30 June 2020 and for the corresponding period of last year are shown below:
| Components of Value of Half Year’s Sales | RMB million | |||||||||
ITEM | 30 June 2020 | 30 June 2019 | ||||||||
A | Value of Half Year’s Sales before Cost of Required Capital | 41,481 | 39,361 | |||||||
B | Cost of Required Capital | (4,592 | ) | (4,792 | ) | |||||
C | Value of Half Year’s Sales after Cost of Required Capital (A + B) | 36,889 | 34,569 | |||||||
Including: Value of Half Year’s Sales of Individual Agent Business Sector | 36,559 | 33,333 | ||||||||
| Note: | The corresponding results of individual agent business sector for the first half of 2019 have been restated to allow for new sector definitions on a pro forma basis. |
The new business margin of half year’s sales of individual agent business sector for the 6 months ended 30 June 2020 are shown below:
| New Business Margin of Half Year’s Sales of Individual Agent Business Sector | ||||||||
| 30 June 2020 | 30 June 2019 | |||||||
By First Year Premium | 39.3 | % | 39.7 | % | ||||
By Annual Premium Equivalent | 39.3 | % | 39.7 | % | ||||
Note 1: Note 2: | First Year Premium is the written premium used for calculation of the value of half year’s sales and Annual Premium Equivalent is calculated as the sum of 100 percent of first year regular premiums and 10 percent of single premiums. The corresponding results of individual agent business sector for the first half of 2019 have been restated to allow for new sector definitions on a pro forma basis. |
34
MOVEMENT ANALYSIS
The following analysis tracks the movement of the embedded value from the start to the end of the Reporting Period:
| Analysis of Embedded Value Movement in the First Half of 2020 | RMB million | |||
ITEM | ||||
A Embedded Value at the Start of Year | 942,087 | |||
B Expected Return on Embedded Value | 39,724 | |||
C Value of New Business in the Period | 36,889 | |||
D Operating Experience Variance | 3,626 | |||
E Investment Experience Variance | 3,463 | |||
F Methodology and Model Changes | (240 | ) | ||
G Market Value and Other Adjustments | 8,666 | |||
H Exchange Gains or Losses | 110 | |||
I Shareholder Dividend Distribution and Capital Injection | (20,834 | ) | ||
J Other | 2,366 | |||
K Embedded Value as at 30 June 2020 (sum A through J) | 1,015,856 | |||
Notes: 1) Numbers may not be additive due to rounding.
2) Items B through J are explained below:
| B | Reflects expected impact of covered business, and the expected return on investments supporting the 2020 opening net worth. |
| C | Value of half year’s sales for the 6 months ended 30 June 2020. |
| D | Reflects the difference between actual operating experience in the first half of 2020 (including mortality, morbidity, lapse, and expenses etc.) and the assumptions. |
| E | Compares actual with expected investment returns during the first half of 2020. |
| F | Reflects the effects of appraisal methodology and model enhancement. |
| G | Change in the market value adjustment from the beginning of year 2020 to 30 June 2020 and other adjustments. |
| H | Reflects the gains or losses due to changes in exchange rate. |
| I | Reflects dividends distributed to shareholders during the first half of 2020. |
| J | Other miscellaneous items. |
35
SENSITIVITY RESULTS
Sensitivity tests were performed using a range of alternative assumptions. In each of the sensitivity tests, only the assumption referred to was changed, with all other assumptions remaining unchanged. The results are summarized below:
| Sensitivity Results | RMB million | |||||||
| Value of In-Force Business after Cost of Required Capital | Value of Half year’s Sales after Cost of Required Capital | |||||||
Base case scenario | 495,704 | 36,889 | ||||||
1. Risk discount rate +50bps | 473,640 | 35,119 | ||||||
2. Risk discount rate -50bps | 519,404 | 38,798 | ||||||
3. Investment return +50bps | 585,753 | 43,575 | ||||||
4. Investment return -50bps | 406,018 | 30,206 | ||||||
5. 10% increase in expenses | 489,289 | 34,701 | ||||||
6. 10% decrease in expenses | 502,119 | 39,076 | ||||||
7. 10% increase in mortality rate for non-annuity products and 10% decrease in mortality rate for annuity products | 492,274 | 36,372 | ||||||
8. 10% decrease in mortality rate for non-annuity products and 10% increase in mortality rate for annuity products | 499,134 | 37,407 | ||||||
9. 10% increase in lapse rates | 494,732 | 35,920 | ||||||
10. 10% decrease in lapse rates | 496,629 | 37,897 | ||||||
11. 10% increase in morbidity rates | 488,793 | 35,685 | ||||||
12. 10% decrease in morbidity rates | 502,772 | 38,095 | ||||||
13. Allowing for diversification in calculation of VIF | 532,917 | – | ||||||
36
WILLIS TOWERS WATSON’S REVIEW OPINION REPORT ON EMBEDDED VALUE
To The Directors of China Life Insurance Company Limited
China Life Insurance Company Limited (“China Life”) has prepared embedded value results as at 30 June 2020 (“EV Results”). The disclosure of these EV Results, together with a description of the methodology and assumptions that have been used, are shown in the Embedded Value section.
China Life has engaged Towers Watson Management Consulting (Shenzhen) Co. Ltd. Beijing Branch (“Willis Towers Watson”) to review its EV Results. This report is addressed solely to China Life in accordance with the terms of our engagement letter, and sets out the scope of our work and our conclusions. To the fullest extent permitted by applicable law, we do not accept or assume any responsibility, duty of care or liability to anyone other than China Life for or in connection with our review work, the opinions we have formed, or for any statement set forth in this report.
Scope of Work
Our scope of work covered:
| • | a review of the methodology used to develop the embedded value and value of half year’s sales as at 30 June 2020, in accordance with the “CAA Standards of Actuarial Practice: Appraisal of Embedded Value” issued by the China Association of Actuaries (“CAA”); |
| • | a review of the economic and operating assumptions used to develop the embedded value and value of half year’s sales as at 30 June 2020; and |
| • | a review of the results of China Life’s calculation of the EV Results. |
In carrying out our review, we have relied on the accuracy of audited and unaudited data and information provided by China Life.
Opinion
Based on the scope of work above, we have concluded that:
| • | the embedded value methodology used by China Life is in accordance with the “CAA Standards of Actuarial Practice: Appraisal of Embedded Value” issued by the CAA; |
| • | the economic assumptions used by China Life are internally consistent, have been set with regard to current economic conditions, and have made allowance for the company’s current and expected future asset mix and investment strategy; |
| • | the operating assumptions used by China Life have been set with appropriate regard to past, current and expected future experience; and |
| • | the EV Results have been prepared, in all material respects, in accordance with the methodology and assumptions set out in the Embedded Value section. |
For and on behalf of Willis Towers Watson Lingde Hong
26 August 2020
37

MATERIAL LITIGATIONS OR ARBITRATIONS
During the Reporting Period, the Company was not involved in any material litigation or arbitration.
MAJOR CONNECTED TRANSACTIONS
Continuing Connected Transactions
During the Reporting Period, the following continuing connected transactions were carried out by the Company pursuant to Rule 14A.76(2) of the Rules Governing the Listing of Securities on the HKSE (the “Listing Rules”), including the policy management agreement between the Company and CLIC, the asset management agreement between the Company and AMC, the insurance sales framework agreement between the Company and CLP&C, the framework agreements entered into by CLWM with CLIC, CLP&C, CLI, Pension Company and China Life E-commerce Company Limited (“CLEC”), respectively, the framework agreement between the Company and Chongqing International Trust Inc. (“Chongqing Trust”), and the framework agreement between the
Company and China Life Capital. These continuing connected transactions were subject to the reporting, announcement and annual review requirements but were exempt from the independent shareholders’ approval requirement under the Listing Rules. CLIC, the controlling shareholder of the Company, holds 60% of the equity interest in CLP&C and 100% of the equity interest in each of CLI, CLEC and China Life Capital. Therefore, each of CLIC, CLP&C, CLI, CLEC and China Life Capital constitutes a connected person of the Company. AMC is held as to 60% and 40% by the Company and CLIC, respectively, and is therefore a connected subsidiary of the Company. CLWM is a subsidiary of AMC, and is therefore also a connected subsidiary of the Company. Chongqing Trust is an associate of CLIC and CLP&C by virtue of its acting as the trustee of a trust scheme of which CLP&C is a beneficiary, and is therefore also a connected person of the Company pursuant to Rule 14A.13(2) of the Listing Rules.
38
During the Reporting Period, the continuing connected transactions carried out by the Company that were subject to the reporting, announcement, annual review and independent shareholders’ approval requirements under Chapter 14A of the Listing Rules included the framework agreements entered into by AMP with the Company, CLIC, CLP&C and CLI, respectively, and the asset management agreement for alternative investments between the Company and CLI. Such agreements and the transactions thereunder have been approved by the independent shareholders of the Company. AMP is a subsidiary of AMC, and is therefore a connected subsidiary of the Company.
During the Reporting Period, the Company also carried out certain continuing connected transactions, including the asset management agreement between CLIC and AMC, and the framework agreement between the Comp any and CLWM, which were exempt from the reporting, announcement, annual review and independent shareholders’ approval requirements under Chapter 14A of the Listing Rules.
The Company has complied with the disclosure requirements under Chapter 14A of the Listing Rules in respect of the above continuing connected transactions. When conducting the above continuing connected transactions during the Reporting Period, the Company has followed the pricing policies and guidelines formulated at the time when such transactions were entered into.
Policy Management Agreement
The Company and CLIC entered into the 2018 policy management agreement on 26 December 2017, with a term from 1 January 2018 to 31 December 2020. Pursuant to the agreement, the Company will continue to accept CLIC’s entrustment to provide policy administration services relating to the non-transferred policies. For details as to the method of calculation of the service fee, please refer to Note 18 in the Notes to the Interim Condensed Consolidated Financial Statements. The annual cap for the three years ending 31 December 2020 is RMB708 million.
For the first half of 2020, the service fee paid by CLIC to the Company amounted to RMB281.48 million.
Asset Management Agreements
Asset Management Agreement between the Company and AMC
The Company and AMC entered into the 2019-2021 asset management agreement on 28 December 2018, with a term from 1 January 2019 to 31 December 2021. In order to optimize the structure of service fees and further enhance the performance incentives for AMC, the Company and AMC entered into the 2020-2022 asset management agreement on 1 July 2020 to replace the 2019-2021 asset management agreement, and to revise the annual caps in light of the needs for business development and the revised structure of service fees. Pursuant to the 2020-2022 asset management agreement, AMC agreed to invest and manage assets entrusted to it by the Company, on a discretionary basis, within the scope granted by the Company and in accordance with the requirements of applicable laws and regulations, regulatory requirements and the investment guidelines given by the Company. In consideration of AMC’s services in respect of investing and managing various categories of assets entrusted to it by the Company under the agreement, the Company agreed to pay AMC a service fee. For details as to the method of calculation of the service fee for the first half of 2020, please refer to Note 18 in the Notes to the Interim Condensed Consolidated Financial Statements. The annual caps for the three years ending 31 December 2022 are RMB3,000 million, RMB4,000 million and RMB5,000 million, respectively.
For the first half of 2020, the Company paid AMC a service fee of RMB872.65 million.
Asset Management Agreement between CLIC and AMC
CLIC and AMC entered into the 2019-2021 asset management agreement on 29 December 2018, with an entrustment term from 1 January 2019 to 31 December 2021. In order to optimize the structure of service fees and further enhance the performance incentives for AMC, CLIC and AMC entered into the 2020-2022 asset management agreement on 1 July 2020 to replace the 2019-2021 asset management agreement, and to revise the annual caps in light of the needs for business development and the revised
39
structure of service fees. Pursuant to the 2020–2022 asset management agreement, AMC agreed to invest and manage assets entrusted to it by CLIC, on a discretionary basis, subject to the investment guidelines and instructions given by CLIC. In consideration of AMC’s services in respect of investing and managing assets entrusted to it by CLIC under the agreement, CLIC agreed to pay AMC a service fee. For details as to the method of calculation of the service fee for the first half of 2020, please refer to Note 18 in the Notes to the Interim Condensed Consolidated Financial Statements. The annual cap for the three years ending 31 December 2022 is RMB500 million.
For the first half of 2020, CLIC paid AMC a service fee of RMB44.51 million.
Asset Management Agreement for Alternative Investments between the Company and CLI
As approved by the 2017 Annual General Meeting of the Company, the Company and CLI entered into the 2019 asset management agreement for alternative investments on 31 December 2018. Such agreement took effect from 1 January 2019, with a term of two years until 31 December 2020. Unless a party serves the other party a written notice for non-renewal prior to 90 working days before the expiry date of the agreement, the agreement will be automatically renewed for one year from the expiry date thereof. Pursuant to the agreement, CLI agreed to invest and manage assets entrusted to it by the Company (including equity, real estate, related financial products and quasi-securitization
financial products), on a discretionary basis, within the scope of utilization of insurance funds as specified by regulatory authorities and in accordance with the requirements of applicable laws and regulations and the investment guidelines given by the Company, and the Company agreed to pay CLI the investment management service fee, floating management fee, performance-based bonus and real estate operation management fee in respect of the investment and management services provided by CLI to the Company. For details as to the method of calculation of the investment management service fee, floating management fee, performance-based bonus and real estate operation management fee, please refer to Note 18 in the Notes to the Interim Condensed Consolidated Financial Statements. In addition, the assets entrusted by the Company to CLI will also be partially used for the subscription of the related financial products established and issued by CLI or of which CLI has participated in the establishment and issuance, and such related financial products will be limited to infrastructure investment schemes and project asset-backed schemes.
For the three years ending 31 December 2021, the annual caps on the contractual amount of assets newly entrusted by the Company to CLI for investment and management, as well as the annual caps on the amount of the investment management service fee, floating management fee, performance-based bonus and real estate operation management service fee payable by the Company to CLI are as follows:
Amount of Assets Newly | Amount of the Investment Management Service Fee, Floating Management Fee, Performance-based Bonus and Real Estate Operation Management Service Fee (RMB million or its equivalent in foreign currency) | |||||
For the year ended | 200,000 (including the amount for the subscription of the related financial products: 100,000) | 1,391 | ||||
For the year ending | 200,000 (including the amount for the subscription of the related financial products: 100,000) | 1,982 | ||||
For the year ending | 200,000 (including the amount for the subscription of the related financial products: 100,000) | 2,266 | ||||
40
For the first half of 2020, the investment management service fee, floating management fee, performance-based bonus and real estate operation management service fee paid by the Company to CLI amounted to RMB290.59 million, and the contractual amount of assets newly entrusted by the Company to CLI for investment and management was RMB3,562.07 million. For the first half of 2020, the amount for the subscription of the related financial products established and issued by CLI or of which CLI had participated in the establishment and issuance was RMB2,970.00 million.
Cooperation Framework Agreement for Investment Management with Insurance Funds between the Company and China Life Capital
The Company and China Life Capital entered into the 2020–2022 framework agreement on 31 December 2019, with a term from 1 January 2020 to 31 December 2022. Pursuant to the agreement, the Company will continue to subscribe in the capacity of the limited partner for the fund products of which China Life Capital or any of its subsidiaries serves (individually and jointly with third parties) as the general partner, and/or the fund products of which China Life Capital serves as the manager (including the fund manager and co-manager). For the three years ending 31 December 2022, the annual cap for the subscription by the Company in the capacity of the limited partner of the fund products of which China Life Capital or any of its subsidiaries serves as the general partner is RMB5,000 million, and the annual cap for the management fee charged by China Life Capital as the general partner or the manager of the fund products is RMB200 million.
For the first half of 2020, the amount of subscription by the Company in the capacity of the limited partner of the fund products of which China Life Capital or any of its subsidiaries serves as the general partner was RMB0 million, and the management fee charged by China Life Capital as the general partner or the manager of the fund products was RMB32.86 million.
Insurance Sales Framework Agreement
The Company and CLP&C entered into the 2018 insurance sales framework agreement on 31 January 2018, with a term of three years from 8 March 2018 to 7 March 2021. Pursuant to the agreement, CLP&C will continue to entrust the Company to act as an agent to sell selected insurance products within the authorized regions, and pay an agency service fee to the Company in consideration of the services provided. For details as to the method of calculation of the agency service fee, please refer to Note 18 in the Notes to the Interim Condensed Consolidated Financial Statements. The annual caps for the three years ending 31 December 2020 are RMB4,260 million, RMB5,540 million and RMB7,050 million, respectively.
For the first half of 2020, CLP&C paid the Company an agency service fee of RMB1,202.64 million.
Framework Agreements with AMP
Framework Agreement between the Company and AMP
As approved by the First Extraordinary General Meeting 2019 of the Company, the Company and AMP entered into the 2020-2022 framework agreement on 31 December 2019, with a term of three years from 1 January 2020 to 31 December 2022. Pursuant to the agreement, the Company and AMP will continue to conduct certain daily transactions, including the subscription and redemption of fund products, sales agency services, asset management for specific clients and other daily transactions permitted by laws and regulations. Pricing of the transactions under the agreement shall be determined by the parties through arm’s length negotiations with reference to industry practices. For the three years ending 31 December 2022, the annual cap of the subscription price and corresponding subscription fee for the subscription of fund products is RMB72,600 million; the annual cap of the redemption price and corresponding redemption fee for the redemption of fund products is RMB72,600 million; the annual caps of the sales commission fee and client maintenance fee payable by AMP are RMB700 million, RMB800 million and RMB900 million, respectively; the annual caps of the management fee (including the performance-based fee) payable by the Company for the asset management for specific clients are RMB300 million, RMB400 million and RMB500 million, respectively; and the annual cap of the fees for other daily transactions is RMB100 million.
41
For the first half of 2020, the subscription price and corresponding subscription fee for the subscription of fund products were RMB599.50 million, the redemption price and corresponding redemption fee for the redemption of fund products were RMB1,370.35 million, the sales commission fee and client maintenance fee paid by AMP were RMB1.73 million, the management fee (including the performance-based fee) paid by the Company for the asset management for specific clients was RMB17.15 million, and the fees for other daily transactions were RMB1.37 million.
Framework Agreement between CLIC and AMP
As approved by the First Extra ordinary General Meeting 2019 of the Company, CLIC and AMP entered into the 2020-2022 framework agreement on 6 September 2019, with a term of three years from 1 January 2020 to 31 December 2022. Pursuant to the agreement, CLIC and AMP will continue to conduct certain daily transactions, including the subscription and redemption of fund products and private asset management. Pricing of the transactions under the agreement shall be determined by the parties through arm’s length negotiations with reference to industry practices. For the three years ending 31 December 2022, the annual cap of the subscription price and corresponding subscription fee for the subscription of fund products is RMB10,000 million; the annual cap of the redemption price and corresponding redemption fee for the redemption of fund products is RMB10,000 million; and the annual cap of the management fee (including the performance-based fee) payable by CLIC for the private asset management is RMB100 million.
For the first half of 2020, the subscription price and corresponding subscription fee for the subscription of fund products were RMB700.00 million, the redemption price and corresponding redemption fee for the redemption of fund products were RMB1,300.57 million, and the management fee (including the performance-based fee) paid by CLIC for the private asset management was RMB12.32 million.
Framework Agreement between CLP&C and AMP
As approved by the First Extra ordinary General Meeting 2019 of the Company, CLP&C and AMP entered into the 2020-2022 framework agreement on 3 December 2019, with a term of three years from 1 January 2020 to 31 December 2022. Pursuant to the agreement, CLP&C and AMP will continue to conduct certain daily transactions, including the subscription and redemption of fund products, asset management for specific clients and other daily transactions permitted by laws and regulations. Pricing of the
transactions under the agreement shall be determined by the parties through arm’s length negotiations with reference to industry practices. For the three years ending 31 December 2022, the annual cap of the subscription price for the fund products is RMB10,000 million; the annual cap of the redemption price for the fund products is RMB10,000 million; the annual cap of the subscription fee for the fund products is RMB100 million; the annual cap of the redemption fee for the fund products is RMB100 million; the annual cap of the management fee (including the performance-based fee) payable by CLP&C for the asset management for specific clients is RMB100 million; and the annual cap of the fees for other daily transactions is RMB100 million.
For the first half of 2020, the subscription price for the fund products was RMB0 million, the redemption price for the fund products was RMB0 million, the subscription fee for the fund products was RMB0 million, the redemption fee for the fund products was RMB0 million, the management fee (including the performance-based fee) paid by CLP&C for the asset management for specific clients was RMB2.55 million, and the fees for other daily transactions were RMB0.09 million.
Framework Agreement between CLI and AMP
As approved by the First Extraordinary General Meeting 2019 of the Company, CLI and AMP entered into the 2020-2022 framework agreement on 17 February 2020, with a term of three years from 1 January 2020 to 31 December 2022. Pursuant to the agreement, CLI and AMP will continue to conduct certain daily transactions, including the subscription and redemption of fund products, asset management for specific clients, advisory services and other daily transactions permit ted by laws and regulations. Pricing of the transactions under the agreement shall be determined by the parties through arm’s length negotiations with reference to industry practices. For the three years ending 31 December 2022, the annual cap of the subscription price and corresponding subscription fee for the subscription of fund products is RMB10,000 million; the annual cap of the redemption price and corresponding redemption fee for the redemption of fund products is RMB10,000 million; the annual cap of the management fee (including the performance-based fee) payable by CLI and its subsidiaries for the asset management for specific clients is RMB150 million; the annual cap of the management fee (including the performance-based fee) payable by the subsidiaries of AMP for the asset management for specific clients is RMB150 million; the annual cap of the advisory fee payable by CLI and its subsidiaries for the advisory services is RMB150 million; the annual cap of the advisory fee payable by AMP and its subsidiaries for the advisory services is RMB150 million; and the annual cap of the fees for other daily transactions is RMB150 million.
42
For the first half of 2020, the subscription price and corresponding subscription fee for the subscription of fund products were RMB16.43 million, the redemption price and corresponding redemption fee for the redemption of fund products were RMB32.27 million, the management fee (including the performance-based fee) paid by CLI and its subsidiaries for the asset management for specific clients was RMB0 million, the management fee (including the performance-based fee) paid by the subsidiaries of AMP for the asset management for specific clients was RMB0 million; the advisory fee paid by CLI and its subsidiaries for the advisory services was RMB0 million; the advisory fee paid by AMP and its subsidiaries for the advisory services was RMB0 million, and the fees for other daily transactions were RMB0.24 million.
Framework Agreements with CLWM
Framework Agreement between the Company and CLWM
The Company and CLWM entered into the 2018-2020 framework agreement on 28 December 2017, pursuant to which the Company will continue to conduct certain transactions with CLWM during the period from 1 January 2018 to 31 December 2020, including the asset management services, the sales agency services for asset management products and other daily transactions permitted by laws and regulations. Pricing of the transactions under the agreement shall be determined by the parties through arm’s length negotiations with reference to industry practices. For the three years ending 31 December 2020, the annual cap of the management fee payable by the Company for the asset management services is RMB240 million; the annual cap of fees in connection with the sales agency services payable by CLWM, including the sales commission fee, client maintenance fee, handling fee and intermediary fee, is RMB100 million; and the annual cap of the fees for other daily transactions is RMB100 million.
For the first half of 2020, the management fee paid by the Company for the asset management services was RMB3.60 million; the fees in connection with the sales agency services paid by CLWM, including the sales commission fee, client maintenance fee, handling fee and intermediary fee, were RMB0 million; and the fees for other daily transactions were RMB5.65 million.
Framework Agreement between CLIC and CLWM
CLIC and CLWM entered into the 2018-2020 framework agreement on 27 December 2017, pursuant to which CLIC will continue to conduct certain transactions with CLWM during the period from 1 January 2018 to 31 December 2020, including the asset management services and advisory services. Pricing of the transactions under the agreement shall be determined by the parties through arm’s length negotiations with reference to industry practices. For the three years ending 31 December 2020, the annual caps of the management fee payable by CLIC for the asset management services are RMB50 million, RMB120 million and RMB180 million, respectively; and the annual caps of the advisory fee payable by CLIC for the advisory services are RMB50 million, RMB80 million and RMB120 million, respectively.
For the first half of 2020, the management fee paid by CLIC for the asset management services was RMB1.07 million, and the advisory fee paid by CLIC for the advisory services was RMB0.86 million.
Framework Agreement between CLP&C and CLWM
CLP&C and CLWM entered into the 2018–2020 frame work agreement on 29 December 2017, pursuant to which CLP&C will continue to conduct certain transactions with CLWM during the period from 1 January 2018 to 31 December 2020, including the asset management services, advisory services and other daily transactions permitted by laws and regulations. Pricing of the transactions under the agreement shall be determined by the parties through arm’s length negotiations with reference to industry practices. For the three years ending 31 December 2020, the annual caps of the management fee payable by CLP&C for the asset management services are RMB50 million, RMB150 million and RMB240 million, respectively; the annual caps of the advisory fee payable by CLP&C for the advisory services are RMB40 million, RMB80 million and RMB120 million, respectively; and the annual caps of the fees for other daily transactions are RMB150 million, RMB400 million and RMB700 million, respectively.
For the first half of 2020, the management fee paid by CLP&C for the asset management services was RMB2.36 million, the advisory fee paid by CLP&C for the advisory services was RMB1.84 million, and the fees for other daily transactions were RMB0.01 million.
43
Framework Agreement between CLI and CLWM
CLI and CLWM entered into the 2018-2020 framework agreement on 20 December 2017, pursuant to which CLI will continue to conduct certain transactions with CLWM during the period from 1 January 2018 to 31 December 2020, including the asset management services, advisory services and other daily transactions permitted by laws and regulations. Pricing of the transactions under the agreement shall be determined by the parties through arm’s length negotiations with reference to industry practices. For the three years ending 31 December 2020, the annual caps of the management fee for the asset management services are RMB40 million, RMB80 million and RMB120 million, respectively; the annual caps of the advisory fee for the advisory services are RMB40 million, RMB80 million and RMB120 million, respectively; and the annual caps of the fees for other daily transactions are RMB20 million, RMB80 million and RMB160 million, respectively.
For the first half of 2020, there was no relevant transaction between CLI and CLWM.
Framework Agreement between Pension Company and CLWM
Pension Company and CLWM entered into the 2018-2020 framework agreement on 26 March 2018, pursuant to which Pension Company will conduct certain transactions with CLWM during the period from 1 January 2018 to 31 December 2020, including the asset management services, advisory services and other daily transactions permitted by laws and regulations. Pricing of the transactions under the agreement shall be determined by the parties through arm’s length negotiations with reference to industry practices. For the three years ending 31 December 2020, the annual caps of the management fee payable by Pension Company for the asset management services are RMB100 million, RMB150 million and RMB200 million, respectively; the annual caps of the advisory fee payable by Pension Company for the advisory services are RMB40 million, RMB80 million and RMB90 million, respectively; and the annual caps of the fees for other daily transactions are RMB90 million, RMB180 million and RMB270 million, respectively.
For the first half of 2020, there was no relevant transaction between Pension Company and CLWM.
Framework Agreement between CLEC and CLWM
CLEC and CLWM entered into the 2018–2020 framework agreement on 29 December 2017, pursuant to which CLEC will conduct certain transactions with CLWM during the period from 1 January 2018 to 31 December 2020, including the asset management services, advisory services and other daily transactions permitted by laws and regulations. Pricing of the transactions under the agreement shall be determined by the parties through arm’s length negotiations with reference to industry practices. For the three years ending 31 December 2020, the annual caps of the management fee payable by CLEC for the asset management services are RMB5 million, RMB10 million and RMB15 million, respectively; the annual caps of the advisory fee payable by CLEC for the advisory services are RMB5 million, RMB10 million and RMB15 million, respectively; and the annual caps of the fees for other daily transactions are RMB200 million; RMB300 million and RMB400 million, respectively.
For the first half of 2020, there was no relevant transaction between CLEC and CLWM.
Framework Agreement between the Company and Chongqing Trust
The Company and Chongqing Trust entered into the 2020-2022 framework agreement on 27 December 2019, with a term of three years from 1 January 2020 to 31 December 2022. Pursuant to the agreement, the Company and Chongqing Trust will continue to conduct the subscription and redemption of trust products and other daily transactions permitted by laws and regulations. Pricing of the transactions under the agreement shall be determined by the parties through arm’s length negotiations with reference to industry practices. For the three years ending 31 December 2022, the annual cap of the total amount of subscription and redemption of the trust products is RMB30,000 million; the annual cap of the trustee’s remuneration is RMB500 million; and the annual cap of the fees for other daily transactions is RMB100 million.
For the first half of 2020, the total amount of subscription and redemption of the trust products was RMB2,000.00 million, the trustee’s remuneration was RMB0.53 million, and the fees for other daily transactions were RMB0 million.
44
Other Major Connected Transaction
Formation of Partnership (Hebei Xiongan Baiyangdian Ecological and Environmental Protection Fund)
As approved at the sixteenth meeting of the sixth session of the Board of Directors, the Company and other investors (each as a limited partner) originally intended to enter into a partnership agreement with China Xiongan Group Fund Management Co., Ltd. and China Life Industrial Investment Management Co., Ltd. (“CLIIM”) (each as a general partner) by 31 December 2019 for the formation of Hebei Xiongan Baiyangdian Ecological and Environmental Protection Fund (Limited Partnership). The Company planned to contribute RMB3 billion to the partnership. China Life Capital would serve as the manager of the partnership. The partnership shall have a term of fifteen years. It shall invest in ecological and environmental protection projects in Baiyangdian watershed, covering water, solid waste treatment and other industries.
As there might be changes in the investors of the partnership and the size of the partnership might decrease, the parties were not able to enter into the partnership agreement by 31 December 2019 as originally planned. The Company will promptly make a further announcement in respect of the connected transaction when the terms of the partnership agreement are finalized by the parties.
Each of CLIIM and China Life Capital is a subsidiary of CLIC, and therefore a connected person of the Company. The transaction concerning the formation of partnership as described above constituted a connected transaction of the Company that was subject to the reporting and announcement requirements but was exempt from the independent shareholders’ approval requirement under Rule 14A.76(2) of the Listing Rules.
The Company has complied with the disclosure requirement under Chapter 14A of the Listing Rules in respect of the connected transaction concerning the formation of partnership as described above.
Statement on Claims, Debt Transactions and Guarantees of a Non-operating Nature with Related Parties
During the Reporting Period, the Company was not involved in claims, debt transactions or guarantees of a non-operating nature with related parties.
PURCHASE, SALE OR REDEMPTION OF THE COMPANY’S SECURITIES
During the Reporting Period, the Company and its subsidiaries did not purchase, sell or redeem any of the Company’s listed securities.
MATERIAL CONTRACTS AND THEIR PERFORMANCE
During the Reporting Period, the Company neither acted as trustee, contractor or lessee of other companies’ assets, nor entrusted, contracted or leased its assets to other companies, the profit or loss from which accounted for 10% or more of the Company’s profits for the Reporting Period, nor were there any such matters that occurred in previous periods but subsisted during the Reporting Period.
The Company neither gave external guarantees nor provided guarantees to its non-wholly owned subsidiaries during the Reporting Period.
45
Entrusted wealth management during the Reporting Period or any wealth management occurred in previous periods but subsisted during the Reporting Period: Investment is one of the principal businesses of the Company. The Company has adopted the mode of entrusted investment for management of its investment assets, and established a diversified framework of entrusted investment management with China Life’s internal managers playing the key role and the external managers offering effective supports. The internal managers include AMC and its subsidiaries, CLI and its subsidiaries, and Pension Company. The external managers comprise both domestic and overseas managers, including fund companies, securities companies and other professional investment management institutions. The Company selected different investment managers based on the purpose of allocation of various types of investments, their risk features and the expertise of different managers, so as to establish a great variety of investment portfolios and improve the efficiency of capital utilization. The Company entered into entrusted investment management agreements with all managers and supervised the managers’ daily investment performance through the measures such as investment guidelines, asset entrustment and performance appraisals. The Company also adopted risk control measures in respect of specific investments based on the characteristics of different managers and investment products.
Except as otherwise disclosed in this report, the Company had no other material contracts during the Reporting Period.
H SHARE STOCK APPRECIATION RIGHTS
No H Share Stock Appreciation Rights of the Company were granted or exercised in the first half of 2020. The Company will deal with such rights and related matters in accordance with relevant PRC governmental policies.
UNDERTAKINGS OF THE COMPANY, SHAREHOLDERS, EFFECTIVE CONTROLLERS, ACQUIRERS, DIRECTORS, SUPERVISORS, SENIOR MANAGEMENT OR OTHER RELATED PARTIES WHICH ARE EITHER GIVEN OR EFFECTIVE DURING THE REPORTING PERIOD
Prior to the listing of the Company’s A Shares (30 November 2006), land use rights were injected by CLIC into the Company during its reorganization. Out of these, four pieces of land (with a total area of 10,421.12 square meters) had not had its formalities in relation to the change of ownership completed. Further, out of the properties injected into the Company, there were six properties (with a gross floor area of 8,639.76 square meters) in respect of which the formalities in relation to the change of ownership had not been completed. CLIC undertook to complete the above-mentioned formalities within one year of the date of listing of the Company’s A Shares, and in the event that such formalities could not be completed within such period, CLIC would bear any potential losses to the Company due to the defective ownership.
CLIC strictly followed these commitments. As at the end of the Reporting Period, save for the two properties and related land of the Company’s Shenzhen Branch, the ownership registration formalities of which had not been completed due to historical reasons, all other formalities in relation to the change of land and property ownership had been completed. The Shenzhen Branch of the Company continues to use such properties and land, and no other parties have questioned or hindered the use of such properties and land by the Company.
46
The Company’s Shenzhen Branch and the other co-owners of the properties have issued a letter to the governing department of the original owner of the properties in respect of the confirmation of ownership of the properties, requesting it to report the ownership issue to the State-owned Assets Supervision and Administration Commission of the State Council (the “SASAC”), and requesting the SASAC to confirm the respective shares of each co-owner in the properties and to issue written documents in this regard to the department of land and resources of Shenzhen, so as to assist the Company and the other co-owners to complete the formalities in relation to the division of ownership of the properties.
Given that the change of ownership of the above two properties and related land use rights were directed by the co-owners, and all formalities in relation to the change of ownership were proceeded slowly due to reasons such as issues rooted in history and government approvals, CLIC, the controlling shareholder of the Company, made further commitment as follows: CLIC will assist the Company in completing, and urge the co-owners to complete, the formalities in relation to the change of ownership in respect of the above two properties and related land use rights as soon as possible. If the formalities cannot be completed due to the reasons of the co-owners, CLIC will take any other legally practicable measures to resolve the issue and will bear any potential losses suffered by the Company as a result of the defective ownership.
AUDITORS
A resolution was passed at the 2019 Annual General Meeting held on 29 June 2020 to engage Ernst & Young Hua Ming LLP as the PRC auditor and the auditor for US Form 20-F of the Company for the year 2020, and Ernst & Young as the Hong Kong auditor of the Company for the year 2020. The Company’s 2020 half-year financial statements prepared in accordance with the China Accounting Standards for Business Enterprises have been reviewed (not audited) by Ernst & Young Hua Ming LLP and the Company’s 2020 Interim Condensed Consolidated Financial Statements prepared in accordance with the International Financial Reporting Standards have been reviewed (not audited) by Ernst & Young.
RESTRICTION ON MAJOR ASSETS
The major assets of the Company are financial assets. During the Reporting Period, there was no major asset of the Company being seized, detained or frozen that is subject to the disclosure requirements.
OTHERS
In order to consistently implement the relevant arrangements under the “Notice of the State Council on Issuing the Implementation Plan for Transferring Part of State-owned Capital to Supplement Social Security Fund” (Guo Fa [2017] No. 49), the CBIRC has approved the one-off transfer by the Ministry of Finance of 10% of its equity interest in CLIC to the National Council for Social Security Fund (the “SSF”) (the “Gratuitous Transfer”) in accordance with the “Reply for the Approval of Change of Shareholder of China Life Insurance (Group) Company” (CBIRC’s Reply [2020] No. 63). Following completion of the Gratuitous Transfer, the Ministry of Finance and the SSF hold 90% and 10% equity interest in CLIC, respectively. CLIC is the controlling shareholder of the Company, and the Ministry of Finance is the effective controller of the Company. The Gratuitous Transfer would not result in any change of the controlling shareholder or effective controller of the Company. For further details, please refer to the announcements published by the Company on the website of the SSE (http://www.sse.com.cn) and the HKEx news website of Hong Kong Exchanges and Clearing Limited (http://www.hkexnews.hk).
47

CORPORATE GOVERNANCE
In the first half of 2020, the Company adhered strictly to the regulatory requirements and listing rules of the jurisdictions where it is listed, and adopted effective measures to improve the efficiency of the Board of Directors, strengthen the communication with investors, standardize and upgrade the system and workflow of information disclosure, and increase the transparency of its business operations, so as to ensure that investors, especially small and medium investors, have an equal access to the Company’s information.
The shareholders’ general meetings, Board of Directors meetings and Board of Supervisors meetings of the Company have been functioning pursuant to their relevant procedural rules. As at 30 June 2020, the Board of Directors held five meetings, and the Board of Supervisors held two meetings.
As at the latest practicable date (26 August 2020), the Board of Directors held seven meetings, and the Board of Supervisors held three meetings. The announcements concerning the resolutions adopted at the above meetings were published on the China Securities Journal, Shanghai Securities News and Securities Times, as well as the website of the SSE, the HKExnews website of Hong Kong Exchanges and Clearing Limited and the website of the Company.
Shareholders’ general meetings convened during the Reporting Period are as follows:
The “Proposal in relation to the Investment by the Company in China Life Aged-care Industry Investment Fund” was considered and approved by a combination of on-site and online voting at the First Extraordinary General Meeting 2020 held in Beijing on 20 February 2020.
48
Eight proposals, including the “Proposal in relation to the Report of the Board of Directors of the Company for the Year 2019”, the “Proposal in relation to the Report of the Board of Supervisors of the Company for the Year 2019”, the “Proposal in relation to the Financial Report of the Company for the Year 2019”, the “Proposal in relation to the Profit Distribution Plan of the Company for the Year 2019”, the “Proposal in relation to the Remuneration of Directors and Supervisors of the Company”, the “Proposal in relation to the Election of Mr. Lam Chi Kuen as an Independent Director of the Sixth Session of the Board of Directors of the Company”, the “Proposal in relation to the
Remuneration of Auditors of the Company for the Year 2019 and the Appointment of Auditors of the Company for the Year 2020” and the “Proposal in relation to the General Mandate for the Issuance of H Shares by the Company”, were considered and approved by a combination of on-site and online voting, and the “Duty Report of the Independent Directors of the Board of Directors of the Company for the Year 2019” and the “Report on the Overall Status of Connected Transactions of the Company for the Year 2019” were received and reviewed at the 2019 Annual General Meeting held in Beijing on 29 June 2020.
Session of the meeting | Date of the meeting | Index for websites on which | Date of publication of resolutions | |||
| First Extraordinary General Meeting 2020 | 20 February 2020 | http://www.sse.com.cn http://www.hkexnews.hk | 20 February 2020 | |||
| http://www.e-chinalife.com | ||||||
| http://www.sse.com.cn | ||||||
2019 Annual General Meeting | 29 June 2020 | http://www.hkexnews.hk | 29 June 2020 | |||
| http://www.e-chinalife.com |
The Company has applied the principles of the Corporate Governance Code and Corporate Governance Report (the “CG Code”) as set out in Appendix 14 to the Listing Rules, and has complied with all code provisions of the CG Code during the Reporting Period.
The Audit Committee of the Board of the Company has reviewed the 2020 Interim Report of the Company.
IMPLEMENTATION OF PROFIT DISTRIBUTION PLAN DURING THE REPORTING PERIOD
The Company will not declare any interim dividend of ordinary shares for the Reporting Period.
According to the Profit Distribution Plan of the Company for the Year 2019 approved at the 2019 Annual General Meeting held on 29 June 2020, with the appropriation to its discretionary surplus reserve fund of RMB5,857 million (10% of the net profit for the year 2019 under the China Accounting Standards for Business Enterprises), based on a total of 28,264,705,000 shares in issue, the Company has distributed a cash dividend of RMB0.73 per share (inclusive of tax) to all holders of ordinary shares of the Company, totaling approximately RMB20,633 million.
49
CHANGES IN ORDINARY SHARES AND SHAREHOLDERS INFORMATION
Changes in Share Capital
During the Reporting Period, there was no change in the total number of shares and the share capital of the Company.
Information on Shareholders
Total number of shareholders and their shareholdings
| Total number of holders of ordinary shares as at the end of the Reporting Period | No. of holders of A Shares: 121,613 | |
| No. of holders of H Shares : 26,997 | ||
| Particulars of top ten shareholders of the Company | ||
Name of shareholder | Nature of shareholder | Percentage of shareholding | Total number of shares held as at the end of the Reporting Period | Increase/decrease during the Reporting Period | Number of shares subject to selling restrictions | Unit: Shares Number of shares pledged or frozen | ||||||||||||||||
China Life Insurance (Group) Company | State-owned legal person | 68.37 | % | 19,323,530,000 | 0 | – | – | |||||||||||||||
HKSCC Nominees Limited | Overseas legal person | 25.92 | % | 7,324,925,201 | +1,234,498 | – | – | |||||||||||||||
China Securities Finance Corporation Limited | State-owned legal person | 2.56 | % | 723,937,634 | 0 | – | – | |||||||||||||||
Central Huijin Asset Management Limited | State-owned legal person | 0.42 | % | 119,719,900 | 0 | – | – | |||||||||||||||
Hong Kong Securities Clearing Company Limited | Overseas legal person | 0.23 | % | 66,295,344 | +11,645,180 | – | – | |||||||||||||||
China Universal Asset Management Co., Ltd – Industrial and Commercial Bank of China Limited – China Universal – Tianfu Bull No. 53 Asset Management Plan | Other | 0.05 | % | 15,015,845 | 0 | – | – | |||||||||||||||
China National Nuclear Corporation | State-owned legal person | 0.04 | % | 12,400,000 | 0 | – | – | |||||||||||||||
Industrial and Commercial Bank of China Limited – SSE 50 Exchange Traded Index Securities Investment Fund | Other | 0.04 | % | 11,293,409 | -1,512,714 | – | – | |||||||||||||||
China International Television Corporation | State-owned legal person | 0.04 | % | 10,000,000 | 0 | – | – | |||||||||||||||
Abu Dhabi Investment Authority | Overseas legal person | 0.03 | % | 9,174,546 | -1,063,762 | – | – | |||||||||||||||
| 1. | HKSCC Nominees Limited is a company that holds shares on behalf of the clients of the Hong Kong stock brokers and other participants of the CCASS system. The relevant regulations of the HKSE do not require such persons to declare whether their shareholdings are pledged or frozen. Hence, HKSCC Nominees Limited is unable to calculate or provide the number of shares that are pledged or frozen. | |||
| Details of shareholders | ||||
| 2. | China Universal Asset Management Co., Ltd – Industrial and Commercial Bank of China Limited – China Universal – Tianfu Bull No. 53 Asset Management Plan has Industrial and Commercial Bank of China Limited as its asset trustee. Industrial and Commercial Bank of China Limited – SSE 50 Exchange Traded Index Securities Investment Fund has Industrial and Commercial Bank of China Limited as its fund depositary. Save as above, the Company was not aware of any connected relationship and concerted parties as defined by the “Measures for the Administration of the Takeover of Listed Companies” among the top ten shareholders of the Company. | |||
50
Change in the Controlling Shareholder and the Effective Controller
During the Reporting Period, there was no change in the controlling shareholder and the effective controller of the Company.
Interests and Short Positions in the Shares and Underlying Shares of the Company Held by Substantial Shareholders and Other Persons Under Hong Kong Laws and Regulations
So far as is known to the Directors, Supervisors and the chief executive of the Company, as at 30 June 2020, the following persons (other than the Directors, Supervisors and the chief executive of the Company) had interests or short positions in the shares or underlying shares of the Company which would fall to be disclosed to the Company under the provisions of Divisions 2 and 3 of Part XV of the SFO, or which were recorded in the register required to be kept by the Company pursuant to Section 336 of the SFO, or as otherwise notified to the Company and HKSE:
Name of substantial shareholder | Capacity | Class of shares | Number of shares held | Percentage of the respective class of shares | Percentage of the total number of shares in issue | |||||||||||||
China Life Insurance (Group) Company | Beneficial owner | A Shares | 19,323,530,000 | (L) | 92.80 | % | 68.37 | % | ||||||||||
BlackRock, Inc.(Note) | Interest in controlled corporation | H Shares | 665,162,100 | (L) | 8.94 | % | 2.35 | % | ||||||||||
| 1,258,000 | (S) | 0.02 | % | 0.00 | % | |||||||||||||
The letter “L” denotes a long position. The letter “S” denotes a short position.
| (Note): | BlackRock, Inc. was interested in a total of 665,162,100 H shares in accordance with the provisions of Part XV of the SFO. Of these shares, BlackRock Investment Management, LLC, BlackRock Financial Management, Inc., BlackRock Institutional Trust Company, National Association, BlackRock Fund Advisors, BlackRock Advisors, LLC, BlackRock Japan Co., Ltd., BlackRock Asset Management Canada Limited, BlackRock Investment Management (Australia) Limited, BlackRock Asset Management North Asia Limited, BlackRock (Netherlands) B.V., BlackRock Advisors (UK) Limited, BlackRock International Limited, BlackRock Asset Management Ireland Limited, BLACKROCK (Luxembourg) S.A., BlackRock Investment Management (UK) Limited, BlackRock Asset Management Deutschland AG, BlackRock Fund Managers Limited, BlackRock Life Limited, BlackRock (Singapore) Limited, BlackRock Asset Management (Schweiz) AG and BlackRock Mexico Operadora were interested in 4,009,000 H shares, 11,683,000 H shares, 128,753,588 H shares, 170,077,000 H shares, 11,084,000 H shares, 59,183,499 H shares, 1,035,000 H shares, 4,309,000 H shares, 31,571,236 H shares, 1,163,000 H shares, 2,232,000 H shares, 1,254,000 H shares, 52,737,436 H shares, 85,914,000 H shares, 34,747,893 H shares, 494,000 H shares, 41,641,742 H shares, 20,453,741 H shares, 2,388,000 H shares, 54,000 H shares and 376,965 H shares, respectively. All of these entities are either controlled or indirectly controlled subsidiaries of BlackRock, Inc. Of these 665,162,100 H shares, 8,578,000 H shares were cash settled unlisted derivatives. |
BlackRock, Inc. held by way of attribution a short position as defined under Part XV of the SFO in 1,258,000 H shares. Of these 1,258,000 H shares, 902,000 H shares were cash settled unlisted derivatives. |
Save as disclosed above, the Directors, Supervisors and the chief executive of the Company are not aware of any other party who, as at 30 June 2020, had an interest or short position in the shares and underlying shares of the Company which was recorded in the register required to be kept by the Company pursuant to Section 336 of the SFO.
51
DIRECTORS, SUPERVISORS, SENIOR MANAGEMENT AND EMPLOYEES
Change in Shares of the Company Held by Directors, Supervisors and Senior Management
During the Reporting Period, there was no change in shares of the Company held by Directors, Supervisors and senior management.
Change of Directors, Supervisors and Senior Management
After the election at the First Extraordinary General Meeting 2019 of the Company and upon the approval by the CBIRC Beijing Bureau, Mr. Zhao Peng served as an Executive Director of the sixth session of the Board of Directors and a member of the Strategy and Assets and Liabilities Management Committee of the Company from 20 February 2020. Due to the adjustment of work arrangements, Mr. Zhao Peng ceased to be an Executive Director of the sixth session of the Board of Directors and a member of the Strategy and Assets and Liabilities Management Committee of the Company from 23 April 2020. Mr. Lam Chi Kuen was elected as an Independent Director of the sixth session of the Board of Directors of the Company at the 2019 Annual General Meeting of the Company. The qualification of Mr. Lam Chi Kuen as a Director is still subject to the approval of the CBIRC Beijing Bureau.
After the election at the fourth extraordinary meeting of the second session of the employee representative meeting of the Company and upon the approval by the CBIRC Beijing Bureau, Ms. Wang Xiaoqing served as an Employee Representative Supervisor of the sixth session of the Board of Supervisors of the Company from 27 December 2019. Due to the adjustment of work arrangements, Mr. Song Ping ceased to be an Employee Representative Supervisor of the sixth session of the Board of Supervisors of the Company from 3 January 2020. Due to the adjustment of work arrangements, Mr. Luo Zhaohui ceased to be a Non-employee Representative Supervisor of the sixth session of the Board of Supervisors of the Company from 22 July 2020.
Due to the adjustment of work arrangements, Mr. Zhao Peng ceased to be the person in charge of finance of the Company from 23 April 2020. As considered by the twenty-fifth meeting of the sixth session of the Board of Directors of the Company and upon the approval by the CBIRC Beijing Bureau, Ms. Huang Xiumei served as the person in charge of finance of the Company from 20 May 2020.
Employees of the Company
As at 30 June 2020, the Company had 101,541 employees in total. There was no material change in the employee remuneration policy and training program when compared with the information disclosed in the annual report of the Company for 2019.
Disclosure of Interests of Directors, Supervisors and the Chief Executive in the Shares of the Company
As at 30 June 2020, none of the Directors, Supervisors and the chief executive of the Company had any interests or short positions in the shares, underlying shares or debentures of the Company or its associated corporations (within the meaning of Part XV of the SFO) that were required to be recorded in the register of the Company required to be kept pursuant to Section 352 of the SFO or which had to be notified to the Company and the HKSE pursuant to the Model Code for Securities Transactions by Directors of Listed Issuers (the “Model Code”) as set out in Appendix 10 to the Listing Rules.
Compliance with the Code for Securities Transactions by Directors and Supervisors of the Company
The Board has established written guidelines on no less exacting terms than the Model Code for Directors and Supervisors of the Company in respect of their dealings in the securities of the Company. After making specific inquiries to all the Directors and Supervisors of the Company, they confirmed that they had complied with the Model Code and the Company’s own guidelines during the Reporting Period.
52
Auditor’s Independent Review Report

To the board of directors of China Life Insurance Company Limited
(Incorporated in the People’s Republic of China with limited liability)
INTRODUCTION
We have reviewed the interim condensed consolidated financial statements, set out on pages 55 to 103, which comprise the interim condensed consolidated statement of financial position of China Life Insurance Company Limited (the “Company”) and its subsidiaries (together, the “Group”) as at 30 June 2020 and the related interim condensed consolidated statements of comprehensive income, changes in equity and cash flows for the six-month period then ended, a summary of significant accounting policies and explanatory notes. The Rules Governing the Listing of Securities on The Stock Exchange of Hong Kong Limited require the preparation of a report on interim financial information to be in compliance with the relevant provisions thereof and International Accounting Standard 34 Interim Financial Reporting (“IAS 34”) issued by the International Accounting Standards Board. The directors of the Company are responsible for the preparation and presentation of these interim condensed consolidated financial statements in accordance with IAS 34. Our responsibility is to express a conclusion on these interim condensed consolidated financial statements based on our review. Our report is made solely to you, as a body, in accordance with our agreed terms of engagement, and for no other purpose. We do not assume responsibility towards, or accept liability to, any other person for the contents of this report.
SCOPE OF REVIEW
We conducted our review in accordance with International Standard on Review Engagements 2410 Review of Interim Financial Information Performed by the Independent Auditor of the Entity. A review of interim financial information consists of making inquiries, primarily of persons responsible for financial and accounting matters, and applying analytical and other review procedures. A review is substantially less in scope than an audit conducted in accordance with International Standards on Auditing and consequently does not enable us to obtain assurance that we would become aware of all significant matters that might be identified in an audit. Accordingly, we do not express an audit opinion.
CONCLUSION
Based on our review, nothing has come to our attention that causes us to believe that the interim condensed consolidated financial statements are not prepared, in all material respects, in accordance with IAS 34.
Ernst & Young
Certified Public Accountants
Hong Kong
26 August 2020
54
Interim Condensed Consolidated Statement of Financial Position
As at 30 June 2020
| Notes | Unaudited As at 30 June 2020 RMB million | Audited As at 31 December 2019 RMB million | ||||||||||
| ASSETS | ||||||||||||
Property, plant and equipment | 51,303 | 51,758 | ||||||||||
Right-of-use assets | 3,291 | 3,520 | ||||||||||
Investment properties | 13,450 | 12,141 | ||||||||||
Investments in associates and joint ventures | 6 | 227,764 | 222,983 | |||||||||
Held-to-maturity securities | 7.1 | 1,001,314 | 928,751 | |||||||||
Loans | 7.2 | 651,388 | 608,920 | |||||||||
Term deposits | 7.3 | 536,256 | 535,260 | |||||||||
Statutory deposits – restricted | 6,333 | 6,333 | ||||||||||
Available-for-sale securities | 7.4 | 1,052,029 | 1,058,957 | |||||||||
Securities at fair value through profit or loss | 7.5 | 150,399 | 141,608 | |||||||||
Derivative financial assets | 7.6 | — | 428 | |||||||||
Securities purchased under agreements to resell | 61,202 | 4,467 | ||||||||||
Accrued investment income | 43,241 | 41,703 | ||||||||||
Premiums receivable | 48,395 | 17,281 | ||||||||||
Reinsurance assets | 5,273 | 5,161 | ||||||||||
Other assets | 33,378 | 34,029 | ||||||||||
Deferred tax assets | 14 | 128 | 128 | |||||||||
Cash and cash equivalents | 80,889 | 53,306 | ||||||||||
|
|
|
| |||||||||
Total assets | 3,966,033 | 3,726,734 | ||||||||||
|
|
|
| |||||||||
The notes on pages 61 to 103 form an integral part of the interim condensed consolidated financial statements.
55
Interim Condensed Consolidated Statement of Financial Position (continued)
As at 30 June 2020
| Notes | Unaudited As at 30 June 2020 RMB million | Audited As at 31 December 2019 RMB million | ||||||||||
| LIABILITIES AND EQUITY | ||||||||||||
Liabilities | ||||||||||||
Insurance contracts | 8 | 2,858,092 | 2,552,736 | |||||||||
Investment contracts | 9 | 284,882 | 267,804 | |||||||||
Policyholder dividends payable | 114,038 | 112,593 | ||||||||||
Interest-bearing loans and borrowings | 20,361 | 20,045 | ||||||||||
Lease liabilities | 2,960 | 3,091 | ||||||||||
Bonds payable | 34,991 | 34,990 | ||||||||||
Financial liabilities at fair value through profit or loss | 4,259 | 3,859 | ||||||||||
Securities sold under agreements to repurchase | 48,127 | 118,088 | ||||||||||
Annuity and other insurance balances payable | 54,774 | 51,019 | ||||||||||
Premiums received in advance | 2,888 | 60,898 | ||||||||||
Other liabilities | 107,377 | 81,114 | ||||||||||
Deferred tax liabilities | 14 | 10,151 | 10,330 | |||||||||
Current income tax liabilities | 181 | 223 | ||||||||||
Statutory insurance fund | 775 | 602 | ||||||||||
|
|
|
| |||||||||
Total liabilities | 3,543,856 | 3,317,392 | ||||||||||
|
|
|
| |||||||||
Equity | ||||||||||||
Share capital | 19 | 28,265 | 28,265 | |||||||||
Other equity instruments | 20 | 7,791 | 7,791 | |||||||||
Reserves | 205,598 | 197,221 | ||||||||||
Retained earnings | 174,252 | 170,487 | ||||||||||
|
|
|
| |||||||||
Attributable to equity holders of the Company | 415,906 | 403,764 | ||||||||||
|
|
|
| |||||||||
Non-controlling interests | 6,271 | 5,578 | ||||||||||
|
|
|
| |||||||||
Total equity | 422,177 | 409,342 | ||||||||||
|
|
|
| |||||||||
Total liabilities and equity | 3,966,033 | 3,726,734 | ||||||||||
|
|
|
| |||||||||
Approved and authorised for issue by the board of directors on 26 August 2020.
Wang Bin | Su Hengxuan | |
Director | Director |
The notes on pages 61 to 103 form an integral part of the interim condensed consolidated financial statements.
56
Interim Condensed Consolidated Statement of Comprehensive Income
For the six months ended 30 June 2020
Unaudited For the six months ended 30 June | ||||||||||||
| 2020 | 2019 | |||||||||||
| Notes | RMB million | RMB million | ||||||||||
REVENUES | ||||||||||||
Gross written premiums | 427,367 | 377,976 | ||||||||||
Less: premiums ceded to reinsurers | (3,113 | ) | (2,641 | ) | ||||||||
|
|
|
| |||||||||
Net written premiums | 424,254 | 375,335 | ||||||||||
Net change in unearned premium reserves | (16,318 | ) | (14,038 | ) | ||||||||
|
|
|
| |||||||||
Net premiums earned | 407,936 | 361,297 | ||||||||||
|
|
|
| |||||||||
Investment income | 10 | 72,706 | 66,345 | |||||||||
Net realised gains on financial assets | 11 | 10,807 | 3,786 | |||||||||
Net fair value gains through profit or loss | 12 | 8,606 | 13,107 | |||||||||
Other income | 4,376 | 3,686 | ||||||||||
|
|
|
| |||||||||
Total revenues | 504,431 | 448,221 | ||||||||||
|
|
|
| |||||||||
BENEFITS, CLAIMS AND EXPENSES | ||||||||||||
Insurance benefits and claims expenses | ||||||||||||
Life insurance death and other benefits | (62,640 | ) | (83,821 | ) | ||||||||
Accident and health claims and claim adjustment expenses | (24,311 | ) | (21,819 | ) | ||||||||
Increase in insurance contract liabilities | (284,999 | ) | (224,409 | ) | ||||||||
Investment contract benefits | (5,030 | ) | (4,617 | ) | ||||||||
Policyholder dividends resulting from participation in profits | (14,507 | ) | (10,836 | ) | ||||||||
Underwriting and policy acquisition costs | (56,518 | ) | (45,595 | ) | ||||||||
Finance costs | (1,772 | ) | (1,930 | ) | ||||||||
Administrative expenses | (17,047 | ) | (16,958 | ) | ||||||||
Statutory insurance fund contribution | (803 | ) | (737 | ) | ||||||||
Other expenses | (5,260 | ) | (4,271 | ) | ||||||||
|
|
|
| |||||||||
Total benefits, claims and expenses | (472,887 | ) | (414,993 | ) | ||||||||
|
|
|
| |||||||||
Net gains on investments of associates and joint ventures | 4,020 | 5,665 | ||||||||||
Including: share of profit of associates and joint ventures | 4,690 | 5,665 | ||||||||||
|
|
|
| |||||||||
Profit before income tax | 13 | 35,564 | 38,893 | |||||||||
Income tax | 14 | (4,502 | ) | (964 | ) | |||||||
|
|
|
| |||||||||
Net profit | 31,062 | 37,929 | ||||||||||
|
|
|
| |||||||||
Attributable to: | ||||||||||||
– Equity holders of the Company | 30,535 | 37,599 | ||||||||||
– Non-controlling interests | 527 | 330 | ||||||||||
Basic and diluted earnings per share | 15 | RMB1.07 | RMB1.32 | |||||||||
The notes on pages 61 to 103 form an integral part of the interim condensed consolidated financial statements.
57
Interim Condensed Consolidated Statement of Comprehensive Income (continued)
For the six months ended 30 June 2020
Unaudited For the six months ended 30 June | ||||||||
| 2020 | 2019 | |||||||
| RMB million | RMB million | |||||||
Other comprehensive income | ||||||||
Other comprehensive income that may be reclassified to profit or loss in subsequent periods: | ||||||||
Fair value gains/(losses) on available-for-sale securities | 11,865 | 42,263 | ||||||
Amount transferred to net profit from other comprehensive income | (10,835 | ) | (4,759 | ) | ||||
Portion of fair value changes on available-for-sale securities attributable to participating policyholders | 1,829 | (11,144 | ) | |||||
Share of other comprehensive income of associates and joint ventures under the equity method | 18 | 378 | ||||||
Exchange differences on translating foreign operations | 83 | 65 | ||||||
Income tax relating to components of other comprehensive income | (568 | ) | (6,586 | ) | ||||
|
|
|
| |||||
Other comprehensive income that may be reclassified to profit or loss in subsequent periods | 2,392 | 20,217 | ||||||
|
|
|
| |||||
Other comprehensive income that will not be reclassified to profit or loss in subsequent periods: | ||||||||
Share of other comprehensive income of associates and joint ventures under the equity method | (108 | ) | — | |||||
|
|
|
| |||||
Other comprehensive income for the period, net of tax | 2,284 | 20,217 | ||||||
|
|
|
| |||||
Total comprehensive income for the period, net of tax | 33,346 | 58,146 | ||||||
|
|
|
| |||||
Attributable to: | ||||||||
– Equity holders of the Company | 32,800 | 57,777 | ||||||
– Non-controlling interests | 546 | 369 | ||||||
The notes on pages 61 to 103 form an integral part of the interim condensed consolidated financial statements.
58
Interim Condensed Consolidated Statement of Changes in Equity
For the six months ended 30 June 2020
| Unaudited | ||||||||||||||||||||||||
| Attributable to equity holders of the Company | Non- controlling interests RMB million | Total RMB million | ||||||||||||||||||||||
| Share capital RMB million | Other equity instruments RMB million | Reserves RMB million | Retained earnings RMB million | |||||||||||||||||||||
As at 1 January 2019 | 28,265 | 7,791 | 149,309 | 130,117 | 4,919 | 320,401 | ||||||||||||||||||
Net profit | — | — | — | 37,599 | 330 | 37,929 | ||||||||||||||||||
Other comprehensive income | — | — | 20,178 | — | 39 | 20,217 | ||||||||||||||||||
|
|
|
|
|
|
|
|
|
|
|
| |||||||||||||
Total comprehensive income | — | — | 20,178 | 37,599 | 369 | 58,146 | ||||||||||||||||||
|
|
|
|
|
|
|
|
|
|
|
| |||||||||||||
Transactions with owners | ||||||||||||||||||||||||
Appropriation to reserves | — | — | 1,354 | (1,354 | ) | — | — | |||||||||||||||||
Dividends paid | — | — | — | (4,718 | ) | — | (4,718 | ) | ||||||||||||||||
Dividends to non-controlling interests | — | — | — | — | (133 | ) | (133 | ) | ||||||||||||||||
Others | — | — | (107 | ) | — | — | (107 | ) | ||||||||||||||||
|
|
|
|
|
|
|
|
|
|
|
| |||||||||||||
Total transactions with owners | — | — | 1,247 | (6,072 | ) | (133 | ) | (4,958 | ) | |||||||||||||||
|
|
|
|
|
|
|
|
|
|
|
| |||||||||||||
As at 30 June 2019 | 28,265 | 7,791 | 170,734 | 161,644 | 5,155 | 373,589 | ||||||||||||||||||
|
|
|
|
|
|
|
|
|
|
|
| |||||||||||||
As at 1 January 2020 | 28,265 | 7,791 | 197,221 | 170,487 | 5,578 | 409,342 | ||||||||||||||||||
Net profit | — | — | — | 30,535 | 527 | 31,062 | ||||||||||||||||||
Other comprehensive income | — | — | 2,265 | — | 19 | 2,284 | ||||||||||||||||||
|
|
|
|
|
|
|
|
|
|
|
| |||||||||||||
Total comprehensive income | — | — | 2,265 | 30,535 | 546 | 33,346 | ||||||||||||||||||
|
|
|
|
|
|
|
|
|
|
|
| |||||||||||||
Transactions with owners | ||||||||||||||||||||||||
Appropriation to reserves | — | — | 5,936 | (5,936 | ) | — | — | |||||||||||||||||
Dividends paid (Note 16) | — | — | — | (20,834 | ) | — | (20,834 | ) | ||||||||||||||||
Dividends to non-controlling interests | — | — | — | — | (161 | ) | (161 | ) | ||||||||||||||||
Others | — | — | 176 | — | 308 | 484 | ||||||||||||||||||
|
|
|
|
|
|
|
|
|
|
|
| |||||||||||||
Total transactions with owners | — | — | 6,112 | (26,770 | ) | 147 | (20,511 | ) | ||||||||||||||||
|
|
|
|
|
|
|
|
|
|
|
| |||||||||||||
As at 30 June 2020 | 28,265 | 7,791 | 205,598 | 174,252 | 6,271 | 422,177 | ||||||||||||||||||
|
|
|
|
|
|
|
|
|
|
|
| |||||||||||||
The notes on pages 61 to 103 form an integral part of the interim condensed consolidated financial statements.
59
Interim Condensed Consolidated Statement of Cash Flows
For the six months ended 30 June 2020
| Unaudited | ||||||||
| For the six months | ||||||||
| ended 30 June | ||||||||
| 2020 | 2019 | |||||||
| RMB million | RMB million | |||||||
Net cash inflow from operating activities | 182,792 | 150,290 | ||||||
|
|
|
| |||||
CASH FLOWS FROM INVESTING ACTIVITIES | ||||||||
Disposals and maturities | 305,627 | 360,314 | ||||||
Purchases | (394,808 | ) | (485,617 | ) | ||||
Investments in associates and joint ventures | (2,319 | ) | (16,122 | ) | ||||
Decrease/(increase) in term deposits, net | (972 | ) | 2,815 | |||||
Decrease/(increase) in securities purchased under agreements to resell, net | (57,015 | ) | 6,688 | |||||
Interest received | 61,162 | 61,167 | ||||||
Dividends received | 9,536 | 8,552 | ||||||
Increase in policy loans, net | (9,850 | ) | (13,705 | ) | ||||
|
|
|
| |||||
Net cash outflow from investing activities | (88,639 | ) | (75,908 | ) | ||||
|
|
|
| |||||
CASH FLOWS FROM FINANCING ACTIVITIES | ||||||||
Decrease in securities sold under agreements to repurchase, net | (69,331 | ) | (101,645 | ) | ||||
Interest paid | (2,568 | ) | (1,685 | ) | ||||
Repayment of borrowings | (523 | ) | — | |||||
Dividends paid to equity holders of the Company | (201 | ) | (3,527 | ) | ||||
Dividends paid to non-controlling interests | (161 | ) | (133 | ) | ||||
Proceeds from issue of bonds | — | 34,988 | ||||||
Cash received from borrowings | 681 | 26 | ||||||
Payment of principal portion of lease liabilities | (670 | ) | (511 | ) | ||||
Capital injected into subsidiaries by non-controlling interests | 6,795 | 4,896 | ||||||
Cash paid related to other financing activities | (704 | ) | (346 | ) | ||||
|
|
|
| |||||
Net cash outflow from financing activities | (66,682 | ) | (67,937 | ) | ||||
|
|
|
| |||||
Foreign exchange gains on cash and cash equivalents | 112 | 5 | ||||||
|
|
|
| |||||
Net increase in cash and cash equivalents | 27,583 | 6,450 | ||||||
|
|
|
| |||||
Cash and cash equivalents | ||||||||
Beginning of period | 53,306 | 50,809 | ||||||
|
|
|
| |||||
End of period | 80,889 | 57,259 | ||||||
|
|
|
| |||||
Analysis of balances of cash and cash equivalents | ||||||||
Cash at banks and in hand | 78,512 | 56,056 | ||||||
Short-term bank deposits | 2,377 | 1,203 | ||||||
The notes on pages 61 to 103 form an integral part of the interim condensed consolidated financial statements.
60
Notes to the Interim Condensed Consolidated Financial Statements
For the six months ended 30 June 2020
| 1 | ORGANISATION AND PRINCIPAL ACTIVITIES |
China Life Insurance Company Limited (the “Company”) was established in the People’s Republic of China (“China” or the “PRC”) on 30 June 2003 as a joint stock company with limited liability as part of a group restructuring of China Life Insurance (Group) Company (“CLIC”, formerly China Life Insurance Company) and its subsidiaries. The Company and its subsidiaries are hereinafter collectively referred to as the “Group”. The Group’s principal activities are the writing of life, health, accident and other types of personal insurance business; reinsurance business for personal insurance business; fund management business permitted by national laws and regulations or approved by the State Council of the People’s Republic of China, etc. The address of its registered office is 16 Financial Street, Xicheng District, Beijing, the PRC. The Company is listed on the New York Stock Exchange, the Stock Exchange of Hong Kong Limited, and the Shanghai Stock Exchange.
These unaudited interim condensed consolidated financial statements are presented in millions of Renminbi (“RMB million”) unless otherwise stated. The interim condensed consolidated financial statements have been approved and authorised for issue by the board of directors of the Company on 26 August 2020.
| 2 | BASIS OF PREPARATION |
These interim condensed consolidated financial statements have been prepared in accordance with International Accounting Standard 34 Interim Financial Reporting issued by the International Accounting Standards Board (“IASB”). The interim condensed consolidated financial statements should be read in conjunction with the consolidated annual financial statements for the year ended 31 December 2019, which have been prepared in accordance with International Financial Reporting Standards (“IFRSs”).
Except for the standards and amendments described below, the accounting policies applied are consistent with those of the consolidated annual financial statements for the year ended 31 December 2019, as described in those annual financial statements.
| 2.1 | New accounting standards and amendments adopted by the Group for the first time for the financial year beginning on 1 January 2020 |
Standards/Amendments | Content | Effective for annual periods beginning on or after | ||
IFRS 3 Amendments | Definition of a Business | 1 January 2020 | ||
IAS 1 and IAS 8 Amendments | Definition of Material | 1 January 2020 | ||
IFRS 9, IAS 39 and IFRS 7 Amendments | Interest Rate Benchmark Reform | 1 January 2020 | ||
IFRS 16 Amendment | Covid-19-Related Rent Concessions (early adopted) | 1 June 2020 |
61
Notes to the Interim Condensed Consolidated Financial Statements (continued)
For the six months ended 30 June 2020
| 2 | BASIS OF PREPARATION (continued) |
| 2.1 | New accounting standards and amendments adopted by the Group for the first time for the financial year beginning on 1 January 2020 (continued) |
IFRS 3 Amendments – Definition of a Business
In October 2018, the IASB issued amendments to the definition of a business in IFRS 3 Business Combinations. The amendments clarify and provide additional guidance on the definition of a business. The amendments clarify that for an integrated set of activities and assets to be considered a business, it must include, at a minimum, an input and a substantive process that together significantly contribute to the ability to create outputs. A business can exist without including all of the inputs and processes needed to create outputs. The amendments remove the assessment of whether market participants are capable of acquiring the business and continue to produce outputs. Instead, the focus is on whether acquired inputs and acquired substantive processes together significantly contribute to the ability to create outputs. The amendments have also narrowed the definition of outputs to focus on goods or services provided to customers, investment income or other income from ordinary activities. Furthermore, the amendments provide guidance to assess whether an acquired process is substantive and introduce an optional fair value concentration test to permit a simplified assessment of whether an acquired set of activities and assets is not a business. The Group has applied the amendments prospectively to transactions or other events that occurred on or after 1 January 2020. The amendments did not have any significant impact on the Group’s consolidated financial statements.
IAS 1 and IAS 8 Amendments – Definition of Material
In October 2018, the IASB issued amendments to IAS 1 Presentation of Financial Statements and IAS 8 Accounting Policies, Changes in Accounting Estimates and Errors to provide a new definition of material. The new definition states that information is material if omitting, misstating or obscuring it could reasonably be expected to influence decisions that the primary users of general purpose financial statements make on the basis of those financial statements. The amendments clarify that materiality will depend on the nature or magnitude of information. A misstatement of information is material if it could reasonably be expected to influence decisions made by the primary users. The amendments did not have any significant impact on the Group’s consolidated financial statements.
IFRS 9, IAS 39 and IFRS 7 Amendments – Interest Rate Benchmark Reform
In September 2019, the IASB issued the amendments to IFRS 9 Financial Instruments, IAS 39 Financial Instruments: Recognition and Measurement and IFRS 7 Financial Instruments: Disclosures to respond to the hedge accounting induced in the Interbank Offered Rates (IBOR) reform. The amendments provide temporary reliefs which enable hedge accounting to continue during the period of uncertainty before the replacement of an existing interest rate benchmark. The amendments did not have any significant impact on the Group’s consolidated financial statements.
IFRS 16 Amendment – Covid-19-Related Rent Concessions (early adopted)
In May 2020, the IASB issued the amendment to IFRS 16 Leases to provide an optional relief to lessees from applying IFRS 16’s guidance on lease modification accounting for rent concessions arising as a direct consequence of COVID-19. The amendment does not apply to lessors.
The practical expedient applies only to rent concessions occurring as a direct consequence of COVID-19 and only if all of the following conditions are met: (i) the change in lease payments results in revised consideration for the lease that is substantially the same as, or less than, the consideration for the lease immediately preceding the change; (ii) any reduction in lease payments affects only payments originally due on or before 30 June 2021; (iii) there is no substantive change to other terms and conditions of the lease. The amendment is effective retrospectively for annual periods beginning on or after 1 June 2020 with earlier application permitted.
The Group has early adopted the amendment on 1 January 2020. Because the Group was not provided with a significant amount of rent concessions arising as a direct consequence of COVID-19, the amendment did not have any significant impact on the Group’s consolidated financial statements.
62
Notes to the Interim Condensed Consolidated Financial Statements (continued)
For the six months ended 30 June 2020
| 2 | BASIS OF PREPARATION (continued) |
| 2.2 | New accounting standards and amendments that are effective but temporary exemption is applied by the Group for the financial year beginning on 1 January 2020 |
Standards/Amendments | Content | Effective for annual periods beginning on or after | ||
IFRS 9 | Financial Instruments | 1 January 2018 |
IFRS 9 – Financial Instruments
In July 2014, the IASB issued the final version of IFRS 9, bringing together all phases of the financial instruments project to replace IAS 39 and all previous versions of IFRS 9. The standard introduces new requirements for classification and measurement, impairment, and hedge accounting. IFRS 9 is effective for annual periods beginning on or after 1 January 2018, with early adoption permitted. Based on the current assessment, the Group expects that the adoption of IFRS 9 will have a significant impact on the Group’s consolidated financial statements. The Group has adopted the temporary exemption permitted in Amendments to IFRS 4 Applying IFRS 9 Financial Instruments with IFRS 4 Insurance Contracts (“IFRS 4 Amendments”) to apply IAS 39 rather than IFRS 9, until the effective date of IFRS 17. Refer to Note 17 for more details.
Classification and measurement
IFRS 9 requires that the Group classifies debt instruments based on the combined effect of application of business models (hold to collect contractual cash flows, hold to collect contractual cash flows and sell financial assets or other business models) and contractual cash flow characteristics (solely payments of principal and interest on the principal amount outstanding or not). Debt instruments not giving rise to cash flows that are solely payments of principal and interest on the principal amount outstanding would be measured at fair value through profit or loss. Other debt instruments giving rise to cash flows that are solely payments of principal and interest on the principal amount outstanding would be measured at amortised cost, fair value through other comprehensive income (“FVOCI”) or fair value through profit or loss (“FVTPL”), based on their respective business models. The Group analysed the contractual cash flow characteristics of financial assets as at 30 June 2020 and made relevant disclosures in Note 17.
Equity instruments would generally be measured at fair value through profit or loss unless the Group elects to measure at FVOCI for certain equity investments not held for trading. This will result in unrealised gains and losses on equity instruments currently classified as available-for-sale securities being recorded in income going forward. Currently, these unrealised gains and losses are recognised in other comprehensive income (“OCI”). If the Group elects to record equity investments at FVOCI, gains and losses would be recognised in retained earnings when the instruments be disposed, except for the received dividends which do not represent a recovery of part of the investment cost.
Impairment
IFRS 9 replaces the “incurred loss” model with the “expected credit loss” model which is designed to include forward-looking information. The Group is in the process of developing and testing the key models required under IFRS 9 and analysing the impact on the expected loss provision; the Group believed that the provision for debt instruments of the Group under the “expected credit loss” model would be larger than that under the previous “incurred loss” model.
Hedge accounting
The Group does not apply hedge accounting currently, so the Group expects that the new hedge accounting model under IFRS 9 will have no impact on the Group’s consolidated financial statements.
63
Notes to the Interim Condensed Consolidated Financial Statements (continued)
For the six months ended 30 June 2020
| 2 | BASIS OF PREPARATION (continued) |
| 2.3 | New accounting standards and amendments that are not yet effective and have not been early adopted by the Group for the financial year beginning on 1 January 2020 |
Standards/Amendments | Content | Effective for annual periods beginning on or after | ||
IFRS 17 | Insurance Contracts | 1 January 2023 | ||
IFRS 10 and IAS 28 Amendments | Sale or Contribution of Assets between an Investor and its Associate or Joint Venture | No mandatory effective date yet determined but available for adoption |
The Group has not early adopted any standard, interpretation or amendment that has been issued but is not yet effective.
IFRS 17 – Insurance Contracts
In May 2017, the IASB issued IFRS 17 Insurance Contracts, a comprehensive new accounting standard for insurance contracts covering recognition and measurement, presentation and disclosure, which replaces IFRS 4 Insurance Contracts.
In contrast to the requirements in IFRS 4, which are largely based on grandfathering previous local accounting policies for measurement purposes, IFRS 17 provides a comprehensive model (the general model) for insurance contracts, supplemented by the variable fee approach for contracts with direct participation features and the premium allocation approach mainly for short-duration which typically applies to certain non-life insurance contracts.
The main features of the new accounting model for insurance contracts are as follows:
| • | The fulfilment cash flows including the expected present value of future cash flows and explicit risk adjustment, remeasured every reporting period; |
| • | A contractual service margin represents the unearned profitability of the insurance contracts and is recognised in profit or loss over the coverage period; |
| • | Certain changes in the expected present value of future cash flows are adjusted against the contractual service margin and thereby recognised in profit or loss over the remaining coverage period; |
| • | The effect of changes in discount rates will be reported in either profit or loss or OCI, determined by an accounting policy choice; |
| • | The recognition of insurance revenue and insurance service expenses in the statement of comprehensive income based on the concept of services provided during the period; |
| • | Amounts that the policyholder will always receive, regardless of whether an insured event happens (non- distinct investment components) are not presented in the statement of comprehensive income, but are recognised directly in the statement of financial position; |
| • | Insurance services results are presented separately from the insurance finance income or expense; |
| • | Extensive disclosures to provide information on the recognised amounts from insurance contracts and the nature and extent of risks arising from these contracts. |
64
Notes to the Interim Condensed Consolidated Financial Statements (continued)
For the six months ended 30 June 2020
| 2 | BASIS OF PREPARATION (continued) |
| 2.3 | New accounting standards and amendments that are not yet effective and have not been early adopted by the Group for the financial year beginning on 1 January 2020 (continued) |
IFRS 17 – Insurance Contracts (continued)
In June 2020, the IASB issued the amendments to IFRS 17 which include a deferral of the effective date of IFRS 17 to annual reporting periods beginning on or after 1 January 2023. Insurers qualifying for the deferral of IFRS 9 can apply both IFRS 17 and IFRS 9 for the first time to annual reporting periods beginning on or after 1 January 2023. The Group is currently assessing the impact of the implementation of the standard.
Except for IFRS 17, there are no IFRSs or IFRIC interpretations that are not yet effective but would be expected to have a significant impact on the financial position and performance of the Group.
| 3 | CRITICAL ACCOUNTING ESTIMATES AND JUDGEMENTS IN APPLYING ACCOUNTING POLICIES |
The preparation of the interim condensed consolidated financial statements requires management to make judgements, estimates and assumptions that affect the application of accounting policies and the reported amounts of assets and liabilities, income and expenses. Actual results may differ from these estimates.
In preparing the interim condensed consolidated financial statements, the significant judgements made by management in applying the Group’s accounting policies and the key sources of estimation uncertainty were the same as those applied to the consolidated financial statements for the year ended 31 December 2019.
| 4 | FINANCIAL RISK MANAGEMENT |
The Group’s activities are exposed to a variety of financial risks. The key financial risk is that proceeds from the sale of financial assets will not be sufficient to fund the obligations arising from the Group’s insurance and investment contracts. The most important components of financial risk are market risk, credit risk and liquidity risk.
The interim condensed consolidated financial statements do not include all financial risk management information and disclosures required in the consolidated annual financial statements, and should be read in conjunction with the Group’s consolidated annual financial statements for the year ended 31 December 2019.
There have been no significant changes in the Group’s risk management processes since 31 December 2019 or in any risk management policies.
Fair value hierarchy
Level 1 fair value is based on quoted prices (unadjusted) in active markets for identical assets or liabilities that the entity can obtain at the measurement date.
Other than Level 1 quoted prices, Level 2 fair value is based on valuation techniques using significant inputs, that are observable for the asset being measured, either directly or indirectly, for substantially the full term of the asset through corroboration with observable market data. Observable inputs generally used to measure the fair value of securities classified as Level 2 include quoted market prices for similar assets in active markets; quoted market prices in markets that are not active for identical or similar assets and other market observable inputs. This level includes the debt securities for which quotations are available from pricing services providers. Fair values provided by pricing services providers are subject to a number of validation procedures by management. These procedures include a review of the valuation models utilised and the results of these models, as well as the recalculation of prices obtained from pricing services at the end of each reporting period.
65
Notes to the Interim Condensed Consolidated Financial Statements (continued)
For the six months ended 30 June 2020
| 4 | FINANCIAL RISK MANAGEMENT (continued) |
Fair value hierarchy (continued)
Under certain conditions, the Group may not receive a price quote from independent third-party pricing services. In this instance, the Group’s valuation team may choose to apply an internally developed valuation method to the assets or liabilities being measured, determine the main inputs for valuation, and analyse the change of the valuation and report it to management. Key inputs involved in internal valuation services are not based on observable market data. They reflect assumptions made by management based on judgements and experiences. The assets or liabilities valued by this method are generally classified as Level 3.
As at 30 June 2020, assets classified as Level 1 accounted for approximately 35.33% of the assets measured at fair value on a recurring basis. Fair value measurements classified as Level 1 include certain debt securities, equity securities that are traded in an active exchange market or interbank market and open-ended funds with public market price quotation. The Group considers a combination of certain factors to determine whether a market for a financial instrument is active, including the occurrence of trades within the specific period, the respective trading volume, and the degree which the implied yields for a debt security for observed transactions differs from the Group’s understanding of the current relevant market rates and information. Trading prices from the Chinese interbank market are determined by both trading counterparties and can be observed publicly. The Company adopted this price of the debt securities traded on the Chinese interbank market at the reporting date as their fair market value and classified the investments as Level 1. Open-ended funds also have active markets. Fund management companies publish the net asset value of these funds on their websites on each trade date. Investors subscribe for and redeem units of these funds in accordance with the funds’ net asset value published by the fund management companies on each trade date. The Company adopted the unadjusted net asset value of the funds at the reporting date as their fair market value and classified the investments as Level 1.
As at 30 June 2020, assets classified as Level 2 accounted for approximately 43.56% of the assets measured at fair value on a recurring basis. They primarily include certain debt securities and equity securities. Valuations are generally obtained from third party pricing services for identical or comparable assets, or through the use of valuation methodologies using observable market inputs, or recent quoted market prices. Valuation service providers typically gather, analyse and interpret information related to market transactions and other key valuation model inputs from multiple sources, and through the use of widely accepted internal valuation models, provide a theoretical quote on various securities. Debt securities are classified as Level 2 when they are valued at recent quoted prices from the Chinese interbank market or from valuation service providers.
As at 30 June 2020, assets classified as Level 3 accounted for approximately 21.11% of the assets measured at fair value on a recurring basis. They primarily include unlisted equity securities and unlisted debt securities. Fair values are determined using valuation techniques, including discounted cash flow valuations, the comparable companies approach, etc. The determination of Level 3 is primarily based on the significance of certain unobservable inputs.
66
Notes to the Interim Condensed Consolidated Financial Statements (continued)
For the six months ended 30 June 2020
| 4 | FINANCIAL RISK MANAGEMENT (continued) |
Fair value hierarchy (continued)
The following table presents the Group’s quantitative disclosures of the fair value measurement hierarchy for assets and liabilities measured at fair value as at 30 June 2020:
| Fair value measurement using | ||||||||||||||||
| Quoted prices in active markets Level 1 RMB million | Significant observable inputs Level 2 RMB million | Significant unobservable inputs Level 3 RMB million | Total RMB million | |||||||||||||
Assets measured at fair value | ||||||||||||||||
Available-for-sale securities | ||||||||||||||||
– Equity securities | ||||||||||||||||
Funds | 82,333 | — | — | 82,333 | ||||||||||||
Common stocks | 237,608 | 17,572 | — | 255,180 | ||||||||||||
Preferred stocks | — | — | 59,550 | 59,550 | ||||||||||||
Wealth management products | — | 38,396 | — | 38,396 | ||||||||||||
Others | 11,976 | 17,720 | 72,913 | 102,609 | ||||||||||||
– Debt securities | ||||||||||||||||
Government bonds | 680 | 22,524 | — | 23,204 | ||||||||||||
Government agency bonds | 11,908 | 149,630 | — | 161,538 | ||||||||||||
Corporate bonds | 1,962 | 131,240 | — | 133,202 | ||||||||||||
Subordinated bonds/debts | — | 54,501 | — | 54,501 | ||||||||||||
Others | — | 3,889 | 116,991 | 120,880 | ||||||||||||
| Securities at fair value through profit or loss | ||||||||||||||||
– Equity securities | ||||||||||||||||
Funds | 16,612 | 81 | — | 16,693 | ||||||||||||
Common stocks | 49,342 | 444 | — | 49,786 | ||||||||||||
Others | — | 200 | — | 200 | ||||||||||||
– Debt securities | ||||||||||||||||
Government bonds | 69 | 673 | — | 742 | ||||||||||||
Government agency bonds | 305 | 5,651 | — | 5,956 | ||||||||||||
Corporate bonds | 4,732 | 71,290 | 16 | 76,038 | ||||||||||||
Others | — | 984 | — | 984 | ||||||||||||
|
|
|
|
|
|
|
| |||||||||
Total | 417,527 | 514,795 | 249,470 | 1,181,792 | ||||||||||||
|
|
|
|
|
|
|
| |||||||||
Liabilities measured at fair value | ||||||||||||||||
Financial liabilities at fair value through profit or loss | (4,259 | ) | — | — | (4,259 | ) | ||||||||||
Investment contracts at fair value through profit or loss | (10 | ) | — | — | (10 | ) | ||||||||||
|
|
|
|
|
|
|
| |||||||||
Total | (4,269 | ) | — | — | (4,269 | ) | ||||||||||
|
|
|
|
|
|
|
| |||||||||
67
Notes to the Interim Condensed Consolidated Financial Statements (continued)
For the six months ended 30 June 2020
| 4 | FINANCIAL RISK MANAGEMENT (continued) |
Fair value hierarchy (continued)
The following table presents the changes in Level 3 assets and liabilities for the six months ended 30 June 2020:
| Available-for-sale securities | Securities at fair value through profit or loss | Derivative financial assets | Total assets | |||||||||||||||||
| Debt securities RMB million | Equity securities RMB million | Debt securities RMB million | RMB million | RMB million | ||||||||||||||||
Opening balance | 105,650 | 128,899 | 16 | 428 | 234,993 | |||||||||||||||
Purchases | 11,152 | 650 | — | — | 11,802 | |||||||||||||||
Transferred into Level 3 | — | — | — | — | — | |||||||||||||||
Transferred out of Level 3 | — | — | — | — | — | |||||||||||||||
Total gains/(losses) recorded in profit or loss | — | — | — | (121 | ) | (121 | ) | |||||||||||||
Total gains/(losses) recorded in other comprehensive income | 546 | 3,964 | — | — | 4,510 | |||||||||||||||
Disposals or exercises | — | (1,050 | ) | — | (307 | ) | (1,357 | ) | ||||||||||||
Maturity | (357 | ) | — | — | — | (357 | ) | |||||||||||||
|
|
|
|
|
|
|
|
|
| |||||||||||
Closing balance | 116,991 | 132,463 | 16 | — | 249,470 | |||||||||||||||
|
|
|
|
|
|
|
|
|
| |||||||||||
68
Notes to the Interim Condensed Consolidated Financial Statements (continued)
For the six months ended 30 June 2020
| 4 | FINANCIAL RISK MANAGEMENT (continued) |
Fair value hierarchy (continued)
The following table presents the Group’s quantitative disclosures of the fair value measurement hierarchy for assets and liabilities measured at fair value as at 31 December 2019:
| Fair value measurement using | Total RMB million | |||||||||||||||
| Quoted prices in active markets Level 1 RMB million | Significant observable inputs Level 2 RMB million | Significant unobservable inputs Level 3 RMB million | ||||||||||||||
Assets measured at fair value | ||||||||||||||||
Available-for-sale securities | ||||||||||||||||
– Equity securities | ||||||||||||||||
Funds | 102,349 | — | — | 102,349 | ||||||||||||
Common stocks | 214,206 | 22,117 | — | 236,323 | ||||||||||||
Preferred stocks | — | — | 58,314 | 58,314 | ||||||||||||
Wealth management products | — | 32,640 | — | 32,640 | ||||||||||||
Others | — | 28,319 | 70,585 | 98,904 | ||||||||||||
– Debt securities | ||||||||||||||||
Government bonds | 2,620 | 21,138 | — | 23,758 | ||||||||||||
Government agency bonds | 24,305 | 146,884 | — | 171,189 | ||||||||||||
Corporate bonds | 5,360 | 143,095 | — | 148,455 | ||||||||||||
Subordinated bonds/debts | 1,069 | 52,853 | — | 53,922 | ||||||||||||
Others | — | 6,817 | 105,650 | 112,467 | ||||||||||||
Securities at fair value through profit or loss | ||||||||||||||||
– Equity securities | ||||||||||||||||
Funds | 16,023 | 78 | — | 16,101 | ||||||||||||
Common stocks | 40,070 | 211 | — | 40,281 | ||||||||||||
Others | — | 20 | — | 20 | ||||||||||||
– Debt securities | ||||||||||||||||
Government bonds | 33 | 8 | — | 41 | ||||||||||||
Government agency bonds | 362 | 6,497 | — | 6,859 | ||||||||||||
Corporate bonds | 7,999 | 69,200 | 16 | 77,215 | ||||||||||||
Others | — | 1,091 | — | 1,091 | ||||||||||||
Derivative financial assets | — | — | 428 | 428 | ||||||||||||
|
|
|
|
|
|
|
| |||||||||
Total | 414,396 | 530,968 | 234,993 | 1,180,357 | ||||||||||||
|
|
|
|
|
|
|
| |||||||||
Liabilities measured at fair value | ||||||||||||||||
Financial liabilities at fair value through profit or loss | (3,859 | ) | — | — | (3,859 | ) | ||||||||||
Investment contracts at fair value through profit or loss | (10 | ) | — | — | (10 | ) | ||||||||||
|
|
|
|
|
|
|
| |||||||||
Total | (3,869 | ) | — | — | (3,869 | ) | ||||||||||
|
|
|
|
|
|
|
| |||||||||
69
Notes to the Interim Condensed Consolidated Financial Statements (continued)
For the six months ended 30 June 2020
| 4 | FINANCIAL RISK MANAGEMENT (continued) |
Fair value hierarchy (continued)
The following table presents the changes in Level 3 assets and liabilities for the six months ended 30 June 2019:
| Available-for-sale securities | Total assets | Derivative financial liabilities | Total liabilities | |||||||||||||||||
| Debt securities RMB million | Equity securities RMB million | RMB million | RMB million | RMB million | ||||||||||||||||
Opening balance | 79,248 | 100,000 | 179,248 | (1,877 | ) | (1,877 | ) | |||||||||||||
Purchases | 1,953 | 4,213 | 6,166 | — | — | |||||||||||||||
Transferred into Level 3 | — | — | — | — | — | |||||||||||||||
Transferred out of Level 3 | — | (1,780 | ) | (1,780 | ) | — | — | |||||||||||||
Total gains/(losses) recorded in profit or loss | — | — | — | 404 | 404 | |||||||||||||||
Total gains/(losses) recorded in other comprehensive income | (86 | ) | 2,371 | 2,285 | — | — | ||||||||||||||
Disposals or exercises | — | (4,000 | ) | (4,000 | ) | 1,473 | 1,473 | |||||||||||||
Maturity | (368 | ) | — | (368 | ) | — | — | |||||||||||||
|
|
|
|
|
|
|
|
|
| |||||||||||
Closing balance | 80,747 | 100,804 | 181,551 | — | — | |||||||||||||||
|
|
|
|
|
|
|
|
|
| |||||||||||
The assets and liabilities whose fair value measurements are classified under Level 3 above do not have material impact on the profit or loss of the Group.
For the assets and liabilities measured at fair value on a recurring basis, during the six months ended 30 June 2020, debt securities of RMB12,964 million (for the six months ended 30 June 2019: RMB24,200 million) were transferred from Level 1 to Level 2 within the fair value hierarchy, whereas RMB3,150 million (for the six months ended 30 June 2019: RMB15,599 million) debt securities were transferred from Level 2 to Level 1. No material equity securities were transferred from Level 1 to Level 2 (for the six months ended 30 June 2019: same), whereas RMB1,870 million (for the six months ended 30 June 2019: RMB5,739 million) equity securities were transferred from Level 2 to Level 1.
For the six months ended 30 June 2020 and the six months ended 30 June 2019, there were no significant changes in the business or economic circumstances that affected the fair value of the Group’s financial assets and liabilities. There were also no reclassifications of financial assets.
As at 30 June 2020 and 31 December 2019, significant unobservable inputs such as the discount rate and discounts for lack of marketability were used in the valuation of mainly assets and liabilities at fair value classified as Level 3. The fair value was not significantly sensitive to reasonable changes in these significant unobservable inputs.
70
Notes to the Interim Condensed Consolidated Financial Statements (continued)
For the six months ended 30 June 2020
| 4 | FINANCIAL RISK MANAGEMENT (continued) |
Fair value hierarchy (continued)
The table below presents information about the significant unobservable inputs used for primary assets and liabilities at fair value classified as Level 3 as at 30 June 2020 and 31 December 2019:
Fair value | Valuation | Significant | Range | Relationships between fair | ||||||
Equity securities | 30 June 2020: 25,643 31 December 2019: 26,265 | Comparable companies approach | Discounts for lack of marketability | 30 June 2020: 13%–35% 31 December 2019: 11%–35% | The fair value is inversely related to the discounts for lack of marketability | |||||
| 30 June 2020: 31,547 31 December 2019: 28,346 | Net asset value method | N/A | N/A | N/A | ||||||
| 30 June 2020: 73,465 31 December 2019: 72,477 | Discounted cash flow method | Discount rate | 30 June 2020: 3.80%–6.38% 31 December 2019: 3.80%–6.38% | The fair value is inversely related to discount rate | ||||||
Debt securities | 30 June 2020: 116,991 31 December 2019: 105,666 | Discounted cash flow method | Discount rate | 30 June 2020: 3.88%–9.53% 31 December 2019: 3.02%–6.22% | The fair value is inversely related to discount rate | |||||
Derivative financial assets | 30 June 2020: — 31 December 2019: 428 | Comparable companies approach | Discounts for lack of marketability | 30 June 2020: Not applicable 31 December 2019: 15% | The fair value is inversely related to the discounts for lack of marketability |
71
Notes to the Interim Condensed Consolidated Financial Statements (continued)
For the six months ended 30 June 2020
| 5 | SEGMENT INFORMATION |
| 5.1 | Operating segments |
The Group operates in four operating segments:
| (i) | Life insurance business (Life) |
Life insurance business relates primarily to the sale of life insurance policies, including those life insurance policies without significant insurance risk transferred.
| (ii) | Health insurance business (Health) |
Health insurance business relates primarily to the sale of health insurance policies, including those health insurance policies without significant insurance risk transferred.
| (iii) | Accident insurance business (Accident) |
Accident insurance business relates primarily to the sale of accident insurance policies.
| (iv) | Other businesses (Others) |
Other businesses relate primarily to income and cost of the agency business in respect of transactions with CLIC, etc., as described in Note 18, net share of profit of associates and joint ventures, income and expenses of subsidiaries, and unallocated income and expenditure of the Group.
| 5.2 | Allocation basis of income and expenses |
Investment income, net realised gains on financial assets, net fair value gains through profit or loss and foreign exchange gains/(losses) within other expenses are allocated among segments in proportion to the respective segments’ average liabilities of insurance contracts and investment contracts at the beginning and end of the period. Administrative expenses are allocated among segments in proportion to the unit cost of the respective products in different segments. Unallocated other income and other expenses are presented in the “Others” segment directly. Income tax is not allocated.
72
Notes to the Interim Condensed Consolidated Financial Statements (continued)
For the six months ended 30 June 2020
| 5 | SEGMENT INFORMATION (continued) |
| For the six months ended 30 June 2020 | ||||||||||||||||||||||||
| Life | Health | Accident | Others | Elimination | Total | |||||||||||||||||||
| RMB million | ||||||||||||||||||||||||
Revenues | ||||||||||||||||||||||||
Gross written premiums | 346,137 | 72,264 | 8,966 | — | — | 427,367 | ||||||||||||||||||
– Term life | 1,240 | — | — | — | — | |||||||||||||||||||
– Whole life | 39,020 | — | — | — | — | |||||||||||||||||||
– Endowment | 59,252 | — | — | — | — | |||||||||||||||||||
– Annuity | 246,625 | — | — | — | — | |||||||||||||||||||
Net premiums earned | 345,591 | 54,693 | 7,652 | — | — | 407,936 | ||||||||||||||||||
Investment income | 66,539 | 4,242 | 222 | 1,703 | — | 72,706 | ||||||||||||||||||
Net realised gains on financial assets | 10,017 | 637 | 33 | 120 | — | 10,807 | ||||||||||||||||||
Net fair value gains through profit or loss | 7,249 | 460 | 24 | 873 | — | 8,606 | ||||||||||||||||||
Other income | 503 | 29 | — | 4,861 | (1,017 | ) | 4,376 | |||||||||||||||||
Including: inter-segment revenue | — | — | — | 1,017 | (1,017 | ) | — | |||||||||||||||||
|
|
|
|
|
|
|
|
|
|
|
| |||||||||||||
Segment revenues | 429,899 | 60,061 | 7,931 | 7,557 | (1,017 | ) | 504,431 | |||||||||||||||||
|
|
|
|
|
|
|
|
|
|
|
| |||||||||||||
Benefits, claims and expenses | ||||||||||||||||||||||||
Insurance benefits and claims expenses | ||||||||||||||||||||||||
Life insurance death and other benefits | (60,684 | ) | (1,941 | ) | (15 | ) | — | — | (62,640 | ) | ||||||||||||||
Accident and health claims and claim adjustment expenses | — | (20,724 | ) | (3,587 | ) | — | — | (24,311 | ) | |||||||||||||||
Increase in insurance contract liabilities | (268,204 | ) | (16,685 | ) | (110 | ) | — | — | (284,999 | ) | ||||||||||||||
Investment contract benefits | (5,024 | ) | (6 | ) | — | — | — | (5,030 | ) | |||||||||||||||
Policyholder dividends resulting from participation in profits | (14,433 | ) | (74 | ) | — | — | — | (14,507 | ) | |||||||||||||||
Underwriting and policy acquisition costs | (43,763 | ) | (8,799 | ) | (2,733 | ) | (1,223 | ) | — | (56,518 | ) | |||||||||||||
Finance costs | (1,286 | ) | (81 | ) | (4 | ) | (401 | ) | — | (1,772 | ) | |||||||||||||
Administrative expenses | (10,684 | ) | (3,829 | ) | (1,226 | ) | (1,308 | ) | — | (17,047 | ) | |||||||||||||
Statutory insurance fund contribution | (550 | ) | (189 | ) | (64 | ) | — | — | (803 | ) | ||||||||||||||
Other expenses | (3,421 | ) | (345 | ) | (80 | ) | (2,431 | ) | 1,017 | (5,260 | ) | |||||||||||||
Including: inter-segment expenses | (953 | ) | (61 | ) | (3 | ) | — | 1,017 | — | |||||||||||||||
|
|
|
|
|
|
|
|
|
|
|
| |||||||||||||
Segment benefits, claims and expenses | (408,049 | ) | (52,673 | ) | (7,819 | ) | (5,363 | ) | 1,017 | (472,887 | ) | |||||||||||||
|
|
|
|
|
|
|
|
|
|
|
| |||||||||||||
Net gains on investments of associates and joint ventures | — | — | — | 4,020 | — | 4,020 | ||||||||||||||||||
Including: share of profit of associates and joint ventures | — | — | — | 4,690 | — | 4,690 | ||||||||||||||||||
|
|
|
|
|
|
|
|
|
|
|
| |||||||||||||
Segment results | 21,850 | 7,388 | 112 | 6,214 | — | 35,564 | ||||||||||||||||||
|
|
|
|
|
|
|
|
|
|
|
| |||||||||||||
Income tax | (4,502 | ) | ||||||||||||||||||||||
|
| |||||||||||||||||||||||
Net profit | 31,062 | |||||||||||||||||||||||
|
| |||||||||||||||||||||||
Attributable to | ||||||||||||||||||||||||
– Equity holders of the Company | 30,535 | |||||||||||||||||||||||
– Non-controlling interests | 527 | |||||||||||||||||||||||
Other comprehensive income attributable to equity holders of the Company | 1,889 | 120 | 6 | 250 | — | 2,265 | ||||||||||||||||||
Depreciation and amortisation | 1,539 | 528 | 180 | 292 | — | 2,539 | ||||||||||||||||||
73
Notes to the Interim Condensed Consolidated Financial Statements (continued)
For the six months ended 30 June 2020
| 5 | SEGMENT INFORMATION (continued) |
| For the six months ended 30 June 2019 | ||||||||||||||||||||||||
| Life | Health | Accident | Others | Elimination | Total | |||||||||||||||||||
| RMB million | ||||||||||||||||||||||||
Revenues | ||||||||||||||||||||||||
Gross written premiums | 307,461 | 62,416 | 8,099 | — | — | 377,976 | ||||||||||||||||||
– Term life | 1,238 | — | — | — | — | |||||||||||||||||||
– Whole life | 28,931 | — | — | — | — | |||||||||||||||||||
– Endowment | 62,020 | — | — | — | — | |||||||||||||||||||
– Annuity | 215,272 | — | — | — | — | |||||||||||||||||||
Net premiums earned | 307,009 | 46,989 | 7,299 | — | — | 361,297 | ||||||||||||||||||
Investment income | 61,445 | 3,653 | 220 | 1,027 | — | 66,345 | ||||||||||||||||||
Net realised gains on financial assets | 3,551 | 211 | 13 | 11 | — | 3,786 | ||||||||||||||||||
Net fair value gains through profit or loss | 11,727 | 696 | 42 | 642 | — | 13,107 | ||||||||||||||||||
Other income | 485 | 30 | — | 3,910 | (739 | ) | 3,686 | |||||||||||||||||
Including: inter-segment revenue | — | — | — | 739 | (739 | ) | — | |||||||||||||||||
|
|
|
|
|
|
|
|
|
|
|
| |||||||||||||
Segment revenues | 384,217 | 51,579 | 7,574 | 5,590 | (739 | ) | 448,221 | |||||||||||||||||
|
|
|
|
|
|
|
|
|
|
|
| |||||||||||||
Benefits, claims and expenses | ||||||||||||||||||||||||
Insurance benefits and claims expenses | ||||||||||||||||||||||||
Life insurance death and other benefits | (82,129 | ) | (1,673 | ) | (19 | ) | — | — | (83,821 | ) | ||||||||||||||
Accident and health claims and claim adjustment expenses | — | (18,874 | ) | (2,945 | ) | — | — | (21,819 | ) | |||||||||||||||
Increase in insurance contract liabilities | (209,451 | ) | (14,927 | ) | (31 | ) | — | — | (224,409 | ) | ||||||||||||||
Investment contract benefits | (4,610 | ) | (7 | ) | — | — | — | (4,617 | ) | |||||||||||||||
Policyholder dividends resulting from participation in profits | (10,780 | ) | (56 | ) | — | — | — | (10,836 | ) | |||||||||||||||
Underwriting and policy acquisition costs | (34,449 | ) | (7,448 | ) | (2,648 | ) | (1,050 | ) | — | (45,595 | ) | |||||||||||||
Finance costs | (1,484 | ) | (89 | ) | (5 | ) | (352 | ) | — | (1,930 | ) | |||||||||||||
Administrative expenses | (10,614 | ) | (3,583 | ) | (1,335 | ) | (1,426 | ) | — | (16,958 | ) | |||||||||||||
Statutory insurance fund contribution | (510 | ) | (162 | ) | (65 | ) | — | — | (737 | ) | ||||||||||||||
Other expenses | (2,850 | ) | (254 | ) | (67 | ) | (1,839 | ) | 739 | (4,271 | ) | |||||||||||||
Including: inter-segment expenses | (696 | ) | (40 | ) | (3 | ) | — | 739 | — | |||||||||||||||
|
|
|
|
|
|
|
|
|
|
|
| |||||||||||||
Segment benefits, claims and expenses | (356,877 | ) | (47,073 | ) | (7,115 | ) | (4,667 | ) | 739 | (414,993 | ) | |||||||||||||
|
|
|
|
|
|
|
|
|
|
|
| |||||||||||||
Net gains on investments of associates and joint ventures | — | — | — | 5,665 | — | 5,665 | ||||||||||||||||||
Including: share of profit of associates and joint ventures | — | — | — | 5,665 | — | 5,665 | ||||||||||||||||||
|
|
|
|
|
|
|
|
|
|
|
| |||||||||||||
Segment results | 27,340 | 4,506 | 459 | 6,588 | — | 38,893 | ||||||||||||||||||
|
|
|
|
|
|
|
|
|
|
|
| |||||||||||||
Income tax | (964 | ) | ||||||||||||||||||||||
|
| |||||||||||||||||||||||
Net profit | 37,929 | |||||||||||||||||||||||
|
| |||||||||||||||||||||||
Attributable to | ||||||||||||||||||||||||
– Equity holders of the Company | 37,599 | |||||||||||||||||||||||
– Non-controlling interests | 330 | |||||||||||||||||||||||
Other comprehensive income attributable to equity holders of the Company | 18,497 | 1,098 | 67 | 516 | — | 20,178 | ||||||||||||||||||
Depreciation and amortisation | 1,262 | 400 | 160 | 208 | — | 2,030 | ||||||||||||||||||
74
Notes to the Interim Condensed Consolidated Financial Statements (continued)
For the six months ended 30 June 2020
| 6 | INVESTMENTS IN ASSOCIATES AND JOINT VENTURES |
| For the six months ended 30 June | ||||||||
| 2020 | 2019 | |||||||
| RMB million | RMB million | |||||||
As at 1 January | 222,983 | 198,772 | ||||||
Change of the cost | 2,291 | 15,801 | ||||||
Share of profit or loss | 4,690 | 5,665 | ||||||
Other equity movements | 111 | 335 | ||||||
Declared dividends (i) | (1,604 | ) | (1,013 | ) | ||||
Impairment (ii) | (707 | ) | — | |||||
|
|
|
| |||||
As at 30 June | 227,764 | 219,560 | ||||||
|
|
|
| |||||
| (i) | The 2019 final dividend of HKD0.026 in cash per ordinary share was approved and declared in the Annual General Meeting of Sino-Ocean Group Holding Limited (“Sino-Ocean”) on 20 May 2020, and the Company’s cash dividend receivable is equivalent to RMB54 million as at 30 June 2020. |
The 2019 final dividend of RMB0.0604 in cash per ordinary share was approved and declared in the Annual General Meeting of China United Network Communications Limited (“China Unicom”) on 22 May 2020. The Company received a cash dividend of RMB193 million during the period.
| (ii) | Sino-Ocean, the Group’s associate, is listed in Hong Kong. On 30 June 2020, the stock price of Sino-Ocean was HKD1.86 per share. As at 31 December 2019, the cumulative impairment loss of RMB2.51 billion for the investment in Sino-Ocean had been recognised by the Group. The Group performed an impairment test to this investment on 30 June 2020. A further impairment loss of RMB707 million was recognised for this investment valued using the discounted future cash flow method for the six months ended 30 June 2020. In the valuation, the Group separated the development properties and investment properties by considering the different future cash flow features. The discount rates applied in the valuation were 10% and 8% for development properties and investment properties, respectively. |
75
Notes to the Interim Condensed Consolidated Financial Statements (continued)
For the six months ended 30 June 2020
| 7 | FINANCIAL ASSETS |
| 7.1 | Held-to-maturity securities |
| As at 30 June 2020 RMB million | As at 31 December 2019 RMB million | |||||||
Debt securities | ||||||||
Government bonds | 219,870 | 215,928 | ||||||
Government agency bonds | 479,405 | 401,799 | ||||||
Corporate bonds | 196,454 | 198,322 | ||||||
Subordinated bonds/debts | 105,585 | 112,702 | ||||||
|
|
|
| |||||
Total | 1,001,314 | 928,751 | ||||||
|
|
|
| |||||
Debt securities | ||||||||
Listed in Mainland, PRC | 210,532 | 209,123 | ||||||
Listed in Hong Kong, PRC | 160 | 157 | ||||||
Listed overseas | 84 | 62 | ||||||
Unlisted (i) | 790,538 | 719,409 | ||||||
|
|
|
| |||||
Total | 1,001,314 | 928,751 | ||||||
|
|
|
| |||||
| (i) | Unlisted debt securities include those traded on the Chinese interbank market. |
The fair value of held-to-maturity securities is determined by reference to other debt securities which are measured by fair value. Please refer to Note 4. As at 30 June 2020, the provision for the investment of held-to-maturity securities was RMB17 million (as at 31 December 2019: same).
| As at 30 June 2020 | As at 31 December 2019 | |||||||||||||||||||||||
| Level 1 | Level 2 | Total | Level 1 | Level 2 | Total | |||||||||||||||||||
Debt securities – fair value hierarchy | RMB million | RMB million | RMB million | RMB million | RMB million | RMB million | ||||||||||||||||||
Government bonds | 99,368 | 137,636 | 237,004 | 15,749 | 212,449 | 228,198 | ||||||||||||||||||
Government agency bonds | 52,125 | 448,732 | 500,857 | 57,955 | 357,058 | 415,013 | ||||||||||||||||||
Corporate bonds | 2,763 | 203,521 | 206,284 | 7,914 | 198,879 | 206,793 | ||||||||||||||||||
Subordinated bonds/debts | — | 111,377 | 111,377 | — | 118,571 | 118,571 | ||||||||||||||||||
|
|
|
|
|
|
|
|
|
|
|
| |||||||||||||
Total | 154,256 | 901,266 | 1,055,522 | 81,618 | 886,957 | 968,575 | ||||||||||||||||||
|
|
|
|
|
|
|
|
|
|
|
| |||||||||||||
Debt securities – Contractual maturity schedule | As at 30 June 2020 RMB million | As at 31 December 2019 RMB million | ||||||
Maturing: | ||||||||
Within one year | 19,531 | 24,454 | ||||||
After one year but within five years | 137,201 | 128,266 | ||||||
After five years but within ten years | �� | 218,525 | 241,372 | |||||
After ten years | 626,057 | 534,659 | ||||||
|
|
|
| |||||
Total | 1,001,314 | 928,751 | ||||||
|
|
|
| |||||
76
Notes to the Interim Condensed Consolidated Financial Statements (continued)
For the six months ended 30 June 2020
| 7 | FINANCIAL ASSETS (continued) |
| 7.2 | Loans |
| As at 30 June 2020 RMB million | As at 31 December 2019 RMB million | |||||||
Policy loans (i) | 184,722 | 174,872 | ||||||
Other loans | 469,384 | 436,766 | ||||||
|
|
|
| |||||
Total | 654,106 | 611,638 | ||||||
|
|
|
| |||||
Impairment | (2,718 | ) | (2,718 | ) | ||||
|
|
|
| |||||
Net value | 651,388 | 608,920 | ||||||
|
|
|
| |||||
Fair value | 663,533 | 623,840 | ||||||
|
|
|
| |||||
| As at 30 June 2020 RMB million | As at 31 December 2019 RMB million | |||||||
Maturing: | ||||||||
Within one year | 223,284 | 213,937 | ||||||
After one year but within five years | 276,846 | 229,415 | ||||||
After five years but within ten years | 131,814 | 129,596 | ||||||
After ten years | 22,162 | 38,690 | ||||||
|
|
|
| |||||
Total | 654,106 | 611,638 | ||||||
|
|
|
| |||||
Impairment | (2,718 | ) | (2,718 | ) | ||||
|
|
|
| |||||
Net value | 651,388 | 608,920 | ||||||
|
|
|
| |||||
| (i) | As at 30 June 2020, maturities of policy loans are within 6 months (as at 31 December 2019: same), and their fair values approximated to their carrying amounts. |
| 7.3 | Term deposits |
| As at 30 June 2020 RMB million | As at 31 December 2019 RMB million | |||||||
Maturing: | ||||||||
Within one year | 38,023 | 107,039 | ||||||
After one year but within five years | 498,233 | 420,191 | ||||||
After five years but within ten years | — | 8,030 | ||||||
|
|
|
| |||||
Total | 536,256 | 535,260 | ||||||
|
|
|
| |||||
As at 30 June 2020, the Group’s term deposits of RMB2,750 million (as at 31 December 2019: RMB3,491 million) were deposited in banks to back overseas borrowings and are restricted to use.
77
Notes to the Interim Condensed Consolidated Financial Statements (continued)
For the six months ended 30 June 2020
| 7 | FINANCIAL ASSETS (continued) |
| 7.3 | Term deposits (continued) |
In December 2016, Sunny Bamboo Limited and Golden Bamboo Limited, subsidiaries of the Company, entered into a loan agreement with the Hong Kong branch of Agricultural Bank of China. The Company arranged a deposit with Beijing Xicheng branch of Agricultural Bank of China to back these loans. As at 30 June 2020, the amount of such term deposit was RMB750 million (as at 31 December 2019: RMB750 million).
On 6 December 2017, New Fortune Wisdom Limited and New Capital Wisdom Limited, subsidiaries of Ningbo Meishan Bonded Port Area Guo Yang Guo Sheng Investment Partnership (Limited Partnership) (“Guo Yang Guo Sheng”), a subsidiary of the Company, entered into a loan agreement with a subsidiary of Agricultural Bank of China. Guo Yang Guo Sheng arranged deposits with Beijing Xicheng branch of the Agricultural Bank of China to back these loans. As at 30 June 2020, the amounts of such term deposits and current deposits were RMB2,000 million (as at 31 December 2019: same) and RMB1,026 million (as at 31 December 2019: RMB1,069 million), respectively.
| 7.4 | Available-for-sale securities |
| As at 30 June 2020 RMB million | As at 31 December 2019 RMB million | |||||||
Available-for-sale securities, at fair value | ||||||||
Debt securities | ||||||||
Government bonds | 23,204 | 23,758 | ||||||
Government agency bonds | 161,538 | 171,189 | ||||||
Corporate bonds | 133,202 | 148,455 | ||||||
Subordinated bonds/debts | 54,501 | 53,922 | ||||||
Others (i) | 120,880 | 112,467 | ||||||
|
|
|
| |||||
Subtotal | 493,325 | 509,791 | ||||||
|
|
|
| |||||
Equity securities | ||||||||
Funds | 82,333 | 102,349 | ||||||
Common stocks | 255,180 | 236,323 | ||||||
Preferred stocks | 59,550 | 58,314 | ||||||
Wealth management products | 38,396 | 32,640 | ||||||
Others (i) | 102,609 | 98,904 | ||||||
|
|
|
| |||||
Subtotal | 538,068 | 528,530 | ||||||
|
|
|
| |||||
Available-for-sale securities, at cost | ||||||||
Equity securities | ||||||||
Others (i) | 20,636 | 20,636 | ||||||
|
|
|
| |||||
Total | 1,052,029 | 1,058,957 | ||||||
|
|
|
| |||||
| (i) | Other available-for-sale securities mainly include unlisted equity investments, private equity funds, trust schemes and perpetual bonds. |
78
Notes to the Interim Condensed Consolidated Financial Statements (continued)
For the six months ended 30 June 2020
| 7 | FINANCIAL ASSETS (continued) |
| 7.4 | Available-for-sale securities (continued) |
| As at 30 June 2020 RMB million | As at 31 December 2019 RMB million | |||||||
Debt securities | ||||||||
Listed in Mainland, PRC | 41,266 | 46,505 | ||||||
Unlisted | 452,059 | 463,286 | ||||||
|
|
|
| |||||
Subtotal | 493,325 | 509,791 | ||||||
|
|
|
| |||||
Equity securities | ||||||||
Listed in Mainland, PRC | 155,054 | 152,293 | ||||||
Listed in Hong Kong, PRC | 107,365 | 95,428 | ||||||
Listed overseas | 214 | 1,458 | ||||||
Unlisted | 296,071 | 299,987 | ||||||
|
|
|
| |||||
Subtotal | 558,704 | 549,166 | ||||||
|
|
|
| |||||
Total | 1,052,029 | 1,058,957 | ||||||
|
|
|
| |||||
Unlisted debt securities include those traded on the Chinese interbank market and those not publicly traded. Unlisted equity securities include those not traded on stock exchanges, which are mainly open-ended funds with public market price quotations, wealth management products and private equity funds.
Debt securities – Contractual maturity schedule | As at 30 June 2020 RMB million | As at 31 December 2019 RMB million | ||||||
Maturing: | ||||||||
Within one year | 31,377 | 26,075 | ||||||
After one year but within five years | 131,938 | 155,110 | ||||||
After five years but within ten years | 226,205 | 226,421 | ||||||
After ten years | 103,805 | 102,185 | ||||||
|
|
|
| |||||
Total | 493,325 | 509,791 | ||||||
|
|
|
| |||||
79
Notes to the Interim Condensed Consolidated Financial Statements (continued)
For the six months ended 30 June 2020
| 7 | FINANCIAL ASSETS (continued) |
| 7.5 | Securities at fair value through profit or loss |
| As at 30 June 2020 RMB million | As at 31 December 2019 RMB million | |||||||
Debt securities | ||||||||
Government bonds | 742 | 41 | ||||||
Government agency bonds | 5,956 | 6,859 | ||||||
Corporate bonds | 76,038 | 77,215 | ||||||
Others | 984 | 1,091 | ||||||
|
|
|
| |||||
Subtotal | 83,720 | 85,206 | ||||||
|
|
|
| |||||
Equity securities | ||||||||
Funds | 16,693 | 16,101 | ||||||
Common stocks | 49,786 | 40,281 | ||||||
Others | 200 | 20 | ||||||
|
|
|
| |||||
Subtotal | 66,679 | 56,402 | ||||||
|
|
|
| |||||
Total | 150,399 | 141,608 | ||||||
|
|
|
| |||||
Debt securities | ||||||||
Listed in Mainland, PRC | 32,712 | 35,804 | ||||||
Listed in Hong Kong, PRC | 74 | 102 | ||||||
Listed overseas | 317 | 167 | ||||||
Unlisted | 50,617 | 49,133 | ||||||
|
|
|
| |||||
Subtotal | 83,720 | 85,206 | ||||||
|
|
|
| |||||
Equity securities | ||||||||
Listed in Mainland, PRC | 52,711 | 39,770 | ||||||
Listed in Hong Kong, PRC | 117 | 611 | ||||||
Listed overseas | 4,001 | 6,418 | ||||||
Unlisted | 9,850 | 9,603 | ||||||
|
|
|
| |||||
Subtotal | 66,679 | 56,402 | ||||||
|
|
|
| |||||
Total | 150,399 | 141,608 | ||||||
|
|
|
| |||||
Unlisted debt securities include those traded on the Chinese interbank market and those not publicly traded. Unlisted equity securities include those not traded on stock exchanges, which are mainly open-ended funds with public market price quotations.
| 7.6 | Derivative financial assets |
| As at 30 June 2020 RMB million | As at 31 December 2019 RMB million | |||||||
Forward contract | – | 428 | ||||||
The derivative financial assets of the Company above was a forward contract to purchase equity securities. The fair value is based on an active quoted price of the equity security with consideration of discounts for lack of marketability, which was classified as Level 3.
80
Notes to the Interim Condensed Consolidated Financial Statements (continued)
For the six months ended 30 June 2020
| 8 | INSURANCE CONTRACTS |
| (a) | Process used to decide on assumptions |
| (i) | For the insurance contracts of which future insurance benefits are affected by investment yields of the corresponding investment portfolios, the discount rate assumption is based on expected investment returns of the asset portfolio backing these liabilities, considering the impacts of time value on reserves. |
In developing discount rate assumptions, the Group considers investment experience, the current investment portfolio and the trend of the relevant yield curves. The assumed discount rates reflect the future economic outlook as well as the Group’s investment strategy. The assumed discount rates with risk margin are as follows:
Discount rate assumptions | ||||
As at 30 June 2020 | 4.85% | |||
As at 31 December 2019 | 4.85% | |||
As at 30 June 2019 | 4.85% | |||
For the insurance contracts of which future insurance benefits are not affected by investment yields of the corresponding investment portfolios, the discount rate assumption is based on the “Yield curve of reserve computation benchmark for insurance contracts”, published on the “China Bond” website with consideration of liquidity spreads, taxation and other relevant factors. The assumed spot discount rates with risk margin are as follows:
Discount rate assumptions | ||||
As at 30 June 2020 | 3.31%~4.83% | |||
As at 31 December 2019 | 3.52%~4.83% | |||
As at 30 June 2019 | 3.46%~4.83% | |||
There is uncertainty on the discount rate assumption, which is affected by factors such as future macro-economy, monetary and foreign exchange policies, capital market and availability of investment channels of insurance funds. The Group determines the discount rate assumption based on the information obtained at the end of each reporting period, including the consideration of risk margin.
| (ii) | The mortality and morbidity assumptions are based on the Group’s historical mortality and morbidity experience. The assumed mortality rates and morbidity rates vary with the age of the insured and contract type. |
The Group bases its mortality assumptions on China Life Insurance Mortality Table (2000-2003), adjusted where appropriate to reflect the Group’s recent historical mortality experience. The main source of uncertainty with life insurance contracts is that epidemics and wide-ranging lifestyle changes could result in deterioration in future mortality experience, thus leading to an inadequate reserving of liability. Similarly, improvements in longevity due to continuing advancements in medical care and social conditions may expose the Group to longevity risk.
The Group bases its morbidity assumptions for critical illness products on analysis of historical experience and expectations of future developments. There are two main sources of uncertainty. Firstly, wide-ranging lifestyle changes could result in future deterioration in morbidity experience. Secondly, future development of medical technologies and improved coverage of medical facilities available to policyholders may bring forward the timing of diagnosing critical illness, which demands earlier payment of the critical illness benefits. Both could ultimately result in an inadequate reserving of liability if current morbidity assumptions do not properly reflect such trends.
Risk margin is considered in the Group’s mortality and morbidity assumptions.
81
Notes to the Interim Condensed Consolidated Financial Statements (continued)
For the six months ended 30 June 2020
| 8 | INSURANCE CONTRACTS (continued) |
| (a) | Process used to decide on assumptions (continued) |
| (iii) | Expense assumptions are based on expected unit costs with the consideration of previous expense studies and future trends. Expense assumptions are affected by certain factors such as future inflation and market competition which bring uncertainty to these assumptions. The Group determines expense assumptions based on information obtained at the end of each reporting period and risk margin. Components of expense assumptions include the cost per policy and percentage of premium as follows: |
| Individual Life | Group Life | |||||||||||||||
| RMB Per Policy | % of Premium | RMB Per Policy | % of Premium | |||||||||||||
As at 30 June 2020 | 45.00 | 0.85%~0.90% | 25.00 | 0.90% | ||||||||||||
As at 31 December 2019 | 45.00 | 0.85%~0.90% | 25.00 | 0.90% | ||||||||||||
As at 30 June 2019 | 45.00 | 0.85%~0.90% | 25.00 | 0.90% | ||||||||||||
| (iv) | The lapse rates and other assumptions are affected by certain factors, such as future macro-economy, availability of financial substitutions, and market competition, which bring uncertainty to these assumptions. The lapse rates and other assumptions are determined with reference to creditable past experience, current conditions, future expectations and other information. |
| (v) | The Group applied a consistent method to determine risk margin. The Group considers risk margin for the discount rate, mortality and morbidity and expense assumptions to compensate for the uncertain amount and timing of future cash flows. When determining risk margin, the Group considers historical experience, future expectations and other factors. The Group determines the risk margin level by itself as the regulations have not imposed any specific requirement on it. |
The Group adopted a consistent process to decide on assumptions for the insurance contracts disclosed in this note. On each reporting date, the Group reviews the assumptions for reasonable estimates of liability and risk margin, with consideration of all available information, and taking into account the Group’s historical experience and expectation of future events.
82
Notes to the Interim Condensed Consolidated Financial Statements (continued)
For the six months ended 30 June 2020
| 8 | INSURANCE CONTRACTS (continued) |
| (b) | Net liabilities of insurance contracts |
| As at 30 June 2020 RMB million | As at 31 December 2019 RMB million | |||||||
Gross | ||||||||
Long-term insurance contracts | 2,806,629 | 2,521,331 | ||||||
Short-term insurance contracts | ||||||||
– Claims and claim adjustment expenses | 22,007 | 18,404 | ||||||
– Unearned premiums | 29,456 | 13,001 | ||||||
|
|
|
| |||||
Total, gross | 2,858,092 | 2,552,736 | ||||||
|
|
|
| |||||
Recoverable from reinsurers | ||||||||
Long-term insurance contracts | (4,122 | ) | (3,839 | ) | ||||
Short-term insurance contracts | ||||||||
– Claims and claim adjustment expenses | (165 | ) | (145 | ) | ||||
– Unearned premiums | (506 | ) | (369 | ) | ||||
|
|
|
| |||||
Total, ceded | (4,793 | ) | (4,353 | ) | ||||
|
|
|
| |||||
Net | ||||||||
Long-term insurance contracts | 2,802,507 | 2,517,492 | ||||||
Short-term insurance contracts | ||||||||
– Claims and claim adjustment expenses | 21,842 | 18,259 | ||||||
– Unearned premiums | 28,950 | 12,632 | ||||||
|
|
|
| |||||
Total, net | 2,853,299 | 2,548,383 | ||||||
|
|
|
| |||||
| (c) | Movements in liabilities of short-term insurance contracts |
The table below presents movements in claims and claim adjustment expense reserve:
| For the six months ended 30 June | ||||||||
| 2020 RMB million | 2019 RMB million | |||||||
Notified claims | 2,781 | 2,536 | ||||||
Incurred but not reported | 15,623 | 12,269 | ||||||
|
|
|
| |||||
Total as at 1 January – gross | 18,404 | 14,805 | ||||||
|
|
|
| |||||
Cash paid for claims settled in period | ||||||||
– Cash paid for current period’s claims | (7,907 | ) | (8,249 | ) | ||||
– Cash paid for prior periods’ claims | (13,017 | ) | (11,799 | ) | ||||
Claims incurred in period | ||||||||
– Claims arising in current period | 23,732 | 20,405 | ||||||
– Claims arising in prior periods | 795 | 1,727 | ||||||
|
|
|
| |||||
Total as at 30 June – gross | 22,007 | 16,889 | ||||||
|
|
|
| |||||
Notified claims | 2,918 | 2,016 | ||||||
Incurred but not reported | 19,089 | 14,873 | ||||||
|
|
|
| |||||
Total as at 30 June – gross | 22,007 | 16,889 | ||||||
|
|
|
| |||||
83
Notes to the Interim Condensed Consolidated Financial Statements (continued)
For the six months ended 30 June 2020
| 8 | INSURANCE CONTRACTS (continued) |
| (c) | Movements in liabilities of short-term insurance contracts (continued) |
The table below presents movements in unearned premium reserves:
For the six months ended 30 June | ||||||||||||||||||||||||
| 2020 | 2019 | |||||||||||||||||||||||
| RMB million | RMB million | |||||||||||||||||||||||
| Gross | Ceded | Net | Gross | Ceded | Net | |||||||||||||||||||
As at 1 January | 13,001 | (369 | ) | 12,632 | 11,432 | (370 | ) | 11,062 | ||||||||||||||||
Increase | 29,456 | (506 | ) | 28,950 | 25,417 | (317 | ) | 25,100 | ||||||||||||||||
Release | (13,001 | ) | 369 | (12,632 | ) | (11,432 | ) | 370 | (11,062 | ) | ||||||||||||||
|
|
|
|
|
|
|
|
|
|
|
| |||||||||||||
As at 30 June | 29,456 | (506 | ) | 28,950 | 25,417 | (317 | ) | 25,100 | ||||||||||||||||
|
|
|
|
|
|
|
|
|
|
|
| |||||||||||||
| (d) | Movements in liabilities of long-term insurance contracts |
The table below presents movements in the liabilities of long-term insurance contracts:
| For the six months ended 30 June | ||||||||
| 2020 | 2019 | |||||||
| RMB million | RMB million | |||||||
As at 1 January | 2,521,331 | 2,189,794 | ||||||
Premiums | 376,241 | 334,284 | ||||||
Release of liabilities (i) | (167,283 | ) | (168,552 | ) | ||||
Accretion of interest | 63,275 | 57,286 | ||||||
Change in assumptions | ||||||||
– Change in discount rates | 12,656 | 2,133 | ||||||
Other movements | 409 | (174 | ) | |||||
|
|
|
| |||||
As at 30 June | 2,806,629 | 2,414,771 | ||||||
|
|
|
| |||||
| (i) | The release of liabilities mainly consists of release due to death or other termination and related expenses, release of residual margin and change of reserves for claims and claim adjustment expenses. |
84
Notes to the Interim Condensed Consolidated Financial Statements (continued)
For the six months ended 30 June 2020
| 9 | INVESTMENT CONTRACTS |
| As at | As at | |||||||
| 30 June | 31 December | |||||||
| 2020 | 2019 | |||||||
| RMB million | RMB million | |||||||
Investment contracts with discretionary participating features (“DPF”) at amortised cost | 63,728 | 61,657 | ||||||
Investment contracts without DPF | ||||||||
– At amortised cost | 221,144 | 206,137 | ||||||
– At fair value through profit or loss | 10 | 10 | ||||||
|
|
|
| |||||
Total | 284,882 | 267,804 | ||||||
|
|
|
| |||||
The table below presents movements of investment contracts with DPF:
| For the six months ended 30 June | ||||||||
| 2020 | 2019 | |||||||
| RMB million | RMB million | |||||||
As at 1 January | 61,657 | 59,129 | ||||||
Deposits received | 2,774 | 2,677 | ||||||
Deposits withdrawn, payments on death and other benefits | (1,383 | ) | (1,365 | ) | ||||
Interest credited | 680 | 654 | ||||||
|
|
|
| |||||
As at 30 June | 63,728 | 61,095 | ||||||
|
|
|
| |||||
The fair value of investment contracts at fair value through profit or loss was classified as Level 1. As at 30 June 2020, the fair value of investment contracts at amortised cost was RMB273,973 million (as at 31 December 2019: RMB260,582 million), which was classified as Level 3.
85
Notes to the Interim Condensed Consolidated Financial Statements (continued)
For the six months ended 30 June 2020
| 10 | INVESTMENT INCOME |
| For the six months ended 30 June | ||||||||
| 2020 | 2019 | |||||||
| RMB million | RMB million | |||||||
Debt securities | ||||||||
– held-to-maturity securities | 20,904 | 18,240 | ||||||
– available-for-sale securities | 10,990 | 10,444 | ||||||
– at fair value through profit or loss | 1,699 | 1,760 | ||||||
Equity securities | ||||||||
– available-for-sale securities | 9,528 | 8,994 | ||||||
– at fair value through profit or loss | 525 | 569 | ||||||
Bank deposits | 13,026 | 13,531 | ||||||
Loans | 15,790 | 12,679 | ||||||
Securities purchased under agreements to resell | 244 | 128 | ||||||
|
|
|
| |||||
Total | 72,706 | 66,345 | ||||||
|
|
|
| |||||
For the six months ended 30 June 2020, the interest income included in investment income was RMB62,653 million (for the six months ended 30 June 2019: RMB56,782 million). All interest income was accrued using the effective interest method.
| 11 | NET REALISED GAINS ON FINANCIAL ASSETS |
| For the six months ended 30 June | ||||||||
| 2020 | 2019 | |||||||
| RMB million | RMB million | |||||||
Debt securities | ||||||||
Realised gains (i) | 1,320 | 2,956 | ||||||
Impairment | — | (922 | ) | |||||
|
|
|
| |||||
Subtotal | 1,320 | 2,034 | ||||||
|
|
|
| |||||
Equity securities | ||||||||
Realised gains (i) | 14,155 | 4,196 | ||||||
Impairment (ii) | (4,668 | ) | (2,444 | ) | ||||
|
|
|
| |||||
Subtotal | 9,487 | 1,752 | ||||||
|
|
|
| |||||
Total | 10,807 | 3,786 | ||||||
|
|
|
| |||||
| (i) | Realised gains were generated mainly from available-for-sale securities. |
| (ii) | During the six months ended 30 June 2020, the Group recognised an impairment charge of RMB99 million (for the six months ended 30 June 2019: RMB791 million) of available-for-sale funds, an impairment charge of RMB4,569 million (for the six months ended 30 June 2019: RMB1,653 million) of available-for-sale equity securities, for which the Group determined that objective evidence of impairment existed. |
86
Notes to the Interim Condensed Consolidated Financial Statements (continued)
For the six months ended 30 June 2020
| 12 | NET FAIR VALUE GAINS THROUGH PROFIT OR LOSS |
| For the six months ended 30 June | ||||||||
| 2020 | 2019 | |||||||
| RMB million | RMB million | |||||||
Debt securities | 74 | 277 | ||||||
Equity securities | 8,568 | 12,765 | ||||||
Stock appreciation rights | 289 | (132 | ) | |||||
Financial liabilities at fair value through profit or loss | (204 | ) | (207 | ) | ||||
Derivative financial instruments | (121 | ) | 404 | |||||
|
|
|
| |||||
Total | 8,606 | 13,107 | ||||||
|
|
|
| |||||
| 13 | PROFIT BEFORE INCOME TAX |
Profit before income tax is stated after charging/(crediting) the following:
| For the six months ended 30 June | ||||||||
| 2020 | 2019 | |||||||
| RMB million | RMB million | |||||||
Employee salaries and welfare costs | 9,359 | 8,064 | ||||||
Housing benefits | 626 | 557 | ||||||
Contribution to the defined contribution pension plan | 870 | 1,277 | ||||||
Depreciation and amortisation | 2,539 | 2,030 | ||||||
Foreign exchange losses/(gains) | 25 | (30 | ) | |||||
| 14 | TAXATION |
Deferred income tax assets and liabilities are offset when there is a legally enforceable right to offset current tax assets against current tax liabilities and when the deferred income tax relates to the same tax authority.
| (a) | The amount of taxation charged to net profit represents: |
| For the six months ended 30 June | ||||||||
| 2020 | 2019 | |||||||
| RMB million | RMB million | |||||||
Current taxation – enterprise income tax | 5,249 | (1,962 | ) | |||||
Deferred taxation | (747 | ) | 2,926 | |||||
|
|
|
| |||||
Total tax charges | 4,502 | 964 | ||||||
|
|
|
| |||||
87
Notes to the Interim Condensed Consolidated Financial Statements (continued)
For the six months ended 30 June 2020
| 14 | TAXATION (continued) |
| (b) | The reconciliation between the Group’s effective tax rate and the statutory tax rate of 25% in the PRC (for the six months ended 30 June 2019: same) is as follows: |
| For the six months ended 30 June | ||||||||
| 2020 | 2019 | |||||||
| RMB million | RMB million | |||||||
Profit before income tax | 35,564 | 38,893 | ||||||
Tax computed at the statutory tax rate | 8,891 | 9,723 | ||||||
Adjustment on current income tax of previous period (i) | (464 | ) | (5,228 | ) | ||||
Non-taxable income (ii) | (4,252 | ) | (3,716 | ) | ||||
Expenses not deductible for tax purposes (ii) | 27 | 69 | ||||||
Unused tax losses | 181 | 21 | ||||||
Others | 119 | 95 | ||||||
|
|
|
| |||||
Income tax at the effective tax rate | 4,502 | 964 | ||||||
|
|
|
| |||||
| (i) | According to Cai Shui [2019] No.72, Notice on Pre-tax Deduction Policy of Commissions and Handling Charges for Insurance Companies, the commissions and handling charges incurred by insurance companies related to its operating activities, which do not exceed 18% of the total premium income of the period after deducting surrender premium, etc., are allowed to be deducted in calculating the taxable income, and the excessive part is allowed to be brought forward to subsequent years. This notice issued above was effective from 1 January 2019 and applicable to 2018’s final settlement and payment of enterprise income tax filing. Accordingly, the Company’s current income tax for the six months ended 30 June 2019 was deducted by RMB5,154 million regarding to 2018’s final settlement and payment. |
| (ii) | Non-taxable income mainly includes interest income from government bonds, dividend income from applicable equity securities, etc. Expenses not deductible for tax purposes mainly include donations and other expenses that do not meet the criteria for deduction according to the relevant tax regulations. |
| (c) | As at 30 June 2020 and 31 December 2019, the amounts of deferred tax assets and liabilities were as follows: |
| As at | As at | |||||||
| 30 June | 31 December | |||||||
| 2020 | 2019 | |||||||
| RMB million | RMB million | |||||||
Deferred tax assets | 14,527 | 13,352 | ||||||
Deferred tax liabilities | (24,550 | ) | (23,554 | ) | ||||
|
|
|
| |||||
Net deferred tax assets | 128 | 128 | ||||||
Net deferred tax liabilities | (10,151 | ) | (10,330 | ) | ||||
|
|
|
| |||||
88
Notes to the Interim Condensed Consolidated Financial Statements (continued)
For the six months ended 30 June 2020
| 14 | TAXATION (continued) |
| (c) | As at 30 June 2020 and 31 December 2019, the amounts of deferred tax assets and liabilities were as follows (continued): |
As at 30 June 2020 and 30 June 2019, deferred tax was calculated in full on temporary differences under the liability method using the principal tax rate of 25%. The movements in net deferred income tax assets and liabilities during the period are as follows:
Net deferred tax assets/(liabilities)
| Insurance | Investments | Others | Total | |||||||||||||
| RMB million | RMB million | RMB million | RMB million | |||||||||||||
| (i) | (ii) | (iii) |
| |||||||||||||
As at 1 January 2019 | (5,308 | ) | 3,927 | 2,638 | 1,257 | |||||||||||
(Charged)/credited to net profit | 646 | (2,967 | ) | (605 | ) | (2,926 | ) | |||||||||
(Charged)/credited to other comprehensive income | ||||||||||||||||
– Available-for-sale securities | — | (9,401 | ) | — | (9,401 | ) | ||||||||||
– Portion of fair value changes on available-for-sale securities attributable to participating policyholders | 2,786 | — | — | 2,786 | ||||||||||||
– Others | — | 29 | — | 29 | ||||||||||||
|
|
|
|
|
|
|
| |||||||||
As at 30 June 2019 | (1,876 | ) | (8,412 | ) | 2,033 | (8,255 | ) | |||||||||
|
|
|
|
|
|
|
| |||||||||
As at 1 January 2020 | 1,557 | (14,673 | ) | 2,914 | (10,202 | ) | ||||||||||
(Charged)/credited to net profit | 985 | 151 | (389 | ) | 747 | |||||||||||
(Charged)/credited to other comprehensive income | ||||||||||||||||
– Available-for-sale securities | — | (130 | ) | — | (130 | ) | ||||||||||
– Portion of fair value changes on available-for-sale securities attributable to participating policyholders | (457 | ) | — | — | (457 | ) | ||||||||||
– Others | — | 19 | — | 19 | ||||||||||||
|
|
|
|
|
|
|
| |||||||||
As at 30 June 2020 | 2,085 | (14,633 | ) | 2,525 | (10,023 | ) | ||||||||||
|
|
|
|
|
|
|
| |||||||||
| (i) | The deferred tax liabilities arising from the insurance category are mainly related to the change of long-term insurance contract liabilities at 31 December 2008 as a result of the first time adoption of IFRSs in 2009 and the temporary differences of short-term insurance contract liabilities and policyholder dividends payable. |
| (ii) | The deferred tax arising from the investments category is mainly related to the temporary differences of unrealised gains/(losses) on available- for-sale securities, securities at fair value through profit or loss, and others. |
| (iii) | The deferred tax arising from the others category is mainly related to the temporary differences of employee salaries and welfare costs payable. |
89
Notes to the Interim Condensed Consolidated Financial Statements (continued)
For the six months ended 30 June 2020
| 14 | TAXATION (continued) |
| (d) | The analysis of net deferred tax assets and deferred tax liabilities is as follows: |
| As at | As at | |||||||
| 30 June 2020 | 31 December 2019 | |||||||
| RMB million | RMB million | |||||||
Deferred tax assets: | ||||||||
– deferred tax assets to be recovered after 12 months | 8,074 | 7,508 | ||||||
– deferred tax assets to be recovered within 12 months | 6,453 | 5,844 | ||||||
|
|
|
| |||||
Subtotal | 14,527 | 13,352 | ||||||
|
|
|
| |||||
Deferred tax liabilities: | ||||||||
– deferred tax liabilities to be settled after 12 months | (20,110 | ) | (19,906 | ) | ||||
– deferred tax liabilities to be settled within 12 months | (4,440 | ) | (3,648 | ) | ||||
|
|
|
| |||||
Subtotal | (24,550 | ) | (23,554 | ) | ||||
|
|
|
| |||||
Net deferred tax liabilities | (10,023 | ) | (10,202 | ) | ||||
|
|
|
| |||||
| 15 | EARNINGS PER SHARE |
There is no difference between the basic and diluted earnings per share. The basic and diluted earnings per share for the six months ended 30 June 2020 are calculated based on the net profit for the period attributable to ordinary equity holders of the Company and the weighted average of 28,264,705,000 ordinary shares (for the six months ended 30 June 2019: same).
| 16 | DIVIDENDS |
A dividend in respect of 2019 of RMB0.73 (inclusive of tax) per ordinary share, totalling RMB20,633 million, was approved at the Annual General Meeting on 29 June 2020.
A distribution of RMB201 million (inclusive of tax) to the holders of Core Tier 2 Capital Securities was approved by management in the first half of 2020 according to the authorisation by the board of directors, which was delegated by the General Meeting.
90
Notes to the Interim Condensed Consolidated Financial Statements (continued)
For the six months ended 30 June 2020
| 17 | DISCLOSURES ABOUT THE TEMPORARY EXEMPTION FROM IFRS 9 |
According to IFRS 4 Amendments, the Company made the assessment based on the Group’s financial position of 31 December 2015, concluding that the carrying amount of the Group’s liabilities arising from contracts within the scope of IFRS 4, which includes any deposit components or embedded derivatives unbundled from insurance contracts, was significant compared to the total carrying amount of all its liabilities. The percentage of the total carrying amount of its liabilities connected with insurance relative to the total carrying amount of all its liabilities is greater than 90 percent. There had been no significant change in the activities of the Group since then that requires reassessment. Therefore, the Group’s activities are predominantly connected with insurance, meeting the criteria to apply temporary exemption from IFRS 9.
Sino-Ocean, China Unicom, China Guangfa Bank Company Limited (“CGB”) and certain associates of the Group, have already adopted IFRS 9. According to IFRS 4 Amendments, the Group elected not to apply uniform accounting policies when using the equity method for these associates.
| (a) | The tables below present the fair value of the following groups of financial assets(i) under IFRS 9 as at 30 June 2020 and 31 December 2019 and fair value changes for the six months ended 30 June 2020 and 30 June 2019: |
| Fair value as at | Fair value as at | |||||||
| 30 June 2020 | 31 December 2019 | |||||||
| RMB million | RMB million | |||||||
Held for trading financial assets | 150,399 | 141,608 | ||||||
Financial assets that are managed and whose performance are evaluated on a fair value basis | — | — | ||||||
Other financial assets | ||||||||
– Financial assets with contractual terms that give rise to specified dates to cash flows that are solely payments of principal and interest on the principal amount outstanding (“SPPI”) | 1,807,035 | 1,615,856 | ||||||
– Financial assets with contractual terms that do not give rise to SPPI | 779,327 | 860,644 | ||||||
|
|
|
| |||||
Total | 2,736,761 | 2,618,108 | ||||||
|
|
|
| |||||
| Fair value changes for | ||||||||
| the six months ended 30 June | ||||||||
| 2020 | 2019 | |||||||
| RMB million | RMB million | |||||||
Held for trading financial assets | 8,642 | 13,042 | ||||||
Financial assets that are managed and whose performance are evaluated on a fair value basis | — | — | ||||||
Other financial assets | ||||||||
– Financial assets with contractual terms that give rise to SPPI | 15,932 | (4,464 | ) | |||||
– Financial assets with contractual terms that do not give rise to SPPI | 8,047 | 46,153 | ||||||
|
|
|
| |||||
Total | 32,621 | 54,731 | ||||||
|
|
|
| |||||
| (i) | Only including securities at fair value through profit or loss, loans (excluding policy loans), available-for-sale securities and held-to-maturity securities. |
91
Notes to the Interim Condensed Consolidated Financial Statements (continued)
For the six months ended 30 June 2020
| 17 | DISCLOSURES ABOUT THE TEMPORARY EXEMPTION FROM IFRS 9 (continued) |
| (b) | The table below presents the credit risk exposure(ii) for aforementioned financial assets with contractual terms that give rise to SPPI: |
| Carrying amount(iii) As at 30 June 2020 RMB million | Carrying amount(iii) As at 31 December 2019 RMB million | |||||||
Domestic | ||||||||
Rating not required (iv) | 639,151 | 657,905 | ||||||
AAA | 1,096,548 | 893,336 | ||||||
AA+ | 5,728 | 7,671 | ||||||
AA | 393 | 1,163 | ||||||
AA- | 3,000 | 3,000 | ||||||
|
|
|
| |||||
Subtotal | 1,744,820 | 1,563,075 | ||||||
|
|
|
| |||||
Overseas | ||||||||
AAA | – | 30 | ||||||
A+ | 21 | 4,014 | ||||||
A | 170 | 3,541 | ||||||
A- | 61 | 35 | ||||||
BBB+ | 112 | 135 | ||||||
BBB- | 14 | 14 | ||||||
Not rated | 25 | 25 | ||||||
|
|
|
| |||||
Subtotal | 403 | 7,794 | ||||||
|
|
|
| |||||
Total | 1,745,223 | 1,570,869 | ||||||
|
|
|
| |||||
| (c) | The table below presents financial assets without low credit risk for aforementioned financial assets with contractual terms that give rise to SPPI: |
| As at 30 June 2020 | ||||||||
| Carrying amount(iii) RMB million | Fair value RMB million | |||||||
Domestic | 9,121 | 6,508 | ||||||
Overseas | 25 | 8 | ||||||
|
|
|
| |||||
Total | 9,146 | 6,516 | ||||||
|
|
|
| |||||
| As at 31 December 2019 | ||||||||
| Carrying amount(iii) RMB million | Fair value RMB million | |||||||
Domestic | 11,834 | 8,237 | ||||||
Overseas | 25 | 9 | ||||||
|
|
|
| |||||
Total | 11,859 | 8,246 | ||||||
|
|
|
| |||||
| (ii) | Credit risk ratings for domestic assets are provided by domestic qualified external rating agencies and credit risk ratings for overseas assets are provided by overseas qualified external rating agencies. |
| (iii) | For financial assets measured at amortised cost, the carrying amount before adjusting impairment allowance is disclosed here. |
| (iv) | Mainly including government bonds and policy financial bonds. |
92
Notes to the Interim Condensed Consolidated Financial Statements (continued)
For the six months ended 30 June 2020
| 18 | SIGNIFICANT RELATED PARTY TRANSACTIONS |
| (a) | Related parties |
The table set forth below summarises the names of significant related parties and the nature of relationship with the Company as at 30 June 2020:
Significant related parties | Relationship with the Company | |
| CLIC | Immediate and ultimate holding company | |
| China Life Asset Management Company Limited (“AMC”) | A subsidiary of the Company | |
| China Life Pension Company Limited (“Pension Company”) | A subsidiary of the Company | |
China Life (Suzhou) Pension and Retirement Investment Company Limited (“Suzhou Pension Company”) | A subsidiary of the Company | |
| Golden Phoenix Tree Limited | A subsidiary of the Company | |
| Shanghai Rui Chong Investment Co., Limited (“Rui Chong Company”) | A subsidiary of the Company | |
| New Aldgate Limited | A subsidiary of the Company | |
| Glorious Fortune Forever Limited | A subsidiary of the Company | |
| CL Hotel Investor, L.P. | A subsidiary of the Company | |
| Golden Bamboo Limited | A subsidiary of the Company | |
| Sunny Bamboo Limited | A subsidiary of the Company | |
| Fortune Bamboo Limited | A subsidiary of the Company | |
| Guo Yang Guo Sheng | A subsidiary of the Company | |
| Shanghai Yuan Shu Yuan Jiu Investment Management Partnership (Limited Partnership) | A subsidiary of the Company | |
| Shanghai Yuan Shu Yuan Pin Investment Management Partnership (Limited Partnership) | A subsidiary of the Company | |
| Shanghai Wansheng Industry Partnership (Limited Partnership) (“Shanghai Wansheng”) | A subsidiary of the Company | |
| Ningbo Meishan Bonded Port Area Bai Ning Investment Partnership (Limited Partnership) | A subsidiary of the Company | |
| Wuhu Yuanxiang Tianfu Investment Management Partnership (Limited Partnership) | A subsidiary of the Company | |
| Wuhu Yuanxiang Tianyi Investment Management Partnership (Limited Partnership) | A subsidiary of the Company | |
| China Life (Beijing) Health Management Co., Limited | A subsidiary of the Company | |
| CBRE Global Investors U.S. Investments I, LLC | A subsidiary of the Company | |
China Life Guangde (Tianjin) Equity Investment Fund Partnership (Limited Partnership) | A subsidiary of the Company | |
| China Life Franklin Asset Management Company Limited (“AMC HK”) | An indirect subsidiary of the Company | |
| China Life AMP Asset Management Co., Limited | An indirect subsidiary of the Company | |
| King Phoenix Tree Limited | An indirect subsidiary of the Company | |
| China Life Wealth Management Co., Limited | An indirect subsidiary of the Company | |
| China Century Core Fund Limited | An indirect subsidiary of the Company | |
| China Life Franklin (Shenzhen) Equity Investment Fund Management Co., Limited | An indirect subsidiary of the Company | |
| New Capital Wisdom Limited | An indirect subsidiary of the Company | |
| New Fortune Wisdom Limited | An indirect subsidiary of the Company |
93
Notes to the Interim Condensed Consolidated Financial Statements (continued)
For the six months ended 30 June 2020
| 18 | SIGNIFICANT RELATED PARTY TRANSACTIONS (continued) |
| (a) | Related parties (continued) |
The table set forth below summarises the names of significant related parties and the nature of relationship with the Company as at 30 June 2020 (continued):
Significant related parties | Relationship with the Company | |
| Wisdom Forever Limited Partnership | An indirect subsidiary of the Company | |
| Xi’an Shengyi Jingsheng Real Estate Co., Ltd | An indirect subsidiary of the Company | |
| Dalian Hope Building Company Ltd | An indirect subsidiary of the Company | |
| Sino-Ocean | An associate of the Company | |
| CGB | An associate of the Company | |
| China Life Property & Casualty Insurance Company Limited (“CLP&C”) | An associate of the Company | |
| COFCO Futures Company Limited | An associate of the Company | |
| Sinopec Sichuan to East China Gas Pipeline Co., Ltd. | An associate of the Company | |
| China Unicom | An associate of the Company | |
| Joy City Commercial Property Fund L.P. | A joint venture of a subsidiary of the Company | |
| Mapleleaf Century Limited | A joint venture of subsidiaries of the Company | |
| China Life Real Estate Co., Limited (“CLRE”) | Under common control of CLIC | |
| China Life Insurance (Overseas) Company Limited (“CL Overseas”) | Under common control of CLIC | |
| China Life Investment Holding Company Limited (“CLI”) | Under common control of CLIC | |
| China Life Ecommerce Company Limited (“CL Ecommerce”) | Under common control of CLIC | |
| China Life Enterprise Annuity Fund (“EAP”) | A pension fund jointly set up by the Company and others |
94
Notes to the Interim Condensed Consolidated Financial Statements (continued)
For the six months ended 30 June 2020
| 18 | SIGNIFICANT RELATED PARTY TRANSACTIONS (continued) |
| (a) | Related parties (continued) |
The table set forth below summarises the names of significant related parties and the nature of relationship with the Company as at 30 June 2020 (continued):
Significant related parties | Relationship with the Company | |
Kun Lun Trust • Tianjin Urban Communications Construction No. 1 Collective Fund Trust Scheme | A directly held consolidated structured entity of the Company | |
Jiao Yin Guo Xin • CL Shaanxi Coal and Chemical Industry Group Co., Ltd. Debt-to-Equity Swap Collective Fund Trust Scheme | A directly and indirectly held consolidated structured entity of the Company | |
Shan Guo Tou • Jing Tou Corporate Trust Loan Collective Funds Trust Scheme | A directly held consolidated structured entity of the Company | |
China Life – China Hua Neng Debt-to-Equity Swap Investment Scheme | A directly held consolidated structured entity of the Company | |
Jiao Yin Guo Xin • CL China Aluminium Co., Ltd. Supply-side Reform Collective Fund Trust Scheme | A directly held consolidated structured entity of the Company | |
Jian Xin Trust • CL Guo Xin Collective Fund Trust Scheme | A directly held consolidated structured entity of the Company | |
Guang Da • Hui Ying No. 8 Collective Fund Trust Scheme | A directly held consolidated structured entity of the Company | |
Chongqing Trust Fund • Guo Rong No. 4 Collective Fund Trust Scheme | A directly held consolidated structured entity of the Company | |
Jiao Yin Guo Xin • Jing Tou Corporate Collective Funds Trust Scheme | A directly held consolidated structured entity of the Company | |
Shang Xin – Ningbo Wu Lu Si Qiao PPP Collective Fund Trust Scheme | A directly held consolidated structured entity of the Company | |
China Life – Yanzhou Coal Mining Debt Investment Scheme | A directly held consolidated structured entity of the Company | |
Kun Lun Trust – China Metallurgical No. 1 Collective Fund Trust Scheme | A directly held consolidated structured entity of the Company | |
Jiang Su Trust – Xin Bao Sheng No. 144 (Jing Tou) Collective Fund Trust Scheme | A directly held consolidated structured entity of the Company | |
China Life – Hua Neng International Infrastructure Debt Investment Scheme | A directly held consolidated structured entity of the Company | |
CITIC Jing Cheng – Tianjin Port Group Loan Collective Fund Trust Scheme | A directly held consolidated structured entity of the Company | |
CLI – China COSCO SHIPPING Debt Investment Scheme | A directly held consolidated structured entity of the Company | |
Guang Da • Hui Ying No. 11 Collective Fund Trust Scheme | A directly held consolidated structured entity of the Company | |
China Life – Tianjin Subway Infrastructure Debt Investment Scheme | A directly held consolidated structured entity of the Company | |
Bai Rui Heng Yi No. 604 Collective Funds Trust Scheme | A directly and indirectly held consolidated structured entity of the Company | |
CL AMC – Yuan Liu No. 1 Insurance Asset Management Product | A directly and indirectly held consolidated structured entity of the Company | |
China Life – Hua Neng Development of Infrastructure Debt Investment Scheme | A directly held consolidated structured entity of the Company | |
Kun Lun Trust – Jizhong Energy Group Loan Collective Fund Trust Scheme | A directly held consolidated structured entity of the Company | |
Jiao Yin Guo Xin – CLI – China Nonferrous Metal Collective Fund Trust Scheme | A directly held consolidated structured entity of the Company |
95
Notes to the Interim Condensed Consolidated Financial Statements (continued)
For the six months ended 30 June 2020
| 18 | SIGNIFICANT RELATED PARTY TRANSACTIONS (continued) |
| (b) | Transactions with significant related parties |
The following table summarises the significant transactions carried out by the Group with its significant related parties:
| For the six months ended 30 June | ||||||||||||
| Notes | 2020 RMB million | 2019 RMB million | ||||||||||
Transactions with CLIC and its subsidiaries | ||||||||||||
Policy management fee received from CLIC | (i) | 281 | 287 | |||||||||
Asset management fee received from CLIC | (ii.a) | 45 | 47 | |||||||||
Distribution of dividends from the Company to CLIC | 14,106 | 3,092 | ||||||||||
Distribution of profits from AMC to CLIC | 147 | 122 | ||||||||||
Asset management fee received from CL Overseas | (ii.b) | 36 | 39 | |||||||||
Asset management fee received from CLP&C | (ii.c) | 8 | 9 | |||||||||
Payment of insurance premium to CLP&C | 16 | 13 | ||||||||||
Claim and other payments received from CLP&C | 4 | 7 | ||||||||||
Agency fee received from CLP&C | (iii) | 1,203 | 986 | |||||||||
Rental and service fee received from CLP&C | 24 | 22 | ||||||||||
Payment of rental, project fee and other expenses to CLRE |
| 21 | 22 | |||||||||
Property leasing expenses charged by CLI | (iv) | 37 | 40 | |||||||||
Retained asset management fee received from CLI | 1 | 3 | ||||||||||
Payment of asset management fee to CLI | (ii.d) | 291 | 289 | |||||||||
Property leasing income received from CLI | 20 | 18 | ||||||||||
Payment of real estate purchase to CLI | 86 | — | ||||||||||
Transactions between CGB and the Group | ||||||||||||
Interest on deposits received from CGB | 1,425 | 1,288 | ||||||||||
Commission expenses charged by CGB | (v) | 118 | 57 | |||||||||
Cash dividend from CGB | 550 | — | ||||||||||
Transactions between Sino-Ocean and the Group | ||||||||||||
Cash dividend from Sino-Ocean (Note 6) | 54 | 145 | ||||||||||
Interest of corporate bonds received from Sino-Ocean | 19 | 14 | ||||||||||
Management fee charged by Sino-Ocean | 26 | — | ||||||||||
Transaction between EAP and the Group | ||||||||||||
Contribution to EAP | 355 | 297 | ||||||||||
Transaction between other associates and joint ventures and the Group | ||||||||||||
Distribution of profits from other associates and joint ventures to the Group (Note 6) | 1,000 | 868 | ||||||||||
Transactions between AMC and the Company | ||||||||||||
Payment of an asset management fee to AMC | (ii.e) | 873 | 691 | |||||||||
Distribution of profits from AMC | 220 | 183 | ||||||||||
96
Notes to the Interim Condensed Consolidated Financial Statements (continued)
For the six months ended 30 June 2020
| 18 | SIGNIFICANT RELATED PARTY TRANSACTIONS (continued) |
| (b) | Transactions with significant related parties (continued) |
The following table summarises the significant transactions carried out by the Group with its significant related parties (continued):
| For the six months ended 30 June | ||||||||||||
| Notes | 2020 RMB million | 2019 RMB million | ||||||||||
Transactions between Pension Company and the Company | ||||||||||||
Rental received from Pension Company | 33 | 34 | ||||||||||
Agency fee received from Pension Company for entrusted sales of annuity funds and other businesses | (vi) | 18 | 16 | |||||||||
Marketing fee income for promotion of annuity business from Pension Company | 4 | 2 | ||||||||||
Transaction between AMC HK and the Company | ||||||||||||
Payment of an investment management fee to AMC HK | (ii.f) | 11 | 8 | |||||||||
Transaction between Suzhou Pension Company and the Company | ||||||||||||
Capital contribution to Suzhou Pension Company | 205 | 200 | ||||||||||
Transaction between Rui Chong Company and the Company | ||||||||||||
Rental fee charged by Rui Chong Company | 24 | 24 | ||||||||||
Transaction between Guo Yang Guo Sheng and the Company | ||||||||||||
Capital reduction from Guo Yang Guo Sheng | — | 100 | ||||||||||
Transaction between Shanghai Wansheng and the Company | ||||||||||||
Capital contribution to Shanghai Wansheng | 12 | — | ||||||||||
Transaction between CL Guang De and the Company | ||||||||||||
Capital contribution to CL Guang De | 118 | — | ||||||||||
Transaction between other associates and joint ventures and the Company | ||||||||||||
Distribution of profits from other associates and joint ventures to the Company | 864 | 753 | ||||||||||
Transaction between the consolidated structured entities/other subsidiaries and the Company | ||||||||||||
Distribution of profits from consolidated structured entities to the Company | 6,738 | 4,688 | ||||||||||
97
Notes to the Interim Condensed Consolidated Financial Statements (continued)
For the six months ended 30 June 2020
| 18 | SIGNIFICANT RELATED PARTY TRANSACTIONS (continued) |
| (b) | Transactions with significant related parties (continued) |
Notes:
| (i) | On 26 December 2017, the Company and CLIC renewed a renewable insurance agency agreement, effective from 1 January 2018 to 31 December 2020. The Company performs its duties of insurance agents in accordance with the agreement, but does not acquire any rights and profits or assume any obligations, losses and risks as an insurer of the non-transferable policies. The policy management fee was payable semi-annually, and is equal to the sum of (1) the number of policies in force as at the last day of the period, multiplied by RMB8.0 per policy and (2) 2.5% of the actual premiums and deposits received during the period, in respect of such policies. The policy management fee income is included in other income in the interim condensed consolidated statement of comprehensive income. |
| (ii.a) | In December 2018, CLIC renewed an asset management agreement with AMC, entrusting AMC to manage and make investments for its insurance funds. The agreement is effective from 1 January 2019 to 31 December 2021. In accordance with the agreement, CLIC paid AMC a basic service fee at the rate of 0.05% per annum for the management of insurance funds. The service fee was calculated on a monthly basis and payable on a seasonal basis, by multiplying the average book value of the assets under management (after deducting the funds obtained from and interests accrued for repurchase transactions, deducting the principal and interests of debt and equity investment schemes, project asset-backed schemes, customised non-standard products) at the beginning and the end of any given month by the rate of 0.05%, divided by 12. According to specific projects, debt investment schemes, equity investment plans, project asset-backed plans, and customised non-standard products are based on the contractual agreed rate, without paying for an extra management fee. At the end of each year, CLIC assessed the investment performance of the assets managed by AMC, compared the actual results against benchmark returns and made adjustment to the basic service fee. |
| (ii.b) | In 2018, CL Overseas renewed an investment management agreement with AMC HK, effective from 1 January 2018 to 31 December 2022. In accordance with the agreement, CL Overseas entrusted AMC HK to manage and make investments for its insurance funds and paid AMC HK a basic investment management fee and an investment performance fee. The basic investment management fee was accrued by multiplying the weighted average total funds by the basic fee rate. The investment performance fee was calculated based on the difference between the total actual annual yields and predetermined net realised yield. The basic investment management fee was calculated and payable on a semi-annual basis. The investment performance fee was payable according to the total actual annual yield at the end of each year. |
| (ii.c) | On 15 May 2018, CLP&C renewed an agreement for the management of insurance funds with AMC, entrusting AMC to manage and make investments for its insurance funds, effective from 1 January 2018 to 31 December 2019. The agreement was subject to an automatic one-year renewal since 1 January 2020 if no objections were raised by both parties upon expiry. In accordance with the agreement, CLP&C paid AMC a fixed service fee and a variable service fee. The fixed service fee was calculated on a monthly basis and payable on an annual basis, by multiplying the average net asset value of assets of each category under management at the beginning and the end of any given month by the responding annual investment management fee rate, divided by 12. The variable service fee was payable on an annual basis, and linked to investment performance. |
| (ii.d) | On 31 December 2018, the Company and CLI renewed a management agreement of alternative investment of insurance funds, effective from 1 January 2019 to 31 December 2020. In accordance with the agreement, the Company entrusted CLI to engage in investment, operation and management of equities, real estate and related financial products, and securitised financial products under the instructions of the annual guidelines. The Company paid CLI an asset management fee and a performance related bonus based on the agreement. For fixed-income projects, the management fee rate was between 0.05% and 0.6% according to different ranges of returns; for non-fixed-income projects, the management fee rate for invested projects was 0.3%, the management fee rates for newly signed projects were between 0.05% and 0.3% according to CLI’s involvement in project management and the performance-related bonus is based on the internal return rate upon expiry of the project. In addition, the Company adjusts the investment management fees for fixed-income projects and non-fixed-income projects based on the annual evaluation results on CLI’s performance. The adjustment (variable management fee) ranges from negative 10% to positive 15% of the investment management fee in the current period. |
| (ii.e) | On 28 December 2018, the Company and AMC renewed the agreement for the management of insurance funds, effective from 1 January 2019 to 31 December 2021. In accordance with the agreement, the Company entrusted AMC to manage and make investments for its insurance funds and paid AMC a fixed investment management service fee and a variable investment management service fee. The fixed annual service fee was calculated and payable on a seasonal basis, by multiplying the average net value of the assets under management by the rate of 0.05%; the variable investment management service fee was payable annually, based on the results of performance evaluation, at 20% of the fixed service fee per annum. Asset management fees charged to the Company by AMC are eliminated in the interim condensed consolidated statement of comprehensive income. |
98
Notes to the Interim Condensed Consolidated Financial Statements (continued)
For the six months ended 30 June 2020
| 18 | SIGNIFICANT RELATED PARTY TRANSACTIONS (continued) |
| (b) | Transactions with significant related parties (continued) |
Notes (continued):
| (ii.f) | On 31 December 2018, the Company and AMC HK renewed the management agreement of insurance funds investment, which is effective from 1 January 2019 to 31 December 2021. In accordance with the agreement, the Company entrusted AMC HK to manage and make investments for its insurance funds and paid AMC HK an asset management fee on a seasonal basis and the maximum investment management fee to be paid annually is RMB30 million. The management fee rate for financial products, such as investment plans, project asset-backed plans, customised products and insurance asset management products, set up by AMC HK in the industry permitted by regulatory policies, is set according to contractual terms. The management fee rate for the directive investment operation of term deposits, common stocks, funds, financial products and other investment products, universal account B-2 and entrusted assets account alike was 0.02%; the management fee rate for unlisted equity investment was 0.3%; the management fee rate for customised investment portfolio was agreed upon the management fee of market-oriented entrusted investment. Asset management fees charged to the Company by AMC HK are eliminated in the interim condensed consolidated statement of comprehensive income. |
| (iii) | On 31 January 2018, the Company and CLP&C signed a new insurance agency framework agreement, whereby CLP&C entrusted the Company to act as an agent to sell designated insurance products in certain authorised jurisdictions. The agency fee was determined based on cost (tax included) plus a margin. The agreement is effective for three years, from 8 March 2018 to 7 March 2021. |
| (iv) | On 29 December 2017, the Company renewed a property leasing agreement with CLI, effective from 1 January 2018 to 31 December 2020, pursuant to which CLI leased to the Company certain buildings of its own. Annual rental payable by the Company to CLI in relation to the CLI properties is determined either by reference to the market rent, or, the costs incurred by CLI in holding and maintaining the properties, plus a margin of approximately 5%. The rental was paid on a semi-annual basis, and each payment was equal to one half of the total annual rental. |
| (v) | On 19 October 2018, the Company and CGB renewed an insurance agency agreement to distribute insurance products. All individual insurance products suitable for distribution through bancassurance channels are included in the agreement. CGB provides agency services, including the sale of insurance products, collecting premiums and paying benefits. The Company paid the agency commission by multiplying the net amount of total premiums received from the sale of each category individual insurance products after deducting the surrender premiums in the hesitation period, by the responding fixed commission rate. The commission rates for various insurance products sold by CGB are agreed based on arm’s length transactions. The commissions are payable on a monthly basis. The agreement was effective from the signing date to 16 August 2020. |
On 28 December 2018, the Company and CGB signed another insurance agency agreement to distribute corporate group insurance products. The corporate group insurance products suitable for distribution through bancassurance channels are included in the agreement. The Company paid the agency commission by multiplying the net amount of total premiums received from the sale of each category group insurance product after deducting the surrender premiums, by the responding fixed commission rate. The commission rates for various insurance products sold by CGB are agreed by reference to comparable market prices of independent third-parties. The commissions are paid on a monthly basis. The agreement is effective for two years from 1 January 2019, with an automatic one-year renewal if no objections were raised by either party upon expiry.
| (vi) | On 1 January 2019, the Company and Pension Company renewed an entrusted agency agreement for pension business acted by life business. The agreement is effective from 1 January 2019 to 31 December 2021. The business means that Pension Company entrusted the Company to sell enterprise annuity funds, pension security business, occupational pension business and the third-party asset management business. The commissions agreed upon in the agreement include the daily business commissions and the annual promotional plans commissions. According to the agreement, the commissions for the entrusting service of enterprise annuity fund management, which is the core business of Pension Company, are calculated at 30% to 80% of the annual entrusting management fee revenues, depending on the duration of the agreement. The commissions for account management service are calculated at 60% of the first year’s account management fee and were only charged for the first year, regardless of the duration of the agreement. The commissions for investment management services, in accordance with the duration of the agreement, are calculated at 60% to 3% of the annual investment management fee (excluding risk reserves for investment), decreasing annually. The commissions of the group pension plan are, in accordance with the duration of the contracts, calculated at 50% to 3% of the annual investment management fee, decreasing annually; the commissions of the personal pension plan are calculated at 30% to 50% of the annual investment management fee according to the various rates of the daily management fee applied to the various individual pension management products in all of the management years; the commissions of occupation annuity and third-party asset management business are in accordance with the provision of annual promotional plans, which should be determined by both parties on a separate occasion. The commissions charged to Pension Company by the Company are eliminated in the interim condensed consolidated statement of comprehensive income of the Group. |
99
Notes to the Interim Condensed Consolidated Financial Statements (continued)
For the six months ended 30 June 2020
| 18 | SIGNIFICANT RELATED PARTY TRANSACTIONS (continued) |
| (c) | Amounts due from/to significant related parties |
The following table summarises the balances due from and to significant related parties. The balances of the Group are all unsecured. The balances of the Group are non-interest-bearing, and have no fixed repayment dates except for deposits with CGB, wealth management products and other securities of CGB and corporate bonds issued by Sino-Ocean.
| As at 30 June 2020 RMB million | As at 31 December 2019 RMB million | |||||||
Amounts due from and to significant related parties of the Group | ||||||||
Amount due from CLIC | 330 | 334 | ||||||
Amount due to CLIC | (14,106 | ) | — | |||||
Amount due from CL Overseas | 43 | 56 | ||||||
Amount due from CLP&C | 293 | 334 | ||||||
Amount due to CLP&C | (63 | ) | (31 | ) | ||||
Amount due from CLI | 9 | 18 | ||||||
Amount due to CLI | (354 | ) | (401 | ) | ||||
Amount due from CLRE | 2 | 2 | ||||||
Amount deposited with CGB | 70,696 | 59,420 | ||||||
Wealth management products and other securities of CGB | 394 | 844 | ||||||
Amount due from CGB | 2,066 | 894 | ||||||
Amount due to CGB | (61 | ) | (75 | ) | ||||
Corporate bonds of Sino-Ocean | 706 | 922 | ||||||
Amount due from Sino-Ocean | 76 | 8 | ||||||
Amount due from CL Ecommerce | 16 | 13 | ||||||
Amount due to CL Ecommerce | (64 | ) | (68 | ) | ||||
Amounts due from and to subsidiaries of the Company | ||||||||
Amount due to AMC | (411 | ) | (381 | ) | ||||
Amount due to AMC HK | (11 | ) | (9 | ) | ||||
Amount due from Pension Company | 41 | 30 | ||||||
Amount due to Pension Company | (38 | ) | (35 | ) | ||||
Amount due from Rui Chong Company | 118 | 118 | ||||||
| (d) | Key management personnel compensation |
| For the six months ended 30 June | ||||||||
| 2020 RMB million | 2019 RMB million | |||||||
Salaries and other benefits | 7 | 8 | ||||||
|
|
|
| |||||
The total compensation package for the Company’s key management personnel has not yet been finalised in accordance with regulations of the relevant PRC authorities. The compensation listed above is the tentative payment.
100
Notes to the Interim Condensed Consolidated Financial Statements (continued)
For the six months ended 30 June 2020
| 18 | SIGNIFICANT RELATED PARTY TRANSACTIONS (continued) |
| (e) | Transactions with state-owned enterprises |
Under IAS 24 Related Party Disclosures (“IAS 24”), business transactions between state-owned enterprises controlled by the PRC government are within the scope of related party transactions. CLIC, the ultimate holding company of the Group, is a state-owned enterprise. The Group’s key business is insurance and investment related and therefore the business transactions with other state-owned enterprises are primarily related to insurance and investment activities. The related party transactions with other state-owned enterprises were conducted in the ordinary course of business. Due to the complex ownership structure, the PRC government may hold indirect interests in many companies. Some of these interests may, in themselves or when combined with other indirect interests, be controlling interests which may not be known to the Group. Nevertheless, the Group believes that the following captures the material related parties and has applied IAS 24 exemption and disclosed only qualitative information.
As at 30 June 2020, most of the bank deposits of the Group were with state-owned banks and the issuers of corporate bonds and subordinated bonds held by the Group were mainly state-owned enterprises. For the six months ended 30 June 2020, a large portion of its group insurance business of the Group were with state-owned enterprises; the majority of bancassurance commission charges were paid to state-owned banks and postal offices; and the majority of the reinsurance agreements of the Group were entered into with a state-owned reinsurance company.
| 19 | SHARE CAPITAL |
| As at 30 June 2020 | As at 31 December 2019 | |||||||||||||||
| No. of shares | RMB million | No. of shares | RMB million | |||||||||||||
Registered, authorised, issued and fully paid | ||||||||||||||||
Ordinary shares of RMB1 each | 28,264,705,000 | 28,265 | 28,264,705,000 | 28,265 | ||||||||||||
|
|
|
|
|
|
|
| |||||||||
As at 30 June 2020, the Company’s share capital was as follows:
| As at 30 June 2020 | ||||||||
| No. of shares | RMB million | |||||||
Owned by CLIC (i) | 19,323,530,000 | 19,324 | ||||||
Owned by other equity holders | 8,941,175,000 | 8,941 | ||||||
Including: Domestic listed | 1,500,000,000 | 1,500 | ||||||
Overseas listed (ii) | 7,441,175,000 | 7,441 | ||||||
|
|
|
| |||||
Total | 28,264,705,000 | 28,265 | ||||||
|
|
|
| |||||
| (i) | All shares owned by CLIC are domestic listed shares. |
| (ii) | Overseas listed shares are traded on the Stock Exchange of Hong Kong Limited and the New York Stock Exchange. |
101
Notes to the Interim Condensed Consolidated Financial Statements (continued)
For the six months ended 30 June 2020
| 20 | OTHER EQUITY INSTRUMENTS |
| (a) | Basic information |
| As at 31 December 2019 RMB million | Increase RMB million | Decrease RMB million | As at 30 June 2020 RMB million | |||||||||||||
Core Tier 2 Capital Securities | 7,791 | — | — | 7,791 | ||||||||||||
|
|
|
|
|
|
|
| |||||||||
Total | 7,791 | — | — | 7,791 | ||||||||||||
|
|
|
|
|
|
|
| |||||||||
The Company issued Core Tier 2 Capital Securities at par with the nominal value of USD1,280 million on 3 July 2015, and listed such securities on the Stock Exchange of Hong Kong Limited on 6 July 2015. The securities were issued in the specified denomination of USD200,000 and integral multiples of USD1,000 in excess thereof. After a deduction of the issue expense, the total amount of the proceeds raised from this issuance was USD1,274 million or RMB7,791 million. The issued capital securities have a term of 60 years, which is extendable upon expiry. Distributions shall be payable on the securities semi-annually and the Company has the option to redeem the securities at the end of the fifth year after issuance and on any distribution payment date thereafter. The initial distribution rate for the first five interest-bearing years is 4.00%, if the Company does not exercise this option, the rate of distribution will be reset based on the comparable US treasury yield plus a margin of 2.294% at the end of the fifth year and every five years thereafter.
| (b) | Equity attributable to equity holders |
| As at 30 June 2020 RMB million | As at 31 December 2019 RMB million | |||||||
Equity attributable to equity holders of the Company | 415,906 | 403,764 | ||||||
Equity attributable to ordinary equity holders of the Company | 408,115 | 395,973 | ||||||
Equity attributable to other equity instruments holders of the Company | 7,791 | 7,791 | ||||||
Equity attributable to non-controlling interests | 6,271 | 5,578 | ||||||
Equity attributable to ordinary equity holders of non-controlling interests | 6,271 | 5,578 | ||||||
|
|
|
| |||||
Refer to Note 16 for the information of distribution to other equity instruments holders of the Company for the six months ended 30 June 2020. As at 30 June 2020, there were no accumulated distributions unpaid attributable to other equity instrument holders of the Company.
102
Notes to the Interim Condensed Consolidated Financial Statements (continued)
For the six months ended 30 June 2020
| 21 | PROVISIONS AND CONTINGENCIES |
The following is a summary of the significant contingent liabilities:
| As at 30 June 2020 RMB million | As at 31 December 2019 RMB million | |||||||
Pending lawsuits | 497 | 523 | ||||||
|
|
|
| |||||
The Group involves in certain lawsuits arising from the ordinary course of business. In order to accurately disclose the contingent liabilities for pending lawsuits, the Group analysed all pending lawsuits case by case at the end of each interim and annual reporting period. A provision will only be recognised if management determines, based on third-party legal advice, that the Group has present obligations and the settlement of which is expected to result in an outflow of the Group’s resources embodying economic benefits, and the amount of such obligations could be reasonably estimated. Otherwise, the Group will disclose the pending lawsuits as contingent liabilities. As at 30 June 2020 and 31 December 2019, the Group had other contingent liabilities but disclosure of such was not practical because the amounts of liabilities could not be reliably estimated and were not material in aggregate.
| 22 | COMMITMENTS |
| (a) | Capital commitments |
The Group had the following capital commitments relating to property development projects and investments:
| As at 30 June 2020 RMB million | As at 31 December 2019 RMB million | |||||||
Contracted, but not provided for | ||||||||
Investments | 64,703 | 64,866 | ||||||
Property, plant and equipment | 4,156 | 3,941 | ||||||
|
|
|
| |||||
Total | 68,859 | 68,807 | ||||||
|
|
|
| |||||
| (b) | Operating lease commitments – as lessor |
The future minimum rentals receivable under non-cancellable operating leases are as follows:
| As at 30 June 2020 RMB million | As at 31 December 2019 RMB million | |||||||
Not later than one year | 533 | 578 | ||||||
Later than one year but not later than five years | 1,294 | 1,133 | ||||||
Later than five years | 145 | 231 | ||||||
|
|
|
| |||||
Total | 1,972 | 1,942 | ||||||
|
|
|
| |||||
103

BASIC INFORMATION OF THE COMPANY
| BASIC INFORMATION | ||
Registered Name in Chinese | 中國人壽保險股份有限公司(簡稱「中國人壽」) | |
Registered Name in English | China Life Insurance Company Limited (“China Life”) | |
Legal Representative | Wang Bin | |
Registered Office Address | 16 Financial Street, Xicheng District, Beijing, P.R. China | |
Postal Code | 100033 | |
Current Office Address | 16 Financial Street, Xicheng District, Beijing, P.R. China | |
Postal Code | 100033 | |
Telephone | 86-10-63633333 | |
Fax | 86-10-66575722 | |
Website | www.e-chinalife.com | |
| ir@e-chinalife.com | ||
Hong Kong Office Address | 16/F, Tower A, China Life Centre, One Harbour Gate, 18 Hung Luen Road, Hung Hom, Kowloon, Hong Kong | |
Telephone | 852-29192628 | |
Fax | 852-29192638 | |
104
CONTACT INFORMATION
| Board Secretary | Securities Representative | |||
Name | Li Mingguang | Li Yinghui | ||
Office Address | 16 Financial Street, Xicheng District, Beijing, P.R. China | 16 Financial Street, Xicheng District, Beijing, P.R. China | ||
Telephone | 86-10-63631241 | 86-10-63631191 | ||
Fax | 86-10-66575112 | 86-10-66575112 | ||
| ir@e-chinalife.com | liyh@e-chinalife.com | |||
* Ms. Li Yinghui, Securities Representative of the Company, is also the main contact person of the external Company Secretary engaged by the Company | ||||
INFORMATION DISCLOSURE AND PLACE FOR OBTAINING THE REPORT
Media for the Company’s A Share Disclosure | China Securities Journal, Shanghai Securities News, Securities Times | |
| CSRC’s Designated Website for the Company’s Interim Report Disclosure | www.sse.com.cn | |
| The Company’s H Share Disclosure Websites | HKExnews website of Hong Kong Exchanges and Clearing Limited at www.hkexnews.hk The Company’s website at www.e-chinalife.com | |
| The Company’s Interim Report may be obtained at | 12/F, China Life Plaza, 16 Financial Street, Xicheng District, Beijing, P.R. China | |
STOCK INFORMATION
| Stock Type | Exchanges on which the Stocks are Listed | Stock Short Name | Stock Code | |||
A Share | Shanghai Stock Exchange | China Life | 601628 | |||
H Share | The Stock Exchange of Hong Kong Limited | China Life | 2628 | |||
ADR | New York Stock Exchange | – | LFC | |||
OTHER RELEVANT INFORMATION
H Share Registrar and Transfer Office | Computershare Hong Kong Investors Services Limited | Address: Shops 1712-1716, 17th Floor, Hopewell Centre, 183 Queen’s Road East, Wanchai, Hong Kong | ||
Depositary of ADR | Deutsche Bank | Address: 60 Wall Street, New York, NY 10005 | ||
Domestic Legal Adviser | King & Wood Mallesons | |||
International Legal Advisers | Latham & Watkins LLP | Debevoise & Plimpton LLP | ||
| Domestic Auditor | International Auditor | |||
| Ernst & Young Hua Ming LLP Ernst & Young | ||||
Auditors of the Company | Address: Level 16, Ernst & Young Tower, Oriental Plaza, No. 1 East Changan Avenue, Dongcheng District, Beijing, P.R. China | Address: 22/F, CITIC Tower, 1 Tim Mei Avenue, Central, Hong Kong | ||
| Name of the Signing Auditors: Huang Yuedong, Xu Ting | ||||
105
INDEX OF INFORMATION DISCLOSURE ANNOUNCEMENTS
Serial | Items | Date of disclosure | ||||
1 | Investment in China Life Aged-Care Industry Investment Fund and Notice of the First Extraordinary General Meeting 2020 | 2020/1/2 | ||||
2 | Notice of the First Extraordinary General Meeting 2020 | 2020/1/2 | ||||
3 | Form of Proxy of Holders of H Shares for use at the First Extraordinary General Meeting 2020 of the Company to be held on Thursday, 20 February 2020 | 2020/1/2 | ||||
4 | Reply Slip of Holders of H Shares | 2020/1/2 | ||||
5 | Notification Letter and Change Request Form to Registered Shareholders | 2020/1/2 | ||||
6 | Notification Letter and Request Form to Non-Registered Shareholders | 2020/1/2 | ||||
7 | Announcement – Approval of Qualification as Supervisor by the CBIRC Beijing Bureau and Resignation of Supervisor | 2020/1/3 | ||||
8 | Announcement of Premium Income | 2020/1/15 | ||||
9 | Election of Language and Means of Receipt of Corporate Communication | 2020/1/16 | ||||
10 | Reply Form | 2020/1/16 | ||||
11 | Announcement – Estimated Profit Increase for the Year 2019 | 2020/1/19 | ||||
12 | Clarification Announcement | 2020/2/13 | ||||
13 | Indicative Announcement – Approval by the CBIRC of Gratuitous Transfer of the Controlling Shareholder’s Partial State-owned Shares | 2020/2/14 | ||||
14 | Announcement – Forfeiture of Unclaimed Dividends | 2020/2/17 | ||||
15 | Announcement of Premium Income | 2020/2/18 | ||||
16 | Announcement – Resolutions Passed at the First Extraordinary General Meeting 2020 | 2020/2/20 | ||||
17 | Announcement – Approval of Qualification of Director by the CBIRC Beijing Bureau | 2020/3/2 | ||||
18 | Notice of Board Meeting | 2020/3/12 | ||||
19 | Announcement of Premium Income | 2020/3/12 | ||||
20 | Announcement – Collection of Questions for 2019 Annual Results Briefing | 2020/3/19 | ||||
21 | Announcement of Results for the Year Ended 31 December 2019 | 2020/3/25 | ||||
22 | China Life Insurance Company Limited 2019 Environmental, Social and Governance & Social Responsibility Report | 2020/3/25 | ||||
23 | Summary of Solvency Quarterly Report of Insurance Company (Fourth Quarter of 2019) | 2020/3/25 | ||||
24 | Announcement – Continuing Connected Transactions under New Asset Management Agreements and Revision of Annual Caps for Continuing Connected Transactions | 2020/3/25 | ||||
25 | Announcement – Nomination of Independent Non-Executive Director | 2020/3/25 | ||||
26 | Notice of Board Meeting | 2020/4/9 | ||||
27 | Announcement of Premium Income | 2020/4/14 | ||||
28 | Annual Report 2019 | 2020/4/16 | ||||
106
Serial | Items | Date of disclosure | ||||
29 | Reports of the Board of Directors & the Board of Supervisors for 2019, Financial Report and Profit Distribution Plan for 2019, Remuneration of Directors and Supervisors, Election of Independent Director, Remuneration of Auditors for 2019 & Appointment of Auditors for 2020, General Mandate to Issue H Shares, Duty Report of the Independent Directors of the Board of Directors for 2019, Report on the Overall Status of Connected Transactions for 2019 & Notice of AGM | 2020/4/16 | ||||
30 | Notice of Annual General Meeting | 2020/4/16 | ||||
31 | Form of Proxy of Holders of H Shares for use at the Annual General Meeting of the Company to be held on Monday, 29 June 2020 | 2020/4/16 | ||||
32 | Reply Slip of H Share Shareholders | 2020/4/16 | ||||
33 | Notification Letter and Change Request Form to Registered Shareholders | 2020/4/16 | ||||
34 | Notification Letter and Request Form to Non-Registered Shareholders | 2020/4/16 | ||||
35 | 2020 First Quarter Report | 2020/4/23 | ||||
36 | Announcement – Resignation of Executive Director and Change of Person in Charge of Finance | 2020/4/23 | ||||
37 | Summary of Solvency Quarterly Report of Insurance Company (First Quarter of 2020) | 2020/4/23 | ||||
38 | China Life Insurance Company Limited – Announcement on Changes in Accounting Estimates | 2020/4/23 | ||||
39 | Announcement of Premium Income | 2020/5/14 | ||||
40 | Announcement – Approval of Qualification of Person in Charge of Finance by CBIRC Beijing Bureau | 2020/5/26 | ||||
41 | Notice of Redemption | 2020/5/27 | ||||
42 | Announcement of Premium Income | 2020/6/11 | ||||
43 | Announcement – Resolutions Passed at the Annual General Meeting and Distribution of Final Dividend | 2020/6/29 | ||||
107
DEFINITIONS AND MATERIAL RISK ALERT
In this report, unless the context otherwise requires, the following expressions have the following meanings:
China Life, the Company2 | China Life Insurance Company Limited and its subsidiaries | |
CLIC | China Life Insurance (Group) Company, the controlling shareholder of the Company | |
AMC | China Life Asset Management Company Limited, a non-wholly owned subsidiary of the Company | |
Pension Company | China Life Pension Company Limited, a non-wholly owned subsidiary of the Company | |
AMP | China Life AMP Asset Management Company Limited, an indirect non-wholly owned subsidiary of the Company | |
CLWM | China Life Wealth Management Company Limited, an indirect non-wholly owned subsidiary of the Company | |
CGB | China Guangfa Bank Co., Ltd., an associate of the Company | |
CLP&C | China Life Property and Casualty Insurance Company Limited, a non-wholly owned subsidiary of CLIC | |
CLI | China Life Investment Holding Company Limited, a wholly-owned subsidiary of CLIC | |
China Life Capital | China Life Capital Investment Company, an indirect wholly-owned subsidiary of CLIC | |
CBIRC | China Banking and Insurance Regulatory Commission, the predecessors of which are China Insurance Regulatory Commission and China Banking Regulatory Commission | |
CBIRC Beijing Bureau | Beijing Bureau of the China Banking and Insurance Regulatory Commission | |
CSRC | China Securities Regulatory Commission | |
HKSE | The Stock Exchange of Hong Kong Limited | |
SSE | Shanghai Stock Exchange | |
Company Law | Company Law of the People’s Republic of China | |
Insurance Law | Insurance Law of the People’s Republic of China | |
Securities Law | Securities Law of the People’s Republic of China | |
Articles of Association | Articles of Association of China Life Insurance Company Limited | |
China or PRC | For the purpose of this report, “China” or “PRC” refers to the People’s Republic of China, excluding the Hong Kong Special Administrative Region, Macau Special Administrative Region and Taiwan region | |
RMB | Renminbi Yuan | |
Material Risk Alert:
The risks faced by the Company primarily include risks relating to macro trends, insurance risk, market risk, credit risk, operational risk, strategic risk, reputation risk, liquidity risk and information safety risk. The Company has adopted various measures to manage and control different risks effectively. The Company has stated in this report the details of its existing risks relating to macro trends and please refer to the “Future Prospect” in the section headed “Management Discussion and Analysis”. For other risk analysis, please refer to the “Internal Control and Risk Management” in the section headed “Corporate Governance” of the 2019 annual report of the Company. During the Reporting Period, there was no material change in the other risks mentioned above.
| 2 | Except for “the Company” referred to in the Interim Condensed Consolidated Financial Statements. |
108

China Life Insurance Company Limited Office Address: 16 Financial Street, Xicheng District, Beijing, P. R. China Telephone: 86-10-63633333 Website: www.e-chinalife.com E-mail: ir@e-chinalife.comina Telephone: 86-10-63633333 Website: www.e-chinalife.com E-mail: ir@e-chinalife.com FSC www.fsc.org MIX Paper from responsible sources FSCTM C007445