Commission File Number 001-31914
EXHIBIT 99.1
Hong Kong Exchanges and Clearing Limited and The Stock Exchange of Hong Kong Limited take no responsibility for the contents of this announcement, make no representation as to its accuracy or completeness and expressly disclaim any liability whatsoever for any loss howsoever arising from or in reliance upon the whole or any part of the contents of this announcement.

中國人壽保險股份有限公司
CHINA LIFE INSURANCE COMPANY LIMITED
(A joint stock limited company incorporated in the People’s Republic of China with limited liability)
(Stock Code: 2628)
ANNOUNCEMENT OF RESULTS FOR THE YEAR ENDED
31 DECEMBER 2020
CHAIRMAN’S STATEMENT
Looking back at the past year, in the face of the unexpected COVID-19 pandemic and a complicated and tough external environment, China Life closely followed the national guidance, maintained its strategic consistency, and continued to seek high-quality development. We proceeded well with both the pandemic control and the reform and development, and achieved a steady growth of our key performance indicators, including embedded value and premium income, serving the overall stable development of the life insurance industry and fully achieving the goal for the first stage of the “China Life Revitalization” initiative as well as the targets set in the “13th Five-Year Plan”. I, on behalf of the Company’s board of directors (the “Board”), hereby report to shareholders and the public on the Company’s operating results for the year of 2020.
During the Reporting Period, the Company’s comprehensive strength was further enhanced and its leading market position was consolidated. The Company’s gross written premiums amounted to RMB612,265 million, exceeding RMB600 billion for the first time and achieving a new record high. The embedded value of the Company exceeded RMB1 trillion, reaching RMB1,072,140 million and leading the industry. Total assets exceeded RMB4 trillion, amounting to RMB4,252,410 million, an increase of 14.1% from the end of 2019. Net profit attributable to equity holders of the Company was RMB50,268 million. As at the end of the Reporting Period, the core solvency ratio and the comprehensive solvency ratio were 260.10% and 268.92%, respectively. The Board has proposed to distribute an annual cash dividend of RMB0.64 per share (inclusive of tax) and such proposal will be submitted to the 2020 Annual General Meeting for review and discussion.
1
In 2020, facing unprecedented challenges, we firmly upheld the original aspiration of “Protecting People’s Good Life” by focusing on our principal businesses and taking on social responsibilities. With strong development resilience, we enhanced social well-being in serving the overall national development plan, created long-term business value in pursuing high-quality development, strengthened driving forces in reform and innovation, and advanced steady operations to support modernization of corporate governance.
In the past year, we proactively leveraged advantages of our principal businesses to firmly serve the overall national development. In the fight against the COVID-19 pandemic, we took immediate actions to donate funds and supplies to the front line of pandemic prevention and control and offer complimentary insurance protection for 2.5 million medical workers fighting on the front line and over 14 million people with a sum assured of nearly RMB3.3 trillion on a cumulative basis. We also expanded insurance coverage of existing insurance plans and introduced special services and measures, playing the role of insurance as a “shock absorber”. We actively supported the targeted poverty alleviation, inputting over RMB87 million on a cumulative basis in 1,281 poverty alleviation localities, lifting all of them out of poverty. Poverty alleviation through consumption amounted to over RMB30 million. By leveraging our principal businesses, we developed exclusive insurance products to support poverty alleviation and risk coverage, covering more than 18 million people from registered poverty-stricken households as well as those on the edge of the poverty line, underwriting a sum assured of RMB3.4 trillion. In building a moderately prosperous society in all respects and fighting against poverty, one team and one individual of the Company received honorary titles of National Advanced Team and Individual in Poverty Alleviation respectively. By sticking to the role of finance in serving the real economy, we actively participated in the strategic regional developments, including the coordinated development of the Beijing-Tianjin-Hebei Region, the Yangtze River Economic Belt developments, the building of the Guangdong-Hong Kong- Macao Greater Bay Area and the integrated development along the Yangtze River Delta, supporting the development of the country to be a manufacturer of quality and with a strong transportation network, as well as the building of a “Green China”. As at the end of the Reporting Period, the existing investments made by the Company serving the real economy exceeded RMB2.3 trillion, and new investments made in the year exceeded RMB600 billion.
In the past year, we further advanced high-quality development and enhanced our capability in value creation. By prioritizing business value growth and sticking to the protection role of insurance, we increased effective insurance supplies and achieved coordinated growth of business value and scale. During the Reporting Period, despite the impact of the pandemic, the business structure of the Company was further optimized, and its protection-oriented business maintained a growing trend. Value of one year’s sales of the Company reached RMB58,373 million, generally remaining stable compared to 2019. With the reinforced asset-liability management and interaction, the Company registered a gross investment income of RMB198,596 million in 2020, reaching a record high.
2
In the past year, we accelerated transformation and upgrade, with digitalized operations creating strong driving forces. We pushed forward the “Dingxin Project” in great depth and primarily completed the customer-centric sales deployment of “Yi Ti Duo Yuan”. The individual agent business sector saw increased capability in value creation, and the diversified business sector went through steady transformation in operation modes. The market-oriented incentive and restraint mechanism for talents in key fields such as sales and investment was gradually established. Keeping up with the “digital era”, we built the online digital platform based on our profound offline strength, and established the industry- leading hybrid clouds. Technology empowerment mitigated negative impacts of the pandemic by providing foundational power, and the technology operation model of “Collective Wisdom, Agility, Iteration” set a new exemplary model in the industry. Empowered by technologies adopted under the “Technology-driven China Life” strategy, operations and services were upgraded in all aspects, becoming more Internet-based, intelligent, integrated and ecological, effectively meeting the needs of customers for high-quality services.
In the past year, we advanced the corporate governance system with scientific and effective risk prevention and control mechanisms. Aiming at the best practices of corporate governance of listed companies in the three listing venues, we actively improved the corporate governance mechanism and effectively enhanced the modernization of our corporate governance, and received the “Hong Kong Corporate Governance Excellence Award” for 2020. We accelerated the integration of “Environmental, Social and Governance” (“ESG”) management into our operation and management system and put the ESG investment concept into practice. China Life Asset Management Company (“AMC”), the Company’s non-wholly owned subsidiary, was the first insurance asset management company in China to sign the United Nations – Supported Principles for Responsible Investment (UNPRI), and was deeply engaged in the “Green Finance” with new green investments in the year reaching RMB30.6 billion. Adhering to the principle of prudent and steady operation, we continued to pay attention to and proactively prevented and mitigated major financial risks, effectively followed the law of asset-liability management and paid great attention to interest risk, market risk, credit risk and compliance risk, so as to strictly prevent any external risk incidents from penetrating into the Company. We also carried out special governance on key risks and greatly promoted intelligent risk control. In the integrated risk rating by the regulatory authority, the Company has received the rating of Class A for 11 consecutive quarters.
3
The 14th Five-Year Plan marks the first five years of China’s new journey toward fully building a modern socialist country, in which the insurance industry will undertake the new mission of contributing to the modernization of a national governance system and governance capability. With economic and social development, social well-being will reach a new level, and the expansion of the middle-income group will accelerate. Deeply grounded in China’s economy which has strong resilience and great potential, the life insurance industry is at an important stage full of strategic opportunities, and will have a broader space for development. At the same time, we also see that the COVID-19 pandemic is still continuing around the world with wide and far-reaching impacts and uncertainties, which has affected the release of demands for insurance and posed challenges to assets allocation and traditional insurance operation modes at the liability end. We will seize the new changes of current opportunities and challenges, further mobilize the advantage of risk management expertise in our principal businesses, implement the new development concept, actively explore to build and achieve a new development pattern for the life insurance industry, continuously deepen the supply side structural reform with customer-centric principle, accelerate transformation and upgrade, and constantly enhance the match and fit between our own development and the needs of the times, so as to protect people’s well-being and promote economic and social development with strengthened services capabilities.
2021 is the beginning of the 14th Five-Year Plan and also a critical year for the Company’s high-quality development. We will further push forward the “China Life Revitalization” initiative, and continue to maintain high-quality development. We will also fully engage in the new development pattern of “dual circulation” and strive to achieve stable development, business quality improvement, reform and innovation, and risk prevention and control. We will take development as the top priority, emphasize business value, and achieve business development driven by a productive sales force; fully push forward the “Dingxin Project” reforms, accelerate marketization, and further enhance internal driving forces; continue to reinforce the technology and innovation driven development, accelerate operational digitalization, and provide customers with “convenient, quality and caring” services; continue to strengthen asset-liability interaction, strictly implement the regulatory requirements, continuously improve the risk prevention and control system, strictly prevent key risks, and enhance our corporate governance capability.
With a profound historical accumulation, China Life has always played an important role of an explorer and pioneer of China’s life insurance industry. Time goes by with dreams ahead. In this new promising era, we will stick to our original aspiration and forge ahead on the journey of building a world-class life insurance company, with a view to rewarding our shareholders and people from all walks of life with satisfactory operating performances.
4
FINANCIAL SUMMARY
| I. | Major Financial Data and Indicators for the Past Five Years |
| RMB million | ||||||||||||||||||||||||
| Major Financial Data1 | Under International Financial Reporting Standards (IFRS) | |||||||||||||||||||||||
| 2020 | 2019 | Change | 2018 | 2017 | 2016 | |||||||||||||||||||
For the year ended | ||||||||||||||||||||||||
Total revenues | 804,961 | 729,474 | 10.3 | % | 627,419 | 643,355 | 540,781 | |||||||||||||||||
Net premiums earned | 604,666 | 560,278 | 7.9 | % | 532,023 | 506,910 | 426,230 | |||||||||||||||||
Benefits, claims and expenses | 758,139 | 677,690 | 11.9 | % | 621,243 | 608,827 | 522,794 | |||||||||||||||||
Insurance benefits and claims expenses | 580,801 | 509,467 | 14.0 | % | 479,219 | 466,043 | 407,045 | |||||||||||||||||
Profit before income tax | 54,488 | 59,795 | -8.9 | % | 13,921 | 41,671 | 23,842 | |||||||||||||||||
Net profit attributable to equity holders of the Company | 50,268 | 58,287 | -13.8 | % | 11,395 | 32,253 | 19,127 | |||||||||||||||||
Net profit attributable to ordinary share holders of the Company | 50,067 | 57,893 | -13.5 | % | 11,011 | 31,873 | 18,741 | |||||||||||||||||
Net cash inflow/(outflow) from operating activities | 304,024 | 286,032 | 6.3 | % | 147,552 | 200,990 | 89,098 | |||||||||||||||||
As at 31 December | ||||||||||||||||||||||||
Total assets | 4,252,410 | 3,726,734 | 14.1 | % | 3,254,403 | 2,897,591 | 2,696,951 | |||||||||||||||||
Investment assets2 | 4,095,454 | 3,573,154 | 14.6 | % | 3,104,014 | 2,753,124 | 2,573,049 | |||||||||||||||||
Total liabilities | 3,795,479 | 3,317,392 | 14.4 | % | 2,931,113 | 2,572,281 | 2,389,303 | |||||||||||||||||
Total equity holders’ equity | 450,051 | 403,764 | 11.5 | % | 318,371 | 320,933 | 303,621 | |||||||||||||||||
Per share (RMB) | ||||||||||||||||||||||||
Earnings per share (basic and diluted)3 | 1.77 | 2.05 | -13.5 | % | 0.39 | 1.13 | 0.66 | |||||||||||||||||
Equity holders’ equity per share3 | 15.92 | 14.28 | 11.5 | % | 11.26 | 11.35 | 10.74 | |||||||||||||||||
Ordinary share holders’ equity per share3 | 15.92 | 14.01 | 13.7 | % | 10.99 | 11.08 | 10.47 | |||||||||||||||||
Net cash inflow/(outflow) from operating activities per share3 | 10.76 | 10.12 | 6.3 | % | 5.22 | 7.11 | 3.15 | |||||||||||||||||
Major financial ratios | ||||||||||||||||||||||||
Weighted average ROE (%) | 11.84 | 16.47 | | decrease of 4.63 percentage points | | 3.54 | 10.49 | 6.16 | ||||||||||||||||
Gearing ratio4 (%) | 89.25 | 89.02 | | increase of 0.23 percentage point | | 90.07 | 88.77 | 88.59 | ||||||||||||||||
Gross investment yield5 (%) | 5.30 | 5.24 | | increase of 0.06 percentage point | | 3.29 | 5.16 | 4.69 | ||||||||||||||||
5
Notes:
| 1. | Net profit refers to net profit attributable to equity holders of the Company, while equity holders’ equity refers to equity attributable to equity holders of the Company. |
| 2. | Investment assets = Cash and cash equivalents + Securities at fair value through profit or loss + Available-for-sale securities + Held-to-maturity securities + Term deposits + Derivative financial assets + Securities purchased under agreements to resell + Loans + Statutory deposits-restricted + Investment properties + Investments in associates and joint ventures |
| 3. | In calculating the percentage change of the “Earnings per share (basic and diluted)”, “Equity holders’ equity per share”, “Ordinary share holders’ equity per share” and “Net cash inflow/(outflow) from operating activities per share”, the tail differences of the basic figures have been taken into account. |
| 4. | Gearing ratio = Total liabilities/Total assets |
| 5. | Gross investment yield = (Gross investment income – Interest paid for securities sold under agreements to repurchase)/((Investment assets at the end of the previous year – Securities sold under agreements to repurchase at the end of the previous year – Derivative financial liabilities at the end of the previous year + Investment assets at the end of the period – Securities sold under agreements to repurchase at the end of the period – Derivative financial liabilities at the end of the period)/2) |
6
| II. | Major Items of the Consolidated Financial Statements and the Reasons for Change |
| RMB million | ||||||||||||||
| As at | As at | |||||||||||||
Major Items of the Consolidated Statement | 31 December | 31 December | ||||||||||||
of Financial Position | 2020 | 2019 | Change | Main Reasons for Change | ||||||||||
Term deposits | 545,667 | 535,260 | 1.9 | % | — | |||||||||
Held-to-maturity securities | 1,189,369 | 928,751 | 28.1 | % | An increase in the allocation of government bonds | |||||||||
Available-for-sale securities | 1,215,603 | 1,058,957 | 14.8 | % | An increase in the allocation of available-for- sale securities | |||||||||
Securities at fair value through profit or loss | 161,570 | 141,608 | 14.1 | % | An increase in the scale of debt-type assets in securities at fair value through profit or loss | |||||||||
Securities purchased under agreements to resell | 7,947 | 4,467 | 77.9 | % | The needs for liquidity management | |||||||||
Cash and cash equivalents | 56,629 | 53,306 | 6.2 | % | The needs for liquidity management | |||||||||
Loans | 658,535 | 608,920 | 8.1 | % | An increase in policy loans and certificates of deposit | |||||||||
Investment properties | 14,217 | 12,141 | 17.1 | % | New investments in investment properties | |||||||||
Investments in associates and joint ventures | 239,584 | 222,983 | 7.4 | % | An increase in investments in associates and joint ventures | |||||||||
Deferred tax assets | 87 | 128 | -32.0 | % | Affected by an increase in fair value of available-for-sale securities | |||||||||
Insurance contracts | 2,973,225 | 2,552,736 | 16.5 | % | The accumulation of insurance liabilities from new policies and renewals | |||||||||
Investment contracts | 288,212 | 267,804 | 7.6 | % | An increase in the scale of universal insurance accounts | |||||||||
7
| Major Items of the | As at | As at | ||||||||||||
| Consolidated Statement | 31 December | 31 December | ||||||||||||
of Financial Position | 2020 | 2019 | Change | Main Reasons for Change | ||||||||||
Securities sold under agreements to repurchase | 122,249 | 118,088 | 3.5 | % | The needs for liquidity management | |||||||||
Annuity and other insurance balances payable | 55,031 | 51,019 | 7.9 | % | An increase in maturities payable | |||||||||
Interest-bearing loans and other borrowingsNote | 19,556 | 20,045 | -2.4 | % | — | |||||||||
Deferred tax liabilities | 15,286 | 10,330 | 48.0 | % | Affected by an increase in fair value of available-for-sale securities | |||||||||
Equity holders’ equity | 450,051 | 403,764 | 11.5 | % | Due to the combined impact of total comprehensive income and profit distribution during the Reporting Period | |||||||||
| Note: | Interest-bearing loans and other borrowings include a three-year bank loan of EUR330 million with a maturity date on 8 September 2023, a five-year bank loan of GBP275 million with a maturity date on 25 June 2024, a five- year bank loan of USD860 million with a maturity date on 16 September 2024, a six-month bank loan of EUR127 million with a maturity date on 13 January 2021 which is automatically renewed upon maturity pursuant to the terms of the agreement, a six-month bank loan of EUR78 million with a maturity date on 4 January 2021 which is automatically renewed upon maturity pursuant to the terms of the agreement. All the above are fixed rate loans. Interest-bearing loans and other borrowings also include a five-year bank loan of USD970 million with a maturity date on 27 September 2024, and an eighteen-month bank loan of EUR110 million with a maturity date on 9 March 2022, both of which are floating rate loans. |
8
| For the year ended 31 December | RMB million | |||||||||||||
| Major Items of the | ||||||||||||||
| Consolidated Statement | ||||||||||||||
of Comprehensive Income | 2020 | 2019 | Change | Main Reasons for Change | ||||||||||
Net premiums earned | 604,666 | 560,278 | 7.9 | % | — | |||||||||
Life insurance business | 479,600 | 445,719 | 7.6 | % | Due to the steady growth of life insurance business | |||||||||
Health insurance business | 109,091 | 99,575 | 9.6 | % | The Company greatly developed health insurance business | |||||||||
Accident insurance business | 15,975 | 14,984 | 6.6 | % | Due to the growth of accident insurance business | |||||||||
Investment income | 154,497 | 139,919 | 10.4 | % | An increase in interest income from debt-type investments and dividends from stocks | |||||||||
Net realised gains on financial assets | 14,583 | 1,831 | 696.5 | % | An increase in spread income of equity assets in available-for-sale securities | |||||||||
Net fair value gains through profit or loss | 21,900 | 19,251 | 13.8 | % | An increase in spread income of stocks in securities at fair value through profit or loss | |||||||||
Net gains on investments of associates and joint ventures | 7,666 | 8,011 | -4.3 | % | A decrease in the profits of certain associates | |||||||||
Other income | 9,315 | 8,195 | 13.7 | % | An increase in income of investment management service fees by subsidiaries | |||||||||
Insurance benefits and claims expenses | 580,801 | 509,467 | 14.0 | % | An increase in the change of insurance contract liabilities | |||||||||
9
| Major Items of the | ||||||||||||||
| Consolidated Statement | ||||||||||||||
of Comprehensive Income | 2020 | 2019 | Change | Main Reasons for Change | ||||||||||
Investment contract benefits | 9,846 | 9,157 | 7.5 | % | An increase in the scale of universal insurance accounts | |||||||||
Policyholder dividends resulting from participation in profits | 28,279 | 22,375 | 26.4 | % | An increase in investment yield from the participating accounts | |||||||||
Underwriting and policy acquisition costs | 84,342 | 81,396 | 3.6 | % | Due to the Company’s business growth | |||||||||
Finance costs | 3,747 | 4,255 | -11.9 | % | A decrease in interest paid for securities sold under agreements to repurchase | |||||||||
Administrative expenses | 37,687 | 40,275 | -6.4 | % | Due to a decrease in expenses amid the COVID-19 pandemic and the reinforced cost administration by the Company | |||||||||
Income tax | 3,103 | 781 | 297.3 | % | Due to the impact from the adjustment of the policy on pre-tax deduction of underwriting and policy acquisition costs adopted in 2019 | |||||||||
Net profit attributable to equity holders of the Company | 50,268 | 58,287 | -13.8 | % | Due to the combined impact of the update of discount rate assumptions for reserves of traditional insurance contracts, the adjustment of the policy on pre-tax deduction of underwriting and policy acquisition costs adopted in 2019 and the change in gross investment income | |||||||||
10
MANAGEMENT DISCUSSION AND ANALYSIS
| I. | Review of Business Operations in 2020 |
In 2020, the unexpected outbreak of the COVID-19 pandemic posed great challenges to the development of the insurance industry. On the one hand, as the macro economy slowed down significantly, demands for insurance was difficult to be fully released; on the other hand, the onsite insurance operation activities were restricted, affecting both the business development and agent team-building. Under the combined influence of multiple factors, the growth of the life insurance industry for the year declined.
Despite a tough and complicated external environment, the Company pushed forward high-quality development, adhered to the strategic core of “Three Major Transformations, Dual Centers and Dual Focuses, Asset-liability Interaction”, and upheld the operational guideline of “prioritizing business value, strengthening sales force, achieving stable growth, upgrading technology, optimizing customer services and guarding against risks”. The Company proceeded well with both the pandemic control and the reform and development, and realized a steady and sound growth of its key performance indicators, such as embedded value and premium income. During the Reporting Period, the Company achieved the coordinated growth of business scale and value, pushed forward the asset-liability interaction, accelerated the implementation of technological achievements, improved both the quality and efficiency of operations and services, and achieved remarkable results for the Company’s high-quality development.
Meanwhile, the Company firmly implemented the “China Life Revitalization” initiative, and pushed forward reforms under the “Dingxin Project”. In 2020, while continuing to optimize its organizational structure, the Company kicked off a series of transformation programs in all aspects, and further advanced the gradual implementation of new business models and operation mechanisms. The customer-centric sales deployment of “Yi Ti Duo Yuan” was implemented in greater depth. The value creation capability of the individual agent business sector was prominent with its focus on the individual customer market. The standardized and regulated management system for the basic operational units was also rolled out. The diversified business sector targeted institutional customers and further defined its positioning so as to effectively improve its professional operation capability. The Company’s investment capability was improved significantly, and an investment management system which adapted to investment value chain and a market-oriented compensation incentive system were established. The Company reinforced the standardization of its business operation and services, and fully launched the establishment of the Shared Service Center. Its business operation became more intelligent and integrated, and customer satisfaction continued to rise. The Company optimized the technology development mode by implementing an IT product operation mechanism with emphasis on the pan-product development teams, and the supporting ability, responsiveness and stability of technologies saw great improvement. New technologies, such as mobile services and digital field offices, were also widely applied. The Company accelerated the intellectualization of its risk management, realized active risk detection and real-time monitoring in respect of risk prevention and control, which effectively improved the efficiency of risk management and control. By upholding the principle of “strong headquarters, streamlined provincial branches, optimized city branches and invigorated field offices”, the Company established a classified and hierarchical management system for its branches, upgrading and downgrading branches at different levels per their performances, and further increased allocation of financial resources to the basic operational units, which significantly energized their development.
11
Key Performance Indicators of 2020
| RMB million | ||||||||
| 2020 | 2019 | |||||||
Gross written premiums | 612,265 | 567,086 | ||||||
Premiums from new policies | 193,939 | 181,289 | ||||||
Including: First-year regular premiums | 115,421 | 109,416 | ||||||
First-year regular premiums with ten years or longer payment duration | 56,398 | 59,168 | ||||||
Renewal premiums | 418,326 | 385,797 | ||||||
Gross investment income | 198,596 | 169,043 | ||||||
Net profit attributable to equity holders of the Company | 50,268 | 58,287 | ||||||
Value of one year’s sales | 58,373 | 58,698 | ||||||
Including: Individual agent business sector1 | 57,669 | 56,972 | ||||||
Policy Persistency Rate (14 months)2 (%) | 85.70 | 86.80 | ||||||
Policy Persistency Rate (26 months)2 (%) | 82.40 | 85.90 | ||||||
Surrender Rate3 (%) | 1.09 | 1.89 | ||||||
| As at 31 December 2020 | As at 31 December 2019 | |||||||
Embedded value | 1,072,140 | 942,087 | ||||||
Number of long-term in-force policies (hundred million) | 3.17 | 3.03 | ||||||
|
|
|
| |||||
Notes:
| 1. | The results of individual agent business sector for the year 2019 have been restated to allow for new sector definitions on a pro forma basis. |
| 2. | The Persistency Rate for long-term individual life insurance policy is an important operating performance indicator for life insurance companies. It measures the ratio of in-force policies in a pool of policies after a certain period of time. It refers to the proportion of policies that are still effective during the designated month in the pool of policies whose issue date was 14 or 26 months ago. |
| 3. | Surrender Rate = Surrender payment/(Liability of long-term insurance contracts at the beginning of the period + Premiums of long-term insurance contracts) |
12
During the Reporting Period, despite the impact of the pandemic, the Company demonstrated development resilience with key business indicators reaching their record high. In 2020, the Company’s gross written premiums amounted to RMB612,265 million, exceeding RMB600 billion for the first time, an increase of 8.0% year on year, maintaining its industry leadership position. As at the end of the Reporting Period, the embedded value of the Company exceeded RMB1 trillion, reaching RMB1,072,140 million, an increase of 13.8% from the end of 2019.
During the Reporting Period, the Company continued to prioritize business value, and its business structure was further optimized. Premiums from new policies amounted to RMB193,939 million, an increase of 7.0% year on year. In particular, first-year regular premiums amounted to RMB115,421 million (a year-on-year increase of 5.5%), which accounted for 97.96% of long-term first-year premiums. The percentage of premiums from designated protection-oriented products in the first-year regular premiums rose by 0.6 percentage point year on year, with a continuous increase in the average premiums per policy. Renewal premiums amounted to RMB418,326 million (a year- on-year increase of 8.4%), which accounted for 68.32% of the gross written premiums (a year- on-year increase of 0.29 percentage point). Facing a complicated external environment in 2020, first-year regular premiums with a payment duration of ten years or longer reached RMB56,398 million, a decrease of 4.7% year on year. In 2020, the value of one year’s sales of the Company was RMB58,373 million, a decrease of 0.6% year on year, basically remaining stable. As for the end of the Reporting Period, the number of long-term in-force policies was 317 million, an increase of 4.6% from the end of 2019. During the Reporting Period, the surrender rate was 1.09%, a decrease of 0.80 percentage point year on year.
During the Reporting Period, the Company continued to enhance the asset-liability management and the asset-liability interaction created synergy on two ends. With enhanced emphasis on asset-liability management, the Company strengthened its asset-liability matching, established a management system with clear rights and responsibilities as well as orderly operation, and improved relevant systems and processes. To fully implement the asset-liability management philosophy, the Company effectively coordinated various processes, including business planning, operations and services, product development and investment management. In 2020, the Company adhered to the market-oriented approach, achieved significant improvement in its asset allocation capability and realized a stable increase in its investment income. The gross investment income reached RMB198,596 million, an increase of 17.5% year on year. Due to the combined impact of the update of discount rate assumptions for reserves of traditional insurance contracts, the adjustment of the policy on pre-tax deduction of underwriting and policy acquisition costs adopted in 2019 and the change in gross investment income, net profit attributable to equity holders of the Company was RMB50,268 million, a decrease of 13.8% year on year.
13
| II. | Business Analysis |
| (I) | Insurance Business |
| 1. | Gross written premiums categorized by business |
| For the year ended 31 December | RMB million | |||||||||||
| 2020 | 2019 | Change | ||||||||||
Life Insurance Business | 480,593 | 446,562 | 7.6 | % | ||||||||
First-year business | 108,205 | 100,674 | 7.5 | % | ||||||||
First-year regular | 106,001 | 98,342 | 7.8 | % | ||||||||
Single | 2,204 | 2,332 | -5.5 | % | ||||||||
Renewal business | 372,388 | 345,888 | 7.7 | % | ||||||||
Health Insurance Business | 115,089 | 105,581 | 9.0 | % | ||||||||
First-year business | 69,722 | 66,213 | 5.3 | % | ||||||||
First-year regular | 9,408 | 11,000 | -14.5 | % | ||||||||
Single | 60,314 | 55,213 | 9.2 | % | ||||||||
Renewal business | 45,367 | 39,368 | 15.2 | % | ||||||||
Accident Insurance Business | 16,583 | 14,943 | 11.0 | % | ||||||||
First-year business | 16,012 | 14,402 | 11.2 | % | ||||||||
First-year regular | 12 | 74 | -83.8 | % | ||||||||
Single | 16,000 | 14,328 | 11.7 | % | ||||||||
Renewal business | 571 | 541 | 5.5 | % | ||||||||
|
|
|
|
|
| |||||||
Total | 612,265 | 567,086 | 8.0 | % | ||||||||
|
|
|
|
|
| |||||||
Note: Single premiums in the above table include premiums from short-term insurance business.
During the Reporting Period, gross written premiums from the life insurance business of the Company amounted to RMB480,593 million, rising by 7.6% year on year; gross written premiums from the health insurance business reached RMB115,089 million, rising by 9.0% year on year, and gross written premiums from accident insurance business were RMB16,583 million, rising by 11.0% year on year.
14
| 2. | Gross written premiums categorized by channel |
| For the year ended 31 December | RMB million | |||||||
| 2020 | 20191 | |||||||
Individual Agent Business Sector2 | 511,044 | 484,517 | ||||||
First-year business of long-term insurance | 99,838 | 96,237 | ||||||
First-year regular | 99,555 | 95,957 | ||||||
Single | 283 | 280 | ||||||
Renewal business | 391,272 | 371,140 | ||||||
Short-term insurance business | 19,934 | 17,140 | ||||||
Bancassurance Channel | 41,240 | 25,438 | ||||||
First-year business of long-term insurance | 15,757 | 12,516 | ||||||
First-year regular | 15,748 | 12,488 | ||||||
Single | 9 | 28 | ||||||
Renewal business | 25,109 | 12,516 | ||||||
Short-term insurance business | 374 | 406 | ||||||
Group Insurance Channel | 28,872 | 28,846 | ||||||
First-year business of long-term insurance | 2,040 | 3,018 | ||||||
First-year regular | 110 | 968 | ||||||
Single | 1,930 | 2,050 | ||||||
Renewal business | 1,862 | 1,995 | ||||||
Short-term insurance business | 24,970 | 23,833 | ||||||
Other Channels3 | 31,109 | 28,285 | ||||||
First-year business of long-term insurance | 188 | 3 | ||||||
First-year regular | 8 | 3 | ||||||
Single | 180 | — | ||||||
Renewal business | 83 | 146 | ||||||
Short-term insurance business | 30,838 | 28,136 | ||||||
|
|
|
| |||||
| Total | 612,265 | 567,086 | ||||||
|
|
|
| |||||
Notes:
| 1. | According to the sales deployment of “Yi Ti Duo Yuan”, data for the year 2019 were adjusted on a pro forma basis. |
| 2. | Premiums of individual agent business sector included premiums of the general sales team and the upsales team. |
| 3. | Premiums of other channels mainly included premiums of government-sponsored health insurance business and online sales, etc. |
15
In 2020, the Company continued to push forward the customer-centric sales deployment of “Yi Ti Duo Yuan”. The individual agent business sector focused on the individual customer market and the capability in value creation was prominent. The diversified business sector targeted institutional customers and its business positioning was clearly defined, which saw effective improvement in its professional operation capability. With emphasis on business development driven by productive sales force, the structure of its sales force was further optimized. As at the end of the Reporting Period, the Company’s total sales force was approximately 1.458 million, maintaining the leading position in the industry.
Individual Agent Business Sector
In 2020, facing the severe impact of the pandemic on the economic and social development as well as the insurance industry, the individual agent business sector adhered to the priority of business value, pushed forward transformation and upgrade of its sales management, continued to optimize its business structure, and realized continuous growth in both business scale and value against unfavourable market conditions. During the Reporting Period, the gross written premiums from the sector amounted to RMB511,044 million, an increase of 5.5% year on year. First-year regular premiums were RMB99,555 million, an increase of 3.7% year on year. The designated protection-oriented business continued to grow, with its first-year regular premiums and the average premiums per policy rising significantly year on year. As affected by the pandemic, first-year regular premiums with a payment duration of ten years or longer in the sector were RMB56,183 million, a decrease of 2.2% year on year. Renewal premiums amounted to RMB391,272 million, an increase of 5.4% year on year. The capability of the individual agent business sector in value creation was prominent. The value of one year’s sales of the sector was RMB57,669 million, an increase of 1.2% year on year. New business margin of one year’s sales of the sector was 47.9%, which remained stable compared to 2019.
In 2020, the individual agent business sector firmly implemented the strategy of business development driven by productive sales force, and fully upgraded the Agent Management and Compensation System in line with the deployment of “Dingxin Project” to enhance the quality of the sales force. Despite certain fluctuation in the size of the sales force due to the impact of the pandemic, the Company firmly adhered to high-quality development by further tightening the agent recruitment, strengthening sales force management and optimizing the structure of the sales force. As at the end of the Reporting Period, the number of agents of the sector was 1,378,000, including 841,000 agents from the general agent team and 537,000 agents from the upsales team, and the monthly average productive agents increased by 9.7% year on year.
16
Diversified Business Sector
In 2020, the transformation and upgrade under “Dingxin Project” was carried out in the diversified business sector in great depth. By concentrating on the development philosophy of “professional operation, enhancement of quality and efficiency, transformation and innovation, and regulatory compliance”, the diversified business sector coordinated well with the individual agent business sector, and focused on the development of bancassurance, group insurance and health insurance business. Although business development was generally affected by the pandemic, the diversified business sector consolidated its advantages, and demonstrated an upward trend in business development. During the Reporting Period, gross written premiums from the sector amounted to RMB101,221 million, an increase of 22.6% year on year.
Bancassurance Channel. With equal emphasis on business scale and value as its long- term goal, the bancassurance channel focused on bank agency business and steadily pushed forward the business transformation. During the Reporting Period, gross written premiums from the channel amounted to RMB41,240 million, an increase of 62.1% year on year. First-year regular premiums amounted to RMB15,748 million, an increase of 26.1% year on year. Renewal premiums amounted to RMB25,109 million (a year-on- year increase of 100.6%), accounting for 60.89% of the gross written premiums from the channel (a year-on-year increase of 11.69 percentage points). The bancassurance channel constantly strengthened sales team management, and the quality of the sales force was improved steadily. As at the end of the Reporting Period, the number of bancassurance channel account managers was 29,000, and both the quarterly average active managers and the production capacity per manager increased substantially.
Group Insurance Channel. The group insurance channel continued to deepen its diversified business development and improve profitability, reinforced the expansion of key business sectors, and achieved steady development in different business fields. During the Reporting Period, gross written premiums from the channel were RMB28,872 million, an increase of 0.1% year on year. Short-term insurance premiums were RMB24,970 million, an increase of 4.8% year on year. As at the end of the Reporting Period, the number of direct sales representatives was 51,000, and the number of high- performance personnel increased by 33.3% from the end of 2019.
17
Other Channels. In 2020, gross written premiums from other channels reached RMB31,109 million, an increase of 10.0% year on year. The Company actively participated in all kinds of government-sponsored health insurance businesses, which maintained the leading market position. As at the end of the Reporting Period, the Company carried out over 220 supplementary major medical expenses insurance programs, providing services to 360 million people. It also undertook over 300 health care entrusted programs, covering 170 million people, provided supplementary medical insurance to 54 million people, and offered long-term care insurance protection to 15 million people.
The Company pushed forward its online insurance business, consistently increased the supply of online insurance products, enhanced its online insurance operations and promoted integration of online and offline sales to provide a more diversified and convenient channel for customers seeking insurance products and services. In 2020, the Company’s online insurance business saw greater development opportunities, which resulted in a rapid growth of its development.
Being customer-centric, the Company fully leveraged the collaborative advantages of the fellow members of China Life Insurance (Group) Company (“CLIC”) and actively provided customers with a series of quality financial and insurance service solutions. In 2020, premiums from property insurance cross-sold by the Company exceeded RMB20 billion for the first time, an increase of 14.0% year on year, whereas new bids of enterprise annuity funds and pension security products of China Life Pension Company Limited cross-sold by the Company grew by 20.7% year on year. The Company entrusted China Guangfa Bank Co. Ltd. (“CGB”) to sell bancassurance products, with first-year regular premiums increasing by 29.0% year on year. The number of new debit cards and credit cards jointly issued by the Company and CGB exceeded 1,150,000. Meanwhile, the Company gave full play to the brand advantages on the comprehensive financial strength, and worked with CGB and China Life Property and Casualty Insurance Company Limited (“CLP&C”) to carry out various operation activities to provide customers with diversified and individualized services, thus fostering a sound synergy and mutual benefits.
18
| 3. | Analysis of major insurance products |
| (1) | Top five insurance products in terms of gross written premiums |
| For the year ended 31 December 2020 | RMB million |
Insurance product | Gross written premium | Standard premiums from new policies1 | Major sales channel | Surrender payment | ||||||||||
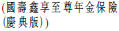
China Life Xin Xiang Zhi Zun Annuity Insurance | 42,657 | 12,813 | Mainly through the channel of exclusive individual agents | 170 | ||||||||||
(Celebration Version)
| ||||||||||||||
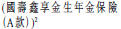
China Life Xin Xiang Jin Sheng
| 34,828 | — | Mainly through the channel of exclusive individual agents | 506 | ||||||||||
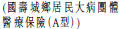
China Life Critical Illness Group | 26,955 | 26,955 | Through other sales channels | — | ||||||||||
Health Insurance for Rural and | ||||||||||||||
Urban Citizens (Type A)
| ||||||||||||||
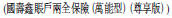
China Life Xin Fu Ying Jia
| 24,116 | — | Mainly through the channel of exclusive individual agents | 779 | ||||||||||
China Life Hong Fu Zhi | 20,271 | — | Mainly through the channel of exclusive individual agents | 745 | ||||||||||
(Participating Insurance)
| ||||||||||||||


Notes:
| 1. | Standard premiums were calculated in accordance with the calculation methods set forth in the “Notice on Establishing the Industry Standard of Standard Premiums in the Life Insurance Industry” (Bao Jian Fa [2004] No. 102) and the “Supplementary Notice of the ‘Notice on Establishing the Industry Standard of Standard Premiums in the Life Insurance Industry’” (Bao Jian Fa [2005] No. 25) of the former China Insurance Regulatory Commission. |
| 2. | China Life Xin Xiang Jin Sheng Annuity Insurance (Type A), China Life Xin Fu Ying Jia Annuity Insurance and China Life Hong Fu Zhi Zun Annuity Insurance (Participating Insurance) have been replaced by their upgraded products, and the gross written premiums were recorded as renewal premiums. |
19
| (2) | Top three insurance products in terms of net increase in investment contracts |
| For the year ended 31 December 2020 | RMB million | |||||
| Net increase | ||||||||||||
| in investment | Surrender | |||||||||||
Insurance product | contracts | Major sales channel | payment | |||||||||
China Life Xin Account Endowment Insurance | 11,630 | Mainly through the channel of | 121 | |||||||||
(Universal Insurance) (Exclusive Version) | exclusive individual agents | |||||||||||
| ||||||||||||
China Life Xin Account Endowment Insurance | 7,883 | Mainly through the channel of | 261 | |||||||||
(Universal Insurance) (Diamond Version) | exclusive individual agents | |||||||||||
| ||||||||||||
China Life Xin Account Annuity Insurance | 3,406 | Mainly through the channel of | 291 | |||||||||
(Universal Insurance) (Excellent Version) | exclusive individual agents | |||||||||||
| ||||||||||||

| 4. | Insurance contracts |
RMB million | ||||||
| As at 31 December 2020 | As at 31 December 2019 | Change | ||||||||||
Life insurance | 2,767,642 | 2,385,407 | 16.0 | % | ||||||||
Health insurance | 195,487 | 158,800 | 23.1 | % | ||||||||
Accident insurance | 10,096 | 8,529 | 18.4 | % | ||||||||
|
|
|
|
|
| |||||||
Total of insurance contracts | 2,973,225 | 2,552,736 | 16.5 | % | ||||||||
|
|
|
|
|
| |||||||
Including: residual margin Note | 837,293 | 768,280 | 9.0 | % | ||||||||
| Note: | The residual margin is a component of insurance contract reserve, which results in no Day 1 gain at the initial recognition of an insurance contract. The residual margin is set to zero if it is negative. The growth of residual margin arises mainly from new business. |
As at the end of the Reporting Period, the reserves of insurance contracts of the Company were RMB2,973,225 million, 16.5% up from RMB2,552,736 million as at the end of 2019, which was primarily due to the accumulation of insurance liabilities from new policies and renewal business. As at the date of the statement of financial position, the reserves of various insurance contracts of the Company passed the liability adequacy test.
20
| 5. | Analysis of claims and policyholder benefits |
| For the year ended 31 December | RMB million |
| 2020 | 2019 | Change | ||||||||||
Insurance benefits and claims expenses | 580,801 | 509,467 | 14.0 | % | ||||||||
Life insurance business | 490,994 | 427,673 | 14.8 | % | ||||||||
Health insurance business | 82,146 | 75,471 | 8.8 | % | ||||||||
Accident insurance business | 7,661 | 6,323 | 21.2 | % | ||||||||
Investment contract benefits | 9,846 | 9,157 | 7.5 | % | ||||||||
Policyholder dividends resulting from participation in profits | 28,279 | 22,375 | 26.4 | % | ||||||||
|
|
|
|
|
| |||||||
During the Reporting Period, insurance benefits and claims expenses rose by 14.0% year on year due to an increase in the change of insurance contract liabilities. In particular, life insurance business rose by 14.8% year on year mainly due to the steady growth of the life insurance business. Investment contract benefits rose by 7.5% year on year due to an increase in the scale of universal insurance accounts. Policyholder dividends resulting from participation in profits increased by 26.4% year on year due to an increase in investment yield from participating accounts.
| 6. | Analysis of underwriting and policy acquisition costs and other expenses |
| For the year ended 31 December | RMB million |
| 2020 | 2019 | Change | ||||||||||
Underwriting and policy acquisition costs | 84,342 | 81,396 | 3.6 | % | ||||||||
Finance costs | 3,747 | 4,255 | -11.9 | % | ||||||||
Administrative expenses | 37,687 | 40,275 | -6.4 | % | ||||||||
Other expenses | 12,208 | 9,602 | 27.1 | % | ||||||||
Statutory insurance fund contribution | 1,229 | 1,163 | 5.7 | % | ||||||||
|
|
|
|
|
| |||||||
During the Reporting Period, underwriting and policy acquisition costs rose by 3.6% year on year due to the Company’s business growth. Finance costs decreased by 11.9% year on year due to a decrease of interest paid for securities sold under agreements to repurchase. Administrative expenses decreased by 6.4% year on year due to a decrease in expenses amid the COVID-19 pandemic and the reinforced cost administration by the Company.
21
| (II) | Investment Business |
In 2020, the global economy was severely impacted by the COVID-19 pandemic, which then started to recover as governments around the world introduced macro hedging policies. By effectively coordinating the pandemic prevention and control and the economic and social development, and accelerating the formation of a new development pattern of “dual circulation”, China’s economy was the first to pick up and continued to recover from the impact of the pandemic, and China was the world’s only major economy to achieve growth in 2020. Throughout the year, the interest rate of the domestic bond market fluctuated greatly, which rebounded significantly after falling to a historical low level in early April and went higher than the level at the beginning of 2020; at the same time, the stock market also fluctuated upward after falling to the lowest level of the whole year at the end of March with an obvious structural market characteristics.
The Company actively responded to the complex and ever-changing investment environment, adhered to the fundamental principle of asset-liability interaction management, firmly implemented its strategic allocation plan for assets with medium- and long-terms, and made flexible tactical allocation based on market situations. In 2020, the Company mainly allocated to three major asset types. Firstly, in respect of the liability-matching portfolios, the Company effectively seized the opportunity of interest rate recovery and a supply increase in the second half of 2020, and increased allocation mainly in government bonds with long duration to further lengthen the duration of assets and narrow the duration gap between assets and liabilities; secondly, in respect of non-standard fixed income assets and quasi-fixed income assets with stable cash flows and higher interest income, to which the Company insisted on allocating as much as possible on the premise of controlling credit risks by proactively dealing with the situation of the decreasing financing demands and intensified market competitions; thirdly, in respect of equity assets with potential elastic return in the future, the Company continued to increase its allocation to core assets under the structural market environment, and optimized the tactical investment of equity assets to increase the yields from the asset portfolios.
22
In 2020, the Company reshaped its organizational structure according to investment value chain and established a market-oriented incentive and restraint mechanism, which resulted in a significant improvement of its coordinated management capability in asset allocation. In respect of entrusted management, the Company introduced a competitive mechanism that compared entrusted asset managers within and outside China Life, eliminating bad performers through strict assessment. The constant optimization of investment management system was expected to have long-term and far-reaching effects on the Company’s insurance fund investment.
| 1. | Investment portfolios |
As at the end of the Reporting Period, our investment assets categorized by investment object are set out as below:
| RMB million | ||||||||||||||||
| As at 31 December 2020 | As at 31 December 2019 | |||||||||||||||
| Investment category | Amount | Percentage | Amount | Percentage | ||||||||||||
Fixed-maturity financial assets | 3,076,329 | 75.12 | % | 2,674,261 | 74.85 | % | ||||||||||
Term deposits | 545,667 | 13.32 | % | 535,260 | 14.98 | % | ||||||||||
Bonds | 1,718,639 | 41.97 | % | 1,410,564 | 39.48 | % | ||||||||||
Debt-type financial products1 | 453,641 | 11.08 | % | 415,024 | 11.62 | % | ||||||||||
Other fixed-maturity investments2 | 358,382 | 8.75 | % | 313,413 | 8.77 | % | ||||||||||
Equity financial assets | 700,748 | 17.10 | % | 605,996 | 16.95 | % | ||||||||||
Common stocks | 350,107 | 8.55 | % | 276,604 | 7.74 | % | ||||||||||
Funds3 | 114,311 | 2.79 | % | 118,450 | 3.31 | % | ||||||||||
Bank wealth management products | 13,013 | 0.32 | % | 32,640 | 0.91 | % | ||||||||||
Other equity investments4 | 223,317 | 5.44 | % | 178,302 | 4.99 | % | ||||||||||
Investment properties | 14,217 | 0.35 | % | 12,141 | 0.34 | % | ||||||||||
Cash and others5 | 64,576 | 1.58 | % | 57,773 | 1.62 | % | ||||||||||
Investments in associates and joint ventures | 239,584 | 5.85 | % | 222,983 | 6.24 | % | ||||||||||
|
|
|
|
|
|
|
| |||||||||
Total | 4,095,454 | 100.00 | % | 3,573,154 | 100.00 | % | ||||||||||
|
|
|
|
|
|
|
| |||||||||
23
Notes:
| 1. | Debt-type financial products include debt investment schemes, equity investment plans, trust schemes, project asset-backed plans, credit asset-backed securities, specialized asset management plans, and asset management products, etc. |
| 2. | Other fixed-maturity investments include policy loans, statutory deposits-restricted, and interbank certificates of deposits, etc. |
| 3. | Funds include equity funds, bond funds and money market funds, etc. In particular, the balances of money market funds as at 31 December 2020 and 31 December 2019 were RMB1,206 million and RMB1,829 million, respectively. |
| 4. | Other equity investments include private equity funds, unlisted equities, preference shares, and equity investment plans, etc. |
| 5. | Cash and others include cash, cash at banks, short-term deposits and securities purchased under agreements to resell, etc. |
As at the end of the Reporting Period, the Company’s investment assets reached RMB4,095,454 million, an increase of 14.6% from the end of 2019. Among the major types of investments, the percentage of investment in bonds rose to 41.97% from 39.48% as at the end of 2019, the percentage of term deposits changed to 13.32% from 14.98% as at the end of 2019, the percentage of investment in debt-type financial products changed to 11.08% from 11.62% as at the end of 2019, and the percentage of investment in stocks and funds (excluding money market funds) rose to 11.31% from 11.00% as at the end of 2019.
24
| 2. | Investment income |
| For the year ended 31 December | RMB million | |||||||
| 2020 | 2019 | |||||||
Gross investment income | 198,596 | 169,043 | ||||||
Net investment income | 162,783 | 149,109 | ||||||
Net income from fixed-maturity investments | 127,673 | 116,254 | ||||||
Net income from equity investments | 24,983 | 22,804 | ||||||
Net income from investment properties | (50 | ) | 31 | |||||
Investment income from cash and others | 1,841 | 861 | ||||||
Share of profit of associates and joint ventures | 8,336 | 9,159 | ||||||
Net realised gains on financial assets | 14,583 | 1,831 | ||||||
Net fair value gains through profit or loss | 21,900 | 19,251 | ||||||
Disposal gains and impairment loss of associatesand joint ventures | (670 | ) | (1,148 | ) | ||||
| Net investment yield1 | 4.34 | % | 4.61 | % | ||||
| Gross investment yield2 | 5.30 | % | 5.24 | % | ||||
|
|
|
| |||||
Notes:
| 1. | Net investment yield = (Net investment income – Interest paid for securities sold under agreements to repurchase)/((Investment assets at the end of the previous year – Securities sold under agreements to repurchase at the end of the previous year + Investment assets at the end of the period – Securities sold under agreements to repurchase at the end of the period)/2) |
| 2. | Gross investment yield = (Gross investment income – Interest paid for securities sold under agreements to repurchase)/((Investment assets at the end of the previous year – Securities sold under agreements to repurchase at the end of the previous year – Derivative financial liabilities at the end of the previous year + Investment assets at the end of the period – Securities sold under agreements to repurchase at the end of the period – Derivative financial liabilities at the end of the period)/2) |
25
During the Reporting Period, the Company’s net investment income was RMB162,783 million, an increase of RMB13,674 million from 2019, rising by 9.2% year on year. Due to the impact of an overall decline in interest rate during 2020 as well as the maturity of the existing investment assets, the net investment yield was 4.34%, down by 27 base points from 2019. By closely keeping pace with equity market fluctuations and paying constant attention to risk exposures, the Company timely cashed-in spread income, continued to optimize its position structure, and achieved stable investment income. The gross investment income of the Company reached RMB198,596 million, an increase of RMB29,553 million from 2019. The gross investment yield was 5.30%, up by 6 base points from 2019. The comprehensive investment yield1 taking into account the current net fair value changes of available-for-sale securities recognized in other comprehensive income was 6.33%, down by 95 base points from 2019.
| 3. | Credit risk management |
The Company’s debt-type financial products mainly concentrated on the sectors such as transportation, finance, public utilities and energy, and the financing entities were primarily large central-owned enterprises and state-owned enterprises. As at the end of the Reporting Period, over 99% of the debt-type financial products were rated AAA or above by external rating institutions. In general, the quality of the Company’s debt-type financial assets was in good condition and the credit risks were well controlled.
The Company insisted on the prudent investment philosophy and carried out comprehensive risk management to prevent various investment risks. Based on a disciplined and scientific internal rating system and a multi-dimensional management mechanism of risk limits, the Company scrutinized credit profiles of targets and risk exposure concentration before investment in a prudent manner and carried out ongoing tracking after investment, effectively controlling credit risks through early detection, early warning and early disposal. Under a market environment where credit default events occurred frequently, no credit default event occurred for the Company in 2020.
| 1 | Comprehensive investment yield = (Gross investment income – Interest paid for securities sold under agreements to repurchase + Current net fair value changes of available-for-sale securities recognised in other comprehensive income)/ ((Investment assets at the end of the previous year – Securities sold under agreements to repurchase at the end of the previous year – Derivative financial liabilities at the end of the previous year + Investment assets at the end of the period – Securities sold under agreements to repurchase at the end of the period – Derivative financial liabilities at the end of the period)/2) |
26
| 4. | Major investments |
During the Reporting Period, there was no material equity investment or non-equity investment of the Company that is subject to disclosure requirements.
| III. | Analysis of Specific Items |
| (I) | Profit before Income Tax |
| For the year ended 31 December | RMB million | |||||||||||
| 2020 | 2019 | Change | ||||||||||
Profit before income tax | 54,488 | 59,795 | -8.9 | % | ||||||||
Life insurance business | 28,073 | 42,418 | -33.8 | % | ||||||||
Health insurance business | 11,611 | 5,875 | 97.6 | % | ||||||||
Accident insurance business | 572 | 489 | 17.0 | % | ||||||||
Other businesses | 14,232 | 11,013 | 29.2 | % | ||||||||
|
|
|
|
|
| |||||||
During the Reporting Period, profit before income tax from the life insurance business decreased by 33.8% year on year due to the combined impact of the update of discount rate assumptions for reserves of traditional insurance contracts and the change in gross investment income. Profit before income tax from the health insurance business rose by 97.6% year on year mainly due to the growth of short-term health insurance business and business quality improvement. Profit before income tax from the accident insurance business rose by 17.0% year on year mainly due to the growth of the accident insurance business and business quality improvement. Profit before income tax from other businesses rose by 29.2% year on year mainly due to an increase in profits from subsidiaries.
27
| (II) | Analysis of Cash Flows |
| 1. | Liquidity sources |
The Company’s cash inflows mainly come from insurance premiums, income from non- insurance contracts, interest income, dividend and bonus, and proceeds from sale and maturity of investment assets. The primary liquidity risks with respect to these cash inflows are the risk of surrender by contract holders and policyholders, as well as the risks of default by debtors, interest rate fluctuations and other market volatilities. The Company closely monitors and manages these risks.
The Company’s cash and bank deposits can provide it with a source of liquidity to meet normal cash outflows. As at the end of the Reporting Period, the balance of cash and cash equivalents was RMB56,629 million. In addition, the vast majority of its term deposits in banks allow it to withdraw funds on deposits, subject to a penalty interest charge. As at the end of the Reporting Period, the amount of term deposits was RMB545,667 million.
The Company’s investment portfolio also provides it with a source of liquidity to meet unexpected cash outflows. It is also subject to market liquidity risk due to the large size of its investments in some of the markets in which it invests. In some circumstances, some of its holdings of investment securities may be large enough to have an influence on the market value. These factors may adversely affect its ability to sell these investments or sell them at a fair price.
| 2. | Liquidity uses |
The Company’s principal cash outflows primarily relate to the payables for the liabilities associated with its various life insurance, annuity, accident insurance and health insurance products, operating expenses, income taxes and dividends that may be declared and paid to its equity holders. Cash outflows arising from its insurance activities primarily relate to benefit payments under these insurance products, as well as payments for policy surrenders, withdrawals and policy loans.
The Company believes that its sources of liquidity are sufficient to meet its current cash requirements.
28
| 3. | Consolidated cash flows |
The Company has established a cash flow testing system, and conducts regular tests to monitor the cash inflows and outflows under various scenarios and adjusts the asset portfolio accordingly to ensure sufficient sources of liquidity.
| For the year ended 31 December | RMB million | |||||||
| 2020 | 2019 | Change | Main Reasons for Change | |||||||||||
Net cash inflow/(outflow) from operating activities | 304,024 | 286,032 | 6.3 | % | An increase in premiums due to the steady growth of the Company’s business | |||||||||
Net cash inflow/(outflow) from investing activities | (292,797 | ) | (247,515 | ) | 18.3 | % | The needs for investment management | |||||||
Net cash inflow/(outflow) from financing activities | (7,760 | ) | (36,075 | ) | -78.5 | % | The needs for liquidity management | |||||||
Foreign exchange gains/(losses) on cash and cash equivalents | (144 | ) | 55 | N/A | — | |||||||||
Net increase/(decrease) in cash and cash equivalents | 3,323 | 2,497 | 33.1 | % | — | |||||||||
29
| (III) | Solvency Ratio |
An insurance company shall have the capital commensurate with its risks and business scale. According to the nature and capacity of loss absorption by capital, the capital of an insurance company is classified into the core capital and the supplementary capital. The core solvency ratio is the ratio of core capital to minimum capital, which reflects the adequacy of the core capital of an insurance company. The comprehensive solvency ratio is the ratio of the sum of core capital and supplementary capital to minimum capital, which reflects the overall capital adequacy of an insurance company. The following table shows our solvency ratios as at the end of the Reporting Period:
| RMB million | ||||||||
| As at 31 December 2020 | As at 31 December 2019 | |||||||
Core capital | 1,031,947 | 952,030 | ||||||
Actual capital | 1,066,939 | 987,067 | ||||||
Minimum capital | 396,749 | 356,953 | ||||||
Core solvency ratio | 260.10 | % | 266.71 | % | ||||
Comprehensive solvency ratio | 268.92 | % | 276.53 | % | ||||
|
|
|
| |||||
| Note: | The China Risk Oriented Solvency System was formally implemented on 1 January 2016. This table is compiled according to the rules of the system. |
As at the end of the Reporting Period, the Company’s comprehensive solvency ratio decreased by 7.61 percentage points from the end of 2019, which was due to a consistent growth in insurance business and investment assets, dividends payment, a decline in solvency reserve assessment rate and redemption of other equity instruments.
| (IV) | Sale of Material Assets and Equity |
During the Reporting Period, there was no sale of material assets and equity of the Company.
30
| (V) | Major Subsidiaries and Associates of the Company |
| RMB million | ||||||||||||
| Company Name | Major Business Scope | Registered Capital | Shareholding | Total Assets | Net Assets | Net Profit | ||||||||||||||||
China Life Asset Management Company Limited | Management and utilization of proprietary funds; acting as agent or trustee for asset management business; consulting business relevant to the above businesses; other asset management business permitted by applicable PRC laws and regulations | 4,000 | 60 | % | 13,897 | 12,237 | 2,133 | |||||||||||||||
China Life Pension Company Limited | Group pension insurance and annuity; individual pension insurance and annuity; short-term health insurance; accident insurance; reinsurance of the above insurance businesses; business for the use of insurance funds that are permitted by applicable PRC laws and regulations; pension insurance asset management product business; management of funds in RMB or foreign currency as entrusted by entrusting parties for the retirement benefit purpose; other businesses permitted by the China Banking and Insurance Regulatory Commission (the “CBIRC”) | 3,400 | | 70.74 is held by is held by | % | 6,789 | 4,931 | 817 | ||||||||||||||
China Life Property and Casualty Insurance Company Limited | Property loss insurance; liability insurance; credit insurance and bond insurance; short-term health insurance and accident insurance; reinsurance of the above insurance businesses; business for the use of insurance funds that are permitted by applicable PRC laws and regulations; other business permitted by the CBIRC | 18,800 | 40 | % | 106,930 | 26,551 | 1,730 | |||||||||||||||
China Guangfa Bank Co., Ltd. | Taking public deposits; granting short-term, mid-term and long-term loans; handling settlements in and out of China; honoring bills and offering discounting services; issuing financial bonds; issuing, paying for and underwriting government bonds as an agent; sales and purchases of negotiable securities such as government bonds and financial bonds; engaging in inter-bank borrowings; providing letters of credit service and guarantee; engaging in bank card business; acting as payment and receipt agent and insurance agent; providing safe deposit box services; taking deposits and granting loans in foreign currency; foreign currency remittance; foreign currency exchange; international settlements; foreign exchange settlements and sales; inter-bank foreign currency borrowings; honoring bills of exchange and offering discounting services in foreign currency; granting foreign currency loans; granting foreign currency guarantees; sales and purchases of negotiable securities other than shares in a foreign currency for itself and as an agent; issuing negotiable securities other than shares in a foreign currency for itself and as an agent; sales and purchases of foreign exchange on its own account and on behalf of its customers; issuing and making payments for foreign credit card as an agent; offshore financial operations; assets and credit verification, consultation and notarization businesses; other businesses approved by the CBIRC and other relevant authorities | 19,687 | 43.686 | % | 3,027,972 | 218,150 | 13,812 | |||||||||||||||
31
| IV. | Technology Empowerment and Operations and Services |
| (I) | Technology Empowerment |
In 2020, the Company pushed forward digital transformation in all aspects, accelerated technological innovation, proactively applied digital technologies to reinforce technology empowerment and support its high-quality development in various fields.
Great leap in capability, technological innovation at full speed
Technological deployment, demonstrating China Life’s strength. Centering on the strategic core of “Dual Centers and Dual Focuses” and optimizing technological governance and deployment, the Company implemented the tech products-based management system, accelerated the establishment of innovation incubation center and R&D sub-centers for technological application, and continued to improve the technology-empowered ability in value creation and the diversification of supply. Leveraging on the established advantages of its sales force and service network, the Company intensified online and offline integration with offline digital field offices and online digital platform, which enabled frequent interaction between the Company, its agents and customers under the “Technology-driven China Life” layout, and provided convenient, efficient and precise financial and insurance services to customers.
Technology as a driver, activating innovation vitality. The Company reinforced its technological innovation in terms of its four technological innovation-themed laboratories, namely InsurTech, cloud computing and infrastructures, cyber security and block chain. Nearly 50 research projects in cutting-edge technologies were further advanced, and 28 intelligent application scenarios covering various aspects were introduced. A flexible and nimble hybrid cloud with a powerful hash rate was innovated with great efforts, which fully supported the seamless shift of the Company’s operations and management from offline to online and effectively ensured continuity of the Company’s business operations during the pandemic.
Digital ecosystem, bringing out the synergy effect. With the continued expansion of an interconnecting, open and shared social ecosystem based on the digital platform, the Company released more than 1,700 standardized services and launched more than 740 innovative micro- applications. It also cooperated with different institutions such as medical and healthcare institutions, etc., to carry out nearly 170,000 services and activities, which consistently enriched the Company’s insurance-centered digital ecosystem services.
32
Empowerment upgrade, advancement of digital transformation in all aspects
Digital sales, creating new driving forces for development. The Company launched online agent recruitment, online agent training and online business development by employing digital technologies. The full-process online agent recruitment was quickly put into use; 155,000 AI online training sessions were carried out, with the number of participations reaching 11.10 million person-time; live video streaming of morning assemblies and cloud innovation meetings, etc., were held intensively, with a daily average number of 2,200 meetings during the pandemic; the “Golden Manual 2.0” was upgraded in all aspects to facilitate precise marketing with more powerful intelligent algorithm, so as to realize the overall empowerment of digital tools of the insurance sales value chain.
Digital field offices, creating new intelligent bases. Cutting-edge technologies such as 5G, “Internet of Things” and edge computing were widely applied in the Company’s 30,000 field offices across China (including branches and sales & services offices), and the newly equipped electronic facilities such as the self-service terminals for business processing, intelligent sensing equipment and visualized smart screen brought new vitality to field offices. Given the application of the automatic Internet access, digital coaching and training, multi-dimensional and visualized performance tracking, and AI real-time performance reporting, the field offices were established to be important digital supports for service extension.
Digital services, enhancing customers’ new experience. Being customer-centric, the Company pushed forward intelligent upgrade of online services. The “Contactless Services” facilitated customers accessing insurance services just at home by employing Internet video and intelligent identification technology. Based on big data and AI technologies, the intelligent claims settlement model for health insurance, covering 19 key risks in five categories, made claims settlement services more efficient and convenient, and the big data-based intelligent policy “health check” with the family of customers as the focus provided thoughtful suggestions for customers to make the best choices.
33
| (II) | Operations and Services |
In 2020, focusing on customer demands, the Company adhered to the operation and management objective of “strengthening efficiency, promoting technology driven development, achieving value improvements and offering first-class customer experience” and upheld the “convenient, quality and caring” service concept to push forward operations and services to be more Internet-based, intelligent, integrated and ecological and provide customers with high-quality services. In early 2020, the Company upgraded a variety of services to overcome severe challenges during the pandemic. The Company made a quick response to simplify claims settlement procedures, implemented remote claims settlement and remote investigation over video, and completed the payment of more than 1,000 coronavirus-related claims. It also introduced a new service mode, namely the “Online Customer Service Agent”, through which customers could easily connect to the online customer service agent with one click, and offered the special telephone voice navigation and 24/7 customer services so as to fully meet customers’ needs.
Product supply was enriched constantly. In 2020, the Company adhered to the product development concept of being “customer centric, market oriented and value focused”, strengthened asset-liability management and continued to intensify product development such as the protection-oriented products. High-quality development of the Company was properly supported through product innovation and upgrade. The Company currently had a product system catering to all types of customers, and created a variety of brand products in the market. In 2020, the Company newly developed and upgraded a total of 237 products, including 19 life insurance products, 198 health insurance products, 7 accident insurance products and 13 annuity insurance products. Out of these products, 216 were protection-oriented products and 21 were long-term savings products.
34
Online services were expanded with increased quality. The Company focused on usage habits of its customers and designed more online service applications available at the fingertips through the Internet. Service contents were enriched continuously to promote online and offline service coordination. The number of active users of China Life Insurance App increased by 48% year on year, paperless application rate of long-term individual insurance reached 99.9% and the promotion of paperless application rate of group insurance reached 97.9%, the online processing rate of policy administration and claims settlement for individual and group insurance rose by 20, 28 and 37 percentage points year on year respectively, and the number of electronic notification messages increased by 82.5% year on year.
Intelligent services were convenient and efficient. The Company further applied AI technologies in a variety of business processes to provide customers with efficient and precise services. The use of intelligent models for review and quality inspection in the process of insurance application helped increase efficiencies of underwriting and dual recordings by 40% and 25%, respectively, year on year. The Company also sped up application of intelligent technologies in its contacting services with intelligent online customer services and intelligent outbound-call services up by 158% year on year, and the volume of electronic follow-up calls for new policies reaching 92%. The application of intelligent models promoted the automated approval rates of underwriting and policy administration to be 92.7% and 99%, respectively.
Insurance policy services became more friendly. To meet customers’ needs, the Company provided “convenient and caring” services of premium quality in claims settlement with integrated internal and external resources. A network of over 20,000 medical institutions was established, providing direct claims payment services for customers of more than five million person-times in 2020. With the promotion of “Claims Settlement for Critical Illness within One Day”, the time required for making a claims payment was further shortened, and customers with critical illness could be paid soon after their diagnosis was confirmed. The scope of services and service efficiency were comprehensively improved as more service contact points were available for customers and self-service channels were enriched in terms of policy administration.
Deployment of ecological services was accelerated. The Company completed a framework for customer experience management, designed a route panorama for future customer services and established a customer experience improvement mechanism driven by customers’ needs to constantly optimize its business process. In 2020, the Company upgraded the online + offline scenario-based ecological service model, and the number of participants in the customer festival and the online visits of the “Little Painters of China Life” event increased by 20% and 300% year on year, respectively. 430 million recommendations of personalized service scenarios to customers were made, effectively extending the customer experience chain.
35
Constantly implementing the strategy of “Inclusive Healthcare” and “Integrated Aged- care”. The Company actively participated in the “Healthy China” program. By consolidating the resources of healthcare and medical services, the Company established a healthcare ecosystem covering full life cycles to constantly improve its health service capabilities, and promoted the construction of the online and offline platforms by enhancing cooperation with technology companies to explore the possible feasibility that insurance businesses were propelled by health services. As at the end of the Reporting Period, more than a hundred types of services were available on China Life Inclusive Healthcare Service Platform, and the accumulated number of its registered users led the industry. During the pandemic, the Company quickly established the “Healthcare Service Zone” especially for the prevention and control of the pandemic. In 2020, the Company created an innovative model for the cooperation between medical and insurance entities and promoted application of the integrated claims settlement model of “basic medical insurance + supplementary major medical expenses insurance + commercial insurance”. The Company continued to extend the deployment of China Life aged care, and invested in the construction of several large retirement communities in Suzhou, Hainan, Chengdu and other cities. The Company set up the China Life Integrated Aged Care Fund, steadily made investments by focusing on real assets such as continuing care retirement communities, medical care complexes in urban core areas and boutique aged care apartments, and deployed high-quality resources in the aged care industry such as rehabilitation, medical and care, hospital, health care big data and health industrial parks, so as to further meet the needs of customers in the strategic regions such as Beijing-Tianjin-Hebei, the Yangtze River Economic Belt and Guangdong-Hong Kong-Macao.
36
| V. | Future Prospect |
| (I) | Industry Landscape and Development Trends |
China is still in an important period of strategic opportunity for development at present and for the foreseeable future, and the foundation for long-term economic growth remains solid. With the full kick-off of the “14th Five-Year Plan”, a new development pattern of “dual circulation” is to be fostered, propelling sustained and healthy growth of China’s economy, which will provide a favourable external environment for the high-quality development of the insurance industry. Recently, insurance regulatory authorities issued a number of policies to strengthen long-term strong oversight of the industry, and put great efforts to address market disorders so as to maintain economic and financial security, laying a solid foundation for the healthy development of the industry. China has initiated the “Healthy China” program to actively cope with the aging population, and healthcare and aged-care sectors will become the important growth drivers for life insurance industry in the next stage of development. The insurance- technology integration will be further accelerated, and with cloud computing, big data, AI and other technologies further empowering the insurance value chain in aspects such as sales and services, operation and management and risk prevention and control, digital transformation of the industry will be further sped up. As the insurance market fully opening up, there will be more insurance providers in the industry, which will further enhance the market sophistication. Given the multiple positive factors, there is still great development potential and broad development space for China’s life insurance industry.
| (II) | Development Strategies and Business Plans of the Company |
2021 is the critical year for the Company’s high-quality development. The Company will push forward “China Life Revitalization” initiative in all aspects, taking development as the top priority, adhering to the strategic core of “Three Major Transformations, Dual Centers and Dual Focuses, Asset-liability Interaction”, upholding the operational guideline of “prioritizing business value, strengthening the sales force, achieving stable growth, upgrading technology, optimizing services, and guarding against risks”, in order to achieve steady business development, improve development quality, deepen reform and innovation, and constantly enhance risk prevention and control. These efforts will greatly power the Company’s high- quality development during the “14th Five-Year Plan” period.
37
| (III) | Potential Risks |
The international economic and financial situation remains complicated and challenging, there are many uncertainties in the impact of the pandemic at home and abroad and the external environment, and the foundation for the recovery of the domestic economy is not yet very solid, which together bring challenges for the stable development of the insurance business. Insurance funds investment is facing challenges such as downward trend of the benchmark interest rate in the domestic market, an increase of defaults in the bond market and shortages of assets with long duration, which result in more pressure on asset allocation. The Company will take a variety of measures to actively deal with risks and challenges. On the one hand, it will closely follow market conditions and customer demands, put more efforts to product innovation, optimize product structure, improve service quality, and actively expand the insurance supply with enhanced quality; on the other hand, the Company will reinforce its research and judgement on the macro-economic situations, enhance asset-liability management and flexibly adjust asset allocation for the purpose of achieving stable investment income. Moreover, the Company will adhere to the market-oriented and customer-centered principle, push forward reform and transformation and fully enhance the quality of business operation and management. In the future, the Company will continuously focus on and enhance the analysis of complex risk factors including the COVID-19 pandemic, and strive to promote its high-quality development.
The Company believes that it will have sufficient capital to meet its insurance business expenditures and new general investment needs in 2021. At the same time, the Company will make corresponding financing arrangements based on capital market conditions to further implement its future business development strategies.
38
ANNUAL RESULTS2
CONSOLIDATED STATEMENT OF COMPREHENSIVE INCOME
For the year ended 31 December 2020
| 2020 | 2019 | |||||||||||
| Notes | RMB million | RMB million | ||||||||||
REVENUES | ||||||||||||
Gross written premiums | 612,265 | 567,086 | ||||||||||
Less: premiums ceded to reinsurers | (6,053 | ) | (5,238 | ) | ||||||||
|
|
|
| |||||||||
Net written premiums | 606,212 | 561,848 | ||||||||||
Net change in unearned premium reserves | (1,546 | ) | (1,570 | ) | ||||||||
|
|
|
| |||||||||
Net premiums earned | 604,666 | 560,278 | ||||||||||
|
|
|
| |||||||||
Investment income | 1 | 154,497 | 139,919 | |||||||||
Net realised gains on financial assets | 2 | 14,583 | 1,831 | |||||||||
Net fair value gains through profit or loss | 3 | 21,900 | 19,251 | |||||||||
Other income | 9,315 | 8,195 | ||||||||||
|
|
|
| |||||||||
Total revenues | 804,961 | 729,474 | ||||||||||
|
|
|
| |||||||||
BENEFITS, CLAIMS AND EXPENSES | ||||||||||||
Insurance benefits and claims expenses | ||||||||||||
Life insurance death and other benefits | 4 | (113,609 | ) | (127,877 | ) | |||||||
Accident and health claims and claim adjustment expenses | 4 | (52,395 | ) | (50,783 | ) | |||||||
Increase in insurance contract liabilities | 4 | (414,797 | ) | (330,807 | ) | |||||||
Investment contract benefits | 5 | (9,846 | ) | (9,157 | ) | |||||||
Policyholder dividends resulting from participation in profits | (28,279 | ) | (22,375 | ) | ||||||||
Underwriting and policy acquisition costs | (84,342 | ) | (81,396 | ) | ||||||||
Finance costs | 6 | (3,747 | ) | (4,255 | ) | |||||||
Administrative expenses | (37,687 | ) | (40,275 | ) | ||||||||
Statutory insurance fund contribution | 7 | (1,229 | ) | (1,163 | ) | |||||||
Other expenses | (12,208 | ) | (9,602 | ) | ||||||||
|
|
|
| |||||||||
Total benefits, claims and expenses | (758,139 | ) | (677,690 | ) | ||||||||
|
|
|
| |||||||||
Net gains on investments of associates and joint ventures | 8 | 7,666 | 8,011 | |||||||||
Including: share of profit of associates and joint ventures | 8,336 | 9,159 | ||||||||||
|
|
|
| |||||||||
Profit before income tax | 9 | 54,488 | 59,795 | |||||||||
Income tax | 10 | (3,103 | ) | (781 | ) | |||||||
|
|
|
| |||||||||
Net profit | 51,385 | 59,014 | ||||||||||
|
|
|
| |||||||||
Attributable to: – Equity holders of the Company | 50,268 | 58,287 | ||||||||||
– Non-controlling interests | 1,117 | 727 | ||||||||||
Basic and diluted earnings per share | 11 | RMB1.77 | RMB2.05 | |||||||||
|
|
|
| |||||||||
| 2 | The “Group” refers to China Life Insurance Company Limited and its subsidiaries in this part. |
39
CONSOLIDATED STATEMENT OF COMPREHENSIVE INCOME (continued)
For the year ended 31 December 2020
| 2020 | 2019 | |||||||||||
| Note | RMB million | RMB million | ||||||||||
Other comprehensive income | ||||||||||||
Other comprehensive income that may be reclassified to profit or loss in subsequent periods: | ||||||||||||
Fair value gains/(losses) on available-for-sale securities | 52,547 | 69,600 | ||||||||||
Amount transferred to net profit from other comprehensive income | (14,386 | ) | (4,635 | ) | ||||||||
Portion of fair value changes on available-for-sale securities attributable to participating policyholders | (3,959 | ) | (19,521 | ) | ||||||||
Share of other comprehensive income of associates and joint ventures under the equity method | 672 | 599 | ||||||||||
Exchange differences on translating foreign operations | (986 | ) | 237 | |||||||||
Income tax relating to components of other comprehensive income | 10 | (8,482 | ) | (11,292 | ) | |||||||
|
|
|
| |||||||||
Other comprehensive income that may be reclassified to profit or loss in subsequent periods | 25,406 | 34,988 | ||||||||||
|
|
|
| |||||||||
Other comprehensive income that will not be reclassified to profit or loss in subsequent periods: | ||||||||||||
Share of other comprehensive income of associates and joint ventures under the equity method | 344 | (76 | ) | |||||||||
|
|
|
| |||||||||
Other comprehensive income for the year, net of tax | 25,750 | 34,912 | ||||||||||
|
|
|
| |||||||||
Total comprehensive income for the year, net of tax | 77,135 | 93,926 | ||||||||||
|
|
|
| |||||||||
Attributable to: | ||||||||||||
– Equity holders of the Company | 75,967 | 93,134 | ||||||||||
– Non-controlling interests | 1,168 | 792 | ||||||||||
|
|
|
| |||||||||
40
Notes:
| 1 | INVESTMENT INCOME |
| For the year ended 31 December | ||||||||
2020 RMB million | 2019 RMB million | |||||||
Debt securities | ||||||||
– held-to-maturity securities | 44,757 | 38,229 | ||||||
– available-for-sale securities | 22,695 | 21,373 | ||||||
– at fair value through profit or loss | 3,482 | 3,546 | ||||||
Equity securities | ||||||||
– available-for-sale securities | 24,185 | 21,823 | ||||||
– at fair value through profit or loss | 798 | 981 | ||||||
Bank deposits | 25,860 | 26,695 | ||||||
Loans | 31,948 | 27,111 | ||||||
Securities purchased under agreements to resell | 772 | 161 | ||||||
|
|
|
| |||||
Total | 154,497 | 139,919 | ||||||
|
|
|
| |||||
For the year ended 31 December 2020, the interest income included in investment income was RMB129,514 million (2019: RMB117,115 million). All interest income was accrued using the effective interest method.
| 2 | NET REALISED GAINS ON FINANCIAL ASSETS |
| For the year ended 31 December | ||||||||
2020 RMB million | 2019 RMB million | |||||||
Debt securities | ||||||||
Realised gains (i) | 1,287 | 3,714 | ||||||
Impairment (ii) | 288 | (3,749 | ) | |||||
|
|
|
| |||||
Subtotal | 1,575 | (35 | ) | |||||
|
|
|
| |||||
Equity securities | ||||||||
Realised gains (i) | 24,925 | 4,504 | ||||||
Impairment (ii) | (11,917 | ) | (2,638 | ) | ||||
|
|
|
| |||||
Subtotal | 13,008 | 1,866 | ||||||
|
|
|
| |||||
Total | 14,583 | 1,831 | ||||||
|
|
|
| |||||
| (i) | Realised gains were generated mainly from available-for-sale securities. |
| (ii) | During the year ended 31 December 2020, the Group recognised an impairment charge of RMB111 million (2019: RMB888 million) of available-for-sale funds, an impairment charge of RMB11,732 million (2019: RMB1,750 million) of available-for-sale sale stock securities, an impairment charge of RMB74 million (2019: nil) of available- for-sale other equity securities, an impairment reverse of RMB16 million (2019: an impairment charge of RMB1,027 million) of available-for-sale debt securities, an impairment reverse of RMB275 million (2019: an impairment charge of RMB2,718 million) of loans and an impairment charge of RMB3 million (2019: RMB4 million) of held-to- maturity securities, for which the Group determined that objective evidence of impairment existed. |
41
| 3 | NET FAIR VALUE GAINS THROUGH PROFIT OR LOSS |
| For the year ended 31 December | ||||||||
2020 RMB million | 2019 RMB million | |||||||
Debt securities | (583 | ) | 778 | |||||
Equity securities | 22,997 | 18,279 | ||||||
Stock appreciation rights | 255 | (258 | ) | |||||
Financial liabilities at fair value through profit or loss | (648 | ) | (380 | ) | ||||
Derivative financial instruments | (121 | ) | 832 | |||||
|
|
|
| |||||
Total | 21,900 | 19,251 | ||||||
|
|
|
| |||||
| 4 | INSURANCE BENEFITS AND CLAIMS EXPENSES |
| Gross | Ceded | Net | ||||||||||
| RMB million | RMB million | RMB million | ||||||||||
For the year ended 31 December 2020 | ||||||||||||
Life insurance death and other benefits | 117,129 | (3,520 | ) | 113,609 | ||||||||
Accident and health claims and claim adjustment expenses | 53,073 | (678 | ) | 52,395 | ||||||||
Increase in insurance contract liabilities | 415,186 | (389 | ) | 414,797 | ||||||||
|
|
|
|
|
| |||||||
Total | 585,388 | (4,587 | ) | 580,801 | ||||||||
|
|
|
|
|
| |||||||
For the year ended 31 December 2019 | ||||||||||||
Life insurance death and other benefits | 130,975 | (3,098 | ) | 127,877 | ||||||||
Accident and health claims and claim adjustment expenses | 51,394 | (611 | ) | 50,783 | ||||||||
Increase in insurance contract liabilities | 331,523 | (716 | ) | 330,807 | ||||||||
|
|
|
|
|
| |||||||
Total | 513,892 | (4,425 | ) | 509,467 | ||||||||
|
|
|
|
|
| |||||||
| 5 | INVESTMENT CONTRACT BENEFITS |
Benefits of investment contracts are mainly the interest credited to investment contracts.
42
| 6 | FINANCE COSTS |
| For the year ended 31 December | ||||||||
2020 RMB million | 2019 RMB million | |||||||
Interest expenses for securities sold under agreements to repurchase | 1,565 | 2,392 | ||||||
Interest expenses for bonds payable | 1,503 | 1,168 | ||||||
Interest expenses for interest-bearing loans and borrowings | 566 | 589 | ||||||
Interest on lease liabilities | 113 | 106 | ||||||
|
|
|
| |||||
Total | 3,747 | 4,255 | ||||||
|
|
|
| |||||
| 7 | STATUTORY INSURANCE FUND |
As required by the CIRC Order [2008] No. 2, “Measures for Administration of Statutory Insurance Fund”, all insurance companies have to pay the statutory insurance fund contribution from 1 January 2009. The Group is subject to the statutory insurance fund contribution, (i) at 0.15% and 0.05% of premiums and accumulated policyholder deposits from life policies with guaranteed benefits and life policies without guaranteed benefits, respectively; (ii) at 0.8% and 0.15% of premiums from short-term health policies and long-term health policies, respectively; (iii) at 0.8% of premiums from accident insurance contracts, at 0.08% and 0.05% of accumulated policyholder deposits from accident investment contracts with guaranteed benefits and without guaranteed benefits, respectively. When the accumulated statutory insurance fund contributions reach 1% of total assets, no additional contribution to the statutory insurance fund is required.
| 8 | INVESTMENTS IN ASSOCIATES AND JOINT VENTURES |
2020 RMB million | 2019 RMB million | |||||||
As at 1 January | 222,983 | 198,772 | ||||||
Change of the cost | 13,997 | 18,590 | ||||||
Share of profit or loss | 8,336 | 9,159 | ||||||
Declared dividends | (5,253 | ) | (3,227 | ) | ||||
Other equity movements | 228 | 1,189 | ||||||
Impairment | (707 | ) | (1,500 | ) | ||||
|
|
|
| |||||
As at 31 December | 239,584 | 222,983 | ||||||
|
|
|
| |||||
43
| Movement | ||||||||||||||||||||||||||||||||||||||||||||
Accounting method | Cost | As at 31 December 2019 | Change of the cost | Share of profit or loss | Declared dividends | Other equity movements | Provision of impairment | As at 31 December 2020 | Percentage of equity interest | Accumulated amount of impairment | ||||||||||||||||||||||||||||||||||
Associates | ||||||||||||||||||||||||||||||||||||||||||||
CGB (i) | Equity Method | 45,176 | 75,180 | — | 6,185 | (550 | ) | (841 | ) | — | 79,974 | 43.686 | % | — | ||||||||||||||||||||||||||||||
Sino-Ocean Group Holding Limited (“Sino-Ocean”) (ii) | Equity Method | 11,245 | 11,387 | — | 717 | (178 | ) | 66 | (707 | ) | 11,285 | 29.59 | % | (3,217 | ) | |||||||||||||||||||||||||||||
CLP&C | Equity Method | 6,000 | 9,332 | — | 746 | (271 | ) | 813 | — | 10,620 | 40.00 | % | — | |||||||||||||||||||||||||||||||
COFCO Futures Company Limited (“COFCO Futures”) | Equity Method | 1,339 | 1,550 | — | 73 | (10 | ) | (1 | ) | — | 1,612 | 35.00 | % | — | ||||||||||||||||||||||||||||||
Sinopec Sichuan to East China Gas Pipeline Co., Ltd. (“Pipeline Company”) | Equity Method | 20,000 | 21,433 | — | 1,231 | (1,998 | ) | 10 | — | 20,676 | 43.86 | % | — | |||||||||||||||||||||||||||||||
China United Network Communications Limited (“China Unicom”) (iii) | Equity Method | 21,801 | 22,068 | (28 | ) | 516 | (193 | ) | 70 | — | 22,433 | 10.29 | % | — | ||||||||||||||||||||||||||||||
Others (iv) | Equity Method | 42,391 | 29,755 | 13,160 | (1,032 | ) | (789 | ) | 461 | — | 41,555 | — | ||||||||||||||||||||||||||||||||
|
|
|
|
|
|
|
|
|
|
|
|
|
|
|
|
|
| |||||||||||||||||||||||||||
Subtotal | 147,952 | 170,705 | 13,132 | 8,436 | (3,989 | ) | 578 | (707 | ) | 188,155 | (3,217 | ) | ||||||||||||||||||||||||||||||||
|
|
|
|
|
|
|
|
|
|
|
|
|
|
|
|
|
| |||||||||||||||||||||||||||
Joint ventures | ||||||||||||||||||||||||||||||||||||||||||||
Joy City Commercial Property Fund L.P. (“Joy City”) | Equity Method | 6,281 | 5,849 | — | 100 | (154 | ) | (16 | ) | — | 5,779 | 66.67 | % | — | ||||||||||||||||||||||||||||||
Mapleleaf Century Limited (“MCL”) | Equity Method | 7,656 | 5,140 | — | (477 | ) | — | 73 | — | 4,736 | 75.00 | % | — | |||||||||||||||||||||||||||||||
Others (iv) | Equity Method | 42,786 | 41,289 | 865 | 277 | (1,110 | ) | (407 | ) | — | 40,914 | — | ||||||||||||||||||||||||||||||||
|
|
|
|
|
|
|
|
|
|
|
|
|
|
|
|
|
| |||||||||||||||||||||||||||
Subtotal | 56,723 | 52,278 | 865 | (100 | ) | (1,264 | ) | (350 | ) | — | 51,429 | — | ||||||||||||||||||||||||||||||||
|
|
|
|
|
|
|
|
|
|
|
|
|
|
|
|
|
| |||||||||||||||||||||||||||
Total | 204,675 | 222,983 | 13,997 | 8,336 | (5,253 | ) | 228 | (707 | ) | 239,584 | (3,217 | ) | ||||||||||||||||||||||||||||||||
|
|
|
|
|
|
|
|
|
|
|
|
|
|
|
|
|
| |||||||||||||||||||||||||||
| (i) | The 2019 final dividend of RMB0.0639 in cash per ordinary share was approved and declared in the Annual General Meeting of CGB on 23 June 2020. The Company received a cash dividend of RMB550 million. |
| (ii) | The 2019 final dividend of HKD0.026 in cash per ordinary share was approved and declared in the Annual General Meeting of Sino-Ocean on 20 May 2020. The Company received a cash dividend equivalent to RMB54 million. The 2020 interim dividend of HKD0.062 in cash per ordinary share was approved and declared by the Board of Directors of Sino-Ocean on 17 August 2020. The Company received a cash dividend equivalent to RMB124 million. |
44
Sino-Ocean, the Group’s associate is listed in Hong Kong. On 31 December 2020, the stock price of Sino-Ocean was HKD1.55 per share. As at 31 December 2019, the cumulative impairment loss of RMB2.51 billion for the investment in Sino-Ocean had been recognised by the Group. The Group performed an impairment test to this investment on 30 June 2020. A further impairment loss of RMB707 million was recognised for this investment valued using the discounted future cash flow method. On 31 December 2020, the Group continued to perform an impairment test to this investment and no further impairment loss should be made, which involved significant assumptions including selling prices of properties under development, rental prices of investment properties and discount rates, and the Group used 10% as the discount rate of cash flow for properties under development and investment properties (As at 31 December 2019: 10% for properties under development and 8% for investment properties).
| (iii) | The 2019 final dividend of RMB0.0604 in cash per ordinary share was approved and declared in the Annual General Meeting of China Unicom on 22 May 2020. The Company received a cash dividend of RMB193 million. On 31 December 2020, China Unicom’s share price was RMB4.46 per share. |
| (iv) | The Group invested in real estate, industrial logistics assets and other industries through these enterprises. |
| (v) | There is no significant restriction for the Group to dispose of its associates and joint ventures. |
As at 31 December 2020, the major associates and joint ventures of the Group are as follows:
Name | Place of incorporation | Percentage of equity interest held | ||||
Associates | ||||||
CGB | PRC | 43.686 | % | |||
Sino-Ocean | Hong Kong, PRC | 29.59 | % | |||
CLP&C | PRC | 40.00 | % | |||
COFCO Futures | PRC | 35.00 | % | |||
Pipeline Company | PRC | 43.86 | % | |||
China Unicom | PRC | 10.29 | % | |||
Joint ventures | ||||||
Joy City | The British Cayman Islands | 66.67 | % | |||
MCL | The British Virgin Islands | 75.00 | % | |||
As at 31 December 2019, the major associates and joint ventures of the Group are as follows:
Name | Place of incorporation | Percentage of equity interest held | ||||
Associates | ||||||
CGB | PRC | 43.686 | % | |||
Sino-Ocean | Hong Kong, PRC | 29.59 | % | |||
CLP&C | PRC | 40.00 | % | |||
COFCO Futures | PRC | 35.00 | % | |||
Pipeline Company | PRC | 43.86 | % | |||
China Unicom | PRC | 10.29 | % | |||
Joint ventures | ||||||
Joy City | The British Cayman Islands | 66.67 | % | |||
MCL | The British Virgin Islands | 75.00 | % | |||
45
The following table illustrates the financial information of the Group’s major associates and joint ventures as at 31 December 2020 and for the year ended 31 December 2020:
CGB RMB million | Sino- Ocean RMB million | CLP&C RMB million | COFCO Futures million | Pipeline Company million | China Unicom RMB | Joy City RMB million | MCL RMB million | |||||||||||||||||||||||||
Total assets | 3,027,972 | 263,528 | 106,930 | 20,567 | 34,933 | 582,475 | 10,306 | 24,196 | ||||||||||||||||||||||||
Total liabilities | 2,809,822 | 193,806 | 80,379 | 17,512 | 1,068 | 251,001 | 85 | 13,342 | ||||||||||||||||||||||||
Total equity | 218,150 | 69,722 | 26,551 | 3,055 | 33,865 | 331,474 | 10,221 | 10,854 | ||||||||||||||||||||||||
Total equity attributable to equity holders of the associates and joint ventures | 173,159 | 52,273 | 26,551 | 3,048 | 33,865 | 147,709 | 10,221 | 10,854 | ||||||||||||||||||||||||
Total adjustments (i) | 2,612 | (6,528 | ) | — | — | 427 | 16,981 | (1,552 | ) | (4,540 | ) | |||||||||||||||||||||
Total equity attributable to equity holders of the associates and joint ventures after adjustments | 175,771 | 45,745 | 26,551 | 3,048 | 34,292 | 164,690 | 8,669 | 6,314 | ||||||||||||||||||||||||
Proportion of the Group’s ownership | 43.686 | % | 29.59 | % | 40.00 | % | 35.00 | % | 43.86 | % | 10.29 | % | 66.67 | % | 75.00 | % | ||||||||||||||||
Gross carrying value of the investments | 79,974 | 14,502 | 10,620 | 1,612 | 20,676 | 22,433 | 5,779 | 4,736 | ||||||||||||||||||||||||
Impairment | — | (3,217 | ) | — | — | — | — | — | — | |||||||||||||||||||||||
Net carrying value of the investments | 79,974 | 11,285 | 10,620 | 1,612 | 20,676 | 22,433 | 5,779 | 4,736 | ||||||||||||||||||||||||
|
|
|
|
|
|
|
|
|
|
|
|
|
|
|
| |||||||||||||||||
Total revenues | 80,525 | 61,271 | 77,990 | 2,193 | 5,259 | 306,490 | 360 | 853 | ||||||||||||||||||||||||
Net profit/(loss) | 13,812 | 4,675 | 1,730 | 208 | 2,823 | 12,525 | 339 | 185 | ||||||||||||||||||||||||
Other comprehensive income | (1,944 | ) | 630 | 1,991 | (5 | ) | — | (1,706 | ) | (25 | ) | 650 | ||||||||||||||||||||
Total comprehensive income | 11,868 | 5,305 | 3,721 | 203 | 2,823 | 10,819 | 314 | 835 | ||||||||||||||||||||||||
|
|
|
|
|
|
|
|
|
|
|
|
|
|
|
| |||||||||||||||||
The following table illustrates the financial information of the Group’s major associates and joint ventures as at 31 December 2019 and for the year ended 31 December 2019:
CGB RMB | Sino- Ocean | CLP&C RMB million | COFCO Futures | Pipeline Company | China Unicom | Joy City RMB million | MCL RMB million | |||||||||||||||||||||||||
Total assets | 2,632,798 | 243,700 | 91,167 | 12,671 | 36,327 | 564,231 | 10,281 | 24,381 | ||||||||||||||||||||||||
Total liabilities | 2,423,234 | 178,088 | 67,837 | 9,792 | 777 | 240,735 | 168 | 13,620 | ||||||||||||||||||||||||
Total equity Total equity attributable to equity holders of the associates and joint ventures | | 209,564 164,573 |
| | 65,612 49,909 |
| | 23,330 23,330 |
| | 2,879 2,872 |
| | 35,550 35,550 |
| | 323,496 143,327 |
| | 10,113 10,113 |
| | 10,761 10,761 |
| ||||||||
Total adjustments (i) Total equity attributable to equity holders of the associates and joint ventures after adjustments | | 412 164,985 |
| | (6,209 43,700 | )
| | — 23,330 |
| | — 2,872 |
| | 449 35,999 |
| | 17,454 160,781 |
| | (1,339 8,774 | )
| | (3,908 6,853 | )
| ||||||||
Proportion of the Group’s ownership | 43.686 | % | 29.59 | % | 40.00 | % | 35.00 | % | 43.86 | % | 10.29 | % | 66.67 | % | 75.00 | % | ||||||||||||||||
Gross carrying value of the investments | 75,180 | 13,897 | 9,332 | 1,550 | 21,433 | 22,068 | 5,849 | 5,140 | ||||||||||||||||||||||||
Impairment | — | (2,510 | ) | — | — | — | — | — | — | |||||||||||||||||||||||
Net carrying value of the investments | 75,180 | 11,387 | 9,332 | 1,550 | 21,443 | 22,068 | 5,849 | 5,140 | ||||||||||||||||||||||||
|
|
|
|
|
|
|
|
|
|
|
|
|
|
|
| |||||||||||||||||
Total revenues | 76,312 | 56,704 | 69,498 | 793 | 5,008 | 291,435 | 306 | 795 | ||||||||||||||||||||||||
Net profit/(loss) | 12,581 | 4,166 | 2,123 | 153 | 2,635 | 11,264 | 287 | 348 | ||||||||||||||||||||||||
Other comprehensive income | 643 | 152 | 1,310 | 1 | — | (501 | ) | — | — | |||||||||||||||||||||||
Total comprehensive income | 13,224 | 4,318 | 3,433 | 154 | 2,635 | 10,763 | 287 | 348 | ||||||||||||||||||||||||
|
|
|
|
|
|
|
|
|
|
|
|
|
|
|
| |||||||||||||||||
46
| (i) | Including adjustments for the difference of accounting policies, fair value and others. |
The Group had no contingent liabilities with the associates and joint ventures as at 31 December 2020 and 31 December 2019. The Group had a capital contribution commitment of RMB25,364 million with joint ventures as at 31 December 2020 (as at 31 December 2019: RMB24,430 million).
| 9 | PROFIT BEFORE INCOME TAX |
Profit before income tax is stated after charging/(crediting) the following:
| For the year ended 31 December | ||||||||
2020 RMB million | 2019 RMB million | |||||||
Employee salaries and welfare costs | 19,523 | 20,125 | ||||||
Housing benefits | 1,317 | 1,189 | ||||||
Contribution to the defined contribution pension plan | 2,455 | 2,905 | ||||||
Depreciation and amortisation | 5,161 | 4,379 | ||||||
Foreign exchange losses/(gains) | (119 | ) | 67 | |||||
Remuneration in respect of audit services provided by auditors | 63 | 60 | ||||||
|
|
|
| |||||
| 10 | TAXATION |
Deferred income tax assets and liabilities are offset when there is a legally enforceable right to offset current tax assets against current tax liabilities and when the deferred income tax relates to the same tax authority.
| (a) | The amount of taxation charged to net profit represents: |
| For the year ended 31 December | ||||||||
2020 RMB million | 2019 RMB million | |||||||
Current taxation – Enterprise income tax | 6,588 | 614 | ||||||
Deferred taxation | (3,485 | ) | 167 | |||||
|
|
|
| |||||
Total tax charges | 3,103 | 781 | ||||||
|
|
|
| |||||
47
| (b) | The reconciliation between the Group’s effective tax rate and the statutory tax rate of 25% in the PRC (2019: same) is as follows: |
| For the year ended 31 December | ||||||||
2020 RMB million | 2019 RMB million | |||||||
Profit before income tax | 54,488 | 59,795 | ||||||
Tax computed at the statutory tax rate | 13,622 | 14,949 | ||||||
Adjustment on current income tax of previous period (i) | (464 | ) | (5,228 | ) | ||||
Non-taxable income (ii) | (10,787 | ) | (9,589 | ) | ||||
Expenses not deductible for tax purposes (ii) | 202 | 313 | ||||||
Unused tax losses | 495 | 239 | ||||||
Others | 35 | 97 | ||||||
|
|
|
| |||||
Income tax at the effective tax rate | 3,103 | 781 | ||||||
|
|
|
| |||||
| (i) | According to Cai Shui [2019] No.72, Notice on Pre-tax Deduction Policy of Commissions and Handling Charges for Insurance Companies, the commissions and handling charges incurred by insurance companies related to its operating activities, which do not exceed 18% of the total premium income of the year after deducting surrender premium, etc., are allowed to be deducted in calculating the taxable income, and the excessive part is allowed to be brought forward to subsequent years. This notice issued above was effective from 1 January 2019 and applicable to the final settlement and payment of enterprise income tax filing for the year ended 31 December 2018. Accordingly, the Company’s current income tax for the year ended 31 December 2019 was deducted by RMB5,154 million regarding to the final settlement and payment. |
| (ii) | Non-taxable income mainly includes interest income from government bonds, dividend income from applicable equity securities, etc. Expenses not deductible for tax purposes mainly include donations and other expenses that do not meet the criteria for deduction according to the relevant tax regulations. |
| (c) | As at 31 December 2020 and 31 December 2019, the amounts of deferred tax assets and liabilities are as follows: |
As at 31 December | As at 31 December | |||||||
2020 RMB million | 2019 RMB million | |||||||
Deferred tax assets | 17,174 | 13,352 | ||||||
Deferred tax liabilities | (32,373 | ) | (23,554 | ) | ||||
|
|
|
| |||||
Net deferred tax assets | 87 | 128 | ||||||
Net deferred tax liabilities | (15,286 | ) | (10,330 | ) | ||||
|
|
|
| |||||
48
As at 31 December 2020 and 31 December 2019, deferred income tax was calculated in full on temporary differences under the liability method using the principal tax rate of 25%. The movements in net deferred income tax assets and liabilities during the period were as follows:
| Net deferred tax assets/(liabilities) | ||||||||||||||||
| Insurance | Investments | Others | Total | |||||||||||||
| RMB million | RMB million | RMB million | RMB million | |||||||||||||
| (i) | (ii) | (iii) | ||||||||||||||
As at 1 January 2019 | (5,308 | ) | 3,927 | 2,638 | 1,257 | |||||||||||
(Charged)/credited to net profit | 1,985 | (2,428 | ) | 276 | (167 | ) | ||||||||||
(Charged)/credited to other comprehensive income | ||||||||||||||||
– Available-for-sale securities | — | (16,260 | ) | — | (16,260 | ) | ||||||||||
– Portion of fair value changes on available-for-sale securities attributable to participating policyholders | 4,880 | — | — | 4,880 | ||||||||||||
– Others | — | 88 | — | 88 | ||||||||||||
|
|
|
|
|
|
|
| |||||||||
As at 31 December 2019 | 1,557 | (14,673 | ) | 2,914 | (10,202 | ) | ||||||||||
|
|
|
|
|
|
|
| |||||||||
As at 1 January 2020 | 1,557 | (14,673 | ) | 2,914 | (10,202 | ) | ||||||||||
(Charged)/credited to net profit | 1,787 | 1,759 | (61 | ) | 3,485 | |||||||||||
(Charged)/credited to other comprehensive income | ||||||||||||||||
– Available-for-sale securities | — | (9,446 | ) | — | (9,446 | ) | ||||||||||
– Portion of fair value changes on available-for-sale securities attributable to participating policyholders | 990 | — | — | 990 | ||||||||||||
– Others | — | (26 | ) | — | (26 | ) | ||||||||||
|
|
|
|
|
|
|
| |||||||||
As at 31 December 2020 | 4,334 | (22,386 | ) | 2,853 | (15,199 | ) | ||||||||||
|
|
|
|
|
|
|
| |||||||||
| (i) | The deferred tax liabilities arising from the insurance category are mainly related to the change of long-term insurance contract liabilities at 31 December 2008 as a result of the first time adoption of IFRSs in 2009 and the temporary differences of short-term insurance contract liabilities and policyholder dividends payable. |
| (ii) | The deferred tax arising from the investments category is mainly related to the temporary differences of unrealised gains/(losses) on available-for-sale securities, securities at fair value through profit or loss, and others. |
| (iii) | The deferred tax arising from the others category is mainly related to the temporary differences of employee salaries and welfare costs payable. |
Unrecognised deductible tax losses of the Group amounted to RMB3,300 million as at 31 December 2020 (as at 31 December 2019: RMB1,321 million). Unrecognised deductible temporary differences of the Group amounted to RMB1 million as at 31 December 2020 (as at 31 December 2019: RMB1 million).
49
| (d) | The analysis of net deferred tax assets and deferred tax liabilities is as follows: |
| As at 31 December | As at 31 December | |||||||
2020 RMB million | 2019 RMB million | |||||||
Deferred tax assets: | ||||||||
– deferred tax assets to be recovered after 12 months | 10,882 | 7,508 | ||||||
– deferred tax assets to be recovered within 12 months | 6,292 | 5,844 | ||||||
|
|
|
| |||||
Subtotal | 17,174 | 13,352 | ||||||
|
|
|
| |||||
Deferred tax liabilities: | ||||||||
– deferred tax liabilities to be settled after 12 months | (28,107 | ) | (19,906 | ) | ||||
– deferred tax liabilities to be settled within 12 months | (4,266 | ) | (3,648 | ) | ||||
|
|
|
| |||||
Subtotal | (32,373 | ) | (23,554 | ) | ||||
|
|
|
| |||||
Net deferred tax liabilities | (15,199 | ) | (10,202 | ) | ||||
|
|
|
| |||||
| 11 | EARNINGS PER SHARE |
There is no difference between the basic and diluted earnings per share. The basic and diluted earnings per share for the year ended 31 December 2020 are calculated based on the net profit for the year attributable to ordinary equity holders of the Company and the weighted average of 28,264,705,000 ordinary shares (2019: same).
| 12 | DIVIDENDS |
Pursuant to the shareholders’ approval at the Annual General Meeting on 29 June 2020, a final dividend of RMB0.73 (inclusive of tax) per ordinary share totalling RMB20,633 million in respect of the year ended 31 December 2019 was declared and paid in 2020. The dividend has been recorded in the consolidated financial statements for the year ended 31 December 2020.
A distribution of RMB201 million (inclusive of tax) to the holders of Core Tier 2 Capital Securities was approved by management in 2020 according to the authorisation by the Board of Directors, which was delegated by the General Meeting.
Pursuant to a resolution passed at the meeting of the Board of Directors on 25 March 2021, a final dividend of RMB0.64 (inclusive of tax) per ordinary share totalling approximately RMB18,089 million for the year ended 31 December 2020 was proposed for shareholders’ approval at the forthcoming Annual General Meeting. The dividend has not been recorded in the consolidated financial statements for the year ended 31 December 2020.
50
CONSOLIDATED STATEMENT OF FINANCIAL POSITION
As at 31 December 2020
As at 31 2020 | As at 31 2019 | |||||||||||
| Note | RMB million | RMB million | ||||||||||
ASSETS | ||||||||||||
Property, plant and equipment | 52,747 | 51,758 | ||||||||||
Right-of-use assets | 3,076 | 3,520 | ||||||||||
Investment properties | 14,217 | 12,141 | ||||||||||
Investments in associates and joint ventures | 8 | 239,584 | 222,983 | |||||||||
Held-to-maturity securities | 1,189,369 | 928,751 | ||||||||||
Loans | 658,535 | 608,920 | ||||||||||
Term deposits | 545,667 | 535,260 | ||||||||||
Statutory deposits – restricted | 6,333 | 6,333 | ||||||||||
Available-for-sale securities | 1,215,603 | 1,058,957 | ||||||||||
Securities at fair value through profit or loss | 161,570 | 141,608 | ||||||||||
Derivative financial assets | — | 428 | ||||||||||
Securities purchased under agreements to resell | 7,947 | 4,467 | ||||||||||
Accrued investment income | 45,200 | 41,703 | ||||||||||
Premiums receivable | 20,730 | 17,281 | ||||||||||
Reinsurance assets | 6,095 | 5,161 | ||||||||||
Other assets | 29,021 | 34,029 | ||||||||||
Deferred tax assets | 87 | 128 | ||||||||||
Cash and cash equivalents | 56,629 | 53,306 | ||||||||||
|
|
|
| |||||||||
Total assets | 4,252,410 | 3,726,734 | ||||||||||
|
|
|
| |||||||||
51
CONSOLIDATED STATEMENT OF FINANCIAL POSITION (continued)
As at 31 December 2020
As at 31 December | As at 31 December | |||||||
| RMB million | RMB million | |||||||
LIABILITIES AND EQUITY | ||||||||
Liabilities | ||||||||
Insurance contracts | 2,973,225 | 2,552,736 | ||||||
Investment contracts | 288,212 | 267,804 | ||||||
Policyholder dividends payable | 122,510 | 112,593 | ||||||
Interest-bearing loans and borrowings | 19,556 | 20,045 | ||||||
Lease liabilities | 2,664 | 3,091 | ||||||
Bonds payable | 34,992 | 34,990 | ||||||
Financial liabilities at fair value through profit or loss | 3,732 | 3,859 | ||||||
Securities sold under agreements to repurchase | 122,249 | 118,088 | ||||||
Annuity and other insurance balances payable | 55,031 | 51,019 | ||||||
Premiums received in advance | 53,021 | 60,898 | ||||||
Other liabilities | 104,426 | 81,114 | ||||||
Deferred tax liabilities | 15,286 | 10,330 | ||||||
Current income tax liabilities | 191 | 223 | ||||||
Statutory insurance fund | 384 | 602 | ||||||
|
|
|
| |||||
Total liabilities | 3,795,479 | 3,317,392 | ||||||
|
|
|
| |||||
Equity | ||||||||
Share capital | 28,265 | 28,265 | ||||||
Other equity instruments | — | 7,791 | ||||||
Reserves | 237,890 | 197,221 | ||||||
Retained earnings | 183,896 | 170,487 | ||||||
|
|
|
| |||||
Attributable to equity holders of the Company | 450,051 | 403,764 | ||||||
|
|
|
| |||||
Non-controlling interests | 6,880 | 5,578 | ||||||
|
|
|
| |||||
Total equity | 456,931 | 409,342 | ||||||
|
|
|
| |||||
Total liabilities and equity | 4,252,410 | 3,726,734 | ||||||
|
|
|
| |||||
52
CONSOLIDATED STATEMENT OF CHANGES IN EQUITY
For the year ended 31 December 2020
| Attributable to equity holders of the Company | Non- controlling interests | Total | ||||||||||||||||||||||
| Share capital | Other equity instruments | Reserves | Retained earnings | |||||||||||||||||||||
| RMB million | RMB million | RMB million | RMB million | RMB million | RMB million | |||||||||||||||||||
As at 1 January 2019 | 28,265 | 7,791 | 149,309 | 130,117 | 4,919 | 320,401 | ||||||||||||||||||
Net profit | — | — | — | 58,287 | 727 | 59,014 | ||||||||||||||||||
Other comprehensive income | — | — | 34,847 | — | 65 | 34,912 | ||||||||||||||||||
|
|
|
|
|
|
|
|
|
|
|
| |||||||||||||
Total comprehensive income | — | — | 34,847 | 58,287 | 792 | 93,926 | ||||||||||||||||||
|
|
|
|
|
|
|
|
|
|
|
| |||||||||||||
Transactions with owners | ||||||||||||||||||||||||
Appropriation to reserves | — | — | 13,087 | (13,087 | ) | — | — | |||||||||||||||||
Dividends paid | — | — | — | (4,916 | ) | — | (4,916 | ) | ||||||||||||||||
Dividends to non-controlling interests | — | — | — | — | (133 | ) | (133 | ) | ||||||||||||||||
Reserves to retained earnings | — | — | (86 | ) | 86 | — | — | |||||||||||||||||
Others | — | — | 64 | — | — | 64 | ||||||||||||||||||
|
|
|
|
|
|
|
|
|
|
|
| |||||||||||||
Total transactions with owners | — | — | 13,065 | (17,917 | ) | (133 | ) | (4,985 | ) | |||||||||||||||
|
|
|
|
|
|
|
|
|
|
|
| |||||||||||||
As at 31 December 2019 | 28,265 | 7,791 | 197,221 | 170,487 | 5,578 | 409,342 | ||||||||||||||||||
|
|
|
|
|
|
|
|
|
|
|
| |||||||||||||
As at 1 January 2020 | 28,265 | 7,791 | 197,221 | 170,487 | 5,578 | 409,342 | ||||||||||||||||||
Net profit | — | — | — | 50,268 | 1,117 | 51,385 | ||||||||||||||||||
Other comprehensive income | — | — | 25,699 | — | 51 | 25,750 | ||||||||||||||||||
|
|
|
|
|
|
|
|
|
|
|
| |||||||||||||
Total comprehensive income | — | — | 25,699 | 50,268 | 1,168 | 77,135 | ||||||||||||||||||
|
|
|
|
|
|
|
|
|
|
|
| |||||||||||||
Transactions with owners | ||||||||||||||||||||||||
Appropriation to reserves | — | — | 16,025 | (16,025 | ) | — | — | |||||||||||||||||
Dividends paid | — | — | — | (20,834 | ) | — | (20,834 | ) | ||||||||||||||||
Dividends to non-controlling interests | — | — | — | — | (174 | ) | (174 | ) | ||||||||||||||||
Others | — | (7,791 | ) | (1,055 | ) | — | 308 | (8,538 | ) | |||||||||||||||
|
|
|
|
|
|
|
|
|
|
|
| |||||||||||||
Total transactions with owners | — | (7,791 | ) | 14,970 | (36,859 | ) | 134 | (29,546 | ) | |||||||||||||||
|
|
|
|
|
|
|
|
|
|
|
| |||||||||||||
As at 31 December 2020 | 28,265 | — | 237,890 | 183,896 | 6,880 | 456,931 | ||||||||||||||||||
|
|
|
|
|
|
|
|
|
|
|
| |||||||||||||
53
CONSOLIDATED STATEMENT OF CASH FLOWS
For the year ended 31 December 2020
| 2020 | 2019 | |||||||
| RMB million | RMB million | |||||||
CASH FLOWS FROM OPERATING ACTIVITIES | ||||||||
Profit before income tax | 54,488 | 59,795 | ||||||
Adjustments for: | ||||||||
Investment income | (154,497 | ) | (139,919 | ) | ||||
Net realised and unrealised gains on financial assets | (36,483 | ) | (21,082 | ) | ||||
Insurance contracts | 419,866 | 335,971 | ||||||
Depreciation and amortisation | 5,161 | 4,379 | ||||||
Foreign exchange losses/(gains) | (119 | ) | 67 | |||||
Net gains on investments of associates and joint ventures | (7,666 | ) | (8,011 | ) | ||||
Changes in operating assets and liabilities: | ||||||||
Decrease/(increase) in securities at fair value through profit or loss, net | (21,954 | ) | 6,858 | |||||
Financial liabilities at fair value through profit or loss | 3,004 | 1,213 | ||||||
Receivables and payables | 40,592 | �� | 50,622 | |||||
Income tax paid | (3,263 | ) | (8,636 | ) | ||||
Interest received – securities at fair value through profit or loss | 4,120 | 3,811 | ||||||
Dividends received – securities at fair value through profit or loss | 775 | 964 | ||||||
|
|
|
| |||||
Net cash inflow/(outflow) from operating activities | 304,024 | 286,032 | ||||||
|
|
|
| |||||
CASH FLOWS FROM INVESTING ACTIVITIES | ||||||||
Disposals and maturities: | ||||||||
Disposals of debt investments | 36,774 | 112,182 | ||||||
Maturities of debt investments | 198,640 | 133,519 | ||||||
Disposals of equity investments | 308,406 | 450,014 | ||||||
Disposals of property, plant and equipment | 57 | 72 | ||||||
Disposals of subsidiaries | 2,175 | 1,432 | ||||||
Purchases: | ||||||||
Debt investments | (593,917 | ) | (504,292 | ) | ||||
Equity investments | (338,306 | ) | (545,657 | ) | ||||
Property, plant and equipment | (7,467 | ) | (11,415 | ) | ||||
Investments in associates and joint ventures | (14,942 | ) | (23,389 | ) | ||||
Decrease/(increase) in term deposits, net | (10,947 | ) | 24,102 | |||||
Decrease/(increase) in securities purchased under agreements to resell, net | (3,850 | ) | 5,468 | |||||
Interest received | 126,848 | 116,846 | ||||||
Dividends received | 29,590 | 25,169 | ||||||
Increase in policy loans, net | (25,858 | ) | (32,707 | ) | ||||
Cash received related to other investing activities | — | 1,141 | ||||||
|
|
|
| |||||
Net cash inflow/(outflow) from investing activities | (292,797 | ) | (247,515 | ) | ||||
|
|
|
| |||||
54
CONSOLIDATED STATEMENT OF CASH FLOWS (continued)
For the year ended 31 December 2020
2020 RMB million | 2019 RMB million | |||||||
CASH FLOWS FROM FINANCING ACTIVITIES | ||||||||
Increase/(decrease) in securities sold under agreements to repurchase, net | 4,912 | (73,552 | ) | |||||
Interest paid | (3,779 | ) | (3,072 | ) | ||||
Repayment of borrowings | (6,505 | ) | (365 | ) | ||||
Dividends paid to equity holders of the Company | (20,834 | ) | (4,916 | ) | ||||
Dividends paid to non-controlling interests | (161 | ) | (133 | ) | ||||
Proceeds from issue of bonds | — | 34,988 | ||||||
Cash received from borrowings | 6,822 | 123 | ||||||
Payment of principal portion of lease liabilities | (1,478 | ) | (1,348 | ) | ||||
Cash paid for redemption of other equity instruments | (9,060 | ) | — | |||||
Capital injected into subsidiaries by non-controlling interests | 22,846 | 12,961 | ||||||
Cash received related to other financing activities | 1,069 | — | ||||||
Cash paid related to other financing activities | (1,592 | ) | (761 | ) | ||||
|
|
|
| |||||
Net cash inflow/(outflow) from financing activities | (7,760 | ) | (36,075 | ) | ||||
|
|
|
| |||||
Foreign exchange gains/(losses) on cash and cash equivalents | (144 | ) | 55 | |||||
|
|
|
| |||||
Net increase in cash and cash equivalents | 3,323 | 2,497 | ||||||
|
|
|
| |||||
Cash and cash equivalents Beginning of the year | 53,306 | 50,809 | ||||||
|
|
|
| |||||
End of the year | 56,629 | 53,306 | ||||||
|
|
|
| |||||
Analysis of balances of cash and cash equivalents | ||||||||
Cash at banks and in hand | 56,510 | 52,800 | ||||||
Short-term bank deposits | 119 | 506 | ||||||
|
|
|
| |||||
55
SEGMENT INFORMATION
| 1 | Operating segments |
The Group operates in four operating segments:
| (i) | Life insurance business (Life) |
Life insurance business relates primarily to the sale of life insurance policies, including those life insurance policies without significant insurance risk transferred.
| (ii) | Health insurance business (Health) |
Health insurance business relates primarily to the sale of health insurance policies, including those health insurance policies without significant insurance risk transferred.
| (iii) | Accident insurance business (Accident) |
Accident insurance business relates primarily to the sale of accident insurance policies.
| (iv) | Other businesses (Others) |
Other businesses relate primarily to income and cost of the agency business in respect of transactions with CLIC, etc., net share of profit of associates and joint ventures, income and expenses of subsidiaries, and unallocated income and expenditure of the Group.
| 2 | Allocation basis of income and expenses |
Investment income, net realised gains on financial assets, net fair value gains through profit or loss and foreign exchange gains/(losses) within other expenses are allocated among segments in proportion to the respective segments’ average liabilities of insurance contracts and investment contracts at the beginning and end of the year. Administrative expenses are allocated among segments in proportion to the unit cost of respective products in the different segments. Unallocated other income and other expenses are presented in the “Others” segment directly. Income tax is not allocated.
| 3 | Allocation basis of assets and liabilities |
Financial assets, securities sold under agreements to repurchase and derivative financial liabilities are allocated among segments in proportion to the respective segments’ average liabilities of insurance contracts and investment contracts at the beginning and end of the year. Insurance and investment contract liabilities are presented under the respective segments. The remaining assets and liabilities are not allocated.
56
| For the year ended 31 December 2020 | ||||||||||||||||||||||||
| Life | Health | Accident | Others | Elimination | Total | |||||||||||||||||||
| RMB million | ||||||||||||||||||||||||
Revenues | ||||||||||||||||||||||||
Gross written premiums | 480,593 | 115,089 | 16,583 | — | — | 612,265 | ||||||||||||||||||
– Term life | 2,674 | — | — | — | — | |||||||||||||||||||
– Whole life | 73,747 | — | — | — | — | |||||||||||||||||||
– Endowment | 109,275 | — | — | — | — | |||||||||||||||||||
– Annuity | 294,897 | — | — | — | — | |||||||||||||||||||
Net premiums earned | 479,600 | 109,091 | 15,975 | — | — | 604,666 | ||||||||||||||||||
Investment income | 140,963 | 9,202 | 462 | 3,870 | — | 154,497 | ||||||||||||||||||
Net realised gains on financial assets | 13,523 | 877 | 44 | 139 | — | 14,583 | ||||||||||||||||||
Net fair value gains through profit or loss | 17,727 | 1,148 | 58 | 2,967 | — | 21,900 | ||||||||||||||||||
Other income | 1,284 | 75 | — | 10,404 | (2,448 | ) | 9,315 | |||||||||||||||||
Including: inter-segment revenue | — | — | — | 2,448 | (2,448 | ) | — | |||||||||||||||||
|
|
|
|
|
|
|
|
|
|
|
| |||||||||||||
Segment revenues | 653,097 | 120,393 | 16,539 | 17,380 | (2,448 | ) | 804,961 | |||||||||||||||||
|
|
|
|
|
|
|
|
|
|
|
| |||||||||||||
Benefits, claims and expenses | ||||||||||||||||||||||||
Insurance benefits and claims expenses | ||||||||||||||||||||||||
Life insurance death and other benefits | (108,862 | ) | (4,714 | ) | (33 | ) | — | — | (113,609 | ) | ||||||||||||||
Accident and health claims and claim adjustment expenses | — | (44,987 | ) | (7,408 | ) | — | — | (52,395 | ) | |||||||||||||||
Increase in insurance contract liabilities | (382,132 | ) | (32,445 | ) | (220 | ) | — | — | (414,797 | ) | ||||||||||||||
Investment contract benefits | (9,494 | ) | (352 | ) | — | — | — | (9,846 | ) | |||||||||||||||
Policyholder dividends resulting from participation in profits | (28,129 | ) | (150 | ) | — | — | — | (28,279 | ) | |||||||||||||||
Underwriting and policy acquisition costs | (60,841 | ) | (15,921 | ) | (5,315 | ) | (2,265 | ) | — | (84,342 | ) | |||||||||||||
Finance costs | (2,798 | ) | (183 | ) | (7 | ) | (759 | ) | — | (3,747 | ) | |||||||||||||
Administrative expenses | (23,360 | ) | (8,677 | ) | (2,649 | ) | (3,001 | ) | — | (37,687 | ) | |||||||||||||
Statutory insurance fund contribution | (833 | ) | (302 | ) | (94 | ) | — | — | (1,229 | ) | ||||||||||||||
Other expenses | (8,575 | ) | (1,051 | ) | (241 | ) | (4,789 | ) | 2,448 | (12,208 | ) | |||||||||||||
Including: inter-segment expenses | (2,292 | ) | (148 | ) | (8 | ) | — | 2,448 | — | |||||||||||||||
|
|
|
|
|
|
|
|
|
|
|
| |||||||||||||
Segment benefits, claims and expenses | (625,024 | ) | (108,782 | ) | (15,967 | ) | (10,814 | ) | 2,448 | (758,139 | ) | |||||||||||||
|
|
|
|
|
|
|
|
|
|
|
| |||||||||||||
Net gains on investments of associates and joint ventures | — | — | — | 7,666 | — | 7,666 | ||||||||||||||||||
Including: share of profit of associates and joint ventures | — | — | — | 8,336 | — | 8,336 | ||||||||||||||||||
|
|
|
|
|
|
|
|
|
|
|
| |||||||||||||
Segment results | 28,073 | 11,611 | 572 | 14,232 | — | 54,488 | ||||||||||||||||||
|
|
|
|
|
|
|
|
|
|
|
| |||||||||||||
Income tax | (3,103 | ) | ||||||||||||||||||||||
|
| |||||||||||||||||||||||
Net profit | 51,385 | |||||||||||||||||||||||
|
| |||||||||||||||||||||||
Attributable to | ||||||||||||||||||||||||
– Equity holders of the Company | 50,268 | |||||||||||||||||||||||
– Non-controlling interests | 1,117 | |||||||||||||||||||||||
Other comprehensive income attributable to equity holders of the Company | 23,685 | 1,534 | 78 | 402 | — | 25,699 | ||||||||||||||||||
Depreciation and amortisation | 3,086 | 1,118 | 351 | 606 | — | 5,161 | ||||||||||||||||||
|
|
|
|
|
|
|
|
|
|
|
| |||||||||||||
57
| As at 31 December 2020 | ||||||||||||||||||||||||
| Life | Health | Accident | Others | Elimination | Total | |||||||||||||||||||
| RMB million | ||||||||||||||||||||||||
Assets | ||||||||||||||||||||||||
Financial assets | 3,537,020 | 222,559 | 10,964 | 117,237 | — | 3,887,780 | ||||||||||||||||||
Others | 10,076 | 14,939 | 675 | 239,584 | — | 265,274 | ||||||||||||||||||
|
|
|
|
|
|
|
|
|
|
|
| |||||||||||||
Segment assets | 3,547,096 | 237,498 | 11,639 | 356,821 | — | 4,153,054 | ||||||||||||||||||
|
|
|
|
|
|
|
|
|
|
|
| |||||||||||||
Unallocated | ||||||||||||||||||||||||
Property, plant and equipment | 52,747 | |||||||||||||||||||||||
Others | 46,609 | |||||||||||||||||||||||
|
| |||||||||||||||||||||||
Total | 4,252,410 | |||||||||||||||||||||||
|
| |||||||||||||||||||||||
Liabilities | ||||||||||||||||||||||||
Insurance contracts | 2,767,642 | 195,487 | 10,096 | — | — | 2,973,225 | ||||||||||||||||||
Investment contracts | 271,757 | 16,455 | — | — | — | 288,212 | ||||||||||||||||||
Securities sold under agreements to repurchase | 109,156 | 7,070 | 358 | 5,665 | — | 122,249 | ||||||||||||||||||
Others | 84,668 | 6,013 | 370 | 23,288 | — | 114,339 | ||||||||||||||||||
|
|
|
|
|
|
|
|
|
|
|
| |||||||||||||
Segment liabilities | 3,233,223 | 225,025 | 10,824 | 28,953 | — | 3,498,025 | ||||||||||||||||||
|
|
|
|
|
|
|
|
|
|
|
| |||||||||||||
Unallocated | ||||||||||||||||||||||||
Others | 297,454 | |||||||||||||||||||||||
|
| |||||||||||||||||||||||
Total | 3,795,479 | |||||||||||||||||||||||
|
| |||||||||||||||||||||||
58
| For the year ended 31 December 2019 | ||||||||||||||||||||||||
| Life | Health | Accident | Others | Elimination | Total | |||||||||||||||||||
| RMB million | ||||||||||||||||||||||||
Revenues | ||||||||||||||||||||||||
Gross written premiums | 446,562 | 105,581 | 14,943 | — | — | 567,086 | ||||||||||||||||||
– Term life | 2,584 | — | — | — | — | |||||||||||||||||||
– Whole life | 61,612 | — | — | — | — | |||||||||||||||||||
– Endowment | 113,950 | — | — | — | — | |||||||||||||||||||
– Annuity | 268,416 | — | — | — | — | |||||||||||||||||||
Net premiums earned | 445,719 | 99,575 | 14,984 | — | — | 560,278 | ||||||||||||||||||
Investment income | 129,334 | 7,849 | 443 | 2,293 | — | 139,919 | ||||||||||||||||||
Net realised gains on financial assets | 1,646 | 100 | 6 | 79 | — | 1,831 | ||||||||||||||||||
Net fair value gains through profit or loss | 16,947 | 1,027 | 58 | 1,219 | — | 19,251 | ||||||||||||||||||
Other income | 1,110 | 60 | — | 8,698 | (1,673 | ) | 8,195 | |||||||||||||||||
Including: inter-segment revenue | — | — | — | 1,673 | (1,673 | ) | — | |||||||||||||||||
|
|
|
|
|
|
|
|
|
|
|
| |||||||||||||
Segment revenues | 594,756 | 108,611 | 15,491 | 12,289 | (1,673 | ) | 729,474 | |||||||||||||||||
|
|
|
|
|
|
|
|
|
|
|
| |||||||||||||
Benefits, claims and expenses | ||||||||||||||||||||||||
Insurance benefits and claims expenses | ||||||||||||||||||||||||
Life insurance death and other benefits | (124,194 | ) | (3,649 | ) | (34 | ) | — | — | (127,877 | ) | ||||||||||||||
Accident and health claims and claim adjustment expenses | — | (44,613 | ) | (6,170 | ) | — | — | (50,783 | ) | |||||||||||||||
Increase in insurance contract liabilities | (303,479 | ) | (27,209 | ) | (119 | ) | — | — | (330,807 | ) | ||||||||||||||
Investment contract benefits | (8,810 | ) | (347 | ) | — | — | — | (9,157 | ) | |||||||||||||||
Policyholder dividends resulting from participation in profits | (22,251 | ) | (124 | ) | — | — | — | (22,375 | ) | |||||||||||||||
Underwriting and policy acquisition costs | (57,071 | ) | (16,554 | ) | (5,443 | ) | (2,328 | ) | — | (81,396 | ) | |||||||||||||
Finance costs | (3,288 | ) | (200 | ) | (12 | ) | (755 | ) | — | (4,255 | ) | |||||||||||||
Administrative expenses | (25,328 | ) | (9,075 | ) | (2,962 | ) | (2,910 | ) | — | (40,275 | ) | |||||||||||||
Statutory insurance fund contribution | (797 | ) | (273 | ) | (93 | ) | — | — | (1,163 | ) | ||||||||||||||
Other expenses | (7,120 | ) | (692 | ) | (169 | ) | (3,294 | ) | 1,673 | (9,602 | ) | |||||||||||||
Including: inter-segment expenses | (1,573 | ) | (95 | ) | (5 | ) | — | 1,673 | — | |||||||||||||||
|
|
|
|
|
|
|
|
|
|
|
| |||||||||||||
Segment benefits, claims and expenses | (552,338 | ) | (102,736 | ) | (15,002 | ) | (9,287 | ) | 1,673 | (677,690 | ) | |||||||||||||
Net gains on investments of associates and joint ventures | — | — | — | 8,011 | — | 8,011 | ||||||||||||||||||
Including: share of profit of associates and joint ventures | — | — | — | 9,159 | — | 9,159 | ||||||||||||||||||
|
|
|
|
|
|
|
|
|
|
|
| |||||||||||||
Segment results | 42,418 | 5,875 | 489 | 11,013 | — | 59,795 | ||||||||||||||||||
|
|
|
|
|
|
|
|
|
|
|
| |||||||||||||
Income tax | (781 | ) | ||||||||||||||||||||||
|
| |||||||||||||||||||||||
Net profit | 59,014 | |||||||||||||||||||||||
|
| |||||||||||||||||||||||
Attributable to | ||||||||||||||||||||||||
– Equity holders of the Company | 58,287 | |||||||||||||||||||||||
– Non-controlling interests | 727 | |||||||||||||||||||||||
Other comprehensive income attributable to equity holders of the Company | 31,861 | 1,931 | 109 | 946 | — | 34,847 | ||||||||||||||||||
Depreciation and amortisation | 2,671 | 917 | 312 | 479 | — | 4,379 | ||||||||||||||||||
|
|
|
|
|
|
|
|
|
|
|
| |||||||||||||
59
| As at 31 December 2019 | ||||||||||||||||||||||||
| Life | Health | Accident | Others | Elimination | Total | |||||||||||||||||||
| RMB million | ||||||||||||||||||||||||
Assets | ||||||||||||||||||||||||
Financial assets | 3,111,140 | 183,142 | 10,080 | 76,907 | — | 3,381,269 | ||||||||||||||||||
Others | 8,953 | 12,109 | 572 | 222,983 | — | 244,617 | ||||||||||||||||||
|
|
|
|
|
|
|
|
|
|
|
| |||||||||||||
Segment assets | 3,120,093 | 195,251 | 10,652 | 299,890 | — | 3,625,886 | ||||||||||||||||||
|
|
|
|
|
|
|
|
|
|
|
| |||||||||||||
Unallocated | ||||||||||||||||||||||||
Property, plant and equipment | 51,758 | |||||||||||||||||||||||
Others | 49,090 | |||||||||||||||||||||||
|
| |||||||||||||||||||||||
Total | 3,726,734 | |||||||||||||||||||||||
|
| |||||||||||||||||||||||
Liabilities | ||||||||||||||||||||||||
Insurance contracts | 2,385,407 | 158,800 | 8,529 | — | — | 2,552,736 | ||||||||||||||||||
Investment contracts | 252,362 | 15,442 | — | — | — | 267,804 | ||||||||||||||||||
Securities sold under agreements to repurchase | 106,377 | 6,447 | 365 | 4,899 | — | 118,088 | ||||||||||||||||||
Others | 80,820 | 5,687 | 346 | 23,904 | — | 110,757 | ||||||||||||||||||
|
|
|
|
|
|
|
|
|
|
|
| |||||||||||||
Segment liabilities | 2,824,966 | 186,376 | 9,240 | 28,803 | — | 3,049,385 | ||||||||||||||||||
|
|
|
|
|
|
|
|
|
|
|
| |||||||||||||
Unallocated | ||||||||||||||||||||||||
Others | 268,007 | |||||||||||||||||||||||
|
| |||||||||||||||||||||||
Total | 3,317,392 | |||||||||||||||||||||||
|
| |||||||||||||||||||||||
60
SUMMARY OF SIGNIFICANT ACCOUNTING POLICIES
The principal accounting policies applied in the preparation of these consolidated financial statements are set out below. These policies have been consistently applied to all the years presented, unless otherwise stated.
Basis of preparation
The Group has prepared these consolidated financial statements in accordance with International Financial Reporting Standards (“IFRSs”), amendments to IFRSs and interpretations issued by the International Accounting Standards Board (“IASB”). These consolidated financial statements also comply with the applicable disclosure provisions of the Rules Governing the Listing of Securities on The Stock Exchange of Hong Kong Limited (the “Listing Rules”) and the applicable disclosure requirements of the Hong Kong Companies Ordinance. The Group has prepared the consolidated financial statements under the historical cost convention, except for financial assets and liabilities at fair value through profit or loss, available for sale securities, insurance contract liabilities and certain property, plant and equipment at deemed cost as part of the Restructuring process. The preparation of financial statements in compliance with IFRSs requires the use of certain critical accounting estimates. It also requires management to exercise its judgement in the process of applying the Group’s accounting policies.
New accounting standards and amendments adopted by the Group for the first time for the financial year beginning on 1 January 2020
Standards/Amendments | Content | Effective for annual periods beginning on or after | ||||
IFRS 3 Amendments | Definition of a Business | 1 January 2020 | ||||
IAS 1 and IAS 8 Amendments | Definition of Material | 1 January 2020 | ||||
IFRS 9, IAS 39 and IFRS 7 Amendments | Interest Rate Benchmark Reform | 1 January 2020 | ||||
IFRS 16 Amendment | Covid-19-Related Rent Concessions (early adopted) | 1 June 2020 | ||||
61
IFRS 3 Amendments – Definition of a Business
In October 2018, the IASB issued amendments to the definition of a business in IFRS 3 Business Combinations. The amendments clarify and provide additional guidance on the definition of a business. The amendments clarify that for an integrated set of activities and assets to be considered a business, it must include, at a minimum, an input and a substantive process that together significantly contribute to the ability to create outputs. A business can exist without including all of the inputs and processes needed to create outputs. The amendments remove the assessment of whether market participants are capable of acquiring the business and continue to produce outputs. Instead, the focus is on whether acquired inputs and acquired substantive processes together significantly contribute to the ability to create outputs. The amendments have also narrowed the definition of outputs to focus on goods or services provided to customers, investment income or other income from ordinary activities. Furthermore, the amendments provide guidance to assess whether an acquired process is substantive and introduce an optional fair value concentration test to permit a simplified assessment of whether an acquired set of activities and assets is not a business. The Group has applied the amendments prospectively to transactions or other events that occurred on or after 1 January 2020. The amendments did not have any significant impact on the Group’s consolidated financial statements.
IAS 1 and IAS 8 Amendments – Definition of Material
In October 2018, the IASB issued amendments to IAS 1 Presentation of Financial Statements and IAS 8 Accounting Policies, Changes in Accounting Estimates and Errors to provide a new definition of material. The new definition states that information is material if omitting, misstating or obscuring it could reasonably be expected to influence decisions that the primary users of general purpose financial statements make on the basis of those financial statements. The amendments clarify that materiality will depend on the nature or magnitude of information, or both. The amendments did not have any significant impact on the Group’s consolidated financial statements.
IFRS 9, IAS 39 and IFRS 7 Amendments – Interest Rate Benchmark Reform
In September 2019, the IASB issued the amendments to IFRS 9 Financial Instruments, IAS 39 Financial Instruments: Recognition and Measurement and IFRS 7 Financial Instruments: Disclosures to respond to the hedge accounting induced in the Interbank Offered Rates (IBOR) reform. The amendments provide temporary reliefs which enable hedge accounting to continue during the period of uncertainty before the replacement of an existing interest rate benchmark. The amendments did not have any significant impact on the Group’s consolidated financial statements.
62
IFRS 16 Amendment – Covid-19-Related Rent Concessions (early adopted)
In May 2020, the IASB issued the amendment to IFRS 16 Leases to provide an optional relief to lessees from applying IFRS 16’s guidance on lease modification accounting for rent concessions arising as a direct consequence of Covid-19. The amendment does not apply to lessors.
The practical expedient applies only to rent concessions occurring as a direct consequence of Covid-19 and only if all of the following conditions are met: (i) the change in lease payments results in revised consideration for the lease that is substantially the same as, or less than, the consideration for the lease immediately preceding the change; (ii) any reduction in lease payments affects only payments originally due on or before 30 June 2021; (iii) there is no substantive change to other terms and conditions of the lease. The amendment is effective retrospectively for annual periods beginning on or after 1 June 2020 with earlier application permitted.
The Group has early adopted the amendment on 1 January 2020. Because the Group was not provided with a significant amount of rent concessions arising as a direct consequence of Covid-19, the amendment did not have any significant impact on the Group’s consolidated financial statements.
New accounting standards and amendments that are effective but temporary exemption is applied by the Group for the financial year beginning on 1 January 2020
Standards/Amendments | Content | Effective for annual periods beginning on or after | ||||
IFRS 9 | Financial Instruments | 1 January 2018 |
IFRS 9 – Financial Instruments
In July 2014, the IASB issued the final version of IFRS 9, bringing together all phases of the financial instruments project to replace IAS 39 and all previous versions of IFRS 9. The standard introduces new requirements for classification and measurement, impairment, and hedge accounting. IFRS 9 is effective for annual periods beginning on or after 1 January 2018, with early adoption permitted. Based on the current assessment, the Group expects that the adoption of IFRS 9 will have a significant impact on the Group’s consolidated financial statements. The Group has adopted the temporary exemption permitted in Amendments to IFRS 4 Applying IFRS 9 Financial Instruments with IFRS 4 Insurance Contracts (“IFRS 4 Amendments”) to apply IAS 39 rather than IFRS 9, until the effective date of IFRS 17.
63
Classification and measurement
IFRS 9 requires that the Group classifies debt instruments based on the combined effect of application of business models (hold to collect contractual cash flows, hold to collect contractual cash flows and sell financial assets or other business models) and contractual cash flow characteristics (solely payments of principal and interest on the principal amount outstanding or not). Debt instruments not giving rise to cash flows that are solely payments of principal and interest on the principal amount outstanding would be measured at fair value through profit or loss. Other debt instruments giving rise to cash flows that are solely payments of principal and interest on the principal amount outstanding would be measured at amortised cost, fair value through other comprehensive income (“FVOCI”) or fair value through profit or loss, based on their respective business models. The Group analysed the contractual cash flow characteristics of financial assets as at 31 December 2020 and made relevant disclosures.
Equity instruments would generally be measured at fair value through profit or loss unless the Group elects to measure at FVOCI for certain equity investments not held for trading. This will result in unrealised gains and losses on equity instruments currently classified as available-for-sale securities being recorded in income going forward. Currently, these unrealised gains and losses are recognised in other comprehensive income (“OCI”). If the Group elects to record equity investments at FVOCI, gains and losses would be recognised in retained earnings when the instruments be disposed, except for the received dividends which do not represent a recovery of part of the investment cost.
Impairment
IFRS 9 replaces the “incurred loss” model with the “expected credit loss” model which is designed to include forward-looking information. The Group is in the process of developing and testing the key models required under IFRS 9 and analysing the impact on the expected loss provision; the Group believed that the provision for debt instruments of the Group under the “expected credit loss” model would be larger than that under the previous “incurred loss” model.
Hedge accounting
The Group does not apply the hedge accounting currently, so the Group expects that the new hedge accounting model under IFRS 9 will have no impact on the Group’s consolidated financial statements.
64
New accounting standards and amendments that are not yet effective and have not been early adopted by the Group for the financial year beginning on 1 January 2020
Standards/Amendments | Content | Effective for annual periods beginning on or after | ||
IFRS 9, IAS 39, IFRS 7, | Interest Rate Benchmark Reform – Phase 2 | 1 January 2021 | ||
IFRS 17 | Insurance Contracts | 1 January 2023 | ||
IFRS 10 and IAS 28 Amendments | Sale or Contribution of Assets between an Investor and its Associate or Joint Venture | No mandatory effective date yet determined but available for adoption |
The Group has not early adopted any standard, interpretation or amendment that has been issued but is not yet effective.
IFRS 9, IAS 39, IFRS 7, IFRS 4 and IFRS 16 Amendments – Interest Rate Benchmark Reform – Phase 2
In August 2020, the IASB issued IFRS 9, IAS 39, IFRS 7, IFRS 4 and IFRS 16 Amendments Interest Rate Benchmark Reform – Phase 2. The amendments address issues not dealt with in the previous amendments which affect financial reporting when an existing interest rate benchmark is replaced with an alternative benchmark rate. The Phase 2 amendments provide a practical expedient to allow the effective interest rate to be updated without adjusting the carrying amount when accounting for changes in the basis for determining the contractual cash flows of financial assets and liabilities, if the change is a direct consequence of the interest rate benchmark reform and the new basis for determining the contractual cash flows is economically equivalent to the previous basis immediately preceding the change. In addition, the amendments permit changes required by the interest rate benchmark reform to be made to hedge designations and hedge documentation without the hedging relationship being discontinued. Any gains or losses that could arise on transition are dealt with through the normal requirements of IFRS 9 to measure and recognise hedge ineffectiveness. The amendments also provide a temporary relief to entities from having to meet the separately identifiable requirement when the alternative benchmark rate is designated as a risk component. The relief allows an entity, upon designation of the hedge, to assume that the separately identifiable requirement is met, provided the entity reasonably expects the risk component to become separately identifiable within the next 24 months. Furthermore, the amendments require an entity to disclose additional information to enable users of financial statements to understand the effect of interest rate benchmark reform on an entity’s financial instruments and risk management strategy. The amendments are effective for annual periods beginning on or after 1 January 2021 and shall be applied retrospectively, but entities are not required to restate the comparative information.
65
The Group had certain interest-bearing bank borrowings denominated in US dollars and Euros based on the London Interbank Offered Rate (“LIBOR”) and the Europe Interbank Offered Rate (“EURIBOR”) as at 31 December 2020. If the interest rates of these borrowings are replaced by alternative benchmark rates in a future period, the Group will apply this practical expedient upon the modification of these borrowings when the “economically equivalent” criterion is met and expects that no significant modification gain or loss will arise as a result of applying the amendments to these changes.
IFRS 17 – Insurance Contracts
In May 2017, the IASB issued IFRS 17 Insurance Contracts, a comprehensive new accounting standard for insurance contracts covering recognition and measurement, presentation and disclosure, which replaces IFRS 4 Insurance Contracts.
In contrast to the requirements in IFRS 4, which are largely based on grandfathering previous local accounting policies for measurement purposes, IFRS 17 provides a comprehensive model (the general model) for insurance contracts, supplemented by the variable fee approach for contracts with direct participation features and the premium allocation approach mainly for short-duration which typically applies to certain non-life insurance contracts.
The main features of the new accounting model for insurance contracts are as follows:
| • | The fulfilment cash flows including the expected present value of future cash flows and explicit risk adjustment, remeasured every reporting period; |
| • | A contractual service margin represents the unearned profitability of the insurance contracts and is recognised in profit or loss over the coverage period; |
| • | Certain changes in the expected present value of future cash flows are adjusted against the contractual service margin and thereby recognised in profit or loss over the remaining coverage period; |
| • | The effect of changes in discount rates will be reported in either profit or loss or OCI, determined by an accounting policy choice; |
| • | The recognition of insurance revenue and insurance service expenses in the statement of comprehensive income based on the concept of services provided during the period; |
| • | Amounts that the policyholder will always receive, regardless of whether an insured event happens (non-distinct investment components) are not presented in the statement of comprehensive income, but are recognised directly in the statement of financial position; |
66
| • | Insurance services results are presented separately from the insurance finance income or expense; |
| • | Extensive disclosures to provide information on the recognised amounts from insurance contracts and the nature and extent of risks arising from these contracts. |
In June 2020, the IASB issued the amendments to IFRS 17 which include a deferral of the effective date of IFRS 17 to annual reporting periods beginning on or after 1 January 2023. Insurers qualifying for the deferral of IFRS 9 can apply both IFRS 17 and IFRS 9 for the first time to annual reporting periods beginning on or after 1 January 2023. The Group is currently assessing the impact of the implementation of the standard.
IFRS 10 and IAS 28 Amendments – Sale or Contribution of Assets between an Investor and its Associate or Joint Venture
Amendments to IFRS 10 and IAS 28 address an inconsistency between the requirements in IFRS 10 and IAS 28 in dealing with the sale or contribution of assets between an investor and its associate or joint venture. The amendments require a full recognition of a gain or loss when the sale or contribution of assets between an investor and its associate or joint venture constitutes a business. For a transaction involving assets that do not constitute a business, a gain or loss resulting from the transaction is recognised in the investor’s profit or loss only to the extent of the unrelated investor’s interest in that associate or joint venture. The IASB has deferred the effective date of these amendments indefinitely, but an entity that early adopts the amendments must apply them prospectively. The Group will apply these amendments when they become effective.
67
EMBEDDED VALUE
Assumptions
Economic assumptions: The calculations are based upon assumed corporate tax rate of 25% for all years. The investment return is assumed to be 5% per annum. 16% grading to 20% (remaining level thereafter) of the investment return is assumed to be exempt from income tax. The investment return and tax exempt assumptions are based on the Company’s strategic asset mix and expected future returns. The risk-adjusted discount rate used is 10% per annum.
Other operating assumptions such as mortality, morbidity, lapses and expenses are based on the Company’s recent operating experience and expected future outlook.
SUMMARY OF RESULTS
The embedded value as at 31 December 2020, the value of one year’s sales for the 12 months ended 31 December 2020, and the corresponding results as at 31 December 2019 are shown below:
| Components of Embedded Value | RMB million |
| 31 December | 31 December | |||||||
| ITEM | 2020 | 2019 | ||||||
A Adjusted Net Worth | 568,587 | 482,793 | ||||||
B Value of In-Force Business before Cost of Required Capital | 565,797 | 509,515 | ||||||
C Cost of Required Capital | (62,244 | ) | (50,220 | ) | ||||
D Value of In-Force Business after Cost of Required Capital (B + C) | 503,553 | 459,295 | ||||||
E Embedded Value (A + D) | 1,072,140 | 942,087 | ||||||
|
|
|
| |||||
F Value of One Year’s Sales before Cost of Required Capital | 64,354 | 63,745 | ||||||
G Cost of Required Capital | (5,981 | ) | (5,047 | ) | ||||
H Value of One Year’s Sales after Cost of Required Capital (F + G) | 58,373 | 58,698 | ||||||
Including: Value of One Year’s Sales of Individual Agent Business Sector | 57,669 | 56,972 | ||||||
|
|
|
| |||||
| Note 1: | Numbers may not be additive due to rounding. |
| Note 2: | The results of individual agent business sector for the year 2019 have been restated to allow for new sector definitions on a pro forma basis. |
68
SUMMARY OF RESULTS (continued)
The new business margin of one year’s sales of individual agent business sector for the 12 months ended 31 December 2020 is shown below:
New Business Margin of One Year’s Sales of Individual Agent Business Sector
31 December 2020 | 31 December 2019 | |||||||
By First Year Premium | 47.9 | % | 49.4 | % | ||||
By Annual Premium Equivalent | 48.1 | % | 49.4 | % | ||||
|
|
|
| |||||
| Note 1: | First Year Premium is the written premium used for calculation of the value of one year’s sales and Annual Premium Equivalent is calculated as the sum of 100 percent of first year regular premiums and 10 percent of single premiums. |
| Note 2: | The results of individual agent business sector for the year 2019 have been restated to allow for new sector definitions on a pro forma basis. |
69
Movement analysis
The following analysis tracks the movement of the embedded value from the start to the end of the Reporting Period:
| Analysis of Embedded Value Movement in 2020 | RMB million |
ITEM | ||||
A Embedded Value at the Start of Year | 942,087 | |||
B Expected Return on Embedded Value | 75,991 | |||
C Value of New Business in the Period | 58,373 | |||
D Operating Experience Variance | 567 | |||
E Investment Experience Variance | 24,024 | |||
F Methodology, Model and Assumption Changes | 950 | |||
G Market Value and Other Adjustments | (1,293 | ) | ||
H Exchange Gains or Losses | (518 | ) | ||
I Shareholder Dividend Distribution and Capital Changes | (28,626 | ) | ||
J Others | 585 | |||
K Embedded Value as at 31 December 2020 (sum A through J) | 1,072,140 | |||
|
|
| Note: | Items B through J are explained below: |
��
| B | Reflects expected impact of covered business, and the expected return on investments supporting the 2020 opening net worth. |
| C | Value of one year’s sales for the 12 months ended 31 December 2020. |
| D | Reflects the difference between actual operating experience in 2020 (including mortality, morbidity, lapse, and expenses etc.) and the assumptions. |
| E | Compares actual with expected investment returns during 2020. |
| F | Reflects the effects of appraisal methodology and model enhancement, and assumption changes. |
| G | Change in the market value adjustment from the beginning of year 2020 to 31 December 2020 and other adjustments. |
| H | Reflects the gains or losses due to changes in exchange rate. |
| I | Reflects dividends distributed to shareholders during 2020 and redemption of other equity instruments. |
| J | Other miscellaneous items. |
70
Sensitivity Results
Sensitivity tests were performed using a range of alternative assumptions. In each of the sensitivity tests, only the assumption referred to was changed, with all other assumptions remaining unchanged. The results are summarized below:
| Sensitivity Results | RMB million |
| Value of In-Force Business after Cost of Required Capital | Value of One Year’s Sales after Cost of Required Capital | |||||||
Base case scenario | 503,553 | 58,373 | ||||||
1. Risk discount rate +50bps | 480,522 | 55,630 | ||||||
2. Risk discount rate -50bps | 528,297 | 61,344 | ||||||
3. Investment return +50bps | 598,225 | 68,247 | ||||||
4. Investment return -50bps | 409,278 | 48,499 | ||||||
5. 10% increase in expenses | 497,088 | 54,817 | ||||||
6. 10% decrease in expenses | 510,018 | 61,930 | ||||||
7. 10% increase in mortality rate for non-annuity products and 10% decrease in mortality rate for annuity products | 499,989 | 57,440 | ||||||
8. 10% decrease in mortality rate for non-annuity products and 10% increase in mortality rate for annuity products | 507,089 | 59,310 | ||||||
9. 10% increase in lapse rates | 502,802 | 57,061 | ||||||
10. 10% decrease in lapse rates | 504,252 | 59,735 | ||||||
11. 10% increase in morbidity rates | 496,380 | 56,121 | ||||||
12. 10% decrease in morbidity rates | 510,867 | 60,631 | ||||||
13. Using 2019 EV appraisal assumptions | 501,482 | 59,106 | ||||||
14. Allowing for diversification in calculation of VIF | 545,333 | — | ||||||
|
|
|
| |||||
71
CORPORATE GOVERNANCE
The Company has applied the principles of the Corporate Governance Code as set out in Appendix 14 to the Rules Governing the Listing of Securities on The Stock Exchange of Hong Kong Limited, and has complied with all code provisions of the Corporate Governance Code during the Reporting Period.
PURCHASE, SALES OR REDEMPTION OF THE COMPANY’S SECURITIES
During the Reporting Period, the Company and its subsidiaries did not purchase, sell or redeem any of the Company’s listed securities.
ELIGIBILITY FOR ATTENDING THE ANNUAL GENERAL MEETING AND CLOSURE OF REGISTER OF MEMBERS FOR H SHARES
The H Share register of members of the Company will be closed for the purpose of determining H Share shareholders’ entitlement to attend the Annual General Meeting, from Saturday, 29 May 2021 to Wednesday, 30 June 2021 (both days inclusive), during which period no transfer of H Shares will be registered. In order to attend the Annual General Meeting, H Share shareholders should ensure that all transfer documents, accompanied by the relevant share certificates, are lodged with the Company’s H Share registrar, Computershare Hong Kong Investor Services Limited, at Shops 1712-1716, 17th Floor, Hopewell Centre, 183 Queen’s Road East, Wanchai, Hong Kong, not later than 4:30 p.m. on Friday, 28 May 2021.
RECOMMENDATION OF FINAL DIVIDEND, WITHHOLDING AND PAYMENT OF INCOME TAX, AND CLOSURE OF REGISTER OF MEMBERS FOR H SHARES
The Board of Directors has recommended a final dividend of RMB0.64 per share (inclusive of tax), amounting to a total of approximately RMB18,089 million, subject to the approval of shareholders at the forthcoming Annual General Meeting scheduled on Wednesday, 30 June 2021. If approved, the final dividend is expected to be paid on Thursday, 26 August 2021 to the H Share shareholders whose names appear on the H Share register of members of the Company on Wednesday, 14 July 2021.
The H Share register of members of the Company will be closed from Friday, 9 July 2021 to Wednesday, 14 July 2021 (both days inclusive), during which period no transfer of H Shares will be registered. In order to be entitled to the dividend, H Share shareholders should ensure that all transfer documents, accompanied by the relevant share certificates, are lodged with the Company’s H Share registrar, Computershare Hong Kong Investor Services Limited, at Shops 1712-1716, 17th Floor, Hopewell Centre, 183 Queen’s Road East, Wanchai, Hong Kong, not later than 4:30 p.m. on Thursday, 8 July 2021.
72
According to the Enterprise Income Tax Law of the People’s Republic of China (《中華人民共和國企 業所得稅法》) and its implementation regulations which came into effect on 1 January 2008 and were amended on 29 December 2018 and other relevant rules and regulations, the Company is required to withhold and pay enterprise income tax at the rate of 10% before distributing the 2020 final dividend to non-resident enterprise shareholders as appearing on the H Share register of members of the Company. Any shares registered in the name of non-individual registered shareholders, including HKSCC Nominees Limited, other nominees, trustees or other groups and organizations, will be treated as being held by non- resident enterprise shareholders and therefore will be subject to the withholding of the enterprise income tax.
Pursuant to the Individual Income Tax Law of People’s Republic of China (《中華人民共和國個人 所得稅法》) and its implementation regulations and other relevant rules and regulations, the Company is required to withhold and pay individual income tax before distributing the 2020 final dividend to individual shareholders as appearing on the H Share register of members of the Company (the “Individual H Shareholders”). However, the Individual H Shareholders may be entitled to certain tax preferential treatments pursuant to the tax treaties between the PRC and the countries (regions) in which the Individual H Shareholders are domiciled and the tax arrangements between Mainland China and Hong Kong (Macau). In this regard, the Company will implement the following arrangements in relation to the withholding and payment of individual income tax for the Individual H Shareholders:
| • | For Individual H Shareholders who are Hong Kong or Macau residents or whose country (region) of domicile is a country (region) which has entered into a tax treaty with the PRC stipulating a tax rate of 10%, the Company will withhold and pay individual income tax at the rate of 10% on behalf of the Individual H Shareholders in the distribution of final dividend; |
| • | For Individual H Shareholders whose country (region) of domicile is a country (region) which has entered into a tax treaty with the PRC stipulating a tax rate of less than 10%, the Company will temporarily withhold and pay individual income tax at the rate of 10% on behalf of the Individual H Shareholders in the distribution of final dividend; |
| • | For Individual H Shareholders whose country (region) of domicile is a country (region) which has entered into a tax treaty with the PRC stipulating a tax rate of more than 10% but less than 20%, the Company will withhold and pay individual income tax at the effective tax rate stipulated in the relevant tax treaty in the distribution of final dividend; |
| • | For Individual H Shareholders whose country (region) of domicile is a country (region) which has entered into a tax treaty with the PRC stipulating a tax rate of 20%, or a country (region) which has not entered into any tax treaties with the PRC, or under any other circumstances, the Company will withhold and pay individual income tax at the rate of 20% on behalf of the Individual H Shareholders in the distribution of final dividend. |
73
If Individual H Shareholders consider that the tax rate adopted by the Company for the withholding and payment of individual income tax on their behalf is not the same as the tax rate stipulated in any tax treaties between the PRC and the countries (regions) in which they are domiciled, please submit promptly to the H Share registrar of the Company, Computershare Hong Kong Investor Services Limited, a letter of entrustment and all application materials showing that they are residents of a country (region) which has entered into a tax treaty with the PRC. The Company will then submit the above documents to competent tax authorities who will proceed with the subsequent tax related arrangements.
As to the A Shareholders, it is expected that the Company will complete the distribution of the 2020 final dividend by Thursday, 15 July 2021. The Company will announce separately on the Shanghai Stock Exchange details of the arrangement regarding the distribution of the 2020 final dividend to its A Share shareholders.
For Hong Kong investors (including enterprises and individuals) investing in the Company’s A Shares via the Shanghai Stock Connect Program, their dividends will be distributed in RMB by the Company through the Shanghai Branch of China Securities Depository and Clearing Corporation Limited to the account of the nominee holding such A Shares. The Company will withhold and pay income tax at the rate of 10% on behalf of those investors. For investors via the Shanghai Stock Connect Program who are tax residents of other countries and whose country of domicile is a country which has entered into a tax treaty with the PRC stipulating a dividend tax rate of less than 10%, those enterprises or individuals may, or may entrust a withholding agent to, apply to the competent tax authorities for the entitlement of the rate under such tax treaty. Upon approval by the tax authorities, the paid amount in excess of the tax payable based on the tax rate according to such tax treaty will be refunded. The record date, the dividend distribution date and other arrangements for investors via the Shanghai Stock Connect Program will be the same as those for the Company’s A Share shareholders.
For Shanghai and Shenzhen investors (including enterprises and individuals) investing in the Company’s H Shares via the Hong Kong Stock Connect Program, the Shanghai Branch and the Shenzhen Branch of China Securities Depository and Clearing Corporation Limited, as the nominees of the holders of H Shares for investors via the Hong Kong Stock Connect Program, will receive the dividends distributed by the Company and distribute such dividends to the relevant investors through its depositary and clearing system. The final dividend to be distributed to the investors of H Shares via the Hong Kong Stock Connect Program will be paid in RMB. The record date for investors of H Shares via the Hong Kong Stock Connect Program will be the same as that for the H Share shareholders of the Company. If approved at the Annual General Meeting, the final dividend is expected to be paid on Tuesday, 31 August 2021 to the investors of H Shares via the Hong Kong Stock Connect Program. Pursuant to the Notice on Relevant Taxation Policies Concerning the Pilot Inter-connected Mechanism for Trading on the Shanghai Stock Market and the Hong Kong Stock Market (Cai Shui [2014] No. 81) (《關於滬港股票市場交易互聯互通機制試點有關稅收政策的通知》(財稅[2014]81 號) ) promulgated on 17 November 2014, the Notice on Relevant Taxation Policies Concerning the Pilot Inter-connected Mechanism for Trading on the Shenzhen Stock Market and the Hong Kong Stock Market (Cai Shui [2016] No. 127) (《關於深港股票市場交易互聯互通機制試點有關稅收政策的通知》(財稅[2016]127號) ) promulgated on 5 December 2016, the Notice of the Ministry of Finance, the State Administration of Taxation and the China Securities Regulatory Commission on Continuing to Implement the Relevant Individual Income Tax Policy Concerning the Inter-connected Mechanism for Trading on the Shanghai Stock Market and the Hong Kong Stock Market (Cai Shui [2017] No. 78) (《財政部稅務總局證監會關於繼續執行滬港股票市場交易互聯互通機制有關個人所得稅政策的通知》(財稅[2017]78號)) promulgated on 17 November 2017 and the Announcement on the Continued Implementation of the Individual Income Tax Policies on the Inter-connected Mechanisms for Trading on the Shanghai and Hong Kong Stock Markets and for Trading on the Shenzhen and Hong Kong Stock Markets and on the Mutual Recognition of Funds between the Mainland and Hong Kong (Announcement No. 93 [2019] of the Ministry of Finance, the State Taxation Administration and the China Securities Regulatory Commission) (《關於繼續執行滬港、深港股票市場交易互聯互通機制和內地與香港基金互認有關個人所得稅政策的公告》(財政部稅務總局證監會公告2019 年第93 號)) promulgated on 5 December 2019:
74
| • | For Mainland individual investors who invest in the H Shares of the Company via the Hong Kong Stock Connect Program, the Company will withhold individual income tax at the rate of 20% in the distribution of the final dividend. Individual investors may, by producing valid tax payment proofs, apply to the competent tax authority of China Securities Depository and Clearing Corporation Limited for tax refund relating to the withholding tax already paid abroad. For Mainland securities investment funds that invest in the H Shares of the Company via the Hong Kong Stock Connect Program, the Company will withhold individual income tax in the distribution of the final dividend pursuant to the foregoing provisions; |
| • | For Mainland enterprise investors that invest in the H Shares of the Company via the Hong Kong Stock Connect Program, the Company will not withhold the income tax in the distribution of the final dividend and the Mainland enterprise investors shall file the tax returns on their own. |
REVIEW OF ANNUAL RESULTS
The Audit Committee of the Board of Directors of the Company has reviewed the annual results of the Company for the year ended 31 December 2020. The 2020 consolidated financial statements of the Company prepared in accordance with the International Financial Reporting Standards have been audited by Ernst & Young based on the International Standards on Auditing and Ernst & Young has issued standard unqualified opinions on the 2020 consolidated financial statements.
PUBLICATION OF ANNUAL REPORT
The Company’s annual report will be published on the Company’s website (http://www.e-chinalife.com) and the HKExnews’ website of Hong Kong Exchanges and Clearing Limited (http://www.hkexnews.hk) in due course.
75
This announcement is published in both English and Chinese. Should there be any inconsistency between the Chinese and English versions, the Chinese version shall prevail.
As at the date of this announcement, the Board of Directors of the Company comprises:
| Executive Directors: | Wang Bin, Su Hengxuan, Li Mingguang | |
| Non-executive Directors: | Yuan Changqing, Wang Junhui | |
| Independent Non-executive Directors: | Chang Tso Tung Stephen, Robinson Drake Pike, | |
| Tang Xin, Leung Oi-Sie Elsie |
| By Order of the Board |
| CHINA LIFE INSURANCE COMPANY LIMITED Wang Bin |
| Chairman |
Beijing, China
25 March 2021
76