Exhibit 99.1
China Life Insurance Company Limited Stoke Code : 2628 Annual Report 2021
The Company is a life insurance company established in Beijing, China on 30 June 2003 according to the Company Law and the Insurance Law of the People’s Republic of China. The Company was successfully listed on the New York Stock Exchange, the Hong Kong Stock Exchange and the Shanghai Stock Exchange on 17 and 18 December 2003, and 9 January 2007, respectively. The Company’s registered capital is RMB28,264,705,000.
The Company is a leading life insurance company in China and possesses an extensive distribution network comprising exclusive agents, direct sales representatives, and dedicated and non-dedicated agencies. The Company is one of the largest institutional investors in China, and becomes one of the largest insurance asset management companies in China through its controlling shareholding in China Life Asset Management Company Limited. The Company also has controlling shareholding in China Life Pension Company Limited.
Our products and services include individual life insurance, group life insurance, and accident and health insurance. The Company is a leading provider of individual and group life insurance, annuity products and accident and health insurance in China. As at 31 December 2021, the Company had approximately 323 million long-term individual and group life insurance policies, annuity contracts, and long-term health insurance policies in force. We also provide both individual and group accident and short-term health insurance policies and services.
CONTENTS
| 01 PRELUDE | 2 | |||
Core Competitiveness | 2 | |||
Honors and Awards | 3 | |||
Business Highlights | 5 | |||
Financial Summary | 6 | |||
| 02 LETTER TO SHAREHOLDERS | 12 |
| 03 MANAGEMENT DISCUSSION AND ANALYSIS | 15 | |||
Review of Business Operations in 2021 | 15 | |||
Business Analysis | 19 | |||
Analysis of Specific Items | 29 | |||
Technology Empowerment and Operations and Services | 32 | |||
Future Prospect | 33 | |||
| 04 EMBEDDED VALUE | 34 |
| 05 SIGNIFICANT EVENTS | 40 | |||
Material Litigations or Arbitrations | 40 | |||
Major Connected Transactions | 40 | |||
Material Contracts and Their Performance | 48 | |||
Undertakings | 48 | |||
Alleged Violation of Laws and Regulations, Penalties Imposed and Rectification | 49 | |||
Restriction on Major Assets | 49 | |||
Performance of Environmental and Social Responsibilities | 49 | |||
| 06 CORPORATE GOVERNANCE | 52 | |||
Report of the Board of Directors | 52 | |||
Report of the Board of Supervisors | 61 | |||
Changes in Ordinary Shares and Shareholders Information | 65 | |||
Directors, Supervisors, Senior Management and Employees | 68 | |||
Report of Corporate Governance | 82 | |||
| 07 OTHER INFORMATION | 116 | |||
Basic Information of the Company | 116 | |||
Index of Information Disclosure Announcements | 119 | |||
Definitions and Material Risk Alert | 123 | |||
| 08 FINANCIAL REPORT | 124 | |||
Independent Auditor’s Report | 124 | |||
Consolidated Statement of Financial Position | 131 | |||
Consolidated Statement of Comprehensive Income | 133 | |||
Consolidated Statement of Changes in Equity | 135 | |||
Consolidated Statement of Cash Flows | 136 | |||
Notes to the Consolidated Financial Statements | 138 | |||
Core Competitiveness
Long history and excellent brand | The predecessor of the Company, one of the first batch of enterprises to underwrite insurance business in China, was approved by the Chinese Government for establishment in October 1949. After the restructuring and reorganization, the Company was successively listed at home and abroad, becoming the first financial insurance enterprise in China triple-listed on the Shanghai Stock Exchange, the Hong Kong Stock Exchange and the New York Stock Exchange. The Company has been playing the role of an explorer and pioneer in China’s life insurance industry, and through long-term and continuous brand building, China Life has become one of the famous and strong brands in the world with growing brand value and influence. | |||||||
Prominent principal business and sound financial strength
| The Company sticks to the original role of insurance and further explores the huge potentials of the life insurance market. The Company has a sound institutional and services network, with its business outlets and services counters covering both urban and rural areas across China, which forms a powerful distribution and services network and through which the Company maintains its leading position in China’s life insurance market and becomes the life insurance service provider within the reach of customers. Through the long-term development and accumulation, China Life has solid financial strength comparable to world-class enterprises in the world, with its total assets ranking No. 1 in the life insurance industry in China. As one of the largest institutional investors in China, the Company becomes one of the largest insurance asset management companies in China through its controlling shareholding in China Life Asset Management Company Limited. | |||||||
Convenient services and superb customer experience | The Company adheres to the service concept of “honest and trustworthy, professional and efficient, customer-oriented, and first-class experience”, develops the operation model of “multiple accesses at the front-end, intelligent centralization at the headquarters, and comprehensive sharing for operations”, and has established a customer-oriented digital operation and service system. The Company keeps considering and catering to demands of its customers, devoting itself to improve customer experience, and providing customers with “convenient, quality and caring” services. The Company also adheres to the concept of “people-oriented, caring for life, creating value and serving the community”, with the aim to consistently contribute to the protection of people’s good life. | |||||||
Leading technologies and innovation empowerment
| The Company implements the “Technology-driven China Life” development strategy in great depth by adhering to the leading concept of technological innovation. The Company has established digital platforms closely integrating online and offline resources with teams and outlets as the support and industry-leading hybrid clouds as the base, creating an open, win-win and diversified digital insurance ecosystem, facilitating the Company’s digital transformation in all aspects, and accelerating the replacement of old growth drivers with new ones, through which the Company’s business operation is empowered in all aspects, and the Company is able to provide smart, convenient, efficient and well-targeted comprehensive financial and insurance services to the public. | |||||||
Professional and stable core team | During the long course of its development, the Company has accumulated a wealth of experience in operation and management and has a stable and professional management team that is well versed in the art of management in China’s life insurance market. The Company’s core management team and key personnel comprise those who have in-depth knowledge and understanding of the life insurance market in China, including the Company’s senior management, experienced underwriting personnel, insurance actuaries, investment managers and risk management teams. During the Reporting Period, there was no change of the above personnel which might have a material impact on the Company. The Company has been pushing forward the reform of the market-oriented remuneration system, continuously stimulating its internal vitality, and building a talent team that matches its high-quality development. | |||||||
2
Honors and Awards
“2021 Forbes Global 2000”, ranking 49th
Forbes
“2021 Fortune China 500 List”, ranking 8th
Fortune China
“Most Respected Enterprise in Asia (Insurance Industry)”
Institutional Investor
“2021 Best Life Insurance Company in Asia”
21st Century Business Herald
“Best Listed Company”
“Listed Company with the Best Investment Value for the 14th Five-Year Plan Period”
Hong Kong Tai Kung Wen Wei Media Group, the Listed Companies Association of Beijing, Hong Kong Chinese Enterprises Association, the Chinese Financial Association of Hong Kong, the Chinese Securities Association of Hong Kong, the Hong Kong Chartered Governance Institute and Hong Kong Securities Professionals Association “Assessment and Selection of the 11th China Securities 2021 ‘Golden Bauhinia’ Awards”
“Golden Dragon Award – 2021 Best Listed Insurance Company”
Financial Times
“Gold Medal List of Chinese Financial Institution”
“New Fortune Best Listed Company”
New Fortune “Assessment and Selection of the 3rd New Fortune Best Listed Company”

3
“Ark Prize for Insurance Company with
High-quality Development in 2021”
“Ark Prize for Golden Insurance Service in 2021” “Ark Prize for Technological Progress of China’s Insurance Industry in 2021”
Securities Times
“Assessment and Selection of the Ark Prizes for China’s Insurance Industry in 2021”
“Annual Insurance Protection Brand Top Award”
Shanghai Securities News
“Assessment and Selection of the 12th ‘Golden Wealth Management’”
“Investment Golden Bull Award for Insurance Company”
China Securities Journal “Assessment and Selection of Investment Golden Bull Awards for China’s Insurance Industry in 2021”
“Influential Insurance Company of the Year” “Sustainable and Green Development Award”
Hexun.com
The “19th Financial Annual Champion Awards”
“Social Responsibility Award of the Year”
Caijing “Assessment and Selection of the 2021 Evergreen Awards”
“Bronze Prize for Global Innovator”
European Financial Management and Marketing Association (EFMA) and Accenture “Efma-Accenture Innovation in Insurance Awards”

4
5
Financial Summary
MAJOR FINANCIAL DATA AND INDICATORS FOR THE PAST FIVE YEARS1
| RMB million | ||||||||||||||||||||||||
| Under International Financial Reporting Standards (IFRS) | ||||||||||||||||||||||||
Major Financial Data | 2021 | 2020 | Change | 2019 | 2018 | 2017 | ||||||||||||||||||
For the year ended | ||||||||||||||||||||||||
Total revenues | 824,930 | 805,049 | 2.5 | % | 729,499 | 627,472 | 643,379 | |||||||||||||||||
Net premiums earned | 611,251 | 604,666 | 1.1 | % | 560,278 | 532,023 | 506,910 | |||||||||||||||||
Benefits, claims and expenses | 784,763 | 758,239 | 3.5 | % | 677,722 | 621,310 | 608,855 | |||||||||||||||||
Insurance benefits and claims expenses | 618,754 | 580,801 | 6.5 | % | 509,467 | 479,219 | 466,043 | |||||||||||||||||
Profit before income tax | 50,495 | 54,476 | -7.3 | % | 59,788 | 13,907 | 41,667 | |||||||||||||||||
Net profit attributable to equity holders of the Company | 50,921 | 50,257 | 1.3 | % | 58,281 | 11,382 | 32,249 | |||||||||||||||||
Net profit attributable to ordinary shareholders of the Company | 50,921 | 50,056 | 1.7 | % | 57,887 | 10,998 | 31,869 | |||||||||||||||||
Net cash inflow/(outflow) from operating activities | 286,448 | 304,019 | -5.8 | % | 286,028 | 147,551 | 200,990 | |||||||||||||||||
As at 31 December | ||||||||||||||||||||||||
Total assets | 4,891,085 | 4,252,466 | 15.0 | % | 3,726,791 | 3,254,460 | 2,897,656 | |||||||||||||||||
Investment assets2 | 4,716,401 | 4,095,491 | 15.2 | % | 3,573,199 | 3,104,065 | 2,753,176 | |||||||||||||||||
Total liabilities | 4,404,427 | 3,795,529 | 16.0 | % | 3,317,432 | 2,931,146 | 2,572,308 | |||||||||||||||||
Total equity holders’ equity | 478,585 | 450,056 | 6.3 | % | 403,779 | 318,393 | 320,967 | |||||||||||||||||
Per share (RMB) | ||||||||||||||||||||||||
Earnings per share (basic and diluted)3 | 1.80 | 1.77 | 1.7 | % | 2.05 | 0.39 | 1.13 | |||||||||||||||||
Equity holders’ equity per share3 | 16.93 | 15.92 | 6.3 | % | 14.29 | 11.26 | 11.36 | |||||||||||||||||
Ordinary share holders’ equity per share3 | 16.93 | 15.92 | 6.3 | % | 14.01 | 10.99 | 11.08 | |||||||||||||||||
Net cash inflow/(outflow) from operating activities per share3 | 10.13 | 10.76 | -5.8 | % | 10.12 | 5.22 | 7.11 | |||||||||||||||||
Major financial ratios | ||||||||||||||||||||||||
Weighted average ROE (%) | 10.97 | 11.83 | | decrease of 0.86 percentage point | | 16.47 | 3.54 | 10.49 | ||||||||||||||||
Gearing ratio4 (%) | 90.05 | 89.25 | | increase of 0.80 percentage point | | 89.02 | 90.07 | 88.77 | ||||||||||||||||
Gross investment yield5 (%) | 4.98 | 5.30 | | decrease of 0.32 percentage point | | 5.24 | 3.29 | 5.16 | ||||||||||||||||
6
Notes:
| 1. | The financial data of previous years for this report have been restated due to a business combination under common control this year. For details, please refer to Note 35 in the Notes to the Consolidated Financial Statements in this annual report. |
| 2. | Investment assets = Cash and cash equivalents + Securities at fair value through profit or loss + Available-for-sale securities + Held-to-maturity securities + Term deposits + Derivative financial assets + Securities purchased under agreements to resell + Loans + Statutory deposits-restricted + Investment properties + Investments in associates and joint ventures |
| 3. | In calculating the percentage change of the “Earnings per share (basic and diluted)”, “Equity holders’ equity per share”, “Ordinary share holders’ equity per share” and “Net cash inflow/(outflow) from operating activities per share”, the tail differences of the basic figures have been taken into account. |
| 4. | Gearing ratio = Total liabilities/Total assets |
| 5. | Gross investment yield = (Gross investment income – Interest paid for securities sold under agreements to repurchase)/((Investment assets at the end of the previous year – Securities sold under agreements to repurchase at the end of the previous year – Derivative financial liabilities at the end of the previous year + Investment assets at the end of the period – Securities sold under agreements to repurchase at the end of the period – Derivative financial liabilities at the end of the period)/2) |
7
MAJOR ITEMS OF THE CONSOLIDATED FINANCIAL STATEMENTS AND THE REASONS FOR CHANGE
| RMB million | ||||||||||||||
Major Items of the Consolidated Statement of Financial Position | As at 31 December 2021 | As at 31 December 2020 | Change | Main Reasons for Change | ||||||||||
Term deposits | 529,488 | 545,678 | -3.0 | % | — | |||||||||
Held-to-maturity securities | 1,533,753 | 1,189,369 | 29.0 | % | An increase in the allocation of government bonds | |||||||||
Available-for-sale securities | 1,429,287 | 1,215,603 | 17.6 | % | An increase in the allocation of bonds in available-for-sale securities | |||||||||
Securities at fair value through profit or loss | 206,771 | 161,570 | 28.0 | % | An increase in the allocation of debt-type assets in securities at fair value through profit or loss | |||||||||
Securities purchased under agreements to resell | 12,915 | 7,947 | 62.5 | % | The needs for liquidity management | |||||||||
Cash and cash equivalents | 60,440 | 56,655 | 6.7 | % | The needs for liquidity management | |||||||||
Investments in associates and joint ventures | 257,953 | 239,584 | 7.7 | % | New investments in associates and joint ventures and an increase in the equity of associates and joint ventures | |||||||||
Insurance contracts | 3,419,899 | 2,973,225 | 15.0 | % | The accumulation of insurance liabilities from new policies and renewals | |||||||||
Investment contracts | 313,594 | 288,212 | 8.8 | % | An increase in the scale of universal insurance accounts | |||||||||
Securities sold under agreements to repurchase | 239,446 | 122,249 | 95.9 | % | The needs for liquidity management | |||||||||
Annuity and other insurance balances payable | 56,818 | 55,031 | 3.2 | % | An increase in maturities payable | |||||||||
Interest-bearing loans and other borrowingNote | 18,686 | 19,556 | -4.4 | % | The fluctuation of exchange rate | |||||||||
Deferred tax liabilities | 7,481 | 15,286 | -51.1 | % | The change in fair value of financial assets | |||||||||
Equity holders’ equity | 478,585 | 450,056 | 6.3 | % | Due to the combined impact of total comprehensive income and profit distribution during the Reporting Period | |||||||||
| Note: | Interest-bearing loans and other borrowings include a three-year bank loan of EUR330 million with a maturity date on 8 September 2023, a five-year bank loan of GBP275 million with a maturity date on 25 June 2024, a five-year bank loan of USD860 million with a maturity date on 16 September 2024, and a six-month bank loan of EUR127 million with a maturity date on 13 January 2022, which is automatically renewed upon maturity pursuant to the terms of the agreement, and a six-month bank loan of EUR78 million with a maturity date on 5 January 2022, which is automatically renewed upon maturity pursuant to the terms of the agreement. All the above are fixed rate bank loans. Interest-bearing loans and other borrowings also include a five-year bank loan of USD970 million with a maturity date on 27 September 2024, and an eighteen-month bank loan of EUR110 million with a maturity date on 9 March 2022, both of which are floating rate loans. |
8
| For the year ended 31 December | RMB million | |||||||||||
Major Items of the Consolidated | 2021 | 2020 | Change | Main Reasons for Change | ||||||||
Net premiums earned | 611,251 | 604,666 | 1.1% | — | ||||||||
Life insurance business | 480,214 | 479,600 | 0.1% | — | ||||||||
Health insurance business | 114,549 | 109,091 | 5.0% | Great efforts made by the Company in the development of health insurance business | ||||||||
Accident insurance business | 16,488 | 15,975 | 3.2% | — | ||||||||
Investment income | 178,387 | 154,497 | 15.5% | An increase in interest income from debt-type investments | ||||||||
Net realised gains on financial assets | 20,344 | 14,583 | 39.5% | An increase in spread income of stocks in available-for-sale securities | ||||||||
Net fair value gains through profit or loss | 4,943 | 21,900 | -77.4% | Due to the market value fluctuation of securities at fair value through profit or loss and investment operations | ||||||||
Net gains on investments of associates and joint ventures | 10,328 | 7,666 | 34.7% | An increase in the profits of certain associates | ||||||||
Other income | 10,005 | 9,403 | 6.4% | An increase in the income of management service fees by subsidiaries | ||||||||
Insurance benefits and claims expenses | 618,754 | 580,801 | 6.5% | An increase in the change of insurance contract liabilities | ||||||||
Investment contract benefits | 10,628 | 9,846 | 7.9% | An increase in the scale of universal insurance accounts | ||||||||
Policyholder dividends resulting from participation in profits | 26,511 | 28,279 | -6.3% | A decrease in investment income from the participating accounts | ||||||||
Underwriting and policy acquisition costs | 65,744 | 84,361 | -22.1% | A decrease in regular premiums of new policies | ||||||||
Finance costs | 5,598 | 3,747 | 49.4% | An increase in interest paid for securities sold under agreements to repurchase | ||||||||
Administrative expenses | 40,808 | 37,706 | 8.2% | Due to the expiration of policies on temporary expenses deduction | ||||||||
Income tax | (1,917 | ) | 3,103 | N/A | Due to the combined impact of income tax payable and deferred income tax | |||||||
Net profit attributable to equity holders of the Company | 50,921 | 50,257 | 1.3% | Due to the stable and sound business operations of the Company, satisfactory results in investment, and updated discount rate assumptions for reserves of traditional insurance contracts based on market information as at the date of the statement of financial position | ||||||||
9


PURSUING THE HIGH-QUALITY Being committed to the new development concept at a new development stage, the Company fully implemented the national strategy and deployment, and made its contributions to the new development landscape. With stability as the top priority, we worked hard and overcame many difficulties to push forward the high-quality development of the Company, achieving steady progress and setting up a good start for the 14th Five-Year Plan period.
Letter to Shareholders
Dear Shareholders,
The year 2021 marked a starting point for China to build a new development landscape. Being committed to the new development concept at a new development stage, the Company fully implemented the national strategy and deployment, and made its contributions to the new development landscape. With stability as the top priority, we worked hard and overcame many difficulties to push forward the high-quality development of the Company, achieving steady progress and setting up a good start for the 14th Five-Year Plan period.
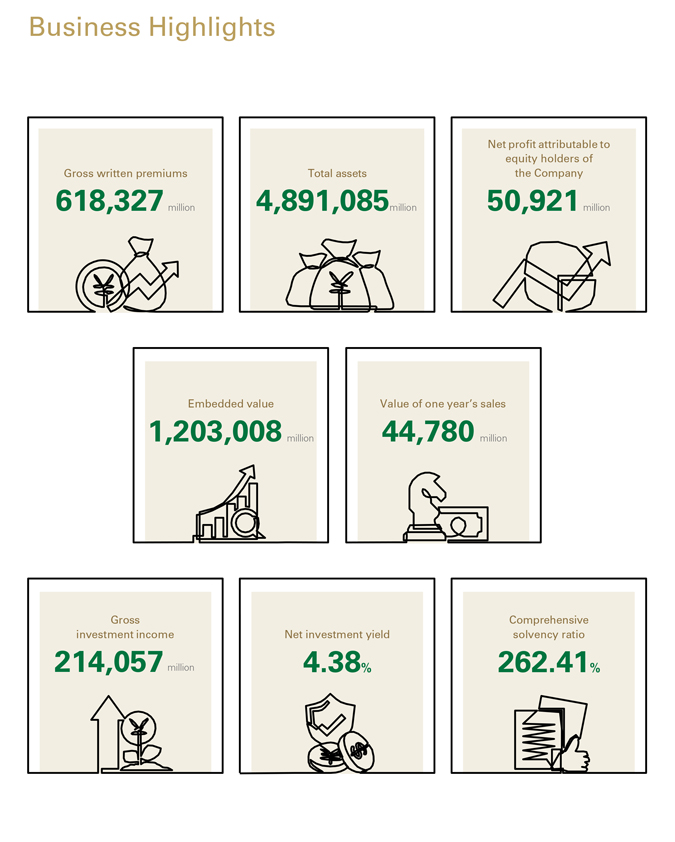
During the Reporting Period, the Company’s gross written premiums amounted to RMB618,327 million, and the embedded value reached RMB1,203,008 million, maintaining the leading position in the industry in both business scale and value. Our total assets were RMB4,891,085 million, increasing by 15.0% from the end of 2020. Net profit attributable to equity holders of the Company was RMB50,921 million, an increase of 1.3% year on year. As at the end of the Reporting Period, the core solvency ratio and the comprehensive solvency ratio were 253.7 0% and 262. 41%, respectively, which remained at a high level. The Board has proposed to distribute an annual cash dividend of RMB0.65 per share (inclusive of tax), and such proposal will be submitted to the 2021 Annual General Meeting for review and discussion.
Looking back at 2021, the domestic economy was facing several challenges, such as a complicated and severe international environment and sporadic outbreaks of the pandemic, and development of the insurance industry saw great pressure with the release of demands for insurance consumption slowing down, and the industry still in the throes of transformation and upgrade. China Life, being people-centered, actively responded to major challenges by focusing on its principal businesses, made arduous efforts in coordinating pandemic prevention and control as well as operation management, and achieved prominent progress in a variety of fields, such as serving the overall national development, business performance, transformation and innovation and risk control, etc., which further enhanced the Company’s comprehensive strengths. In the evaluation of operations of insurance companies by the Insurance Association of China, the Company was awarded Grade A for six consecutive years. In 2021, the Company ranked 49th and 8th in the Forbes Global 2000 and the Fortune China 500, respectively, and received many honors, such as “Best Listed Company and Listed Company with the Best Investment Value for the 14th Five-Year Plan Period” from the 11th China Securities 2021 “Golden Bauhinia” Awards and “Most Respected Enterprise in Asia (insurance industry)” from the Institutional Investor.
We proactively leveraged advantages of our principal businesses to serve the overall national development. We firmly took the responsibility of serving the overall interests of national development, and acted as a main force in implementing the national strategies of Healthy China program and proactively responding to population aging. We actively participated in the construction of a multi-level social security system. The supplementary major medical expenses insurance programs covered over 350 million people, the long-term care insurance programs covered 23 million people, the city-customized commercial medical insurance programs covered over 10 million people, and the pilot programs for the exclusive commercial pension insurance were carried out in an orderly manner. By sticking to the role of the financial industry in serving the real economy, the Company focused on major national strategies and continuously improved the quality and efficiency of its services. Our investments in the real economy in aggregate have exceeded RMB2.7 trillion, with new investments during the Reporting Period amounting to nearly RMB770 billion. Investments in serving the national strategy for regional developments have exceeded RMB1.4 trillion in total. Our green investments have accumulatively exceeded RMB300 billion, aiming at facilitating the green development strategy of “peak carbon emissions and carbon neutrality”. With the establishment of a green investment standard system, AMC, the Company’s non-wholly owned subsidiary, has launched the first ESG bond index and ESG equity index in the domestic insurance asset management industry. We fully advanced rural revitalization strategy, optimizing the rural revitalization-related insurance product supply and consistently supporting the development of key regions in need of assistance in China.
12
We demonstrated strong resilience and consistently maintained industry leadership in both business scale and value. In 2021, the insurance industry developed under multiple challenges. Prioritizing business value creation, the Company’s gross written premiums reached a new high after exceeding RMB600 billion in 2020, and the embedded value increased by 12.2% after exceeding RMB1 trillion, both maintaining its leading position in the industry. Due to the overall transformation of the industry, the value of one year’s sales of the Company decreased from the high base to RMB44,780 million, and the decline was within a reasonable range, which was a hard-won result. The Company consistently optimized the investment fund allocation towards major assets categories and the assets and liabilities were well coordinated. During the Reporting Period, the Company achieved a gross investment income of RMB214,057 million, an increase of 7.8% year on year, and realized a gross investment yield of 4.98%.
We focused on enhancing the growth drivers through continuously deepening reforms and innovation. We maintained strategic consistency and implemented the “Dingxin Project” in greater depth, laying a solid foundation for the steady development of the Company at a new stage. As the sales deployment of “Yi Ti Duo Yuan” was further deepened, we actively explored on the sales system reform and firmly promoted the transformation of the largest sales force in the industry to become more professional and specialized. The number of our high-performance agents was stable, and the foundation of our sales force remained solid. The market-oriented incentive, assessment and restraint mechanism was further promoted, and the Company’s investment center witnessed prominent results in its market-oriented reforms. Being customer-centric, we proceeded with the reform in insurance product supply to improve the multi-dimensional and multi-level product system. We strengthened service innovation and centralized operations, and continuously improved our customer experience with “convenient, quality and caring” services, with the proportion of highly satisfied customers remained at a high level. The Company constantly implemented the strategy of “Inclusive Healthcare” and “Integrated Aged-care” to expand new development space for long-term deployment.
We enhanced technology-driven development and the digital transformation was further advanced. In the digital era, we constantly strengthened the driving and supporting role of technology innovation, accelerated the digital transformation under the principle of “Collective Wisdom, Agility, and Iteration”, enhanced the technology-empowered value creation and proceeded with creating a digital insurance ecosystem to facilitate the construction of Digital China Life. We comprehensively upgraded the technological architecture, reinforced the integration of technology and business operations, and pushed forward the whole process of operation and management to be more digitalized and intelligent. Our technological adaptability was greatly improved with technology empowerment becoming increasingly prominent. Our capacity of data governance and security management was also firmly enhanced.
We coordinated development and security and consistently strengthened our risk management and control. We upheld a systematic concept to strengthen asset-liability management, adhered to robust and prudent operations and firmly held on to the bottom line of no systematic financial risks. By strictly implementing the regulatory requirements, optimizing the enterprise-wide risk management system and improving the risk management mechanism, we consistently strengthened our risk control measures and risk management capability. In the integrated risk rating for insurance industry conducted by CBIRC, the Company has received the rating of Class A for 15 consecutive quarters.
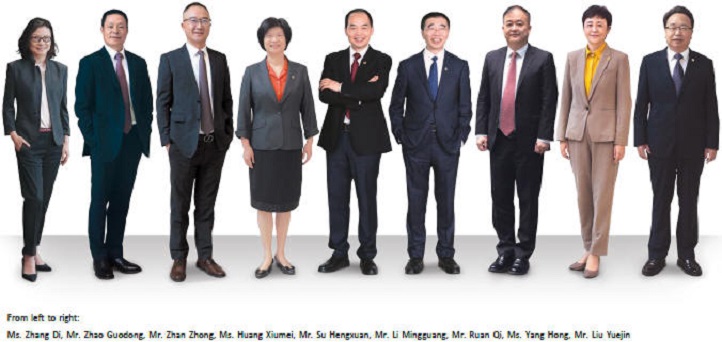
As a company listed in three listing venues, China Life committed to the best practices of corporate governance, and a sound and effective corporate governance structure has played an important role in promoting the steady operation and development of the Company. During the Reporting Period, we successfully completed the election of and formed the seventh session of the Board of Directors and the Board of Supervisors, further improving the governance structure and effectiveness. China Life will continue to push forward the construction of a corporate governance system well aligned with the characteristics of Chinese state-owned financial enterprises and put into more efforts to promote the high-quality development of the Company.
13
2022 is an important year for fully building a modern socialist country and marching towards the second Centenary Goal. At present, China’s economic development faces triple pressures of shrinking demands, supply disruption, and weakened expectations of growth, which are also seen in the life insurance industry to some extent. Despite complicated situations, we firmly believe that the long-term positive fundamentals of China’s life insurance industry remain unchanged. From the perspective of macro environment, China’s economy will maintain the sound development momentum in the long-term, and the overall social situation will remain stable. As the financial reform and opening up is accelerated in all aspects, high-quality development has become the key for the life insurance industry to achieve new progresses. With the in-depth development of the insurance supply, China will remain as one of the largest incremental markets of life insurance around the world. From the perspective of public demands, as awareness of insurance increases and consumption demands are upgraded, the demands for risk management, wealth management and health management will continue to expand, and the life insurance industry will open up a broader development space. The life insurance industry is still at an important stage full of strategic opportunities, and the long-term development situation remains promising.
“To see a thousand miles afar, we should ascend a higher mountain”. China Life and its predecessor are the participants, who witnessed and promoted the commencement, development and progress of China’s insurance industry, and grow together with the industry. Standing at a new starting point, we will strengthen our judgement on the current situation and future trend, and properly analyze challenges and opportunities. With the focus on serving the national development and the goal of “Protecting People’s Good Life”, we will seize strategic development opportunities and carry out various tasks in a down-to-earth manner. By sticking to the original role of insurance, we will consistently deepen the supply-side reforms and improve our capacity of insurance service supply with steady progress. Besides, we will lead the high-quality development of the industry with our own high-quality development, aiming to building a world-class life insurance company and rewarding the shareholders and people from all walks of life with satisfactory operating performances.
Board of Directors of China Life Insurance Company Limited |
| 24 March 2022 |

14
Management Discussion and Analysis
REVIEW OF BUSINESS OPERATIONS IN 2021
In 2021, the worldwide COVID-19 pandemic continued to evolve, and the domestic economy was facing triple pressures of shrinking demands, supply disruption, and weakened expectations of growth amid a complicated and challenging international environment. Under the unprecedented pressures, such as the decelerated release of insurance demands and decline of sales force, the growth of life insurance industry further slowed down in terms of premiums. In addition, the insurance industry regulator continued to promote the return to its original role by the insurance sector, further improved system building, and bolstered regulations in the areas of insurance product management, sales channel development, market behaviors, operations and services as well as corporate governance, with an aim at the high-quality development of the industry.
During the Reporting Period, the Company adhered to the strategic core of “Three Major Transformations, Dual
Centers and Dual Focuses, Asset-liability Interaction,” and upheld the operational guideline of “prioritizing business value, strengthening sales force, achieving stable growth, upgrading technology, optimizing customer services and guarding against risks.” By concentrating efforts and overcoming difficulties with strong resilience, the Company steadfastly promoted its high- quality development while proceeding with routine pandemic prevention and control, and achieved stable and sound business operations as a whole, with its market leading position further solidified. The quality and efficiency of its operations and services were significantly improved, digital transformation was sped up, and its comprehensive strengths were greatly enhanced.
15
The Company pushed forward the “Dingxin Project” in greater depth and made breakthroughs in several aspects. The optimization of business modes achieved remarkable results. As the customer-centric sales deployment of “Yi Ti Duo Yuan” was further deepened, the individual agent business sector consistently prioritized business value and made great efforts in improving the quality of its sales force. The diversified business sector further optimized its business modes, which saw improved capability of business value creation.
The achievements of market-oriented reforms were continuously consolidated. The market- oriented investment management system was further advanced, the classification management system of branches was continuously improved, and intensified efforts were made in promoting the assessment, incentive and restraint mechanisms for managers in key cities with optimized human resource management. The efficiency of technology empowerment continued to improve. The management system based on tech products was comprehensively implemented to facilitate the integration of technology and business operations, and digital transformation was pushed forward continuously. China Life “Internet of Things” fully covered all business units and sales outlets across China, and technology empowerment demonstrated significant effectiveness. The upgrading of operation model achieved remarkable results. Key breakthroughs were made for the operation model of “multiple accesses at the front-end, intelligent centralization at the headquarters and comprehensive sharing for operations”, and the service efficiency and experience, operation control foundation and operational risk control capability were significantly enhanced.
16
Key Performance Indicators of 2021
| RMB million | ||||||||
| 2021 | 2020 | |||||||
Gross written premiums | 618,327 | 612,265 | ||||||
Premiums from new policies | 175,864 | 193,939 | ||||||
Including: First-year regular premiums | 98,410 | 115,421 | ||||||
First-year regular premiums with a payment duration of ten years or longer | 41,682 | 56,398 | ||||||
Renewal premiums | 442,463 | 418,326 | ||||||
Gross investment income | 214,057 | 198,596 | ||||||
Net profit attributable to equity holders of the Company | 50,921 | 50,257 | ||||||
Value of one year’s sales | 44,780 | 58,373 | ||||||
Including: Individual agent business sector | 42,945 | 57,669 | ||||||
Policy Persistency Rate (14 months)1 (%) | 80.50 | 85.70 | ||||||
Policy Persistency Rate (26 months)1 (%) | 81.10 | 82.40 | ||||||
Surrender Rate2 (%) | 1.20 | 1.09 | ||||||
| As at 31 December 2021 | As at 31 December 2020 | |||||||
Embedded value | 1,203,008 | 1,072,140 | ||||||
Number of long-term in-force policies (hundred million) | 3.23 | 3.17 | ||||||
Notes:
| 1. | The Persistency Rate for long-term individual life insurance policy is an important operating performance indicator for life insurance companies. It measures the ratio of in-force policies in a pool of policies after a certain period of time. It refers to the proportion of policies that are still effective during the designated month in the pool of policies whose issue date was 14 or 26 months ago. |
| 2. | Surrender Rate = Surrender payment/(Liability of long-term insurance contracts at the beginning of the period + Premiums of long-term insurance contracts) |
17
During the Reporting Period, while the life insurance industry was under pressure and the growth of premiums continued to slow down, the Company prioritized business value and pushed forward transformation and upgrade, and maintained the industry leadership position in both business scale and value. In 2021, the Company’s gross written premiums amounted to RMB618,327 million, an increase of 1.0% year on year, and renewal premiums reached RMB442,463 million, an increase of 5.8% year on year. As at the end of the Reporting Period, the embedded value of the Company reached RMB1,203,008 million, an increase of 12.2% from the end of 2020. Due to the impact of the pandemic and the slowdown in the release of demands for insurance consumption, premiums from new policies were RMB175,864 million, a decrease of 9.3% year on year. The first-year regular premiums were RMB98,410 million, a decrease of 14.7% year on year; in particular, first-year regular premiums with a payment duration of ten years or longer were RMB41,682 million, a decrease of 26.1% year on year. In 2021, the value of one year’s sales of the Company was RMB44,780 million, a decrease of 23.3% year on year. The number of long-term in-force policies was 323 million, an increase of 1.9% from the end of 2020. The surrender rate was 1.20%, an increase of 0.11 percentage point year on year.
During the Reporting Period, in the face of a complex and changing market situation, the Company always maintained its strategic consistency, reinforced asset-liability management, firmly implemented its medium- to long-term strategic plan of asset allocation, and continuously optimized its allocation management by centering on the investment value creation chain. In 2021, the Company flexibly made tactical allocations in response to the market change, taking into account short-term income stability, prevention of key risks, and long-term opportunities. The gross investment income amounted to RMB214,057 million, an increase of 7.8% year on year, and the gross investment yield was 4.98%.
In 2021, the Company maintained stable and sound business operations and achieved satisfactory results in investment. It updated the discount rate assumptions for reserves of traditional insurance contracts based on market information as at the date of the statement of financial position. Taking the above factors into account, net profit attributable to equity holders of the Company was RMB50,921 million, an increase of 1.3% year on year. | 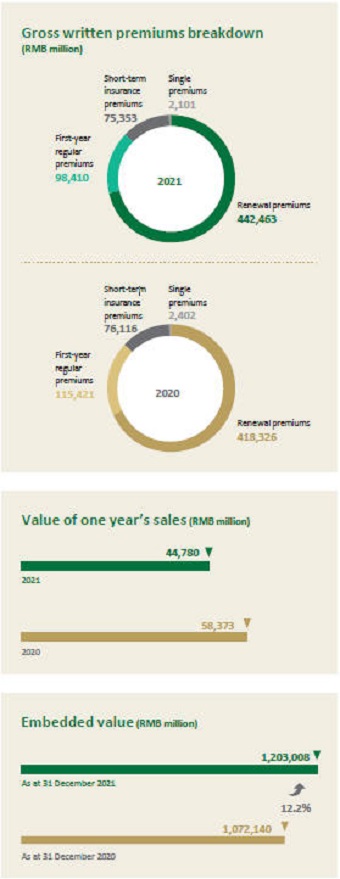 |
18
BUSINESS ANALYSIS
Figures of Gross Written Premiums
Gross written premiums categorized by business
For the year ended 31 December | RMB million | |||||||||||
| 2021 | 2020 | Change | ||||||||||
Life Insurance Business | 481,311 | 480,593 | 0.1 | % | ||||||||
First-year business | 86,882 | 108,205 | -19.7 | % | ||||||||
First-year regular | 84,820 | 106,001 | -20.0 | % | ||||||||
Single | 2,062 | 2,204 | -6.4 | % | ||||||||
Renewal business | 394,429 | 372,388 | 5.9 | % | ||||||||
Health Insurance Business | 120,609 | 115,089 | 4.8 | % | ||||||||
First-year business | 73,120 | 69,722 | 4.9 | % | ||||||||
First-year regular | 13,579 | 9,408 | 44.3 | % | ||||||||
Single | 59,541 | 60,314 | -1.3 | % | ||||||||
Renewal business | 47,489 | 45,367 | 4.7 | % | ||||||||
Accident Insurance Business | 16,407 | 16,583 | -1.1 | % | ||||||||
First-year business | 15,862 | 16,012 | -0.9 | % | ||||||||
First-year regular | 11 | 12 | -8.3 | % | ||||||||
Single | 15,851 | 16,000 | -0.9 | % | ||||||||
Renewal business | 545 | 571 | -4.6 | % | ||||||||
|
|
|
|
|
| |||||||
Total | 618,327 | 612,265 | 1.0 | % | ||||||||
|
|
|
|
|
| |||||||
| Note: | Single premiums in the above table include premiums from short-term insurance business. |
During the Reporting Period, gross written premiums from the life insurance business of the Company amounted to RMB481,311 million, rising by 0.1% year on year. Gross written premiums from the health insurance business reached RMB120,609 million, rising by 4.8% year on year. Gross written premiums from accident insurance business were RMB16,407 million, a year-on-year decrease of 1.1%.
19
Gross written premiums categorized by channel
For the year ended 31 December | 2021 | RMB million 2020 | ||||||
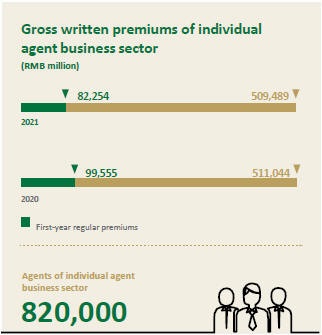
Individual Agent Business Sector1 | 509,489 | 511,044 | ||||||
First-year business of long-term insurance | 82,514 | 99,838 | ||||||
First-year regular | 82,254 | 99,555 | ||||||
Single | 260 | 283 | ||||||
Renewal business | 407,973 | 391,272 | ||||||
Short-term insurance business | 19,002 | 19,934 | ||||||
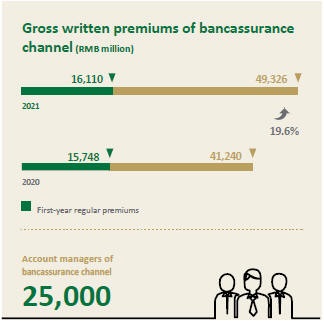
Bancassurance Channel | 49,326 | 41,240 | ||||||
First-year business of long-term insurance | 16,123 | 15,757 | ||||||
First-year regular | 16,110 | 15,748 | ||||||
Single | 13 | 9 | ||||||
Renewal business | 32,792 | 25,109 | ||||||
Short-term insurance business | 411 | 374 | ||||||
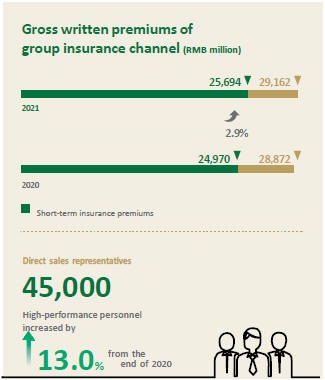
Group Insurance Channel | 29,162 | 28,872 | ||||||
First-year business of long-term insurance | 1,846 | 2,040 | ||||||
First-year regular | 44 | 110 | ||||||
Single | 1,802 | 1,930 | ||||||
Renewal business | 1,622 | 1,862 | ||||||
Short-term insurance business | 25,694 | 24,970 | ||||||
Other Channels2 | 30,350 | 31,109 | ||||||
First-year business of long-term insurance | 28 | 188 | ||||||
First-year regular | 2 | 8 | ||||||
Single | 26 | 180 | ||||||
Renewal business | 76 | 83 | ||||||
Short-term insurance business | 30,246 | 30,838 | ||||||
|
|
|
| |||||
Total | 618,327 | 612,265 | ||||||
|
|
|
| |||||
Notes:
| 1. | Premiums of individual agent business sector included premiums acquired by the general sales team and the upsales team. |
| 2. | Premiums of other channels mainly included premiums of government-sponsored health insurance business and online sales, etc. |
Insurance Business
Analysis of insurance business
In 2021, facing persistent impacts of the COVID-19 pandemic and a challenging market environment, the industry faced unprecedented pressure for transformation. The Company continued to deepen the customer-centric sales deployment of “Yi Ti Duo Yuan”, focusing on business restructuring and making breakthroughs, and stressing precise allocation of resources on the basis of standardized management. The individual agent business sector consistently prioritized business value and further promoted operation differentiation between sales teams. The diversified business sector achieved progress while maintaining stability and coordinated effectively with the individual agent business sector by concentrating on specialized operations, quality and efficiency enhancement, and transformation and innovation. As at the end of the Reporting Period, the number of total sales force of the Company was approximately 890,000.
Individual Agent Business Sector
The individual agent business sector pursued high-quality development, consistently deepened business restructuring, and achieved steady business development. During the Reporting Period, gross written premiums from the sector were RMB509,489 million, a decrease of 0.3% year on year. Renewal premiums amounted to RMB407,973 million, an increase of 4.3% year on year.
20
First-year regular premiums were RMB82,254 million, a decrease of 17.4% year on year, of which first-year regular premiums with a payment duration of ten years or longer were RMB41,580 million, a decrease of 26.0% year on year. In 2021, the value of one year’s sales of the sector was RMB42,945 million, a decrease of 25.5% year on year, and new business margin of one year’s sales by annual premium equivalent was 42.2%, a decrease of 5.9 percentage points year on year.
Affected by sporadic outbreaks of the pandemic and the challenging market environment, the whole industry had difficulties in agent recruitment and retention, and the size of sales force consequently declined to a certain extent. The Company adhered to the sales force development strategy of improving quality with stabilised quantity, and made great efforts in enhancing its quality. As at the end of the Reporting Period, the number of agents of the sector was 820,000, including 519,000 agents from the general sales team and 301,000 agents from the upsales team. The monthly average productive agents decreased compared with the previous year, however, the number of high-performance agents was stable, and the foundation of sales force remained solid. Although the sector’s development was under pressure, the Company adhered to the strategy of “productive agents-driven business” and made solid stride in business restructuring. The 4.0 version of the regular agent management system was fully promoted and implemented, and transformation of sales team was pushed forward aiming at becoming more specialized and professional.
Diversified Business Sector
Pushing forward “Dingxin Project” deployment in great depth, the diversified business sector concentrated on specialized operation as well as quality and efficiency enhancement, and actively developed the bancassurance, group insurance, and health insurance businesses.
Bancassurance Channel With equal emphasis on business scale and value, the bancassurance channel consistently pushed forward sound and healthy development. During the Reporting Period, gross written premiums from the channel amounted to RMB49,326 million, an increase of 19.6% year on year. First-year regular premiums were RMB16,110 million, an increase of 2.3% year on year; in particular, first-year regular premiums with a payment duration of five years or longer were RMB6,743 million, an increase of 35.3% year on year. Renewal premiums amounted to RMB32,792 million (a year-on-year increase of 30.6%), accounting for 66.48% of gross written premiums from the channel (a year-on-year increase of 5.59 percentage points). The bancassurance channel constantly enhanced the professional service support capability of the sales team, and the quality of which was steadily improved. As at the end of the Reporting Period, the number of the channel’s account managers was 25,000, the quarterly average active managers remained stable, and the productivity per manager increased continuously.
21
Group Insurance Channel The group insurance channel insisted on the coordination of business scale and profitability and achieved stable development in all business lines. During the Reporting Period, gross written premiums from the channel were RMB29,162 million, an increase of 1.0% year on year. Short-term insurance premiums from the channel were RMB25,694 million, an increase of 2.9% year on year. As at the end of the Reporting Period, the number of direct sales representatives was 45,000, among which the high-performance personnel increased by 13.0% from the end of 2020.
Other Channels In 2021, gross written premiums from other channels were RMB30,350 million, a decrease of 2.4% year on year. The Company proactively participated in a variety of government-sponsored health insurance businesses. As at the end of the Reporting Period, the Company carried out over 200 supplementary major medical expenses insurance programs, covering more than 350 million people. It also undertook over 400 health care entrusted programs, providing services to more than 100 million people; 61 long-term care insurance programs in 17 provinces and cities, covering 23 million people; and 170 supplementary medical insurance programs in 22 provinces and cities, covering 91 million people. The Company also participated in the construction of a multi-level social security system and implemented 54 city customized commercial medical insurance projects in 15 provinces and cities, covering more than 10 million people.
In addition, the Company greatly developed the online insurance business and provided customers with high-quality service experience through online-to-offline sales and online direct sales. In full compliance with the regulatory requirements of the CBIRC with respect to the online insurance business, the Company optimized its online organization and business system, featuring centralized operation and unified management, and offered a variety of products for different scenarios and customers. During the Reporting Period, the Company’s online insurance business grew rapidly, which was mostly achieved through online-to-offline integration with sales channels of individual agents, bancassurance and group insurance. Total premiums1 under the CBIRC caliber were RMB34,969 million, reaching a record high once again. In the future, the Company will further strengthen the online- to-offline integration of its online insurance business, actively explore on the dedicated online life insurance business, and provide customers with more convenient online insurance services.
| 1 | Including premiums from online insurance business acquired by different sales channels of the Company. |
22
Integrated Financial Sector
Being customer-centric, the Company fully leveraged the resource advantages of the fellow members of CLIC and actively engaged in the construction of a “Life Insurance plus” integrated financial ecosystem, turning the integrated financial advantages into a driving force for the high-quality development of the Company. In 2021, due to the impact of the comprehensive reform on auto insurance and the slower growth of this sector, premiums from CLP&C cross-sold by the Company were RMB21,107 million, with the number of insurance policies increased by 18.0% year on year. Additional first-year receipts of enterprise annuity funds and pension security products of AMP cross-sold by the Company were RMB28,197 million. The Company entrusted CGB to sell its bancassurance products, with the first-year regular premiums recording a relatively stable growth. The number of new debit cards and credit cards jointly issued by the Company and CGB reached 1,224,000. Meanwhile, in order to satisfy the diverse needs of its customers, the Company worked with CGB and CLP&C to carry out various operation activities to provide customers with a series of quality financial and insurance service solutions.
By integrating online and offline as well as internal and external healthcare resources, the Company improved its health management and service capabilities and actively participated in the Healthy China program. China Life Inclusive Healthcare Service Platform continued to diversify its services while upgrading its system functions. As at the end of the Reporting Period, more than a hundred types of services were available on the platform, and the size of the accumulated registered users of the platform led the industry with an increase of over 35% from the end of 2020. The Company continued to formulate the China Life aged care system and deployed towards high-quality resources in the aged care industry such as rehabilitation, medical care, hospital, health care big data, and health industrial parks through the China Life Integrated Aged Care Fund. In 2021, the China Life Integrated Aged Care Fund reserved a batch of pension and retirement projects that could meet the diversified and multi-level demands of customers in strategic regions such as Beijing-Tianjin-Hebei, the Yangtze River Economic Belt, and the Guangdong-Hong Kong-Macao Greater Bay Area.
Analysis of insurance products
Adhering to the customer-centric product development concept and the original role of insurance, the Company fully implemented major national strategies including Healthy China program, proactively responding to population aging and rural revitalization, accelerated insurance product innovation and advanced the supply-side reform of insurance products to create a diversified product system.
By closely integrating the Healthy China program with its own business development, the Company consistently optimized and upgraded its health insurance products and strengthened the innovative research and development of illness insurance products and medical insurance products, etc., in terms of the insured customer group, scope of cover, and protection functions, so as to offer diversified health protections. The Company actively served the national strategy of responding to population aging and deepened its research in insurance coverage and benefits. By leveraging the advantages of the long- term risk protection of insurance products and the long- term application of insurance fund, the Company launched the exclusive commercial pension insurance and special annuity insurance products for the elderly customers. It also developed exclusive insurance products to facilitate rural revitalization strategy, proactively playing its role in protecting people’s well-being.
In 2021, the Company newly developed and upgraded a total of 160 products, including 12 life insurance products, 138 health insurance products, two accident insurance products, and eight annuity insurance products. Out of these products, 144 were protection-oriented insurance products, and 16 were long-term savings insurance products.
23
Top five insurance products in terms of gross written premiums
| For the year ended 31 December | RMB million | |||||||||||||
Insurance product | Gross written premiums | Standard premiums from new policies1 | Major sales channel | Surrender payment | ||||||||||
China Life Xin Xiang Zhi Zun Annuity Insurance (Celebration Version) | 40,851 | 75 | Mainly through the channel of exclusive individual agents | 834 | ||||||||||
China Life Xin Yao Dong Fang Annuity Insurance | 39,573 | 11,908 | Mainly through the channel of exclusive individual agents | 293 | ||||||||||
China Life Xin Xiang Jin Sheng Annuity Insurance (Type A) | 34,094 | — | Mainly through the channel of exclusive individual agents | 586 | ||||||||||
China Life Critical Illness Group Health Insurance for Rural and Urban Citizens (Type A) | 25,112 | 25,112 | Through other channels | — | ||||||||||
China Life Xin Fu Ying Jia Annuity Insurance | 23,114 | — | Mainly through the channel of exclusive individual agents | 1,231 | ||||||||||

Notes:
| 1. | Standard premiums were calculated in accordance with the calculation methods set forth in the “Notice on Establishing the Industry Standard of Standard Premiums in the Life Insurance Industry” (Bao Jian Fa [2004] No. 102) and the “Supplementary Notice of the ‘Notice on Establishing the Industry Standard of Standard Premiums in the Life Insurance Industry’” (Bao Jian Fa [2005] No. 25) of the former China Insurance Regulatory Commission. |
| 2. | China Life Xin Xiang Jin Sheng Annuity Insurance (Type A) and China Life Xin Fu Ying Jia Annuity Insurance have been replaced by their upgraded products and are no longer on sale, and premiums from insurance business were recorded as renewal premiums. |
Top three insurance products in terms of net increase in investment contracts
| For the year ended 31 December | RMB million | |||||||||
Insurance product | Net increase in investment contracts | Major sales channel | Surrender payment | |||||||
China Life Xin Account Endowment Insurance (universal insurance) (exclusive version) | 12,580 | Mainly through the channel of exclusive individual agents | 156 | |||||||
China Life Xin Account Endowment Insurance (universal insurance) (diamond version) | 7,858 | Mainly through the channel of exclusive individual agents | 419 | |||||||
China Life Xin Zun Bao Whole Life Insurance (universal insurance) (celebration version) | 3,718 | Mainly through the channel of exclusive individual agents | 20 | |||||||


24
Insurance contracts
| RMB million | ||||||||||||
| As at 31 December 2021 | As at 31 December 2020 | Change | ||||||||||
Life insurance | 3,180,931 | 2,767,642 | 14.9 | % | ||||||||
Health insurance | 228,899 | 195,487 | 17.1 | % | ||||||||
Accident insurance | 10,069 | 10,096 | -0.3 | % | ||||||||
|
|
|
| |||||||||
Total of insurance contracts | 3,419,899 | 2,973,225 | 15.0 | % | ||||||||
|
|
|
| |||||||||
Including: Residual margin Note | 835,400 | 837,293 | -0.2 | % | ||||||||
| Note: | The residual margin is a component of insurance contract reserve, which results in no Day 1 gain at the initial recognition of an insurance contract. The residual margin is set to zero if it is negative. |
As at the end of the Reporting Period, the reserves of insurance contracts of the Company were RMB3,419,899 million, 15.0% up from RMB2,973,225 million as at the end of 2020, primarily due to the accumulation of insurance liabilities from new policies and renewals. As at the date of the statement of financial position, the reserves of various insurance contracts of the Company passed the liability adequacy test.
Analysis of claims and policyholder benefits
| RMB million | ||||||||||||
For the year ended 31 December | 2021 | 2020 | Change | |||||||||
Insurance benefits and claims expenses | 618,754 | 580,801 | 6.5 | % | ||||||||
Life insurance business | 527,863 | 490,994 | 7.5 | % | ||||||||
Health insurance business | 83,688 | 82,146 | 1.9 | % | ||||||||
Accident insurance business | 7,203 | 7,661 | -6.0 | % | ||||||||
Investment contract benefits | 10,628 | 9,846 | 7.9 | % | ||||||||
Policyholder dividends resulting from participation in profits | 26,511 | 28,279 | -6.3 | % | ||||||||
During the Reporting Period, insurance benefits and claims expenses rose by 6.5% year on year due to an increase in the change of insurance contract liabilities. In particular, due to steady growth of life insurance business, insurance benefits and claims expenses of life insurance business rose by 7.5% year on year. Insurance benefits and claims expenses of health insurance business rose by 1.9% year on year, and insurance benefits and claims expenses of accident insurance business declined by 6.0% year on year. Investment contract benefits rose by 7.9% year on year due to an increase in the scale of the universal insurance accounts. Policyholder dividends resulting from participation in profits declined by 6.3% year on year due to a decrease in investment income from the participating accounts.
25
Analysis of underwriting and policy acquisition costs and other expenses
| RMB million | ||||||||||||
For the year ended 31 December | 2021 | 2020 | Change | |||||||||
Underwriting and policy acquisition costs | 65,744 | 84,361 | -22.1 | % | ||||||||
Finance costs | 5,598 | 3,747 | 49.4 | % | ||||||||
Administrative expenses | 40,808 | 37,706 | 8.2 | % | ||||||||
Other expenses | 15,467 | 12,270 | 26.1 | % | ||||||||
Statutory insurance fund contribution | 1,253 | 1,229 | 2.0 | % | ||||||||
During the Reporting Period, underwriting and policy acquisition costs declined by 22.1% year on year due to a decrease in regular premiums from new policies. Finance costs rose by 49.4% year on year due to an increase in interest paid for securities sold under agreements to repurchase. Administrative expenses rose by 8.2% year on year due to the expiration of policies on temporary expenses deduction.
Investment Business
In 2021, domestic bond yields fluctuated within a tight range, which rose at first and then fell down, and the interest rate pivot trended downwards on the whole. The A-share market was volatile, with significant sector divergence. The Company always adhered to its strategic consistency, prioritized asset-liability management in using insurance funds, firmly implementing its medium- to long-term strategic plan of asset allocation, and making flexible tactical allocations in response to the market change. Firstly, the Company seized the opportunity of a relatively high interest rate in the first half of 2021 and increased allocation to assets with long durations such as government bonds to further narrow the duration gap. Secondly, the Company prudently controlled equity risk exposures in open market to reduce portfolio volatility and secure the investment gains. Thirdly, the Company strengthened the innovation in alternative investment models, and positioned for sectors with prime prospects to establish a diversified investment portfolio.
26
Investment portfolios
As at the end of the Reporting Period, the Company’s investment assets categorized by investment object are set out as below:
| RMB million | ||||||||||||||||
| As at 31 December 2021 | As at 31 December 2020 | |||||||||||||||
Investment category | Amount | Percentage | Amount | Percentage | ||||||||||||
Fixed-maturity financial assets | 3,672,262 | 77.86 | % | 3,076,340 | 75.12 | % | ||||||||||
Term deposits | 529,488 | 11.23 | % | 545,678 | 13.32 | % | ||||||||||
Bonds | 2,273,425 | 48.20 | % | 1,718,639 | 41.97 | % | ||||||||||
Debt-type financial products1 | 443,784 | 9.41 | % | 453,641 | 11.08 | % | ||||||||||
Other fixed-maturity investments2 | 425,565 | 9.02 | % | 358,382 | 8.75 | % | ||||||||||
Equity financial assets | 699,457 | 14.83 | % | 700,748 | 17.10 | % | ||||||||||
Common stocks | 302,090 | 6.41 | % | 350,107 | 8.55 | % | ||||||||||
Funds3 | 112,689 | 2.39 | % | 114,311 | 2.79 | % | ||||||||||
Other equity investments4 | 284,678 | 6.03 | % | 236,330 | 5.76 | % | ||||||||||
Investment properties | 13,374 | 0.28 | % | 14,217 | 0.35 | % | ||||||||||
Cash and others5 | 73,355 | 1.56 | % | 64,602 | 1.58 | % | ||||||||||
Investments in associates and joint ventures | 257,953 | 5.47 | % | 239,584 | 5.85 | % | ||||||||||
|
|
|
|
|
|
|
| |||||||||
Total | 4,716,401 | 100.00 | % | 4,095,491 | 100.00 | % | ||||||||||
|
|
|
|
|
|
|
| |||||||||
| Notes: |
| 1. | Debt-type financial products include debt investment schemes, trust schemes, project asset-backed plans, credit asset-backed securities, specialized asset management plans, and asset management products, etc. |
| 2. | Other fixed-maturity investments include policy loans, statutory deposits-restricted, and interbank certificates of deposits, etc. |
| 3. | Funds include equity funds, bond funds and money market funds, etc. In particular, the balances of money market funds as at 31 December 2021 and 31 December 2020 were RMB1,961 million and RMB1,206 million, respectively. |
| 4. | Other equity investments include private equity funds, unlisted equities, preference shares, equity investment plans and bank wealth management products, etc. |
| 5. | Cash and others include cash, cash at banks, short-term deposits, and securities purchased under agreements to resell, etc. |
As at the end of the Reporting Period, the Company’s investment assets reached RMB4,716,401 million, an increase of 15.2% from the end of 2020. Among the major types of investments, the percentage of investment in bonds rose to 48.20% from 41.97% as at the end of 2020, the percentage of term deposits changed to 11.23% from 13.32% as at the end of 2020, the percentage of investment in debt-type financial products changed to 9.41% from 11.08% as at the end of 2020, and the percentage of investment in stocks and funds (excluding money market funds) changed to 8.75% from 11.31% as at the end of 2020.
27
Investment income
For the year ended 31 December | 2021 | RMB million 2020 | ||||||
Gross investment income | 214,057 | 198,596 | ||||||
Net investment income | 188,770 | 162,783 | ||||||
Net income from fixed-maturity investments Net | 148,453 | 127,673 | ||||||
income from equity investments | 28,718 | 24,983 | ||||||
Net income from investment properties | 55 | (50 | ) | |||||
Investment income from cash and others | 1,216 | 1,841 | ||||||
Share of profit of associates and joint ventures | 10,328 | 8,336 | ||||||
Net realised gains on financial assets | 20,344 | 14,583 | ||||||
Net fair value gains through profit or loss | 4,943 | 21,900 | ||||||
Disposal gains and impairment losses of associates and joint ventures | — | (670 | ) | |||||
Net investment yield1 | 4.38 | % | 4.34 | % | ||||
Gross investment yield2 | 4.98 | % | 5.30 | % | ||||
| Notes: |
| 1. | Net investment yield = (Net investment income – Interest paid for securities sold under agreements to repurchase)/((Investment assets at the end of the previous year – Securities sold under agreements to repurchase at the end of the previous year + Investment assets at the end of the period – Securities sold under agreements to repurchase at the end of the period)/2) |
| 2. | Gross investment yield = (Gross investment income – Interest paid for securities sold under agreements to repurchase)/((Investment assets at the end of the previous year – Securities sold under agreements to repurchase at the end of the previous year – Derivative financial liabilities at the end of the previous year + Investment assets at the end of the period – Securities sold under agreements to repurchase at the end of the period – Derivative financial liabilities at the end of the period)/2) |
In 2021, the Company’s net investment income was RMB188,770 million, rising by 16.0% year on year, an increase of RMB25,987 million from 2020. Since the Company consistently increased its allocation to bonds with long durations in recent years, and the income from investments in associates and joint ventures also increased, the net investment yield was 4.38% for 2021, up by 4 basis points from 2020. The gross investment income of the Company reached RMB214,057 million, rising by 7.8% year on year, an increase of RMB15,461 million from 2020. Gross investment yield was 4.98%, down by 32 basis points from 2020. Affected by the fluctuation in the equity market, the comprehensive investment yield2 taking into account the current net fair value changes of available-for-sale securities recognized in other comprehensive income was 4.87%, down by 146 basis points from 2020.
Credit risk management
The Company’s credit asset investments mainly included credit bonds and debt-type financial products, which concentrated on sectors such as banking, transportation, non-banking finance, public utilities, and energy, and the financing entities were primarily large central-owned enterprises and state-owned enterprises. As at the end of the Reporting Period, over 97% of the credit bonds and over 99% of the debt-type financial products held by the Company were rated AAA by external rating institutions. In general, the asset quality of the Company’s credit investment products was in good condition, and the credit risks were well controlled.
| 2 | Comprehensive investment yield = (Gross investment income – Interest paid for securities sold under agreements to repurchase + Current net fair changes of available-for-sale securities recognised in other comprehensive income)/((Investment assets at the end of the previous year – Securities sold under agreements to repurchase at the end of the previous year – Derivative financial liabilities at the end of the previous year + Investment assets at the end of the period – Securities sold under agreements to repurchase at the end of the period – Derivative financial liabilities at the end of period)/2) |
28
The Company insisted on a prudent investment philosophy and carried out comprehensive risk management to prevent various investment risks. Based on a disciplined and scientific internal rating system and a multi-dimensional management mechanism of risk limits, the Company scrutinized credit profiles of targets and risk exposure concentration before investment in a prudent manner and carried out ongoing tracking after investment, effectively managing the credit risks through early identification, early warning, and early disposal. Under a market environment where credit default events occurred frequently, no credit default event occurred for the Company in 2021.
Major investments
During the Reporting Period, there was no material equity investment or non-equity investment of the Company that is subject to disclosure requirements.
ANALYSIS OF SPECIFIC ITEMS
Profit before Income Tax
| RMB million | ||||||||||||
For the year ended 31 December | 2021 | 2020 | Change | |||||||||
Profit before income tax | 50,495 | 54,476 | -7.3 | % | ||||||||
Life insurance business | 22,771 | 28,073 | -18.9 | % | ||||||||
Health insurance business | 8,599 | 11,611 | -25.9 | % | ||||||||
Accident insurance business | 1,682 | 572 | 194.1 | % | ||||||||
Other businesses | 17,443 | 14,220 | 22.7 | % | ||||||||
During the Reporting Period, profit before income tax from the life insurance business decreased by 18.9% year on year. The change in investment yield, and the change in accrued cost of reserve as a result of business accumulation, etc., contributed to the above result comprehensively. Profit before income tax from the health insurance business decreased by 25.9% year on year due to an increase in claims expenses of certain insurance businesses. Profit before income tax from the accident insurance business increased by 194.1% due to business quality improvement. Profit before income tax from other businesses increased by 22.7%, primarily due to an increase in the profits of certain associates.
Analysis of Cash Flows
Liquidity sources
The Company’s cash inflows mainly come from insurance premiums, income from non-insurance contracts, interest income, dividends and bonus, and proceeds from sale and maturity of investment assets. The primary liquidity risks with respect to these cash inflows are the risk of surrender by contract holders and policyholders, as well as the risks of default by debtors, interest rate fluctuations and other market volatilities. The Company closely monitors and manages these risks.
The Company’s cash and bank deposits can provide it with a source of liquidity to meet normal cash outflows. As at the end of the Reporting Period, the balance of cash and cash equivalents was RMB60,440 million. In addition, the vast majority of its term deposits in banks allow it to withdraw funds on deposits, subject to a penalty interest charge. As at the end of the Reporting Period, the amount of term deposits was RMB529,488 million.
The Company’s investment portfolio also provides it with a source of liquidity to meet unexpected cash outflows. It is also subject to market liquidity risk due to the large size of its investments in some of the markets in which it invests. In some circumstances, some of its holdings of investment securities may be large enough to have an influence on the market value. These factors may adversely affect its ability to sell these investments or sell them at a fair price.
Liquidity uses
The Company’s principal cash outflows primarily relate to the payables for the liabilities associated with its various life insurance, annuity, accident insurance and health insurance products, operating expenses, income taxes and dividends that may be declared and paid to its equity holders. Cash outflows arising from its insurance activities primarily relate to benefit payments under these insurance products, as well as payments for policy surrenders, withdrawals and policy loans.
The Company believes that its sources of liquidity are sufficient to meet its current cash requirements.
29
Consolidated cash flows
The Company established a cash flow testing system, and conducted regular tests to monitor the cash inflows and outflows under various scenarios and adjusted the asset portfolio accordingly to ensure sufficient sources of liquidity.
| RMB million | ||||||||||||||
For the year ended 31 December | 2021 | 2020 | Change | Main Reasons for Change | ||||||||||
Net cash inflow/(outflow) from operating activities | 286,448 | 304,019 | -5.8 | % | The change of allocation in securities at fair value through profit or loss | |||||||||
Net cash inflow/(outflow) from investing activities | (393,731 | ) | (292,799 | ) | 34.5 | % | The needs for investment management | |||||||
Net cash inflow/(outflow) from financing activities | 111,139 | (7,760 | ) | N/A | The needs for liquidity management | |||||||||
Foreign exchange gains/(losses) on cash and cash equivalents | (71 | ) | (144 | ) | -50.7 | % | — | |||||||
|
|
|
| |||||||||||
Net increase in cash and cash quivalents | 3,785 | 3,316 | 14.1 | % | — | |||||||||
|
|
|
| |||||||||||
Solvency Ratio
An insurance company shall have the capital commensurate with its risks and business scale. According to the nature and capacity of loss absorption by capital, the capital of an insurance company is classified into the core capital and the supplementary capital. The core solvency ratio is the ratio of core capital to minimum capital, which reflects the adequacy of the core capital of an insurance company. The comprehensive solvency ratio is the ratio of the sum of core capital and supplementary capital to minimum capital, which reflects the overall capital adequacy of an insurance company. The following table shows the Company’s solvency ratios as at the end of the Reporting Period:
| RMB million | ||||||||
| As at 31 December 2021 | As at 31 December 2020 | |||||||
Core capital | 1,020,756 | 1,031,947 | ||||||
Actual capital | 1,055,768 | 1,066,939 | ||||||
Minimum capital | 402,341 | 396,749 | ||||||
Core solvency ratio | 253.70 | % | 260.10 | % | ||||
Comprehensive solvency ratio | 262.41 | % | 268.92 | % | ||||
|
|
|
| |||||
| Note: | The China Risk Oriented Solvency System was formally implemented on 1 January 2016. This table is compiled according to the rules of the system. |
As at the end of the Reporting Period, the Company’s comprehensive solvency ratio decreased by 6.51 percentage points from the end of 2020, primarily due to the continuous growth of insurance business and investment assets, dividends payment, and a decline of discount rate in solvency reserve.
Sale of Material Assets and Equity
During the Reporting Period, there was no sale of material assets and equity of the Company.
30
Major Subsidiaries and Associates of the Company
| RMB million | ||||||||||||||||||
Company Name | Major Business Scope | Registered Capital | Shareholding | Total Assets | Net | Net | ||||||||||||
China Life Asset Management Company Limited | Management and utilization of proprietary funds; acting as agent or trustee for asset management business; consulting business relevant to the above businesses; other asset management business permitted by applicable PRC laws and regulations | 4,000 | 60% | 16,658 | 14,324 | 2,760 | ||||||||||||
China Life Pension Company Limited | Group pension insurance and annuity; individual pension insurance and annuity; short-term health insurance; accident insurance; reinsurance of the above insurance businesses; business for the use of insurance funds that are permitted by applicable PRC laws and regulations; pension insurance asset management product business; management of funds in RMB or foreign currency as entrusted by entrusting parties for the retirement benefit purpose; other businesses permitted by the CBIRC | 3,400 | | 70.74% is held by the Company, and 3.53% is held by AMC | | 8,305 | 5,889 | 1,158 | ||||||||||
China Life Property and Casualty Insurance Company Limited | Property loss insurance; liability insurance; credit insurance and bond insurance; short-term health insurance and accident insurance; reinsurance of the above insurance businesses; business for the use of insurance funds that are permitted by applicable PRC laws and regulations; other businesses permitted by the CBIRC | 18,800 | 40% | 120,178 | 25,422 | 621 | ||||||||||||
China Guangfa Bank Co., Ltd. | Taking public deposits; granting short-term, mid-term and long- term loans; handling settlements in and out of China; honoring bills and offering discounting services; issuing financial bonds; issuing, paying for and underwriting government bonds as an agent; sales and purchases of negotiable securities such as government bonds and financial bonds; engaging in inter-bank borrowings; providing letters of credit service and guarantee; engaging in bank card business; acting as payment and receipt agent and insurance agent; providing safe deposit box services; taking deposits and granting loans in foreign currency; foreign currency remittance; foreign currency exchange; international settlements; foreign exchange settlements and sales; inter-bank foreign currency borrowings; honoring bills of exchange and offering discounting services in foreign currency; granting foreign currency loans; granting foreign currency guarantees; sales and purchases of negotiable securities other than shares in a foreign currency for itself and as an agent; issuing negotiable securities other than shares in a foreign currency for itself and as an agent; sales and purchases of foreign exchange on its own account and on behalf of its customers; issuing and making payments for foreign credit card as an agent; offshore financial operations; assets and credit verification, consultation and notarization businesses; other businesses approved by the CBIRC and other relevant authorities | 19,687 | 43.686% | 3,359,985 | 234,501 | 17,476 | ||||||||||||
| Note: | For details, please refer to Note 9 and Note 41(d) in the Notes to the Consolidated Financial Statements in this annual report. |
Structured Entities Controlled by the Company
Details of structured entities controlled by the Company is set out in the Note 41(d) to the Consolidated Financial Statements in this annual report.
31
TECHNOLOGY EMPOWERMENT AND OPERATIONS AND SERVICES
Technology Empowerment
In 2021, the Company accelerated technological innovation, strengthened digital- driven operations, deepened technology-empowered value creation, continued to build a digital insurance ecosystem, and promoted the integration of technologies with business operations. The leading and supporting role of its technological innovation was continuously enhanced.
Technological innovation, leading to the upgrade of technology architecture as a whole. With the support of the strong computing power of China Life Hybrid Cloud and the openness and compatibility of the digital platform, the Company fulfilled the upgrade to a distributed architecture for all core systems, from com puting, storage, database and middleware to application software. Its technology-supporting capacity realised a leap-forward development with the data processing capacity improved by 10 times and the elastic capacity scaling time of computing resources reduced to minute level.
Agile delivery, significantly enhancing the response to changes by technology. The Company widely implemented the tech products-based management system, and facilitated the comprehensive circulation of technology-based operations with a digital operation mechanism featuring full data and full chain tracing. More updated functions and services were launched at a high frequency, and technology products were iterated and optimized more than 40 times on a daily basis to quickly respond to market changes, offering more accurate and efficient services to customers.
Intelligence upgrading, further enhancing technology empowerment. China Life “Internet of Things” covered all business units and scales outlets of the Company across China and technology services were accessible to the frontline. It fulfilled centralized management and control of 240,000 electronic appliances in 12 categories throughout the Company with the establishment of an online Digital Twin, and its service efficiency was improved by 70% compared with 2020. The “China Life ‘Internet of Things’ — Edge Computing, Intelligent Perception and Digital Presentation” won the 2021 FinTech and Digital Transformation Innovation award. The Company also comprehensively developed its intelligent services, with its intelligent robots serving in various business fields, such as sales, services, operations, finance, risk control, and among others. Its big data- empowered scenarios were increased by 84% compared with 2020 and the daily average intelligent services reached more than 5 million person-times.
Interactive traffic, constantly amplifying the digital ecological effects. The online socialized collaboration system, which seamlessly connected with mobile phones, desktops, large screens and various digital applications, comprehensively improved the communication and interaction experience of the customers, salespersons, and employees of the Company. The Company enriched its digital insurance ecosystem continuously, releasing 3,256 standardized services in total on its digital platform, a year-on-year increase of 92%, launched nearly 1,000 ecological applications, and carried out nearly 400,000 services and activities with different cooperative institutions.
Operations and Services
In 2021, being customer-centric, the Company adhered to the operational objectives of “efficiency first, technology-driven, value increase and first-class customer experience”, accelerated the transformation of operations and services to be more Internet-based and intelligent, and continued to provide customers with high-quality and “convenient, quality and caring” services. As a result, its customer experience continued to be improved and customer appraisal remained at a high level.
Online services were growing rapidly. The Company upgraded various online service points of contact, with the registered users of China Life Insurance APP reaching 112 million, a year-on-year increase of 21%, and the monthly average active users increasing by 18.1% year on year. The online processing rate of policy administration and claims settlement for individual insurance rose to 88.3% and 98.7%, respectively. More than 780 million electronic notification messages were sent, services provided by Online Customer Service Agent increased by nine folds year on year, and the average waiting time for customers over the counter was shortened significantly year on year.
Intelligent service capacity was significantly enhanced. The Company upgraded and promoted its intelligent business models so that the service efficiency for new policies of long-term individual insurance was improved by 37.2% year on year, and the intelligent approval rates of underwriting, policy administration and claims settlement reached 93.4%, 99.1% and 73.1%, respectively. Application scenarios of Internet-based intelligent customer services were expanded, and services provided by intelligent robots reached over 75 million times. As the digital services were fully implemented, percentage of non-manual customer services in the contact center reached 88.9%.
32
Customer experience was further improved. Claims settlement services provided by the Company were efficient and warm. In 2021, “Direct Claims Payment” provided claims payments to over six million customers. “Claims Settlement for Critical Illness within One Day” benefited 170,000 customer-times, with payment amount up by 32.3% year on year. Door-to-door services were provided to more than 117,000 customers difficult to reaching the counters. Scenario-based services benefited various groups of customers. The Company also led the industry to launch the senior-friendly version of China Life App, and introduced several senior-oriented services, such as the “sit and wait” service over the counters. The Company carried out a variety of value-added services continuously, such as “Immunity Enhancement Program”, “Little Painters of China Life” and “Customer Festival”, etc., all themed on “health, parent-child education and enjoying life”.
FUTURE PROSPECT
Industry Landscape and Development Trends
Overall, the life insurance industry in China is still at an important stage full of strategic opportunities with the high-quality development as its key development theme. At present and in the near future, China’s economy remains resilient, and the long-term positive economic fundamentals featuring ample development potential and room to maneuver will remain unchanged. With the promotion of common prosperity, the size of China’s middle class will continue to grow, meaning more effective demands for the life insurance market. The consistent promotion of the Healthy China program and the national strategy of proactively responding to population aging will also provide broader space for the development of the industry. With market players speeding up their reform and transformation, the foundation for the high-quality development of the industry will be further consolidated. Meanwhile, the industry has witnessed continuous breakthroughs in technological innovations with the accelerated digital transformation of the industry. Technologies such as cloud computing, big data, artificial intelligence, and the “Internet of Things” has greatly empowered various aspects of the value chain, such as sales service, operation management, and risk prevention and control, etc. With domestic insurance industry consistently promoting its opening up, it will see more diversified industry players, and the market sophistication will be improved further.
Development Strategies and Business Plans of the Company
In 2022, the Company will uphold the guideline of making progress while maintaining stability and adhere to the original function of insurance, constantly deepen the supply-side reforms, give full play to the protection role of insurance, and continue to pursue the high-quality development of the Company by enhancing its capability of value creation, digital operations, innovation of insurance products and services as well as risk prevention and control.
Potential Risks
The internal and external environment has become more complex, challenging and uncertain since unprecedented global changes and the impact of the global pandemic continue to evolve. China’s economy is facing triple pressures of shrinking demands, supply disruption, and weakened expectations of growth, which also bring challenges to the steady development of the insurance industry. As the impact of the COVID-19 pandemic still exists, various regions and cities have taken more stringent prevention and control measures, which have restricted the on-site marketing and training activities and will thus greatly affect business development and agent recruitment and management. Since the traditional sales force-driven business development mode has encountered difficulties, market players are actively seeking transformation by making unremitting efforts in adjusting business structure and improving the quality of the sales force, and the industry will be still under pressure in the short term. The Company will take a variety of measures to actively respond to such risks and challenges. It will adhere to the principle of making progress while maintaining stability, continue to push forward reform and transformation, and strive to improve the quality of its business operation and management. As to the capital market, with market interest rate trending downwards and the volatility in the equity market increasing, credit default events occur frequently and the investment income of insurance funds will be likely subject to higher fluctuation in the short term. The Company will continue to prioritize asset- liability management, deepen its research on specialized investment, further optimize its asset allocation mix and flexibly adjust its investment strategies to respond to market changes. Furthermore, the Company will continuously focus on and enhance the analysis of the related complex risk factors and make great stride in pursuing its high-quality development.
The Company believes that it will have sufficient capital to meet its insurance business expenditures and new general investment needs in 2022. At the same time, the Company will make corresponding financing arrangements based on capital market conditions if it plans to implement any business development strategies in the future.
33
EMBEDDED VALUE
BACKGROUND
China Life Insurance Company Limited prepares financial statements to public investors in accordance with the relevant accounting standards. An alternative measure of the value and profitability of a life insurance company can be provided by the embedded value method. Embedded value is an actuarially determined estimate of the economic value of the life insurance business of an insurance company based on a particular set of assumptions about future experience, excluding the economic value of future new business. In addition, the value of one year’s sales represents an actuarially determined estimate of the economic value arising from new life insurance business issued in one year based on a particular set of assumptions about future experience.
China Life Insurance Company Limited believes that reporting the Company’s embedded value and value of one year’s sales provides useful information to investors in two respects. First, the value of the Company’s in-force business represents the total amount of shareholders’ interest in distributable earnings, in present value terms, which can be expected to emerge over time, in accordance with the assumptions used. Second, the value of one year’s sales provides an indication of the value created for investors by new business activity based on the assumptions used and hence the potential of the business. However, the information on embedded value and value of one year’s sales should not be viewed as a substitute of financial measures under the relevant accounting basis. Investors should not make investment decisions based solely on embedded value information and the value of one year’s sales.
It is important to note that actuarial standards with respect to the calculation of embedded value are still evolving. There is still no universal standard which defines the form, calculation methodology or presentation format of the embedded value of an insurance company. Hence, differences in definition, methodology, assumptions, accounting basis and disclosures may cause inconsistency when comparing the results of different companies.
Also, the calculation of embedded value and value of one year’s sales involves substantial technical complexity and estimates can vary materially as key assumptions are changed. Therefore, special care is advised when interpreting embedded value results.
The values shown below do not consider the future financial impact of transactions between the Company and CLIC, CLI, AMC, Pension Company, CLP&C, and etc.
34
DEFINITIONS OF EMBEDDED VALUE AND VALUE OF ONE YEAR’S SALES
The embedded value of a life insurer is defined as the sum of the adjusted net worth and the value of in-force business allowing for the cost of required capital.
“Adjusted net worth” is equal to the sum of:
| • | Net assets, defined as assets less corresponding policy liabilities and other liabilities valued; and |
| • | Net-of-tax adjustments for relevant differences between the market value and the book value of assets, together with relevant net-of-tax adjustments to certain liabilities. |
The market value of assets can fluctuate significantly over time due to the impact of the prevailing market environment. Hence the adjusted net worth can fluctuate significantly between valuation dates.
The “value of in-force business” and the “value of one year’s sales” are defined here as the discounted value of the projected stream of future shareholders’ interest in distributable earnings for existing in-force business at the valuation date and for one year’s sales in the 12 months immediately preceding the valuation date.
The value of in-force business and the value of one year’s sales have been determined using a traditional deterministic discounted cash flow methodology. This methodology makes implicit allowance for the cost of investment guarantees and policyholder options, asset/ liability mismatch risk, credit risk, the risk of operating experience’s fluctuation and the economic cost of capital through the use of a risk-adjusted discount rate.
PREPARATION AND REVIEW
The embedded value and the value of one year’s sales were prepared by China Life Insurance Company Limited in accordance with the “CAA Standards of Actuarial Practice: Appraisal of Embedded Value” issued by the China Association of Actuaries (“CAA”) in November 2016. Deloitte Consulting performed a review of China Life’s embedded value. The review statement from Deloitte Consulting is contained in the “Independent Actuaries Review Opinion Report on Embedded Value of China Life Insurance Company Limited” section.
ASSUMPTIONS
Economic assumptions: The calculations are based upon assumed corporate tax rate of 25% for all years. The investment return is assumed to be 5% per annum. 17% grading to 21% (remaining level thereafter) of the investment return is assumed to be exempt from income tax. The investment return and tax exempt assumptions are based on the Company’s strategic asset mix and expected future returns. The risk-adjusted discount rate used is 10% per annum.
Other operating assumptions such as mortality, morbidity, lapses and expenses are based on the Company’s recent operating experience and expected future outlook.
35
SUMMARY OF RESULTS
The embedded value as at 31 December 2021, the value of one year’s sales for the 12 months ended 31 December 2021, and the corresponding results as at 31 December 2020 are shown below:
Components of Embedded Value and Value of One Year’s Sales
RMB million
ITEM | 31 December 2021 | 31 December 2020 | ||||||||
A | Adjusted Net Worth | 674,317 | 568,587 | |||||||
B | Value of In-Force Business before Cost of Required Capital | 593,137 | 565,797 | |||||||
C | Cost of Required Capital | (64,446 | ) | (62,244 | ) | |||||
D | Value of In-Force Business after Cost of Required Capital (B + C) | 528,691 | 503,553 | |||||||
E | Embedded Value (A + D) | 1,203,008 | 1,072,140 | |||||||
F | Value of One Year’s Sales before Cost of Required Capital | 50,474 | 64,354 | |||||||
G | Cost of Required Capital | (5,693 | ) | (5,981 | ) | |||||
H | Value of One Year’s Sales after Cost of Required Capital (F + G) | 44,780 | 58,373 | |||||||
| Including: Value of One Year’s Sales of Individual Agent Business Sector | 42,945 | 57,669 | ||||||||
Note: | Numbers may not be additive due to rounding. |
The new business margin of one year’s sales of individual agent business sector for the 12 months ended 31 December 2021 is shown below:
New Business Margin of One Year’s Sales of Individual Agent Business Sector
| 31 December 2021 | 31 December 2020 | |||||||
By First Year Premium | 41.6 | % | 47.9 | % | ||||
By Annual Premium Equivalent | 42.2 | % | 48.1 | % | ||||
Note: | First Year Premium is the written premium used for calculation of the value of one year’s sales and Annual Premium Equivalent is calculated as the sum of 100 percent of first year regular premiums and 10 percent of single premiums. |
36
MOVEMENT ANALYSIS
The following analysis tracks the movement of the embedded value from the start to the end of the Reporting Period:
Analysis of Embedded Value Movement in 2021
ITEM | RMB million | |||||
A | Embedded Value at the Start of Year | 1,072,140 | ||||
B | Expected Return on Embedded Value | 84,962 | ||||
C | Value of New Business in the Period | 44,780 | ||||
D | Operating Experience Variance | (6,392 | ) | |||
E | Investment Experience Variance | (2,711 | ) | |||
F | Methodology, Model and Assumption Changes | (7,614 | ) | |||
G | Market Value and Other Adjustments | 38,575 | ||||
H | Exchange Gains or Losses | (173 | ) | |||
I | Shareholder Dividend Distribution and Capital Changes | (18,089 | ) | |||
J | Others | (2,471 | ) | |||
K | Embedded Value as at 31 December 2021 (sum A through J) | 1,203,008 | ||||
| Notes: 1. | Numbers may not be additive due to rounding. | |||||
| 2. | Items B through J are explained below: | |||||
| B | Reflects expected impact of covered business, and the expected return on investments supporting the 2021 opening net worth. | |||||
| C | Value of one year’s sales for the 12 months ended 31 December 2021. | |||||
| D | Reflects the difference between actual operating experience in 2021 (including mortality, morbidity, lapse, and expenses etc.) and the assumptions. | |||||
| E | Compares actual with expected investment returns during 2021. | |||||
| F | Reflects the effects of appraisal methodology and model enhancement, and assumption changes. | |||||
| G | Change in the market value adjustment from the beginning of year 2021 to 31 December 2021 and other adjustments. | |||||
| H | Reflects the gains or losses due to changes in exchange rate. | |||||
| I | Reflects dividends distributed to shareholders during 2021. | |||||
| J | Other miscellaneous items. | |||||
37
SENSITIVITY RESULTS
Sensitivity tests were performed using a range of alternative assumptions. In each of the sensitivity tests, only the assumption referred to was changed, with all other assumptions remaining unchanged. The results are summarized below:
Sensitivity Results
| RMB million | ||||||||||
| Value of In-Force Business after Cost of Required Capital | Value of One year’s Sales after Cost of Required Capital | |||||||||
Base case scenario | 528,691 | 44,780 | ||||||||
1. | Risk discount rate +50bps | 504,849 | 42,688 | |||||||
2. | Risk discount rate -50bps | 554,272 | 47,042 | |||||||
3. | Investment return +50bps | 630,761 | 53,202 | |||||||
4. | Investment return -50bps | 427,018 | 36,362 | |||||||
5. | 10% increase in expenses | 522,276 | 41,566 | |||||||
6. | 10% decrease in expenses | 535,107 | 47,995 | |||||||
7. | 10% increase in mortality rate for non-annuity products and 10% decrease in mortality rate for annuity products | 525,259 | 43,970 | |||||||
8. | 10% decrease in mortality rate for non-annuity products and 10% increase in mortality rate for annuity products | 532,101 | 45,594 | |||||||
9. | 10% increase in lapse rates | 528,559 | 43,925 | |||||||
10. | 10% decrease in lapse rates | 528,752 | 45,661 | |||||||
11. | 10% increase in morbidity rates | 520,500 | 42,717 | |||||||
12. | 10% decrease in morbidity rates | 537,058 | 46,853 | |||||||
13. | Using 2020 EV appraisal assumptions | 527,279 | 44,273 | |||||||
14. | Allowing for diversification in calculation of VIF | 574,225 | — | |||||||
38
INDEPENDENT ACTUARIES REVIEW OPINION REPORT ON EMBEDDED VALUE OF CHINA LIFE INSURANCE COMPANY LIMITED
China Life Insurance Company Limited (“China Life”) has prepared embedded value results as at 31 December 2021 (“EV Results”). The disclosure of these EV Results, together with a description of the methodology and assumptions that have been used, are shown in the Embedded Value section.
China Life has retained Deloitte Consulting (Shanghai) Co., Ltd. to review its EV Results. The task is undertaken by Deloitte Actuarial and Insurance Solutions of Deloitte Consulting (Shanghai) Co., Ltd. (“Deloitte Consulting” or “we”).
Scope of work
Our scope of work covered:
| • | a review of the methodology used to develop the embedded value and value of one year’s sales as at 31 December 2021, in accordance with the “CAA Standards of Actuarial Practice: Appraisal of Embedded Value”, issued by the China Association of Actuaries (“CAA”); |
| • | a review of the economic and operating assumptions used to develop embedded value and value of one year’s sales as at 31 December 2021; and |
| • | a review of China Life’s EV Results, including embedded value, value of one year’s sales, analysis of embedded value movement from 31 December 2020 to 31 December 2021, and the sensitivity results of value of in-force business and value of one year’s sales. |
Basis of Opinion, Reliance and Limitation
We carried out our review work based on “CAA Standards of Actuarial Practice: Appraisal of Embedded Value”, issued by CAA. In carrying out our review, we have relied on the completeness and accuracy of audited and unaudited data and information provided by China Life.
The determination of embedded value is based on a range of assumptions on future operations and investment performance. The future actual experiences are affected by internal and external factors, many of which are not entirely controlled by China Life. Hence the future actual experiences may deviate from these assumptions.
This report is addressed solely to China Life in accordance with the terms of our engagement letter. To the fullest extent permitted by applicable law, we do not accept or assume any responsibility, duty of care or liability to anyone other than China Life for or in connection with our review work, the opinions we have formed, or for any statements set forth in this report.
Opinion
Based on the scope of work above, we have concluded that:
| • | The embedded value methodology used by China Life is in line with the “CAA Standards of Actuarial Practice: Appraisal of Embedded Value” issued by CAA. This method is commonly used by life and health insurance companies in China; |
| • | The economic assumptions used by China Life have taken into account the current investment market conditions and the investment strategy of China Life; |
| • | The operating assumptions used by China Life have taken into account the past experience and the expectation of future experience; and |
| • | The embedded value results are consistent with its methodology and assumptions used. The overall result is reasonable. |
For and on behalf of Deloitte Consulting (Shanghai) Co., Ltd.
Eric Lu Yu Jiang
24 March 2022
39
SIGNIFICANT EVENTS
MATERIAL LITIGATIONS OR ARBITRATIONS
During the Reporting Period, the Company was not involved in any material litigation or arbitration.
MAJOR CONNECTED TRANSACTIONS
Continuing Connected Transactions
During the Reporting Period, the following continuing connected transactions were carried out by the Company pursuant to Rule 14A.76(2) of the Rules Governing the Listing of Securities on the HKSE (the “Listing Rules”), including the asset management agreement between the Company and AMC, the insurance sales framework agreement between the Company and CLP&C, the framework agreement between the Company and Chongqing International Trust Inc. (“Chongqing Trust”), and the framework agreement between the Company and China Life Capital. These continuing connected transactions were subject to the reporting, announcement and annual review requirements but were exempt from the independent shareholders’ approval requirement under the Listing Rules. CLIC, the controlling shareholder of the Company, holds 60% of the equity interest in CLP&C and 100% of the equity interest in China Life Capital. Therefore, each of CLIC, CLP&C and China Life Capital constitutes a connected person of the Company. AMC is held as to 60% and 40% by the Company and CLIC, respectively, and is therefore a connected subsidiary of the Company. Chongqing Trust is an associate of CLIC and CLP&C by virtue of its acting as the trustee of a trust scheme of which CLP&C is a beneficiary, and is therefore also a connected person of the Company pursuant to Rule 14A.13(2) of the Listing Rules.
During the Reporting Period, the continuing connected transactions carried out by the Company that were subject to the reporting, announcement, annual review and independent shareholders’ approval requirements under Chapter 14A of the Listing Rules included the framework agreements entered into by AMP with the Company, CLIC, CLP&C and CLI, respectively, and the asset management agreement for alternative investments between the Company and CLI. Such agreements and the transactions thereunder have been approved by the independent shareholders of the Company. CLIC holds 100% of the equity interest in CLI. Therefore, CLI is a connected person of the Company. AMP is a subsidiary of AMC, and is therefore a connected subsidiary of the Company.
40
During the Reporting Period, the Company also carried out certain continuing connected transactions, including the policy management agreement between the Company and CLIC, and the asset management agreement between CLIC and AMC, which were exempt from the reporting, announcement, annual review and independent shareholders’ approval requirements under Chapter 14A of the Listing Rules.
The Company has complied with the disclosure requirements under Chapter 14A of the Listing Rules in respect of the above continuing connected transactions. When conducting the above continuing connected transactions during the Reporting Period, the Company has followed the pricing policies and guidelines formulated at the time when such transactions were entered into.
Policy Management Agreement
The Company and CLIC entered into the 2021 policy management agreement on 31 December 2020, with a term from 1 January 2021 to 31 December 2021. Pursuant to the agreement, the Company accepted CLIC’s entrustment to provide policy administration services relating to the non-transferred policies. The Company acted as a service provider under the agreement and did not acquire any rights or assume any obligations as an insurer under the non-transferred policies. For details as to the method of calculation of the service fee, please refer to Note 35 in the Notes to the Consolidated Financial Statements. The annual cap in respect of the service fee paid by CLIC to the Company for the year ended 31 December 2021 was RMB599 million. The Company and CLIC entered into the 2022-2024 policy management agreement on 31 December 2021, with a term from 1 January 2022 to 31 December 2024. Pursuant to the agreement, the Company will continue to accept CLIC’s entrustment to provide policy administration services relating to the non-transferred policies. The annual cap in respect of the service fee to be paid by CLIC to the Company for each of the three years ending 31 December 2024 is RMB491 million.
For the year ended 31 December 2021, the service fee paid by CLIC to the Company amounted to RMB553.66 million.
Asset Management Agreements
Asset Management Agreement between the Company and AMC
The Company and AMC entered into the 2019-2021 asset management agreement on 28 December 2018, with a term from 1 January 2019 to 31 December 2021. In order to optimize the structure of service fees and further enhance the performance incentives for AMC, the Company and AMC entered into the 2020-2022 asset management agreement on 1 July 2020 to replace the 2019-2021 asset management agreement, and to revise the annual caps in light of the needs for business development and the revised structure of service fees. Pursuant to the 2020-2022 asset management agreement, AMC agreed to invest and manage assets entrusted to it by the Company, on a discretionary basis, within the scope granted by the Company and in accordance with the requirements of applicable laws and regulations, regulatory requirements and the investment guidelines given by the Company. In consideration of AMC’s services in respect of investing and managing various categories of assets entrusted to it by the Company under the agreement, the Company agreed to pay AMC a service fee. For details as to the method of calculation of the service fee, please refer to Note 35 in the Notes to the Consolidated Financial Statements. The annual caps for the three years ending 31 December 2022 are RMB3,000 million, RMB4,000 million and RMB5,000 million, respectively.
For the year ended 31 December 2021, the Company paid AMC a service fee of RMB2,741.56 million.
Asset Management Agreement between CLIC and AMC
CLIC and AMC entered into the 2019-2021 asset management agreement on 29 December 2018, with an entrustment term from 1 January 2019 to 31 December 2021. In order to optimize the structure of service fees and further enhance the performance incentives for AMC, CLIC and AMC entered into the 2020-2022 asset management agreement on 1 July 2020 to replace the 2019-2021 asset management agreement, and to revise the annual caps in light of the needs for business development and the revised structure of service fees. Pursuant to the 2020-2022 asset management agreement, AMC agreed to invest and manage assets entrusted to it by CLIC, on a discretionary basis, subject to the investment guidelines and instructions given by CLIC. In consideration of AMC’s services in respect of investing and managing assets entrusted to it by CLIC under the agreement, CLIC agreed to pay AMC a service fee. For details as to the method of calculation of the service fee, please refer to Note 35 in the Notes to the Consolidated Financial Statements. The annual cap for the three years ending 31 December 2022 is RMB500 million.
41
For the year ended 31 December 2021, CLIC paid AMC a service fee of RMB156.45 million.
Asset Management Agreement for Alternative Investments between the Company and CLI
As approved by the 2017 Annual General Meeting of the Company, the Company and CLI entered into the 2019 asset management agreement for alternative investments on 31 December 2018. Such agreement took effect from 1 January 2019 and expired on 31 December 2021. Pursuant to the agreement, CLI agreed to invest and manage assets entrusted to it by the Company (including equity, real estate, related financial products and quasi-securitization financial products), on a discretionary basis, within the scope of utilization of insurance funds as specified by regulatory authorities and in accordance with the requirements of applicable laws and regulations and the investment guidelines given by the Company, and the Company agreed to pay CLI the investment management service fee, floating management fee, performance-based bonus and real estate operation management service fee in respect of the investment and management services provided by CLI to the Company. For details as to the method of calculation of the investment management service fee, floating management fee, performance-based bonus and real estate operation management service fee, please refer to Note 35 in the Notes to the Consolidated Financial Statements. In addition, the assets entrusted by the Company to CLI would also be partially used for the subscription of the related financial products established and issued by CLI or of which CLI had participated in the establishment and issuance, and such related financial products would be limited to infrastructure investment schemes and project asset-backed schemes.
For the three years ended 31 December 2021, the annual caps on the contractual amount of assets newly entrusted by the Company to CLI for investment and management, as well as the annual caps on the amount of the investment management service fee, floating management fee, performance-based bonus and real estate operation management service fee payable by the Company to CLI are as follows:
Amount of Assets Newly Entrusted for Investment and Management during the Subscription of the Related (RMB million or its equivalent in foreign currency) | Amount of the Investment Management Service Fee, Floating Management Fee, Performance-based Bonus and Real Estate Operation Management Service Fee (RMB million or its equivalent in foreign currency) | |||||
For the year ended 31 December 2019 | 200,000 (including the amount for the | 1,391 | ||||
For the year ended 31 December 2020 | 200,000 (including the amount for the | 1,982 | ||||
For the year ended 31 December 2021 | 200,000 (including the amount for the | 2,266 | ||||
42
As approved by the Extraordinary General Meeting 2021 of the Company, the Company and CLI entered into the 2022-2024 agreement for entrusted investment and management and operating services with respect to alternative investments with insurance funds on 27 December 2021. Pursuant to the agreement, the Company will entrust CLI to perform services including the entrusted investment and management and the entrusted operation with respect to alternative investments. For the entrusted investment and management, it covers the equity/real estate direct investments, equity/real estate funds, non-standard financial products and quasi-securitization financial products already entrusted by the Company to CLI for investment and management under the existing projects, as well as the non-standard financial products and quasi-securitization financial products entrusted for investment under the new projects. CLI will continue to invest and manage assets entrusted to it by the Company, on a discretionary basis, within the scope of utilization of insurance funds as specified by the regulatory authorities and in accordance with the requirements of applicable laws and regulations and the investment guidelines of the Company, and the Company will pay CLI the investment management service fee, product management fee, real estate operation management service fee and performance award in respect of the investment and management services provided by CLI to the Company. For the entrusted operation, CLI will provide the operating services to the Company with respect to the equity/real estate funds invested by the Company at its own discretion and within the scope prescribed in the agreement, and the Company will pay CLI the entrusted operating fee in this regard. Such agreement took effect from 1 January 2022, with a term of two years ending on 31 December 2023. Unless a party serves the other party a written notice for non-renewal prior to 90 working days before the expiry date of the agreement, the agreement will be automatically renewed for one year from the expiry date thereof.
For the three years ending 31 December 2024, the annual caps on the contractual amount of assets newly entrusted by the Company to CLI for investment and management, as well as the annual caps on the fees for the investment and management services payable by the Company to CLI (including the investment management service fee, product management fee, real estate operation management service fee and performance reward) and the entrusted operation fee in relation to the operating services are as follows:
| Contractual Amount of Assets Newly Entrusted for Investment and Management during the Period (RMB million or its equivalent in foreign currency) | Fees for the Investment and Management Services and the Entrusted Operation Fee (RMB million or its equivalent in foreign currency) | |||||||
For the year ending 31 December 2022 | 65,000 | 2,000 | ||||||
For the year ending 31 December 2023 | 65,000 | 2,000 | ||||||
For the year ending 31 December 2024 | 65,000 | 2,000 | ||||||
For the year ended 31 December 2021, the investment management service fee, floating management fee, performance-based bonus and real estate operation management service fee paid by the Company to CLI amounted to RMB587.63 million, and the contractual amount of assets newly entrusted by the Company to CLI for investment and management was RMB23,326.50 million. For the year ended 31 December 2021, the amount for the subscription of the related financial products established and issued by CLI or of which CLI had participated in the establishment and issuance was RMB23,326.50 million.
43
Cooperation Framework Agreement for Investment Management with Insurance Funds between the Company and China Life Capital
The Company and China Life Capital entered into the 2020-2022 framework agreement on 31 December 2019, with a term from 1 January 2020 to 31 December 2022. Pursuant to the agreement, the Company will continue to subscribe in the capacity of the limited partner for the fund products of which China Life Capital or any of its subsidiaries serves (individually and jointly with third parties) as the general partner, and/or the fund products of which China Life Capital serves as the manager (including the fund manager and co-manager). For the three years ending 31 December 2022 , the annual cap for the subscription by the Company in the capacity of the limited partner of the fund products of which China Life Capital or any of its subsidiaries serves as the general partner is RMB5,000 million, and the annual cap for the management fee charged by China Life Capital as the general partner or the manager of the fund products is RMB200 million.
For the year ended 31 December 2021, the amount of subscription by the Company in the capacity of the limited partner of the fund products of which China Life Capital or any of its subsidiaries serves as the general partner was RMB4,000.00 million, and the management fee charged by China Life Capital as the general partner or the manager of the fund products was RMB136.31 million.
Insurance Sales Framework Agreement
The Company and CLP&C entered into the 2021 insurance sales framework agreement on 20 February 2021, with a term of two years from 8 March 2021 to 7 March 2023. Unless a party serves the other party a written notice for non-renewal within 30 days before the expiration of the 2021 insurance sales framework agreement, the agreement will be automatically extended for one year from the expiration thereof to 7 March 2024. Pursuant to the agreement, CLP&C will entrust the Company to act as an agent to sell selected insurance products within the authorized regions, and pay an agency service fee to the Company in consideration of the services provided. For details as to the method of calculation of the agency service fee, please refer to Note 35 in the Notes to the Consolidated Financial Statements. The annual caps for the three years ending 31 December 2023 are RMB3,500 million, RMB3, 830 million and RMB4,240 million, respectively.
For the year ended 31 December 2021, CLP&C paid the Company an agency service fee of RMB1,541.99 million.
Framework Agreements with AMP
Framework Agreement between the Company and AMP
As approved by the First Extraordinary General Meeting 2019 of the Company, the Company and AMP entered into the 2020-2022 framework agreement on 31 December 2019, with a term of three years from 1 January 2020 to 31 December 2022. Pursuant to the agreement, the Company and AMP will continue to conduct certain daily transactions, including the subscription and redemption of fund products, sales agency services, asset management for specific clients and other daily transactions permitted by laws and regulations. Pricing of the transactions under the agreement shall be determined by the parties through arm’s length negotiations with reference to industry practices. For the three years ending 31 December 2022, the annual cap of the subscription price and corresponding subscription fee for the subscription of fund products is RMB72,600 million; the annual cap of the redemption price and corresponding redemption fee for the redemption of fund products is RMB72,600 million; the annual caps of the sales commission fee and client maintenance fee payable by AMP are RMB700 million, RMB800 million and RMB900 million, respectively; the annual caps of the management fee (including the performance-based fee) payable by the Company for the asset management for specific clients are RMB300 million, RMB400 million and RMB500 million, respectively; and the annual cap of the fees for other daily transactions is RMB100 million.
For the year ended 31 December 2021, the subscription price and corresponding subscription fee for the subscription of fund products were RMB8,909.41 million, the redemption price and corresponding redemption fee for the redemption of fund products were RMB4,067.58 million, the sales commission fee and client maintenance fee paid by AMP were RMB1.39 million, the management fee (including the performance-based fee) paid by the Company for the asset management for specific clients was RMB65.84 million, and the fees for other daily transactions were RMB1.28 million.
44
Framework Agreement between CLIC and AMP
As approved by the First Extraordinary General Meeting 2019 of the Company, CLIC and AMP entered into the 2020-2022 framework agreement on 6 September 2019, with a term of three years from 1 January 2020 to 31 December 2022. Pursuant to the agreement, CLIC and AMP will continue to conduct certain daily transactions, including the subscription and redemption of fund products and private asset management. Pricing of the transactions under the agreement shall be determined by the parties through arm’s length negotiations with reference to industry practices. For the three years ending 31 December 2022, the annual cap of the subscription price and corresponding subscription fee for the subscription of fund products is RMB10,000 million; the annual cap of the redemption price and corresponding redemption fee for the redemption of fund products is RMB10,000 million; and the annual cap of the management fee (including the performance-based fee) payable by CLIC for the private asset management is RMB100 million.
For the year ended 31 December 2021, the subscription price and corresponding subscripti on fee for the subscription of fund products were RMB0 million, the redemption price and corresponding redemption fee for the redemption of fund products were RMB101.40 million, and the management fee (including the performance-based fee) paid by CLIC for the private asset management was RMB26.37 million.
Framework Agreement between CLP&C and AMP
As approved by the First Extraordinary General Meeting 2019 of the Company, CLP&C and AMP entered into the 2020-2022 framework agreement on 3 December 2019, with a term of three years from 1 January 2020 to 31 December 2022. Pursuant to the agreement, CLP&C and AMP will continue to conduct certain daily transactions, including the subscription and redem ption of fund products, asset management for specific clients and other daily transactions permitted by laws and regulations. Pricing of the transactions under the agreement shall be determined by the parties through arm’s length negotiations with reference to industry practices. For the three years ending 31 December 2022, the annual cap of the subscription price for the fund products is RMB10,000 million; the annual cap of the redemption price for the fund products is RMB10,000 million; the annual cap of the subscription fee for the fund products is RMB100 million; the annual cap of the redemption fee for the fund products is RMB100 million; the annual cap of the management fee (including the performance-based fee) payable by CLP&C for the asset management for specific clients is RMB100 million; and the annual cap of the fees for other daily transactions is RMB100 million.
For the year ended 31 December 2021, the subscription price for the fund products was RMB0 million, the redemption price for the fund products was RMB 0 million, the subscription fee for the fund products was RMB0 million, the redemption fee for the fund products was RMB0 million, the management fee (including the performance-based fee) paid by CLP&C for the asset management for specific clients was RMB15.75 million, and the fees for other daily transactions were RMB0.13 million.
Framework Agreement between CLI and AMP
As approved by the First Extraordinary General Meeting 2019 of the Company, CLI and AMP entered into the 2020-2022 framework agreement on 17 February 2020, with a term of three years from 1 January 2020 to 31 December 2022. Pursuant to the agreement, CLI and AMP will continue to conduct certain daily transactions, including the subscription and redemption of fund products, asset management for specific clients, advisory services and other daily transactions permitted by laws and regulations. Pricing of the transactions under the agreement shall be determined by the parties through arm’s length negotiations with reference to industry practices. For the three years ending 31 December 2022, the annual cap of the subscription price and corresponding subscription fee for the subscription of fund products is RMB10,000 million; the annual cap of the redemption price and corresponding redemption fee for the redemption of fund products is RMB10,000 million; the annual cap of the management fee (including the performance-based fee) payable by CLI and its subsidiaries for the asset management for specific clients is RMB150 million; the annual cap of the management fee (including the performance-based fee) payable by the subsidiaries of AMP for the asset management for specific clients is RMB150 million; the annual cap of the advisory fee payable by CLI and its subsidiaries for the advisory services is RMB150 million; the annual cap of the advisory fee payable by AMP and its subsidiaries for the advisory services is RMB150 million; and the annual cap of the fees for other daily transactions is RMB150 million.
45
For the year ended 31 December 2021, the subscription price and corresponding subscription fee for the subscription of fund products were RMB2,832.27 million, the redemption price and corresponding redemption fee for the redemption of fund products were RMB3,466.89 million, the management fee (including the performance-based fee) paid by CLI and its subsidiaries for the asset management for specific clients was RMB0 million, the management fee (including the performance-based fee) paid by the subsidiaries of AMP for the asset management for specific clients was RMB0 million; the advisory fee paid by CLI and its subsidiaries for the advisory services was RMB0 million; the advisory fee paid by AMP and its subsidiaries for the advisory services was RMB0 million, and the fees for other daily transactions were RMB3.50 million.
Framework Agreement between the Company and Chongqing Trust
The Company and Chongqing Trust entered into the 2020-2022 framework agreement on 27 December 2019, with a term of three years from 1 January 2020 to 31 December 2022. Pursuant to the agreement, the Company and Chongqing Trust will continue to conduct the subscription and redemption of trust products and other daily transactions permitted by laws and regulations. Pricing of the transactions under the agreement shall be determined by the parties through arm’s length negotiations with reference to industry practices. For the three years ending 31 December 2022, the annual cap of the total amount of subscription and redemption of the trust products is RMB30,000 million; the annual cap of the trustee’s remuneration is RMB500 million; and the annual cap of the fees for other daily transactions is RMB100 million.
For the year ended 31 December 2021, the total amount of subscription and redemption of the trust products was RMB2,266.63 million, the trustee’s remuneration was RMB16.47 million, and the fees for other daily transactions were RMB0 million.
Confirmation by Auditor
The Board has received a comfort letter from the auditor of the Company with respect to the above continuing connected transactions which were subject to the reporting, announcement and/or independent shareholders’ approval requirements, and the letter stated that during the Reporting Period:
| 1. | nothing has come to the auditors’ attention that causes them to believe that the disclosed continuing connected transactions have not been approved by the Company’s Board of Directors; |
| 2. | for transactions involving the provision of goods or services by the Company, nothing has come to the auditors’ attention that causes them to believe that the transactions were not, in all material respects, in accordance with the pricing policies of the Company; |
| 3. | nothing has come to the auditors’ attention that causes them to believe that the transactions were not entered into, in all material respects, in accordance with the relevant agreements governing such transactions; and |
| 4. | nothing has come to the auditors’ attention that causes them to believe that the amounts of the continuing connected transactions have exceeded the total amount of the annual caps set by the Company. |
Confirmation by Independent Directors
The Company’s Independent Directors have reviewed the above continuing connected transactions which were subject to the reporting, announcement and/or independent shareholders’ approval requirements, and confirmed that:
| 1. | the transactions were entered into in the ordinary and usual course of business of the Company; |
| 2. | the transactions were conducted on normal commercial terms; |
| 3. | the transactions were entered into in accordance with the agreements governing those continuing connected transactions, and the terms are fair and reasonable and in the interests of shareholders of the Company as a whole; and |
| 4. | the amounts of the above transactions have not exceeded the relevant annual caps. |
Other Major Connected Transaction
Formation of China Life Chengda (Wuxi) Equity Investment Center (Limited Partnership)
As approved at the fifth meeting of the seventh session of the Board of Directors, the Company, CLP&C and Wuxi Fengrun Investment Co., Ltd. (each as a limited partner) entered into a partnership agreement with China Life Chengda (Shanghai) Healthcare Equity Investment Management Company Limited (“CLCD”, as the general partner) and Chengda Fengzhi (Shanghai) Corporate Management Center (Limited Partnership) (as the special limited partner) on 31 December 2021 for the formation of China Life Chengda (Wuxi) Equity Investment Center (Limited Partnership) (the “Partnership”). The total capital contribution by all partners of the Partnership shall be RMB10,000,000,000, of which RMB7,500,000,000 shall be contributed by the Company. China Life Equity Investment Company Limited (“CLEI”) will serve as the manager of the Partnership. The Partnership will have a term of eight years, and will primarily make direct or indirect investment in private equity projects in the medical health and technological innovation sectors.
46
Investment in Partnerships through Equity Investment Plans
As approved at the fifth meeting of the seventh session of the Board of Directors, the Company and CLI entered into an entrustment contract on 11 January 2022, pursuant to which the Company will contribute no more than RMB1,500,000,000 to CLI – Xinyuan No. 1 Equity Investment Plan (“Xinyuan EIP”) established by CLI. All funds under Xinyuan EIP will be used for the subscription of limited partnership interest in Beijing Xinyuan No. 1 Equity Investment Fund Partnership (Limited Partnership) (“Xinyuan Partnership”). CLI will, on behalf of Xinyuan EIP and as a limited partner, enter into a partnership agreement with Guangzhou Jinhong Asset Management Co., Ltd. (“Guangzhou Jinhong”) and National Energy (Beijing) Private Equity Fund Management Co., Ltd. (each as a general partner) , and Beijing Guoneng Green and Low-Carbon Development Investment Fund (Limited Partnership) and China Longyuan Power Group Corporation Limited (each as a limited partner). The total capital contribution by all partners of Xinyuan Partnership shall be RMB3,002,000,000. China Life Jinshi Asset Management Company Limited (“China Life Jinshi”) will serve as the manager of Xinyuan Partnership. Xinyuan Partnership will primarily invest in green and low-carbon investment targets (such as wind power, photovoltaic power, energy storage and other clean energy projects).
As approved at the fifth meeting of the seventh session of the Board of Directors, the Company and CLP&C intend to contribute no more than RMB2,400,000,000 and RMB600,000,000, respectively, to CLI – Xindian No. 1 Equity Investment Plan (“Xindian EIP”) established by CLI and enter into an entrustment contract with CLI by 31 December 2022 for such purpose. All funds under Xindian EIP will be used for the subscription of limited partnership interest in Beijing Xindian No. 1 Equity Investment Fund Partnership (Limited Partnership) (“Xindian Partnership”). CLI will, on behalf of Xindian EIP and as a limited partner, enter into a partnership agreement with Guangzhou Jinhong (as the general partner) and China Huadian Corporation Ltd. (as a limited partner). The total capital contribution by all partners of Xindian Partnership shall be RMB6,001,000,000. China Life Jinshi will serve as the manager of Xindian Partnership. Xindian Partnership will primarily invest in equity interests of unlisted enterprises in the clean energy sectors such as wind power, photovoltaic power and energy storage.
Acquisition of Creditor’s Rights on Trust Loan through Asset-backed Plan
As approved at the fifth meeting of the seventh session of the Board of Directors, the Company signed a subscription letter on 27 December 2021 for the subscription of “China Life - Chengxin No. 1 Asset-backed Plan” (“Asset-back Plan”) with an amount of RMB1,999,845,375. The Asset- back Plan was established by AMC as the manager/trustee of the plan, and the proceeds from the Asset-backed Plan will be used for the acquisition from Chongqing Trust of the creditor’s rights on the trust units in Phase II of “Chongqing Trust – XCMG Assembled Funds Trust Plan”. The trust plan, with a total size of RMB2,000,000,000 and an interest rate of 4.75% per annum, was established on 13 May 2020 and will expire on 13 May 2025. As at 27 December 2021, the sum of the outstanding principal under such trust plan and its accrued and undistributed interests amounted to RMB1,999,845,375.
Each of CLP&C, CLCD, CLEI, CLI, Guangzhou Jinhong, China Life Jinshi and Chongqing Trust is an associate of CLIC, and therefore a connected person of the Company. The above transactions constituted one-off connected transactions of the Company that were subject to the reporting and announcement requirements but were exempt from the independent shareholders’ approval requirement under Rule 14A.76(2) of the Listing Rules.
The Company has complied with the disclosure requirement under Chapter 14A of the Listing Rules in respect of the above one-off connected transactions.
Statement on Claims, Debt Transactions and Guarantees etc. of a Non-operating Nature with Related Parties
During the Reporting Period, the Company was not involved in claims, debt transactions or guarantees of a non-operating nature with related parties.
47
MATERIAL CONTRACTS AND THEIR PERFORMANCE
During the Reporting Period, the Company neither acted as trustee, contractor or lessee of other companies’ assets, nor entrusted, contracted or leased its assets to other companies, the profit or loss from which accounted for 10 % or more of the Company’s profits for the Reporting Period, nor were there any such matters that occurred in previous periods but subsisted during the Reporting Period.
The Company neither gave external guarantees nor provided guarantees to its holding subsidiaries during the Reporting Period.
Entrusted investment management during the Reporting Period or any investment management occurred in previous periods but subsisted during the Reporting Period: Investment is one of the principal businesses of the Company. The Company mainly adopts the mode of entrusted investment for management of its investment assets, and has established a diversified framework of entrusted investment management with China Life’s internal managers playing the key role and the external managers offering effective supports. The internal managers include AMC and its subsidiaries, CLI and its subsidiaries and Pension Company. The external managers comprise both domestic and overseas managers, including fund companies, securities companies and other professional investment management institutions. The Company selected different investment managers based on the purpose of allocation of various types of investments, their risk features and the expertise of different managers, so as to establish a great variety of investment portfolios and improve the efficiency of insurance fund utilization. The Company entered into entrusted investment management agreements with all managers and supervised the managers’ daily investment performance through the measures such as investment guidelines, asset entrustment and performance appraisals. The Company also adopted risk control measures in respect of specific investments based on the characteristics of different managers and investment products.
Except as otherwise disclosed in this report, the Company had no other material contracts during the Reporting Period.
UNDERTAKINGS OF THE COMPANY, SHAREHOLDERS, EFFECTIVE CONTROLLERS, ACQUIRERS, DIRECTORS, SUPERVISORS, SENIOR MANAGEMENT OR OTHER RELATED PARTIES WHICH ARE EITHER GIVEN OR EFFECTIVE DURING THE REPORTING PERIOD
Prior to the listing of the Company’s A Shares (30 November 2006), land use rights were injected by CLIC into the Company during its reorganization. Out of these, four pieces of land (with a total area of 10,421.12 square meters) had not had its formalities in relation to the change of ownership completed. Further, out of the properties injected into the Company, there were six properties (with a gross floor area of 8,639.76 square meters) in respect of which the formalities in relation to the change of ownership had not been completed. CLIC undertook to complete the above-mentioned formalities within one year of the date of listing of the Company’s A Shares, and in the event that such formalities could not be completed within such period, CLIC would bear any potential losses to the Company due to the defective ownership.
CLIC strictly followed these commitments. As at the end of the Reporting Period, save for the two properties and related land of the Company’s Shenzhen Branch, the ownership registration formalities of which had not been completed due to historical reasons, all other formalities in relation to the change of land and property ownership had been completed. The Shenzhen Branch of the Company continues to use such properties and land, and no other parties have questioned or hindered the use of such properties and land by the Company.
The Company’s Shenzhen Branch and the other co-owners of the properties have issued a letter to the governing department of the original owner of the properties in respect of the confirmation of ownership of the properties, requesting it to report the ownership issue to the State-owned Assets Supervision and Administration Commission of the State Council (“SASAC”), and requesting the SASAC to confirm the respective shares of each co-owner in the properties and to issue written documents in this regard to the department of land and resources of Shenzhen, so as to assist the Company and the other co-owners to complete the formalities in relation to the division of ownership of the properties.
48
Given that the change of ownership of the above two properties and related land use rights were directed by the co-owners, and all formalities in relation to the change of ownership were proceeded slowly due to reasons such as issues rooted in history and government approvals, CLIC, the controlling shareholder of the Company, made further commitment as follows: CLIC will assist the Company in completing, and urge the co-owners to complete, the formalities in relation to the change of ownership in respect of the above two properties and related land use rights as soon as possible. If the formalities cannot be completed due to the reasons of the co-owners, CLIC will take any other legally practicable measures to resolve the issue and will bear any potential losses suffered by the Company as a result of the defective ownership.
ALLEGED VIOLATION OF LAWS AND REGULATIONS BY, PENALTIES IMPOSED ON AND RECTIFICATION OF THE COMPANY AND ITS CONTROLLING SHAREHOLDERS, EFFECTIVE CONTROLLER, DIRECTORS, SUPERVISORS OR SENIOR MANAGEMENT
During the Reporting Period, the Company was not investigated for suspected crimes according to law, and none of its controlling shareholders, effective controller, Directors, Supervisors and senior management were not subject to any compulsory measures for suspected crimes according to law. The Company or its controlling shareholders, effective controller, Directors, Supervisors and senior management were not subject to any criminal punishment, investigation by the CSRC for alleged violation of laws and regulations, administrative penalty by the CSRC, or material administrative penalty by other competent authorities, nor were they detained by the disciplinary inspection and supervison authorities for alleged serious violation of disciplines or laws or duty-related crimes which had an impact on their performance of duties. None of the Company’s Directors, Supervisors and senior management were subject to any compulsory measures by other competent authorities for alleged violation of laws and regulations which had an impact on their performance of duties.
After the Reporting Period, as at the date of disclosure of this report, based on the information disclosed on 8 January 2022 on the website of the Central Commission for Discipline Inspection and the National Supervisory Commission, Mr. Wang Bin, the former Secretary of the Party Committee and the former Chairman of the Board of Directors of CLIC, is currently under the disciplinary review and investigation by the Central Commission for Discipline Inspection and the National Supervisory Commission for suspected serious violation of disciplines and laws. Mr. Wang Bin is also the former Chairman of the Board and the former Executive Director of the Company. Given that Mr. Wang Bin was not able to perform his role and duties as the Chairman of the Board during the period of review and investigation, Mr. Yuan Changqing, a Non-Executive Director of the Company, was elected at the sixth meeting of the seventh session of the Board of Directors of the Company to assume the roles and duties of the Chairman of the Board and the legal representative of the Company during the period commencing from the date of passing of the Board resolution and ending on the effective date of the appointment of a new Chairman of the Board. The Board received a resignation letter from Mr. Wang Bin on 23 February 2022. As Mr. Wang Bin was not able to perform his role and duties as a Director, he had resigned from his positions as the Chairman of the Board and an Executive Director of the Company. The resignation took effect on the same day. Please refer to the announcements published by the Company on the website of the HKSE on 9 January 2022, 13 January 2022 and 23 February 2022, respectively.
RESTRICTION ON MAJOR ASSETS
The major assets of the Company are financial assets. During the Reporting Period, there was no major asset of the Company being seized, detained or frozen that is subject to the disclosure requirements.
PERFORMANCE OF ENVIRONMENTAL AND SOCIAL RESPONSIBILITIES
For the performance by the Company of its social responsibility during the Reporting Period, please refer to the full text of the “2021 Environment, Social and Governance (ESG) Report” (“ESG Report 2021”) separately disclosed by the Company on the website of the SSE (www.sse.com.cn) and the HKExnews website of the Hong Kong Exchanges and Clearing Limited (www.hkexnews.hk). The specific information on environment is set out in Part Two of the ESG Report 2021, and the specific information on the consolidation of achievements in poverty alleviation and rural revitalization undertakings, etc. is set out in Part One of the ESG Report 2021.
49


PRACTICING THE BEST CORPORATE With the establishment of a corporate governance system with reasonably designed structure, well- developed mechanism, strict rules and regulations, as well as high efficiency in operation as its core objectives, the Company constantly promotes the development of corporate governance and commits to the best practices of corporate governance, so as to further improve governance structure and effectiveness.
CORPORATE GOVERNANCE
REPORT OF THE BOARD OF DIRECTORS
Directors of the Company during the Reporting Period and up to the date of this report were as follows:
| EXECUTIVE DIRECTORS | Su Hengxuan Li Mingguang Huang Xiumei
| (appointed on 1 July 2021)
| ||
| NON-EXECUTIVE DIRECTORS | Yuan Changqing Wang Junhui Liu Huimin Yin Zhaojun |
(resigned on 7 February 2021 due to the adjustment of work arrangements) (resigned on 15 January 2021 due to the adjustment of work arrangements) | ||
| INDEPENDENT DIRECTORS | Tang Xin Leung Oi-Sie Elsie Lam Chi Kuen Zhai Haitao Chang Tso Tung Stephen Robinson Drake Pike | (appointed on 29 June 2021) (appointed on 14 October 2021) (retired on 28 June 2021 due to the expiration of his term of office) (retired on 13 October 2021 due to the expiration of his term of office) | ||
Notes:
| 1. | The Board of the Company received a resignation letter from Mr. Wang Bin on 23 February 2022. As Mr. Wang Bin was not able to perform his role and duties as a Director, he had resigned from his positions as the Chairman of the Board and an Executive Director of the Company. |
| 2. | The Board of the Company received a resignation letter from Mr. Tang Xin, an Independent Director of the Company, on 6 March 2022. As Mr. Tang Xin had consecutively served as an Independent Director for six years, he tendered his resignation for such position to the Board of the Company pursuant to the relevant regulatory requirements. Since the resignation of Mr. Tang Xin will result in the number of Independent Directors of the Company falling below the minimum number required by the relevant regulations and the Articles of Association, Mr. Tang Xin will continue to perform his duties as an Independent Director until the qualification of a new Independent Director is approved by the CBIRC. |
52
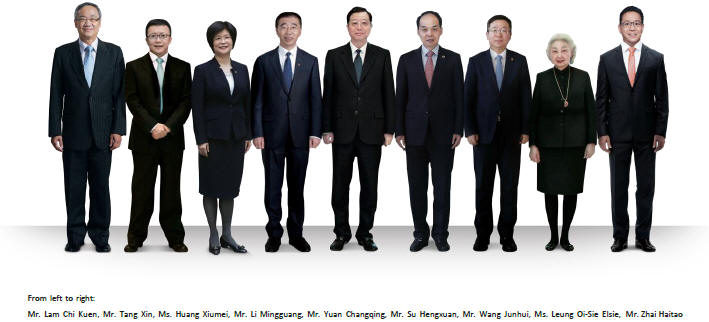
PRINCIPAL BUSINESS
The Company is a leading life insurance company in China and possesses an extensive distribution network comprising exclusive agents, direct sales representatives, and dedicated and non-dedicated agencies, providing products and services such as individual and group life insurance, accident and health insurance. The Company is one of the largest institutional investors in China, and becomes one of the largest insurance asset management companies in China through its controlling shareholding in AMC. The Company also has controlling shareholding in Pension Company.
BUSINESS REVIEW
Overall operation of the Company during the Reporting Period
For details of the overall operation of the Company during the Reporting Period, the future development of its business and the principal risks faced by it, please refer to the sections headed “Management Discussion and Analysis” and “Internal Control and Risk Management” in this annual report. These discussions form part of the “Report of the Board of Directors”.
Environmental policies and performance of the Company
With its commitment to “ensuring a healthy and friendly environment for the accomplishment of ‘carbon neutrality’ objective”, the Company practiced the concepts of responsible investment and green operations on a voluntarily basis and took active actions in responding to climate change, thus firmly pursuing the high-quality development with green and low carbon approach.
The Company kicked off green investment to serve the development of green finance. In 2021, the Company incorporated ESG assessment into its decision-making process for investment in alternative investment projects and was proactively engaged in the implementation of high-quality projects with both ecological benefits and potential investment returns, thus recording an additional green investment of over RMB50 billion and a cumulative green investment of over RMB300 billion for the year. AMC, the major platform of the Company for investment, further deepened its cooperation and communication with UNPRI and other international organizations and formulated the “Basic Guiding Rules of China Life Asset Management Company Limited for ESG/Green Investment (for Trial Implementation)” for the purpose of further developing its ESG investment management system.
53
The Company consistently promoted the paperless application for new insurance policies and facilitated the utilization of electronic insurance policies, thereby reducing carbon emissions incurred during the process of application for new insurance policies. In 2021, the paperless insurance application rate of long-term individual insurance reached 99.9%, which saved approximately 1,343 tons of paper during the process of the application of new policies. The intelligent online operation system was also established to save approximately 2,214 tons of paper in every aspect of its business operations. With the acceleration of technological innovation, the Company effectively supported the demands for remote working from a daily average number of over 90,000 users, offering a brand new experience of “working on the same platform, communicating without boundary and being interactive in multi-screen” for its employees and sales agents. Besides, more than 280,000 meetings were convened via the webcast and over 320 million online messages were sent out on a real-time basis for the year.
In 2021, the Company developed a system for addressing climate change, paid attention to and studied the impacts of climate change on its sustainable development, fully identified opportunities and challenges arising therefrom in three aspects, namely products, operations and investments, and devised any plans to address such change, so as to enhance its own resilience in defending against climate risk.
Compliance by the Company with the relevant laws and regulations that have a significant impact
The Company adhered to the code of conduct of “being trustworthy, assuming risks, emphasizing on services and being legal compliant” and promoted the compliance culture and concepts of “being compliant on a voluntary basis, and creating value from compliance”, thereby creating the compliance environment of “starting from the top level and having responsibility for all to be compliant”. The Company strictly observed and effectively implemented applicable laws and regulations and regulatory requirements, such as the Insurance Law, the Company Law, the Securities Law, the “Personal Information Protection Law”, the “Regulations on Preventing and Dealing with Illegal Fund-raising”, the “Provisions on the Administration of Insurance Companies” 3, the “Provisions of the China Banking and Insurance Regulatory Commission on Administrative Licensing Procedures”, the “Measures of the China Banking and Insurance Regulatory Commission on Administrative Punishment”, the “Provisions on the Supervision and Administration of Insurance Agents”, the “Standards for the Corporate Governance of Banking and Insurance Institutions”, the “Provisions on the Administration of Solvency of Insurance Companies”, the “Regulatory Rules for the Solvency of Insurance Companies”, the “Provisions on the Administration of Reinsurance Business”, the “Measures for the Administration of Licenses of Banking and Insurance Institutions”, the “Measures for Oversight of Online Insurance Business”, the “Notice of the General Office of the China Banking and Insurance Regulatory Commission on Further Regulating Matters Related to the Online Personal Insurance Business of Insurance Institutions”, the “Notice of the General Office of the China Banking and Insurance Regulatory Commission on Regulating Issues Related to Short-term Health Insurance Business”, the “Measures for the Supervision and Administration of Accident Insurance Business”, the “Measures for the Regulatory Evaluation of Consumers’ Rights and Interests Protection of Banking and Insurance Institutions” and the “Measures for the Administration of the Handling of Banking and Insurance Consumer Complaints”, consistently made improvement to its systems and mechanism, and implemented the spirit and requirements of major regulatory documents on product development and design, sales management, solvency management, reinsurance management, investment supervision and corporate governance, etc., as released by the CBIRC in a stringent manner for the purpose of further carrying out compliance management responsibilities at all levels and in various lines. The Company consistently improved the compliance management framework of “three lines of defense” to ensure that the three lines of defense performed their own functions and collaborated with each other, which formed a joint force in compliance management. The Company also consolidated its foundation in all aspects for its steady and healthy development and firmly defended the bottom line of the systematic risk, which guaranteed the healthy and high- quality development of the Company on an ongoing basis.
| 3 | On 30 December 2021, the CBIRC issued the “Regulatory Rules for the Solvency of Insurance Companies (II)”, which were implemented on 1 January 2022. The former “Regulatory Rules for the Solvency of Insurance Companies” were abolished simultaneously. |
54
Relationship between the Company and its customers
Being customer-centric all along, the Company was committed to offering high-quality services to customers, and provided insurance services and value-added services for more than 500 million customers.
The Company attached great importance to the protection of consumers’ rights and interests, improved the top-level design for facilitating the establishment of systems and mechanism, and developed a multi-dimensional mechanism for protection of consumers’ rights and interests covering product and service review, internal assessment, information disclosure, complaint management, promotion and education of financial knowledge and emergency response, etc., which integrated the protection of consumers’ rights and interests into every aspect of corporate governance and business operation and management. In 2021, the Company carried out over 40,000 educational and promotion activities in connection with the protection of consumers’ rights and interests, with the cumulative number of participants reaching 150 million.
Please also refer to the “Technology Empowerment and Operations and Services” in the section headed “Management Discussion and Analysis” in this annual report and Part Two of the ESG Report 2021 separately disclosed by the Company.
Relationship between the Company and its employees
The Company created a harmonious labour relationship according to law and entered into employment contracts with its employees in a timely manner. The Company strengthened the management of employees in all aspects by establishing the following mechanisms: an employee team management mechanism with the characteristics of focus on basic level, combination of training and working of employees, hierarchical responsibility and unified regulation; a performance management mechanism that was strategy-based and result-oriented, adopted hierarchical classification, and focused on application; and a remuneration distribution mechanism that was based on the principles of salary determined by position, remuneration paid based on performance, emphasis on incentives and preference to the local level, and was compatible with the high-quality development requirements of the Company. The Company also emphasized on the growth and cultivation of employees by stepping up its effort on the development of training system for employees, pursued innovation for development to apply education and training in the entire process of growth of cadre employees, and continued to focus on empowerment. The Company attached importance to humanistic concern by constantly improving the mechanism for communication with employees, safeguarding the legitimate rights and interests of employees in a practical manner and encouraging employees to arrange vacations and annual leave in a scientific way, with an aim to achieve work-life balance.
The Company actively promoted the construction of a corporate democratic management system with employee representative meetings as its basic form to protect the democratic rights of employees and to facilitate the joint development between employees and the Company. The Company and its provincial branches have fully established the system of employee representative meetings, safeguarded the right to know, right to propose, right to decide and right to vote at such meetings according to law, and inspected and monitored the implementation of any resolutions adopted by employee representative meetings, thus carrying out the function of supervising the implementation of proposals in a serious manner and constantly improving democratic management. In 2021, the Company held four extraordinary employee representative meetings, during which the “Report on the Candidates for Employee Representative Supervisors of the Seventh Session of the Board of Supervisors”, the “Provisional Measures of China Life Insurance Company Limited for the Responsibility Attribution of Directors, Supervisors and Senior Management”, the “Enterprise Annuity Plan of China Life Insurance (Group) Company”, the “Implementing Rules for the Enterprise Annuity Plan of China Life Insurance Company Limited”, the “Report on the Candidates for Additional Employee Representative Supervisors of the Seventh Session of the Board of Supervisors”, the “Measures for the Administration of Remuneration of Senior Management of Branches of China Life Insurance Company Limited”, the “Measures for the Administration of Remuneration of Employees of Branches of China Life Insurance Company Limited” and the “Measures for the Administration of Fringe Benefits of Branches of China Life Insurance Company Limited” were considered and approved.
For details regarding the Company’s employees (including the number of employees, composition of professionals, educational levels, remuneration policy and training program), please refer to the section headed “Directors, Supervisors, Senior Management and Employees” in this annual report.
55
For information such as the environmental policies and performance of the Company during the Reporting Period, relationship between the Company and its customers, and the relationship between the Company and its employees, please also refer to the full text of the ESG Report 2021 separately disclosed by the Company on the website of the SSE (www.sse.com.cn) and the HKExnews website of the Hong Kong Exchanges and Clearing Limited (www.hkexnews.hk).
FORMULATION AND IMPLEMENTATION OF PROFIT DISTRIBUTION POLICY
In accordance with Article 217 of the Articles of Association, the basic principles of the Company’s profit distribution are as follows:
| 1. | The Company shall take the investment return for investors into full account and allocate the required percentage of the Company’s realised distributable profits to shareholders as dividends each year; |
| 2. | The Company shall maintain a sustainable and steady profit distribution policy and at the same time take into consideration the Company’s long-term interest, general interest of all the shareholders and the sustainable development of the Company; |
| 3. | The Company shall give priority to cash dividends as its profit distribution manner. |
In accordance with Article 218 of the Articles of Association, the Company’s profit distribution policy is as follows:
| 1. | Profit distribution modes: The Company may distribute dividends in the form of cash or shares or a combination of cash and shares. If practicable, the Company may distribute interim dividends. The Company’s dividends shall not bear interest, save in the case where the Company fails to distribute the dividends to the shareholders on the day when dividends were due to have been distributed; |
| 2. | Conditions for and percentage of distribution of cash dividends: If the Company makes profits in a given year and the cumulative undistributed profit is positive, the Company shall distribute dividends in the form of cash and the cumulative profits distributed in cash over the past three years by the Company shall be no less than thirty percent (30%) of the average annual distributable profits in recent three years; |
| 3. | Conditions for distribution of share dividends: If the Company’s operation is sound and the Board of Directors is of the opinion that share dividends distribution is in the interest of all the Company’s shareholders since the Company’s stock price does not match the Company’s share capital, the Company may propose a share dividends distribution plan if the conditions for cash dividends listed above are satisfied. |
In addition, the Company’s profit distribution is required to comply with relevant regulatory requirements. If the Company’s core solvency ratio or comprehensive solvency ratio does not meet the minimum requirements, the CBIRC may adopt regulatory measures against the Company due to its failure to meet the minimum requirements, which may restrict the Company’s ability to distribute dividends to its shareholders.
In accordance with Article 219 of the Articles of Association, the procedures of reviewing the Company’s profit distribution proposal is as follows:
The Company’s profit distribution proposal shall be reviewed by the Board of Directors. The Board of Directors shall have a sufficient discussion of the reasonableness of the profit distribution proposal. After a special resolution regarding the proposal is reached and independent opinions have been given by the Company’s Independent Directors, the proposal shall be submitted to the Company’s general meeting for approval. In reviewing the profit distribution proposal, the Company shall provide Internet-based voting mechanism to the shareholders. When deliberating on specific cash dividend proposal by the Company’s general meeting, the Company shall make active communication with shareholders, especially small- and medium-sized shareholders, through various channels. The Company shall also fully solicit opinions and appeals from small- and medium-sized shareholders, and give timely reply to concerns of small- and medium-sized shareholders.
Profit distribution plan and public reserves capitalization plan for the year 2021
In accordance with the profit distribution plan for the year 2021 approved by the Board on 24 March 2022, with the appropriation to its discretionary surplus reserve fund of RMB5,096 million (10% of the net profit for 2021), the Company, based on 28,264,705,000 shares in issue, proposed to distribute cash dividends amounting to approximately RMB18,372 million (representing 36% of the net profit attributable to equity holders of the Company in the consolidated statements) to all shareholders of the Company at RMB0.65 per share (inclusive of tax). The foregoing profit distribution plan is subject to the approval by the 2021 Annual General Meeting. Dividends payable to domestic shareholders are declared, valued and paid in RMB. Dividends payable to shareholders of the Company’s foreign-listed shares are declared and valued in RMB and paid in the currency of the jurisdiction in which the foreign-listed shares are listed (if the Company is listed in more than one jurisdiction, dividends shall be paid in the currency of the Company’s principal jurisdiction of listing as determined by the Board). The Company shall pay dividends to shareholders of foreign-listed shares in conformity with the PRC regulations on foreign exchange control. If no such regulations are in place, the applicable exchange rate is the average closing rate published by the People’s Bank of China one week before the declaration of the distribution of dividends.
56
No public reserve capitalization is provided for in the profit distribution plan for the year.
The profit distribution policy of the Company complied with the Articles of Association and the examination and approval procedures of the Company, clearly defined the dividend distribution standards and percentage and the decision-making procedures and system. Small-and medium-sized shareholders of the Company have sufficient opportunities to express their opinions and appeals, and their legitimate rights have been well protected. The Independent Directors diligently considered the profit distribution policy and expressed their independent opinions in this regard.
CHANGES IN ACCOUNTING ESTIMATES
The changes in accounting estimates of the Company during the Reporting Period are set out in Note 3 in the Notes to the Consolidated Financial Statements in this annual report.
RESERVES
Details of the reserves of the Company are set out in Note 37 in the Notes to the Consolidated Financial Statements in this annual report.
CHARITABLE DONATIONS
The total amount of charitable donations made by the Company during the Reporting Period was approximately RMB218.88 million.
PROPERTY, PLANT AND EQUIPMENT
Details of the movement in property, plant and equipment of the Company are set out in Note 6 in the Notes to the Consolidated Financial Statements in this annual report.
SHARE CAPITAL
Details of the movement in share capital of the Company are set out in Note 36 in the Notes to the Consolidated Financial Statements in this annual report.
INFORMATION OF TAX DEDUCTION FOR HOLDERS OF LISTED SECURITIES
Shareholders are taxed and/or enjoy tax relief for the dividend income received from the Company in accordance with the “Individual Income Tax Law of the People’s Republic of China”, the “Enterprise Income Tax Law of the People’s Republic of China”, and relevant administrative rules, governmental regulations and guiding documents. Please refer to the announcement published by the Company on the website of the SSE on 9 July 2021 for the information on income tax in respect of the dividend distributed to A Share shareholders during the Reporting Period, and the announcement published by the Company on the HKExnews website of Hong Kong Exchanges and Clearing Limited on 30 June 2021 for the information on income tax in respect of the dividend distributed to H Share shareholders during the Reporting Period.
PURCHASE, SALE OR REDEMPTION OF THE COMPANY’S SECURITIES
During the Reporting Period, the Company and its subsidiaries did not purchase, sell or redeem any of the Company’s listed securities.
H SHARE STOCK APPRECIATION RIGHTS
No H Share stock appreciation rights of the Company were granted or exercised in 2021. The Company will deal with such rights and related matters in accordance with the PRC national policies.
DAY-TO-DAY OPERATIONS OF THE BOARD
Details of the Board meetings and the Board’s performance of its duties during the Reporting Period are set out in the section headed “Report of Corporate Governance” in this annual report.
DIRECTORS’ AND SUPERVISORS’ SERVICE CONTRACTS
None of the Directors or Supervisors has entered into any service contracts with the Company and its subsidiaries that are not terminable within one year or can only be terminated by the Company with payment of compensation (other than statutory compensation).
57
INTERESTS OF DIRECTORS AND SUPERVISORS (AND THEIR CONNECTED ENTITIES) IN MATERIAL TRANSACTIONS, ARRANGEMENTS OR CONTRACTS
None of the Directors or Supervisors (and their connected entities) is or was materially interested, directly or indirectly, in any transaction, arrangement or contract of significance entered into by the Company or its controlling shareholders or any of their respective subsidiaries at any time during the Reporting Period or subsisted at the end of the Reporting Period.
DIRECTORS’ AND SUPERVISORS’ RIGHTS TO ACQUIRE SHARES
No arrangements to which the Company, any of its subsidiaries or holding companies, or any subsidiary of the Company’s holding companies is a party, and whose objects are, or one of whose objects is, to enable Directors or Supervisors (including their spouses and children under the age of 18) to acquire benefits by means of the acquisition of shares in, or debentures of, the Company or any other body corporate, subsisted at any time during the Reporting Period or at the end of the Reporting Period.
DISCLOSURE OF INTERESTS OF DIRECTORS, SUPERVISORS AND THE CHIEF EXECUTIVE IN THE SHARES OF THE COMPANY
As at the end of the Reporting Period, none of the Directors, Supervisors and the chief executive of the Company had any interests or short positions in the shares, underlying shares or debentures of the Company or its associated corporations (within the meaning of Part XV of the Securities and Futures Ordinance (Chapter 571 of the Laws of Hong Kong) (the “SFO”)) that were required to be recorded in the register of the Company required to be kept pursuant to Section 352 of the SFO or which had to be notified to the Company and the HKSE pursuant to the Model Code for Securities Transactions by Directors of Listed Issuers (the “Model Code”) as set out in Appendix 10 to the Listing Rules. In addition, the Board has created a code of conduct in relation to the sale and purchase of the Company’s securities by Directors and Supervisors, which is no less stringent than the Model Code. Upon specific inquiry by the Company, the Directors and Supervisors have confirmed observation of the Model Code and the Company’s own code of conduct in the year of 2021.
PERMITTED INDEMNITY PROVISION
The Company made appropriate insurance arrangement with respect to legal actions that might be faced by its Directors in connection with corporate activities, and such insurance arrangement was in force during the Reporting Period and up to the date of this report.
PENSION PLAN
Full-time employees of the Company are covered by various government-sponsored pension plans, under which the employees are entitled to a monthly pension based on certain formulae. These government agencies are responsible for the pension liability to these employees upon retirement. The Company contributes on a monthly basis to these pension plans. All contributions made under the government-sponsored pension plans described above are fully attributable to employees of the Company at the time of the payment and the Company is unable to forfeit any amounts contributed by it to such plans. In addition to the government-sponsored pension plans, the Company established an employee annuity fund plan pursuant to the relevant laws and regulations in the PRC, whereby the Company is required to contribute to the plan at fixed rates of the employees’ salary costs. Contributions made by the Company under the annuity fund plan that is forfeited in respect of those employees who resign from their positions prior to the full vesting of the contributions will be recorded in the public account of the annuity fund and shall not be used to offset any contributions to be made by the Company in the future. All funds in the public account will be attributed to the employees whose accounts are in normal status after the approval procedures are completed as required. Under these plans, the Company has no legal or constructive obligation for retirement benefit beyond the contributions made.
58
PRE-EMPTIVE RIGHTS AND ARRANGEMENTS FOR SHARE OPTIONS
According to the Articles of Association and relevant PRC laws, there is no provision for any pre-emptive rights of the shareholders of the Company. At present, the Company does not have any arrangement for share options.
MANAGEMENT CONTRACTS
No management or administration contracts for the whole or substantial part of any business of the Company were entered into during the Reporting Period.
MATERIAL GUARANTEES
Independent Directors of the Company have rendered their independent opinions on the Company’s external guarantees, and are of the view that:
| 1. | during the Reporting Period, the Company did not provide any external guarantee; |
| 2. | the Company’s internal control system regarding external guarantees is in compliance with the requirements of relevant laws and regulations; and |
| 3. | the Company has expressly provided in its Articles of Association the level of authority required for approving external guarantees and the approval procedures. |
RESPONSIBILITY STATEMENT OF DIRECTORS ON FINANCIAL REPORTS
The Directors are responsible for overseeing the preparation of the financial report for each financial period which gives a true and fair view of the Company’s financial position, performance results and cash flows for that period. To the best knowledge of the Directors, there was no material event or condition during the Reporting Period that might have a material adverse effect on the on-going operations of the Company.
BOARD’S STATEMENT ON INTERNAL CONTROL
In accordance with the requirements of the “Standard Regulations on Corporate Internal Control”, the Board conducted an assessment on internal control relating to the Company’s financial reporting functions, and confirmed that its internal control was effective as at 31 December 2021.
MAJOR CUSTOMERS
In 2021, the gross written premiums received from the Company’s five largest customers accounted for less than 5% of the Company’s gross written premiums for the year. There is no related party of the Company among the five largest customers.
SUFFICIENCY OF PUBLIC FLOAT
Based on the information publicly available to the Company and within the knowledge of the Directors as at the Latest Practicable Date (24 March 2022), not less than 25% of the issued share capital of the Company (being the minimum public float applicable to the shares of the Company) was held in public hands.
COMPLIANCE WITH THE CORPORATE GOVERNANCE CODE
The Company has applied the principles of the Corporate Governance Code (the “CG Code”) as set out in Appendix 14 to the Listing Rules, and has complied with all code provisions of the CG Code during the Reporting Period.
59
AUDITORS
Following the consideration and approval by the shareholders at the 2020 Annual General Meeting of the Company, PricewaterhouseCoopers Zhong Tian LLP has been appointed as the PRC auditor and the auditor for the Form 20-F of the Company for the year 2021, and PricewaterhouseCoopers has been appointed as the Hong Kong auditor of the Company for the year 2021, who will hold office until the conclusion of the 2021 Annual General Meeting. In 2021, PricewaterhouseCoopers Zhong Tian LLP and PricewaterhouseCoopers served as the Company’s auditors for the first year.
Remuneration paid by the Company to the auditors is subject to the approval at the shareholders’ general meeting, pursuant to which the Board is authorized to determine the amount and make payment. Audit fees paid by the Company to the auditors will not affect the independence of the auditors.
Remuneration paid by the Company to PricewaterhouseCoopers Zhong Tian LLP and PricewaterhouseCoopers in 2021 was as follows:
Service/Nature | RMB million
Fees | |||
Audit, review and agreed-upon procedures fee | 46.51 | |||
Including: Internal control audit fee | 8.50 | |||
Non-audit services fee (tax services and consultation services) | 1.13 | |||
|
| |||
Total | 47.64 | |||
|
| |||
The Company had engaged Ernst & Young Hua Ming LLP and Ernst & Young for eight consecutive years, being the maximum consecutive tenure of service permitted under the “Administrative Measures for the Appointment of Accounting Firms by State-owned Financial Enterprises” (Caijin [2020] No. 6) issued by the Ministry of Finance, and the Company was therefore required to change the auditors. Ernst & Young Hua Ming LLP, the PRC auditor and the auditor for the Form 20-F of the Company for the year 2020, and Ernst & Young, the Hong Kong auditor of the Company for the year 2020, had retired as the auditors of the Company upon conclusion of the 2020 Annual General Meeting. The Company had communicated with the accounting firms originally engaged by it in connection with the change of accounting firms, and such accounting firms did not raise any objection against the change.
The Company is taking active actions to proceed with the selection and appointment of its auditors for the year 2022, and investors are advised to pay attention to the announcements made by the Company in its listed jurisdictions for the further development in this regard.
By Order of the Board Yuan Changqing Non-executive Director | ||||
| 24 March 2022 | ||||
60
REPORT OF THE BOARD OF SUPERVISORS
Pursuant to the Company Law and the Articles of Association, the Company has established a Board of Supervisors. The Board of Supervisors performs the following duties in accordance with the Company Law, the Articles of Association and the “Procedural Rules for the Board of Supervisors Meetings”: to examine the finances of the Company; to monitor whether the Directors, President, Vice Presidents and other senior management officers of the Company have acted in contravention of laws, regulations, the Articles of Association and resolutions of the shareholders’ general meetings when discharging their duties; to review the financial information of the Company such as financial reports, results reports and profit distribution plans to be approved by the Board; to propose the convening of extraordinary shareholders’ general meetings, to propose resolutions at shareholders’ general meetings and to perform any other duties under the laws, regulations and regulatory rules of the Company’s listed jurisdictions.
The Board of Supervisors consists of Non-employee Representative Supervisor s, such as shareholder representatives, and Employee Representative Supervisors, of which the Employee Representative Supervisors shall not be less than one-third of the Board of Supervisors. Non-employee Representative Supervisors, such as shareholder representatives, shall be elected and removed by a shareholders’ general meeting while
Employee Representative Supervisors shall be elected and removed by employees of the Company in a democratic manner.
The Board of Supervisor s is accountable to the shareholders and reports its work to the shareholders’ general meeting according to relevant laws. It is also responsible for appraising the Company’s operations in compliance with law, financial reports, connected transactions and internal control, etc. during the Reporting Period.
61
Meetings of the Board of Supervisors are convened by the Chairman of the Board of Supervisors. According to the Articles of Association, the Company formulated the “Procedural Rules for the Board of Supervisors Meetings” and established protocols for the Board of Supervisors meetings. Board of Supervisors meetings are categorized as regular or ad-hoc meetings in accordance with the degree of pre-planning involved. There are at least three regular meetings each year, mainly to adopt and review financial reports and periodic reports, and examine the financial condition and internal control of the Company. Ad-hoc meetings are convened when necessary.
Currently, the seventh session of the Board of Supervisors of the Company comprises Mr. Jia Yuzeng, Mr. Niu Kailong4, Mr. Cao Qingyang, Ms. Wang Xiaoqing and Mr. Lai Jun5, with Mr. Jia Yuzeng acting as the Chairman of the Board of Supervisors. Mr. Jia Yuzeng and Mr. Niu Kailong are Non-employee Representative Supervisors, whereas Mr. Cao Qingyang, Ms. Wang Xiaoqing and Mr. Lai Jun are Employee Representative Supervisors. In October 2021, Mr. Han Bing resigned from his position as a Supervisor of the Company due to the adjustment of work arrangements.
MEETINGS AND ATTENDANCE
During the Reporting Period, six meetings were held by the Board of Supervisors of the Company. Attendance records of individual Supervisors are as follows:
Name of Supervisor | Number of meetings attended in person/number of meetings required to attend | Number of meetings attended by proxies/number of meetings required to attend | ||||||
Jia Yuzeng Niu | 6/6 | 0/6 | ||||||
Kailong Cao | 2/2 | 0/2 | ||||||
Qingyang | 6/6 | 0/6 | ||||||
Wang Xiaoqing | 6/6 | 0/6 | ||||||
Lai Jun | 2/2 | 0/2 | ||||||
Attendance records of the resigned Supervisor at the meetings of the Board of Supervisors are as follows:
Name of Supervisor | Number of meetings attended in person/number of meetings required to attend | Number of meetings attended by proxies/number of meetings required to attend | ||||||
Han Bing | 4/4 | 0/4 | ||||||
| Note: | The number of meetings attended in person includes meetings attended by the Supervisors on-site and by way of telephone or video conference. |
ACTIVITIES OF THE BOARD OF SUPERVISORS
Attending meetings of the Board of Supervisors and diligently discharging their duties. Pursuant to the regulatory requirements of the jurisdictions where the Company is listed, the Articles of Association and the “Procedural Rules for the Board of Supervisors’ Meetings” of the Company, and in accordance with the work arrangement of the Board of Supervisors, the Board of Supervisors convened its regular meetings in a timely manner, at which it considered and approved proposals in relation to the Company’s financial reports, periodic reports, internal control, and risk management, etc. In 2021, the Board of Supervisors held six meetings in total, at which the Supervisors earnestly expressed their views, actively participated in discussions and diligently discharged their duties, thereby providing valuable advice for the business development of the Company.
| 4 | As elected by the 2020 Annual General Meeting of the Company and upon approval by the CBIRC, the appointment of Mr. Niu Kailong as a Supervisor became effective on 14 October 2021. |
| 5 | As elected by the sixth extraordinary meeting of the third session of the employee representative meeting of the Company and upon approval by the CBIRC, the appointment of Mr. Lai Jun as a Superviors became effective on 14 October 2021. |
62
Attending and participating in corporate governance meetings and actively exercising their supervisory role. In 2021, the Board of Supervisors attended the 2020 Annual General Meeting of the Company and the First Extraordinary General Meeting 2021, and participated in the regular meetings of the Board. All members of the Board of Supervisors participated in the regular meetings of the Audit Committee, the Nomination and Remuneration Committee, the Risk Management and Consumer Rights Protection Committee, the Strategy and Assets and Liabilities Management Committee, and the Connected Transactions Control Committee, respectively, in accordance with the work allocation among Supervisors determined by the Board of Supervisors. By attending these meetings, all Supervisors diligently discharged their duties, oversaw the procedures for convening meetings, carefully listened to the matters considered at the meetings, and participated in discussions when necessary, thus proactively pushing forward the further enhancement of corporate governance.
Supervising the performance of duties by the Board and senior management in reputational risk management. Members of the Board of Supervisors listened to an annual reputational risk management report prepared by the senior management through participation in the meetings of the Board and the Risk Management and Consumer Rights Protection Committee, so as to supervise the performance of duties by the Board in reputational risk management.
Organizing the evaluations of the performance of duties by Directors and Supervisors. Firstly, an evaluation of the performance of duties by Directors was comm enced in accordance with the “Measures for the Evaluation of the Performance of Duties by Directors and Supervisors of the Company”. Secondly, an evaluation of the performance of duties by Supervisors was organized and commenced in accordance with the “Measures for the Evaluation of the Performance of Duties by Directors and Supervisors of the Company”. After the final evaluation by the Board of Supervisors, all members of both the Board6 and the Board of Supervisors of the Company were evaluated as competent in their performance of duties in 2021.
Actively conducting research and investigation activities, examining and understanding the business operations of the Company. In November 2021, the members of the Board of Supervisors conducted investigation and research activities on the investment sector of the Company, listened to reports concerning the investment management structure and investment system of the Company, and had discussion and communication among themselves with respect to the relevant issues. Through the investigation and research, the Board of Supervisors comprehended the risk prevention and control mechanism for the investment business of the Company in great depth, and further discussed matters in relation to the optimization of the risk prevention and control mechanism, the implementation of the “Dingxin Project” and the promotion of the high- quality development of the Company.
Attending training courses and constantly enhancing performance of duties by the Supervisors. In 2021, all members of the Board of Supervisors attended the training programs on anti-money laundering and a training course on the “Standards for the Corporate Governance of Banking and Insurance Institutions” offered by The Insurance Association of China. Mr. Jia Yuzeng, the Chairman of the Board of Supervisors, attended a special training course for directors and supervisors of listed companies within Beijing as organized by the Listed Companies Association of Beijing (the “LCAB”) and the “Special Training Course for the Supervisory Committee of Listed Companies” offered by the China Association for Public Companies. Mr. Niu Kailong, Mr. Cao Qingyang and Ms. Wang Xiaoqing, being the Supervisors, attended a special training course for directors and supervisors of listed companies within Beijing as organized by the LCAB, respectively.
| 6 | As Mr. Wang Bin, a former Executive Director of the Company, was unable to perform his duties as a Director nor participate in a Director self- assessment in the evaluation of the performance of duties by Directors for 2021, he was excluded from the scope of such evaluation. |
63
INDEPENDENT OPINION OF THE BOARD OF SUPERVISORS ON CERTAIN MATTERS
During the Reporting Period, the Board of Supervisors of the Company performed its supervisory duties in a diligent manner in accordance with the requirements of the Company Law, the Articles of Association and the “Procedural Rules for the Board of Supervisors Meetings”. The Board of Supervisors had no objection in respect of the matters under its supervision during the Reporting Period.
The Company’s operations in compliance with law. During the Reporting Period, the Company’s operations were in compliance with the law. The Company’s operations and decision-making procedures were in compliance with the Company Law and the Articles of Association. All Directors and senior management of the Company maintained strict principles of diligence and integrity and performed their duties conscientiously. The Board of Supervisors is not aware of any of them having violated any law, regulation, or any provision in the Articles of Association or harmed the interests of the Company in the course of discharging their duties.
The authenticity of the financial report. The Company’s annual financial report truly reflected the Company’s financial position and operating results. PricewaterhouseCoopers Zhong Tian LLP and PricewaterhouseCoopers have performed audits and have issued standard and unqualified auditors’ reports in respect of the financial statements for the year 2021 in accordance with the China Standards on Auditing of PRC Certified Public Accountants and the International Standards on Auditing, respectively.
Acquisition and sale of assets. During the Reporting Period, the prices for acquisition and sale of assets by the Company were fair and reasonable. The Board of Supervisors is not aware of any insider trading, any acts harming the interests of shareholders or incurring any loss to the Company’s assets.
Connected transactions. During the Reporting Period, the connected transactions of the Company were on commercial terms. The Board of Supervisors is not aware of any acts harming the interests of the Company.
Internal control system and self-evaluation report on internal control. During the Reporting Period, the Company sought to improve its internal control system, and consistently enhanced the effectiveness of such system. The Board of Supervisors of the Company reviewed the self-evaluation report on the Company’s internal control system and did not raise any objection against the self-evaluation report of the Board regarding the Company’s internal control system.
Information disclosure. The Company performed its obligation of information disclosure in strict compliance with the regulatory requirements, seriously implemented various information disclosure management systems, and disclosed information in a timely and fair manner. The Board of Supervisors is not aware of any false representations, misleading statements or material omissions during the Reporting Period.
By Order of the Board of Supervisors Jia Yuzeng Chairman of the Board of Supervisors | ||||
| 24 March 2022 | ||||
64
CHANGES IN ORDINARY SHARES AND SHAREHOLDERS INFORMATION
CHANGES IN SHARE CAPITAL
During the Reporting Period, there was no change in the total number of shares and the share capital of the Company.
ISSUE AND LISTING OF SECURITIES
As at the end of the Reporting Period, the Company had not issued any securities in the last three years. During the Reporting Period, there was no change in the total number of shares and the share structure of the Company due to bonus issues or placings, nor were there any internal employees’ shares.
INFORMATION ON SHAREHOLDERS AND EFFECTIVE CONTROLLER
Total number of shareholders and their shareholdings
| Total number of ordinary share shareholders as at the end of the Reporting Period | No. of A Share shareholders: 151,802 No. of H Share shareholders: 25,415 | Total number of ordinary share shareholders as at the end of the month prior to the disclosure of the annual report | No. of A Share shareholders: 147,078 No. of H Share shareholders: 25,326 |
Particulars of top ten shareholders of the Company
| Unit: Shares | ||||||||||||||||||||||
Name of shareholder | Nature of shareholder | Percentage of shareholding | Number of shares held as at the end of the Reporting Period | Increase/decrease during the Reporting Period | Number of shares subject to selling restrictions | Number of shares pledged or frozen | ||||||||||||||||
China Life Insurance (Group) Company HKSCC | State-owned legal person | 68.37 | % | 19,323,530,000 | — | — | — | |||||||||||||||
Nominees Limited | Overseas legal person | 25.93 | % | 7,327,931,503 | +596,257 | — | — | |||||||||||||||
China Securities Finance Corporation Limited | State-owned legal person | 2.51 | % | 708,240,246 | -15,697,388 | — | — | |||||||||||||||
Central Huijin Asset Management Limited | State-owned legal person | 0.41 | % | 117,165,585 | -2,554,315 | — | — | |||||||||||||||
Hong Kong Securities Clearing Company Limited | Overseas legal person | 0.20 | % | 57,106,771 | +8,685,066 | — | — | |||||||||||||||
Guosen Securities Co., Ltd. – Founder Fubon CSI Insurance Theme Index Security Investment Fund | Other | 0.08 | % | 22,334,683 | +18,520,041 | — | — | |||||||||||||||
China Universal Asset Management Co., Ltd | Other | 0.05 | % | 15,015,845 | — | — | — | |||||||||||||||
Industrial and Commercial Bank of China Limited – SSE 50 Exchange Traded Index Securities Investment Fund | Other | 0.05 | % | 14,177,504 | +1,780,228 | — | — | |||||||||||||||
China International Television Corporation Li | State-owned legal person | 0.04 | % | 10,000,000 | — | — | — | |||||||||||||||
Zhuo | Domestic natural person | 0.03 | % | 9,530,133 | +9,530,033 | — | — | |||||||||||||||
65
Notes:
| 1. | HKSCC Nominees Limited is a company that holds shares on behalf of the clients of the Hong Kong stock brokers and other participants of the CCASS system. The relevant regulations of the HKSE do not require such persons to declare whether their shareholdings are pledged or frozen. Hence, HKSCC Nominees Limited is unable to calculate or provide the number of shares that are pledged or frozen. |
| 2. | China Universal Asset Management Co., Ltd – Industrial and Commercial Bank of China Limited – China Universal – Tianfu Bull No. 53 Asset Management Plan has Industrial and Commercial Bank of China Limited as its asset trustee. Industrial and Commercial Bank of China Limited - SSE 50 Exchange Traded Index Securities Investment Fund has Industrial and Commercial Bank of China Limited as its fund depositary. Save as above, the Company was not aware of any connected relationship and concerted parties as defined by the “Measures for the Administration of the Takeover of Listed Companies” among the top ten shareholders of the Company. |
Information relating to the Controlling Shareholder and Effective Controller
The controlling shareholder of the Company is CLIC, and its relevant information is set out below:
| Name of company | China Life Insurance (Group) Company | |
| Legal representative | Bai Tao (the change of registration with the department in charge of industrial and commercial administration is in progress) | |
| Date of incorporation | 22 August 1996 (CLIC’s predecessor was PICC (Life) Co., Ltd. incorporated in August 1996. It was renamed as China Life Insurance Company, a company approved for formation by the State Council in January 1999. With the approval of the former China Insurance Regulatory Commission in 2003, China Life Insurance Company was restructured as CLIC.) | |
| Major businesses | Insurance services including receipt of premiums and payment of benefits in respect of the in-force life, health, accident and other types of personal insurance business, and the reinsurance business; holding or investing in domestic and overseas insurance companies or other financial insurance institutions; funds application business permitted by national laws and regulations or approved by the State Council of PRC; other businesses approved by insurance regulatory agency. | |
| Shareholdings in other subsidiaries and affiliates listed in China or abroad during the Reporting Period | As at 31 December 2021, CLIC held 1,785,098,644 H shares of Town Health International Medical Group Limited, representing 23.72% of its total shares. | |
The effective controller of the Company is the Ministry of Finance. The equity and controlling relationship between the Company and its effective controller is set out as below:
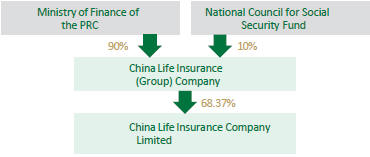
During the Reporting Period, there was no change to the controlling shareholder and the effective controller of the Company. As at the end of the Reporting Period, there was no other corporate shareholder holding more than 10% of the shares in the Company.
66
INTERESTS AND SHORT POSITIONS IN THE SHARES AND UNDERLYING SHARES OF THE COMPANY HELD BY SUBSTANTIAL SHAREHOLDERS AND OTHER PERSONS UNDER HONG KONG LAWS AND REGULATIONS
So far as is known to the Directors, Supervisors and the chief executive of the Company, as at 31 December 2021, the following persons (other than the Directors, Supervisors and the chief executive of the Company) had interests or short positions in the shares or underlying shares of the Company which would fall to be disclosed to the Company under the provisions of Divisions 2 and 3 of Part XV of the SFO, or which were recorded in the register required to be kept by the Company pursuant to Section 336 of the SFO, or as otherwise notified to the Company and the HKSE:
Name of substantial shareholder | Capacity | Class of shares | Number of shares held | Percentage of the respective class of shares | Percentage of the total number of shares in issue | |||||||||||||
China Life Insurance (Group) Company | Beneficial owner | A Shares | 19,323,530,000 | (L) | 92.80 | % | 68.37 | % | ||||||||||
BlackRock, Inc. (Note) | Interest in controlled | H Shares | 461,251,819 | (L) | 6.20 | % | 1.63 | % | ||||||||||
| corporation | 652,000 | (S) | 0.01 | % | 0.00 | % | ||||||||||||
The letter “L” denotes a long position. The letter “S” denotes a short position.
| (Note): | BlackRock, Inc. was interested in a total of 461,251,819 H shares of the Company in accordance with the provisions of Part XV of the SFO. Of these shares, BlackRock Investment Management, LLC, BlackRock Financial Management, Inc., BlackRock Institutional Trust Company, National Association, BlackRock Fund Advisors, BlackRock Advisors, LLC, BlackRock Japan Co., Ltd., BlackRock Asset Management Canada Limited, BlackRock Investment Management (Australia) Limited, BlackRock Asset Management North Asia Limited, BlackRock (Netherlands) B.V., BlackRock Advisors (UK) Limited, BlackRock Asset Management Ireland Limited, BLACKROCK (Luxembourg) S.A., BlackRock Investment Management (UK) Limited, BlackRock Asset Management Deutschland AG, BlackRock Fund Managers Limited, BlackRock Life Limited, BlackRock (Singapore) Limited, BlackRock Asset Management Schweiz AG and Aperio Group, LLC were interested in 4,749,000 H shares, 7,569,000 H shares, 120,413,588 H shares, 157,902,000 H shares, 921,000 H shares, 26,902,045 H shares, 861,000 H shares, 4,736,000 H shares, 16,378,329 H shares, 16,450,130 H shares, 713,000 H shares, 61,780,448 H shares, 814,000 H shares, 14,928,733 H shares, 426,000 H shares, 14,187,720 H shares, 2,962,021 H shares, 2,710,000 H shares, 32,000 H shares and 5,815,805 H shares, respectively. All of these entities are either controlled or indirectly controlled subsidiaries of BlackRock, Inc. Of these 461,251,819 H shares, 159,000 H shares were cash settled unlisted derivatives. |
BlackRock, Inc. held by way of attribution a short position as defined under Part XV of the SFO in 652,000 H shares (0.01%). Of these 652,000 H shares, 551,000 H shares were cash settled unlisted derivatives.
Save as disclosed above, the Directors, Supervisors and the chief executive of the Company are not aware of any other party who, as at 31 December 2021, had an interest or short position in the shares and underlying shares of the Company which was recorded in the register required to be kept by the Company pursuant to Section 336 of the SFO.
67
DIRECTORS, SUPERVISORS, SENIOR MANAGEMENT AND EMPLOYEES
DIRECTORS, SUPERVISORS AND SENIOR MANAGEMENT
CURRENT DIRECTORS, SUPERVISORS AND SENIOR MANAGEMENT
Name | Position | Gender | Date of Birth | Term | Salary/ Remuneration paid in RMB ten thousands | Other benefits, social insurance, housing provident fund and enterprise annuity fund paid by the Company in RMB ten thousands | Total emoluments received from the Company during the Reporting Period in RMB ten thousands (before tax) | Whether | ||||||||||||||
Yuan Changqing | Non-executive Director | Male | September 1961 | Since 11 February 2018 | — | — | — | Yes | ||||||||||||||
Su Hengxuan | Executive Director President | Male | February 1963 | Appointed as an Executive Director since 20 December 2018, President since April 2019 | — | — | — | Yes | ||||||||||||||
Li Mingguang | Executive Director Vice President Chief Actuary Board Secretary | Male | July 1969 | Appointed as an Executive Director since 16 August 2019, Vice President since November 2014, Chief Actuary since March 2012, Board Secretary since June 2017 | 125.30 | 25.80 | 151.10 | No | ||||||||||||||
Huang Xiumei | Executive Director Vice President Person in Charge of Finance | Female | June 1967 | Appointed as an Executive Director since 1 July 2021, Vice President and Person in Charge of Finance since May 2020 | 125.30 | 23.96 | 149.26 | No | ||||||||||||||
Wang Junhui Tang | Non-executive Director | Male | July 1971 | Since 16 August 2019 | — | — | — | Yes | ||||||||||||||
Xin | Independent Director | Male | September 1971 | Since 7 March 2016 | 37.00 | 0 | 37.00 | No | ||||||||||||||
Leung Oi-Sie Elsie | Independent Director | Female | April 1939 | Since 20 July 2016 | 36.00 | 0 | 36.00 | No | ||||||||||||||
Lam Chi Kuen | Independent Director | Male | April 1953 | Since 29 June 2021 | 21.00 | 0 | 21.00 | No | ||||||||||||||
Zhai Haitao | Independent Director | Male | January 1969 | Since 14 October 2021 | 7.00 | 0 | 7.00 | Yes | ||||||||||||||
Jia Yuzeng | Chairman of the Board of Supervisors | Male | June 1962 | Since 11 July 2018 | 125.30 | 23.75 | 149.05 | No | ||||||||||||||
Niu Kailong | Non-employee Representative Supervisor | Male | September 1974 | Since 14 October 2021 | — | — | — | Yes | ||||||||||||||
Cao Qingyang | Employee Representative Supervisor | Male | May 1963 | Since 12 July 2019 | 69.00 | 25.44 | 94.44 | No | ||||||||||||||
Wang Xiaoqing | Employee Representative Supervisor | Female | October 1965 | Since 27 December 2019 | 60.14 | 24.09 | 84.23 | No | ||||||||||||||
Lai Jun | Employee Representative Supervisor | Male | May 1964 | Since 14 October 2021 | 11.29 | 4.09 | 15.38 | No | ||||||||||||||
Ruan Qi | Vice President | Male | July 1966 | Since April 2018 | 125.30 | 23.75 | 149.05 | No | ||||||||||||||
Zhan Zhong | Vice President | Male | April 1968 | Since July 2019 | 125.30 | 23.75 | 149.05 | No | ||||||||||||||
68
Name | Position | Gender | Date of Birth | Term | Salary/ Remuneration paid in RMB ten thousands | Other benefits, social insurance, housing provident fund and enterprise annuity fund paid by the Company in RMB ten thousands | Total emoluments received from the Company during the Reporting Period in RMB ten thousands (before tax) | Whether | ||||||||||||||
Yang Hong | Vice President | Female | February 1967 | Since July 2019 | 125.30 | 23.79 | 149.09 | No | ||||||||||||||
Zhao Guodong | Assistant to the President | Male | November 1967 | Since October 2019 | 65.00 | 23.80 | 88.80 | No | ||||||||||||||
Liu Yuejin | Assistant to the President | Male | April 1967 | Since June 2021 | 32.50 | 11.52 | 44.02 | No | ||||||||||||||
Zhang Di | Assistant to the President Chief Investment Officer | Female | January 1968 | Appointed as an Assistant to the President since December 2021, Chief Investment Officer since January 2022 | — | — | — | No | ||||||||||||||
Xu Chongmiao | Compliance Officer | Male | October 1969 | Since July 2018 | 68.34 | 24.67 | 93.01 | No | ||||||||||||||
Liu Fengji | Person in Charge of Audit | Male | October 1969 | Since December 2021 | — | — | — | No | ||||||||||||||
|
|
|
|
|
|
|
|
|
|
| ||||||||||||
| Total | / | / | / | / | 1,159.07 | 258.41 | 1,417.48 | / | ||||||||||||||
|
|
|
|
|
|
|
|
|
|
| ||||||||||||
Notes:
| 1. | None of the current Directors, Supervisors and senior management of the Company held any shares of the Company during the Reporting Period. |
| 2. | According to the “Procedural Rules for the Board Meetings of China Life Insurance Company Limited”, Directors of the Company serve for a term of three years and may be re-elected. However, Independent Directors may not serve for more than six years. According to the Articles of Association, Supervisors of the Company serve for a term of three years and may be re-elected. |
| 3. | The positions of the Directors, Supervisors and senior management in this report reflect their positions as at the date of this report. The emoluments are calculated based on their terms of office during the Reporting Period. |
| 4. | According to the requirements of the relevant remuneration policies of the Company, the final amount of emoluments of the current Directors, Supervisors and senior management of the Company are subject to review and approval. The result of the review will be disclosed when the final amount is confirmed. |
| 5. | On 30 June 2021, the 2020 Annual General Meeting was convened by the Company for the election of the seventh session of the Board. Given that Mr. Wang Bin, a former Executive Director of the Company, was unable to perform his role and duties as a Director, Mr. Yuan Changqing, a Non-executive Director of the Company, was elected at the sixth meeting of the seventh session of the Board of Directors of the Company on 13 January 2022 to assume the role and duties of the Chairman of the Board. |
On 30 June 2021, the 2020 Annual General Meeting was convened by the Company for the election of the seventh session of the Board of Supervisors, and the first meeting of the seventh session of the Board of Supervisors was convened on the same day for the election of Mr. Jia Yuzeng as the Chairman of the seventh session of the Board of Supervisors of the Company. |
| 6. | Ms. Huang Xiumei was elected as an Executive Director of the seventh session of the Board of the Company at the 2020 Annual General Meeting of the Company. Pursuant to the “Provisions on the Administration of the Qualifications for the Directors, Supervisors and Senior Managers of Insurance Companies”, the appointment of Ms. Huang Xiumei as an Executive Director of the seventh session of the Board of the Company became effective on 1 July 2021. |
As elected by the 2019 Annual General Meeting of the Company and upon approval by the CBIRC, Mr. Lam ChiKuen served as an Independent Director of the Company from 29 June 2021. |
As elected by the 2020 Annual General Meeting of the Company and upon approval by the CBIRC, Mr. Zhai Haitao served as an Independent Director of the Company from 14 October 2021. |
The Board of the Company received a resignation letter from Mr. Tang Xin, an Independent Director of the Company, on 6 March 2022. As Mr. Tang Xin had consecutively served as an Independent Director for six years, he tendered his resignation for such position to the Board of the Company pursuant to the relevant regulatory requirements. Since the resignation of Mr. Tang Xin will result in the number of Independent Directors of the Company falling below the minimum number required by the relevant regulations and the Articles of Association, Mr. Tang Xin will continue to perform his duties as an Independent Director until the qualification of a new Independent Director is approved by the CBIRC. |
| 7. | As elected by the 2020 Annual General Meeting of the Company and upon approval by the CBIRC, Mr. Niu Kailong served as a Non-employee Representative Supervisor of the Company from 14 October 2021. |
As elected by the sixth extraordinary meeting of the third session of the employee representative meeting of the Company and upon approval by the CBIRC, Mr. Lai Jun served as an Employee Representative Supervisor of the Company from 14 October 2021. |
| 8. | As considered by the thirty-fifth meeting of the sixth session of the Board of the Company and upon approval by the CBIRC, Mr. Liu Yuejin served as an Assistant to the President of the Company from June 2021. |
As considered and approved by the thirty-fifth meeting of the sixth session of the Board and the fourth meeting of the seventh session of the Board of the Company and upon approval by the CBIRC, Ms. Zhang Di served as an Assistant to the President of the Company from December 2021 and the Chief Investment Officer from January 2022. |
As considered and approved by the fourth meeting of the seventh session of the Board of the Company, Mr. Liu Fengji served as a temporary Person in Charge of Audit of the Company from October 2021. Upon approval by the CBIRC, he became the Person in Charge of Audit of the Company from December 2021. |
69
RESIGNATION AND RETIREMENT OF DIRECTORS, SUPERVISORS AND SENIOR MANAGEMENT
Name | Previous Position | Gender | Date of Birth | Term | Salary/ Remuneration paid in RMB ten thousands | Other benefits, social insurance, housing provident fund and enterprise annuity fund paid by the Company in RMB ten thousands | Total emolument received from the Company during the Reporting Period in RMB ten thousands (before tax) | Whether received emolument from connected parties of the Company | Reason for changes | |||||||||||||||||||
Wang Bin | Chairman of the Board Executive Director | Male | November 1958 | 3 December 2018 –23 February 2022 | — | — | — | Yes | Resigned due to the failure to perform his role and duties as a Director | |||||||||||||||||||
Liu Huimin | Non-executive Director | Male | June 1965 | 31 July 2017 – 7 February 2021 | — | — | — | Yes | Resigned due to the adjustment of work arrangements | |||||||||||||||||||
Yin Zhaojun | Non-executive Director | Male | July 1965 | 31 July 2017 – 15 January 2021 | — | — | — | Yes | Resigned due to the adjustment of work arrangements | |||||||||||||||||||
Chang Tso Tung Stephen | Independent Director | Male | November 1948 | 20 October 2014 – 28 June 2021 | 16.00 | 0 | 16.00 | No | Retired due to the expiration of term of office | |||||||||||||||||||
Robinson Drake Pike | Independent Director | Male | October 1951 | 11 July 2015 – 13 October 2021 | 30.00 | 0 | 30.00 | No | Retired due to the expiration of term of office | |||||||||||||||||||
Han Bing | Non-employee Representative Supervisor | Male | November 1971 | 12 July 2019 – 18 October 2021 | 25.06 | 10.75 | 35.81 | No | Resigned due to the adjustment of work arrangements | |||||||||||||||||||
Yang Chuanyong | Person in Charge of Audit | Male | March 1963 | December 2020 – October 2021 | 14.43 | 6.07 | 20.50 | No | Resigned due to the adjustment of work arrangements | |||||||||||||||||||
|
|
|
|
|
|
|
|
|
|
|
|
|
| |||||||||||||||
Total | / | / | / | / | 85.49 | 16.82 | 102.31 | / | / | |||||||||||||||||||
|
|
|
|
|
|
|
|
|
|
|
|
|
| |||||||||||||||
Notes:
| 1. | None of the resigned or retired Directors, Supervisors and senior management of the Company held any shares of the Company during the Reporting Period. |
| 2. | This table sets out the information of Directors, Supervisors and senior management who resigned or retired during the period from the beginning of the Reporting Period to the date of this report. |
| 3. | The emoluments are calculated based on the terms of office of the resigned and retired Directors, Supervisors and senior management during the Reporting Period. |
| 4. | According to the requirements of the relevant remuneration policies of the Company, the final amount of emoluments of the resigned and retired Directors, Supervisors and senior management is currently subject to review and approval. The result of the review will be disclosed when the final amount is confirmed. |
70
PERSONAL PROFILE OF CURRENT DIRECTORS, SUPERVISORS, SENIOR MANAGEMENT AND COMPANY SECRETARY
| DIRECTORS | ||
 | Mr. Yuan Changqing, born in 1961, Chinese
Mr. Yuan became a Non-executive Director of the Company in February 2018. He has been performing duties as the acting Chairman of the Board of Directors of the Company since January 2022, and is the Deputy Secretary to the Party Committee, Vice Chairman and President of China Life Insurance (Group) Company (the controlling shareholder of the Company). Mr. Yuan served as the Deputy Secretary to the Party Committee and the Chairman of the Supervisory Committee of Agricultural Bank of China Limited from April 2015 to May 2017. He served as the Deputy General Manager and the Secretary to the Discipline Inspection Committee of China Everbright Group Corporation Limited from November 2014 to April 2015, the Secretary to the Discipline Inspection Committee of China Everbright Group Limited from December 2008 to August 2012, and an Executive Director, the Deputy General Manager and the Secretary to the Discipline Inspection Committee of China Everbright Group Limited from August 2012 to November 2014, during which he concurrently served as the Chairman of Everbright Securities Company Limited. During the period from 1995 to 2008, he successively served as the Vice President, President and Secretary to the Party Committee of Xinjiang Branch, the President and Secretary to the Party Committee of Henan Branch, and the Director of the Organization Department of the Party Committee and the General Manager of the Human Resources Department of the head office of Industrial and Commercial Bank of China Limited. During the period from 1981 to 1995, he held various professional and management positions in branch offices of the People’s Bank of China and Industrial and Commercial Bank of China. Mr. Yuan, a senior economist, graduated from the University of Hong Kong, majoring in international business administration with a master’s degree in business administration. | |
 | Mr. Su Hengxuan, born in 1963, Chinese
Mr. Su became an Executive Director of the Company in December 2018. He has been the President of the Company since April 2019, the Vice President of China Life Insurance (Group) Company since December 2017 and a Director of China Guangfa Bank Co., Ltd. since September 2020. He was the President of China Life Pension Company Limited from March 2015 to February 2018. Mr. Su successively served various positions in the Company from 2000 to 2015, including the Deputy General Manager of Henan Branch, the General Manager of the Individual Insurance Department of the Company, the General Manager of the Individual Insurance Sales Department of the Company, an Assistant to the President and the Vice President of the Company. Mr. Su graduated from Wuhan University and the University of Science and Technology of China and obtained a doctoral degree in management science and engineering from the University of Science and Technology of China in 2011. Mr. Su, a senior economist, has over 35 years of experience in the operation and management of life insurance business. | |
71
 | Mr. Li Mingguang, born in 1969, Chinese
Mr. Li became an Executive Director of the Company in August 2019. He has been the Vice President of the Company since November 2014, the Chief Actuary of the Company since March 2012, the Chief Actuary of China Life Pension Company Limited since May 2012 and the Board Secretary of the Company since June 2017. Mr. Li joined the Company in 1996 and subsequently served as the Deputy Division Chief, the Division Chief, an Assistant to the General Manager of the Product Development Department, the Responsible Actuary of the Company and the General Manager of the Actuarial Department. He graduated from Shanghai Jiaotong University with a bachelor’s degree in computer science in 1991, Central University of Finance and Economics majoring in monetary banking (actuarial science) with a master’s degree in 1996 and Tsinghua University with an EMBA in 2010, and also studied in University of Pennsylvania in the United States in 2011. Mr. Li is a Fellow of the China Association of Actuaries (FCAA) and a Fellow of the Institute and Faculty of Actuaries (FIA). He was the Chairman of the first session of the China Actuarial Working Committee and the Secretary-general of both the first and the second sessions of the China Association of Actuaries. He is currently the Vice Chairman of the China Association of Actuaries. Mr. Li receives a special government allowance from the State Council. | |
 | Ms. Huang Xiumei, born in 1967, Chinese
Ms. Huang became an Executive Director of the Company in July 2021. She has been the Vice President and the Person in Charge of Finance of the Company since May 2020. Ms. Huang has been a Director of China Life Asset Management Company Limited since June 2021, a Director of Sino-Ocean Group Holding Limited since March 2021, and a Director of China Life Franklin Asset Management Company Limited since February 2021. From 2018 to 2021, she served as a Director of China Life Pension Company Limited. From 2016 to 2020, she served as the Vice President, the Board Secretary and the Person in Charge of Finance of China Life Pension Company Limited. From 2014 to 2016, she served as the Financial Controller and the General Manager of the Financial Management Department of the Company. From 2005 to 2014, Ms. Huang held various positions at the Company’s Fujian Branch, including an Assistant to the General Manager, the Deputy General Manager, the Branch Head, the Deputy General Manager (responsible for daily operations) and the General Manager. From 1999 to 2005, she served as the Deputy Division Chief of the Planning and Finance Division, the Manager of the Planning and Finance Department and the Manager of the Finance Department of the Company’s Fujian Branch, and during the period from 2004 to 2005, she concurrently served as the Deputy General Manager of the Company’s Fuzhou Branch. Ms. Huang graduated from Fuzhou University, majoring in accounting with a bachelor’s degree. She is a senior accountant. | |
72
 | Mr. Wang Junhui, born in 1971, Chinese
Mr. Wang became a Non-executive Director of the Company in August 2019. He has been the Chief Investment Officer of China Life Insurance (Group) Company and the President of China Life Asset Management Company Limited since August 2016. He has been the Chairman of China Life AMP Asset Management Company Limited since December 2016 and a Director of China United Network Communications Group Co., Ltd. since March 2021. From 2004 to 2016, he successively served as an Assistant to the President and the Vice President of China Life Asset Management Company Limited, and the President of China Life Investment Holding Company Limited. From 2002 to 2004, he successively served as the Director of the Investment Department and an Assistant to the General Manager of Harvest Fund Management Co., Ltd. Mr. Wang graduated from the School of Computer Science of Beijing University of Technology with a bachelor’s degree in software in 1995 and from Chinese Academy of Fiscal Sciences of the Ministry of Finance of the PRC with a doctoral degree in finance in 2008. He is a senior economist. | |
 | Mr. Tang Xin, born in 1971, Chinese
Mr. Tang became an Independent Director of the Company in March 2016. He is a professor of the School of Law of Tsinghua University, the Head of the Commercial Law Research Center of Tsinghua University, an associate editor of “Tsinghua Law Review”, a member of the Listing Committee of the Shanghai Stock Exchange, a member of the Legal Professional Advisory Committee of the Shenzhen Stock Exchange, the Chairman of the Independent Director Committee of the China Association for Public Companies, a member of the Legislative Affair Committee of the Asset Management Association of China and an Independent Director of each of Harvest Fund Management Co., Ltd. and Bank of Guizhou Co., Ltd. Mr. Tang was elected as a member of the first and second sessions of the Merger, Acquisition and Reorganization Review Committee of the China Securities Regulatory Commission from 2008 to 2010. He served as an Independent Director of China Spacesat Co., Ltd. from 2008 to 2014, an Independent Director of each of SDIC Power Holdings Co., Ltd. and Changjiang Securities Company Limited from 2009 to 2013, and an Independent Director of Beijing Rural Commercial Bank Co., Ltd. from 2009 to 2015. Mr. Tang graduated from Renmin University of China with bachelor’s, master’s and doctoral degrees in law. | |
73
 | Ms. Leung Oi-Sie Elsie, born in 1939, Chinese
Ms. Leung became an Independent Director of the Company in July 2016. She was the first Secretary for Justice of Hong Kong, a member of the Executive Council of Hong Kong, the Deputy Director of the Hong Kong Basic Law Committee of the Standing Committee of the 2nd, 3rd and 4th National People’s Congress and a consultant of Iu, Lai & Li Solicitors & Notaries. Ms. Leung served as a member of the Social Welfare Advisory Committee and the Equal Opportunities Commission, an executive committee member and a council member of the Hong Kong Federation of Women, the Chairperson and President of the International Federation of Women Lawyers, and the Honorary President of the Nanhai Worldwide Friendship Federation. She is a Justice of the Peace, a Notary Public and a China-Appointed Attesting Officer. She has been awarded the “Grand Bauhinia Medal” and admitted as a solicitor by the Law Societies of Hong Kong and England. Ms. Leung graduated from the University of Hong Kong with a master’s degree in law, and is a fellow of the International Academy of Matrimonial Lawyers. She served as an Independent Non-executive Director of United Company RUSAL Plc from December 2009 to June 2021. She has been an Independent Non- executive Director of China Resources Power Holdings Company Limited since April 2010, and an Independent Non-executive Director of PetroChina Company Limited since June 2017. | |
 | Mr. Lam Chi Kuen, born in 1953, Chinese
Mr. Lam became an Independent Director of the Company in June 2021. He is currently an Independent Non-executive Director of China Cinda Asset Management Co., Ltd. and an Independent Non-executive Director of Luks Group (Vietnam Holdings) Company Limited. He served as an Independent Non-executive Director of China Pacific Insurance (Group) Co., Ltd. from 2013 to 2019. Mr. Lam, a practicing certified public accountant in Hong Kong for approximately 35 years, was a partner and senior consultant of Ernst & Young from 1992 to 2013 and has extensive experience in accounting, auditing and financial management. Mr. Lam received a Higher Diploma in Accounting from the Hong Kong Polytechnic College (the current Hong Kong Polytechnic University). He is a member of the Hong Kong Institute of Certified Public Accountants and a senior member of the Association of Chartered Certified Accountants. | |
 | Mr. Zhai Haitao, born in 1969, Chinese
Mr. Zhai became an Independent Director of the Company in October 2021. He is the President and Founding Partner of Primavera Capital Group, and an Independent Non-executive Director of each of China Everbright Environment Group Limited and China Everbright Water Limited. From 2000 to 2009, Mr. Zhai worked at and held various positions in Goldman Sachs Group, including the Managing Director, the Chief Representative of its Beijing Office, the Director of the Strategic Cooperation Office between Goldman Sachs Group and Industrial and Commercial Bank of China, and the Credit Rating Consultant of the Ministry of Finance of the PRC and China Development Bank. From 1995 to 1998, he was the Deputy Representative of the People’s Bank of China Representative Office for the Americas based in New York. From 1990 to 1995, Mr. Zhai worked at the International Department of the People’s Bank of China. Mr. Zhai holds a master’s degree in international affairs from Columbia University, a master’s degree in business administration from New York University and a bachelor’s degree in economics from Peking University. | |
74
SUPERVISORS
| ||
 | Mr. Jia Yuzeng, born in 1962, Chinese
Mr. Jia became the Chairman of the Board of Supervisors of the Company in July 2018. He has been an Executive Director of the Insurance Society of China since July 2020 and a Director of China Insurance Security Fund Co., Ltd. since December 2020. During the period from 2006 to March 2018, he successively served as a Supervisor, the General Manager of the Human Resources Department, an Assistant to the President, the Vice President, the Board Secretary, an Executive Director and the Compliance Officer of China Life Pension Company Limited. During the period from 2004 to 2006, he served as the General Manager of the Work Department of the Trade Union, the Executive Deputy Director of the Trade Union and a Supervisor of the Company. During the period from 1988 to 2004, he successively served as the Division Head of the General Office and a secretary (at the deputy division level) of the PRC Ministry of Supervision, the Deputy Director (responsible for daily operations) of the Minister Office of the General Supervision Office under the Supervision Department of the Central Commission for Discipline Inspection, and an inspector (at the division level), supervisor, inspector (at the deputy bureau level) and special supervisor of the General Office of the Central Commission for Discipline Inspection. Mr. Jia graduated from the Open University of Hong Kong in 2003, majoring in business administration with a master’s degree in business administration. | |
 | Mr. Niu Kailong, born in 1974, Chinese
Mr. Niu became a Supervisor of the Company in October 2021. He is the General Manager of the Strategic Planning Department/Office of the Board of Directors (in preparation) of China Life Insurance (Group) Company and the President of China Life Institute of Finance. Mr. Niu successively worked at PICC Property and Casualty Company Limited, the People’s Insurance Company (Group) of China Limited and PICC Reinsurance Company Limited. He served as the Deputy General Manager of the Strategic Planning Department of the People’s Insurance Company (Group) of China Limited from April 2017, a Supervisor, the Deputy General Manager (responsible for daily operations) of the Strategic Planning Department and the Deputy General Manager (responsible for daily operations) of the Strategic Planning Department/Office of the Board of Directors of PICC Reinsurance Company Limited from October 2017, the person in charge of the Strategy and Investment Management Department of China Life Healthcare Investment Company Limited from July 2020, and the Deputy General Manager (responsible for daily operations) of the Strategic Planning Department of China Life Insurance (Group) Company from August 2020. Mr. Niu graduated from Nankai University with a doctoral degree in finance. He is an associate researcher (social science) and senior economist. | |
75
| Mr. Cao Qingyang, born in 1963, Chinese
Mr. Cao became a Supervisor of the Company in July 2019. He has been the General Manager of the Product Development Department of the Company since February 2011. From 2008 to 2011, he successively served as the Deputy General Manager of Tianjin Branch and the Group Leader of the Statistics Working Group of the Company. From 2004 to 2008, he successively served as the General Manager of the Investor Relations Department, the Deputy Secretary-General of the Board Secretariat and concurrently the General Manager of the Investor Relations Department, and the Deputy Secretary-General of the Board Secretariat of the Company. Mr. Cao graduated from Nankai University in 2004, majoring in finance with a doctoral degree in economics. | |
 | Ms. Wang Xiaoqing, born in 1965, Chinese
Ms. Wang became a Supervisor of the Company in December 2019. She has successively been the Deputy General Manager and the General Manager of the Risk Management Department of the Company since April 2018. From May 2016 to April 2018, she served as the Secretary to the Discipline Inspection Committee of Tibet Autonomous Region Branch of the Company. From 2010 to 2016, she successively served as an Assistant to the General Manager and the Deputy General Manager of the County Insurance Management Department, and the Deputy General Manager of the Audit Department of the Company. From 2003 to 2010, she successively served as the Deputy Division Chief of the Training Division, the Deputy Division Chief of the Business Inspection Division, the Division Chief of the Agent Management Division, the Senior Manager of the Integrated Development Division of the Individual Insurance Sales Department of the Company, and the Deputy General Manager of No. 5 Sales Office in Beijing Branch of the Company. Ms. Wang graduated from Nanjing Communication Engineering College in 1988, majoring in radio communication engineering with a bachelor’s degree in engineering. | |
 | Mr. Lai Jun, born in 1964, Chinese
Mr. Lai became a Supervisor of the Company in October 2021. He is the General Manager of the Human Resources Department of the Company. Mr. Lai joined the Company in 1984, and successively served as the Deputy General Manager and the Secretary to the Discipline Inspection Committee of Xinjiang Branch of the Company, the Person in Charge, the Deputy General Manager (responsible for daily operations) and the General Manager of Hainan Branch, as well as the General Manager of Xinjiang Branch of the Company from 2002 to 2021. Mr. Lai graduated from the Central Party School of the Chinese Communist Party, majoring in economics and management. He is a senior economist. | |

76
SENIOR MANAGEMENT
Mr. Su Hengxuan, please see the section “Directors” for his personal profile.
Mr. Li Mingguang, please see the section “Directors” for his personal profile.
Ms. Huang Xiumei, please see the section “Directors” for her personal profile. | ||
 | Mr. Ruan Qi, born in 1966, Chinese
Mr. Ruan became the Vice President of the Company in April 2018. He successively served as the General Manager (at the general manager level of the provincial branches) of the Information Technology Department and the Chief Information Technology Officer of the Company from 2016 to 2018. Mr. Ruan served as the General Manager of China Life Data Center and the General Manager (at the general manager level of the provincial branches) of the Information Technology Department of the Company from 2014 to 2016, and the Deputy General Manager and the General Manager of the Information Technology Department of the Company from 2004 to 2014. He successively served as the Deputy Division Chief of the Computer Division of Fujian Branch, and the Deputy Manager (responsible for daily operations) and the Manager of the Information Technology Department of the Company from 2000 to 2004. Mr. Ruan, a senior engineer, graduated from Beijing Institute of Posts and Telecommunications in August 1987, majoring in computer science and communications with a bachelor’s degree in engineering, and from Xiamen University with a master’s degree in business administration for senior management (EMBA) in December 2007. | |
 | Mr. Zhan Zhong, born in 1968, Chinese
Mr. Zhan became the Vice President of the Company in July 2019. He was an Employee Representative Supervisor of the Company from July 2015 to August 2017. Mr. Zhan successively served as the General Manager (at the general manager level of the provisional branches) of the Individual Insurance Sales Department and the Marketing Director of the Company from 2014 to 2019. He served as the Deputy General Manager (responsible for daily operations) and the General Manager of the Company’s Qinghai Branch from 2013 to 2014. From 2009 to 2013, Mr. Zhan successively served as the Deputy General Manager (responsible for daily operations) and the General Manager of the Individual Insurance Sales Department of the Company. From 2005 to 2009, he successively served as the General Manager of the Individual Insurance Sales Department of the Company’s Guangdong Branch and an Assistant to the General Manager of the Company’s Guangdong Branch. From 1996 to 2005, he successively served as the Director of the Marketing Department of Chengdu High-tech Sub-branch of Zhongbao Life Insurance Company, an Assistant to the Manager and the Manager of the Marketing Department of Chengdu Branch, and the Deputy General Manager of Chengdu Branch of Taikang Life Insurance Company. Mr. Zhan graduated from Kunming Institute of Technology in July 1989, majoring in industrial electric automation with a bachelor’s degree in engineering. | |
77
 | Ms. Yang Hong, born in 1967, Chinese
Ms. Yang became the Vice President of the Company in July 2019. She successively served as the General Manager of the Operation Service Center and the Operation Director of the Company from 2018 to 2019. Ms. Yang successively served as the Deputy General Manager (responsible for daily operations) and the General Manager of the Research and Development Center, the General Manager (at the general manager level of the provincial branches) of the Business Management Department and the General Manager (at the general manager level of the provincial branches) of the Process and Operation Department of the Company from 2011 to 2018. From 2002 to 2011, she successively served as an Assistant to the General Manager and the Deputy General Manager of the Business Management Department, and the General Manager of the Customer Service Department of the Company. Ms. Yang graduated from the Computer Science Department of Jilin University in 1989, majoring in system structure with a bachelor’s degree of science, and from the School of Economics and Management of Tsinghua University in 2013 with a master’s degree in business administration for senior management. | |
 | Mr. Zhao Guodong, born in 1967, Chinese
Mr. Zhao became an Assistant to the President of the Company in October 2019. He has been the General Manager of the Company’s Jiangsu Branch since July 2018. He successively served as the Deputy General Manager (responsible for daily operations) and the General Manager of Chongqing Branch, the General Manager of Hunan Branch of the Company from 2016 to 2018, the Deputy General Manager of each of Fujian Branch and Hunan Branch of the Company from 2007 to 2016, and the Deputy General Manager of Changde Branch and the General Manager of Yiyang Branch in Hunan province of the Company from 2001 to 2007. Mr. Zhao graduated from Hunan Computer School in 1988, majoring in computer software, and from China Central Radio and TV University in 2006, majoring in business administration. | |
 | Mr. Liu Yuejin, born in 1967, Chinese
Mr. Liu became an Assistant to the President of the Company in June 2021. He is the General Manager of Guangdong Branch of the Company. Mr. Liu joined the Company in 1996, and successively served as an Assistant to the General Manager and the Deputy General Manager of the Company’s Guizhou Branch and the Deputy General Manager of Shanxi Branch, the Person in Charge, the Deputy General Manager (responsible for daily operations) and the General Manager of Guizhou Branch, and the General Manager of Chongqing Branch from 2010 to 2020. Prior to joining the Company, he worked at the Department of Finance of Shanxi Province. Mr. Liu graduated from Shanxi Institute of Finance and Economics, majoring in planning and statistics with a bachelor’s degree in economics. | |
78
 | Ms. Zhang Di, born in 1968, Chinese
Ms. Zhang became an Assistant to the President of the Company in December 2021. She has been the Chief Investment Officer of the Company since January 2022. Ms. Zhang joined the Company in 2001, and successively served as an Assistant to the General Manager, the Deputy General Manager, the Deputy General Manager (responsible for daily operations), and the General Manager of the Investment Management Department and the General Manager of the Investment Management Center of the Company from 2010. Prior to joining the Company, she worked at companies including Beijing Zhongbaoxin Real Estate Development Company Limited and PICC Trust and Investment Company, etc. Ms. Zhang graduated from Northern Jiaotong University, majoring in transportation management and engineering with a bachelor’s degree in engineering. | |
| Mr. Xu Chongmiao, born in 1969, Chinese
Mr. Xu became the Compliance Officer of the Company in July 2018. He has been the General Manager of the Legal and Compliance Department and the Legal Officer of the Company since September 2014. From 2006 to 2014, he successively served as the Deputy General Manager of the Legal Affairs Department, the Deputy General Manager of the Legal and Compliance Department and the Legal Officer at the general manager level of the Company. From 2000 to 2006, he successively served as the Deputy Division Chief of the Regulations Division of the Development and Research Department and a senior regulations researcher of the Legal Affairs Department of the Company. Mr. Xu graduated from Fudan University in August 1991, majoring in economic law with a bachelor’s degree in law, and from Renmin University of China in July 1996 and July 2005, respectively, majoring in economic law with master’s and doctoral degrees in law. Mr. Xu is admitted as a lawyer and certified public accountant in the PRC. | |
| Mr. Liu Fengji, born in 1969, Chinese
Mr. Liu became the Person in Charge of Audit of the Company in December 2021. He served as a temporary Person in Charge of Audit of the Company from October to December 2021, and is the General Manager of the Audit Department of the Company. Mr. Liu joined the Company in 1992, and successively served as an Assistant to the General Manager of the Company’s Tianjin Branch, the Deputy General Manager of Ningxia Hui Autonomous Region Branch, the Person in Charge, the Deputy General Manager (responsible for daily operations) and the General Manager of Qinghai Branch, and the General Manager of Tianjin Branch from 2011 to 2021. Mr. Liu graduated from Tianjin Institute of Finance and Economics in 1992, majoring in finance (insurance direction) with a bachelor’s degree in economics, and from Nankai University in 2013, majoring in business administration for senior management with a master’s degree in business administration. | |


79
| COMPANY SECRETARY | ||
 | Mr. Heng Victor Ja Wei, born in 1977, British
Mr. Heng is the managing partner of Morison Heng, Certified Public Accountants. Mr. Heng holds a Master of Science degree of the Imperial College of Science, Technology and Medicine, the University of London. Mr. Heng is a member of The Hong Kong Institute of Certified Public Accountants and a fellow of The Association of Chartered Certified Accountants. Mr. Heng has over 15 years of experience in accounting and auditing for private and public companies and financial consultancy. Mr. Heng serves as an Independent Non-executive Director of Lee & Man Chemical Company Limited, Matrix Holdings Limited, Best Food Holding Company Limited and Veson Holdings Limited, all of which are listed on the main board of the HKSE. | |
POSITIONS HELD BY CURRENT DIRECTORS, SUPERVISORS AND SENIOR MANAGEMENT IN SHAREHOLDERS OF THE COMPANY
Name | Name of shareholders | Position | Term | |||
| Yuan Changqing | China Life Insurance (Group) Company | Vice Chairman, President | Since May 2017 | |||
| Su Hengxuan | China Life Insurance (Group) Company | Vice President | Since December 2017 | |||
| Wang Junhui | China Life Insurance (Group) Company | Chief Investment Officer | Since August 2016 | |||
| Niu Kailong | China Life Insurance (Group) Company | General Manager of the Strategic Planning Department/Office of the Board of Directors (in preparation) and President of China Life Institute of Finance | Since March 2021 |
80
REMUNERATION OF DIRECTORS, SUPERVISORS AND SENIOR MANAGEMENT
Decision-making procedures for the remuneration of Directors, Supervisors and senior management: the remuneration of Directors and Supervisors are approved by shareholders at general meetings, whereas the remuneration of senior management is approved by the Board of Directors.
Basis for determination of the remuneration of Directors, Supervisors and senior management: the remuneration of Directors, Supervisors and senior management are determined based on the operating results of the Company and the performance appraisal conducted by the Board of Directors, and in accordance with the measures for the administration of remunerations of the Company.
Actual payment of remuneration to Directors, Supervisors and senior management: during the Reporting Period, the remuneration actually received by all Directors, Supervisors and senior management (including the resigned Directors, Supervisors and senior management) from the Company totaled RMB15.1979 million. In accordance with the relevant requirements of the measures for the administration of remuneration of the Company, the standard for performance-based bonus (as part of the compensation) payable to Directors, Supervisors and senior management of the Company in 2021 has not yet been determined.
EMPLOYEES AND BRANCHES
Employees
| Unit: Persons | ||||
Number of employees of the Company | 101,459 | |||
Number of employees of the Company’s major subsidiaries | 1,803 | |||
Employees in total | 103,262 | |||
Resigned and retired employees of the Company and its major subsidiaries for which extra costs have to be incurred | 25 | |||
As at the end of the Reporting Period, the composition of the employees of the Company and its major subsidiaries is as follows:
Structure of Expertise
| Unit: Persons | ||||
Class of Expertise | Number of Employees | |||
Management and administration | 19,275 | |||
Sales and sales management | 46,555 | |||
Finance and auditing | 4,696 | |||
Insurance verification, claim processing and customer services | 23,829 | |||
Other expertise and technicians | 5,134 | |||
Others | 3,773 | |||
|
| |||
Total | 103,262 | |||
|
| |||
Education Level
| Unit: Persons | ||||
Education Level | Number of Employees | |||
Master and above | 5,889 | |||
Bachelor | 68,671 | |||
College Diploma | 24,715 | |||
Secondary School | 1,455 | |||
Others | 2,532 | |||
|
| |||
Total | 103,262 | |||
|
| |||
81
Remuneration Policy for Employees
The Company has established a remuneration and incentive system with reference to employee’s positions, the Company’s performance and market conditions.
Training Plans
In 2021, the Company prioritized morals and also emphasized on capabilities, pursued the problem-based approach for offering targeted training courses for employees, adopted a classified and hierarchical management system to cover all employees, and focused on reforms and innovation for joint development and sharing. The Company integrated real situations into its education and training and put stringent management into practice, concentrated on the development of a quality system that covers source cultivation, follow-up cultivation and whole-process cultivation, continued to further develop the systems for training courses and training management, stepped up its efforts to build a team of part-time lecturers, pushed forward the integration of talents selection, cultivation, utilization and retention, and consistently enhanced the suitability and effectiveness of education and training plans for employees, with a view to facilitating the business development of the Company and the healthy team development of cadre employees.
Branches
As at 31 December 2021, the Company had approximately 19,000 branches7.
REPORT OF CORPORATE GOVERNANCE
OVERVIEW OF CORPORATE GOVERNANCE
The Company implements good corporate governance policies and firmly believes that through fostering sound corporate governance, further enhancing its transparency the Company can operate in a more systematic manner, make decisions in a more scientific way, and boost the confidence of investors.
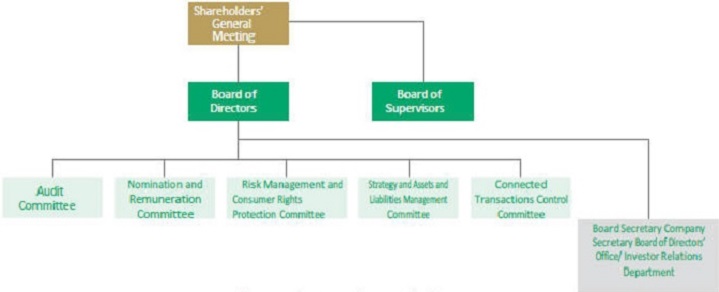
(Corporate Governance Structure Chart)
| 7 | Including branches at the provincial or prefecture level, sub-branches, sales offices and sales & services offices. |
82
With the establishment of a corporate governance system with reasonably designed structure, well-developed mechanism, strict rules and regulations, as well as high efficiency in operation as its core objectives, the Company constantly promotes the development of its corporate governance, strictly performs its obligation of information disclosure, enhances its transparency and actively serves the interest of public investors so as to enhance its image and position in the capital market.
The Company has set up a corporate governance structure with well-defined duties and responsibilities strictly in accordance with relevant laws, regulations and regulatory requirements, including the Company Law and the Securities Law. The corporate governance structure of the Company generally meets the regulatory requirements of its listed jurisdictions and the relevant provisions. The Company has carried out its corporate governance procedures strictly in accordance with relevant laws, regulations and regulatory requirements, including the Company Law and the Securities Law, as well as the requirements of its Articles of Association and procedural rules. Shareholders’ general meetings, Board meetings and Board of Supervisors meetings of the Company have been functioning independently and coordinately.
In accordance with the regulatory requirements of its listed jurisdictions and the relevant provisions of its Articles of Association, the Company has continuously improved the decision-making mechanism of the Board. The Board is accountable to shareholders of the Company with respect to the assets and resources entrusted to it by the shareholders, and performs its duties on corporate governance. All m embers of the Board have taken initiatives to look into the Company’s affairs and have had a comprehensive understanding of the Company’s businesses. They have devoted sufficient time in performing their duties as Directors with due care and in a diligent and efficient manner. By setting up mechanisms including regular reporting of business development strategies and marketing tactics, the management of the Company can periodically report the business operations, development strategies and marketing tactics to the Board, which provides a basis for the Board’s decision-making.
The Company has actively promoted the establishment of corporate governance, continuously improved its corporate governance structure and enhanced its scientific decision-making ability. In order to improve the decision-making efficiency of the specialized Board committees, the Board has established five specialized Board committees, i.e. the Audit Committee, the Nomination and Remuneration Committee, the Risk Management and Consumer Rights Protection Committee, the Strategy and Assets and Liabilities Management Committee, and the Connected Transactions Control Committee. These specialized Board committees conduct studies on specific matters, hold meetings both on a regular and an ad-hoc basis, communicate with the senior management, provide advice and recommendations for the Board’s consideration, and deal with matters entrusted or authorized by the Board, for the purposes of improving the Board’s efficiency and intensifying the Board’s functions.
The Board of Supervisors of the Company has carried out its work and performed its duties in accordance with the Articles of Association and the “Procedural Rules for the Board of Supervisors Meetings”. Members of the Board of Supervisors attended the shareholders’ general meetings and the Board of Supervisors meetings, participated in the Board meetings and the meetings of the specialized Board committees based on their work allocation, and conducted investigations on local branches to have an in-depth understanding of the implementation of the decisions made by the Board, so as to diligently perform their role of supervision.
The Company has consistently made improvements to its systems relating to corporate governance. Pursuant to the relevant regulatory requirements and after taking into account its actual operation, the Company has formulated the “Measures for the Evaluation of the Performance of Duties by Directors and Supervisors” and the “Provisional Measures for the Administration of Undertakings of Substantial Shareholders” to further strengthen the evaluation and management of the performance of duties by Directors and Supervisors and the administration of undertakings of substantial shareholders.
The Company has made information disclosure in a timely, open and transparent manner pursuant to the requirements of the listing rules of its listed jurisdictions. The Company has continuously improved its management of investor relations and enriched its communication with investors in both form and substance, thus ensuring that all shareholders enjoy equal rights and have access to information about the Company in an open, fair, true and accurate manner.
The Company has intensified its management of subsidiaries on an ongoing basis. The Board considered and approved the “Proposal in relation to the Nomination of the Candidates for Directors of the Fifth Session of the Board of Directors of China Life Asset Management Company Limited”, the “Proposal in relation to the Nominiation of the Candidates for Directors of China Life Pension Company Limited” and the “Proposal in relation to the Provision of Shareholders’ Letters of Undertaking to Banking and Insurance Institutions”.
83
During the Reporting Period, the Company won the Tianma Award – “Best Board of Directors” for the first time in the 12th China Listed Company Investor Relations assessment and selection hosted by Securities Times. It was also awarded Grade A in the assessment by the SSE of information disclosure of listed companies for the year 2020-2021, the “Most Respected Enterprise in Asia (Insurance Industry)” by Institutional Investor, the “Best Listed Company” by New Fortune Magazine, the “Best Investor Activity” by Investor Relations Magazine, the “Best Listed Company” and the “Listed Company with the Best Investment Value for the 14th Five-Year Plan Period” in the 11th China Securities 2021 Golden Bauhinia Awards, as well as the “Most Progress in Investor Relations Award” by Hong Kong Investor Relations Association.
Shareholders’ General Meeting
The shareholders’ general meeting, as an organ of the highest authority of the Company, exercises its duties and functions in accordance with relevant laws. Its duties and powers include the election, appointment and removal of Directors and Non-employee Representative Supervisors, review and approval of the reports of the Board of Directors and the Board of Supervisors, review and approval of the annual budget and final accounts of the Company, and any other matters required by the Articles of Association to be approved by way of resolution of the shareholders’ general meeting. The Company ensures that all shareholders are equally treated so as to ensure that the rights of all shareholders are protected, including the right of access to information in relation to, and the right to vote in respect of, major matters of the Company. The Company has the ability to operate and manage its business autonomously, and is separate and independent from its controlling shareholder in its business operations, personnel, assets and financial matters.
Shareholders’ general meetings convened during the Reporting Period are as follows:
Session of the meeting | Date of the meeting | Index for websites on which resolutions were published | Date of publication of resolutions | |||
| 2020 Annual General Meeting | 30 June 2021 | www.sse.com.cn www.hkexnews.hk www.e-chinalife.com | 30 June 2021 | |||
| First Extraordinary General Meeting 2021 | 16 December 2021 | www.sse.com.cn www.hkexnews.hk www.e-chinalife.com | 16 December 2021 | |||
Twenty-four proposals, including the “Proposal in relation to the Report of the Board of Directors of the Company for the Year 2020”, the “Proposal in relation to the Report of the Board of Supervisors of the Company for the Year 2020”, the “Proposal in relation to the Financial Report of the Company for the Year 2020”, the “Proposal in relation to the Profit Distribution Plan of the Company for the Year 2020”, the “Proposal in relation to the Remuneration of Directors and Supervisors of the Company”, the proposal in relation to the election of Executive Directors, Non-executive Directors and Independent Directors of the seventh session of the Board of the Company and the proposal in relation to the election of Non-employee Representative Supervisors of the seventh session of the Board of Supervisors of the Company, were considered and approved by a combination of on-site and online voting, and the “Duty Report of the Independent Directors of the Board of Directors of the Company for the Year 2020” and the “Report on the Overall Status of Connected Transactions of the Company for the Year 2020” were debriefed and reviewed at the 2020 Annual General Meeting held in Beijing on 30 June 2021.
Four proposals, including the amendments to the Articles of Association, amendments to the “Procedural Rules for the Shareholders’ General Meetings” and the execution of an agreement for connected transactions with CLI, were considered and approved by a combination of on-site and online voting at the First Extraordinary General Meeting 2021 held in Beijing on 16 December 2021.
84
Attendance records of the current Directors at the shareholders’ general meetings convened during the Reporting Period:
Name of Director | Type of Director | Number of shareholders’ general meetings required to attend for the year | Number of meetings attended in person | |||||||
| Yuan Changqing | Non-executive Director | 2 | 0 | |||||||
| Su Hengxuan | Executive Director | 2 | 2 | |||||||
| Li Mingguang | Executive Director | 2 | 2 | |||||||
| Huang Xiumei | Executive Director | 1 | 0 | |||||||
| Wang Junhui | Non-executive Director | 2 | 1 | |||||||
| Tang Xin | Independent Director | 2 | 2 | |||||||
| Leung Oi-Sie Elsie | Independent Director | 2 | 2 | |||||||
| Lam Chi Kuen | Independent Director | 2 | 2 | |||||||
| Zhai Haitao | Independent Director | 1 | 1 | |||||||
Attendance records of the resigned Directors at the shareholders’ general meetings convened during the Reporting Period:
|
| |||||||||
Name of Director | Type of Director | Number of shareholders’ general meetings required to attend for the year | Number of meetings attended in person | |||||||
Wang Bin | Executive Director | 2 | 1 | |||||||
Yin Zhaojun | Non-executive Director | 0 | 0 | |||||||
Liu Huimin | Non-executive Director | 0 | 0 | |||||||
Chang Tso Tung Stephen | Independent Director | 0 | 0 | |||||||
Robinson Drake Pike | Independent Director | 1 | 1 | |||||||
BOARD
The Board is the standing decision-making body of the Company and its main duties include: performing the function of corporate governance of the Company, convening shareholders’ general meetings, implementing resolutions passed at such meetings, improving the Company’s corporate governance policies, approving the Company’s development strategies and operation plans, formulating and supervising the Company’s financial policies, annual budgets and financial reports, providing an objective evaluation on the Company’s operating results in its financial reports and other disclosure documents, dealing with senior management personnel matters, arranging for Directors and senior management to attend various training courses, attaching importance to the enhancement of their professional quality, reviewing the compliance policies of the Company, assessing the internal control systems of the Company and reviewing the compliance by the Company with the Corporate Governance Code. The day-to-day management and operation of the Company are delegated to the management. The responsibilities of Non-executive Directors and Independent Directors include, without limitation, regularly attending meetings of the Board and the specialized Board committees of which they are members, providing opinions at meetings of the Board and the specialized Board committees, resolving any potential conflict of interest, serving on the Audit Committee, the Nomination and Remuneration Committee and other specialized Board committees, and inspecting, supervising and reporting on the performance of the Company. The Board is accountable to the shareholders of the Company and reports to them.
Currently, the Board of the Company comprises nine members, including three Executive Directors, two Non-executive Directors and four Independent Directors. The number of Independent Directors complies with the minimum requirement of three Independent Directors and the requirement that at least one-third of the Board be represented by Independent Directors under the regulatory rules of the industry and its listed jurisdictions. All members of the Board have devoted sufficient time in dealing with the affairs of the Board and attended the relevant training courses organized by external regulatory authorities and the Company according to regulatory requirements. They have referred to regulatory documents on a regular basis so as to keep themselves informed of the regulatory development in a timely manner. The Company has applied director’s liability insurances for its Directors, which provide protection to Directors for liabilities that might arise in the course of their performance of duties according to law and facilitate Directors to fully perform their duties. So far as the Company is aware, no financial, business, family or other material relationship exists among members of the Board of Directors, the Board of Supervisors or the senior management.
85
In 2021, Independent Directors of the Board of the Company possessed extensive experience in various fields, such as macro economy, finance and insurance, legal compliance, accounting and auditing. The Company also complies with the requirement of the Listing Rules of the HKSE that at least one of its Independent Directors has appropriate professional qualifications or accounting qualifications or related financial management expertise. As required under the Listing Rules of the SSE and the HKSE, the Company has obtained a written confirmation from each of its Independent Directors in respect of their independence, and the Company is of the opinion that all of the Independent Directors are independent of the Company and strictly perform their duties as Independent Directors. Pursuant to the Articles of Association, Directors shall be elected at the shareholders’ general meeting for a term of three years and may be re-elected on expiry of the three-year term. However, Independent Directors may not serve for more than six years.
The Company has developed a well-established procedure for nomination and election of Directors, under which the Board shall, when nominating Directors, consider their professional ability and conduct, and also take into account the requirement for diversity of the Board members. Complementarity among the Board members in aspects including but not limited to gender, age, culture, educational background, professional experience, skills and knowledge will be considered in the selection of candidates for Directors. Currently, the Board comprises nine members with extensive experience in various fields, such as finance and insurance, macro economy, financial accounting, law and management. The diversified composition of the Board is as follows:
Directors by type:
Executive Director | Non-executive Director | Independent Director | ||
3 persons | 2 persons | 4 persons |
Directors by location:
| ||
Mainland China | Hong Kong, China | |
6 persons | 3 persons | |
Directors by gender:
| ||
Male | Female | |
7 persons | 2 persons | |
Meetings of the Board are held both on a regular and an ad-hoc basis. Regular meetings are convened at least four times a year for the examination and approval of proposals, such as annual report, interim report, quarterly reports, related financial reports, and major business operations of the year. Meetings are convened by the Chairman of the Board and a notice is given to all Directors 14 days before such meetings. Agendas and related documents are sent to the Directors at least 3 days prior to such meetings. In 2021, all notices, agendas and related documents in respect of such regular Board meetings were sent in compliance with the above requirements. By fully reviewing all the relevant proposals, the Board has confirmed that the information contained in its periodic reports and financial reports is true, accurate and complete and contains no false representations, misleading statements or material omissions, and no event or situation which would have material adverse impacts on the Company’s ongoing operation has been found.
Regular Board meetings are held mainly to review the quarterly, interim and annual reports of the Company and to deal with other related matters. The practice of obtaining Board consent through the circulation of written resolutions does not constitute a regular Board meeting. An ad-hoc Board meeting may be convened in urgent situations if requisitioned by any of the following: shareholders representing over one-tenth of voting shares, Directors constituting more than one-third of the total number of Directors, the Board of Supervisors, more than two Independent Directors, the Chairman of the Board or the President of the Company. If the resolution to be considered at such ad-hoc Board meetings has been circulated to all the Directors and more than half of the Directors having voting rights approve such resolution by signing the resolution in writing, the ad-hoc Board meeting need not be physically convened and such resolution in writing shall become an effective resolution.
86
Board meetings convened during the Reporting Period are as follows:
Session of the meeting | Date of the meeting | Resolutions adopted at the meeting | ||
| 32nd meeting of the sixth session of the Board | 22 January 2021 | The “Proposal in relation to the Solvency Report of the Company for the Fourth Quarter of 2020” was considered and approved. | ||
| 33rd meeting of the sixth session of the Board | 25 February 2021 | Three proposals, including the “Proposal in relation to the ‘Product Tracing Report of the Company for 2020’”, were considered and approved. | ||
| 34th meeting of the sixth session of the Board | 25 March 2021 | 42 proposals, including the “Proposal in relation to the Financial Report of the Company for the Year 2020”, were considered and approved. | ||
| 35th meeting of the sixth session of the Board | 28 April 2021 | Ten proposals, including the “Proposal in relation to the ‘First Quarter Report of the Company for 2021’”, were considered and approved. | ||
| 36th meeting of the sixth session of the Board | 26 May 2021 | Four proposals, including the “Proposal in relation to the Participation by the Company in the Capital Increase of CGB”, were considered and approved. | ||
| First meeting of the seventh session of the Board | 30 June 2021 | Five proposals, including the “Proposal in relation to the Composition of Specialized Committees of the Seventh Session of the Board of Directors of the Company”, were considered and approved. | ||
| Second meeting of the seventh session of the Board | 22 July 2021 | The “Proposal in relation to the Solvency Report of the Company for the Second Quarter of 2021” was considered and approved. | ||
| Third meeting of the seventh session of the Board | 25 August 2021 | 12 proposals, including the “Proposal in relation to the Financial Report of the Company for the First Half of 2021”, were considered and approved. | ||
| Fourth meeting of the seventh session of the Board | 28 October 2021 | 15 proposals, including the “Proposal in relation to the Third Quarter Report of the Company for 2021”, were considered and approved. | ||
| Fifth meeting of the seventh session of the Board | 16 December 2021 | 23 proposals, including the “Proposal in relation to the Asset Strategic Allocation Plan of the Company for the Years from 2022 to 2024”, were considered and approved. | ||
| Note: | For details of the above Board resolutions, please refer to the announcements regarding the Board resolutions as published by the Company on the website of the SSE (www.sse.com.cn). |
87
If a Director is materially interested in a matter to be considered by the Board, the Director having such conflict of interest shall have no voting right on the matter to be considered and shall not be counted in the quorum for the Board meeting. All Directors shall have access to the advice and services of the Board Secretary and the Company Secretary. Detailed minutes of Board meetings regarding matters considered by the Board and decisions reached, including any concerns raised by Directors or dissenting views expressed, are kept by the Board Secretary. Minutes of Board meetings are available upon reasonable notice for inspection and comment upon by Directors.
Currently, the seventh session of the Board comprises the following members: Mr. Su Hengxuan, Mr. Li Mingguang and Ms. Huang Xiumei, all being Executive Directors, Mr. Yuan Changqing and Mr. Wang Junhui, all being Non-executive Directors, and Mr. Tang Xin8, Ms. Leung Oi-Sie Elsie, Mr. Lam Chi Kuen and Mr. Zhai Haitao, all being Independent Directors, with Mr. Yuan Changqing, a Non-executive Director of the Company, performing duties as the acting Chairman of the Board. Due to the adjustment of work arrangements, Mr. Yin Zhaojun and Mr. Liu Huimin successively resigned from their positions as Directors. Due to consecutively serving as Independent Directors for six years, Mr. Chang Tso Tung Stephen and Mr. Robinson Drake Pike successively resigned from their positions as Directors. Due to the failure to perform his duties as a Director, Mr. Wang Bin resigned from his positions as the Chairman of the Board and an Executive Director of the Company.
In 2021, all members of the Board developed and refreshed their knowledge and skills by attending special training courses covering topics such as macro economy and the development of the insurance industry. All members of the Board of Directors of the Company attended the training programs on anti-money laundering and a training course on the “Standards for the Corporate Governance of Banking and Insurance Institutions” offered by the Insurance Association of China. Mr. Li Mingguang, an Executive Director of the Company, attended a special training course for directors and supervisors of listed companies within Beijing as organized by the LCAB. Ms. Huang Xiumei, an Executive Director of the Company, attended a special training course on financial risk prevention and control of companies and a special training course for directors and supervisors of listed companies within Beijing, as organized by LCAB. Mr. Wang Junhui, a Non-Executive Director of the Company, attended a special training course for directors and supervisors of listed companies within Beijing as organized by LCAB. Ms. Leung Oi-Sie Elsie and Mr. Lam Chi Kuen, all being Independent Directors of the Company, attended a follow-up training course for independent directors of listed companies as organized by the SSE.
The Company has consistently improved its corporate governance structure, regulated the acts of Directors in performing their duties, and optimized the mechanism for supervising and evaluating the performance of duties by Directors. Pursuant to the “Measures for the Evaluation of the Performance of Duties by Directors and Supervisors of Banking and Insurance Institutions (for Trial Implementation)” published by the CBIRC, the “Operational Guidance for Evaluating the Performance of Duties by Directors of Insurance Companies” issued by the Insurance Association of China, the “Measures for the Evaluation of the Performance of Duties by Directors and Supervisors of the Company” released by the Company and other requirements, and after taking into account the actual situation of its corporate governance, the Company conducted an evaluation of the performance of duties by Directors. Based on the self-assessment of Directors and the evaluation of the Board of Supervisors, all members of the Board of the Company9 were evaluated as competent in their performance of duties in 2021.
| 8 | The Board of the Company received a resignation letter from Mr. Tang Xin, an Independent Director of the Company, on 6 March 2022. As Mr. Tang Xin had consecutively served as an Independent Director for six years, he tendered his resignation for such position to the Board of the Company pursuant to the relevant regulatory requirements. Since the resignation of Mr. Tang Xin will result in the number of Independent Directors of the Company falling below the minimum number required by the relevant regulations and the Articles of Association, Mr. Tang Xin will continue to perform his duties as an Independent Director until the qualification of a new Independent Director is approved by the CBIRC. |
| 9 | As Mr. Wang Bin, a former Executive Director of the Company, was unable to perform his duties as a Director nor participate in a Director self- assessment in the evaluation of the performance of duties by Directors for 2021, he was excluded from the scope of such evaluation. |
88
Meetings and attendance
During the Reporting Period, five regular Board meetings and five ad-hoc Board meetings were held by the Board of the Company, of which seven meetings were convened by a combination of physical meeting and participation through communication tools, and the remaining meetings were convened by written resolutions with voting through communication tools. Attendance records of the current individual Directors are as follows:
Name of Director | Type of Director | Number of meetings attended in person/ Number of meetings required to attend | Number of meetings attended by proxies/ Number of meetings required to attend | |||||||
Yuan Changqing | Non-executive Director | 9/10 | 1/10 | |||||||
Su Hengxuan | Executive Director | 9/10 | 1/10 | |||||||
Li Mingguang | Executive Director | 7/10 | 3/10 | |||||||
Huang Xiumei | Executive Director | 2/4 | 2/4 | |||||||
Wang Junhui | Non-executive Director | 9/10 | 1/10 | |||||||
Tang Xin | Independent Director | 10/10 | 0/10 | |||||||
Leung Oi-Sie Elsie | Independent Director | 10/10 | 0/10 | |||||||
Lam Chi Kuen | Independent Director | 5/5 | 0/5 | |||||||
Zhai Haitao | Independent Director | 2/2 | 0/2 | |||||||
Attendance records of the resigned Directors of the Company at the Board meetings convened during the Reporting Period are as follows:
Name of Director | Type of Director | Number of meetings attended in person/ Number of meetings required to attend | Number of meetings attended by proxies/ Number of meetings required to attend | |||||||
Wang Bin | Executive Director | 8/10 | 2/10 | |||||||
Yin Zhaojun | Non-executive Director | — | — | |||||||
Liu Huimin | Non-executive Director | 1/1 | 0/1 | |||||||
Chang Tso Tung Stephen | Independent Director | 5/5 | 0/5 | |||||||
Robinson Drake Pike | Independent Director | 8/8 | 0/8 | |||||||
Notes:
| 1. | The number of meetings attended in person includes meetings attended by the Directors on-site and by way of telephone or video conference. |
| 2. | All Directors who were unable to attend any meeting of the Board have authorized other Directors to attend and vote at the meeting on their behalf. |
Performance of duties by Independent Directors
In 2021, all Independent Directors of the Board of the Company possessed extensive experience in various fields, such as macro economy, finance and insurance, legal compliance, accounting and auditing. They satisfied the criteria for Independent Directors under the regulatory rules of the Company’s listed jurisdictions. The Independent Directors of the Company performed their duties pursuant to the Articles of Association and the provisions and requirements of the listing rules of the Company’s listed jurisdictions.
All Independent Directors diligently fulfilled their responsibilities and faithfully performed their duties by attending meetings of the Board and the specialized Board committees in 2021, examining and approving the Company’s business development, its financial management and connected transactions, participating in the establishment of specialized Board committees, providing professional and constructive advice in respect of major decisions of the Company, seriously listening to the reports from relevant personnel, understanding the daily operations and any possible operational risks of the Company in a timely manner, and expressing their opinions and exercising their functions and powers at Board meetings, thus actively performing their duties as Independent Directors in an effective manner. At the annual special meeting between the Chairman and the Independent Directors, all Independent Directors put forward their own views and opinions on various aspects such as the macro- environment, industry development, policies of the insurance industry, and corporate governance, etc., and gave advices and recommendations on matters including the development strategy of the Company, development of business, and risk management. The Board attached great importance to opinions and advice from Independent Directors, actively strengthened its communication with them and adopted their advice after careful deliberation and discussion. In 2021, the Company provided various materials to Independent Directors, which facilitated them to comprehend information associated with the insurance industry. All Independent Directors obtained information relating to the operation and management of the Company through various channels, which therefore formed the basis of their scientific and prudent decisions.
89
In 2021, Mr. Tang Xin, Ms. Leung Oi-Sie Elsie, Mr. Lam Chi Kuen and Mr. Zhai Haitao, all being the Independent Directors of the Company, carried out investigation and research on the investment sector of the Company, listened to the reports concerning the investment management structure and investment system of the Company, and discussed and communicated in respect of the relevant issues. Through the investigation and research, the Board further understood the development and status of the Company’s investment business in great depth and examined the effectiveness of the implementation of decisions of the Board.
During the Reporting Period, no Independent Director had raised any objection against the proposals and matters considered by the Board of the Company.
CHAIRMAN AND PRESIDENT
The Chairman of the Board is the legal representative of the Company, primarily responsible for convening and presiding over Board meetings, ensuring the implementation of Board resolutions, attending annual general meetings and arranging attendance by Chairmen/ Chairpersons of Board committees to answer questions raised by shareholders, signing securities issued by the Company and other important documents, providing leadership for the Board to ensure that the Board works effectively and performs its responsibilities, encouraging all Directors to make a full and active contribution to the
Board’s affairs, and promoting a culture of openness and debate. The Chairman of the Board is accountable to and reports to the Board10. During the Reporting Period and up to the date of this report, Mr. Su Hengxuan has served as the President of the Company. The President is responsible for the day-to-day operations of the Company, mainly including implementing strategies, policies, operation plans and investment schemes approved by the Board, formulating the Company’s internal management structure and fundamental management policies, drawing up basic rules and regulations of the Company, submitting to the Board any requests for appointment or removal of senior management officers and exercising other rights granted to him under the Articles of Association and by the Board. The President is fully accountable to the Board for the operations of the Company.
BOARD OF SUPERVISORS
The composition of the Board of Supervisors and the profile of each Supervisor are set forth in the section headed “Directors, Supervisors, Senior Management and Employees” of this report, and the details of the duty performance of the Board of Supervisors are set forth in the section headed “Report of the Board of Supervisors”.
AUDIT COMMITTEE
The Company established its Audit Committee on 30 June 2003. In 2021, the Audit Committee comprised only Independent Directors. Currently, the Audit Committee of the seventh session of the Board comprises Mr. Lam Chi Kuen11, Mr. Tang Xin and Mr. Zhai Haitao12, all being Independent Directors, with Mr. Lam Chi Kuen acting as the Chairman. Due to consecutively serving as Independent Directors for six years, Mr. Chang Tso Tung Stephen and Mr. Robinson Drake Pike successively resigned from their respective positions as a member and the Chairman of the Audit Committee.
All members of the Audit Committee have extensive experience in financial matters. The principal duties of the Audit Committee are to review and supervise the preparation of the Company’s financial reports, assess the effectiveness of the Company’s internal control system, supervise the Company’s internal audit system and its implementation, and recommend the engagement or replacement of external auditors. The Audit Committee is also responsible for communications between the internal and external auditors and the establishment of the internal whistleblowing mechanism of the Company.
| 10 | Given that Mr. Wang Bin, a former Executive Director of the Company, was not able to perform his role and duties as a Director, Mr. Yuan Changqing, a Non-Executive Director of the Company, was elected at the sixth meeting of the seventh session of the Board of the Company on 13 January 2022 to assume the role and duties of the Chairman of the Board. |
| 11 | Mr. Lam Chi Kuen became a member of the Audit Committee in June 2021 and the Chairman of the Audit Committee in February 2022. |
| 12 | Mr. Zhai Haitao became the Chairman of the Audit Committee in October 2021 and a member of the Audit Committee in February 2022. |
90
Meetings and attendance
During the Reporting Period, five meetings were held by the Audit Committee of the Board of the Company. Attendance records of individual members are as follows:
Name of member | Position | Number of meetings attended in person/ Number of meetings required to attend | Number of meetings attended by proxies/ Number of meetings required to attend | |||||||
Zhai Haitao | Independent Director, Chairman of the Audit Committee of the seventh session of the Board | 2/2 | 0/2 | |||||||
Tang Xin | Independent Director, member of the Audit Committee of the seventh session of the Board | 5/5 | 0/5 | |||||||
Lam Chi Kuen | Independent Director, member of the Audit Committee of the seventh session of the Board | 3/3 | 0/3 | |||||||
Attendance records of the resigned Directors at meetings are as follows:
Name of member | Number of meetings attended in person/ Number of meetings required to attend | Number of meetings attended by proxies/ Number of meetings required to attend | ||||||
Chang Tso Tung Stephen | 2/2 | 0/2 | ||||||
Robinson Drake Pike | 3/3 | 0/3 | ||||||
| Note: | The number of meetings attended in person includes attending meetings by the Directors on-site and by telephone or video conference. |
91
The meetings convened are as follows:
Meetings convened | Description | |
| 24 March 2021 18th meeting of the Audit Committee of the sixth session of the Board | Eleven proposals, including the “Proposal in relation to the Financial Report of the Company for the Year 2020” and the “Proposal in relation to the Remuneration of Auditors of the Company for the Year 2020”, were considered and approved, and the report of Ernst & Young Hua Ming LLP on the audit for the year 2020 was debriefed. | |
| 27 April 2021 19th meeting of the Audit Committee of the sixth session of the Board | Five proposals, including the “Proposal in relation to the Financial Report of the Company for the First Quarter of 2021” and the “Proposal in relation to the Appointment of Auditors of the Company for the Year 2021”, were considered and approved, and the report of Ernst & Young Hua Ming LLP on the results of agreed-upon procedures for the first quarter of 2021 and the report of PriceWaterhouseCoopers Zhong Tian LLP on matters associated with independence were debriefed. | |
| 24 August 2021 First meeting of the Audit Committee of the seventh session of the Board | Three proposals, including the “Proposal in relation to the Financial Report of the Company for the First Half of 2021”, were considered and approved, and the report of PricewaterhouseCoopers Zhong Tian LLP on the interim review for 2021 was debriefed. | |
| 27 October 2021 Second meeting of the Audit Committee of the seventh session of the Board | Three proposals, including the “Proposal in relation to the Financial Report of the Company for the Third Quarter of 2021, were considered and approved, and the report of PricewaterhouseCoopers Zhong Tian LLP on the agreed-upon procedures for the Third Quarter of 2021 was debriefed. | |
| 15 December 2021 Third meeting of the Audit Committee of the seventh session of the Board | The“ Prior Approval for the Scope of Additional Services of PricewaterhouseCoopers” was considered and approved. | |
Performance of duties by the Audit Committee
In 2021, the Audit Committee performed its relevant duties and functions in strict compliance with the “Procedural Rules for the Audit Committee Meetings”. All members of the Audit Committee performed their obligations in a responsible manner and reviewed the proposals in relation to the audit of the Company, its financial reports, connected transactions, internal control and legal compliance. During meetings of the Audit Committee, all members actively participated in discussions and gave guiding opinions on any proposals considered and discussed at the meetings.
Reviewing and approving financial reports. The Audit Committee, according to its duties, reviewed and approved annual, interim and quarterly financial reports of the Company. The Audit Committee was of the view that the financial reports of the Company reflected the overall situation of the Company in a true, accurate and complete manner, and gave its written opinion in this regard. By reviewing and monitoring the completeness of financial statements, annual report and accounts, interim report and quarterly reports of the Company, and examining significant matters such as financial statements and reports, the Audit Committee guaranteed the accuracy and completeness of the financial information disclosed by the Company and the consistency of its financial reports. Prior to the audit conducted by the accounting firm and the review of the annual report, the Audit Committee communicated the relevant situations with the auditors and listened to the report in connection with the arrangement of the audit. Before issuing opinion on audit by the accounting firm, the Audit Committee commenced in-depth communications with it so as to understand whether there were any issues arisen during the audit.
92
Assessing the work of and strengthening communications with external auditors. Besides regular meetings, the Audit Committee convened communication meetings in advance with external auditors so as to discuss the annual audit plan of the Company, determine the service scope of the annual audit, listen to the report given by the auditors with respect to the results of the audit on and review of periodic financial reports of the Company, and gave opinions and advice on the agreed-upon procedures proposed annually and quarterly by the external auditors of the Company and the pre-approval of the scope of additional services. Through communications, the Audit Committee enhanced the effectiveness of the internal control of the Company and further supervised the performance of duties by the external auditors in a diligent and responsible way.
Assessing the effectiveness of internal control and monitoring the operation of the Company to be in compliance with law. The Audit Committee provided guidance to the Company on the management of internal control, devised the working plan for internal control assessment, reviewed the work report on assessment of internal control, and inspected the rectification of problems identified in the internal control pursuant to the “Standard Regulations on Corporate Internal Control” and relevant requirements, as well as Section 404 of the U.S. Sarbanes-Oxley Act. The Audit Committee earnestly performed its duties and responsibilities and monitored the Company to carry out its work in compliance with laws and regulations pursuant to the relevant requirements of the CBIRC, the SSE and the HKSE. As required by its duties and responsibilities, the Audit Committee reviewed the annual and half-year compliance reports of the Company to ensure that its work was conducted strictly according to the relevant regulatory requirements in a reasonable and efficient manner.
Examining the internal audit functions of the Company. In 2021, the Audit Committee reviewed proposals including the proposal on the 2020 internal audit work and the proposal on the internal audit work report for the first half of 2021, and discussed any matters of concerns through communication in a timely and effective manner, with a view to further understanding the duties of the Company’s audit departments and supervising the effectiveness of the internal audit function. The Audit Committee was of the view that the internal audit function of the Company was effective during the Reporting Period. In the selection and appointment of external auditors, the Audit Committee performed its duty of review in compliance with laws and issued its review opinions.
NOMINATION AND REMUNERATION COMMITTEE
The Company established the Management Training and Remuneration Committee on 30 June 2003. On 16 March 2006, the Board resolved to change the name of the Management Training and Remuneration Committee to the Nomination and Remuneration Committee, with a majority of Independent Directors on the committee. Currently, the Nomination and Remuneration Committee of the seventh session of the Board comprises Mr. Tang Xin, an Independent Director, Mr. Yuan Changqing, a Non-executive Director, and Mr. Lam Chi Kuen13, an Independent Director, with Mr. Tang Xin acting as the Chairman. Due to consecutively serving as an Independent Director for six years, Mr. Robinson Drake Pike resigned from his position as a member of the Nomination and Remuneration Committee.
The Nomination and Remuneration Committee is mainly responsible for reviewing the structure of the Board, its number of members and composition and drawing up plans for the appointment, succession and appraisal criteria of Directors and senior management. The committee is also responsible for formulating training and remuneration policies for the senior management of the Company. The Nomination and Remuneration Committee, as an advisor to the Board on the nomination of Directors, shall first discuss and agree on the list of candidates to be nominated as new Directors, following which such candidates are recommended to the Board. The Board shall then determine whether such candidates’ appointments should be proposed for approval at the shareholders’ general meeting. The major criteria considered by the Nomination and Remuneration Committee and the Board are educational background, management and research experience in the insurance industry, and the candidates’ commitment to the Company. As to the nomination of Independent Directors, the Nomination and Remuneration Committee will give special consideration to the independence of the relevant candidates.
The Nomination and Remuneration Committee determines, with delegated responsibility, the remuneration packages of all Executive Directors and senior management officers. The fixed salary of the Executive Directors and other members of senior management are determined in accordance with market levels and their respective positions, and the amount of their performance-related bonuses is determined according to the results of performance appraisals. Directors’ fees and the volume of share appreciation rights to be granted are determined with reference to market levels and the actual circumstances of the Company.
| 13 | Mr. Lam Chi Kuen became a member of the Nomination and Remuneration Committee 13 in February 2022. |
93
Meetings and attendance
During the Reporting Period, three meetings were held by the Nomination and Remuneration Committee of the Board of the Company. Attendance records of individual members are as follows:
Name of member | Position | Number of meetings attended in person/ Number of meetings required to attend | Number of meetings attended by proxies/ Number of meetings required to attend | |||||||
Tang Xin | Independent Director, Chairman of the Nomination and Remuneration Committee of the seventh session of the Board | 3/3 | 0/3 | |||||||
Yuan Changqing | Non-executive Director, member of the Nomination and Remuneration Committee of the seventh session of the Board | 0/3 | 3/3 | |||||||
Zhai Haitao | Independent Director, member of the Nomination and Remuneration Committee of the seventh session of the Board | 1/1 | 0/1 | |||||||
Attendance records of the resigned Director of the Company at theBoard meeting covened during the Reporting Period are as follows:
Name of member | Number of meetings attended in person/ Number of meetings required to attend | Number of meetings attended by proxies/ Number of meetings required to attend | ||||||
Robinson Drake Pike | 2/2 | 0/2 | ||||||
Notes:
| 1. | The number of meetings attended in person includes attending meetings by the Directors on-site and by telephone or video conference. |
| 2. | All Directors who were unable to attend any meeting of specialized Board committees have authorized other Directors to attend and vote at the meeting on their behalf. |
| 3. | Mr. Zhai Haitao served as a member of the Nomination and Remuneration Committee from October 2021 to February 2022. |
94
The meetings convened are as follows:
Meetings convened | Description | |
| 24 March 2021 14th meeting of the Nomination and Remuneration Committee of the sixth session of the Board | 17 proposals, including the “Proposal in relation to the Remuneration of Directors and Supervisors of the Company”, the “Proposal in relation to the Remuneration of Senior Management of the Company” and the nomination of the candidates for Directors of the seventh session of the Board, were considered and approved. | |
| 27 April 2021 15th meeting of the Nomination and Remuneration Committee of the sixth session of the Board | Three proposals, including the “Proposal in relation to the Nomination of Mr. Liu Yuejin as an Assistant to the President of the Company” and the “Proposal in relation to the Nomination of Ms. Zhang Di as the Chief Investment Officer of the Company”, were considered and approved. | |
| 27 October 2021 First meeting of the Nomination and Remuneration Committee of the seventh session of the Board | Five proposals, including the “Proposal in relation to the Nomination of Ms. Zhang Di as an Assistant to the President of the Company” and the “Proposal in relation to the Nomination of Mr. Liu Fengji as the Person in Charge of Audit of the Company”, were considered and approved. | |
Performance of duties by the Nomination and Remuneration Committee
In 2021, the Nomination and Remuneration Committee performed its relevant duties and functions in strict compliance with the “Procedural Rules for the Nomination and Remuneration Committee Meetings”. All members of the Nomination and Remuneration Committee performed their obligations in a responsible manner and reviewed the proposals on the candidates for Directors, nomination of senior management officers, business objectives and appraisal results, the remuneration of Directors, Supervisors and senior management, and the report on the duty performance of the Audit Committee and the Nomination and Remuneration Committee. During meetings of the Nomination and Remuneration Committee, all members actively participated in discussions and gave guiding opinions on the proposals considered and discussed at the meetings.
Nomination and proposed appointment of Directors and senior management officers of the Company and the Board diversity policy. The Company firmly believes that the Board diversity may enhance the decision-making capability of the Board, and considers the Board diversity as a key factor for maintaining a sound corporate governance standard and achieving the sustainable development of the Company. In accordance with the “Procedural Rules for the Nomination and Remuneration Committee Meetings” and the Board diversity policy, the Nomination and Remuneration Committee seriously reviewed the structure of the Board, its number of members and composition (including taking into account diversity factors, such as gender, age, cultural and educational background, skills, knowledge and experience), fully reviewed the professional qualifications and industrial background of the candidates for Directors and members of the Board committees and the independence of Independent Directors, and submitted the opinions in relation thereto to the Board. It also conducted a careful assessment on the qualifications, skills, knowledge and experience of candidates for senior management officers to ensure that the candidates met the requirements set by the Company, and submitted a review opinion to the Board and agreed to submit such proposals to the Board for consideration.
Proposing remuneration policy of Directors, Supervisors and senior management officers of the Company. The Nomination and Remuneration Committee took into account various factors such as business development management, strategic investment decisions, and corporate governance management and control, carefully examined and determined the specific remuneration packages of all Executive Directors and senior management officers, approved the terms of service contracts between the Company and each of the Executive Directors, Non-executive Directors and Independent Directors and pushed forward the signing of service contracts between the Company and all Directors, defined the rights, obligations and remunerations of Directors, and seriously appraised the performance of Directors in the discharge of their duties.
95
Carrying out the evaluation of the performance of duties by Directors, Supervisors and senior management officers of the Company and their performance appraisal. The Nomination and Remuneration Committee reviewed proposals on the results of evaluating the performance of duties by Directors for the year 2020, the results of performance appraisal of senior management officers for the year 2020 and the performance target contract of senior management for the year 2021, the remuneration of Directors and Supervisors of the Company, and the remuneration of senior management officers of the Company, and made recommendations to the Board in respect of matters such as the determination of performance target, performance appraisal procedures and results.
RISK MANAGEMENT AND CONSUMER RIGHTS PROTECTION COMMITTEE
The Company established its Risk Management Committee on 30 June 2003. In December 2019, the Board renamed the Risk Management Committee as the Risk Management and Consumer Rights Protection Committee, the additional function of management of consumer rights protection was included in the functions of the original Risk Management Committee, and corresponding changes and amendments were made in such areas as the functions and responsibilities of the committee and the procedural rules of the committee. Currently, the Risk Management and Consumer Rights Protection Committee of the seventh session of the Board comprises Ms. Leung Oi-Sie Elsie, an Independent Director, Mr. Li Mingguang, an Executive Director, Mr. Wang Junhui14, a Non-executive Director, and Mr. Tang Xin15, an Independent Director, with Ms. Leung Oi-Sie Elsie acting as the Chairperson. Due to the adjustment of work arrangements, Mr. Yin Zhaojun and Mr. Liu Huimin successively resigned from their positions as members of the Risk Management and Consumer Rights Protection Committee.
The Risk Management and Consumer Rights Protection Committee is mainly responsible for formulating the Company’s system of risk control benchmarks, establishing well-developed risk management and internal control systems and the system for the management of consumer rights protection, examining and reviewing the Company’s risk preference, risk tolerance and the workreports from the senior management and the Consumer Rights Protection Department, formulating the Company’s risk management policy and major policy on consumer rights protection, reviewing the assessment reports in relation to the Company’s risk management and internal control, studying major investigation findings on risk management and internal control matters as delegated by the Board or on its own initiative and the management’s response to these findings, dealing with major risk emergency events or crisis events or major disagreement in risk management, and supervising and directing the senior management and the relevant departments to resolve any issues identified during the rectification process in a timely manner.
| 14 | Mr. Wang Junhui became a member of the Risk Management and Consumer Rights Protection Committee in February 2021. |
| 15 | Mr. Tang Xin became a member of the Risk Management and Consumer Rights Protection Committee in July 2021. |
96
Meetings and attendance
During the Reporting Period, five meetings were held by the Risk Management and Consumer Rights Protection Committee of the Board of the Company. Attendance records of individual members are as follows:
Name of member | Position | Number of meetings attended in person/ Number of meetings required to attend | Number of meetings attended by proxies/ Number of meetings required to attend | |||||||
Leung Oi-Sie Elsie | Independent Director, Chairperson of the Risk Management and Consumer Rights Protection Committee of the seventh session of the Board | 5/5 | 0/5 | |||||||
Li Mingguang | Executive Director, member of the Risk Management and Consumer Rights Protection Committee of the seventh session of the Board | 3/5 | 2/5 | |||||||
Wang Junhui | Non-executive Director, member of the Risk Management and Consumer Rights Protection Committee of the seventh session of the Board | 4/5 | 1/5 | |||||||
Tang Xin | Independent Director, member of the Risk Management and Consumer Rights Protection Committee of the seventh session of the Board | 3/3 | 0/3 | |||||||
Attendance records of the resigned Directors at the meetings of the Board of Supervisors are as follows:
Name of member | Number of meetings attended in person/ Number of meetings required to attend | Number of meetings attended by proxies/ Number of meetings required to attend | ||||||
Yin Zhaojun | — | — | ||||||
Liu Huimin | — | — | ||||||
Notes:
| 1. | The number of meetings attended in person includes attending meetings by the Directors on-site and by telephone or video conference. |
| 2. | All Directors who were unable to attend any meeting of specialized Board committees have authorized other Directors to attend and vote at the meeting on their behalf. |
97
The meetings convened are as follows:
Meetings convened | Description | |
| 24 March 2021 Eighth meeting of the Risk Management and Consumer Rights Protection Committee of the sixth session of the Board | Seven proposals, including the “Proposal in relation to the New Business Plan of the Company for the Years from 2021 to 2023” and the “Proposal in relation to the ‘Statement of the Company on Risk Preference for the Year 2021’”, were considered and approved. | |
| 27 April 2021 Ninth meeting of the Risk Management and Consumer Rights Protection Committee of the sixth session of the Board | The “Report on the Case Prevention of the Company for the Year 2020” was debriefed. | |
| 24 August 2021 First meeting of the Risk Management and Consumer Rights Protection Committee of the seventh session of the Board | Four proposals, including the “Proposal in relation to the Amendments to the ‘Statement of the Company on Risk Preference for the Year 2021’” and the “Proposal in relation to the ‘Report on the Enterprise-wide Risk Management of the Company for the Second Quarter of 2021’”, were considered and approved. | |
| 27 October 2021 Second meeting of the Risk Management and Consumer Rights Protection Committee of the seventh session of the Board | The “Proposal in relation to the ‘Report on the Enterprise-wide Risk Management of the Company for the Third Quarter of 2021’” was considered and approved. | |
| 15 December 2021 Third meeting of the Risk Management and Consumer Rights Protection Committee of the seventh session of the Board | Five proposals, including the “Proposal in relation to the Risk Compliance Analysis on the Strategic Asset Allocation Plan of the Company for the Years from 2022 to 2024” and the “Proposal in relation to the Work Report on the Fraudualent Risk Management of the Company for the Year 2021”, were considered and approved, and the “Audit Report on the Solvency Risk Management System of the Company for the Year 2021” was debriefed. | |
Performance of duties by the Risk Management and Consumer Rights Protection Committee
In 2021, the Risk Management and Consumer Rights Protection Committee performed its duties and functions in strict compliance with the “Procedural Rules for the Risk Management and Consumer Rights Protection Committee Meetings”. All members performed their obligations in a responsible manner and reviewed the proposals in relation to the internal control system of the Company, its risk management and construction in compliance with law. During meetings of the Risk Management and Consumer Rights Protection Committee, all members actively participated in discussions and gave guiding opinions on the proposals considered and discussed at the meetings.
Reviewing the risk analysis on major matters concerning the business operation and management of the Company. In 2021, the Risk Management and Consumer Rights Protection Committee reviewed the risk analysis on major matters concerning the business operation and management of the Company, reviewed and approved the proposals in relation to the risk compliance analysis on the strategic asset allocation plan for the years from 2022 to 2024, the risk compliance analysis on the asset allocation plan for the year 2022 and the overseas investment plan and investment authorization for the year 2022, and gave guiding opinions on risk control for major matters concerning the business operation and management of the Company in accordance with the regulatory requirements of the CBIRC on the China Risk Oriented Solvency System (C-ROSS).
98
Providing its opinions for the review of the proposals on risk management to the Board. In 2021, the Risk Management and Consumer Rights Protection Committee closely monitored and controlled and effectively prevented internal and external risks of the Company, assisted the Board in reviewing the assessment reports on business risk and internal control of the Company according to the national and international regulatory requirements. The Risk Management and Consumer Rights Protection Committee provided its opinions for the review of the reports on risk management such as the annual and quarterly reports on the enterprise-wide risk management of the Company, work summary on anti-money laundering for the year 2020 and the work plan for the year 2021, the report on case prevention for the year 2020, the statement of the Company on risk preference for the year 2021, the audit report on the solvency risk management system of the Company for the year 2021, the reputational risk management report and the work report on fraudulent risk management, which offered professional support to the Board’s decision-making in a scientific manner.
Reviewing the system of the Company in relation to consumer rights protection. In 2021, the Risk Management and Consumer Rights Protection Committee reviewed the report on the customer rights protection of the Company for the year 2020 and the proposal for customer rights protection of the Company for 2021, and submitted the review opinions to the Board.
STRATEGY AND ASSETS AND LIABILITIES MANAGEMENT COMMITTEE
The Company established the Strategy Committee on 30 June 2003. In October 2010, the proposal to establish the Strategy and Investment Decision Committee on the basis of the Strategy Committee was reviewed and approved at the ninth meeting of the third session of the Board. In June 2018, the proposal to establish the Strategy and Assets and Liabilities Management Committee on the basis of the Strategy and Investment Decision Committee was reviewed and approved at the twenty-fourth meeting of the fifth session of the Board. Currently, the Strategy and Assets and Liabilities Management Committee of the seventh session of the Board comprises Mr. Zhai Haitao16 and Ms. Leung Oi-Sie Elsie, all being the Independent Directors, Mr. Su Hengxuan and Ms. Huang Xiumei17, all being the Executive Directors, and Mr. Wang Junhui, a Non-executive Director, with Mr. Zhai Haitao acting as the Chairman. Due to consecutively serving as an Independent Director for six year, Mr. Chang Tso Tung Stephen resigned from his position as the Chairman of the Strategy and Assets and Liabilities Management Committee.
The Strategy and Assets and Liabilities Management Committee is mainly responsible for the drawing-up of long-term development strategies of the Company, conducting studies on important matters concerning assets and liabilities management and the relevant policies and systems, the system for the application and management of insurance funds, and major strategic investment decisions of the Company, and making recommendations in respect thereof.
| 16 | Mr. Zhai Haitao became the Chairman of the Strategy and Assets and Liabilities Management Committee in February 2022. |
| 17 | Ms. Huang Xiumei became a member of the Strategy and Assets and Liabilities Management Committee in July 2021. |
99
Meetings and attendance
During the Reporting Period, six meetings were held by the Strategy and Assets and Liabilities Management Committee of the Board of the Company. Attendance records of individual members are as follows:
Name of member | Position | Number of meetings attended in person/ Number of meetings required to attend | Number of meetings attended by proxies/ Number of meetings required to attend | |||||||
Lam Chi Kuen | Independent Director, Chairman of the Strategy and Assets and Liabilities Management Committee of the seventh session of the Board | 3/3 | 0/3 | |||||||
Su Hengxuan | Executive Director, member of the Strategy and Assets and Liabilities Management Committee of the seventh session of the Board | 3/6 | 3/6 | |||||||
Leung Oi-Sie Elsie | Independent Director, member of the Strategy and Assets and Liabilities Management Committee of the seventh session of the Board | 6/6 | 0/6 | |||||||
Wang Junhui | Non-executive Director, member of the Strategy and Assets and Liabilities Management Committee of the seventh session of the Board | 4/6 | 2/6 | |||||||
Huang Xiumei | Executive Director, member of the Strategy and Assets and Liabilities Management Committee of the seventh session of the Board | 1/3 | 2/3 | |||||||
Attendance records of the resigned Director at meetings are as follows:
Name of member | Number of meetings attended in person/ Number of meetings required to attend | Number of meetings attended by proxies/ Number of meetings required to attend | ||||||
Chang Tso Tung Stephen | 3/3 | 0/3 | ||||||
Notes:
| 1. | The number of meetings attended in person includes attending meetings by the Directors on-site and by telephone or video conference. |
| 2. | All Directors who were unable to attend any meeting of specialized Board committees have authorized other Directors to attend and vote at the meeting on their behalf. |
| 3. | Mr. Lam Chi Kuen served as the Chairman of the Strategy and Assets and Liabilities Management Committee from July 2021 to February 2022. |
100
The meetings convened are as follows:
Meetings convened | Description | |
| 24 March 2021 15th meeting of the Strategy and Assets and Liabilities Management Committee of the sixth session of the Board | Four proposals, including the “Proposal in relation to the New Business Plan of the Company for the Years from 2021 to 2023” and the “Proposal in relation to the Final Assessment Report for the Outline of the ‘13th Five- Year Development Plan’ of the Company”, were considered and approved. | |
| 27 April 2021 16th meeting of the Strategy and Assets and Liabilities Management Committee of the sixth session of the Board | Two proposals, including the “Proposal in relation to the General Mandate for the Issue of H Shares of the Company”, were considered and approved, and the “Report on the Situation Relevant to the Assets and Liabilities Management of the Company for 2020” was debriefed. | |
| 26 May 2021 17th meeting of the Strategy and Assets and Liabilities Management Committee of the sixth session of the Board | Two proposals, including the “Proposal in relation to the Participation by the Company in the Capital Increase of CGB”, were considered and approved. | |
| 24 August 2021 First meeting of the Strategy and Assets and Liabilities Management Committee of the seventh session of the Board | Two proposals, including the “Proposal in relation to the ‘Statement of the Company on Risk Preference for the Year 2021’”, were considered and approved. | |
| 27 October 2021 Second meeting of the Strategy and Assets and Liabilities Management Committee of the seventh session of the Board | The “Proposal in relation to the Implementation of Tasks and the Performance Appraisal of the Company for 2020” was considered and approved. | |
| 15 December 2021 Third meeting of the Strategy and Assets and Liabilities Management Committee of the seventh session of the Board | Ten proposals, including the “Proposal in relation to the Strategic Asset Allocation Plan of the Company for the Years from 2022 to 2024” and the “Proposal in relation to the Asset Allocation Plan of the Company for the Year 2022”, were considered and approved. | |
Performance of duties by the Strategy and Assets and Liabilities Management Committee
In 2021, all members of the Strategy and Assets and Liabilities Management Committee attended meetings in a timely manner, reviewed the proposals on the application of the Company’s insurance funds, annual investments, major strategic projects, assets and liabilities management and annual related reports. Members of the Strategy and Assets and Liabilities Management Committee diligently performed their duties. During meetings of the Strategy and Assets and Liabilities Management Committee, all members actively participated in discussions and gave professional advices on any proposals considered and discussed at the meetings.
Reviewing annual asset allocation plan and entrusted investments of the Company. In 2021, the Strategy and Assets and Liabilities Management Committee reviewed the proposals on investment plans such as the annual asset allocation plan of the Company and the annual investment plan of the Company for self-use real estate, the proposals on authorization of investments such as the annual authorization by the Company of investment in non self-use real estate, the annual authorization of investment entrusted by the Company in connection with Renminbi liberalization and the annual authorization by the Company of investment in equity investment funds, and the proposals on investment guidelines such as the management guidelines on the investment made by CLI under the entrustment of the Company, and submitted its opinions to the Board in this regard.
Reviewing the systems of the Company concerning assets and liabilities management. In 2021, the Strategy and Assets and Liabilities Management Committee reviewed and approved the proposals on the amendments to the statement of the Company on risk preference for the year 2021 and the amendments to the rules on enterprise- wide risk management of the Company, and submitted its review opinions to the Board.
101
Discussing the Company’s development plans and major strategic projects. In 2021, the Strategy and Assets and Liabilities Management Committee reviewed the proposals on the final assessment report for the outline of the “13th five-year development plan” of the Company, its strategic asset allocation plan for the years from 2022 to 2024, asset allocation plan for the year 2022, the Company’s participation in the capital increase of CGB and its investment in Project Eyas, and made significant recommendations to the Board.
CONNECTED TRANSACTIONS CONTROL COMMITTEE
The Company established its Connected Transactions Control Committee on 29 October 2019. In October 2019, the “Proposal in relation to the Establishment of the Connected Transactions Control Committee of the Board of Directors” was reviewed and approved at the twentieth meeting of the sixth session of the Board, pursuant to which a new Connected Transactions Control Committee was established under the Board of the Company. Currently, the Connected Transactions Control Committee of the seventh session of the Board comprises Mr. Tang Xin, Ms. Leung Oi-Sie Elsie, Mr. Lam Chi Kuen18 and Mr. Zhai Haitao19, all being the Independent Directors, with Mr. Tang Xin acting as the Chairman. Due to consecutively serving as Independent Directors for six years, Mr. Chang Tso Tung Stephen and Mr. Robinson Drake Pike successively resigned from their positions as members of the Connected Transactions Control Committee.
The principal duties of the Connected Transactions Control Committee are to confirm connected parties of the Company, manage, examine and approve connected transactions to control risks relating to connected transactions, and focus on the compliance and necessity of connected transactions and the fairness of their pricing, which provide an important basis for the Board’s decision-making in connected transaction management.
Meetings and attendance
During the Reporting Period, five meetings were held by the Connected Transactions Control Committee of the Board of the Company. Attendance records of individual members are as follows:
Name of member | Position | Number of meetings attended in person/ Number of meetings required to attend | Number of meetings attended by proxies/ Number of meetings required to attend | |||||||
Tang Xin | Independent Director, Chairman of the Connected Transactions Control Committee of the seventh session of the Board | 5/5 | 0/5 | |||||||
Leung Oi-Sie Elsie | Independent Director, member of the Connected Transactions Control Committee of the seventh session of the Board | 5/5 | 0/5 | |||||||
Lam Chi Kuen | Independent Director, member of the Connected Transactions Control Committee of the seventh session of the Board | 3/3 | 0/3 | |||||||
Zhai Haitao | Independent Director, member of the Connected Transactions Control Committee of the seventh session of the Board | 2/2 | 0/2 | |||||||
| 18 | Mr. Lam Chi Kuen became a member of the Connected Transactions Control Committee in June 2021. |
| 19 | Mr. Zhai Haitao became a member of the Connected Transactions Control Committee in October 2021. |
102
Attendance records of the resigned Directors at meetings are as follows:
Name of member | Number of meetings attended in person/ Number of meetings required to attend | Number of meetings attended by proxies/ Number of meetings required to attend | ||||||
Chang Tso Tung Stephen | 2/2 | 0/2 | ||||||
Robinson Drake Pike | 3/3 | 0/3 | ||||||
| Note: | The number of meetings attended in person includes attending meetings by the Directors on-site and by telephone or video conference. |
The meetings convened are as follows:
Meetings convened | Description | |
| 24 March 2021 Eighth meeting of the Connected Transactions Control Committee of the sixth session of the Board | Four proposals, including the “Proposal in relation to the Execution of a Supplemental Agreement to the ‘Agreement for the Entrusted Management of Retained Assets’ between the Company and China Life Investment Management Company Limited” and the “Proposal in relation to the ‘Report on the Overall Status of Connected Transactions of the Company for the Year 2020’”, were considered and approved. | |
| 26 May 2021 Ninth meeting of the Connected Transactions Control Committee of the sixth session of the Board | Two proposals, including the “Proposal in relation to the Participation by the Company in the Capital Increase of CGB”, were considered and approved. | |
| 24 August 2021 First meeting of the Connected Transactions Control Committee of the seventh session of the Board | Two proposals, including the “Proposal in relation to an Increase in Revolving Investment for Project Qihang”, were considered and approved. | |
| 27 October 2021 Second meeting of the Connected Transactions Control Committee of the seventh session of the Board | The “Proposal in relation to the Execution of the ‘Agreement for Entrusted Investment and Management and Operating Services with respect to Alternative Investments with Insurance Funds’ between the Company and China Life Investment Management Company Limited” was considered and approved. | |
| 15 December 2021 Third meeting of the Connected Transactions Control Committee of the seventh session of the Board | Nine proposals, including the “Proposal in relation to the Renewal of the ‘Policy Management Agreement’ between the Company and China Life Insurance (Group) Company” and the “Proposal in relation to the Renewal of the Asset Management Agreement between the Company and China Life Franklin Asset Management Company Limited”, were considered and approved. | |
103
Performance of duties by the Connected Transactions Control Committee
In 2021, the Connected Transactions Control Committee performed its duties and functions in strict compliance with the “Procedural Rules for the Connected Transactions Control Committee Meetings”. All members performed their obligations in a responsible manner and reviewed the proposals in relation to the connected transactions of the Company. During meetings of the Connected Transactions Control Committee, all members actively participated in discussions and gave guiding opinions on the proposals considered and discussed at the meetings.
Determining connected parties of the Company. In 2021, the Connected Transactions Control Committee reviewed the “Report on Determining a List of Connected Parties of the Company as of 31 December 2020” and the “Report on Determining a List of Connected Parties of the Company as of 30 June 2021”, and reported to the Board in respect thereof.
Approving connected transactions. In 2021, the Connected Transactions Control Committee reviewed connected transaction projects, such as the participation by the Company in the capital increase of CGB, its investment in Project Eyas, Investment i n China Life Smart Healthcare Fund Project, renewal of the “Policy Management Agreement” with CLIC, renewal of the “Framework Agreement for Daily Connected Transactions” with Pension Company, renewal of the framework agreement for the connected transaction regarding bonds distribution with AMC, renewal of the framework agreement for connected transactions with Sino-Ocean Group and other framework agreements for daily connected transactions, and the execution of the “Agreement for Entrusted Investment and Management and Operating Services with respect to Alternative Investments with Insurance Funds” with CLI, fully discussed the necessity, feasibility and risks of the projects and made recommendations to the Board in respect thereof.
Reviewing the implementation of the system for connected transactions management. In 2021, the Connected Transactions Control Committee reviewed the implementation of the Company’s system for connected transactions management and the report on connected transactions, considered and approved the “Proposal in relation to the ‘Report on the Overall Status of Connected Transactions of the Company for the Year 2020’”, and submitted the review opinions to the Board.
INDEPENDENCE OF THE COMPANY FROM ITS CONTROLLING SHAREHOLDER
Employees: The Company is independent in the aspects of employment, human resources and remuneration management.
Assets: The Company owns all assets relating to the operation of its principal business. At present, the Company does not provide any guarantee for its shareholders. The Company’s assets are independent, complete, and independent of the shareholders of the Company and other related parties.
Finance: The Company has established a separate financial department, and an independent financial accounting system and financial management system; further, the Company makes financial decisions on its own; it employs separate financial personnel, opens separate accounts with banks and does not share bank accounts with CLIC; the Company, as a separate taxpayer, pays taxes individually according to law.
Organization: The Company has established a well-developed organizational system, under which internal bodies such as the Board of Directors and the Board of Supervisors operate separately. There is no subordinate relationship between such internal bodies and the functional departments of the Company’s controlling shareholder.
Business operations: The Company independently develops personal insurance businesses, including life insurance, health insurance and accident insurance businesses; reinsurance relating to the above insurance businesses; use of funds permitted by applicable PRC laws and regulations or the State Council; as well as all types of personal insurance services, consulting business and agency business; sale of securities investment funds; and other businesses permitted by the insurance administrative and regulatory authorities of the PRC. The Company currently possesses the “Insurance Permit” (Number: 000005) issued by the CBIRC. The Company is independently engaged in the businesses as prescribed in its business scope according to law, has separate sales and agency channels and is licensed to use licensed trademarks without consideration. The completeness and independence of the Company’s business operations will not be adversely affected by its relationship with related parties.
104
PERFORMANCE APPRAISAL AND INCENTIVES FOR SENIOR MANAGEMENT
The Company implements a term-of-service and target-related responsibility system for senior management. Performance target contracts are entered into between the Chairman of the Board and the President, and between the President and other senior management of the Company. The performance target contract system is an important tool in disassembling the strategic goals of the Company in a scientific manner, which is conducive towards the breakdown of targets and transmission of responsibility, enhancing the implementation capability of the Company and ensuring the successful completion of its annual business targets. The performance appraisal criteria listed in the individual performance target contracts of senior management are partially linked to the business targets of the Company and partially formulated with reference to the duties and functions of their respective positions.
The remuneration for senior management mainly comprises position compensation, performance rewards, welfare benefits and medium and long term incentives.
SHAREHOLDERS’ INTERESTS
To safeguard shareholders’ interests, in addition to the right to participate in the Company’s affairs by attending shareholders’ general meetings, shareholders have the right to convene extraordinary shareholders’ general meetings under certain circumstances.
If the number of Directors is less than the number stipulated in the Company Law or two-thirds of the number specified by the Articles of Association, or the uncovered losses incurred amount to one-third of the Company’s total share capital or if the Board or the Board of Supervisors deems necessary, or more than half of the Directors (including at least two Independent Directors) request, or shareholders holding 10% or more shares of the Company make a requisition, the Board shall convene an extraordinary shareholders’ general meeting within two months. Where shareholders holding 10% or more shares request an extraordinary shareholders’ general meeting, such shareholders shall make a request in writing to the Board with a clear agenda. The Board shall, upon receipt of such a written request, convene a meeting as soon as possible. If the Board fails to convene a meeting within 30 days of the receipt of such a written request, shareholders making such a request may convene a meeting by themselves at the cost of the Company within four months of the receipt by the Board of such a written request.
In accordance with the Articles of Association, when the Company convenes the shareholders’ general meeting, shareholders individually or in aggregate holding 3% or more of the shares of the Company shall have the right to submit proposals to the Company. The Company should include such matters that fall into the scope of the functions and powers of the shareholders’ general meeting in the agenda of the meeting. Shareholders individually or in aggregate holding 3% or more of the shares of the Company may submit provisional proposals in writing to the convenor sixteen days prior to the shareholders’ general meeting. The provisional proposals shall fall into the scope of the functions and powers of the shareholders’ general meeting and specify explicit topics and specific resolution matters.
Shareholders may put forward enquiries to the Board through the Board Secretary or the Company Secretary, or put forward proposals at shareholders’ general meetings through their proxies. The Company has made available its contact details in its correspondence with shareholders to enable such enquiries or proposals to be properly directed.
INFORMATION DISCLOSURE AND INVESTOR RELATIONS
The Company has established a well-developed, effective and practical information disclosure management system in strict compliance with the regulatory laws and regulations of its listed jurisdictions and the insurance industry, internal rules and regulations as well as self-regulatory requirements and continued to improve the quality of its information disclosure, so as to ensure that domestic and overseas investors obtain true, accurate and complete information in a compliant and effective manner. The Company has attached great importance to its contact and communication with domestic and overseas investors, and proactively developed investor relations by offering various channels to facilitate such investors to keep abreast of any major business development of the Company in a timely manner.
The Company has created the “Investor Relations” section on its official website at www.e-chinalife.com to facilitate investors to access announcement s, operating results materials and other information for public disclosure as published by the Company in the three listing venues. In addition, investors may call the investor relations hotline of the Company at 86-10-63631329 or email to the investor relations email box at ir@e-chinalife.com if they have any further inquiries. The Company will respond to such enquiries in a timely manner.
105
In 2021, the Company further proceeded with the construction of its information disclosure regulation system, and continued to make amendments to improve the regulations in connection with the information disclosure affairs management and the registration and management of persons who have knowledge of inside information as required by the revised rules of the CSRC and the SSE, which led to the successful and efficient implementation of the basic regulation system of information disclosure. For the disclosure by way of provisional announcements, the Company fulfilled its obligation of information disclosure in a timely manner by publishing timely announcements with respect to the progress of such matters as significant matters, major investments and connected transactions in its listed jurisdictions or on the media satisfying the conditions prescribed by the CSRC, the official website of the Company and the website of Insurance Association of China. For the disclosure by way of periodic reports, the Company constantly enhanced the quality of information disclosure with its focus primarily on investor concerns, and delivered corporate value to the market and investors in an approachable, simple and clear, and graphically illustrated manner. The Company also regularly organized training courses and promotion activities relating to the relevant rules of information disclosure and corporate governance. It properly arranged information disclosure on the basis that the differences between the laws and regulations of its listed jurisdictions in the PRC and overseas, and the differences between the regulatory requirements of its listed jurisdictions and the insurance industry, are well defined. The Company strictly managed its inside information and carried out the registration and filing procedures on persons who have knowledge of inside information in compliance with law, strengthened the confidentiality of inside information, and safeguarded the legitimate rights and interests of investors, with a view to maintaining the fairness, impartiality and openness of information disclosure of the Company. In 2021, the Company was awarded Grade A in the assessment by the SSE of information disclosure of listed companies for the year of 2020-2021.
The Company took active actions to respond to any uncertainties brought by the social, economic and financial environments both internationally and domestically, and developed investor relations in a proactive way with its stringent attitude and innovative thinking. It kept abreast with the development pace of technology era and consistently made innovation in its communications with and services to investors, which constantly enhanced the efficiency of communication between the Company and capital market, and mitigated the negative impacts brought by the pandemic. The works conducted by the Company for investor relations mainly included holding general meetings and results briefings, embarking on global non-deal roadshows, holding online and offline conferences with investors and analysts, attending investors’ meetings, frequently updating information on its investor relations website, and timely responding to enquiries from investors and analysts. In 2021, the Company communicated with more than 5,200 investors and analysts, including more than 2,600 investors who attended results briefings online and offline. The Company held over 170 online and offline meetings with approximately 1,500 investors and analysts for the year, and communicated with more than 1,100 institutional investors by attending a total of 46 investors’ meetings held locally or internationally. It also communicated with more than 90 investors in non-deal roadshows for annual and interim results. In addition, the Company focused on the protection of medium and small investors, actively responded to any enquiries from them, kept in close contact with investors by various means such as email, phone and internet, and recorded a click-through rate of 35,000 person-times for the live video streaming of results briefings. The Company reviews its policy for communication with shareholders once a year and considers that such policy remains effective based on the feedbacks received from investors and the capital market on investor relations.
In 2021, the Company won various awards, including the “Precedent for the Best Practices of the Office of the Board of Directors of Listed Company for 2021” by the China Association for Public Companies, the “Best Investor Activity” by the Investor Relations Magazine, the “Most Progress in Investor Relations Award” by Hong Kong Investor Relations Association, the “Interaction of Medium and Small Investor Relations Award” and the “Institutional Friendly Communication Award” by www.p5W.net, and the “Best Communication with the Capital Market Award” and the “Best Digital Investor Relations Award” in the 5th Excellent IR in China. With the outstanding achievements of its practice in investor relations management, the Company was among the first batch of companies to have been selected for inclusion of its investor relations precedents into the case study collection of the SSE for investor relations management.
106
CHANGES OF THE ARTICLES OF ASSOCIATION
In accordance with the relevant requirements of the Company Law, the “Reply of the State Council on the Adjustment of the Notice Period for General Meeting and Other Matters Applicable to the Overseas Listed Companies” (Guo Han [2019] No. 97), and the “Measures for the Administration of Connected Transactions of Insurance Companies” (Yin Bao Jian Fa [2019] No. 35)20 and the “Guiding Opinions on Banking and Insurance Institutions Strengthening the Building of Working Systems and Mechanisms for Protection of Consumer Rights and Interests” (Yin Bao Jian Fa [2019] No. 38) issued by the CBIRC, the amendments to the Articles of Association were put to vote and adopted by way of special resolution at the First Extraordinary General Meeting 2021 held on 16 December 2021. The major amendments to the Articles of Association mainly include: 1. revising the notice period for general meeting, removing the requirements for shareholders who intend to attend a general meeting to give written reply to the Company and for minimum percentage of voting rights and relevant procedures for convening general meetings, and optimizing the provisions with respect to the change of registration by the holders of H shares prior to the date of a general meeting in accordance with Article 102 of the Company Law and the relevant requirements of the “Reply of the State Council on the Adjustment of the Notice Period for General Meeting and Other Matters Applicable to the Overseas Listed Companies” (Guo Han [2019] No. 97); and 2. revising the provisions of the Articles of Association with respect to the specialized committees of the Board, establishing a new Connected Transactions Control Committee under the Board of Directors of the Company, and adding the new provisions with respect to the com position of the Connected Transactions Control Committee; as well as changing the name of the Risk Management Committee under the Board of the Company to the Risk Management and Consumer Rights Protection Committee, in accordance with the relevant requirements of the “Measures for the Administration of Connected Transactions of Insurance Companies” (Yin Bao Jian Fa [2019] No. 35) and the “Guiding Opinions on Banking and Insurance Institutions Strengthening the Building of Working Systems and Mechanisms for Protection of Consumer Rights and Interests” (Yin Bao Jian Fa [2019] No. 38).
The amendments to the Articles of Association as described above shall come into effect after the approval from the CBIRC.
INTERNAL CONTROL AND RISK MANAGEMENT
The Company has consistently proceeded with tasks in compliance with the regulatory requirements of relevant regulatory authorities, such as the SSE, the HKSE, the U.S. Securities and Exchange Commission (the “SEC”) and the New York Stock Exchange, with respect to corporate internal control.
Internal Control
The Company has been devoting significant effort towards the promotion of internal control and the establishment of internal control related systems. In accordance with the requirements of Section 404 of the “U.S. Sarbanes-Oxley Act”, the “Standard Regulations on Corporate Internal Control”, the “Implementation Guidelines for Corporate Internal Control”, the “Guidance on Internal Control for Companies Listed on the Shanghai Stock Exchange”, the “Rules Governing the Listing of Securities on The Stock Exchange of Hong Kong Limited”, and the “Basic Standards of Internal Control for Insurance Companies” issued by the CBIRC, the Company has carried out a lot of work on its internal control system establishment, rules implementation and risk management by strictly following its corporate governance structure. The Company has also formulated and issued the “Internal Control Implementation Manual of China Life Insurance Company Limited (2021 Edition)” to strengthen the implementation of internal control standards and internal control assessments, and actively promoted the culture and philosophy of internal control, thereby continuously enhancing the internal control of the Company.
| 20 | The “Measures for the Administration of Connected Transactions of Insurance Companies” (Yin Bao Jian Fa [2019] No. 35) was abolished on 1 March 2022, and the “Measures for the Administration of Connected Transactions of Banking and Insurance Institutions” (Order of the China Banking and Insurance Regulatory Commission [2022] No. 1) was implemented. The relevant amendments to the Articles of Assocation are in line with the requirements of the two aforesaid regulatory provisions. |
107
Pursuant to the requirements of the “Notice on the Proper Preparation for Disclosure of 2021 Annual Reports of Companies Listed on the Main Board” and the “Business Guide for the Periodic Reports of Listed Companies” promulgated by the SSE, the Company shall release an Internal Control Self-assessment Report simultaneously with the publication of its 2021 annual report. Meanwhile, the Company, as an overseas private issuer, was required to provide a specific assessment report on its internal control system relating to financial reporting for the year ended 31 December 2021 in its Form 20-F (U.S. Annual Report) to be submitted to the SEC in accordance with Section 404 of the U.S. Sarbanes-Oxley Act. In accordance with the requirements of laws and regulations relating to internal control of the jurisdictions where the Company is listed, the Company has completed internal control self- assessments in relation to the requirements of Section 404 of the U.S. Sarbanes-Oxley Act and the SSE for the year ended 31 December 2021. Such assessments are conducted on an annual basis and in two stages, namely, interim assessment and supplementary test. The Company has confirmed after the assessments that its internal controls were effective. The Company has also received from its independent auditors an unqualified opinion on the effectiveness of its internal control in relation to financial reporting as at 31 December 2021. The Company’s assessment report and the report of its independent auditors will be included as an attachment to its annual report submitted to the SSE and its Form 20-F to be submitted to the SEC.
It is the responsibility of the Board of the Company to establish and effectively implement well-established internal control systems, assess their effectiveness and disclose the report on the internal control assessment. The Board and the Audit Committee are responsible for leading the implementation of internal control measures of the Company, and the Board of Supervisors supervises the internal control assessments performed by the Board. The Company has established the Risk Management Department in its headquarters and branches. The Company also conducts tests on the management level, assesses the effectiveness of the established and implemented internal control systems in accordance with the regulatory requirements of the jurisdictions where the Company is listed, and reports to the Board, the Audit Committee and the management.
In compliance with regulatory requirements and having considered the characteristics of its business and management requirements, the Company has established and implemented a series of internal control measures and procedures with respect to currency and funds, insurance operations, external investments, physical assets, information technology, financial reporting and information disclosure to ensure the safety and integrity of its assets. By strictly complying with relevant PRC laws and regulations as well as the internal rules and regulations of the Company, the quality of accounting information has been improved.
A relatively well-developed internal control system has been established in terms of team-building, sales and operations, and system management for the sales channels, such as individual insurance, bancassurance, group insurance and health insurance. This internal control system regulates the relevant authorizations and operational workflows, and effectively adopts the measures to prevent and manage risks relating to the operation of exclusive agents. The Company has promulgated clear regulations for the workflows and authorizations relating to the verification of insurance policies, insurance claims and insurance preservation. The Company has also formulated business operation standards and service quality standards, developed systems of business, document and file management, and further regulated the management of business approval authority to strengthen its control over business risk and improve the quality of its services.
In accordance with relevant laws and regulations such as the “Accounting Law of the People’s Republic of China” and the “Enterprise Accounting Standards” and taking into account the needs of the Company for its business development, operation and management, the Company has formulated and issued the “Accounting System of China Life Insurance Company Limited” and the “Accounting Practices of China Life Insurance Company Limited”. The accounting units of the Company at all levels have implemented them in strict compliance with the requirements of the accounting system and various basic systems to regulate works relating to financial accounting and preparation of financial reports. The accounting units of the Company at all levels have assigned positions in a reasonable manner, clearly defined duties and responsibilities of such positions and their scope of authority on management, and strictly prohibited employees from serving incompatible positions concurrently, thus exercising the control over financial risks in an efficient manner.
108
The Company has formulated the “ Measures for the Administration of the Accountability System for Major Errors in Periodic Report Disclosures of China Life Insurance Company Limited”, which set forth provisions governing the basic responsibilities of periodic report disclosures, the major errors in periodic report disclosures and the responsibility attribution. As at 31 December 2021, there has been no major error in periodic report disclosures of the Company. In order to cope with the latest regulatory requirements, enhance the confidentiality of its inside information, and register and submit information concerning persons who have knowledge of inside information, the Company, after taking into account the regulatory requirements, has revised during the Reporting Period the “Measures for the Administration of Registration of Persons Who Have Knowledge of Inside Information of China Life Insurance Company Limited”. For the purpose of strengthening the its emergency management for the information disclosure of emergencies, the Company has, after taking into account the regulatory requirements, revised the “Measures for the Emergency Management for the Information Disclosure of Emergencies of China Life Insurance Company Limited” during the Reporting Period and, after taking into account the regulatory requirements, revised the “Rules for the Administration of Information Disclosure of China Life Insurance Company Limited” and the “System of Internal Reporting of Material Information of China Life Insurance Company Limited” in 2018. In particular, the internal report on material information has been included in the indicator system under the internal control report of the Company. Persons responsible for reporting material information obtain and identify potential material information at the level of operation and management by making use of various information technologies, and submit and report such information to the President and the Board of the Company as earlier as possible. The Board then makes the final decision on whether to release the material information, and discloses the same to such extent as it considers reasonable and practicable.
The Company has established a well-developed system relating to investment decisions in accordance with the relevant laws and regulations and based on the actual situation of investment management. The system defines the approval and decision-making authority, authorization mechanism and specific decision-making procedures for investment management. All major investment decisions shall be approved and implemented in strict compliance with the internal decision-making process of the Company and the requirements of its investment management system. The Investment Decisions Committee is a permanent body of the Company for investment decisions, which is responsible for reviewing major investments and providing support to any investment decisions made by the management.
The Company has established acomprehensive information technology system to cover all aspects of IT work and formed a closed-loop control mechanism focusing on centralized review and publication, periodic inspection and continuous improvement. By conducting measures such as the inspection and evaluation of system implementation on a regular basis, the Company has facilitated the effective implementation of the system and enhanced the standardization and normalization of various IT work. Further, the Company has constantly promoted the construction of the systems of information safety and risk control, and formulated and implemented a series of effective information safety control measures at various stages of the life cycle of the IT system, thereby effectively ensuring the safe and steady operation of the Company. In 2021, the Company conducted several internal and external risk assessments to promote construction by inspection, with a view to consistently enhancing its capability of managing information safety risks.
109
The Risk Management Department, the Audit Department and the Legal and Compliance Department of the Company are responsible for the supervision and inspection of its internal control measures. The Company identifies issues in the areas of system design, control implementation and risk management in a timely manner through the adoption of various measures such as walk-through test, control test and risk analysis. It also eliminates loopholes, guards against risks and reduces losses by adopting various measures to improve systems, enhance legal compliance and pursue responsible persons. In 2021, the Company actively adapted to the stringent regulatory environment in the PRC and overseas financial industry and strictly complied with the regulatory requirements to constantly improve the organizational structure of internal audit and further strengthen the mechanism for internal audit management, which effectively performed the supervisory role of audit. The Company carried out the economic responsibility audit on managers at all levels, performed a series of special audits closely related to the Company’s reform for development, and conducted a variety of regular audits on anti-money laundering, connected transactions, assets and liabilities management, solvency system construction, internal control over the application of insurance funds, protection of customer s’ rights and interests, compliance of intermediary business, and insurance fraud management pursuant to regulatory requirements. Meanwhile, the Company has put more efforts on the application of audit results, and played a proactive role to supervise and direct the implementation of rectification measures for any issues identified in audit, facilitating the standardized management and compliance operation of the Company. The Company has formulated regulations with respect to the reporting, investigation, handling of and responsibility attribution for cases involving any violations of laws and regulations by employees, each being implemented by the Legal and Compliance Department , which ensures that cases involving any violations of laws and regulations by employees are handled in a timely manner, and the persons involved will be attributed to proper responsibility. The Legal and Compliance Department reports the criminal cases involving practitioners and manages the responsibility attribution of such cases in accordance with regulations such as the “Measures for the Administration of Criminal Cases Involving Banking and Insurance Institutions (for Trial Implementation)” issued by the CBIRC and internal policies such as the “Measures for the Administration of Criminal Cases (for Trial Implementation)” and the “Implementing Rules for Responsibility Attribution of Cases”. The Company has constantly optimized three lines of defense for compliance management to establish an efficient compliance management system, with a view to identifying, guarding against and mitigating material compliance risks. The Company has also fostered the concept of compliance creating value, and promoted a good interaction between the compliance management functional department of the Company and external regulators, for the purpose of enhancing the overall compliance management standard of the Company and ensuring the achievement of its goal of high-quality development.
Risk Management
Risk Management System
The Company has established an organizational system for comprehensive risk management with the ultimate responsibility assumed by the Board, under the direct leadership of the management, having reliance on the risk management departments and with the close cooperation among the relevant functional departments, and developed a 5-tier organizational structure for risk management covering the corporate governance level, the headquarters level, the provincial branches level, the local or city branches level, and the county sub-branches level. With the reliance on the 5-tier risk management and control structure, the Company has put in place three lines of defense that focus on risk management: the first line of defense consists of branches and sub- branches at all levels and various functional departments that identify, assess, address, monitor and report risks at the front end of business; the second line of defense is composed of the Risk Management and Consumer Rights Protection Committee of the Board, as well as the Risk Management Committee and the Risk Management Department of the Company that take lead in formulating the system, standard and limit for a variety of risks and make recommendations to address such risks; the third line of defense comprises the Audit Committee of the Board, as well as the internal audit department, the Office of the Discipline Inspection Committee and other departments of the Company that supervise the risk management workflows established by the Company and the procedures and actions for control of various risks. The three lines of defense have been coordinated with each other in a proactive manner to organize and commence any work in relation to risk management. By establishing the organizational structure of risk control, the Company has gradually established acriss- cross network of risk control system, with the risk management departments at all levels as leading bodies, the relevant functional departments as main bodies, the vertical decision-making control system and horizontal interactive collaboration mechanism as supporting systems and the comprehensive risk management as focus, thus laying a strong foundation for the Company to achieve a comprehensive risk management system with full coverage, all-employee participation and effective workflows.
110
Work in relation to Risk Management
Pursuant to the requirements of the CBIRC on the China Risk Oriented Solvency System (C-ROSS), the Company pushed forward the establishment of a solvency risk management system, and built a “1+7+N” comprehensive risk management system with the “Comprehensive Risk Management Rules” as the general principles, seven types of risks (including insurance risk, market risk, credit risk, operational risk, strategic risk, reputational risk and liquidity risk) as the key focuses, and having reliance on a series of implementing rules for business such as the “Measures for the Administration of Risk Preference System”. The Company actively implemented key risk monitoring and risk pre-warning classification management, and consistently reinforced the mechanism for formation, transmission and application of the risk preference system, which created a system for the normal management of risk preference with the statement on risk preference as the carrier, and the risk tolerance and limit indicators as the focus. Through the combination of risk preference with various lines of operation and management, the Company maintained a good interaction between risk management and business development. The Company conducts a self-assessment on solvency risk management capability every year so as to assess all work in relation to risk management in two dimensions: the soundness of the system and the effectiveness of its implementation. The Company took specific rectification measures against its own shortcomings and weaknesses, which helped enhanced its risk management standard in all aspects.
The Company followed the requirements under anti-money laundering laws and regulations, kept on improving the system for money-laundering risk management and performed the anti-money laundering obligations under the law, with a view to enhancing both the quality and efficiency of its anti-money laundering work. Meanwhile, pursuant to external regulatory requirements, the Company conducted special governance on illegal fund-raising activities and carried out the self-inspection and rectification in key risk areas, which effectively improved the Company’s precaution capability in key risk areas.
In 2021, the Company vigorously promoted the informatization of risk management, actively applied the latest advanced technologies such as big data and artificial intelligence, and further optimized and upgraded the intelligent application of anti-money laundering in greath depth, thus making significant breakthroughs in the intelligent identification of illegal fund-raising risks, monitoring of sale risk pre-warning, and risk management data mart. The informatization and intellectualization of risk management improved significantly, and the risk management capability of the Company reached a new level, which provided a strong support to the high-quality development of the Company.
Risk Identification and Control
The major risks of the Company in the course of operation and management include insurance risk, market risk, credit risk, operational risk, strategic risk, reputational risk, liquidity risk, information safety risk and ESG risk.
Insurance Risk
Insurance risk refers to the risk that exposes insurance companies to unexpected losses due to the adverse deviation of the actual situation from the projections of assumptions such as loss ratio, expense rate and lapse rate.
The Company assessed and monitored insurance risks through sensitivity analysis and other actuarial appraisal techniques, with a focus on the impact of mortality rate, morbidity rate, lapse rate and other relevantassum ptions on the Company’s operating results. The Company managed insurance risks through the following mechanisms and processes: (1) establishing an organizational structure and a system for insurance risk management, so that insurance risk management can be performed within a scientific, comprehensive and effective management system; (2) devising a system for risk limit indicators and carrying out normal monitoring analysis, so as to contain risks within a controllable range; (3) implementing an effective product development and management system to strictly control product pricing risks, and strengthening empirical analysis to offer support to pricing assumptions and assessing assumptions, in order to prevent and control insurance risks from the front end of products; (4) effectively guarding against adverse selection risks and insurance frauds through the establishment and implementation of a well-developed system for verification of insurance policies and claims, as well as the practical operation regulations; and (5) transferring and mitigating insurance risk through a scientific and reasonable reinsurance arrangement. In 2021, the Company managed insurance risks in a regulated and orderly manner, with sufficient and reasonable provisions of minimum capital for insurance risks. The Company will continuously keep a watch on the development trend of insurance risks and further enhance its capability of managing insurance risks.
111
Market Risk
Market risk refers to the risk that exposes the Company to unexpected losses due to adverse movement in (amongst others) interest rate, equity prices, real estate prices and exchange rate.
In order to address the market risks, the Company continued to pay attention to the risk exposures of interest rate, equity prices, real estate prices and exchange rate, monitored value at risk/mark to market (VaR/MTM), yield volatility, duration and other key market risk indicators on a regular basis, set up a 2-tier risk limit indicator and corresponding threshold values, carried out sensitivity analysis and stress test to measure the risk losses to the Company under stress scenarios, gave pre-warning of market risks and formulated contingency plans for emergencies. Currently, the proportion of each investment asset is in line with the requirements of the CBIRC and the internal management provisions of the Company. According to the results of the risk indicator monitoring and stress test, the market risk of the Company was within a normal controllable range. The Company primarily adopted the following risk control measures in 2021: (1) stepping up efforts on the study of macro economy, currency and financial policies to assess domestic and international economic and market trends in a timely manner; (2) reviewing the risks of major assets and the characteristics of their returns on a regular basis, so as to constantly optimize the model of assets allocation; (3) carrying out the effective management of open market equity exposure and making reasonable allocations; (4) increasing investment in interest rate bonds with long duration when appropriate opportunities arose, with a view to extending the duration of assets and narrowing the gap arising from the duration mismatch of assets and liabilities; and (5) facilitating the establishment of systems to improve risk monitoring and pre-warning functions and simultaneously increasing the frequency and scope of emergency exercises to acquire more experience in emergency response.
Credit Risk
Credit risk refers to the risk that exposes the Company to unexpected losses due to non-performance or delay in the performance of contractual obligations by counterparties, or adverse changes in their credit standings.
The credit risks that the Company is exposed to mainly relate to investment deposits, bond investments, nonstandard financial product investments and reinsurance arrangements, etc.
Credit Risk of Investment Business
To address the credit risks of investment business, the Company developed and continuously improved the organizational structure of credit risk management, and constantly optimized the process for credit risk management. Meanwhile, the Company established and made amendments to the management system and strengthened the implementation of such system pursuant to the regulatory requirements and management practices; strengthened the research on risks and kept on improving risk analysis, assessment, monitoring, pre-warning and emergency response standard. By relying on information technology, the Company consistently enhanced the standard of quantitative analysis on credit risks and diversified the methods used for risk management and control. The Company primarily adopted the following measures in 2021: (1) further improving the centralized credit rating process and system functions to enhance the credit risk management standard; (2) optimizing the credit risk limit management system in multiple dimensions to improve the mechanism for prevention of credit risks prior to investment; (3) strengthening the monitoring of credit risk indicators for the purposes of indicating risk exposure and any change of risk distribution in an effective manner and closely tracking down negative information; and (4) deepening efforts on the research of key industries and the credit risk outlook to enhance the capability of the Company in risk management and control during and after investment.
112
Reinsurance Credit Risk
Reinsurance credit risk refers to the credit risk that may possibly be faced by the Company in connection with the obligations to be undertaken by reinsurers due to their failure to perform reinsurance contracts. To address the reinsurance credit risks, the Company adopted the following measures: (1) properly setting self-retained risk limits through an effective reinsurance management system, and using reinsurance as an effective tool to transfer risks to reinsurers with a high level of solvency; (2) reviewing the relevant information of a reinsurer in the reinsurance registration system in strict compliance with the regulatory requirements prior to the execution of a reinsurance contract to ensure that the reinsurer in cooperation with the Company satisfies with the regulatory requirements; and (3) conducting credit assessment on reinsurers through internal rating to select reinsurers that have higher credit standing to mitigate credit risks.
Operational Risk
Operational risk refers to the risk of direct or indirect losses arising from incomplete internal operational processes, personnel, systems or external events.
The Company consistently implemented regulatory requirements and its operational risk management strategies, optimized the operational risk management system, and regulated the operational risk management processes, so as to enhance the effectiveness of operational risk management policies, systems and process management on an ongoing basis. The Company established an operational risk management system that combines three management tools, namely self-assessment of operational risk and its control, loss data room for operational risks and key risk indicators monitoring, and further reinforced the operational risk management at all levels of branches, so as to facilitate the vertical expansion of operational risk management network and achieve the integration of operational risk management and control with its business development. In the meanwhile, the Company reported operational risk governance to the senior management on a quarterly basis. The operational risk control measures adopted by the Company mainly included the following: (1) carrying out the classification management for operational risk and developing an operational risk management process compatible with the nature, scale and risk characteristics of the Company’s business, including the identification, assessment, control, monitoring and reporting mechanisms; (2) establishing a loss data room for operational risks to carry out the loss data collection and analysis of operational risks on a regular basis; (3) establishing a key indicator room for operational risks to organize regular monitoring of any risks that may cause losses and to take relevant control measures against them; (4) conducting self-assessments on the operational risk management and effect on a regular basis and identifying any issues in the management and control of operational risks, with a view to constantly increasing the capability of the Company in operational risk management; and (5) promoting a culture of operational risk management by organizing and conducting training courses on operational risk management. In 2021, the operational risk management was satisfactory, and losses from operational risks were controllable. With the continual improvement of the operational risk control system, the management foundation of the Company was strengthened consistently and the quality and efficiency of risk management were further enhanced.
Strategic Risk
Strategic risk refers to the risk of mismatch between strategies, market conditions and capabilities of the Company arising from ineffective formulation or implementation of strategies or changes in operational environment.
The Company set up a relatively well-developed system for strategic risk management, and established an organizational system for strategic risk management with the ultimate responsibility assumed by the Board, under the direct leadership of the management and with the division of labour and collaboration among the relevant functional departments. By taking into full account various factors such as market conditions, risk preference and capital position, the Company made planning for its medium- and long-term development and put the same into practice in annual business plans and work plans, so as to strengthen the formulation, approval, implementation and evaluation of whole process management of strategic and development planning. The Company also created an indicator system for the daily monitoring of strategic risks to monitor and analyze strategic risks on a regular basis, which ensured an effective execution of the Company’s strategic risk management. In 2021, the soundness of the Company’s strategic risk management system and the effectiveness of its implementation were maintained.
113
Reputational Risk
Reputational risk refers to the risk of negative comments on the Company from stakeholders, the public and the media as a result of the behaviours of the Company’s divisions at all levels, practitioners or external events, thereby causing losses, damaging brand value, being detrimental to the normal operation of the Company, and even affecting market and social stability. Reputational risk may exist in any aspect of the Company’s operation and management. The Company highly values its reputation and has incorporated reputational risk management into the corporate governance and comprehensive risk management systems to prevent reputational risk.
In 2021, the Company constantly made improvements to its system for reputational risk management to optimize relevant working mechanism and further enhance the standard of reputational risk management. For the improvement of system establishment, a sound mechanism for the evaluation and responsibility attribution of reputional risk was established to consolidate the main management responsibilities, strengthen the governance of reputational risk sources, and mitigate hidden reputational risk in an active and effective manner. The Company constantly proceeded with all tasks throughout the process, such as the identification, evaluation and disposal of reputational risk, so as to properly address any reputational risk incdients and effectively protect brand reputation. The Company also continued to offer training courses and exercises on reputational risk management to raise the risk awareness of all employees, which helped cultivate a culture of reputational risk management.
Liquidity Risk
Liquidity risk refers to the risk that the Company does not have access to sufficient funds in time or at reasonable costs to meet its liabilities or other payment obligations as they become due.
The Company established a system for liquidity risk management to define the organizational structure and responsibilities of liquidity risk management. Further, the Company developed the processes covering the identification, evaluation, monitoring, response and disposal, reporting, and rectification of liquidity risk, and organized regular emergency exercises on liquidity risks. Overall, the liquidity risk of the Company was insignificant. The Company will constantly step up its effort on liquidity risk management pursuant to the regulatory requirements and its own regulations to ensure the performance of its obligation to give insurance benefits as scheduled.
Information Safety Risk
Information safety risk refers to the operational, legal and reputational risks caused by natural factors, human factors, technological loopholes or management defects in the process of applying information technology in the Company.
The Company attached great importance to information safety risk management. Firstly, the Company set up organizations to offer protection for information safety. It established the information safety functional departments at the headquarters and provincial levels for performing the duty of information safety management at each level. Secondly, the Company developed various systems and strictly implemented such systems to ensure the standardization of information management. Thirdly, the Company optimized the safety management requirements for the full life cycle of its IT system. By conducting safety tests and quality checks on the IT system before and after it was put online, the Company consistently enhanced the safety of such system. The Company also formulated contingency plans for regular exercises to enhance its emergency response capability to address cyber attacks or safety accidents. Through the application of new c u t t i n g- edge technologies such as cloud computing and big data in all aspects, the Company built a security situational awareness platform and developed an automatic joint control mechanism focusing on joint prevention and coordination of risks for the entire network with the help from the enterprise general control center, thus achieving the centralized analysis and coordinated disposal of various safety risks. In addition, the Company constantly stepped up efforts on education for the safety awareness of employees to foster a corporate culture of “everyone places emphasis on safety”, and conducted several assessments on internal and external risks, which further enhanced the capability of the Company in information safety risk management. In 2021, there was no circumstance where the Company’s operation was affected due to the breakdown of computers or security breach.
114
In 2021, the Company paid great attention and actively implemented the Data Security Law of the PRC for the purpose of protecting the legitimate rights and interests of customers. It optimized its data governance structure, refined the responsibilities of divisions at all levels for data management, and improved the related data management regulations. The Company assessed the sophistication of data management capability against the national benchmarks, defined the targets to be protected for data security and the key areas for protection, achieved the classified security protection for the full life cycle such as the collection, transmission and storage of data, established a 3-dimensional data security protection system based on classified protection, and consistently strengthened the management and control of data security, in order to ensure that the data was manageable and controllable.
ESG Risk
The Company assesses ESG material issues once a year in view of the external economic, social and macro environment as well as its own development strategy, discusses and determines the risks and opportunities faced by it in relation to ESG, and regards the management and escalation of key issues as its priority of work in ESG for the year. The Board of the Company reviews and confirms the assessment results, taking into consideration the key issues as part of its formulation of an overall strategy, and exercising its supervisory function with respect to the management of such issues and their performance. In 2021, the Company established an ESG risk management system, through which five ESG risks were identified as follows: information safety risk, climate change risk, corruption risk, human resources and customer relationship management risk, and talent attraction and retention risk. The Company has devised the management strategy against the above risks in order to keep track with the risk development trend in a timely manner.
For analysis on the insurance risk, market risk, credit risk and liquidity risk of the Company, please refer to the “Risk Management” section in the Notes to the Consolidated Financial Statements of this annual report.
It should be stated that the risk management and internal control of the Company are designed with the objectives to reasonably ensure the legal compliance of business operation and management, safety of assets, truthfulness and completeness of financial reports and relevant information, improvement of operating efficiency and effectiveness, and accomplishment of development strategy. Given the inherent limitations on risk management and internal control, the Company can only provide reasonable assurance with respect to the accomplishment of the above objectives.
115
OTHER INFORMATION
BASIC INFORMATION OF THE COMPANY
| Registered Name in Chinese |  | |
| Registered Name in English | China Life Insurance Company Limited (“China Life”) | |
| Legal Representative | Yuan Changqing (assuming the roles and duties of the Chairman of the Board and the legal representative of the Company) | |
| Registered Office Address/ Current Office Address | 16 Financial Street, Xicheng District, Beijing, P.R. China | |
| Postal Code | 100033 | |
| Telephone | 86-10-63633333 | |
| Investor Relations Hotline | 86-10-63631329 | |
| Customer Service Hotline | 95519 | |
| Fax | 86-10-66575722 | |
| Website | www.e-chinalife.com | |
| ir@e-chinalife.com | ||
| Hong Kong Office Address | 16/F, Tower A, China Life Centre, One Harbour Gate, 18 Hung Luen Road, Hung Hom, Kowloon, Hong Kong | |
| Telephone | 852-29192628 | |
116
CONTACT INFORMATION
| Board Secretary | Securities Representative | |||
| Name | Li Mingguang | Li Yinghui | ||
| Office Address | 16 Financial Street, Xicheng District, Beijing, P.R. China | 16 Financial Street, Xicheng District, Beijing, P.R. China | ||
| Telephone | 86-10-63631329 | 86-10-63631191 | ||
| Fax | 86-10-66575112 | 86-10-66575112 | ||
| ir@e-chinalife.com | liyh@e-chinalife.com | |||
| * | Ms. Li Yinghui, Securities Representative of the Company, is also the main contact person of the external Company Secretary engaged by the Company |
INFORMATION DISCLOSURE AND PLACE FOR OBTAINING THE REPORT
| Media and Websites for the Company’s A Share Disclosure | China Securities Journal (www.cs.com.cn) Securities Times (www.stcn.com) Securities Daily (www.zqrb.cn) | |
| CSRC’s Designated Website for the Company’s Annual Report Disclosure | www.sse.com.cn | |
| The Company’s H Share Disclosure Websites | HKExnews website of Hong Kong Exchanges and Clearing Limited at www.hkexnews.hk The Company’s website at www.e-chinalife.com | |
| The Company’s Annual Report may be obtained at | 12/F, Tower A, China Life Plaza, 16 Financial Street, Xicheng District, Beijing, P.R. China | |
STOCK INFORMATION
| Stock Type | Exchanges on which the Stocks are Listed | Stock Short Name | Stock Code | |||
| A Share | Shanghai Stock Exchange | China Life | 601628 | |||
| H Share | The Stock Exchange of Hong Kong Limited | China Life | 2628 | |||
| ADR | New York Stock Exchange | – | LFC | |||
117
OTHER RELEVANT INFORMATION
| ||||
| H Share Registrar and Transfer Office | Computershare Hong Kong Investors Services Limited | Address: Shops 1712-1716, 17th Floor, Hopewell Centre, 183 Queen’s Road East, Wanchai, Hong Kong | ||
| Depositary of ADR | Deutsche Bank | Address: 60 Wall Street, New York, NY 10005 | ||
| Domestic Legal Adviser | King & Wood Mallesons | |||
| International Legal Advisers | Latham & Watkins LLP | Debevoise & Plimpton LLP | ||
| Domestic Auditor | International Auditor | |||
| PricewaterhouseCoopers Zhong Tian LLP | PricewaterhouseCoopers | |||
| Auditors of the Company | Address: 11/F, PricewaterhouseCoopers Center, 2 Link Suqare, 202 Hubin Road, Huangpu District, Shanghai, PRC | Address: 22/F, Prince’s Building, Central, Hong Kong | ||
Name of the Signing Auditors: Zhou Xing, Tu Yi | Name of the Certified Auditor: Yip Siu Foon, Linda | |||
118
INDEX OF INFORMATION DISCLOSURE ANNOUNCEMENTS
Serial | Items | Date of disclosure | ||
| 1 | Announcement on the Progress of Connected Transaction in relation to the Formation of the Partnership | 2021/1/5 | ||
| 2 | Announcement of Premium Income | 2021/1/13 | ||
| 3 | Announcement – Resignation of Non-executive Director | 2021/1/18 | ||
| 4 | Election of Language and Means of Receipt of Corporate Communication | 2021/1/18 | ||
| 5 | Reply Form | 2021/1/18 | ||
| 6 | Announcement – Forfeiture of Unclaimed Dividends | 2021/2/5 | ||
| 7 | Announcement – Resignation of Non-executive Director | 2021/2/7 | ||
| 8 | Announcement of Premium Income | 2021/2/22 | ||
| 9 | Announcement – Re-election of Employee Representative Supervisors | 2021/2/25 | ||
| 10 | Notice of Board Meeting | 2021/3/11 | ||
| 11 | Announcement of Premium Income | 2021/3/12 | ||
| 12 | Voluntary Announcement – Convening of 2020 Annual Results Briefing | 2021/3/17 | ||
| 13 | Announcement of Results for the Year Ended 31 December 2020 | 2021/3/25 | ||
| 14 | China Life Insurance Company Limited 2020 Environmental, Social and Governance & Social Responsibility Report | 2021/3/25 | ||
| 15 | Summary of Solvency Quarterly Report of Insurance Company (Fourth Quarter of 2020) | 2021/3/25 | ||
| 16 | Announcement – Nomination of Directors | 2021/3/25 | ||
| 17 | Announcement – Nomination of Non-employee Representative Supervisor | 2021/3/25 | ||
| 18 | Overseas Regulatory Announcement – China Life Insurance Company Limited – Announcement on Changes in Accounting Estimates | 2021/3/25 | ||
| 19 | Announcement of Premium Income | 2021/4/13 | ||
| 20 | Notice of Board Meeting | 2021/4/14 | ||
| 21 | Annual Report 2020 | 2021/4/15 | ||
| 22 | Reports of the Board of Directors & the Board of Supervisors for 2020, Financial Report and Profit Distribution Plan for 2020, Remuneration of Directors & Supervisors, Election of Directors, Election of Non-employee Representative Supervisors, Renewal of Liability Insurance for Directors, Supervisors & Senior Management, Continued Donations to China Life Foundation, Duty Report of the Independent Directors for 2020, Report on the Overall Status of Connected Transactions for 2020 & Notice of AGM | 2021/4/15 | ||
| 23 | Notice of Annual General Meeting | 2021/4/15 | ||
| 24 | Form of Proxy of Holders of H Shares for use at the Annual General Meeting of the Company to be held on Wednesday, 30 June 2021 | 2021/4/15 | ||
| 25 | Reply Slip of H Share Shareholders | 2021/4/15 | ||
| 26 | Notification Letter and Change Request Form to Registered Shareholders | 2021/4/15 | ||
| 27 | Notification Letter and Request Form to Non-Registered Shareholders | 2021/4/15 | ||
| 28 | Announcement – Estimated Profit Increase for the First Quarter of 2021 | 2021/4/21 |
119
Serial | Items | Date of disclosure | ||
| 29 | 2021 First Quarter Report | 2021/4/28 | ||
| 30 | Summary of Solvency Quarterly Report of Insurance Company (First Quarter of 2021) | 2021/4/28 | ||
| 31 | Announcement – Proposed Change of Auditors | 2021/4/28 | ||
| 32 | Overseas Regulatory Announcement – China Life Insurance Company Limited – Announcement on Changes in Accounting Estimates | 2021/4/28 | ||
| 33 | Announcement of Premium Income | 2021/5/13 | ||
| 34 | Appointment of Auditors for the Year 2021, General Mandate to Issue H Shares and Supplemental Notice of Annual General Meeting | 2021/5/25 | ||
| 35 | Supplemental Notice of Annual General Meeting | 2021/5/25 | ||
| 36 | Supplemental Form of Proxy of Holders of H Shares for use at the Annual General Meeting of the Company to be held on Wednesday, 30 June 2021 | 2021/5/25 | ||
| 37 | Notification Letter and Change Request Form to Registered Shareholders | 2021/5/25 | ||
| 38 | Notification Letter and Request Form to Non-Registered Shareholders | 2021/5/25 | ||
| 39 | Announcement of Premium Income | 2021/6/15 | ||
| 40 | Announcement – Approval of Qualification of Independent Director by the CBIRC and Resignation of Independent Director | 2021/6/30 | ||
| 41 | Announcement – Resolutions Passed at the Annual General Meeting, Election of Members of the Seventh Session of the Board of Directors and the Board of Supervisors, Change of Auditors and Distribution of Final Dividend | 2021/6/30 | ||
| 42 | Announcement on Qualification of Executive Director | 2021/7/6 | ||
| 43 | Announcement of Premium Income | 2021/7/14 | ||
| 44 | Announcement – Election of Employee Representative Supervisor | 2021/8/2 | ||
| 45 | Announcement of Premium Income | 2021/8/12 | ||
| 46 | Notice of Board Meeting | 2021/8/13 | ||
| 47 | Voluntary Announcement – Convening of 2021 Interim Results Briefing | 2021/8/16 | ||
| 48 | Announcement of Unaudited Interim Results for the Six Months Ended 30 June 2021 | 2021/8/25 | ||
| 49 | Announcement – Proposed Amendments to the Articles of Association | 2021/8/25 | ||
| 50 | Announcement on the Progress of Connected Transaction in relation to a Partnership | 2021/8/25 | ||
| 51 | Summary of Solvency Quarterly Report of Insurance Company (Second Quarter of 2021) | 2021/8/25 | ||
| 52 | Overseas Regulatory Announcement – China Life Insurance Company Limited – Announcement on Changes in Accounting Estimates | 2021/8/25 | ||
| 53 | Announcement of Premium Income | 2021/9/13 | ||
| 54 | 2021 Interim Report | 2021/9/15 |
120
Serial | Items | Date of disclosure | ||
| 55 | Notification Letter and Change Request Form to Registered Shareholders | 2021/9/15 | ||
| 56 | Notification Letter and Request Form to Non-Registered Shareholders | 2021/9/15 | ||
| 57 | Proposed Amendments to the Articles of Association, the Procedural Rules for the Shareholders’ General Meetings and the Procedural Rules for the Board of Directors’ Meetings and Notice of the First Extraordinary General Meeting 2021 | 2021/9/28 | ||
| 58 | Notice of the First Extraordinary General Meeting 2021 | 2021/9/28 | ||
| 59 | Form of Proxy of Holders of H Shares for use at the First Extraordinary General Meeting 2021 of the Company to be held on Thursday, 16 December 2021 | 2021/9/28 | ||
| 60 | Reply Slip of Holders of H Shares | 2021/9/28 | ||
| 61 | Notification Letter and Change Request Form to Registered Shareholders | 2021/9/28 | ||
| 62 | Notification Letter and Request Form to Non-Registered Shareholders | 2021/9/28 | ||
| 63 | Announcement of Premium Income | 2021/10/15 | ||
| 64 | Announcement – Approval of Qualification of Independent Director by the CBIRC and Retirement of Independent Director | 2021/10/18 | ||
| 65 | Notice of Board Meeting | 2021/10/18 | ||
| 66 | Announcement – Approval of Qualification of Supervisors by the CBIRC and Resignation of Supervisor | 2021/10/19 | ||
| 67 | 2021 Third Quarter Report | 2021/10/28 | ||
| 68 | Announcement – Supplementary Information regarding Compensation of Directors, Supervisors and Senior Management Members in 2020 | 2021/10/28 | ||
| 69 | Announcement – Continuing Connected Transactions under the Agreement for Entrusted Investment and Management and Operating Services with respect to Alternative Investments with Insurance Funds | 2021/10/28 | ||
| 70 | Summary of Solvency Quarterly Report of Insurance Company (Third Quarter of 2021) | 2021/10/28 | ||
| 71 | Overseas Regulatory Announcement – China Life Insurance Company Limited - Announcement on Changes in Accounting Estimates | 2021/10/28 | ||
| 72 | Announcement of Premium Income | 2021/11/12 | ||
| 73 | Announcement on the Progress of Connected Transaction in relation to a Partnership | 2021/11/19 | ||
| 74 | Renewal of Continuing Connected Transactions and Supplemental Notice of the First Extraordinary General Meeting 2021 | 2021/11/29 | ||
| 75 | Supplemental Notice of the First Extraordinary General Meeting 2021 | 2021/11/29 | ||
| 76 | Supplemental Form of Proxy of Holders of H Shares for use at the First Extraordinary General Meeting 2021 of the Company to be held on Thursday, 16 December 2021 | 2021/11/29 |
121
Serial | Items | Date of disclosure | ||
| 77 | Notification Letter and Change Request Form to Registered Shareholders | 2021/11/29 | ||
| 78 | Notification Letter and Request Form to Non-Registered Shareholders | 2021/11/29 | ||
| 79 | Announcement of Premium Income | 2021/12/13 | ||
| 80 | Announcement – Resolutions Passed at the First Extraordinary General Meeting 2021 | 2021/12/16 | ||
| 81 | Announcement – Connected Transaction – Formation of Partnership | 2021/12/16 | ||
| 82 | Announcement – Renewal of Continuing Connected Transactions under the Policy Management Agreement | 2021/12/16 | ||
| 83 | Announcement – Connected Transactions – Investment in Partnerships through Equity Investment Plans | 2021/12/16 | ||
| 84 | Announcement – Connected Transactions – Acquisition of Creditor’s Rights on the Trust Loan through Asset-backed Plan | 2021/12/16 | ||
| 85 | Supplemental Announcement – Connected Transactions in relation to the Formation of Partnerships | 2021/12/29 |
122
DEFINITIONS AND MATERIAL RISK ALERT
In this report, unless the context otherwise requires, the following expressions have the following meanings:
| China Life, the Company21 | China Life Insurance Company Limited and its subsidiaries | |
| CLIC | China Life Insurance (Group) Company, the controlling shareholder of the Company | |
| AMC | China Life Asset Management Company Limited, a non—wholly owned subsidiary of the Company | |
| Pension Company | China Life Pension Company Limited, a non-wholly owned subsidiary of the Company | |
| AMP | China Life AMP Asset Management Company Limited, an indirect non-wholly owned subsidiary of the Company | |
| CLWM | China Life Wealth Management Company Limited, an indirect non-wholly owned subsidiary of the Company | |
| CGB | China Guangfa Bank Co., Ltd., an associate of the Company | |
| CLP&C | China Life Property and Casualty Insurance Company Limited, a non-wholly owned subsidiary of CLIC | |
| CLI | China Life Investment Management Company Limited, the former China Life Investment Holding Company Limited, a wholly- owned subsidiary of CLIC | |
| China Life Capital | China Life Capital Investment Company, an indirect wholly-owned subsidiary of CLIC | |
| Ministry of Finance | Ministry of Finance of the People’s Republic of China | |
| CBIRC | China Banking and Insurance Regulatory Commission | |
| CSRC | China Securities Regulatory Commission | |
| HKSE | The Stock Exchange of Hong Kong Limited | |
| SSE | Shanghai Stock Exchange | |
| Company Law | Company Law of the People’s Republic of China | |
| Insurance Law | Insurance Law of the People’s Republic of China | |
| Securities Law | Securities Law of the People’s Republic of China | |
| Articles of Association | Articles of Association of China Life Insurance Company Limited | |
| China or PRC | For the purpose of this report, “China” or “PRC” refers to the People’s Republic of China, excluding the Hong Kong Special Administrative Region, Macau Special Administrative Region and Taiwan region | |
| ESG | Environment, Social and Governance | |
| RMB | Renminbi Yuan | |
Material Risk Alert:
The risks faced by the Company primarily include risks relating to macro trends, insurance risk, market risk, credit risk, operational risk, strategic risk, reputational risk, liquidity risk, information safety risk and ESG risk, etc. The Company has adopted various measures to manage and control different risks effectively. For details, please refer to the “Future Prospect” in the section headed “Management Discussion and Analysis” and the “Internal Control and Risk Management” in the section headed “Corporate Governance” of this report.
| 21 | Except for “the Company” referred to in the Consolidated Financial Statements. |
123
FINANCIAL REPORT
Independent Auditor’s Report

To the Shareholders of China Life Insurance Company Limited
(incorporated in the People’s Republic of China with limited liability)
OPINION
What we have audited
The consolidated financial statements of China Life Insurance Company Limited (the “Company”) and its subsidiaries (the “Group”) which are set out on pages 131 to 252, which comprise:
| • | the consolidated statement of financial position as at 31 December 2021; |
| • | the consolidated statement of comprehensive income for the year then ended; |
| • | the consolidated statement of changes in equity for the year then ended; |
124
Independent Auditor’s Report (continued)
OPINION (continued)
What we have audited (continued)
| • | the consolidated statement of cash flows for the year then ended; and |
| • | the notes to the consolidated financial statements, which include significant accounting policies and other explanatory information. |
Our opinion
In our opinion, the consolidated financial statements give a true and fair view of the consolidated financial position of the Group as at 31 December 2021, and of its consolidated financial performance and its consolidated cash flows for the year then ended in accordance with International Financial Reporting Standards (“IFRSs”) and have been properly prepared in compliance with the disclosure requirements of the Hong Kong Companies Ordinance.
BASIS FOR OPINION
We conducted our audit in accordance with International Standards on Auditing (“ISAs”). Our responsibilities under those standards are further described in the Auditor’s Responsibilities for the Audit of the Consolidated Financial Statements section of our report.
We believe that the audit evidence we have obtained is sufficient and appropriate to provide a basis for our opinion.
Independence
We are independent of the Group in accordance with the International Code of Ethics for Professional Accountants (including International Independence Standards) issued by the International Ethics Standards Board for Accountants (“IESBA Code”), and we have fulfilled our other ethical responsibilities in accordance with the IESBA Code.
KEY AUDIT MATTERS
Key audit matters are those matters that, in our professional judgment, were of most significance in our audit of the consolidated financial statements of the current period. These matters were addressed in the context of our audit of the consolidated financial statements as a whole, and in forming our opinion thereon, and we do not provide a separate opinion on these matters.
Key audit matters identified in our audit are summarised as follows:
| • | Long-term insurance contract liabilities |
| • | Impairment tests for investments in associates and joint ventures |
| • | Fair value of level 3 financial assets |
125
Independent Auditor’s Report (continued)
KEY AUDIT MATTERS (continued)
Key Audit Matter
Long-term insurance contract liabilities
Refer to Notes 2.12 and 15 to the consolidated financial statements.
At 31 December 2021, the Group had long-term insurance contract liabilities with the amount of RMB3,379.60 billion, accounting for 76.73% of the Group’s total liabilities.
The Group uses the discounted cash flow method to estimate the reserve of long-term insurance contracts which includes a reasonable estimate of liability, a risk margin and a residual margin.
We have identified the Group’s long-term insurance contract liabilities as a key audit matter due to:
| • | The complexity of the actuarial models to develop the reserve of long-term insurance contracts; |
| • | Significant judgements involved in the actuarial assumptions related to mortality rates, morbidity rates, lapse rates, discount rates and expenses assumptions. Changes in these assumptions could have significant effects on long-term insurance contract liabilities. |
How our audit addressed the Key Audit Matter
We obtained an understanding, evaluated the design and tested the operating effectiveness of internal controls over the Group’s long-term insurance contract liabilities estimation processes, including controls over management’s review of the actuarial models, the actuarial assumptions, the actuarial methodologies and the data inputs used.
With the assistance of our actuarial experts, we performed the following audit procedures:
| • | Comparing the methodologies, actuarial models and actuarial assumptions used by the Group to recognised actuarial practices; |
| • | Testing the completeness and accuracy of the underlying insurance policy data used in the valuation on a sample basis; |
| • | Assessing the reasonableness of the act uarial assumptions by considering the Group’s rationale for the actuarial judgements applied along with comparison to industry data and historical experience; |
| • | Performing an independent actuarial modelling and recalculation of the long—term insurance contract liabilities on a sample basis and comparing our result to the result from the Group’s actuarial models; |
| • | Performing analytical procedures over the movement of long-term insurance contract liabilities considering the appropriateness of changes in the actuarial assumptions in the reporting period. |
Based on the above procedures, we found that the actuarial models applied and key assumptions adopted to estimate the reserve for long-term insurance contracts were supportable by the evidence we gathered.
126
Independent Auditor’s Report (continued)
KEY AUDIT MATTERS (continued)
Key Audit Matter
Impairment tests for investments in associates and joint ventures
Refer to Notes 3.3 and 9 to the consolidated financial statements.
At 31 December 2021, the Group held investments in associates and joint ventures, with a carrying value of
RMB257.95 billion, accounting for 5.27% of the Group’s total assets.
According to the impairment testing results performed by the Group, no impairment loss was recognised for the year ended 31 December 2021. The Group had accumulatively recognised impairment provision of RMB3.22 billion by the end of 2021 on these investments.
We have identified the impairment tests for investments in associates and joint ventures as a key audit matter due to the significant estimates and judgements involved in management’s assessment including discount rates and expected future cash flows.
How our audit addressed the Key Audit Matter
We obtained an understanding, evaluated the design and tested the operating effectiveness of internal controls over the Group’s impairment tests for these investments, including controls over management’s review of the impairment test methodology and the significant assumptions used in the valuation.
With the assistance of our valuation experts, we performed the following audit procedures:
| • | Evaluating the appropriateness of the Group’s impairment methodology by referring to valuation guidelines and industry practices; |
| • | Comparing the discount rates used by the Group in the impairment tests with the discount rates developed by using the weighted average cost of capital model; |
| • | Testing the completeness and accuracy of the underlying key data used by the Group in the cash flows projections; |
| • | Comparing the significant assumptions used by the Group in the impairment tests to the historical business results of these investments and industry data to assess the reasonableness of the assumptions used. |
Based on the above procedures, we found that the significant estimates and judgements involved in impairment tests for investments in associates and joint ventures were supportable by the evidence we gathered.
127
Independent Auditor’s Report (continued)
KEY AUDIT MATTERS (continued)
Key Audit Matter
Fair value of level 3 financial assets
Refer to Note 4.4 to the consolidated financial statements.
At 31 December 2021, the Group held level 3 financial assets measured at fair value, with a carrying value of RMB349.13 billion, accounting for 7.14% of the Group’s total assets.
These level 3 financial assets primarily include unlisted equity securities and unlisted debt securities, which are accounted for as available-for-sale securities at fair value or securities at fair value through profit or loss. The fair values of these financial assets are measured using valuation techniques based on significant unobservable inputs.
We have identified the fair value of the Group’s level 3 financial assets as a key audit matter due to the significant estimates and judgements involved in the determination of valuation techniques, significant assumptions and significant unobservable inputs.
How our audit addressed the Key Audit Matter
We obtained an understanding, evaluated the design and tested the operating effectiveness of internal controls over the Group’s fair value measurement of level 3 financial assets, including controls over management’s review of the valuation techniques, the significant assumptions and the significant unobservable inputs used in the fair value measurements.
With the assistance of our valuation experts, we performed the following audit procedures:
| • | Evaluating the appropriateness of the Group’s valuation techniques, significant assumptions by referring to industry practices and valuation guidelines; |
| • | Testing the significant unobservable inputs used by the Group in determining the fair values and assessing the reasonableness of these inputs by comparing them to information available from third-party sources or market data; |
| • | Independently developing fair value estimates and comparing them to the Group’s valuation results on a sample basis. |
Based on the above procedures, we found that the significant estimates and judgements involved in determining the fair value of level 3 financial instruments were supportable by the evidence we gathered.
OTHER INFORMATION
The directors of the Company are responsible for the other information. The other information comprises all of the information included in the annual report other than the consolidated financial statements and our auditor’s report thereon.
Our opinion on the consolidated financial statements does not cover the other information and we do not express any form of assurance conclusion thereon.
In connection with our audit of the consolidated financial statements, our responsibility is to read the other information and, in doing so, consider whether the other information is materially inconsistent with the consolidated financial statements or our knowledge obtained in the audit or otherwise appears to be materially misstated.
If, based on the work we have performed, we conclude that there is a material misstatement of this other information, we are required to report that fact. We have nothing to report in this regard.
128
Independent Auditor’s Report (continued)
RESPONSIBILITIES OF DIRECTORS AND THOSE CHARGED WITH GOVERNANCE FOR THE CONSOLIDATED FINANCIAL STATEMENTS
The directors of the Company are responsible for the preparation of the consolidated financial statements that give a true and fair view in accordance with IFRSs and the disclosure requirements of the Hong Kong Companies Ordinance, and for such internal control as the directors determine is necessary to enable the preparation of consolidated financial statements that are free from material misstatement, whether due to fraud or error.
In preparing the consolidated financial statements, the directors are responsible for assessing the Group’s ability to continue as a going concern, disclosing, as applicable, matters related to going concern and using the going concern basis of accounting unless the directors either intend to liquidate the Group or to cease operations, or have no realistic alternative but to do so.
Those charged with governance are responsible for overseeing the Group’s financial reporting process.
AUDITOR’S RESPONSIBILITIES FOR THE AUDIT OF THE CONSOLIDATED FINANCIAL STATEMENTS
Our objectives are to obtain reasonable assurance about whether the consolidated financial statements as a whole are free from material misstatement, whether due to fraud or error, and to issue an auditor’s report that includes our opinion. We report our opinion solely to you, as a body, and for no other purpose. We do not assume responsibility towards or accept liability to any other person for the contents of this report. Reasonable assurance is a high level of assurance, but is not a guarantee that an audit conducted in accordance with ISAs will always detect a material misstatement when it exists. Misstatements can arise from fraud or error and are considered material if, individually or in the aggregate, they could reasonably be expected to influence the economic decisions of users taken on the basis of these consolidated financial statements.
As part of an audit in accordance with ISAs, we exercise professional judgment and maintain professional scepticism throughout the audit. We also:
| • | Identify and assess the risks of material misstatement of the consolidated financial statements, whether due to fraud or error, design and perform audit procedures responsive to those risks, and obtain audit evidence that is sufficient and appropriate to provide a basis for our opinion. The risk of not detecting a material misstatement resulting from fraud is higher than for one resulting from error, as fraud may involve collusion, forgery, intentional omissions, misrepresentations, or the override of internal control. |
| • | Obtain an understanding of internal control relevant to the audit in order to design audit procedures that are appropriate in the circumstances, but not for the purpose of expressing an opinion on the effectiveness of the Group’s internal control. |
| • | Evaluate the appropriateness of accounting policies used and the reasonableness of accounting estimates and related disclosures made by the directors. |
129
Independent Auditor’s Report (continued)
AUDITOR’S RESPONSIBILITIES FOR THE AUDIT OF THE CONSOLIDATED FINANCIAL STATEMENTS (continued)
| • | Conclude on the appropriateness of the directors’ use of the going concern basis of accounting and, based on the audit evidence obtained, whether a material uncertainty exists related to events or conditions that may cast significant doubt on the Group’s ability to continue as a going concern. If we conclude that a material uncertainty exists, we are required to draw attention in our auditor’s report to the related disclosures in the consolidated financial statements or, if such disclosures are inadequate, to modify our opinion. Our conclusions are based on the audit evidence obtained up to the date of our auditor’s report. However, future events or conditions may cause the Group to cease to continue as a going concern. |
| • | Evaluate the overall presentation, structure and content of the consolidated financial statements, including the disclosures, and whether the consolidated financial statements represent the underlying transactions and events in a manner that achieves fair presentation. |
| • | Obtain sufficient appropriate audit evidence regarding the financial information of the entities or business activities within the Group to express an opinion on the consolidated financial statements. We are responsible for the direction, supervision and performance of the group audit. We remain solely responsible for our audit opinion. |
We communicate with those charged with governance regarding, among other matters, the planned scope and timing of the audit and significant audit findings, including any significant deficiencies in internal control that we identify during our audit.
We also provide those charged with governance with a statement that we have complied with relevant ethical requirements regarding independence, and to communicate with them all relationships and other matters that may reasonably be thought to bear on our independence, and where applicable, actions taken to eliminate threats or safeguards applied.
From the matters communicated with those charged with governance, we determine those matters that were of most significance in the audit of the consolidated financial statements of the current period and are therefore the key audit matters. We describe these matters in our auditor’s report unless law or regulation precludes public disclosure about the matter or when, in extremely rare circumstances, we determine that a matter should not be communicated in our report because the adverse consequences of doing so would reasonably be expected to outweigh the public interest benefits of such communication.
The engagement partner on the audit resulting in this independent auditor’s report is Yip Siu Foon, Linda.
PricewaterhouseCoopers
Certified Public Accountants
Hong Kong,
24 March 2022
130
Consolidated Statement of Financial Position
As at 31 December 2021
| Notes | As at 31 December 2021 RMB million | As at 31 December 2020 RMB million | ||||||||||
| (Restated Note 35(f)(ii)) | ||||||||||||
ASSETS | ||||||||||||
Property, plant and equipment | 6 | 54,398 | 52,747 | |||||||||
Right-of-use assets | 7 | 2,518 | 3,076 | |||||||||
Investment properties | 8 | 13,374 | 14,217 | |||||||||
Investments in associates and joint ventures | 9 | 257,953 | 239,584 | |||||||||
Held-to-maturity securities | 10.1 | 1,533,753 | 1,189,369 | |||||||||
Loans | 10.2 | 666,087 | 658,535 | |||||||||
Term deposits | 10.3 | 529,488 | 545,678 | |||||||||
Statutory deposits – restricted | 10.4 | 6,333 | 6,333 | |||||||||
Available-for-sale securities | 10.5 | 1,429,287 | 1,215,603 | |||||||||
Securities at fair value through profit or loss | 10.6 | 206,771 | 161,570 | |||||||||
Securities purchased under agreements to resell | 10.7 | 12,915 | 7,947 | |||||||||
Accrued investment income | 10.8 | 51,097 | 45,200 | |||||||||
Premiums receivable | 12 | 20,361 | 20,730 | |||||||||
Reinsurance assets | 13 | 6,630 | 6,095 | |||||||||
Other assets | 14 | 39,559 | 29,040 | |||||||||
Deferred tax assets | 29 | 121 | 87 | |||||||||
Cash and cash equivalents | 60,440 | 56,655 | ||||||||||
|
|
|
| |||||||||
Total assets | 4,891,085 | 4,252,466 | ||||||||||
|
|
|
| |||||||||
The notes on pages 138 to 252 form an integral part of these consolidated financial statements.
131
Consolidated Statement of Financial Position (continued)
As at 31 December 2021
| Notes | As at 31 December 2021 RMB million | As at 31 December 2020 RMB million | ||||||||||
| (Restated Note 35(f)(ii)) | ||||||||||||
LIABILITIES AND EQUITY | ||||||||||||
Liabilities | ||||||||||||
Insurance contracts | 15 | 3,419,899 | 2,973,225 | |||||||||
Investment contracts | 16 | 313,594 | 288,212 | |||||||||
Policyholder dividends payable | 124,949 | 122,510 | ||||||||||
Interest-bearing loans and borrowings | 17 | 18,686 | 19,556 | |||||||||
Lease liabilities | 2,182 | 2,664 | ||||||||||
Bonds payable | 18 | 34,994 | 34,992 | |||||||||
Financial liabilities at fair value through profit or loss | 3,416 | 3,732 | ||||||||||
Securities sold under agreements to repurchase | 19 | 239,446 | 122,249 | |||||||||
Annuity and other insurance balances payable | 56,818 | 55,031 | ||||||||||
Premiums received in advance | 48,699 | 53,021 | ||||||||||
Other liabilities | 20 | 133,676 | 104,476 | |||||||||
Deferred tax liabilities | 29 | 7,481 | 15,286 | |||||||||
Current income tax liabilities | 248 | 191 | ||||||||||
Statutory insurance fund | 21 | 339 | 384 | |||||||||
|
|
|
| |||||||||
Total liabilities | 4,404,427 | 3,795,529 | ||||||||||
|
|
|
| |||||||||
Equity | ||||||||||||
Share capital | 36 | 28,265 | 28,265 | |||||||||
Reserves | 37 | 249,055 | 237,935 | |||||||||
Retained earnings | 201,265 | 183,856 | ||||||||||
|
|
|
| |||||||||
Attributable to equity holders of the Company | 478,585 | 450,056 | ||||||||||
|
|
|
| |||||||||
Non-controlling interests | 8,073 | 6,881 | ||||||||||
|
|
|
| |||||||||
Total equity | 486,658 | 456,937 | ||||||||||
|
|
|
| |||||||||
Total liabilities and equity | 4,891,085 | 4,252,466 | ||||||||||
|
|
|
| |||||||||
Approved and authorised for issue by the Board of Directors on 24 March 2022.
Yuan Changqing | Su Hengxuan | |
| Director | Director |
The notes on pages 138 to 252 form an integral part of these consolidated financial statements.
132
Consolidated Statement of Comprehensive Income
For the year ended 31 December 2021
| Notes | 2021 RMB million | 2020 RMB million | ||||||||||
| (Restated Note 35(f)(ii)) | ||||||||||||
REVENUES | ||||||||||||
Gross written premiums | 5 | 618,327 | 612,265 | |||||||||
Less: premiums ceded to reinsurers | 5 | (8,015 | ) | (6,053 | ) | |||||||
|
|
|
| |||||||||
Net written premiums | 610,312 | 606,212 | ||||||||||
Net change in unearned premium reserves | 939 | (1,546 | ) | |||||||||
|
|
|
| |||||||||
Net premiums earned | 611,251 | 604,666 | ||||||||||
|
|
|
| |||||||||
Investment income | 22 | 178,387 | 154,497 | |||||||||
Net realised gains on financial assets | 23 | 20,344 | 14,583 | |||||||||
Net fair value gains through profit or loss | 24 | 4,943 | 21,900 | |||||||||
Other income | 10,005 | 9,403 | ||||||||||
|
|
|
| |||||||||
Total revenues | 824,930 | 805,049 | ||||||||||
|
|
|
| |||||||||
BENEFITS, CLAIMS AND EXPENSES | ||||||||||||
Insurance benefits and claims expenses | ||||||||||||
Life insurance death and other benefits | 25 | (121,354 | ) | (113,609 | ) | |||||||
Accident and health claims and claim adjustment expenses | 25 | (55,030 | ) | (52,395 | ) | |||||||
Increase in insurance contract liabilities | 25 | (442,370 | ) | (414,797 | ) | |||||||
Investment contract benefits | 26 | (10,628 | ) | (9,846 | ) | |||||||
Policyholder dividends resulting from participation in profits | (26,511 | ) | (28,279 | ) | ||||||||
Underwriting and policy acquisition costs | (65,744 | ) | (84,361 | ) | ||||||||
Finance costs | 27 | (5,598 | ) | (3,747 | ) | |||||||
Administrative expenses | (40,808 | ) | (37,706 | ) | ||||||||
Statutory insurance fund contribution | 21 | (1,253 | ) | (1,229 | ) | |||||||
Other expenses | (15,467 | ) | (12,270 | ) | ||||||||
|
|
|
| |||||||||
Total benefits, claims and expenses | (784,763 | ) | (758,239 | ) | ||||||||
|
|
|
| |||||||||
Net gains on investments of associates and joint ventures | 9 | 10,328 | 7,666 | |||||||||
Including: share of profit of associates and joint ventures | 10,328 | 8,336 | ||||||||||
|
|
|
| |||||||||
Profit before income tax | 28 | 50,495 | 54,476 | |||||||||
Income tax | 29 | 1,917 | (3,103 | ) | ||||||||
|
|
|
| |||||||||
Net profit | 52,412 | 51,373 | ||||||||||
|
|
|
| |||||||||
Attributable to: | ||||||||||||
– Equity holders of the Company | 50,921 | 50,257 | ||||||||||
– Non-controlling interests | 1,491 | 1,116 | ||||||||||
Basic and diluted earnings per share | 31 | RMB1.80 | RMB1.77 | |||||||||
|
|
|
| |||||||||
The notes on pages 138 to 252 form an integral part of these consolidated financial statements.
133
Consolidated Statement of Comprehensive Income (continued)
For the year ended 31 December 2021
| Note | 2021 RMB million | 2020 RMB million | ||||||||||
| (Restated Note 35(f)(ii)) | ||||||||||||
Other comprehensive income | ||||||||||||
Other comprehensive income that may be reclassified to profit or loss in subsequent periods: | ||||||||||||
Fair value gains on available-for-sale securities | 17,065 | 52,547 | ||||||||||
Amount transferred to net profit from other comprehensive income | (21,722 | ) | (14,386 | ) | ||||||||
Portion of fair value changes on available-for-sale securities attributable to policyholders equity | (1,793 | ) | (3,959 | ) | ||||||||
Share of other comprehensive income of associates and joint ventures under the equity method | 1,260 | 672 | ||||||||||
Exchange differences on translating foreign operations | (398 | ) | (986 | ) | ||||||||
Income tax relating to components of other comprehensive income | 29 | 1,098 | (8,482 | ) | ||||||||
|
|
|
| |||||||||
Other comprehensive income that may be reclassified to profit or loss in subsequent periods | (4,490 | ) | 25,406 | |||||||||
|
|
|
| |||||||||
Other comprehensive income that will not be reclassified to profit or loss in subsequent periods: | ||||||||||||
Share of other comprehensive income of associates and joint ventures under the equity method | (59 | ) | 344 | |||||||||
|
|
|
| |||||||||
Other comprehensive income for the year, net of tax | (4,549 | ) | 25,750 | |||||||||
|
|
|
| |||||||||
Total comprehensive income for the year, net of tax | 47,863 | 77,123 | ||||||||||
|
|
|
| |||||||||
Attributable to: | ||||||||||||
– Equity holders of the Company | 46,358 | 75,956 | ||||||||||
– Non-controlling interests | 1,505 | 1,167 | ||||||||||
|
|
|
| |||||||||
The notes on pages 138 to 252 form an integral part of these consolidated financial statements.
134
Consolidated Statement of Changes in Equity
For the year ended 31 December 2021
| Attributable to equity holders of the Company | Non-controlling interests | Total | ||||||||||||||||||||||
| Share capital | Other equity instruments | Reserves | Retained earnings |
|
| |||||||||||||||||||
| RMB million | RMB million | RMB million | RMB million | RMB million | RMB million | |||||||||||||||||||
| (Note 36) | (Note 37) | |||||||||||||||||||||||
As at 1 January 2020 (Restated Note 35(f)(ii)) | 28,265 | 7,791 | 197,266 | 170,458 | 5,580 | 409,360 | ||||||||||||||||||
Net profit | — | — | — | 50,257 | 1,116 | 51,373 | ||||||||||||||||||
Other comprehensive income | — | — | 25,699 | — | 51 | 25,750 | ||||||||||||||||||
|
|
|
|
|
|
|
|
|
|
|
| |||||||||||||
Total comprehensive income | — | — | 25,699 | 50,257 | 1,167 | 77,123 | ||||||||||||||||||
|
|
|
|
|
|
|
|
|
|
|
| |||||||||||||
Transactions with owners | ||||||||||||||||||||||||
Appropriation to reserves (Note 37) | — | — | 16,025 | (16,025 | ) | — | — | |||||||||||||||||
Dividends paid | — | — | — | (20,834 | ) | — | (20,834 | ) | ||||||||||||||||
Dividends to non-controlling interests | — | — | — | — | (174 | ) | (174 | ) | ||||||||||||||||
Others | — | (7,791 | ) | (1,055 | ) | — | 308 | (8,538 | ) | |||||||||||||||
|
|
|
|
|
|
|
|
|
|
|
| |||||||||||||
Total transactions with owners | — | (7,791 | ) | 14,970 | (36,859 | ) | 134 | (29,546 | ) | |||||||||||||||
|
|
|
|
|
|
|
|
|
|
|
| |||||||||||||
As at 31 December 2020 | 28,265 | — | 237,935 | 183,856 | 6,881 | 456,937 | ||||||||||||||||||
|
|
|
|
|
|
|
|
|
|
|
| |||||||||||||
As at 1 January 2021 | 28,265 | — | 237,935 | 183,856 | 6,881 | 456,937 | ||||||||||||||||||
Net profit | — | — | — | 50,921 | 1,491 | 52,412 | ||||||||||||||||||
Other comprehensive income | — | — | (4,608 | ) | — | 14 | (4,594 | ) | ||||||||||||||||
|
|
|
|
|
|
|
|
|
|
|
| |||||||||||||
Total comprehensive income | — | — | (4,608 | ) | 50,921 | 1,505 | 47,818 | |||||||||||||||||
|
|
|
|
|
|
|
|
|
|
|
| |||||||||||||
Transactions with owners | ||||||||||||||||||||||||
Appropriation to reserves (Note 37) | — | — | 15,378 | (15,378 | ) | — | — | |||||||||||||||||
Dividends paid (Note 33) | — | — | — | (18,089 | ) | — | (18,089 | ) | ||||||||||||||||
Dividends to non-controlling interests | — | — | — | — | (359 | ) | (359 | ) | ||||||||||||||||
Reserves to retained earnings (Note 37) | — | — | 45 | (45 | ) | — | — | |||||||||||||||||
Others | — | — | 305 | — | 46 | 351 | ||||||||||||||||||
|
|
|
|
|
|
|
|
|
|
|
| |||||||||||||
Total transactions with owners | — | — | 15,728 | (33,512 | ) | (313 | ) | (18,097 | ) | |||||||||||||||
|
|
|
|
|
|
|
|
|
|
|
| |||||||||||||
As at 31 December 2021 | 28,265 | — | 249,055 | 201,265 | 8,073 | 486,658 | ||||||||||||||||||
|
|
|
|
|
|
|
|
|
|
|
| |||||||||||||
The notes on pages 138 to 252 form an integral part of these consolidated financial statements.
135
Consolidated Statement of Cash Flows
For the year ended 31 December 2021
| 2021 RMB million | 2020 RMB million | |||||||
| (Restated Note 35(f)(ii)) | ||||||||
CASH FLOWS FROM OPERATING ACTIVITIES | ||||||||
Profit before income tax | 50,495 | 54,476 | ||||||
Adjustments for: | ||||||||
Investment income | (178,387 | ) | (154,497 | ) | ||||
Net realised and unrealised gains on financial assets | (25,287 | ) | (36,483 | ) | ||||
Insurance contracts | 445,472 | 419,866 | ||||||
Depreciation and amortisation | 5,287 | 5,162 | ||||||
Foreign exchange losses/(gains) | (645 | ) | (119 | ) | ||||
Net gains on investments of associates and joint ventures | (10,328 | ) | (7,666 | ) | ||||
Changes in operating assets and liabilities: | ||||||||
Increase in securities at fair value through profit or loss, net | (44,527 | ) | (21,954 | ) | ||||
Financial liabilities at fair value through profit or loss | (1,478 | ) | 3,004 | |||||
Receivables and payables | 47,129 | 40,598 | ||||||
Income tax paid | (5,862 | ) | (3,263 | ) | ||||
Interest received – securities at fair value through profit or loss | 3,753 | 4,120 | ||||||
Dividends received – securities at fair value through profit or loss | 826 | 775 | ||||||
|
|
|
| |||||
Net cash inflow/(outflow) from operating activities | 286,448 | 304,019 | ||||||
|
|
|
| |||||
CASH FLOWS FROM INVESTING ACTIVITIES | ||||||||
Disposals and maturities: | ||||||||
Disposals of debt investments | 37,708 | 36,774 | ||||||
Maturities of debt investments | 196,596 | 198,640 | ||||||
Disposals of equity investments | 385,308 | 308,406 | ||||||
Disposals of property, plant and equipment | 341 | 57 | ||||||
Disposals of subsidiaries | 559 | 2,175 | ||||||
Purchases: | ||||||||
Debt investments | (745,973 | ) | (593,917 | ) | ||||
Equity investments and subsidiaries | (409,676 | ) | (338,306 | ) | ||||
Property, plant and equipment | (5,475 | ) | (7,469 | ) | ||||
Investments in associates and joint ventures | (7,072 | ) | (14,942 | ) | ||||
Decrease/(Increase) in term deposits, net | 17,748 | (10,947 | ) | |||||
Increase in securities purchased under agreements to resell, net | (2,804 | ) | (3,850 | ) | ||||
Interest received | 142,311 | 126,848 | ||||||
Dividends received | 32,177 | 29,590 | ||||||
Increase in policy loans, net | (35,479 | ) | (25,858 | ) | ||||
|
|
|
| |||||
Net cash inflow/(outflow) from investing activities | (393,731 | ) | (292,799 | ) | ||||
|
|
|
| |||||
The notes on pages 138 to 252 form an integral part of these consolidated financial statements.
136
Consolidated Statement of Cash Flows (continued)
For the year ended 31 December 2021
| 2021 RMB million | 2020 RMB million | |||||||
| (Restated Note 35(f)(ii)) | ||||||||
CASH FLOWS FROM FINANCING ACTIVITIES | ||||||||
Increase in securities sold under agreements to repurchase, net | 117,211 | 4,912 | ||||||
Interest paid | (8,194 | ) | (3,779 | ) | ||||
Repayment of borrowings | — | (6,505 | ) | |||||
Dividends paid to equity holders of the Company | (18,089 | ) | (20,834 | ) | ||||
Dividends paid to non-controlling interests | (372 | ) | (161 | ) | ||||
Cash received from borrowings | — | 6,822 | ||||||
Payment of lease liabilities | (1,517 | ) | (1,478 | ) | ||||
Cash paid for redemption of other equity instruments | — | (9,060 | ) | |||||
Capital injected into subsidiaries by non-controlling interests | 22,850 | 22,846 | ||||||
Cash received related to other financing activities | — | 1,069 | ||||||
Cash paid related to other financing activities | (750 | ) | (1,592 | ) | ||||
|
|
|
| |||||
Net cash inflow/(outflow) from financing activities | 111,139 | (7,760 | ) | |||||
|
|
|
| |||||
Foreign exchange gains/(losses) on cash and cash equivalents | (71 | ) | (144 | ) | ||||
|
|
|
| |||||
Net increase in cash and cash equivalents | 3,785 | 3,316 | ||||||
|
|
|
| |||||
Cash and cash equivalents | ||||||||
Beginning of the year | 56,655 | 53,339 | ||||||
|
|
|
| |||||
End of the year | 60,440 | 56,655 | ||||||
|
|
|
| |||||
Analysis of balances of cash and cash equivalents | ||||||||
Cash at banks and in hand | 60,256 | 56,536 | ||||||
Short-term bank deposits | 184 | 119 | ||||||
|
|
|
| |||||
The notes on pages 138 to 252 form an integral part of these consolidated financial statements.
137
Notes to the Consolidated Financial Statements
For the year ended 31 December 2021
| 1 | ORGANISATION AND PRINCIPAL ACTIVITIES |
China Life Insurance Company Limited (the “Company”) was established in the People’s Republic of China (“China” or the “PRC”) on 30 June 2003 as a joint stock company with limited liability as part of a group restructuring of China Life Insurance (Group) Company (“CLIC”, formerly China Life Insurance Company) and its subsidiaries (the “Restructuring”). The Company and its subsidiaries are hereinafter collectively referred to as the “Group”. The Group’s principal activities are the writing of life, health, accident and other types of personal insurance business; reinsurance business for personal insurance business; fund management business permitted by national laws and regulations or approved by the State Council of the People’s Republic of China, etc.
The Company is a joint stock company incorporated in the PRC with limited liability. The address of its registered office is
16 Financial Street, Xicheng District, Beijing, the PRC. The Company is listed on the New York Stock Exchange, the Stock Exchange of Hong Kong Limited, and the Shanghai Stock Exchange.
These consolidated financial statements are presented in millions of Renminbi (“RMB million”) unless otherwise stated. These consolidated financial statements have been approved and authorised for issue by the Board of Directors on 24 March 2022.
| 2 | SUMMARY OF SIGNIFICANT ACCOUNTING POLICIES |
The principal accounting policies applied in the preparation of these consolidated financial statements are set out below. These policies have been consistently applied to all the years presented, unless otherwise stated.
| 2.1 | Basis of preparation |
The Group has prepared these consolidated financial statements in accordance with International Financial Reporting Standards (“IFRSs”), amendments to IFRSs and interpretations issued by the International Accounting Standards Board (“IASB”). These consolidated financial statements also comply with the applicable disclosure provisions of the Rules Governing the Listing of Securities on The Stock Exchange of Hong Kong Limited (the “Listing Rules”) and the applicable disclosure requirements of the Hong Kong Companies Ordinance. The Group has prepared the consolidated financial statements under the historical cost convention, except for financial assets and liabilities at fair value through profit or loss, available for sale securities, insurance contract liabilities and certain property, plant and equipment at deemed cost as part of the Restructuring process. The preparation of financial statements in compliance with IFRSs requires the use of certain critical accounting estimates. It also requires management to exercise its judgement in the process of applying the Group’s accounting policies. The areas involving a higher degree of judgement or complexity, or areas where assumptions and estimates are significant to the consolidated financial statements are disclosed in Note 3.
| 2.1.1 | New accounting standards and amendments adopted by the Group for the first time for the financial year beginning on 1 January 2021 |
Standards/Amendments | Content | Effective for annual periods beginning on or after | ||||
| IFRS 9, IAS 39, IFRS 7, IFRS 4 and IFRS 16 Amendments | Interest Rate Benchmark Reform – Phase 2 | 1 January 2021 | ||||
| Amendments to IFRS 16 | Covid-19-Related Rent Concessions beyond 30 June 2021 | 1 April 2021 | ||||
138
Notes to the Consolidated Financial Statements (continued)
For the year ended 31 December 2021
| 2 | SUMMARY OF SIGNIFICANT ACCOUNTING POLICIES (continued) |
| 2.1 | Basis of preparation (continued) |
| 2.1.1 | New accounting standards and amendments adopted by the Group for the first time for the financial year beginning on 1 January 2021 (continued) |
IFRS 9, IAS 39, IFRS 7, IFRS 4 and IFRS 16 Amendments – Interest Rate Benchmark Reform – Phase 2
In August 2020, the IASB issued IFRS 9, IAS 39, IFRS 7, IFRS 4 and IFRS 16 Amendments Interest Rate Benchmark Reform – Phase 2. The amendments address issues not dealt with in the previous amendments which affect financial reporting when an existing interest rate benchmark is replaced with an alternative benchmark rate. The key reliefs provided by the Phase 2 amendments are as follows:
| • | Changes to contractual cash flows. When changing the basis for determining contractual cash flows for financial assets and liabilities (including lease liabilities), the reliefs have the effect that the changes that are required by an interest rate benchmark reform (that is, are necessary as a direct consequence of IBOR reform and are economically equivalent) will not result in an immediate gain or loss in the income statement. |
| • | Hedge accounting. The hedge accounting reliefs will allow most IAS 39 or IFRS 9 hedge relationships that are directly affected by IBOR reform to continue. However, additional ineffectiveness might need to be recorded. |
The amendments are effective for annual periods beginning on or after 1 January 2021 and shall be applied retrospectively, but entities are not required to restate the comparative information.
The Group had certain interest-bearing bank borrowings denominated in US dollars and Euros based on the London
Interbank Offered Rate (“LIBOR”) and the Europe Interbank Offered Rate (“EURIBOR”) as at 31 December 2021. If the interest rates of these borrowings are replaced by alternative benchmark rates in a future period, the Group will apply this practical expedient upon the modification of these borrowings when the “economically equivalent” criterion is met and expects that no significant modification gain or loss will arise as a result of applying the amendments to these changes.
IFRS 16 Amendment – Covid-19-Related Rent Concessions beyond 30 June 2021
In May 2020, the IASB issued the amendment to IFRS 16 Leases to provide an optional relief to lessees from applying IFRS 16’s guidance on lease modification accounting for rent concessions arising as a direct consequence of COVID-19. The amendment does not apply to lessors.
In March 2021, the IASB has extended by one year the application period of the practical expedient in IFRS 16 Leases to help lessees accounting for covid-19-related rent concessions.
The Group has adopted the amendment on 1 April 2021. Because the Group was not provided with a significant amount of rent concessions arising as a direct consequence of COVID-19, the amendment did not have any significant impact on the Group’s consolidated financial statements.
139
Notes to the Consolidated Financial Statements (continued)
For the year ended 31 December 2021
| 2 | SUMMARY OF SIGNIFICANT ACCOUNTING POLICIES (continued) |
| 2.1 | Basis of preparation (continued) |
| 2.1.2 | New accounting standards and amendments that are effective for the financial year ended 31 December 2021 but temporary exemption is applied by the Group |
Standards/Amendments | Content | Effective for annual periods | ||
IFRS9 | Financial Instruments | 1 January 2018 |
IFRS 9 – Financial Instruments
In July 2014, the IASB issued the final version of IFRS 9, bringing together all phases of the financial instruments project to replace IAS 39 and all previous versions of IFRS 9. The standard introduces new requirements for classification and measurement, impairment, and hedge accounting. IFRS 9 is effective for annual periods beginning on or after 1 January 2018, with early adoption permitted. Based on the current assessment, the Group expects that the adoption of IFRS 9 will have a significant impact on the consolidated financial statements. The Group has adopted the temporary exemption permitted in the Amendments to IFRS 4 Applying IFRS 9 Financial Instruments with IFRS 4 Insurance Contracts (“IFRS 4 Amendment”) to apply IAS 39 rather than IFRS 9, until the effective date of IFRS 17. Refer to Note 34 for more details.
Classification and measurement
IFRS 9 requires that the Group classifies debt instruments based on the combined effect of application of business models (hold to collect contractual cash flows, hold to collect contractual cash flows and sell financial assets or other business models) and contractual cash flow characteristics (solely payments of principal and interest on the principal amount outstanding or not). Debt instruments not giving rise to cash flows that are solely payments of principal and interest on the principal amount outstanding would be measured at fair value through profit or loss. Other debt instruments giving rise to cash flows that are solely payments of principal and interest on the principal amount outstanding would be measured at amortised cost, fair value through other comprehensive income (“FVOCI”) or fair value through profit or loss, based on their respective business models. The Group analysed the contractual cash flow characteristics of financial assets as at 31 December 2021 and made relevant disclosures in Note 34.
Equity instruments would generally be measured at fair value through profit or loss unless the Group elects to measure at FVOCI for certain equity investments not held for trading. This will result in unrealised gains and losses on equity instruments currently classified as available-for-sale securities being recorded in income going forward. Currently, these unrealised gains and losses are recognised in other comprehensive income (“OCI”). If the Group elects to record equity investments at FVOCI, gains and losses would be recognised in retained earnings when the instruments be disposed, except for the received dividends which do not represent a recovery of part of the investment cost.
Impairment
IFRS 9 replaces the “incurred loss” model with the “expected credit loss” model which is designed to include forward-looking information. The Group is in the process of developing and testing the key models required under IFRS 9 and analysing the impact on the expected loss provision; the Group believes that the provision for debt instruments of the Group under the “expected credit loss” model would be larger than that under the previous “incurred loss” model.
Hedge accounting
The Group does not apply the hedge accounting currently, so the Group expects that the new hedge accounting model under IFRS 9 will have no impact on the Group’s consolidated financial statements.
140
Notes to the Consolidated Financial Statements (continued)
For the year ended 31 December 2021
| 2 | SUMMARY OF SIGNIFICANT ACCOUNTING POLICIES (continued) |
| 2.1 | Basis of preparation (continued) |
| 2.1.3 | New accounting standards and amendments that are not yet effective and have not been early adopted by the Group for the financial year beginning on 1 January 2021 |
Standards/Amendments | Content | Effective for annual periods beginning on or after | ||
Amendments to IFRS 3 | Update Reference to the Conceptual Framework Property, | 1 January 2022 | ||
Amendments to IAS 16 | Plant and Equipment: Proceeds before intended use | 1 January 2022 | ||
Amendments to IAS 37 | Onerous Contracts – Cost of Fulfilling a Contract Annual | 1 January 2022 | ||
Annual improvements | Improvements to IFRS Standards 2018-2020 Cycle | 1 January 2022 | ||
Amendments to IAS 1 | Classification of Liabilities as Current or Non-current | 1 January 2023 | ||
IFRS 17 | Insurance Contracts | 1 January 2023 | ||
Amendment to IAS 12 | Deferred Tax related to Assets and Liabilities arising from a Single Transaction | 1 January 2023 | ||
IFRS 10 and IAS 28 Amendments | Sale or Contribution of Assets between an Investor and its Associate or Joint Venture | No mandatory effective date yet determined but available for adoption | ||
The Group has not early adopted any standard, interpretation or amendment that has been issued but is not yet effective.
IFRS 17 – Insurance Contracts
In May 2017, the IASB issued IFRS 17 Insurance Contracts, a comprehensive new accounting standard for insurance contracts covering recognition and measurement, presentation and disclosure, which replaces IFRS 4 Insurance Contracts.
In contrast to the requirements in IFRS 4, which are largely based on grandfathering previous local accounting policies for measurement purposes, IFRS 17 provides a comprehensive model (the general model) for insurance contracts, supplemented by the variable fee approach for contracts with direct participation features and the premium allocation approach mainly for short-duration which typically applies to certain non-life insurance contracts.
The main features of the new accounting model for insurance contracts are as follows:
| • | The fulfilment cash flows including the expected present value of future cash flows and explicit risk adjustment, remeasured every reporting period; |
| • | A contractual service margin represents the unearned profitability of the insurance contracts and is recognised in profit or loss over the coverage period; |
| • | Certain changes in the expected present value of future cash flows are adjusted against the contractual service margin and thereby recognised in profit or loss over the remaining coverage period; |
| • | The effect of changes in discount rates will be reported in either profit or loss or OCI, determined by an accounting policy choice; |
| • | The recognition of insurance revenue and insurance service expenses in the statement of comprehensive income based on the concept of services provided during the period; |
141
Notes to the Consolidated Financial Statements (continued)
For the year ended 31 December 2021
| 2 | SUMMARY OF SIGNIFICANT ACCOUNTING POLICIES (continued) |
| 2.1 | Basis of preparation (continued) |
| 2.1.3 | New accounting standards and amendments that are not yet effective and have not been early adopted by the Group for the financial year beginning on 1 January 2021 (continued) |
IFRS 17 – Insurance Contracts (continued)
| • | Amounts that the policyholder will always receive, regardless of whether an insured event happens (non-distinct investment components) are not presented in the statement of comprehensive income, but are recognised directly in the statement of financial position; |
| • | Insurance services results are presented separately from the insurance finance income or expense; |
| • | Extensive disclosures to provide information on the recognised amounts from insurance contracts and the nature and extent of risks arising from these contracts. |
In June 2020, the IASB issued the amendments to IFRS 17 which include a deferral of the effective date of IFRS 17 to annual reporting periods beginning on or after 1 January 2023. Insurers qualifying for the deferral of IFRS 9 can apply both IFRS 17 and IFRS 9 for the first time to annual reporting periods beginning on or after 1 January 2023. In December 2021, the IASB issued the amendment to IFRS 17, which permit entities that first apply IFRS 17 and IFRS 9 at the same time to present comparative information about a financial asset as if the classification and measurement requirements of IFRS 9 had been applied to that financial asset before. The Group is currently assessing the impact of the implementation of the standard.
Except for IFRS 17, there are no other new accounting standards, amendments or IFRIC interpretations that are not yet effective but would be expected to have a significant impact on the financial position and performance of the Group.
| 2.2 | Consolidation |
The consolidated financial statements include the financial statements of the Company and its subsidiaries for the year ended 31 December 2021. Subsidiaries are those entities which are controlled by the Group (including the structured entities controlled by the Group). Control is achieved when the Group is exposed, or has rights, to variable returns from its involvement with the investee and has the ability to affect those returns through its power over the investee. Specifically, the Group controls an investee if and only if the Group has:
| • | power over the investee (i.e., existing rights that give it the current ability to direct the relevant activities of the investee); |
| • | exposure, or rights, to variable returns from its involvement with the investee; and |
| • | the ability to use its power over the investee to affect its returns. |
When the Group has less than a majority of the voting or similar rights of an investee, the Group considers all relevant facts and circumstances in assessing whether it has power over an investee, including:
| • | the contractual arrangement with the other vote holders of the investee; |
| • | rights arising from other contractual arrangements; and |
| • | the Group’s voting rights and potential voting rights. |
The Group re-assesses whether or not it controls an investee if facts and circumstances indicate that there are changes to one or more of the three elements of control. Consolidation of a subsidiary begins when the Group obtains control over the subsidiary and ceases when the Group loses control of the subsidiary.
142
Notes to the Consolidated Financial Statements (continued)
For the year ended 31 December 2021
| 2 | SUMMARY OF SIGNIFICANT ACCOUNTING POLICIES (continued) |
| 2.2 | Consolidation (continued) |
Profit or loss and each component of OCI are attributed to the equity holders of the Company and to the non-controlling interests, even if this results in the non-controlling interests having a deficit balance. When necessary, adjustments are made to the financial statements of subsidiaries to bring their accounting policies in line with the Group’s accounting policies. All intra-group assets and liabilities, equity, income, expenses and cash flows relating to transactions between members of the Group are eliminated in full upon consolidation.
A change in the ownership interest of a subsidiary, without a loss of control, is accounted for as an equity transaction. If the Group loses control over a subsidiary, it:
| • | derecognises the assets (including goodwill) and liabilities of the subsidiary; |
| • | derecognises the carrying amount of any non-controlling interests; |
| • | derecognises the cumulative translation differences recorded in equity; |
| • | recognises the fair value of the consideration received; |
| • | recognises the fair value of any investment retained; |
| • | recognises any surplus or deficit in profit or loss; and |
| • | reclassifies the Group’s share of components previously recognised in OCI to profit or loss or retained earnings, as appropriate, as if the Group had directly disposed of the related assets or liabilities. |
The consolidated financial statements incorporate the financial statements of the combining entities or businesses in business combination under common control as if they had been combined from the date when the combining entities or businesses first came under the control of the ultimate holding company. The net assets of the combining entities or businesses are consolidated using the carrying amount from the ultimate holding company’s perspective. No amount is recognised for goodwill or excess of the Group’s interest in the book value of the net assets over cost at the time of the common control combination, to the extent of the continuation of the ultimate holding company’s interest. The consolidated statement of comprehensive income includes the results of each of the combining entities or businesses from the earliest date presented or since the date when the combining entities or businesses first came under common control, where this is a shorter period, regardless of the date of the common control combination.
The comparative financial data have been restated to reflect the business combinations under common control occurred during this year. Transaction costs, including professional fees, registration fees, costs of furnishing information to shareholders, costs or losses incurred in combining operations of the previously separate businesses and other costs incurred in relation to the common control combination that is to be accounted for by using the merger accounting method are recognised as expenses in the period in which they are incurred.
The acquisition method of accounting is used to account for the acquisition of subsidiaries by the Group, other than common control combinations. The consideration transferred for the acquisition of a subsidiary is the fair value of the assets transferred, the liabilities incurred and the equity interest issued by the Group. The consideration transferred includes the fair value of any asset or liability resulting from a contingent consideration arrangement. Acquisition-related costs are expensed as incurred. Identifiable assets acquired, and liabilities and contingent liabilities assumed in a business combination are measured initially at their fair value at the acquisition date. On an acquisition-by-acquisition basis, the Group recognises any non-controlling interest in the acquiree either at fair value or at the non-controlling interest’s proportionate share of the acquiree’s net assets.
143
Notes to the Consolidated Financial Statements (continued)
For the year ended 31 December 2021
| 2 | SUMMARY OF SIGNIFICANT ACCOUNTING POLICIES (continued) |
| 2.2 | Consolidation (continued) |
The excess of the aggregate of the consideration transferred, the fair value of any non-controlling interest in the acquiree, and the fair value of any previous equity interest in the acquiree at the acquisition date over the fair value of the net identifiable assets acquired and liabilities assumed is recorded as goodwill. If this is less than the fair value of the net assets of the subsidiary acquired in the case of a bargain purchase, the Group re-assesses whether it has correctly identified all of the assets acquired and all of the liabilities assumed, and reviews the procedures used to measure the amounts to be recognised at the acquisition date. If the re-assessment still results in an excess of the fair value of net assets acquired over the aggregate consideration transferred, then the gain is recognised in profit or loss. Goodwill is tested annually for impairment and carried at cost less accumulated impairment losses. If there is any indication that goodwill is impaired, recoverable amount is estimated and the difference between carrying amount and recoverable amount is recognised as an impairment charge. Impairment losses on goodwill are not reversed in subsequent periods. Gains or losses on the disposal of an entity take into consideration the carrying amount of goodwill relating to the entity sold.
The investments in subsidiaries are accounted for only in the Company’s statement of financial position at cost less impairment. Cost is adjusted to reflect changes in consideration arising from contingent consideration amendments. Cost also includes direct attributable costs of investment. The results of subsidiaries are accounted for by the Company on the basis of dividends received and receivable.
Transactions with non-controlling interests
The Group treats transactions with non-controlling interests that do not result in loss of controls as equity transactions. For shares purchased from non-controlling interests, the difference between any consideration paid and the relevant share acquired of the carrying value of net assets of the subsidiary is recorded in equity. Gains or losses on disposal of shares to non-controlling interests are also recorded in equity.
When the Group ceases to have control or significant influence, any retained interest in the entity is re-measured to its fair value, with the change in carrying amount recognised in profit or loss. The fair value is the initial carrying amount for the purposes of subsequently accounting for the retained interest as an associate, joint venture or financial asset. In addition, any amounts previously recognised in OCI in respect of that entity are accounted for as if the Group had directly disposed of the related assets or liabilities. This may mean that amounts previously recognised in OCI are reclassified to profit or loss.
If the ownership interest in an associate is reduced but significant influence is retained, only a proportionate share of the amounts previously recognised in OCI is reclassified to profit or loss as appropriate.
| 2.3 | Associates and joint ventures |
Associates are entities over which the Group has significant influence, generally accompanying a shareholding of between 20% and 50% of the voting rights of the investee. Significant influence is the power to participate in the financial and operating policy decisions of the investee, but is not control or joint control over those policies.
Joint ventures are the type of joint arrangements whereby the parties that have joint control of the arrangement have rights to the net assets of the joint venture. Joint control is the contractually agreed sharing of control of an arrangement, which exists only when decisions about the relevant activities require the unanimous consent of the parties sharing control.
Investments in associates and joint ventures are accounted for using the equity method of accounting and are initially recognised at cost.
144
Notes to the Consolidated Financial Statements (continued)
For the year ended 31 December 2021
| 2 | SUMMARY OF SIGNIFICANT ACCOUNTING POLICIES (continued) |
| 2.3 | Associates and joint ventures (continued) |
The Group’s share of post-acquisition profit or loss of its associates and joint ventures is recognised in net profit, and its share of post-acquisition movements in OCI is recognised in the consolidated statement of comprehensive income. The cumulative post-acquisition movements are adjusted against the carrying amount of the investment. When the Group’s share of losses in an associate or joint venture equals or exceeds its interest in the associate or joint venture, including any other unsecured receivables, the Group does not recognise further losses unless it has obligations to make payments on behalf of the associate or joint venture.
Unrealised gains on transactions between the Group and its associates or joint ventures are eliminated to the extent of the Group’s interests in the associates or joint ventures. Unrealised losses are also eliminated unless the transaction provides evidence of an impairment of the asset transferred. Associates and joint ventures’ accounting policies have been changed where necessary to ensure consistency with the policies adopted by the Group.
Goodwill represents the excess of the cost of an acquisition over the fair value of the Group’s share of the net identifiable assets of acquired associates or joint ventures at the date of acquisition. Goodwill on acquisitions of associates and joint ventures is included in investments in associates and joint ventures and is tested for impairment as part of the overall balance. Impairment losses on goodwill are not reversed. Gains or losses on the disposal of an entity take into consideration the carrying amount of goodwill relating to the entity sold.
The Group determines at each reporting date whether there is any objective evidence that the investments in associates and joint ventures are impaired. If this is the case, an impairment loss is recognised for the amount by which the investment’s carrying amount exceeds its recoverable amount. The recoverable amount is the higher of the investment’s fair value less costs of disposal and value in use. The impairment of investments in the associates and joint ventures is reviewed for possible reversal at each reporting date.
The investments in associates and joint ventures are stated at cost less impairment in the Company’s statement of financial position. The results of associates and joint ventures are accounted for by the Company on the basis of dividends received and receivable.
| 2.4 | Segment reporting |
The Group’s operating segments are presented in a manner consistent with the internal management reporting provided to the operating decision maker - president office for deciding how to allocate resources and for assessing performance.
Operating segment refers to the segment within the Group that satisfies the following conditions: i) the segment generates income and incurs costs from daily operating activities; ii) management evaluates the operating results of the segment to make resource allocation decision and to evaluate the business performance; and iii) the Group can obtain relevant financial information of the segment, including financial condition, operating results, cash flows and other financial performance indicators.
| 2.5 | Foreign currency translation |
The Company’s functional currency is RMB. Each entity in the Group determines its own functional currency and items included in the financial statements of each entity are measured using that functional currency. The reporting currency of the consolidated financial statements of the Group is RMB. Transactions in foreign currencies are translated at the exchange rates ruling at the transaction dates. Monetary assets and liabilities denominated in foreign currencies are translated at the exchange rates ruling at the end of the reporting period. Exchange differences arising in these cases are recognised in net profit.
145
Notes to the Consolidated Financial Statements (continued)
For the year ended 31 December 2021
| 2 | SUMMARY OF SIGNIFICANT ACCOUNTING POLICIES (continued) |
| 2.6 | Property, plant and equipment |
Property, plant and equipment, are stated at historical costs less accumulated depreciation and any accumulated impairment losses, except for those acquired prior to 30 June 2003, which are stated at deemed cost less accumulated depreciation and any accumulated impairment losses.
The historical costs of property, plant and equipment comprise its purchase price, including import duties and non-refundable purchase taxes, and any directly attributable costs of bringing the asset to its working condition and location for its intended use. Expenditure incurred after terms of property, plant and equipment have been put into operation, such as repairs and maintenance, is normally charged to the statement of comprehensive income in the period in which it is incurred. In situations where the recognition criteria are satisfied, the expenditure for a major inspection is capitalised in the carrying amount of the assets as a replacement. Where significant parts of property, plant and equipment are required to be replaced at intervals, the Group recognises such parts as individual assets with specific useful lives and depreciates them accordingly.
Depreciation
Depreciation is computed on a straight-line basis to write down the cost of each asset to its residual value over its estimated useful lives as follows:
| Estimated useful lives | ||||
Buildings | 15 to 35 years | |||
Office equipment, furniture and fixtures | 3 to 11 years | |||
Motor vehicles | 4 to 8 years | |||
Leasehold improvements | | Over the shorter of the remaining term of the lease and the useful lives | | |
The residual values, depreciation method and useful lives are reviewed periodically to ensure that the method and period of depreciation are consistent with the expected pattern of economic benefits from items of property, plant and equipment.
Assets under construction mainly represent buildings under construction, which are stated at cost less any impairment losses and are not depreciated, except for those acquired prior to 30 June 2003, which are stated at deemed cost less any accumulated impairment losses. Cost comprises the direct costs of construction and capitalised borrowing costs on related borrowed funds during the period of construction. Assets under construction are reclassified to the appropriate category of property, plant and equipment, investment properties or other assets when completed and ready for use.
Impairment and gains or losses on disposals
Property, plant and equipment are reviewed for impairment losses whenever events or changes in circumstances indicate that the carrying amount may not be recoverable. An impairment loss is recognised in net profit for the amount by which the carrying amount of the asset exceeds its recoverable amount, which is the higher of an asset’s net selling price and value in use.
The gain or loss on disposal of an item of property, plant and equipment is the difference between the net sales proceeds and the carrying amount of the relevant asset, and is recognised in net profit.
146
Notes to the Consolidated Financial Statements (continued)
For the year ended 31 December 2021
| 2 | SUMMARY OF SIGNIFICANT ACCOUNTING POLICIES (continued) |
| 2.7 | Leases |
At inception of a contract, the Group assesses whether the contract is, or contains, a lease. A contract is, or contains, a lease if the contract conveys the right to control the use of an identified asset for a period of time in exchange for consideration. To assess whether a contract conveys the right to control the use of an identified asset for a period of a time, the Group assesses whether, throughout the period of use, the lessee has the right to obtain substantially all of the economic benefits from use of the identified asset and the right to direct the use of the identified asset.
As a lessee
Initial measurement
At the commencement date of the lease, the Group recognises right-of-use assets representing the right to use the leased assets, including buildings and land use rights, etc. The Group measures the lease liability at the present value of the lease payments that are not paid at that date, except for short-term leases and leases of low-value assets. In calculating the present value of the lease payments, the lease payments are discounted using the interest rate implicit in the lease. If that rate cannot be readily determined, the Group uses its own incremental borrowing rate.
The lease term is the non-cancellable period of a lease when the Group has the right to use lease assets. When the Group has an option to extend a lease and is reasonably certain to exercise that option to extend a lease, the lease term also comprises the periods covered by the option to extend the lease. When the Group has an option to terminate the lease and is reasonably certain not to exercise that option, the lease term also comprises the periods covered by the option to terminate the lease. The Group reassesses whether it is reasonably certain to exercise an extension option, to exercise a purchase option or not to exercise a termination option, upon the occurrence of either a significant event or a significant change in circumstances that are within the control of the Group and affects whether the Group is reasonably certain to exercise the commensurate options.
Subsequent measurement
The Group applies the straight-line method in depreciating the right-of-use assets. If it is reasonably certain that ownership of a leased asset transfers to the Group at the end of the lease term, the leased asset is depreciated under the remaining useful life of the asset. If it cannot be reasonably determined that ownership of a leased asset transfers to the Group at the end of the lease term, the Group depreciates the right-of-use asset from the commencement date to the earlier of the end of the lease term or the end of the useful life of the right-of-use asset.
The Group uses a constant periodic rate of interest to calculate interest on the lease liability in each period during the lease term and recognises the interest in profit or loss.
Variable lease payments not included in the measurement of the lease liability are recognised in profit or loss in the period in which the event or condition that triggers the payment occurs.
After the commencement date of a lease, when there is a change in in-substance fixed payments, a change in the amounts expected to be payable under a residual value guarantee, a change in future lease payments resulting from a change in an index or a rate used to determine those payments, a change in the assessment or actual exercise situation of a purchase option, an extension option or a termination option, the Group uses the changed present value of lease payments to remeasure the lease liability and adjust the carrying amount of right-of-use asset accordingly. If the carrying amount of the right-of-use asset is reduced to zero and there is a further reduction in the measurement of the lease liability, the Group recognises any remaining amount of the remeasurement in profit or loss.
The Group assesses whether there is any indication that a right-of-use asset may be impaired at the end of reporting period. If any such indication exists, the Group performs the impairment test. An impairment loss is recognised in net profit for the amount by which the carrying amount of the right-of-use asset exceeds its recoverable amount, which is the higher of the right-of-use asset’s net selling price and value in use.
147
Notes to the Consolidated Financial Statements (continued)
For the year ended 31 December 2021
| 2 | SUMMARY OF SIGNIFICANT ACCOUNTING POLICIES (continued) |
| 2.7 | Leases (continued) |
As a lessee (continued)
COVID-19 - Related Rent Concessions
The Group partly adopts the simplified method for rental concessions arising as a direct consequence of COVID-19 reached by the Group and the lessor on the existing lease contracts of buildings. The Group treats the reduced or exempted rent concessions as variable lease payments. When a concession agreement is reached to relieve the original rent payment obligation, the undiscounted cash amount will be used to offset the cost of the related asset or expense, and adjust the related liablity.
As a lessor
At the commencement date of the lease, leases in which the Group does not transfer substantially all the risks and rewards incidental to ownership of an asset are classified as operating leases. Rental income arising is accounted for on a straight-line basis over the lease terms and is included in revenue in the statement of profit or loss.
| 2.8 | Investment properties |
Investment properties are interests in land use rights and buildings that are held to earn rental income and/or for capital appreciation, rather than for the supply of services or for administrative purposes.
Investment properties are measured initially at cost, including transaction costs. Subsequent to initial recognition, investment properties are stated at cost less accumulated depreciation and any impairment loss.
Depreciation is computed on the straight-line basis over the estimated useful lives. The estimated useful lives of investment properties are 15 to 35 years.
Overseas investment properties, that are held by the Group in the form of property ownership, equity investment, or other forms, have expected useful lives not longer than 50 years, determined based on the usage in their locations.
The useful lives and depreciation method are reviewed periodically to ensure that the method and period of depreciation are consistent with the expected pattern of economic benefits from the individual investment properties.
An investment property is derecognised when either it has been disposed of or when the investment property is permanently withdrawn from use and no future economic benefit is expected from its disposal. Any gains or losses on the retirement or disposal of an investment property are recognised in the statement of comprehensive income in the year of retirement or disposal. A transfer to, or from, an investment property is made when, and only when, there is evidence of a change in use.
| 2.9 | Financial assets |
| 2.9.a | Classification |
The Group classifies its financial assets into the following categories: securities at fair value through profit or loss, held-to-maturity securities, loans and receivables and available-for-sale securities. Management determines the classification of its financial assets at initial recognition which depends on the purpose for which the assets are acquired. The Group’s investments in securities fall into the following four categories:
| (i) | Securities at fair value through profit or loss |
This category has two sub-categories: securities held for trading and those designated as at fair value through profit or loss at inception. Securities are classified as held for trading at inception if acquired principally for the purpose of selling in the short-term or if they form part of a portfolio of financial assets in which there is evidence of taking short-term profit. The Group may classify other financial assets as at fair value through profit or loss if they meet the criteria in IAS 39 and designated as such at inception.
148
Notes to the Consolidated Financial Statements (continued)
For the year ended 31 December 2021
| 2 | SUMMARY OF SIGNIFICANT ACCOUNTING POLICIES (continued) |
| 2.9 | Financial assets (continued) |
| 2.9.a | Classification (continued) |
| (ii) | Held-to-maturity securities |
Held-to-maturity securities are non-derivative financial assets with fixed or determinable payments and fixed maturities that the Group has the positive intention and ability to hold to maturity and do not meet the definition of loans and receivables nor designated as available-for-sale securities or securities at fair value through profit or loss.
| (iii) | Loans and receivables |
Loans and receivables are non-derivative financial assets with fixed or determinable payments that are not quoted in an active market other than those that the Group intends to sell in the short-term or held as available-for-sale. Loans and receivables mainly comprise term deposits, loans,securities purchased under agreements to resell, accrued investment income and premium receivables as presented separately in the statement of financial position.
| (iv) | Available-for-sale securities |
Available-for-sale securities are non-derivative financial assets that are either designated in this category or not classified in any of the other categories.
| 2.9.b | Recognition and measurement |
Purchase and sale of investments are recognised on the trade date, when the Group commits to purchase or sell assets. Investments are initially recognised at fair value plus, in the case of all financial assets not carried at fair value through profit or loss, transaction costs that are directly attributable to their acquisition. Investments are derecognised when the rights to receive cash flows from the investments have expired or when they have been transferred and the Group has also transferred substantially all risks and rewards of ownership.
Securities at fair value through profit or loss and available-for-sale securities are carried at fair value. Equity investments that do not have a quoted price in an active market and whose fair value cannot be reliably measured are carried at cost, net of allowance for impairments. Held-to-maturity securities are carried at amortised cost using the effective interest method. Investment gains and losses on sales of securities are determined principally by specific identification. Realised and unrealised gains and losses arising from changes in the fair value of the securities at fair value through profit or loss category, and the change of fair value of available-for-sale debt securities due to foreign exchange impact on the amortised cost are included in net profit in the period in which they arise. The remaining unrealised gains and losses arising from changes in the fair value of available-for-sale securities are recognised in OCI. When securities classified as available-for-sale securities are sold or impaired, the accumulated fair value adjustments are included in net profit as realised gains on financial assets.
Term deposits primarily represent traditional bank deposits which have fixed maturity dates and are stated at amortised cost.
Loans are carried at amortised cost, net of allowance for impairment.
The Group purchases securities under agreements to resell substantially identical securities. These agreements are classified as secured loans and are recorded at amortised cost, i.e., their costs plus accrued interests at the end of the reporting period, which approximates fair value. The amounts advanced under these agreements are reflected as assets in the consolidated statement of financial position. The Group does not take physical possession of securities purchased under agreements to resell. Sale or transfer of the securities is not permitted by the respective clearing house on which they are registered while the lent capital is outstanding. In the event of default by the counterparty, the Group has the right to the underlying securities held by the clearing house.
149
Notes to the Consolidated Financial Statements (continued)
For the year ended 31 December 2021
| 2 | SUMMARY OF SIGNIFICANT ACCOUNTING POLICIES (continued) |
| 2.9 | Financial assets (continued) |
| 2.9.c | Impairment of financial assets other than securities at fair value through profit or loss |
Financial assets other than those accounted for as at fair value through profit or loss are adjusted for impairment, where there are declines in value that are considered to be impaired. In evaluating whether a decline in value is an impairment for these financial assets, the Group considers several factors including, but not limited to, the following:
| • | significant financial difficulty of the issuer or debtor; |
| • | a breach of contract, such as a default or delinquency in payments; |
| • | it becomes probable that the issuer or debtor will enter into bankruptcy or other financial reorganisation; and |
| • | the disappearance of an active market for that financial asset because of financial difficulties. |
In evaluating whether a decline in value is impairment for equity securities, the Group also considers the extent or the duration of the decline. The quantitative factors include the following:
| • | the market price of the equity securities was more than 50% below their cost at the reporting date; |
| • | the market price of the equity securities was more than 20% below their cost for a period of at least six months at the reporting date; and |
| • | the market price of the equity securities was below their cost for a period of more than one year (including one year) at the reporting date. |
When the decline in value is considered impairment, held-to-maturity debt securities are written down to their present value of estimated future cash flows discounted at the securities’ effective interest rates, available-for-sale debt securities and equity securities are written down to their fair value, and the change is recorded in net realised gains on financial assets in the period the impairment is recognised. The impairment loss is reversed through net profit if in a subsequent period the fair value of a debt security increases and the increase can be objectively related to an event occurring after the impairment loss was recognised through net profit. The impairment losses recognised in net profit on equity instruments are not reversed through net profit.
| 2.10 | Fair value measurement |
The Group measures financial instruments, such as securities at fair value through profit or loss and available-for-sale securities, at fair value at each reporting date. Fair value is the price that would be received to sell an asset or paid to transfer a liability in an orderly transaction between market participants at the measurement date. The fair value measurement of assets and liabilities is based on the presumption that the transaction to sell the asset or transfer the liability takes place either:
| • | in the principal market for the asset or liability, or |
| • | in the absence of a principal market, in the most advantageous market for the asset or liability. |
The principal or the most advantageous market must be accessible by the Group at the measurement date.
The fair value of an asset or a liability is measured using the assumptions that market participants would use when pricing the asset or liability, assuming that market participants act in their economic best interest.
A fair value measurement of a non-financial asset takes into account a market participant’s ability to generate economic benefits by using the asset in its highest and best use or by selling it to another market participant that would use the asset in its highest and best use.
150
Notes to the Consolidated Financial Statements (continued)
For the year ended 31 December 2021
| 2 | SUMMARY OF SIGNIFICANT ACCOUNTING POLICIES (continued) |
| 2.10 | Fair value measurement (continued) |
The Group uses valuation techniques that are appropriate in the circumstances and for which sufficient data are available to measure fair value, maximising the use of relevant observable inputs and minimising the use of unobservable inputs.
All assets and liabilities for which fair value is measured or disclosed in the consolidated financial statements are categorised within the fair value hierarchy, described in Notes 4.4, 8, 11 and 41(c) based on the lowest level input that is significant to the fair value measurement as a whole.
For assets and liabilities that are measured at fair value on a recurring basis, the Group determines whether transfers have occurred between each level in the hierarchy by re-assessing categorisation (based on the lowest level input that is significant to the fair value measurement as a whole) at the end of each reporting period.
| 2.11 | Cash and cash equivalents |
Cash amounts represent cash on hand and demand deposits. Cash equivalents are short-term, highly liquid investments with original maturities of 90 days or less, whose carrying value approximates fair value.
| 2.12 | Insurance contracts and investment contracts |
| 2.12.1 | Classification |
The Group issues contracts that transfer insurance risk or financial risk or both. The contracts issued by the Group are classified as insurance contracts and investment contracts. Insurance contracts are those contracts that transfer significant insurance risk. They may also transfer financial risk. Investment contracts are those contracts that transfer financial risk without significant insurance risk. A number of insurance and investment contracts contain a discretionary participating feature (“DPF”). This feature entitles the policyholders to receive additional benefits or bonuses that are, at least in part, at the discretion of the Group.
| 2.12.2 | Insurance contracts |
| 2.12.2.a | Recognition and measurement |
| (i) | Short-term insurance contracts |
Premiums from the sale of short duration accident and health insurance products are recorded when written and are accreted to earnings on a pro-rata basis over the term of the related policy coverage. Reserves for short duration insurance products consist of unearned premium reserve and expected claims and claim adjustment expenses reserve. Actual claims and claim adjustment expenses are charged to net profit as incurred.
The unearned premium reserve represents the portion of the premiums written net of certain acquisition costs relating to the unexpired terms of coverage.
Reserves for claims and claim adjustment expenses consist of the reserves for reported and unreported claims and reserves for claims expenses with respect to insured events. In developing these reserves, the Group considers the nature and distribution of the risks, claims cost development, and experiences in deriving the reasonable estimated amount and the applicable margins. The methods used for reported and unreported claims include the case-by-case estimation method, average cost per claim method, chain ladder method, etc. The Group calculates the reserves for claims expenses based on the reasonable estimates of the future payments for claims expenses.
| (ii) | Long-term insurance contracts |
Long-term insurance contracts include whole life insurance, term life insurance, endowment insurance and annuity policies with significant life contingency risk. Premiums are recognised as revenue when due from policyholders.
The Group uses the discounted cash flow method to estimate the reserve of long-term insurance contracts. The reserve of long-term insurance contracts consists of a reasonable estimate of liability, a risk margin and a residual margin. The long-term insurance contract liabilities are calculated using various assumptions, including assumptions on mortality rates, morbidity rates, lapse rates, discount rates, and expense assumptions, and based on the following principles:
151
Notes to the Consolidated Financial Statements (continued)
For the year ended 31 December 2021
| 2 | SUMMARY OF SIGNIFICANT ACCOUNTING POLICIES (continued) |
| 2.12 | Insurance contracts and investment contracts (continued) |
| 2.12.2 | Insurance contracts (continued) |
| 2.12.2.a | Recognition and measurement (continued) |
| (ii) | Long-term insurance contracts (continued) |
| (a) | The reasonable estimate of liability for long-term insurance contracts is the present value of reasonable estimates of future cash outflows less future cash inflows. The expected future cash inflows include cash inflows of future premiums arising from the undertaking of insurance obligations, with consideration of decrement mostly from death and surrenders. The expected future cash outflows are cash outflows incurred to fulfil contractual obligations, consisting of the following: |
| • | guaranteed benefits based on contractual terms, including payments for deaths, disabilities, diseases, survivals, maturities and surrenders; |
| • | additional non-guaranteed benefits, such as policyholder dividends; and |
| • | reasonable expenses incurred to manage insurance contracts or to process claims, including maintenance expenses and claim settlement expenses. Future administration expenses are included in the maintenance expenses. Expenses are determined based on expense analysis with consideration of future inflation and the Group’s expense management control. |
On each reporting date, the Group reviews the assumptions for reasonable estimates of liability and risk margins, with consideration of all available information, taking into account the Group’s historical experience and expectation of future events. Changes in assumptions are recognised in net profit. Assumptions for the amortisation of residual margin are locked in at policy issuance and are not adjusted at each reporting date.
| (b) | Margin has been taken into consideration while computing the reserve of insurance contracts, measured separately and recognised in net profit in each period over the life of the contracts. At the inception of the contracts, the Group does not recognise Day 1 gain, whereas on the other hand, Day 1 loss is recognised in net profit immediately. |
Margin comprises risk margin and residual margin. Risk margin is the reserve accrued to compensate for the uncertain amount and timing of future cash flows. At the inception of the contract, the residual margin is calculated net of certain acquisition costs, mainly consist of underwriting and policy acquisition costs, by the Group representing Day 1 gain and will be amortised over the life of the contracts. For insurance contracts of which future returns are affected by investment yields of corresponding investment portfolios, their related residual margins are amortised based on estimated future participating dividends payable to policyholders. For insurance contracts of which future returns are not affected by investment yields of corresponding investment portfolios, their related residual margins are amortised based on sum assured of outstanding policies. The subsequent measurement of the residual margin is independent from the reasonable estimate of future discounted cash flows and risk margin. The assumption changes have no effect on the subsequent measurement of the residual margin.
| (c) | The Group has considered the impact of time value on the reserve calculation for insurance contracts. |
| (iii) | Universal life contracts and unit-linked contracts |
Universal life contracts and unit-linked contracts are unbundled into the following components:
| • | insurance components |
| • | non-insurance components |
The insurance components are accounted for as insurance contracts; and the non-insurance components are accounted for as investment contracts (Note 2.12.3), which are stated in the investment contract liabilities.
152
Notes to the Consolidated Financial Statements (continued)
For the year ended 31 December 2021
| 2 | SUMMARY OF SIGNIFICANT ACCOUNTING POLICIES (continued) |
| 2.12 | Insurance contracts and investment contracts (continued) |
| 2.12.2 | Insurance contracts (continued) |
| 2.12.2.b | Liability adequacy test |
The Group assesses the adequacy of insurance contract reserves using the current estimate of future cash flows with available information at the end of each reporting period. If that assessment shows that the carrying amount of its insurance liabilities (less related intangible assets, if applicable) is inadequate in light of the estimated future cash flows, the insurance contract reserves will be adjusted accordingly, and any changes of the insurance contract liabilities will be recognised in net profit.
| 2.12.2.c | Reinsurance contracts held |
Contracts with reinsurers under which the Group is compensated for losses on one or more contracts issued by the Group and that meet the classification requirements for insurance contracts are classified as reinsurance contracts held. Contracts with reinsurers that do not meet these classification requirements are classified as financial assets. Insurance contracts entered into by the Group under which the contract holder is another insurer (inwards reinsurance) are included with insurance contracts.
The benefits to which the Group is entitled under its reinsurance contracts held are recognised as reinsurance assets. Amounts recoverable from or due to reinsurers are measured consistently with the amounts associated with the reinsured insurance contracts and in accordance with the terms of each reinsurance contract. Reinsurance liabilities are primarily premiums payable for reinsurance contracts and are recognised as expenses when due.
The Group assesses its reinsurance assets for impairment as at the end of reporting period. If there is objective evidence that the reinsurance asset is impaired, the Group reduces the carrying amount of the reinsurance asset to its recoverable amount and recognises that impairment loss in net profit.
| 2.12.3 | Investment contracts |
For investment contracts with or without DPF, the Company’s policy fee income mainly consists of acquisition cost and various fees (handling fees and management fees, etc.) over the period of which the service is provided. Policy fee income net of certain acquisition cost is amortised over the expected life of the contracts by period and recognised in revenue.
Except for unit-linked contracts, of which the liabilities are carried at fair value, the liabilities of investment contracts are carried at amortised cost.
| 2.12.4 | DPF in long-term insurance contracts and investment contracts |
DPF is contained in certain long-term insurance contracts and investment contracts. These contracts are collectively called participating contracts. The Group is obligated to pay to the policyholders of participating contracts as a group at the higher of 70% of accumulated surplus available and the rate specified in the contracts. The accumulated surplus available mainly arises from net investment income and gains and losses arising from the assets supporting these contracts. To the extent unrealised gains or losses from available-for-sale securities are attributable to policyholders, shadow adjustments are recognised in OCI. The surplus owed to policyholders is recognised as policyholder dividends payable whether it is declared or not. The amount and timing of distribution to individual policyholders of participating contracts are subject to future declarations by the Group.
| 2.13 | Financial liabilities at fair value through profit or loss |
Financial liabilities at fair value through profit or loss are the portions owned by the external investors in the consolidated structured entities (open-ended funds). Such financial liabilities are designated at fair value upon initial recognition, and all realised or unrealised gains or losses are recognised in net profit.
153
Notes to the Consolidated Financial Statements (continued)
For the year ended 31 December 2021
| 2 | SUMMARY OF SIGNIFICANT ACCOUNTING POLICIES (continued) |
| 2.14 | Securities sold under agreements to repurchase |
The Group retains substantially all the risk and rewards of ownership of securities sold under agreements to repurchase which generally mature within 180 days from the transaction date. Therefore, securities sold under agreements to repurchase are classified as secured borrowings. The Group may be required to provide additional collateral based on the fair value of the underlying securities. Securities sold under agreements to repurchase are recorded at amortised cost, i.e., their cost plus accrued interest at the end of the reporting period. It is the Group’s policy to maintain effective control over securities sold under agreements to repurchase which includes maintaining physical possession of the securities. Accordingly, such securities continue to be carried on the consolidated statement of financial position.
| 2.15 | Bonds payable |
Bonds payable are initially recognised at fair value and subsequently measured at amortised cost using the effective interest rate method. Amortised cost is calculated by taking into account any discount or premium at acquisition and transaction costs.
| 2.16 | Derivative instruments |
Derivatives are initially recognised at fair value on the date on which a derivative contract is entered into and are subsequently re-measured at their fair value. The resulting gain or loss of derivative financial instruments is recognised in net profit. All derivatives are carried as assets when fair value is positive and as liabilities when fair value is negative.
Embedded derivatives that are not closely related to their host contracts and meet the definition of a derivative are separated and fair valued through profit or loss. The Group does not separately measure embedded derivatives that meet the definition of an insurance contract or embedded derivatives that are closely related to host insurance contracts including embedded options to surrender insurance contracts for a fixed amount (or an amount based on a fixed amount and an interest rate).
| 2.17 | Employee benefits |
Pension benefits
Full-time employees of the Group are covered by various government-sponsored pension plans, under which the employees are entitled to a monthly pension based on certain formulae. These government agencies are responsible for the pension liability to these employees upon retirement. The Group contributes on a monthly basis to these pension plans. All contributions made under the government-sponsored pension plans described above are fully attributable to employees at the time of the payment and the Group is unable to forfeit any amounts contributed by it to such plans. In addition to the government-sponsored pension plans, the Group established an employee annuity fund plan pursuant to the relevant laws and regulations in the PRC, whereby the Group is required to contribute to the plan at fixed rates of the employees’ salary costs. Contributions made by the Group under the annuity fund plan that is forfeited in respect of those employees who resign from their positions prior to the full vesting of the contributions will be recorded in the public account of the annuity fund and shall not be used to offset any contributions to be made by the Group in the future. All funds in the public account will be attributed to the employees whose accounts are in normal status after the approval procedures are completed as required. Under these plans, the Group has no legal or constructive obligation for retirement benefit beyond the contributions made.
Housing benefits
All full-time employees of the Group are entitled to participate in various government-sponsored housing funds. The Group contributes on a monthly basis to these funds based on certain percentages of the salaries of the employees. The Group’s liability in respect of these funds is limited to the contributions payable in each year.
Stock appreciation rights
Compensation under the stock appreciation rights is measured based on the fair value of the liabilities incurred and is expensed over the vesting period. Valuation techniques including option pricing models are used to estimate fair value of relevant liabilities. The liability is re-measured at the end of each reporting period to its fair value until settlement. Fair value changes in the vesting period are included in administrative expenses and changes after the vesting period are included in net fair value gains through profit or loss in net profit. The related liability is included in other liabilities.
154
Notes to the Consolidated Financial Statements (continued)
For the year ended 31 December 2021
| 2 | SUMMARY OF SIGNIFICANT ACCOUNTING POLICIES (continued) |
| 2.18 | Share capital |
Ordinary shares are classified as equity. Incremental costs directly attributable to the issue of equity instruments are shown in equity as a deduction, net of tax, from the proceeds.
| 2.19 | Other equity instruments |
Other equity instruments are Core Tier 2 Capital Securities issued by the Group. These securities contain no contractual obligation to deliver cash or another financial asset; or to exchange financial assets or financial liabilities with another entity under conditions that are potentially unfavourable to the Group; or to be settled in the Group’s own equity instruments. Therefore, the Group classifies these securities as other equity instruments. Fees, commissions and other transaction costs of these securities’ issuance are deducted from equity. The distributions of the securities are recognised as profit distribution at the time of declaration.
| 2.20 | Revenue recognition |
Turnover of the Group represents the total revenues which include the following:
Premiums
Premiums from long-term insurance contracts are recognised as revenue when due from the policyholders.
Premiums from the sale of short duration accident and health insurance products are recorded when written and are accreted to earnings on a pro-rata basis over the term of the related policy coverage.
Policy fee income
The policy fee income for investment contracts mainly consists of acquisition costs and various fees (handling fees and management fees, etc.) over the period of which the service is provided. Policy fee income net of certain acquisition costs is amortised over the expected life of the contracts and recognised as other income.
Investment income
Investment income comprises interest income from term deposits, cash and cash equivalents, debt securities, securities purchased under agreements to resell, loans and dividend income from equity securities. Interest income is recorded on an accrual basis using the effective interest rate method. Dividend income is recognised when the right to receive dividend payment is established.
| 2.21 | Finance costs |
Interest expenses for bonds payable, securities sold under agreements to repurchase, interest-bearing loans, borrowings and lease liabilities are recognised within finance costs in net profit using the effective interest rate method.
| 2.22 | Current and deferred income taxation |
Income tax expense for the period comprises current and deferred tax. Income tax is recognised in net profit, except to the extent that it relates to items recognised directly in OCI where the income tax is recognised in OCI.
Current income tax assets and liabilities for the current period are calculated on the basis of the tax laws enacted or substantively enacted at the end of each reporting period in the jurisdictions where the Company and its subsidiaries operate and generate taxable income. Management periodically evaluates positions taken with respect to situations in which applicable tax regulations are subject to interpretation.
155
Notes to the Consolidated Financial Statements (continued)
For the year ended 31 December 2021
| 2 | SUMMARY OF SIGNIFICANT ACCOUNTING POLICIES (continued) |
| 2.22 | Current and deferred income taxation (continued) |
Deferred income tax is recognised, using the liability method, on temporary differences arising between the tax bases of assets and liabilities and their carrying amounts in the consolidated financial statements. Substantively enacted tax rates are used in the determination of deferred income tax.
Deferred income tax is provided on temporary differences arising on investments in subsidiaries, associates and joint ventures except where the timing of the reversal of the temporary difference can be controlled and it is probable that the temporary difference will not be reversed in the foreseeable future.
The carrying amount of deferred tax assets is reviewed at the end of each reporting period and reduced to the extent that it is no longer probable that sufficient taxable profit will be available to allow all or part of the deferred tax asset to be utilised. Conversely, previously unrecognised deferred tax assets are reassessed by the end of each reporting period and are recognised to the extent that it is probable that sufficient taxable profit will be available to allow all or part of the deferred tax asset to be utilised.
Deferred tax assets and liabilities are measured at the tax rates that are expected to apply to the period when the asset is realised or the liability is settled, based on tax rates (and tax laws) that have been enacted or substantively enacted at the end of the reporting period.
Deferred tax assets and deferred tax liabilities are offset if and only if the Group has a legally enforceable right to set off current tax assets and current tax liabilities and the deferred tax assets and deferred tax liabilities relate to income tax levied by the same taxation authority on either the same taxable entity or different taxable entities which intend either to settle current tax liabilities and assets on a net basis, or to realise the assets and settle the liabilities simultaneously, in each future period in which significant amounts of deferred tax liabilities or assets are expected to be settled or recovered.
| 2.23 | Provisions and contingencies |
Provisions are recognised when the Group has a present legal or constructive obligation as a result of past events; it is probable that an outflow of resources will be required to settle the obligation; and the amount has been reliably estimated. Provisions are not recognised for future operating losses.
A contingent liability is a possible obligation that arises from past events and whose existence will only be confirmed by the occurrence or non-occurrence of one or more uncertain future events not wholly within the control of the Group. It can also be a present obligation arising from past events that is not recognised because it is not probable that outflow of economic resources will be required, or the amount of obligation cannot be measured reliably.
A contingent liability is not recognised in the consolidated statement of financial position but is disclosed in the notes to the consolidated financial statements. When a change in the probability of an outflow occurs so that such outflow is probable and can be reliably measured, it will then be recognised as a provision.
| 2.24 | Dividend distribution |
Dividend distribution to the Company’s equity holders is recognised as a liability in the Group’s consolidated financial statements in the year in which the dividends are approved by the Company’s equity holders.
156
Notes to the Consolidated Financial Statements (continued)
For the year ended 31 December 2021
| 3 | CRITICAL ACCOUNTING ESTIMATES AND JUDGEMENTS |
The Group makes estimates and assumptions that affect the reported amounts of assets and liabilities. Estimates and judgements are continually evaluated and based on historical experience and other factors, including expectations of future events that are believed to be reasonable under the circumstances. The Group exercises significant judgement in making appropriate assumptions.
Areas susceptible to changes in critical estimates and judgements, which affect the carrying value of assets and liabilities, are set out below. It is possible that actual results may be different from the estimates and judgements referred to below.
| 3.1 | Estimates of future benefit payments and premiums arising from long-term insurance contracts |
The determination of the liabilities under long-term insurance contracts is based on estimates of future benefit payments, premiums and relevant expenses made by the Group and the margins. Assumptions about mortality rates, morbidity rates, lapse rates, discount rates, expense assumptions and policy dividend assumptions are made based on the most recent historical analysis and current and future economic conditions. The liability uncertainty arising from uncertain future benefit payments, premiums and relevant expenses is reflected in the risk margin.
The residual margin relating to the long-term insurance contracts is amortised over the expected life of the contracts, based on the assumptions (mortality rates, morbidity rates, lapse rates, discount rates, expenses assumption and policy dividend assumptions) that are determined at inception of the contracts and remain unchanged for the duration of the contracts.
The judgements exercised in the valuation of insurance contract liabilities (including contracts with DPF) affect the amounts recognised in the consolidated financial statements as insurance contract benefits and insurance contract liabilities.
The impact of the various assumptions and their changes are described in Note 15.
157
Notes to the Consolidated Financial Statements (continued)
For the year ended 31 December 2021
| 3 | CRITICAL ACCOUNTING ESTIMATES AND JUDGEMENTS (continued) |
| 3.2 | Financial instruments |
The Group’s principal investments are debt securities, equity securities, term deposits and loans. The critical estimates and judgements are those associated with the recognition of impairment and the measurement of fair value.
The Group considers a wide range of factors in the impairment assessment as described in Note 2.9.c.
Fair value is the price that would be received to sell an asset or paid to transfer a liability in an orderly transaction between market participants at the measurement date. When the fair values of financial assets and liabilities recorded in the consolidated statement of financial position cannot be measured based on quoted prices in active markets, their fair value is measured using valuation techniques which require a degree of judgements. The methods and assumptions used by the Group in measuring the fair value of financial instruments are as follows:
| • | debt securities: fair values are generally based upon current bid prices. Where current bid prices are not readily available, fair values are estimated using either prices observed in recent transactions, values obtained from current bid prices of comparable investments or valuation techniques when the market is not active. |
| • | equity securities: fair values are generally based upon current bid prices. Where current bid prices are not readily available, fair values are estimated using either prices observed in recent transactions or commonly used market pricing models. Equity securities, for which fair values cannot be measured reliably, are recognised at cost less impairment. |
| • | securities purchased under agreements to resell, policy loans, term deposits, interest-bearing loans and borrowings, and securities sold under agreements to repurchase: the carrying amounts of these assets in the consolidated statement of financial position approximate fair value. |
| • | fair values of other loans are obtained from valuation techniques. |
For the description of valuation techniques, please refer to Note 4.4. Using different valuation techniques and parameter assumptions may lead to some differences of fair value estimations.
| 3.3 | Impairment of investments in associates and joint ventures |
The Group assesses whether there are any indicators of impairment for investments in associates and joint ventures at the end of each reporting period. Investments in associates and joint ventures are tested for impairment when there are indicators that the carrying amounts may not be recoverable. An impairment exists when the carrying value of investments in associates and joint ventures exceeds its recoverable amount, which is the higher of its fair value less costs of disposal and its value in use. The calculation of the fair value less costs of disposal is based on available data from binding sales transactions in an arm’s length transaction of similar assets or observable market prices less incremental costs for disposing of investments in associates and joint ventures. When value in use calculations are undertaken, the Group must estimate the expected future cash flows from investments in associates and joint ventures and choose a suitable discount rate in order to calculate the present value of those cash flows.
| 3.4 | Income tax |
The Group is subject to income tax in numerous jurisdictions. During the normal course of business, certain transactions and activities for which the ultimate tax determination is uncertain, the Group needs to exercise significant judgement when determining the income tax. If the final settlement results of the tax matters are different from the amounts recorded, these differences will impact the final income tax expense and deferred tax for the period.
158
Notes to the Consolidated Financial Statements (continued)
For the year ended 31 December 2021
| 3 | CRITICAL ACCOUNTING ESTIMATES AND JUDGEMENTS (continued) |
| 3.5 | Determination of control over investee |
The Group applies its judgement to determine whether the control indicators set out in Note 2.2 indicate that the Group controls structured entities such as funds and asset management products.
The Group issues certain structured entities (e.g. funds and asset management products), and acts as a manager for such entities according to the contracts. In addition, the Group may be exposed to variability of returns as a result of holding shares of the structured entities. Determining whether the Group controls such structured entities usually focuses on the assessment of the aggregate economic interests of the Group in the entities (including any carried interests and expected management fees) and the decision-making rights on the entity. As at 31 December 2021, the Group has consolidated some funds issued and managed by the Company’s subsidiary, China Life AMP Asset Management Company (“CL AMP”), some debt investment schemes and asset management products issued and managed by the Company’s subsidiary, China Life Asset Management Company Limited (“AMC”) and some trust schemes and debt investment schemes issued and managed by third parties in the consolidated financial statements. Please refer to Note 41(d) for the details.
| 4 | RISK MANAGEMENT |
Risk management is carried out by the Company’s Risk Management Committee under policies approved by the Company’s Board of Directors.
The Group issues contracts that transfer insurance risk or financial risk or both. This section summarises these risks and the way the Group manages them.
| 4.1 | Insurance risk |
| 4.1.1 | Types of insurance risks |
The risk under any one insurance contract is the possibility that an insured event occurs and the uncertainty about the amount of the resulting claim. By the very nature of an insurance contract, this risk is random and therefore unpredictable. For a portfolio of insurance contracts where the theory of probability is applied to the pricing and provisioning, the principal risk that the Group faces under its insurance contracts is that the actual claims and benefit payments are less favourable than the underlying assumptions used in establishing the insurance liabilities. This occurs when the frequency or severity of claims and benefits exceeds the estimates. Insurance events are random, and the actual number of claims and the amount of benefits paid will vary each year from estimates established using statistical techniques.
Experience shows that the larger the portfolio of similar insurance contracts, the smaller the relative variability of the expected outcome will be. In addition, a more diversified portfolio is less likely to be affected across the board by a change in any subset of the portfolio. The Group has developed its insurance underwriting strategy to diversify the types of insurance risks accepted and within each of these categories to achieve a sufficiently large population to reduce the variability of the expected outcome. The Group manages insurance risk through underwriting strategies, reinsurance arrangements and claims handling.
The Group manages insurance risks through two types of reinsurance agreements, ceding on a quota share basis or a surplus basis, to cover insurance liability risk. Reinsurance contracts cover almost all products, which contain risk liabilities. The products reinsured include: life insurance, accident and health insurance or death, disability, accident, illness and assistance in terms of product category or function, respectively. These reinsurance agreements spread insured risk to a certain extent and reduce the effect of potential losses to the Group. However, the Group’s direct insurance liabilities to the policyholder are not eliminated because of the credit risk associated with the failure of reinsurance companies to fulfil their responsibilities.
159
Notes to the Consolidated Financial Statements (continued)
For the year ended 31 December 2021
| 4 | RISK MANAGEMENT (continued) |
| 4.1 | Insurance risk (continued) |
| 4.1.2 | Concentration of insurance risks |
Insurance operations of the Group are mainly located in the PRC. There are no significant differences among the regions where the Group underwrites insurance contracts.
The table below presents the Group’s major products of long-term insurance contracts:
| For the year ended 31 December | ||||||||||||||||
| 2021 | 2020 | |||||||||||||||
Product name | RMB million | % | RMB million | % | ||||||||||||
Premiums of long-term insurance contracts | ||||||||||||||||
Xin Xiang Zhi Zun Annuity (Celebration Version) (a) | 40,851 | 7.52 | % | 42,657 | 7.96 | % | ||||||||||
Xin Xiang Jin Sheng Annuity (A Version) (b) | 34,094 | 6.28 | % | 34,828 | 6.50 | % | ||||||||||
Xin Fu Ying Jia Annuity (c) | 23,114 | 4.26 | % | 24,116 | 4.50 | % | ||||||||||
Kang Ning Whole Life (d) | 15,430 | 2.84 | % | 17,553 | 3.27 | % | ||||||||||
Hong Ying Participating Endowment (e) | 66 | 0.01 | % | 137 | 0.03 | % | ||||||||||
Others (f) | 429,419 | 79.09 | % | 416,859 | 77.74 | % | ||||||||||
|
|
|
|
|
|
|
| |||||||||
Total | 542,974 | 100.00 | % | 536,150 | 100.00 | % | ||||||||||
|
|
|
|
|
|
|
| |||||||||
Insurance benefits of long-term insurance contracts | ||||||||||||||||
Xin Xiang Zhi Zun Annuity (Celebration Version) (a) | 67 | 0.08 | % | 21 | 0.03 | % | ||||||||||
Xin Xiang Jin Sheng Annuity (A Version) (b) | 145 | 0.17 | % | 58 | 0.07 | % | ||||||||||
Xin Fu Ying Jia Annuity (c) | 1,826 | 2.16 | % | 1,823 | 2.17 | % | ||||||||||
Kang Ning Whole Life (d) | 5,653 | 6.70 | % | 5,075 | 6.05 | % | ||||||||||
Hong Ying Participating Endowment (e) | 10,315 | 12.22 | % | 11,393 | 13.59 | % | ||||||||||
Others (f) | 66,412 | 78.67 | % | 65,484 | 78.09 | % | ||||||||||
|
|
|
|
|
|
|
| |||||||||
Total | 84,418 | 100.00 | % | 83,854 | 100.00 | % | ||||||||||
|
|
|
|
|
|
|
| |||||||||
| As at 31 December 2021 | As at 31 December 2020 | |||||||||||||||
| RMB million | % | RMB million | % | |||||||||||||
Liabilities of long-term insurance contracts | ||||||||||||||||
Xin Xiang Zhi Zun Annuity (Celebration Version) (a) | 73,283 | 2.17 | % | 30,885 | 1.05 | % | ||||||||||
Xin Xiang Jin Sheng Annuity (A Version) (b) | 101,608 | 3.01 | % | 64,055 | 2.18 | % | ||||||||||
Xin Fu Ying Jia Annuity (c) | 140,196 | 4.15 | % | 114,111 | 3.89 | % | ||||||||||
Kang Ning Whole Life (d) | 365,246 | 10.81 | % | 338,286 | 11.52 | % | ||||||||||
Hong Ying Participating Endowment (e) | 14,479 | 0.43 | % | 24,398 | 0.83 | % | ||||||||||
Others (f) | 2,684,791 | 79.43 | % | 2,364,798 | 80.53 | % | ||||||||||
|
|
|
|
|
|
|
| |||||||||
Total | 3,379,603 | 100.00 | % | 2,936,533 | 100.00 | % | ||||||||||
|
|
|
|
|
|
|
| |||||||||
160
Notes to the Consolidated Financial Statements (continued)
For the year ended 31 December 2021
| 4 | RISK MANAGEMENT (continued) |
| 4.1 | Insurance risk (continued) |
| 4.1.2 | Concentration of insurance risks (continued) |
| (a) | Xin Xiang Zhi Zun Annuity (Celebration Version) is an annuity insurance contract with the options for regular premium of 3 years and 5 years paid annually or monthly. Its insured period is 10 years. This product is applicable to healthy policyholders between 28-day-old and 68-year-old. From the first effective date after the fifth policy years to the expiration period, if the policyholders live to the annual corresponding effective date, the annuity payment shall be paid at 60% of annual premium according to the basic sum insured if the payment period is 3 years; and the annuity payment shall be paid at 100% of annual premium according to the basic sum insured if the payment period is 5 years. If the policyholders live to the annual corresponding effective date of the expiration period, the contract terminates and maturity benefit is paid at the basic sum insured. If death incurred over insured period, the contract terminates and death benefit is paid at the premium received (without interest). |
| (b) | Xin Xiang Jin Sheng Annuity (A Version) is an annuity insurance contract with the options for regular premium of 3 years and 5 years paid annually or monthly. Its insured period is 15 years. This product is applicable to healthy policyholders between 28-day-old and 65-year-old. From the effective date to the contractual date starting to claim of Xin Xiang Jin Sheng Annuity (A Version) after the fifth policy years or sixth policy years, if the policyholders live to the annual corresponding effective date, the annuity payment shall be paid at 50% of annual premium according to the basic sum insured if the payment period is 3 years; and the annuity payment shall be paid at 100% of annual premium according to the basic sum insured if the payment period is 5 years. From the first effective date after the seventh policy years to the expiration period, if the policyholders live to the annual corresponding effective date, the annuity payment shall be paid at 24% of annual premium according to the basic sum insured if the payment period is 3 years; and the annuity payment shall be paid at 32% of annual premium according to the basic sum insured if the payment period is 5 years. If the policyholders live to the annual corresponding effective date of the expiration period, the contract terminates and maturity benefit is paid at the basic sum insured. If death incurred over insured period, the contract terminates and death benefit is paid at the premium received (without interest). |
| (c) | Xin Fu Ying Jia Annuity is an annuity insurance contract with the options for regular premium of 3 years, 5 years or 10 years. Its insured period extends from the effective date of Xin Fu Ying Jia Annuity to the corresponding date when policyholders reach the age of 88. This product is applicable to healthy policyholders between 28-day-old and 70-year-old. There are 12 age ranges for policyholders to choose to receive care money, which are: thirty, thirty-five, forty, forty-five, fifty, fifty-five, sixty, sixty-five, seventy, seventy-five, eighty, and eighty-five years old. From the effective date to the contractual date starting to claim of Xin Fu Ying Jia Annuity, the annuity payment of first policy year is paid at 20% of the first premium of the product, and the following annuity payments are paid at 20% of the basic sum insured by Xin Fu Ying Jia Annuity. From the first corresponding date after the contractual date starting to claim of annuity, to the corresponding date when the policyholders reach the age of 88-year-old, annuity is paid at 3% of the basic sum insured during the insured period if policyholders live to the annual corresponding effective date; annuity is paid at the premium received (without interest) during the insured period if policyholders live to the contractual date starting to claim of annuity; the contract terminates and death benefit is paid at the premium received (without interest) or the cash value of the contract, whichever greater when death incurred before the contractual date starting to claim of annuity; the contract terminates and death benefit is paid at the cash value of the contract when death incurred after contractual date starting to claim of annuity; the contract terminates and accidental death benefit is paid at the premium received (without interest) less any death benefit paid when accidents occurred and due to which death incurred within 180 days. Death benefit and accidental death benefit are paid only once. |
161
Notes to the Consolidated Financial Statements (continued)
For the year ended 31 December 2021
| 4 | RISK MANAGEMENT (continued) |
| 4.1 | Insurance risk (continued) |
| 4.1.2 | Concentration of insurance risks (continued) |
| (d) | Kang Ning Whole Life is a whole life insurance contract with the options for single premium or regular premium of 10 years or 20 years and the payment methods of insurance are divided into single payment, annual payment, and semi-annual payment. This product is applicable to healthy policyholders under 70-year-old. The critical illness benefit is paid at 200% of the basic sum insured. If the critical illness benefits are paid within the payment period, the insurance premium of each subsequent period shall be exempted, and the contract shall continue to be valid from the date of the payment of the critical illness benefits. Both death and disability benefits are paid at 300% of the basic sum insured less any critical illness benefits paid. |
| (e) | Hong Ying Participating Endowment is a participating endowment insurance contract with the options for single premium or regular premium of 3 years, 5 years or 10 years. Its insured period can be 6 years, 10 years or 15 years. This product is applicable to healthy policyholders between 30-day-old and 70-year-old. Maturity benefit of a single premium policy is paid at the basic sum insured, while that of a regular premium policy is paid at the basic sum insured multiplied by the number of years of the premium payments. Disease death benefit incurred within the first policy year is paid at the premium received (without interest). Disease death benefit incurred after the first policy year is paid at the basic sum insured for a single premium policy or the basic sum insured multiplied by the number of years of premium payments for a regular premium policy. When accidents occurred during taking a train, a ship or a flight period, death benefit is paid at the basic sum multiplied by 3 insured for a single premium policy or the basic sum multiplied by 3 and times the number of years of premium payments insured for a regular premium policy. When accidents occurred out of the period of taking a train, a ship or a flight, death benefit is paid at the basic sum multiplied by 2 insured for a single premium policy or the basic sum multiplied by 2 and times the number of years of premium payments insured for a regular premium policy. |
| (f) | Others consist of various long-term insurance contracts with no significant concentration. |
| 4.1.3 | Sensitivity analysis |
Sensitivity analysis of long-term insurance contracts
Liabilities for long-term insurance contracts and liabilities unbundled from universal life insurance contracts and unit-linked insurance contracts with insurance risk are calculated based on the assumptions on mortality rates, morbidity rates, lapse rates and discount rates. Changes in insurance contract reserve assumptions reflect the Company’s actual operating results and changes in its expectation of future events. The Company considers the potential impact of future risk factors on its operating results and incorporates such potential impact in the determination of assumptions.
Holding all other variables constant, if mortality rates and morbidity rates were to increase or decrease from the current best estimate by 10%, pre-tax profit for the year would have been RMB39,459 million or RMB40,963 million (as at 31 December 2020: RMB34,590 million or RMB35,955 million) lower or higher, respectively.
Holding all other variables constant, if lapse rates were to increase or decrease from the current best estimate by 10%, pre-tax profit for the year would have been RMB399 million or RMB472 million higher or lower, respectively (as at 31 December 2020: RMB707 million or RMB646 million lower or higher).
Holding all other variables constant, if the discount rates were 50 basis points higher or lower than the current best estimate, pre-tax profit for the year would have been RMB130,439 million or RMB152,136 million (as at 31 December 2020: RMB114,536 million or RMB131,732 million) higher or lower, respectively.
162
Notes to the Consolidated Financial Statements (continued)
For the year ended 31 December 2021
| 4 | RISK MANAGEMENT (continued) |
| 4.1 | Insurance risk (continued) |
| 4.1.3 | Sensitivity analysis (continued) |
Sensitivity analysis of short-term insurance contracts
The assumptions of reserves for claims and claim adjustment expenses may be affected by other variables such as claims payment of short-term insurance contracts, which may result in the synchronous changes to reserves for claims and claim adjustment expenses.
Holding all other variables constant, if claim ratios are 100 basis points higher or lower than the current assumption, pre- tax profit is expected to be RMB740 million (as at 31 December 2020: RMB733 million) lower or higher, respectively.
The following table indicates the claim development for short-term insurance contracts without taking into account the impacts of ceded business:
| Short-term insurance contracts (accident year) | ||||||||||||||||||||||||
Estimated claims expenses | 2017 | 2018 | 2019 | 2020 | 2021 | Total | ||||||||||||||||||
| RMB Million | ||||||||||||||||||||||||
Year end | 33,926 | 40,601 | 49,727 | 52,589 | 56,938 | |||||||||||||||||||
1 year later | 34,845 | 42,785 | 51,051 | 52,057 | ||||||||||||||||||||
2 years later | 34,328 | 41,945 | 50,972 | |||||||||||||||||||||
3 years later | 34,328 | 41,945 | ||||||||||||||||||||||
4 years later | 34,328 | |||||||||||||||||||||||
|
|
|
|
|
|
|
|
|
|
|
| |||||||||||||
Estimated accumulated claims expenses | 34,328 | 41,945 | 50,972 | 52,057 | 56,938 | 236,240 | ||||||||||||||||||
Accumulated claims expenses paid | (34,328 | ) | (41,945 | ) | (50,275 | ) | (49,157 | ) | (34,301 | ) | (210,006 | ) | ||||||||||||
|
|
|
|
|
|
|
|
|
|
|
| |||||||||||||
Unpaid claims expenses | — | — | 697 | 2,900 | 22,637 | 26,234 | ||||||||||||||||||
|
|
|
|
|
|
|
|
|
|
|
| |||||||||||||
The following table indicates the claim development for short-term insurance contracts taking into account the impacts of ceded business:
| Short-term insurance contracts (accident year) | ||||||||||||||||||||||||
Estimated claims expenses | 2017 | 2018 | 2019 | 2020 | 2021 | Total | ||||||||||||||||||
| RMB Million | ||||||||||||||||||||||||
Year end | 33,700 | 40,157 | 49,175 | 51,994 | 55,862 | |||||||||||||||||||
1 year later | 34,560 | 42,280 | 50,414 | 51,260 | ||||||||||||||||||||
2 years later | 34,045 | 41,442 | 50,315 | |||||||||||||||||||||
3 years later | 34,045 | 41,442 | ||||||||||||||||||||||
4 years later | 34,045 | |||||||||||||||||||||||
|
|
|
|
|
|
|
|
|
|
|
| |||||||||||||
Estimated accumulated claims expenses | 34,045 | 41,442 | 50,315 | 51,260 | 55,862 | 232,924 | ||||||||||||||||||
Accumulated claims expenses paid | (34,045 | ) | (41,442 | ) | (49,629 | ) | (48,406 | ) | (33,580 | ) | (207,102 | ) | ||||||||||||
|
|
|
|
|
|
|
|
|
|
|
| |||||||||||||
Unpaid claims expenses | — | — | 686 | 2,854 | 22,282 | 25,822 | ||||||||||||||||||
|
|
|
|
|
|
|
|
|
|
|
| |||||||||||||
163
Notes to the Consolidated Financial Statements (continued)
For the year ended 31 December 2021
| 4 | RISK MANAGEMENT (continued) |
| 4.2 | Financial risk |
The Group’s activities are exposed to a variety of financial risks. The key financial risk is that proceeds from the sale of financial assets will not be sufficient to fund the obligations arising from the Group’s insurance and investment contracts. The most important components of financial risk are market risk, credit risk and liquidity risk.
The Group’s overall risk management program focuses on the unpredictability of financial markets and seeks to minimise potential adverse effects on the financial performance of the Group. Risk management is carried out by a designated department under policies approved by management. The responsible department identifies, evaluates and manages financial risks in close cooperation with the Group’s operating units. The Group provides written principles for overall risk management, as well as written policies covering specific areas, such as managing market risk, credit risk, and liquidity risk.
The Group manages financial risk by holding an appropriately diversified investment portfolio as permitted by laws and regulations designed to reduce the risk of concentration in any one specific industry or issuer. The structure of the investment portfolio held by the Group is disclosed in Note 10.
The sensitivity analyses below are based on a change in an assumption while holding all other assumptions constant. In practice this is unlikely to occur, and changes in some of the assumptions may be correlated, such as change in interest rate and change in market price.
| 4.2.1 | Market risk |
| (i) | Interest rate risk |
Interest rate risk is the risk that the value or future cash flows of a financial instrument will fluctuate due to changes in market interest rates. The Group’s financial assets are principally composed of term deposits, debt securities and loans which are exposed to interest rate risk. Changes in the level of interest rates could have a significant impact on the Group’s overall investment return. Many of the Group’s insurance policies offer guaranteed returns to policyholders. These guarantees expose the Group to interest rate risk.
The Group manages interest rate risk through adjustments to portfolio structure and duration, and, to the extent possible, by monitoring the mean duration of its assets and liabilities.
The sensitivity analysis for interest rate risk illustrates how changes in interest income and the fair value of future cash flows of a financial instrument will fluctuate because of changes in market interest rates at the end of the reporting period.
As at 31 December 2021, if market interest rates were 50 basis points higher or lower with all other variables held constant, pre-tax profit for the year would have been RMB830 million (as at 31 December 2020: RMB627 million) higher or lower, respectively, mainly as a result of higher or lower interest income on floating rate cash and cash equivalents, term deposits, statutory deposits – restricted, debt securities and loans and the fair value losses or gains on debt securities assets at fair value through profit or loss. Pre-tax available-for-sale reserve in equity would have been RMB18,831 million (as at 31 December 2020: RMB13,906 million) lower or higher, as a result of a decrease or increase in the fair value of available-for-sale securities.
164
Notes to the Consolidated Financial Statements (continued)
For the year ended 31 December 2021
| 4 | RISK MANAGEMENT (continued) |
| 4.2 | Financial risk (continued) |
| 4.2.1 | Market risk (continued) |
| (ii) | Price risk |
Price risk arises mainly from the volatility of prices of equity securities held by the Group. Prices of equity securities are determined by market forces. The Group is subject to increased price risk mainly because China’s capital markets are relatively volatile.
The Group manages price risk by holding an appropriately diversified investment portfolio as permitted by laws and regulations designed to reduce the risk of concentration in any one specific industry or issuer.
As at 31 December 2021, if the prices of all the Group’s equity securities had increased or decreased by 10% with all other variables held constant, pre-tax profit for the year would have been RMB6,371 million (as at 31 December 2020: RMB6,596 million) higher or lower, respectively, mainly as a result of an increase or decrease in fair value of equity securities excluding available-for-sale securities. Pre-tax available-for-sale reserve in equity would have been RMB49,804 million (as at 31 December 2020: RMB45,939 million) higher or lower, respectively, as a result of an increase or decrease in fair value of available-for-sale equity securities. If prices decreased to the extent that the impairment criteria were met, a portion of such decrease of the available-for-sale equity securities would reduce pre-tax profit through impairment.
| (iii) | Currency risk |
Currency risk is the volatility of fair value or future cash flows of financial instruments resulted from changes in foreign currency exchange rates. The Group’s currency risk exposure mainly arises from cash and cash equivalents, term deposits, debt investments, equity investments, interest-bearing loans and borrowings denominated in currencies other than the functional currency, such as US dollar, HK dollar, GB pound and EUR, etc.
The following table summarises primary financial assets and financial liabilities denominated in currencies other than RMB as at 31 December 2021 and 2020, expressed in RMB equivalent:
As at 31 December 2021 | US dollar | HK dollar | GB pound | EUR | Others | Total | ||||||||||||||||||
Financial assets | ||||||||||||||||||||||||
Equity securities | ||||||||||||||||||||||||
– Available-for-sale securities | 10,989 | 75,694 | — | — | — | 86,683 | ||||||||||||||||||
– Securities at fair value through profit or loss | 4,776 | 897 | 391 | 1,433 | 927 | 8,424 | ||||||||||||||||||
Debt securities | ||||||||||||||||||||||||
– Held-to-maturity securities | 131 | — | — | — | — | 131 | ||||||||||||||||||
– Loans | 1,292 | — | — | — | — | 1,292 | ||||||||||||||||||
– Available-for-sale securities | 4,696 | — | — | — | — | 4,696 | ||||||||||||||||||
– Securities at fair value through profit or loss | 206 | — | 18 | 11 | 61 | 296 | ||||||||||||||||||
Term deposits | 7,785 | — | — | — | — | 7,785 | ||||||||||||||||||
Cash and cash equivalents | 1,920 | 198 | 289 | 56 | 3 | 2,466 | ||||||||||||||||||
|
|
|
|
|
|
|
|
|
|
|
| |||||||||||||
Total | 31,795 | 76,789 | 698 | 1,500 | 991 | 111,773 | ||||||||||||||||||
|
|
|
|
|
|
|
|
|
|
|
| |||||||||||||
Financial liabilities | ||||||||||||||||||||||||
Interest-bearing loans and other borrowings | 11,668 | — | 2,366 | 4,652 | — | 18,686 | ||||||||||||||||||
|
|
|
|
|
|
|
|
|
|
|
| |||||||||||||
Total | 11,668 | — | 2,366 | 4,652 | — | 18,686 | ||||||||||||||||||
|
|
|
|
|
|
|
|
|
|
|
| |||||||||||||
165
Notes to the Consolidated Financial Statements (continued)
For the year ended 31 December 2021
| 4 | RISK MANAGEMENT (continued) |
| 4.2 | Financial risk (continued) |
| 4.2.1 | Market risk (continued) |
| (iii) | Currency risk (continued) |
As at 31 December 2020 | US dollar | HK dollar | GB pound | EUR | Others | Total | ||||||||||||||||||
Financial assets | ||||||||||||||||||||||||
Equity securities | ||||||||||||||||||||||||
– Available-for-sale securities | 9,711 | 108,493 | — | — | — | 118,204 | ||||||||||||||||||
– Securities at fair value through profit or loss | 4,352 | 185 | 350 | 1,219 | 847 | 6,953 | ||||||||||||||||||
Debt securities | ||||||||||||||||||||||||
– Held-to-maturity securities | 220 | — | — | — | — | 220 | ||||||||||||||||||
– Loans | 1,445 | — | — | — | — | 1,445 | ||||||||||||||||||
– Available-for-sale securities | 3,615 | — | — | — | — | 3,615 | ||||||||||||||||||
– Securities at fair value through profit or loss | 297 | — | 21 | 11 | 10 | 339 | ||||||||||||||||||
Term deposits | 7,990 | — | — | — | — | 7,990 | ||||||||||||||||||
Cash and cash equivalents | 598 | 1,297 | 358 | 140 | 7 | 2,400 | ||||||||||||||||||
|
|
|
|
|
|
|
|
|
|
|
| |||||||||||||
Total | 28,228 | 109,975 | 729 | 1,370 | 864 | 141,166 | ||||||||||||||||||
|
|
|
|
|
|
|
|
|
|
|
| |||||||||||||
Financial liabilities | ||||||||||||||||||||||||
Interest-bearing loans and other borrowings | 11,940 | — | 2,444 | 5,172 | — | 19,556 | ||||||||||||||||||
|
|
|
|
|
|
|
|
|
|
|
| |||||||||||||
Total | 11,940 | — | 2,444 | 5,172 | — | 19,556 | ||||||||||||||||||
|
|
|
|
|
|
|
|
|
|
|
| |||||||||||||
As at 31 December 2021, if RMB had strengthened or weakened by 10% against US dollar, HK dollar, GB pound, EUR and other foreign currencies, with all other variables held constant, pre-tax profit for the year would have been RMB640 million (as at 31 December 2020: RMB339 million) lower or higher, respectively, mainly as a result of foreign exchange losses or gains on translation of US dollar, HK dollar, GB pound, EUR and other foreign currencies denominated financial assets and financial liabilities other than the available-for-sale equity securities included in the table above. Pre-tax available-for-sale reserve in equity would have been RMB8,440 million (as at 31 December 2020: RMB11,593 million) lower or higher, respectively, as a result of foreign exchange of the available-for-sale equity securities at fair value. The actual exchange gains in 2021 were RMB645 million (2020: exchange gains in RMB119 million).
166
Notes to the Consolidated Financial Statements (continued)
For the year ended 31 December 2021
| 4 | RISK MANAGEMENT (continued) |
| 4.2 | Financial risk (continued) |
| 4.2.2 | Credit risk |
Credit risk is the risk that one party of a financial transaction or the issuer of a financial instrument will fail to discharge its obligation and cause another party to incur a financial loss. Because the Group’s investment portfolio is restricted to the types of investments as permitted by the China Banking and Insurance Regulatory Commission (“CBIRC”) and a significant portion of the portfolio is in government bonds, government agency bonds, corporate bonds with higher credit rating and term deposits with the state-owned commercial banks, the Group’s overall exposure to credit risk is relatively low.
Credit risk is controlled by the application of credit approvals, limits and monitoring procedures. The Group manages credit risk through in-house research and analysis of the Chinese economy and the underlying obligors and transaction structures. Where appropriate, the Group obtains collateral in the form of rights to cash, securities, property and equipment to lower the credit risk.
Credit risk exposure
The carrying amount of financial assets included on the consolidated statement of financial position represents the maximum credit risk exposure at the reporting date without taking account of any collateral held or other credit enhancements attached. The Group has no credit risk exposure relating to off-balance sheet items as at 31 December 2021 and 2020.
Collateral and other credit enhancements
Securities purchased under agreements to resell are pledged by counterparties’ debt securities or term deposits of which the Group could take the ownership if the owner of the collateral defaults. Policy loans and most of premium receivables are collateralised by their policies’ cash value according to the terms and conditions of policy loan contracts and policy contracts, respectively.
Credit quality
The Group’s debt securities investment mainly includes government bonds, government agency bonds, corporate bonds and subordinated bonds, and most of the debt securities are guaranteed by either the Chinese government or Chinese government controlled financial institutions. As at 31 December 2021, 100.0% (as at 31 December 2020: 99.9%) of the corporate bonds held by the Group or the issuers of these corporate bonds had credit ratings of AA/A-2 or above. As at
31 December 2021, 100.0% (as at 31 December 2020: 100.0%) of the subordinated bonds held by the Group either had credit ratings of AA/A-2 or above, or were issued by national commercial banks. The bonds issuers’ credit ratings are assigned by a qualified appraisal institution in the PRC and updated at each reporting date.
As at 31 December 2021, 99.5% (as at 31 December 2020: 99.7%) of the Group’s bank deposits are with the four largest state-owned commercial banks, other national commercial banks and China Securities Depository and Clearing
Corporation Limited (“CSDCC”) in the PRC. The Group believes these commercial banks, and CSDCC have a high credit quality. The Group’s most other loans excluding policyholder loans, are guaranteed by third parties or with pledge, or have the fiscal annual budget income as the source of repayment, or have higher credit rating borrowers. As a result, the Group concludes that the credit risk associated with term deposits and accrued investment income thereof, statutory deposits – restricted, other loans, and cash and cash equivalents has not caused a material impact on the Group’s consolidated financial statements as at 31 December 2021 and 2020.
The credit risk associated with securities purchased under agreements to resell, policy loans and most of premium receivables has not caused a material impact on the Group’s consolidated financial statements taking into consideration their sufficient collateral held and maturity terms of no more than one year as at 31 December 2021 and 2020.
167
Notes to the Consolidated Financial Statements (continued)
For the year ended 31 December 2021
| 4 | RISK MANAGEMENT (continued) |
| 4.2 | Financial risk (continued) |
| 4.2.3 | Liquidity risk |
Liquidity risk is the risk that the Group is unable to obtain funds at a reasonable funding cost when required to meet a repayment obligation and fund its asset portfolio within a certain time.
In the normal course of business, the Group attempts to match the maturity of financial assets to the maturity of insurance and financial liabilities to reduce liquidity risk.
The following tables set forth the contractual and expected undiscounted cash flows for financial assets and liabilities and insurance liabilities:
As at 31 December 2021 | Contractual and expected cash flows (undiscounted) | |||||||||||||||||||||||
Carrying value | Without maturity | Not later than 1 year | Later than 1 year but not later | Later than 3 years but not later than 5 years | Later than 5 years | |||||||||||||||||||
|
|
|
|
|
|
|
|
|
|
|
| |||||||||||||
| RMB Million | ||||||||||||||||||||||||
Financial assets | ||||||||||||||||||||||||
Contractual cash inflows | ||||||||||||||||||||||||
Equity securities | 699,457 | 699,457 | — | — | — | — | ||||||||||||||||||
Debt securities | 2,470,354 | — | 231,604 | 461,413 | 508,864 | 3,029,545 | ||||||||||||||||||
Loans | 666,087 | — | 376,766 | 138,241 | 110,345 | 137,705 | ||||||||||||||||||
Term deposits | 529,488 | — | 144,271 | 372,571 | 53,822 | — | ||||||||||||||||||
Statutory deposits – restricted | 6,333 | — | 1,936 | 4,682 | 181 | — | ||||||||||||||||||
Securities purchased under agreements to resell | 12,915 | — | 12,658 | 346 | — | — | ||||||||||||||||||
Accrued investment income | 51,097 | — | 49,133 | 1,964 | — | — | ||||||||||||||||||
Premiums receivable | 20,361 | — | 20,361 | — | — | — | ||||||||||||||||||
Cash and cash equivalents | 60,440 | — | 60,440 | — | — | — | ||||||||||||||||||
|
|
|
|
|
|
|
|
|
|
|
| |||||||||||||
Subtotal | 4,516,532 | 699,457 | 897,169 | 979,217 | 673,212 | 3,167,250 | ||||||||||||||||||
|
|
|
|
|
|
|
|
|
|
|
| |||||||||||||
Financial and insurance liabilities | ||||||||||||||||||||||||
Expected cash outflows | ||||||||||||||||||||||||
Insurance contracts | 3,419,899 | — | 111,912 | 86,132 | (202,368 | ) | (5,990,882 | ) | ||||||||||||||||
Investment contracts | 313,594 | — | (31,671 | ) | 16,479 | 94,302 | (957,814 | ) | ||||||||||||||||
Contractual cash outflows | ||||||||||||||||||||||||
Securities sold under agreements to repurchase | 239,446 | — | (239,679 | ) | — | — | — | |||||||||||||||||
Financial liabilities at fair value through profit or loss | 3,416 | (3,416 | ) | — | — | — | — | |||||||||||||||||
Annuity and other insurance balances payable | 56,818 | — | (56,818 | ) | — | — | — | |||||||||||||||||
Interest-bearing loans and other borrowings | 18,686 | — | (2,552 | ) | (17,122 | ) | — | — | ||||||||||||||||
Bonds payable | 34,994 | — | (332 | ) | (37,996 | ) | — | — | ||||||||||||||||
Lease liabilities | 2,182 | — | (1,093 | ) | (1,067 | ) | (203 | ) | (29 | ) | ||||||||||||||
|
|
|
|
|
|
|
|
|
|
|
| |||||||||||||
Subtotal | 4,089,035 | (3,416 | ) | (220,233 | ) | 46,426 | (108,269 | ) | (6,948,725 | ) | ||||||||||||||
|
|
|
|
|
|
|
|
|
|
|
| |||||||||||||
Net cash inflow/(outflow) | 427,497 | 696,041 | 676,936 | 1,025,643 | 564,943 | (3,781,475 | ) | |||||||||||||||||
|
|
|
|
|
|
|
|
|
|
|
| |||||||||||||
168
Notes to the Consolidated Financial Statements (continued)
For the year ended 31 December 2021
| 4 | RISK MANAGEMENT (continued) |
| 4.2 | Financial risk (continued) |
| 4.2.3 | Liquidity risk (continued) |
| Contractual and expected cash flows (undiscounted) | ||||||||||||||||||||||||
As at 31 December 2020 | Carrying value | Without maturity | Not later than 1 year | Later than 1 year but not later than 3 years | Later than 3 years but not later than 5 years | Later than 5 years | ||||||||||||||||||
|
|
|
|
|
|
|
|
|
|
|
| |||||||||||||
| RMB Million | ||||||||||||||||||||||||
Financial assets | ||||||||||||||||||||||||
Contractual cash inflows | ||||||||||||||||||||||||
Equity securities | 700,748 | 700,748 | — | — | — | — | ||||||||||||||||||
Debt securities | 1,865,794 | — | 136,885 | 349,334 | 287,939 | 2,260,215 | ||||||||||||||||||
Loans | 658,535 | — | 235,901 | 219,840 | 129,813 | 173,729 | ||||||||||||||||||
Term deposits | 545,678 | — | 75,364 | 329,191 | 197,867 | 1,753 | ||||||||||||||||||
Statutory deposits – restricted | 6,333 | — | 297 | 6,098 | 720 | — | ||||||||||||||||||
Securities purchased under agreements to resell | 7,947 | — | 7,947 | — | — | — | ||||||||||||||||||
Accrued investment income | 45,200 | — | 44,197 | 565 | 438 | — | ||||||||||||||||||
Premiums receivable | 20,730 | — | 20,730 | — | — | — | ||||||||||||||||||
Cash and cash equivalents | 56,655 | — | 56,655 | — | — | — | ||||||||||||||||||
|
|
|
|
|
|
|
|
|
|
|
| |||||||||||||
Subtotal | 3,907,620 | 700,748 | 577,976 | 905,028 | 616,777 | 2,435,697 | ||||||||||||||||||
|
|
|
|
|
|
|
|
|
|
|
| |||||||||||||
Financial and insurance liabilities | ||||||||||||||||||||||||
Expected cash outflows | ||||||||||||||||||||||||
Insurance contracts | 2,973,225 | — | 190,123 | 151,280 | (93,971 | ) | (5,618,867 | ) | ||||||||||||||||
Investment contracts | 288,212 | — | (29,149 | ) | (13,861 | ) | 68,882 | (798,317 | ) | |||||||||||||||
Contractual cash outflows | ||||||||||||||||||||||||
Securities sold under agreements to repurchase | 122,249 | — | (122,249 | ) | — | — | — | |||||||||||||||||
Financial liabilities at fair value through profit or loss | 3,732 | (3,732 | ) | — | — | — | — | |||||||||||||||||
Annuity and other insurance balances payable | 55,031 | — | (55,031 | ) | — | — | — | |||||||||||||||||
Interest-bearing loans and other borrowings | 19,556 | — | (2,044 | ) | (4,384 | ) | (14,680 | ) | — | |||||||||||||||
Bonds payable | 34,992 | — | (328 | ) | (2,996 | ) | (36,498 | ) | — | |||||||||||||||
Lease liabilities | 2,664 | — | (1,273 | ) | (1,250 | ) | (331 | ) | (41 | ) | ||||||||||||||
|
|
|
|
|
|
|
|
|
|
|
| |||||||||||||
Subtotal | 3,499,661 | (3,732 | ) | (19,951 | ) | 128,789 | (76,598 | ) | (6,417,225 | ) | ||||||||||||||
|
|
|
|
|
|
|
|
|
|
|
| |||||||||||||
Net cash inflow/(outflow) | 407,959 | 697,016 | 558,025 | 1,033,817 | 540,179 | (3,981,528 | ) | |||||||||||||||||
|
|
|
|
|
|
|
|
|
|
|
| |||||||||||||
The amounts set forth in the tables above for insurance and investment contracts in each column are the undiscounted cash flows representing expected future benefit payments taking into consideration of future premiums payments or deposits from policyholders. The excess cash inflows from matured financial assets will be reinvested to cover any future liquidity exposures. The estimate is subject to assumptions related to mortality, morbidity, the lapse rate, the loss ratio of short-term insurance contracts, expense and other assumptions. Actual experience may differ from estimates.
169
Notes to the Consolidated Financial Statements (continued)
For the year ended 31 December 2021
| 4 | RISK MANAGEMENT (continued) |
| 4.2 | Financial risk (continued) |
| 4.2.3 | Liquidity risk (continued) |
The liquidity analysis above does not include policyholder dividends payable of RMB124,949 million as at 31 December 2021 (as at 31 December 2020: RMB122,510 million). As at 31 December 2021, declared dividends of RMB86,506 million (as at 31 December 2020: RMB82,154 million) included in policyholder dividends payable have a maturity not later than one year. For the remaining policyholder dividends payable, the amount and timing of the undiscounted cash flows are indeterminate due to the uncertainty of future experiences including investment returns and are subject to future declarations by the Group.
Although all investment contracts with DPF and investment contracts without DPF contain contractual options to surrender that can be exercised immediately by all policyholders at any time, the Group’s expected cash flows (undiscounted) as shown in the above tables are based on past experience and future expectations. Should these contracts be surrendered immediately, it would cause a cash outflow of RMB68,289 million and RMB242,540 million, respectively for the year ended 31 December 2021 (2020: RMB64,445 million and RMB220,973 million, respectively), payable within one year.
| 4.2.4 | Capital management |
The Group’s objectives for managing capital are to comply with the insurance capital requirements based on the minimum capital and actual capital required by the CBIRC, prevent risk in operation and safeguard the Group’s ability to continue as a going concern so that it can continue to provide returns for equity holders and benefits for other stakeholders. The Group replenishes capital to improve the solvency ratio by issuing Core Tier 2 Capital Securities and bonds for capital replenishment according to the relevant laws and the approval of the relevant authorities.
The Group is also subject to other local capital requirements, such as statutory deposits-restricted requirement, statutory insurance fund requirement, statutory reserve fund requirement and general reserve requirement discussed in detail in Note 10.4, Note 21 and Note 37, respectively.
The Group manages capital to ensure its continuous and full compliance with the regulations mainly through monitoring its quarterly solvency ratios, as well as the solvency ratio based on annual stress testing.
170
Notes to the Consolidated Financial Statements (continued)
For the year ended 31 December 2021
| 4 | RISK MANAGEMENT (continued) |
| 4.2 | Financial risk (continued) |
| 4.2.4 | Capital management (continued) |
The table below summarises the core and comprehensive solvency ratio, core capital, actual capital and minimum capital of the Company under Insurance Institution Solvency Regulations (No.1—No.17):
| As at 31 December 2021 RMB million | As at 31 December 2020 RMB million | |||||||
Core capital | 1,020,756 | 1,031,947 | ||||||
Actual capital | 1,055,768 | 1,066,939 | ||||||
Minimum capital | 402,341 | 396,749 | ||||||
Core solvency ratio | 254 | % | 260 | % | ||||
Comprehensive solvency ratio | 262 | % | 269 | % | ||||
According to the solvency ratios results mentioned above, and the unquantifiable evaluation results of operational risk, strategic risk, reputational risk and liquidity risk of insurance companies, the CBIRC evaluates the comprehensive solvency of insurance companies and supervises insurance companies by classifying them into four categories:
| (i) | Category A: solvency ratios meet the requirements, and the operational risk, strategic risk, reputational risk and liquidity risk are very low; |
| (ii) | Category B: solvency ratios meet the requirements, and the operational risk, strategic risk, reputational risk and liquidity risk are low; |
| (iii) | Category C: solvency ratios do not meet the requirements or solvency ratios meet the requirements but one or several risks in operation, strategy, reputation and liquidity are high; |
| (iv) | Category D: solvency ratios do not meet the requirements or solvency ratios meet the requirements but one or several risks in operation, strategy, reputation and liquidity are severe. |
According to the Supervision Information System of the China Risk Oriented Solvency System, the latest Integrated Risk Rating result of the Company was Category A.
| 4.3 | Disclosures about interest in unconsolidated structured entities |
The Group’s interest in unconsolidated structured entities are recorded as securities at fair value through profit or loss, available-for-sale securities and loans. These structured entities typically raise funds by issuing securities or other beneficiary certificates. The purpose of these structured entities is primarily to generate management service fees, or provide finance to public and private infrastructure construction. Refer to Note 3.5 for the Group’s consolidation judgements related to structured entities.
These structured entities that the Group has interest in are guaranteed by third parties with higher credit ratings, or by pledging, or by having the fiscal budget income as the source of repayment, or by borrowers with higher credit ratings.
The Group did not guarantee or provide any financing support for the structured entities that the Group had interest in or sponsored.
171
Notes to the Consolidated Financial Statements (continued)
For the year ended 31 December 2021
| 4 | RISK MANAGEMENT (continued) |
| 4.3 | Disclosures about interest in unconsolidated structured entities (continued) |
(i) The unconsolidated structured entities that the Group has interest in
The Group believes that the maximum exposure approximates the carrying amount of interest in these unconsolidated structured entities. The size of unconsolidated structured entities as well as the Group’s carrying amount of the assets recognised in the financial statements relating to its interest in unconsolidated structured entities and the Group’s maximum exposure are shown below:
| Unconsolidated structured entities | ||||||||||||||||
As at 31 December 2021 | Size RMB million | Carrying amount of assets RMB million | Maximum exposure RMB million | Interest held by the Group | ||||||||||||
Funds managed by affiliated entities | 168,466 | 9,860 | 9,860 | Investment income and service fee | ||||||||||||
Funds managed by third parties | Note 1 | 97,988 | 97,988 | Investment income | ||||||||||||
Trust schemes managed by affiliated entities | 1,994 | 1,296 | 1,296 | Investment income | ||||||||||||
Trust schemes managed by third parties | Note 1 | 62,702 | 62,702 | Investment income | ||||||||||||
Debt investment schemes managed by affiliated entities | 39,817 | 15,770 | 15,770 | Investment income and service fee | ||||||||||||
Debt investment schemes managed by third parties | Note 1 | 51,172 | 51,172 | Investment income | ||||||||||||
Others managed by affiliated entities Note 2 | 28,368 | 14,150 | 14,150 | Investment income and service fee | ||||||||||||
Others managed by third parties Note 2 | Note 1 | 107,372 | 107,372 | Investment income | ||||||||||||
| Unconsolidated structured entities | ||||||||||||||||
As at 31 December 2020 | Size RMB million | Carrying amount of assets RMB million | Maximum exposure RMB million | Interest held by the Group | ||||||||||||
Funds managed by affiliated entities | 158,182 | 8,232 | 8,232 | Investment income and service fee | ||||||||||||
Funds managed by third parties | Note 1 | 99,649 | 99,649 | Investment income | ||||||||||||
Trust schemes managed by affiliated entities | 2,096 | 1,298 | 1,298 | Investment income | ||||||||||||
Trust schemes managed by third parties | Note 1 | 63,229 | 63,229 | Investment income | ||||||||||||
Debt investment schemes managed by affiliated entities | 18,275 | 9,172 | 9,172 | Investment income and service fee | ||||||||||||
Debt investment schemes managed by third parties | Note 1 | 27,747 | 27,747 | Investment income | ||||||||||||
Others managed by affiliated entities Note 2 | 290,937 | 12,681 | 12,681 | Investment income and service fee | ||||||||||||
Others managed by third parties Note 2 | Note 1 | 75,551 | 75,551 | Investment income | ||||||||||||
Note 1: | Funds, trust schemes, debt investment schemes and others managed by third parties were sponsored by third party financial institutions and the information related to size of these structured entities were not publicly available. | |
Note 2: | Others included wealth management products, special asset management schemes, and asset-backed plans, etc. | |
172
Notes to the Consolidated Financial Statements (continued)
For the year ended 31 December 2021
| 4 | RISK MANAGEMENT (continued) |
| 4.3 | Disclosures about interest in unconsolidated structured entities (continued) |
| (ii) | The unconsolidated structured entities that the Group has sponsored but does not have interest in As at |
31 December 2021, the size of the unconsolidated structured entities that the Group sponsored but had no interest was RMB633,503 million (as at 31 December 2020: RMB686,989 million), which were mainly funds, special asset management schemes, pension security products and pension products, etc., sponsored by the Group to generate management service fee income. In 2021, the management service fee from these structured entities was RMB1,995 million (2020: RMB2,092 million), which was recorded as other income. The Group did not transfer assets to these structured entities.
| 4.4 | Fair value hierarchy |
Level 1 fair value is based on quoted prices (unadjusted) in active markets for identical assets or liabilities that the entity can obtain at the measurement date.
Other than Level 1 quoted prices, Level 2 fair value is based on valuation techniques using significant inputs, that are observable for the asset being measured, either directly or indirectly, for substantially the full term of the asset through corroboration with observable market data. Observable inputs generally used to measure the fair value of securities classified as Level 2 include quoted market prices for similar assets in active markets; quoted market prices in markets that are not active for identical or similar assets and other market observable inputs. This level includes the debt securities for which quotations are available from pricing services providers. Fair values provided by pricing services providers are subject to a number of validation procedures by management. These procedures include a review of the valuation models utilised and the results of these models, as well as the recalculation of prices obtained from pricing services at the end of each reporting period.
Under certain conditions, the Group may not receive a price quote from independent third-party pricing services. In this instance, the Group’s valuation team may choose to apply an internally developed valuation method to the assets or liabilities being measured, determine the main inputs for valuation, and analyse the change of the valuation and report it to management. Key inputs involved in internal valuation services are not based on observable market data. They reflect assumptions made by management based on judgements and experiences. The assets or liabilities valued by this method are generally classified as Level 3.
As at 31 December 2021, assets classified as Level 1 accounted for approximately 29.82% of assets measured at fair value on a recurring basis. Fair value measurements classified as Level 1 include certain debt securities, equity securities that are traded in an active exchange market or interbank market and open-ended funds with public market price quotations. The Group considers a combination of certain factors to determine whether a market for a financial instrument is active, including the occurrence of trades within the specific period, the respective trading volume, and the degree which the implied yields for a debt security for observed transactions differs from the Group’s understanding of the current relevant market rates and information. Trading prices from the Chinese interbank market are determined by both trading counterparties and can be observed publicly. The Group adopted this price of the debt securities traded on the Chinese interbank market at the reporting date as their fair market value and classified the investments as Level 1: Open-ended funds also have active markets. Fund management companies publish the net asset value of these funds on their websites on each trade date. Investors subscribe for and redeem units of these funds in accordance with the funds’ net asset value published by the fund management companies on each trade date. The Company adopted the unadjusted net asset value of the funds at the reporting date as their fair market value and classified the investments as Level 1.
As at 31 December 2021, assets classified as Level 2 accounted for approximately 48.57% of assets measured at fair value on a recurring basis. They primarily include certain debt securities and equity securities. Valuations are generally obtained from third party pricing services for identical or comparable assets, or through the use of valuation methodologies using observable market inputs, or recent quoted market prices. Valuation service providers typically gather, analyse and interpret information related to market transactions and other key valuation model inputs from multiple sources, and through the use of widely accepted internal valuation models, provide a theoretical quote on various securities. Debt securities are classified as Level 2 when they are valued at recent quoted prices from the Chinese interbank market or from valuation service providers.
173
Notes to the Consolidated Financial Statements (continued)
For the year ended 31 December 2021
| 4 | RISK MANAGEMENT (continued) |
| 4.4 | Fair value hierarchy (continued) |
At 31 December 2021, assets classified as Level 3 accounted for approximately 21.61% of assets measured at fair value on a recurring basis. They primarily include unlisted equity securities and unlisted debt securities. Fair values are determined using valuation techniques, including discounted cash flow valuations, the comparable companies approach, etc. The determination of Level 3 is primarily based on the significance of certain unobservable inputs.
For the accounting policies regarding the determination of fair values of financial assets and liabilities, see Note 3.2.
The following table presents the Group’s quantitative disclosures of the fair value measurement hierarchy for assets and liabilities measured at fair value as at 31 December 2021:
| Fair value measurement using | ||||||||||||||||
| Quoted prices in active markets Level 1 RMB million | Significant observable inputs Level 2 RMB million | Significant unobservable inputs Level 3 RMB million | Total RMB million | |||||||||||||
Assets measured at fair value | ||||||||||||||||
Available-for-sale securities | ||||||||||||||||
– Equity securities | ||||||||||||||||
Funds | 94,895 | — | — | 94,895 | ||||||||||||
Common stocks | 233,347 | 23,094 | — | 256,441 | ||||||||||||
Preferred stocks | — | — | 52,127 | 52,127 | ||||||||||||
Wealth management products | — | 5,005 | — | 5,005 | ||||||||||||
Others | 21,010 | 49,530 | 136,456 | 206,996 | ||||||||||||
– Debt securities | ||||||||||||||||
Government bonds | 9,208 | 49,353 | — | 58,561 | ||||||||||||
Government agency bonds | 31,464 | 228,289 | — | 259,753 | ||||||||||||
Corporate bonds | 4,705 | 198,442 | — | 203,147 | ||||||||||||
Subordinated bonds | 16,880 | 94,149 | — | 111,029 | ||||||||||||
Others | — | 555 | 160,499 | 161,054 | ||||||||||||
Securities at fair value through profit or loss | ||||||||||||||||
– Equity securities | ||||||||||||||||
Funds | 17,572 | 222 | — | 17,794 | ||||||||||||
Common stocks | 43,476 | 2,173 | — | 45,649 | ||||||||||||
Others | 5 | 266 | — | 271 | ||||||||||||
– Debt securities | ||||||||||||||||
Government bonds | 153 | 1,240 | — | 1,393 | ||||||||||||
Government agency bonds | 2,346 | 5,643 | — | 7,989 | ||||||||||||
Corporate bonds | 6,646 | 83,734 | 45 | 90,425 | ||||||||||||
Others | 100 | 43,150 | — | 43,250 | ||||||||||||
|
|
|
|
|
|
|
| |||||||||
Total | 481,807 | 784,845 | 349,127 | 1,615,779 | ||||||||||||
|
|
|
|
|
|
|
| |||||||||
Liabilities measured at fair value | ||||||||||||||||
Financial liabilities at fair value through profit or loss | (3,416 | ) | — | — | (3,416 | ) | ||||||||||
Investment contracts at fair value through profit or loss | (9 | ) | — | — | (9 | ) | ||||||||||
|
|
|
|
|
|
|
| |||||||||
Total | (3,425 | ) | — | — | (3,425 | ) | ||||||||||
|
|
|
|
|
|
|
| |||||||||
174
Notes to the Consolidated Financial Statements (continued)
For the year ended 31 December 2021
| 4 | RISK MANAGEMENT (continued) |
| 4.4 | Fair value hierarchy (continued) |
The following table presents the changes in Level 3 financial instruments for the year ended 31 December 2021:
| Available-for-sale securities | Securities at fair value through profit or loss | Total RMB million | ||||||||||||||
| Debt securities RMB million | Equity securities RMB million | Debt securities RMB million | ||||||||||||||
Opening balance | 143,905 | 150,010 | 9 | 293,924 | ||||||||||||
Purchases | 27,415 | 43,661 | — | 71,076 | ||||||||||||
Transfer into Level 3 | — | — | 36 | 36 | ||||||||||||
Total gains/(losses) recorded in other comprehensive income | 4,073 | (2,212 | ) | — | 1,861 | |||||||||||
Disposals or exercises | — | (2,876 | ) | — | (2,876 | ) | ||||||||||
Maturity | (14,894 | ) | — | — | (14,894 | ) | ||||||||||
|
|
|
|
|
|
|
| |||||||||
Closing balance | 160,499 | 188,583 | 45 | 349,127 | ||||||||||||
|
|
|
|
|
|
|
| |||||||||
175
Notes to the Consolidated Financial Statements (continued)
For the year ended 31 December 2021
| 4 | RISK MANAGEMENT (continued) |
| 4.4 | Fair value hierarchy (continued) |
The following table presents the Group’s quantitative disclosures of the fair value measurement hierarchy for assets and liabilities measured at fair value as at 31 December 2020:
| Fair value measurement using | ||||||||||||||||
| Quoted prices in active markets Level 1 | Significant observable inputs Level 2 | Significant unobservable inputs Level 3 | Total | |||||||||||||
| RMB million | RMB million | RMB million | RMB million | |||||||||||||
Assets measured at fair value | ||||||||||||||||
Available-for-sale securities | ||||||||||||||||
– Equity securities | ||||||||||||||||
Funds | 97,476 | — | — | 97,476 | ||||||||||||
Common stocks | 278,255 | 22,994 | — | 301,249 | ||||||||||||
Preferred stocks | — | — | 53,778 | 53,778 | ||||||||||||
Wealth management products | — | 13,013 | — | 13,013 | ||||||||||||
Others | 11,038 | 41,401 | 96,232 | 148,671 | ||||||||||||
– Debt securities | ||||||||||||||||
Government bonds | 5,838 | 43,418 | — | 49,256 | ||||||||||||
Government agency bonds | 25,297 | 143,716 | — | 169,013 | ||||||||||||
Corporate bonds | 2,408 | 133,617 | — | 136,025 | ||||||||||||
Subordinated bonds | 6,244 | 75,551 | — | 81,795 | ||||||||||||
Others | — | 816 | 143,905 | 144,721 | ||||||||||||
Securities at fair value through profit or loss | ||||||||||||||||
– Equity securities | ||||||||||||||||
Funds | ||||||||||||||||
Common stocks | 16,731 | 104 | — | 16,835 | ||||||||||||
Others | 48,334 | 524 | — | 48,858 | ||||||||||||
– Debt securities | 41 | 221 | — | 262 | ||||||||||||
Government bonds | ||||||||||||||||
Government agency bonds | 336 | 1,302 | — | 1,638 | ||||||||||||
Corporate bonds | 972 | 3,450 | — | 4,422 | ||||||||||||
Others | 2,957 | 83,837 | 9 | 86,803 | ||||||||||||
Total | — | 2,752 | — | 2,752 | ||||||||||||
|
|
|
|
|
|
|
| |||||||||
Liabilities measured at fair value | 495,927 | 566,716 | 293,924 | 1,356,567 | ||||||||||||
|
|
|
|
|
|
|
| |||||||||
Financial liabilities at fair value through profit or loss | (3,732 | ) | — | — | (3,732 | ) | ||||||||||
Investment contracts at fair value through profit or loss | (10 | ) | — | — | (10 | ) | ||||||||||
|
|
|
|
|
|
|
| |||||||||
Total | (3,742 | ) | — | — | (3,742 | ) | ||||||||||
|
|
|
|
|
|
|
| |||||||||
176
Notes to the Consolidated Financial Statements (continued)
For the year ended 31 December 2021
| 4 | RISK MANAGEMENT (continued) |
| 4.4 | Fair value hierarchy (continued) |
The following table presents the changes in Level 3 financial instruments for the year ended 31 December 2020:
| Available-for-sale securities | Securities at fair value through profit or loss | Derivative financial assets RMB million | Total RMB million | |||||||||||||||||
| Debt securities RMB million | Equity securities RMB million | Debt securities RMB million | ||||||||||||||||||
Opening balance | 105,650 | 128,899 | 16 | 428 | 234,993 | |||||||||||||||
Purchases | 38,486 | 19,953 | – | – | 58,439 | |||||||||||||||
Total gains/(losses) recorded in profit or loss | – | – | (7 | ) | (121 | ) | (128 | ) | ||||||||||||
Total gains/(losses) recorded in other comprehensive income | 653 | 7,127 | – | – | 7,780 | |||||||||||||||
Disposals or exercises | – | (5,969 | ) | – | (307 | ) | (6,276 | ) | ||||||||||||
Maturity | (884 | ) | – | – | – | (884 | ) | |||||||||||||
|
|
|
|
|
|
|
|
|
| |||||||||||
Closing balance | 143,905 | 150,010 | 9 | – | 293,924 | |||||||||||||||
|
|
|
|
|
|
|
|
|
| |||||||||||
The assets and liabilities whose fair value measurements are classified under Level 3 above do not have material impact on the profit or loss of the Group.
For the assets and liabilities measured at fair value on a recurring basis, during the year ended 31 December 2021, RMB16,499 million (2020: RMB12,084 million) debt securities were transferred from Level 1 to Level 2 within the fair value hierarchy, whereas RMB31,764 million (2020: RMB9,825 million) debt securities were transferred from Level 2 to Level 1. RMB4,196 million equity securities were transferred from Level 1 to Level 2 (2020: no equity securities were transferred from Level 1 to Level 2), whereas RMB5,520 million equity securities were transferred from Level 2 to Level 1 (2020: no material equity securities were transferred from Level 2 to Level 1).
For the years ended 31 December 2021 and 2020, there were no significant changes in the business or economic circumstances that affected the fair value of the Group’s financial assets and liabilities. There were also no reclassifications of financial assets.
As at 31 December 2021 and 2020, significant unobservable inputs such as discount rate and discounts for lack of marketability were used in the valuation of primary assets and liabilities at fair value classified as Level 3. The fair value was not significantly sensitive to reasonable changes in these significant unobservable inputs.
177
Notes to the Consolidated Financial Statements (continued)
For the year ended 31 December 2021
| 4 | RISK MANAGEMENT (continued) |
| 4.4 | Fair value hierarchy (continued) |
The table below presents information about the significant unobservable inputs used for primary financial instruments at fair value classified as Level 3 as at 31 December 2021 and 31 December 2020:
Fair value | Valuation techniques | Significant | Range | Relationships between fair value and | ||||||
Equity securities | 31 December 2021: 28,245 31 December 2020: 28,162 | Comparable companies approach | Discounts for lack of marketability | 31 December 2021: 11%-30% 31 December 2020: 12%-35% | The fair value is inversely related to the discounts for lack of marketability | |||||
31 December 2021: 36,556 31 December 2020: 36,697 | Net asset value method | N/A | N/A | N/A | ||||||
31 December 2021: 116,245 31 December 2020: 84,212 | Discounted cash flow method | Discount rate | 31 December 2021: 2.69%-9.93% 31 December 2020: 3.80%-6.07% | The fair value is inversely related to discount rate | ||||||
Debt securities | 31 December 2021: 160,499 31 December 2020: 143,905 | Discounted cash flow method | Discount rate | 31 December 2021: 3.21%-9.78% 31 December 2020: 3.88%-9.82% | The fair value is inversely related to discount rate |
178
Notes to the Consolidated Financial Statements (continued)
For the year ended 31 December 2021
| 5 | SEGMENT INFORMATION |
| 5.1 | Operating segments |
The Group operates in four operating segments:
| (i) | Life insurance business (Life) |
Life insurance business relates primarily to the sale of life insurance policies, including those life insurance policies without significant insurance risk transferred.
| (ii) | Health insurance business (Health) |
Health insurance business relates primarily to the sale of health insurance policies, including those health insurance policies without significant insurance risk transferred.
| (iii) | Accident insurance business (Accident) |
Accident insurance business relates primarily to the sale of accident insurance policies.
| (iv) | Other businesses (Others) |
Other businesses relate primarily to income and cost of the agency business in respect of transactions with CLIC, etc., as described in Note 35, net share of profit of associates and joint ventures, income and expenses of subsidiaries, and unallocated income and expenditure of the Group.
| 5.2 | Allocation basis of income and expenses |
Investment income, net realised gains on financial assets, net fair value gains through profit or loss and foreign exchange gains/(losses) within other expenses are allocated among segments in proportion to the respective segments’ average liabilities of insurance contracts and investment contracts at the beginning and end of the year. Administrative expenses are allocated among segments in proportion to the unit cost of respective products in the different segments. Unallocated other income and other expenses are presented in the “Others” segment directly. Income tax is not allocated.
| 5.3 | Allocation basis of assets and liabilities |
Financial assets, securities sold under agreements to repurchase and derivative financial liabilities are allocated among segments in proportion to the respective segments’ average liabilities of insurance contracts and investment contracts at the beginning and end of the year. Insurance and investment contract liabilities are presented under the respective segments. The remaining assets and liabilities are not allocated.
179
Notes to the Consolidated Financial Statements (continued)
For the year ended 31 December 2021
| 5 | SEGMENT INFORMATION (continued) |
| For the year ended 31 December 2021 | ||||||||||||||||||||||||
| Life | Health | Accident | Others | Elimination | Total | |||||||||||||||||||
| RMB million | ||||||||||||||||||||||||
Revenues | ||||||||||||||||||||||||
Gross written premiums | 481,311 | 120,609 | 16,407 | — | — | 618,327 | ||||||||||||||||||
– Term life | 2,501 | — | — | — | — | |||||||||||||||||||
– Whole life | 69,923 | — | — | — | — | |||||||||||||||||||
– Endowment | 97,791 | — | — | — | — | |||||||||||||||||||
– Annuity | 311,096 | — | — | — | — | |||||||||||||||||||
Net premiums earned | 480,214 | 114,549 | 16,488 | — | — | 611,251 | ||||||||||||||||||
Investment income | 160,204 | 10,831 | 496 | 6,856 | — | 178,387 | ||||||||||||||||||
Net realised gains on financial assets | 18,768 | 1,256 | 58 | 262 | — | 20,344 | ||||||||||||||||||
Net fair value gains through profit or loss | 2,795 | 187 | 9 | 1,952 | — | 4,943 | ||||||||||||||||||
Other income | 1,228 | 85 | — | 11,826 | (3,134 | ) | 10,005 | |||||||||||||||||
Including: inter-segment revenue | — | — | — | 3,134 | (3,134 | ) | — | |||||||||||||||||
|
|
|
|
|
|
|
|
|
|
|
| |||||||||||||
Segment revenues | 663,209 | 126,908 | 17,051 | 20,896 | (3,134 | ) | 824,930 | |||||||||||||||||
|
|
|
|
|
|
|
|
|
|
|
| |||||||||||||
Benefits, claims and expenses | ||||||||||||||||||||||||
Insurance benefits and claims expenses | ||||||||||||||||||||||||
Life insurance death and other benefits | (114,657 | ) | (6,656 | ) | (41 | ) | — | — | (121,354 | ) | ||||||||||||||
Accident and health claims and claim adjustment expenses | — | (48,076 | ) | (6,954 | ) | — | — | (55,030 | ) | |||||||||||||||
Increase in insurance contract liabilities | (413,206 | ) | (28,956 | ) | (208 | ) | — | — | (442,370 | ) | ||||||||||||||
Investment contract benefits | (10,223 | ) | (405 | ) | — | — | — | (10,628 | ) | |||||||||||||||
Policyholder dividends resulting from participation in profits | (26,367 | ) | (144 | ) | — | — | — | (26,511 | ) | |||||||||||||||
Underwriting and policy acquisition costs | (38,290 | ) | (21,021 | ) | (4,835 | ) | (1,598 | ) | — | (65,744 | ) | |||||||||||||
Finance costs | (4,608 | ) | (308 | ) | (14 | ) | (668 | ) | — | (5,598 | ) | |||||||||||||
Administrative expenses | (23,339 | ) | (11,069 | ) | (2,948 | ) | (3,452 | ) | — | (40,808 | ) | |||||||||||||
Statutory insurance fund contribution | (787 | ) | (367 | ) | (99 | ) | — | — | (1,253 | ) | ||||||||||||||
Other expenses | (8,961 | ) | (1,307 | ) | (270 | ) | (8,063 | ) | 3,134 | (15,467 | ) | |||||||||||||
Including: inter-segment expenses | (2,929 | ) | (196 | ) | (9 | ) | — | 3,134 | — | |||||||||||||||
|
|
|
|
|
|
|
|
|
|
|
| |||||||||||||
Segment benefits, claims and expenses | (640,438 | ) | (118,309 | ) | (15,369 | ) | (13,781 | ) | 3,134 | (784,763 | ) | |||||||||||||
|
|
|
|
|
|
|
|
|
|
|
| |||||||||||||
Net gains on investments of associates and joint ventures | — | — | — | 10,328 | — | 10,328 | ||||||||||||||||||
Including: share of profit of associates and joint ventures | — | — | — | 10,328 | — | 10,328 | ||||||||||||||||||
|
|
|
|
|
|
|
|
|
|
|
| |||||||||||||
Segment results | 22,771 | 8,599 | 1,682 | 17,443 | — | 50,495 | ||||||||||||||||||
|
|
|
|
|
|
|
|
|
|
|
| |||||||||||||
Income tax | 1,917 | |||||||||||||||||||||||
|
| |||||||||||||||||||||||
Net profit | 52,412 | |||||||||||||||||||||||
Attributable to | ||||||||||||||||||||||||
– Equity holders of the Company | 50,921 | |||||||||||||||||||||||
�� Non-controlling interests | 1,491 | |||||||||||||||||||||||
Other comprehensive income attributable to equity holders of the Company | (5,290 | ) | (354 | ) | (16 | ) | 1,097 | — | (4,563 | ) | ||||||||||||||
Depreciation and amortisation | 2,919 | 1,359 | 368 | 641 | — | 5,287 | ||||||||||||||||||
|
|
|
|
|
|
|
|
|
|
|
| |||||||||||||
180
Notes to the Consolidated Financial Statements (continued)
For the year ended 31 December 2021
| 5 | SEGMENT INFORMATION (continued) |
| As at 31 December 2021 | ||||||||||||||||||||||||
| Life | Health | Accident | Others | Elimination | Total | |||||||||||||||||||
| RMB million | ||||||||||||||||||||||||
Assets | ||||||||||||||||||||||||
Financial assets | 4,001,202 | 259,618 | 11,668 | 223,824 | — | 4,496,312 | ||||||||||||||||||
Others | 9,893 | 16,044 | 569 | 257,953 | — | 284,459 | ||||||||||||||||||
|
|
|
|
|
|
|
|
|
|
|
| |||||||||||||
Segment assets | 4,011,095 | 275,662 | 12,237 | 481,777 | — | 4,780,771 | ||||||||||||||||||
|
|
|
|
|
|
|
|
|
|
|
| |||||||||||||
Unallocated | ||||||||||||||||||||||||
Property, plant and equipment | 54,398 | |||||||||||||||||||||||
Others | 55,916 | |||||||||||||||||||||||
|
| |||||||||||||||||||||||
Total | 4,891,085 | |||||||||||||||||||||||
|
| |||||||||||||||||||||||
Liabilities | ||||||||||||||||||||||||
Insurance contracts | 3,180,931 | 228,899 | 10,069 | — | — | 3,419,899 | ||||||||||||||||||
Investment contracts | 296,104 | �� | 17,490 | — | — | — | 313,594 | |||||||||||||||||
Securities sold under agreements to repurchase | 217,288 | 14,536 | 672 | 6,950 | — | 239,446 | ||||||||||||||||||
Others | 87,371 | 5,276 | 379 | 22,102 | — | 115,128 | ||||||||||||||||||
|
|
|
|
|
|
|
|
|
|
|
| |||||||||||||
Segment liabilities | 3,781,694 | 266,201 | 11,120 | 29,052 | — | 4,088,067 | ||||||||||||||||||
|
|
|
|
|
|
|
|
|
|
|
| |||||||||||||
Unallocated | ||||||||||||||||||||||||
Others | 316,360 | |||||||||||||||||||||||
|
| |||||||||||||||||||||||
Total | 4,404,427 | |||||||||||||||||||||||
|
| |||||||||||||||||||||||
181
Notes to the Consolidated Financial Statements (continued)
For the year ended 31 December 2021
| 5 | SEGMENT INFORMATION (continued) |
| For the year ended 31 December 2020 | ||||||||||||||||||||||||
| Life | Health | Accident | Others | Elimination | Total | |||||||||||||||||||
| RMB million | ||||||||||||||||||||||||
Revenues | ||||||||||||||||||||||||
Gross written premiums | 480,593 | 115,089 | 16,583 | — | — | 612,265 | ||||||||||||||||||
– Term life | 2,674 | — | — | — | — | |||||||||||||||||||
– Whole life | 73,747 | — | — | — | — | |||||||||||||||||||
– Endowment | 109,275 | — | — | — | — | |||||||||||||||||||
– Annuity | 294,897 | — | — | — | — | |||||||||||||||||||
Net premiums earned | 479,600 | 109,091 | 15,975 | — | — | 604,666 | ||||||||||||||||||
Investment income | 140,963 | 9,202 | 462 | 3,870 | — | 154,497 | ||||||||||||||||||
Net realised gains on financial assets | 13,523 | 877 | 44 | 139 | — | 14,583 | ||||||||||||||||||
Net fair value gains through profit or loss | 17,727 | 1,148 | 58 | 2,967 | — | 21,900 | ||||||||||||||||||
Other income | 1,284 | 75 | — | 10,492 | (2,448 | ) | 9,403 | |||||||||||||||||
Including: inter-segment revenue | — | — | — | 2,448 | (2,448 | ) | — | |||||||||||||||||
|
|
|
|
|
|
|
|
|
|
|
| |||||||||||||
Segment revenues | 653,097 | 120,393 | 16,539 | 17,468 | (2,448 | ) | 805,049 | |||||||||||||||||
|
|
|
|
|
|
|
|
|
|
|
| |||||||||||||
Benefits, claims and expenses | ||||||||||||||||||||||||
Insurance benefits and claims expenses | ||||||||||||||||||||||||
Life insurance death and other benefits | (108,862 | ) | (4,714 | ) | (33 | ) | — | — | (113,609 | ) | ||||||||||||||
Accident and health claims and claim adjustment expenses | — | (44,987 | ) | (7,408 | ) | — | — | (52,395 | ) | |||||||||||||||
Increase in insurance contract liabilities | (382,132 | ) | (32,445 | ) | (220 | ) | — | — | (414,797 | ) | ||||||||||||||
Investment contract benefits | (9,494 | ) | (352 | ) | — | — | — | (9,846 | ) | |||||||||||||||
Policyholder dividends resulting from participation in profits | (28,129 | ) | (150 | ) | — | — | — | (28,279 | ) | |||||||||||||||
Underwriting and policy acquisition costs | (60,841 | ) | (15,921 | ) | (5,315 | ) | (2,284 | ) | — | (84,361 | ) | |||||||||||||
Finance costs | (2,798 | ) | (183 | ) | (7 | ) | (759 | ) | — | (3,747 | ) | |||||||||||||
Administrative expenses | (23,360 | ) | (8,677 | ) | (2,649 | ) | (3,020 | ) | — | (37,706 | ) | |||||||||||||
Statutory insurance fund contribution | (833 | ) | (302 | ) | (94 | ) | — | — | (1,229 | ) | ||||||||||||||
Other expenses | (8,575 | ) | (1,051 | ) | (241 | ) | (4,851 | ) | 2,448 | (12,270 | ) | |||||||||||||
Including: inter-segment expenses | (2,292 | ) | (148 | ) | (8 | ) | — | 2,448 | — | |||||||||||||||
|
|
|
|
|
|
|
|
|
|
|
| |||||||||||||
Segment benefits, claims and expenses | (625,024 | ) | (108,782 | ) | (15,967 | ) | (10,914 | ) | 2,448 | (758,239 | ) | |||||||||||||
|
|
|
|
|
|
|
|
|
|
|
| |||||||||||||
Net gains on investments of associates and joint ventures | — | — | — | 7,666 | — | 7,666 | ||||||||||||||||||
Including: share of profit of associates and joint ventures | — | — | — | 8,336 | — | 8,336 | ||||||||||||||||||
|
|
|
|
|
|
|
|
|
|
|
| |||||||||||||
Segment results | 28,073 | 11,611 | 572 | 14,220 | — | 54,476 | ||||||||||||||||||
|
|
|
|
|
|
|
|
|
|
|
| |||||||||||||
Income tax | (3,103 | ) | ||||||||||||||||||||||
|
| |||||||||||||||||||||||
Net profit | 51,373 | |||||||||||||||||||||||
|
| |||||||||||||||||||||||
Attributable to | ||||||||||||||||||||||||
– Equity holders of the Company | 50,257 | |||||||||||||||||||||||
– Non-controlling interests | 1,116 | |||||||||||||||||||||||
Other comprehensive income attributable to equity holders of the Company | 23,685 | 1,534 | 78 | 402 | — | 25,699 | ||||||||||||||||||
Depreciation and amortisation | 3,086 | 1,118 | 351 | 607 | — | 5,162 | ||||||||||||||||||
|
|
|
|
|
|
|
|
|
|
|
| |||||||||||||
182
Notes to the Consolidated Financial Statements (continued)
For the year ended 31 December 2021
| 5 | SEGMENT INFORMATION (continued) |
| As at 31 December 2020 | ||||||||||||||||||||||||
| Life | Health | Accident | Others | Elimination | Total | |||||||||||||||||||
| RMB million | ||||||||||||||||||||||||
Assets | ||||||||||||||||||||||||
Financial assets | 3,537,020 | 222,559 | 10,964 | 117,276 | — | 3,887,819 | ||||||||||||||||||
Others | 10,076 | 14,939 | 675 | 239,584 | — | 265,274 | ||||||||||||||||||
|
|
|
|
|
|
|
|
|
|
|
| |||||||||||||
Segment assets | 3,547,096 | 237,498 | 11,639 | 356,860 | — | 4,153,093 | ||||||||||||||||||
|
|
|
|
|
|
|
|
|
|
|
| |||||||||||||
Unallocated | ||||||||||||||||||||||||
Property, plant and equipment | 52,747 | |||||||||||||||||||||||
Others | 46,626 | |||||||||||||||||||||||
|
| |||||||||||||||||||||||
Total | 4,252,466 | |||||||||||||||||||||||
|
| |||||||||||||||||||||||
Liabilities | ||||||||||||||||||||||||
Insurance contracts | 2,767,642 | 195,487 | 10,096 | — | — | 2,973,225 | ||||||||||||||||||
Investment contracts | 271,757 | 16,455 | — | — | — | 288,212 | ||||||||||||||||||
Securities sold under agreements to repurchase | 109,156 | 7,070 | 358 | 5,665 | — | 122,249 | ||||||||||||||||||
Others | 84,668 | 6,013 | 370 | 23,288 | — | 114,339 | ||||||||||||||||||
|
|
|
|
|
|
|
|
|
|
|
| |||||||||||||
Segment liabilities | 3,233,223 | 225,025 | 10,824 | 28,953 | — | 3,498,025 | ||||||||||||||||||
|
|
|
|
|
|
|
|
|
|
|
| |||||||||||||
Unallocated | ||||||||||||||||||||||||
Others | 297,504 | |||||||||||||||||||||||
|
| |||||||||||||||||||||||
Total | 3,795,529 | |||||||||||||||||||||||
|
| |||||||||||||||||||||||
183
Notes to the Consolidated Financial Statements (continued)
For the year ended 31 December 2021
| 6 | PROPERTY, PLANT AND EQUIPMENT |
| Buildings | Office equipment, furniture and fixtures | Motor vehicles | Assets under construction | Leasehold improvements | Total | |||||||||||||||||||
| RMB million | ||||||||||||||||||||||||
Cost | ||||||||||||||||||||||||
As at 1 January 2021 | 50,428 | 8,091 | 1,352 | 11,333 | 2,798 | 74,002 | ||||||||||||||||||
Transfers upon completion | 7,208 | — | — | (7,601 | ) | 182 | (211 | ) | ||||||||||||||||
Additions | 1,415 | 716 | 5 | 3,267 | — | 5,403 | ||||||||||||||||||
Transfers into investment properties | — | — | — | (209 | ) | — | (209 | ) | ||||||||||||||||
Disposals | (456 | ) | (456 | ) | (46 | ) | — | (548 | ) | (1,506 | ) | |||||||||||||
|
|
|
|
|
|
|
|
|
|
|
| |||||||||||||
As at 31 December 2021 | 58,595 | 8,351 | 1,311 | 6,790 | 2,432 | 77,479 | ||||||||||||||||||
|
|
|
|
|
|
|
|
|
|
|
| |||||||||||||
Accumulated depreciation | ||||||||||||||||||||||||
As at 1 January 2021 | (13,085 | ) | (5,433 | ) | (891 | ) | — | (1,821 | ) | (21,230 | ) | |||||||||||||
Charge for the year | (1,799 | ) | (778 | ) | (149 | ) | — | (379 | ) | (3,105 | ) | |||||||||||||
Disposals | 271 | 434 | 44 | — | 530 | 1,279 | ||||||||||||||||||
|
|
|
|
|
|
|
|
|
|
|
| |||||||||||||
As at 31 December 2021 | (14,613 | ) | (5,777 | ) | (996 | ) | — | (1,670 | ) | (23,056 | ) | |||||||||||||
|
|
|
|
|
|
|
|
|
|
|
| |||||||||||||
Impairment | ||||||||||||||||||||||||
As at 1 January 2021 | (24 | ) | — | — | (1 | ) | — | (25 | ) | |||||||||||||||
Charge for the year | — | — | — | — | — | — | ||||||||||||||||||
Disposals | — | — | — | — | — | — | ||||||||||||||||||
|
|
|
|
|
|
|
|
|
|
|
| |||||||||||||
As at 31 December 2021 | (24 | ) | — | — | (1 | ) | — | (25 | ) | |||||||||||||||
|
|
|
|
|
|
|
|
|
|
|
| |||||||||||||
Net book value | ||||||||||||||||||||||||
As at 1 January 2021 | 37,319 | 2,658 | 461 | 11,332 | 977 | 52,747 | ||||||||||||||||||
|
|
|
|
|
|
|
|
|
|
|
| |||||||||||||
As at 31 December 2021 | 43,958 | 2,574 | 315 | 6,789 | 762 | 54,398 | ||||||||||||||||||
|
|
|
|
|
|
|
|
|
|
|
| |||||||||||||
184
Notes to the Consolidated Financial Statements (continued)
For the year ended 31 December 2021
| 6 | PROPERTY, PLANT AND EQUIPMENT (continued) |
| Buildings | Office equipment, furniture and | Motor vehicles | Assets under construction | Leasehold improvements | Total | |||||||||||||||||||
| RMB million | ||||||||||||||||||||||||
Cost | ||||||||||||||||||||||||
As at 1 January 2020 | 44,771 | 8,368 | 1,364 | 14,378 | 2,619 | 71,500 | ||||||||||||||||||
Transfers upon completion | 6,010 | 3 | — | (6,456 | ) | 322 | (121 | ) | ||||||||||||||||
Additions | 222 | 626 | 131 | 5,509 | — | 6,488 | ||||||||||||||||||
Transfers into investment properties | — | — | — | (2,098 | ) | — | (2,098 | ) | ||||||||||||||||
Disposals | (575 | ) | (906 | ) | (143 | ) | — | (143 | ) | (1,767 | ) | |||||||||||||
|
|
|
|
|
|
|
|
|
|
|
| |||||||||||||
As at 31 December 2020 | 50,428 | 8,091 | 1,352 | 11,333 | 2,798 | 74,002 | ||||||||||||||||||
|
|
|
|
|
|
|
|
|
|
|
| |||||||||||||
Accumulated depreciation | ||||||||||||||||||||||||
As at 1 January 2020 | (11,811 | ) | (5,484 | ) | (841 | ) | — | (1,581 | ) | (19,717 | ) | |||||||||||||
Charge for the year | (1,582 | ) | (725 | ) | (189 | ) | — | (377 | ) | (2,873 | ) | |||||||||||||
Disposals | 308 | 776 | 139 | — | 137 | 1,360 | ||||||||||||||||||
|
|
|
|
|
|
|
|
|
|
|
| |||||||||||||
As at 31 December 2020 | (13,085 | ) | (5,433 | ) | (891 | ) | — | (1,821 | ) | (21,230 | ) | |||||||||||||
|
|
|
|
|
|
|
|
|
|
|
| |||||||||||||
Impairment | ||||||||||||||||||||||||
As at 1 January 2020 | (24 | ) | — | — | (1 | ) | — | (25 | ) | |||||||||||||||
Charge for the year | — | — | — | — | — | — | ||||||||||||||||||
|
|
|
|
|
|
|
|
|
|
|
| |||||||||||||
As at 31 December 2020 | (24 | ) | — | — | (1 | ) | — | (25 | ) | |||||||||||||||
|
|
|
|
|
|
|
|
|
|
|
| |||||||||||||
Net book value | ||||||||||||||||||||||||
As at 1 January 2020 | 32,936 | 2,884 | 523 | 14,377 | 1,038 | 51,758 | ||||||||||||||||||
|
|
|
|
|
|
|
|
|
|
|
| |||||||||||||
As at 31 December 2020 | 37,319 | 2,658 | 461 | 11,332 | 977 | 52,747 | ||||||||||||||||||
|
|
|
|
|
|
|
|
|
|
|
| |||||||||||||
As at 31 December 2021, the net book value of buildings above which were in process to obtain title certificates was RMB9,605 million (as at 31 December 2020: RMB6,159 million).
185
Notes to the Consolidated Financial Statements (continued)
For the year ended 31 December 2021
| 7 | LEASES |
| (a) | Right-of-use assets |
| Buildings | Others | Total | ||||||||||
| RMB million | ||||||||||||
Cost | ||||||||||||
As at 1 January | 5,430 | 2 | 5,432 | |||||||||
2021 Additions | 972 | 1 | 973 | |||||||||
Deductions | (1,032 | ) | (1 | ) | (1,033 | ) | ||||||
|
|
|
|
|
| |||||||
As at 31 December 2021 | 5,370 | 2 | 5,372 | |||||||||
|
|
|
|
|
| |||||||
Accumulated depreciation | ||||||||||||
As at 1 January 2021 | (2,355 | ) | (1 | ) | (2,356 | ) | ||||||
Charge for the year | (1,410 | ) | (1 | ) | (1,411 | ) | ||||||
Deductions | 912 | 1 | 913 | |||||||||
|
|
|
|
|
| |||||||
As at 31 December 2021 | (2,853 | ) | (1 | ) | (2,854 | ) | ||||||
|
|
|
|
|
| |||||||
Impairment | ||||||||||||
As at 1 January 2021 | ||||||||||||
As at 31 December 2021 | — | — | — | |||||||||
|
|
|
|
|
| |||||||
Net book value | — | — | — | |||||||||
|
|
|
|
|
| |||||||
As at 1 January 2021 | 3,075 | 1 | 3,076 | |||||||||
|
|
|
|
|
| |||||||
As at 31 December 2021 | 2,517 | 1 | 2,518 | |||||||||
|
|
|
|
|
| |||||||
| Buildings | Others | Total | ||||||||||
| RMB million | ||||||||||||
Cost | ||||||||||||
As at 1 January 2020 | 4,686 | 2 | 4,688 | |||||||||
Additions | 1,157 | 1 | 1,158 | |||||||||
Deductions | (413 | ) | (1 | ) | (414 | ) | ||||||
|
|
|
|
|
| |||||||
As at 31 December 2020 | 5,430 | 2 | 5,432 | |||||||||
|
|
|
|
|
| |||||||
Accumulated depreciation | ||||||||||||
As at 1 January 2020 | (1,167 | ) | (1 | ) | (1,168 | ) | ||||||
Charge for the year | (1,517 | ) | (1 | ) | (1,518 | ) | ||||||
Deductions | 329 | 1 | 330 | |||||||||
|
|
|
|
|
| |||||||
As at 31 December 2020 | (2,355 | ) | (1 | ) | (2,356 | ) | ||||||
|
|
|
|
|
| |||||||
Impairment | ||||||||||||
As at 1 January 2020 | ||||||||||||
As at 31 December 2020 | — | — | — | |||||||||
|
|
|
|
|
| |||||||
Net book value | — | — | — | |||||||||
|
|
|
|
|
| |||||||
As at 1 January 2020 | 3,519 | 1 | 3,520 | |||||||||
|
|
|
|
|
| |||||||
As at 31 December 2020 | 3,075 | 1 | 3,076 | |||||||||
|
|
|
|
|
| |||||||
The Group had no significant profit or loss from subleasing right-of-use assets or sale and leaseback transactions for the year ended 31 December 2021 (2020: same).
The Group’s right-of-use assets include the above assets and land use rights disclosed in Note 14.
186
Notes to the Consolidated Financial Statements (continued)
For the year ended 31 December 2021
| 7 | LEASES (continued) |
| (b) | The amounts recognised in profit or loss in relation to leases are as follows: |
| As at 31 December 2021 RMB million | As at 31 December 2020 RMB million | |||||||
Interest on lease liabilities | 96 | 113 | ||||||
Depreciation charge of right-of-use assets | 1,411 | 1,518 | ||||||
Expense relating to short-term leases | 332 | 260 | ||||||
Expense relating to leases of low-value assets (except for short-term lease liabilities) | 1 | 2 | ||||||
|
|
|
| |||||
Total | 1,840 | 1,893 | ||||||
|
|
|
| |||||
| 8 | INVESTMENT PROPERTIES |
| Buildings RMB million | ||||
Cost | ||||
As at 1 January 2021 | 15,385 | |||
Additions | (414 | ) | ||
|
| |||
As at 31 December 2021 | 14,971 | |||
|
| |||
Accumulated depreciation | ||||
As at 1 January 2021 | (1,168 | ) | ||
Additions | (429 | ) | ||
|
| |||
As at 31 December 2021 | (1,597 | ) | ||
|
| |||
Net book value | ||||
As at 1 January 2021 | 14,217 | |||
|
| |||
As at 31 December 2021 | 13,374 | |||
|
| |||
Fair value | ||||
As at 1 January 2021 | 17,285 | |||
|
| |||
As at 31 December 2021 | 16,626 | |||
|
| |||
187
Notes to the Consolidated Financial Statements (continued)
For the year ended 31 December 2021
| 8 | INVESTMENT PROPERTIES (continued) |
| Buildings RMB million | ||||
Cost | ||||
As at 1 January 2020 | 12,898 | |||
Additions | 2,487 | |||
|
| |||
As at 31 December 2020 | 15,385 | |||
|
| |||
Accumulated depreciation | ||||
As at 1 January 2020 | (757 | ) | ||
Additions | (411 | ) | ||
|
| |||
As at 31 December 2020 | (1,168 | ) | ||
|
| |||
Net book value | ||||
As at 1 January 2020 | 12,141 | |||
|
| |||
As at 31 December 2020 | 14,217 | |||
|
| |||
Fair value | ||||
As at 1 January 2020 | 14,870 | |||
|
| |||
As at 31 December 2020 | 17,285 | |||
|
| |||
The Company leases part of its investment properties to its subsidiaries and charges rentals based on the areas occupied by the respective entities. These properties are categorised as property, plant and equipment of the Group in the consolidated statement of financial position.
The Group has no restrictions on the use of its investment properties and no contractual obligations to each investment property purchased, constructed or developed or for repairs, maintenance and enhancements.
As at 31 December 2021, the net book value of investment properties which were in process to obtain title certificates was RMB981 million (as at 31 December 2020: RMB1,044 million).
The fair value of investment properties of the Group as at 31 December 2021 amounted to RMB16,626 million (as at
31 December 2020: RMB17,285 million), which was estimated by the Group having regards to valuations performed by independent appraisers. The investment properties were classified as Level 3 in the fair value hierarchy.
The Group uses the weighted average of market comparison approach and income approach as its valuation method to estimate the fair value of its investment properties. Under the market comparison approach, the estimated fair value of a property is based on the average sale price of comparable properties recently sold; the income approach is to convert projected future incomes of investment properties into value by rate of return, rate of capitalization or income multiplier. According to the calculation results of the above two valuation approaches, with consideration of the comprehensive adjustment coefficient, which is composed of a number of adjusting factors, including the time and the conditions of sale, the geographical location, age, decoration, floor area, lot size of the property and other factors.
Under the market comparison approach and income approach, an increase (decrease) in the comprehensive adjustment coefficient will result in an increase (decrease) in the fair value of investment properties.
188
Notes to the Consolidated Financial Statements (continued)
For the year ended 31 December 2021
| 9 | INVESTMENTS IN ASSOCIATES AND JOINT VENTURES |
| 2021 RMB million | 2020 RMB million | |||||||
As at 1 January | 239,584 | 222,983 | ||||||
Change of the cost | 11,400 | 13,997 | ||||||
Share of profit or loss | 10,328 | 8,336 | ||||||
Declared dividends | (4,480 | ) | (5,253 | ) | ||||
Other equity movements | 1,121 | 228 | ||||||
Impairment | — | (707 | ) | |||||
|
|
|
| |||||
As at 31 December | 257,953 | 239,584 | ||||||
|
|
|
| |||||
| Movement | ||||||||||||||||||||||||||||||||||||||||||||
Accounting method | Cost | As at 31 December 2020 | Change of the cost | Share of profit or loss | Declared dividends | Other equity movements | Provision of impairment | As at 31 December 2021 | Percentage equity interest | Accumulated of amount of impairment | ||||||||||||||||||||||||||||||||||
| RMB Million | RMB Million | |||||||||||||||||||||||||||||||||||||||||||
Associates | ||||||||||||||||||||||||||||||||||||||||||||
China Guangfa Bank Co., Ltd. (“CGB”) (i) | | Equity Method | | 45,176 | 79,974 | — | 5,819 | (662 | ) | 1,048 | — | 86,179 | 43.686 | % | — | |||||||||||||||||||||||||||||
Sino-Ocean Group Holding Limited (“Sino-Ocean”) (ii) | | Equity Method | | 11,245 | 11,285 | — | 589 | (271 | ) | 296 | — | 11,899 | 29.59 | % | (3,217 | ) | ||||||||||||||||||||||||||||
China Life Property and Casualty Insurance Company Limited (“CLP&C”) | | Equity Method | | 6,000 | 10,620 | — | 272 | (214 | ) | (527 | ) | — | 10,151 | 40.00 | % | — | ||||||||||||||||||||||||||||
COFCO Futures Company Limited (“COFCO Futures”) | | Equity Method | | 1,339 | 1,612 | — | 98 | (15 | ) | (3 | ) | — | 1,692 | 35.00 | % | — | ||||||||||||||||||||||||||||
Sinopec Sichuan to East China Gas Pipeline Co., Ltd. (“Pipeline Company”) | | Equity Method | | 20,000 | 20,676 | — | 1,335 | (608 | ) | 35 | — | 21,438 | 43.86 | % | — | |||||||||||||||||||||||||||||
China United Network Communications Limited (“China Unicom”) (iii) | | Equity Method | | 21,801 | 22,433 | — | 602 | (369 | ) | (22 | ) | — | 22,644 | 10.29 | % | — | ||||||||||||||||||||||||||||
Others (iv) | | Equity Method | | 48,001 | 41,555 | 5,610 | 3,022 | (1,042 | ) | (130 | ) | — | 49,015 | — | ||||||||||||||||||||||||||||||
|
|
|
|
|
|
|
|
|
|
|
|
|
|
|
|
|
| |||||||||||||||||||||||||||
Subtotal | 153,562 | 188,155 | 5,610 | 11,737 | (3,181 | ) | 697 | — | 203,018 | (3,217 | ) | |||||||||||||||||||||||||||||||||
|
|
|
|
|
|
|
|
|
|
|
|
|
|
|
|
|
| |||||||||||||||||||||||||||
Joint ventures | ||||||||||||||||||||||||||||||||||||||||||||
Joy City Commercial Property Fund L.P. (“Joy City”) | | Equity Method | | 6,281 | 5,779 | — | 111 | (354 | ) | 10 | — | 5,546 | 66.67 | % | — | |||||||||||||||||||||||||||||
Mapleleaf Century Limited (“MCL”) Equity Method | 7,656 | 4,736 | — | (1,004 | ) | — | 505 | — | 4,237 | 75.00 | % | — | ||||||||||||||||||||||||||||||||
Others (iv) | | Equity Method | | 48,576 | 40,914 | 5,790 | (516 | ) | (945 | ) | (91 | ) | — | 45,152 | — | |||||||||||||||||||||||||||||
|
|
|
|
|
|
|
|
|
|
|
|
|
|
|
|
|
| |||||||||||||||||||||||||||
Subtotal | 62,513 | 51,429 | 5,790 | (1,409 | ) | (1,299 | ) | 424 | — | 54,935 | — | |||||||||||||||||||||||||||||||||
|
|
|
|
|
|
|
|
|
|
|
|
|
|
|
|
|
| |||||||||||||||||||||||||||
Total | 216,075 | 239,584 | 11,400 | 10,328 | (4,480 | ) | 1,121 | — | 257,953 | (3,217 | ) | |||||||||||||||||||||||||||||||||
|
|
|
|
|
|
|
|
|
|
|
|
|
|
|
|
|
|
|
| |||||||||||||||||||||||||
189
Notes to the Consolidated Financial Statements (continued)
For the year ended 31 December 2021
| 9 | INVESTMENTS IN ASSOCIATES AND JOINT VENTURES (continued) |
| (i) | The 2020 final dividend of RMB0.077 in cash per ordinary share was approved and declared in the Annual General Meeting of CGB on 30 June 2021. The Company received a cash dividend of RMB662 million. |
| (ii) | The 2020 final dividend of HKD0.09 in cash per ordinary share was approved and declared in the Annual General Meeting of Sino-Ocean on 21 May 2021. The Company received a cash dividend equivalent to RMB168 million. The 2021 interim dividend of HKD0.055 in cash per ordinary share was approved and declared by the Board of Directors of Sino-Ocean on 19 August 2021. The Company received a cash dividend equivalent to RMB103 million. |
Sino-Ocean, the Group’s associate is listed in Hong Kong. On 31 December 2021, the stock price of Sino-Ocean was HKD1.82 per share. As at 31 December 2020, the cumulative impairment loss of RMB3,217 million for the investment in Sino-Ocean had been recognised by the Group. The Group performed an impairment test to this investment valued using the discounted future cash flow method on 31 December 2021 and no further impairment loss should be made. The impairment test involved significant assumptions including selling prices of properties under development, rental prices of investment properties and discount rates, and the Group used 10% as the discount rate of cash flow for properties under development and investment properties (As at 31 December 2020: 10% for properties under development and investment properties).
| (iii) | The 2020 final dividend of RMB0.0669 in cash per ordinary share was approved and declared in the Annual General Meeting of China Unicom on 11 May 2021. The Company received a cash dividend of RMB213 million. The 2021 interim dividend of RMB0.0488 in cash per ordinary share was approved and declared in the Annual General Meeting of China Unicom on 23 September 2021. The Company received a cash dividend equivalent to RMB156 million. |
On 31 December 2021, the stock price of China Unicom was RMB3.93 per share.
| (iv) | The Group invested in real estate, industrial logistics assets and other industries through these enterprises. |
| (v) | There is no significant restriction for the Group to dispose of its other associates and joint ventures. |
As at 31 December 2021, the major associates and joint ventures of the Group are as follows:
Name | Place of incorporation | Percentage of equity interest held | ||||||
Associates | ||||||||
CGB | PRC | 43.686 | % | |||||
Sino-Ocean | Hong Kong, PRC | 29.59 | % | |||||
CLP&C | PRC | 40.00 | % | |||||
COFCO Futures | PRC | 35.00 | % | |||||
Pipeline Company | PRC | 43.86 | % | |||||
China Unicom | PRC | 10.29 | % | |||||
Joint ventures | ||||||||
Joy City | The British Cayman Islands | 66.67 | % | |||||
MCL | The British Virgin Islands | 75.00 | % | |||||
190
Notes to the Consolidated Financial Statements (continued)
For the year ended 31 December 2021
| 9 | INVESTMENTS IN ASSOCIATES AND JOINT VENTURES (continued) |
As at 31 December 2020, the major associates and joint ventures of the Group are as follows:
Name | Place of incorporation | Percentage of equity interest held | ||||||
Associates | ||||||||
CGB | PRC | 43.686 | % | |||||
Sino-Ocean | Hong Kong, PRC | 29.59 | % | |||||
CLP&C | PRC | 40.00 | % | |||||
COFCO Futures | PRC | | 35.00 | % | ||||
Pipeline Company | PRC | 43.86 | % | |||||
China Unicom | PRC | | 10.29 | % | ||||
Joint ventures | ||||||||
Joy City | The British Cayman Islands | 66.67 | % | |||||
MCL | The British Virgin Islands | 75.00 | % | |||||
The following table illustrates the financial information of the Group’s major associates and joint ventures as at 31 December 2021 and for the year ended 31 December 2021:
| CGB RMB million | Sino-Ocean RMB million | CLP&C RMB million | COFCO Futures RMB million | Pipeline Company RMB million | China Unicom RMB million | Joy City RMB million | MCL RMB million | |||||||||||||||||||||||||
Total assets | 3,359,985 | 281,252 | 120,178 | 25,153 | 37,099 | 593,284 | 10,258 | 24,195 | ||||||||||||||||||||||||
Total liabilities | 3,125,484 | 204,805 | 94,756 | 21,868 | 1,476 | 257,074 | 232 | 13,035 | ||||||||||||||||||||||||
Total equity | 234,501 | 76,447 | 25,422 | 3,285 | 35,623 | 336,210 | 10,026 | 11,160 | ||||||||||||||||||||||||
Total equity attributable to equity holders of the associates and joint ventures | 189,510 | 55,074 | 25,422 | 3,277 | 35,623 | 149,217 | 10,026 | 11,160 | ||||||||||||||||||||||||
Total adjustments (i) | 464 | (7,257 | ) | — | — | 405 | 16,509 | (1,707 | ) | (5,511 | ) | |||||||||||||||||||||
Total equity attributable to equity holders of the associates and joint ventures after adjustments | 189,974 | 47,817 | 25,422 | 3,277 | 36,028 | 165,726 | 8,319 | 5,649 | ||||||||||||||||||||||||
Proportion of the Group’s ownership | 43.686 | % | 29.59 | % | 40.00 | % | 35.00 | % | 43.86 | % | 10.29 | % | 66.67 | % | 75.00 | % | ||||||||||||||||
Gross carrying value of the investments Impairment | 86,179 | 15,116 | 10,151 | 1,692 | 21,438 | 22,644 | 5,546 | 4,237 | ||||||||||||||||||||||||
Net carrying value of the investments | — | (3,217 | ) | — | — | — | — | — | — | |||||||||||||||||||||||
Total revenues | 86,179 | 11,899 | 10,151 | 1,692 | 21,438 | 22,644 | 5,546 | 4,237 | ||||||||||||||||||||||||
|
|
|
|
|
|
|
|
|
|
|
|
|
|
|
| |||||||||||||||||
Net profit/(loss) | 74,905 | 68,645 | 82,549 | 6,846 | 5,583 | 331,665 | 352 | 897 | ||||||||||||||||||||||||
Other comprehensive income | 17,476 | 5,091 | 621 | 281 | 3,081 | 14,416 | 333 | 28 | ||||||||||||||||||||||||
Total comprehensive income | 2,416 | (35 | ) | (766 | ) | (8 | ) | — | (27 | ) | 15 | 447 | ||||||||||||||||||||
| 19,892 | 5,056 | (145 | ) | 273 | 3,081 | 14,389 | 348 | 475 | ||||||||||||||||||||||||
|
|
|
|
|
|
|
|
|
|
|
|
|
|
|
| |||||||||||||||||
191
Notes to the Consolidated Financial Statements (continued)
For the year ended 31 December 2021
| 9 | INVESTMENTS IN ASSOCIATES AND JOINT VENTURES (continued) |
The following table illustrates the financial information of the Group’s major associates and joint ventures as at 31 December 2020 and for the year ended 31 December 2020:
| CGB RMB million | Sino-Ocean RMB million | CLP&C RMB million | COFCO Futures RMB million | Pipeline Company RMB million | China Unicom RMB million | Joy City RMB million | MCL RMB million | |||||||||||||||||||||||||
Total assets | 3,027,972 | 263,528 | 106,930 | 20,567 | 34,933 | 582,475 | 10,306 | 24,196 | ||||||||||||||||||||||||
Total liabilities | 2,809,822 | 193,806 | 80,379 | 17,512 | 1,068 | 251,001 | 85 | 13,342 | ||||||||||||||||||||||||
Total equity | 218,150 | 69,722 | 26,551 | 3,055 | 33,865 | 331,474 | 10,221 | 10,854 | ||||||||||||||||||||||||
Total equity attributable to equity holders of the associates and joint ventures | 173,159 | 52,273 | 26,551 | 3,048 | 33,865 | 147,709 | 10,221 | 10,854 | ||||||||||||||||||||||||
Total adjustments (i) | 2,612 | (6,528 | ) | — | — | 427 | 16,981 | (1,552 | ) | (4,540 | ) | |||||||||||||||||||||
Total equity attributable to equity holders of the associates and joint ventures after adjustments | 175,771 | 45,745 | 26,551 | 3,048 | 34,292 | 164,690 | 8,669 | 6,314 | ||||||||||||||||||||||||
Proportion of the Group’s ownership | 43.686 | % | 29.59 | % | 40.00 | % | 35.00 | % | 43.86 | % | 10.29 | % | 66.67 | % | 75.00 | % | ||||||||||||||||
Gross carrying value of the investments Impairment | 79,974 | 14,502 | 10,620 | 1,612 | 20,676 | 22,433 | 5,779 | 4,736 | ||||||||||||||||||||||||
Net carrying value of the investments | — | (3,217 | ) | — | — | — | — | — | — | |||||||||||||||||||||||
Total revenues | 79,974 | 11,285 | 10,620 | 1,612 | 20,676 | 22,433 | 5,779 | 4,736 | ||||||||||||||||||||||||
|
|
|
|
|
|
|
|
|
|
|
|
|
|
|
| |||||||||||||||||
Net profit/(loss) | 80,525 | 61,271 | 77,990 | 2,193 | 5,259 | 306,490 | 360 | 853 | ||||||||||||||||||||||||
Other comprehensive income | 13,812 | 4,675 | 1,730 | 208 | 2,823 | 12,525 | 339 | 185 | ||||||||||||||||||||||||
Total comprehensive income | (1,944 | ) | 630 | 1,991 | (5 | ) | — | (1,706 | ) | (25 | ) | 650 | ||||||||||||||||||||
| 11,868 | 5,305 | 3,721 | 203 | 2,823 | 10,819 | 314 | 835 | |||||||||||||||||||||||||
|
|
|
|
|
|
|
|
|
|
|
|
|
| �� |
|
| ||||||||||||||||
| (i) | Including adjustments for the difference of accounting policies, fair value and others. |
The Group had no contingent liabilities with the associates and joint ventures as at 31 December 2021 and 31 December 2020. The Group had a capital contribution commitment of RMB20,730 million with associates and joint ventures as at 31 December 2021 (as at 31 December 2020: RMB25,364 million). The capital contribution commitment amount has been included in the capital commitments in Note 40.
192
Notes to the Consolidated Financial Statements (continued)
For the year ended 31 December 2021
| 10 | FINANCIAL ASSETS |
| 10.1 | Held-to-maturity securities |
| As at 31 December 2021 RMB million | As at 31 December 2020 RMB million | |||||||
Debt securities | ||||||||
Government bonds | 349,370 | 265,198 | ||||||
Government agency bonds | 911,451 | 617,515 | ||||||
Corporate bonds | 209,627 | 201,988 | ||||||
Subordinated bonds | 63,305 | 104,668 | ||||||
|
|
|
| |||||
Total | 1,533,753 | 1,189,369 | ||||||
|
|
|
| |||||
Debt securities | ||||||||
Listed in Mainland, PRC | 246,134 | 215,671 | ||||||
Listed in Hong Kong, PRC | 87 | 148 | ||||||
Listed overseas | 44 | 70 | ||||||
Unlisted (i) | 1,287,488 | 973,480 | ||||||
|
|
|
| |||||
Total | 1,533,753 | 1,189,369 | ||||||
|
|
|
| |||||
| (i) | Unlisted debt securities include those traded on the Chinese interbank market. |
As at 31 December 2021, no accumulated impairment loss for the investment of held-to-maturity securities has been recognised by the Group (2020: RMB20 million).
Debt securities – fair value hierarchy | As at 31 December 2021 | As at 31 December 2020 | ||||||||||||||||||||||
| Level 1 RMB million | Level 2 RMB million | Total RMB million | Level 1 RMB million | Level 2 RMB million | Total RMB million | |||||||||||||||||||
Government bonds | 68,300 | 314,113 | 382,413 | 37,134 | 238,636 | 275,770 | ||||||||||||||||||
Government agency bonds | 74,241 | 895,343 | 969,584 | 71,715 | 559,488 | 631,203 | ||||||||||||||||||
Corporate bonds | 7,911 | 211,882 | 219,793 | 4,433 | 205,440 | 209,873 | ||||||||||||||||||
Subordinated bonds | — | 66,481 | 66,481 | 12,332 | 96,362 | 108,694 | ||||||||||||||||||
|
|
|
|
|
|
|
|
|
|
|
| |||||||||||||
Total | 150,452 | 1,487,819 | 1,638,271 | 125,614 | 1,099,926 | 1,225,540 | ||||||||||||||||||
|
|
|
|
|
|
|
|
|
|
|
| |||||||||||||
Debt securities – Contractual maturity schedule | As at 31 December 2021 RMB million | As at 31 December 2020 RMB million | ||||||
Maturing: | ||||||||
Within one year | 55,370 | 25,520 | ||||||
After one year but within five years | 147,786 | 146,463 | ||||||
After five years but within ten years | 163,479 | 206,134 | ||||||
After ten years | 1,167,118 | 811,252 | ||||||
|
|
|
| |||||
Total | 1,533,753 | 1,189,369 | ||||||
|
|
|
| |||||
193
Notes to the Consolidated Financial Statements (continued)
For the year ended 31 December 2021
| 10 | FINANCIAL ASSETS (continued) |
| 10.2 | Loans |
| As at 31 December 2021 RMB million | As at 31 December 2020 RMB million | |||||||
Policy loans (i) | 236,209 | 200,730 | ||||||
Other loans | 433,697 | 460,248 | ||||||
|
|
|
| |||||
Total | 669,906 | 660,978 | ||||||
|
|
|
| |||||
Impairment | (3,819 | ) | (2,443 | ) | ||||
|
|
|
| |||||
Net value | 666,087 | 658,535 | ||||||
|
|
|
| |||||
| As at 31 December 2021 RMB million | As at 31 December 2020 RMB million | |||||||
Maturing: | ||||||||
Within one year | 348,940 | 231,291 | ||||||
After one year but within five years | 182,493 | 287,196 | ||||||
After five years but within ten years | 106,319 | 114,885 | ||||||
After ten years | 32,154 | 27,606 | ||||||
|
|
|
| |||||
Total | 669,906 | 660,978 | ||||||
|
|
|
| |||||
Impairment | (3,819 | ) | (2,443 | ) | ||||
|
|
|
| |||||
Net value | 666,087 | 658,535 | ||||||
|
|
|
| |||||
| (i) | As at 31 December 2021, maturities of policy loans were within 6 months (as at 31 December 2020: same). |
| 10.3 | Term deposits |
| As at 31 December 2021 RMB million | As at 31 December 2020 RMB million | |||||||
Maturing: | ||||||||
Within one year | 135,301 | 63,090 | ||||||
After one year but within five years | 394,187 | 480,848 | ||||||
After five years but within ten years | — | 1,740 | ||||||
|
|
|
| |||||
Total | 529,488 | 545,678 | ||||||
|
|
|
| |||||
As at 31 December 2021, the Group’s term deposits of RMB2,641 million (as at 31 December 2020: RMB750 million) were deposited in banks for risk reserves of enterprise annuity fund investments, risk reserves of personal endowment security management business and backing overseas borrowings, which are restricted to use.
194
Notes to the Consolidated Financial Statements (continued)
For the year ended 31 December 2021
| 10 | FINANCIAL ASSETS (continued) |
| 10.4 | Statutory deposits – restricted |
| As at 31 December 2021 RMB million | As at 31 December 2020 RMB million | |||||||
Contractual maturity schedule: | ||||||||
Within one year | 1,720 | — | ||||||
After one year but within five years | 4,613 | 6,333 | ||||||
|
|
|
| |||||
Total | 6,333 | 6,333 | ||||||
|
|
|
| |||||
Insurance companies in China are required to deposit an amount that equals 20% of their registered capital with banks in compliance with regulations of the CBIRC. These funds may not be used for any purpose other than for paying off debts during liquidation proceedings.
| 10.5 | Available-for-sale securities |
| As at 31 December 2021 RMB million | As at 31 December 2020 RMB million | |||||||
Available-for-sale securities, at fair value | ||||||||
Debt securities | ||||||||
Government bonds | 58,561 | 49,256 | ||||||
Government agency bonds | 259,753 | 169,013 | ||||||
Corporate bonds | 203,147 | 136,025 | ||||||
Subordinated bonds | 111,029 | 81,795 | ||||||
Others (i) | 161,054 | 144,721 | ||||||
|
|
|
| |||||
Subtotal | 793,544 | 580,810 | ||||||
|
|
|
| |||||
Equity securities | ||||||||
Funds | 94,895 | 97,476 | ||||||
Common stocks | 256,441 | 301,249 | ||||||
Preferred stocks | 52,127 | 53,778 | ||||||
Wealth management products | 5,005 | 13,013 | ||||||
Others (i) | 206,996 | 148,671 | ||||||
|
|
|
| |||||
Subtotal | 615,464 | 614,187 | ||||||
|
|
|
| |||||
Available-for-sale securities, at cost | ||||||||
Equity securities | ||||||||
Others (i) | 20,279 | 20,606 | ||||||
|
|
|
| |||||
Total | 1,429,287 | 1,215,603 | ||||||
|
|
|
| |||||
| (i) | Other available-for-sale securities mainly include unlisted equity investments, private equity funds, trust schemes and perpetual bonds. |
195
Notes to the Consolidated Financial Statements (continued)
For the year ended 31 December 2021
| 10 | FINANCIAL ASSETS (continued) |
| 10.5 | Available-for-sale securities (continued) |
| As at 31 December 2021 RMB million | As at 31 December 2020 RMB million | |||||||
Debt securities | ||||||||
Listed in Mainland, PRC | 86,145 | 42,154 | ||||||
Unlisted | 707,399 | 538,656 | ||||||
|
|
|
| |||||
Subtotal | 793,544 | 580,810 | ||||||
|
|
|
| |||||
Equity securities | ||||||||
Listed in Mainland, PRC | 238,155 | 200,254 | ||||||
Listed in Hong Kong, PRC | 75,694 | 108,493 | ||||||
Listed overseas | 28 | 278 | ||||||
Unlisted | 321,866 | 325,768 | ||||||
|
|
|
| |||||
Subtotal | 635,743 | 634,793 | ||||||
|
|
|
| |||||
Total | 1,429,287 | 1,215,603 | ||||||
|
|
|
| |||||
Unlisted debt securities include those traded on the Chinese interbank market and those not publicly traded. Unlisted equity securities include those not traded on stock exchanges, which are mainly open-ended funds with public market price quotations, wealth management products and private equity funds.
Debt securities – Contractual maturity schedule | As at 31 December 2021 RMB million | As at 31 December 2020 RMB million | ||||||
Maturing: | ||||||||
Within one year | 36,597 | 36,870 | ||||||
After one year but within five years | 179,476 | 125,202 | ||||||
After five years but within ten years | 318,992 | 271,394 | ||||||
After ten years | 258,479 | 147,344 | ||||||
|
|
|
| |||||
Total | 793,544 | 580,810 | ||||||
|
|
|
| |||||
196
Notes to the Consolidated Financial Statements (continued)
For the year ended 31 December 2021
| 10 | FINANCIAL ASSETS (continued) |
| 10.6 | Securities at fair value through profit or loss |
| As at 31 December 2021 RMB million | As at 31 December 2020 RMB million | |||||||
Debt securities | ||||||||
Government bonds | 1,393 | 1,638 | ||||||
Government agency bonds | 7,989 | 4,422 | ||||||
Corporate bonds | 90,425 | 86,803 | ||||||
Others | 43,250 | 2,752 | ||||||
|
|
|
| |||||
Subtotal | 143,057 | 95,615 | ||||||
|
|
|
| |||||
Equity securities | ||||||||
Funds | 17,794 | 16,835 | ||||||
Common stocks | 45,649 | 48,858 | ||||||
Others | 271 | 262 | ||||||
|
|
|
| |||||
Subtotal | 63,714 | 65,955 | ||||||
|
|
|
| |||||
Total | 206,771 | 161,570 | ||||||
|
|
|
| |||||
Debt securities | ||||||||
Listed in Mainland, PRC | 29,934 | 32,333 | ||||||
Listed in Hong Kong, PRC | 23 | 72 | ||||||
Listed overseas | 273 | 262 | ||||||
Unlisted | 112,827 | 62,948 | ||||||
|
|
|
| |||||
Subtotal | | 143,057 | | 95,615 | ||||
|
|
|
| |||||
Equity securities | ||||||||
Listed in Mainland, PRC | 45,817 | 51,629 | ||||||
Listed in Hong Kong, PRC | 736 | 80 | ||||||
Listed overseas | 4,849 | 4,213 | ||||||
Unlisted | | 12,312 | | 10,033 | ||||
|
|
|
| |||||
Subtotal | | 63,714 | | 65,955 | ||||
|
|
|
| |||||
Total | 206,771 | 161,570 | ||||||
|
|
|
| |||||
Unlisted debt securities include those traded on the Chinese interbank market and those not publicly traded. Unlisted equity securities include those not traded on stock exchanges, which are mainly open-ended funds with public market price quotations.
197
Notes to the Consolidated Financial Statements (continued)
For the year ended 31 December 2021
| 10 | FINANCIAL ASSETS (continued) |
| 10.7 | Securities purchased under agreements to resell |
| As at 31 December 2021 RMB million | As at 31 December 2020 RMB million | |||||||
Maturing: | ||||||||
Within 30 days | 11,896 | 7,947 | ||||||
Above 30 days | 1,019 | — | ||||||
|
|
|
| |||||
Total | 12,915 | 7,947 | ||||||
|
|
|
| |||||
| 10.8 | Accrued investment income |
| As at 31 December 2021 RMB million | As at 31 December 2020 RMB million | |||||||
Bank deposits | 12,735 | 12,570 | ||||||
Debt securities | 31,900 | 26,454 | ||||||
Others | 6,462 | 6,176 | ||||||
|
|
|
| |||||
Total | 51,097 | 45,200 | ||||||
|
|
|
| |||||
Current | 49,031 | 44,197 | ||||||
Non-current | 2,066 | 1,003 | ||||||
|
|
|
| |||||
Total | 51,097 | 45,200 | ||||||
|
|
|
| |||||
198
Notes to the Consolidated Financial Statements (continued)
For the year ended 31 December 2021
| 11 | FAIR VALUE OF FINANCIAL ASSETS AND LIABILITIES |
The table below presents the carrying value and estimated fair value of major financial assets and liabilities, and investment contracts:
| Carrying value | Estimated fair value (i) | |||||||||||||||
| As at 31 December 2021 RMB million | As at 31 December 2020 RMB million | As at 31 December 2021 RMB million | As at 31 December 2020 RMB million | |||||||||||||
Held-to-maturity securities (ii) | 1,533,753 | 1,189,369 | 1,638,271 | 1,225,540 | ||||||||||||
Loans (iii) | 666,087 | 658,535 | 686,005 | 667,545 | ||||||||||||
Term deposits | 529,488 | 545,667 | 529,488 | 545,667 | ||||||||||||
Statutory deposits – restricted | 6,333 | 6,333 | 6,333 | 6,333 | ||||||||||||
Available-for-sale securities, at fair value | 1,409,008 | 1,194,997 | 1,409,008 | 1,194,997 | ||||||||||||
Securities at fair value through profit or loss | 206,771 | 161,570 | 206,771 | 161,570 | ||||||||||||
Securities purchased under agreements to resell | 12,915 | 7,947 | 12,915 | 7,947 | ||||||||||||
Cash and cash equivalents | 60,440 | 56,655 | 60,440 | 56,655 | ||||||||||||
Investment contracts (iii) | (313,594 | ) | (288,212 | ) | (299,727 | ) | (276,521 | ) | ||||||||
Financial liabilities at fair value through profit or loss | (3,416 | ) | (3,732 | ) | (3,416 | ) | (3,732 | ) | ||||||||
Securities sold under agreements to repurchase | (239,446 | ) | (122,249 | ) | (239,446 | ) | (122,249 | ) | ||||||||
Bonds payable | (34,994 | ) | (34,992 | ) | (35,898 | ) | (35,602 | ) | ||||||||
Interest-bearing loans and borrowings | (18,686 | ) | (19,556 | ) | (18,686 | ) | (19,556 | ) | ||||||||
| (i) | The estimates and judgements to determine the fair value of financial assets are described in Note 3.2. |
| (ii) | The fair value of held-to-maturity securities is determined by reference with other debt securities which are measured by fair value. Please refer to Note 4.4. |
| (iii) | Investment contracts at fair value through profit or loss have quoted prices in active markets, and therefore, their fair value was classified as Level 1. |
The fair value of policy loans approximated its carrying value. The fair values of other loans and investment contracts at amortised cost were determined using valuation techniques, with consideration of the present value of expected cash flows arising from contracts using a risk-adjusted discount rate, allowing for the risk-free rate available on the valuation date, credit risk and risk margin associated with the future cash flows. The fair values of other loans and investment contracts at amortised cost were classified as Level 3.
| 12 | PREMIUMS RECEIVABLE |
As at 31 December 2021, the carrying value of premiums receivable within one year was RMB19,935 million (as at 31 December 2020: RMB20,458 million).
199
Notes to the Consolidated Financial Statements (continued)
For the year ended 31 December 2021
| 13 | REINSURANCE ASSETS |
| As at 31 December 2021 RMB million | As at 31 December 2020 RMB million | |||||||
Long-term insurance contracts ceded (Note 15) | 4,910 | 4,228 | ||||||
Due from reinsurance companies | 485 | 1,135 | ||||||
Ceded unearned premiums (Note 15) | 823 | 523 | ||||||
Claims recoverable from reinsurers (Note 15) | 412 | 209 | ||||||
|
|
|
| |||||
Total | 6,630 | 6,095 | ||||||
|
|
|
| |||||
Current | 1,720 | 1,867 | ||||||
Non-current | 4,910 | 4,228 | ||||||
|
|
|
| |||||
Total | 6,630 | 6,095 | ||||||
|
|
|
| |||||
| 14 | OTHER ASSETS |
| As at 31 December 2021 RMB million | As at 31 December 2020 RMB million | |||||||
Investments receivable and prepaid | 9,493 | 1,559 | ||||||
Land use rights (i) | 8,011 | 8,056 | ||||||
Disbursements | 5,327 | 5,866 | ||||||
Automated policy loans | 3,673 | 3,522 | ||||||
Tax prepaid | 3,353 | 2,257 | ||||||
Due from related parties | 717 | 728 | ||||||
Prepayments to constructors | 101 | 187 | ||||||
Others | 8,884 | 6,865 | ||||||
|
|
|
| |||||
Total | 39,559 | 29,040 | ||||||
|
|
|
| |||||
Current | 30,713 | 19,717 | ||||||
Non-current | 8,846 | 9,323 | ||||||
|
|
|
| |||||
Total | 39,559 | 29,040 | ||||||
|
|
|
| |||||
| (i) | The Group’s right-of-use assets include the above land use rights and right-of-use assets disclosed in Note 7. |
200
Notes to the Consolidated Financial Statements (continued)
For the year ended 31 December 2021
| 15 | INSURANCE CONTRACTS |
| (a) | Process used to decide on assumptions |
| (i) | For the insurance contracts of which future insurance benefits are affected by investment yields of the corresponding investment portfolios, the discount rate assumption is based on expected investment returns of the asset portfolio backing these liabilities, considering the impacts of time value on reserves. |
In developing the discount rate assumptions, the Group considers investment experience, the current investment portfolio and the trend of the relevant yield curves. The assumed discount rates reflect the future economic outlook as well as the Group’s investment strategy. The assumed discount rates with risk margin are as follows:
| Discount rate assumptions | ||||
As at 31 December 2021 | 4.85% | |||
As at 31 December 2020 | 4.85% | |||
For the insurance contracts of which future insurance benefits are not affected by investment yields of the corresponding investment portfolios, the discount rate assumption is based on the “Yield curve of reserve computation benchmark for insurance contracts”, published on the “China Bond” website with consideration of liquidity spreads, taxation and other relevant factors. The assumed spot discount rates with risk margin are as follows:
| Discount rate assumptions | ||||
As at 31 December 2021 | 2.88%~4.80% | |||
As at 31 December 2020 | 3.09%~4.80% | |||
There is uncertainty on the discount rate assumption, which is affected by factors such as future macro-economy, monetary and foreign exchange policies, capital market and availability of investment channels of insurance funds. The Group determines the discount rate assumption based on the information obtained at the end of each reporting period, including the consideration of risk margin.
| (ii) | The mortality and morbidity assumptions are based on the Group’s historical mortality and morbidity experience. The assumed mortality rates and morbidity rates vary with the age of the insured and contract type. |
The Group bases its mortality assumptions on China Life Insurance Mortality Table (2010-2013), adjusted where appropriate to reflect the Group’s recent historical mortality experience. The main source of uncertainty with life insurance contracts is that epidemics and wide-ranging lifestyle changes could result in deterioration in future mortality experience, thus leading to an inadequate reserving of liability. Similarly, improvements in longevity due to continuing advancements in medical care and social conditions may expose the Group to longevity risk.
The Group bases its morbidity assumptions for critical illness products on analysis of historical experience and expectations of future developments. There are two main sources of uncertainty. Firstly, wide-ranging lifestyle changes could result in future deterioration in morbidity experience. Secondly, future development of medical technologies and improved coverage of medical facilities available to policyholders may bring forward the timing of diagnosing critical illness, which demands earlier payment of the critical illness benefits. Both could ultimately result in an inadequate reserving of liability if current morbidity assumptions do not properly reflect such trends.
Risk margin is considered in the Group’s mortality and morbidity assumptions.
201
Notes to the Consolidated Financial Statements (continued)
For the year ended 31 December 2021
| 15 | INSURANCE CONTRACTS (continued) |
| (a) | Process used to decide on assumptions (continued) |
| (iii) | Expense assumptions are based on expected unit costs with the consideration of previous expense studies and future trends. Expense assumptions are affected by certain factors such as future inflation and market competition which bring uncertainty to these assumptions. The Group determines expense assumptions based on information obtained at the end of each reporting period and risk margin. Components of expense assumptions include the cost per policy and percentage of premium as follows: |
| Individual Life | Group Life | |||||||||||||
| RMB Per Policy | % of Premium | RMB Per Policy | % of Premium | |||||||||||
As at 31 December 2021 | 45.00 | 0.85%~0.90% | 25.00 | 0.90 | % | |||||||||
As at 31 December 2020 | 45.00 | 0.85%~0.90% | 25.00 | 0.90 | % | |||||||||
| (iv) | The lapse rates and other assumptions are affected by certain factors, such as future macro-economy, availability of financial substitutions, and market competition, which bring uncertainty to these assumptions. The lapse rates and other assumptions are determined with reference to creditable past experience, current conditions, future expectations and other information. |
| (v) | The Group applies a consistent method to determine risk margin. The Group considers risk margin for the discount rate, mortality and morbidity and expense assumptions to compensate for the uncertain amount and timing of future cash flows. When determining risk margin, the Group considers historical experience, future expectations and other factors. The Group determines the risk margin level by itself as the regulations have not imposed any specific requirement on it. |
The Group adopts a consistent process to decide on assumptions for the insurance contracts disclosed in this note. On each reporting date, the Group reviews the assumptions for reasonable estimates of liability and risk margin, with consideration of all available information, and taking into account the Group’s historical experience and expectation of future events.
202
Notes to the Consolidated Financial Statements (continued)
For the year ended 31 December 2021
| 15 | INSURANCE CONTRACTS (continued) |
| (b) | Net liabilities of insurance contracts |
| As at 31 December 2021 RMB million | As at 31 December 2020 RMB million | |||||||
Gross | ||||||||
Long-term insurance contracts | 3,379,603 | 2,936,533 | ||||||
Short-term insurance contracts | ||||||||
– Claims and claim adjustment expenses | 26,234 | 21,991 | ||||||
– Unearned premiums | 14,062 | 14,701 | ||||||
|
|
|
| |||||
Total, gross | 3,419,899 | 2,973,225 | ||||||
|
|
|
| |||||
Recoverable from reinsurers | ||||||||
Long-term insurance contracts (Note 13) | (4,910 | ) | (4,228 | ) | ||||
Short-term insurance contracts | ||||||||
– Claims and claim adjustment expenses (Note 13) | (412 | ) | (209 | ) | ||||
– Unearned premiums (Note 13) | (823 | ) | (523 | ) | ||||
|
|
|
| |||||
Total, ceded | (6,145 | ) | (4,960 | ) | ||||
|
|
|
| |||||
Net | ||||||||
Long-term insurance contracts | 3,374,693 | 2,932,305 | ||||||
Short-term insurance contracts | ||||||||
– Claims and claim adjustment expenses | 25,822 | 21,782 | ||||||
– Unearned premiums | 13,239 | 14,178 | ||||||
|
|
|
| |||||
Total, net | 3,413,754 | 2,968,265 | ||||||
|
|
|
| |||||
| (c) | Movements in liabilities of short-term insurance contracts |
The table below presents movements in claims and claim adjustment expense reserve:
| 2021 RMB million | 2020 RMB million | |||||||
Notified claims | 4,319 | 2,781 | ||||||
Incurred but not reported | 17,672 | 15,623 | ||||||
|
|
|
| |||||
Total as at 1 January – Gross | 21,991 | 18,404 | ||||||
|
|
|
| |||||
Cash paid for claims settled | ||||||||
– Cash paid for current year claims | (34,301 | ) | (32,804 | ) | ||||
– Cash paid for prior year claims | (17,783 | ) | (16,682 | ) | ||||
Claims incurred | ||||||||
– Claims arising in current year | 56,938 | 52,589 | ||||||
– Claims arising in prior years | (611 | ) | 484 | |||||
|
|
|
| |||||
Total as at 31 December – Gross | 26,234 | 21,991 | ||||||
|
|
|
| |||||
Notified claims | 4,197 | 4,319 | ||||||
Incurred but not reported | 22,037 | 17,672 | ||||||
|
|
|
| |||||
Total as at 31 December – Gross | 26,234 | 21,991 | ||||||
|
|
|
| |||||
203
Notes to the Consolidated Financial Statements (continued)
For the year ended 31 December 2021
| 15 | INSURANCE CONTRACTS (continued) |
| (c) | Movements in liabilities of short-term insurance contracts (continued) |
The table below presents movements in unearned premium reserves:
2021 RMB million | 2020 RMB million | |||||||||||||||||||||||
| Gross | Ceded | Net | Gross | Ceded | Net | |||||||||||||||||||
As at 1 January | 14,701 | (523 | ) | 14,178 | 13,001 | (369 | ) | 12,632 | ||||||||||||||||
Increase | 14,062 | (823 | ) | 13,239 | 14,701 | (523 | ) | 14,178 | ||||||||||||||||
Release | (14,701 | ) | 523 | (14,178 | ) | (13,001 | ) | 369 | (12,632 | ) | ||||||||||||||
|
|
|
|
|
|
|
|
|
|
|
| |||||||||||||
As at 31 December | 14,062 | (823 | ) | 13,239 | 14,701 | (523 | ) | 14,178 | ||||||||||||||||
|
|
|
|
|
|
|
|
|
|
|
| |||||||||||||
| (d) | Movements in liabilities of long-term insurance contracts |
The table below presents movements in the liabilities of long-term insurance contracts:
| 2021 RMB million | 2020 RMB million | |||||||
As at 1 January | 2,936,533 | 2,521,331 | ||||||
Premiums | 542,974 | 536,150 | ||||||
Release of liabilities (i) | (287,705 | ) | (288,959 | ) | ||||
Accretion of interest | 148,504 | 129,679 | ||||||
Change in assumptions | ||||||||
– Change in discount rates | 30,701 | 35,071 | ||||||
– Change in other assumptions (ii) | 7,574 | 3,472 | ||||||
Other movements | 1,022 | (211 | ) | |||||
|
|
|
| |||||
As at 31 December | 3,379,603 | 2,936,533 | ||||||
|
|
|
| |||||
| (i) | The release of liabilities mainly consists of release due to death or other benefits and related expenses, release of residual margin and change of reserves for claims and claim adjustment expenses. |
| (ii) | For the year ended 31 December 2021, the change in other assumptions was mainly caused by the change in morbidity rate assumptions of certain products, which increased insurance contract liabilities by RMB5,897 million. This change reflected the Group’s most recent experience and future expectations about the morbidity rates as at the reporting date. Changes in assumptions other than morbidity rates increased insurance contract liabilities by RMB1,677 million. |
For the year ended 31 December 2020, the change in other assumptions was mainly caused by the change in morbidity rate assumptions of certain products, which increased insurance contract liabilities by RMB2,081 million. This change reflected the Group’s most recent experience and future expectations about the morbidity rates as at the reporting date. Changes in assumptions other than morbidity rates increased insurance contract liabilities by RMB1,391 million.
204
Notes to the Consolidated Financial Statements (continued)
For the year ended 31 December 2021
| 16 | INVESTMENT CONTRACTS |
| As at 31 December 2021 RMB million | As at 31 December 2020 RMB million | |||||||
Investment contracts with DPF at amortised cost | 68,544 | 64,950 | ||||||
Investment contracts without DPF | ||||||||
– At amortised cost | 245,041 | 223,252 | ||||||
– At fair value through profit or loss | 9 | 10 | ||||||
|
|
|
| |||||
Total | 313,594 | 288,212 | ||||||
|
|
|
| |||||
The table below presents movements of investment contracts with DPF:
| 2021 RMB million | 2020 RMB million | |||||||
As at 1 January | 64,950 | 61,657 | ||||||
Deposits received | 4,910 | 5,000 | ||||||
Deposits withdrawn, payments on death and other benefits | (2,711 | ) | (3,008 | ) | ||||
Policy fees deducted from account balances | (41 | ) | (39 | ) | ||||
Interest credited | 1,436 | 1,340 | ||||||
|
|
|
| |||||
As at 31 December | 68,544 | 64,950 | ||||||
|
|
|
| |||||
| 17 | INTEREST-BEARING LOANS AND BORROWINGS |
| Maturity date | Interest rate | As at 31 December 2021 RMB million | As at 31 December 2020 RMB million | |||||||||||
Credit loans | 5 January 2022 | 1.80 | % | 563 | 626 | |||||||||
Guaranteed loans | 13 January 2022 | 1.50 | % | 913 | 1,015 | |||||||||
Guaranteed loans | 9 March 2022 | EURLIBOR + 3.00 | %(i) | 794 | 883 | |||||||||
Guaranteed loans | 8 September 2023 | 3.10 | % | 2,383 | 2,648 | |||||||||
Credit loans | 25 June 2024 | 3.08 | % | 2,366 | 2,444 | |||||||||
Credit loans | 16 September 2024 | 3.30 | % | 5,483 | 5,611 | |||||||||
Credit loans | 27 September 2024 | USD LIBOR + 1.00 | %(ii) | 6,184 | 6,329 | |||||||||
|
|
|
| |||||||||||
Total | 18,686 | 19,556 | ||||||||||||
|
|
|
| |||||||||||
| (i) | 3.00% when EURIBOR is negative. |
| (ii) | 1.00% when USD LIBOR is negative. |
205
Notes to the Consolidated Financial Statements (continued)
For the year ended 31 December 2021
| 18 | BONDS PAYABLE |
As at 31 December 2021, all bonds payable were the bonds for capital replenishment (the “Bond”) with a total carrying value of RMB34,994 million (as at 31 December 2020: RMB34,992 million), and the fair value of RMB35,898 million (as at 31 December 2020: RMB35,602 million). The fair value of the Bond was classified as level 2 in the fair value hierarchy. The following table presents the par value of the bonds payable:
Issue date | Maturity date | Interest rate p.a. | As at 31 December 2021 RMB million | As at 31 December 2020 RMB million | ||||||||||||
22 March 2019 | 22 March 2029 | 4.28 | % | 35,000 | 35,000 | |||||||||||
|
|
|
| |||||||||||||
Total | 35,000 | 35,000 | ||||||||||||||
|
|
|
| |||||||||||||
The fair value of bonds payable is based on the valuation results of China Central Depository & Clearing Co., Ltd.
On 20 March 2019, the Company issued a bond in the national inter-bank bond market at a principal amount of RMB35 billion, and completed the issuance on 22 March 2019. The bond has a 10-year maturity and a fixed coupon rate of 4.28% per annum. The Company has a conditional right to redeem the bonds at the end of the fifth year. If the Company does not redeem the bonds at the end of the fifth year, the coupon rate per annum for the remaining 5 years will be raised to 5.28%.
Bonds payable are measured at amortised cost as described in Note 2.15.
| 19 | SECURITIES SOLD UNDER AGREEMENTS TO REPURCHASE |
| As at 31 December 2021 RMB million | As at 31 December 2020 RMB million | |||||||
Interbank market | 181,121 | 97,974 | ||||||
Stock exchange market | 58,325 | 24,275 | ||||||
|
|
|
| |||||
Total | 239,446 | 122,249 | ||||||
|
|
|
| |||||
Maturing: | ||||||||
Within 30 days | 237,371 | 122,101 | ||||||
More than 30 days within 90 days After | 2,075 | 140 | ||||||
90 days | — | 8 | ||||||
|
|
|
| |||||
Total | 239,446 | 122,249 | ||||||
|
|
|
| |||||
As at 31 December 2021, bonds with a carrying value of RMB199,211 million (as at 31 December 2020: RMB113,454 million) were pledged as collateral for financial assets sold under agreements to repurchase resulting from repurchase transactions entered into by the Group in the interbank market.
For debt repurchase transactions through the stock exchange, the Group is required to deposit certain exchange-traded bonds into a collateral pool with fair value converted at a standard rate pursuant to the stock exchange’s regulation which should be no less than the balance of the related repurchase transaction. As at 31 December 2021, the carrying value of securities deposited in the collateral pool was RMB298,043 million (as at 31 December 2020: RMB256,062 million). The collateral is restricted from trading during the period of the repurchase transaction.
206
Notes to the Consolidated Financial Statements (continued)
For the year ended 31 December 2021
| 20 | OTHER LIABILITIES |
| As at 31 December 2021 RMB million | As at 31 December 2020 RMB million | |||||||
Payable to the third-party holders of consolidated structured entities | 67,862 | 42,654 | ||||||
Interest payable to policyholders | 17,866 | 16,139 | ||||||
Salary and welfare payable | 12,874 | 11,318 | ||||||
Brokerage and commission payable | 5,352 | 7,057 | ||||||
Payable to constructors | 2,497 | 2,594 | ||||||
Agency deposits | 1,467 | 1,811 | ||||||
Interest payable of debt instruments | 1,528 | 1,320 | ||||||
Tax payable | 717 | 889 | ||||||
Stock appreciation rights (Note 32) | 291 | 493 | ||||||
Others | ||||||||
Total | 23,222 | 20,201 | ||||||
|
|
|
| |||||
Current | 133,676 | 104,476 | ||||||
|
|
|
| |||||
Non-current | 133,676 | 104,476 | ||||||
Total | — | — | ||||||
|
|
|
| |||||
| 133,676 | 104,476 | |||||||
|
|
|
| |||||
| 21 | STATUTORY INSURANCE FUND |
As required by the CIRC Order [2008] No. 2, “Measures for Administration of Statutory Insurance Fund”, all insurance companies have to pay the statutory insurance fund contribution from 1 January 2009. The Group is subject to the statutory insurance fund contribution, (i) at 0.15% and 0.05% of premiums and accumulated policyholder deposits from life policies with guaranteed benefits and life policies without guaranteed benefits, respectively; (ii) at 0.8% and 0.15% of premiums from short-term health policies and long-term health policies, respectively; (iii) at 0.8% of premiums from accident insurance contracts, at 0.08% and 0.05% of accumulated policyholder deposits from accident investment contracts with guaranteed benefits and without guaranteed benefits, respectively. When the accumulated statutory insurance fund contributions reach 1% of total assets, no additional contribution to the statutory insurance fund is required.
207
Notes to the Consolidated Financial Statements (continued)
For the year ended 31 December 2021
| 22 | INVESTMENT INCOME |
| For the year ended 31 December | ||||||||
| 2021 RMB million | 2020 RMB million | |||||||
Debt securities | ||||||||
– held-to-maturity securities | 56,830 | 44,757 | ||||||
– available-for-sale securities | 29,491 | 22,695 | ||||||
– at fair value through profit or loss | 4,079 | 3,482 | ||||||
Equity securities | ||||||||
– available-for-sale securities | 27,806 | 24,185 | ||||||
– at fair value through profit or loss | 912 | 798 | ||||||
Bank deposits | 25,949 | 25,860 | ||||||
Loans | 32,970 | 31,948 | ||||||
Securities purchased under agreements to resell | 350 | 772 | ||||||
|
|
|
| |||||
Total | 178,387 | 154,497 | ||||||
|
|
|
| |||||
For the year ended 31 December 2021, the interest income included in investment income was RMB149,669 million (2020: RMB129,514 million). Interest income was mainly accrued using the effective interest method.
| 23 | NET REALISED GAINS ON FINANCIAL ASSETS |
| For the year ended 31 December | ||||||||
| 2021 RMB million | 2020 RMB million | |||||||
Debt securities | ||||||||
Realised gains (i) | 198 | 1,287 | ||||||
Impairment (ii) | (1,359 | ) | 288 | |||||
|
|
|
| |||||
Subtotal | (1,161 | ) | 1,575 | |||||
|
|
|
| |||||
Equity securities | ||||||||
Realised gains (i) | 42,867 | 24,925 | ||||||
Impairment (ii) | (21,362 | ) | (11,917 | ) | ||||
|
|
|
| |||||
Subtotal | 21,505 | 13,008 | ||||||
|
|
|
| |||||
Total | 20,344 | 14,583 | ||||||
|
|
|
| |||||
| (i) | Realised gains were generated mainly from available-for-sale securities. |
| (ii) | During the year ended 31 December 2021, the Group recognised an impairment charge of RMB8 million on available-for-sale funds (2020: RMB111 million); an impairment charge of RMB21,354 million on available-for-sale stock securities (2020: RMB11,732 million); no impairment charge on available-for-sale other equity securities (2020: RMB74 million); an impairment reversal of RMB17 million on available-for-sale debt securities (2020: RMB16 million); an impairment charge of RMB1,376 million on loans (2020: an impairment reversal of RMB275 million) and no impairment charge of held-to-maturity securities (2020: RMB3 million), for which the Group determined that objective evidence of impairment existed. |
208
Notes to the Consolidated Financial Statements (continued)
For the year ended 31 December 2021
| 24 | NET FAIR VALUE GAINS THROUGH PROFIT OR LOSS |
| For the year ended 31 December | ||||||||
| 2021 RMB million | 2020 RMB million | |||||||
Debt securities | 1,069 | (583 | ) | |||||
Equity securities | 3,470 | 22,997 | ||||||
Stock appreciation rights | 202 | 255 | ||||||
Financial liabilities at fair value through profit or loss | 202 | (648 | ) | |||||
Derivative financial instruments | — | (121 | ) | |||||
|
|
|
| |||||
Total | 4,943 | 21,900 | ||||||
|
|
|
| |||||
| 25 | INSURANCE BENEFITS AND CLAIMS EXPENSES |
| Gross RMB million | Ceded RMB million | Net RMB million | ||||||||||
For the year ended 31 December 2021 | ||||||||||||
Life insurance death and other benefits | 125,998 | (4,644 | ) | 121,354 | ||||||||
Accident and health claims and claim adjustment expenses | 56,327 | (1,297 | ) | 55,030 | ||||||||
Increase in insurance contract liabilities | 443,053 | (683 | ) | 442,370 | ||||||||
|
|
|
|
|
| |||||||
Total | 625,378 | (6,624 | ) | 618,754 | ||||||||
|
|
|
|
|
| |||||||
For the year ended 31 December 2020 | ||||||||||||
Life insurance death and other benefits | 117,129 | (3,520 | ) | 113,609 | ||||||||
Accident and health claims and claim adjustment expenses | 53,073 | (678 | ) | 52,395 | ||||||||
Increase in insurance contract liabilities | 415,186 | (389 | ) | 414,797 | ||||||||
|
|
|
|
|
| |||||||
Total | 585,388 | (4,587 | ) | 580,801 | ||||||||
|
|
|
|
|
| |||||||
| 26 | INVESTMENT CONTRACT BENEFITS |
Benefits of investment contracts are mainly the interest credited to investment contracts.
209
Notes to the Consolidated Financial Statements (continued)
For the year ended 31 December 2021
| 27 | FINANCE COSTS |
| For the year ended 31 December | ||||||||
| 2021 | 2020 | |||||||
| RMB million | RMB million | |||||||
Interest expenses for securities sold under agreements to repurchase | 3,523 | 1,565 | ||||||
Interest expenses for bonds payable | 1,500 | 1,503 | ||||||
Interest expenses for interest-bearing loans and borrowings | 479 | 566 | ||||||
Interest on lease liabilities | 96 | 113 | ||||||
|
|
|
| |||||
Total | 5,598 | 3,747 | ||||||
|
|
|
| |||||
| 28 | PROFIT BEFORE INCOME TAX |
Profit before income tax is stated after charging/(crediting) the following:
| For the year ended 31 December | ||||||||
| 2021 | 2020 | |||||||
| RMB million | RMB million | |||||||
Employee salaries and welfare costs | 20,928 | 19,534 | ||||||
Housing benefits | 1,412 | 1,318 | ||||||
Contribution to the defined contribution pension plan | 3,273 | 2,455 | ||||||
Depreciation and amortisation | 5,287 | 5,162 | ||||||
Foreign exchange gains | (645 | ) | (119 | ) | ||||
Remuneration in respect of audit services provided by auditors | 53 | 63 | ||||||
|
|
|
| |||||
| 29 | TAXATION |
Deferred income tax assets and liabilities are offset when there is a legally enforceable right to offset current tax assets against current tax liabilities and when the deferred income tax relates to the same tax authority.
| (a) | The amount of taxation charged to net profit represents: |
| For the year ended 31 December | ||||||||
| 2021 | 2020 | |||||||
| RMB million | RMB million | |||||||
Current taxation – Enterprise income tax | 4,824 | 6,588 | ||||||
Deferred taxation | (6,741 | ) | (3,485 | ) | ||||
|
|
|
| |||||
Total tax charges | (1,917 | ) | 3,103 | |||||
|
|
|
| |||||
210
Notes to the Consolidated Financial Statements (continued)
For the year ended 31 December 2021
| 29 | TAXATION (continued) |
| (b) | The reconciliation between the Group’s effective tax rate and the statutory tax rate of 25% in the PRC (2020: same) is as follows: |
| For the year ended 31 December | ||||||||
| 2021 | 2020 | |||||||
| RMB million | RMB million | |||||||
Profit before income tax | 50,495 | 54,476 | ||||||
Tax computed at the statutory tax rate | 12,624 | 13,619 | ||||||
Adjustment on current income tax of previous period | (412 | ) | (464 | ) | ||||
Non- taxable income (i) | (14,425 | ) | (10,787 | ) | ||||
Expenses not deductible for tax purposes (i) | 276 | 202 | ||||||
Unused tax losses | 27 | 498 | ||||||
Others | (7 | ) | 35 | |||||
|
|
|
| |||||
Income tax at the effective tax rate | (1,917 | ) | 3,103 | |||||
|
|
|
| |||||
| (i) | Non-taxable income mainly includes interest income from government bonds, dividend income from applicable equity securities, etc. Expenses not deductible for tax purposes mainly include donations and other expenses that do not meet the criteria for deduction according to the relevant tax regulations. |
| (c) | As at 31 December 2021 and 31 December 2020, the amounts of deferred tax assets and liabilities are as follows: |
| As at 31 December 2021 RMB million | As at 31 December 2020 RMB million | |||||||
Deferred tax assets | 22,354 | 17,174 | ||||||
Deferred tax liabilities | (29,714 | ) | (32,373 | ) | ||||
|
|
|
| |||||
Net deferred tax assets | 121 | 87 | ||||||
Net deferred tax liabilities | (7,481 | ) | (15,286 | ) | ||||
|
|
|
| |||||
211
Notes to the Consolidated Financial Statements (continued)
For the year ended 31 December 2021
| 29 | TAXATION (continued) |
| (c) | As at 31 December 2021 and 31 December 2020, the amounts of deferred tax assets and liabilities are as follows: (continued) |
As at 31 December 2021 and 31 December 2020, deferred income tax was calculated in full on temporary differences under the liability method using the principal tax rate of 25%. The movements in net deferred income tax assets and liabilities during the period were as follows:
Net deferred tax assets/(liabilities)
| Insurance RMB million (i) | Investments RMB million (ii) | Others RMB million (iii) | Total RMB million | |||||||||||||
As at 1 January 2020 | 1,557 | (14,673 | ) | 2,914 | (10,202 | ) | ||||||||||
(Charged)/Credited to net profit | 1,787 | 1,759 | (61 | ) | 3,485 | |||||||||||
(Charged)/Credited to other comprehensive income | ||||||||||||||||
– Available-for-sale securities | — | (9,446 | ) | — | (9,446 | ) | ||||||||||
– Portion of fair value changes on available- for-sale securities attributable to participating policyholders | 990 | — | — | 990 | ||||||||||||
– Others | — | (26 | ) | — | (26 | ) | ||||||||||
|
|
|
|
|
|
|
| |||||||||
As at 31 December 2020 | 4,334 | (22,386 | ) | 2,853 | (15,199 | ) | ||||||||||
|
|
|
|
|
|
|
| |||||||||
As at 1 January 2021 | 4,334 | (22,386 | ) | 2,853 | (15,199 | ) | ||||||||||
(Charged)/Credited to net profit | 2,862 | 3,534 | 345 | 6,741 | ||||||||||||
(Charged)/Credited to other comprehensive income | ||||||||||||||||
– Available-for-sale securities | — | 677 | — | 677 | ||||||||||||
– Portion of fair value changes on available- for-sale securities attributable to participating policyholders | 448 | — | — | 448 | ||||||||||||
– Others | — | (27 | ) | — | (27 | ) | ||||||||||
|
|
|
|
|
|
|
| |||||||||
As at 31 December 2021 | 7,644 | (18,202 | ) | 3,198 | (7,360 | ) | ||||||||||
|
|
|
|
|
|
|
| |||||||||
| (i) | The deferred tax liabilities arising from the insurance category are mainly related to the change of long-term insurance contract liabilities at 31 December 2008 as a result of the first time adoption of IFRSs in 2009 and the temporary differences of short-term insurance contract liabilities and policyholder dividends payable. |
| (ii) | The deferred tax arising from the investments category is mainly related to the temporary differences of unrealised gains/(losses) on available-for-sale securities, securities at fair value through profit or loss, and others. |
| (iii) | The deferred tax arising from the others category is mainly related to the temporary differences of employee salaries and welfare costs payable. |
Unrecognised deductible tax losses of the Group amounted to RMB3,173 million as at 31 December 2021 (as at 31 December 2020: RMB3,300 million). Unrecognised deductible temporary differences of the Group amounted to RMB1 million as at 31 December 2021 (as at 31 December 2020: RMB1 million).
212
Notes to the Consolidated Financial Statements (continued)
For the year ended 31 December 2021
| (d) | The analysis of net deferred tax assets and deferred tax liabilities is as follows: |
| As at 31 December 2021 RMB million | As at 31 December 2020 RMB million | |||||||
Deferred tax assets: | ||||||||
– deferred tax assets to be recovered after 12 months | 14,695 | 10,882 | ||||||
– deferred tax assets to be recovered within 12 months | 7,659 | 6,292 | ||||||
|
|
|
| |||||
Subtotal | 22,354 | 17,174 | ||||||
|
|
|
| |||||
Deferred tax liabilities: | ||||||||
– deferred tax liabilities to be settled after 12 months | (26,850 | ) | (28,107 | ) | ||||
– deferred tax liabilities to be settled within 12 months | (2,864 | ) | (4,266 | ) | ||||
|
|
|
| |||||
Subtotal | (29,714 | ) | (32,373 | ) | ||||
|
|
|
| |||||
Net deferred tax liabilities | (7,360 | ) | (15,199 | ) | ||||
|
|
|
| |||||
| 30 | NET PROFIT ATTRIBUTABLE TO EQUITY HOLDERS OF THE COMPANY |
Net profit attributable to equity holders of the Company is recognised in the financial statements of the Company to the extent of RMB42,865 million (2020: RMB44,594 million).
| 31 | EARNINGS PER SHARE |
There is no difference between the basic and diluted earnings per share. The basic and diluted earnings per share for the year ended 31 December 2021 are calculated based on the net profit for the year attributable to ordinary equity holders of the Company and the weighted average of 28,264,705,000 ordinary shares (2020: same).
213
Notes to the Consolidated Financial Statements (continued)
For the year ended 31 December 2021
| 32 | STOCK APPRECIATION RIGHTS |
The Board of Directors of the Company approved, on 5 January 2006, an award of stock appreciation rights of 4.05 million units and on 21 August 2006, another award of stock appreciation rights of 53.22 million units to eligible employees. The exercise prices of the two awards were HKD5.33 and HKD6.83, respectively, the average closing price of shares in the five trading days prior to 1 July 2005 and 1 January 2006, the dates for vesting and exercise price setting purposes of this award. Upon the exercise of stock appreciation rights, exercising recipients will receive payments in RMB, subject to any withholding tax, equal to the number of stock appreciation rights exercised times the difference between the exercise price and market price of the H shares at the time of exercise.
Stock appreciation rights have been awarded in units, with each unit representing the value of one H share. No shares of common stock will be issued under the stock appreciation rights plan. According to the Company’s plan, all stock appreciation rights will have an exercise period of five years from the date of award and will not be exercisable before the fourth anniversary of the date of award unless specific market or other conditions have been met. On 26 February 2010, the Board of Directors of the Company extended the exercise period of all stock appreciation rights, which is also subject to government policy.
As at 31 December 2021, there were 55.01 million units outstanding and exercisable (as at 31 December 2020: same). As at 31 December 2021, the amount of intrinsic value for the vested stock appreciation rights was RMB278 million (as at 31 December 2020: RMB480 million).
The fair value of the stock appreciation rights is estimated on the date of valuation at each reporting date using lattice-based option valuation models based on expected volatility from 14% to 30%, an expected dividend yield of no higher than 6.05% and a risk-free interest rate ranging from -0.01% to 0.25%.
The Company recognised a gain of RMB202 million in the net fair value through profit or loss in the consolidated comprehensive income representing the fair value change of the rights during the year ended 31 December 2021 (2020: fair value gain of RMB255 million). RMB278 million and RMB13 million were included in salary and staff welfare payable included under other liabilities for the units not exercised and exercised but not paid as at 31 December 2021 (as at 31 December 2020: RMB480 million and RMB13 million), respectively. There was no unrecognised compensation cost for the stock appreciation rights as at 31 December 2021 (as at 31 December 2020: nil).
| 33 | DIVIDENDS |
Pursuant to the shareholders’ approval at the Annual General Meeting on 30 June 2021, a final dividend of RMB0.64 (inclusive of tax) per ordinary share totalling RMB18,089 million in respect of the year ended 31 December 2020 was declared and paid in 2021. The dividend has been recorded in the consolidated financial statements for the year ended 31 December 2021.
Pursuant to a resolution passed at the meeting of the Board of Directors on 24 March 2022, a final dividend of RMB0.65 (inclusive of tax) per ordinary share totalling approximately RMB18,372 million for the year ended 31 December 2021 was proposed for shareholders’ approval at the forthcoming Annual General Meeting. The dividend has not been recorded in the consolidated financial statements for the year ended 31 December 2021.
214
Notes to the Consolidated Financial Statements (continued)
For the year ended 31 December 2021
| 34 | DISCLOSURES ABOUT THE TEMPORARY EXEMPTION FROM IFRS 9 |
According to IFRS 4 Amendments, the Company made the assessment based on the Group’s financial position of 31 December 2015, concluding that the carrying amount of the Group’s liabilities arising from contracts within the scope of IFRS 4, which includes any deposit components or embedded derivatives unbundled from insurance contracts, was significant compared to the total carrying amount of all its liabilities. The percentage of the total carrying amount of its liabilities connected with insurance relative to the total carrying amount of all its liabilities is greater than 90 percent. There had been no significant change in the activities of the Group since then that requires reassessment. Therefore, the Group’s activities are predominantly connected with insurance, meeting the criteria to apply temporary exemption from IFRS 9.
Sino-Ocean, China Unicom, CGB and certain associates of the Group, have adopted IFRS 9. According to IFRS 4 Amendments, the Group elected not to apply uniform accounting policies when using the equity method for these associates.
| (a) | The tables below present the fair value of the following groups and fair value changes for the years of major financial assets (i) under IFRS 9: |
| For the year ended 31 December | ||||||||
| 2021 RMB million | 2020 RMB million | |||||||
Held for trading financial assets | 206,771 | 161,570 | ||||||
Financial assets that are managed and whose performance are evaluated on a fair value basis | — | — | ||||||
Other financial assets | ||||||||
– Financial assets with contractual terms that give rise on specified dates to cash flows that are solely payments of principal and interest on the principal amount outstanding (“SPPI”) | 2,559,014 | 1,978,361 | ||||||
– Financial assets with contractual terms that do not give rise to SPPI | 958,340 | 929,597 | ||||||
|
|
|
| |||||
Total | 3,724,125 | 3,069,528 | ||||||
|
|
|
| |||||
Fair value changes for the year ended 31 December | ||||||||
| 2021 RMB million | 2020 RMB million | |||||||
Held for trading financial assets | 4,541 | 22,414 | ||||||
Financial assets that are managed and whose performance are evaluated on a fair value basis | — | — | ||||||
Other financial assets | ||||||||
– Financial assets with contractual terms that give rise to SPPI | 92,219 | (11,064 | ) | |||||
– Financial assets with contractual terms that do not give rise to SPPI | 14,959 | 55,151 | ||||||
|
|
|
| |||||
Total | 111,719 | 66,501 | ||||||
|
|
|
| |||||
| (i) | Only including securities at fair value through profit or loss, loans (excluding policy loans), available-for-sale securities and held-to-maturity securities. |
215
Notes to the Consolidated Financial Statements (continued)
For the year ended 31 December 2021
| 34 | DISCLOSURES ABOUT THE TEMPORARY EXEMPTION FROM IFRS 9 (continued) |
| (b) | The table below presents the credit risk exposure (ii) for aforementioned financial assets with contractual terms that give rise to SPPI: |
| Carrying amount (iii) | ||||||||
| As at 31 December 2021 RMB Million | As at 31 December 2020 RMB Million | |||||||
Domestic | ||||||||
Rating not required (iv) | 832,127 | 719,142 | ||||||
AAA | 1,592,582 | 1,207,034 | ||||||
AA+ | 6,551 | 4,197 | ||||||
AA | 80 | 170 | ||||||
AA- | 3,000 | 3,000 | ||||||
|
|
|
| |||||
Subtotal | 2,434,340 | 1,933,543 | ||||||
|
|
|
| |||||
Overseas | ||||||||
A+ | 427 | 25 | ||||||
A | 4,331 | 3,654 | ||||||
A- | 13 | 45 | ||||||
BBB+ | 75 | 112 | ||||||
BBB- | — | 13 | ||||||
Not rated | — | 24 | ||||||
|
|
|
| |||||
Subtotal | 4,846 | 3,873 | ||||||
|
|
|
| |||||
Total | 2,439,186 | 1,937,416 | ||||||
|
|
|
| |||||
216
Notes to the Consolidated Financial Statements (continued)
For the year ended 31 December 2021
| 34 | DISCLOSURES ABOUT THE TEMPORARY EXEMPTION FROM IFRS 9 (continued) |
| (c) | The table below presents financial assets without low credit risk for aforementioned financial assets with contractual terms that give rise to SPPI: |
| As at 31 December 2021 | ||||||||
| Carrying amount (iii) RMB Million | Fair value RMB Million | |||||||
Domestic | ||||||||
Overseas | 9,631 | 7,274 | ||||||
Total | — | — | ||||||
|
|
|
| |||||
| 9,631 | 7,274 | |||||||
|
|
|
| |||||
| As at 31 December 2020 | ||||||||
| Carrying amount (iii) RMB Million | Fair value RMB Million | |||||||
Domestic | 7,367 | 4,966 | ||||||
Overseas | 24 | 4 | ||||||
|
|
|
| |||||
Total | 7,391 | 4,970 | ||||||
|
|
|
| |||||
| (ii) | Credit risk ratings for domestic assets are provided by domestic qualified external rating agencies and credit risk ratings for overseas assets are provided by overseas qualified external rating agencies. |
| (iii) | For financial assets measured at amortised cost, the carrying amount before adjusting impairment allowance is disclosed here. |
| (iv) | Mainly including government bonds and policy financial bonds. |
| 35 | SIGNIFICANT RELATED PARTY TRANSACTIONS |
| (a) | Related parties with control relationship |
Information of the parent company is as follows:
Name | Location of registration | Principal business | Relationship with the Company | Nature of ownership | Legal representative | |||||
| CLIC | Beijing, China | Insurance services including receipt of premiums and payment of benefits in respect of the in-force life, health, accident and other types of personal insurance business, and the reinsurance business; holding or investing in domestic and overseas insurance companies or other financial insurance institutions; fund management business permitted by national laws and regulations or approved by the State Council of the People’s Republic of China; and other businesses approved by insurance regulatory agencies. | Immediate and ultimate holding company | State-owned | Bai Tao (the change of registration with the department in charge of industrial and commercial administration is in progress) | |||||
217
Notes to the Consolidated Financial Statements (continued)
For the year ended 31 December 2021
| 35 | SIGNIFICANT RELATED PARTY TRANSACTIONS (continued) |
| (b) | Subsidiaries |
Refer to Note 41(d) for the basic and related information of subsidiaries.
| (c) | Associates and joint ventures |
Refer to Note 9 for the basic and related information of associates and joint ventures.
| (d) | Other related parties |
Significant related parties | Relationship with the Company | |
China Life Real Estate Co., Limited (“CLRE”) | Under common control of CLIC | |
China Life Insurance (Overseas) Company Limited (“CL Overseas”) | Under common control of CLIC | |
China Life Investment Management Company Limited (Formerly known as “China Life Investment Holding Company Limited”)(“CLI”) | Under common control of CLIC | |
China Life Ecommerce Company Limited (“CL Ecommerce”) | Under common control of CLIC | |
China Life Healthcare Investment company limited (“CLHI”) | Under common control of CLIC | |
China Life Enterprise Annuity Fund (“EAP”) | A pension fund jointly set up by the Company and others | |
| (e) | Registered capital of related parties with control relationship and changes during the year |
Name of related party | As at 31 December 2020 | Increase | Decrease | As at 31 December 2021 | ||||||||||||
| million | million | million | million | |||||||||||||
CLIC | RMB4,600 | — | — | RMB4,600 | ||||||||||||
AMC | RMB4,000 | — | — | RMB4,000 | ||||||||||||
China Life Pension Company Limited (“Pension Company”) | RMB3,400 | — | — | RMB3,400 | ||||||||||||
China Life (Suzhou) Pension and Retirement Investment Company Limited (“Suzhou Pension Company”) | RMB1,991 | 190 | — | RMB2,181 | ||||||||||||
CL AMP | RMB1,288 | — | — | RMB1,288 | ||||||||||||
CL Wealth | RMB200 | — | — | RMB200 | ||||||||||||
Shanghai Rui Chong Investment Co., Limited (“Rui Chong Company”) | RMB6,800 | — | 700 | RMB6,100 | ||||||||||||
China Life (Beijing) Health Management Co., Limited (“CL Health”) | RMB1,530 | — | — | RMB1,530 | ||||||||||||
China Life Franklin (Shenzhen) Equity Investment Fund Management Co., Limited (“Franklin Shenzhen Company”) | USD2 | — | — | USD2 | ||||||||||||
Xi’an Shengyi Jingsheng Real Estate Co., Ltd. (“Shengyi Jingsheng”) | RMB1,131 | — | — | RMB1,131 | ||||||||||||
Dalian Hope Building Company Ltd. (“Hope Building”) | RMB484 | — | — | RMB484 | ||||||||||||
The table above does not include the partnerships and the subsidiaries which were not set up or invested in Mainland China that having control relationship with the Group. These partnerships and subsidiaries do not have related information about registered capital.
218
Notes to the Consolidated Financial Statements (continued)
For the year ended 31 December 2021
| 35 | SIGNIFICANT RELATED PARTY TRANSACTIONS (continued) |
| (f) | Percentages of holding of related parties with control relationship and changes during the year |
Shareholder
| As at 31 December 2020 | As at 31 December 2021 | |||||||||||||||||||||||
| Amount million | Percentage of holding | Increase million | Decrease million | Amount million | Percentage of holding | |||||||||||||||||||
CLIC | RMB19,324 | 68.37 | % | — | — | RMB19,324 | 68.37 | % | ||||||||||||||||
Subsidiaries
| As at 31 December 2020 | As at 31 December 2021 | |||||||||||||||||||||||
| Amount million | Percentage of holding | Increase million | Decrease million | Amount million | Percentage of holding | |||||||||||||||||||
AMC | RMB1,680 | | 60.00% directly |
| — | — | RMB1,680 | | 60.00% directly |
| ||||||||||||||
Pension Company | RMB2,746 | | 74.27% directly and indirectly |
| — | — | RMB2,746 | | 74.27% directly and indirectly |
| ||||||||||||||
China Life Franklin Asset Management Company Limited (“AMC HK”) | HKD130 | | 50.00% indirectly | | — | — | HKD130 | | 50.00% indirectly |
| ||||||||||||||
Suzhou Pension Company | RMB1,991 | | 100.00% directly | | 190 | — | RMB2,181 | | 100.00% directly |
| ||||||||||||||
CL AMP | RMB1,095 | | 85.03% indirectly | | — | — | RMB1,095 | | 85.03% indirectly |
| ||||||||||||||
CL Wealth | RMB200 | | 100.00% indirectly | | — | — | RMB200 | | 100.00% indirectly |
| ||||||||||||||
Golden Phoenix Tree Limited | — | | 100.00% directly | | — | — | — | | 100.00% directly |
| ||||||||||||||
King Phoenix Tree Limited | — | | 100.00% indirectly | | — | — | — | | 100.00% indirectly |
| ||||||||||||||
Rui Chong Company | RMB6,800 | | 100.00% directly | | — | 700 | RMB6,100 | | 100.00% directly |
| ||||||||||||||
New Aldgate Limited | RMB1,167 | | 100.00% directly | | — | — | RMB1,167 | | 100.00% directly |
| ||||||||||||||
Glorious Fortune Forever Limited | — | | 100.00% directly | | — | — | — | | 100.00% directly |
| ||||||||||||||
CL Hotel Investor, L.P. | RMB95 | | 100.00% directly | | 190 | — | RMB285 | | 100.00% directly |
| ||||||||||||||
Golden Bamboo Limited | RMB1,993 | | 100.00% directly | | — | — | RMB1,993 | | 100.00% directly |
| ||||||||||||||
Sunny Bamboo Limited | RMB1,876 | | 100.00% directly | | — | — | RMB1,876 | | 100.00% directly |
| ||||||||||||||
Fortune Bamboo Limited | RMB2,435 | | 100.00% directly | | — | — | RMB2,435 | | 100.00% directly |
| ||||||||||||||
China Century Core Fund Limited | USD1,125 | | 100.00% indirectly | | — | — | USD1,125 | | 100.00% indirectly |
| ||||||||||||||
CL Health | RMB1,530 | | 100.00% directly | | — | — | RMB1,530 | | 100.00% directly |
| ||||||||||||||
Franklin Shenzhen Company | USD2 | | 100.00% indirectly | | — | — | USD2 | | 100.00% indirectly |
| ||||||||||||||
219
Notes to the Consolidated Financial Statements (continued)
For the year ended 31 December 2021
| 35 | SIGNIFICANT RELATED PARTY TRANSACTIONS (continued) |
| (f) | Percentages of holding of related parties with control relationship and changes during the year (continued) |
Subsidiaries
| As at 31 December 2020 | As at 31 December 2021 | |||||||||||||||||||||||
| Amount million | Percentage of holding | Increase million | Decrease million | Amount million | Percentage of holding | |||||||||||||||||||
Guo Yang Guo Sheng | RMB2,835 | | 89.997% directly | | — | — | RMB2,835 | | 89.997% directly | | ||||||||||||||
New Capital Wisdom Limited | — | | 100.00% indirectly | | — | — | — | | 100.00% indirectly | | ||||||||||||||
New Fortune Wisdom Limited | — | | 100.00% indirectly | | — | — | — | | 100.00% indirectly | | ||||||||||||||
Wisdom Forever Limited Partnership | USD452 | | 100.00% indirectly | | — | — | USD452 | | 100.00% indirectly | | ||||||||||||||
Shanghai Yuan Shu Yuan Jiu Investment Management Partnership (Limited Partnership) (“Yuan Shu Yuan Jiu”) | RMB571 | | 99.98% directly | | — | — | RMB571 | | 99.98% directly | | ||||||||||||||
Shanghai Yuan Shu Yuan Pin Investment Management Partnership (Limited Partnership) (“Yuan Shu Yuan Pin”) | RMB571 | | 99.98% directly | | — | — | RMB571 | | 99.98% directly | | ||||||||||||||
Shanghai Wansheng Industry Partnership (Limited Partnership) (“Shanghai Wansheng”) | RMB4,012 | | 99.98% directly | | 12 | — | RMB4,024 | | 99.98% directly | | ||||||||||||||
Ningbo Meishan Bonded Port Area Bai Ning Investment Partnership (Limited Partnership) (“Bai Ning”) | RMB1,680 | | 99.98% directly | | — | — | RMB1,680 | | 99.98% directly | | ||||||||||||||
Hope Building | RMB484 | | 100.00% indirectly | | — | — | RMB484 | | 100.00% indirectly | | ||||||||||||||
Wuhu Yuanxiang Tianfu Investment Management Partnership (Limited Partnership) (“Yuanxiang Tianfu”) | RMB533 | | 99.98% directly | | 15 | — | RMB548 | | 99.98% directly | | ||||||||||||||
Wuhu Yuanxiang Tianyi Investment Management Partnership (Limited Partnership) (“Yuanxiang Tianyi”) | RMB533 | | 99.98% directly | | 15 | — | RMB548 | | 99.98% directly | | ||||||||||||||
Shengyi Jingsheng | RMB1,063 | | 100.00% indirectly | | 30 | — | RMB1,093 | | 100.00% indirectly | | ||||||||||||||
CBRE Global Investors U.S. Investments I, LLC (“CG Investments”) | RMB3,660 | | 99.99% directly | | 451 | — | RMB4,111 | | 99.99% directly |
| ||||||||||||||
China Life Guangde(Tianjin) Equity Investment Fund Partnership (Limited Partnership) (“CL Guang De”) | RMB295 | | 99.95% directly | | 321 | — | RMB616 | | 99.95% directly | | ||||||||||||||
Beijing China Life Pension Industry Investment Fund (Limited Partnership) (“CL Pension Industry”) | RMB9 | | 99.90% directly | | 495 | — | RMB504 | | 99.90% directly | | ||||||||||||||
220
Notes to the Consolidated Financial Statements (continued)
For the year ended 31 December 2021
| 35 | SIGNIFICANT RELATED PARTY TRANSACTIONS (continued) |
| (f) | Percentages of holding of related parties with control relationship and changes during the year (continued) |
Subsidiaries
| As at 31 December 2020 | As at 31 December 2021 | |||||||||||||||||||||||
| Amount million | Percentage of holding | Increase million | Decrease million | Amount million | Percentage of holding | |||||||||||||||||||
China Life Qihang Phase I (Tianjin) Equity Investment Fund Partnership (Limited Partnership) (“CL Qihang Fund l”) | RMB1 | | 99.99% directly | | 6,064 | — | RMB6,065 | | 99.99% directly | | ||||||||||||||
China Life Xing Wan (Tianjin) Enterprise Management Partnership (Limited Partnership) (“CL Xing Wan”)(i) | — | — | 3,865 | — | RMB3,865 | | 99.98% indirectly | | ||||||||||||||||
China Life Insurance Sales Company Limited (“CL Sales”)(ii) | — | — | — | — | — | | 90.81% directly | | ||||||||||||||||
China Life (Hangzhou) Hotel Company Limited (“CL Hangzhou Hotel”)(i) | — | — | 65 | — | RMB65 | | 99.99% indirectly | | ||||||||||||||||
China Life Jiayuan (Xiamen) Health Management Company Limited (“CL Jiayuan”)(i) | — | — | 300 | — | RMB300 | | 99.99% indirectly | | ||||||||||||||||
| (i) | CL Xing Wan, CL Hangzhou Hotel, CL Jiayuan were newly included in the consolidated financial statements of the Group for the year ended 31 December 2021. |
| (ii) | For the year ended 31 December 2021, the Company injected capital of RMB500 million to CL Sales, a wholly owned subsidiary of CLIC, and acquired 90.81% of the shareholders’ equity. Both parties are under common control by CLIC which is not transitory before and after the combination. Therefore, this is a business combination under common control. The financial statements of the Group were restated based on the financial statements as at 31 December 2021 obtained from the merged party on the date of combination. |
221
Notes to the Consolidated Financial Statements (continued)
For the year ended 31 December 2021
| 35 | SIGNIFICANT RELATED PARTY TRANSACTIONS (continued) |
| (g) | Transactions with significant related parties |
| For the year ended 31 December | ||||||||||
| Notes | 2021 RMB million | 2020 RMB million | ||||||||
Transactions with CLIC and its subsidiaries | ||||||||||
CLIC | ||||||||||
Distribution of dividends from the Company and AMC to CLIC | 12,663 | 14,253 | ||||||||
Policy management fee received from CLIC | (i) (vii) | 554 | 564 | |||||||
Asset management fee received from CLIC | (ii.a) | 156 | 125 | |||||||
CLP&C | ||||||||||
Agency fee received from CLP&C | (iii) (vii) | 1,634 | 2,289 | |||||||
Dividends from CLP&C (Note 9) | 214 | 271 | ||||||||
Rental and a service fee received from CLP&C | 78 | 54 | ||||||||
Asset management fee received from CLP&C | (ii.c) | 52 | 41 | |||||||
CLI | ||||||||||
Payment of asset management fee to CLI | (ii.d) (vii) | 588 | 651 | |||||||
Payment of real estate purchase to CLI | 103 | 135 | ||||||||
Property leasing expenses charged by CLI | 52 | 71 | ||||||||
CLHI | ||||||||||
Payment of a operation management service fee to CLHI | (vi) | 112 | 106 | |||||||
CL Overseas | ||||||||||
Asset management fee received from CL Overseas | (ii.b) | 79 | 73 | |||||||
| For the year ended 31 December | ||||||||||||
| Notes | 2021 RMB million | 2020 RMB million | ||||||||||
Transactions with associates and joint ventures | ||||||||||||
CGB | ||||||||||||
Interest on deposits received from CGB | 3,268 | 2,938 | ||||||||||
Dividends from CGB (Note 9) | 662 | 550 | ||||||||||
Commission expenses charged by CGB | (iv) | 190 | 189 | |||||||||
Rental fee received from CGB | 145 | 124 | ||||||||||
Insurance premium received from CGB | 88 | 3 | ||||||||||
Sino-Ocean | ||||||||||||
Dividends from Sino-Ocean (Note 9) | 271 | 178 | ||||||||||
Interest of corporate bonds received from Sino-Ocean | 17 | 26 | ||||||||||
Transaction between other associates and joint ventures and the Group | ||||||||||||
Dividends from other associates and joint ventures (Note 9) | 3,333 | 4,254 | ||||||||||
222
Notes to the Consolidated Financial Statements (continued)
For the year ended 31 December 2021
| 35 | SIGNIFICANT RELATED PARTY TRANSACTIONS (continued) |
| (g) | Transactions with significant related parties (continued) |
| For the year ended 31 December | ||||||||||||
| Notes | 2021 RMB million | 2020 RMB million | ||||||||||
Transaction between EAP and the Group | ||||||||||||
Contribution to EAP | 1,357 | 1,140 | ||||||||||
| For the year ended 31 December | ||||||||||
| Notes | 2021 RMB million | 2020 RMB million | ||||||||
Transactions between other subsidiaries and the Company | ||||||||||
Payment of an asset management fee | ||||||||||
Payment of an asset management fee to AMC | (ii.e) (vii) | 2,742 | 2,089 | |||||||
Payment of an asset management fee to AMC HK | (ii.f) | 15 | 18 | |||||||
Dividends from subsidiaries | ||||||||||
Dividends from AMC | 432 | 220 | ||||||||
Dividends from Pension Company | 127 | — | ||||||||
Dividends from the other subsidiaries | 738 | 301 | ||||||||
Agency fee received | ||||||||||
Agency fee received from Pension Company for entrusted sales of annuity funds and other businesses | (v) | 70 | 57 | |||||||
Rental received | ||||||||||
Rental received from Pension Company | 70 | 68 | ||||||||
Capital increase in subsidiaries | ||||||||||
Capital contribution to China Life Qihang Fund I | 6,064 | — | ||||||||
Capital contribution to CL Pension Industry | 495 | — | ||||||||
Capital contribution to CG Investments | 451 | — | ||||||||
Capital contribution to CL Guang De | 321 | 285 | ||||||||
Capital contribution to CL Hotel Investors,L.P. | 190 | 95 | ||||||||
Capital contribution to Suzhou Pension Company | 190 | 205 | ||||||||
Capital contribution to Yuanxiang Tianfu | 15 | — | ||||||||
Capital contribution to Yuanxiang Tianyi | 15 | — | ||||||||
Capital contribution to Shanghai Wansheng | 12 | 12 | ||||||||
Capital reduction of subsidiaries | ||||||||||
Capital reduction from Rui Chong | 700 | — | ||||||||
Transactions between the consolidated structured entities and the Company | ||||||||||
Distribution of profits from the consolidated structured entities to the Company | 15,947 | 14,429 | ||||||||
223
Notes to the Consolidated Financial Statements (continued)
For the year ended 31 December 2021
| 35 | SIGNIFICANT RELATED PARTY TRANSACTIONS (continued) |
| (g) | Transactions with significant related parties (continued) |
Notes:
| (i) | On 26 December 2017, the Company and CLIC renewed a renewable insurance agency agreement, effective from 1 January 2018 to 31 December 2020. The Company performs its duties of insurance agents in accordance with the agreement, but does not acquire any rights and profits or assume any obligations, losses and risks as an insurer of the non-transferable policies. The policy management fee was payable semi-annually, and is equal to the sum of (1) the number of policies in force as at the last day of the period, multiplied by RMB8.0 per policy and (2) 2.5% of the actual premiums and deposits received during the period, in respect of such policies. The policy management fee income is included in other income in the consolidated statement of comprehensive income. On 31 December 2020, the Company and the CLIC renewed the insurance agency agreement. This agreement is effective from 1 January 2021 to 31 December 2021. |
| (ii.a) | In December 2018, CLIC renewed an asset management agreement with AMC, entrusting AMC to manage and make investments for its insurance funds. The agreement is effective from 1 January 2019 to 31 December 2021. In accordance with the agreement, CLIC paid AMC a basic service fee at the rate of 0.05% per annum for the management of insurance funds. The service fee was calculated on a monthly basis and payable on a seasonal basis, by multiplying the average book value of the assets under management (after deducting the funds and interests of positive repurchase transactions and deducting the principal and interests of debt and equity investment schemes, project asset-backed schemes and customised non-standard products) at the beginning and the end of any given month by the rate of 0.05%, divided by 12. According to specific projects, debt investment schemes, equity investment plans, project asset-backed plans, and customised non-standard products are based on the contractual agreed rate, without paying for an extra management fee. At the end of each year, CLIC assessed the investment performance of the assets managed by AMC, compared the actual results against benchmark returns and made adjustment to the basic service fee. In July 2020, CLIC revised the asset management agreement with AMC, effective from 1 July 2020 to 31 December 2022. The annual rate of the basic service fee has been changed from 0.05% to 0.08%, and the other terms mentioned above remain unchanged. |
| (ii.b) | In 2018, CL Overseas renewed an investment management agreement with AMC HK, effective from 1 January 2018 to 31 December 2022. In accordance with the agreement, CL Overseas entrusted AMC HK to manage and make investments for its insurance funds and paid AMC HK a basic investment management fee and an investment performance fee. The basic investment management fee was accrued by multiplying the weighted average total funds by the basic fee rate. The investment performance fee was calculated based on the difference between the total actual annual yields and predetermined net realised yield. The basic investment management fee was calculated and payable on a semi-annual basis. The investment performance fee was payable according to the total actual annual yield at the end of each year. |
| (ii.c) | On 10 February 2021, CLP&C renewed an agreement for the management of insurance funds with AMC, entrusting AMC to manage and make investments for its insurance funds, effective from 1 January 2021 to 31 December 2023. In accordance with the agreement, CLP&C paid AMC a fixed service fee and a variable service fee. The fixed service fee was calculated on a monthly basis and payable on an annual basis, by multiplying the average net asset value of assets of each category under management at the beginning and the end of any given month by the responding annual investment management fee rate, divided by 12. The variable service fee was payable on an annual basis, and linked to investment performance. |
| (ii.d) | On 31 December 2018, the Company and CLI renewed a management agreement of alternative investment of insurance funds, effective from 1 January 2019 to 31 December 2020. The agreement shall be automatically renewed for one year unless either party gives written notice to the other party not to renew it 90 business days prior to the expiration of this agreement. On 1 January 2021, the agreement was automatically renewed for one year. In accordance with the agreement, the Company entrusted CLI to engage in investment, operation and management of equities, real estate and related financial products, and securitised financial products under the instructions of the annual guidelines. The Company paid CLI an asset management fee and a performance related bonus based on the agreement. For fixed-income projects, the management fee rate was between 0.05% and 0.6% according to different ranges of returns; for non-fixed-income projects, the management fee rate for invested projects was 0.3%, the management fee rates for newly signed projects were between 0.05% and 0.3% according to CLI’s involvement in project management and the performance-related bonus is based on the internal return rate upon expiry of the project. In addition, the Company adjusts the investment management fees for fixed-income projects and non-fixed-income projects based on the annual evaluation results on CLI’s performance. The adjustment (variable management fee) ranges from negative 10% to positive 15% of the investment management fee in the current period. |
224
Notes to the Consolidated Financial Statements (continued)
For the year ended 31 December 2021
| 35 | SIGNIFICANT RELATED PARTY TRANSACTIONS (continued) |
| (g) | Transactions with significant related parties (continued) |
Notes (continued):
| (ii.e) | On 28 December 2018, the Company and AMC renewed the agreement for the management of insurance funds, effective from 1 January 2019 to 31 December 2021. In accordance with the agreement, the Company entrusted AMC to manage and make investments for its insurance funds and paid AMC a fixed investment management service fee and a variable investment management service fee. The fixed annual service fee was calculated and payable on a seasonal basis, by multiplying the average net value of the assets under management by the rate of 0.05%; the variable investment management service fee was payable annually, based on the results of performance evaluation, at 20% of the fixed service fee per annum. On 1 July 2020, the Company and AMC revised the agreement for the management of insurance funds, effective from 1 July 2020 to 31 December 2022. The calculation method of the fixed annual service fee has been changed from five ten thousandths of the net value of the total investment assets to daily accrued fixed service fee by multiplying the net value of the total investment assets on the day by the variety-based annual investment management fee rate divided by 360. The other terms above remain unchanged. Asset management fees charged to the Company by AMC are eliminated in the consolidated statement of comprehensive income. |
225
Notes to the Consolidated Financial Statements (continued)
For the year ended 31 December 2021
| 35 | SIGNIFICANT RELATED PARTY TRANSACTIONS (continued) |
| (g) | Transactions with significant related parties (continued) |
Notes (continued):
| (ii.f) | On 31 December 2018, the Company and AMC HK renewed the management agreement of insurance funds investment, which is effective from 1 January 2019 to 31 December 2021. In accordance with the agreement, the Company entrusted AMC HK to manage and make investments for its insurance funds and paid AMC HK an asset management fee on a seasonal basis and the maximum investment management fee paid annually is RMB30 million. The management fee rate for financial products, such as investment plans, project asset-backed plans, customised products and insurance asset management products, set up by AMC HK in the industry permitted by regulatory policies, is set according to contractual terms. The management fee rate for the directive investment operation of term deposits, common stocks, funds, financial products and other investment products, universal account B-2 and entrusted assets account alike was 0.02%; the management fee rate for unlisted equity investment was 0.3%; the management fee rate for customised investment portfolio was agreed upon the management fee of market-oriented entrusted investment. Asset management fees charged to the Company by AMC HK are eliminated in the consolidated statement of comprehensive income. |
| (iii) | On 31 January 2018, the Company and CLP&C signed an insurance agency framework agreement, whereby CLP&C entrusted the Company to act as an agent to sell designated P&C insurance products in certain authorised jurisdictions. The agency fee was determined based on cost (tax included) plus a margin. The agreement is effective for three years, from 8 March 2018 to 7 March 2021. On 20 February 2021, CLP&C and the Company renewed the agreement, effective for two years, from 8 March 2021 to 7 March 2023. |
CLP&C and CL Sales signed the Strategic Cooperation Agreement on 22 July 2019. According to the agreement, CL Sales, as an agent of insurance products, provides intermediary services for CLP&C. The two parties determine the specific commissions and the standard of sales management fee through fair negotiation, based on the local market price and the paid- in premium which exclude value-added tax and deducte the premium from batch reduction. This agreement is valid for three years, from 22 July 2019 to 21 July 2022. |
| (iv) | On 19 October 2018, the Company and CGB renewed an insurance agency agreement to distribute insurance products. All individual insurance products suitable for distribution through bancassurance channels are included in the agreement. CGB provides agency services, including the sale of insurance products, collecting premiums and paying benefits. The Company paid the agency commission by multiplying the net amount of total premiums received from the sale of each category individual insurance products after deducting the surrender premiums in the hesitation period, by the responding fixed commission rate. The commission rates for various insurance products sold by CGB are agreed based on arm’s length transactions. The commissions are payable on a monthly basis. On 22 August 2020, the Company and CGB renewed an insurance agency agreement to distribute insurance products, effective from the signing date to 22 August 2022. |
On 28 December 2018, the Company and CGB signed another insurance agency agreement to distribute corporate group insurance products. The corporate group insurance products suitable for distribution through bancassurance channels are included in the agreement. The Company paid the agency commission by multiplying the net amount of total premiums received from the sale of each category group insurance product after deducting the surrender premiums, by the responding fixed commission rate. The commission rates for various insurance products sold by CGB are agreed by reference to comparable market prices of independent third-parties. The commissions are paid on a monthly basis. The agreement is effective for two years from 1 January 2019, with an automatic one-year renewal if no objections were raised by either party upon expiry. |
| (v) | On 1 January 2019, the Company and Pension Company renewed an entrusted agency agreement for pension business acted by life business. The agreement is effective from 1 January 2019 to 31 December 2021. The business means that Pension Company entrusted the Company to sell enterprise annuity funds, pension security business, occupational pension business and the third-party asset management business. The commissions agreed upon in the agreement include the daily business commissions and the annual promotional plans commissions. According to the agreement, the commissions for the entrusting service of enterprise annuity fund management, which is the core business of Pension Company, are calculated at 30% to 80% of the annual entrusting management fee revenues, depending on the duration of the agreement. The commissions for account management service are calculated at 60% of the first year’s account management fee and were only charged for the first year, regardless of the duration of the agreement. The commissions for investment management services, in accordance with the duration of the agreement, are calculated at 60% to 3% of the annual investment management fee (excluding risk reserves for investment), decreasing annually. The commissions of the group pension plan are, in accordance with the duration of the contracts, calculated at 50% to 3% of the annual investment management fee, decreasing annually; the commissions of the personal pension plan are calculated at 30% to 50% of the annual investment management fee according to the various rates of the daily management fee applied to the various individual pension management products in all of the management years; the commissions of occupation annuity and third-party asset management business are in accordance with the provision of annual promotional plans, which should be determined by both parties on a separate occasion. The commissions charged to Pension Company by the Company are eliminated in the consolidated statement of comprehensive income of the Group. |
226
Notes to the Consolidated Financial Statements (continued)
For the year ended 31 December 2021
| 35 | SIGNIFICANT RELATED PARTY TRANSACTIONS (continued) |
| (g) | Transactions with significant related parties (continued) |
Notes (continued):
| (vi) | On 25 November 2020, the Company and CLHI signed a new aged-care projects management service agreement, effective from 1 January 2020 to 31 December 2021. In accordance with the agreement, the Company entrusted CLHI to operate and manage existed aged-care projects and paid CLHI a management service fee. The management service fee was calculated and payable on a seasonal basis, by multiplying the total amount of the investments under management (based on the daily weighted average investment amount) by the annual rate of 2.7%. |
| (vii) | These transactions constitute continuing connected transactions which are subject to reporting and announcement requirements but are exempt from independent shareholders’ approval requirements under Chapter 14A of the Listing Rules. The Company has complied with the disclosure requirements in accordance with Chapter 14A of the Listing Rules. |
227
Notes to the Consolidated Financial Statements (continued)
For the year ended 31 December 2021
| 35 | SIGNIFICANT RELATED PARTY TRANSACTIONS (continued) |
| (h) | Amounts due from/to significant related parties |
The following table summarises the balances due from and to significant related parties. The balances of the Group are all unsecured. The balances of the Group are non-interest-bearing and have no fixed repayment dates except for deposits with CGB, wealth management products and other securities of CGB, and corporate bonds issued by Sino-Ocean.
| As at 31 December 2021 RMB million | As at 31 December 2020 RMB million | |||||||
The resulting balances due from and to | ||||||||
Amount due from CLIC | 342 | 348 | ||||||
Amount due from CL Overseas | 59 | 43 | ||||||
Amount due from CLP&C | 258 | 251 | ||||||
Amount due to CLP&C | (17 | ) | (22 | ) | ||||
Amount due from CLI | 51 | 32 | ||||||
Amount due to CLI | (445 | ) | (447 | ) | ||||
Amount due from CLRE | 2 | 2 | ||||||
Amount due to CLHI | (40 | ) | (38 | ) | ||||
Amount deposited with CGB | 69,148 | 71,419 | ||||||
Wealth management products and other financial instruments of CGB | 8,384 | 603 | ||||||
Amount due from CGB Note | 9,138 | 1,240 | ||||||
Amount due to CGB | (80 | ) | (51 | ) | ||||
Corporate bonds of Sino-Ocean | 356 | 361 | ||||||
Amount due from Sino-Ocean | 7 | 7 | ||||||
Amount due from CL Ecommerce | 3 | 12 | ||||||
Amount due to CL Ecommerce | (15 | ) | (17 | ) | ||||
The resulting balances due from and to subsidiaries of the Company | ||||||||
Amount due to AMC | (717 | ) | (1,293 | ) | ||||
Amount due to AMC HK | (8 | ) | (8 | ) | ||||
Amount due from Pension Company | 46 | 39 | ||||||
Amount due to Pension Company | (114 | ) | (43 | ) | ||||
Amount due from Rui Chong Company | 604 | 114 | ||||||
Note:
Board of directors of the Company approved and announced on 26 May 2021 to subscribe 918,578,836 shares of Guangfa Bank’s additional stock issue at RMB8.7364 per share, amounted to RMB8,025 million. As at 31 December 2021, the Company has finished the capital injection to Guangfa Bank and was awaiting the final regulatory approval. Therefore the capital contribution was recorded as other account receivable.
| (i) | Key management personnel compensation |
| For the year ended 31 December | ||||||||
| 2021 | 2020 | |||||||
| RMB million | RMB million | |||||||
Salaries and other benefits | 15 | 28 | ||||||
|
|
|
| |||||
The total compensation package for the Company’s key management personnel has not yet been finalised in accordance with regulations of the relevant PRC authorities. The compensation listed above is the tentative payment.
228
Notes to the Consolidated Financial Statements (continued)
For the year ended 31 December 2021
| 35 | SIGNIFICANT RELATED PARTY TRANSACTIONS (continued) |
| (j) | Transactions with state-owned enterprises |
Under IAS 24 Related Party Disclosures (“IAS 24”), business transactions between state-owned enterprises controlled by the PRC government are within the scope of related party transactions. CLIC, the ultimate holding company of the Group, is a state-owned enterprise. The Group’s key business is insurance and investment related and therefore the business transactions with other state-owned enterprises are primarily related to insurance and investment activities. The related party transactions with other state-owned enterprises were conducted in the ordinary course of business. Due to the complex ownership structure, the PRC government may hold indirect interests in many companies. Some of these interests may, in themselves or when combined with other indirect interests, be controlling interests which may not be known to the Group. Nevertheless, the Group believes that the following captures the material related parties and has applied IAS 24 exemption and disclosed only qualitative information.
As at 31 December 2021, most of the bank deposits of the Group were with state-owned banks; the issuers of corporate bonds and subordinated bonds held by the Group were mainly state-owned enterprises. For the year ended 31 December 2021, a large portion of group insurance business of the Group was with state-owned enterprises; the majority of bancassurance commission charges were paid to state-owned banks and postal offices; and the majority of the reinsurance agreements of the Group were entered into with a state-owned reinsurance company.
| 36 | SHARE CAPITAL |
| As at 31 December 2021 | As at 31 December 2020 | |||||||||||||||
| No. of shares | RMB million | No. of shares | RMB million | |||||||||||||
Registered, authorised, issued and fully paid | ||||||||||||||||
Ordinary shares of RMB1 each | 28,264,705,000 | 28,265 | 28,264,705,000 | 28,265 | ||||||||||||
|
|
|
|
|
|
|
| |||||||||
As at 31 December 2021, the Company’s share capital was as follows:
| As at 31 December 2021 | ||||||||
| No. of shares | RMB million | |||||||
Owned by CLIC (i) | 19,323,530,000 | 19,324 | ||||||
Owned by other equity holders | 8,941,175,000 | 8,941 | ||||||
Including: domestic listed | 1,500,000,000 | 1,500 | ||||||
overseas listed (ii) | 7,441,175,000 | 7,441 | ||||||
|
|
|
| |||||
Total | 28,264,705,000 | 28,265 | ||||||
|
|
|
| |||||
| (i) | All shares owned by CLIC are domestic listed shares. |
| (ii) | Overseas listed shares are traded on the Stock Exchange of Hong Kong Limited and the New York Stock Exchange. |
229
Notes to the Consolidated Financial Statements (continued)
For the year ended 31 December 2021
| 37 | RESERVES |
Share premium RMB million | Other reserves RMB million | Unrealised gains/ (losses) from available- for-sale securities RMB million | Other comprehensive income reclassifiable to profit or loss under the equity method RMB million | Statutory reserve fund RMB million | Discretionary reserve fund RMB million | General reserve RMB million | Exchange differences on translating foreign operations RMB million | Other comprehensive income non- reclassifiable to profit or loss under the equity method RMB million | Total RMB million | |||||||||||||||||||||||||||||||
|
|
|
| (a) | (b) | (c) |
|
|
| |||||||||||||||||||||||||||||||
As at 1 January 2020 | 53,905 | 1,148 | 28,594 | 756 | 40,516 | 34,645 | 37,888 | (24 | ) | (162 | ) | 197,266 | ||||||||||||||||||||||||||||
Other comprehensive income for the year | — | — | 25,674 | 646 | — | — | — | (965 | ) | 344 | 25,699 | |||||||||||||||||||||||||||||
Appropriation to reserves | — | — | — | — | 5,009 | 5,857 | 5,159 | — | — | 16,025 | ||||||||||||||||||||||||||||||
Others | — | (1,055 | ) | — | — | — | — | — | — | — | (1,055 | ) | ||||||||||||||||||||||||||||
|
|
|
|
|
|
|
|
|
|
|
|
|
|
|
|
|
|
|
| |||||||||||||||||||||
As at 31 December 2020 | 53,905 | 93 | 54,268 | 1,402 | 45,525 | 40,502 | 43,047 | (989 | ) | 182 | 237,935 | |||||||||||||||||||||||||||||
|
|
|
|
|
|
|
|
|
|
|
|
|
|
|
|
|
|
|
| |||||||||||||||||||||
As at 1 January 2021 | 53,905 | 93 | 54,268 | 1,402 | 45,525 | 40,502 | 43,047 | (989 | ) | 182 | 237,935 | |||||||||||||||||||||||||||||
Other comprehensive income for the year | — | — | (5,349 | ) | 1,233 | — | — | — | (388 | ) | (104 | ) | (4,608 | ) | ||||||||||||||||||||||||||
Appropriation to reserves | — | — | — | — | 5,096 | 5,009 | 5,273 | — | — | 15,378 | ||||||||||||||||||||||||||||||
Other comprehensive income to retained earnings | — | — | — | — | — | — | — | — | 45 | 45 | ||||||||||||||||||||||||||||||
Others | — | 305 | — | — | — | — | — | — | — | 305 | ||||||||||||||||||||||||||||||
|
|
|
|
|
|
|
|
|
|
|
|
|
|
|
|
|
|
|
| |||||||||||||||||||||
As at 31 December 2021 | 53,905 | 398 | 48,919 | 2,635 | 50,621 | 45,511 | 48,320 | (1,377 | ) | 123 | 249,055 | |||||||||||||||||||||||||||||
|
|
|
|
|
|
|
|
|
|
|
|
|
|
|
|
|
|
|
| |||||||||||||||||||||
| (a) | Pursuant to the relevant PRC laws, the Company appropriated 10% of its net profit under Chinese Accounting Standards (“CAS”) to statutory reserve which amounted to RMB5,096 million for the year ended 31 December 2021 (2020: RMB5,009 million). |
| (b) | Approved at the Annual General Meeting in 30 June 2021, the Company appropriated RMB5,009 million to the discretionary reserve fund for the year ended 31 December 2020 based on net profit under CAS (2020: RMB5,857 million). |
| (c) | Pursuant to “Financial Standards of Financial Enterprises—Implementation Guide” issued by the Ministry of Finance of the PRC on 30 March 2007, for the year ended 31 December 2021, the Company appropriated 10% of net profit under CAS which amounted to RMB5,096 million to the general reserve for future uncertain catastrophes, which cannot be used for dividend distribution or conversion to share capital increment (2020: RMB5,009 million). In addition, pursuant to the CAS, the Group appropriated RMB177 million to the general reserve of its subsidiaries attributable to the Company in the consolidated financial statements (2020: RMB150 million). |
Under related PRC law, dividends may be paid only out of distributable profits. Any distributable profits that are not distributed in a given year are retained and available for distribution in the subsequent years.
230
Notes to the Consolidated Financial Statements (continued)
For the year ended 31 December 2021
| 38 | NOTES TO THE CONSOLIDATED STATEMENT OF CASH FLOWS |
Changes in liabilities arising from financing activities
| Interest- bearing loans and borrowings RMB million | Bonds payable RMB million | Lease liabilities RMB million | Securities sold under agreements to repurchase RMB million | Other liability- payable to the third-party holders of consolidated structured entities RMB million | Other liability- interest payable related to financing activities RMB million | Total RMB million | ||||||||||||||||||||||
At 1 January 2020 | 20,045 | 34,990 | 3,091 | 118,088 | 21,400 | 1,327 | 198,941 | |||||||||||||||||||||
Changes from financing cash flows | 317 | — | (1,618 | ) | 4,912 | 21,254 | (3,639 | ) | 21,226 | |||||||||||||||||||
Foreign exchange movement | (806 | ) | — | — | — | — | — | (806 | ) | |||||||||||||||||||
Changes arising from losing control of consolidated structured entities | — | — | — | (751 | ) | — | — | (751 | ) | |||||||||||||||||||
New leases | — | — | 1,156 | — | — | — | 1,156 | |||||||||||||||||||||
Interest expense | — | 2 | 113 | — | — | 3,632 | 3,747 | |||||||||||||||||||||
Others | — | — | (78 | ) | — | — | — | (78 | ) | |||||||||||||||||||
|
|
|
|
|
|
|
|
|
|
|
|
|
| |||||||||||||||
At 31 December 2020 | 19,556 | 34,992 | 2,664 | 122,249 | 42,654 | 1,320 | 223,435 | |||||||||||||||||||||
|
|
|
|
|
|
|
|
|
|
|
|
|
| |||||||||||||||
At 1 January 2021 | 19,556 | 34,992 | 2,664 | 122,249 | 42,654 | 1,320 | 223,435 | |||||||||||||||||||||
Changes from financing cash flows | — | — | (1,517 | ) | 117,211 | 25,208 | (6,461 | ) | 134,441 | |||||||||||||||||||
Foreign exchange movement | (870 | ) | — | — | — | — | — | (870 | ) | |||||||||||||||||||
Changes arising from losing control of consolidated structured entities | — | — | — | (368 | ) | — | — | (368 | ) | |||||||||||||||||||
New leases | — | — | 1,086 | — | — | — | 1,086 | |||||||||||||||||||||
Interest expense | — | 2 | 96 | — | — | 5,500 | 5,598 | |||||||||||||||||||||
Others | — | — | (147 | ) | 354 | — | — | 207 | ||||||||||||||||||||
|
|
|
|
|
|
|
|
|
|
|
|
|
| |||||||||||||||
At 31 December 2021 | 18,686 | 34,994 | 2,182 | 239,446 | 67,862 | 359 | 363,529 | |||||||||||||||||||||
|
|
|
|
|
|
|
|
|
|
|
|
|
| |||||||||||||||
231
Notes to the Consolidated Financial Statements (continued)
For the year ended 31 December 2021
| 39 | PROVISIONS AND CONTINGENCIES |
The following is a summary of the significant contingent liabilities:
| As at 31 December 2021 RMB million | As at 31 December 2020 RMB million | |||||||
Pending lawsuits | 506 | 403 | ||||||
|
|
|
| |||||
The Group involves in certain lawsuits arising from the ordinary course of business. In order to accurately disclose the contingent liabilities for pending lawsuits, the Group analysed all pending lawsuits case by case at the end of each interim and annual reporting period. A provision will only be recognised if management determines, based on third-party legal advice, that the Group has present obligations and the settlement of which is expected to result in an outflow of the Group’s resources embodying economic benefits, and the amount of such obligations could be reasonably estimated. Otherwise, the Group will disclose the pending lawsuits as contingent liabilities. As at 31 December 2021 and 2020, the Group had other contingent liabilities but disclosure of such was not practical because the amounts of liabilities could not be reliably estimated and were not material in aggregate.
| 40 | COMMITMENTS |
| (a) | Capital commitments |
The Group had the following capital commitments relating to property development projects and investments:
| As at 31 December 2021 RMB million | As at 31 December 2020 RMB million | |||||||
Contracted, but not provided for | ||||||||
Investments | 94,770 | 78,954 | ||||||
Property, plant and equipment | 1,528 | 3,063 | ||||||
|
|
|
| |||||
Total | 96,298 | 82,017 | ||||||
|
|
|
| |||||
| (b) | Operating lease commitments |
As lessor, the future minimum rentals receivable under non-cancellable operating leases are as follows:
| As at 31 December 2021 RMB million | As at 31 December 2020 RMB million | |||||||
Not later than one year | 781 | 768 | ||||||
Later than one year but not later than five years | 1,296 | 1,526 | ||||||
Later than five years | 142 | 193 | ||||||
|
|
|
| |||||
Total | 2,219 | 2,487 | ||||||
|
|
|
| |||||
232
Notes to the Consolidated Financial Statements (continued)
For the year ended 31 December 2021
| 41 | STATEMENT OF FINANCIAL POSITION AND NOTES TO KEY ITEMS |
Statement of financial position
As at 31 December 2021
| Notes | As at 31 December 2021 RMB million | As at 31 December 2020 RMB million | ||||||||||
ASSETS | ||||||||||||
Property, plant and equipment | 41(a) | 51,116 | 50,159 | |||||||||
Right-of-use assets | 41(b) | 2,239 | 2,823 | |||||||||
Investment properties | 41(c) | 6,191 | 6,162 | |||||||||
Investments in subsidiaries | 41(d) | 170,387 | 88,951 | |||||||||
Investments in associates and joint ventures | 41(e) | 162,984 | 157,401 | |||||||||
Held-to-maturity securities | 41(f) | 1,531,640 | 1,188,509 | |||||||||
Loans | 41(g) | 646,998 | 638,849 | |||||||||
Term deposits | 41(h) | 491,332 | 521,886 | |||||||||
Statutory deposits – restricted | 41(i) | 5,653 | 5,653 | |||||||||
Available-for-sale securities | 41(j) | 1,370,035 | 1,187,153 | |||||||||
Securities at fair value through profit or loss | 41(k) | 120,191 | 127,404 | |||||||||
Securities purchased under agreements to resell | 41(l) | 3,463 | 5,888 | |||||||||
Accrued investment income | 41(m) | 49,717 | 44,582 | |||||||||
Premiums receivable | 12 | 20,361 | 20,730 | |||||||||
Reinsurance assets | 13 | 6,630 | 6,095 | |||||||||
Other assets | 41(n) | 33,821 | 24,479 | |||||||||
Cash and cash equivalents | 53,593 | 50,692 | ||||||||||
|
|
|
| |||||||||
Total assets | 4,726,351 | 4,127,416 | ||||||||||
|
|
|
| |||||||||
LIABILITIES AND EQUITY | ||||||||||||
Liabilities | ||||||||||||
Insurance contracts | 15 | 3,419,899 | 2,973,225 | |||||||||
Investment contracts | 16 | 313,594 | 288,212 | |||||||||
Policyholder dividends payable | 124,949 | 122,510 | ||||||||||
Lease liabilities | 1,889 | 2,416 | ||||||||||
Bonds payable | 18 | 34,994 | 34,992 | |||||||||
Securities sold under agreements to repurchase | 41(p) | 232,496 | 116,584 | |||||||||
Annuity and other insurance balances payable | 56,818 | 55,031 | ||||||||||
Premiums received in advance | 48,699 | 53,021 | ||||||||||
Other liabilities | 41(q) | 61,487 | 59,219 | |||||||||
Deferred tax liabilities | 41(o) | 6,581 | 15,909 | |||||||||
Statutory insurance fund | 21 | 339 | 384 | |||||||||
|
|
|
| |||||||||
Total liabilities | 4,301,745 | 3,721,503 | ||||||||||
|
|
|
| |||||||||
Equity | ||||||||||||
Share capital | 36 | 28,265 | 28,265 | |||||||||
Reserves | 41(r) | 243,076 | 234,071 | |||||||||
|
|
|
| |||||||||
Retained earnings | 153,265 | 143,577 | ||||||||||
|
|
|
| |||||||||
Total equity | 424,606 | 405,913 | ||||||||||
|
|
|
| |||||||||
Total liabilities and equity | 4,726,351 | 4,127,416 | ||||||||||
|
|
|
| |||||||||
233
Notes to the Consolidated Financial Statements (continued)
For the year ended 31 December 2021
| 41 | STATEMENT OF FINANCIAL POSITION AND NOTES TO KEY ITEMS (continued) |
| (a) | Property, plant and equipment |
| Buildings | Office equipment furniture and fixtures | Motor vehicles | Assets under construction | Leasehold improvements | Total | |||||||||||||||||||
| RMB million | ||||||||||||||||||||||||
Cost | ||||||||||||||||||||||||
As at 1 January 2021 | 48,281 | 7,773 | 1,330 | 10,568 | 2,746 | 70,698 | ||||||||||||||||||
Transfers upon completion | 6,757 | — | — | (7,148 | ) | 174 | (217 | ) | ||||||||||||||||
Additions | 607 | 675 | 2 | 3,140 | — | 4,424 | ||||||||||||||||||
Transfers into investment properties | — | — | — | (209 | ) | — | (209 | ) | ||||||||||||||||
Disposals | (300 | ) | (440 | ) | (45 | ) | — | (548 | ) | (1,333 | ) | |||||||||||||
|
|
|
|
|
|
|
|
|
|
|
| |||||||||||||
As at 31 December 2021 | 55,345 | 8,008 | 1,287 | 6,351 | 2,372 | 73,363 | ||||||||||||||||||
|
|
|
|
|
|
|
|
|
|
|
| |||||||||||||
Accumulated depreciation | ||||||||||||||||||||||||
As at 1 January 2021 | (12,614 | ) | (5,248 | ) | (874 | ) | — | (1,778 | ) | (20,514 | ) | |||||||||||||
Charge for the year | (1,705 | ) | (740 | ) | (148 | ) | — | (372 | ) | (2,965 | ) | |||||||||||||
Disposals | 264 | 420 | 43 | — | 530 | 1,257 | ||||||||||||||||||
|
|
|
|
|
|
|
|
|
|
|
| |||||||||||||
As at 31 December 2021 | (14,055 | ) | (5,568 | ) | (979 | ) | — | (1,620 | ) | (22,222 | ) | |||||||||||||
|
|
|
|
|
|
|
|
|
|
|
| |||||||||||||
Impairment | ||||||||||||||||||||||||
As at 1 January 2021 | (24 | ) | — | — | (1 | ) | — | (25 | ) | |||||||||||||||
Charge for the year | — | — | — | — | — | — | ||||||||||||||||||
Disposals | — | — | — | — | — | — | ||||||||||||||||||
|
|
|
|
|
|
|
|
|
|
|
| |||||||||||||
As at 31 December 2021 | (24 | ) | — | — | (1 | ) | — | (25 | ) | |||||||||||||||
|
|
|
|
|
|
|
|
|
|
|
| |||||||||||||
Net book value | ||||||||||||||||||||||||
As at 1 January 2021 | 35,643 | 2,525 | 456 | 10,567 | 968 | 50,159 | ||||||||||||||||||
|
|
|
|
|
|
|
|
|
|
|
| |||||||||||||
As at 31 December 2021 | 41,266 | 2,440 | 308 | 6,350 | 752 | 51,116 | ||||||||||||||||||
|
|
|
|
|
|
|
|
|
|
|
| |||||||||||||
234
Notes to the Consolidated Financial Statements (continued)
For the year ended 31 December 2021
| 41 | STATEMENT OF FINANCIAL POSITION AND NOTES TO KEY ITEMS (continued) |
| (a) | Property, plant and equipment (continued) |
| Buildings | Office equipment furniture and fixtures | Motor vehicles | Assets under construction | Leasehold improvements | Total | |||||||||||||||||||
| RMB million | ||||||||||||||||||||||||
Cost | ||||||||||||||||||||||||
As at 1 January 2020 | 42,699 | 8,092 | 1,341 | 13,658 | 2,571 | 68,361 | ||||||||||||||||||
Transfers upon completion | 6,010 | 2 | — | (6,451 | ) | 318 | (121 | ) | ||||||||||||||||
Additions | 147 | 580 | 131 | 5,459 | — | 6,317 | ||||||||||||||||||
Transfers into investment properties | — | — | — | (2,098 | ) | — | (2,098 | ) | ||||||||||||||||
Disposals | (575 | ) | (901 | ) | (142 | ) | — | (143 | ) | (1,761 | ) | |||||||||||||
|
|
|
|
|
|
|
|
|
|
|
| |||||||||||||
As at 31 December 2020 | 48,281 | 7,773 | 1,330 | 10,568 | 2,746 | 70,698 | ||||||||||||||||||
|
|
|
|
|
|
|
|
|
|
|
| |||||||||||||
Accumulated depreciation | ||||||||||||||||||||||||
As at 1 January 2020 | (11,411 | ) | (5,329 | ) | (823 | ) | — | (1,543 | ) | (19,106 | ) | |||||||||||||
Charge for the year | (1,511 | ) | (690 | ) | (189 | ) | — | (372 | ) | (2,762 | ) | |||||||||||||
Disposals | 308 | 771 | 138 | — | 137 | 1,354 | ||||||||||||||||||
|
|
|
|
|
|
|
|
|
|
|
| |||||||||||||
As at 31 December 2020 | (12,614 | ) | (5,248 | ) | (874 | ) | — | (1,778 | ) | (20,514 | ) | |||||||||||||
|
|
|
|
|
|
|
|
|
|
|
| |||||||||||||
Impairment | ||||||||||||||||||||||||
As at 1 January 2020 | (24 | ) | — | — | (1 | ) | — | (25 | ) | |||||||||||||||
Charge for the year | — | — | — | — | — | — | ||||||||||||||||||
Disposals | — | — | — | — | — | — | ||||||||||||||||||
|
|
|
|
|
|
|
|
|
|
|
| |||||||||||||
As at 31 December 2020 | (24 | ) | — | — | (1 | ) | — | (25 | ) | |||||||||||||||
|
|
|
|
|
|
|
|
|
|
|
| |||||||||||||
Net book value | ||||||||||||||||||||||||
As at 1 January 2020 | 31,264 | 2,763 | 518 | 13,657 | 1,028 | 49,230 | ||||||||||||||||||
As at 31 December 2020 | 35,643 | 2,525 | 456 | 10,567 | 968 | 50,159 | ||||||||||||||||||
|
|
|
|
|
|
|
|
|
|
|
| |||||||||||||
235
Notes to the Consolidated Financial Statements (continued)
For the year ended 31 December 2021
| 41 | STATEMENT OF FINANCIAL POSITION AND NOTES TO KEY ITEMS (continued) |
| (b) | Right-of-use assets |
| Buildings | Others | Total | ||||||||||
| RMB million | ||||||||||||
Cost | ||||||||||||
As at 1 January 2021 | 5,060 | 1 | 5,061 | |||||||||
Additions | 836 | — | 836 | |||||||||
Deductions | (1,019 | ) | (1 | ) | (1,020 | ) | ||||||
|
|
|
|
|
| |||||||
As at 31 December 2021 | 4,877 | — | 4,877 | |||||||||
|
|
|
|
|
| |||||||
Accumulated depreciation | ||||||||||||
As at 1 January 2021 | (2,238 | ) | — | (2,238 | ) | |||||||
Charge for the year | (1,309 | ) | — | (1,309 | ) | |||||||
Deductions | 908 | 1 | 909 | |||||||||
|
|
|
|
|
| |||||||
As at 31 December 2021 | | (2,639 | ) | | 1 | | (2,638 | ) | ||||
|
|
|
|
|
| |||||||
Impairment | ||||||||||||
As at 1 January 2021 |
| — |
| — | — | |||||||
|
|
|
|
|
| |||||||
As at 31 December 2021 | — | — | — | |||||||||
|
|
|
|
|
| |||||||
Net book value | ||||||||||||
As at 1 January 2021 | 2,822 | 1 | 2,823 | |||||||||
|
|
|
|
|
| |||||||
As at 31 December 2021 | 2,238 | 1 | 2,239 | |||||||||
|
|
|
|
|
| |||||||
236
Notes to the Consolidated Financial Statements (continued)
For the year ended 31 December 2021
| 41 | STATEMENT OF FINANCIAL POSITION AND NOTES TO KEY ITEMS (continued) |
| (b) | Right-of-use assets (continued) |
| Buildings | Others | Total | ||||||||||
| RMB million | ||||||||||||
Cost | ||||||||||||
As at 1 January 2020 | 4,447 | 1 | 4,448 | |||||||||
Additions | 1,103 | — | 1,103 | |||||||||
Deductions | (490 | ) | — | (490 | ) | |||||||
|
|
|
|
|
| |||||||
As at 31 December 2020 | 5,060 | 1 | 5,061 | |||||||||
|
|
|
|
|
| |||||||
Accumulated depreciation | ||||||||||||
As at 1 January 2020 | (1,176 | ) | — | (1,176 | ) | |||||||
Charge for the year | ||||||||||||
Deductions | (1,453 | ) | — | (1,453 | ) | |||||||
As at 31 December 2020 | 391 | — | 391 | |||||||||
|
|
|
|
|
| |||||||
Impairment | (2,238 | ) | — | (2,238 | ) | |||||||
|
|
|
|
|
| |||||||
As at 1 January 2020 | — | — | — | |||||||||
|
|
|
|
|
| |||||||
As at 31 December 2020 | — | — | — | |||||||||
|
|
|
|
|
| |||||||
Net book value | ||||||||||||
As at 1 January 2020 | 3,271 | 1 | 3,272 | |||||||||
|
|
|
|
|
| |||||||
As at 31 December 2020 | 2,822 | 1 | 2,823 | |||||||||
|
|
|
|
|
| |||||||
The Group had no significant profit or loss from subleasing right-of-use assets or sale and leaseback transactions for the year ended 31 December 2021 (2020: same).
| (c) | Investment properties |
| Buildings RMB million | ||||
Cost | ||||
As at 1 January 2021 | | 6,796 | | |
Additions | 218 | |||
|
| |||
As at 31 December 2021 | 7,014 | |||
|
| |||
Accumulated depreciation | ||||
As at 1 January 2021 | (634 | ) | ||
Additions | (189 | ) | ||
|
| |||
As at 31 December 2021 | | (823 | ) | |
|
| |||
Net book value | ||||
As at 1 January 2021 | 6,162 | |||
|
| |||
As at 31 December 2021 | | 6,191 | | |
|
| |||
Fair value | ||||
As at 1 January 2021 | 7,878 | |||
|
| |||
As at 31 December 2021 | 8,190 | |||
|
| |||
237
Notes to the Consolidated Financial Statements (continued)
For the year ended 31 December 2021
| 41 | STATEMENT OF FINANCIAL POSITION AND NOTES TO KEY ITEMS (continued) |
| (c) | Investment properties (continued) |
| Buildings RMB million | ||||
Cost | ||||
As at 1 January 2020 Additions | 4,387 | |||
As at 31 December 2020 | 2,409 | |||
|
| |||
Accumulated depreciation As at | 6,796 | |||
|
| |||
1 January 2020 Additions | ||||
As at 31 December 2020 | (473 | ) | ||
| (161 | ) | |||
|
| |||
Net book value | ||||
As at 1 January 2020 | (634) | |||
As at 31 December 2020 Fair | ||||
| 3,914 | ||||
value | 6,162 | |||
As at 1 January 2020 | 5,462 | |||
|
| |||
As at 31 December 2020 | 7,878 | |||
|
| |||
The fair value of investment properties of the Company as at 31 December 2021 amounted to RMB8,190 million (as at 31 December 2020: RMB7,878 million), which was estimated by the Company having regards to valuations performed by an independent appraiser. The investment properties were classified as Level 3 in the fair value hierarchy.
| (d) | Investments in subsidiaries |
| As at 31 December 2021 RMB million | As at 31 December 2020 RMB million | |||||||
Unlisted investments at cost | 170,387 | 88,951 | ||||||
|
|
|
| |||||
238
Notes to the Consolidated Financial Statements (continued)
For the year ended 31 December 2021
| 41 | STATEMENT OF FINANCIAL POSITION AND NOTES TO KEY ITEMS (continued) |
| (d) | Investments in subsidiaries (continued) |
| (i) | The table below presents the basic information of the Company’s subsidiaries as at 31 December 2021: |
Name | Place of incorporation and operation | Percentage of equity interest held | Registered capital | Principal activities | ||||||||
AMC (i) | PRC | 60.00% directly | RMB4,000 million | Asset management | ||||||||
Pension Company (i) | PRC | 74.27% directly and indirectly | RMB3,400 million | Pension and annuity | ||||||||
AMC HK | Hong Kong, PRC | 50.00% indirectly | Not applicable | Asset management | ||||||||
Suzhou Pension Company (i) | PRC | 100.00% directly | RMB2,181 million | | Investment in retirement properties | | ||||||
CL AMP (i) | PRC PRC | 85.03% indirectly | RMB1,288 million | Fund management | ||||||||
CL Wealth (i) | Hong Kong, PRC | 100.00% indirectly | RMB200 million | Financial service | ||||||||
Golden Phoenix Tree Limited | The British Jersey Island | 100.00% directly | Not applicable | Investment | ||||||||
King Phoenix Tree Limited | PRC | 100.00% indirectly | Not applicable | Investment | ||||||||
Rui Chong Company (i) | Hong Kong, PRC Hong | 100.00% directly | RMB6,100 million | Investment | ||||||||
New Aldgate Limited | Kong, PRC | 100.00% directly | Not applicable | Investment | ||||||||
Glorious Fortune Forever Limited | USA | 100.00% directly | Not applicable | Investment | ||||||||
CL Hotel Investor, L.P. | The British Virgin Islands | 100.00% directly | Not applicable | Investment | ||||||||
Golden Bamboo Limited | The British Virgin Islands | 100.00% directly | Not applicable | Investment | ||||||||
Sunny Bamboo Limited | The British Virgin Islands | 100.00% directly | Not applicable | Investment | ||||||||
Fortune Bamboo Limited | The British Cayman Islands | 100.00% directly | Not applicable | Investment | ||||||||
China Century Core Fund Limited | PRC | 100.00% indirectly | Not applicable | Investment | ||||||||
CL Health (i) | PRC | 100.00% directly | RMB1,530 million | Health management | ||||||||
Franklin Shenzhen Company (i) | PRC | 100.00% indirectly | USD2 million | Investment | ||||||||
Guo Yang Guo Sheng (ii) | The British Virgin Islands | 89.997% directly | Not applicable | Investment | ||||||||
New Capital Wisdom Limited | The British Virgin Islands | 100.00% indirectly | Not applicable | Investment | ||||||||
New Fortune Wisdom Limited | The British Cayman Islands | 100.00% indirectly | Not applicable | Investment | ||||||||
Wisdom Forever Limited Partnership Bai Ning (ii) | PRC | 100.00% indirectly | Not applicable | Investment | ||||||||
Yuan Shu Yuan Pin (ii) | PRC | 99.98% directly | Not applicable | Investment | ||||||||
Yuan Shu Yuan Jiu (ii) | PRC | 99.98% directly | Not applicable | Investment | ||||||||
Hope Building (i) | PRC | 99.98% directly | Not applicable | Investment | ||||||||
Shanghai Wansheng (ii) | PRC | 100.00% indirectly | RMB484 million | Investment | ||||||||
Yuanxiang Tianfu (ii) | PRC | 99.98% directly | Not applicable | Investment | ||||||||
Yuanxiang Tianyi (ii) | PRC | 99.98% directly | Not applicable | Investment | ||||||||
Shengyi Jingsheng (i) | PRC | 99.98% directly | Not applicable | Investment | ||||||||
CG Investments | USA | 100.00% indirectly | RMB1,131 million | Investment | ||||||||
CL Guang De (ii) | PRC | 99.99% directly | Not applicable | Investment | ||||||||
CL Pension Industry (ii) | PRC | 99.95% directly | Not applicable | Investment | ||||||||
China Life Qihang Fund I (ii) | PRC | 99.90% directly | Not applicable | Investment | ||||||||
CL Xing Wan (ii) | PRC | 99.99% directly | Not applicable | Investment | ||||||||
CL Sales (i) | PRC | 99.98 % indirectly | Not applicable | Investment Insurance | ||||||||
CL Hangzhou Hotel (i) | PRC | 90.81%directly | RMB544 million | Agent Hotel | ||||||||
CL Jiayuan (i) | PRC | 99.99% directly | RMB65 million | Management Health | ||||||||
| (i) | The above subsidiaries are registered as limited companies in accordance of the Company Law of the People’s Republic of China. |
| (ii) | The above subsidiaries are registered as limited liability partnerships in accordance of the Law of the People’s Republic of China on Partnerships. |
Non-controlling interests in subsidiaries are not significant to the Company.
239
Notes to the Consolidated Financial Statements (continued)
For the year ended 31 December 2021
| 41 | STATEMENT OF FINANCIAL POSITION AND NOTES TO KEY ITEMS (continued) |
| (d) | Investments in subsidiaries (continued) |
| (ii) | The table below presents the basic information of the Company’s major consolidated structured entities as at 31 December 2021: |
Name | Percentage of shares held | Trust/investments received | Principal activities | |||||||
CL Asset - Yuanliu No.1 Insurance Asset Management Product | 58.69% directly | RMB75,716 million | Investment management | |||||||
CL Investment - China Eastern Airlines Group Equity | 100.00% directly | RMB11,000 million | Investment management | |||||||
China Life - China Hua Neng Debt-to-Equity Swap | 100.00% directly | RMB10,000 million | Investment management | |||||||
Shan Guo Tou • Jing Tou Corporate Trust Loan Collective Funds Trust Scheme | 100.00% directly | RMB10,000 million | Investment management | |||||||
Jiao Yin Guo Xin • China Aluminium Co., Ltd. Supply-side Reform Collective Fund Trust Scheme | 99.99% directly | RMB10,000 million | Investment management | |||||||
Jian Xin Trust - CL Guo Xin Collective Fund Trust Scheme | 99.99% directly | | RMB10,000 million | | | Investment management | | |||
Guang Da • Hui Ying No. 8 Collective Fund | 89.00% directly | RMB10,000 million | Investment management | |||||||
Bai Rui Heng Yi No.817 Collective Fund Trust Scheme (Zhong Guo Guo Xin) | 90.00% directly and indirectly | RMB10,000 million | Investment management | |||||||
Jiao Yin Guo Xin • CL Shanxi Coal Mining | 75.00% directly | RMB10,000 million | Investment management | |||||||
Debt-to-Equity Collective Funds Trust Scheme | and indirectly | |||||||||
Chongqing Trust Fund • Guo Rong No.4 Collective Fund | 85.00% directly | RMB9,996 million | Investment management | |||||||
Jiao Yin Guo Xin • Jing Tou Corporate | 91.95% directly | RMB9,982 million | Investment management | |||||||
Collective Funds | ||||||||||
China Life - Yanzhou Coal Mining Debt Investment | 100.00% directly | RMB9,000 million | Investment management | |||||||
Zhong Hang Trust Fund • Tian Qi [2020] No.372 China Eastern Airlines Equity Instrument Investment Collective Fund Trust Scheme | 99.99% directly | RMB9,000 million | Investment management | |||||||
Shang Xin - Ningbo Wu Lu Si Qiao PPP Collective Fund Trust Scheme | 88.02% directly | RMB8,758 million | Investment management | |||||||
Kun Lun Trust • China Metallurgical No.1 Collective Fund | 86.25% directly | RMB8,000 million | Investment management | |||||||
Jiang Su Trust •Xin Bao Sheng No.144 (Jing Tou) | 84.00% directly | RMB8,000 million | Investment management | |||||||
CL - Hua Neng International Development of Infrastructure Debt Investment Scheme | 88.61% directly | RMB7,900 million | Investment management | |||||||
CL - Dian Tou Clean Energy Equity Investment Scheme (series I) | 89.47% directly | RMB7,600 million | Investment management | |||||||
Zhong Xin Jin Cheng • Tianjin Port Group Loans Collective Fund Trust Scheme | 99.98% directly | RMB6,000 million | Investment management | |||||||
CL An Bao An Ji Half-year Debt Collective Fund Scheme | 89.15% directlyand indirectly | RMB6,166 million | Investment management | |||||||
CL Investment-COSCO Marine Debt Investment Scheme | 71.67% directly | RMB6,000 million | Investment management | |||||||
Guang Da • Hui Ying No. 11 Collective Fund Trust Scheme | 72.41% directly | RMB5,800 million | Investment management | |||||||
China Life - Tianjin Metro Infrastructure Debt Investment Scheme | 93.91% directly | RMB5,750 million | Investment management | |||||||
240
Notes to the Consolidated Financial Statements (continued)
For the year ended 31 December 2021
| 41 | STATEMENT OF FINANCIAL POSITION AND NOTES TO KEY ITEMS (continued) |
| (d) | Investments in subsidiaries (continued) |
| (ii) | The table below presents the basic information of the Company’s major consolidated structured entities as at 31 December 2021: (continued) |
Name | Percentage of shares held | Trust/investments received | Principal activities | |||
Bai Rui Fu Cheng No.424 Collective Fund Trust Scheme (Wu Han Metro) | 96.36% directly | RMB5,486 million | Investment management | |||
Kun Lun Trust • Tianjin Urban Communications Construction No. 1 Collective Fund Trust Scheme | 99.99% directly | RMB5,001 million | Investment management | |||
CL Investment — COSCO Marine Debt Investment Scheme (series II) | 100.00% directly | RMB5,000 million | Investment management | |||
Wu Kuang Trust — Xing Fu No.137 Collective Fund Trust Scheme | 90.00% directly | RMB5,000 million | Investment management |
| (e) | Investments in associates and joint ventures |
| 2021 RMB million | 2020 RMB million | |||||||
As at 1 January | 157,401 | 154,501 | ||||||
Investments in associates and joint ventures | 5,583 | 2,900 | ||||||
|
|
|
| |||||
As at 31 December | 162,984 | 157,401 | ||||||
|
|
|
| |||||
| (f) | Held-to-maturity securities |
| As at 31 December 2021 RMB million | As at 31 December 2020 RMB million | |||||||
Debt securities | ||||||||
Government bonds | 349,116 | 264,983 | ||||||
Government agency bonds | 910,151 | 617,515 | ||||||
Corporate bonds | 209,068 | 201,343 | ||||||
Subordinated bonds | 63,305 | 104,668 | ||||||
|
|
|
| |||||
Total | 1,531,640 | 1,188,509 | ||||||
|
|
|
| |||||
Debt securities | ||||||||
Listed in Mainland, PRC | 245,879 | 215,457 | ||||||
Unlisted | 1,285,761 | 973,052 | ||||||
|
|
|
| |||||
Total | 1,531,640 | 1,188,509 | ||||||
|
|
|
| |||||
Unlisted debt securities include those traded on the Chinese interbank market.
The estimated fair value of all held-to-maturity securities was RMB1,636,030 million as at 31 December 2021 (as at 31 December 2020: RMB1,224,617 million).
241
Notes to the Consolidated Financial Statements (continued)
For the year ended 31 December 2021
| 41 | STATEMENT OF FINANCIAL POSITION AND NOTES TO KEY ITEMS (continued) |
| (f) | Held-to-maturity securities (continued) |
As at 31 December 2021, no accumulated impairment loss for the investment of held-to-maturity securities has been recognised by the Company (as at 31 December 2020: same).
Debt securities – Contractual maturity schedule | As at 31 December 2021 RMB million | As at 31 December 2020 RMB million | ||||||
Maturing: | ||||||||
Within one year | 55,016 | 25,267 | ||||||
After one year but within five years | 147,684 | 146,287 | ||||||
After five years but within ten years | 163,348 | 205,928 | ||||||
After ten years | 1,165,592 | 811,027 | ||||||
|
|
|
| |||||
Total | 1,531,640 | 1,188,509 | ||||||
|
|
|
| |||||
| (g) | Loans |
| As at 31 December 2021 RMB million | As at 31 December 2020 RMB million | |||||||
Policy loans | 236,209 | 200,730 | ||||||
Other loans | 414,608 | 440,562 | ||||||
|
|
|
| |||||
Total | 650,817 | 641,292 | ||||||
Impairment | (3,819 | ) | (2,443 | ) | ||||
|
|
|
| |||||
Net value | 646,998 | 638,849 | ||||||
|
|
|
| |||||
| As at 31 December 2021 RMB million | As at 31 December 2020 RMB million | |||||||
Maturing: | ||||||||
Within one year | 348,708 | 231,084 | ||||||
After one year but within five years | 168,954 | 279,286 | ||||||
After five years but within ten years | 101,456 | 103,666 | ||||||
After ten years | 31,699 | 27,256 | ||||||
|
|
|
| |||||
Total | 650,817 | 641,292 | ||||||
|
| |||||||
Impairment | (3,819 | ) | (2,443 | ) | ||||
|
|
|
| |||||
Net value | 646,998 | 638,849 | ||||||
|
|
|
| |||||
242
Notes to the Consolidated Financial Statements (continued)
For the year ended 31 December 2021
| 41 | STATEMENT OF FINANCIAL POSITION AND NOTES TO KEY ITEMS (continued) |
| (h) | Term deposits |
| As at 31 December 2021 RMB million | As at 31 December 2020 RMB million | |||||||
Maturing: | ||||||||
Within one year | 127,401 | 60,324 | ||||||
After one year but within five years | 363,931 | 459,822 | ||||||
After five years but within ten years | — | 1,740 | ||||||
|
|
|
| |||||
Total | 491,332 | 521,886 | ||||||
|
|
|
| |||||
As at 31 December 2021, the Company’s term deposits of RMB750 million (as at 31 December 2020: RMB750 million) were deposited in banks to back overseas borrowings and are restricted to use. Please refer to Note 10.3 for the details.
| (i) | Statutory deposits – restricted |
| As at 31 December 2021 RMB million | As at 31 December 2020 RMB million | |||||||
Contractual maturity schedule: | ||||||||
Within one year | 1,600 | — | ||||||
After one year but within five years | 4,053 | 5,653 | ||||||
|
|
|
| |||||
Total | 5,653 | 5,653 | ||||||
|
|
|
| |||||
Insurance companies in China are required to deposit an amount that equals to 20% of their registered capital with banks in compliance with regulations of the CBIRC. These funds may not be used for any purpose other than for paying off debts during liquidation proceedings.
243
Notes to the Consolidated Financial Statements (continued)
For the year ended 31 December 2021
| 41 | STATEMENT OF FINANCIAL POSITION AND NOTES TO KEY ITEMS (continued) |
| (j) | Available-for-sale securities |
| As at 31 December 2021 RMB million | As at 31 December 2020 RMB million | |||||||
Available-for-sale securities, at fair value | ||||||||
Debt securities | ||||||||
Government bonds | 58,446 | 49,148 | ||||||
Government agency bonds | 258,864 | 168,912 | ||||||
Corporate bonds | 201,911 | 134,513 | ||||||
Subordinated bonds | 111,029 | 81,795 | ||||||
Others (i) | 149,151 | 130,734 | ||||||
|
|
|
| |||||
Subtotal | 779,401 | 565,102 | ||||||
|
|
|
| |||||
Equity securities | ||||||||
Funds | 93,312 | 96,308 | ||||||
Common stocks | 256,291 | 301,106 | ||||||
Preferred stocks | 52,127 | 53,778 | ||||||
Wealth management products | 5,005 | 13,013 | ||||||
Others (i) | 163,620 | 137,287 | ||||||
|
|
|
| |||||
Subtotal | 570,355 | 601,492 | ||||||
|
|
|
| |||||
Available-for-sale securities, at cost | ||||||||
Equity securities | ||||||||
Others (i) | 20,279 | 20,559 | ||||||
|
|
|
| |||||
Total | 1,370,035 | 1,187,153 | ||||||
|
|
|
| |||||
| (i) | Other available-for-sale securities mainly include unlisted equity investments, private equity funds and perpetual bonds. |
| As at 31 December 2021 RMB million | As at 31 December 2020 RMB million | |||||||
Debt securities | ||||||||
Listed in Mainland, PRC | 85,531 | 41,466 | ||||||
Unlisted | 693,870 | 523,636 | ||||||
|
|
|
| |||||
Subtotal | 779,401 | 565,102 | ||||||
|
|
|
| |||||
Equity securities | ||||||||
Listed in Mainland, PRC | 237,305 | 199,859 | ||||||
Listed in Hong Kong, PRC | 75,694 | 108,493 | ||||||
Listed overseas | 28 | 278 | ||||||
Unlisted | 277,607 | 313,421 | ||||||
|
|
|
| |||||
Subtotal | 590,634 | 622,051 | ||||||
|
|
|
| |||||
Total | 1,370,035 | 1,187,153 | ||||||
|
|
|
| |||||
Unlisted debt securities include those traded on the Chinese interbank market and those not publicly traded. Unlisted equity securities include those not traded on stock exchanges, which are mainly open-ended funds with public market price quotations, wealth management products and private equity funds.
244
Notes to the Consolidated Financial Statements (continued)
For the year ended 31 December 2021
| 41 | STATEMENT OF FINANCIAL POSITION AND NOTES TO KEY ITEMS (continued) |
| (j) | Available-for-sale securities (continued) |
Debt securities – Contractual maturity schedule | As at 31 December 2021 RMB million | As at 31 December 2020 RMB million | ||||||
Maturing: | ||||||||
Within one year | 35,510 | 36,802 | ||||||
After one year but within five years | 174,433 | 124,578 | ||||||
After five years but within ten years | 313,145 | 266,057 | ||||||
After ten years | 256,313 | 137,665 | ||||||
|
|
|
| |||||
Total | 779,401 | 565,102 | ||||||
|
|
|
| |||||
| (k) | Securities at fair value through profit or loss |
| As at 31 December 2021 RMB million | As at 31 December 2020 RMB million | |||||||
Debt securities | ||||||||
Government bonds | 1,156 | 1,469 | ||||||
Government agency bonds | 5,851 | 2,715 | ||||||
Corporate bonds | 62,009 | 68,569 | ||||||
Others | 7,143 | 1,485 | ||||||
|
|
|
| |||||
Subtotal | 76,159 | 74,238 | ||||||
|
|
|
| |||||
Equity securities | ||||||||
Funds | 12,229 | 9,771 | ||||||
Common stocks | 31,537 | 43,133 | ||||||
Others | 266 | 262 | ||||||
|
|
|
| |||||
Subtotal | 44,032 | 53,166 | ||||||
|
|
|
| |||||
Total | 120,191 | 127,404 | ||||||
|
|
|
| |||||
Debt securities | ||||||||
Listed in Mainland, PRC | 23,252 | 26,132 | ||||||
Listed overseas | 231 | 217 | ||||||
Unlisted | 52,676 | 47,889 | ||||||
|
|
|
| |||||
Subtotal | 76,159 | 74,238 | ||||||
|
|
|
| |||||
Equity securities | ||||||||
Listed in Mainland, PRC | 28,118 | 39,540 | ||||||
Listed in Hong Kong, PRC | 56 | 64 | ||||||
Listed overseas | 4,849 | 4,213 | ||||||
Unlisted | 11,009 | 9,349 | ||||||
|
|
|
| |||||
Subtotal | 44,032 | 53,166 | ||||||
|
|
|
| |||||
Total | 120,191 | 127,404 | ||||||
|
|
|
| |||||
Unlisted debt securities include those traded on the Chinese interbank market and those not publicly traded. Unlisted equity securities include those not traded on stock exchanges, which are mainly open-ended funds with public market price quotations.
245
Notes to the Consolidated Financial Statements (continued)
For the year ended 31 December 2021
| 41 | STATEMENT OF FINANCIAL POSITION AND NOTES TO KEY ITEMS (continued) |
| (l) | Securities purchased under agreements to sell |
| As at 31 December 2021 RMB million | As at 31 December 2020 RMB million | |||||||
Maturing: | ||||||||
Within 30 days | 3,463 | 5,888 | ||||||
|
|
|
| |||||
Total | 3,463 | 5,888 | ||||||
|
|
|
| |||||
| (m) | Accrued investment income |
| As at 31 December 2021 RMB million | As at 31 December 2020 RMB million | |||||||
Bank deposits | 12,124 | 12,298 | ||||||
Debt securities | 30,761 | 26,093 | ||||||
Others | 6,832 | 6,191 | ||||||
|
|
|
| |||||
Total | 49,717 | 44,582 | ||||||
|
|
|
| |||||
Current | 47,674 | 43,602 | ||||||
Non-current | 2,043 | 980 | ||||||
|
|
|
| |||||
Total | 49,717 | �� | 44,582 | |||||
|
|
|
| |||||
| (n) | Other assets |
| As at 31 December 2021 RMB million | As at 31 December 2020 RMB million | |||||||
Investments receivable and prepaid | 9,129 | 1,554 | ||||||
Land use rights | 7,479 | 7,509 | ||||||
Disbursements | 5,324 | 5,349 | ||||||
Automated policy loans | 3,673 | 3,522 | ||||||
Tax prepaid | 2,686 | 2,257 | ||||||
Due from related parties | 590 | 714 | ||||||
Others | 4,940 | 3,574 | ||||||
|
|
|
| |||||
Total | 33,821 | 24,479 | ||||||
|
|
|
| |||||
Current | 26,222 | 16,907 | ||||||
Non-current | 7,599 | 7,572 | ||||||
|
|
|
| |||||
Total | 33,821 | 24,479 | ||||||
|
|
|
| |||||
246
Notes to the Consolidated Financial Statements (continued)
For the year ended 31 December 2021
| 41 | STATEMENT OF FINANCIAL POSITION AND NOTES TO KEY ITEMS (continued) |
| (o) | Deferred tax |
| (i) | The movements in deferred tax assets and liabilities during the year are as follows: |
Deferred tax assets/(liabilities)
| Insurance RMB million | Investments RMB million | Others RMB million | Total RMB million | |||||||||||||
As at 1 January 2020 | 1,557 | (15,077 | ) | 2,630 | (10,890 | ) | ||||||||||
(Charged)/Credited to net profit | 1,787 | 1,710 | (84 | ) | 3,413 | |||||||||||
(Charged)/Credited to other comprehensive income | ||||||||||||||||
– Available-for-sale securities | — | (9,422 | ) | — | (9,422 | ) | ||||||||||
– Portion of fair value changes on available-for- sale securities attributable to participating policyholders | 990 | — | — | 990 | ||||||||||||
|
|
|
|
|
|
|
| |||||||||
As at 31 December 2020 | 4,334 | (22,789 | ) | 2,546 | (15,909 | ) | ||||||||||
|
|
|
|
|
|
|
| |||||||||
As at 1 January 2021 | 4,334 | (22,789 | ) | 2,546 | (15,909 | ) | ||||||||||
(Charged)/Credited to net profit | 2,862 | 4,261 | 344 | 7,467 | ||||||||||||
(Charged)/Credited to other comprehensive income | ||||||||||||||||
– Available-for-sale securities | — | 1,413 | — | 1,413 | ||||||||||||
– Portion of fair value changes on available-for- sale securities attributable to participating policyholders | 448 | — | — | 448 | ||||||||||||
|
|
|
|
|
|
|
| |||||||||
As at 31 December 2021 | 7,644 | (17,115 | ) | 2,890 | (6,581 | ) | ||||||||||
|
|
|
|
|
|
|
| |||||||||
| (ii) | The analysis of deferred tax assets and deferred tax liabilities during the year is as follows: |
| As at 31 December 2021 RMB million | As at 31 December 2020 RMB million | |||||||
Deferred tax assets: | ||||||||
– deferred tax assets to be recovered after 12 months | 13,832 | 10,051 | ||||||
– deferred tax assets to be recovered within 12 months | 7,358 | 6,006 | ||||||
|
|
|
| |||||
Subtotal | 21,190 | 16,057 | ||||||
|
|
|
| |||||
Deferred tax liabilities: | ||||||||
– deferred tax liabilities to be settled after 12 months | (25,141 | ) | (27,921 | ) | ||||
– deferred tax liabilities to be settled within 12 months | (2,630 | ) | (4,045 | ) | ||||
|
|
|
| |||||
Subtotal | (27,771 | ) | (31,966 | ) | ||||
|
|
|
| |||||
Net deferred tax liabilities | (6,581 | ) | (15,909 | ) | ||||
|
|
|
| |||||
247
Notes to the Consolidated Financial Statements (continued)
For the year ended 31 December 2021
| 41 | STATEMENT OF FINANCIAL POSITION AND NOTES TO KEY ITEMS (continued) |
| (p) | Securities sold under agreements to repurchase |
| As at 31 December 2021 RMB million | As at 31 December 2020 RMB million | |||||||
Interbank market | 176,924 | 95,901 | ||||||
Stock exchange market | 55,572 | 20,683 | ||||||
|
|
|
| |||||
Total | 232,496 | 116,584 | ||||||
|
|
|
| |||||
Maturing: | ||||||||
Within 30 days | 230,421 | 116,436 | ||||||
After 30 days within 90 days | 2,075 | 140 | ||||||
After 90 days | — | 8 | ||||||
|
|
|
| |||||
Total | 232,496 | 116,584 | ||||||
|
|
|
| |||||
As at 31 December 2021, bonds with a carrying value of RMB194,593 million (as at 31 December 2020: RMB111,233 million) were pledged as collateral for financial assets sold under agreements to repurchase resulted from repurchase transactions entered into by the Company in the interbank market.
For debt repurchase transactions through the stock exchange, the Company is required to deposit certain exchange-traded bonds into a collateral pool with fair value converted at a standard rate pursuant to the stock exchange’s regulation which should be no less than the balance of the related repurchase transaction. As at 31 December 2021, the carrying value of securities deposited in the collateral pool was RMB292,323 million (as at 31 December 2020: RMB250,407 million). The collateral is restricted from trading during the period of the repurchase transaction.
| (q) | Other liabilities |
| As at 31 December 2021 RMB million | As at 31 December 2020 RMB million | |||||||
Interest payable to policyholders | 17,866 | 16,139 | ||||||
Salary and welfare payable | 11,500 | 10,060 | ||||||
Brokerage and commission payable | 5,351 | 7,051 | ||||||
Payable to constructors | 2,324 | 2,410 | ||||||
Agency deposits | 1,467 | 1,811 | ||||||
Interest payable of debt instruments | 1,271 | 1,249 | ||||||
Tax payable | 434 | 634 | ||||||
Stock appreciation rights (Note 32) | 291 | 493 | ||||||
Others | 20,983 | 19,372 | ||||||
|
|
|
| |||||
Total | 61,487 | 59,219 | ||||||
|
|
|
| |||||
Current | 61,487 | 59,219 | ||||||
Non-current | — | — | ||||||
|
|
|
| |||||
Total | 61,487 | 59,219 | ||||||
|
|
|
| |||||
248
Notes to the Consolidated Financial Statements (continued)
For the year ended 31 December 2021
| 41 | STATEMENT OF FINANCIAL POSITION AND NOTES TO KEY ITEMS (continued) |
| (r) | Reserves |
| Share premium RMB million | Other reserves RMB million | Unrealised gains/(losses) from available-for-sale securities RMB million | Statutory reserve fund RMB million | Discretionary reserve fund RMB million | General reserve RMB million | Total RMB million | ||||||||||||||||||||||
As at 1 January 2020 | 53,860 | — | 27,891 | 40,468 | 34,645 | 37,304 | 194,168 | |||||||||||||||||||||
Other comprehensive income for the year | — | — | 25,297 | — | — | — | 25,297 | |||||||||||||||||||||
Appropriation to reserves | — | — | — | 5,009 | 5,857 | 5,009 | 15,875 | |||||||||||||||||||||
Others | — | (1,269 | ) | — | — | — | — | (1,269 | ) | |||||||||||||||||||
|
|
|
|
|
|
|
|
|
|
|
|
|
| |||||||||||||||
As at 31 December 2020 | 53,860 | (1,269 | ) | 53,188 | 45,477 | 40,502 | 42,313 | 234,071 | ||||||||||||||||||||
|
|
|
|
|
|
|
|
|
|
|
|
|
| |||||||||||||||
As at 1 January 2021 | 53,860 | (1,269 | ) | 53,188 | 45,477 | 40,502 | 42,313 | 234,071 | ||||||||||||||||||||
Other comprehensive income for the year | — | — | (5,584 | ) | — | — | — | (5,584 | ) | |||||||||||||||||||
Appropriation to reserves | — | — | — | 5,096 | 5,009 | 5,096 | 15,201 | |||||||||||||||||||||
Others | (500 | ) | (112 | ) | — | — | — | — | (612 | ) | ||||||||||||||||||
|
|
|
|
|
|
|
|
|
|
|
|
|
| |||||||||||||||
As at 31 December 2021 | 53,360 | (1,381 | ) | 47,604 | 50,573 | 45,511 | 47,409 | 243,076 | ||||||||||||||||||||
|
|
|
|
|
|
|
|
|
|
|
|
|
| |||||||||||||||
| (s) | Provisions and contingencies |
The following is a summary of the significant contingent liabilities:
| As at 31 December 2021 RMB million | As at 31 December 2020 RMB million | |||||||
Pending lawsuits | 506 | 403 | ||||||
|
|
|
| |||||
249
Notes to the Consolidated Financial Statements (continued)
For the year ended 31 December 2021
| 41 | STATEMENT OF FINANCIAL POSITION AND NOTES TO KEY ITEMS (continued) |
| (t) | Commitments |
| (i) | Capital commitments |
Capital commitments of the Company relating to property development projects and investments:
| As at 31 December 2021 RMB million | As at 31 December 2020 RMB million | |||||||
Contracted, but not provided for | ||||||||
Investments | 112,194 | 94,586 | ||||||
Property, plant and equipment | 1,485 | 3,051 | ||||||
|
|
|
| |||||
Total | 113,679 | 97,637 | ||||||
|
|
|
| |||||
| (ii) | Operating lease commitments |
As lessor, the future minimum rentals receivable under non-cancellable operating leases are as follows:
| As at 31 December 2021 RMB million | As at 31 December 2020 RMB million | |||||||
Not later than one year | 548 | 553 | ||||||
Later than one year but not later than five years | 833 | 953 | ||||||
Later than five years | 142 | 162 | ||||||
|
|
|
| |||||
Total | 1,523 | 1,668 | ||||||
|
|
|
| |||||
250
Notes to the Consolidated Financial Statements (continued)
For the year ended 31 December 2021
| 42 | DIRECTORS’, SUPERVISORS’, CHIEF EXECUTIVE’S AND SENIOR MANAGEMENT’S REMUNERATION |
The total compensation package for the directors, supervisors, chief executive and senior management for the year ended 31 December 2021 in accordance with the related measures for compensation management of the Company has not yet been finalised. The amount of the compensation not provided for is not expected to have a significant impact on the Group’s 2021 consolidated financial statements. The final compensation will be disclosed in a separate announcement when determined.
| (a) | Directors’ and chief executive’s emoluments |
The aggregate amounts of emoluments paid to directors and chief executive of the Company for the year ended 31 December 2021 are as follows:
| Name | Remuneration paid | Benefits in kind | Pension scheme contributions | Total | ||||||||||||
| RMB thousand | ||||||||||||||||
Su Hengxuan (i) | — | — | — | — | ||||||||||||
Li Mingguang | 1,253.0 | 160.0 | 98.0 | 1,511.0 | ||||||||||||
Huang Xiumei (iii) | 626.5 | 70.5 | 49.7 | 746.7 | ||||||||||||
Yuan Changqing (ii) | — | — | — | — | ||||||||||||
Yin Zhaojun (iv) | — | — | — | — | ||||||||||||
Liu Huimin (iv) | — | — | — | — | ||||||||||||
Wang Junhui (ii) | — | — | — | — | ||||||||||||
Lam Chi Kuen (v) | 210.0 | — | — | 210.0 | ||||||||||||
Zhai Haitao (v) | 70.0 | — | — | 70.0 | ||||||||||||
Tang Xin | 370.0 | — | — | 370.0 | ||||||||||||
Leung Oi-Sie Elsie | 360.0 | — | — | 360.0 | ||||||||||||
Chang Tso Tung Stephen (vi) | 160.0 | — | — | 160.0 | ||||||||||||
Robinson Drake Pike (vi) | 300.0 | — | — | 300.0 | ||||||||||||
| (i) | Su Hengxuan did not receive remuneration from the Company. |
| (ii) | Yuan Changqing, Wang Donghui and other non-executive directors did not receive remuneration from the Company. |
| (iii) | Huang Xiumei was appointed as executive director in July 2021. |
| (iv) | Yin Zhaojun, Liu Huimin resigned as non-executive director in January 2021 and February 2021. |
| (v) | Lam Chi Kuen, Zhai Haitao were appointed as independent director in June 2021 and October 2021. |
| (vi) | Chang Tso Tung Stephen resigned as independent director in October 2020 and continued to perform as independent director until June 2021; Robinson Drake Pike resigned as independent director in June 2021 and continued to perform as independent director until October 2021. |
| (vii) | Wang Bin did not receive remuneration from the Company and resigned as chairman and executive director in February 2022. |
| (viii) | The above remuneration was calculated based on the relevant employment period during the reporting period. |
251
Notes to the Consolidated Financial Statements (continued)
For the year ended 31 December 2021
| 42 | DIRECTORS’, SUPERVISORS’, CHIEF EXECUTIVE’S AND SENIOR MANAGEMENT’S REMUNERATION (continued) |
| (a) | Directors’ and chief executive’s emoluments (continued) |
The aggregate amounts of emoluments paid to directors and chief executive of the Company for the year ended 31 December 2020 are as follows:
| Name | Basic salaries | Performance related bonuses | Subtotal of salary income | Deferred payment included in salary income | Benefits in kind | Pension scheme contributions | Total | Deferred payment included in total | Actual paid included in total | |||||||||||||||||||||||||||
| RMB thousand | ||||||||||||||||||||||||||||||||||||
Su Hengxuan (i) Li | — | — | — | — | — | — | — | — | — | |||||||||||||||||||||||||||
Mingguang Zhao | 1,253.0 | 1,253.0 | 2,506.0 | 751.8 | 139.9 | 86.1 | 2,732.0 | 751.8 | 1,980.2 | |||||||||||||||||||||||||||
Peng (iii) | — | — | — | — | — | — | — | — | — | |||||||||||||||||||||||||||
Yuan Changqing (ii) Liu | — | — | — | — | — | — | — | — | — | |||||||||||||||||||||||||||
Huimin (ii) | — | — | — | — | — | — | — | — | — | |||||||||||||||||||||||||||
Yin Zhaojun (ii) | — | — | — | — | — | — | — | — | — | |||||||||||||||||||||||||||
Wang Junhui (ii) | — | — | — | — | — | — | — | — | — | |||||||||||||||||||||||||||
Chang Tso Tung Stephen (iv) | 250.0 | 70.0 | 320.0 | — | — | — | 320.0 | — | 320.0 | |||||||||||||||||||||||||||
Robinson Drake Pike | 250.0 | 70.0 | 320.0 | — | — | — | 320.0 | — | 320.0 | |||||||||||||||||||||||||||
Tang Xin | 250.0 | 70.0 | 320.0 | — | — | — | 320.0 | — | 320.0 | |||||||||||||||||||||||||||
Leung Oi-Sie Elsie | 250.0 | 50.0 | 300.0 | — | — | — | 300.0 | — | 300.0 | |||||||||||||||||||||||||||
| (i) | Su Hengxuan did not receive remuneration from the Company. |
| (ii) | Yuan Changqing, Wang Donghui and other non-executive directors did not receive remuneration from the Company. |
| (iii) | Zhao Peng was appointed as executive director from February to April 2020. He did not receive remuneration from the Company. |
| (iv) | Chang Tso Tung Stephen resigned as independent director on 19 October 2020. He continued to perform as independent director until 28 June 2021, when the qualification of new independent director was approved by CBIRC. |
| (v) | Wang Bin did not receive remuneration from the Company and resigned as chairman and executive director in February 2022. |
| (v) | The above remuneration was calculated based on the relevant employment period during the reporting period. |
The compensation amounts disclosed above for these directors and the chief executive for the year ended 31 December 2020 were restated based on the finalised amounts determined during 2021.
The directors and chief executive received the compensation amounts disclosed above during their term of office in 2021 and 2020.
In addition to the directors’ emoluments disclosed above, certain directors of the Company received emoluments from CLIC, the amounts of which were not apportioned between their services to the Company and their services to CLIC.
252
Notes to the Consolidated Financial Statements (continued)
For the year ended 31 December 2021
| 42 | DIRECTORS’, SUPERVISORS’, CHIEF EXECUTIVE’S AND SENIOR MANAGEMENT’S REMUNERATION (continued) |
| (b) | Supervisors’ emoluments |
The aggregate amounts of emoluments paid to supervisors of the Company for the year ended 31 December 2021 are as follows:
| Name | Remuneration paid | Benefits in kind | Pension scheme contributions | Total | ||||||||||||
| RMB thousand | ||||||||||||||||
Jia Yuzeng | 1,253.0 | 139.5 | 98.0 | 1,490.5 | ||||||||||||
Han Bing (i) | 250.6 | 49.0 | 58.5 | 358.1 | ||||||||||||
Cao Qingyang | 690.0 | 114.8 | 139.6 | 944.4 | ||||||||||||
Wang Xiaoqing | 601.4 | 113.4 | 127.5 | 842.3 | ||||||||||||
Lai Jun (ii) | 112.9 | 19.7 | 21.2 | 153.8 | ||||||||||||
Niu Kailong (ii) | — | — | — | — | ||||||||||||
| (i) | Han Bing resigned as shareholder representative supervisor in October 2021. |
| (ii) | Lai Jun and Niu Kailong were appointed as employee representative supervisor and shareholder representative supervisor in October 2021. Niu Kailong did not receive remuneration from the Company. |
| (iii) | The above remuneration was calculated based on the relevant employment period during the reporting period. |
The aggregate amounts of emoluments paid to supervisors of the Company for the year ended 31 December 2020 are as follows:
| Name | Basic salaries | Performance related bonuses | Subtotal of salary income | Deferred payment included in salary income | Benefits in kind | Pension scheme contributions | Total | Deferred payment included in total | Actual paid included in total | |||||||||||||||||||||||||||
| RMB thousand | ||||||||||||||||||||||||||||||||||||
Jia Yuzeng Han | 1,432.0 | 1,432.0 | 2,864.0 | 859.2 | 139.4 | 86.1 | 3,089.5 | 859.2 | 2,230.3 | |||||||||||||||||||||||||||
Bing | 505.5 | 976.2 | 1,481.7 | — | 207.3 | 129.7 | 1,818.7 | — | 1,818.7 | |||||||||||||||||||||||||||
Cao Qingyang | 593.6 | 959.3 | 1,552.9 | — | 207.9 | 127.6 | 1,888.4 | — | 1,888.4 | |||||||||||||||||||||||||||
Wang Xiaoqing | 518.4 | 940.1 | 1,458.5 | — | 206.9 | 115.6 | 1,781.0 | — | 1,781.0 | |||||||||||||||||||||||||||
Luo Zhaohui (i) | — | — | — | — | — | — | — | — | — | |||||||||||||||||||||||||||
Song Ping (ii) | 42.1 | 74.7 | 116.8 | 29.9 | 20.2 | 8.5 | 145.5 | 29.9 | 115.6 | |||||||||||||||||||||||||||
| (i) | Luo Zhaohui resigned as shareholder representative supervisor in July 2020 and did not receive remuneration from the Company. |
| (ii) | Song Ping resigned as employee representative supervisor in January 2020. |
| (iii) | The above remuneration was calculated based on the relevant employment period during the reporting period. |
The compensation amounts disclosed above for these supervisors for the year ended 31 December 2020 were restated based on the finalised amounts determined during 2021.
The supervisors received the compensation amounts disclosed above during their term of office in 2021 and 2020.
253
Notes to the Consolidated Financial Statements (continued)
For the year ended 31 December 2021
| 42 | DIRECTORS’, SUPERVISORS’, CHIEF EXECUTIVE’S AND SENIOR MANAGEMENT’S REMUNERATION (continued) |
| (c) | Five highest paid individuals |
For the year ended 31 December 2021, the five individuals whose emoluments were the highest in the Company include one director and one supervisor (2020: one director and one supervisor).
Details of the remuneration of the five highest paid individuals are as follows:
| 2021 RMB thousand | 2020 RMB thousand | |||||||
Basic salaries, housing allowances, other allowances and benefits in kind | 6,985.3 | 13,940.1 | ||||||
Pension scheme contributions | 490.2 | 430.5 | ||||||
|
|
|
| |||||
Total | 7,475.5 | 14,370.6 | ||||||
|
|
|
| |||||
The emoluments fell within the following bands:
| Number of individuals For the year ended 31 December | ||||||||
| 2021 | 2020 | |||||||
RMB0 – RMB1,000,000 | — | — | ||||||
RMB1,000,001 – RMB2,000,000 | 5 | — | ||||||
RMB2,000,001 – RMB3,000,000 | — | 3 | ||||||
RMB3,000,001 – RMB4,000,000 | — | 2 | ||||||
RMB4,000,001 – RMB4,500,000 | — | — | ||||||
For the year ended 31 December 2021, no emoluments were paid by the Company to the directors, chief executive, supervisors or any of the five highest paid individuals as an inducement to join or upon joining the Company or compensation for loss of office as a director of any member of the Group or of any other office in connection with the management (2020: nil).
The emoluments of the five highest paid individuals are the total emoluments paid to them during the year.
There was no arrangement under which a director, chief executive or supervisor waived or agreed to waive any remuneration during the year.
254

In case of any discrepancy between the Chinese version and the English version of this report, the Chinese version shall prevail; in case of any discrepancy between the printed version and the website version of this report, the website version shall prevail.
China Life Insurance Company Limited Office Address : 16 Financial Street, Xicheng District, Beijing, P. R. China Telephone : 86-10-63633333 Website : www.e-chinalife.com E-mail : ir@e-chinalife.com TM FSC www.fsc.org MIX Paper from responsible sources FSCTM C019970