QuickLinks -- Click here to rapidly navigate through this document
Filed Pursuant to Rule 424(b)(1)
Registration No. 333-133872
Prospectus
4,590,258 Shares

Reddy Ice Holdings, Inc.
Common Stock
The selling stockholders identified in this prospectus, including affiliates of Bear, Stearns & Co. Inc., an underwriter participating in this offering, and certain of our executive officers, are offering 4,590,258 shares. We will not receive any of the proceeds from the sale of shares being sold in this offering.
Our common stock is listed on the New York Stock Exchange under the trading symbol "FRZ". On May 23, 2006, the last reported sale price of our common stock was $21.55 per share.
Investing in our common stock involves risks. See "Risk Factors" beginning on page 8.
| | Per Share | Total | | |||||
|---|---|---|---|---|---|---|---|---|
| Public Offering Price | $ | 21.55 | $ | 98,920,059.90 | ||||
Underwriting Discount | $ | 1.0775 | $ | 4,946,003.00 | ||||
Proceeds to the Selling Stockholders | $ | 20.4725 | $ | 93,974,056.90 | ||||
Certain of the selling stockholders have granted the underwriters a 30-day option to purchase up to 688,539 additional shares to cover any over-allotments.
Delivery of shares will be made on or about May 30, 2006.
Neither the Securities and Exchange Commission nor any state securities commission has approved or disapproved of these securities or passed upon the adequacy or accuracy of this prospectus. Any representation to the contrary is a criminal offense.
| Bear, Stearns & Co. Inc. | Lehman Brothers |
| Goldman, Sachs & Co. | Wachovia Securities | Piper Jaffray | ||
Morgan Keegan & Company, Inc. | ||||
The date of this prospectus is May 23, 2006.
You should rely only on information contained in this prospectus. We have not authorized anyone to provide you with different information. We are not making an offer of these securities in any state where the offer is not permitted. You should not assume that the information contained in this prospectus is accurate as of any date other than the date on the front of this prospectus.
"Reddy Ice" and the logo set forth on the cover of this prospectus are our registered trademarks in the United States.
i
The following is a summary of information set forth throughout this prospectus and should be read together with the more detailed information and the financial statements and the related notes included elsewhere in this prospectus. See "Risk Factors" for factors that you should consider before investing in our common stock and "Forward-Looking Statements" for information relating to statements contained in this prospectus that are not historical facts. In this prospectus, unless otherwise noted, (1) the words "Company," "we," "our," "ours" and "us" refer to Reddy Ice Group, Inc., formerly known as Packaged Ice, Inc., and its subsidiaries for periods through August 14, 2003 and to Reddy Ice Holdings, Inc. and its subsidiaries for periods subsequent to August 14, 2003, (2) "Reddy Group" refers to Reddy Ice Group, Inc., formerly known as Packaged Ice, Inc., and not its subsidiaries, and (3) "Reddy Holdings" refers to Reddy Ice Holdings, Inc. and not its subsidiaries.
Our Company
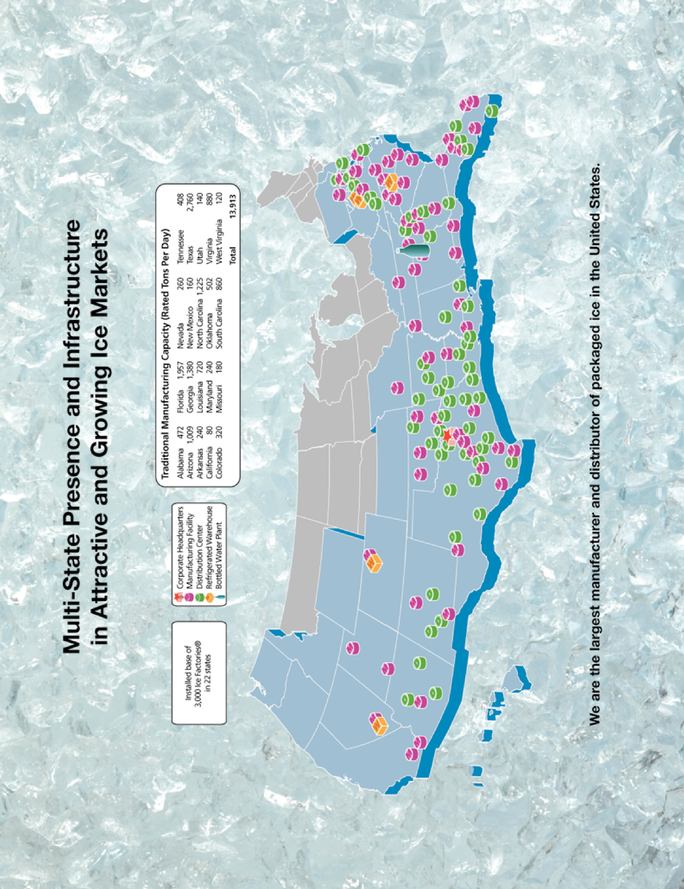
We are the largest manufacturer and distributor of packaged ice in the United States, serving approximately 82,000 customer locations in 31 states and the District of Columbia under the Reddy Ice™ brand name. Our principal product is ice packaged in seven to fifty pound bags, which we sell to a highly diversified customer base, including supermarkets, mass merchants and convenience stores. In 2005, we sold approximately 1.9 million tons of ice. Our products are primarily sold throughout the southern United States (the "Sun Belt"), one of the most attractive regions in the country for packaged ice sales due to warm weather, extended peak selling seasons and favorable population growth patterns. Population growth is one of the primary drivers for growth in demand for packaged ice, and we operate in many of the fastest growing metropolitan areas in the United States. In addition, our broad geographic reach helps insulate us from the impact of cool or rainy weather in any particular region. No other manufacturer and distributor of packaged ice in the United States has the geographic presence, infrastructure and capacity necessary to meet the multi-state demands of customers in our markets.
Our business is characterized by consistent annual customer demand, attractive margins and modest annual capital requirements. Based on our past experience, retail consumer demand for packaged ice is relatively unaffected by adverse economic conditions due to its low cost and the lack of readily available substitutes. In 2005, we had revenues, Adjusted EBITDA and a net loss of $319.8 million, $84.8 million and $12.1 million, respectively. For the three months ended March 31, 2006, we had revenues, Adjusted EBITDA and a net loss of $44.8 million, $0.5 million, and $8.2 million, respectively. For the definition of Adjusted EBITDA and a reconciliation of net income (loss) to EBITDA and EBITDA to Adjusted EBITDA, see "Summary Historical Financial Data".
We operate in two business segments: ice products and non-ice products and operations. Ice products accounted for approximately 95% of our total revenues in 2005. This segment consists of the traditional manufacture and delivery of ice from a central point of production to the point of sale as well as sales from The Ice Factory® machines, our proprietary equipment located in our customers' high volume locations that produce, package and store ice through an automated, self-contained process. In 2005, traditional ice manufacturing and Ice Factory sales accounted for approximately 90% and 10% of our ice segment revenues, respectively. Non-ice products and operations consists of refrigerated warehousing and the manufacture and sale of bottled water.
We have built a strong and loyal customer base by providing a high level of service and quality at competitive prices utilizing our extensive network of ice manufacturing plants and distribution centers. We have a diverse customer base and long-standing relationships with our customers across all major retail channels as evidenced by our high retention rates with prominent supermarkets, mass merchants and convenience stores such as Albertson's, Circle-K, ExxonMobil, Food Lion, Kroger, 7-Eleven and Wal-Mart. Our largest customer, Wal-Mart and Sam's Club on a combined basis, accounted for approximately 11% of our revenues in 2005 and the three months ended March 31, 2006, and approximately 10% of our revenues in 2004. Most of our major customers, including nineteen of our top twenty retail ice customers in terms of revenues, have purchased ice from us and our predecessor companies for over a decade. Within our markets, we are the sole supplier of packaged ice to the majority of our top twenty retail ice customers. The percentage of our total revenues derived from and volume sold to national and regional convenience and grocery store chains has grown over the last several years as each of these retail channels has consolidated. We have benefited from supplying these national and regional retailers as many of these customers have grown at rates in excess of industry averages.
1
At March 31, 2006, we owned or operated 58 ice manufacturing facilities, 54 distribution centers, approximately 79,000 merchandisers (cold storage units installed at customer locations), approximately 3,000 Ice Factories, five refrigerated warehouses and one bottled water plant. As of the same date, we had an aggregate daily ice manufacturing capacity of approximately 17,000 tons. We acquired 11 businesses in 2004, two businesses in 2005 and three businesses in the first four months of 2006.
Competitive Strengths
We believe our competitive strengths include:
- •
- Stable and Predictable Cash Flow Generation as a result of our recent acquisitions, limited working capital needs and modest capital expenditure requirements going forward.
- •
- Multi-State Presence and Infrastructure that allows us to benefit from continued consolidation within our customer base and from increased reliance by national and regional customers on suppliers that serve multiple markets and helps insulate us from the variability of weather patterns in any individual region.
- •
- Leading Market Position in Attractive Ice Markets, including the Sun Belt and many of the fastest growing metropolitan areas in the United States.
- •
- Long Standing Relationships with High Quality Customers, which we believe provide us with a significant competitive advantage over other suppliers in our markets.
- •
- Multiple Distribution Service Offerings that enable us to offer our customers the flexibility to meet their specific supply requirements in a reliable and cost-efficient manner.
- •
- Strong, Incentivized Management Team with Proven Execution Capabilities that has been responsible for successfully executing our strategy of increasing our profitability through operational improvements, including cost rationalization, facility consolidation and working capital management, while strengthening customer relationships.
Business Strategy
Our business strategy is to strengthen our competitive position, increase revenues and drive profitability by:
- •
- Enhancing Revenue Growth from our existing customers, new products and outsourcing by large retailers.
- •
- Selectively Pursuing Acquisitions that enhance the density of our distribution routes, provide capacity rationalization opportunities, increase our market penetration in existing markets or expand our presence in contiguous markets.
- •
- Continuing Efficiency Improvements to continue to improve our operating margins.
Notwithstanding our strengths, we expect to face significant challenges in our business, including:
- •
- We Are in a Seasonal and Weather-dependent Business resulting in significant seasonal fluctuations in demand, revenues and profitability. In addition, weather patterns have an impact on the level of demand for packaged ice and, as a result, on our revenues and profitability.
- •
- We Have Many Competitors in each of our geographic markets and could lose market share or customers to them or could be forced to reduce our prices to retain or attract business. New competitors may also enter our markets, including ice producers from outside our current sales area.
- •
- We Will Use Substantially All of Our Cash to Pay Dividends, which may limit our ability to pursue growth opportunities and operate our business generally.
- •
- We Have a High Level of Indebtedness which will require us to divert much of our cash flow to service our debt costs. This level of indebtedness and the terms of our debt may impede our ability to operate our business or pay dividends on our common stock.
- •
- We Face Rising Energy Costs, which could reduce our margins and operating cash flow.
2
| Shares of common stock offered by the selling stockholders | 4,590,258 shares. | |||
Shares of common stock outstanding prior to and following this offering | 21,637,020 shares. | |||
Percentage of outstanding common stock following this offering represented by shares offered | 21.2%. | |||
Use of Proceeds | The shares of stock offered hereby are being sold by the selling stockholders, including certain affiliates of Bear, Stearns & Co. Inc. and certain of our executive officers. We will not receive any of the proceeds from the sale of shares of common stock in this offering. The selling stockholders will receive all the net proceeds from the sale of shares of common stock offered by this prospectus. | |||
Dividend Policy | Our board of directors has adopted a dividend policy, which reflects an intention to distribute as regular quarterly dividends to our stockholders a substantial portion of the cash generated by our business in excess of our expected cash needs and other possible uses. These expected cash needs include operating expenses and working capital requirements, cash interest and principal payments on our indebtedness, capital expenditures, incremental costs associated with being a public company and taxes. See "Dividend Policy and Restrictions". | |||
New York Stock Exchange symbol | FRZ. | |||
General Information About This Prospectus
Throughout this prospectus, unless the context otherwise requires or we specifically state otherwise, we have assumed the following:
• | no exercise by the underwriters of their option to purchase up to 688,539 additional shares to cover over-allotments as described in the "Underwriting" section; and | |
• | 43,075 shares reserved and available for future grant or issuance under our Long-Term Incentive and Share Award Plan will be excluded. |
Some figures in this prospectus may not total due to rounding adjustments.
Corporate Information
Reddy Ice Holdings, Inc. was incorporated on May 8, 2003. Our principal executive offices are located at 8750 North Central Expressway, Suite 1800, Dallas, Texas 75231 and our telephone number is (214) 526-6740. Our website address iswww.reddyice.com. Information contained in or connected to our website is not deemed to be incorporated by reference into, and does not otherwise constitute a part of, this prospectus.
3
Summary Historical Financial Data
The following table sets forth, for the periods and dates indicated, our summary historical financial data.
Reddy Holdings and its wholly owned subsidiary Cube Acquisition Corp. were formed on May 8, 2003 for the purpose of acquiring Packaged Ice, Inc. and effecting certain capital-raising transactions in connection with such acquisition. On August 15, 2003 Cube merged with and into Packaged Ice, which we refer to in this prospectus as the merger, with Packaged Ice being the surviving corporation. In connection with the merger, Packaged Ice was renamed Reddy Ice Group, Inc. Reddy Holdings and Cube conducted no operations during the period from May 8, 2003 through August 14, 2003. In this summary, "Cube" refers to Cube Acquisition Corp., "Successor" refers to Reddy Holdings and its subsidiaries while "Predecessor" refers to pre-merger Reddy Group and its subsidiaries, which was then known as "Packaged Ice, Inc".
Our summary historical financial data for the period from January 1, 2003 through August 14, 2003 has been derived from the audited financial statements of the Predecessor included elsewhere in this prospectus. Our summary financial data for the period from May 8, 2003 through December 31, 2003 and for the years ended December 31, 2004 and 2005 have been derived from the audited financial statements of the Successor included elsewhere in this prospectus. The summary historical financial data of the Successor as of March 31, 2006 and for the three-month periods ended March 31, 2005 and March 31, 2006 have been derived from the unaudited condensed financial statements of the Successor included elsewhere in this prospectus. The unaudited condensed financial statements as of March 31, 2006 and for the three months ended March 31, 2006 and 2005 include all adjustments that are, in the opinion of management, necessary for a fair presentation of our financial position and results of operations for the periods presented. Operating results for the three months ended March 31, 2006 are not necessarily indicative of the results that may be expected for the entire year. You should read the summary historical financial data in connection with the information included under the heading "Management's Discussion and Analysis of Financial Condition and Results of Operations" and the historical financial statements and accompanying notes included elsewhere in this prospectus.
4
| | | ||||||||||||||||||||
|---|---|---|---|---|---|---|---|---|---|---|---|---|---|---|---|---|---|---|---|---|---|
| | January 1, 2003 to August 14, 2003 | | May 8, 2003 (Date of Inception) to December 31, 2003 | Year Ended December 31, 2004 | Year Ended December 31, 2005 | Three Months Ended March 31, 2005 | Three Months Ended March 31, 2006 | ||||||||||||||
| | (Predecessor) | | (Successor) | (Successor) | (Successor) | (Successor) | (Successor) | ||||||||||||||
| | (in thousands, except per share amounts) | ||||||||||||||||||||
| Operating Data: | |||||||||||||||||||||
| Revenues: | |||||||||||||||||||||
| Ice products | $ | 139,618 | $ | 79,954 | $ | 268,319 | $ | 304,755 | $ | 35,989 | $ | 41,738 | |||||||||
| Non-ice products and operations | 11,651 | 6,965 | 17,408 | 15,017 | 3,255 | 3,070 | |||||||||||||||
| Total | $ | 151,269 | $ | 86,919 | $ | 285,727 | $ | 319,772 | $ | 39,244 | $ | 44,808 | |||||||||
| Gross profit | 48,746 | 28,304 | 94,811 | 104,711 | 2,824 | 5,681 | |||||||||||||||
| Impairment of assets | — | — | — | 5,725 | — | — | |||||||||||||||
| Income (loss) from operations | 26,512 | 13,141 | 52,150 | 43,246 | (7,574 | ) | (6,940 | ) | |||||||||||||
| Interest expense | (21,063 | ) | (10,370 | ) | (25,105 | ) | (34,421 | ) | (9,308 | ) | (6,954 | ) | |||||||||
| Income (loss) before taxes | 5,565 | 2,771 | 27,045 | (19,364 | ) | (16,882 | ) | (13,894 | ) | ||||||||||||
| Income tax benefit (expense) | — | (1,053 | ) | (10,494 | ) | 7,248 | 6,702 | 5,655 | |||||||||||||
| Net income (loss) | 5,565 | 1,718 | 16,551 | (12,116 | ) | (10,180 | ) | (8,239 | ) | ||||||||||||
| Preferred dividends | 2,566 | 4,431 | 10,583 | — | — | — | |||||||||||||||
| Net income (loss) available to common stockholders | 2,999 | (2,713 | ) | 5,968 | (12,116 | ) | (10,180 | ) | (8,239 | ) | |||||||||||
Net Income (Loss) Per Share Data(1): | |||||||||||||||||||||
| Basic net income (loss) per share: | |||||||||||||||||||||
| Net income (loss) available to common stockholders | $ | 0.15 | $ | (0.35 | ) | $ | 0.44 | $ | (0.72 | ) | $ | (0.74 | ) | $ | (0.39 | ) | |||||
| Weighted average common shares outstanding | 20,159 | 7,858 | 13,675 | 16,760 | 13,728 | 21,273 | |||||||||||||||
| Diluted net income (loss) per share: | |||||||||||||||||||||
| Net income (loss) available to common stockholders | $ | 0.14 | $ | (0.35 | ) | $ | 0.44 | $ | (0.72 | ) | $ | (0.74 | ) | $ | (0.39 | ) | |||||
| Weighted average common shares outstanding | 20,808 | 7,858 | 13,703 | 16,760 | 13,728 | 21,273 | |||||||||||||||
| Other Financial Data: | |||||||||||||||||||||
| Capital expenditures(2) | $ | 7,848 | $ | 13,721 | $ | 15,988 | $ | 21,723 | $ | 5,729 | $ | 3,957 | |||||||||
| Proceeds from disposition of assets | 1,236 | 311 | 2,657 | 2,108 | 388 | 353 | |||||||||||||||
| Total depreciation and amortization expense | 14,528 | 7,616 | 23,185 | 24,529 | 6,156 | 6,142 | |||||||||||||||
| Net cash provided by (used in) operating activities | (4,846 | ) | 30,092 | 47,786 | 55,587 | (14,662 | ) | (9,376 | ) | ||||||||||||
| Net cash used in investing activities | (6,612 | ) | (206,128 | ) | (30,205 | ) | (20,551 | ) | (5,341 | ) | (5,008 | ) | |||||||||
| Net cash provided by (used in) financing activities | 11,664 | 188,837 | (25,904 | ) | (5,517 | ) | 18,341 | (9,348 | ) | ||||||||||||
| EBITDA(3) | 41,156 | 20,757 | 75,335 | 39,586 | (1,418 | ) | (798 | ) | |||||||||||||
| Adjusted EBITDA(3) | 50,734 | 24,240 | 80,221 | 84,824 | (738 | ) | 544 | ||||||||||||||
| | March 31, 2006 | |||
|---|---|---|---|---|
| | (in thousands) | |||
| Balance Sheet Data: | ||||
| Cash and cash equivalents | $ | 10,265 | ||
| Working capital(4) | 15,907 | |||
| Total assets | 580,840 | |||
| Total debt | 355,849 | |||
| Stockholders' equity | 169,074 | |||
- (1)
- Net income (loss) per share is calculated by dividing net income (loss) by the weighted average common shares outstanding. Weighted average common shares outstanding for the historical periods beginning with the period from May 8, 2003 to December 31, 2003 reflects the 138 for one stock split of our outstanding shares of common stock that was effected prior to the completion of our initial public offering.
- (2)
- Capital expenditures for the period from May 8, 2003 to December 31, 2003 and the year ended December 31, 2005 include $10.5 million and $2.5 million, respectively, related to purchases of leased assets.
- (3)
- EBITDA represents net income (loss) before income taxes, interest expense and depreciation and amortization. Adjusted EBITDA represents EBITDA as further adjusted to give effect to unusual items, non-cash items and other adjustments set forth below, all of which adjustments are required in calculating covenant ratios and compliance under our credit facilities. See "Description of Indebtedness—Credit Facilities" and "Management's Discussion and Analysis of Financial Condition and Results of Operations—Liquidity and Capital Resources" for more detail regarding the adjustments required in calculating Adjusted EBITDA. EBITDA and Adjusted EBITDA are not presentations made in accordance with generally accepted accounting principles, or GAAP, are not measures of financial condition or profitability, and should not be considered as an alternative to (1) net income (loss) determined in accordance with GAAP or (2) operating cash flows determined in accordance with GAAP. We believe that the inclusion of EBITDA and Adjusted EBITDA in this prospectus is appropriate to provide additional information to investors about certain material non-cash items and certain material unusual items as well as the calculation of certain financial covenants contained in our credit facilities. Adjusted EBITDA is a material component of these covenants. For instance, our credit facilities contain financial covenant ratios, specifically total leverage and interest coverage ratios, that are calculated by reference to Adjusted EBITDA. Non-compliance with the financial ratio maintenance covenants contained in our credit facilities could result in the requirement to immediately repay all amounts outstanding under such facilities. In addition, under the restricted payments covenant contained in our credit facilities, our ability to pay dividends is restricted by a formula based on the amount of our Adjusted EBITDA. For a description of required financial covenant levels and actual ratio calculations based
5
on Adjusted EBITDA, see "Management's Discussion and Analysis of Financial Condition and Results of Operations—Liquidity and Capital Resources". We are also restricted from paying dividends under the Reddy Holdings indenture. See "Management's Discussion and Analysis of Financial Condition and Results of Operations—Liquidity and Capital Resources". We also believe that investors will use Adjusted EBITDA to evaluate our liquidity and our ability to pay dividends as described under "Dividend Policy and Restrictions," which is particularly important given our leverage. Management also uses Adjusted EBITDA as a basis for measuring performance of our business for purposes of management compensation. Because not all companies use identical calculations, these presentations of EBITDA and Adjusted EBITDA may not be comparable to similarly titled measures of other companies. The following table sets forth, for the historical financial data, a reconciliation of net cash provided by (used in) operating activities and net income (loss) to EBITDA and Adjusted EBITDA.
| | | |||||||||||||||||||
|---|---|---|---|---|---|---|---|---|---|---|---|---|---|---|---|---|---|---|---|---|
| | January 1, 2003 to August 14, 2003 | | May 8, 2003 (Date of Inception) to December 31, 2003 | Year Ended December 31, 2004 | Year Ended December 31, 2005 | Three Months Ended March 31, 2005 | Three Months Ended March 31, 2006 | |||||||||||||
| | (Predecessor) | | (Successor) | (Successor) | (Successor) | (Successor) | (Successor) | |||||||||||||
| | (in thousands) | |||||||||||||||||||
| Reconciliation of Net Cash Provided by (Used in) Operating Activities to Net Income (Loss): | ||||||||||||||||||||
| Net cash provided by (used in) operating activities | $ | (4,846 | ) | $ | 30,092 | $ | 47,786 | $ | 55,587 | $ | (14,662 | ) | $ | (9,376 | ) | |||||
| Total depreciation and amortization expense | (14,528 | ) | (7,616 | ) | (23,185 | ) | (24,529 | ) | (6,156 | ) | (6,142 | ) | ||||||||
| Amortization of debt issuance costs and debt discount | (23 | ) | (882 | ) | (4,410 | ) | (13,358 | ) | (3,373 | ) | (3,271 | ) | ||||||||
| Deferred taxes | — | (1,053 | ) | (10,176 | ) | 7,115 | 6,702 | 5,655 | ||||||||||||
| Gain (loss) on disposition of assets | 11 | — | (398 | ) | (1,848 | ) | (149 | ) | (104 | ) | ||||||||||
| Stock-based compensation expense | — | (63 | ) | (302 | ) | (2,947 | ) | (284 | ) | (1,245 | ) | |||||||||
| Realized gain on derivative | — | — | 3,362 | — | — | — | ||||||||||||||
| Loss on extinguishment of debt | — | — | — | (28,189 | ) | — | — | |||||||||||||
| Impairment of assets | — | — | — | (5,725 | ) | — | — | |||||||||||||
| Changes in assets and liabilities, net of effects of acquisitions | 24,951 | (18,760 | ) | 3,874 | 1,778 | 7,742 | 6,244 | |||||||||||||
| Net income (loss) | $ | 5,565 | $ | 1,718 | $ | 16,551 | $ | (12,116 | ) | $ | (10,180 | ) | $ | (8,239 | ) | |||||
Reconciliation of Net Income (Loss) to EBITDA: | ||||||||||||||||||||
| Net income (loss) | $ | 5,565 | $ | 1,718 | $ | 16,551 | $ | (12,116 | ) | $ | (10,180 | ) | $ | (8,239 | ) | |||||
| Income tax expense (benefit) | — | 1,053 | 10,494 | (7,248 | ) | (6,702 | ) | (5,655 | ) | |||||||||||
| Interest expense | 21,063 | 10,370 | 25,105 | 34,421 | 9,308 | 6,954 | ||||||||||||||
| Total depreciation and amortization expense | 14,528 | 7,616 | 23,185 | 24,529 | 6,156 | 6,142 | ||||||||||||||
| EBITDA | $ | 41,156 | $ | 20,757 | $ | 75,335 | $ | 39,586 | $ | (1,418 | ) | $ | (798 | ) | ||||||
| Reconciliation of EBITDA to Adjusted EBITDA: | ||||||||||||||||||||
| EBITDA | $ | 41,156 | $ | 20,757 | $ | 75,335 | $ | 39,586 | $ | (1,418 | ) | $ | (798 | ) | ||||||
| Other non-cash charges(a) | (11 | ) | 63 | 700 | 38,233 | 433 | 1,349 | |||||||||||||
| Acquisition adjustments(b) | 6,827 | 3,119 | 1,987 | 167 | (13 | ) | (7 | ) | ||||||||||||
| Elimination of lease expenses(c) | 2,762 | 94 | — | 273 | 100 | — | ||||||||||||||
| Terminated financing costs(d) | — | — | 233 | — | — | — | ||||||||||||||
| Elimination of monitoring fee(e) | — | 207 | 615 | 394 | 160 | — | ||||||||||||||
| Transaction expenses(f) | — | — | 1,351 | 6,171 | — | — | ||||||||||||||
| Adjusted EBITDA | $ | 50,734 | $ | 24,240 | $ | 80,221 | $ | 84,824 | $ | (738 | ) | $ | 544 | |||||||
6
- (a)
- Includes impairment of assets, amortization of unearned compensation, loss on extinguishment of debt and gain or loss on the disposition of assets and non-cash stock-based compensation expense.
- (b)
- We acquired two businesses in 2003 and a total of 16 businesses in 2004, 2005 and the first four months of 2006. For the purposes of calculating Adjusted EBITDA, we have included the incremental Adjusted EBITDA of these businesses as if we had consummated each acquisition at the beginning of the period in which such acquisition occurred. The incremental Adjusted EBITDA attributable to these acquired businesses is based upon the unaudited historical results prior to their respective acquisition dates and is adjusted to give effect to the continuing impact of elimination of expenses of the acquired business. We cannot assure you that the historical results of these businesses would not have been different from the results reflected in this adjustment if such results had been subject to audits by independent auditors, and any such differences may be material. In addition, this adjustment is not necessarily representative of the contribution of the acquired businesses to our results for future periods.
- (c)
- Represents the elimination of historical operating lease expense resulting from the purchase of manufacturing and packaging equipment for $9.4 million in August 2003 and $1.1 million in November of 2003 and the purchase of leased real estate for $2.5 million in September 2005.
- (d)
- Represents costs incurred in connection with a proposed financing transaction that terminated prior to consummation.
- (e)
- Represents the elimination following our initial public offering of monitoring fees payable to our principal stockholders pursuant to the monitoring and management services agreement that is described in "Certain Relationships and Related Transactions".
- (f)
- Reflects the payment of transaction bonuses in connection with the October 27, 2004 offering of the Reddy Holdings notes and other expenses related to that transaction, and costs incurred in connection with the initial public offering of Reddy Holdings' common stock in August 2005.
- (4)
- Working capital is defined as current assets less current liabilities.
7
You should carefully consider the risks described below as well as the other information contained in this prospectus before investing in our common stock. If any of the following risks and uncertainties actually occur, our business, financial condition and results of operations could be materially adversely affected. In such case, you may lose all or part of your original investment.
Risks Relating to Our Dividend Policy
The payment of dividends is at the sole discretion of our board of directors and the reduction or elimination of dividends would negatively affect the market price of our common stock.
We are not obligated to pay dividends on our common stock. The payment of dividends is at the sole discretion of our board of directors and our board of directors may decide to eliminate or reduce any dividends paid on our common stock. Any reduction or elimination of dividends could cause the market price of our common stock to decline and could further cause your shares of common stock to become less liquid, which may result in losses by you.
Even if our board of directors desires to declare and pay dividends, we might not have cash in the future to pay dividends in the intended amounts or at all.
Our ability to pay dividends, and our board of directors' determination to keep our dividend policy, will depend on numerous factors, including the following:
- •
- the state of our business, competition and changes in our industry;
- •
- changes in the factors, assumptions and other considerations made by our board of directors in reviewing and adopting our dividend policy, as described under "Dividend Policy and Restrictions";
- •
- our future results of operations, financial condition, liquidity needs and capital resources;
- •
- our various expected cash needs, including cash interest and principal payments on our indebtedness, capital expenditures, the purchase price of acquisitions, incremental costs associated with being a public company and taxes; and
- •
- potential sources of liquidity, including borrowing under our revolving credit facility or possible asset sales.
Our actual cash available to pay dividends may not equal or exceed the amount necessary to pay dividends as described in this prospectus. Over time, our capital and other cash needs will invariably be subject to uncertainties, which could affect whether we pay dividends and the level of any dividends we may pay in the future. In addition, to the extent that we would seek to raise additional cash from additional debt incurrence or equity security issuances, we cannot assure you that such financing will be available on reasonable terms or at all. Each of the factors listed above could negatively affect our ability to pay dividends in accordance with our dividend policy or at all.
If our estimates relating to dividends payable in the first year following the closing of this offering change, you may not receive the amount of dividends you expected.
If our estimates of cash available to pay dividends for the first year following the closing of this offering were to fall below our expectations, our assumptions as to estimated cash needs were to be too low or if other applicable assumptions were to prove incorrect, we may need to:
- •
- either reduce or eliminate dividends, which may result in a decline in the market price or liquidity, or both, of our common stock;
8
- •
- fund dividends by incurring additional debt (to the extent we are permitted to do so under the agreements governing our debt), which would increase our leverage and limit our funding alternatives for other uses;
- •
- amend the terms of our credit facilities or the Reddy Holdings indenture to permit us to pay dividends or make other payments if we are otherwise not permitted to do so, which is likely to require us to incur significant costs;
- •
- fund dividends from future issuances of equity securities, which could be dilutive to our stockholders and negatively affect the market price of our common stock;
- •
- fund dividends from other sources, such as by asset sales or by working capital, which would leave us with less cash available for other purposes; and
- •
- reduce other expected uses of cash, such as capital expenditures, which could limit our ability to grow.
Our ability to pay dividends is restricted by agreements governing our debt, including our credit facilities and the Reddy Holdings indenture, and by Delaware law.
Our credit facilities and the Reddy Holdings indenture restrict our ability to pay dividends. We refer you to "Description of Indebtedness—Credit Facilities" and "—Reddy Holdings' 101/2% Senior Discount Notes due 2012" and "Dividend Policy and Restrictions", where we describe the terms of our indebtedness, including provisions limiting our ability to declare and pay dividends.
Additionally, under the Delaware General Corporation Law, or DGCL, our board of directors may not authorize payment of a dividend unless it is either paid out of our surplus, as calculated in accordance with the DGCL, or if we do not have a surplus, it is paid out of our net profits for the fiscal year in which the dividend is declared and/or the preceding fiscal year.
If, as a result of these restrictions, we are required to reduce or eliminate the payment of dividends, a decline in the market price or liquidity, or both, of our common stock could result. This may in turn result in losses by you.
Our dividend policy may limit our ability to pursue growth opportunities, which may harm our competitive position and cause the market price of our common stock to decline.
If we continue paying dividends at the level currently anticipated under our dividend policy, we may not retain a sufficient amount of cash to consummate acquisitions, and may need to seek financing to fund a material expansion of our business, including any significant acquisitions or to pursue growth opportunities requiring capital expenditures significantly beyond our current expectations. The risks relating to funding any dividends, or other cash needs as a result of paying dividends, are summarized in the preceding risk factors. If we are unable to take timely advantage of growth opportunities, our future financial condition and competitive position may be harmed, which in turn may adversely affect the market price of our common stock.
Risks Relating to Our Business
We have a substantial amount of indebtedness, which may reduce our cash flow and impede our ability to pay dividends on our common stock, remain in compliance with debt covenants, make payments on our indebtedness and operate our business.
As of March 31, 2006, we had outstanding indebtedness of approximately $355.8 million, which would have represented approximately 68% of our total consolidated capitalization on a book basis. As of March 31, 2006, we also had availability of $54.2 million (net of standby letters of credit of approximately $5.8 million) under our revolving credit facility.
Our substantial indebtedness could have important consequences. For example, it could:
- •
- make it more difficult for us to comply with the terms of our outstanding debt;
9
- •
- require us to dedicate a substantial portion of our cash flow to pay principal and interest on our debt, thus making it more difficult for us to pay dividends on our common stock;
- •
- make us more vulnerable to, and reduce our flexibility in planning for, changes in general economic, industry and competitive conditions;
- •
- limit our ability to borrow additional amounts for working capital, capital expenditures, acquisitions, debt service requirements, execution of our strategy, or other purposes; and
- •
- place us at a disadvantage compared to our competitors with less debt.
Any of the above listed factors could make us more vulnerable to defaults and place us at a competitive disadvantage, therefore making an investment in our common stock less attractive when compared to other investments. Further, if we do not have sufficient earnings to service our debt, we would need to refinance all or part of our existing debt, sell assets, borrow more money or sell securities, none of which we can guarantee we will be able to do on commercially reasonable terms or at all.
We could incur more indebtedness, which may increase the risks associated with our substantial leverage, including our ability to service our indebtedness and pay dividends on our common stock.
The Reddy Holdings indenture and our credit facilities permit us, under certain circumstances, to incur a significant amount of additional indebtedness. For example, our credit facilities allow us to incur up to an additional $80.0 million of incremental term loans under our credit facilities, subject to certain conditions. See "Description of Indebtedness—Credit Facilities". In addition, we may incur additional indebtedness through our revolving credit facility. If we incur additional debt, the risks associated with our substantial leverage, including our ability to service our debt and pay dividends on our common stock, would increase. This, in turn, could negatively affect the market price of our common stock.
The terms of our credit facilities and the Reddy Holdings indenture may restrict our current and future operations, particularly our ability to respond to changes in our business or to take certain actions.
Our credit facilities and the Reddy Holdings indenture contain, and any future indebtedness of ours would likely contain, a number of financial and other restrictive covenants that impose significant operating and financial restrictions on us, including restrictions that may limit our ability to engage in acts that may be in our best long-term interests. For a more complete description of these covenants and restrictions, see "Description of Indebtedness".
The operating and financial restrictions and covenants in our existing and future debt agreements may adversely affect our ability to finance future operations or capital needs or to engage in other business activities. A breach of any of the restrictive covenants in our credit facilities could result in a default under such facilities. If any such default occurs, the lenders may elect to declare all obligations under our credit facilities to be immediately due and payable, enforce their security interest or require us to apply all of our available cash to repay these borrowings, any of which would result in an event of default under the Reddy Holdings notes. If the debt under our credit facilities or the Reddy Holdings notes were to be accelerated, our business operations would be interrupted, which would adversely affect the market price of our common stock. See "Description of Indebtedness".
The seasonal nature of the ice business results in losses and lower profit margins in the first and fourth quarters of the year.
We experience significant seasonal fluctuations in our net sales and profitability. We make a disproportionate amount of our sales in the second and third calendar quarters when the weather is generally warmer, which results in an increased demand for ice. We also earn our net income during these same periods. As a result of seasonal revenue declines and the lack of a corresponding decrease in certain expenses, we experience net losses and materially lower profit margins during the first and fourth calendar quarters. Variations in demand could have a material adverse effect on the timing of our cash flows and therefore limit our ability to timely service our
10
obligations with respect to our indebtedness and to pay dividends. In addition, because our operating results depend significantly on sales during the second and third calendar quarters, our results of operations may fluctuate significantly if the weather during these periods is cool or rainy.
Weather conditions and weather events can decrease our sales or increase our expenses.
Cool or rainy weather can decrease sales, while extremely hot weather may increase our expenses, each resulting in a negative impact on our operating results and cash flow. Ice consumers demand ice for a variety of reasons, but many of them buy ice in connection with outdoor related activities, both commercial and recreational. As a result, demand for ice increases during periods of warm, sunny weather, and conversely, demand decreases during periods of cool, rainy weather. During extended periods of cool or rainy weather on a national basis, our revenues and resulting net income may substantially decline. Also, hot weather does not necessarily result in greater net income. During extended periods of hot weather, our profits and cash flow may decline because of an increase in expenses in response to excess demand. We may have to transport ice from one plant to another and, in some cases, purchase ice from third party sources and transport it to a specific market to meet this excess demand, resulting in higher expenses and inconsistent service and product quality. Finally, although extreme weather events such as hurricanes can cause an increase in volume sales, those sales are not necessarily profitable due to added costs and disruptions to our normal service and distribution routes.
Our failure to successfully compete in our markets, retain existing customers and obtain new customers could limit our prospects and cause us to lose market share.
Our businesses are highly competitive. We have many competitors in each of our geographic markets offering similar products and services. In addition, two of the largest regional ice producers have recently announced plans to consolidate. Other ice producers, including our direct competitors, may also consolidate in the future. Competition in our businesses is based primarily on service, quality and price. We could lose market share if we fail to successfully compete against our competitors in any of these areas, if our existing competitors expand their capacity, if new entrants successfully penetrate our markets, if we fail to adequately serve our existing base of customers, or if our larger grocery or convenience store customers decide to manufacture their own ice rather than purchase our products.
Increases in the prices of electricity, certain raw materials, fuel, insurance and other required expenses could, if we cannot pass those price increases along to our customers, have an adverse effect on our results of operations.
We use substantial amounts of polyethylene, which is the primary raw material used to manufacture the bags we use to package our ice, electricity in connection with our manufacturing process and fuel to operate the refrigerated trucks for ice delivery. We also carry general liability, workers' compensation, health and vehicle insurance. We have already experienced increases in bag costs, fuel costs, electricity costs and insurance costs and may experience further increases in such costs in the future, including as a result of the expiration in June 2006 of a fixed price electricity contract to supply electricity to the majority of our Texas facilities, which we have renewed at higher rates. If the prices for these items or other expenses increase beyond the amounts that we are able to pass along to our customers, our margins and our operating cash flow would decrease.
Our acquisitions may not be successfully integrated and could cause unexpected financial or operational difficulties.
In 2004, 2005, and the first four months of 2006, we completed a total of 16 acquisitions. We anticipate that we may, from time to time, selectively acquire additional businesses, assets or securities of companies that we believe would provide a strategic fit with our business. Acquisitions are also accompanied by risks, such as potential exposure to unknown liabilities of acquired companies and the possible loss of key employees and customers of the acquired business. Further, acquisitions are subject to risks associated with the difficulty and expense of integrating the operations and personnel of the acquired companies, the potential disruption to our business and the diversion
11
of management time and attention, any of which could increase the costs of operating our business, negate the expected benefits of the acquisitions or result in the loss of customers.
We could incur substantial costs as a result of violations of or liabilities under environmental laws.
Our operations are subject to a wide range of environmental laws and regulations governing, among other things, air emissions, wastewater discharges, the use, management and disposal of hazardous and non-hazardous materials and wastes and the cleanup of contamination. Noncompliance with such laws and regulations, or incidents resulting in environmental releases, could cause us to incur substantial costs, including cleanup costs, fines and penalties, third party claims for personal injury, investments to retrofit or upgrade our facilities and programs, or curtailment of our operations. For example, our ice manufacturing and cold storage operations use refrigerants such as ammonia and Freon. Some of our facilities may not be in compliance with certain Freon refrigerant requirements, such as leak detection and repair, recordkeeping or reporting. In addition, the market price of Freon is rising as a result of phase-outs under federal laws, which could significantly increase our operating costs in the future if we are not able to obtain approved substitutes. From time to time, our use of ammonia has resulted in releases that have temporarily disrupted our manufacturing operations and resulted in lawsuits or administrative penalties.
Material violations of, or liabilities under, environmental laws may require us to incur substantial costs which could reduce our margins, or to divert resources from ongoing environmental programs and improvements, which could delay our efforts to integrate acquisitions and upgrade our operations, or expose us to risk of further environmental liability.
Our business could be disrupted or we could incur substantial costs because of government laws and regulations.
We are subject to various federal, state and local laws relating to many aspects of our business, including labeling, sanitation, health and safety and manufacturing processes. We cannot predict the types of government regulations that may be enacted in the future by the various levels of government or how existing or future laws or regulations will be interpreted or enforced. The enactment of more stringent laws or regulations or a stricter interpretation of existing laws and regulations may cause a disruption in our operations or require additional expenditures by us, some of which could be material. We may incur material costs and liabilities in order to comply with any such laws and regulations and such costs and liabilities may result in substantial expenses to us and could divert management's time and attention.
If we are unable to retain senior executives and attract and retain other qualified employees, our business might be adversely affected.
Our success depends in part on our ability to attract, hire, train and retain qualified managerial, sales and marketing personnel. Competition for these types of personnel is high. We may be unsuccessful in attracting and retaining the personnel we require to conduct our operations. Our success also depends to a significant extent on the continued service and performance of our senior management team and in particular on the continued service of William P. Brick, our Chairman and Chief Executive Officer, and Jimmy C. Weaver, our President and Chief Operating Officer. In addition, we do not carry "key man" life insurance. Our inability to successfully attract and retain personnel or the loss of any member of our senior management team could impair our ability to execute our business plan. Our employment agreements with our named executive officers are summarized under "Management—Executive Compensation and Incentive Programs—Employment Agreements".
Accidents involving our products and equipment could expose us to increased costs as a result of product liability claims.
We are subject to a risk of product liability claims and adverse publicity if a consumer is or claims to be harmed while using our products or equipment. Any such claim may result in negative publicity, loss of revenues or higher costs associated with litigation.
12
We currently carry product liability insurance. However, this insurance may be insufficient to pay for all or a large part of these losses. If our insurance does not adequately cover these losses, our results of operations and cash flow would decrease and such a decrease could be material.
We may lose customers' business to competitors as a result of our limited intellectual property protection, including on The Ice Factory.
As the sole major ice supplier using an on-site production and delivery system at our customers' retail locations, we have enjoyed a competitive advantage over our competitors. Our proprietary Ice Factory system is preferred by certain of our high volume customers to traditional ice delivery and gives us more flexibility during peak seasons. Competitors sometimes test machines similar to The Ice Factory. If any of our competitors are successful with the rollout of a competing system, we could lose business to these companies, which would result in decreased cash flows and results of operations.
It is also our practice to protect certain of our proprietary materials and processes by relying on trade secrets laws and non-disclosure and confidentiality agreements. Confidentiality or trade secrets may not be maintained and others may independently develop or obtain access to such materials or processes, which could adversely affect our competitive position and ability to differentiate our products and services from our competitors' offerings.
Limitations on our ability to utilize our tax assets before they expire may negatively affect financial results and the ability to pay dividends and other distributions to you.
We may not be able to utilize our tax assets. As of December 31, 2005, we had net operating loss carry-forwards for U.S. federal income tax purposes of approximately $122 million, of which approximately $84 million was generated prior to August 15, 2003. There are annual limitations on the utilization of the $84 million portion of the net operating loss carry-forwards due to changes in ownership on and prior to August 15, 2003. As a result of changes in ownership that occurred in connection with our initial public offering on August 12, 2005, annual limitations also apply to the portion of our net operating loss carryforwards generated from August 15, 2003 to August 12, 2005 and additional limitations apply to the net operating loss carry-forwards generated prior to August 15, 2003. Changes in ownership resulting from this offering or future transactions may limit the future utilization of our net operating loss carryforwards generated after August 12, 2005, and may result in additional limitations on our prior net operating loss carryforwards.
If we are not able to utilize our tax assets in the manner or in the timeframe we anticipate, our future after-tax cash flow available for dividends and other distributions to stockholders will be reduced.
Any significant reduction in goodwill and other intangible assets would have an adverse effect on the value of our business.
Our acquisitions have resulted in significant amounts of goodwill and other intangible assets. Goodwill, which relates to the excess of cost over the fair value of the net assets of the businesses acquired, and intangible assets totaled approximately $296.6 million at March 31, 2006, representing approximately 51% of our total assets. In the future, goodwill and intangible assets may increase as a result of future acquisitions. Goodwill and intangible assets are reviewed at least annually for impairment. Impairment may result from, among other things, deterioration in the performance of acquired businesses, adverse market conditions, adverse changes in applicable laws or regulations, including changes that restrict the activities of the acquired business, and a variety of other circumstances. During the year ended December 31, 2005 we recorded a non-cash impairment charge of $5.7 million to the goodwill in the cold storage portion of our non-ice products and operations business segment as a result of a significant reduction in cold storage sales volumes related to a particular customer. The amount of this and any future impairment must be charged to earnings. Any future determination requiring the write-off of a significant portion of the goodwill and intangible assets recorded on our balance sheet would have an adverse effect on the value of our business.
13
We are subject to certain regulations as a result of being a public company, which results in a greater burden on our management resources and increased costs.
As a public company with listed equity securities, we are required to comply with new laws, regulations and requirements, including provisions of the Sarbanes-Oxley Act of 2002, related Securities and Exchange Commission ("SEC") regulations and requirements of the New York Stock Exchange. Complying with new statutes, regulations and requirements occupies a significant amount of the time of our board of directors, management and our officers, increases our costs and expenses and sometimes diverts management's attention from other business concerns.
We will be exposed to risks relating to evaluations of our internal controls over financial reporting as required by Section 404 of the Sarbanes-Oxley Act of 2002, which could cause the market price of our common stock to decline.
We are in the process of evaluating our internal controls systems to allow management to report on, and our independent auditors to attest to, our internal controls over financial reporting. We will be performing the system and process evaluation and testing (and any necessary remediation) required to comply with the management certification and auditor attestation requirements of Section 404 of the Sarbanes-Oxley Act of 2002. While we anticipate being able to fully implement the requirements relating to internal controls and all other aspects of Section 404 by our December 31, 2006 deadline, we cannot be certain as to the timing of completion of our evaluation, testing and remediation actions or the impact of the same on our operations. If we are not able to implement the requirements of Section 404 in a timely manner or with adequate compliance, we might be subject to sanctions or investigation by regulatory authorities, such as the SEC or the New York Stock Exchange. Any such action could increase expenses, divert management's attention or lower investors' confidence in our company, which could cause the market price of our common stock to decline.
Risks Relating to Our Common Stock
The market for our common stock may be volatile, which could cause the value of your investment to decrease.
Volatility in the market price of our common stock may prevent you from being able to sell our common stock held by you at or above the price you paid for it. The market price of our common stock may fluctuate widely as a result of various factors, such as period-to-period fluctuations in our actual or anticipated operating results, sales of our common stock by our existing equity investors, failure to pay dividends at anticipated levels, developments in our industry, the failure of securities analysts to cover our common stock or changes in financial estimates by analysts, failure to meet financial estimates by analysts, competitive factors, general economic and securities market conditions and other external factors. Also, securities markets worldwide experience significant price and volume fluctuations. This market volatility, as well as general economic or market conditions, and market conditions affecting the stock of companies in our industry in particular, could reduce the market price of our common stock in spite of our operating performance.
Limited trading volume of our common stock may contribute to its price volatility.
For the first quarter of 2006, the average daily trading volume for our common stock as reported by the New York Stock Exchange was approximately 63,000 shares. Even if we achieve a wider dissemination of our common stock as a result of this offering, we are uncertain as to whether a more active trading market in our common stock will develop. As a result, relatively small trades may have a significant impact on the price of our common stock.
If our share price is volatile, we may be the target of securities litigation, which is costly and time-consuming to defend.
In the past, following periods of market volatility in the price of a company's securities, security holders have often instituted class action litigation. If the market value of our common stock experiences adverse fluctuations
14
and we become involved in this type of litigation, regardless of the outcome, we could incur substantial legal costs and our management's attention could be diverted from the operation of our business, causing our business to suffer.
Future sales of our shares could depress the market price of our common stock.
Sales of a substantial number of shares of common stock in the public market by our current stockholders, or the threat that substantial sales may occur, could cause the market price of our common stock to decrease significantly or make it difficult for us to raise additional capital by selling stock. In connection with this offering, our directors and executive officers, as well as the selling stockholders in this offering, have entered into 90-day lock-up agreements at the request of the underwriters. Subject to extension under certain circumstances, on the day that is 91 days after the date of this prospectus, those parties will be able to sell in the public market an aggregate of 5,004,251 shares of our common stock that they will hold after this offering (assuming no exercise of the over-allotment option), subject to the applicable volume, manner of sale, holding period and other limitations of Rule 144 under the Securities Act of 1933. See "Underwriting—No Sales of Similar Securities" for further information regarding lock-up agreements.
Bear, Stearns & Co. Inc. and Lehman Brothers Inc. may also consent to the release of some or all of these shares that are subject to lock-up agreements for sale prior to the expiration of the applicable lock-up agreement. See the section of this prospectus entitled "Shares Eligible for Future Sale" for further details regarding the number of shares eligible for sale in the public market after this offering.
We cannot predict the size of future issuances of our common stock or the effect, if any, that future issuances and sales of shares of our common stock will have on the market price of our common stock. Sales of substantial amounts of our common stock (including shares issued in connection with an acquisition), or the perception that such sales could occur, may adversely affect prevailing market prices for our common stock.
We are a holding company with no operations, and unless we receive dividends, distributions, advances, transfers of funds or other payments from our subsidiaries, we will be unable to pay dividends on our common stock and meet our debt service and other obligations.
We are a holding company and conduct all of our operations through our subsidiaries. We do not have, apart from our ownership of Reddy Group, any independent operations. As a result, we will rely on dividends and other payments or distributions from Reddy Group and our other subsidiaries to pay dividends on our common stock and meet our debt service and other obligations. The ability of Reddy Group and our other subsidiaries to pay dividends or make other payments or distributions to us will depend on our operating results and may be restricted by, among other things, the covenants that are contained in our credit facilities and the covenants of any future outstanding indebtedness we or our subsidiaries incur.
In addition, because we are a holding company, your claims as stockholders will be structurally subordinated to all existing and future liabilities and obligations (whether or not for borrowed money) of our subsidiaries, including obligations under our credit facilities. Therefore, in the event of our bankruptcy, liquidation or reorganization, our assets and those of our subsidiaries will be able to satisfy the claims of our stockholders only after all of our and our subsidiaries' liabilities and obligations have been paid in full.
Ownership of our common stock is concentrated among a few stockholders who could act in a way that favors their interests to the detriment of our interests and those of other stockholders.
Prior to this offering, each of Bear Stearns Merchant Banking and Trimaran Fund Management L.L.C. beneficially owned 20% of our outstanding shares of common stock. As a result of sales in this offering, and assuming no exercise of the over-allotment option, each of Bear Stearns Merchant Banking and Trimaran Fund Management L.L.C. will beneficially own 9.9% of our outstanding shares of common stock. Nonetheless, following the consummation of this offering, and assuming no exercise of the over-allotment option, our executive officers, directors and the selling stockholders will still, in the aggregate, hold approximately 24.5% of our outstanding
15
shares. None of our other stockholders beneficially owns more than 7.1% of our common stock. In the event that all or some of our executive officers, directors or the selling stockholders decided to act in concert, they could influence the outcome of certain corporate actions, such as the election of our directors and extraordinary corporate transactions.
Provisions of our charter documents and the Delaware General Corporation Law may inhibit a takeover, which could negatively affect our stock price.
Provisions of our charter documents and the Delaware General Corporation Law, the state in which we are incorporated, could discourage potential acquisition proposals or make it more difficult for a third party to acquire control of our company, even if doing so might be beneficial to our stockholders. Our amended and restated certificate of incorporation and by-laws provide for various procedural and other requirements that could make it more difficult for stockholders to effect certain corporate actions. For example, our amended and restated certificate of incorporation authorizes our board of directors to determine the rights, preferences, privileges and restrictions of unissued series of preferred stock without any vote or action by our stockholders. Our board of directors could therefore authorize and issue shares of preferred stock with voting or conversion rights that could dilute the voting power or diminish other rights of holders of our common stock. Additional provisions are included in our amended and restated certificate of incorporation and by-laws which could make it more difficult for stockholders to effect certain corporate actions, including:
- •
- the sole power of a majority of the board of directors to fix the number of directors and to fill any vacancy on the board of directors;
- •
- requirements for advance notification of stockholder nominations and proposals; and
- •
- the inability of stockholders to act by written consent and restrictions on the ability of stockholders to call special meetings.
See "Description of Capital Stock". These provisions may discourage acquisition proposals and may make it more difficult or expensive for a third party to acquire a majority of our outstanding voting stock or may delay, prevent or deter a merger, acquisition, tender offer or proxy contest, which may negatively affect our stock price.
16
This prospectus is intended to qualify for the safe harbor from liability established by the Private Securities Litigation Reform Act of 1995. This prospectus includes "forward-looking statements". We believe the expectations reflected in such forward-looking statements are accurate. However, we cannot assure you that such expectations will occur. Forward-looking statements often include words such as "may," "should," "expect," "intend," "estimate," "anticipate," "believe," "predict," "plan," "potential" and "continue" and the negatives of these terms and variations of them or similar terminology. The forward-looking statements in this prospectus include, but are not limited to, statements under "Summary," "Risk Factors," "Dividend Policy and Restrictions," "Management's Discussion and Analysis of Financial Condition and Results of Operations" and "Business" regarding our future financial condition, prospects, developments and business strategies. These forward-looking statements involve known and unknown risks, uncertainties and other factors that may cause our actual results, performance or achievements to be materially different from future results expressed or implied by the forward-looking statements. Factors you should consider that could cause these differences are:
- •
- general economic trends and seasonality;
- •
- weather conditions;
- •
- the ability of our subsidiaries to make distributions to us in amounts sufficient to make dividend payments to our stockholders in accordance with our dividend policy;
- •
- our substantial leverage and ability to service our debt and pay dividends;
- •
- the restrictive covenants under our indebtedness;
- •
- the availability of capital sources;
- •
- fluctuations in our operating costs, including in the prices of electricity, fuel, polyethylene and other required expenses;
- •
- competitive practices in the industry in which we compete;
- •
- changes in labor conditions;
- •
- our capital expenditure requirements;
- •
- the risks associated with acquisitions and the failure to integrate acquired businesses;
- •
- technological changes and innovations;
- •
- costs associated with potential product liability claims or liabilities under environmental laws;
- •
- legislative or regulatory requirements; and
- •
- all the other factors described herein under "Risk Factors".
You should not unduly rely on these forward-looking statements as they speak only as of the date of this prospectus. Except as required by law, we are not obligated to publicly release any revisions to these forward- looking statements to reflect events or circumstances occurring after the date of this prospectus or to reflect the occurrence of unanticipated events. Important factors that could cause our actual results to differ materially from our expectations are discussed elsewhere in this prospectus.
17
All of the shares of common stock being offered hereby in this offering are being sold by the selling stockholders, including certain affiliates of Bear, Stearns & Co. Inc., one of the underwriters, and certain of our executive officers. We will not receive any of the proceeds from the sale of shares of common stock in this offering. The selling stockholders will receive all the net proceeds from the sale of shares of common stock offered by this prospectus.
We estimate that we will incur approximately $0.6 million of costs in connection with this offering. These costs will be recorded as operating expenses in our financial statements following the consummation of this offering.
18
DIVIDEND POLICY AND RESTRICTIONS
General
In connection with our initial public offering, our board of directors adopted a dividend policy which reflects an intention to distribute as regular quarterly dividends to our stockholders a substantial portion of the cash generated by our business in excess of our expected cash needs and other possible uses. These expected cash needs include operating expenses and working capital requirements, interest and principal payments on our indebtedness, capital expenditures, incremental costs associated with being a public company and taxes. This policy reflects our judgment that it is in the best interest of our stockholders to distribute to them a substantial portion of the cash generated by our business rather than using the cash for other purposes in the future that are unplanned and have not been specifically identified.
We believe that our dividend policy will limit, but not preclude, our ability to pursue growth. This limitation could be significant, for example, with respect to large acquisitions and growth opportunities that require cash investments in amounts greater than our available cash or external financing resources. In order to pay dividends at the level currently anticipated under our dividend policy, we expect that we would need additional financing to fund significant acquisitions or to pursue growth opportunities requiring capital expenditures significantly beyond our anticipated capital expenditure levels. However, we intend to retain sufficient cash after the distribution of dividends to permit the pursuit of growth opportunities that do not require material capital investment. For further discussion of the relationship of our dividend policy to our ability to pursue potential growth opportunities, see "—Assumptions and Considerations" below.
In accordance with our dividend policy, we have paid dividends at a rate of $1.53 per share per year declared on a quarterly basis from the closing of our initial public offering through the quarter ended March 31, 2006. On April 24, 2006, our board of directors increased the dividend rate to an annual rate of $1.60 per share, which we intend to maintain for at least the first four full fiscal quarters following the closing of this offering (the "Initial Four Quarters"), subject to our board of directors' decision to declare these dividends and various restrictions on our ability to do so.
In determining our intended dividend level for the Initial Four Quarters, we reviewed and analyzed the factors described below under "—Assumptions and Considerations".
However, as described more fully below, you may not receive dividends in the intended amounts, or at all, as a result of the following factors:
- •
- we may not have enough cash to pay dividends due to changes in our operating earnings, capital expenditure requirements, working capital requirements and other anticipated cash needs;
- •
- while the dividend policy adopted by our board of directors contemplates the distribution of a substantial portion of our cash available to pay dividends, our board of directors could modify or revoke this policy at any time;
- •
- even if our dividend policy is not modified or revoked, the actual amount of dividends distributed under the policy and the decision to make any distribution will remain at all times entirely at the discretion of our board of directors;
- •
- the amount of dividends that we may distribute is limited by restricted payments covenants in our credit facilities, the indenture governing the Reddy Holdings notes and, potentially, the terms of any future indebtedness that we may incur;
- •
- the amount of dividends that we may distribute is subject to restrictions under Delaware law; and
19
- •
- our stockholders have no contractual or other legal right to dividends, and we are not otherwise required to pay dividends.
Any reduction or elimination of dividends will adversely affect the liquidity or market price, or both, of our common stock.
Prior to our initial public offering, we had no history of paying regular dividends out of our cash flow, reflecting our previous policy of utilizing our cash flow to fund acquisitions, to pursue other growth opportunities and to repay indebtedness. As noted above, we now believe that we can provide greater value to our stockholders by distributing to them a substantial portion of our cash flow. Dividends on our common stock will not be cumulative.
Estimated Minimum Adjusted EBITDA
Our management has prepared the estimated financial information set forth below in order to provide an estimate of the amount of cash that may be available to pay dividends, in the event that our board of directors determines to do so and subject to the limitations on our ability to pay dividends. In the view of our management, the estimated financial information was prepared on a reasonable basis, reflects the best currently available estimates and judgments and presents, to the best of management's knowledge and belief, our expected course of action and our expected future financial performance. Neither our independent registered public accounting firm nor any other independent registered public accounting firm has compiled, examined, or performed any procedures with respect to the estimated financial information contained herein, nor have they expressed any opinion or any other form of assurance on such information or its achievability, and assume no responsibility for, and disclaim any association with, the estimated financial information.
The estimated financial information below is only an estimate, is not a prediction of fact and should not be relied upon as being necessarily indicative of future results. You are cautioned not to place undue reliance on the estimated financial information. The factors, assumptions and other considerations relating to the estimated financial information are inherently uncertain and, although considered reasonable by our management as of the date of preparation, are subject to a wide variety of significant business, economic, competitive and other risks and uncertainties, as described in greater detail under "Risk Factors" and "Forward-Looking Statements". There will be differences between actual and projected results. Accordingly, we cannot assure you that the estimated financial information is indicative of our future performance or that the actual results will not differ materially from the estimated financial information presented below.
We believe that, in order to pay dividends on our common stock in the year following this offering according to our dividend policy solely from cash generated by our business, while also meeting our expected cash needs and complying with the covenants included in our credit facilities and contained in the Reddy Holdings indenture, we would need to have at least $66.1 million in Adjusted EBITDA, which we refer to as estimated minimum Adjusted EBITDA below. Adjusted EBITDA is calculated in accordance with the definition contained in our credit facilities and represents EBITDA as further adjusted to exclude specified unusual items, non-cash expense items and other adjustments such as non-cash compensation expense, fees paid under our monitoring agreement (which was terminated upon consummation of our initial public offering), fees and expenses relating to our initial public offering and the related transactions, fees and expenses related to permitted acquisitions and specified historical payments to members of our management and directors. For a more detailed description of the definition of Adjusted EBITDA under our credit facilities, please see "—Restrictions on Payment of Dividends—Credit Facilities".
20
We believe that our estimated Adjusted EBITDA for the four full fiscal quarters following the closing of this offering will be at least equal to our estimated minimum Adjusted EBITDA and we have determined that our assumptions as to cash capital expenditures, cash working capital expenditures, principal repayments of indebtedness, cash interest expense on indebtedness, and cash income taxes are reasonable. We have also determined that if our Adjusted EBITDA for such period is at or above this level, we would be permitted to pay dividends under the Reddy Holdings notes and Reddy Group would be permitted to pay dividends to Reddy Holdings under our credit facilities in accordance with the expected terms thereof, in each case at the dividend levels described above. In addition, we do not believe that restrictions under the laws of the State of Delaware as described in greater detail under "—Restrictions on Payment of Dividends—Delaware Law" will limit out ability to make dividend payments at the stated levels. Nothing in this prospectus should be understood to be directly or indirectly an estimate for any period other than the Initial Four Quarters.
The following table sets forth our unaudited calculation illustrating that $66.1 million of Adjusted EBITDA for the Initial Four Quarters would be sufficient to fund dividends at the level described above for the Initial Four Quarters and would satisfy (1) the total leverage and interest coverage covenants contained in our credit facilities, (2) the minimum cumulative distributable cash calculation contained in our credit facilities, (3) the consolidated coverage ratio contained in the Reddy Holdings indenture and (4) the minimum "buildup amount" calculation contained in the Reddy Holdings indenture.
| | Initial Four Quarters Ending June 30, 2007 | ||||
|---|---|---|---|---|---|
| | (in thousands) | ||||
| Estimated cash available to pay dividends on common stock based on minimum Adjusted EBITDA | |||||
| Estimated minimum Adjusted EBITDA(1) | $ | 66,061 | |||
| Less: | |||||
| Estimated cash interest expense(2) | 15,275 | ||||
| Estimated cash income taxes(3) | 444 | ||||
| Estimated net cash capital expenditures(4) | 14,774 | ||||
| Estimated cash working capital requirements(5) | — | ||||
| Estimated principal repayments of indebtedness(6) | 73 | ||||
| Estimated cash available to pay dividends on common stock(7) | $ | 35,495 | |||
| Estimated calculations under our credit facilities | |||||
| Estimated total leverage ratio derived from the above(8) | 3.64 | x | |||
| Estimated interest coverage ratio derived from the above(9) | 4.30 | x | |||
| Estimated remaining Cumulative Distributable Cash(10) | $ | 58,882 | |||
Estimated calculations under the Reddy Holdings indenture | |||||
| Estimated consolidated coverage ratio(11) | 2.20 | x | |||
| Estimated remaining buildup amount(12) | $ | 122,049 | |||
21
The following table sets forth our unaudited calculation of EBITDA, Adjusted EBITDA, pro forma Adjusted EBITDA and pro forma estimated cash available to pay dividends on our common stock for the year ended December 31, 2005 and for the twelve months ended March 31, 2006. In each period, the calculation of pro forma Adjusted EBITDA gives effect to acquisitions consummated in such period and to the elimination of lease expenses associated with the purchase of certain leased real estate during such period, in each case as if the transactions had occurred at the beginning of such period. The calculation of pro forma cash available to pay dividends gives further effect to our initial public offering, the entry into our credit facilities, the repayment of our prior credit facilities, the repurchase of Reddy Group's 87/8% senior subordinated notes and the related transactions, in each case as if the transactions had occurred at the beginning of such period.
To derive Adjusted EBITDA, we have given effect to items that are specified in our credit facilities.
| | Year Ended December 31, 2005 | Twelve Months Ended March 31, 2006 | |||||||
|---|---|---|---|---|---|---|---|---|---|
| | (in thousands) | ||||||||
| Pro forma cash available to pay dividends | |||||||||
Net cash provided by operating activities | $ | 55,587 | $ | 60,873 | |||||
| Adjustments to reconcile net cash provided by operating activities to net loss: | |||||||||
| Total depreciation and amortization expense | (24,529 | ) | (24,515 | ) | |||||
| Amortization of debt issuance costs and debt discount | (13,358 | ) | (13,256 | ) | |||||
| Deferred taxes | 7,115 | 6,068 | |||||||
| Loss on disposition of assets | (1,848 | ) | (1,803 | ) | |||||
| Stock-based compensation expense | (2,947 | ) | (3,908 | ) | |||||
| Loss on extinguishment of debt | (28,189 | ) | (28,189 | ) | |||||
| Impairment of assets | (5,725 | ) | (5,725 | ) | |||||
| Changes in assets and liabilities: | |||||||||
| Accounts receivable, inventory and prepaid assets | 1,391 | 3,379 | |||||||
| Accounts payable, accrued expenses and other | 387 | (3,099 | ) | ||||||
Net loss | (12,116 | ) | (10,175 | ) | |||||
| Depreciation expense related to costs of sales | 18,838 | 18,811 | |||||||
| Depreciation and amortization expense | 5,691 | 5,704 | |||||||
| Interest expense | 34,421 | 32,067 | |||||||
| Income tax benefit | (7,248 | ) | (6,201 | ) | |||||
| EBITDA | 39,586 | 40,206 | |||||||
| Other non-cash charges: | |||||||||
| Stock-based compensation expense | 2,471 | 3,432 | |||||||
| Loss on disposition of assets | 1,848 | 1,803 | |||||||
| Loss on extinguishment of debt | 28,189 | 28,189 | |||||||
| Impairment of assets | 5,725 | 5,725 | |||||||
| Monitoring fees | 394 | 235 | |||||||
| Transaction expenses(13) | 6,171 | 6,171 | |||||||
| Adjusted EBITDA | $ | 84,384 | $ | 85,761 | |||||
| Acquisition adjustments(14) | $ | 167 | $ | 495 | |||||
| Elimination of lease expense(15) | 273 | 174 | |||||||
| Pro forma Adjusted EBITDA | $ | 84,824 | $ | 86,430 | |||||
| Less: | |||||||||
| Pro forma cash interest expense(2) | $ | (14,650 | ) | $ | (14,833 | ) | |||
| Cash income taxes(3) | — | — | |||||||
| Net cash capital expenditures(4) | (17,157 | ) | (15,420 | ) | |||||
| Cash working capital requirements(5) | — | — | |||||||
| Pro forma principal repayments of indebtedness(6) | (510 | ) | (270 | ) | |||||
| Pro forma incremental public company expenses(16) | (468 | ) | (281 | ) | |||||
| Estimated pro forma cash available to pay dividends | $ | 52,039 | $ | 55,626 | |||||
22
- (1)
- We have not estimated any unknown non-recurring cash expenses that would be excluded from Adjusted EBITDA in this presentation of minimum Adjusted EBITDA. To the extent that our definition of Adjusted EBITDA allows us to exclude certain other cash expenses from the calculation of Adjusted EBITDA in a future period, the amount of minimum Adjusted EBITDA that we would have to generate would increase by the amount of the cash expenses excluded from Adjusted EBITDA in that period.
- (2)
- Pro forma cash interest expense for the year ended December 31, 2005 and the twelve months ended March 31, 2006 represents an annualized amount based on historical cash interest expense from August 12, 2005, the closing date of our initial public offering, to the end of the indicated period. The $150.5 million aggregate principal amount at maturity of the Reddy Holdings notes will not require cash interest payments to be made until May 1, 2009. For the Initial Four Quarters, our estimated cash interest expense assumes average borrowings of $242.6 million under our credit facilities and assumes an average forward LIBOR of 5.2%.
- (3)
- For the year ended December 31, 2005 and the twelve months ended March 31, 2006, there were no income tax payments related to alternative minimum tax. Due to the utilization of NOLs, we paid no regular cash income taxes during those same periods. Based on our estimated minimum Adjusted EBITDA, we expect cash taxes related to alternative minimum tax for the Initial Four Quarters to be approximately $0.4 million.
- (4)
- For the year ended December 31, 2005, our gross capital expenditures were approximately $19.3 million and proceeds from dispositions of assets were approximately $2.1 million. For the twelve months ended March 31, 2006, our gross capital expenditures were approximately $17.5 million and proceeds from dispositions of assets were approximately $2.1 million. We expect net capital expenditures for the Initial Four Quarters to be approximately $14.8 million.
- (5)
- Working capital requirements represent the reconciliation of reported revenues and operating expenses to cash paid or received. The items used in this reconciliation include trade receivables, prepaid expenses and other assets, accounts payable and accrued liabilities, and other liabilities where there is a difference between cash received or paid and the accrual method of accounting. The amount can be a source or use of cash depending on the mix of adjustments or receivables, accruals and other categories, driven by the timing of payment versus accounting for certain transactions. Historically, our working capital calculations have been predictable with only minor adjustments over comparable periods and we expect this to continue during the Initial Four Quarters.
- (6)
- Our credit facilities do not have any scheduled principal payments during the Initial Four Quarters and we expect that there will be no mandatory principal prepayments with respect to our credit facilities during such period. Amounts reflected during the Initial Four Quarters and on a pro forma basis for the year ended December 31, 2005 and the twelve months ended March 31, 2006 reflect the maturities of outstanding miscellaneous long-term debt.
- (7)
- The table below sets forth the number of outstanding shares of common stock upon the closing of this offering and the estimated per share and aggregate dividend amounts payable on such shares during the Initial Four Quarters.
| | | Dividends | ||||||
|---|---|---|---|---|---|---|---|---|
| | Number of Shares | |||||||
| | Per Share | Aggregate | ||||||
| | | | (in millions) | |||||
| Estimated dividends on our outstanding common stock | 21,637,020 | $ | 1.60 | $ | 34.6 | |||
- On August 12, 2006 up to 25% of the restricted share units ("RSUs") outstanding pursuant to our Long-Term Incentive and Share Award Plan may vest and additional shares in respect of such RSUs may be issued, subject to the satisfaction of time-based and performance-based vesting criteria. If all of these RSUs vest, the aggregate dividends payable during the Initial Four Quarters would increase by $0.2 million from the amount shown above. In addition, subject to the satisfaction of further performance-based critera, following August 12, 2006 dividend equivalents will be payable in cash on the remaining unvested performance-based RSUs. Such dividend equivalents would equal up to $0.3 million during the Initial Four Quarters and would be in addition to the amounts shown above.
23
- (8)
- Calculated as total debt (as defined in our credit facilities) divided by Adjusted EBITDA as of March 31, 2007, the most recent fiscal quarter prior to the end of the Initial Four Quarters for which we will be required to deliver a covenant compliance certificate under our credit facilities. See "Description of Indebtedness—Credit Facilities". Total debt is defined as the sum of all indebtedness of Reddy Group and its subsidiaries for borrowed money or evidenced by bonds, debentures, notes or similar instruments plus all capitalized lease obligations plus all synthetic lease obligations (in each case exclusive of intercompany indebtedness and, without duplication, any contingent liability in respect of the foregoing less proceeds from asset sales or casualty events held pending reinvestment or used to repay borrowings under our credit facilities). Our credit facilities require Reddy Group to maintain a total leverage ratio of no greater than 4.0 to 1.0 in order to be in covenant compliance and a total leverage ratio of no greater than 3.75 to 1.0 in order to pay dividends to Reddy Holdings for the purpose of paying dividends on the Reddy Holdings common stock. Our compliance with these ratios is determined as of the most recently ended fiscal quarter for which we are required to have delivered a covenant compliance certificate under our credit facilities.
- (9)
- Calculated as Adjusted EBITDA divided by cash interest expense (as defined in our credit facilities) as of March 31, 2007, the most recent fiscal quarter prior to the end of the Initial Four Quarters for which we will be required to deliver a covenant compliance certificate under our credit facilities. See "Description of Indebtedness—Credit Facilities". Cash interest expense is defined as the aggregate cash interest expense of Reddy Group and its subsidiaries for such applicable period determined in accordance with GAAP (including the portion of any cash payments made or accrued in respect of capital leases allocable to interest expense). Our credit facilities require Reddy Group to maintain an interest coverage ratio of no less than 3.25 to 1.0. Our compliance with this ratio is determined as of the most recently ended fiscal quarter for which we are required to have delivered a covenant compliance certificate under our credit facilities.
- (10)
- Under our credit facilities we generally are restricted from paying dividends to the extent that the amount of such dividends would exceed our Cumulative Distributable Cash (as defined in our credit facilities) for the period (taken as one accounting period) from July 1, 2005 to the end of our most recently ended fiscal quarter for which a covenant compliance certificate has been delivered to the lenders under our credit facilities. A summary of the definition of Cumulative Distributable Cash is set forth under "—Restrictions on Payment of Dividends—Credit Facilities". The amount of Cumulative Distributable Cash reflected above is calculated for the period from July 1, 2005 to March 31, 2007 (the most recent quarter prior to the end of the Initial Four Quarters for which we will be required to deliver a covenant compliance certificate under our credit facilities) after giving effect to $21.1 million in dividends paid following the completion of our initial public offering and prior to the date of this prospectus but prior to reducing Cumulative Distributable Cash for the actual payment of dividends during the Initial Four Quarters.
- (11)
- Calculated as the ratio of our EBITDA (as defined in the Reddy Holdings Indenture) to our consolidated interest expense (as defined in the Reddy Holdings indenture). The impact of our consolidated coverage ratio on our ability to pay dividends is described, and the definitions of EBITDA and consolidated interest expense are set forth, under "—Restrictions on Payment of Dividends—Reddy Holdings' 101/2% Senior Discount Notes due 2012".
- (12)
- Under the Reddy Holdings indenture we generally are restricted from paying dividends to the extent that the amount of such dividends would exceed our "buildup amount" (as defined in the Reddy Holdings indenture). A summary of the definition of buildup amount is set forth under "—Restrictions on Payment of Dividends—Reddy Holdings' 101/2% Senior Discount Notes due 2012". The buildup amount reflected above is calculated after giving effect to $21.1 million in dividends paid following the completion of our initial public offering and prior to the date of this prospectus but prior to reducing the buildup amount for the actual payment of dividends during the Initial Four Quarters.
- (13)
- Represents costs incurred in connection with our initial public offering for the termination of the monitoring agreement, the payment of transaction bonuses to certain employees and the payment of other fees and expenses.
24
- (14)
- We acquired two businesses in 2005, both of which businesses were acquired in the third quarter of 2005. We also completed two acquisitions in the first quarter of 2006. For the purposes of calculating pro forma Adjusted EBITDA, we have included the incremental Adjusted EBITDA of these businesses as if we had consummated those acquisitions at the beginning of the period in which such acquisition occurred. The incremental Adjusted EBITDA attributable to these acquired businesses is based upon the unaudited historical results prior to their respective acquisition dates and is adjusted to give effect to the continuing impact of elimination of expenses of the acquired businesses. We cannot assure you that the historical results of these businesses would not have been different from the results reflected in this adjustment if such results had been subject to audits by independent auditors, and any such differences may be material. In addition, this adjustment is not necessarily representative of the contribution of the acquired businesses to our results for future periods.
- (15)
- Represents the elimination of historical lease expense resulting from the purchase of certain leased real estate in the third quarter of 2005.
- (16)
- Our Adjusted EBITDA for the year ended December 31, 2005 and the twelve months ended March 31, 2006 include ongoing expenses associated with being a public company issuer, including director and officer liability insurance premiums, expenses relating to stockholders' meetings, printing expenses, investor relations expenses, additional filing fees, registrar and transfer agent fees, independent directors' fees, additional personnel costs, additional legal fees, listing fees, estimated incremental Public Company Accounting Oversight Board expenses, and miscellaneous fees only to the extent actually incurred in such period. In calculating our estimated pro forma cash available to pay dividends we have determined that such expenses will be approximately $750,000 on an annual basis and have included a prorated amount for the portion of each period prior to the completion of our initial public offering in our calculation of estimated pro forma cash available to pay dividends as we believe that there is a reasonable basis for our estimate.
Assumptions and Considerations
Based on a review and analysis conducted by our management and our board of directors, we believe that our minimum Adjusted EBITDA for the Initial Four Quarters will be at least $66.1 million, that we will have sufficient availability under the Cumulative Distributable Cash calculation contained in our credit facilities, based on our minimum Adjusted EBITDA for the Initial Four Quarters we would meet the total leverage and interest leverage ratios contained in our credit facilities and the consolidated coverage ratio set forth in the Reddy Holdings indenture and that we will have sufficient availability under the Reddy Holdings indenture buildup amount to pay dividends at the stated rate during the Initial Four Quarters. We have also determined that the assumptions set forth above are reasonable. We considered the following factors in establishing our belief concerning the minimum Adjusted EBITDA required to support our dividend policy:
- •
- our historical results of operations and financial condition, including our pro forma Adjusted EBITDA which was $84.8 million and $86.4 million for the year ended December 31, 2005 and the twelve months ended March 31, 2006, respectively;
- •
- our estimated cumulative consolidated net income (loss) and minimum Adjusted EBITDA and our belief that our actual cumulative consolidated net income (loss) and Adjusted EBITDA for the Initial Four Quarters will be at least this amount;
- •
- the matters discussed in the notes to the tables above;
- •
- the terms of our debt instruments, including our credit facilities and the Reddy Holdings indenture, which may restrict our ability to pay dividends;
- •
- our net capital expenditures of approximately $17.2 million and approximately $15.4 million for the year ended December 31, 2005 and the twelve months ended March 31, 2006, respectively, and our expected net capital expenditures of approximately $14.8 million for the Initial Four Quarters. Management believes that the amount of expected capital expenditures for the Initial Four Quarters is sufficient to maintain our present operations;
25
- •
- our operating expenses (excluding depreciation and amortization) of $42.0 million and $44.3 million for the year ended December 31, 2005 and the twelve months ended March 31, 2006, respectively, as well as our expected operating expenses (excluding depreciation and amortization) and other cash needs for the Initial Four Quarters;
- •
- an analysis of the impact of our intention to pay dividends at the level described above on our operations and performance based on prior years' results;
- •
- our belief that our revolving credit facilities would have had sufficient capacity to finance expected fluctuations in working capital and other cash needs, including the payment of dividends at the levels described above, although we currently do not intend to borrow under our revolving credit facilities to pay dividends;
- •
- other possible uses of cash with attractive rates of return;
- •
- potential sources of liquidity, including possible asset sales, and capital resources;
- •
- that LIBOR, which, at our option, will be the basis for interest calculations under our credit facilities, will not increase beyond currently anticipated levels;
- •
- the state of our business, the environment in which we operate and the various risks we face, including customer demand, competition, changes in our industry and regulatory and other risks and that they will remain consistent with previous periods; and
- •
- our assumption regarding the absence of extraordinary business events and risks that may adversely affect our business, results of operations or anticipated cash needs.
Our intended policy to distribute rather than retain a significant portion of the cash generated by our business as regular quarterly dividends is based upon the current assessment by our board of directors of the factors and assumptions listed above. If these factors and assumptions were to change, we would need to reassess that policy. Over time, our capital and other cash needs will be subject to increasing uncertainties and are more difficult to predict, which could affect whether we pay dividends and the level of any dividends we may pay in the future.
If our Adjusted EBITDA for the Initial Four Quarters were to fall below the $66.1 million level (or if our assumptions as to capital expenditures, interest expense, taxes, working capital requirements or required debt repayments are too low or if other assumptions stated above were to prove incorrect) or if events occurred which reduced our cumulative distributable cash calculation contained in our credit facilities or our "buildup amount" under the Reddy Holdings indenture we may need to either reduce or eliminate dividends or, to the extent we were permitted to do so under our indebtedness, to fund a portion of our dividends with borrowings or from other sources. A reduction in our Adjusted EBITDA for the Initial Four Quarters could also cause us to fail to satisfy the specific leverage ratio threshold that we must meet to be able to pay dividends under our credit facilities (see "—Restrictions on Payment of Dividends—Credit Facilities") and could also cause our interest coverage and total leverage ratios under our credit facilities to fall below the minimum required levels, in which case we would be in default under our credit facilities and would be required to either cure the default or obtain a waiver from the lenders under our credit facilities. Additionally, a reduction in our Adjusted EBITDA could also cause us to fail to satisfy the specific consolidated coverage ratio threshold that we must meet under the Reddy Holdings indenture (see "—Restrictions on Payment of Dividends—Reddy Holdings' 101/2% Senior Discount Notes due 2012") in order to be able to pay dividends. While we are permitted to fund the payment of dividends from borrowings under our revolving credit facility, if we were to use working capital or permanent borrowings to fund dividends, we would have less cash and/or borrowing capacity available for future dividends and other purposes, which could negatively impact our financial condition, our results of operations, our liquidity and our ability to maintain or expand our business. In addition, to the extent we finance capital expenditures with indebtedness, we will begin to incur incremental debt service obligations.
We cannot assure you that our Adjusted EBITDA will in fact equal or exceed the minimum level set forth above or that we will have sufficient capacity under our credit facilities or the Reddy Holdings indenture, and our belief that we will equal or exceed such levels is subject to all of the risks, considerations and factors identified in other sections of this prospectus, including those identified in the section entitled "Risk Factors".
26
As noted above, we have estimated our initial dividend level and the minimum Adjusted EBITDA required to pay dividends at that level only for the Initial Four Quarters. Moreover, we cannot assure you that we will pay dividends during or following such period at the level estimated above, or at all. Dividend payments are within the absolute discretion of our board of directors and will be dependent upon many factors and future developments that could differ materially from our current expectations. Over time, our capital and other cash needs will invariably be subject to uncertainties, which could affect the level of any dividends we pay in the future.
Restrictions on Payment of Dividends
Our ability to pay dividends will be restricted by current and future agreements governing our debt, including our credit facilities and the Reddy Holdings indenture and by Delaware law.
Credit Facilities
Our credit facilities enable us to pay dividends, subject to the satisfaction of financial covenants, conditions and other restrictions. Under our credit facilities, the payment of dividends to our stockholders is restricted as follows:
- •
- Under the restricted payments covenant, we generally are restricted from paying dividends. However, the covenant includes an exception for paying dividends in an amount not greater than our Cumulative Distributable Cash for the period (taken as one accounting period) from July 1, 2005 to the end of our most recently-ended fiscal quarter for which a covenant compliance certificate under our credit facilities has been delivered to the lenders.
"Cumulative Distributable Cash" is defined under our credit facilities as:
- (a)
- $10,000,000, plus
- (b)
- "Available Cash" for the period (taken as one accounting period) from July 1, 2005 to the end of our most recently-ended fiscal quarter for which a covenant compliance certificate under our credit facilities has been delivered to the lenders,plus
- (c)
- the amount of any net cash proceeds received by Reddy Holdings from issuances of shares of Reddy Holdings capital stock after the completion of the initial public offering of our common stock to the extent we have contributed such proceeds to Reddy Group,less
- (d)
- (i) the amount of payments made by Reddy Group to Reddy Holdings to fund dividend payments on, or repurchases of, Reddy Holdings capital stock (other than certain repurchases from former employees, directors and officers) or to pay cash interest expense on, or redeem or repurchase, Reddy Holdings notes, and (ii) amounts used to make certain restricted investments,less
- (e)
- to the extent occurring after the end of the most recently ended reference period and until taken into account in determining Available Cash for the fiscal quarter in which such event has occurred, (i) cash payments for acquisitions (except to the extent funded with indebtedness or proceeds of asset sales or casualty events) and (ii) mandatory repayments of loans under our credit facilities (other than under the revolving credit facility) during a dividend suspension period.
"Available Cash" for any fiscal quarter is defined under our credit facilities as:
- (a)
- Adjusted EBITDA for such fiscal quarter,plus,
- (b)
- to the extent not included in Adjusted EBITDA for any fiscal quarter, the cash amount realized in respect of extraordinary, non-recurring or unusual gains, andless
- (c)
- (i) to the extent included in net income used to calculate for any fiscal quarter such Adjusted EBITDA for any fiscal quarter, the amount of Reddy Group's cash interest expense, Reddy Group's cash tax expense, the cash cost of any extraordinary, nonrecurring or unusual losses and cash payments on account of non-cash losses or non-cash charges, (ii) capital expenditures (except to the extent funded with indebtedness (other than the revolving credit facility) or proceeds of asset sales
27
or casualty events), (iii) cash payments for acquisitions (except to the extent funded with indebtedness or proceeds of asset sales or casualty events) and (iv) payments and prepayments of the principal amount of indebtedness (other than payments and prepayments of the revolving credit facility) other than to the extent funded with indebtedness (other than indebtedness under our revolving credit facility).
"Adjusted EBITDA" is defined under our credit facilities to be the sum of:
- (a)
- net income,plus
- (b)
- to the extent deducted in determining net income, the sum of (i) amounts attributable to depreciation and amortization, (ii) income tax expense, (iii) interest expense, (iv) any other non-cash charges (less non-cash income) for which no cash reserves (or receivables) have been or will be set aside (or created) including non-cash compensation expenses, (v) any loss from the extinguishment of indebtedness, (vi) any fees paid prior to the completion of the initial public offering of our common stock in respect of the monitoring agreement that was terminated in connection with the initial public offering, (vii) transaction adjustments (as defined in our credit facilities and including the fees and expenses incurred in connection with the initial public offering and the related transactions), (viii) all fees and expenses incurred in connection with permitted acquisitions to the extent accounted for as expenses, (ix) for the four fiscal quarters ending after September 30, 2004, an amount equal to the sum of (x) the special transaction payments paid to certain members of management and certain directors in connection with the issuance of the Reddy Holdings notes not to exceed $1.3 million plus (y) an amount not to exceed $4.0 million for other expenses incurred in connection with the issuance of the Reddy Holdings notes and the related amendment to our credit facilities which was in effect at the time of the Reddy Holdings notes offering.
- •
- Under our credit facilities, Reddy Group may only pay dividends to Reddy Holdings to make dividend payments on Reddy Holdings' stock if Reddy Group's total leverage ratio for the most recently ended fiscal quarter for which a covenant compliance certificate has been delivered is less than or equal to 3.75 to 1.0. If at the end of any fiscal quarter, Reddy Group's leverage ratio is greater than 3.75 to 1.0, and therefore Reddy Group is not permitted to pay dividends, Reddy Group is required by our credit facilities to apply 50% of the Available Cash generated during each such quarter to make a mandatory prepayment of the loans under our credit facilities. As a result of this provision, our ability to pay dividends at the specified rate or at all for the Initial Four Quarters may be significantly impaired if Reddy Group's leverage ratio is greater than 3.75 to 1.0 at the end of any fiscal quarter during the Initial Four Quarters.
- •
- Our credit facilities preclude us and Reddy Group from declaring any dividends if a default under our credit facilities has occurred and is continuing. In addition, we and Reddy Group are precluded from paying any dividends if an event of default under our credit facilities has occurred and is continuing. In particular, it will be an event of default if Reddy Group's total leverage ratio exceeds 4.0 to 1.0 or Reddy Group's interest coverage ratio is less than 3.25 to 1.0.
The foregoing is a summary of the actual provisions that are included in our credit facilities. The credit agreement governing our credit facilities has been incorporated by reference as an exhibit to the registration statement of which this prospectus forms a part. For a description of additional terms relating to our credit facilities, see "Description of Indebtedness—Credit Facilities".
Reddy Holdings' 101/2% Senior Discount Notes due 2012
The indenture governing the Reddy Holdings notes restricts the amount of dividends, distributions and other restricted payments we may pay. Under this indenture, we are restricted from paying dividends on our common stock unless, at the time of such payment:
- •
- no default or event of default has occurred and is continuing or would occur as a consequence thereof;
- •
- the consolidated coverage ratio set forth in the Reddy Holdings indenture exceeds 2.0 to 1.0; and
- •
- there is sufficient capacity under the buildup amount under the Reddy Holdings indenture.
28
The consolidated coverage ratio under the Reddy Holdings indenture means the ratio of our EBITDA for the most recent four fiscal quarters to our consolidated interest expense for such four quarter period. "EBITDA" under the Reddy Holdings indenture is defined as the sum of our consolidated net income plus our income tax expense, our interest expense, our depreciation and amortization expense, unrealized non-cash gains or losses or non-cash charges in respect of hedging obligations required to be taken under generally accepted accounting principles, unrealized foreign currency translation gains or losses and all other non-cash charges, except to the extent representing an accrual or reserve for a future cash expenditure. "Consolidated net income" under the Reddy Holdings indenture is defined as net income of Reddy Holdings and its restricted subsidiaries: plus or minus cash dividends received on investments or equity in net losses of persons other than restricted subsidiaries, respectively; provided that the following are not included in consolidated net income: (i) net income or loss of subsidiaries acquired in pooling of interests transactions for any period prior to the date of their acquisition, (ii) any net income of a subsidiary restricted in the payment of a dividend (other than certain permitted restrictions, including those under our credit facilities), (iii) gains or losses from non-ordinary course asset sales, (iv) extraordinary gains or losses, (v) the cumulative effect of changes in accounting principles, (vi) non-recurring fees and expenses and write offs of deferred financing costs related to the financing transactions in connection with the 2003 merger of Cube and Packaged Ice and, (vii) any fees, charges, costs or expenses relating to our initial public offering and paid in cash, to the extent deducted in the determination of consolidated net income. "Consolidated interest expense" under the Reddy Holdings indenture is defined as total interest expense plus, to the extent not included in total interest expense, (i) interest expense attributable to capital leases, (ii) amortization of debt discount and issuance costs, (iii) capitalized interest, (iv) non-cash interest expense, (v) fees on letters of credit, (vi) net payments pursuant to hedging obligations, (vii) dividends accrued on certain disqualified stock (viii) interest incurred in connection with investments in discontinued operations, (ix) interest on guaranteed indebtedness and (x) cash contributions to employee stock ownership plans to the extent they are used to pay interest or fees on indebtedness incurred by such plans. We are generally required to calculate our consolidated coverage ratio on a pro forma basis to give effect to incurrences and repayments of indebtedness as well as acquisitions and dispositions.
The buildup amount equals 50% of our consolidated net income accrued during the period (treated as one accounting period) from July 1, 2003 to the end of the most recent fiscal quarter for which internal financial statements are available (or, if such consolidated net income is a deficit, minus 100% of such deficit), plus, the net cash proceeds of the issuance of capital stock, subject to certain exceptions, and any cash capital contribution received by us from our stockholders in each case after August 15, 2003 plus the amount by which our indebtedness is reduced on our balance sheet as a result of the conversion or exchange of such indebtedness for our capital stock, plus the net reduction in certain restricted investments made by us, less the amount of certain restricted payments we make from time to time, including, among other things, the payment of cash dividends.
In addition, regardless of whether we could make any restricted payments under the buildup amount provision referred to above, we may (1) make dividend payments at any time in an aggregate amount of up to $15.0 million if no default has occurred and is continuing under the Reddy Holdings indenture and (2) pay dividends on our capital stock of up to 6.0% per year of the cash proceeds (net of underwriters' fees, discounts, commissions or other expenses paid by us) received by us from any underwritten public offerings of our common stock subject to specified conditions. We are currently able to pay approximately $7.0 million annually in dividends under this 6.0% provision as a result of the initial public offering of our common stock completed in August 2005. However, the amount of dividend payments permitted under this 6.0% provision correspondingly reduces the amount we would otherwise have available to us under the buildup amount for restricted payments, including dividends.
We estimate that as of March 31, 2006, we would have been able to pay dividends under the Reddy Holdings indenture in an amount equal to $120.2 million (which amount is net of $12.8 million in dividends paid since the closing of our initial public offering and prior to March 31, 2006 and $8.3 million in dividends declared on March 15, 2006 and paid on April 17, 2006). Based on the foregoing, and based on assumptions used in our calculation of estimated Adjusted EBITDA for the Initial Four Quarters, we believe that we will have sufficient capacity under our buildup amount calculation to pay dividends at the anticipated levels during the Initial Four
29
Quarters. As of March 31, 2006, our consolidated coverage ratio would be approximately 3.0 to 1.0, which is in excess of the minimum level required to pay dividends under the Reddy Holdings indenture.
For a more complete description of the Reddy Holdings indenture, see "Description of Indebtedness—Reddy Holdings' 101/2% Senior Discount Notes due 2012".
Delaware Law
Under Delaware law, Reddy Holdings' board of directors may not authorize payment of a dividend unless it is either paid out of Reddy Holdings' "surplus" (which is defined as total assets at fair market value minus total liabilities, minus statutory capital), or if Reddy Holdings does not have a surplus, it is paid out of Reddy Holdings' net profits for the fiscal year in which the dividend is declared and/or the preceding fiscal year. The value of a corporation's assets can be measured in a number of ways and may not necessarily equal their book value. The value of our capital may be adjusted from time to time by our board. Our board of directors may base this determination on our financial statements, a fair valuation of our assets or another reasonable method. Although we believe we will be permitted to pay dividends at the anticipated levels during the Initial Four Quarters in compliance with Delaware law, Reddy Holdings' board will periodically seek to assure itself that the statutory requirements will be met before actually declaring dividends. In future periods, our board of directors may seek opinions from outside valuation firms to the effect that our solvency or assets are sufficient to allow payment of dividends, and such opinions may not be forthcoming. If we sought and were not able to obtain such an opinion, we likely would not be able to pay dividends. Reddy Holdings is a holding company and conducts all of its operations through its subsidiaries. As a result, Reddy Holdings will rely principally on dividend distributions from Reddy Group to have funds available for the payment of dividends. Reddy Group, like Reddy Holdings, is incorporated in Delaware. As a result, Reddy Group is subject to the same considerations and limitations under Delaware law on the declaration of dividends.
30
The following table sets forth our cash and cash equivalents and capitalization as of March 31, 2006.
The information below should be read in conjunction with "Selected Historical Consolidated Financial Data", "Description of Indebtedness" and our consolidated financial statements included elsewhere in this prospectus.
| | As of March 31, 2006 | ||||||
|---|---|---|---|---|---|---|---|
| | (in thousands) | ||||||
Cash and cash equivalents | $ | 10,265 | |||||
Debt (including current maturities): | |||||||
| Credit facilities: | |||||||
| Revolving credit facility(1) | $ | — | |||||
| Term loan facility | 240,000 | ||||||
| Reddy Holdings' notes(2) | 115,560 | ||||||
| Other debt | 289 | ||||||
Total debt (including current maturities) | 355,849 | ||||||
| Stockholders' equity | |||||||
| Common stock(3) | 216 | ||||||
| Additional paid-in capital | 213,255 | ||||||
| Other | (44,397 | ) | |||||
| Total stockholders' equity | 169,074 | ||||||
| Total capitalization | $ | 524,923 | |||||
- (1)
- As of March 31, 2006, we had no outstanding borrowings under our revolving credit facility and $54.2 million of availability under our revolving credit facility, which was net of outstanding letters of credit of $5.8 million.
- (2)
- Represents the accreted value of the $150.5 million aggregate principal amount at maturity of the Reddy Holdings notes issued at a price of 66.333% and includes amortization at a rate of 101/2% per annum through March 31, 2006.
- (3)
- Common stock, $0.01 par value; 75,000,000 shares authorized, 21,637,020 shares issued and outstanding as of March 31, 2006 excludes 43,075 shares available for future issuance under our Long-Term Incentive and Share Award Plan.
31
Since August 12, 2005, our common stock has been listed on the New York Stock Exchange under the symbol "FRZ." The following table sets forth, on a per share basis and for the period indicated, the high and low last reported sale prices for our common stock reported by the New York Stock Exchange.
| | NYSE Market Price | | |||||||
|---|---|---|---|---|---|---|---|---|---|
| | Cash dividends declared per share(1) | ||||||||
| | High | Low | |||||||
| 2005: | |||||||||
| Third quarter (commencing August 10, 2005) | $ | 21.69 | $ | 19.05 | $ | 0.20788 | |||
| Fourth quarter | $ | 22.51 | $ | 20.51 | $ | 0.38250 | |||
| 2006: | |||||||||
| First quarter | $ | 22.84 | $ | 19.52 | $ | 0.38250 | |||
| Second quarter (through May 23, 2006) | $ | 23.73 | $ | 21.55 | — | ||||
- (1)
- Declared dividends were paid on or about the fifteenth day of the first month of the following quarter.
On May 23, 2006, the last sale price of our common stock reported by the New York Stock Exchange was $21.55 per share. As at May 1, 2006 there were approximately 128 registered holders of record of our common stock.
32
SELECTED HISTORICAL CONSOLIDATED FINANCIAL DATA
The following table sets forth, for the periods and dates indicated, selected historical financial data of Reddy Holdings. Reddy Holdings and its wholly owned subsidiary Cube were formed on May 8, 2003 for the purpose of acquiring Packaged Ice and effecting certain capital transactions in connection with such acquisition. On August 15, 2003 Cube merged with and into Packaged Ice, with Packaged Ice being the surviving corporation. In connection with the merger Packaged Ice was renamed Reddy Group. Reddy Holdings and Cube conducted no operations during the period from May 8, 2003 through August 14, 2003. In the Selected Historical Consolidated Financial Data, "Successor" refers to Reddy Holdings and its subsidiaries while "Predecessor" refers to pre-merger Reddy Group and its subsidiaries, which was then known as "Packaged Ice, Inc."
Our selected historical financial data as of December 31, 2003, 2004 and 2005, for the period from May 8, 2003 through December 31, 2003 and for the years ended December 31, 2004 and 2005 have been derived from the audited financial statements of the Successor included elsewhere in this prospectus. Our selected historical financial data for the period from January 1, 2003 through August 14, 2003 have been derived from the audited financial statements of the Predecessor included elsewhere in this prospectus. Our selected historical financial data as of December 31, 2002 and 2001 and for the years ended December 31, 2002 and 2001 have been derived from the financial statements of the Predecessor for such years, which are not included in this prospectus. Our selected historical financial data as of March 31, 2006 and for the three-month periods ended March 31, 2006 and March 31, 2005 have been derived from the unaudited condensed financial statements of the Successor included elsewhere in this prospectus. The unaudited condensed financial statements as of March 31, 2006 and for the three months ended March 31, 2006 and 2005 include all adjustments that are, in the opinion of management, necessary for a fair presentation of our financial position and results of operations for the period presented. Operating results for the three months ended March 31, 2006 are not necessarily indicative of the results that may be expected for the entire year.
The information presented below should be read in conjunction with "Management's Discussion and Analysis of Financial Condition and Results of Operations" and all the historical financial statements included elsewhere in this prospectus.
33
| | Predecessor | | Successor | |||||||||||||||||||||||||
|---|---|---|---|---|---|---|---|---|---|---|---|---|---|---|---|---|---|---|---|---|---|---|---|---|---|---|---|---|
| | Year Ended December 31, | | | May 8, 2003 (Date of Inception) to December 31, 2003 | Year Ended December 31, | Three Months Ended March 31, | ||||||||||||||||||||||
| | January 1, 2003 to August 14, 2003 | | ||||||||||||||||||||||||||
| | 2001 | 2002 | | 2004 | 2005 | 2005 | 2006 | |||||||||||||||||||||
| (in thousands, except per share amounts) | ||||||||||||||||||||||||||||
| Operating Data: | ||||||||||||||||||||||||||||
| Revenues: | ||||||||||||||||||||||||||||
| Ice products | $ | 223,019 | $ | 216,654 | $ | 139,618 | $ | 79,954 | $ | 268,319 | $ | 304,755 | $ | 35,989 | $ | 41,738 | ||||||||||||
| Non-ice products and operations | 21,228 | 19,006 | 11,651 | 6,965 | 17,408 | 15,017 | 3,255 | 3,070 | ||||||||||||||||||||
| Total | $ | 244,247 | $ | 235,660 | $ | 151,269 | $ | 86,919 | $ | 285,727 | $ | 319,772 | $ | 39,244 | $ | 44,808 | ||||||||||||
| Cost of sales (excluding depreciation) | 156,434 | 144,852 | 91,642 | 52,732 | 173,066 | 196,223 | 31,679 | 34,413 | ||||||||||||||||||||
| Depreciation expense related to cost of sales | 19,283 | 18,567 | 10,881 | 5,883 | 17,850 | 18,838 | 4,741 | 4,714 | ||||||||||||||||||||
| Gross profit | 68,530 | 72,241 | 48,746 | 28,304 | 94,811 | 104,711 | 2,824 | 5,681 | ||||||||||||||||||||
| Operating expenses | 37,372 | 33,739 | 18,598 | 13,430 | 36,928 | 42,030 | 8,834 | 11,089 | ||||||||||||||||||||
| Depreciation and amortization expense | 14,533 | 6,137 | 3,647 | 1,733 | 5,335 | 5,691 | 1,415 | 1,428 | ||||||||||||||||||||
| Loss (gain) on disposition of assets | (49 | ) | 4,345 | (11 | ) | — | 398 | 1,848 | 149 | 104 | ||||||||||||||||||
| Impairment of assets | — | 7,363 | — | — | — | 5,725 | — | — | ||||||||||||||||||||
| Management agreement termination fees and transaction bonuses and expenses | — | — | — | — | — | 6,171 | — | — | ||||||||||||||||||||
| Other income, net | 19 | 161 | 116 | — | — | — | — | — | ||||||||||||||||||||
| Loss on extinguishment of debt | — | 2,494 | — | — | — | 28,189 | — | — | ||||||||||||||||||||
| Interest expense | (36,686 | ) | (34,870 | ) | (21,063 | ) | (10,370 | ) | (25,105 | ) | (34,421 | ) | (9,308 | ) | (6,954 | ) | ||||||||||||
| Income tax benefit (expense) | — | — | — | (1,053 | ) | (10,494 | ) | 7,248 | 6,702 | 5,655 | ||||||||||||||||||
| Cumulative effect of change in accounting principle(1) | — | (73,230 | ) | — | — | — | — | — | — | |||||||||||||||||||
| Net income (loss) | (19,993 | ) | (84,788 | ) | 5,565 | 1,718 | 16,551 | (12,116 | ) | (10,180 | ) | (8,239 | ) | |||||||||||||||
| Net income (loss) available to common stockholders | $ | (23,451 | ) | $ | (88,598 | ) | $ | 2,999 | $ | (2,713 | ) | $ | 5,968 | $ | (12,116 | ) | $ | (10,180 | ) | $ | (8,239 | ) | ||||||
| Basic net income (loss) per share(2): | ||||||||||||||||||||||||||||
| Net income (loss) available to common stockholders before cumulative effect of change in accounting principle | $ | (1.19 | ) | $ | (0.76 | ) | $ | 0.15 | $ | (0.35 | ) | $ | 0.44 | $ | (0.72 | ) | $ | (0.74 | ) | $ | (0.39 | ) | ||||||
| Cumulative effect of change in accounting principle | — | (3.64 | ) | — | — | — | — | — | — | |||||||||||||||||||
| Net income (loss) available to common stockholders | $ | (1.19 | ) | $ | (4.40 | ) | $ | 0.15 | $ | (0.35 | ) | $ | 0.44 | $ | (0.72 | ) | $ | (0.74 | ) | $ | (0.39 | ) | ||||||
| Weighted average common shares outstanding | 19,756 | 20,157 | 20,159 | 7,858 | 13,675 | 16,760 | 13,728 | 21,273 | ||||||||||||||||||||
| Diluted net income (loss) per share(2): | ||||||||||||||||||||||||||||
| Net income (loss) available to common stockholders before cumulative effect of change in accounting principle | $ | (1.19 | ) | $ | (0.76 | ) | $ | 0.14 | $ | (0.35 | ) | $ | 0.44 | $ | (0.72 | ) | $ | (0.74 | ) | $ | (0.39 | ) | ||||||
| Cumulative effect of change in accounting principle | — | (3.64 | ) | — | — | — | — | — | — | |||||||||||||||||||
| Net income (loss) available to common stockholders | $ | (1.19 | ) | $ | (4.40 | ) | $ | 0.14 | $ | (0.35 | ) | $ | 0.44 | $ | (0.72 | ) | $ | (0.74 | ) | $ | (0.39 | ) | ||||||
| Weighted average common shares outstanding | 19,756 | 20,157 | 20,808 | 7,858 | 13,703 | 16,760 | 13,728 | 21,273 | ||||||||||||||||||||
| Cash dividends declared per share | $ | — | $ | — | $ | — | $ | — | $ | 0.59 | $ | 0.76 | $ | — | $ | 0.3825 | ||||||||||||
| Balance Sheet Data: | ||||||||||||||||||||||||||||
| Total cash and cash equivalents and restricted cash(3) | $ | 16,913 | $ | 6,500 | $ | 12,801 | $ | 4,478 | $ | 33,997 | $ | $ | 10,265 | |||||||||||||||
| Working capital(4) | (4,234 | ) | (6,079 | ) | 7,651 | 2,208 | 33,083 | 15,907 | ||||||||||||||||||||
| Total assets | 460,784 | 347,573 | 614,336 | 588,620 | 603,764 | 580,840 | ||||||||||||||||||||||
| Total debt | 332,667 | 305,214 | 330,947 | 437,066 | 352,960 | 355,849 | ||||||||||||||||||||||
| Total stockholders' equity (deficit) | 52,477 | (37,149 | ) | 191,318 | 82,933 | 183,183 | 169,074 | |||||||||||||||||||||
| Other Financial Data: | ||||||||||||||||||||||||||||
| Net cash provided by (used in): | ||||||||||||||||||||||||||||
| Cash flows—operating activities | $ | 19,153 | $ | 32,690 | $ | (4,846 | ) | $ | 30,092 | $ | 47,786 | $ | 55,587 | $ | (14,662 | ) | $ | (9,376 | ) | |||||||||
| Cash flows—investing activities | (7,602 | ) | (11,595 | ) | (6,612 | ) | (206,128 | ) | (30,205 | ) | (20,551 | ) | (5,341 | ) | (5,008 | ) | ||||||||||||
| Cash flows—financing activities | (2,365 | ) | (24,808 | ) | 11,664 | 188,837 | (25,904 | ) | (5,517 | ) | 18,341 | (9,348 | ) | |||||||||||||||
| Capital expenditures(5) | 16,510 | 14,403 | 7,848 | 13,721 | 15,988 | 21,723 | 5,729 | 3,957 | ||||||||||||||||||||
| Proceeds from dispositions | 10,968 | 3,378 | 1,236 | 311 | 2,657 | 2,108 | 388 | 353 | ||||||||||||||||||||
- (1)
- Effective January 1, 2002, we adopted SFAS No. 142,Accounting for Goodwill and Other Intangible Assets,which provides that goodwill and other intangible assets with indefinite lives shall not be amortized and shall be tested for impairment of value on an annual basis. In connection with the adoption of SFAS No. 142, we recorded an impairment of goodwill of $73.2 million, based on an independent appraisal, as a cumulative effect of change in accounting principle as of January 1, 2002.
- (2)
- Net income (loss) per share is calculated by dividing net income (loss) by the weighted average common shares outstanding.
- (3)
- Includes restricted cash of $6.7 million at December 31, 2001, which was used to collateralize outstanding standby letters of credit.
- (4)
- Working capital is defined as current assets less current liabilities.
- (5)
- Excludes the costs of acquisitions. Capital expenditures for the period May 8, 2003 (Date of Inception) to December 31, 2003 and the year ended December 31, 2005 include $10.5 million and $2.5 million, respectively, related to the purchase of leased assets.
34
MANAGEMENT'S DISCUSSION AND ANALYSIS OF
FINANCIAL CONDITION AND RESULTS OF OPERATIONS
The following discussion summarizes the significant factors affecting our results of operations and financial condition during the three month periods ended March 31, 2006 and March 31, 2005 and the three year period ended December 31, 2005. This discussion contains forward-looking statements that involve risks and uncertainties. Our actual results could differ materially from those anticipated in the forward-looking statements for many reasons, including the risks described in "Forward-Looking Statements," "Risk Factors" and elsewhere in this prospectus. You should read the following discussion with "Selected Historical Consolidated Financial Data" and all the historical financial statements included elsewhere in this prospectus.
Overview
We are the largest manufacturer and distributor of packaged ice in the United States and currently serve approximately 82,000 customer locations in 31 states and the District of Columbia. We operate in two business segments—ice products and non-ice products and operations. Ice products accounted for approximately 94% of revenues in the year ended December 31, 2004, 95% of revenues in the year ended December 31, 2005, 92% of revenues in the three months ended March 31, 2005 and 93% of revenues in the three months ended March 31, 2006. Our ice products business segment consists of:
- •
- the traditional manufacture and delivery of ice from a central point of production to the point of sale; and
- •
- the installation and operation of The Ice Factory, our proprietary equipment located in our customers' high volume locations that produces, packages and stores ice through an automated, self-contained system.
Our other business segment, non-ice products and operations, consists of refrigerated warehousing for third parties and the manufacture and sale of bottled water.
Seasonality. Our results of operations are highly seasonal, characterized by peak demand during the warmer months of May through September, with an extended peak selling season in the southern United States. As a result of this seasonality and the fixed costs in our business, the proportion of revenues earned in our ice and non-ice business segments and the ratio of costs to revenues in any given quarter are not necessarily indicative of the ratios for a full year. Revenues within specific markets can also be affected by weather conditions, with cool or rainy weather negatively impacting demand and extremely hot weather increasing our costs as we respond to excess customer demand for our products. Approximately 69%, 68% and 66% of our revenues occurred during the second and third calendar quarters in 2005, 2004 and 2003, respectively. The higher level of sales in 2005 was primarily due to the effects of the hurricane season, which caused a significant increase in sales during the third quarter of 2005. The decrease in 2003 was primarily due to the timing of our 2003 acquisitions, which occurred in the fourth quarter of 2003. As a result of seasonal revenue declines and a less than proportional decline in certain expenses during the first and fourth quarters, we typically experience lower profit margins resulting in losses during these periods. In addition, because a significant portion of our annual sales are generated during the second and third calendar quarters, our annual results of operations may fluctuate significantly if the weather during these periods is cool or rainy. For additional information concerning the impact of seasonality on our results of operations, see "—General Economic Trends and Seasonality".
Predecessor and Successor. On August 15, 2003, Packaged Ice, Inc. merged with Cube Acquisition Corp., a wholly owned subsidiary of Reddy Ice Holdings, Inc. Packaged Ice was the surviving corporation and became a wholly owned subsidiary of Reddy Holdings, which was established on May 8, 2003. In connection with the merger, Packaged Ice was renamed Reddy Ice Group, Inc. Reddy Holdings and Reddy Group are collectively referred to as the "Successor". Packaged Ice prior to the merger is referred to as the "Predecessor".
In accordance with GAAP, we have separated our historical financial results for the Predecessor and the Successor. The separate presentation is required under GAAP in situations when there is a change in accounting basis, which occurred when purchase accounting was applied to the acquisition of the Predecessor. Purchase accounting requires that the historical carrying value of assets acquired and liabilities assumed be adjusted to fair
35
value, which may yield results that are not comparable on a period-to-period basis due to the different, and sometimes higher, cost basis associated with the allocation of the purchase price. In addition, at the time of the acquisition of the Predecessor, we experienced changes in our business relationships as a result of the entry into the new employment agreements with members of our management described under "Management—Executive Compensation and Incentive Programs—Employment Agreements," the financing transactions for the acquisition of the Predecessor and transactions with our stockholders described under "Certain Relationships and Related Transactions," and the purchase of $9.4 million of leased equipment which was consummated simultaneously with the acquisition of the Predecessor. There were no material changes to the operations or customer relationships of the business as a result of the acquisition of the Predecessor.
We believe that this separate presentation may impede the ability of users of our financial information to understand our operating and cash flow performance. Consequently, in order to enhance an analysis of our operating results and cash flows, we have presented our operating results and cash flows on a combined basis for the twelve month period ended December 31, 2003. This combined presentation for the twelve month period ended December 31, 2003 simply represents the mathematical addition of the pre-merger results of operations of the Predecessor for the period from January 1, 2003 to August 14, 2003 and the results of operations of the Successor for the period from May 8, 2003 to December 31, 2003. The Successor conducted no operations from the date of formation of Reddy Holdings and Cube, May 8, 2003, until the merger on August 14, 2003. These combined results are not intended to represent what our operating results would have been had the merger occurred at the beginning of the period. A reconciliation showing the mathematical combination of our operating results for such periods is included herein.
In evaluating our results of operations and financial performance, our management has used the combined results for the twelve months ended December 31, 2003 as a single measurement period. Due to the highly seasonal nature of our business, we believe that comparisons among the full year results for 2005 and 2004 and either the Predecessor's results for the period from January 1, 2003 to August 14, 2003 or the Successor's results for the period from May 8, 2003 to December 31, 2003 are not relevant or helpful to investors. We believe this combined presentation provides relevant information for investors.
Revenues. Our revenues primarily represent sales of packaged ice, packaged ice bags for use in our Ice Factory equipment, bottled water and cold storage services. There is no right of return with respect to these products or services. A portion of our revenues also represents fees earned under management agreements for Ice Factories located outside our primary territories that are recognized as earnings under contract terms.
Cost of Sales (Excluding Depreciation). Our cost of sales (excluding depreciation) consists of costs related to the manufacture and distribution of our products, including, in particular:
- •
- manufacturing and distribution labor costs;
- •
- raw materials (primarily of polyethylene-based plastic bags);
- •
- product delivery expenses, including fuel and vehicle rental expense related to products delivered by our own distribution network, as well as fees paid to distributors who deliver ice to our customers on our behalf;
- •
- utility expenses (primarily electricity used in connection with the manufacturing, storage and distribution processes); and
- •
- Ice Factory-related costs associated with customer service representatives and machine technicians (note, however, that Ice Factories generally do not increase our plant occupancy, delivery or utility costs).
Depreciation Expense Related to Cost of Sales and Depreciation and Amortization Expense. Depreciation and amortization are divided into two line items—depreciation expense related to cost of sales and depreciation and amortization expense. Depreciation expense related to cost of sales consists of depreciation expense for our production and distribution equipment. Depreciation and amortization expense consists of depreciation and amortization expense for our selling, general and administrative functions.
36
Operating Expenses. Our operating expenses are costs associated with selling, general and administrative functions. These costs include executive officers' compensation, office and administrative salaries, insurance, legal and other professional services and costs associated with leasing office space. Labor costs, including associated payroll taxes and benefit costs but excluding non-cash stock-based compensation expense, included in operating expenses represented approximately 7% of revenues in 2005 and 2004, and approximately 12% of revenues in the three months ended March 31, 2006 and 2005.
Facilities. At March 31, 2006, we owned or operated 58 ice manufacturing facilities, 54 distribution centers, approximately 79,000 merchandisers (cold storage units installed at customer locations), approximately 3,000 Ice Factories, five refrigerated warehouses and one bottled water plant. As of the same date, we had an aggregate daily ice manufacturing capacity of approximately 17,000 tons.
Three Months Ended March 31, 2006 Compared to Three Months Ended March 31, 2005
| | Three Months Ended March 31, | ||||||
|---|---|---|---|---|---|---|---|
| | 2005 | 2006 | |||||
| | (in thousands) | ||||||
| Consolidated Results | |||||||
| Revenues | $ | 39,244 | $ | 44,808 | |||
| Cost of sales (excluding depreciation) | 31,679 | 34,413 | |||||
| Depreciation expense related to cost of sales | 4,741 | 4,714 | |||||
| Gross profit | 2,824 | 5,681 | |||||
| Operating expenses | 8,834 | 11,089 | |||||
| Depreciation and amortization expense | 1,415 | 1,428 | |||||
| Loss on dispositions of assets | 149 | 104 | |||||
| Loss from operations | (7,574 | ) | (6,940 | ) | |||
| Interest expense | 9,308 | 6,954 | |||||
| Loss before income taxes | (16,882 | ) | (13,894 | ) | |||
| Income tax benefit | 6,702 | 5,655 | |||||
| Net loss | $ | (10,180 | ) | $ | (8,239 | ) | |
Ice Operations: | |||||||
| Revenues | $ | 35,989 | $ | 41,378 | |||
| Cost of sales (excluding depreciation) | 29,464 | 32,351 | |||||
| Depreciation expense related to cost of sales | 4,466 | 4,464 | |||||
| Operating expenses | 8,317 | 10,700 | |||||
Non-Ice Operations: | |||||||
| Revenues | $ | 3,255 | $ | 3,070 | |||
| Cost of sales (excluding depreciation) | 2,215 | 2,062 | |||||
| Depreciation expense related to cost of sales | 275 | 250 | |||||
| Operating expenses | 517 | 389 | |||||
Revenues: Revenues increased $5.6 million from $39.2 million for the three months ended March 31, 2005 to $44.8 million for the three months ended March 31, 2006. This increase was primarily due to the effects of higher average pricing for our ice products, increases in ice volume sales due to warmer and drier average weather conditions in our markets and the continuing positive effects of package sizing initiatives, which consisted primarily of converting a portion of our ice sales from seven to ten pound bags.
37
Cost of Sales (Excluding Depreciation): Cost of sales (excluding depreciation) increased $2.7 million from $31.7 million for the three months ended March 31, 2005 to $34.4 million for the three months ended March 31, 2006. This increase in cost of sales was primarily due to increased costs of plastic bags, electricity, fuel and third party distribution expense related to sales volume increases. Bag costs and fuel costs also increased due to higher market prices of energy related items. Partially offsetting these increases was a $0.6 million decrease in insurance costs, primarily health insurance, and a $0.4 million decrease in other employee benefit costs.
Labor costs, including associated payroll taxes and benefit costs (including health insurance), accounted for approximately 32% and 36% of revenues in the three months ended March 31, 2006 and 2005, respectively. Cost of plastic bags represented approximately 7% of revenues in the three months ended March 31, 2006 and 6% of revenues in the three months ended March 31, 2005. Fuel expenses represented approximately 4% and 3% of revenues in the three months ended March 31, 2006 and 2005, respectively. Expenses for independent third party distribution services represented approximately 6% of revenues in the three months ended March 31, 2006 and 2005. Electricity expense represented approximately 7% of revenues in the three months ended March 31, 2006 and 2005. We have recently experienced increasing electricity costs and expect those costs to continue to rise as a result of the expiration in June 2006 of a fixed price electricity contract to supply electricity to the majority of our Texas facilities, which we have renewed at higher rates.
Depreciation Expense Related to Cost of Sales: Depreciation expense related to cost of sales decreased by $0.03 million from $4.74 million for the three months ended March 31, 2005 to $4.71 million for the three months ended March 31, 2006 due to the effect of asset dispositions and assets becoming fully depreciated, partially offset by additional depreciation expense of approximately $0.5 million associated with production and distribution equipment placed in service during 2005 and early 2006.
Operating Expenses: Operating expenses increased $2.3 million from $8.8 million for the three months ended March 31, 2005 to $11.1 million for the three months ended March 31, 2006. This increase was primarily due to an increase of $1.0 million in non-cash stock-based compensation expense, an increase of $0.7 million in accrued incentive compensation and $0.5 million of professional services incurred during the three months ended March 31, 2006 in connection with a potential acquisition that we are no longer pursuing, partially offset by reduced bad debt expense of $0.4 million.
Depreciation and Amortization: Depreciation and amortization expense increased by $0.01 million from $1.42 million for the three months ended March 31, 2005 to $1.43 million for the three months ended March 31, 2006. This increase was primarily due to additional amortization expense associated with the intangible assets recorded in connection with the acquisitions completed in 2005 and the three months ended March 31, 2006.
Interest Expense: Interest expense decreased $2.4 million from $9.3 million for the three months ended March 31, 2005 to $6.9 million for the three months ended March 31, 2006, primarily due to the repurchase of substantially all of our 87/8% senior subordinated notes on August 12, 2005, partially offset by a $1.5 million increase in interest expense under our term loan facility.
Year Ended December 31, 2005 Compared to Year Ended December 31, 2004
The following table summarizes our historical results of operations for the periods indicated.
38
| | Year Ended December 31, 2004 | Year Ended December 31, 2005 | |||||
|---|---|---|---|---|---|---|---|
| | (dollars in thousands) | ||||||
| Consolidated Results: | |||||||
| Revenues | $ | 285,727 | $ | 319,772 | |||
| Cost of sales (excluding depreciation) | 173,066 | 196,223 | |||||
| Depreciation expense related to cost of sales | 17,850 | 18,838 | |||||
| Gross profit | 94,811 | 104,711 | |||||
| Operating expenses | 36,928 | 42,030 | |||||
| Depreciation and amortization expense | 5,335 | 5,691 | |||||
| Loss (gain) on disposition of assets | 398 | 1,848 | |||||
| Impairment of Assets | — | 5,725 | |||||
| Management agreement termination fees and transaction bonuses and expenses | — | 6,171 | |||||
| Income from operations | 52,150 | 43,246 | |||||
| Loss on extinguishment of debt | — | 28,189 | |||||
| Interest expense | 25,105 | 34,421 | |||||
| Income (loss) before income taxes | 27,045 | (19,364 | ) | ||||
| Income tax benefit (expense) | (10,494 | ) | 7,248 | ||||
| Net income (loss) | $ | 16,551 | $ | (12,116 | ) | ||
| Ice Operations: | |||||||
| Revenues | $ | 268,319 | $ | 304,755 | |||
| Cost of sales (excluding depreciation) | 162,811 | 186,668 | |||||
| Depreciation expense related to cost of sales | 16,769 | 17,769 | |||||
| Operating expenses | 35,040 | 40,172 | |||||
| Non-Ice Operations: | |||||||
| Revenues | $ | 17,408 | $ | 15,017 | |||
| Cost of sales (excluding depreciation) | 10,255 | 9,555 | |||||
| Depreciation expense related to cost of sales | 1,081 | 1,069 | |||||
| Operating expenses | 1,888 | 1,858 | |||||
Revenues: Revenues increased $34.0 million from $285.7 million for the year ended December 31, 2005 to $319.7 million for the year ended December 31, 2005. This increase was primarily due to an increase in volume sales in our ice operations, primarily in the third quarter of 2005, due to more favorable weather conditions in most of our markets and increased demand resulting from the impact of Hurricanes Katrina and Rita, and the effects of package sizing initiatives, which consisted primarily of converting a portion of our ice sales from seven to ten pound bags. Also contributing to the increase was higher average pricing, the effects of the acquisitions of ice companies (approximately $5.7 million) and changes in terms under which we do business with the majority of our distributors (approximately $2.6 million). The modifications to our distributor business occurred mostly in the second quarter of 2004 and resulted in a corresponding increase in cost of sales (excluding depreciation). Partially offsetting these increases in revenues was a $2.4 million decrease in non-ice revenue, primarily due to volume decreases in our cold storage business.
Cost of Sales (Excluding Depreciation): Cost of sales (excluding depreciation) increased $23.2 million from $173.0 million for the year ended December 31, 2004 to $196.2 million for the year ended December 31, 2005. This increase in cost of sales (excluding depreciation) was primarily due to the increased volume sales referred to above, approximately $4.0 million of additional costs associated with acquired ice operations, a $2.6 million increase in distribution costs related to changes in terms under which we do business with the majority of our distributors, and a $5.3 million increase in fuel and plastic bag costs due to market increases in energy prices. Partially offsetting these increases was a $0.7 million reduction of costs in our non-ice operations, primarily labor costs in our cold storage operations related to decreased sales volumes.
39
Labor costs, including associated payroll taxes and benefit costs (including health insurance), accounted for approximately 24% and 25% of revenues in 2005 and 2004, respectively. Cost of plastic bags represented approximately 7% and 6% of revenues in 2005 and 2004, respectively. Fuel expenses represented approximately 3% of revenues in 2005 and 2004. Expenses for independent third party distribution services represented approximately 6% and 5% of revenues in 2005 and 2004, respectively. Electricity expense represented approximately 5% and 6% of revenues in 2005 and 2004, respectively.
Depreciation Expense Related to Cost of Sales: Depreciation expense related to cost of sales increased by $1.0 million from $17.8 million for the year ended December 31, 2004 to $18.8 million for the year ended December 31, 2005. This increase was a result of additional depreciation expense associated with new production and distribution equipment placed in service during 2005 and assets acquired through the acquisition of ice companies throughout 2004 and 2005, partially offset by the effect of asset dispositions.
Operating Expenses: Operating expenses increased $5.1 million from $36.9 million for the year ended December 31, 2004 to $42.0 million for the year ended December 31, 2005. The increase was primarily due to $1.8 million of increased incentive compensation, increased non-cash stock-based compensation of $2.2 million, additional costs related to acquired ice operations of $0.6 million and a $1.9 million net increase in other costs, primarily insurance and professional services. Partially offsetting these increases was a $1.4 million decrease in financing transaction expenses due to the issuance of the Reddy Holdings notes in the fourth quarter of 2004 resulted in expenses that did not recur in 2005.
Depreciation and Amortization: Depreciation and amortization expense increased by $0.3 million from $5.3 million for the year ended December 31, 2004 to $5.6 million for the year ended December 31, 2005. This increase was primarily due to additional amortization expense associated with the intangible assets recorded in connection with the acquisitions completed in 2004 and 2005.
Impairment of Assets: Due to the significant reduction in cold storage sales volumes related to a particular customer, we evaluated the goodwill recorded in the cold storage portion of our non-ice business segment in accordance with SFAS No. 142, "Goodwill and Other Intangibles" as of June 30, 2005. As a result of such evaluation, we recorded a non-cash impairment charge of $5.7 million during the year ended December 31, 2005.
Management Agreement Termination Fees and Transaction Bonuses and Expenses: In connection with our initial public offering and the related transactions in August 2005, we recorded expenses of $6.2 million. These charges were related to payments to our majority owners to terminate the monitoring and management services agreement (approximately $4.0 million), transaction bonuses to certain employees (approximately $1.8 million) and other fees and expenses (approximately $0.4 million).
Loss on Extinguishment of Debt: In connection with our initial public offering and the related transactions in August 2005, we repurchased substantially all of our 87/8% senior subordinated notes pursuant to a tender offer and consent solicitation and repaid all balances outstanding under our prior credit facility. We incurred a loss of $28.1 million in connection with these repayments consisting of the tender premiums and consent fees paid to the holders of the 87/8% senior subordinated notes (approximately $17.3 million), the write-off of deferred debt costs and original issue discount related to the 87/8% senior subordinated notes and our prior credit facilities (approximately $10.6 million) and other fees and expenses (approximately $0.2 million). Additionally, during the three months ended September 30, 2005, we paid $0.4 million to purchase and retire the Reddy Holdings notes with an aggregate principal amount at maturity of $0.5 million. A loss of $0.046 million was recognized in connection with this transaction.
Interest Expense: Interest expense increased $9.3 million from $25.1 million for the year ended
December 31, 2004 to $34.4 million for the year ended December 31, 2005. This increase was due to $9.1 million of non-cash interest expense associated with the Reddy Holdings notes issued on October 27, 2004, the effects of higher interest on our variable rate debt combined with greater outstanding balances under our credit facilities, partially offset by the effect of the repurchase of substantially all of our 87/8% senior subordinated notes on August 12, 2005.
40
Year Ended December 31, 2004 Compared to Twelve Months Ended December 31, 2003
The following table summarizes our historical results of operations for the periods indicated. The financial data for the combined twelve month period ended December 31, 2003 represents the mathematical addition of the pre-merger results of operations of the Predecessor for the period from January 1, 2003 to August 14, 2003 and the results of operations of the Successor for the period from May 8, 2003 to December 31, 2003. The discussion of our results of operations which follows is based upon the combined twelve month period ended December 31, 2003.
See "—Overview—Predecessor and Successor" above for a discussion of the use of financial information for the combined twelve month period ended December 31, 2003.
| | Predecessor | Successor | Non-GAAP Combined | Successor | |||||||||
|---|---|---|---|---|---|---|---|---|---|---|---|---|---|
| | January 1 to August 14, 2003 | May 8, 2003 (Date of Inception) to December 31, 2003 | Twelve Months Ended December 31, 2003 | Year Ended December 31, 2004 | |||||||||
| | (dollars in thousands) | ||||||||||||
| Consolidated Results: | |||||||||||||
| Revenues | $ | 151,269 | $ | 86,919 | $ | 238,188 | $ | 285,727 | |||||
| Cost of sales (excluding depreciation) | 91,642 | 52,732 | 144,374 | 173,066 | |||||||||
| Depreciation expense related to cost of sales | 10,881 | 5,883 | 16,764 | 17,850 | |||||||||
| Gross profit | 48,746 | 28,304 | 77,050 | 94,811 | |||||||||
| Operating expenses | 18,598 | 13,430 | 32,028 | 36,928 | |||||||||
| Depreciation and amortization expense | 3,647 | 1,733 | 5,380 | 5,335 | |||||||||
| Loss (gain) on disposition of assets | (11 | ) | — | (11 | ) | 398 | |||||||
| Income from operations | 26,512 | 13,141 | 39,653 | 52,150 | |||||||||
| Other income, net | 116 | — | 116 | — | |||||||||
| Interest expense | (21,063 | ) | (10,370 | ) | (31,433 | ) | (25,105 | ) | |||||
| Income before income taxes | 5,565 | 2,771 | 8,336 | 27,045 | |||||||||
| Income tax expense | — | 1,053 | 1,053 | 10,494 | |||||||||
| Net income | $ | 5,565 | $ | 1,718 | $ | 7,283 | $ | 16,551 | |||||
Ice Operations: | |||||||||||||
| Revenues | $ | 139,618 | $ | 79,954 | $ | 219,572 | $ | 268,319 | |||||
| Cost of sales (excluding depreciation) | 84,384 | 48,867 | 133,251 | 162,811 | |||||||||
| Depreciation expense related to cost of sales | 10,475 | 5,500 | 15,975 | 16,769 | |||||||||
| Operating expenses | 17,051 | 12,509 | 29,560 | 35,040 | |||||||||
Non-Ice Operations: | |||||||||||||
| Revenues | $ | 11,651 | $ | 6,965 | $ | 18,616 | $ | 17,408 | |||||
| Cost of sales (excluding depreciation) | 7,258 | 3,865 | 11,123 | 10,255 | |||||||||
| Depreciation expense related to cost of sales | 406 | 383 | 789 | 1,081 | |||||||||
| Operating expenses | 1,547 | 921 | 2,468 | 1,888 | |||||||||
Revenues. Revenues increased $47.5 million from $238.2 million for the twelve months ended December 31, 2003 to $285.7 million for the year ended December 31, 2004. Approximately $38.0 million of the increase was due to our 2003 acquisitions, including Triangle in November 2003, and the 11 acquisitions consummated in 2004. Approximately $5.5 million of the increase was due to changes in the terms under which we do business with the majority of our distributors. These modifications to the distributor business occurred mostly in the second quarter of 2004 and also resulted in a corresponding increase in cost of sales (excluding depreciation). The remainder of the increase in revenues from ice businesses resulted primarily from higher average selling prices. Revenues in non-ice businesses decreased by $1.2 million, largely due to volume decreases in the cold storage operations.
41
Cost of Sales (Excluding Depreciation). Cost of sales (excluding depreciation) increased $28.7 million from $144.4 million for the twelve months ended December 31, 2003 to $173.1 million for the year ended December 31, 2004. As a percentage of revenues, cost of sales (excluding depreciation) remained constant at 60.6%. The increase in cost of sales (excluding depreciation) was primarily due to approximately $21.0 million of additional costs associated with acquired operations, $5.5 million of additional costs resulting from the changes in the terms under which we do business with the majority of our distributors as described above and approximately $5.1 million of increased fuel, bag and electricity costs related to market increases in the price of energy. These increases were partially offset by a reduction of $2.9 million in equipment leasing costs resulting from asset purchases in the last half of 2003. Labor costs, including associated payroll taxes and benefit costs included in cost of sales (excluding depreciation), accounted for approximately 25% of revenues in each of the year ended December 31, 2004 and the twelve months ended December 31, 2003. Cost of plastic bags represented approximately 6% of revenues in each of the year ended December 31, 2004 and the twelve months ended December 31, 2003. Fuel expenses represented approximately 3% of revenues in the year ended December 31, 2004, as compared to 2% in the twelve months ended December 31, 2003. Expenses for independent third party distribution services represented approximately 5% of revenues in the year ended December 31, 2004, as compared to 4% of revenues in the twelve months ended December 31, 2003. Electricity expense represented approximately 6% of revenues in each of the year ended December 31, 2004 and the twelve months ended December 31, 2003.
Depreciation Expense Related to Cost of Sales. Depreciation expense related to cost of sales increased by $1.1 million from $16.8 million for the twelve months ended December 31, 2003 to $17.9 million for the year ended December 31, 2004, primarily as a result of depreciation of production and distribution equipment acquired in connection with the acquisitions consummated in the last quarter of 2003 and in 2004. This increase was partially offset by the effects of the revaluation of our property and equipment that resulted from the application of purchase accounting in connection with the merger on August 15, 2003.
Operating Expenses. Operating expenses increased $4.9 million from $32.0 million for the twelve months ended December 31, 2003 to $36.9 million for the year ended December 31, 2004. As a percentage of revenues, operating expenses decreased from 13.4% for the twelve months ended December 31, 2003 to 12.9% for the year ended December 31, 2004. The increase in operating expenses was primarily due to $3.2 million of expenses associated with acquired businesses and $1.5 million of expenses incurred in the fourth quarter of 2004 in connection with certain capital markets transactions, including the redemption of our preferred stock and payment of accrued dividends thereon and the payment of a dividend on our common stock. Partially offsetting these increases was a $0.6 million decrease in operating expenses in our non-ice businesses, primarily due to headcount reductions in our cold storage operations.
Depreciation and Amortization. Depreciation and amortization expense decreased from $5.38 million for the twelve months ended December 31, 2003 to $5.34 million for the year ended December 31, 2004, primarily due to the revaluation of our property and equipment in connection with the merger on August 15, 2003, partially offset by additional amortization expense associated with intangible assets recorded in connection with the acquisitions we have completed since the fourth quarter of 2003 and in 2004.
Interest Expense. Interest expense decreased $6.3 million from $31.4 million for the twelve months ended December 31, 2003 to $25.1 million for the year ended December 31, 2004. The decrease was primarily due to the effects of the refinancing of our debt on August 15, 2003, which resulted in lower average interest rates and a $3.4 million non-cash credit to interest expense in the fourth quarter of 2004 related to the expiration of our interest rate collar agreement. These decreases were partially offset by a $2.0 million increase in non-cash interest expense associated with the Reddy Holdings notes issued on October 27, 2004.
Liquidity and Capital Resources
We intend to fund our ongoing capital and working capital requirements as well as debt service, including our internal growth and acquisitions, through a combination of cash flows from operations and borrowings under our credit facilities.
42
We generate cash from the sale of packaged ice through traditional delivery methods, by which we manufacture, package and store ice at a central facility and transport it to our customers' retail locations when needed, and through Ice Factories, which manufacture, package and store ice in our customers' retail locations. Our primary uses of cash are (a) cost of sales, (b) operating expenses, (c) debt service, (d) dividends on our common stock, (e) capital expenditures related to replacing and modernizing the capital equipment in our traditional ice plants and acquiring and installing additional Ice Factories and (f) acquisitions. Historically, we have financed our capital and working capital requirements, including our acquisitions, through a combination of cash flows from operations, borrowings under our revolving credit facilities and operating leases.
Our ability to generate cash from our operations is subject to weather, general economic, financial, competitive, legislative, regulatory and other factors that are beyond our control. As a result, we cannot assure you that our business will generate sufficient cash flow from operations in amounts sufficient to enable us to pay dividends or service our debt and to fund our other liquidity needs. If we do not have sufficient liquidity, we will have to take actions such as reducing or delaying strategic acquisitions, investments and joint ventures, selling assets, restructuring or refinancing our debt or seeking additional equity capital. We cannot assure you that any of these remedies could, if necessary, be effected on commercially reasonable terms, or at all. In addition, the terms of existing or future debt instruments, including the terms of the credit agreement governing our credit facilities and the Reddy Holdings indenture, may restrict us from adopting some of these alternatives.
Capital expenditures totaled $19.3 million in 2005 and $4.0 million for the three months ended March 31, 2006. As we have consolidated acquisitions into the existing company infrastructure, we have identified non-core and excess assets which can be disposed of. From time to time, we also dispose of other assets which are no longer useful in our operations. As a result of dispositions of these non-core and excess assets, we realized proceeds of approximately $2.1 million in 2005 and $0.4 million during the three months ended March 31, 2006. As a result, our net capital expenditures were $17.2 million in 2005 and $3.6 million for the three months ended March 31, 2006.
In 2005, we completed the acquisition of two small ice companies for a total cash purchase price of approximately $0.9 million, including direct acquisition costs of $0.02 million. In the three months ended March 31, 2006, we completed the acquisition of two small ice companies. We acquired one additional ice company in April 2006. The total cash purchase price for these three acquisitions was approximately $2.0 million, including direct acquisition costs of $0.04 million. We will continue to evaluate acquisition opportunities as they become available. In conjunction with these evaluations, we will consider our liquidity, availability under our credit facilities, mandatory principal repayments under our debt agreements and availability of other capital resources.
Cash Flows for the Three Months Ended March 31, 2006 and 2005
Net cash used in operating activities was $9.4 million and $14.7 million in the three months ended March 31, 2006 and 2005, respectively. The decrease in cash used in operating activities was primarily the result of a $1.9 million reduction in our net loss, which was primarily driven by a $2.4 million reduction in interest expense as a result of the debt refinancing and principal reductions completed in connection with the initial public offering of our common stock on August 12, 2005. In addition, $1.5 million less cash was used in operating activities as a result of changes in working capital in the three months ended March 31, 2006 as compared to changes in working capital in the three months ended March 31, 2005, principally due to changes in the timing of our interest payments following the initial public offering of our common stock, partially offset by increases in accounts receivable due to increased revenues in the three months ended March 31, 2006.
Net cash used in investing activities was $5.0 million and $5.3 million in the three months ended March 31, 2006 and 2005, respectively. The decrease in cash used in investing activities is primarily due to a $1.8 million decrease in property and equipment additions, primarily related to the timing of our capital expenditure budget in 2006 versus 2005, partially offset by a $1.4 million increase in the cost of acquisitions. During the three months ended March 31, 2006, we completed two acquisitions for $1.4 million. We did not complete any acquisitions in the three months ended March 31, 2005.
43
Financing activities used net cash of $9.3 million in the three months ended March 31, 2006, compared to providing net cash of $18.3 million in the three months ended March 31, 2005. During the three months ended March 31, 2005, the exercise of employee stock options and net borrowings under our revolving credit facility provided cash of $19.0 million, only $0.7 million of which was used to repay debt. In the three months ended March 31, 2006, there were no cash inflows from financing activities while $8.3 million was used to pay cash dividends to our common stockholders and $1.0 million was used to repurchase common stock.
Cash Flows for the Years Ended December 31, 2005, 2004 and for the Twelve Months Ended December 31, 2003
The following table summarizes our historical cash flows. The cash flow data for the combined twelve months ended December 31, 2003 represents the mathematical addition of the pre-merger cash flows of the Predecessor for the period from January 1, 2003 to August 14, 2003 and the cash flows of the Successor for the period from May 8, 2003 to December 31, 2003. The discussion of our historical cash flows which follows is based upon the combined twelve month period ended December 31, 2003.
See "—Overview—Predecessor and Successor" above for a discussion of the use of financial information for the combined twelve month period ended December 31, 2003.
| | Predecessor | Successor | Non-GAAP Combined | Successor | ||||||||||||
|---|---|---|---|---|---|---|---|---|---|---|---|---|---|---|---|---|
| | January 1 to August 14, 2003 | May 8, 2003 (Date of Inception) to December 31, 2003 | Twelve Months Ended December 31, 2003 | Year Ended December 31, 2004 | Year Ended December 31, 2005 | |||||||||||
| | (dollars in thousands) | |||||||||||||||
| Net cash provided by (used in): | ||||||||||||||||
| Operating activities | $ | (4,846 | ) | $ | 30,092 | $ | 25,246 | $ | 47,786 | $ | 55,587 | |||||
| Investing activities | (6,612 | ) | (206,128 | ) | (212,740 | ) | (30,205 | ) | (20,551 | ) | ||||||
| Financing activities | 11,664 | 188,837 | 200,501 | (25,904 | ) | (5,517 | ) | |||||||||
Net cash provided by operating activities was $55.6 million, $47.8 million and $25.2 million in 2005, 2004 and 2003, respectively. The increase in cash provided by operating activities from 2004 to 2005 was primarily due to a $5.6 million increase in net income, after adjusting for non-cash expenses, and a $2.2 million reduction in cash used by changes in working capital. The increase in cash provided by operating activities from 2003 to 2004 was primarily due to a $18.7 million increase in income before taxes, which was the result of additional income from acquired operations, reduced operating lease costs due to the purchase of certain leased assets in 2003 and reduced cash interest expense as a result of the refinancing of our debt in August 2003.
Net cash used in investing activities was $20.6 million, $30.2 million and $212.7 million in 2005, 2004 and 2003, respectively. Net cash used in investing activities in 2005 consisted of net capital expenditures of $17.2 million and acquisitions of ice companies and leased assets totaling $3.4 million. Net cash used in investing activities in 2004 consisted of net capital expenditures of $13.3 million and cash used for 11 small acquisitions of $16.9 million. Net cash used in investing activities in 2003 consisted principally of cash used for acquisitions of $192.7 million, including for the acquisition of Packaged Ice and Triangle.
Net cash used in financing activities was $5.5 million, in 2005, as compared to $25.9 million in 2004, and cash provided by financing activities of $200.5 million in 2003. The use of cash by financing activities in 2005 was a result of the repayment of outstanding amounts on the revolving credit facility and other miscellaneous debt during the year of approximately $6.0 million, the payment of $4.5 million in cash dividends to our common stockholders, partially offset by a net $5.0 million provided by the initial public offering of our common stock and other related transactions. The initial public offering and stock option exercises provided net cash proceeds of $118.0 million and the issuance of the new term loan under our credit facilities provided $240.0 million. Approximately $353.0 million was used to retire Reddy Group's 87/8% senior subordinated notes, repay the borrowings under our prior credit facilities and fund debt issuance costs. The use of cash by financing activities in 2004 was caused primarily by the redemption of our preferred stock for $114.2 million and the payment of a common dividend of
44
$10.4 million in the fourth quarter of 2004, which was partially offset by $100.2 million of cash raised from the offering of the Reddy Holdings notes. In 2003, the net cash provided by financing activities was primarily the result of net equity contributions from our new owners as they recapitalized the company.
Long-term Debt and Other Obligations
Overview. At March 31, 2006, we had approximately $355.8 million of total debt outstanding as follows:
- •
- $115.6 million of the Reddy Holdings' notes due 2012 (net of unamortized discount of $34.9 million);
- •
- $240.0 million of outstanding term loans under our credit facilities which mature on August 12, 2012; and
- •
- $0.2 million of other debt.
Reddy Holdings Notes
On October 27, 2004, Reddy Holdings issued $151.0 million aggregate principal amount at maturity of 101/2% Senior Discount Notes due 2012 in a private placement offering pursuant to an exemption from registration under the Securities Act of 1933. The Reddy Holdings notes were sold at 66.333% of the stated principal amount, which resulted in gross proceeds of $100.2 million. Reddy Holdings used the net proceeds of that offering, together with a dividend of approximately $28.4 million from Reddy Group, to redeem all of Reddy Holdings' existing series A preferred stock for approximately $99.2 million, to pay accumulated dividends on such stock as of the date of redemption in the amount of approximately $15.0 million and to pay a dividend of approximately $10.4 million to its common stockholders. In connection with these transactions, Reddy Group made a special transaction payment of approximately $1.2 million in the aggregate to certain members of management and certain directors. In connection with the offering of the Reddy Holdings notes and the related transactions, we amended our credit agreement existing at the time.
Each Reddy Holdings note had an initial accreted value of $663.33 per $1,000 principal amount at maturity. The accreted value of each Reddy Holdings note increases from the date of issuance until November 1, 2008 at a rate of 101/2% per annum such that the accreted value will equal the stated principal amount at maturity on November 1, 2008. Thereafter cash interest on the Reddy Holdings notes will accrue and be payable semi-annually at a rate of 101/2% per annum. The Reddy Holdings notes are unsecured obligations of Reddy Holdings and are:
- •
- not guaranteed by any of Reddy Holdings' subsidiaries;
- •
- senior in right of payment to all of Reddy Holdings' future subordinated indebtedness;
- •
- equal in right of payment with any of Reddy Holdings' existing and future unsecured senior indebtedness;
- •
- effectively subordinated to Reddy Holdings' existing and future secured debt, including Reddy Holdings' guarantees of our credit facilities; and
- •
- structurally subordinated to all obligations and preferred equity of Reddy Holdings' subsidiaries.
The Reddy Holdings notes include customary covenants that restrict, among other things, the ability to incur or guarantee additional debt or issue certain preferred stock, pay dividends or redeem, repurchase or retire our capital stock or subordinated indebtedness, make certain investments, incur liens, enter into arrangements that restrict dividends from our subsidiaries, merge or sell all or substantially all of our assets or enter into various transactions with affiliates. Prior to November 1, 2007, we may redeem up to 35% of the principal amount of the Reddy Holdings notes at a redemption price of 110.5% of the principal amount thereof, plus accrued and unpaid interest to the date of redemption, with funds raised in equity offerings that are specified in the Reddy Holdings indenture. From and after November 1, 2008, we may redeem any or all of the Reddy Holdings notes by paying a redemption premium which is initially 5.25% of the principal amount at maturity of the notes, and will decline annually to 0% commencing on November 1, 2010. If a change of control occurs on or prior to November 1, 2007, we may, at our option, redeem all, but not less than all, of the Reddy Holdings notes at a redemption price equal to the sum of (i) the accreted value of the notes as of the redemption date, (ii) a premium equal to 125% of one year's coupon payment and (iii) any accrued and unpaid interest to the date of redemption. If we experience a change of control and do not elect to make the optional redemption described in the previous sentence, we will be required to make an offer to repurchase the Reddy Holdings notes at a price equal to 101% of their accreted value, plus accrued
45
and unpaid interest, if any, to the date of purchase. We may also be required to make an offer to purchase the Reddy Holdings notes with proceeds of asset sales that are not reinvested in our business or used to repay other indebtedness. We completed a registered exchange offer for the Reddy Holdings notes pursuant to a registration statement under the Securities Act of 1933 that was declared effective on August 26, 2005.
The indenture governing the Reddy Holdings notes restricts the amount of dividends, distributions and other restricted payments we may pay. For information on the restrictions imposed by the Reddy Holdings indenture, see "Dividend Policy and Restrictions—Restrictions on Payment and Dividends—Reddy Holdings' 101/2% Senior Discount Notes due 2012."
Credit Facilities
On August 9, 2005, Reddy Group entered into credit facilities in an aggregate amount of $300.0 million, with a syndicate of banks, financial institutions and other entities, which includes Credit Suisse, Cayman Islands Branch, which acts as Administrative Agent under the credit facilities, Bear Stearns Corporate Lending, Inc., Lehman Commercial Paper Inc. and Wachovia Bank, National Association. The credit facilities consist of a seven-year term loan facility in the amount of $240.0 million, all of which was drawn concurrently with the closing of our initial public offering, and a five-year revolving credit facility in the amount of $60.0 million. Proceeds of the term loan were used to repay our prior credit facilities.
At March 31, 2006, we had $54.2 million of availability under the revolving credit facility, net of outstanding standby letters of credit of $5.8 million. The standby letters of credit are used primarily to secure certain insurance obligations. At this time, we do not anticipate any significant changes in our standby letters of credit until late in the second quarter of 2006, at which time collateral will be required for our 2006 policy renewals. However, later in 2006, this additional new collateral will be partially offset by reductions in collateral related to earlier policy years. Principal balances outstanding under the revolving credit facility bear interest per annum, at our option, at the sum of the base rate plus 0.75% or LIBOR plus 1.75%. The base rate is defined as the greater of the prime rate (as announced from time to time by the Administrative Agent) or the federal funds rate plus 0.5%. At March 31, 2006, the weighted average interest rate of borrowings outstanding under the credit facilities was 6.3%. Interest on base rate loans is payable on the last day of each quarter. Interest on LIBOR loans is payable upon maturity of the LIBOR loan or on the last day of the quarter if the interest period for such LIBOR loan exceeds 90 days. Reddy Group pays a quarterly fee on the average availability under our credit facilities based on an annual rate of 0.5%. Except as described below, the terms of the senior credit facilities prohibit Reddy Group from paying dividends and otherwise transferring assets to Reddy Holdings, except for certain limited dividends, the proceeds of which must be related to maintaining Reddy Holdings' corporate existence.
In addition, our credit facilities will allow us to incur up to an additional $80.0 million of incremental term loans under our credit facilities, subject to certain conditions. No lenders have committed to provide the incremental term loans. In the event that we incur incremental term loans that mature on or before the one year anniversary of the final maturity of the existing term loans and that bear interest with margins higher than the margin applicable to any term loans outstanding under our credit facilities, the margins applicable to the existing term loans will be increased to equal the margins applicable to the incremental term loans. In the event that we incur incremental term loans that mature after the one-year anniversary of the final maturity of the existing term loans and that bear interest with margins more than 0.25% higher than the margins applicable to any term loans outstanding under our credit facilities, the margins applicable to the existing term loans will be increased to equal the margins applicable to the incremental term loans, less 0.25%.
The credit facilities do not require any scheduled principal payments prior to the stated maturity dates. Subject to certain conditions, mandatory repayments of the revolving credit facility and term loan (and if the term loan is no longer outstanding, mandatory commitment reductions of the revolving credit facility) are required to be made with portions of the proceeds from (1) asset sales, (2) the issuance of debt securities and (3) insurance and condemnation awards, subject to various exceptions. In the event of a change in control, as defined in our credit facilities, an event of default will occur under our credit facilities. Under our credit facilities, Reddy Group may only pay dividends to Reddy Holdings if Reddy Group's total leverage ratio for the most recently ended fiscal quarter is less than or equal to 3.75 to 1.0. In addition, our credit facilities preclude Reddy Group from declaring any dividends if an event of
46
default under our credit facilities has occurred and is continuing. In particular, it will be an event of default if Reddy Group's leverage ratio exceeds, or Reddy Group's interest coverage ratio is less than, the levels described below.
Our credit facilities contain certain financial and other covenants, including maintenance by Reddy Group of a total leverage ratio not in excess of 4.0 to 1.0 and an interest coverage ratio not less than 3.25 to 1.0. Loans under our credit facilities are secured by substantially all of Reddy Group's assets and the capital stock of all of its subsidiaries. Reddy Holdings guarantees our credit facilities and such guarantee is secured by the capital stock of Reddy Group. At March 31, 2006, Reddy Group was in compliance with these covenants.
Covenant Compliance
Credit Facilities
We believe that the credit agreement governing our credit facilities and the Reddy Holdings indenture are material agreements, that the covenants contained in these agreements are material terms of these agreements and that the information presented below about these covenants is material to investors' understanding of our financial condition and liquidity. In addition, the breach of covenants in our credit facilities, which will be based on ratios that include Adjusted EBITDA as a component, could result in a default under these facilities, allowing the lenders to elect to declare all amounts borrowed due and payable, which would further result in a default under the Reddy Holdings indenture.
Under the restricted payments covenant under our credit facilities, we generally are restricted from paying dividends. However, the covenant includes an exception for paying dividends in an amount not greater than our Cumulative Distributable Cash for the period (taken as one accounting period) from July 1, 2005 to the end of our most recently-ended fiscal quarter for which a covenant compliance certificate under our credit facilities has been delivered to the lenders. See "Dividend Policy and Restrictions—Restrictions on Payment of Dividends—Credit Facilities" and "Description of Indebtedness—Credit Facilities". In addition, under our credit facilities, we may only pay dividends if Reddy Group's total leverage ratio for the most recently ended fiscal quarter for which we are required to deliver a covenant compliance certificate is less than or equal to 3.75 to 1.0. If at the end of any fiscal quarter, Reddy Group's leverage ratio is greater than 3.75 to 1.0, and therefore Reddy Group is not permitted to pay dividends, we will be required by our credit facilities to apply 50% of our Available Cash generated during each such quarter to make a mandatory prepayment of the loans under our credit facilities. As a result of this provision, our ability to pay dividends at the specified rate or at all for the Initial Four Quarters may be significantly impaired if Reddy Group's leverage ratio is greater than 3.75 to 1.0 at the end of any fiscal quarter during the Initial Four Quarters. Our credit facilities will preclude us and Reddy Group from declaring any dividends if a default under our credit facilities has occurred and is continuing. In addition, our credit facilities will preclude us and Reddy Group from paying any dividends if an event of default under our credit facilities has occurred and is continuing. In particular, it will be an event of default if Reddy Group's total leverage ratio exceeds 4.0 to 1.0 or Reddy Group's interest coverage ratio is less than 3.25 to 1.0.
As a result of the above, the presentation of Adjusted EBITDA and the ratios referred to above are appropriate to provide additional information to investors to demonstrate compliance with, and our ability to pay dividends under, the applicable covenants. The following table presents Adjusted EBITDA on a pro forma basis after giving effect to the transactions described in notes (14) and (15) to "Dividend Policy and Restrictions—Estimated Minimum Adjusted EBITDA".
| | Year Ended December 31, 2005 | Twelve Months Ended March 31, 2006 | ||||
|---|---|---|---|---|---|---|
| | (in thousands) | (in thousands) | ||||
| Pro forma Adjusted EBITDA | $ | 84,824 | $ | 86,430 | ||
| Total leverage ratio | 2.8:1.0 | 2.8:1.0 | ||||
| Interest coverage ratio | 5.8:1.0 | 5.8:1.0 | ||||
For a more complete description, see "Description of Indebtedness—Credit Facilities" and "Dividend Policy and Restrictions". In addition, the credit agreement governing our credit facilities has been incorporated by reference as an exhibit to the registration statement of which this prospectus forms a part.
47
Adjusted EBITDA is different from EBITDA that is derived solely from GAAP components. Adjusted EBITDA should not be construed as an alternative to net income (loss), cash flows from operations or net cash from operating or investing activities as defined by GAAP, and it is not necessarily indicative of cash available to fund our cash needs as determined in accordance with GAAP. In addition, not all companies use identical calculations, and this presentation may not be comparable to similarly titled measures of other companies.
Reddy Holdings' 101/2% Senior Discount Notes due 2012
The indenture governing the Reddy Holdings notes restricts the amount of dividends, distributions and other restricted payments we may pay. Under this indenture, we are restricted from paying dividends on our common stock unless, at the time of such payment, no default or event of default has occurred and is continuing or would occur as a consequence thereof; the consolidated coverage ratio set forth in the Reddy Holdings indenture exceeds 2.0 to 1.0; and there is sufficient capacity under the buildup amount under the Reddy Holdings indenture. See "Dividend Policy and Restrictions—Restrictions on Payment of Dividends—Reddy Holdings' 101/2% Senior Discount Notes due 2012" and "Description of Indebtedness—Reddy Holdings' 101/2% Senior Discount Notes due 2012".
In addition, regardless of whether we could make any restricted payments under the buildup amount provision of the Reddy Holdings indenture, we may (1) make dividend payments at any time in an aggregate amount of up to $15.0 million if no default has occurred and is continuing under the Reddy Holdings indenture and (2) pay dividends on our capital stock of up to 6.0% per year of the cash proceeds (net of underwriters' fees, discounts, commissions or other expenses paid by us) received by us from any underwritten public offerings of our common stock subject to specified conditions. We are currently able to pay approximately $7.0 million annually in dividends under this 6.0% provision as a result of the initial public offering of our common stock completed in August 2005. However, the amount of dividend payments permitted under this 6.0% provision correspondingly reduces the amount we would otherwise have available to us under the buildup amount for restricted payments, including dividends.
We estimate that as of March 31, 2006, we would have been able to pay dividends under the Reddy Holdings indenture in an amount equal to $120.2 million (which amount is net of $12.8 million in dividends paid since the closing of our initial public offering and prior to March 31, 2006 and $8.3 million in dividends declared on March 15, 2006 and paid on April 17, 2006). Based on the foregoing, and based on assumptions used in our calculation of estimated Adjusted EBITDA for the Initial Four Quarters, we believe that we will have sufficient capacity under our buildup amount calculation to pay dividends at the anticipated levels during the Initial Four Quarters. As of March 31, 2006, our consolidated coverage ratio was 3.0 to 1.0. We currently estimate that as of the end of each of the Initial Four Quarters, our consolidated coverage ratio would be approximately 3.0 to 1.0, which is in excess of the minimum level required to pay dividends under the Reddy Holdings indenture.
Interest Rate Hedging Agreement
Effective September 12, 2005, Reddy Group entered into an interest rate hedging agreement (the "Hedge") to fix the interest rate on a portion of our term loan facility. The Hedge has a term of three years and ten months and an initial notional balance of $220 million. The notional balance decreases by $20 million on October 12 of each of the next three years, beginning on October 12, 2006. Reddy Group pays a fixed rate of 4.431% on the notional balance outstanding and receives an amount equal to 3-month LIBOR. Any net payable or receivable amount is settled quarterly. If Reddy Group had been required to settle the Hedge as of March 31, 2006, it would have received $4.2 million. The fair value of the Hedge is included in the caption "Other Assets" in the consolidated balance sheet. Changes in the fair value of the Hedge are recorded as "Other Comprehensive Income" in the consolidated statement of stockholders' equity. Reddy Group is exposed to risk of loss in the event of non-performance by the counterparty to the Hedge; however, we do not anticipate non-performance by the counterparty.
Liquidity Outlook
Due to the seasonal nature of our business, we record the majority of our revenues and profits during the months of May through September. The majority of the cash generated from those operations is received between
48
July and November. We have used the excess cash generated from our 2005 selling season to fund our operations during the winter months, as well as capital expenditures, acquisitions and dividends to our common stockholders.
We estimate that our capital expenditures for 2006 will be approximately $16 million to $18 million, which will primarily be used to maintain and expand our traditional ice operations. There can be no assurance that our capital expenditures will not exceed this estimate. In the normal course of our business, we dispose of obsolete, worn-out and unneeded assets. As a result of dispositions of excess assets, we estimate that we will generate proceeds of approximately $2 million to $3 million in 2006 for net capital expenditures of approximately $13 million to $16 million.
Based on our expected level of operations, we believe that cash flows from operations, together with available borrowings under our revolving credit facility, will be adequate to meet our future liquidity needs for at least the next twelve months. As of May 1, 2006, we had approximately $40.8 million of availability under our revolving credit facility, which reflected a $13.5 million outstanding balance under our revolving credit facility and standby letters of credit of $5.8 million. During the next two months, we expect that the availability under our revolving credit facility will range between approximately $40 million to approximately $44 million due to borrowings on our revolving credit facility to fund operations, capital expenditures and debt service. Such borrowings under our revolving credit facility are expected to be seasonal as our cash flows from operations decline to their lowest point during March and April due to reduced sales in January and February and the need to finance seasonal increases in accounts receivable and inventories as temperatures and sales volumes begin to increase in April and May. As part of our ongoing acquisition program, we are currently pursuing several small acquisition opportunities which are in various stages of negotiations. If we are successful in completing any of these transactions during the next two months, additional borrowings under our revolving credit facility may be required. During the latter part of the second quarter of 2006 and into the third quarter of 2006, we expect that the availability under our revolving credit facility will increase to approximately $50 million to $55 million. As noted previously, we record the majority of our sales and profits during the months of May through September and the majority of the cash generated from those operations is received in August through November. During those months in 2006, we expect to repay all amounts borrowed under our revolving credit facility in the spring of 2006, fund dividends on our common stock, fund current capital expenditures and debt service and build up cash balances.
Debt and Capital Leases
The table below summarizes the future payments due under our significant contractual obligations as of December 31, 2005:
| | Total | 2006 | 2007 to 2008 | 2009 to 2010 | 2011 and thereafter | |||||||||||
|---|---|---|---|---|---|---|---|---|---|---|---|---|---|---|---|---|
| | (in millions) | |||||||||||||||
| Long-term debt(1) | $ | 487.0 | $ | 14.9 | $ | 32.3 | $ | 56.6 | $ | 383.2 | ||||||
| Operating leases | 33.9 | 9.5 | 13.1 | 6.7 | 4.6 | |||||||||||
| Purchase obligations(2) | 25.3 | 3.8 | 7.5 | 7.5 | 6.5 | |||||||||||
| Total contractual obligations | $ | 546.2 | $ | 28.2 | $ | 52.9 | $ | 70.8 | $ | 394.3 | ||||||
- (1)
- Includes estimated cash interest to be paid over the remaining terms of the debt.
- (2)
- Consists of our obligation to purchase 2,000 merchandisers and $0.75 million of spare parts per year from a certain vendor under a supply agreement that expires May 31, 2012.
49
General Economic Trends and Seasonality
Our results of operations are generally affected by the economic trends in our market area, but results to date have not been significantly impacted by inflation. If we experience an extended period of high inflation, which affects multiple expense items, we believe that we will be able to pass on these higher costs to our customers.
The ice business is highly seasonal, with the bulk of demand coming in the warmer spring and summer months. Accordingly, we experience seasonal fluctuations in our net sales and profitability. We make a disproportionate amount of our sales in the second and third calendar quarters. We also typically have net income in these same periods, whereas we typically experience net loss in the first and fourth calendar quarters. We believe that over two-thirds of our revenues will occur during the second and third calendar quarters when the weather conditions are generally warmer and demand is greater, while less than one-third of our revenues will occur during the first and fourth calendar quarters when the weather is generally cooler. This belief is consistent with historical trends. As a result of seasonal revenue declines and the lack of proportional corresponding expense decreases, we will most likely experience lower profit margins and even losses during the first and fourth calendar quarters. In addition, because our operating results depend significantly on sales during our peak season, our quarterly results of operations may fluctuate significantly as a result of adverse weather during this peak selling period if the weather is unusually cool or rainy on a more national or regional basis.
The following tables summarize the unaudited quarterly information for the three month period ended March 31, 2006 and the years ended December 31, 2005 and 2004.
For the three month period ended March 31, 2006:
| | 1st | |||
|---|---|---|---|---|
| | (in thousands) | |||
| Revenues | $ | 44,808 | ||
| Gross profit | 5,681 | |||
| Net loss available to common stockholders | (8,239 | ) | ||
For the year ended December 31, 2005
1st | 2nd | 3rd | 4th | Year | ||||||||||||
|---|---|---|---|---|---|---|---|---|---|---|---|---|---|---|---|---|
| | (in thousands) | |||||||||||||||
| Revenues | $ | 39,244 | $ | 93,123 | $ | 126,562 | $ | 60,843 | $ | 319,772 | ||||||
| Gross profit | 2,824 | 35,290 | 52,773 | 13,824 | 104,711 | |||||||||||
| Net income (loss) available to common stockholders | (10,180 | ) | 5,395 | (3,093 | ) | (4,238 | ) | (12,116 | ) | |||||||
For the year ended December 31, 2004:
| | 1st | 2nd | 3rd | 4th | Year | ||||||||||
|---|---|---|---|---|---|---|---|---|---|---|---|---|---|---|---|
| | (in thousands) | ||||||||||||||
| Revenues | $ | 37,380 | $ | 88,529 | $ | 106,507 | $ | 53,311 | $ | 285,727 | |||||
| Gross profit | 4,372 | 34,054 | 43,091 | 13,294 | 94,811 | ||||||||||
| Net income (loss) available to common stockholders | (14,789 | ) | 12,164 | 13,233 | (4,640 | ) | 5,968 | ||||||||
Off-Balance Sheet Arrangements
We have no off-balance sheet arrangements that have or are reasonably likely to have a current or future effect on our financial condition, changes in financial condition, revenues or expenses, results of operations, liquidity, capital expenditures or capital resources.
50
Critical Accounting Policies
Allowances for Doubtful Accounts. We maintain allowances for doubtful accounts for estimated losses resulting from the inability of our customers to make the required payments on their accounts. We have attempted to reserve for these estimated losses based on our past experience with similar accounts receivable and believe our reserves to be adequate. If the financial condition of our customers were to deteriorate, resulting in an impairment of their ability to make payments on their accounts, additional allowances may be required.
Long-Lived Assets. Property and equipment is carried at cost and is being depreciated on a straight-line basis over estimated lives of 10 to 40 years for buildings and site improvements and 2 to 20 years for plant, equipment and machinery. Maintenance and repairs are charged to expense as incurred, while capital improvements that extend the useful lives of the underlying assets are capitalized. We accounted for all of our historical acquisitions using the purchase method of accounting and as a result recorded significant amounts of goodwill. Other intangible assets include the following that are amortized over their useful lives:
| Intangible Assets | Useful Life | |
|---|---|---|
| Goodwill | Indefinite life | |
| Trade name | Indefinite life | |
| Customer relationships | Straight line method over economic lives of 15 to 30 years | |
| Debt issuance costs | Effective interest method over the term of the debt |
Impairment of Long-Lived Assets. In accordance with SFAS No. 144, "Accounting for Impairment or Disposal of Long-Lived Assets," long-lived assets and certain identifiable intangible assets to be held and used are reviewed for impairment on an annual basis or whenever events or changes in circumstances indicate that the carrying amount of such assets may not be recoverable. The determination of recoverability of long-lived assets and certain other identifiable intangible assets is based on an estimate of undiscounted future cash flows resulting from the use of the asset or its disposition. Measurement of an impairment loss for long-lived assets and other intangible assets that management expects to hold and use are based on the fair value of the asset. Long-lived assets to be disposed of are reported at the lower of carrying amount or net realizable value. In accordance with SFAS No. 142, "Goodwill and Other Intangible Assets," goodwill is evaluated using a market valuation approach based on valuations of comparable businesses, multiples of earnings of comparable businesses and discounted cash flows. Goodwill is evaluated at each fiscal year end and whenever events or changes in circumstances indicate that the carrying amount may not be recoverable.
Due to the significant reduction in cold storage sales volumes related to a particular customer, goodwill in the cold storage portion of our non-ice business segment was evaluated in accordance with SFAS No. 142, which resulted in a non-cash impairment charge of $5.7 million during the year ended December 31, 2005. There were no impairment charges in the three months ended March 31, 2006.
Inherent in the determination of such future cash flows and valuations are certain estimates and judgments, including the interpretation of current economic indicators and market values and assumptions about our strategic plans with regards to our operations. To the extent additional information arises or our strategies change, it is possible that our conclusions regarding the impairment of goodwill or other long-lived assets could change and result in a material effect on our financial position or results of operations.
Recently Adopted Accounting Pronouncements
In November 2004, the FASB issued SFAS No. 151, "Inventory Costs—an amendment of ARB No. 43, chapter 4". SFAS No. 151 seeks to clarify the accounting for abnormal amounts of idle facility expense, freight, handling costs, and wasted material (spoilage) in the determination of inventory carrying costs. The statement requires such costs to be treated as a current period expense. This statement is effective for fiscal years beginning after July 15, 2005. We adopted SFAS No. 151 on January 1, 2006. The adoption of SFAS No. 151 did not have a material effect on our results of operations and financial position.
51
In December 2004, the FASB issued SFAS No. 153, "Exchanges of Nonmonetary Assets, an Amendment to APB Opinion No. 29". The accounting guidance in APB Opinion No. 29, "Accounting for Nonmonetary Transactions", is based on the principle that exchanges of nonmonetary assets should be measured based on the fair value of the assets exchanged. The guidance in APB No. 29, however, included certain exceptions to that principle. SFAS No. 153 amends APB No. 29 to eliminate the exception for nonmonetary exchanges of similar productive assets and replaces it with a general exception for exchanges of nonmonetary assets that do not have commercial substance. A nonmonetary exchange has commercial substance if the future cash flows of the entity are expected to change significantly as a result of the exchange. SFAS No. 153 is effective for nonmonetary asset exchanges occurring in fiscal periods beginning after June 15, 2005. The adoption of SFAS No. 153 on January 1, 2006 had no effect on our results of operations and financial position.
We adopted SFAS No. 123(R), "Share Based Payment", on January 1, 2006. SFAS No. 123(R) establishes accounting standards for all transactions in which an entity exchanges its equity instruments for goods and services. SFAS No. 123(R) focuses primarily on accounting for transactions with employees, and carries forward without change prior guidance for share based payments for transactions with non-employees. Under the provisions of SFAS No. 123(R), we have selected the modified prospective method adoption and straight line amortization of compensation cost. The adoption of this standard did not have a material effect on our results of operations or financial position.
In March 2005, the FASB issued FASB Interpretation ("FIN") No. 47, "Accounting for Conditional Asset Retirement Obligations". FIN No. 47 clarifies that the term "conditional asset retirement obligation" as used in SFAS No. 143, "Accounting for Asset Retirement Obligations", refers to a legal obligation to perform an asset retirement activity in which the timing and (or) method of settlement are conditional on a future event that may or may not be within the control of the entity. An entity is required to recognize a liability for the fair value of a conditional asset retirement obligation if the fair value of the liability can be reasonably estimated. The fair value of a liability for the conditional asset retirement obligation should be recognized when incurred generally upon acquisition, construction, or development and (or) through the normal operation of the asset. Uncertainty about the timing and (or) method of settlement of a conditional asset retirement obligation should be factored into the measurement of the liability when sufficient information exists. FIN No. 47 was effective for fiscal years ending after December 15, 2005, and therefore is applicable for the year ended December 31, 2005. The adoption of FIN No. 47 had no effect on our results of operations and financial position.
Quantitative and Qualitative Disclosures About Market Risk
Market risk generally represents the risk that losses may occur in the value of financial instruments as a result of movements in interest rates, foreign currency exchange rates and commodity prices. Our main market risk exposure category is interest rate risk.
We are exposed to some market risk due to the floating interest rates under our credit facilities. Principal balances outstanding under the term loan and the revolving credit facility bear interest, at our option, at the London Inter-Bank Offered Rate ("LIBOR") plus 1.75% or the prime rate (as announced from time to time by the Administrative Agent) plus 0.75%.
Effective September 12, 2005, we entered into an interest rate hedging agreement (the "Hedge") to fix the interest rate on a notional balance of $220 million. See "—Liquidity and Capital Resources—Interest Rate Hedging Agreement."
As of March 31, 2006, our credit facilities had an outstanding principal balance of $240.0 million at the weighted average interest rate of 6.3% per annum. At March 31, 2006, the 30-day LIBOR rate was 4.8%. If LIBOR were to increase by 1% from year end levels, the annual increase expense, given our principal balances at March 31, 2006 and the effect of the Hedge, would be approximately $0.2 million.
52
Industry and market data used throughout this prospectus were obtained through company research, surveys and studies conducted by third parties and industry and general publications. Industry surveys, studies and publications generally state that they have obtained information from sources believed to be reliable, but do not guarantee the accuracy and completeness of such information. While we believe that each of these surveys, studies and publications is reliable, neither we nor the underwriters have independently verified such data, and neither we nor the underwriters make any representations as to the accuracy of such information. Similarly, we believe our internal research is reliable, but it has not been verified by any independent sources.
We estimate that the annual wholesale market for packaged ice is approximately $1.8 billion, which includes manufacturers such as ourselves and in-house production, primarily by small retail operations and, to a lesser extent, by large retailers. The packaged ice industry is highly fragmented and is led by us and several regional, multi-facility operators. The industry includes numerous local and regional companies of varying size and resources, with most ice manufacturers having annual revenues of less than $1.0 million.
Traditional ice manufacturers produce and distribute packaged ice from a centrally located facility and, as a result of high transportation costs, are typically limited to servicing customers within approximately 100 miles from the point of production. Packaged ice suppliers compete based primarily on service, quality and price, with success dependent upon prompt and reliable delivery during peak seasonal months, an efficient manufacturing and distribution system, high-density customer distribution routes within a region and high customer concentration in a market area. Each customer location typically carries one brand of ice provided by a single supplier.
The packaged ice industry is highly seasonal, characterized by peak demand during the warmer months of May through September, with an extended peak selling season in the southern United States. We believe volume growth in the packaged ice industry generally tracks population growth, thus favoring geographic markets with faster population growth. Demand within specific geographic markets can also be affected by weather conditions, with cool or rainy weather negatively impacting ice purchases.
53
Overview
We are the largest manufacturer and distributor of packaged ice in the United States, serving approximately 82,000 customer locations in 31 states and the District of Columbia under the Reddy Ice brand name. Our principal product is ice packaged in seven to fifty pound bags, which we sell to a highly diversified customer base, including supermarkets, mass merchants and convenience stores. In 2005, we sold approximately 1.9 million tons of ice. Our products are primarily sold throughout the southern United States (the "Sun Belt"), one of the most attractive regions in the country for packaged ice sales due to warm weather, extended peak selling seasons and favorable population growth patterns. Population growth is one of the primary drivers for growth in demand for packaged ice, and we operate in many of the fastest growing metropolitan areas in the United States. In addition, our broad geographic reach helps insulate us from the impact of cool or rainy weather in any particular region. No other manufacturer and distributor of packaged ice in the United States has the geographic presence, infrastructure or capacity necessary to meet the multi-state demands of customers in our markets.
Our business is characterized by consistent annual customer demand, attractive margins and modest annual capital requirements. Based on past experience, retail consumer demand for packaged ice is relatively unaffected by adverse economic conditions due to its low cost and the lack of readily available substitutes. For the year ended December 31, 2005, we had revenues, Adjusted EBITDA, and a net loss of $319.8 million, $84.8 million, and $12.1 million, respectively. For the three months ended March 31, 2006, we had revenues, Adjusted EBITDA and a net loss of $44.8 million, $0.5 million and $8.2 million, respectively.
We operate in two business segments: ice products and non-ice products and operations. Ice products accounted for approximately 95% of our total revenues in 2005. This segment consists of the traditional manufacture and delivery of ice from a central point of production to the point of sale as well as sales from The Ice Factory machines, our proprietary equipment located in our customers' high volume locations that produce, package and store ice through an automated, self-contained process. In 2005, traditional ice manufacturing and Ice Factory sales accounted for approximately 90% and 10% of our ice product revenues, respectively. Non-ice products and operations consist of refrigerated warehousing and the manufacture and sale of bottled water.
We market our ice products to satisfy a broad range of customers, primarily under the Reddy Ice brand name. We produce ice in cube, half-moon, cylindrical and crushed forms (collectively referred to as "cubed ice") as well as block forms. Our primary ice product is cubed ice packaged in small bags (typically seven and ten pounds), which we sell principally to convenience stores and supermarkets. We also sell significant amounts of medium bags of cubed ice (16 to 20 pounds) and ten-pound block bags to the same convenience stores and supermarkets. We sell cubed ice in assorted bag sizes ranging from 16 to 50 pounds to restaurants, bars, stadiums, vendors and caterers and block ice in 10-, 25- and 300-pound sizes to our commercial, agricultural and industrial customers. The majority of our sales are direct to supermarket chains, convenience stores, mass merchants and other commercial customers. In addition, a portion of our products is sold through distributors who deliver ice to our customers on our behalf and who resell ice to their own customers.
We have built a strong and loyal customer base by providing a high level of service and quality at competitive prices utilizing our extensive network of ice manufacturing plants and distribution centers. We have a diverse customer base and long-standing relationships with our customers across all major retail channels as evidenced by our high retention rates with prominent supermarkets, mass merchants and convenience stores such as Albertson's, Circle-K, ExxonMobil, Food Lion, Kroger, 7-Eleven and Wal-Mart. Our largest customer, Wal-Mart and Sam's Club on a combined basis, accounted for approximately 11% of our revenues in 2005 and the three months ended March 31, 2006. Most of our major customers, including nineteen of our top twenty retail ice customers in terms of revenues, have purchased ice from us and our predecessor companies for over a decade. Within our markets we are the sole supplier of packaged ice to the majority of our top twenty retail ice customers. The percentage of our total revenues derived from and volume sold to national and regional convenience and grocery store chains has grown over the last several years as each of these retail channels has consolidated. We have benefited from supplying these national and regional retailers as many of these customers have grown at rates in excess of industry averages.
54
At March 31, 2006, we owned or operated 58 ice manufacturing facilities, 54 distribution centers, approximately 79,000 merchandisers (cold storage units installed at customer locations), approximately 3,000 Ice Factories, five refrigerated warehouses and one bottled water plant. As of the same date, we had an aggregate daily ice manufacturing capacity of approximately 17,000 tons.
Competitive Strengths
Our competitive strengths include:
Stable and Predictable Cash Flow Generation. Historically, we have been able to generate significant cash flows from our operating activities. As a result of our recent acquisitions, limited working capital needs and modest capital expenditure requirements going forward, we believe we are well positioned to generate strong free cash flow to pay dividends to our stockholders and to service our indebtedness. In addition, at December 31, 2005, we had approximately $122 million of federal and state net operating loss carryforwards, or NOLs, which, subject to limitations, are available to offset future taxable income. These NOLs will begin to expire in 2012 and, if not utilized, will fully expire by 2025.
Multi-State Presence and Infrastructure. We are the largest company in the packaged ice industry, serving customers in 31 states and the District of Columbia. Our large geographic footprint gives us the necessary manufacturing capacity and distribution scale to service large retailers across multiple states and regions. Smaller local suppliers do not have the multi-state or multi-region service capabilities increasingly required by such customers. As a result of our multi-state presence and infrastructure, we believe we are well positioned to benefit from continued consolidation within our customer base and from increased reliance by national and regional customers on suppliers that serve multiple markets. In addition to providing us with competitive advantages with our customers, our broad geographic reach also helps insulate us from the variability of weather patterns in any individual region.
Leading Market Position in Attractive Ice Markets. We are the largest manufacturer and distributor of packaged ice in the United States. We are the market leader in the Sun Belt, one of the most attractive regions in the United States for packaged ice in terms of weather and population growth patterns. The markets we serve include many of the fastest growing metropolitan areas in the United States. We believe our strong market position in these desirable markets is likely to contribute to future growth in revenue and profitability.
Long Standing Relationships with High Quality Customers. We have been providing ice products and delivery services to many of our customers for more than a decade. These customers include prominent retailers across a variety of channels. Many of these customers require significant volumes of ice products on a multi-state basis and would require numerous suppliers to replace the extent of the services we currently provide. In addition, our customers depend on our consistent ability to ensure prompt and reliable delivery, particularly during peak seasonal months. The strength of our customer relationships is further reinforced by the fact that almost all of our customers rely on a single supplier of packaged ice at each point of sale. We believe that the strength of our customer relationships provides us with a significant competitive advantage over other suppliers in our markets.
Multiple Distribution Service Offerings. We attract and retain customers by offering a variety of service alternatives to meet our customers' specific supply chain needs. These alternatives include traditional distribution methods, such as delivery to our merchandisers, delivery of bulk quantities to retail locations and warehouse shipments from a centralized point of production. In addition, our proprietary Ice Factory units provide certain high volume customers with self-contained on-site ice production, packaging and storage. These delivery alternatives enable us to offer our customers the flexibility to meet their specific supply requirements in a reliable and cost-efficient manner.
Strong, Incentivized Management Team with Proven Execution Capabilities. Led by our Chairman and Chief Executive Officer, William P. Brick, and our President and Chief Operating Officer, Jimmy C. Weaver, our executive officers have extensive industry experience, averaging approximately 13 years with us and our predecessors. Our management team has been responsible for successfully executing our strategy of increasing our profitability through operational improvements, including cost rationalization, facility consolidation and working
55
capital management, while strengthening customer relationships. After giving effect to this offering, members of our senior management team will have a combined equity ownership in Reddy Holdings of approximately 3.6% of Reddy Holdings' fully diluted common equity.
Business Strategy
Our business strategy is to strengthen our competitive position, increase revenues and drive profitability by:
Enhancing Revenue Growth. We believe there are several opportunities to maintain and grow our revenues through:
Growth from Our Existing Customers. We intend to capitalize on our long-standing customer relationships by growing with our large national and regional customers as they seek to increase their market penetration and consolidate the retail segments in which they operate. As the sole supplier in our regions to the majority of these customers, we are well positioned to share in our customers' growth. In addition, for certain customers for whom we are not the sole supplier, there is a likely opportunity to capture incremental volume as these customers continue to reduce their supplier base in order to achieve efficiencies across the supply chain.
New Product Introductions. We continue to broaden our product offerings through the introduction of new sizes of bagged ice. We believe that introducing new bag sizes at various price points offers an opportunity to enhance our product mix and increase our sales and operating margins.
Growth from Outsourcing Trends of Large Retailers. Several large retailers continue to produce packaged ice in-house. Consistent with general outsourcing trends among retailers, we have assumed certain ice supply requirements for a number of large retail chains that previously operated captive ice manufacturing facilities, including Albertson's, HEB and Safeway. We should be able to capture additional volume from new and existing customers if retailers increasingly choose to outsource and focus on their core competencies.
Selectively Pursuing Acquisitions. The packaged ice industry continues to be highly fragmented. We will continue to pursue strategic acquisitions in existing or adjacent geographic markets that enhance the density of our distribution routes, provide capacity rationalization opportunities, increase our market penetration in existing markets or expand our presence in contiguous markets. During the three months ended March 31, 2006, we acquired two ice companies. We acquired one an additional ice company in April 2006. Including direct acquisition costs, the total purchase price for these three acquisitions was approximately $2.0 million. In 2005, we acquired two businesses for purchase prices aggregating approximately $0.9 million, including direct acquisition costs of $0.02 million and purchased certain leased real estate assets for a purchase price of $2.5 million. In addition, we made 11 acquisitions in 2004, for purchase prices aggregating $16.9 million. We completed the integration of our 2004 and 2005 acquisitions with our operations, financial and management systems and customer service departments during the year in which these acquisitions were consummated.
Continuing Efficiency Improvements. In the last five years, we have consolidated our ice manufacturing and distribution facilities, reducing the total number of facilities (including all acquired facilities) from 136 to 112 at March 31, 2006. As we have reduced the number of facilities, we have increased our overall capacity by relocating equipment and investing in new equipment. We have identified several opportunities for continued facility consolidations that we expect can be implemented without a significant increase in capital expenditures. In addition, we believe there are opportunities for continued efficiency improvements through distribution route optimization.
Ice Products
We market our ice products to satisfy a broad range of customers, primarily under the Reddy Ice brand name. We produce our ice in cube, half-moon, cylindrical and crushed forms and also produce ice in block forms. Our primary ice product is cubed ice packaged in small bags (primarily seven and ten pounds), which we sell principally to convenience stores and supermarkets. We also sell significant amounts of medium bags of cubed ice (16 to 20 pounds) and ten-pound block bags to the same convenience stores and supermarkets. We sell cubed ice in assorted
56
bag sizes ranging from 16 to 50 pounds to restaurants, bars, stadiums, vendors and caterers. In addition, we sell block ice in 10-, 25- and 300-pound sizes to commercial, agricultural and industrial customers.
We continue to broaden our product offerings through the introduction of new sizes of bagged cubed ice as well as new ice products. New bag sizes such as ten-pound bags of cubed ice may offer an opportunity to enhance revenue and income from operations. In 2005, sales of ten-pound bags of cubed ice accounted for approximately 24% of ice product revenues, an increase from approximately 0.1% of ice product revenues in 2003. We expect sales of ten-pound bags as a percentage of ice product revenues to continue to increase in 2006. In addition, we continue to develop and test new products, including an extra clear, perfectly square ice cube that melts more slowly than standard ice cubes and is targeted toward consumers of home refrigerator ice.
Manufacturing
To ensure that the water supplied by each municipality meets our quality standards, the water is often filtered for use in the ice making process. We use low micron filtration, carbon filtration, water softeners, ozone generators and reverse osmosis as needed to achieve the proper water quality needed to produce a clear product. All of our ice manufacturing facilities are certified by the International Packaged Ice Association. This certification requires the inspection of more than 50 areas of operations, ensuring high water quality, a sanitary operating environment and safe working conditions.
We manufacture ice in two ways: the vertical plate method and the vertical tube method. In both methods, water is circulated over cold vertical surfaces where the flowing water freezes into ice. The process of freezing the water while in motion acts as a final purification process by extracting minerals and other dissolved solids still present in the water following the filtration process. When the ice builds to the proper thickness it is detached from the plates or tubes by heating the freezing surfaces. In the vertical plate method, the sheet of ice falls onto a motor driven cutter, which chops the ice into smaller sizes and empties into a collection bin. In the vertical tube method, as the tube of ice falls into the collection bin, it is cut into small cubes by a rotating cutter. From the collection bin, the ice is transferred to a central refrigerated holding bin where the ice is mechanically raked and dried before it is packaged.
From the central refrigerated holding bin, the ice is then mechanically screened to remove any small pieces and to separate the ice according to size. The ice is then transferred to packaging machines, where the ice is measured and packaged into a variety of bag sizes. After bagging the ice, the product is palletized and stored in our cold storage vaults before being delivered to customer locations.
For the majority of our manufacturing facilities, we use ammonia as the refrigerant in the ice makers and storage vaults. Ammonia is a common refrigerant used for most industrial refrigeration systems.
Distribution
Due to high product transportation and shipping costs, the ice business has historically been a regional service business in which manufacturers produce and package ice at centrally located facilities and distribute to a limited market radius of approximately 100 miles. Due to these geographic constraints and the limited amount of product differentiation in the packaged ice industry, we focus on maintaining an efficient service, distribution and pricing system in each of our markets. We deliver ice through both traditional distribution methods and the on-site Ice Factory system. We believe that this unique combination of distribution service offerings enables us to better serve our customers.
Traditional Distribution. We produce and bag ice at centrally located manufacturing facilities and subsequently sell the product with several delivery alternatives. These delivery alternatives include (1) delivering packaged ice directly to the customers' retail locations and stocking our merchandisers, (2) delivering pallet quantities to retail locations where our customers' employees stock our merchandisers and (3) warehousing shipments of ice from our facilities to the facilities of our customers who choose to deliver ice to their retail locations through their own distribution network. Our products are delivered through our own distribution operation as well as by third-party distributors who transport and deliver the product to our customers. These distributors also purchase ice from us for resale to their own customers. To store ice inventory, we own or rent appropriate freezer
57
space. We own or lease approximately 1,200 trucks for distribution in non-peak periods. During the peak summer months, we estimate that we may rent up to approximately 200 additional trucks.
We currently serve approximately 79,000 customer locations through traditional distribution methods, principally through the use of our company owned ice merchandisers that are installed at most of our customers' locations. Our size and scale provide us with an efficient production and distribution network by providing us with customer density, additional production capacity and dedicated distribution centers. The increased customer density has improved routing efficiencies and reduced our transportation costs, which represent our largest cost component. In addition, our production capacity in adjacent geographic markets has allowed us to avoid "out of ice" situations and related lost sales during peak periods.
In 2005, traditional ice manufacturing and distribution accounted for approximately 90% of ice product revenues.
Ice Factory. The Ice Factory is our proprietary self-contained automated system placed at the customer's location that manufactures, bags and stores packaged ice. Each unit is built to our specifications and includes an ice maker, merchandiser and bagging machine. The unit is capable of producing and packaging 240 bags of ice per day. The Ice Factory is most frequently used in high volume supermarkets and other commercial locations. The Ice Factory, when combined with traditional delivery methods, provides our customers with the flexibility to meet their specific supply requirements in a cost-efficient manner. Transportation costs, the most significant costs of traditional ice delivery, are eliminated by on-site production. As a result of these cost savings, we believe that The Ice Factory provides us with operating efficiencies in high volume locations compared to traditional ice delivery.
Ice Factory locations are selected only after a thorough review and analysis of historical ice sales and the local competitive environment. Approximately 800 of our installed base of approximately 3,000 Ice Factories are operated and maintained by other ice suppliers under management agreements with us. In 2005, Ice Factories accounted for approximately 10% of ice product revenues.
We believe that providing frequent, regular and reliable service and support to our customers is one of the most important elements in operating our Ice Factory network. We have a routine route servicing system, which utilizes trained service representatives to perform the regularly scheduled service procedures, and we maintain toll-free telephone support for responding to customer calls regarding repairs and maintenance.
Customers
We market our ice products to a broad range of customers, including supermarket chains, mass merchants, convenience stores, wholesale ice and food distributors, commercial users, resorts and restaurants, agricultural buyers and competitive producers and self-suppliers who experience supply shortages. The primary purchasers of our traditional ice products and users of our Ice Factory are retailers with no internal ice production capacity. We believe that our high level of service and quality products at competitive prices results in customer loyalty.
We have a diversified customer base. Our largest customer, Wal-Mart and Sam's Club on a combined basis, accounted for approximately 11% of our revenues in 2005 and for the three months ended March 31, 2006 and for approximately 10% and 9% of our revenues in 2004 and 2003, respectively. Our other largest national accounts include the supermarket chains Albertson's, Kroger and Safeway; and the convenience and petroleum store chains Circle K, 7-Eleven and ExxonMobil. Major regional customers include the supermarket chains Publix, Winn-Dixie, Food Lion and HEB and the convenience and petroleum store chains Diamond Shamrock, The Pantry and RaceTrac. In 2005, our sales, measured in terms of tons, were allocated to our retail channels as follows: 45% to supermarket and mass merchant chains, 28% to convenience and petroleum store chains, 13% to distributors and 14% to other channels. The percentage of our total volume measured in terms of tons sold to national and regional supermarket, mass merchant and convenience and petroleum store chains has grown from approximately 54% in 2002 to approximately 57% in 2005, due to consolidation within those retail channels.
58
Sales and Marketing
Our sales and marketing personnel communicate regularly with our existing customers and initiate discussions with potential new customers. Sales and marketing personnel at our corporate headquarters, along with certain members of our senior management, communicate with our larger national and regional chain customers while our field personnel handle smaller local customers and local representatives of our larger national and regional chain customers.
Typically, our customer relationships are long term and turnover of major customers is infrequent. As a result, a significant portion of our corporate sales and marketing efforts are focused on maintaining and expanding these existing relationships. We also regularly explore and develop new customer relationships.
Competition
The traditional packaged ice industry is highly competitive and highly fragmented. In the United States, the traditional packaged ice industry is led by us and three smaller, regional, multi-facility suppliers. The largest of these regional ice suppliers recently announced that it has entered into an agreement to acquire another of the three regional suppliers that is primarily active in California. Although these regional suppliers generally do not serve customers in our primary markets, we do compete with numerous smaller local and regional companies of varying sizes and competitive resources. Most ice manufacturers have annual revenues of less than $1.0 million. In addition to our direct competition, numerous convenience and grocery retailers operate commercial ice plants for internal use or manufacture and bag ice at their store locations. However, our ice products generally do not face competition within a particular store as almost all of our customers rely on a single supplier of packaged ice at each point of sale.
Competition in the packaged ice industry is based primarily on service, quality and price. To compete successfully, an ice manufacturer must be able to offer significant supply and distribution capacity on a seasonal basis while maintaining cost efficiency. We are the largest company in the packaged ice industry, serving customers in 31 states and the District of Columbia. Our large geographic footprint, manufacturing capacity and distribution infrastructure, including traditional ice delivery, warehouse delivery and The Ice Factory, gives us the ability to service large retailers across multiple states and regions in a variety of ways. Because of these attributes, we are positioned to benefit from continued consolidation within our customer base and from increased reliance by national and regional customers on suppliers that serve multiple markets.
We have been providing ice products and delivery services to many of our large customers for more than a decade. Our customers depend on our consistent ability to ensure prompt and reliable delivery, particularly during peak seasonal months. The strength of our customer relationships is further reinforced by the fact that almost all of our customers rely on a single supplier of packaged ice at each point of sale. We believe that the strength of our customer relationships provides us with a significant competitive advantage over other suppliers in our markets.
Acquisitions
From 1997 through 1999, we pursued a consolidation strategy within the highly fragmented packaged ice industry. During that period, we completed approximately 80 acquisitions. Significant acquisitions included the purchase of Reddy Ice Corporation from Suiza Foods Corporation in April 1998 and the purchase of Cassco Ice & Cold Storage, Inc., which we refer to in this prospectus as Cassco, in July 1998. Reddy Ice Corporation, prior to our acquisition of it, had been active in the consolidation of the packaged ice industry, having made 28 acquisitions from January 1997 to April 1998. Cassco was a leading regional producer and distributor of packaged ice products and was an owner/operator of refrigerated warehouses in the mid-Atlantic region. We did not complete any significant acquisitions from 1999 through the third quarter of 2003 due to the decline in our common stock value and our substantial leverage.
In the fourth quarter of 2003, we acquired two ice companies for purchase prices aggregating $67.4 million, the more significant of which was Triangle Ice Co., Inc., the purchase price for which was approximately $64.3 million. These acquisitions were financed with the proceeds from a sale of our common and preferred stock, term loan borrowings under our credit facilities and the use of cash on hand. Prior to the acquisition, Triangle operated primarily in North and South Carolina. Although Triangle served some of the same customers as we did
59
before we acquired Triangle, such as Food Lion, Wal-Mart, Winn-Dixie and Circle K, there was no overlap between any of our customer locations and those of Triangle. With revenues of approximately $30.0 million for the fiscal year ended April 30, 2003, Triangle owned or operated eight ice manufacturing facilities and one distribution center and had an aggregate daily ice manufacturing capacity of approximately 2,085 tons.
In 2004, we completed eleven acquisitions for a total purchase price of approximately $16.9 million, including direct acquisition costs of $0.5 million. In 2005, we completed two acquisitions for a total purchase price of approximately $0.9 million, including direct acquisition costs of $0.02 million, and purchased certain leased real estate assets for a purchase price of $2.5 million. The purchase price for each of these acquisitions in 2004 and 2005 was paid from our available working capital. Annual revenue associated with each of the acquisitions in 2004 and 2005 ranged from $0.1 million to $3.2 million and aggregated approximately $14 million. These acquisitions have added three ice manufacturing facilities and five distribution centers to the facilities we own or operate.
During the three months ended March 31, 2006, we acquired two ice companies. We acquired an additional ice company in April 2006. The total purchase price, including direct acquisition costs for these three acquisitions, was approximately $2.0 million. Annual revenue associated with these acquisitions aggregates approximately $1.5 million. These acquisitions have added one ice manufacturing plant to the facilities we own and operate.
We will continue to consider strategic acquisitions in existing or adjacent geographic markets that enhance the density of our distribution routes, provide capacity rationalization opportunities, increase our market penetration in existing markets or expand our presence in contiguous markets.
Dispositions
In recent years, as part of our strategy to reduce our debt and make better use of our assets, we began a program to evaluate and dispose of excess and non-core assets, including real estate and equipment. In 2005, 2004 and 2003, we realized $2.1 million, $2.7 million and $1.5 million, respectively, in proceeds from non-core assets disposed of, primarily through the sale of real estate. In 2005 and 2004, we recorded losses on the dispositions of assets in the amount of $1.8 million and $0.4 million, respectively. In 2003, we realized a gain of $0.01 million related to dispositions. There were no impairments or writedowns associated with dispositions in 2005, 2004, or 2003.
Non-Ice Products
We also derive revenues from other goods and services, including refrigerated warehousing and the manufacture and sale of bottled water. Revenues from these non-ice products and operations have accounted for approximately 5%, 6% and 8% of our total revenues during the years ended December 31, 2005, 2004 and 2003, respectively.
Employees and Labor Relations
At May 1, 2006, we directly employed approximately 1,500 company employees and retained approximately 1,000 additional employees through temporary employment agencies. Each year, during the second and third quarters, our labor force increases to approximately 2,900 total employees due to seasonal increases in ice demand and during the first and fourth quarters, our labor force decreases to approximately 2,000 total employees due to seasonal decreases in ice demand. We direct and control the hiring process for substantially all of these seasonal employees, while using temporary employment agencies for payroll administration and risk management of workers compensation insurance. We generally have not experienced any difficulty in meeting these seasonal employment needs. Labor, including the associated payroll taxes and benefit expenses, is our most significant expense item and was approximately 32% of our revenues for the year ended December 31, 2005. As of May 1, 2006, no employees were represented by a union or subject to a collective bargaining agreement. We have never experienced a work stoppage due to labor difficulties and we believe our relationship with our employees is good.
Raw Materials and Suppliers
We have not experienced any material supply problems in the past with respect to our business segments.
60
We use large quantities of plastic bags. The cost of bags was approximately 7% of our revenues in 2005. There are numerous plastic bag manufacturers throughout the United States with the capability of providing for our plastic bag needs. Although one company dominates the industry, we currently purchase bags from several companies to ensure price competition. Historically, market prices for plastic bags have fluctuated in response to a number of factors, including changes in polyethylene prices. During 2005, increases in the price of plastic bags resulted in approximately $3.0 million of additional costs. Significant increases in the cost of plastic bags could have a material adverse effect on our business as we may not be able to pass this expense through to our customers. We continue to evaluate means to control these costs in the future.
Electricity is a significant component of our manufacturing costs. The cost of electricity was approximately 5% of our revenues in 2005. Since 2002, our plants have been operating in both regulated and deregulated electricity markets. A significant number of our manufacturing facilities operate in regulated electricity markets and pay rates based on standard schedules for similar industrial facilities. With the assistance of an outside consultant and our own internal resources, we regularly monitor and review rate schedules, usage and other statistical data to ensure proper billing and identify additional cost control opportunities that may be available in these regulated markets. In deregulated electricity markets, we regularly evaluate market conditions and competing suppliers to obtain the best pricing available. Significant increases in electricity rates in both the regulated and deregulated markets in which we operate could have a material adverse effect on our results of operations as we may not be able to pass this expense through to our customers. The effect of electric rate increases in 2005 was not material. However, we expect rate increases in 2006 to have a more significant impact on our results of operations as regulated utilities begin to pass through energy cost increases. In addition, our fixed rate electric supply contract to supply the electricity to the majority of our Texas facilities will expire in June 2006 and we have already renewed the contract at higher rates.
We have relationships with approximately 175 third party ice distributors and co-packers throughout our market area who deliver a portion of our products to our customers and sell ice to their own customers. We have contractual relationships with approximately 110 of these distributors and co-packers. Our contracts contain standard terms governing their relationship with us, including exclusivity and price. Distributors handled approximately 27% of our ice sales, measured in terms of seven-pound equivalent units, in 2005, either delivering the product to our customers for a delivery fee or reselling the ice to their own customers. We generally do business with distributors under one of two arrangements. Beginning in the first half of 2004, we began shifting the majority of our distributors to an arrangement that results in reporting sales and cost of sales (excluding depreciation) at their gross, rather than net, amounts. Total costs related to these distribution services were approximately 6% of our revenues in 2005.
We also use large quantities of fuel in our distribution process. Numerous vendors throughout the United States provide the fuel for our vehicles. Fuel expenses in 2005 and 2004 were approximately 3% of our revenues. Market prices for fuel have fluctuated widely in the past. Significant increases in fuel prices could have a material adverse effect on our business as we may not be able to pass this expense through to our customers. During 2005, increases in the price of fuel resulted in approximately $2.3 million of additional costs.
Information Systems
Internal information systems are critical to our ability to operate efficiently. We are able to monitor individual manufacturing plants and Ice Factory performance on a daily basis through automated and manual reporting systems. This information enables us to track detailed cost and profitability information, identify opportunities to redistribute traditional manufacturing capacity among markets, assess the cost-effectiveness of an Ice Factory at a particular location and analyze market sales trends. In addition, all of our accounting and financial reporting functions are integrated into a single accounting platform that is installed in all reporting locations and connected to our central facility in Dallas, Texas. This system facilitates centralized cash management, timely financial reporting, consistent reporting formats and improved inventory tracking. We are currently in the process of implementing mobile technology with our delivery personnel to create and record sales transactions. As of May 1, 2006, this process was substantially complete. We anticipate extending this mobile technology implementation to our distributor base in 2006 and 2007.
61
Intellectual Property
We regard The Ice Factory® as proprietary and rely primarily on a combination of patents, nondisclosure and confidentiality agreements and other protection methods to secure and protect our intellectual property rights. We hold or have exclusive rights to several patents relating to The Ice Factory, including the bagging device and the overall assembly of the unit. The patents filed in North America relating to The Ice Factory expire at various dates from 2010 through 2014. In addition, we have developed or acquired a number of trademarks (both registered and common law) and trade names for use in our ice business, and we hold licenses for the use of additional trademarks from third parties. We believe the use of our trademarks creates goodwill and results in product differentiation. However, we do not believe that the loss of any of our trademarks would have a material adverse effect on our business or results of operations.
Government Regulation
The packaged ice industry is subject to various federal, state and local laws and regulations. These require us to, among other things, obtain licenses for our plants and machines, pay annual license and inspection fees, comply with certain detailed design and quality standards regarding our plants and Ice Factories and continuously control the quality and quantity of our ice.
Our packaged ice products are subject to federal and state regulation as a food pursuant to the Federal Food, Drug and Cosmetic Act, regulations promulgated thereunder by the Food and Drug Administration and analogous state statutes. These statutes and regulations impose comprehensive food manufacturing practices governing the sanitary conditions of the facilities where ice is manufactured, the design and maintenance of the equipment used to manufacture the ice, the quality of source water and the sanitary practices of employees during ice production. We cannot predict the types of government regulations that may be enacted in the future by federal, state or local governments or how existing or future laws or regulations will be interpreted or enforced. The enactment of more stringent laws or regulations or a stricter interpretation of existing laws and regulations may require additional expenditures by us, some of which could be material. Various states have imposed additional requirements including (1) quarterly testing of ice for the presence of microbes and certain substances regulated under the federal Safe Drinking Water Act, (2) specific requirements for keeping ice packaging operations separate from other activities and (3) labeling requirements for the bags used, including the name of the ice manufacturer, the manufacturing location and the net weight. Certain of our Ice Factories and ice manufacturing facilities are subject to routine and random safety, health and quality inspections. We believe that our facilities, manufacturing practices and Ice Factories are in substantial compliance with all applicable federal, state and local laws and regulations and that we will be able to maintain such substantial compliance in the future.
We are subject to certain health and safety regulations, including Occupational Safety and Health Act regulations. These regulations require us to comply with certain manufacturing, health and safety standards to protect our employees from accidents. From time to time, our employees experience accidents on the job, which on occasion will result in a review or an investigation by the Occupational Safety and Health Administration. Such reviews may result in penalties or the requirement that we make modifications to our procedures or facilities, all of which may result in increased costs.
Environmental Matters
Our ice manufacturing, bottled water and cold storage operations are subject to a wide range of environmental laws and regulations governing, among other things, air emissions, wastewater discharges, the use, management and disposal of hazardous and non-hazardous materials and wastes, and the cleanup of contamination. These requirements are complex, changing and tend to become more stringent over time. Noncompliance with such laws and regulations, or incidents resulting in environmental releases, could cause us to incur substantial costs, including cleanup costs, fines and penalties, third party claims for personal injury, investments to retrofit or upgrade our facilities and programs, or curtailment of our operations.
Our facilities use refrigerants such as ammonia and Freon in manufacturing and cold storage operations. We have implemented risk and safety management plans at our facilities, as required under applicable laws and
62
regulations, based on the quantity of ammonia stored and/or used at these locations. We will continue to review our facilities on an ongoing basis, including recently acquired facilities, to evaluate the feasibility of reducing on-site ammonia storage through engineering controls or, where required, to implement or update such programs. Some of our facilities that use various Freon compounds may not be in compliance with applicable Freon refrigerant requirements, including leak detection and repair, recordkeeping or reporting. We will continue to identify subject facilities and to implement procedural or mechanical changes as necessary to comply with applicable laws and regulations. To date, maintaining compliance with and addressing violations under these and other environmental laws and regulations has not had a significant effect on our business, financial condition or results of operations. However, significant operating costs and capital expenditures could be incurred if additional or more stringent requirements are imposed in the future.
From time to time, our use of ammonia has resulted in incidents that have temporarily disrupted our manufacturing operations and resulted in liability for administrative penalties and claims for personal injury. To date our costs to resolve these liabilities have not been material. Although we carry liability insurance against such losses, we could incur significant costs if our coverage is not sufficient to pay for all or a large part of any judgments against us, or if our carrier refuses coverage for these losses.
In addition, some Freon refrigerants are subject to phase-outs and, as a result, are very costly to obtain. We will continue to reduce our dependence on such Freon compounds by upgrading or modifying our operations and by identifying approved substitutes. Based on current information, we believe that the Freon phase-outs will not impede our ability to produce ice and provide cold storage or result in material cost increases for Freon substitutes.
Certain of our current and former facilities have a history of industrial or commercial operations. Because some environmental laws can impose liability for the entire cost of cleanup upon any of the current or former owners or operators, regardless of fault, it is possible that we could become liable for investigating or remediating contamination at these properties if any investigation or remediation is required in the future. Such costs have not historically had, and are not expected to have in the future, a material adverse effect on our business, financial condition or results of operations.
Seasonality
The packaged ice business is highly seasonal, characterized by peak demand during the warmer months of May through September, with an extended peak selling season in the southern United States. Approximately 69%, 68% and 66% of our annual revenues occurred during the second and third calendar quarters in each of 2005, 2004 and 2003. Approximately 68% of our annual revenues also occurred during the second and third calendar quarters of 2002, 2001 and 2000. For information on our revenues per quarter for each of 2005, 2004 and 2003, see Note 16 to our audited consolidated financial statements included elsewhere in this prospectus. The higher level in 2005 was primarily due to the effects of the hurricane season, which caused a significant increase in sales during the third quarter of 2005. The lower level in 2003 was primarily due to the timing of our acquisitions, which occurred in the fourth quarter of that year. As a result of seasonal revenue declines and a less than proportional decline in certain expenses during the first and fourth quarters, we typically experience lower margins resulting in losses during these periods. In addition, because our operating results depend significantly on sales during our peak season, our quarterly results of operations may fluctuate significantly as a result of adverse weather during this peak selling period if the weather is unusually cool or rainy on a national or regional basis.
Properties
We maintain our principal executive offices in Dallas, Texas, where we lease approximately 17,958 square feet of space. The lease in Dallas expires in 2015. At March 31, 2006, we owned or leased 58 ice manufacturing plants, 54 distribution centers, five refrigerated warehouses and one bottled water plant. As of March 31, 2006, we leased 12 of our ice manufacturing plants and 18 of our distribution centers. The leases are scheduled to expire at various dates from 2007 to 2016. Including an installed base of approximately 3,000 Ice Factories, we had a combined, rated ice manufacturing capacity of approximately 17,000 tons per day. We believe that our current physical properties, along with our planned capital expenditures, are adequate for us to execute our current business strategy.
63
Certain manufacturing and distribution facilities may be permanently closed in conjunction with our continuing consolidation plans, while others may be closed on a seasonal basis depending upon production requirements. As of March 31, 2006, we had four idle properties that are being marketed for disposition. These properties are excluded from the table below.
The following is a list of our active facilities and total rated traditional ice manufacturing capacity as of March 31, 2006:
| | Ice Products | Non-Ice Products | | |||||||
|---|---|---|---|---|---|---|---|---|---|---|
| | Traditional Manufacturing Capacity (Tons Per Day)(1) | |||||||||
| | Manufacturing Facilities | Distribution Centers | Refrigerated Warehouses | Bottled Water Plants | ||||||
| Alabama | 2 | 1 | — | 1 | 472 | |||||
| Arizona | 3 | 3 | — | — | 1,009 | |||||
| Arkansas | 1 | 3 | — | — | 240 | |||||
| California | 1 | — | — | — | 80 | |||||
| Colorado | 1 | — | 1 | — | 320 | |||||
| Florida | 9 | 5 | — | — | 1,957 | |||||
| Georgia | 5 | 3 | — | — | 1,380 | |||||
| Louisiana | 3 | 6 | — | — | 720 | |||||
| Maryland | 1 | 2 | — | — | 240 | |||||
| Mississippi | — | 2 | — | — | — | |||||
| Missouri | 1 | — | — | — | 180 | |||||
| Nevada | 1 | — | 1 | — | 260 | |||||
| New Mexico | 1 | 3 | — | — | 160 | |||||
| North Carolina | 4 | — | 1 | — | 1,225 | |||||
| Oklahoma | 3 | 2 | — | — | 502 | |||||
| South Carolina | 4 | — | — | — | 860 | |||||
| Tennessee | 2 | — | — | — | 408 | |||||
| Texas | 11 | 20 | — | — | 2,760 | |||||
| Utah | 1 | — | — | — | 140 | |||||
| Virginia | 3 | 4 | 2 | — | 880 | |||||
| West Virginia | 1 | — | — | — | 120 | |||||
| Total | 58 | 54 | 5 | 1 | 13,913 | |||||
- (1)
- Does not include the rated ice manufacturing capacity of our installed Ice Factories, which was approximately 3,000 tons per day in the aggregate as of March 31, 2006 and approximately 476 tons per day of idle traditional ice manufacturing capacity as of March 31, 2006.
Legal Proceedings
We are involved in various claims, lawsuits and proceedings arising in the ordinary course of business. There are uncertainties inherent in the ultimate outcome of such matters and it is difficult to determine the ultimate costs that we may incur. We believe the resolution of such uncertainties and the incurrence of such costs will not have a material adverse effect on our consolidated financial position, results of operations or cash flows.
64
Directors and Executive Officers
The following table sets forth information regarding Reddy Group's executive officers and the members of Reddy Holdings' board of directors and committee memberships. The composition of Reddy Group's board of directors is identical to that of Reddy Holdings, however there are no committees of Reddy Group's board of directors.
| Name | Age | Positions | ||
|---|---|---|---|---|
| William P. Brick(4) | 55 | Chairman of the Board of Directors and Chief Executive Officer | ||
| Jimmy C. Weaver | 52 | President, Chief Operating Officer and Director | ||
| Steven J. Janusek | 34 | Executive Vice President, Chief Financial Officer and Secretary | ||
| Ben D. Key | 51 | Senior Vice President—Sales | ||
| Graham D. Davis | 51 | Senior Vice President—Central Operations | ||
| Thomas L. Dann | 56 | Senior Vice President—Western Operations | ||
| Joseph A. Geloso | 51 | Senior Vice President—Eastern Operations | ||
| Raymond D. Booth | 54 | Senior Vice President—Mid-Atlantic Operations | ||
| Mark A. Steffek | 37 | Vice President—Finance and Treasurer | ||
| Andrew R. Heyer(2) | 48 | Director | ||
| Theodore J. Host(2)(3) | 60 | Director | ||
| David E. King(3)(4) | 47 | Director | ||
| Douglas R. Korn(2) | 43 | Director | ||
| Michael S. McGrath(1)(3) | 59 | Director | ||
| Tracy L. Noll(1)(2)(4) | 57 | Director | ||
| William P. Phoenix(3)(4) | 49 | Director | ||
| Robert N. Verdecchio(1)(2)(3) | 49 | Director |
- (1)
- Member of the Audit Committee. Mr. Noll is the chairperson of the committee.
- (2)
- Member of the Compensation Committee. Mr. Host is the chairperson of the committee.
- (3)
- Member of the Governance and Nominating Committee. Mr. Verdecchio is the chairperson of the committee.
- (4)
- Member of the Executive Committee.
William P. Brickbecame Chief Executive Officer of Reddy Holdings and a member of Reddy Holdings' board of directors on August 15, 2003, Chief Executive Officer of Reddy Group in April 2001 and the Chairman of Reddy Group's Board of Directors in June 2001. Prior to joining Reddy Group, Mr. Brick was employed by Suiza Foods Corporation, now known as Dean Foods Company, where he served as Executive Vice President from July 1996 until October 1996 and as Chief Operating Officer of Dairy Operations from October 1996 until January 2000. Before joining Suiza, Mr. Brick was the Vice President-Sales and Marketing for the Metropoulos Management Group from February 1996 until June 1996. From 1995 until January 1996, he served as Vice President-Sales and Marketing for Ultra Products. In addition, from 1991 until December 1994, Mr. Brick held various positions with the Morningstar Group, Inc., including Vice President of Sales, and he served in several capacities for Palm Dairies Inc. in Calgary, Alberta, from 1988 until 1991.
Jimmy C. Weaverbecame President of Reddy Holdings and a member of Reddy Holdings' board of directors on August 15, 2003, Chief Operating Officer of Reddy Group in April 1998, President of Reddy Group in February 2001 and Director of Reddy Group in May 2002. From April 1998 through January 2001, he served as Executive
65
Vice President of Reddy Group. Mr. Weaver joined Reddy Ice Corporation in September 1996 and was President of Reddy Ice Corporation prior to its acquisition by Reddy Group in April 1998. From May 1993 until August 1996, Mr. Weaver was Vice President of Sales and Marketing of Booth/Crystal Tips, a manufacturing division of Scotsman Industries based in Dallas, Texas, that produces and sells ice making equipment.
Steven J. Janusek became Executive Vice President, Chief Financial Officer and Secretary of Reddy Holdings on August 15, 2003, Chief Financial Officer of Reddy Group in October 2000, Executive Vice President of Reddy Group in April 2001 and Secretary of Reddy Group in June 2001. Mr. Janusek is a certified public accountant and served as Treasurer from February 2000 until March 2001 and as Corporate Controller from January 1998 until October 2000. Mr. Janusek joined Southwestern Ice, Inc. in July 1994 and from January 1996 served as the Corporate Controller of Southwestern Ice until its merger with Reddy Group in April 1997. Mr. Janusek briefly resigned his position as Chief Financial Officer in March 2001 to pursue another opportunity but returned to Reddy Group as Chief Financial Officer in April 2001.
Ben D. Key became Senior Vice President—Sales of Reddy Group in April 2001. From April 1998 until April 2001, Mr. Key served as Vice President—Sales. Mr. Key joined Reddy Ice Corporation in June 1997 and served in the same position prior to its acquisition by Reddy Group. Prior to joining Reddy Ice Corporation, Mr. Key was engaged in government service and political consulting for twenty years.
Graham D. Davis became Senior Vice President—Central Operations of Reddy Group in March 2001. From April 1998 through March 2001, he was Senior Vice President—Western Operations. For the five years prior to joining Reddy Group, Mr. Davis was Executive Vice President of Operations of Reddy Ice Corporation.
Thomas L. Dann became Senior Vice President—Western Operations of Reddy Group in March 2001. Mr. Dann joined Reddy Ice in 1987 through the acquisition of his company, Lampasas Ice, which he owned and operated from 1971. While at Reddy Ice Corporation and subsequently at Reddy Group, Mr. Dann has served in various management positions including Plant Manager, Zone Manager and Area Vice President.
Joseph A. Geloso became Senior Vice President—Eastern Operations of Reddy Group in February 2001. Mr. Geloso joined Reddy Ice Corporation in 1987 as a plant manager. While at Reddy Ice and subsequently at Reddy Group, Mr. Geloso served in various management positions including Plant Manager, Zone Manager and Area Vice President.
Raymond D. Booth became Senior Vice President—Mid-Atlantic Operations of Reddy Group in July 2003. Prior to joining Reddy Group, Mr. Booth was the principal of Booth Consulting, LLC and was engaged by Reddy Group to oversee its mid-Atlantic cold storage businesses as well as serving other food related clients. Mr. Booth has over 32 years experience in the dairy foods business, where his career engaged him in all aspects of the growth through acquisition and branding of Country Fresh, LLC. He served in various senior management positions including Senior Vice President of Country Fresh, LLC, one of the Midwest's largest dairy products providers. Country Fresh merged with Suiza Foods in November 1997, and Mr. Booth became Suiza's Senior Vice President of Operations in January 1999. He served in that capacity until January 2001 when he became President of Suiza's Country Fresh division. Mr. Booth served in that capacity until December 31, 2001 when he started his own consulting company.
Mark A. Steffek became Vice President—Finance and Treasurer of Reddy Holdings on August 15, 2003 and Vice President—Finance and Treasurer of Reddy Group in April 2001. Mr. Steffek is a certified public accountant and from September 1991 until he joined Reddy Group in September 2000 as Director of Financial Reporting and Assistant Treasurer, he served as an auditor with Deloitte & Touche LLP in various capacities, including senior manager.
Andrew R. Heyer became a member of the board of directors on August 15, 2003 and is a founder and Managing Director of Trimaran Fund Management, L.L.C. Prior to founding Trimaran, Mr. Heyer was a vice-chairman of CIBC World Markets Corp. and co-head of CIBC Argosy Merchant Banking Funds. Prior to joining CIBC in 1995, Mr. Heyer was a founder and managing director of The Argosy Group L.P. Mr. Heyer serves as a director of Niagara Corporation, Hain Celestial Group Inc., Millennium Digital Media Holdings, L.L.C., Brite Media Group LLC, Charlie Brown's Acquisition Corp., El Pollo Loco, Inc. and Village Voice Media, L.L.C. Mr. Heyer holds
66
an M.B.A. and a B.S. in economics from the Wharton School of the University of Pennsylvania. Mr. Heyer currently serves as a trustee of the University of Pennsylvania and Chairman of the Board of Overseers of the University of Pennsylvania School of Social Policy and Practice.
Theodore J. Hostbecame a member of the board of directors on November 15, 2005. Mr. Host is a private investor. From October 2001 to April 2004, Mr. Host was the CEO and Director, and from November 1999 until October 2001 was President, CEO and a Director, of Prestige Brands International, a consumer products company. Mr. Host worked with McCown DeLeeuw & Co. to create a consumer products start-up company from March 1996 to November 1999. Prior thereto, Mr. Host served as the President and Chief Operating Officer, and later Chief Executive Officer, of The Scotts Company, a lawn care company. Mr. Host holds Bachelor of Arts and Master of Arts degrees in business from New York University. Mr. Host is also a director and member of the audit and compensation committees of the board of directors of GlycoGenesys, Inc.
David E. King became a member of the board of directors on August 15, 2003 and is a Senior Managing Director of Bear, Stearns & Co. Inc. and an Executive Vice President of Bear Stearns Merchant Banking, LLC. Prior to joining Bear Stearns in April 2001, Mr. King was a Partner at McCown De Leeuw & Co., a private equity investment partnership from 1990 to 2000, in charge of that firm's New York office investment activities. Currently, Mr. King is a Director of 24 Hour Fitness Worldwide, Inc., ACA Capital Holdings, Inc., Cavalry Investments LLC, Churchill Financial Holdings, LLC, Global VantEdge, Inc. and Sutton Place Group, LLC. Mr. King also sits on the advisory board of Falconhead Capital LLC. Mr. King holds an M.B.A. from Stanford University, an M.S. from the State University of New York, Stony Brook, and a B.A. from Rice University.
Douglas R. Korn became a member of the board of directors on August 15, 2003 and is a Senior Managing Director of Bear, Stearns & Co. Inc. and an Executive Vice President of Bear Stearns Merchant Banking, LLC. Prior to joining Bear Stearns in January 1999, Mr. Korn was a Managing Director of Eos Partners, L.P., an investment partnership. Mr. Korn is currently a Director of Vitamin Shoppe Holdings. Mr. Korn holds an M.B.A. from Harvard Business School and a B.S. in economics from the Wharton School of the University of Pennsylvania.
Michael S. McGrathbecame a member of the board of directors on February 22, 2006. Mr. McGrath is the former President and Chief Operating Officer of Dr. Pepper/Seven Up, Inc., the North American business of Cadbury Schweppes plc. From August 1998 to March 2002, Mr. McGrath was President and Chief Operating Officer of Cadbury Beverages/Seven Up. In April 2002, Mr. McGrath's responsibilities as President and Chief Operating Officer were expanded to include Cadbury Schweppes' Dr. Pepper business. Mr. McGrath retired in January 2005. Mr. McGrath holds a Bachelor of Education from Boston College.
Tracy L. Noll became a member of the board of directors in November 2003 and is the chairman of our audit and compensation committees. Mr. Noll also served on the board of directors of Packaged Ice from September 2002 until the merger in August 2003. Mr. Noll is currently a private investor based in Dallas, Texas. Mr. Noll was President and Chief Operating Officer of National Dairy Holdings, L.P., a $2 billion private company, from April 2001 to September 2003. He previously served as Executive Vice President, Corporate Development of Suiza Foods Corporation, now known as Dean Foods Company, from 1997 to 2001 and as Suiza's Executive Vice President and Chief Financial Officer from 1994 to 1997. Mr. Noll serves as a director of Lakeview Farms Inc. and as director and audit committee chairman of Citi Trends, Inc.
William P. Phoenix became a member of the board of directors on August 15, 2003 and is a Managing Director of Trimaran Fund Management, L.L.C. Prior to joining Trimaran, Mr. Phoenix was a Managing Director of CIBC Capital Partners and was a Managing Director of CIBC World Markets Corp. Prior to joining CIBC World Markets Corp. in 1995, Mr. Phoenix had been a Managing Director of Canadian Imperial Bank of Commerce, which he joined in 1982. Mr. Phoenix also serves as a director of Millennium Digital Media Holdings, L.L.C., Eureka Broadband Corporation, Brite Media Group LLC and Charlie Brown's Acquisition Corp. and serves as a director and chairman of Urban Brands, Inc. Mr. Phoenix holds an M.B.A. from the University of Toronto and a B.A. in economics from the University of Western Ontario.
67
Robert N. Verdecchiobecame a member of the board of directors on September 7, 2005. Mr. Verdecchio is a private investor. From 1997 to 2004 he served as a member of the board of directors of Pegasus Communications Corporation when it operated as a provider of satellite, cable and broadcast television. Mr. Verdecchio also served as Pegasus' chief financial officer from 1991 to 1999. Mr. Verdecchio holds a B.S. in Accounting from Temple University.
Board of Directors
Composition of the Board of Directors
Our board of directors currently consists of ten directors. We currently have four independent directors, Theodore J. Host, Michael S. McGrath, Tracy L. Noll, and Robert N. Verdecchio. Our board of directors has determined that each of Mr. Host, Mr. McGrath, Mr. Noll and Mr. Verdecchio is "independent," as defined under and required by the Federal securities laws and the rules of the New York Stock Exchange. The rules of the New York Stock Exchange require a majority of the members of our board of directors to be "independent" directors prior to August 12, 2006, the first anniversary of the closing of our initial public offering. In connection with the consummation of this offering, we anticipate that Andrew R. Heyer, David E. King, Douglas R. Korn and William P. Phoenix will tender their resignations from our board of directors, as a result of which we will have a majority of independent directors on our board of directors.
Committees of the Board of Directors
Audit Committee. Our audit committee consists of Tracy L. Noll, Michael S. McGrath and Robert N. Verdecchio. Each member of the audit committee is financially literate, as such qualification is interpreted by the board of directors in its business judgment. In addition, our board of directors has determined that Mr. Noll is an "audit committee financial expert" as such term is defined in Item 401(h) of Regulation S-K. In accordance with the requirements of the New York Stock Exchange, the audit committee is composed entirely of "independent" (as defined under Federal securities laws and the rules of the New York Stock Exchange) directors.
The audit committee held eight meetings during the year ended December 31, 2005 and acted twice by written consent. The audit committee will have at least four regular meetings each year. The results of each meeting are reported at the next regular meeting of our board.
The audit committee has the responsibility for overseeing:
- •
- our accounting and financial reporting processes;
- •
- the reliability of our financial statements;
- •
- the effective evaluation and management of our financial risks;
- •
- our compliance with laws and regulations; and
- •
- the maintenance of an effective and efficient audit of our financial statements by a qualified independent registered public accounting firm.
The audit committee's duties include:
- •
- becoming aware of the current areas of greatest financial risk to us and ensuring that management is effectively assessing and managing risks;
- •
- considering the effectiveness of our disclosure controls and procedures to promote timely, accurate, compliant and meaningful disclosure in our periodic reports filed with the SEC;
- •
- periodically reviewing with the independent registered public accounting firm their assessment as to the adequacy of our structure of internal controls over financial accounting and reporting, and their qualitative judgments as to the accounting principles employed and related disclosures by us and the conclusions expressed in our financial reports;
68
- •
- reviewing our accounting policies and practices to ensure they meet the requirements with respect to the rules and pronouncements of the FASB, the SEC and the Public Company Accounting Oversight Board;
- •
- selecting, evaluating and, if necessary, replacing our independent registered public accounting firm;
- •
- actively engaging in dialogue with the independent auditors with respect to any disclosed relationships or services that may impact the objectivity or independence of the independent registered public accounting firm;
- •
- meeting with the independent registered public accounting firm, the internal auditors and senior management to review the scope and methodology of the proposed audit;
- •
- discussing with management policies and practices regarding earnings press releases, as well as financial information and earnings guidelines provided to analysts and rating agencies;
- •
- setting clear hiring policies with respect to any current or former employees of our independent registered public accounting firm;
- •
- reviewing periodically our code of conduct and obtaining confirmation from management that the policies included in the code of conduct are understood and implemented;
- •
- establishing procedures for the receipt, retention and treatment of complaints we receive regarding our internal accounting controls or auditing matters and for the confidential, anonymous submission by employees of their concerns regarding our internal accounting controls and auditing matters; and
- •
- having the authority to engage independent counsel and other advisers, as necessary, to carry out any of the foregoing duties.
Compensation Committee. Our compensation committee consists of Theodore J. Host, Tracy L. Noll, Andrew R. Heyer, Douglas R. Korn and Robert N. Verdecchio. Of the five members of our compensation committee, our board of directors has determined that three members, Messrs. Host, Noll and Verdecchio, are independent. The rules of the New York Stock Exchange require all members of the compensation committee to be "independent" directors prior to August 12, 2006, the first anniversary of the closing of our initial public offering. Prior to August 12, 2006 we expect to satisfy this requirement. The nominating and governance committee will recommend to our board nominees for the compensation committee.
The compensation committee held one meeting during the year ended December 31, 2005 and acted five times by written consent. The compensation committee will have at least one regular meeting each year. The results of each meeting are reported at the next regular meeting of our board.
The primary responsibility of the compensation committee is to develop and oversee the implementation of our philosophy with respect to the compensation of our officers. In that regard, the compensation committee's duties include:
- •
- developing and maintaining a compensation policy and strategy that creates a direct relationship between pay levels and corporate performance and returns to stockholders;
- •
- recommending compensation and benefit plans to our board for approval;
- •
- reviewing and approving annual corporate and personal goals and objectives to serve as the basis for the chief executive officer's compensation, evaluating the chief executive officer's performance in light of the goals and, based on such evaluation, determining the chief executive officer's compensation;
- •
- determining the annual total compensation for our chief executive officer, president, chief operating officer, chief financial officer and senior vice president of sales;
- •
- with respect to our equity-based compensation plans, approving the grants of stock options and other equity-based incentives as permitted under our compensation plans;
69
- •
- reviewing and recommending compensation for non-employee directors to our board; and
- •
- reviewing and recommending employment agreements, severance arrangements and change of control plans that provide for benefits upon a change in control, or other provisions for our executive officers and directors, to our board.
Governance and Nominating Committee. Our governance and nominating committee consists of Theodore J. Host, Michael S. McGrath, David E. King, William P. Phoenix and Robert N. Verdecchio. Of the five members of our governance and nominating committee, our board of directors has determined that three members, Messrs. Host, McGrath and Verdecchio, are independent. The rules of the New York Stock Exchange require all members of the governance and nominating committee to be "independent" directors prior to August 12, 2006, the first anniversary of the closing of our initial public offering. Prior to August 12, 2006 we expect to satisfy this requirement. The governance and nominating committee will recommend to our board nominees for the governance and nominating committee.
The governance and nominating committee held three meetings during the year ended December 31, 2005 and acted once by written consent. The governance and nominating committee will have at least one regular meeting each year. The results of each meeting are reported at the next regular meeting of our board. The governance and nominating committee's duties include:
- •
- identifying individuals qualified to serve as our directors;
- •
- recommending a set of corporate governance guidelines to our board;
- •
- reviewing periodically the composition of our board;
- •
- identifying and recommending director candidates for our board;
- •
- recommending to our board nominees for election as directors;
- •
- recommending to our board the composition of the committees of the board;
- •
- reviewing periodically our corporate governance guidelines and recommending governance issues that should be considered by our board;
- •
- reviewing periodically our committee structure and operations and the working relationship between each committee and the board; and
- •
- considering, discussing and recommending ways to improve our board's effectiveness.
Executive Committee. Our executive committee consists of William P. Brick, David E. King, Tracy L. Noll and William P. Phoenix. The executive committee has been delegated authority by our board of directors to approve certain acquisitions, dispositions and other transactions, in each case, subject to per-transaction dollar limitations and limitations imposed by Delaware law. The executive committee met frequently during the year ended December 31, 2005 and acted five times, in each case by written consent.
Compensation Committee Interlocks and Insider Participation
The compensation levels of our executive officers are currently determined by our compensation committee, subject to the approval of our board of directors. None of our executive officers has served as a director or member of the compensation committee, or other committee serving an equivalent function, of any entity of which an executive officer is expected to serve as a member of our compensation committee.
Codes of Conduct and Ethics and Corporate Governance Guidelines
Prior to the consummation of our initial public offering, our board of directors adopted (1) a new code of business conduct and ethics applicable to our directors, officers and employees and (2) new corporate governance guidelines, each in accordance with applicable rules and regulations of the SEC and the New York Stock Exchange.
70
Director Compensation
None of the existing board members, other than the independent members, presently receives any compensation for their services on the board. The annual compensation for the services of our independent directors is $25,000 per annum, payable quarterly in arrears, plus an additional $2,500 per annum for each committee on which he or she serves. Additionally we have granted stock options and restricted share units to our independent directors from time to time, as determined by the full board of directors. Directors are also reimbursed for ordinary and necessary expenses incurred in attending meetings of the Board of Directors or committee meetings. On November 3, 2005, we granted 4,000 restricted share units ("RSUs") to each of our independent directors at that time. Fifty percent of each award of RSUs (the "Time-vested RSUs") will vest in four equal annual installments beginning on August 12, 2006 and continuing on August 12 of each of the following three years, provided the recipient remains a director of Reddy Holdings through such vesting dates. The remaining fifty percent of each award of RSUs (the "Performance-vested RSUs") will vest in four equal annual installments beginning on August 12, 2006 and continuing on August 12 of each of the following three years, provided the recipient remains a director of Reddy Holdings through such vesting dates and the applicable performance condition for the applicable vesting period is met. At the time of their appointment to the board of directors, Mr. Host and Mr. McGrath were granted 4,000 and 3,500 RSUs, respectively, with substantially similar vesting provisions to the RSUs granted on November 3, 2005.
Executive Compensation and Incentive Programs
Summary Compensation Table
The following table sets forth certain compensation information for our Chief Executive Officer and four additional highly compensated executive officers (the "Named Executive Officers") for the three years ended December 31, 2005, 2004 and 2003:
| | | Annual Compensation | Long-Term Compensation | | ||||||||||||||||
|---|---|---|---|---|---|---|---|---|---|---|---|---|---|---|---|---|---|---|---|---|
| Name/Principal Position | Year | Salary | Bonus | Annual Other Compensation | Restricted Awards Stock | Securities Underlying Options | All Other Compensation | |||||||||||||
| William P. Brick Chairman of the Board, Chief Executive Officer | 2005 2004 2003 | $ | 418,269 389,231 360,000 | $ | 443,483 54,467 293,781 | $ | — — 60,262 | (4) | $ | 2,520,000 — 182,968 | (1) (5) | — 32,568 273,240 | $ | 186,716 242,602 668,441 | (2) (3) (6) | |||||
Jimmy C. Weaver President & Chief Operating Officer | 2005 2004 2003 | $ | 293,269 275,000 242,308 | $ | 234,601 32,453 194,494 | $ | — — 34,341 | (4) | $ | 1,680,000 — 107,820 | (1) (5) | — — 325,266 | $ | 208,023 249,227 407,021 | (2) (3) (6) | |||||
Steven J. Janusek Executive Vice President, Chief Financial Officer & Secretary | 2005 2004 2003 | $ | 209,231 180,000 164,308 | $ | 132,339 16,340 97,927 | $ | — — 14,934 | (4) | $ | 1,008,000 — 45,306 | (1) (5) | — — 143,106 | $ | 94,694 111,146 172,737 | (2) (3) (6) | |||||
Ben D. Key Senior Vice President—Sales | 2005 2004 2003 | $ | 171,923 150,000 150,000 | $ | 108,277 13,617 81,606 | $ | — — 12,932 | (4) | $ | 504,000 — 43,564 | (1) (5) | — — 84,594 | $ | 60,787 66,953 159,562 | (2) (3) (6) | |||||
Raymond D. Booth Senior Vice-President—Mid-Atlantic Operations | 2005 2004 2003 | $ | 157,300 147,308 66,231 | $ | 96,247 13,617 25,000 | $ | — — — | $ | 504,000 — — | (1) | — — 130,107 | $ | 102,420 100,828 13,417 | (2) (3) (6) | ||||||
- (1)
- Represents award of restricted stock units ("RSUs"). Fifty percent of the RSUs will vest in four equal annual installments beginning on August 12, 2006 and continuing on August 12 of each of the following three years, provided the employee remains employed with the Company through such vesting dates. The remaining 50% of each award of RSUs will vest in four equal annual installments beginning on August 12, 2006 and continuing on August 12 of each of the following three years, provided the employee remains employed with the Company through such vesting dates and the applicable performance condition for the applicable vesting period is met.
- (2)
- Represents amounts (i) paid to the employee as a special transaction bonus in connection with our initial public offering in August 2005, (ii) the reimbursement of sales commissions incurred by the employee in connection with the sale of common stock in the initial public
71
offering, (iii) contributions made to Reddy Group's 401(k) plan by us, (iv) the value of travel and lodging expenses paid by us for the benefit of the employee's spouse and (v) the value of life insurance benefits paid by us; for Mr. Brick, such amount also includes $7,500 of reimbursements for a life insurance policy. The amounts by employee and category are as follows:
| | Special Transaction Bonus | Commission Reimbursement | 401(k) Contributions | Spousal Travel | Life Insurance | Total | ||||||||||||
|---|---|---|---|---|---|---|---|---|---|---|---|---|---|---|---|---|---|---|
| William P. Brick | $ | 176,250 | $ | — | $ | 2,000 | $ | — | $ | 8,466 | $ | 186,716 | ||||||
| Jimmy C. Weaver | 187,500 | 18,340 | 1,125 | 92 | 966 | 208,023 | ||||||||||||
| Steven J. Janusek | 82,500 | 10,189 | 2,000 | 5 | — | 94,694 | ||||||||||||
| Ben D. Key | 48,750 | 9,781 | 1,290 | — | 966 | 60,787 | ||||||||||||
| Raymond D. Booth | 75,000 | 27,183 | — | 237 | — | 102,420 | ||||||||||||
- (3)
- Represents amounts (i) paid to the employee as a special transaction bonus in connection with the October 2004 issuance of the Reddy Holdings notes, (ii) contributions made to Reddy Group's 401(k) plan by us and (iii) the value of life insurance benefits paid by us; for Mr. Brick, such amount also includes $7,500 of reimbursements for a life insurance policy. The amounts by employee and category are as follows:
| | Special Transaction Bonus | 401(k) Contributions | Life Insurance | Total | ||||||||
|---|---|---|---|---|---|---|---|---|---|---|---|---|
| William P. Brick | $ | 232,000 | $ | 1,998 | $ | 8,604 | $ | 242,602 | ||||
| Jimmy C. Weaver | 247,000 | 1,123 | 1,104 | 249,227 | ||||||||
| Steven J. Janusek | 109,000 | 1,800 | 346 | 111,146 | ||||||||
| Ben D. Key | 65,000 | 1,125 | 828 | 66,953 | ||||||||
| Raymond D. Booth | 100,000 | — | 828 | 100,828 | ||||||||
- (4)
- Represents bonuses to (i) reimburse the employee for income taxes payable on the grant of restricted stock that was received in August 2003 and (ii) reimburse the employee for the final income taxes due on the grant of restricted stock that was received in May 2002 and cancelled in February 2003. The amounts paid are allocated between the two grants as follows:
| | 2003 Grant | 2002 Grant | Total | ||||||
|---|---|---|---|---|---|---|---|---|---|
| William P. Brick | $ | 47,572 | $ | 12,690 | $ | 60,262 | |||
| Jimmy C. Weaver | 28,033 | 6,308 | 34,341 | ||||||
| Steven J. Janusek | 11,780 | 3,154 | 14,934 | ||||||
| Ben D. Key | 11,327 | 1,605 | 12,932 | ||||||
| Raymond D. Booth | — | — | — | ||||||
- (5)
- Pursuant to the terms of the merger, certain members of the senior management team, including the Named Executive Officers, received shares of restricted common and 12% cumulative redeemable Series A preferred stock in an aggregate value of $500,000. All such restricted common shares vest on August 15, 2006 if the employee is still employed by us on that date. All restricted preferred shares were repurchased on October 27, 2004, at a redemption price of $1,000 per share plus accrued and unpaid dividends.
- (6)
- Represents amounts (i) paid to the employee in connection with change of control agreements which were entered into on May 9, 2001, (ii) signing bonuses paid in connection with the signing of new employment agreements on August 14, 2003, (iii) transaction fees paid in connection with the Triangle acquisition, (iv) contributions made to Reddy Group's 401(k) plan by us and (v) the value of life insurance benefits paid by us; for Mr. Brick, such amount also includes $7,500 of reimbursements for a life insurance policy. The amounts by employee and category are as follows:
| | Change of Control Agreement | Signing Bonus | Triangle Transaction Fee | 401(k) Contributions | Life Insurance | Total | ||||||||||||
|---|---|---|---|---|---|---|---|---|---|---|---|---|---|---|---|---|---|---|
| William P. Brick | $ | 630,000 | $ | 22,500 | $ | 5,675 | $ | 1,662 | $ | 8,604 | $ | 668,441 | ||||||
| Jimmy C. Weaver | 371,250 | 28,125 | 5,417 | 1,125 | 1,104 | 407,021 | ||||||||||||
| Steven J. Janusek | 156,000 | 12,375 | 2,383 | 1,644 | 335 | 172,737 | ||||||||||||
| Ben D. Key | 150,000 | 7,313 | 1,408 | 260 | 581 | 159,562 | ||||||||||||
| Raymond D. Booth | — | 11,250 | 2,167 | — | — | 13,417 | ||||||||||||
72
Employment Agreements
On August 14, 2003, we entered into executive employment agreements (each, an "employment agreement") with each of William P. Brick, our Chief Executive Officer, Jimmy C. Weaver, our President and Chief Operating Officer, Steven J. Janusek, our Executive Vice President, Chief Financial Officer and Secretary, Ben D. Key, our Senior Vice President—Sales and Raymond D. Booth, our Senior Vice President-Mid-Atlantic Operations. The employment agreements with Messrs. Brick, Weaver, Janusek, Key and Booth each became effective as of August 14, 2003. The employment agreements for each of Messrs. Brick, Weaver, Janusek, Key and Booth are of indefinite duration.
Under the terms of each employment agreement, in addition to his annual salary, each executive officer is entitled to participate in incentive compensation plans on the same basis as other comparable level employees. Each executive officer is also entitled to participate in various benefit plans.
Each of these employment agreements provides for a minimum base salary. In addition, each agreement provides that the executive is entitled to receive an annual bonus upon achieving certain performance and operating targets. The employment agreements with Messrs. Brick, Weaver, Janusek, Key and Booth provide for minimum base salaries of $360,000, $275,000, $180,000, $150,000 and $140,000, respectively. On March 26, 2004, the Compensation Committee approved an increase in Mr. Brick's annual salary to $400,000 per year, effective as of that date. On March 24, 2005, the Compensation Committee approved revised compensatory arrangements with respect to certain of our executive officers and our Chief Executive Officer approved revised compensatory arrangements with respect to certain additional executive officers. Pursuant to the revised compensatory arrangements, certain of our officers received an increase in their base salaries effective March 25, 2005. Each executive officer's base salary was increased in accordance with the terms of such executive officer's employment agreement. On February 22, 2006, the Compensation Committee approved revised compensatory arrangements with respect to certain of our executive officers. Pursuant to the revised compensatory arrangements, certain of our officers received an increase in their base salaries effective April 7, 2006. Each executive officer's base salary was increased in accordance with the terms of such executive officer's employment agreement. The current annual base salaries for our Chief Executive Officer and named executive officers are $450,000 for Mr. Brick, $315,000 for Mr. Weaver, $230,000 for Mr. Janusek, $180,000 for Mr. Key and $160,000 for Mr. Booth.
Each of these employment agreements provides for severance payments under certain circumstances. If Messrs. Brick or Weaver are terminated "without cause" or terminate their employment for "good reason" or become disabled, then they will receive a severance amount equal to 150% of their annual base salary payable either in a lump sum or on an ordinary payroll basis over a period of 18 months at our discretion. In addition, Mr. Brick's employment agreement entitles him to receive healthcare benefits from the date of termination of his employment until age 65. If Messrs. Janusek or Key are terminated "without cause" or terminate their employment for "good reason" or become disabled, then they will receive a severance amount equal to 100% of their annual base salary payable either in a lump sum or on an ordinary payroll basis over a period of 12 months at our discretion. If Mr. Booth is terminated "without cause" or becomes disabled, then he will receive a severance amount equal to 100% of his annual base salary payable either in a lump sum or on an ordinary payroll basis over a period of 12 months at our discretion. If we elect to pay a severance amount over a period of time, then the executive will also be entitled to a continuation in benefits for such period. The employment agreements also restrict the executive's business activities that compete with our business. In the case of Messrs. Brick and Weaver, these restrictions apply for a period of two years following the termination of the executive's employment. In the case of Messrs. Janusek, Booth and Key, these restrictions apply for a period of 18 months following the termination of the executive's employment.
Option Grants in Last Fiscal Year
As of December 31, 2005, none of our employees held stock options to purchase shares of Reddy Ice's common stock. No stock options to purchase shares of Reddy Ice's common stock were granted in 2005.
73
The following table provides certain information regarding the exercise of stock options to purchase shares of Reddy Ice's common stock during the year ended December 31, 2005, by the Named Executive Officers, and the fiscal year-end value of stock options held by such officers:
| | | Number of Securities Underlying Unexercised Options/SARs at Fiscal Year End | | | ||||||
|---|---|---|---|---|---|---|---|---|---|---|
| | | Value of Unexercised In-The-Money Options/SARs at Fiscal Year End | ||||||||
| | Number of Shares Underlying Options/SARs Exercised(1) | |||||||||
| | Exercisable | Unexercisable | Exercisable | Unexercisable | ||||||
| William P. Brick | 305,752 | — | — | — | — | |||||
| Jimmy C. Weaver | 325,268 | — | — | — | — | |||||
| Steven J. Janusek | 143,118 | — | — | — | — | |||||
| Ben D. Key | 84,570 | — | — | — | — | |||||
| Raymond D. Booth | 130,107 | — | — | — | — | |||||
- (1)
- All of our employees who held outstanding stock options to purchase shares of Reddy Ice's common stock on August 12, 2005 exercised their unvested options for restricted shares prior to the consummation of our initial public offering, in accordance with the terms of the 2003 Stock Option Plan, as amended.
Stock Incentive Plans
Long-Term Incentive and Share Award Plan
On August 8, 2005, our board of directors and stockholders approved, and we adopted, a long-term incentive and share award plan (the "Long-Term Incentive and Share Award Plan"). The Long-Term Incentive and Share Award Plan will terminate on the earlier of ten years after August 12, 2005 or when the board of directors terminates the Long-Term Incentive and Share Award Plan. An aggregate of 750,000 shares is reserved for issuance under the Long-Term Incentive and Shares Award Plan, subject to customary antidilution adjustments. The Long-Term Incentive and Share Award Plan provides for the grant of incentive stock options, or ISOs, as defined in section 422 of the Internal Revenue Code, nonqualified stock options, restricted stock, restricted stock units, stock appreciation rights, or SARs, dividend equivalent rights, performance share awards, performance units and other share-based awards to certain of our employees, consultants and directors, as determined by the Compensation Committee. The Compensation Committee administers the Long-Term Incentive and Share Award Plan.
2003 Stock Option Plan
We established the Reddy Ice Holdings, Inc. 2003 Stock Option Plan, effective August 15, 2003, which provides for the grant of options to purchase shares of our common stock to our employees, directors and officers. The plan is administered by our Compensation Committee. Options granted under our 2003 Stock Option Plan included time-based options and performance-based options. Time-based options generally vested 20% per year with the initial vesting of 20% occurring on the first day of the calendar year following the year of grant. The performance-based options vested in three tranches based on obtaining certain performance and operating targets. One-half of the shares were subject to the first tranche, one-quarter of the shares were subject to the second tranche, and one-quarter of the shares were subject to the third tranche. Any unvested performance-based options automatically vested after eight years. All options granted pursuant to this plan expired ten (10) years after the date of grant.
Concurrently with the consummation of our initial public offering, we amended the 2003 Stock Option Plan to accelerate the schedule for vesting of time-based options, immediately vest all outstanding performance-based options, allow unvested options to be exercised for restricted stock with identical vesting schedules and provide for accelerated vesting of options upon the termination of an optionholder's employment under certain circumstances. We recognized approximately $0.5 million of non-cash compensation expense related to the acceleration of vesting schedules. We did not recognize any compensation expense associated with the other amendments noted above. We do not expect to issue additional options under the 2003 Stock Option Plan.
74
Indemnification of Directors and Officers
For a period of six years after the acquisition of Packaged Ice on August 15, 2003, we have agreed to cause Reddy Group to:
- •
- indemnify and hold harmless, and provide advancement of expenses to, persons who at the closing of the merger were serving, or at any time prior to the closing of the merger have served as, one of our or our subsidiaries' officers or directors, to the fullest extent permitted by law, and shall cause the surviving corporation to assume our obligations under any indemnification agreements; and
- •
- cause to be maintained in effect policies of directors' and officers' insurance, for the benefit of those persons who are covered by directors' and officers' liability insurance at the closing of the merger, providing coverage that is at least equal to the coverage provided under the current directors' and officers' liability insurance policies, to the extent that such liability insurance can be maintained at an annual cost to Reddy Holdings that is not greater than 200% of the premium for the directors' and officers' liability insurance for the year prior to the closing of the merger and related transactions.
At the closing of the merger, each of the executive officers, including the Named Executive Officers, and all directors entered into indemnity agreements with both Reddy Group and Reddy Holdings, pursuant to which both entities have agreed to indemnify and hold harmless each executive officer and director for acting in his capacity as our officer or director to the fullest extent permitted under applicable law, respectively. Indemnity will not extend to gross negligence, willful misconduct or bad faith. In addition, Reddy Holdings will maintain a directors' and officers' insurance policy.
Insofar as indemnification for liabilities arising under the Securities Act may be permitted to directors, officers or persons controlling us pursuant to the foregoing, we have been informed that, in the opinion of the SEC, such indemnification is against public policy as expressed in the Securities Act and is, therefore, unenforceable.
75
PRINCIPAL AND SELLING STOCKHOLDERS
The following table sets forth the percentage of Reddy Holdings' common equity that is beneficially owned as of April 10, 2006, in each case, by:
- •
- each of our directors;
- •
- each of our named executive officers;
- •
- all of our executive officers and directors as a group;
- •
- each person, or group of affiliated persons, known to us to beneficially own 5% or more of our outstanding common stock; and
- •
- each selling stockholder.
| | Common Stock Shares Beneficially Owned Prior to Offering* | | Common Stock Shares to be sold in the Offering | Common Stock Shares Beneficially Owned After Offering Without Over-allotment* | | Common Stock Shares Beneficially Owned After Offering With Over-allotment* | | ||||||||||
|---|---|---|---|---|---|---|---|---|---|---|---|---|---|---|---|---|---|
| | Percentage of Beneficial Ownership Prior to Offering** | Percentage of Beneficial Ownership After Offering Without Over-allotment** | Percentage of Beneficial Ownership After Offering With Over-allotment** | ||||||||||||||
| Beneficial Owner | Without Over-allotment* | With Over-allotment* | |||||||||||||||
| 5% Stockholders | |||||||||||||||||
| Trimaran Fund II, L.L.C.(1) | 1,547,155 | (2) | 7.2% | 783,042 | 864,913 | 764,113 | 3.5 | % | 682,242 | 3.2 | % | ||||||
| Trimaran Parallel Fund II, L.P.(1) | 635,955 | (2) | 2.9% | 321,868 | 355,521 | 314,087 | 1.5 | % | 280,434 | 1.3 | % | ||||||
| Trimaran Capital, L.L.C.(1) | 97,531 | (2) | *** | 49,362 | 54,523 | 48,169 | *** | 43,008 | *** | ||||||||
| CIBC Employee Private Equity Partners (Trimaran)(1) | 983,541 | (2) | 4.5% | 497,787 | 549,833 | 485,754 | 2.2 | % | 433,708 | 2.0 | % | ||||||
| CIBC Capital Corporation(1) | 1,294,961 | (2) | 6.0% | 543,070 | 599,852 | 861,508 | 4.0 | % | 792,981 | 3.7 | % | ||||||
| Jay R. Bloom(1) | 4,337,194 | 20.0% | 2,195,129 | 2,424,642 | 2,142,065 | 9.9 | % | 1,912,552 | 8.8 | % | |||||||
| Dean C. Kehler(1) | 4,337,194 | 20.0% | 2,195,129 | 2,424,642 | 2,142,065 | 9.9 | % | 1,912,552 | 8.8 | % | |||||||
| Bear Stearns Merchant Banking Partners II, L.P.(3) | 1,711,161 | (4) | 7.9% | 866,048 | 1,047,148 | 845,113 | 3.9 | % | 664,013 | 3.1 | % | ||||||
| Bear Stearns Merchant Banking Investors II, L.P.(3) | 337,075 | (4) | 1.6% | 170,599 | 206,273 | 166,476 | *** | 130,802 | *** | ||||||||
| Bear Stearns MB-PSERS II, L.P.(3) | 939,807 | (4) | 4.3% | 475,653 | 575,117 | 464,154 | 2.1 | % | 364,690 | 1.7 | % | ||||||
| The BSC Employee Fund III, L.P.(3) | 485,834 | (4) | 2.2% | 245,889 | 297,307 | 239,945 | 1.1 | % | 188,527 | *** | |||||||
| The BSC Employee Fund IV, L.P.(3) | 863,317 | (4) | 4.0% | 436,940 | 528,310 | 426,377 | 2.0 | % | 335,007 | 1.5 | % | ||||||
| John D. Howard(3) | 4,337,194 | 20.0% | 2,195,129 | 2,654,155 | 2,142,065 | 9.9 | % | 1,683,039 | 7.8 | % | |||||||
| The Bear Stearns Companies, Inc.(3) | 4,337,194 | 20.0% | 2,195,129 | 2,654,155 | 2,142,065 | 9.9 | % | 1,683,039 | 7.8 | % | |||||||
| Wachovia Corporation(5) | 1,528,960 | 7.1% | — | — | 1,528,960 | 7.1 | % | 1,528,960 | 7.1 | % | |||||||
| Noonday Asset Management, L.P.(6) | 1,290,100 | 6.0% | — | — | 1,290,100 | 6.0 | % | 1,290,100 | 6.0 | % | |||||||
| Named Executive Officers and Directors | |||||||||||||||||
| Andrew R. Heyer(1) | 4,337,194 | 20.0% | 2,195,129 | 2,424,642 | 2,142,065 | 9.9 | % | 1,912,552 | 8.8 | % | |||||||
| Theodore J. Host | — | *** | — | — | — | — | — | — | |||||||||
| David E. King | — | *** | — | — | — | — | — | — | |||||||||
| Douglas R. Korn | — | *** | — | — | — | — | — | — | |||||||||
| Michael S. McGrath | 3,000 | *** | — | — | 3,000 | *** | 3,000 | *** | |||||||||
| Tracy L. Noll | 22,286 | (7) | *** | — | — | 22,286 | *** | 22,286 | *** | ||||||||
| William P. Phoenix | — | *** | — | — | — | — | — | — | |||||||||
| Robert N. Verdecchio | — | *** | — | — | — | — | — | — | |||||||||
| William P. Brick | 252,379 | (8) | 1.2% | 52,379 | 52,379 | 200,000 | *** | 200,000 | *** | ||||||||
| Jimmy C. Weaver | 253,651 | (9) | 1.2% | 50,000 | 50,000 | 203,651 | *** | 203,651 | *** | ||||||||
| Steven J. Janusek | 114,066 | (10) | *** | 21,791 | 21,791 | 92,275 | *** | 92,275 | *** | ||||||||
| Ben D. Key | 57,795 | (11) | *** | 17,000 | 17,000 | 40,795 | *** | 40,795 | *** | ||||||||
| Raymond D. Booth | 82,923 | (12) | *** | 5,000 | 5,000 | 77,923 | *** | 77,923 | *** | ||||||||
| Total executive officers and directors as a group (13 persons) | 5,123,294 | (13) | 23.7% | 2,341,299 | 2,570,812 | 2,781,995 | 12.9 | % | 2,552,482 | 11.8 | % | ||||||
| Other selling stockholders (9 persons) | 351,484 | 1.6% | 53,830 | 53,830 | 297,654 | 1.4 | % | 297,654 | 1.4 | % | |||||||
- *
- All holdings in this beneficial ownership table have been rounded to the nearest whole share.
- **
- The percentage of beneficial ownership for all holders has been rounded to the nearest 1/10th of a percentage.
- ***
- Percentage of shares beneficially owned by such person does not exceed one percent.
76
- (1)
- Messrs. Heyer, Bloom and Kehler may be deemed to share beneficial ownership of shares owned of record by Trimaran Fund II, L.L.C., Trimaran Parallel Fund II, L.P., Trimaran Capital, L.L.C., CIBC Employee Private Equity Fund (Trimaran) Partners and CIBC Capital Corporation by virtue of their status as managing partners of Trimaran Investments II, L.L.C.
- Through
- Trimaran Investments II, L.L.C., Messrs. Heyer, Bloom and Kehler share investment and voting power with respect to shares owned by Trimaran Fund II, L.L.C., Trimaran Parallel Fund II, L.P., Trimaran Capital, L.L.C., CIBC Employee Private Equity Fund (Trimaran) Partners and CIBC Capital Corporation but disclaim, other than with respect to Trimaran Capital, L.L.C., beneficial ownership of such shares. The business address for each stockholder identified in this footnote is 622 Third Avenue, New York, New York 10017.
- (2)
- Trimaran Fund II, L.L.C., Trimaran Parallel Fund II, L.P., Trimaran Capital, L.L.C., CIBC Employee Private Equity Fund (Trimaran) Partners and CIBC Capital Corporation due to their common control by Trimaran Investments II, L.L.C., could be deemed to beneficially own each other's shares, but disclaim such beneficial ownership.
- Prior
- to this offering, CIBC Capital Corporation directly owns 1,073,012 shares, or 5.0% of our common stock, and, through its ownership of an interest in Trimaran Fund II, L.L.C., beneficially owns an additional 1.0% of our common stock. Following this offering, CIBC Capital Corporation will directly own 751,891 shares or, assuming exercise in full of the over-allotment option, 695,109 shares.
- (3)
- Mr. Howard, by virtue of his status as the sole member of JDH Management, LLC, and The Bear Stearns Companies Inc. may be deemed to share beneficial ownership of shares owned of record by Bear Stearns Merchant Banking Partners II, L.P., Bear Stearns Merchant Banking Investors II, L.P., Bear Stearns MB PSERS II, L.P., The BSC Employee Fund III, L.P. and The BSC Employee Fund IV, L.P. Mr. Howard and The Bear Stearns Companies Inc. share investment and voting power with respect to shares owned by Bear Stearns Merchant Banking Partners II, L.P., Bear Stearns Merchant Banking Investors II, L.P., Bear Stearns MB PSERS II, L.P., The BSC Employee Fund III, L.P. and The BSC Employee Fund IV, L.P., but disclaim beneficial ownership of such shares. The business address for each stockholder identified in this footnote is 383 Madison Avenue, New York, New York 10179 and the telephone number is (212) 272-2000.
- (4)
- Bear Stearns Merchant Banking Partners II, L.P., Bear Stearns Merchant Banking Investors II, L.P., Bear Stearns MB PSERS II, L.P., The BSC Employee Fund III, L.P. and The BSC Employee Fund IV, L.P., due to their common control, could be deemed to beneficially own each other's shares, but disclaim such beneficial ownership.
- (5)
- This information is based on Schedule 13G filed with the SEC on February 10, 2006 by Wachovia Corporation. According to the Schedule 13G, the address of Wachovia Corporation is One Wachovia Center, Charlotte, North Carolina 28288-0137.
- (6)
- This information is based on Schedule 13G/A filed with the SEC on January 18, 2006 by Noonday Asset Management, L.P. According to the Schedule 13G/A, Noonday Asset Management, L.P., Noonday G.P. (U.S.), L.L.C., Noonday Capital, L.L.C., David I. Cohen, Saurabh K. Mittal, Chun R. Ding, William F. Duhamel, Charles E. Ellwein, Richard B. Fried, Monica R. Landry, William F. Mellin, Stephen L. Millham, Jason E. Moment, Rajiv A. Patel, Derek C. Schrier, Thomas F. Steyer, Mark C. Wehrly have shared voting and dispositive power with respect to, and shared beneficial ownership of, 1,290,100 of the shares; Noonday Capital Partners, L.L.C. has shared voting and dispositive power with respect to, and shared beneficial ownership of, 23,800 of the shares; Farallon Capital Partners, L.P. has shared voting and dispositive power with respect to, and shared beneficial ownership of, 254,100 of the shares; Farallon Capital Institutional Partners, L.P. has shared voting and dispositive power with respect to, and shared beneficial ownership of, 317,700 of the shares; Farallon Capital Institutional Partners II, L.P. has shared voting and dispositive power with respect to, and shared beneficial ownership of, 17,000 of the shares; Farallon Capital Institutional Partners III, L.P. has shared voting and dispositive power with respect to, and shared beneficial ownership of, 19,700 of the shares; Tinicum Partners, L.P. has shared voting and dispositive power with respect to, and shared beneficial ownership of, 7,500 of the shares; Farallon Capital Offshore Investors II, L.P. has shared and dispositive voting power with respect to, and shared beneficial ownership of, 190,218 of the shares; Farallon Capital Management, L.L.C. has shared voting and dispositive power with respect to, and shared beneficial ownership of, 460,082 of the shares and Farallon Partners, L.L.C. has shared voting and dispositive power with respect to, and shared beneficial ownership of, 830,018 of the shares. According to the Schedule 13G/A, the address of each of Noonday Asset Management, L.P. According to the Schedule 13G/A, Noonday Asset Management, L.P., Noonday G.P. (U.S.), L.L.C., Noonday Capital, L.L.C., David I. Cohen and Saurabh K. Mittal is c/o Noonday Asset Management, L.P., 227 West Trade Street, Suite 2140, Charlotte, North Carolina 28202. According to the Schedule 13G/A, the address of each of the other reporting persons referenced in this footnote is c/o Farallon Capital Management, L.L.C., One Maritime Plaza, Suite 1325, San Francisco, California 94111.
- (7)
- Includes 2,266 restricted shares received by Mr. Noll upon cashless exercise of options to purchase common stock prior to the consummation of our initial public offering which remain unvested.
- (8)
- Includes 53,827 restricted shares received by Mr. Brick upon cashless exercise of options to purchase common stock prior to the consummation of our initial public offering which remain unvested.
- (9)
- Includes 57,263 restricted shares received by Mr. Weaver upon cashless exercise of options to purchase common stock prior to the consummation of our initial public offering which remain unvested.
- (10)
- Includes 25,196 restricted shares received by Mr. Janusek upon cashless exercise of options to purchase common stock prior to the consummation of our initial public offering which remain unvested.
- (11)
- Includes 14,888 restricted shares received by Mr. Key upon cashless exercise of options to purchase common stock prior to the consummation of our initial public offering which remain unvested.
- (12)
- Includes 22,905 restricted shares received by Mr. Booth upon cashless exercise of options to purchase common stock prior to the consummation of our initial public offering which remain unvested.
- (13)
- Includes 176,345 restricted shares in the aggregate, received by the executive officers and directors upon cashless exercise of options to purchase common stock prior to the consummation of our initial public offering which remain unvested.
77
CERTAIN RELATIONSHIPS AND RELATED TRANSACTIONS
Monitoring and Management Services Agreement
Reddy Group, Trimaran Fund Management, L.L.C., or Trimaran, and an entity affiliated with Bear Stearns Merchant Banking, or BSMB, were parties to a Monitoring and Management Services Agreement, pursuant to which Trimaran and an entity affiliated with BSMB provided monitoring and management services to Reddy Group with respect to financial and operating matters. Pursuant to the agreement, at the closing of the acquisition of Packaged Ice on August 15, 2003, Trimaran and an entity affiliated with BSMB received a transaction fee equal to $7.5 million in connection with services rendered in connection with the merger. Pursuant to the agreement, Trimaran and an entity affiliated with BSMB also received an annual fee for ongoing monitoring and management services equal to $0.6 million per annum (pro forma for the acquisition of Triangle and other businesses). The agreement also provided that Trimaran and BSMB would be reimbursed for their reasonable out-of-pocket expenses in connection with activities undertaken pursuant to the agreement and would be indemnified for liabilities incurred in connection with their role under the agreement, other than for liabilities resulting from their gross negligence or willful misconduct.
Trimaran, BSMB and certain of their respective affiliates also rendered additional services in connection with acquisitions, divestitures and financings. In connection with these services, under certain circumstances, Trimaran and BSMB earned a fee equal to 2% of the value of any such transactions over $10 million in value. In addition, the annual monitoring and management services fee was increased in connection with acquisitions by an amount equal to 1% of the trailing twelve month pro forma EBITDA of acquired businesses (calculated at the time any acquisition by Reddy Group was consummated). Upon consummation of our initial public offering, we terminated this agreement and made payments to each of Trimaran and an entity affiliated with BSMB of $2.0 million.
Certain Transactions Relating to our Initial Public Offering
In connection with our initial public offering, the Company paid certain members of management and other employees cash bonuses totaling approximately $1.2 million and issued 25,817 shares of common stock to certain employees.
Pursuant to the directed share program in connection with our initial public offering, McCarter C. Weaver, the father of Jimmy C. Weaver, our President and Chief Operating Officer and a Director, purchased 6,600 shares of our common stock at the initial public offering price of $18.50 per share, for a total purchase price of $122,100.
Shareholders Agreement
On August 14, 2003, the stockholders of Reddy Holdings entered into a shareholders agreement that governed certain relations among, and contained certain obligations of, such stockholders. In connection with our initial public offering, all of the provisions of the shareholders agreement terminated, other than the provisions relating to registration rights. See "Shares Eligible for Future Sale—Registration Rights" for more information regarding the registration rights held by certain of our stockholders.
Purchasing Initiative
We are one of several portfolio companies in which BSMB has an interest. In 2004, BSMB initiated a process to identify areas where cost savings may be achieved by its portfolio companies by coordinating the purchase activities of these companies to take advantage of volume purchase discounts that would otherwise not be available to us if we were acting independently. In connection with this undertaking, BSMB entered into consulting arrangements with individuals and consulting firms. The consulting fees are charged to BSMB's portfolio companies based on each company's pro rata share of the overall cost savings achieved. As of December 31, 2005, based on information received from BSMB, our share of the consulting fees will be approximately $0.2 million.
Other Transactions Related to this Offering
Tracy L. Noll, a Director, has indicated to us that he intends to purchase approximately 25,000 shares of our common stock in this offering at the public offering price set forth on the cover of this prospectus.
78
Credit Facilities
In connection with the closing of our initial public offering, Reddy Group entered into new credit facilities in an aggregate principal amount of $300 million. The lenders are a syndicate of banks, financial institutions and other entities, which currently includes Bear Stearns Corporate Lending, Inc., Lehman Commercial Paper Inc. and Wachovia Bank, National Association.
The following is a summary of the provisions that are included in our credit facilities. The specific terms of our credit facilities are contained in the copy of the amended and restated credit agreement, which we refer to as the credit agreement in this prospectus, that has been incorporated by reference as an exhibit to the registration statement of which this prospectus forms a part.
Our credit facilities, among other things, permit availability for the payment of dividends under the restricted payments covenant. See "Dividend Policy and Restrictions—Restrictions on Payment of Dividends—Credit Facilities".
The credit agreement provides for a seven-year term loan facility in the amount of $240 million and a five-year revolving credit facility in the amount of $60 million (collectively, the "credit facilities"). The term loan will not amortize.
In addition, our credit facilities allow us to incur up to an additional $80 million of incremental term loans, subject to certain conditions. No lenders have committed to provide the incremental term loans. In the event that we incur incremental term loans that mature on or before the one year anniversary of the final maturity of the existing term loans and that bear interest with margins higher than the margin then applicable to any term loans outstanding under the credit facilities, the margins applicable to the existing term loans will be increased to equal the margins applicable to the incremental term loans. In the event that we incur incremental term loans that mature after the one year anniversary of the final maturity of the existing term loans and that bear interest with margins more than 0.25% higher than the margins applicable to any term loans outstanding under the credit facilities, the margins applicable to the existing term loans will be increased to equal the margins applicable to the incremental term loans, less 0.25%.
Subject to certain exceptions, our credit facilities require mandatory prepayments and corresponding reductions thereunder with the proceeds from (1) asset sales, (2) the issuance of debt securities and certain preferred stock that is redeemable at the holder's option prior to six months after the maturity of our term loan facility, (3) insurance and condemnation awards and (4) during certain dividend suspension periods, 50% of Available Cash (as defined in the credit agreement) for the immediately preceding fiscal quarter. Voluntary prepayments of our credit facilities will be permitted at any time, subject to certain notice and minimum amount requirements and breakage costs.
Our credit facilities contain certain covenants, including restrictions on:
- •
- our business activities;
- •
- incurrence of indebtedness and liens;
- •
- the sale of assets;
- •
- mergers, acquisitions and other business combinations;
- •
- voluntary prepayment of certain debt (including the Reddy Holdings notes);
- •
- transactions with affiliates;
- •
- loans and investments;
- •
- sale and leaseback transactions; and
- •
- prohibitions on the payment of cash dividends or the repurchase or redemption of stock.
Our credit facilities also contain various financial covenants, including maintenance by Reddy Group of a total leverage ratio of not in excess of 4.0 to 1.0 and an interest coverage ratio of not less than 3.25 to 1.0.
79
Reddy Group's total leverage ratio is defined as its ratio of total debt outstanding on the last day of a fiscal quarter to Adjusted EBITDA for the last four fiscal quarters and is tested as of the end of each of our fiscal quarters. Total debt is defined as the sum of all indebtedness of Reddy Group and its subsidiaries for borrowed money or evidenced by bonds, debentures, notes or similar instruments plus all capitalized lease obligations plus all synthetic lease obligations (in each case exclusive of intercompany indebtedness) and, without duplication, any contingent liability in respect of the foregoing, in each case for the last four fiscal quarters, less proceeds from asset sales or casualty events held pending reinvestment or to repay borrowings under our credit facilities.
Our interest coverage ratio is defined as our ratio of Adjusted EBITDA to Reddy Group's cash interest expense, in each case for the last four fiscal quarters and is tested as of the end of each of our fiscal quarters. Interest expense is defined as the aggregate interest expense of Reddy Group and its subsidiaries for the applicable period determined in accordance with GAAP (including the portion of any cash payments made or accrued in respect of capital leases allocable to interest expense).
Adjusted EBITDA is used to determine compliance with the total leverage and interest coverage financial covenant ratios contained in our credit facilities. The calculation of Adjusted EBITDA in this prospectus is in accordance with the definitions contained in the credit facilities.
Adjusted EBITDA is defined to be the sum of (a) net income,plus (b) to the extent deducted in determining net income, the sum of (i) amounts attributable to depreciation and amortization, (ii) income tax expense, (iii) interest expense, (iv) any other non-cash charges (less non-cash income) for which no cash reserves (or receivables) have been or will be set aside (or created), including non-cash compensation expenses, (v) any loss from the extinguishment of indebtedness, (vi) any fees paid prior to the closing date of the credit agreement in respect of the monitoring agreement that was terminated in connection with the initial public offering, (vii) transaction adjustments (as defined in our credit facilities and including the fees and expenses incurred in connection with our initial public offering and the related transactions), (viii) all fees and expenses incurred in connection with permitted acquisitions to the extent accounted for as expenses, (ix) for the four fiscal quarters ending after September 30, 2004, an amount equal to the sum of (x) the special transaction payments paid to certain members of management and certain directors in connection with the issuance of the Reddy Holdings notes not to exceed $1.3 million plus (y) an amount not to exceed $4.0 million for other expenses incurred in connection with the issuance of the Reddy Holdings notes and the related amendment to our credit agreement which was in effect at the time of the Reddy Holdings notes offering.
In addition, Reddy Holdings guarantees our credit facilities. The Reddy Holdings guarantee of our credit facilities restricts Reddy Holdings' ability to incur indebtedness (other than the Reddy Holdings notes and certain other indebtedness).
Our credit facilities contain customary events of default, including payment defaults, breaches of representations and warranties, covenant defaults, cross-payment default and cross-acceleration to certain other indebtedness, certain events of bankruptcy and insolvency, certain events under the Employee Retirement Income Security Act of 1974, as amended, material judgments, actual or asserted failure of any guarantee or security document supporting our credit facilities to be in full force and effect and change of control. If a bankruptcy event of default occurs, all outstanding loans under our credit facilities will automatically become due and payable and all commitments under our credit facilities will automatically terminate. If an event of default (other than a bankruptcy event of default) occurs, the lenders under our credit facilities will be entitled to take various actions, including all actions permitted to be taken by a secured creditor, the acceleration of amounts due under our credit facilities and requiring that all such amounts be immediately paid in full.
All obligations under our credit facilities are jointly and severally guaranteed by Reddy Holdings and all of Reddy Group's current subsidiaries. The debt under our credit facilities is secured by a pledge of Reddy Group's capital stock and the capital stock of Reddy Group's subsidiaries and a perfected lien and security interest in substantially all of Reddy Group's and its direct and indirect domestic subsidiaries' owned real property having a fair market value in excess of $1.0 million and personal assets (tangible and intangible). Reddy Group's future domestic subsidiaries are required to guarantee our credit facilities and to secure such guarantee with substantially all of their
80
owned real property having a fair market value in excess of $1.0 million and personal assets (tangible and intangible).
Reddy Holdings' 101/2% Senior Discount Notes due 2012
On October 27, 2004, Reddy Holdings issued $151.0 million aggregate principal amount at maturity of 101/2% Senior Discount Notes due 2012. Each Reddy Holdings note has an initial accreted value of $663.33 per $1,000 principal amount at maturity. The accreted value of each Reddy Holdings note increases from the date of issuance until November 1, 2008 at a rate of 101/2% per annum such that the accreted value will equal the stated principal amount at maturity on November 1, 2008. Thereafter cash interest on the Reddy Holdings notes will accrue and be payable semi-annually at a rate of 101/2% per annum. The Reddy Holdings notes are unsecured obligations of Reddy Holdings and are:
- •
- not guaranteed by any of Reddy Holdings' subsidiaries;
- •
- senior in right of payment to all of Reddy Holdings' future subordinated indebtedness;
- •
- equal in right of payment with any of Reddy Holdings' future unsecured senior indebtedness;
- •
- subordinated to Reddy Holdings' existing and future secured debt (including debt under our credit facilities that is guaranteed by Reddy Holdings); and
- •
- structurally subordinated to all obligations and preferred equity of Reddy Holdings' subsidiaries.
The Reddy Holdings notes include customary covenants that restrict, among other things, the ability to incur additional debt or issue certain preferred stock, pay dividends or redeem, repurchase or retire our capital stock or subordinated indebtedness, make certain investments, incur liens, enter into arrangements that restrict dividends from our subsidiaries, merge or sell all or substantially all of our assets or enter into various transactions with affiliates. Prior to November 1, 2007, we may redeem up to 35% of the principal amount at maturity of the Reddy Holdings notes at a redemption price of 110.5% of the accreted value thereof, plus accrued and unpaid interest to the date of redemption, with funds raised in equity offerings that are specified in the Reddy Holdings indenture. From and after November 1, 2008, we may redeem any or all of the Reddy Holdings notes by paying a redemption premium which is initially 5.25% of the principal amount at maturity of the notes, and will decline annually to 0% from and after November 1, 2010. If a change of control occurs on or prior to November 1, 2007, we may, at our option, redeem all, but not less than all, of the Reddy Holdings notes at a redemption price equal to the sum of (i) the accreted value of the notes as of the redemption date, (ii) a premium equal to 125% of one year's coupon payment and (iii) any accrued and unpaid interest to the date of redemption. If we experience a change of control and do not elect to make the optional redemption described in the previous sentence, we will be required to make an offer to repurchase the Reddy Holdings notes at a price equal to 101% of their accreted value, plus accrued and unpaid interest, if any, to the date of purchase. We may also be required to make an offer to purchase the Reddy Holdings notes with proceeds of asset sales that are not reinvested in our business or used to repay other indebtedness. We registered the Reddy Holdings notes with the SEC pursuant to a registration statement that was declared effective on August 26, 2005.
During the three months ended September 30, 2005, we paid $0.4 million to purchase and retire the Reddy Holdings notes with an aggregate principal amount at maturity of $0.5 million. A loss of $0.046 million was recognized in connection with this transaction.
81
The following is a description of the material terms of our amended and restated certificate of incorporation and by-laws. We also refer you to our amended and restated certificate of incorporation and by-laws, copies of which have been filed as exhibits to the registration statement of which this prospectus forms a part.
Authorized Capitalization
Our authorized capital stock consists of (i) 75,000,000 shares of common stock, par value $0.01 per share, of which 21,637,020 shares are issued and outstanding, and (ii) 25,000,000 shares of preferred stock, par value $0.01 per share, of which no shares are issued and outstanding. We effected a 138 for one stock split of our common stock prior to the completion of our initial public offering.
Common Stock
Voting Rights. Holders of common stock are entitled to one vote per share held of record on all matters submitted for action by the stockholders. The holders of common stock do not have cumulative voting rights in the election of directors. Accordingly, the holders of more than 50% of the shares of common stock voting can, if they choose to do so, elect all the directors standing for election. In such event, the holders of the remaining shares of common stock will not be able to elect any directors.
Dividend Rights. All shares of our common stock are entitled to receive dividends ratably if, as and when dividends are declared from time to time by our board of directors out of funds legally available for that purpose, after payments of dividends required to be paid on outstanding preferred stock, as described below, if any.
Our board of directors has adopted a dividend policy which reflects an intention to distribute as regular quarterly dividends to our stockholders a substantial portion of the cash generated by our business in excess of operating expenses and working capital requirements, interest and principal payments on our indebtedness, capital expenditures, incremental costs associated with being a public company and taxes. The current dividend rate is $1.60 per share of common stock per annum. Our board of directors may, at its discretion, decrease the level of dividends provided for the common stock in this dividend policy or discontinue entirely the payment of dividends. See "Dividend Policy and Restrictions".
Liquidation Rights. Upon our liquidation, dissolution or winding up, whether voluntary or involuntary, any business combination or a sale or disposition of all or substantially all of our assets, all shares of common stock are entitled to receive ratably the assets available for distribution to the stockholders after payment of liabilities and accrued but unpaid dividends and liquidation preferences on any outstanding preferred stock.
Other Matters. Holders of common stock have no preemptive or conversion rights and our common stock is not subject to further calls or assessment by us. There are no redemption or sinking fund provisions applicable to our common stock. All outstanding shares of common stock, including the shares of common stock offered in this offering, are fully paid and non-assessable.
Preferred Stock
Our amended and restated certificate of incorporation authorizes our board of directors to establish one or more series of preferred stock. Unless required by law or by any stock exchange on which our common stock is listed, the authorized shares of preferred stock will be available for issuance without further action by you. Our board of directors is able to determine, with respect to any series of preferred stock, the terms and rights of that series including:
- •
- the designation of the series;
- •
- the number of shares of the series, which our board may, except where otherwise provided in the preferred stock designation, increase or decrease, but not below the amount of shares then outstanding;
- •
- whether dividends, if any, will be cumulative or non-cumulative and the dividend rate of the series;
82
- •
- the dates at which dividends, if any, will be payable;
- •
- the redemption rights and price or prices, if any, for shares of the series;
- •
- the terms and amounts of any sinking fund provided for the purchase or redemption of shares of the series;
- •
- the amounts payable on shares of the series in the event of any voluntary or involuntary liquidation, dissolution or winding-up of the affairs of our company;
- •
- whether the shares of the series will be convertible into shares of any other class or series, or any other security, of our company or any other corporation, and, if so, the specification of the other class or series or other security, the conversion price or prices or rate or rates, any rate adjustments, the date or dates as of which the shares will be convertible and all other terms and conditions upon which the conversion may be made;
- •
- restrictions on the issuance of shares of the same series or of any other class or series; and
- •
- the voting rights, if any, of the holders of the series.
No shares of our preferred stock are outstanding, and we have no immediate plans to issue any preferred stock. The issuance of any of our preferred stock could provide needed flexibility in connection with possible acquisitions and other corporate purposes, however, the issuance could also make it more difficult for a third party to acquire a majority of our outstanding voting stock or discourage an attempt to gain control of us. In addition, the board of directors, without stockholder approval, can issue shares of preferred stock with voting and conversion rights which could dilute the voting power and diminish other rights of the holders of common stock. We are subject to the listing requirements of the New York Stock Exchange, which require stockholder approval of certain issuances equal to or exceeding 20% of the then outstanding voting power of then outstanding number of shares of common stock. These additional shares may be used for a variety of corporate purposes, including future public offerings, to raise additional capital or to facilitate acquisitions.
Authorized but Unissued Capital Stock
The DGCL does not require stockholder approval for any issuance of authorized shares. These additional shares may be used for a variety of corporate purposes, including future public offerings, to raise additional capital or to facilitate acquisitions.
One of the effects of the existence of unissued and unreserved common stock or preferred stock may be to enable our board of directors to issue shares to persons friendly to current management, which issuance could render more difficult or discourage an attempt to obtain control of our company by means of a merger, tender offer, proxy contest or otherwise, and thereby protect the continuity of our management and possibly deprive the stockholders of opportunities to sell their shares of common stock at prices higher than prevailing market prices.
Registration Rights
Our existing equity investors will have registration rights for their shares of common stock for resale in some circumstances. See "Shares Eligible for Future Sale—Registration Rights" for more information regarding the registration rights held by certain of our existing stockholders.
Anti-Takeover Effects of Certain Provisions of our Amended and Restated Certificate of Incorporation, Amended and Restated By-laws and Applicable Laws
Our amended and restated certificate of incorporation and our amended and restated by-laws contain certain provisions that are intended to enhance the likelihood of continuity and stability in the composition of the board of directors and which may have the effect of delaying, deferring or preventing a future takeover or change in control of the company unless such takeover or change in control is approved by the board of directors. A stockholder might consider an attempt to takeover or effect a change in control to be in its best interest, including those attempts that might result in a premium over the market price for the shares held by stockholders.
83
These provisions include:
No Cumulative Voting
The DGCL provides that stockholders are not entitled to the right or cumulative votes in the election of directors unless our amended and restated certificate of incorporation provides otherwise. Our amended and restated certificate of incorporation does not expressly provide for cumulative voting.
Special Meetings of Stockholders
Our amended and restated by-laws provide that, except as otherwise required by law, special meetings of the stockholders can only be called by the chairman of the board or our president, or pursuant to a resolution adopted by a majority of the board of directors or by one or more stockholders holding shares of common stock representing at least 50% of the combined voting power of the outstanding common stock. Except as provided above, stockholders will not be permitted to call a special meeting or to require the board of directors to call a special meeting and action may not be taken by written consent in lieu of a meeting.
Requirements for advance notification of stockholder nominations and proposals
Our amended and restated by-laws establish advance notice procedures with respect to stockholder proposals and the nomination of candidates for election as directors, other than nominations made by or at the direction of our board of directors or a committee of the board of directors. In order for any matter to be considered "properly brought" before a meeting, a stockholder must comply with requirements regarding advance notice and provide certain information to us. These provisions could have the effect of delaying until the next stockholders meeting stockholder actions that are favored by the holders of a majority of our outstanding voting securities. These provisions could also discourage a third party from making a tender offer for our common stock, because even if it acquired a majority of our outstanding voting securities, it would be able to take action as a stockholder (such as electing new directors of approving a merger) only at a duly called stockholders meeting and not by written consent.
Undesignated Preferred Stock
The ability to authorize undesignated or "blank check" preferred stock makes it possible for our board of directors to issue preferred stock with voting or other rights or preferences that could impede the success of any attempt to acquire us. These and other provisions may have the effect of deferring hostile takeovers or delaying changes in control or management of our company.
Anti-takeover Effects of Delaware Law
Section 203 of the DGCL provides that, subject to exceptions specified therein, an "interested stockholder" of a Delaware corporation shall not engage in any "business combination," including general mergers or consolidations or acquisitions of additional shares of the corporation, with the corporation for a three-year period following the date of the transaction in which such stockholder becomes an interested stockholder unless:
- •
- prior to such time, the board of directors of the corporation approved either the business combination or the transaction which resulted in the stockholder becoming an interested stockholder;
- •
- upon consummation of the transaction which resulted in the stockholder becoming an "interested stockholder," the interested stockholder owned at least 85% of the voting stock of the corporation outstanding at the time the transaction commenced (excluding specified shares); or
- •
- on or subsequent to such time, the business combination is approved by the board of directors of the corporation and authorized at an annual or special meeting of stockholders, and not by written consent, by the affirmative vote of at least 662/3% percent of the outstanding voting stock not owned by the interested stockholder.
84
Under Section 203, the restrictions described above also do not apply to specified business combinations proposed by an interested stockholder following the announcement or notification of one of specified transactions involving the corporation and a person who had not been an interested stockholder during the previous three years or who became an interested stockholder with the approval of a majority of the corporation's directors, if such transaction is approved or not opposed by a majority of the directors who were directors prior to any person becoming an interested stockholder during the previous three years or were recommended for election or elected to succeed such directors by a majority of such directors.
Except as otherwise specified in Section 203, an "interested stockholder" is defined to include:
- •
- any person that is the owner of 15% or more of the outstanding voting stock of the corporation, or is an affiliate or associate of the corporation and was the owner of 15% or more of the outstanding voting stock of the corporation at any time within three years immediately prior to the date of determination; and
- •
- the affiliates and associates of any such person.
Under some circumstances, Section 203 makes it more difficult for a person who would be an interested stockholder to effect various business combinations with a Delaware corporation for a three-year period. We have not elected to be exempt from the restrictions imposed under Section 203.
Indemnification of Officers and Directors
Our amended and restated certificate of incorporation provides that, to the fullest extent permitted by the DGCL and except as otherwise provided in our by-laws, none of our directors shall be liable to us or our stockholders for monetary damages for a breach of fiduciary duty. The effect of this provision is to eliminate our rights, and our stockholders' rights, to recover monetary damages against a director for breach of a fiduciary duty of care (but not its fiduciary duty of loyalty) as a director, except to the extent otherwise required by the DGCL. This provision does not limit or eliminate our right, or the right of any stockholder, to seek non-monetary relief, such as an injunction or rescission in the event of a breach of a director's duty of care. In addition, our amended and restated certificate of incorporation provides that, if the DGCL is amended to authorize the further elimination or limitation of the liability of a director, then the liability of the directors shall be eliminated or limited to the fullest extent permitted by the DGCL, as so amended. These provisions will not alter the liability of directors under federal or state securities laws. In addition, our amended and restated certificate of incorporation provides for indemnification of any person who was or is made, or threatened to be made, a party to any action, suit or other proceeding, whether criminal, civil, administrative or investigative, because of his or her status as a director or officer of Reddy Holdings, or service as a director, officer, employee or agent of another corporation, partnership, joint venture, trust or other enterprise at our request to the fullest extent authorized under the DGCL against all expenses, liabilities and losses reasonably incurred by such person. Further, our amended and restated certificate of incorporation provides that we may purchase and maintain insurance on our own behalf and on behalf of any other person who is or was a director, officer or agent of Reddy Holdings or was serving at our request as a director, officer, employee or agent of another corporation, partnership, joint venture, trust or other enterprise. We believe that these indemnification provisions and insurance are useful to attract and retain qualified directors and executive officers.
The limitation of liability and indemnification provisions in our amended and restated certificate of incorporation may discourage stockholders from bringing a lawsuit against directors for breach of their fiduciary duty. These provisions may also have the effect of reducing the likelihood of derivative litigation against directors and officers, even though such an action, if successful, might otherwise benefit us and our stockholders. In addition, your investment may be adversely affected to the extent we pay the costs of settlement and damage awards against directors and officers pursuant to these indemnification provisions.
Transfer Agent and Registrar
American Stock Transfer & Trust Company is the transfer agent and registrar for our common stock.
Listing
Our common stock is listed on the New York Stock Exchange under the symbol "FRZ".
85
SHARES ELIGIBLE FOR FUTURE SALE
We cannot predict what effect, if any, market sales of shares or the availability of shares for sale will have on the market price of our common stock. Nevertheless, sales of substantial amounts of common stock in the public market, or the perception that such sales could occur, could materially and adversely affect the market price of our common stock and could impair our future ability to raise capital through the sale of our equity-related securities at a time and price that we deem appropriate.
Upon completion of this offering, we will have outstanding 21,637,020 shares of common stock. Of these shares, 16,355,645 shares, including the 4,590,258 shares sold in this offering assuming the underwriters' over-allotment option is not exercised, will be freely tradable without restriction or further registration under the Securities Act of 1933, except for any shares purchased by our "affiliates" as defined in Rule 144 under the Securities Act of 1933, which would be subject to the limitations and restrictions described below. The remaining 5,281,375 shares of common stock that will be held by our executive officers, directors and the selling stockholders will be "restricted securities" as defined in Rule 144. Restricted securities may be sold in the public market only if registered or if they qualify for an exemption from registration under Rule 144 promulgated under the Securities Act of 1933. Among these restricted securities are 5,256,089 shares of common stock owned by certain of our stockholders that are parties to a shareholders agreement with us. See "—Registration Rights" below for more information regarding stockholder registration rights.
If permitted under our current and future agreements governing our debt, such as our credit facilities and the Reddy Holdings indenture, we may issue shares of common stock from time to time as consideration for future acquisitions, investments or other purposes. In the event any such acquisition, investment or other transaction is significant, the number of shares of common stock that we may issue may in turn be significant. In addition, we may also grant registration rights covering those shares of common stock issued in connection with any such acquisitions, investments or other transactions.
Lock-Up Agreements
In connection with this offering, we, each of our executive officers, directors, the selling stockholders and stockholders affiliated with Bear, Stearns & Co. Inc. and Trimaran Fund Management, L.L.C. subject to certain exceptions (including the issuance by us of no more than 10% of the aggregate number of shares of common stock outstanding after the completion of this offering as consideration for acquisitions made by us), have agreed with the underwriters not to dispose of or hedge any of our shares of common stock for 90 days after the date of this prospectus. The 90-day "lock-up" period during which we and our executive officers, directors, each holder of more than 5% of our common stock and the selling stockholders are restricted from engaging in transactions in our common stock is subject to extension such that, in the event that either (i) during the last 17 days of the "lock-up" period, we issue an earnings or financial results release or material news or a material event relating to us occurs, or (ii) prior to the expiration of the "lock-up" period, we announce that we will release earnings or financial results during the 16-day period beginning on the last day of the "lock-up" period, then in either case the expiration of the "lock-up" period will be extended until the expiration of the 18-day period beginning on the issuance of the earnings or financial results release or the occurrence of the material news or material event, as applicable, unless Bear, Stearns & Co. Inc. and Lehman Brothers Inc. waive, in writing, such an extension. See "Underwriting—No Sales of Similar Securities" for a further discussion of the lock-up agreements.
Registration Rights
Certain of our stockholders, including our executive officers and the selling stockholders, entered into a shareholders agreement as of August 14, 2003 that governs certain relationships among, and contains certain rights and obligations of, such stockholders. See "Certain Relationships and Related Transactions—Shareholders Agreement".
86
These stockholders have the right to participate in registered offerings by us of our common stock, or "piggyback" registration rights. In addition, each of (i) the BSMB-affiliated stockholders and (ii) the Trimaran-affiliated stockholders have the right to make up to three demands on us to register the shares of common stock held by them. These demand and piggyback registration rights are subject to limitations as to the maximum number of shares that may be registered if the managing underwriter in such an offering advises that the number of shares of common stock offered should be limited due to market conditions or otherwise. To exercise their demand registration rights, those parties must request that we effect a registration under the Securities Act of 1933. Upon receipt of such request, we may, subject to certain terms and conditions, either (i) proceed with the demand registration, or (ii) proceed with a registered primary public offering in connection with which the stockholders may exercise their piggyback registration rights.
If requested by the underwriters in either a demand or piggyback registration, the participating stockholders must enter into a lock-up agreement with the underwriters which will restrict their sales of our common stock for 90 days following this offering. We are required to pay all expenses incurred in connection with demand and piggyback registrations, excluding, in the case of demand registrations, underwriting discounts and commissions.
Stock Options
No options to purchase our common stock are currently outstanding.
Following the consummation of our initial public offering, we registered on Form S-8 under the Securities Act all 750,000 shares of common stock reserved for future issuance under our Long-Term Incentive and Share Award Plan, including the shares underlying our outstanding restricted share units, and such shares may be sold as provided therein. As of March 31, 2006, 697,625 shares under the Long-Term Incentive and Share Award Plan were reserved for issuance in connection with the outstanding restricted share units.
Rule 144
In general, under Rule 144, as currently in effect, beginning 90 days after the date of this prospectus, any person, including an affiliate, who has beneficially owned shares of our common stock for a period of at least one year is entitled to sell, within any three-month period, a number of shares that does not exceed the greater of:
- •
- 1.0% of the then-outstanding shares of common stock or 216,370 shares; and
- •
- the average weekly trading volume in the common stock during the four calendar weeks preceding the date on which the notice of the sale is filed with the SEC.
Sales under Rule 144 are also subject to provisions relating to notice, manner of sale, volume limitations and the availability of current public information about us.
Following the lock-up period, and assuming no exercise of the underwriters' over-allotment option to purchase 688,539 shares, we estimate that approximately 5,281,375 shares of our common stock that are restricted securities or are held by our affiliates as of the date of this prospectus will be eligible for sale in the public market in compliance with Rule 144 under the Securities Act (other than 277,124 unvested restricted shares held by certain selling stockholders).
Rule 144(k)
Under Rule 144(k), a person who is not deemed to have been one of our affiliates at any time during the 90 days preceding a sale, and who has beneficially owned the shares for at least two years, including the holding period of any prior owner other than an "affiliate," is entitled to sell the shares without complying with the manner of sale, public information, volume limitation or notice provisions of Rule 144.
87
MATERIAL UNITED STATES FEDERAL INCOME AND ESTATE TAX CONSIDERATIONS
The following is a summary of the material U.S. federal income tax (and, in the case of non-U.S. holders, estate tax) considerations with respect to the ownership and disposition of our common stock by U.S. holders (as defined below) and non-U.S. holders (as defined below) as of the date hereof. This summary deals only with holders that hold our common stock as a capital asset.
For purposes of this summary, a "U.S. holder" means a beneficial owner of our common stock that is any of the following for U.S. federal income tax purposes: (i) an individual who is a citizen or resident of the United States, (ii) a corporation or other entity treated as a corporation for U.S. federal income tax purposes created or organized in or under the laws of the United States, any state thereof, or the District of Columbia, (iii) an estate the income of which is subject to U.S. federal income taxation regardless of its source, or (iv) a trust if (1) its administration is subject to the primary supervision of a court within the United States and one or more U.S. persons have the authority to control all of its substantial decisions or (2) it has a valid election in effect under applicable U.S. Treasury regulations to be treated as a U.S. person. Except as otherwise provided in the discussion of estate tax, "non-U.S. holder" is a beneficial owner that is a nonresident alien individual or a corporation, trust or estate that is not a U.S. holder for U.S. federal income tax purposes.
This summary is based upon provisions of the Internal Revenue Code of 1986, as amended, and regulations, rulings and judicial decisions as of the date hereof. Those authorities may be changed, perhaps retroactively, or be subject to differing interpretations, so as to result in U.S. federal tax considerations different from those summarized below. We cannot assure you that a change in law will not alter significantly the tax considerations that we describe in this summary.
This summary does not represent a detailed description of the U.S. federal tax consequences to you in light of your particular circumstances. In addition, it does not represent a description of the U.S. federal tax consequences to you if you are subject to special treatment under U.S. federal tax laws (including if you are a dealer in securities or a trader in securities that uses a mark-to-market method of accounting for securities holdings, financial institution, tax-exempt entity, partnership or other pass-through entity or investor in such entity, insurance company, person holding common stock as part of a hedging, integrated, conversion or constructive sale transaction or a straddle, person owning directly or constructively 10 percent or more of our voting stock, person subject to alternative minimum tax, U.S. holder whose functional currency is not the U.S. dollar, U.S. expatriate, "controlled foreign corporation" or "passive foreign investment company"), and it generally does not address any U.S. taxes other than the federal income tax or, with respect to non-U.S. holders, federal estate tax.
If an entity classified as a partnership for U.S. federal income tax purposes holds our common stock, the tax treatment of a partner will generally depend on the status of the partner and the activities of the partnership. If you are a partnership holding our common stock, or a partner in such a partnership, we encourage you to consult your tax advisors.
The following discussion of the material U.S. federal income and estate tax consequences of the ownership of our common stock is for general information only and is not tax advice. If you are considering the purchase of our common stock, we encourage you to consult your own tax advisors concerning the particular U.S. federal income, estate and gift tax consequences to you of the ownership and disposition of the common stock, as well as the consequences to you arising under other federal tax laws and under the laws of any other taxing jurisdiction, including any state, local or foreign tax consequences.
U.S. Holders
Dividends
The gross amount of dividends paid to U.S. holders of common stock will be treated as dividend income to such holders, to the extent paid out of current or accumulated earnings and profits, as determined under U.S. federal income tax principles. Such income will be includable in the gross income of a U.S. holder on the day actually or constructively received by the U.S. holder. Under current legislation, which is scheduled to "sunset" at
88
the end of 2008, dividend income will generally be taxed to non-corporate U.S. holders at rates applicable to long-term capital gains, provided that a minimum holding period and other limitations and requirements are satisfied. Dividends received after 2008 will be taxable at ordinary rates. Corporate U.S. holders may be entitled to a dividends received deduction with respect to distributions treated as dividend income for U.S. federal income tax purposes, subject to numerous limitations and requirements.
To the extent that the amount of any distribution exceeds our current and accumulated earnings and profits, the distribution will first be treated as a tax-free return of capital, causing a reduction in the adjusted basis of the shares of common stock to the extent thereof (thereby increasing the amount of gain, or decreasing the amount of loss, to be recognized by the holder on a subsequent disposition of our common stock), and the balance in excess of the adjusted basis will be taxed as capital gain (short-term or long-term, as applicable) recognized on a sale or exchange.
Gain on Disposition of Common Stock
A U.S. holder generally will recognize taxable gain or loss on any sale or exchange of shares of our common stock in an amount equal to the difference between the amount realized and the U.S. holder's basis in such shares of common stock. Such gain or loss will be capital gain or loss. Capital gains of non-corporate holders derived with respect to capital assets held for more than one year are eligible for reduced rates of taxation. The deductibility of capital losses is subject to limitations.
Information Reporting and Backup Withholding
In general, information reporting requirements will apply to dividends paid on our common stock and to the proceeds received on the sale, exchange or other disposition (including a redemption) of common stock by a U.S. holder other than certain exempt recipients (such as corporations). A backup withholding tax will apply to such payments if the U.S. holder fails to provide an accurate taxpayer identification number and to comply with certain certification procedures or otherwise establish an exemption from backup withholding. The amount of any backup withholding from a payment to a U.S. holder will be allowed as a refund or credit against the U.S. holder's U.S. federal income tax liability provided that the required information is timely furnished to the Internal Revenue Service, or IRS.
Non-U.S. Holders
Dividends
Dividends paid to a non-U.S. holder of our common stock, to the extent paid out of current or accumulated earnings and profits, as determined under U.S. federal income tax principles, generally will be subject to withholding of U.S. federal income tax at a 30% rate or such lower rate as may be specified by an applicable income tax treaty. However, dividends that are effectively connected with the conduct of a trade or business by a non-U.S. holder within the United States and, where an income tax treaty applies, are attributable to a U.S. permanent establishment of the non-U.S. holder are not subject to this withholding tax, but instead are subject to U.S. federal income tax on a net income basis at applicable regular graduated tax rates. Certain certification and disclosure requirements (including the provision of a properly executed Form W-8ECI (or successor form)) must be complied with in order for effectively connected dividends to be exempt from this withholding tax. Any such effectively connected dividends received by a foreign corporation may be subject to an additional "branch profits tax" at a 30% rate or such lower rate as may be specified by an applicable income tax treaty.
A non-U.S. holder of our common stock who is entitled to and wishes to claim the benefits of an applicable treaty rate (and avoid backup withholding as discussed below) for dividends, will be required to (i) complete IRS Form W-8BEN (or successor form) and make certain certifications, under penalty of perjury, to establish its status as a non-U.S. person and its entitlement to treaty benefits or (ii) if the common stock is held through certain foreign intermediaries, satisfy the relevant certification requirements of applicable U.S. Treasury regulations. Special certification and other requirements apply to certain non-U.S. holders that are entities rather than individuals.
89
A non-U.S. holder of our common stock eligible for a reduced rate of U.S. federal withholding tax pursuant to an income tax treaty may obtain a refund of any excess amounts withheld by timely filing an appropriate claim for refund with the IRS.
Gain on Disposition of Common Stock
A non-U.S. holder generally will not be subject to U.S. federal income tax with respect to gain recognized on a sale or other disposition of our common stock unless: (i) the gain is effectively connected with a trade or business of the non-U.S. holder in the U.S. and, where a tax treaty applies, is attributable to a U.S. permanent establishment of the non-U.S. holder (in which case, the non-U.S. holder will generally be taxed on its net gain derived from the disposition at the regular graduated U.S. federal income tax rates and, if the non-U.S. holder is a foreign corporation, the "branch profits tax" described above may also apply); (ii) in the case of a non-U.S. holder who is an individual, such holder is present in the U.S. for 183 or more days in the taxable year of the sale or other disposition and certain other conditions are met (in which case, the non-U.S. holder will be subject to U.S. federal income tax at a rate of 30% (or a reduced rate under an applicable treaty) on the amount by which capital gains allocable to U.S. sources exceed capital losses allocable to U.S. sources); or (iii) we are or have been a "U.S. real property holding corporation" for U.S. federal income tax purposes.
We believe we currently are not, and do not anticipate becoming, a "U.S. real property holding corporation" for U.S. federal income tax purposes. If our current view is incorrect, or if we become a U.S. real property holding corporation in the future, and our common stock is regularly traded on an established securities market, a non-U.S. holder who actually or constructively (applying certain ownership attribution rules) holds or held (at any time during the shorter of the five year period preceding the date of disposition or the holder's holding period) more than five percent of the common stock would be subject to U.S. federal income tax at regular graduated rates on a disposition of the common stock but other non-U.S. holders generally would not be. If the common stock is not so traded, all non-U.S. holders would be subject to U.S. federal income tax on disposition of the common stock.
Information Reporting and Backup Withholding
We must report annually to the IRS and to each non-U.S. holder the amount of dividends paid to such holder and the tax withheld (if any) with respect to such dividends, regardless of whether withholding was required. Copies of the information returns reporting such dividends and any withholding may also be made available to the tax authorities in the country in which the non-U.S. holder resides under the provisions of an applicable income tax treaty. In addition, dividends paid to a non-U.S. holder generally will be subject to backup withholding unless applicable certification requirements are met.
Payment of the proceeds of a sale (including a redemption) of our common stock within the United States or conducted through certain U.S. related financial intermediaries is subject to information reporting and, depending upon the circumstances, backup withholding unless the beneficial owner certifies under penalties of perjury that it is not a United States person or the holder otherwise establishes an exemption.
Any amounts withheld under the backup withholding rules may be allowed as a refund or a credit against such holder's U.S. federal income tax liability provided the required information is timely furnished to the IRS.
Federal Estate Tax
Common stock owned or treated as owned by an individual who is not a citizen or resident of the United States, as specifically defined for U.S. federal estate tax purposes, at the time of death will be included in such holder's gross estate for U.S. federal estate tax purposes, unless an applicable estate tax treaty provides otherwise, and, therefore, may be subject to U.S. federal estate tax.
90
The selling stockholders, which include certain affiliates of Bear, Stearns & Co., Inc. and certain of our executive officers, intend to offer the shares through the underwriters. Subject to the terms and conditions in an underwriting agreement among us, the selling stockholders and Bear, Stearns & Co. Inc., Lehman Brothers Inc., Goldman, Sachs & Co., Wachovia Capital Markets, LLC, Piper Jaffray & Co. and Morgan Keegan & Company, Inc., the selling stockholders have agreed to sell to the underwriters, and the underwriters severally have agreed to purchase from the selling stockholders, the number of shares of common stock listed opposite their names below.
| Underwriter | Number of Shares | |
|---|---|---|
| Bear, Stearns & Co. Inc. | 1,377,078 | |
| Lehman Brothers Inc. | 1,377,078 | |
| Goldman, Sachs & Co. | 573,782 | |
| Wachovia Capital Markets, LLC | 573,782 | |
| Piper Jaffray & Co. | 459,025 | |
| Morgan Keegan & Company, Inc. | 229,513 | |
| Total | 4,590,258 | |
The underwriters have agreed to purchase all of the shares sold under the underwriting agreement if any of these shares are purchased (other than shares of our common stock subject to the underwriters' option to purchase additional shares as described below). If an underwriter defaults, the underwriting agreement provides that the purchase commitments of the nondefaulting underwriters may be increased or the underwriting agreement may be terminated.
We and the selling stockholders have agreed to indemnify the underwriters against certain liabilities, including liabilities under the Securities Act of 1933 or to contribute to payments the underwriters may be required to make in respect of those liabilities.
The underwriters are offering the shares, subject to prior sale, when, as and if issued to and accepted by them, subject to approval of legal matters by their counsel, including the validity of the shares, and other conditions contained in the underwriting agreement, such as the receipt by the underwriters of officer's certificates and legal opinions. The underwriters reserve the right to withdraw, cancel or modify offers to the public and to reject orders in whole or in part.
Affiliates of Bear, Stearns & Co. Inc. that are selling stockholders in this offering purchased their securities in the ordinary course of their business. At the time of purchase of their securities, those entities had no agreements or understandings, directly or indirectly, with any person to distribute those securities.
Commissions and Discounts
The underwriters have advised us that they propose initially to offer the shares to the public at the public offering price on the cover page of this prospectus and to dealers at that price less a concession not in excess of $0.645 per share. After this offering, the offering price, concession and discount may be changed.
The following table shows the public offering price, underwriting discount and proceeds before expenses to the selling stockholders. The information assumes either no exercise or full exercise by the underwriters of their option to purchase up to 688,539 additional shares to cover over-allotments.
| | Per Share | Without Option | With Option | ||||||
|---|---|---|---|---|---|---|---|---|---|
| Public offering price | $ | 21.55 | $ | 98,920,059.90 | $ | 113,758,075.35 | |||
| Underwriting discount | $ | 1.0775 | $ | 4,946,003.00 | $ | 5,687,903.77 | |||
| Proceeds to the selling stockholders | $ | 20.4725 | $ | 93,974,056.90 | $ | 108,070,171.58 | |||
91
The expenses of this offering, excluding the underwriting discount and commissions and related fees, are estimated at approximately $0.6 million and are payable by us. The underwriters have agreed to reimburse us for certain of our expenses associated with this offering.
Over-Allotment Option
Certain of the selling stockholders have granted the underwriters an option exercisable for 30 days from the date of this prospectus to purchase a total of up to 688,539 additional shares at the public offering price less the underwriting discount. The underwriters may exercise this option solely to cover any over-allotments, if any, made in connection with this offering. To the extent the underwriters exercise this option in whole or in part, each will be obligated, subject to conditions contained in the underwriting agreement, to purchase a number of additional shares approximately proportionate to that underwriter's initial commitment amount reflected in the above table.
United Kingdom
This document is only being distributed to and is only directed at (i) persons who are outside the United Kingdom or (ii) to investment professionals falling within Article 19(5) of the Financial Services and Markets Act 2000 (Financial Promotion) Order 2005 (the "Order") or (iii) high net worth entities, and other persons to whom it may lawfully be communicated, falling within Article 49(2)(a) to (e) of the Order (all such persons together being referred to as "relevant persons"). The shares of common stock are only available to, and any invitation, offer or agreement to subscribe, purchase or otherwise acquire such common stock will be engaged in only with, relevant persons. Any person who is not a relevant person should not act or rely on this document or any of its contents.
Each of the underwriters has represented and agreed that:
- (a)
- it has only communicated or caused to be communicated and will only communicate or cause to be communicated an invitation or inducement to engage in investment activity (within the meaning of Section 21 of the Financial Services and Markets Act 2000 or FSMA) received by it in connection with the issue or sale of the shares in circumstances in which Section 21(1) of the FSMA does not apply to us, and
- (b)
- it has complied with, and will comply with all applicable provisions of FSMA with respect to anything done by it in relation to the shares in, from or otherwise involving the United Kingdom.
European Economic Area
To the extent that the offer of the common stock is made in any Member State of the European Economic Area that has implemented the Prospectus Directive before the date of publication of a prospectus in relation to the common stock which has been approved by the competent authority in the Member State in accordance with the Prospectus Directive (or, where appropriate, published in accordance with the Prospectus Directive and notified to the competent authority in the Member State in accordance with the Prospectus Directive), the offer (including any offer pursuant to this document) is only addressed to qualified investors in that Member State within the meaning of the Prospectus Directive or has been or will be made otherwise in circumstances that do not require us to publish a prospectus pursuant to the Prospectus Directive.
In relation to each Member State of the European Economic Area which has implemented the Prospectus Directive (each, a "Relevant Member State"), each underwriter has represented and agreed that with effect from and including the date on which the Prospectus Directive is implemented in that Relevant Member State (the "Relevant Implementation Date") it has not made and will not make an offer of shares to the public in that Relevant Member State prior to the publication of a prospectus in relation to the shares which has been approved by the competent authority in that Relevant Member State or, where appropriate, approved in another Relevant Member State and notified to the competent authority in that Relevant Member State, all in accordance with the Prospectus Directive,
92
except that it may, with effect from and including the Relevant Implementation Date, make an offer of shares to the public in that Relevant Member State at any time:
- (a)
- to legal entities which are authorized or regulated to operate in the financial markets or, if not so authorized or regulated, whose corporate purpose is solely to invest in securities,
- (b)
- to any legal entity which has two or more of (1) an average of at least 250 employees during the last financial year; (2) a total balance sheet of more than €43,000,000 and (3) an annual net turnover of more than €50,000,000, as shown in its last annual or consolidated accounts, or
- (c)
- in any other circumstances which do not require the publication by us of a prospectus pursuant to Article 3 of the Prospectus Directive.
For the purposes of this provision, the expression an "offer of shares to the public" in relation to any shares in any Relevant Member State means the communication in any form and by any means of sufficient information on the terms of the offer and the shares to be offered so as to enable an investor to decide to purchase or subscribe the shares, as the same may be varied in that Relevant Member State by any measure implementing the Prospectus Directive in that Relevant Member State and the expression "Prospectus Directive" means Directive 2003/71/EC and includes any relevant implementing measure in each Relevant Member State.
The EEA selling restriction is in addition to any other selling restrictions set out below. In relation to each Relevant Member State, each purchaser of shares of common stock (other than the underwriters) will be deemed to have represented, acknowledged and agreed that it will not make an offer of shares of common stock to the public in any Relevant Member State, except that it may, with effect from and including the date on which the Prospectus Directive is implemented in the Relevant Member State, make an offer of shares of common stock to the public in that Relevant Member State at any time in any circumstances which do not require the publication by us of a prospectus pursuant to Article 3 of the Prospectus Directive, provided that such purchaser agrees that it has not and will not make an offer of any shares of common stock in reliance or purported reliance on Article 3(2)(b) of the Prospectus Directive. For the purposes of this provision, the expression an "offer of Shares to the public" in relation to any shares of common stock in any Relevant Member State has the same meaning as in the preceding paragraph.
No Sales of Similar Securities
We, each of our executive officers and directors and the selling stockholders, subject to certain exceptions (including the issuance by us of no more than 10% of the aggregate number of shares of common stock outstanding after the completion of this offering as consideration for acquisitions made by us), have agreed with the underwriters not to dispose of or hedge any of our shares of common stock for 90 days after the date of this prospectus without first obtaining the written consent of Bear, Stearns & Co. Inc. and Lehman Brothers Inc. The 90-day "lock-up" period during which we and our executive officers and directors and the selling stockholders, are restricted from engaging in transactions in our common stock is subject to extension such that, in the event that either (i) during the last 17 days of the "lock-up" period, we issue an earnings or financial results release or material news or a material event relating to us occurs, or (ii) prior to the expiration of the "lock-up" period, we announce that we will release earnings or financial results during the 16-day period beginning on the last day of the "lock-up" period, then in either case the expiration of the "lock-up" period will be extended until the expiration of the 18-day period beginning on the issuance of the earnings or financial results release or the occurrence of the material news or material event, as applicable, unless Bear, Stearns & Co. Inc. and Lehman Brothers Inc. waive, in writing, such an extension. See "Shares Eligible for Future Sale—Lock-Up Agreements".
Quotation on the New York Stock Exchange
Our common stock is listed on the New York Stock Exchange under the symbol "FRZ".
93
Price Stabilization, Short Positions
Until the distribution of the shares is completed, SEC rules may limit the underwriters from bidding for and purchasing our common stock. However, the underwriters may engage in transactions that stabilize, maintain or otherwise affect the price of our common stock during and after this offering.
If the underwriters over-allot or otherwise create a short position in our common stock in connection with this offering, i.e., if they sell more shares than are listed on the cover of this prospectus, the underwriters may reduce that short position by purchasing shares in the open market. The underwriters may also elect to reduce any short position by exercising all or part of the option to purchase up to 688,539 additional shares to cover over-allotments described above. The underwriters may also sell shares in excess of the option to purchase up to 688,539 additional shares to cover over-allotments, creating a naked short position. A naked short position can only be closed out by buying shares in the open market. A naked short position is more likely to be created if the underwriters are concerned that there could be downward pressure on the price of the shares in the open market after pricing that could adversely affect investors who purchase in this offering. In addition, the underwriters may impose penalty bids, under which selling concessions allowed to syndicate members or other broker-dealers participating in this offering are reclaimed if shares of our common stock previously distributed in this offering are repurchased in connection with stabilization transactions or otherwise. These transactions to stabilize or maintain the market price may cause the price of our common stock to be higher than it might be in the absence of such transactions. The imposition of a penalty bid may also affect the price of our common stock to the extent that it discourages resales.
Neither we nor any of the underwriters makes any representation or prediction as to the direction or magnitude of any effect that the transactions described above may have on the price of our common stock. In addition, neither we nor any of the underwriters makes any representation that we or they will engage in these transactions or that these transactions, once commenced, will not be discontinued without notice.
Other Relationships
Some of the underwriters and their affiliates have engaged in, and may in the future engage in, investment banking and other commercial dealings in the ordinary course of business with us. They have received customary fees and commissions for these transactions.
Prior to this offering, entities affiliated with BSMB, an affiliate of Bear, Stearns & Co. Inc., owned approximately 20% of our outstanding common stock, and entities affiliated with Trimaran owned approximately 20% of our common stock. Following this offering and assuming full exercise of the option to purchase up to 688,539 additional shares to cover over-allotments by the underwriters, entities affiliated with BSMB will own none of our then outstanding common stock and the entities affiliated with Trimaran will own approximately 9.1% of our then outstanding common stock.
Wachovia Corporation, an affiliate of Wachovia Capital Markets, LLC, an underwriter in this offering, owns 7.1% of our common stock. Wachovia Corporation is not a selling stockholder in this offering.
On August 12, 2005, we repaid in full our then existing credit facilities and entered into our current credit facilities with affiliates of certain of the underwriters in this offering. See "Description of Indebtedness."
Bear, Stearns & Co. Inc. is a member of the National Association of Securities Dealers, Inc., or "NASD". Under Rule 2720 of the NASD Conduct Rules, we are considered an affiliate of Bear, Stearns & Co. Inc. since the parent company of this entity beneficially owns through its affiliate, BSMB, approximately 20% of our common stock outstanding as of the date of this prospectus. In addition, an affiliate of Bear, Stearns & Co. Inc. is a selling stockholder and will receive more than 10% of the net proceeds from the sale of common stock in this offering. This offering is being made in compliance with the requirements of Rule 2720(c) of the NASD Conduct Rules. Because there is a bona fide independent market, as defined in Rule 2720, for our common stock, we will not be required to use a qualified independent underwriter for this offering.
Discretionary Shares
The underwriters will not allocate shares to discretionary accounts without the prior specific written approval of the customers. The underwriters will not allocate shares to discretionary accounts in excess of 5% of the total number of shares in this offering.
94
The validity of the shares of common stock being offered will be passed upon for us by Cahill Gordon & ReindelLLP, New York, New York. The underwriters have been represented by Cravath, Swaine & Moore LLP, New York, New York. An investment partnership comprised of select partners of Cahill Gordon & Reindel LLPowns interests representing less than one-tenth of 1% of the capital commitments of funds controlled by Trimaran Fund Management, L.L.C.
The consolidated financial statements of (i) Reddy Ice Holdings, Inc. and subsidiary (the "Successor") as of December 31, 2005 and 2004 and for the years ended December 31, 2005 and 2004 and the period from May 8, 2003 (date of inception) to December 31, 2003, and (ii) Packaged Ice, Inc. and subsidiaries (the "Predecessor"), a wholly owned subsidiary of the Successor, for the period from January 1, 2003 to August 14, 2003, included in this prospectus have been audited by Deloitte & Touche LLP, an independent registered public accounting firm, as stated in their report appearing herein (which report expresses an unqualified opinion on the financial statements and includes an explanatory paragraph related to the acquisition of the Predecessor and the related accounting in accordance with SFAS No. 141, "Business Combinations"), and have been so included in reliance upon the report of such firm given upon their authority as experts in accounting and auditing.
WHERE YOU CAN FIND MORE INFORMATION
We have filed a registration statement on Form S-1 with the SEC regarding this offering of our common stock. This prospectus, which is part of the registration statement, does not contain all of the information included in the registration statement, and you should refer to the registration statement. Statements contained in this prospectus as to the contents of any contract or other document are summaries of the material terms of these contracts and documents but may not describe all of their terms, and where such contract or other document is an exhibit to the registration statement we encourage you to refer to such additional information.
We are subject to the informational requirements of the Securities Exchange Act of 1934, and, in accordance therewith, file annual, quarterly and current reports with the SEC. The reports and other information can be inspected and copied at the public reference facility that the SEC maintains at 450 Fifth Street, N.W., Washington, D.C. 20549. Please call the SEC at (800) 732-0330 for further information on the operation of the public reference room. The SEC also maintains a website athttp://www.sec.gov, which contains reports and other information regarding registrants that file electronically with the SEC.
OUR REPORTS AND OTHER INFORMATION THAT WE HAVE FILED, OR MAY, IN THE FUTURE FILE, WITH THE SEC ARE NOT INCORPORATED INTO AND DO NOT CONSTITUTE PART OF THIS PROSPECTUS. You may also request a copy of our filings at no cost, by writing or telephoning our Secretary at Reddy Ice Holdings, Inc., 8750 North Central Expressway, Suite 1800, Dallas, Texas 75231; Telephone (214) 526-6740.
95
| | Page | |
|---|---|---|
| Reddy Ice Holdings, Inc. and Subsidiary Financial Statements | ||
Report of Independent Registered Public Accounting Firm | F-2 | |
Consolidated Balance Sheets as of December 31, 2005 and 2004 (Successor) | F-3 | |
Consolidated Statements of Operations for the Years ended December 31, 2005 and 2004 (Successor), for the period from May 8, 2003 (Date of Inception) to December 31, 2003 (Successor) and for the period from January 1, 2003 to August 14, 2003 (Predecessor) | F-4 | |
Condensed Consolidated Statements of Stockholders' Equity for the Years ended December 31, 2005 and 2004 (Successor), for the period from May 8, 2003 (Date of Inception) to December 31, 2003 (Successor) and for the period from January 1, 2003 to August 14, 2003 (Predecessor) | F-5 | |
Consolidated Statements of Cash Flows for the Years ended December 31, 2005 and 2004 (Successor), for the period from May 8, 2003 (Date of Inception) to December 31, 2003 (Successor) and for the period from January 1, 2003 to August 14, 2003 (Predecessor) | F-7 | |
Notes to Financial Statements for the Years ended December 31, 2005 and 2004 (Successor), for the period from May 8, 2003 (Date of Inception) to December 31, 2003 (Successor) and for the period from January 1, 2003 to August 14, 2003 (Predecessor) | F-8 | |
Condensed Consolidated Balance Sheet (unaudited) as of March 31, 2006 | F-35 | |
Condensed Consolidated Statements of Operations (unaudited) for the three months ended March 31, 2006 and 2005 | F-36 | |
Condensed Consolidated Statement of Stockholders' Equity (unaudited) for the three months ended March 31, 2006 | F-37 | |
Condensed Consolidated Statements of Cash Flows (unaudited) for the three months ended March 31, 2006 and 2005 | F-38 | |
Notes to the Condensed Consolidated Financial Statements (unaudited) for the three months ended March 31, 2006 and 2005 | F-39 |
F-1
REPORT OF INDEPENDENT REGISTERED PUBLIC ACCOUNTING FIRM
To the Board of Directors and Stockholders of
Reddy Ice Holdings, Inc.
Dallas, Texas
We have audited the accompanying consolidated balance sheets of Reddy Ice Holdings, Inc. and subsidiary (the "Successor") as of December 31, 2005 and 2004, and the related consolidated statements of operations, stockholders' equity and cash flows for the years ended December 31, 2005 and 2004 and the period from May 8, 2003 (date of inception) to December 31, 2003. We have also audited the consolidated statements of operations, stockholders' equity and cash flows of Packaged Ice, Inc. and subsidiaries (the "Predecessor"), a wholly owned subsidiary of the Successor, for the period from January 1, 2003 to August 14, 2003. These financial statements are the responsibility of the Successor's and Predecessor's (collectively, the "Company") management. Our responsibility is to express an opinion on these financial statements based on our audits.
We conducted our audits in accordance with the standards of the Public Company Accounting Oversight Board (United States). Those standards require that we plan and perform the audit to obtain reasonable assurance about whether the financial statements are free of material misstatement. The Company has determined that it is not required to have, nor were we engaged to perform, an audit of its internal control over financial reporting. Our audit included consideration of internal control over financial reporting as a basis for designing audit procedures that are appropriate in the circumstances but not for the purpose of expressing an opinion on the effectiveness of the Company's internal control over financial reporting. Accordingly, we express no such opinion. An audit also includes examining, on a test basis, evidence supporting the amounts and disclosures in the financial statements, assessing the accounting principles used and significant estimates made by management, as well as evaluating the overall financial statement presentation. We believe that our audits provide a reasonable basis for our opinion.
In our opinion, such consolidated financial statements present fairly, in all material respects, the financial position of the Successor as of December 31, 2005 and 2004, and the results of its operations and its cash flows for the years ended December 31, 2005 and 2004 and for the period from May 8, 2003 (date of inception) to December 31, 2003, and the results of operations of the Predecessor and its cash flows for the period from January 1, 2003 to August 14, 2003, in conformity with accounting principles generally accepted in the United States of America.
As discussed in Note 1 to the consolidated financial statements, the Successor acquired the Predecessor on August 15, 2003 in a transaction accounted for in accordance with Statement of Financial Accounting Standards No. 141, "Business Combinations." Accordingly, the assets acquired and liabilities assumed were recorded at fair value on that date by the Successor and are not comparable with those of the Predecessor.
/s/ DELOITTE & TOUCHE LLP
Dallas, Texas
March 14, 2006
F-2
REDDY ICE HOLDINGS, INC. AND SUBSIDIARY
CONSOLIDATED BALANCE SHEETS
| | Successor | ||||||||
|---|---|---|---|---|---|---|---|---|---|
| | December 31, | ||||||||
| | 2005 | 2004 | |||||||
| | (in thousands, except share data) | ||||||||
| ASSETS | |||||||||
| CURRENT ASSETS: | |||||||||
| Cash and cash equivalents | $ | 33,997 | $ | 4,478 | |||||
| Accounts receivable, net | 23,376 | 21,861 | |||||||
| Inventories | 10,087 | 9,435 | |||||||
| Prepaid expenses | 2,356 | 2,651 | |||||||
| Assets held for sale | — | 790 | |||||||
| Deferred tax assets | 2,740 | 2,174 | |||||||
| Total current assets | 72,556 | 41,389 | |||||||
| PROPERTY AND EQUIPMENT, net | 231,816 | 233,661 | |||||||
| GOODWILL | 214,968 | 220,451 | |||||||
| OTHER INTANGIBLES, net | 82,345 | 93,109 | |||||||
| OTHER ASSETS | 2,079 | 10 | |||||||
| TOTAL | $ | 603,764 | $ | 588,620 | |||||
| LIABILITIES AND STOCKHOLDERS' EQUITY | |||||||||
| CURRENT LIABILITIES: | |||||||||
| Current portion of long-term obligations | $ | 65 | $ | 1,869 | |||||
| Notes payable | — | 355 | |||||||
| Revolving credit facility | — | 5,450 | |||||||
| Accounts payable | 12,962 | 15,509 | |||||||
| Accrued expenses | 18,150 | 15,998 | |||||||
| Dividends payable | 8,296 | — | |||||||
| Total current liabilities | 39,473 | 39,181 | |||||||
| LONG-TERM OBLIGATIONS | 352,895 | 429,392 | |||||||
| DEFERRED TAX LIABILITIES, net | 28,213 | 37,114 | |||||||
| COMMITMENTS AND CONTINGENCIES (Note 14) | — | — | |||||||
| STOCKHOLDERS' EQUITY: | |||||||||
| Common stock, $0.01 par value; 75,000,000 shares authorized; 21,690,042 and 13,686,150 shares issued and outstanding at December 31, 2005 and 2004, respectively | 217 | 137 | |||||||
| Additional paid-in capital | 213,096 | 90,077 | |||||||
| Unearned compensation | (52 | ) | (135 | ) | |||||
| Accumulated deficit | (32,065 | ) | (7,146 | ) | |||||
| Accumulated other comprehensive income | 1,987 | — | |||||||
| Total stockholders' equity | 183,183 | 82,933 | |||||||
| TOTAL | $ | 603,764 | $ | 588,620 | |||||
See notes to consolidated financial statements.
F-3
REDDY ICE HOLDINGS, INC. AND SUBSIDIARY
CONSOLIDATED STATEMENTS OF OPERATIONS
| | Successor | Predecessor | ||||||||||||
|---|---|---|---|---|---|---|---|---|---|---|---|---|---|---|
| | Year Ended December 31, | May 8, 2003 (Date of Inception) to December 31, 2003 | | |||||||||||
| | January 1 to August 14, 2003 | |||||||||||||
| | 2005 | 2004 | ||||||||||||
| | (in thousands, except per share amounts) | |||||||||||||
| Revenues | $ | 319,772 | $ | 285,727 | $ | 86,919 | $ | 151,269 | ||||||
| Cost of sales, excluding depreciation expense | 196,223 | 173,066 | 52,732 | 91,642 | ||||||||||
| Depreciation expense related to cost of sales | 18,838 | 17,850 | 5,883 | 10,881 | ||||||||||
| Gross profit | 104,711 | 94,811 | 28,304 | 48,476 | ||||||||||
| Operating expenses | 42,030 | 36,928 | 13,430 | 18,598 | ||||||||||
| Depreciation and amortization expense | 5,691 | 5,335 | 1,733 | 3,647 | ||||||||||
| Loss (gain) on disposition of assets | 1,848 | 398 | — | (11 | ) | |||||||||
| Impairment of assets | 5,725 | — | — | — | ||||||||||
| Management agreement termination fees and transaction bonuses and expenses (Note 11) | 6,171 | — | — | — | ||||||||||
| Income from operations | 43,246 | 52,150 | 13,141 | 26,512 | ||||||||||
| Other income, net | — | — | — | 116 | ||||||||||
| Loss on extinguishment of debt | 28,189 | — | — | — | ||||||||||
| Interest expense | 34,421 | 25,105 | 10,370 | 21,063 | ||||||||||
| Income (loss) before income taxes | (19,364 | ) | 27,045 | 2,771 | 5,565 | |||||||||
| Income tax benefit (expense) | 7,248 | (10,494 | ) | (1,053 | ) | — | ||||||||
| Net income (loss) | (12,116 | ) | 16,551 | 1,718 | 5,565 | |||||||||
| Preferred dividends | — | 10,583 | 4,431 | 2,566 | ||||||||||
| Net income (loss) available to common stockholders | $ | (12,116 | ) | $ | 5,968 | $ | (2,713 | ) | $ | 2,999 | ||||
| Basic net income (loss) per share: | ||||||||||||||
| Net income (loss) available to common stockholders | $ | (0.72 | ) | $ | 0.44 | $ | (0.35 | ) | $ | 0.15 | ||||
| Weighted average common shares outstanding | 16,760 | 13,675 | 7,858 | 20,159 | ||||||||||
| Diluted net income (loss) per share: | ||||||||||||||
| Net income (loss) available to common stockholders | $ | (0.72 | ) | $ | 0.44 | $ | (0.35 | ) | $ | 0.14 | ||||
| Weighted average common shares outstanding | 16,760 | 13,703 | 7,858 | 20,808 | ||||||||||
| Cash dividends declared per share | $ | 0.59 | $ | 0.76 | $ | — | $ | — | ||||||
See notes to consolidated financial statements.
F-4
REDDY ICE HOLDINGS, INC. AND SUBSIDIARY
CONSOLIDATED STATEMENTS OF STOCKHOLDERS' EQUITY
Predecessor for the Period from January 1, 2003 to August 14, 2003 and the Year Ended December 31, 2002:
| | Number of Shares | Par Value | | | | | | | | ||||||||||||||||||||||||
|---|---|---|---|---|---|---|---|---|---|---|---|---|---|---|---|---|---|---|---|---|---|---|---|---|---|---|---|---|---|---|---|---|---|
| | | | | | | Accumulated Other Comprehensive Income | | ||||||||||||||||||||||||||
| | Preferred Stock | Common Stock | Preferred Stock | Common Stock | Additional Paid-In Capital | Stock Subscription Receivable | Treasury Stock | Unearned Compensation | Accumulated Deficit | Total | |||||||||||||||||||||||
| | (in thousands) | ||||||||||||||||||||||||||||||||
| Balance at December 31, 2002 | — | 20,656 | $ | — | $ | 207 | $ | 115,356 | $ | — | $ | (1,491 | ) | $ | (244 | ) | $ | (149,672 | ) | $ | (1,305 | ) | $ | (37,149 | ) | ||||||||
| Exercise of employee stock options | — | 10 | — | — | 19 | — | — | — | — | — | 19 | ||||||||||||||||||||||
| Dividends accumulated on 10% exchangeable preferred stock | — | — | — | — | (2,566 | ) | — | — | — | — | — | (2,566 | ) | ||||||||||||||||||||
| Cancellation of restricted stock | — | (200 | ) | — | (2 | ) | (242 | ) | — | — | 244 | — | — | — | |||||||||||||||||||
| Comprehensive income: | |||||||||||||||||||||||||||||||||
| Net income | — | — | — | — | — | — | — | — | 5,565 | — | 5,565 | ||||||||||||||||||||||
| Increase in fair value of derivative liability | — | — | — | — | — | — | — | — | — | 1,579 | 1,579 | ||||||||||||||||||||||
| �� | |||||||||||||||||||||||||||||||||
| Total comprehensive income | 7,144 | ||||||||||||||||||||||||||||||||
| Balance at August 14, 2003 | — | 20,466 | $ | — | $ | 205 | $ | 112,567 | $ | — | $ | (1,491 | ) | $ | — | $ | (144,107 | ) | $ | 274 | $ | (32,552 | ) | ||||||||||
See notes to consolidated financial statements.
F-5
REDDY ICE HOLDINGS, INC. AND SUBSIDIARY
CONSOLIDATED STATEMENTS OF STOCKHOLDERS' EQUITY (Continued)
Successor for the years ended December 31, 2005 and 2004 and for the period from May 8, 2003 (Date of Inception) to December 31, 2003:
| | Number of Shares | Par Value | | | | | | | | ||||||||||||||||||||||||
|---|---|---|---|---|---|---|---|---|---|---|---|---|---|---|---|---|---|---|---|---|---|---|---|---|---|---|---|---|---|---|---|---|---|
| | | | | | | Accumulated Other Comprehensive Income | | ||||||||||||||||||||||||||
| | Preferred Stock | Common Stock | Preferred Stock | Common Stock | Additional Paid-In Capital | Stock Subscription Receivable | Treasury Stock | Unearned Compensation | Accumulated Deficit | Total | |||||||||||||||||||||||
| | (in thousands) | ||||||||||||||||||||||||||||||||
| Balance at May 8, 2003 (Date of Inception) | — | — | $ | — | $ | — | $ | — | $ | — | $ | — | $ | — | $ | — | $ | — | $ | — | |||||||||||||
| Issuance of common stock | — | 13,634 | — | 137 | 98,663 | (1,203 | ) | — | — | — | — | 97,597 | |||||||||||||||||||||
| Issuance of preferred stock | 98 | — | 1 | — | 98,799 | (1,203 | ) | — | — | — | — | 97,597 | |||||||||||||||||||||
| Grant of restricted preferred and common stock | 1 | 35 | — | — | 500 | — | — | (500 | ) | — | — | — | |||||||||||||||||||||
| Satisfaction of stock subscription receivable | — | — | — | — | — | 2,406 | — | — | — | — | 2,406 | ||||||||||||||||||||||
| Distributions to stockholders | — | — | — | — | (8,961 | ) | — | — | — | — | — | (8,961 | ) | ||||||||||||||||||||
| Dividends on 12% cumulative preferred stock | — | — | — | — | 4,431 | — | — | — | (4,431 | ) | — | — | |||||||||||||||||||||
| Amortization of unearned compensation | — | — | — | — | — | — | — | 63 | — | — | 63 | ||||||||||||||||||||||
| Comprehensive income: | |||||||||||||||||||||||||||||||||
| Net income | — | — | — | — | — | — | — | — | 1,718 | — | 1,718 | ||||||||||||||||||||||
| Increase in fair value of derivative liability | — | — | — | — | — | — | — | — | — | 898 | 898 | ||||||||||||||||||||||
| Total comprehensive income | 2,616 | ||||||||||||||||||||||||||||||||
| Balance at December 31, 2003 | 99 | 13,669 | $ | 1 | $ | 137 | $ | 193,432 | $ | — | $ | — | $ | (437 | ) | $ | (2,713 | ) | $ | 898 | $ | 191,318 | |||||||||||
| Issuance of common stock | — | 17 | — | — | 125 | — | — | — | — | — | 125 | ||||||||||||||||||||||
| Issuance of preferred stock | — | — | — | — | 125 | — | — | — | — | — | 125 | ||||||||||||||||||||||
| Dividends on common stock | — | — | — | — | — | — | — | — | (10,401 | ) | — | (10,401 | ) | ||||||||||||||||||||
| Dividends on 12% cumulative preferred stock | — | — | — | — | 10,583 | — | — | — | (10,583 | ) | — | — | |||||||||||||||||||||
| Redemption of preferred stock | (99 | ) | — | (1 | ) | — | (114,188 | ) | — | — | — | — | — | (114,189 | ) | ||||||||||||||||||
| Amortization of unearned compensation | — | — | — | — | — | — | — | 302 | — | — | 302 | ||||||||||||||||||||||
| Comprehensive income: | |||||||||||||||||||||||||||||||||
| Net income | — | — | — | — | — | — | — | — | 16,551 | — | 16,551 | ||||||||||||||||||||||
| Increase in fair value of derivative liability | — | — | — | — | — | — | — | — | — | 2,464 | 2,464 | ||||||||||||||||||||||
| Realized non-cash gain on derivative | — | — | — | — | — | — | — | — | — | (3,362 | ) | (3,362 | ) | ||||||||||||||||||||
| Total comprehensive income | 15,653 | ||||||||||||||||||||||||||||||||
| Balance at December 31, 2004 | — | 13,686 | $ | — | $ | 137 | $ | 90,077 | $ | — | $ | — | $ | (135 | ) | $ | (7,146 | ) | $ | — | $ | 82,933 | |||||||||||
| Amortization of unearned compensation | — | — | — | — | — | — | — | 83 | — | — | 83 | ||||||||||||||||||||||
| Issuance of stock and compensation expense under stock-based awards | — | 35 | — | — | 2,864 | — | — | — | — | — | 2,864 | ||||||||||||||||||||||
| Exercise of employee stock options | — | 1,057 | — | 11 | 1,788 | — | — | — | — | — | 1,799 | ||||||||||||||||||||||
| Excess tax benefit from exercise of employee stock options | — | — | — | — | 2,258 | — | — | — | — | — | 2,258 | ||||||||||||||||||||||
| Issuance of common stock in connection with initial public offering and related transactions, net of issuance costs | — | 6,912 | — | 69 | 116,109 | — | — | — | — | — | 116,178 | ||||||||||||||||||||||
| Cash dividends declared | — | — | — | — | — | — | — | — | (12,803 | ) | — | (12,803 | ) | ||||||||||||||||||||
| Comprehensive loss: | |||||||||||||||||||||||||||||||||
| Net loss | — | — | — | — | — | — | — | — | (12,116 | ) | — | (12,116 | ) | ||||||||||||||||||||
| Increase in fair value of derivative asset | — | — | — | — | — | — | — | — | — | 1,987 | 1,987 | ||||||||||||||||||||||
| Total comprehensive loss | (10,129 | ) | |||||||||||||||||||||||||||||||
| Balance at December 31, 2005 | — | 21,690 | $ | — | $ | 217 | $ | 213,096 | $ | — | $ | — | $ | (52 | ) | $ | (32,065 | ) | $ | 1,987 | $ | 183,183 | |||||||||||
See notes to consolidated financial statements.
F-6
REDDY ICE HOLDINGS, INC. AND SUBSIDIARY
CONSOLIDATED STATEMENTS OF CASH FLOWS
| | Successor | Predecessor | ||||||||||||||
|---|---|---|---|---|---|---|---|---|---|---|---|---|---|---|---|---|
| | Year Ended December 31, | May 8, 2003 (Date of Inception) to December 31, 2003 | | |||||||||||||
| | January 1 to August 14, 2003 | |||||||||||||||
| | 2005 | 2004 | ||||||||||||||
| | (in thousands) | |||||||||||||||
| CASH FLOWS FROM OPERATING ACTIVITIES: | ||||||||||||||||
| Net income (loss) | $ | (12,116 | ) | $ | 16,551 | $ | 1,718 | $ | 5,565 | |||||||
| Adjustments to reconcile net income (loss) to net cash provided by (used in) operating activities (excluding working capital from acquisitions): | ||||||||||||||||
| Depreciation and amortization expense | 24,529 | 23,185 | 7,616 | 14,528 | ||||||||||||
| Amortization of debt issue costs and debt discounts | 13,358 | 4,410 | 882 | 23 | ||||||||||||
| Deferred tax expense (benefit) | (7,115 | ) | 10,176 | 1,053 | — | |||||||||||
| Loss (gain) on disposition of assets | 1,848 | 398 | — | (11 | ) | |||||||||||
| Stock-based compensation expense | 2,947 | 302 | 63 | — | ||||||||||||
| Realized gain on derivative | — | (3,362 | ) | — | — | |||||||||||
| Loss on extinguishment of debt | 28,189 | — | — | — | ||||||||||||
| Impairment of assets | 5,725 | — | — | — | ||||||||||||
| Changes in assets and liabilities, net of the effects of acquisitions: | ||||||||||||||||
| Accounts receivable, inventory and prepaid assets | (1,391 | ) | (4,537 | ) | 19,064 | (18,815 | ) | |||||||||
| Accounts payable and accrued expenses | (387 | ) | 663 | (304 | ) | (6,136 | ) | |||||||||
| Net cash provided by (used in) operating activities | 55,587 | 47,786 | 30,092 | (4,846 | ) | |||||||||||
| CASH FLOWS FROM INVESTING ACTIVITIES: | ||||||||||||||||
| Property additions | (19,265 | ) | (15,988 | ) | (3,252 | ) | (7,848 | ) | ||||||||
| Proceeds from dispositions of assets | 2,108 | 2,657 | 311 | 1,236 | ||||||||||||
| Acquisition of Packaged Ice, Inc., net of cash acquired | — | — | (124,720 | ) | — | |||||||||||
| Other acquisitions, net of cash acquired | (936 | ) | (16,874 | ) | (67,998 | ) | — | |||||||||
| Cost of purchases of leased assets | (2,458 | ) | — | (10,469 | ) | — | ||||||||||
| Net cash used in investing activities | (20,551 | ) | (30,205 | ) | (206,128 | ) | (6,612 | ) | ||||||||
| CASH FLOWS FROM FINANCING ACTIVITIES: | ||||||||||||||||
| Proceeds from exercise of stock options | 1,799 | — | — | 19 | ||||||||||||
| Proceeds from the issuance of common and preferred stock, net of issuance costs | 116,178 | 250 | 197,600 | — | ||||||||||||
| Dividends and other distributions to stockholders | (4,507 | ) | (10,401 | ) | (8,961 | ) | — | |||||||||
| Redemption of preferred stock | — | (114,189 | ) | — | — | |||||||||||
| Proceeds from the issuance of debt | 240,000 | 100,163 | 330,931 | — | ||||||||||||
| Deferred debt costs | (5,370 | ) | (4,739 | ) | (13,553 | ) | — | |||||||||
| Borrowings (repayments) under the revolving credit facility, net | (5,450 | ) | 5,450 | (11,691 | ) | 11,691 | ||||||||||
| Repayment of debt | (348,167 | ) | (2,438 | ) | (305,489 | ) | (46 | ) | ||||||||
| Net cash provided by (used in) financing activities | (5,517 | ) | (25,904 | ) | 188,837 | 11,664 | ||||||||||
| NET INCREASE (DECREASE) IN CASH AND CASH EQUIVALENTS | 29,519 | (8,323 | ) | 12,801 | 206 | |||||||||||
| CASH AND CASH EQUIVALENTS, BEGINNING OF PERIOD | 4,478 | 12,801 | — | 6,500 | ||||||||||||
| CASH AND CASH EQUIVALENTS, END OF PERIOD | $ | 33,997 | $ | 4,478 | $ | 12,801 | $ | 6,706 | ||||||||
| SUPPLEMENTAL DISCLOSURE OF CASH FLOW INFORMATION: | ||||||||||||||||
| Cash payments for interest | $ | 23,471 | $ | 24,666 | $ | 4,469 | $ | 31,164 | ||||||||
| Cash payments (refunds) of income taxes | $ | (114 | ) | $ | 300 | $ | — | $ | — | |||||||
| Borrowings under the revolving credit facility | $ | 75,900 | $ | 53,100 | $ | — | $ | 151,185 | ||||||||
| Repayments under the revolving credit facility | $ | (81,350 | ) | $ | (47,650 | ) | $ | (11,691 | ) | $ | (139,494 | ) | ||||
| Cash dividends declared, not paid | $ | 8,296 | $ | — | $ | — | $ | — | ||||||||
| Increase in fair value of derivative | $ | 1,987 | $ | 2,464 | $ | 898 | $ | 1,579 | ||||||||
| Reversal of valuation allowance on deferred tax assets | $ | — | $ | 32,760 | $ | — | $ | — | ||||||||
| Issuance of notes payable—premium financing of insurance | $ | 88 | $ | 931 | $ | — | $ | — | ||||||||
| Excess tax benefit from exercise of employee stock options | $ | (2,258 | ) | $ | — | $ | — | $ | — | |||||||
| Additions to property and equipment included in accounts payable | $ | 908 | $ | — | $ | — | $ | — | ||||||||
See notes to consolidated financial statements.
F-7
REDDY ICE HOLDINGS, INC. AND SUBSIDIARIES
NOTES TO CONSOLIDATED FINANCIAL STATEMENTS
1. ORGANIZATION
Reddy Ice Holdings, Inc., a Delaware corporation ("Reddy Holdings"), and its wholly owned subsidiary, Cube Acquisition Corp. ("Cube"), a Texas corporation, were formed on behalf of Trimaran Fund Management LLC ("Trimaran") and Bear Stearns Merchant Banking ("BSMB") on May 8, 2003 for the purpose of acquiring Packaged Ice, Inc. ("Packaged Ice") and effecting certain capital transactions in connection with such acquisition. On August 15, 2003, Cube merged with and into Packaged Ice, with Packaged Ice being the surviving corporation. As a result of the merger, Packaged Ice was delisted from the American Stock Exchange. Reddy Holdings and Cube conducted no operations during the period from May 8, 2003 to August 14, 2003. In connection with the merger, Packaged Ice was renamed Reddy Ice Group, Inc. ("Reddy Group"). Reddy Holdings and its wholly owned subsidiary Reddy Group are referred to collectively herein as the "Successor". Packaged Ice prior to the merger on August 15, 2003 is referred to as the "Predecessor" and, collectively with the Successor, the "Company". As a result of purchase accounting, the Predecessor balances and amounts presented in these consolidated financial statements and footnotes may not be comparable to the Successor balances and amounts.
On August 12, 2005, Reddy Holdings completed an initial public offering of its common stock (see Note 11). As a result of the offering, Reddy Holdings' common shares are publicly traded on the New York Stock Exchange under the ticker symbol "FRZ".
The Company manufactures and distributes packaged ice products and bottled water and owns and operates refrigerated warehouses. The Company is the largest manufacturer of packaged ice products in the United States. The Company serves approximately 82,000 customer locations in 31 states and the District of Columbia.
On August 2, 2005, the Company effected a 138 for 1 stock split and, in conjunction therewith, amended and restated the Company's certificate of incorporation to increase the number of authorized shares of the Company's common stock and preferred stock. All common share and per common share amounts in these consolidated financial statements prior to August 2, 2005 have been retroactively adjusted for all periods presented to give effect to the stock split, including reclassifying an amount equal to the increase in par value from additional paid-in capital to common stock.
2. SUMMARY OF SIGNIFICANT ACCOUNTING POLICIES
Principles of Consolidation. The consolidated financial statements include the accounts of Reddy Ice Holdings, Inc. and its wholly owned subsidiary. All significant intercompany accounts and transactions have been eliminated in consolidation.
Cash and Cash Equivalents. The Company considers all highly liquid investments purchased with an original maturity of three months or less to be cash equivalents.
Accounts Receivable. Accounts receivable are net of allowances for doubtful accounts of $0.6 million and $0.7 million at December 31, 2005 and 2004, respectively. The Company maintains allowances for doubtful accounts for estimated losses resulting from the inability of its customers to make the required payments on their accounts. The estimated losses are based on past experience with similar accounts receivable. If the financial condition of the Company's customers were to deteriorate, resulting in an impairment of their ability to make
F-8
payments, additional allowances may be required. The following table represents the roll-forward of the allowance for doubtful accounts:
| | Successor | Predecessor | |||||||||||
|---|---|---|---|---|---|---|---|---|---|---|---|---|---|
| | Year Ended December 31, | May 8, 2003 (Date of Inception) to December 31, 2003 | | ||||||||||
| | January 1 to August 14, 2003 | ||||||||||||
| | 2005 | 2004 | |||||||||||
| | (in thousands) | ||||||||||||
| Beginning balance | $ | 656 | $ | 114 | $ | — | $ | 495 | |||||
| Charges to expense | 645 | 653 | 222 | 115 | |||||||||
| Other (1) | (701 | ) | (111 | ) | (108 | ) | (288 | ) | |||||
| Ending balance | $ | 600 | $ | 656 | $ | 114 | $ | 322 | |||||
- (1)
- Other activity includes direct write-offs of accounts receivable and other adjustments.
Inventories. Inventories consist of raw materials and supplies and finished goods. Raw materials and supplies include ice packaging material, spare parts, bottled water supplies and merchandiser parts. Finished goods include packaged ice and bottled water. Inventories are valued at the lower of cost or market and include overhead allocations. Cost is determined using the first-in, first-out and average cost methods.
Property and equipment. Property and equipment is carried at cost and is being depreciated on a straight-line basis over estimated lives of 10 to 40 years for buildings and site improvements and 2 to 20 years for plant, equipment and machinery. Maintenance and repairs are charged to expense as incurred, while capital improvements that extend the useful lives of the underlying assets are capitalized.
Goodwill and Other Intangibles. In accordance with Statement of Financial Accounting Standards ("SFAS") No. 142, "Goodwill and Other Intangible Assets," the Company does not amortize its goodwill and certain intangible assets with an indefinite life. Other intangible assets include the following that are amortized over their useful lives:
| Intangible Assets | Useful Life | |
|---|---|---|
| Goodwill | Indefinite life | |
| Trade name | Indefinite life | |
| Customer relationships | Straight line method over economic lives of 15 to 30 years | |
| Debt issue costs | Effective interest method over the term of the debt |
Impairment of Long-Lived Assets. In accordance with SFAS No. 144, "Accounting for Impairment or Disposal of Long-Lived Assets," long-lived assets and certain identifiable intangible assets to be held and used are reviewed for impairment on an annual basis or whenever events or changes in circumstances indicate that the carrying amount of such assets may not be recoverable. The determination of recoverability of long-lived assets and certain other identifiable intangible assets is based on an estimate of undiscounted future cash flows resulting from the use of the asset or its disposition. Measurement of an impairment loss for long-lived assets and other intangible assets that management expects to hold and use are based on the fair value of the asset. Long-lived assets to be disposed of are reported at the lower of carrying amount or net realizable value.
F-9
In accordance with SFAS No. 142, goodwill is evaluated using a market valuation approach, which is based on the valuations of comparable businesses, multiples of earnings of comparable businesses and discounted cash flows. The Company evaluates goodwill at each fiscal year end and whenever events or changes in circumstances indicate that the carrying amount may not be recoverable.
Due to the significant reduction in cold storage sales volumes related to a particular customer, the Company evaluated the goodwill recorded in the cold storage portion of its non-ice business segment in accordance with SFAS No. 142 as of June 30, 2005. As a result of such evaluation, the Company recorded a non-cash impairment charge of $5.7 million, which resulted in the full write-off of goodwill in the Company's cold storage operations.
Income Taxes. The Company accounts for income taxes under the liability method, which requires, among other things, recognition of deferred income tax assets and liabilities for the expected future tax consequences of events that have been recognized in the Company's consolidated financial statements or tax returns. Under this method, deferred income tax assets and liabilities are determined based on the temporary differences between the financial statement carrying amounts and the tax bases of existing assets and liabilities and the recognition of available tax carryforwards. At December 31, 2003, the Company had a deferred tax asset of $34.9 million relating to Predecessor net operating loss carryforwards that was reduced to zero by a valuation allowance. During 2004, the deferred tax asset and the valuation allowance were both reduced by $2.1 million due to the utilization of the Predecessor's net operating loss carryforwards. The remaining valuation allowance of $32.8 million was reversed at December 31, 2004 as it was considered more likely than not that the Predecessor net operating loss carryforwards would be fully utilized.
Revenue Recognition. Revenue is recognized when product (packaged ice, ice packaging bags, and bottled water) is delivered to and accepted by customers. There is no right of return with respect to the packaged ice, bags delivered and bottled water. Revenue resulting from Ice Factory® management agreements and cold storage services is recognized as earned under contract terms.
Earnings Per Share. The computation of net income (loss) per share is based on net income (loss), after deducting any preferred stock dividends, divided by the weighted average number of shares outstanding. For the year ended December 31, 2005 and the period from May 8, 2003 (Date of Inception) to December 31, 2003 there were 1.2 million and 1.6 million shares of dilutive securities which are not included in the computation of diluted net loss per share as their effect would be anti-dilutive.
F-10
| | Successor | Predecessor | |||||||||||
|---|---|---|---|---|---|---|---|---|---|---|---|---|---|
| | Year Ended | May 8, 2003 (Date of Inception) to December 31, 2003 | | ||||||||||
| | December 31, 2005 | December 31, 2004 | January 1 to August 14, 2003 | ||||||||||
| | (in thousands, except per share amounts) | ||||||||||||
| Net income (loss) for basic and diluted computation: | |||||||||||||
| Net income (loss) | $ | (12,116 | ) | $ | 16,551 | $ | 1,718 | $ | 5,565 | ||||
| Preferred dividends | — | 10,583 | 4,431 | 2,566 | |||||||||
| Net income (loss) available to common stockholders | $ | (12,116 | ) | $ | 5,968 | $ | (2,713 | ) | $ | 2,999 | |||
Basic net income (loss) per share: | |||||||||||||
| Weighted average common shares outstanding | 16,760 | 13,675 | 7,858 | 20,159 | |||||||||
| Net income (loss) available to common stockholders | $ | (0.72 | ) | $ | 0.44 | $ | (0.35 | ) | $ | 0.15 | |||
Diluted net income (loss) per share: | |||||||||||||
| Weighted average common shares outstanding | 16,760 | 13,675 | 7,858 | 20,159 | |||||||||
| Shares issuable from assumed conversion of stock options or restricted stock | — | 28 | — | 649 | |||||||||
| Weighted average common shares outstanding, as adjusted | 16,760 | 13,703 | 7,858 | 20,808 | |||||||||
| Net income (loss) available to common stockholders | $ | (0.72 | ) | $ | 0.44 | $ | (0.35 | ) | $ | 0.14 | |||
Fair Values of Financial Instruments. The Company's financial instruments consist primarily of cash and cash equivalents, accounts receivable, accounts payable, debt obligations and an interest rate hedge agreement. The carrying amount of cash, cash equivalents, trade accounts receivable and trade accounts payable are representative of their respective fair values due to the short-term maturity of these instruments. See Note 8 regarding the fair value of the Company's debt obligations and interest rate hedge.
Interest Rate Hedging Agreement. The differential to be paid or received on the interest rate hedging agreement is accrued as interest rates change and is recognized over the life of the agreement as an increase or decrease in interest expense. The Company does not use this instrument for trading purposes. The Company entered into this hedging arrangement for the purpose of hedging the anticipated cash payments for interest associated with its variable rate debt.
Stock Options. At December 31, 2005 and 2004, the Company had two stock-based employee compensation plans, the Reddy Ice Holdings, Inc. Long Term Incentive and Share Award Plan (the "2005 Equity Incentive Plan") and the Reddy Ice Holdings, Inc. 2003 Stock Option Plan (the "2003 Stock Option Plan"), under which stock options and other forms of equity compensation may be granted from time to time. See Note 12 for further information regarding the plans. All of the Predecessor's stock-based compensation plans were terminated and all in-the-money options were paid out in cash in connection with the merger on August 15, 2003 (see Notes 1 and 3).
F-11
Effective January 1, 2005, the Company adopted the fair value recognition provisions of SFAS No. 123, "Accounting for Stock-Based Compensation", as amended by SFAS No. 148, "Accounting for Stock-Based Compensation—Transition and Disclosure". Under the provisions of SFAS No. 148, the Company selected the modified prospective method of adoption and therefore began recognizing stock-based employee compensation cost related to the 2003 Stock Option Plan beginning January 1, 2005, as if the fair value-based accounting method had been used to account for all employee awards granted, modified or settled since the inception of the 2003 Stock Option Plan on August 15, 2003. The Company has also recorded stock-based compensation expense related to the issuance of 250 shares each of restricted common stock and preferred stock since August 15, 2003, the date such restricted common stock and preferred stock were granted.
Through December 31, 2004, the Company accounted for the 2003 Stock Option Plan under the intrinsic value method prescribed by APB Opinion No. 25, "Accounting for Stock Issued to Employees", and related interpretations. No stock-based employee compensation cost related to stock options is reflected in the net income (loss) available to common stockholders for the year ended December 31, 2004 and the period from May 8, 2003 (Date of Inception) to December 31, 2003 as all stock options granted under the 2003 Stock Option Plan had an exercise price equal to or greater than the market value of the underlying common stock on the date of grant. The following table illustrates the effect on the net income (loss) of the Company had it applied the fair value recognition provisions of stock-based compensation as described in SFAS No. 123, "Accounting for Stock-Based Compensation," as amended by SFAS No. 148, "Accounting for Stock-Based Compensation—Transition and Disclosure."
| | Successor | |||||||
|---|---|---|---|---|---|---|---|---|
| | Year Ended December 31, 2004 | May 8, 2003 (Date of Inception) to December 31, 2003 | ||||||
| | (in thousands, except per share amounts) | |||||||
| Net income (loss) available to common stockholders, as reported | $ | 5,968 | $ | (2,713 | ) | |||
| Add: Employee stock-based compensation expense included in reported net income (loss), net of tax | 185 | 39 | ||||||
| Less: Total employee stock-based compensation expense determined under fair value based methods for all awards, net of tax | (325 | ) | (78 | ) | ||||
| Pro forma net income (loss) available to common stockholders | $ | 5,828 | $ | (2,752 | ) | |||
Basic net income (loss) per share: | ||||||||
| As reported | $ | 0.44 | $ | (0.35 | ) | |||
| Pro forma | 0.43 | (0.35 | ) | |||||
| Diluted net income (loss) per share: | ||||||||
| As reported | $ | 0.44 | $ | (0.35 | ) | |||
| Pro forma | 0.43 | (0.35 | ) | |||||
Use of Estimates. The preparation of consolidated financial statements in conformity with accounting principles generally accepted in the United States of America requires management to make estimates and assumptions that affect the reported amounts of assets and liabilities and disclosure of contingent assets and liabilities at the date of the financial statements and the reported amounts of revenues and expenses during the reporting period. Actual results could differ from those estimates.
F-12
New Accounting Pronouncements. In November 2004, the FASB issued SFAS No. 151, "Inventory Costs—an amendment of ARB No. 43, chapter 4". SFAS No. 151 clarifies the accounting for abnormal amounts of idle facility expense, freight, handling costs, and wasted material (spoilage) in the determination of inventory carrying costs. The statement requires such costs to be treated as a current period expense. This statement is effective for fiscal years beginning after July 15, 2005. SFAS No. 151 was adopted on January 1, 2006. The adoption of SFAS No. 151 did not have a material effect on the Company's results of operation and financial position.
In December 2004, the FASB issued SFAS No. 153, "Exchanges of Nonmonetary Assets, an Amendment to APB Opinion No. 29". The accounting guidance in APB Opinion No. 29, "Accounting for Nonmonetary Transactions", is based on the principle that exchanges of nonmonetary assets should be measured based on the fair value of the assets exchanged. The guidance in APB No. 29, however, included certain exceptions to that principle. SFAS No. 153 amends APB No. 29 to eliminate the exception for nonmonetary exchanges of similar productive assets and replaces it with a general exception for exchanges of nonmonetary assets that do not have commercial substance. A nonmonetary exchange has commercial substance if the future cash flows of the entity are expected to change significantly as a result of the exchange. SFAS No. 153 is effective for nonmonetary asset exchanges occurring in fiscal periods beginning after June 15, 2005. The adoption of SFAS No. 153 on January 1, 2006 had no effect on the Company's results of operations and financial position.
In December 2004, the FASB issued SFAS No. 123(R), "Share-Based Payment", which establishes accounting standards for all transactions in which an entity exchanges its equity instruments for goods and services. SFAS No. 123(R) focuses primarily on accounting for transactions with employees, and carries forward without change prior guidance for share-based payments for transactions with non-employees.
SFAS No. 123(R) eliminates the intrinsic value measurement objective in APB Opinion 25 and generally requires companies to measure the cost of employee services received in exchange for an award of equity instruments based on the fair value of the award on the date of the grant. The standard requires grant date fair value to be estimated using either an option-pricing model which is consistent with the terms of the award or a market observed price, if such a price exists. Such cost must be recognized over the period during which an employee is required to provide service in exchange for the award, which is usually the vesting period. The standard also requires the Company to estimate the number of instruments that will ultimately be issued, rather than accounting for forfeitures as they occur.
The Company is required to apply SFAS No. 123(R) to all awards granted, modified or settled on or after the first day of the next fiscal year beginning after June 15, 2005. SFAS No. 123(R) also requires the use of either the "modified prospective method" or the "modified retrospective method." Under the modified prospective method, compensation cost is recognized for all awards granted after adoption of the standard and for the unvested portion of previously granted awards that are outstanding on that date. Under the modified retrospective method, previously issued financial statements must be restated to recognize the expense amounts previously calculated and reported on a pro forma basis, as if the prior standard had been adopted. Under both methods, either the straight line or an accelerated method may be used to amortize the compensation cost associated with awards with graded vesting.
The Company adopted SFAS No. 123(R) on January 1, 2006 using the modified prospective method and straight line amortization of compensation cost. The adoption of this standard did not have a material effect on the Company's results of operations and financial position.
In March 2005, the FASB issued FIN No. 47, "Accounting for Conditional Asset Retirement Obligations". FIN No. 47 clarifies that the term "conditional asset retirement obligation" as used in SFAS No. 143, "Accounting for
F-13
Asset Retirement Obligations", refers to a legal obligation to perform an asset retirement activity in which the timing and (or) method of settlement are conditional on a future event that may or may not be within the control of the entity. An entity is required to recognize a liability for the fair value of a conditional asset retirement obligation if the fair value of the liability can be reasonably estimated. The fair value of a liability for the conditional asset retirement obligation should be recognized when incurred—generally upon acquisition, construction, or development and (or) through the normal operation of the asset. Uncertainty about the timing and (or) method of settlement of a conditional asset retirement obligation should be factored into the measurement of the liability when sufficient information exists. FIN No. 47 was effective for fiscal years ending after December 15, 2005 and therefore is applicable for the year ended December 31, 2005. The adoption of FIN No. 47 had no effect on the Company's results of operations and financial position.
In November 2004, the EITF reached a consensus on EITF 03-13, "Applying the Conditions in Paragraph 42 of FASB Statement No. 144, Accounting for the Impairment or Disposal of Long-Lived Assets, in Determining Whether to Report Discontinued Operations". The EITF reached a consensus in this issue on an approach for evaluating whether the criteria in SFAS No. 144 have been met for purposes of classifying the results of operations of a component of an entity that either has been disposed of or is classified as held for sale as discontinued operations. The approach includes an evaluation of whether the operations and cash flows of a disposed component have been or will be eliminated from the ongoing operations of the entity. Such evaluation depends on whether continuing cash flows have been or are expected to be generated and, if so, whether those continuing cash flows are direct or indirect. The consensus also requires financial statement disclosure of certain information for each discontinued operation that generates continuing cash flows. EITF 03-13 is effective for components of an enterprise that are either disposed of or classified as held for sale in fiscal periods beginning after December 15, 2004. The adoption of EITF 03-13 on January 1, 2005 had no effect on the Company's results of operations and financial position.
3. ACQUISITIONS
On August 15, 2003, Cube merged with and into Packaged Ice, with Packaged Ice being the surviving corporation. Concurrent with the closing of the merger, Packaged Ice was named Reddy Ice Group, Inc. The merger was consummated pursuant to the Agreement and Plan of Merger, dated as of May 12, 2003, by and among Reddy Holdings, Cube and Packaged Ice. Subsequent to the merger, all of the Company's operations were conducted through Reddy Group.
The merger was accounted for as a purchase by Cube of Packaged Ice in accordance with SFAS No. 141, "Business Combinations." Total consideration was $461.0 million, including $113.0 million for common and preferred securities, $316.7 million for assumption of debt and revolving loans, $12.8 million for debt issue costs and $18.5 million in direct merger costs. The total consideration reconciles to the net acquisition costs as follows (dollars in millions):
| Total consideration | $ | 461.0 | |||
| Less: | |||||
| Assumption of debt | (316.7 | ) | |||
| Debt issue costs | (12.8 | ) | |||
| Cash on hand at closing | (6.8 | ) | |||
| Acquisition costs, net of cash acquired | $ | 124.7 | |||
F-14
The total purchase price was allocated to the acquired assets and assumed liabilities based upon estimates of their respective fair values as of the closing date using valuations and other studies. The following table summarizes the estimated fair values of the assets acquired and the liabilities assumed at the date of acquisition (dollars in millions):
| Total assets acquired | $ | 254.6 | |
| Total liabilities assumed | 442.8 | ||
| Net liabilities assumed | $ | 188.2 | |
The excess of the aggregate purchase price over the liabilities assumed of $289.0 million was allocated to goodwill ($208.7 million) and other intangible assets ($80.3 million). Other intangibles identified include customer lists ($61.9 million), which are being amortized over useful lives of 15 to 30 years, debt issue costs ($12.8 million) and a trade name ($5.6 million). During 2004, goodwill and net deferred tax liabilities both decreased by $32.8 million due to the removal of the valuation allowance on Predecessor net operating loss carryforwards (see Note 10).
The merger was financed through:
- •
- Gross proceeds of $150.9 million from the sale of 87/8% senior subordinated notes (face value of $152.0 million, see Note 8);
- •
- A $135.0 million term loan borrowed under Reddy Group's senior secured credit facility (see Note 8);
- •
- Cash contributions to Cube by Reddy Holdings and acquired cash of $6.8 million.
In the fourth quarter of 2003, the Company purchased two ice companies (including Triangle Ice Co., Inc. ("Triangle Ice")) for total consideration of $68.7 million, which included debt issue costs of $0.7 million and direct acquisition costs of $0.6 million. The total purchase price was allocated to the acquired assets and assumed liabilities based upon estimates of their respective fair values as of the closing dates using valuations and other studies. The following table summarizes the estimated fair values of the assets acquired and the liabilities assumed at the date of acquisition (dollars in millions):
| Total assets acquired | $ | 26.2 | |
| Total liabilities assumed | 10.2 | ||
| Net assets acquired | $ | 16.0 | |
The excess of the aggregate purchase price over the net assets acquired of $52.7 million was allocated to goodwill ($40.3 million) and other intangible assets ($12.4 million). Other intangible assets were comprised primarily of customer lists, which are being amortized over useful lives of 15 to 30 years.
The acquisitions were financed through:
- •
- Gross proceeds of $10.0 million from the sale of 690,000 shares each of common and 5,000 shares of preferred stock of Reddy Holdings;
- •
- A $45.0 million supplemental term loan borrowed under Reddy Group's senior secured credit facility (see Note 8);
- •
- use of cash on hand of $14.5 million.
F-15
During 2005 and 2004, the Company purchased two and 11 ice companies, respectively, at various dates throughout the respective years. The total purchase price was allocated to the acquired assets and assumed liabilities based upon estimates of their respective fair values as of the closing dates using valuations and other studies. The following table summarizes the aggregate purchase prices and estimated aggregate fair values of the assets acquired and the liabilities assumed at the date of acquisition (dollars in millions):
| | Successor | ||||||
|---|---|---|---|---|---|---|---|
| | Year Ended December 31, | ||||||
| | 2005 | 2004 | |||||
| Total acquisition costs, including direct acquisition costs | $ | 0.9 | $ | 16.9 | |||
| Total assets acquired | $ | 0.3 | $ | 6.1 | |||
| Total liabilities assumed | — | (1.8 | ) | ||||
| Net assets acquired | $ | 0.3 | $ | 4.3 | |||
The excess of the aggregate purchase price over the net assets acquired or net liabilities assumed was allocated to property and equipment, goodwill and other intangible assets and deferred tax liabilities as follows (dollars in millions):
| | Successor | |||||
|---|---|---|---|---|---|---|
| | Year Ended December 31, | |||||
| | 2005 | 2004 | ||||
| Goodwill | $ | 0.4 | $ | 8.3 | ||
| Other intangible assets | 0.2 | 4.3 | ||||
| Total excess purchase price | $ | 0.6 | $ | 12.6 | ||
Other intangible assets were comprised of customer lists, which are being amortized over useful lives of 15 to 30 years. The 2005 and 2004 acquisitions were funded out of the Company's operating cash flows.
The results of operations of the 2003 acquisitions are included in the Company's consolidated results of operations from the respective dates of acquisition in the fourth quarter of 2003. The results of operations of the 2004 acquisitions are included in the Company's consolidated results of operations from their respective acquisition dates, which range from March 1, 2004 to November 1, 2004. The results of operations of the 2005 acquisitions are included in the Company's consolidated results of operations from their respective acquisition dates, both of which occurred in the third quarter of 2005. The following unaudited pro forma information presents the Company's consolidated results of operations (i) for the twelve month period ended December 31, 2005 as if the two
F-16
acquisitions in 2005 had all occurred on January 1, 2005 and (ii) for the twelve month period ended December 31, 2004 as if the 11 acquisitions in 2004 and the two acquisitions in 2005 had all occurred on January 1, 2004:
| | Successor | |||||
|---|---|---|---|---|---|---|
| | Year Ended December 31, | |||||
| | 2005 | 2004 | ||||
| | (in thousands) (unaudited) | |||||
| Pro forma revenues | $ | 320,317 | $ | 292,776 | ||
| Pro forma net income (loss) available to common stockholders | $ | (12,034 | ) | $ | 6,687 | |
4. INVENTORIES
| | Successor | ||||||
|---|---|---|---|---|---|---|---|
| | December 31, | ||||||
| | 2005 | 2004 | |||||
| | (in thousands) | ||||||
| Raw materials and supplies | $ | 7,801 | $ | 7,584 | |||
| Finished goods | 2,286 | 1,851 | |||||
| Total | $ | 10,087 | $ | 9,435 | |||
5. PROPERTY AND EQUIPMENT
| | Successor | ||||||
|---|---|---|---|---|---|---|---|
| | December 31, | ||||||
| | 2005 | 2004 | |||||
| | (in thousands) | ||||||
| Land | $ | 21,172 | $ | 20,709 | |||
| Buildings and site improvements | 73,221 | 67,984 | |||||
| Plant, equipment and machinery | 180,545 | 167,899 | |||||
| Construction in progress | 1,116 | 2,065 | |||||
| Total | 276,054 | 258,657 | |||||
| Less: accumulated depreciation | 44,238 | 24,996 | |||||
| Total property and equipment, net | $ | 231,816 | $ | 233,661 | |||
Depreciation expense related to cost of sales for the years ended December 31, 2005 and 2004 and the period from May 8, 2003 (Date of Inception) to December 31, 2003 was $18.8 million, $17.9 million and $5.9 million, respectively. Depreciation expense related to cost of sales for the Predecessor for the period from January 1 to August 14, 2003 was $10.9 million.
Depreciation expense included in depreciation and amortization expense for the years ended December 31, 2005 and 2004 and the period from May 8, 2003 (Date of Inception) to December 31, 2003 was $1.4 million, $1.2 million and $0.4 million, respectively. Depreciation expense included in depreciation and amortization expense for the Predecessor for the period from January 1 to August 14, 2003 was $0.7 million.
F-17
6. GOODWILL AND OTHER INTANGIBLES
Goodwill was allocated to the Company's business segments as follows:
| | Successor | ||||||
|---|---|---|---|---|---|---|---|
| | December 31, | ||||||
| | 2005 | 2004 | |||||
| | (in thousands) | ||||||
| Ice products | $ | 211,620 | $ | 211,378 | |||
| Non-ice products and services | 3,348 | 9,073 | |||||
| Total | $ | 214,968 | $ | 220,451 | |||
As discussed in Note 2, the Company recorded a non-cash impairment charge of $5.7 million during the second quarter of 2005 related to goodwill in the Company's non-ice products and services segment.
At December 31, 2005 and 2004, other intangible assets consisted of the following:
| | Successor | ||||||
|---|---|---|---|---|---|---|---|
| | December 31, | ||||||
| | 2005 | 2004 | |||||
| | (in thousands) | ||||||
| Non-amortizable intangible assets—trade name | $ | 5,600 | $ | 5,600 | |||
| Amortizable intangible assets: | |||||||
| Customer lists | 78,194 | 77,916 | |||||
| Debt issue costs | 9,271 | 18,316 | |||||
| Total | 87,465 | 96,232 | |||||
| Less: accumulated amortization | 10,720 | 8,723 | |||||
| Total amortizable intangibles, net | 76,745 | 87,509 | |||||
| Total intangible assets, net | $ | 82,345 | $ | 93,109 | |||
Amortization expense for the years ended December 31, 2005 and 2004 and the period from May 8, 2003 (Date of Inception) to December 31, 2003 was $4.3 million, $4.1 million and $1.3 million, respectively. Amortization expense for the Predecessor for the period from January 1 to August 14, 2003 was $2.9 million. Amortization expense for each of the years ending December 31, 2006, 2007, 2008, 2009 and 2010 is estimated to be $4.3 million. There is no amortization expense related to cost of sales.
F-18
7. ACCRUED EXPENSES
| | Successor | ||||||
|---|---|---|---|---|---|---|---|
| | December 31, | ||||||
| | 2005 | 2004 | |||||
| | (in thousands) | ||||||
| Accrued compensation and employee benefits, including payroll taxes and workers' compensation insurance | $ | 9,758 | $ | 6,411 | |||
| Accrued interest | 3,329 | 5,740 | |||||
| Accrued utilities | 1,425 | 1,191 | |||||
| Accrued property, sales and other taxes | 539 | 806 | |||||
| Other accrued insurance | 1,940 | 1,230 | |||||
| Other | 1,159 | 620 | |||||
| Total | $ | 18,150 | $ | 15,998 | |||
8. REVOLVING CREDIT FACILITY AND LONG-TERM OBLIGATIONS
101/2% Senior Discount Notes. On October 27, 2004, Reddy Holdings issued $151 million at maturity of 101/2% Senior Discount Notes due 2012 (the "Discount Notes") in a private placement offering. The Discount Notes were sold at 66.333% of the stated principal amount, which resulted in gross proceeds of $100.2 million. The net proceeds of the offering, together with a dividend of approximately $28.4 million from Reddy Group, were used to redeem all of Reddy Holdings' existing series A preferred stock for approximately $99.2 million, to pay accumulated dividends on such stock as of the date of redemption in the amount of approximately $15.0 million and to pay a dividend of approximately $10.4 million to our common stockholders. In connection with these transactions, Reddy Group made a special transaction payment of approximately $1.2 million in the aggregate to certain members of management and certain directors (see Note 11).
Each Discount Note had an initial accreted value of $663.33 per $1,000 principal amount at maturity. The accreted value of each Discount Note will increase from the date of issuance until November 1, 2008 at a rate of 101/2% per annum such that the accreted value will equal the stated principal amount at maturity on November 1, 2008. Thereafter, cash interest will accrue and be payable semi-annually at a rate of 101/2% per annum. As of December 31, 2005, the fair value of the Discount Notes was $119.6 million.
The Discount Notes are unsecured obligations of Reddy Holdings and are:
- •
- not guaranteed by any of Reddy Holdings' subsidiaries;
- •
- senior in right of payment to all of Reddy Holdings' future subordinated indebtedness;
- •
- equal in right of payment with any of Reddy Holdings' existing and future unsecured senior indebtedness;
- •
- effectively subordinated to Reddy Holdings' existing and future secured debt, including Reddy Holdings' guarantee of our credit facilities; and
- •
- structurally subordinated to all obligations and preferred equity of Reddy Holdings' subsidiaries.
The Discount Notes include customary covenants that restrict, among other things, Reddy Holdings' ability to incur additional debt or issue certain preferred stock, pay dividends or redeem, repurchase or retire its capital stock or subordinated indebtedness, make certain investments, create liens, enter into arrangements that restrict dividends from its subsidiaries, merge or sell all or substantially all of its assets or enter into various transactions with affiliates. Prior to November 1, 2007, Reddy Holdings may redeem up to 35% of the principal amount of the
F-19
Discount Notes at a redemption price of 110.5% of the principal amount thereof, plus accrued and unpaid interest to the date of redemption, with funds raised in equity offerings that are specified in the indenture governing the Discount Notes. From and after November 1, 2008, Reddy Holdings may redeem any or all of the Discount Notes by paying a redemption premium, which is initially 5.25% of the principal amount at maturity of the notes and declines annually to 0% for the period commencing on November 1, 2010 and thereafter. If a change of control occurs prior to November 1, 2007, Reddy Holdings may, at its option, redeem all, but not less than all, of the Discount Notes at a redemption price equal to the sum of (i) the accreted value of the notes as of the redemption date, (ii) a premium equal to 125% of one year's coupon payment and (iii) any accrued and unpaid interest to the date of redemption. If Reddy Holdings experiences a change of control and does not elect to make the optional redemption described in the previous sentence, Reddy Holdings will be required to make an offer to repurchase the Discount Notes at a price equal to 101% of their accreted value, plus accrued and unpaid interest, if any, to the date of purchase. Reddy Holdings may also be required to make an offer to purchase the senior discount notes with proceeds of asset sales that are not reinvested in the Company's business or used to repay other indebtedness.
The Discount Notes were subject to registration with the SEC pursuant to the Registration Rights Agreement (the "Rights Agreement") entered into at the time of issuance. Pursuant to the Rights Agreement, Reddy Holdings was required, within 150 days after the issuance date, to file a registration statement with the SEC to exchange the Discount Notes for new notes of Reddy Holdings having terms substantially identical in all material respects to the Discount Notes and to use its commercially reasonable efforts to cause the registration statement to be declared effective within 240 days after the issuance date. The 150th day following the issuance of the Discount Notes was March 26, 2005. Reddy Holdings did not file the required registration statement until April 6, 2005 and, as a result, incurred additional interest expense from March 26, 2005 to April 6, 2005 at an annual rate of 0.50%. The 240th day following the issuance of the Discount Notes was June 24, 2005 and, as a result of the registration statement not having been declared effective by the SEC on or prior to that date, Reddy Holdings began accruing additional interest on the Reddy Holdings notes from June 24, 2005 at an annual rate of 0.50% until the registration statement was declared effective on August 26, 2005. Additional interest in the amount of $0.1 million was paid in cash to holders of the Discount Notes on November 1, 2005.
On July 28, 2005, Reddy Holdings obtained the requisite consents from the holders of the Discount Notes to amend the definition of "Consolidated Net Income" in the indenture governing the Discount Notes in order to exclude certain one-time costs and expenses associated with Reddy Holdings' initial public offering of its common stock (See Note 11).
On August 26, 2005, Reddy Holdings paid $0.4 million to purchase and retire Discount Notes with an aggregate principal amount at maturity of $0.5 million. A loss of $0.046 million was recognized in connection with this transaction.
87/8% Senior Subordinated Notes. On July 17, 2003, Cube completed the sale of $152 million of 87/8% Senior Subordinated Notes due August 1, 2011 (the "Subordinated Notes") in connection with a private placement offering. The Subordinated Notes were priced at 99.297%, which resulted in gross proceeds of $150.9 million. At the closing of the merger on August 15, 2003, Reddy Group assumed Cube's obligations under the Subordinated Notes and the related indenture and received the net proceeds of the offering. The net proceeds were used to consummate the merger as discussed in Note 3, which included the repayment of the Predecessor's $255 million aggregate principal amount of 93/4% Senior Subordinated Notes due February 1, 2005 and the outstanding balance of $61.7 million under its bank credit facility. Interest was payable semiannually on February 1 and August 1, commencing on February 1, 2004. In conjunction with issuance of the Subordinated Notes, $7.0 million of debt issuance costs were incurred. In connection with the closing of Reddy Holdings' initial public offering of its
F-20
common stock, substantially all the outstanding Subordinated Notes were repurchased (see discussion below in "Credit Facilities" for further information).
Credit Facilities. On August 15, 2003, Reddy Group entered into a $170 million senior secured credit facility, with the lenders being a syndicate of banks, financial institutions and other entities, including Credit Suisse First Boston as Administrative Agent, Canadian Imperial Bank of Commerce and Bear Stearns Corporate Lending, Inc. (the "Old Credit Facility"). The Old Credit Facility provided for a six-year term loan in the amount of $135 million (the "Original Term Loan") and a five-year revolving credit facility (the "Old Revolving Credit Facility") in the amount of $35 million. Proceeds of the Original Term Loan were used to consummate the merger as discussed in Note 3. On November 6, 2003, the Old Credit Facility was amended to provide a Supplemental Term Loan (together with the Original Term Loan, referred to as the "Old Term Loans") in the amount of $45 million, the proceeds of which were used to fund a portion of the acquisition of Triangle Ice (see Note 3). The Supplemental Term Loan had substantially the same terms as the Original Term Loan.
On August 12, 2005, Reddy Group amended and restated its credit facility with a syndicate of banks, financial institutions and other entities as lenders, including Credit Suisse First Boston, as Administrative Agent, Canadian Imperial Bank of Commerce, Bear Stearns Corporate Lending, Inc. and Lehman Brothers, Inc. (the "Credit Facility"), to increase the maximum amount of the revolving credit facility to $60 million (the "Revolving Credit Facility"), provide for a $240 million term loan (the "Term Loan"), reduce the applicable margins on both the Revolving Credit Facility and Term Loan and extend the maturity of the Revolving Credit Facility to August 12, 2010 and the Term Loan to August 12, 2012. Borrowings under the Revolving Credit Facility and the Term Loan, along with proceeds from the Company's initial public offering (see Note 11), were used to repay the Old Credit Facility, repurchase substantially all of the Company's existing Subordinated Notes and fund other related transactions. A loss on extinguishment of debt of $28.1 million was incurred in connection with these transactions. The loss was due to the payment of tender premiums and consent fees to the holders of the Subordinated Notes ($17.3 million), the write-off of deferred debt costs and original issue discount related to the Subordinated Notes and the Old Credit Facility ($10.6 million) and other fees and expense ($0.2 million).
At December 31, 2005, the Company had $54.7 million of availability under the Revolving Credit Facility, which was net of outstanding standby letters of credit of $5.3 million. The standby letters of credit are used primarily to secure certain insurance obligations.
Principal balances outstanding under the Credit Facility bear interest per annum, at Reddy Group's option, at the sum of the base rate plus 0.75% or LIBOR plus 1.75%. The base rate is defined as the greater of the prime rate (as announced from time to time by the Administrative Agent) or the federal funds rate plus 0.5%. At December 31, 2005, the weighted average interest rate of borrowings outstanding under the Credit Facility was 5.9%. Interest on base rate loans is payable on the last day of each quarter. Interest on LIBOR loans is payable upon maturity of the LIBOR loan or on the last day of the quarter if the term of the LIBOR loan exceeds 90 days. Reddy Group pays a quarterly fee on the average availability under the Revolving Credit Facility based on an annual rate of 0.5%. As of December 31, 2005, the fair value of the Term Loan was $242.4 million.
The Revolving Credit Facility and Term Loan do not require any scheduled principal payments prior to their stated maturity dates. Subject to certain conditions, mandatory repayments of the Revolving Credit Facility and Term Loan (and if the Term Loan is no longer outstanding, mandatory commitment reductions of the Revolving Credit Facility) are required to be made with portions of the proceeds from (1) asset sales, (2) the issuance of debt securities and (3) insurance and condemnation awards, subject to various exceptions. In the event of a change in control, as defined in the Credit Facility, an event of default will occur under the Credit Facility. Under the Credit Facility, Reddy Group may only pay dividends to Reddy Holdings if Reddy Group's leverage ratio for the most
F-21
recently ended fiscal quarter is less than or equal to 3.75 to 1.0. In addition, the Credit Facility precludes Reddy Group from declaring any dividends if an event of default under the Credit Facility has occurred and is continuing. In particular, it will be an event of default if Reddy Group's leverage ratio exceeds 4.0 to 1.0 or Reddy Group's interest coverage ratio is less than 3.25 to 1.0.
The Credit Facility contains financial covenants, which include the maintenance of certain financial ratios, as defined in the Credit Facility, and is collateralized by substantially all of Reddy Group's assets and the capital stock of all of its subsidiaries. Reddy Holdings guarantees the Credit Facility and such guarantee is secured by the capital stock of Reddy Group. At December 31, 2005, Reddy Group was in compliance with these covenants.
Interest Rate Hedging Agreement. Effective September 12, 2005, Reddy Group entered into an interest rate hedging agreement (the "Hedge") to fix the interest rate on a portion of its Term Loan. The Hedge has a term of three years and ten months and an initial notional balance of $220 million. The notional balance decreases by $20 million on October 12 of each of the next three years, beginning on October 12, 2006. Reddy Group pays a fixed rate of 4.431% on the notional balance outstanding and receives an amount equal to 3-month LIBOR. Any net payable or receivable amount is settled quarterly. If Reddy Group had been required to settle the Hedge as of December 31, 2005, it would have received $2.0 million. The fair value of the Hedge is included in the caption "Other Assets" in the consolidated balance sheet. Changes in the fair value of the Hedge are recorded as "Other Comprehensive Income" in the consolidated statement of stockholders' equity. Reddy Group is exposed to risk of loss in the event of non-performance by the counterparty to the Hedge; however, it does not anticipate non-performance by the counterparty.
At December 31, 2005 and 2004, long-term obligations consisted of the following:
| | Successor December 31, | |||||||
|---|---|---|---|---|---|---|---|---|
| | 2005 | 2004 | ||||||
| | (in thousands) | |||||||
| Credit Facility—Term Loans | $ | 240,000 | $ | 177,750 | ||||
| 101/2% Senior Discount Notes | 150,500 | 151,000 | ||||||
| Less: unamortized debt discount on 101/2% Senior Discount Notes | (37,846 | ) | (48,957 | ) | ||||
| 87/8% Senior Subordinated Notes | — | 152,000 | ||||||
| Less: unamortized debt discount on 87/8% Senior Subordinated Notes | — | (879 | ) | |||||
| Other | 306 | 347 | ||||||
| Total long-term obligations | 352,960 | 431,261 | ||||||
| Less: current maturities | 65 | 1,869 | ||||||
| Long-term obligation, net of current maturities | $ | 352,895 | $ | 429,392 | ||||
F-22
As of December 31, 2005, principal maturities of long-term obligations for the next five years are as follows (dollars in thousands):
2006 | $ | 65 | |
2007 | 75 | ||
2008 | 40 | ||
2009 | 21 | ||
2010 | 22 | ||
2011 and thereafter | 352,737 | ||
Total | $ | 352,960 | |
9. NOTES PAYABLE
At December 31, 2004, notes payable consisted of premium financing notes related to certain of the Company's insurance policies. The notes bore interest at a weighted average interest rate of 4.4%, had terms under twelve months and matured at various dates from March 2005 through June 2005. In February 2005, an additional note payable was issued for $0.09 million, which bore interest at 4.25% and matured in December 2005.
10. INCOME TAXES
The Company reported a loss for tax return purposes during the year ended December 31, 2005 and a taxable profit during the year ended December 31, 2004. It incurred a loss for tax return purposes for the period May 8, 2003 (Date of Inception) to December 31, 2003. The Predecessor incurred tax losses for the period from January 1, 2003 to August 14, 2003. The total provision for income taxes varied from the U.S. federal statutory rate due to the following:
| | Successor | Predecessor | ||||||||||||
|---|---|---|---|---|---|---|---|---|---|---|---|---|---|---|
| | Year Ended December 31, | May 8, 2003 (Date of Inception) to December 31, 2003 | | |||||||||||
| | January 1 to August 14, 2003 | |||||||||||||
| | 2005 | 2004 | ||||||||||||
| | (in thousands) | |||||||||||||
| Federal income tax benefit (expense) at statutory rate | $ | 6,777 | $ | (9,466 | ) | $ | (942 | ) | $ | (1,892 | ) | |||
| State income tax benefit (expense), net of federal income tax benefits | 767 | (838 | ) | (91 | ) | (184 | ) | |||||||
| Decrease in valuation allowance | — | — | — | 2,104 | ||||||||||
| Current expiration of state net operating loss carryforwards | (179 | ) | — | — | — | |||||||||
| Non-deductible expenses and other | (117 | ) | (190 | ) | (20 | ) | (28 | ) | ||||||
| Total income tax benefit (expense) | $ | 7,248 | $ | (10,494 | ) | $ | (1,053 | ) | $ | — | ||||
F-23
The income tax benefit (expense) for the years ended December 31, 2005 and 2004 and the period from May 8, 2003 (Date of Inception) to December 31, 2003 is composed of the following:
| | Successor | |||||||||
|---|---|---|---|---|---|---|---|---|---|---|
| | Year Ended December 31, | May 8, 2003 (Date of Inception) to December 31, 2003 | ||||||||
| | 2005 | 2004 | ||||||||
| | | (in thousands) | ||||||||
| Current tax benefit (expense) | $ | 133 | $ | (318 | ) | $ | — | |||
| Deferred tax benefit (expense) | 7,115 | (10,176 | ) | (1,053 | ) | |||||
| Total tax benefit (expense) | $ | 7,248 | $ | (10,494 | ) | $ | (1,053 | ) | ||
Deferred tax assets and liabilities computed at the statutory rate related to temporary differences were as follows:
| | Successor December 31, | ||||||||
|---|---|---|---|---|---|---|---|---|---|
| | 2005 | 2004 | |||||||
| | (in thousands) | ||||||||
| Total current deferred tax assets—other assets | $ | 2,740 | $ | 2,174 | |||||
| Deferred non-current tax assets (liabilities): | |||||||||
| Intangible assets, including goodwill, customer lists and trade names | $ | (38,198 | ) | $ | (39,562 | ) | |||
| Property & equipment | (40,279 | ) | (40,315 | ) | |||||
| Net operating loss carryforwards | 46,453 | 41,698 | |||||||
| Other assets | 4,649 | 1,065 | |||||||
| Total non-current deferred tax liabilities, net | (27,375 | ) | (37,114 | ) | |||||
| Valuation allowance for net operating loss carryforwards | (838 | ) | — | ||||||
| Total non-current deferred tax liabilities, net | $ | (28,213 | ) | $ | (37,114 | ) | |||
| Total deferred tax liabilities, net | $ | (25,473 | ) | $ | (34,940 | ) | |||
As a result of purchase accounting applied in connection with the acquisitions of Packaged Ice and Triangle Ice in 2003, net deferred tax liabilities of $59.1 million were recorded. This amount was primarily due to basis differences related to the allocation of purchase price to fixed assets and the recording of customer lists and trade name.
At December 31, 2005, the Company had approximately $122 million of Federal net operating loss ("NOL") carryforwards, $38 million and $84 million of which are attributable to the Successor and Predecessor, respectively. The NOL carryforwards expire between 2011 and 2025. There is an annual limitation on the utilization of the Federal NOL carryforwards generated by the Predecessor due to an ownership change, as defined by Section 382 of the Internal Revenue Code, as amended. At December 31, 2003, due to the uncertainty of being able to utilize the Predecessor's NOL carryforwards to reduce future taxes, a valuation allowance of $34.9 million was provided to reduce to zero the deferred tax asset resulting from the Predecessor's NOL carryforwards. Based on results for 2004 and other evidence related to the future use of the Predecessor's NOL carryforwards, management believed that it was more likely than not that Predecessor NOL carryforwards would be fully utilized. Accordingly, the valuation allowance on such NOL carryforwards was removed at December 31, 2004, with an offsetting decrease to goodwill. In connection with its initial public offering on August 12, 2005 (see Note 11), the Company experienced another
F-24
change in ownership for tax purposes. As a result, the Company's ability to use the Predecessor's and Successor's Federal NOL carryforwards are subject to an additional limitation. The new limitation is not expected to have a material impact on the Company's ability to utilize such NOL carryforwards. A valuation allowance of $0.8 million was recorded in the year ended December 31, 2005 to reduce state NOL carryforwards to the amount that management believes is more likely than not to be utilized.
During the year ended December 31, 2005, the Company recorded a $2.2 million credit to additional paid in capital, with an offsetting increase to the NOL carryforward, to reflect the tax benefit of deductions related to the exercise of employee stock options in March and August 2005.
11. CAPITAL STOCK
Common Stock. Reddy Holdings is authorized to issue up to 75,000,000 shares of common stock, par value $0.01 per share. Holders of Reddy Holdings' common stock are entitled to one vote per share on all matters to be voted on by stockholders and are entitled to receive dividends, if any, as may be declared from time to time by the Board of Directors of Reddy Holdings. Upon any liquidation or dissolution of Reddy Holdings, the holders of common stock are entitled, subject to any preferential rights of the holders of preferred stock, to receive a pro rata share of all of the assets remaining available for distribution to stockholders after payment of all liabilities.
On May 12, 2003, Reddy Holdings entered into an Investor Subscription Agreement with Trimaran, BSMB and certain members of the Predecessor's senior management group pursuant to which they agreed to purchase 12,978,900 shares of common stock for $7.25 per share. The proceeds were contributed to Cube to fund a portion of the acquisition of Packaged Ice on August 15, 2003 (see Notes 1 and 3). On November 3, 2003, Reddy Holdings entered into a second Investor Subscription Agreement with Trimaran, BSMB and certain members of Reddy Holdings' senior management group pursuant to which they agreed to purchase an additional 690,000 shares of common stock for $7.25 per share, the proceeds of which were used to fund a portion of the acquisition of Triangle Ice (see Note 3).
On February 11, 2005, Reddy Holdings filed a registration statement on Form S-1 with the SEC for a proposed initial public offering ("IPO") of its common stock. The registration statement was declared effective by the SEC on August 10, 2005 and the offering was completed at a public offering price of $18.50 per share. A portion of the shares were sold by Reddy Holdings and a portion were sold by certain of Reddy Holdings' stockholders. The number of shares offered by Reddy Holdings and the selling stockholders was 6,911,765 and 3,288,235, respectively. The selling stockholders also granted the underwriters a 30-day option to purchase up to 1,530,000 additional shares to cover any over-allotments. The underwriters' over-allotment option was exercised on August 11, 2005. Reddy Holdings received proceeds from the offering, net of issuance costs, of $116.2 million on August 12, 2005.
On March 17, 2005, certain employees exercised stock options granted under the 2003 Stock Option Plan to purchase 248,198 shares of Reddy Holdings' common stock for an aggregate purchase price of approximately $1.8 million. On August 8, 2005, Reddy Holdings amended the 2003 Stock Option Plan to accelerate the schedule for vesting of time-based options, immediately vest all outstanding performance-based options, allow unvested options to be exercised for restricted stock with identical vesting schedules and provide for accelerated vesting of options upon the termination of an option holder's employment under certain circumstances. A charge of $0.5 million was recorded in "Operating Expenses" in the consolidated statements of operations in connection with the acceleration of vesting schedules. On August 12, 2005, certain employees and directors performed a cashless exercise of stock options granted under the 2003 Stock Option Plan, which resulted in the issuance of 808,818 shares of common stock, 465,651 of which were restricted shares. In accordance with the 2003 Stock
F-25
Option Plan, as amended, restricted shares vest on the following schedule: 40% on February 28, 2006, 40% on January 16, 2007 and 20% on July 1, 2007.
Also in connection with the IPO and the related transactions, the Company incurred $6.2 million of expenses related to payments to BSMB and Trimaran in connection with the termination of the management services agreement ($4.0 million), transaction bonuses to certain employees ($1.8 million) and other fees and expenses ($0.4 million). Included in the transaction bonuses is $0.5 million of compensation expense related to the issuance of 25,817 shares of common stock.
On August 11, 2005, the board of directors of Reddy Holdings declared a dividend of $0.20788 per share, or $4.5 million in total, payable on October 17, 2005 to stockholders of record on September 30, 2005. On December 15, 2005, the board of directors of Reddy Holdings declared a dividend of $0.3825 per share, or $8.3 million in total, payable on January 17, 2006 to stockholders of record on December 30, 2005.
Preferred Stock. Reddy Holdings is authorized to issue up to 25,000,000 shares of $0.01 par value preferred stock, all of which is currently undesignated. Pursuant to the same Investor Subscription Agreements discussed above, 99,050 shares of Series A Cumulative Redeemable Preferred Stock ("Series A Preferred Stock") were subscribed for on May 12, 2003 and November 3, 2003 and were valued at $1,000 per share. The liquidation preference per share of the Series A Preferred Stock was equal to the sum of (a) $1,000 plus (b) the amount of all accumulated but unpaid dividends on such shares. The holders of the outstanding shares of Series A Preferred Stock immediately preceding the dividend payment date were entitled to receive dividends, as declared by Reddy Holdings' Board of Directors, at a rate per annum equal to 12% of the liquidation amount per share. All dividends were cumulative, whether or not earned or declared, accruing on a daily basis from the issue date and were payable in cash quarterly in arrears on each dividend payment date commencing on November 15, 2003. If Reddy Holdings did not pay the cash dividends on a quarterly basis, all unpaid dividends were to be added to the liquidation amount in respect of such shares on each dividend payment date. If Reddy Holdings failed to make a liquidation payment following the occurrence of a liquidation event or default, as defined in the certificate of designations, the per annum dividend rate would have been increased by 2% per annum during the continuation of any such event or default. In the event of liquidation, the holders of the Series A Preferred Stock would have been entitled to an amount in cash equal to the liquidation amount for each share. The Company was entitled to redeem the Series A shares at its option in whole at any time or in part from time to time, subject to restrictions set forth in the certificate of designations. Series A holders are not entitled or permitted to vote on any matter upon which the holders of common stock are required or permitted to vote.
On October 27, 2004, Reddy Holdings issued $151 million in aggregate principal amount at maturity of its 101/2% Senior Discount Notes (see Note 5). Reddy Holdings used the net proceeds of the Discount Notes offering, together with an approximately $28.4 million dividend from Reddy Group, to redeem all of Reddy Holdings' outstanding Series A Preferred Stock (99,175 shares) for an aggregate liquidation amount of $114.2 million and to pay a dividend of $10.4 million on its common stock. In connection with these events, Reddy Group made a special transaction payment of approximately $1.2 million in the aggregate to certain members of management and certain directors.
In connection with the merger on August 15, 2003 and the Triangle Ice acquisition on November 6, 2003, fees of $7.6 million and $1.3 million, respectively, were paid to the holders of the Company's Series A Preferred Stock and common stock. Such amounts were reflected as immediate distributions to the stockholders of the Company and have been recorded as reductions of additional paid-in capital.
Prior to the merger on August 14, 2003, the Predecessor's board of directors had authorized the designation of 500,000 shares of $0.01 par value 10% exchangeable preferred stock. Holders of the 10% exchangeable preferred stock were entitled to receive dividends equal to 10% of the liquidation preference of $100 per share, and all
F-26
dividends were fully cumulative. Dividends could be paid in cash or in kind by issuing a number of additional shares of the 10% exchangeable preferred stock. All dividends were paid in kind as the Predecessor's debt agreements prohibited the payment of cash dividends. In kind dividends for the period from January 1, 2003 to August 14, 2003 totaled 32,399 shares of 10% exchangeable preferred stock. The 10% exchangeable preferred stock was redeemed in connection with the purchase of Packaged Ice on August 15, 2003 (see Notes 1 and 3).
12. EMPLOYEE BENEFIT PLANS
401(k) Plan. The Company has a 401(k) defined contribution savings plan for the benefit of all employees who have completed one year of service and have met the eligibility requirements to participate. Employees may contribute up to the maximum amount allowed by the Internal Revenue Service, while Company contributions are made at the discretion of the Board of Directors. The Company contributed $257,000, $239,000 and $66,000 during the years ended December 31, 2005 and 2004 and the period from May 8, 2003 (Date of Inception) to December 31, 2003, respectively. Contributions by the Predecessor for the period from January 1 to August 14, 2003 were $125,000.
2005 Equity Incentive Plan. On August 8, 2005, the board of directors and stockholders of Reddy Holdings approved the 2005 Equity Incentive Plan. Under the 2005 Equity Incentive Plan, up to 750,000 shares of common stock may be issued to employees, directors and certain third parties in connection with various incentive awards, including stock options, restricted shares and restricted share units. On October 18, 2005, Reddy Holdings filed a Registration Statement on Form S-8 with the SEC to cover the reoffer and resale of up to 750,000 shares of Reddy Holdings' common stock that Reddy Holdings may issue in the future to participants in the 2005 Equity Incentive Plan.
On November 3, 2005, 9,300 unrestricted common shares were granted to certain employees under the 2005 Equity Incentive Plan. On that same date, 682,000 restricted share units ("RSUs") were granted to certain employees and the independent directors of Reddy Holdings. On November 15, 2005, an additional 10,000 RSUs were granted to certain employees and a newly appointed independent director of Reddy Holdings. Each RSU provides for the grant of one share of unrestricted common stock on the date that the vesting terms of each RSU is satisfied.
Fifty percent of each award of RSUs (the "Time-vested RSUs") will vest in four equal annual installments beginning on August 12, 2006 and continuing on August 12 of each of the following three years, provided the recipient remains employed with the Company through such vesting dates. The remaining fifty percent of each award of RSUs (the "Performance-vested RSUs") will vest in four equal annual installments beginning on August 12, 2006 and continuing on August 12 of each of the following three years, provided the recipient remains employed with the Company through such vesting dates and the applicable performance condition for the applicable vesting period is met. The performance condition for each vesting period will be based on the Company's earned distributable cash per share (as defined in the related restricted share unit agreement) for such vesting period. Each vesting period will begin on July 1 and end on June 30 of the subsequent year. All RSUs will immediately vest in full, and shares will be distributed, at the time of a Change in Control (as defined in the 2005 Equity Incentive Plan). If in any performance period the performance condition for a subsequent performance period is achieved, Performance-vested RSUs will be entitled to dividend equivalent rights in the subsequent performance period equal to the dividends which would be payable on the shares of common stock represented by the RSUs subject to vesting in that period. Payments of such dividend equivalents will be made in cash to the holders of RSUs at the time of actual dividend payments and will not be subject to vesting. Time-vested RSUs will not be entitled to dividend equivalent rights.
F-27
Compensation expense associated with the 2005 Equity Incentive Plan was $0.8 million during the year ended December 31, 2005. Such compensation expense was recorded in "Operating Expenses" in the consolidated statements of operations. Twenty-five percent of the Time-vested RSUs are being expensed during each period ending August 12 in 2006 to 2009. Performance-vested RSUs are being expensed on the same basis as it is management's belief that the performance condition for each period will be met. The weighted average grant-date fair value of the RSUs granted in 2005 was $17.90 per share. The fair value per share was estimated as the closing market price on the date of grant less the present value of dividends expected to be paid during the vesting period. The following weighted average assumptions were used:
| Market value per share at grant date | $ | 21.13 | ||
| Expected quarterly cash dividend per share | $ | 0.3825 | ||
| Discount rate | 4.22 | % | ||
| Vesting period | 4 years |
2003 Stock Option Plan. During 2003, the board of directors approved the 2003 Stock Option Plan that reserved for issuance 1,555,150 shares of common stock, subject to adjustment under certain circumstances. In connection with the acquisition of Triangle Ice (see Note 3), an additional 82,662 shares of common stock were reserved for issuance under the 2003 Stock Option Plan. This plan provides for the granting of incentive awards in the form of stock options to directors, officers and employees of the Company or any of its subsidiaries and affiliates at the discretion of the Compensation Committee of the Board of Directors. The options issued included both time-based and performance-based options. In general, the time-based options vested 20% per year, with the initial vesting of 20% occurring on the first day of the calendar year following the year of grant. The performance based options were to vest in three tranches based on achieving certain corporate performance targets. All options granted pursuant to the 2003 Stock Option Plan were to expire ten years after the date of grant.
The 2003 Stock Option Plan was amended on August 8, 2005 (see Note 11). On August 12, 2005, all outstanding options under the 2003 Stock Option Plan were exercised in exchange for restricted shares (see Note 11). At December 31, 2005, 56,117 shares of common stock were reserved for issuance under the 2003 Stock Option Plan. The Company does not intend to make any additional grants under this plan. Compensation expense associated with the 2003 Stock Option Plan was $1.1 million during the year ended December 31, 2005, excluding the effect of the acceleration of vesting schedules discussed in Note 11. Such compensation expense was recorded in "Operating Expenses" in the consolidated statements of operations.
F-28
The following table indicates share and exercise price information with respect to the 2003 Stock Option Plan for the years ended December 31, 2005 and 2004 and the period from May 8, 2003 (Date of Inception) to December 31, 2003:
| | Year Ended December 31, | | | ||||||||||||
|---|---|---|---|---|---|---|---|---|---|---|---|---|---|---|---|
| | May 8, 2003 (Date of Inception) to December 31, 2003 | ||||||||||||||
| | 2005 | 2004 | |||||||||||||
| | Shares | Weighted Average Exercise Price | Shares | Weighted Average Exercise Price | Shares | Weighted Average Exercise Price | |||||||||
| Outstanding at beginning of year | 1,577,845 | $ | 7.25 | 1,561,285 | $ | 7.25 | — | $ | — | ||||||
| Granted | — | — | 49,087 | 7.25 | 1,592,170 | 7.25 | |||||||||
| Exercised | (1,577,845 | ) | 7.25 | — | — | — | — | ||||||||
| Forfeited | — | — | (32,527 | ) | 7.25 | (30,885 | ) | 7.25 | |||||||
| Outstanding at end of year | — | — | 1,577,845 | $ | 7.25 | 1,561,285 | $ | 7.25 | |||||||
| Weighted average fair value of options granted during the year | $ | — | $ | 6.67 | $ | 2.78 | |||||||||
The "Black-Scholes" method was used to determine the fair value of options granted in the year ended December 31, 2004 and the period from May 8, 2003 (Date of Inception) to December 31, 2003. The Black-Scholes calculations used the following weighted average assumptions:
| | Successor | ||||
|---|---|---|---|---|---|
| | Year Ended December 31, 2004 | May 8, 2003 (Date of Inception) to December 31, 2003 | |||
| Dividend yield | 0.00 | % | 0.00 | % | |
| Volatility | 0.00 | % | 0.00 | % | |
| Risk free interest rate | 4.24 | % | 4.48 | % | |
| Expected lives | 10 years | 10 years | |||
13. RELATED PARTIES
Trimaran and BSMB were party to a Monitoring and Management Services Agreement (the "Monitoring Agreement") pursuant to which they were engaged to provide monitoring and management services to the Company with respect to financial and operating matters. At the closing of the merger in August 2003, Trimaran and BSMB collectively received a financing fee equal to $7.5 million. They also received an annual fee for ongoing monitoring and management services equal to $0.5 million per annum in the aggregate, which was subject to adjustment in certain circumstances. The Monitoring Agreement also provided that Trimaran and BSMB were to be reimbursed for reasonable out-of-pocket expenses in connection with activities undertaken pursuant to the agreement.
Trimaran and BSMB also rendered additional services in connection with acquisitions, divestitures and financings pursuant to the Management Agreement. In connection with these services, they earned a fee equal to 2% of the value of any such transaction if additional equity is invested. In connection with the Triangle Ice
F-29
acquisition, Trimaran and BSMB received fees totaling $1.3 million. In addition, the annual monitoring and management services fee will be increased in connection with acquisitions by an amount equal to 1% of the trailing twelve-month pro forma EBITDA (as defined in the Monitoring Agreement) of acquired businesses. Trimaran and BSMB collectively earned monitoring and management services fees of $0.4 million, $0.6 million and $0.2 million during the years ended December 31, 2005 and 2004 and the period from May 8, 2003 to December 31, 2003, respectively. In connection with the IPO and the related transactions, the Company paid BSMB and Trimaran $4.0 million in the aggregate to terminate the Management Agreement (see Note 11).
The Company is one of several portfolio companies in which BSMB has an interest. In 2004, BSMB initiated a process to identify areas where cost savings may be achieved by its portfolio companies by coordinating the purchases activities of such companies to take advantage of volume purchase discounts that would otherwise not be available to the Company if it were acting independently. In connection with this undertaking, BSMB entered into consulting arrangements with individuals and consulting firms. The consulting fees are charged to BSMB's portfolio companies based on each company's pro rata share of the overall cost savings achieved. As of December 31, 2005, based on information received from BSMB, it is estimated that the Company's share of the consulting fees will be approximately $0.2 million. The Company has recorded a charge for such consulting services in "Operating Expenses" in the consolidated statement of operations for the year ended December 31, 2005.
Certain participants in the Trimaran investment program are affiliated with Canadian Imperial Bank of Commerce and BSMB is affiliated with Bear Stearns Corporate Lending, Inc., who are both lenders to the Credit Facility (see Note 8). In connection with the initial public offering of Reddy Holdings' common stock in August 2005, affiliates of BSMB and Trimaran received an aggregate payment of $3.1 million as compensation for their roles as underwriters for the initial public offering.
Reddy Holdings issued 34,500 shares of restricted common stock and 250 shares of restricted preferred stock valued at an aggregate $0.5 million at the time of issuance to certain members of the Predecessor's senior management on August 14, 2003. The shares vest on the third anniversary of the closing of the merger provided that the grantees are still employed by Reddy Holdings. Compensation expense is being recognized through the amortization of unearned compensation over the three-year life of the grant. In connection with the redemption of the Series A Preferred Stock in October 2004, the restrictions on all of the restricted preferred stock were lifted and the related unearned compensation was fully recognized.
At closing of the merger in August 2003, certain members of the Predecessor's senior management group received a financing fee totaling $0.1 million. In connection with the acquisition of Triangle Ice in November 2003, certain members of the Company's senior management group received a transaction fee totaling $26,000.
In connection with the issuance of the 101/2% Senior Discount Notes, the redemption of Reddy Holdings' Series A Preferred Stock and the payment of a common dividend (see Note 11), certain members of management and certain directors received a special transaction payment totaling $1.2 million.
14. COMMITMENTS AND CONTINGENCIES
The Company has an agreement to purchase the bagging component of the Ice Factory® from an exclusive manufacturer until a minimum of 3,600 components are purchased; however, the agreement does not require the Company to purchase 3,600 components. From the inception of this agreement through December 31, 2005, the Company has purchased approximately 3,090 components.
The Company has leased certain facilities and equipment. Under these and other operating leases, future minimum annual rentals at December 31, 2005 are approximately $9.5 million in 2006, $7.5 million in 2007,
F-30
$5.6 million in 2008, $4.1 million in 2009, $2.6 million in 2010 and $4.6 million thereafter. Rent expense was $11.6 million, $9.4 million and $3.2 million in the years ended December 31, 2005 and 2004 and the period from May 8, 2003 (Date of Inception) to December 31, 2003, respectively. Rent expense of the Predecessor was $7.5 million from January 1, 2003 to August 14, 2003.
In June 1999, the Predecessor entered into an exclusive supply agreement with a merchandiser manufacturer (the "Supply Agreement") in which it committed to purchase 4,000 merchandisers and/or Ice Factory® merchandisers and a minimum of $1.5 million of replacement parts per twelve-month period commencing June 1, 1999. Effective June 1, 2002, the Supply Agreement was amended to modify certain terms, which included extending the term of the Supply Agreement to May 31, 2012 and reducing the annual merchandiser and replacement parts commitments to 2,000 units and $0.75 million, respectively. The Company was in compliance with the amended Supply Agreement at May 31, 2005 and management believes the Company will be in compliance as of May 31, 2006.
The Company is involved in various claims, lawsuits and proceedings arising in the ordinary course of business. There are uncertainties inherent in the ultimate outcome of such matters and it is impossible to presently determine the ultimate costs that may be incurred. Management believes the resolution of such uncertainties and the incurrence of such costs will not have a material adverse effect on the Company's consolidated financial position, results of operations or cash flows.
The Company has been involved in litigation in connection with a June 2001 ammonia release at its Baton Rouge, Louisiana manufacturing facility. The case, a consolidation of seven lawsuits generally referred to as Wallace Acey, Jr., et al. v. Reddy Ice Corp., was filed in the 19th Judicial District Court, Parish of East Baton Rouge, Louisiana. Plaintiffs, who were certified as a settlement class, alleged injuries primarily consisting of inconvenience, watery eyes and offensive odors. The parties reached an agreement in settlement of all claims in 2004 and, thereafter, pursuant to a Final Order and Judgment issued on January 25, 2005, the court approved the fairness of the settlement and dismissed all claims of the class, with prejudice, effective April 2005. The Company's insurance carrier funded the majority of the settlement and related legal fees. The Company recognized $150,000 of expense in its 2004 results related to its obligation under the settlement. On January 26, 2006, the court issued an order establishing a settlement fund distribution protocol and the Company thereafter transferred the settlement fund to an account administered by the court appointed disbursing agent, thereby fulfilling its final obligation under the order. Pursuant to the terms of the order, the Company has no further obligation to fund the settlement. Management understands that the disbursing agent is in the process of distributing the fund to settlement class members. Management does not believe that the final resolution of this litigation as described above will have a material impact on the Company's business, financial condition or results of operations.
15. SEGMENT INFORMATION
The Company has two reportable segments: (1) ice products and (2) non-ice products and services. Ice products include the manufacture and distribution of packaged ice products through traditional ice manufacturing and delivery and The Ice Factory®, which is a proprietary machine that produces, packages, stores and merchandises ice at the point of sale through an automated, self-contained system. Non-ice products and services include refrigerated warehouses and the manufacturing and distribution of bottled water.
The accounting policies of the segments are the same as those described in Note 2. The Company evaluates the performance of each segment based on earnings before interest, taxes, depreciation, amortization, gain or loss on disposition of assets, impairment of assets, loss on extinguishment of debt and management agreement termination fees and transaction bonuses and expenses ("Segment EBITDA"). Segment assets are not a factor in the evaluation of performance. There were no intersegment sales during any of the periods presented below.
F-31
Segment information for the year ended December 31, 2005 was as follows:
| | Successor | ||||||||
|---|---|---|---|---|---|---|---|---|---|
| | Ice | Non-Ice | Total | ||||||
| | (in thousands) | ||||||||
| Revenues | $ | 304,755 | $ | 15,017 | $ | 319,772 | |||
| Cost of sales (excluding depreciation) | 186,668 | 9,555 | 196,223 | ||||||
| Operating expenses | 40,172 | 1,858 | 42,030 | ||||||
| Segment EBITDA | $ | 77,915 | $ | 3,604 | $ | 81,519 | |||
| Total assets | $ | 578,750 | $ | 25,014 | $ | 603,764 | |||
Segment information for the year ended December 31, 2004 was as follows:
| | Successor | ||||||||
|---|---|---|---|---|---|---|---|---|---|
| | Ice | Non-Ice | Total | ||||||
| | (in thousands) | ||||||||
| Revenues | $ | 268,319 | $ | 17,408 | $ | 285,727 | |||
| Cost of sales (excluding depreciation) | 162,811 | 10,255 | 173,066 | ||||||
| Operating expenses | 35,040 | 1,888 | 36,928 | ||||||
| Segment EBITDA | $ | 70,468 | $ | 5,265 | $ | 75,733 | |||
| Total assets | $ | 554,947 | $ | 33,673 | $ | 588,620 | |||
Segment information for the Company for the period from May 8, 2003 (Date of Inception) to December 31, 2003 was as follows:
| | Successor | ||||||||
|---|---|---|---|---|---|---|---|---|---|
| | Ice | Non-Ice | Total | ||||||
| | (in thousands) | ||||||||
| Revenues | $ | 79,954 | $ | 6,965 | $ | 86,919 | |||
| Cost of sales (excluding depreciation) | 48,867 | 3,865 | 52,732 | ||||||
| Operating expenses | 12,509 | 921 | 13,430 | ||||||
| Segment EBITDA | $ | 18,578 | $ | 2,179 | $ | 20,757 | |||
| Total assets | $ | 580,331 | $ | 34,005 | $ | 614,336 | |||
F-32
Segment information for the Predecessor for the period from January 1, 2003 to August 14, 2003 was as follows:
| | Predecessor | ||||||||
|---|---|---|---|---|---|---|---|---|---|
| | Ice | Non-Ice | Total | ||||||
| | (in thousands) | ||||||||
| Revenues | $ | 139,618 | $ | 11,651 | $ | 151,269 | |||
| Cost of sales (excluding depreciation) | 84,384 | 7,258 | 91,642 | ||||||
| Operating expenses | 17,051 | 1,547 | 18,598 | ||||||
| Other income, net | 108 | 8 | 116 | ||||||
| Segment EBITDA | $ | 38,291 | $ | 2,854 | $ | 41,145 | |||
| Total assets | $ | 333,283 | $ | 25,703 | $ | 358,986 | |||
A reconciliation of total Segment EBITDA to net income (loss) for the years ended December 31, 2005 and 2004, the period from May 8, 2003 (Date of Inception) to December 31, 2003 and the period from January 1, 2003 to August 14, 2003 was as follows:
| | Successor | Predecessor | |||||||||||
|---|---|---|---|---|---|---|---|---|---|---|---|---|---|
| | Year Ended December 31, | May 8, 2003 (Date of Inception) to December 31, 2003 | | ||||||||||
| | January 1 to August 14, 2003 | ||||||||||||
| | 2005 | 2004 | |||||||||||
| | (in thousands) | ||||||||||||
| Total Segment EBITDA | $ | 81,519 | $ | 75,733 | $ | 20,757 | $ | 41,145 | |||||
| Depreciation expense related to cost of sales | (18,838 | ) | (17,850 | ) | (5,883 | ) | (10,881 | ) | |||||
| Depreciation and amortization expense | (5,691 | ) | (5,335 | ) | (1,733 | ) | (3,647 | ) | |||||
| Gain (loss) on disposition of assets | (1,848 | ) | (398 | ) | — | 11 | |||||||
| Impairment of assets | (5,725 | ) | — | — | — | ||||||||
| Management agreement termination fees and transaction bonuses and expenses | (6,171 | ) | — | — | — | ||||||||
| Loss on extinguishment of debt | (28,189 | ) | — | — | — | ||||||||
| Interest expense | (34,421 | ) | (25,105 | ) | (10,370 | ) | (21,063 | ) | |||||
| Income tax benefit (expense) | 7,248 | (10,494 | ) | (1,053 | ) | — | |||||||
| Net income (loss) | $ | (12,116 | ) | $ | 16,551 | $ | 1,718 | $ | 5,565 | ||||
Revenues from one group of affiliated customers in the Company's ice segment represented approximately 11%, 10% and 9% of the Company's consolidated revenues in 2005, 2004 and 2003, respectively.
16. QUARTERLY INFORMATION (UNAUDITED)
The following table summarizes the unaudited quarterly information for the years ended December 31, 2005 and 2004, the period from May 8, 2003 (Date of Inception) to December 31, 2003 and the period from January 1, 2003 to August 14, 2003. In the opinion of management, all adjustments necessary for a fair presentation of the unaudited results for the periods are included.
F-33
For the year ended December 31, 2005:
| | Successor | Predecessor | ||||||||||||||
|---|---|---|---|---|---|---|---|---|---|---|---|---|---|---|---|---|
| | 1st | 2nd | 3rd | 4th | Year | |||||||||||
| | (in thousands) | |||||||||||||||
| Revenues | $ | 39,244 | $ | 93,123 | $ | 126,562 | $ | 60,843 | $ | 319,772 | ||||||
| Gross profit | 2,824 | 35,290 | 52,773 | 13,824 | 104,711 | |||||||||||
| Net income (loss) available to common stockholders | (10,180 | ) | 5,395 | (3,093 | ) | (4,238 | ) | (12,116 | ) | |||||||
For the year ended December 31, 2004:
| | Successor | ||||||||||||||
|---|---|---|---|---|---|---|---|---|---|---|---|---|---|---|---|
| | 1st | 2nd | 3rd | 4th | Year | ||||||||||
| | (in thousands) | ||||||||||||||
| Revenues | $ | 37,380 | $ | 88,529 | $ | 106,507 | $ | 53,311 | $ | 285,727 | |||||
| Gross profit | 4,372 | 34,054 | 43,091 | 13,294 | 94,811 | ||||||||||
| Net income (loss) available to common stockholders | (14,789 | ) | 12,164 | 13,233 | (4,640 | ) | 5,968 | ||||||||
For the period from May 8, 2003 (Date of Inception) to December 31, 2003:
| | Successor | |||||||||||||||
|---|---|---|---|---|---|---|---|---|---|---|---|---|---|---|---|---|
| | 1st | 2nd | 3rd | 4th | Year | |||||||||||
| | (in thousands) | |||||||||||||||
| Revenues | $ | — | $ | — | $ | 38,641 | $ | 48,278 | $ | 86,919 | ||||||
| Gross profit | — | — | 15,283 | 13,021 | 28,304 | |||||||||||
| Net income (loss) available to common stockholders | — | — | 5,358 | (8,071 | ) | (2,713 | ) | |||||||||
For the period from January 1, 2003 to August 14, 2003:
| | Predecessor | ||||||||||||||
|---|---|---|---|---|---|---|---|---|---|---|---|---|---|---|---|
| | 1st | 2nd | 3rd | 4th | Year | ||||||||||
| | (in thousands) | ||||||||||||||
| Revenues | $ | 32,567 | $ | 70,749 | $ | 47,953 | $ | — | $ | 151,269 | |||||
| Gross profit | 2,463 | 25,787 | 20,496 | — | 48,476 | ||||||||||
| Net income (loss) available to common stockholders | (15,714 | ) | 7,455 | 11,258 | — | 2,999 | |||||||||
17. SUBSEQUENT EVENTS
During January 2006, the Company completed the acquisitions of two ice companies for an aggregate cash purchase price of approximately $1.4 million. Annual revenues associated with the acquisitions is approximately $1 million.
On February 28, 2006, the Company purchased 51,256 shares of common stock from certain members of management for $1.0 million to provide the employees with funds to satisfy their statutory federal and state tax withholding obligations related to the vesting of shares of restricted stock issued under the 2003 Stock Option Plan. The purchase price was $20.20 per share, the closing market price on February 28, 2006.
F-34
REDDY ICE HOLDINGS, INC. AND SUBSIDIARY
CONDENSED CONSOLIDATED BALANCE SHEETS
(Unaudited)
| | March 31, 2006 | |||||
|---|---|---|---|---|---|---|
| | (in thousands, except share data) | |||||
| ASSETS | ||||||
| CURRENT ASSETS: | ||||||
| Cash and cash equivalents | $ | 10,265 | ||||
| Accounts receivable, net | 21,955 | |||||
| Inventories | 12,425 | |||||
| Prepaid expenses | 2,466 | |||||
| Deferred tax assets | 2,484 | |||||
| Total current assets | 49,595 | |||||
| PROPERTY AND EQUIPMENT, net | 230,414 | |||||
| GOODWILL | 215,334 | |||||
| OTHER INTANGIBLES, net | 81,231 | |||||
| OTHER ASSETS | 4,266 | |||||
| TOTAL | $ | 580,840 | ||||
| LIABILITIES AND STOCKHOLDERS' EQUITY | ||||||
| CURRENT LIABILITIES: | ||||||
| Current portion of long-term obligations | $ | 73 | ||||
| Revolving credit facility | — | |||||
| Accounts payable | 10,964 | |||||
| Accrued expenses | 14,375 | |||||
| Dividends payable | 8,276 | |||||
| Total current liabilities | 33,688 | |||||
| LONG-TERM OBLIGATIONS | 355,776 | |||||
| DEFERRED TAX LIABILITIES, net | 22,302 | |||||
| COMMITMENTS AND CONTINGENCIES (Note 10) | — | |||||
| STOCKHOLDERS' EQUITY: | ||||||
| Common stock, $0.01 par value; 75,00,000 shares authorized; 21,637,020 shares issued and outstanding at March 31, 2006 | 216 | |||||
| Additional paid-in capital | 213,255 | |||||
| Unearned compensation | — | |||||
| Accumulated deficit | (48,580 | ) | ||||
| Accumulated other comprehensive income | 4,183 | |||||
| Total stockholders' equity | 169,074 | |||||
| TOTAL | $ | 580,840 | ||||
See notes to condensed consolidated financial statements.
F-35
REDDY ICE HOLDINGS, INC. AND SUBSIDIARY
CONDENSED CONSOLIDATED STATEMENTS OF OPERATIONS
(Unaudited)
| | Three Months Ended March 31, | |||||||
|---|---|---|---|---|---|---|---|---|
| | 2006 | 2005 | ||||||
| | (in thousands, except per share amounts) | |||||||
| Revenues | $ | 44,808 | $ | 39,244 | ||||
| Cost of sales (excluding depreciation) | 34,413 | 31,679 | ||||||
| Depreciation expense related to cost of sales | 4,714 | 4,741 | ||||||
| Gross profit | 5,681 | 2,824 | ||||||
| Operating expenses | 11,089 | 8,834 | ||||||
| Depreciation and amortization expense | 1,428 | 1,415 | ||||||
| Loss on dispositions of assets | 104 | 149 | ||||||
| Loss from operations | (6,940 | ) | (7,574 | ) | ||||
| Interest expense | 6,954 | 9,308 | ||||||
| Loss before income taxes | (13,894 | ) | (16,882 | ) | ||||
| Income tax benefit | 5,655 | 6,702 | ||||||
| Net loss | $ | (8,239 | ) | $ | (10,180 | ) | ||
Basic and diluted net loss per share: | ||||||||
| Net loss | $ | (0.39 | ) | $ | (0.74 | ) | ||
| Weighted average common shares outstanding | 21,273 | 13,728 | ||||||
| Cash dividends declared per share | $ | 0.3825 | $ | — | ||||
See notes to condensed consolidated financial statements.
F-36
REDDY ICE HOLDINGS, INC. AND SUBSIDIARY
CONDENSED CONSOLIDATED STATEMENT OF STOCKHOLDERS' EQUITY
(Unaudited)
(in thousands)
| | Common Stock | | | | | | ||||||||||||||||
|---|---|---|---|---|---|---|---|---|---|---|---|---|---|---|---|---|---|---|---|---|---|---|
| | | | | Accumulated Other Comprehensive Income | | |||||||||||||||||
| | Number of Shares | Par Value | Additional Paid-In Capital | Unearned Compensation | Accumulated Deficit | Total | ||||||||||||||||
| Balance at January 1, 2006 | 21,690 | $ | 217 | $ | 213,096 | $ | (52 | ) | $ | (32,065 | ) | $ | 1,987 | $ | 183,183 | |||||||
| Reclassification of unearned compensation upon adoption of SFAS No. 123(R) | — | — | (52 | ) | 52 | — | — | — | ||||||||||||||
| Compensation expense related to stock-based awards | — | — | 1,245 | — | — | — | 1,245 | |||||||||||||||
| Cash dividends declared | — | — | — | — | (8,276 | ) | — | (8,276 | ) | |||||||||||||
| Repurchase and retirement of common stock | (53 | ) | (1 | ) | (1,034 | ) | — | — | — | (1,035 | ) | |||||||||||
| Comprehensive loss: | ||||||||||||||||||||||
| Net loss | — | — | — | — | (8,239 | ) | — | (8,239 | ) | |||||||||||||
| Change in fair value of derivative asset | — | — | — | — | — | 2,196 | 2,196 | |||||||||||||||
| Total comprehensive loss | — | — | — | — | — | — | (6,043 | ) | ||||||||||||||
| Balance at March 31, 2006 | 21,637 | $ | 216 | $ | 213,255 | $ | — | $ | (48,580 | ) | $ | 4,183 | $ | 169,074 | ||||||||
See notes to condensed consolidated financial statements.
F-37
REDDY ICE HOLDINGS, INC. AND SUBSIDIARY
CONDENSED CONSOLIDATED STATEMENTS OF CASH FLOWS
(Unaudited)
| | Three Months Ended March 31, | |||||||||
|---|---|---|---|---|---|---|---|---|---|---|
| | 2006 | 2005 | ||||||||
| | (in thousands) | |||||||||
| CASH FLOWS FROM OPERATING ACTIVITIES: | ||||||||||
| Net loss | $ | (8,239 | ) | $ | (10,180 | ) | ||||
| Adjustments to reconcile net loss to net cash used in operating activities (excluding working capital from acquisitions): | ||||||||||
| Depreciation and amortization expense | 6,142 | 6,156 | ||||||||
| Amortization of debt issue costs and debt discount | 3,271 | 3,373 | ||||||||
| Loss on dispositions of assets | 104 | 149 | ||||||||
| Stock-based compensation expense | 1,245 | 284 | ||||||||
| Deferred taxes | (5,655 | ) | (6,702 | ) | ||||||
| Change in assets and liabilities: | ||||||||||
| Accounts receivable, inventory and prepaid expenses | (980 | ) | 1,008 | |||||||
| Accounts payable, accrued expenses and other | (5,264 | ) | (8,750 | ) | ||||||
| Net cash used in operating activities | (9,376 | ) | (14,662 | ) | ||||||
CASH FLOWS FROM INVESTING ACTIVITIES: | ||||||||||
| Property and equipment additions | (3,957 | ) | (5,729 | ) | ||||||
| Proceeds from dispositions of property and equipment | 353 | 388 | ||||||||
| Cost of acquisitions | (1,404 | ) | — | |||||||
| Net cash used in investing activities | (5,008 | ) | (5,341 | ) | ||||||
CASH FLOWS FROM FINANCING ACTIVITIES: | ||||||||||
| Proceeds from the exercise of employee stock options | — | 1,799 | ||||||||
| Cash dividends paid | (8,296 | ) | — | |||||||
| Repurchase and retirement of common stock | (1,035 | ) | — | |||||||
| Borrowings under the credit facility, net | — | 17,250 | ||||||||
| Repayment of long-term obligations | (17 | ) | (708 | ) | ||||||
| Net cash provided by (used in) financing activities | (9,348 | ) | 18,341 | |||||||
NET DECREASE IN CASH AND CASH EQUIVALENTS | (23,732 | ) | (1,662 | ) | ||||||
| CASH AND CASH EQUIVALENTS, BEGINNING OF PERIOD | 33,997 | 4,478 | ||||||||
| CASH AND CASH EQUIVALENTS, END OF PERIOD | $ | 10,265 | $ | 2,816 | ||||||
| SUPPLEMENTAL DISCLOSURE OF CASH FLOW INFORMATION: | ||||||||||
| Cash payments for interest | $ | 3,739 | $ | 9,332 | ||||||
| Borrowings under the credit facility | $ | 1,700 | $ | 28,100 | ||||||
| Repayments on the credit facility | $ | (1,700 | ) | $ | (10,850 | ) | ||||
| Increase in fair value of derivative | $ | 2,196 | $ | — | ||||||
| Cash dividends declared, not paid | $ | 8,276 | $ | — | ||||||
| Excess tax benefit from vesting of restricted stock | $ | — | $ | 600 | ||||||
| Additions to property and equipment included in accounts payable | $ | 399 | $ | — | ||||||
| Issuance of notes payable | $ | — | $ | 88 | ||||||
See notes to condensed consolidated financial statements.
F-38
REDDY ICE HOLDINGS, INC. AND SUBSIDIARY
NOTES TO CONDENSED CONSOLIDATED FINANCIAL STATEMENTS (Unaudited)
FOR THE THREE MONTHS ENDED MARCH 31, 2006 AND 2005
1. General
The condensed consolidated financial statements of Reddy Ice Holdings, Inc. and its wholly owned subsidiary (together, the "Company") included herein are unaudited; however, the balance sheet as of December 31, 2005 has been derived from the audited financial statements for that date. These financial statements have been prepared by the Company pursuant to the rules and regulations of the Securities and Exchange Commission ("SEC"). As applicable under the SEC's regulations, certain information and footnote disclosures normally included in financial statements prepared in accordance with accounting principles generally accepted in the United States of America have been condensed or omitted. All significant intercompany balances and transactions have been eliminated upon consolidation, and all adjustments which, in the opinion of management, are necessary for a fair presentation of the financial position, results of operations and cash flows for the periods covered have been made and are of a normal and recurring nature. The financial statements included herein should be read in conjunction with the consolidated financial statements and the related notes thereto included in the Company's annual report on Form 10-K for the year ended December 31, 2005. Operating results for the three months ended March 31, 2006 are not necessarily indicative of the results to be achieved for the full year.
Reddy Ice Holdings, Inc., a Delaware corporation ("Reddy Holdings"), and its wholly owned subsidiary, Cube Acquisition Corp. ("Cube"), a Texas corporation, were formed on behalf of Trimaran Fund Management LLC ("Trimaran") and Bear Stearns Merchant Banking ("Bear Stearns") on May 8, 2003 for the purpose of acquiring Packaged Ice, Inc. ("Packaged Ice") and effecting certain capital transactions in connection with such acquisition. On August 15, 2003, Cube merged with and into Packaged Ice, with Packaged Ice being the surviving corporation. As a result of the merger, Packaged Ice was delisted from the American Stock Exchange. Reddy Holdings and Cube conducted no operations during the period from May 8, 2003 through August 14, 2003. In connection with the merger, Packaged Ice was renamed Reddy Ice Group, Inc. ("Reddy Group"). Reddy Holdings and its wholly owned subsidiary, Reddy Group, are referred to collectively herein as the "Company".
On August 12, 2005, Reddy Holdings completed an initial public offering of its common stock (see Note 6). As a result of the offering, Reddy Holdings' common shares are publicly traded on the New York Stock Exchange under the ticker symbol "FRZ".
The Company manufactures and distributes packaged ice products and bottled water and owns and operates refrigerated warehouses. The Company is the largest manufacturer of packaged ice products in the United States. The Company serves approximately 82,000 customer locations in 31 states and the District of Columbia.
On August 2, 2005, the Company effected a 138 for 1 stock split and, in conjunction therewith, amended and restated the Company's certificate of incorporation to increase the number of authorized shares of the Company's common stock and preferred stock. All common share and per common share amounts in these condensed consolidated financial statements prior to August 2, 2005 have been retroactively adjusted for all periods presented to give effect to the stock split, including reclassifying an amount equal to the increase in par value from additional paid-in capital to common stock.
2. Acquisitions
During the three months ended March 31, 2006, the Company purchased two ice companies. Including direct acquisition costs, the total acquisition consideration was $1.4 million. The total purchase price was allocated to the acquired assets and assumed liabilities based upon estimates of their respective fair values as of the respective
F-39
closing dates using valuations and other studies. The following table summarizes the estimated fair values of the assets acquired and the liabilities assumed at the date of acquisition (dollars in millions):
| Total assets acquired | $ | 0.7 | |
| Total liabilities assumed | — | ||
| Net assets acquired | $ | 0.7 | |
The excess of the aggregate purchase price over the net assets acquired of $0.7 million was allocated to goodwill ($0.3 million) and other intangible assets ($0.4 million). Other intangible assets are comprised of customer lists, which are being amortized on a straight line basis over their useful lives of 15 to 30 years.
During 2005, the Company purchased two ice companies for total acquisition consideration of $0.9 million. The results of operations of the 2005 acquisitions are included in the Company's consolidated results of operations from the date of each acquisition, which occurred on August 1, 2005 and September 30, 2005.
The following unaudited pro forma information presents the Company's consolidated results of operations (i) for the three months ended March 31, 2006 as if the 2006 acquisitions had all occurred on January 1, 2006 and (ii) for the three months ended March 31, 2005 as if the 2006 and 2005 acquisitions had all occurred on January 1, 2005:
| | Three Months Ended March 31, | ||||||
|---|---|---|---|---|---|---|---|
| | 2006 | 2005 | |||||
| | (in thousands) | ||||||
| Pro forma revenues | $ | 44,823 | $ | 39,460 | |||
| Pro forma net loss | (8,254 | ) | (10,237 | ) | |||
3. Inventories
Inventories consists of raw materials, supplies and finished goods. Raw materials and supplies consist of ice packaging materials, spare parts, bottled water supplies and merchandiser parts. Finished goods consist of packaged ice and bottled water. Inventories are valued at the lower of cost or market and include overhead allocations. Cost is determined using the first-in, first-out and average cost methods.
| | March 31, 2006 | December 31, 2005 | ||||
|---|---|---|---|---|---|---|
| | (in thousands) | |||||
| Raw materials and supplies | $ | 8,854 | $ | 7,801 | ||
| Finished goods | 3,571 | 2,286 | ||||
| Total | $ | 12,425 | $ | 10,087 | ||
In November 2004, the Financial Accounting Standards Board ("FASB") issued Statement of Financial Accounting Standards ("SFAS") No. 151, "Inventory Costs—an amendment of ARB No. 43, chapter 4". SFAS No. 151 seeks to clarify the accounting for abnormal amounts of idle facility expense, freight, handling costs, and wasted material (spoilage) in the determination of inventory carrying costs. The statement requires such costs to be treated as a current period expense. This statement is effective for fiscal years beginning after July 15, 2005. The
F-40
Company adopted SFAS No. 151 on January 1, 2006. The adoption of SFAS No. 151 did not have a material effect on the Company's results of operations and financial position.
4. Accrued Expenses
| | March 31, 2006 | December 31, 2005 | |||||
|---|---|---|---|---|---|---|---|
| | (in thousands) | ||||||
| Accrued compensation and employee benefits, including payroll taxes and workers' compensation insurance | $ | 6,255 | $ | 9,758 | |||
| Accrued interest | 3,273 | 3,329 | |||||
| Accrued utilities | 1,027 | 1,425 | |||||
| Accrued property, sales and other taxes | 1,112 | 539 | |||||
| Other accrued insurance | 1,411 | 1,940 | |||||
| Other | 1,297 | 1,159 | |||||
| Total | $ | 14,375 | $ | 18,150 | |||
5. Revolving Credit Facility and Long-Term Obligations
101/2% Senior Discount Notes. On October 27, 2004, Reddy Holdings issued $151 million at maturity of 101/2% Senior Discount Notes due 2012 (the "Discount Notes") in a private placement offering. The Discount Notes were sold at 66.333% of the stated principal amount, which resulted in gross proceeds of $100.2 million. The net proceeds of the offering, together with a dividend of approximately $28.4 million from Reddy Group, were used to redeem all of Reddy Holdings' existing series A preferred stock for approximately $99.2 million, to pay accumulated dividends on such stock as of the date of redemption in the amount of approximately $15.0 million and to pay a dividend of approximately $10.4 million to Reddy Holdings' common stockholders. In connection with these transactions, Reddy Group made a special transaction payment of approximately $1.2 million in the aggregate to certain members of management and certain directors.
Each Discount Note had an initial accreted value of $663.33 per $1,000 principal amount at maturity. The accreted value of each Discount Note will increase from the date of issuance until November 1, 2008 at a rate of 101/2% per annum such that the accreted value will equal the stated principal amount at maturity on November 1, 2008. Thereafter, cash interest will accrue and be payable semi-annually at a rate of 101/2% per annum.
The Discount Notes are unsecured obligations of Reddy Holdings and are:
- •
- not guaranteed by any of Reddy Holdings' subsidiaries;
- •
- senior in right of payment to all of Reddy Holdings' future subordinated indebtedness;
- •
- equal in right of payment with any of Reddy Holdings' existing and future unsecured senior indebtedness;
- •
- effectively subordinated to Reddy Holdings' existing and future secured debt, including Reddy Holdings' guarantee of our credit facilities; and
- •
- structurally subordinated to all obligations and preferred equity of Reddy Holdings' subsidiaries.
F-41
The Discount Notes include customary covenants that restrict, among other things, Reddy Holdings' ability to incur additional debt or issue certain preferred stock, pay dividends or redeem, repurchase or retire its capital stock or subordinated indebtedness, make certain investments, create liens, enter into arrangements that restrict dividends from its subsidiaries, merge or sell all or substantially all of its assets or enter into various transactions with affiliates. Prior to November 1, 2007, Reddy Holdings may redeem up to 35% of the principal amount of the Discount Notes at a redemption price of 110.5% of the principal amount thereof, plus accrued and unpaid interest to the date of redemption, with funds raised in equity offerings that are specified in the indenture governing the Discount Notes. From and after November 1, 2008, Reddy Holdings may redeem any or all of the Discount Notes by paying a redemption premium, which is initially 5.25% of the principal amount at maturity of the notes and declines annually to 0% for the period commencing on November 1, 2010 and thereafter. If a change of control occurs prior to November 1, 2007, Reddy Holdings may, at its option, redeem all, but not less than all, of the Discount Notes at a redemption price equal to the sum of (i) the accreted value of the notes as of the redemption date, (ii) a premium equal to 125% of one year's coupon payment and (iii) any accrued and unpaid interest to the date of redemption. If Reddy Holdings experiences a change of control and does not elect to make the optional redemption described in the previous sentence, Reddy Holdings will be required to make an offer to repurchase the Discount Notes at a price equal to 101% of their accreted value, plus accrued and unpaid interest, if any, to the date of purchase. Reddy Holdings may also be required to make an offer to purchase the senior discount notes with proceeds of asset sales that are not reinvested in the Company's business or used to repay other indebtedness.
The Discount Notes were registered with the SEC effective August 26, 2005, pursuant to the Registration Rights Agreement (the "Rights Agreement") entered into at the time of issuance.
On July 28, 2005, Reddy Holdings obtained the requisite consents from the holders of the Discount Notes to amend the definition of "Consolidated Net Income" in the indenture governing the Discount Notes in order to exclude certain one-time costs and expenses associated with Reddy Holdings' initial public offering of its common stock (See Note 6).
On August 26, 2005, Reddy Holdings paid $0.4 million to purchase and retire Discount Notes with an aggregate principal amount at maturity of $0.5 million. A loss of $0.046 million was recognized in connection with this transaction.
87/8% Senior Subordinated Notes. On July 17, 2003, Cube completed the sale of $152 million of 87/8% Senior Subordinated Notes due August 1, 2011 (the "Subordinated Notes") in connection with a private placement offering. The Subordinated Notes were priced at 99.297%, which resulted in gross proceeds of $150.9 million. At the closing of the merger on August 15, 2003 (see Note 1), Reddy Group assumed Cube's obligations under the Subordinated Notes and the related indenture and received the net proceeds of the offering. The net proceeds were used to consummate Reddy Holding's acquisition of Packaged Ice, which included the repayment of the Packaged Ice's $255 million aggregate principal amount of 93/4% Senior Subordinated Notes due February 1, 2005 and the outstanding balance of $61.7 million under its bank credit facility. Interest was payable semiannually on February 1 and August 1, commencing on February 1, 2004. In conjunction with issuance of the Subordinated Notes, $7.0 million of debt issuance costs were incurred. In connection with the closing of Reddy Holdings' initial public offering of its common stock, substantially all the outstanding Subordinated Notes were redeemed (see discussion below in "Credit Facilities" for further information).
Credit Facilities. On August 15, 2003, Reddy Group entered into a $170 million senior secured credit facility, with the lenders being a syndicate of banks, financial institutions and other entities, including Credit Suisse First Boston as Administrative Agent, Canadian Imperial Bank of Commerce and Bear Stearns Corporate Lending, Inc.
F-42
(the "Old Credit Facility"). The Old Credit Facility provided for a six-year term loan in the amount of $135 million (the "Original Term Loan") and a five-year revolving credit facility (the "Old Revolving Credit Facility") in the amount of $35 million. Proceeds of the Original Term Loan were used to consummate the merger as discussed in Note 1. On November 6, 2003, the Old Credit Facility was amended to provide a Supplemental Term Loan (together with the Original Term Loan, referred to as the "Old Term Loans") in the amount of $45 million, the proceeds of which were used to fund a portion of the cost of an acquisition. The Supplemental Term Loan had substantially the same terms as the Original Term Loan.
On August 12, 2005, Reddy Group amended and restated its credit facility with a syndicate of banks, financial institutions and other entities as lenders, including Credit Suisse First Boston, as Administrative Agent, Canadian Imperial Bank of Commerce, Bear Stearns Corporate Lending, Inc. and Lehman Brothers, Inc. (the "Credit Facility"), to increase the maximum amount of the revolving credit facility to $60 million (the "Revolving Credit Facility"), provide for a $240 million term loan (the "Term Loan"), reduce the applicable margins on both the Revolving Credit Facility and Term Loan and extend the maturity of the Revolving Credit Facility to August 12, 2010 and the Term Loan to August 12, 2012. Borrowings under the Revolving Credit Facility and the Term Loan, along with proceeds from the Company's initial public offering (see Note 6), were used to repay the Old Credit Facility, repurchase substantially all of the Company's existing Subordinated Notes and fund other related transactions. A loss on extinguishment of debt of $28.1 million was incurred in connection with these transactions. The loss was due to the payment of tender premiums and consent fees to the holders of the Subordinated Notes ($17.3 million), the write-off of deferred debt costs and original issue discount related to the Subordinated Notes and the Old Credit Facility ($10.6 million) and other fees and expenses ($0.2 million).
At March 31, 2006, the Company had $54.2 million of availability under the Revolving Credit Facility, which was net of outstanding standby letters of credit of $5.8 million. The standby letters of credit are used primarily to secure certain insurance obligations.
Principal balances outstanding under the Credit Facility bear interest per annum, at Reddy Group's option, at the sum of the base rate plus 0.75% or LIBOR plus 1.75%. The base rate is defined as the greater of the prime rate (as announced from time to time by the Administrative Agent) or the federal funds rate plus 0.5%. At March 31, 2006, the weighted average interest rate of borrowings outstanding under the Credit Facility was 6.3%. Interest on base rate loans is payable on the last day of each quarter. Interest on LIBOR loans is payable upon maturity of the LIBOR loan or on the last day of the quarter if the term of the LIBOR loan exceeds 90 days. Reddy Group pays a quarterly fee on the average availability under the Revolving Credit Facility based on an annual rate of 0.5%.
The Revolving Credit Facility and Term Loan do not require any scheduled principal payments prior to their stated maturity dates. Subject to certain conditions, mandatory repayments of the Revolving Credit Facility and Term Loan (and if the Term Loan is no longer outstanding, mandatory commitment reductions of the Revolving Credit Facility) are required to be made with portions of the proceeds from (1) asset sales, (2) the issuance of debt securities and (3) insurance and condemnation awards, subject to various exceptions. In the event of a change in control, as defined in the Credit Facility, an event of default will occur under the Credit Facility. Under the Credit Facility, Reddy Group may only pay dividends to Reddy Holdings if Reddy Group's leverage ratio for the most recently ended fiscal quarter is less than or equal to 3.75 to 1.0. In addition, the Credit Facility precludes Reddy Group from declaring any dividends if an event of default under the Credit Facility has occurred and is continuing. In particular, it will be an event of default if Reddy Group's leverage ratio exceeds 4.0 to 1.0 or Reddy Group's interest coverage ratio is less than 3.25 to 1.0.
F-43
The Credit Facility contains financial covenants, which include the maintenance of certain financial ratios, as defined in the Credit Facility, and is collateralized by substantially all of Reddy Group's assets and the capital stock of all of its subsidiaries. Reddy Holdings guarantees the Credit Facility and such guarantee is secured by the capital stock of Reddy Group. At March 31, 2006, Reddy Group was in compliance with these covenants.
Interest Rate Hedging Agreement. Effective September 12, 2005, Reddy Group entered into an interest rate hedging agreement (the "Hedge") to fix the interest rate on a portion of its Term Loan. The Hedge has a term of three years and ten months and an initial notional balance of $220 million. The notional balance decreases by $20 million on October 12 of each of the next three years, beginning on October 12, 2006. Reddy Group pays a fixed rate of 4.431% on the notional balance outstanding and receives an amount equal to 3-month LIBOR. Any net payable or receivable amount is settled quarterly. If Reddy Group had been required to settle the Hedge as of March 31, 2006, it would have received $4.2 million. The fair value of the Hedge is included in the caption "Other Assets" in the consolidated balance sheet. Changes in the fair value of the Hedge are recorded as "Other Comprehensive Income" in the consolidated statement of stockholders' equity. Reddy Group is exposed to risk of loss in the event of non-performance by the counterparty to the Hedge; however, it does not anticipate non-performance by the counterparty.
At March 31, 2006 and December 31, 2005, long-term obligations consisted of the following:
| | March 31, 2006 | December 31, 2005 | ||||||
|---|---|---|---|---|---|---|---|---|
| | (in thousands) | |||||||
| Credit Facility—Term Loan | $ | 240,000 | $ | 240,000 | ||||
| 101/2% Senior Discount Notes | 150,500 | 150,500 | ||||||
| Less: unamortized debt discount on 101/2% Senior Discount Notes | (34,940 | ) | (37,846 | ) | ||||
| Other | 289 | 306 | ||||||
| Total long-term obligations | 355,849 | 352,960 | ||||||
| Less: current maturities | 73 | 65 | ||||||
| Long-term obligations, net of current maturities | $ | 355,776 | $ | 352,895 | ||||
6. Capital Stock
Common Stock. Reddy Holdings is authorized to issue up to 75,000,000 shares of common stock, par value $0.01 per share. Holders of Reddy Holdings' common stock are entitled to one vote per share on all matters to be voted on by stockholders and are entitled to receive dividends, if any, as may be declared from time to time by the Board of Directors of Reddy Holdings. Upon any liquidation or dissolution of Reddy Holdings, the holders of common stock are entitled, subject to any preferential rights of the holders of preferred stock, to receive a pro rata share of all of the assets remaining available for distribution to stockholders after payment of all liabilities.
On February 11, 2005, Reddy Holdings filed a registration statement on Form S-1 with the SEC for a proposed initial public offering ("IPO") of its common stock. The registration statement was declared effective by the SEC on August 10, 2005 at a public offering price of $18.50 per share. A portion of the shares were sold by Reddy Holdings and a portion were sold by certain of Reddy Holdings' stockholders. The number of shares offered by Reddy Holdings and the selling stockholders was 6,911,765 and 3,288,235, respectively. The selling stockholders also granted the underwriters a 30-day option to purchase up to 1,530,000 additional shares to cover any
F-44
over-allotments. The underwriters' over-allotment option was exercised on August 11, 2005. Reddy Holdings received proceeds from the offering, net of issuance costs, of $116.2 million on August 12, 2005.
On March 17, 2005, certain employees exercised stock options granted under the 2003 Stock Option Plan to purchase 248,198 shares of Reddy Holdings' common stock for an aggregate purchase price of approximately $1.8 million. On August 8, 2005, Reddy Holdings amended the 2003 Stock Option Plan to accelerate the schedule for vesting of time-based options, immediately vest all outstanding performance-based options, allow unvested options to be exercised for restricted stock with identical vesting schedules and provide for accelerated vesting of options upon the termination of an option holder's employment under certain circumstances. During the three months ended September 30, 2005, a charge of $0.5 million was recorded in "Operating Expenses" in the consolidated statements of operations in connection with the acceleration of vesting schedules.
On August 12, 2005, certain employees and directors performed a cashless exercise of stock options granted under the 2003 Stock Option Plan, which resulted in the issuance of 808,818 shares of common stock, 465,651 of which were restricted shares. In accordance with the 2003 Stock Option Plan, as amended, restricted shares vest on the following schedule: 40% on February 28, 2006, 40% on January 16, 2007 and 20% on July 1, 2007. In connection with the scheduled vesting on February 28, 2006, the Company purchased and retired 51,256 shares of common stock from employees for $1.0 million to provide the employees with funds to satisfy their minimum statutory federal and state tax withholding obligations related to the vesting of their restricted stock on that date. The purchase price was $20.20 per share, the closing market price on February 28, 2006.
Since August 1, 2005, the board of directors of Reddy Holdings have declared the following dividends on the Company's common stock:
| Declaration Date | Record Date | Payable Date | Dividend Per share | Total Dividend | ||||||
|---|---|---|---|---|---|---|---|---|---|---|
| August 11, 2005 | September 30, 2005 | October 17, 2005 | $ | 0.20788 | $ | 4.5 million | ||||
| December 15, 2005 | December 30, 2005 | January 17, 2006 | $ | 0.3825 | $ | 8.3 million | ||||
| March 15, 2006 | March 31, 2006 | April 17, 2006 | $ | 0.3825 | $ | 8.3 million | ||||
Preferred Stock. Reddy Holdings is authorized to issue up to 25,000,000 shares of $0.01 par value preferred stock, all of which is currently undesignated and unissued.
7. Employee Benefit Plans
2005 Equity Incentive Plan. On August 8, 2005, the board of directors and stockholders of Reddy Holdings approved the 2005 Equity Incentive Plan. Under the 2005 Equity Incentive Plan, up to 750,000 shares of common stock may be issued to employees, directors and certain third parties in connection with various incentive awards, including stock options, restricted shares and restricted share units. On October 18, 2005, Reddy Holdings filed a Registration Statement on Form S-8 with the SEC to cover the reoffer and resale of up to 750,000 shares of Reddy Holdings' common stock that Reddy Holdings may issue in the future to participants in the 2005 Equity Incentive Plan.
On November 3, 2005, 9,300 unrestricted common shares were granted to certain employees under the 2005 Equity Incentive Plan. Restricted share units ("RSUs") have been granted to certain employees and the independent directors of Reddy Holdings in the following amounts: 682,000 RSUs on November 3, 2005, 10,000 RSUs on
F-45
November 15, 2005 and 9,625 RSUs on February 22, 2006. Each RSU provides for the grant of one share of unrestricted common stock on the date that the vesting terms of each RSU is satisfied.
Generally, fifty percent of each award of RSUs (the "Time-vested RSUs") will vest in four equal annual installments beginning on August 12, 2006 and continuing on August 12 of each of the following three years, provided the recipient remains employed with the Company through such vesting dates. The remaining fifty percent of each award of RSUs (the "Performance-vested RSUs") will vest in four equal annual installments beginning on August 12, 2006 and continuing on August 12 of each of the following three years, provided the recipient remains employed with the Company through such vesting dates and the applicable performance condition for the applicable vesting period is met. The performance condition for each vesting period will be based on the Company's earned distributable cash per share (as defined in the related restricted share unit agreement) for such vesting period. Each vesting period will begin on July 1 and end on June 30 of the subsequent year. All RSUs will immediately vest in full, and shares will be distributed, at the time of a Change in Control (as defined in the 2005 Equity Incentive Plan). If in any performance period the performance condition for a subsequent performance period is achieved, Performance-vested RSUs will be entitled to dividend equivalent rights in the subsequent performance period equal to the dividends which would be payable on the shares of common stock represented by the RSUs subject to vesting in that period. Payments of such dividend equivalents will be made in cash to the holders of RSUs at the time of actual dividend payments and will not be subject to vesting. Time-vested RSUs will not be entitled to dividend equivalent rights.
Compensation expense associated with the 2005 Equity Incentive Plan was $0.9 million during the three months ended March 31, 2006. Such compensation expense was recorded in "Operating Expenses" in the consolidated statements of operations. Approximately twenty-five percent of the Time-vested RSUs are being expensed during each period ending August 12 in 2006 to 2009. Performance-vested RSUs are being expensed on the same basis as it is management's belief that the performance condition for each period will be met. As of March 31, 2006, 697,625 shares were reserved for issuance and 43,075 shares were available for grant under the 2005 Equity Incentive Plan.
2003 Stock Option Plan. The 2003 Stock Option Plan was amended on August 8, 2005 (see Note 6). On August 12, 2005, all outstanding options under the 2003 Stock Option Plan were exercised in exchange for restricted shares (see Note 6). At March 31, 2006, 57,883 shares of common stock were available for grant under the 2003 Stock Option Plan. The Company does not intend to make any additional grants under this plan. Compensation expense associated with the 2003 Stock Option Plan was $0.3 million during the three months ended March 31, 2006 and 2005. Such compensation expense was recorded in "Operating Expenses" in the consolidated statements of operations.
Effective January 1, 2005, the Company adopted the fair value recognition provisions of SFAS No. 123, "Accounting for Stock-Based Compensation", as amended by SFAS No. 148, "Accounting for Stock-Based Compensation—Transition and Disclosure". Under the provisions of SFAS No. 148, the Company selected the modified prospective method of adoption and therefore began recognizing stock-based employee compensation cost related to all employee equity grants outstanding at the date of adoption, as well as grants made or modified thereafter.
In December 2004, the FASB issued SFAS No. 123(R), "Share-Based Payment", which established accounting standards for all transactions in which an entity exchanges its equity instruments for goods and services. SFAS No. 123(R) generally requires companies to measure the cost of employee services received in exchange for an award of equity instruments based on the fair value of the award on the date of the grant. The standard requires grant date fair value to be estimated using either an option-pricing model which is consistent with the terms of the
F-46
award or a market observed price, if such a price exists. Such cost must be recognized over the period during which an employee is required to provide service in exchange for the award, which is usually the vesting period. The standard also requires the Company to estimate the number of instruments that will ultimately be issued, rather than accounting for forfeitures as they occur.
The Company adopted SFAS No. 123(R) on January 1, 2006 using the modified prospective method and straight line amortization of compensation cost. The adoption of this standard did not have a material effect on the Company's results of operations and financial position.
8. Net Loss Per Share
The computation of net loss per share is based on net loss divided by the weighted average number of shares outstanding. For the three months March 31, 2006, there were 399,000 shares of restricted stock and 691,000 RSUs which are not included in the computation of diluted net loss per share as their effect would be anti-dilutive. For the three months March 31, 2005, there were 1,536,000 stock options which are not included in the computation of diluted net loss per share as their effect would be anti-dilutive.
9. Income Taxes
The Company's effective tax rate differs from the federal statutory income tax rate of 35% due to state income taxes and the effect of permanent differences, primarily the non-deductible portion of the interest expense recognized on the 101/2% Senior Discount Notes.
In connection with the vesting of restricted stock on February 28, 2006 (see Note 6), the Company realized an excess tax benefit of $1.3 million. Because the Company is not currently making cash payments for income taxes due to its net operating loss ("NOL") carryforwards, such excess benefit has not been recognized in the Company's financial statements and is being reported as a "suspended NOL carryforward" in the footnotes to the consolidated financial statements in accordance with SFAS No. 123(R).
10. Commitments and Contingencies
The Company is involved in various claims, lawsuits and proceedings arising in the ordinary course of business. There are uncertainties inherent in the ultimate outcome of such matters and it is impossible to presently determine the ultimate costs that may be incurred. Management believes the resolution of such uncertainties and the incurrence of such costs will not have a material adverse effect on the Company's consolidated financial position, results of operations or cash flows.
11. Segment Information
The Company has two reportable segments: (1) ice products and (2) non-ice products and services. Ice products include the manufacture and distribution of packaged ice products through traditional ice manufacturing and delivery and The Ice Factory®, which is a proprietary machine that produces, packages, stores and merchandises ice at the point of sale through an automated, self-contained system. Non-ice products and services include refrigerated warehouses and the manufacturing and distribution of bottled water.
The Company evaluates the performance of each segment based on earnings before interest, taxes, depreciation, amortization, gain or loss on disposition of assets, impairment of assets, loss on extinguishment of debt and management agreement termination fees and transaction bonuses and expenses ("Segment EBITDA"). Segment
F-47
assets are not a factor in the evaluation of performance. There were no intersegment sales during the three months ended March 31, 2006 and 2005.
Segment information for the three months ended March 31, 2006 and 2005 was as follows:
| | Three Months Ended March 31, 2006 | Three Months Ended March 31, 2005 | |||||||||||||||||
|---|---|---|---|---|---|---|---|---|---|---|---|---|---|---|---|---|---|---|---|
| | Ice | Non-Ice | Total | Ice | Non-Ice | Total | |||||||||||||
| | (in thousands) | ||||||||||||||||||
| Revenues | $ | 41,738 | $ | 3,070 | $ | 44,808 | $ | 35,989 | $ | 3,255 | $ | 39,244 | |||||||
| Cost of sales (excluding depreciation) | 32,351 | 2,062 | 34,413 | 29,464 | 2,215 | 31,679 | |||||||||||||
| Operating expenses | 10,700 | 389 | 11,089 | 8,317 | 517 | 8,834 | |||||||||||||
| Segment EBITDA | $ | (1,313 | ) | $ | 619 | $ | (694 | ) | $ | (1,792 | ) | $ | 523 | $ | (1,269 | ) | |||
| Total assets | $ | 556,225 | $ | 24,615 | $ | 580,840 | $ | 551,559 | $ | 32,987 | $ | 584,546 | |||||||
The reconciliation of Segment EBITDA to net loss for the three months ended March 31, 2006 and 2005 was as follows:
| | Three Months Ended March 31, | ||||||
|---|---|---|---|---|---|---|---|
| | 2006 | 2005 | |||||
| | (in thousands) | ||||||
| Total Segment EBITDA | $ | (694 | ) | $ | (1,269 | ) | |
| Depreciation expense related to cost of sales | (4,714 | ) | (4,741 | ) | |||
| Depreciation and amortization expense | (1,428 | ) | (1,415 | ) | |||
| Loss on dispositions of assets | (104 | ) | (149 | ) | |||
| Interest expense | (6,954 | ) | (9,308 | ) | |||
| Income tax benefit | 5,655 | 6,702 | |||||
| Net loss | $ | (8,239 | ) | $ | (10,180 | ) | |
F-48
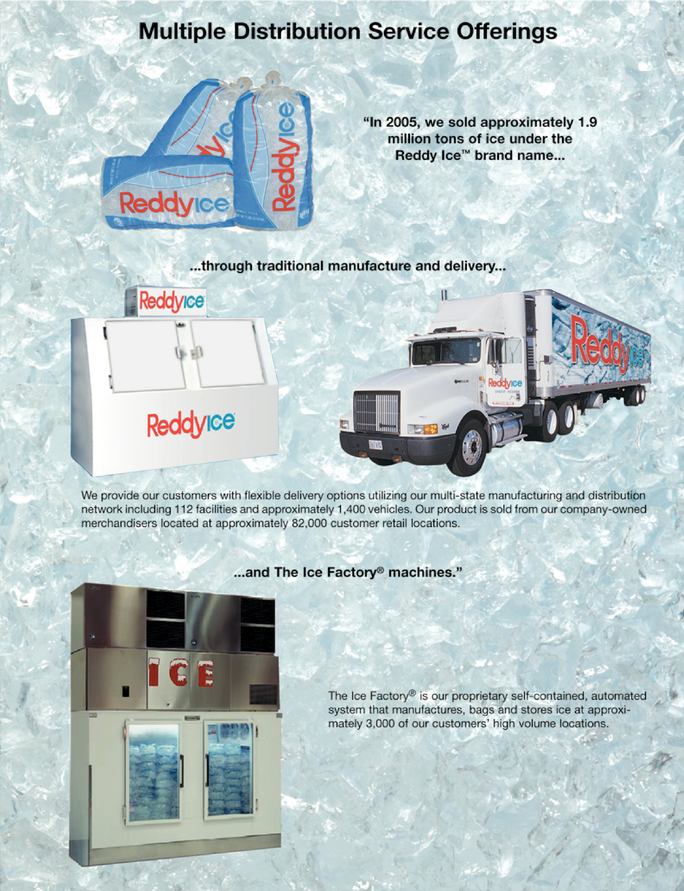
No dealer, salesperson or any other person is authorized to give any information or to represent anything not contained in this Prospectus. You must not rely on any unauthorized information or representations. This Prospectus is an offer to sell only the shares offered hereby, but only under circumstances and in jurisdictions where it is lawful to do so. The information contained in this prospectus is current only as of its date.
TABLE OF CONTENTS
| | Page | |
|---|---|---|
| Summary | 1 | |
| Risk Factors | 8 | |
| Forward-Looking Statements | 17 | |
| Use of Proceeds | 18 | |
| Dividend Policy and Restrictions | 19 | |
| Capitalization | 31 | |
| Price Range of Common Stock | 32 | |
| Selected Historical Consolidated Financial Data | 33 | |
| Management's Discussion and Analysis of Financial Condition and Results of Operations | 35 | |
| Industry Overview | 53 | |
| Business | 54 | |
| Management | 65 | |
| Principal and Selling Stockholders | 76 | |
| Certain Relationships and Related Transactions | 78 | |
| Description of Indebtedness | 79 | |
| Description of Capital Stock | 82 | |
| Shares Eligible for Future Sale | 86 | |
| Material United States Federal Income and Estate Tax Considerations | 88 | |
| Underwriting | 91 | |
| Validity of the Common Stock | 95 | |
| Experts | 95 | |
| Where You Can Find More Information | 95 | |
| Index to Financial Statements | F-1 |
4,590,258 Shares
Common Stock
PROSPECTUS
May 23, 2006
Bear, Stearns & Co. Inc.
Lehman Brothers
Goldman, Sachs & Co.
Wachovia Securities
Piper Jaffray
Morgan Keegan & Company, Inc.
SUMMARY
RISK FACTORS
FORWARD-LOOKING STATEMENTS
USE OF PROCEEDS
DIVIDEND POLICY AND RESTRICTIONS
CAPITALIZATION
PRICE RANGE OF COMMON STOCK
SELECTED HISTORICAL CONSOLIDATED FINANCIAL DATA
MANAGEMENT'S DISCUSSION AND ANALYSIS OF FINANCIAL CONDITION AND RESULTS OF OPERATIONS
INDUSTRY OVERVIEW
BUSINESS
MANAGEMENT
PRINCIPAL AND SELLING STOCKHOLDERS
CERTAIN RELATIONSHIPS AND RELATED TRANSACTIONS
DESCRIPTION OF INDEBTEDNESS
DESCRIPTION OF CAPITAL STOCK
SHARES ELIGIBLE FOR FUTURE SALE
MATERIAL UNITED STATES FEDERAL INCOME AND ESTATE TAX CONSIDERATIONS
UNDERWRITING
VALIDITY OF THE COMMON STOCK
EXPERTS
WHERE YOU CAN FIND MORE INFORMATION
INDEX TO FINANCIAL STATEMENTS
REPORT OF INDEPENDENT REGISTERED PUBLIC ACCOUNTING FIRM
REDDY ICE HOLDINGS, INC. AND SUBSIDIARY CONSOLIDATED BALANCE SHEETS
REDDY ICE HOLDINGS, INC. AND SUBSIDIARY CONSOLIDATED STATEMENTS OF OPERATIONS
REDDY ICE HOLDINGS, INC. AND SUBSIDIARY CONSOLIDATED STATEMENTS OF CASH FLOWS
REDDY ICE HOLDINGS, INC. AND SUBSIDIARIES NOTES TO CONSOLIDATED FINANCIAL STATEMENTS
REDDY ICE HOLDINGS, INC. AND SUBSIDIARY CONDENSED CONSOLIDATED BALANCE SHEETS (Unaudited)
REDDY ICE HOLDINGS, INC. AND SUBSIDIARY CONDENSED CONSOLIDATED STATEMENTS OF OPERATIONS (Unaudited)
REDDY ICE HOLDINGS, INC. AND SUBSIDIARY CONDENSED CONSOLIDATED STATEMENT OF STOCKHOLDERS' EQUITY (Unaudited) (in thousands)
REDDY ICE HOLDINGS, INC. AND SUBSIDIARY CONDENSED CONSOLIDATED STATEMENTS OF CASH FLOWS (Unaudited)
REDDY ICE HOLDINGS, INC. AND SUBSIDIARY NOTES TO CONDENSED CONSOLIDATED FINANCIAL STATEMENTS (Unaudited) FOR THE THREE MONTHS ENDED MARCH 31, 2006 AND 2005