Building Greater Opportunities for Profitable and Sustained Growth May 2010 Exhibit 99.1 |
2 Forward-Looking Statements This presentation contains certain statements, estimates and forecasts with respect to future performance and events. These statements, estimates and forecasts are “forward-looking statements.” In some cases, forward-looking statements can be identified by the use of forward- looking terminology such as “may,” “might,” “will,” “should,” “expect,” “plan,” “anticipate,” “believe,” “estimate,” “predict,” “potential” or “continue” or the negatives thereof or variations thereon or similar terminology. All statements other than statements of historical fact included in this communication are forward-looking statements and are based on various underlying assumptions and expectations and are subject to known and unknown risks, uncertainties and assumptions, and may include projections of our future financial performance based on our growth strategies and anticipated trends in our business. These statements are based on our current expectations and projections about future events. There are important factors that could cause our actual results, level of activity, performance or achievements to differ materially from the results, level of activity, performance or achievements expressed or implied in the forward-looking statements. These factors include, but are not limited to, those discussed under the heading “Risk Factors” and “Management’s Discussion and Analysis of Financial Condition” in our filings with the Securities and Exchange Commission (“SEC”), which are available at the SEC’s website at www.sec.gov and our website at www.cohenandcompany.com/sec-filings. In particular, these risk factors include the following: (a) a decline in general economic conditions or the global financial markets, (b) losses caused by financial or other problems experienced by third parties, (c) losses due to unidentified or unanticipated risks, (d) a lack of liquidity, i.e., ready access to funds for use in our businesses, (e) the ability to attract and retain personnel, (f) litigation and regulatory issues, (g) competitive pressure, and (h) a potential “Ownership Change” under Section 382 of the Internal Revenue Code. As a result, there can be no assurance that the forward-looking statements included in this communication will prove to be accurate or correct. In light of these risks, uncertainties and assumptions, the future performance or events described in the forward-looking statements in this communication might not occur. Accordingly, you should not rely upon forward-looking statements as a prediction of actual results and we do not undertake any obligation to update any forward-looking statements, whether as a result of new information, future events or otherwise. |
3 Table of Contents Page 1. Overview of Cohen & Company 4 2. Cohen & Company’s Businesses A. Capital Markets 11 B. Asset Management 15 3. Financial Summary 17 4. Summary 25 |
Section 1 Overview of Cohen & Company |
5 Overview • Founded in 1999 as small-cap financials investment bank. • Participated actively in helping banks and insurance companies issue trust preferred securities ($11.4 billion issued). • Two main operating businesses – capital markets and asset management. • Specialist in credit-related fixed income – one of the largest and most profitable areas of the capital markets. • Consistent and diversified base of revenue and profitability - asset management base fee income and core trading. • Pursuing higher margin businesses: new issue, advisory, big ticket trading, and principal transactions. • Merged with Alesco Financial Inc. in December 2009. • Listed on the NYSE Amex under the symbol “COHN.” • Headquartered in Philadelphia, additional offices in Boston, Chicago, London, Los Angeles, New York, Paris, San Francisco, Washington DC, among other locations. • Approximately 150 employees. Transactional & Management Expertise in Credit Fixed Income Sector |
6 Key Investment Highlights • Capitalizing on dislocation of current markets and focusing on serving clients and investors. • A significant market participant in secondary trading of credit-related fixed income investments. • Generating diversified revenue from institutional sales and trading, asset management and principal investing with significant recurring revenue streams from asset management. • Winning new asset management business and marketing new investment funds. • Disciplined business model with low fixed cost structure as result of pay for performance, variable compensation system. • Efficient, scalable operations allow quick expansion into new asset classes without significant incremental cost. • Management interests aligned with stockholders through significant stock ownership. • Significant NOLs ($48 million) and NCLs ($69 million) can be used to offset taxable income. Nimble Market Position Represents Strong Opportunity to Drive Value |
7 Key Strengths Revenue Diversification • Revenue diversified by operating business line and asset class. • New issue, secondary trading, asset management, and principal investing capabilities. Deep Experience • Proven ability to attract new talent, reposition existing talent, and grow company in challenging environment. • Relationships with small and mid-sized banks (400+), insurance companies (150+), and regional broker dealers (400+) that are potential sources of advisory and trading revenue. • Trading relationships with over 550 institutional fixed income managers. • Team includes 96 capital markets professionals and 27 asset management professionals with years of experience and relationships in the marketplace. Strong Financial Position • Substantial cash and available credit. • Minimal debt maturities within the next year. • Management contract rights are valuable off-balance sheet assets. Streamlined Cost Structure • Low fixed cost structure. • Substantially all fixed cash costs covered by recurring revenue. • 18.5% non-compensation operating expense ratio in 1Q10 (excluding D&A). Poised to Continue to Grow as Capital Markets Improve |
8 Opportunities for Growth • Sea change in fixed income and capital markets represents dynamic opportunity for experienced, entrepreneurial players. Scale existing businesses – credit trading, global. Start up new businesses – CDs, small ticket fixed income, equity derivatives. Add new asset classes – municipals, emerging markets. Start new investment funds and increase separate accounts business. Asset management incentive fees. Credit default swaps become accessible – legislation pending. New issue, including securitization, returns. Potential acquisitions. Positioned for Rapid Expansion |
9 Diversified, Recurring Revenue Streams • Diverse asset class expertise in institutional sales and trading includes: High grade corporate bonds. High yield corporate bonds and loans. Mortgage and asset backed securities. Collateralized bond and loan obligations. Commercial mortgage backed securities. Hybrid capital of financial institutions (trust preferred securities). Mortgage loans. Brokered deposits. • Senior management fees on structured asset management vehicles provide recurring revenue stream; current monthly run-rate approximates $1.2 million. • Manage $14.8 billion of structured investment products. • Focused on growing $680 million of net asset value of investment funds, separate accounts, and permanent capital vehicles. Diverse Revenue Base Provides Stability |
10 Compensation Philosophy for Long-Term Success • Compensation structure designed to: Attract and retain employees. Pay for performance. Provide ownership incentive to align interests with stockholders. • Ownership achieved primarily through Restricted Stock Units (RSUs) and continuing ownership of existing Cohen members. Significant employee ownership of the Company. • Significant portion of equity / cash compensation is variable and dependent upon performance. • Targeting cash compensation ratio to approximate 65% in any year. Company Culture Supports Stockholder Value Creation |
Section 2A Cohen & Company’s Businesses: Capital Markets |
12 A Significant Market Participant in Secondary Trading of Credit Fixed Income Investments • Sales and trading professionals have grown from 6 at the beginning of 2008 to 85 currently. • Net trading revenue has increased from $0.7 million in 1Q08 to $22.8 million in 1Q10. • Notional amount of securities traded has grown from $267 million in 1Q08 to $6.2 billion in 1Q10. • Active trading clients have increased from 41 in 1Q08 to 278 in 1Q10. • Total transactions have grown from 40 in January 2008 to 2,656 in March 2010. Net Trading Revenue ($ in millions) $4.0 $0.2 $18.2 $44.2 $91.1 $0 $25 $50 $75 $100 2006 2007 2008 2009 1Q10 Annualized Increasing Company Footprint in Marketplace |
13 Capitalizing on the opportunities in current markets • Hiring the best available talent and increasing intellectual capital. • Recent hires have prior experience at: Barclays Bear Stearns BNP Paribas Credit Suisse Deutsche Bank DLJ Goldman Sachs HSBC • Developing new client relationships now possible due to market disruption. Focusing on serving clients and investors • Broadening product offerings across the fixed income spectrum. • Expanding geographic presence with new office in Los Angeles and larger office in London. Using Market Rebuilding to Our Advantage Jefferies JP Morgan Lehman Brothers Merrill Lynch Morgan Stanley Piper Jaffray Rabobank UBS Gaining Market Share During Recent Market Disruption |
14 Growth Opportunities in Capital Markets • Consolidation and cutbacks by competitors resulting in market share gains. • Differentiated from firms with no capital. • Obtaining additional institutional investor client base. • Increasing revenue per account. • Continuing to add new product lines. • Growing advisory and new issue businesses. • Potential increased revenue if: Securitization grows again. Capabilities exist now to underwrite new transactions. Clients are active in secondary trading. Credit Default Swaps (“CDS”) move to an exchange or other “open architecture.” Well Positioned for Long-term Growth in Substantial Market |
Section 2B Cohen & Company’s Businesses: Asset Management |
16 Market Opportunity • Alternative asset management model provide recurring management fees and profit participation through incentive fees. • Deep Value alternative investment funds (established 4Q08) annualized life-to-date returns of 22.2%. • Brigadier alternative investment fund (established 2Q06) with life-to-date returns of 74%, representing an annualized return of 16%. • Increase market share through: Growing existing investment funds and separately managed accounts by capitalizing on superior performance. Creating new investment funds within areas of expertise. Pursuing potential acquisitions and asset management contract roll-up to add to existing platform. Believe a significant percentage of CLO managers have fewer than five funds. Small number of contracts is difficult to sustain on independent platform. Significant Market to Capture in Asset Management Segment |
Section 3 Financial Summary |
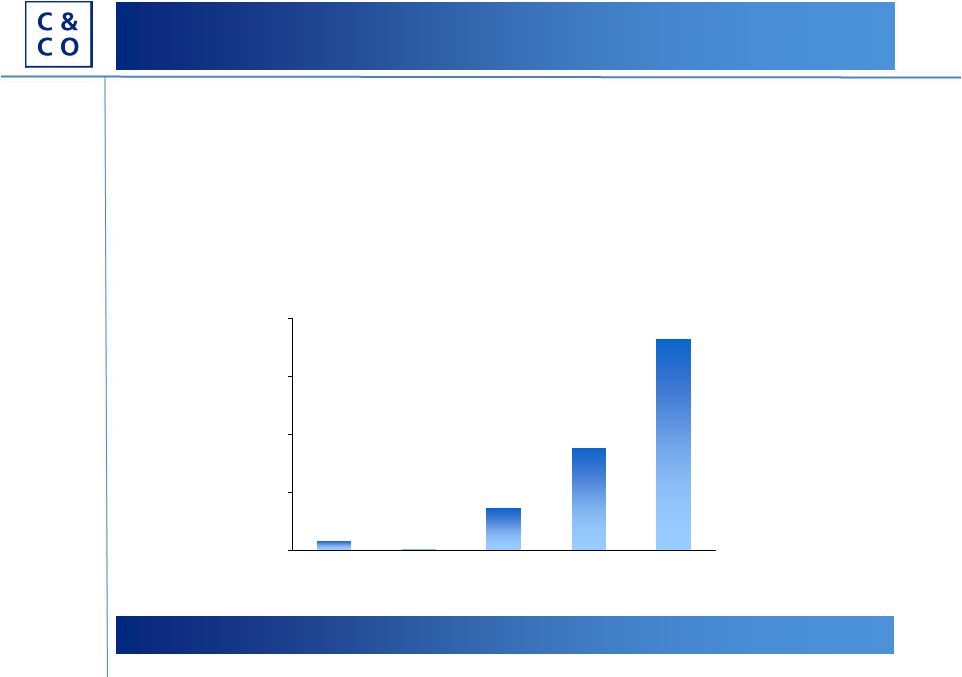
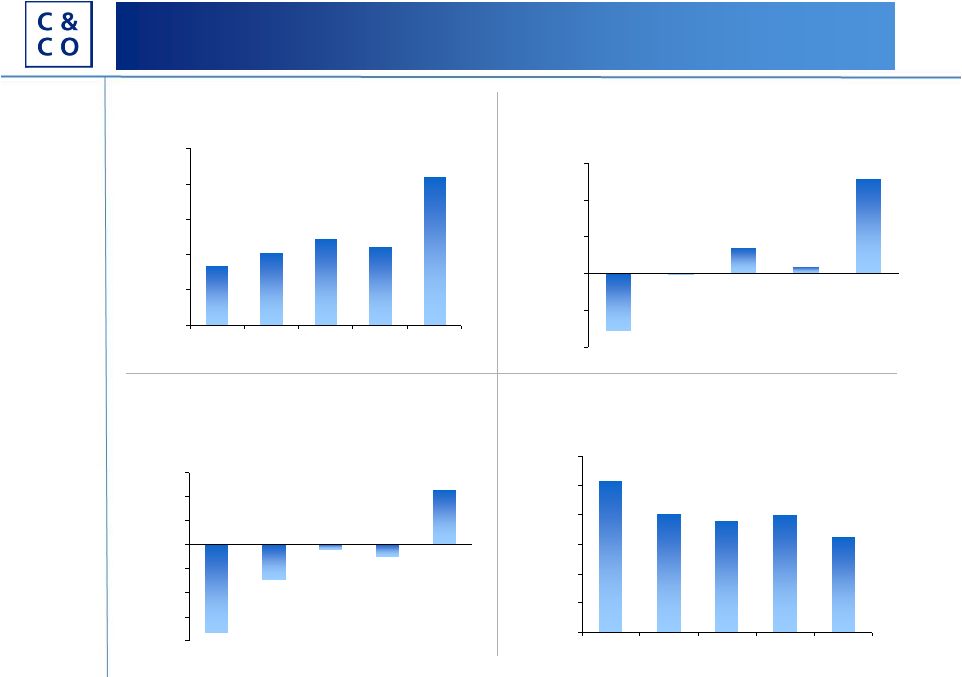
18 • 1Q10 net trading revenue of $22.8 million, a 101% increase over prior year quarter. • Comp as a % of revenue in 2010 is projected to be 65-70% during this period of significant hiring of investment professionals in capital markets. Pay for performance. Variable compensation structure. • 1Q10 non-comp expenses as a % of revenue of 18.5%, excluding depreciation & amortization. Efficient, scalable operations. Low fixed-cost structure. Targeting annual run-rate of $24- $26 million. • 1Q10 operating income of $6.2 million, adjusted operating income of $7.7 million. (1) Total operating expenses in accordance with Generally Accepted Accounting Principals (GAAP) excluding compensation & benefits and depreciation & amortization. (2) Adjusted operating income (loss) represents operating income (loss), computed in accordance with GAAP, before depreciation and amortization, impairments of intangible assets, and share-based compensation expense. See reconciliation table on page 24. Statements of Operations Improving Financial Performance COHEN P&L ($000s) 1Q09 2Q09 3Q09 4Q09 1Q10 New issue 227 $ 518 $ 480 $ 591 $ 668 $ Asset management 9,299 7,614 6,871 7,364 6,770 Principal transactions & other (3,924) 2,620 6,311 1,950 11,527 Net trading 11,317 9,694 10,907 12,247 22,768 Total revenue 16,919 20,446 24,569 22,152 41,733 Compensation and benefits 17,439 16,656 18,762 17,662 27,131 % of Total Revenue 103% 81% 76% 80% 65% Non-comp operating expenses (1) 5,164 4,959 4,768 7,245 7,709 Depreciation & amortization 654 635 630 624 643 Operating income (loss) (6,337) (1,805) 410 (3,379) 6,249 % of Total Revenue -37% -9% 2% -15% 15% Non-operating expense (income) 1,080 1,126 817 (2,342) 1,689 Net income (7,417) (2,931) (407) (1,037) 4,561 Less: Non-controlling interest - - - (87) 1,646 Net inc attributable to COHN (7,417) $ (2,931) $ (407) $ (950) $ 2,915 $ % of Total Revenue -44% -14% -2% -4% 7% Earnings per share (0.77) $ (0.30) $ (0.04) $ (0.10) $ 0.28 $ Fully-diluted earnings per share (0.77) $ (0.30) $ (0.04) $ (0.10) $ 0.28 $ Basic shares 9,612 9,612 9,612 9,723 10,318 Fully-diluted shares 9,612 9,612 9,612 9,723 15,602 Adjusted operating income (loss) (2) (4,649) $ (67) $ 2,138 $ 568 $ 7,692 $ Per fully-diluted share (2) (0.48) $ (0.01) $ 0.22 $ 0.06 $ 0.49 $ |
19 Statements of Operations Charts Net Revenue ($000s) $16,919 $20,446 $24,569 $22,152 $41,733 $0 $10,000 $20,000 $30,000 $40,000 $50,000 1Q09 2Q09 3Q09 4Q09 1Q10 Adjusted Operating Income (Loss) (1) ($000s) ($4,649) ($67) $2,138 $568 $7,692 ($6,000) ($3,000) $0 $3,000 $6,000 $9,000 1Q09 2Q09 3Q09 4Q09 1Q10 Net Income (Loss) ($000s) ($7,417) ($2,931) ($407) ($1,037) $4,561 ($8,000) ($6,000) ($4,000) ($2,000) $0 $2,000 $4,000 $6,000 1Q09 2Q09 3Q09 4Q09 1Q10 Comp as a % of Revenue 103% 81% 76% 80% 65% 0% 20% 40% 60% 80% 100% 120% 1Q09 2Q09 3Q09 4Q09 1Q10 (1) See non-GAAP information and reconciliation table on page 24. |
20 Balance Sheets (1) Includes non-controlling interest. (2) See cautionary note regarding financial statements. Key Off-Balance Sheet Assets • NOLs and NCLs (2) Approximately $48 million of NOLs and $69 million of NCLs as of December 31, 2009. NOLs and NCLs are not currently limited by Section 382 of the Internal Revenue Code of 1986, as amended. Current tax expense is made up only of state, local, and foreign taxes because NOLs and NCLs can be used to offset taxable income generated during 2010. • Asset Management Contracts Providing a steady stream of fee income. Can be monetized in certain circumstances. COHEN BALANCE SHEET ($000s) 3/31/10 12/31/09 Cash and cash equivalents 29,180 $ 69,692 $ Receivables from: Brokers, dealers, clearing agencies 35,120 255 Related parties 1,250 1,255 Other receivables 3,864 4,268 Investments - trading 77,917 135,428 Other investments, at fair value 52,696 43,647 Receivables under resale agmts 75,826 20,357 Goodwill 9,551 9,551 Other assets 25,224 14,989 Total Assets 310,628 $ 299,442 $ Payables to: Brokers, dealers, clearing agencies 2,425 $ 13,491 $ Related parties 34 - Accounts payable & other 13,659 13,039 Accrued compensation 15,089 7,689 Trading securities sold, not yet purch 110,229 114,712 Securities sold under repurch agmt 28,964 - Deferred income taxes 10,655 10,899 Debt 47,040 61,961 Total Liabilities 228,095 221,791 Stockholders' equity (1) 82,533 77,651 Total Liabilities & Equity 310,628 $ 299,442 $ Fully-diluted book value per share 5.26 $ 4.98 $ |
21 Peer Group Market Statistics (1) For BPSG, excludes severance expense for former CEO and CFO. (2) To provide a more meaningful comparison, ratio of Price to Annualized Revenue is NM if negative or greater than 50x. Significantly Undervalued Compared to Peers ($ in MMs except per share) COHN BPSG COWN FBCM JMP KBW OPY RODM Average Current Price 4.93 $ 3.38 $ 4.57 $ 4.23 $ 6.72 $ 25.14 $ 26.10 $ 2.70 $ Current Market Cap 77 $ 436 $ 341 $ 265 $ 146 $ 892 $ 348 $ 95 $ 360 $ Last Quarter Tangible Book 84 $ 226 $ 422 $ 301 $ 128 $ 463 $ 288 $ 62 $ 270 $ Price/Tangible Book 0.9 x 1.9 x 0.8 x 0.9 x 1.1 x 1.9 x 1.2 x 1.5 x 1.3 x Last Quarter Revenue 42 $ 79 $ 56 $ 44 $ 25 $ 133 $ 247 $ 28 $ 88 $ Annualized 167 $ 317 $ 225 $ 177 $ 101 $ 533 $ 987 $ 111 $ 350 $ Price/Annualized Revenue 0.5 x 1.4 x 1.5 x 1.5 x 1.4 x 1.7 x 0.4 x 0.9 x 1.2 x Last Quarter Net Income (1) 5 $ 11 $ (13) $ (8) $ 2 $ 12 $ 9 $ 2 $ 2 $ Annualized 18 $ 44 $ (52) $ (33) $ 7 $ 46 $ 37 $ 8 $ 8 $ Price/Annualized Earnings (2) 4.2 x 9.9 x NM NM 21.2 x 19.2 x 9.5 x 11.4 x 14.2 x Fully-diluted Last Quarter EPS 0.28 $ 0.09 $ (0.18) $ (0.13) $ 0.08 $ 0.32 $ 0.66 $ 0.06 $ 0.13 $ ROE 21.6% 19.6% -12.3% -11.0% 5.4% 10.0% 12.8% 13.4% 3.0% Financial Information as of: 3/31/10 Market Data as of: 5/21/10 Key Comp Group |
22 Peer Group Market Statistics (1) To provide a more meaningful comparison, ratio of Price to Annualized Revenue is NM if negative or greater than 50x. ($ in MMs except per share) COHN EVR GFIG GHL JEF LAZ MF PJC SF Average Current Price 4.93 $ 31.72 $ 5.87 $ 69.91 $ 23.35 $ 32.27 $ 7.99 $ 33.38 $ 52.69 $ Current Market Cap 77 $ 543 $ 702 $ 2,060 $ 4,010 $ 2,900 $ 971 $ 693 $ 1,630 $ 1,689 $ Last Quarter Tangible Book 84 $ 236 $ 246 $ 199 $ 2,281 $ 253 $ 1,068 $ 695 $ 721 $ 712 $ Price/Tangible Book 0.9 x 2.3 x 2.9 x 10.4 x 1.8 x 11.5 x 0.9 x 1.0 x 2.3 x 4.1 x Last Quarter Revenue 42 $ 88 $ 221 $ 49 $ 581 $ 438 $ 240 $ 110 $ 312 $ 255 $ Annualized 167 $ 351 $ 883 $ 195 $ 2,325 $ 1,753 $ 962 $ 438 $ 1,248 $ 1,019 $ Price/Annualized Revenue 0.5 x 1.5 x 0.8 x 10.5 x 1.7 x 1.7 x 1.0 x 1.6 x 1.3 x 2.5 x Last Quarter Net Income 5 $ 2 $ 13 $ 1 $ 74 $ (34) $ (97) $ 1 $ 24 $ (2) $ Annualized 18 $ 8 $ 54 $ 2 $ 296 $ (134) $ (386) $ 2 $ 95 $ (8) $ Price/Annualized Earnings (1) 4.2 x NM 13.1 x NM 13.5 x NM NM NM 17.2 x 14.6 x Fully-diluted Last Quarter EPS 0.28 $ 0.09 $ 0.11 $ 0.02 $ 0.36 $ 0.46 $ (0.78) $ 0.03 $ 0.68 $ 0.12 $ ROE 21.6% 3.4% 21.8% 1.0% 13.0% -53.1% -0.4 x 0.3% 13.2% -1.1% Financial Information as of: 3/31/10 Market Data as of: 5/21/10 Additional Comps Significantly Undervalued Compared to Peers |
23 Cautionary Note Regarding Financial Statements General Due to the nature of our business, our revenues and operating results may fluctuate materially from quarter to quarter. Accordingly, revenue and net income in any particular quarter may not be indicative of future results. Further, our employee compensation arrangements are in large part incentive-based and therefore will fluctuate with revenue. The amount of compensation expense recognized in any one quarter may not be indicative of such expense in future periods. As a result, we suggest that annual results may be the most meaningful gauge for investors in evaluating our business performance. Limitation on usage of NOLs and NCLs If not used, the Company’s net operating loss carryovers (“NOLs”) will begin to expire in 2029 and the net capital loss carryovers (“NCLs”) will begin to expire in 2012. No assurance can be provided that the Company will have future taxable income or future capital gains to benefit from these NOLs and NCLs. Additionally, small changes in the Company’s ownership in the future could cause an “Ownership Change”, in accordance with the terms of Section 382 of the Code. If such a change were to occur in the future, our ability to use the NOLs, NCLs and certain recognized built-in losses to reduce our taxable income in a future year would generally be limited to an annual amount (the “Section 382 Limitation”) equal to the fair value of the Company immediately prior to the Ownership Change multiplied by the “long term tax-exempt interest rate.” In the event of an Ownership Change, NOLs and NCLs that exceed the Section 382 Limitation in any year will continue to be allowed as carry-forwards for the remainder of the carry-forward period, and such NOLs and NCLs would be eligible for use to offset taxable income for years within the carry-forward period subject to the Section 382 Limitation in each year. However, if the carry-forward periods for any NOL or NCL were to expire before such NOL or NCL were fully utilized, the unused portion of that loss would expire unused. |
24 Non-GAAP Measures 1Q09 2Q09 3Q09 4Q09 1Q10 Operating income (loss) (6,337) $ (1,805) $ 410 $ (3,379) $ 6,249 $ Per fully-diluted share (0.66) $ (0.19) $ 0.04 $ (0.35) $ 0.40 $ Operating income (loss) (6,337) $ (1,805) $ 410 $ (3,379) $ 6,249 $ Stock comp expense 1,034 1,103 1,098 3,322 800 Depreciation & amortization 654 635 630 624 643 Adjusted operating income (loss) (4,649) $ (67) $ 2,138 $ 568 $ 7,692 $ Per fully-diluted share (0.48) $ (0.01) $ 0.22 $ 0.06 $ 0.49 $ Fully-diluted shares 9,612 9,612 9,612 9,723 15,602 Adjusted operating income (loss) and adjusted operating income (loss) per fully-diluted share Adjusted operating income (loss) is not a financial measure recognized by GAAP. Adjusted operating income (loss) represents operating income (loss), computed in accordance with GAAP, before depreciation and amortization, impairments of intangible assets, and share-based compensation expense. The items that have been excluded from adjusted operating income (loss) are non-cash items. Adjusted operating income (loss) per fully-diluted share is calculated, by dividing adjusted operating income (loss) by fully- diluted shares outstanding calculated in accordance with GAAP. We present adjusted operating income (loss) and related per fully-diluted share amounts in this presentation because we consider them to be useful and appropriate supplemental measures of our performance. Adjusted operating income (loss) and related per fully-diluted share amounts help us to evaluate our performance without the effects of certain GAAP calculations that may not have a direct cash impact on our current operating performance. In addition, our management uses adjusted operating income (loss) and related per fully-diluted share amounts to evaluate the performance of our operations. Adjusted operating income (loss) and related per fully-diluted share amounts, as we define them, are not necessarily comparable to similarly entitled measures of other companies and may not be appropriate measures for performance relative to other companies. Adjusted operating income (loss) should not be assessed in isolation from or construed as a substitute for operating income (loss) prepared in accordance with GAAP. Adjusted operating income (loss) is not intended to represent, and should not be considered to be a more meaningful measure than, or an alternative to, measures of operating performance as determined in accordance with GAAP. The following table includes a reconciliation of operating income (loss) to adjusted operating income (loss), and the related per fully-diluted share amounts. |
Section 4 Summary |
26 Cohen & Company Summary Poised to Deliver Strong Returns in Years Ahead • Capitalizing on reorganization of current markets and focusing on serving clients and investors. • A significant market participant in secondary trading of credit-related fixed income investments. • Growing, independent firm specializing in credit-related fixed income investments. • Diversified revenue: institutional sales and trading, asset management, and principal investing. • Disciplined business model with low fixed cost structure as a result of pay for performance. • Management’s interests aligned with stockholders through significant stock ownership. • Pursuing strategic opportunities via additional talent and revenue / earnings streams. • Asset management contracts represent substantial off balance sheet assets – providing a steady stream of recurring fee income. |