UNITED STATES
SECURITIES AND EXCHANGE COMMISSION
Washington, D.C. 20549
Form N-CSR
CERTIFIED SHAREHOLDER REPORT OF REGISTERED
MANAGEMENT INVESTMENT COMPANIES
Investment Company Act File Number: 811-21470
Eaton Vance Tax-Advantaged Global Dividend Income Fund
(Exact Name of Registrant as Specified in Charter)
Two International Place, Boston, Massachusetts 02110
(Address of Principal Executive Offices)
Maureen A. Gemma
Two International Place, Boston, Massachusetts 02110
(Name and Address of Agent for Services)
(617) 482-8260
(Registrant’s Telephone Number)
October 31
Date of Fiscal Year End
October 31, 2013
Date of Reporting Period
Item 1. Reports to Stockholders

| | |
Eaton Vance Tax-Advantaged Global Dividend Income Fund (ETG) Annual Report October 31, 2013 | | |

Commodity Futures Trading Commission Registration. Effective December 31, 2012, the Commodity Futures Trading Commission (“CFTC”) adopted certain regulatory changes that subject registered investment companies and advisers to regulation by the CFTC if a fund invests more than a prescribed level of its assets in certain CFTC-regulated instruments (including futures, certain options and swap agreements) or markets itself as providing investment exposure to such instruments. The Fund has claimed an exclusion from the definition of the term “commodity pool operator” under the Commodity Exchange Act and is not subject to the CFTC regulation. Because of its management of other strategies, the Fund’s adviser is registered with the CFTC as a commodity pool operator and a commodity trading advisor.
Fund shares are not insured by the FDIC and are not deposits or other obligations of, or guaranteed by, any depository institution. Shares are subject to investment risks, including possible loss of principal invested.
Annual Report October 31, 2013
Eaton Vance
Tax-Advantaged Global Dividend Income Fund
Table of Contents
| | | | |
Management’s Discussion of Fund Performance | | | 2 | |
| |
Performance | | | 3 | |
| |
Fund Profile | | | 4 | |
| |
Endnotes and Additional Disclosures | | | 5 | |
| |
Financial Statements | | | 6 | |
| |
Report of Independent Registered Public Accounting Firm | | | 22 | |
| |
Federal Tax Information | | | 23 | |
| |
Annual Meeting of Shareholders | | | 24 | |
| |
Dividend Reinvestment Plan | | | 25 | |
| |
Management and Organization | | | 27 | |
| |
Important Notices | | | 29 | |
Eaton Vance
Tax-Advantaged Global Dividend Income Fund
October 31, 2013
Management’s Discussion of Fund Performance1
Economic and Market Conditions
Most major equity markets worldwide recorded strong performance for the 12-month period ended October 31, 2013.
World stock markets were volatile in the final months of 2012 amid the U.S. presidential election and fears of a post-election political deadlock on U.S. tax and spending policies. With the apparent resolution of the so-called “fiscal cliff” budget negotiations in January 2013, global stocks began a sustained rise that gained momentum on positive economic news and continuing support from world central banks. A succession of encouraging economic reports in the U.S. and Europe helped power global stock indexes to record highs in May 2013.
In June 2013, however, equities worldwide faltered after the U.S. Federal Reserve (the Fed) announced that a key component of its economic stimulus effort might be scaled back in late 2013. Investors worried that a stimulus pullback could end markets’ long rise and slow the economic recovery. Global stocks subsequently rebounded as market participants reassessed the potential impact of the Fed’s plan, only to fall again in August 2013 on geopolitical tensions in the Middle East and renewed investor concerns about future Fed policy.
Then, in mid-September 2013, the Fed surprised investors by postponing any stimulus reduction, citing lackluster economic growth and rising interest rates. Global stocks initially jumped in response, but swiftly turned lower amid market participants’ confusion over the Fed’s intentions, along with the mounting threat of a U.S. government shutdown and debt ceiling debacle. While many markets took another hit from the 16-day U.S. government shutdown, they bounced back after a temporary budget deal was reached to reopen the U.S. government and avert a U.S. default on its debts. The two major U.S. stock indexes — the Dow Jones Industrial Average2 and the broader S&P 500 Index — attained new highs, as soft economic data boosted expectations that the Fed would further delay tapering its easy money policies. The Fed confirmed these expectations near period-end by once again leaving its stimulus program intact.
For the full 12-month period, the MSCI World Index (the Index) of global stocks advanced 25.77%. In the U.S., the Dow Jones Industrial Average and the S&P 500 Index rose 21.82% and 27.18%, respectively, while the technology-laden NASDAQ Composite Index added 33.54%. The MSCI Europe Index returned 27.70%, as European stocks benefited from an improving economy following Europe’s prolonged recession. In Asia, the MSCI All Country Pacific Index returned 20.43%, but reflecting concerns about slower economic growth in China, the MSCI Golden Dragon Index returned a more modest 12.89%. Emerging markets overall were an exception to the global trend of double-digit gains, with the MSCI Emerging Markets Index rising 6.53% for the 12-month period.
Fund Performance
For the 12-month period ended October 31, 2013, Eaton Vance Tax-Advantaged Global Dividend Income Fund (the
Fund) had a total return of 27.29% at net asset value (NAV), outperforming the 25.77% return of the Fund’s primary benchmark, the MSCI World Index.
The positive effect of leverage6 in a generally rising market was the key driver of the Fund’s outperformance versus the Index. The use of leverage has the effect of achieving additional exposure to the common and preferred markets, thus magnifying the Fund’s exposure to its underlying investments in both up and down markets. As of the end of the period, the Fund had leverage of 24.26% of its aggregate net assets plus borrowings outstanding.
The Fund’s common stock portfolio performed essentially in line with the Index. Within the common stock portfolio, stock selection in the materials, energy and telecommunication services sectors helped performance versus the Index. In materials, stock selection in chemicals and an underweight in metals & mining aided performance relative to the Index. In energy, stock selection in oil, gas & consumable fuels contributed to performance versus the Index. In telecommunication services, stock selection in wireless telecommunication services boosted performance relative to the Index.
By contrast, stock selection in the information technology (IT) and health care sectors detracted from the Fund’s performance versus the Index, as did stock selection and an underweight in the strong-performing consumer discretionary sector. In IT, that positioning led to stock selection that hurt performance relative to the Index, particularly in IT services, computers & peripherals and communications equipment. In health care, the same bias toward dividend-paying stocks led to ownership of underperforming pharmaceuticals stocks and a lack of holdings in biotechnology, which performed strongly relative to the Index. In consumer discretionary, stock selection and an underweight in the automobiles subsector hurt performance versus the Index, as did a lack of holdings in the strong-performing auto components and Internet & catalog retail subsectors.
The Fund’s preferred stock allocation was the most significant detractor from performance versus the Index, as preferred securities, being interest-rate sensitive, were negatively impacted by rising rates in the second half of the 12-month period. The Fund’s preferred allocation underperformed the Index, but delivered positive absolute performance, while the Fund’s preferred benchmark, the BofA Merrill Lynch Fixed Rate Preferred Securities Index (“the preferred index”), posted negative returns during the period. This outperformance versus the preferred index resulted from a combination of factors. The Fund largely avoided the new issue preferred market in the final months of the period, as rising rates led to a sell-off in new issues. Overweighting high-yield issues also aided the Fund’s performance versus the preferred index, as lower-rated, higher-risk assets generally provided higher yields than the overall preferred market and were less negatively impacted by rising rates. As of period-end, the Fund had 18.49% of its total investments in preferred securities (i.e., preferred stocks and corporate bonds and notes).
See Endnotes and Additional Disclosures in this report.
Past performance is no guarantee of future results. Returns are historical and are calculated by determining the percentage change in net asset value (NAV) or market price (as applicable) with all distributions reinvested and includes management fees and other expenses. Fund performance at market price will differ from its results at NAV due to factors such as changing perceptions about the Fund, market conditions, fluctuations in supply and demand for Fund shares, or changes in Fund distributions. Investment return and principal value will fluctuate so that shares, when sold, may be worth more or less than their original cost. Performance less than one year is cumulative. Performance is for the stated time period only; due to market volatility, current Fund performance may be lower or higher than the quoted return. For performance as of the most recent month end, please refer to www.eatonvance.com.
Eaton Vance
Tax-Advantaged Global Dividend Income Fund
October 31, 2013
Performance2,3
Portfolio Managers Walter A. Row III, CFA, CMT, Michael A. Allison, CFA, John H. Croft, CFA and Judith A. Saryan, CFA
| | | | | | | | | | | | | | | | |
| % Average Annual Total Returns | | Inception Date | | | One Year | | | Five Years | | | Since
Inception | |
Fund at NAV | | | 01/30/2004 | | | | 27.29 | % | | | 14.55 | % | | | 7.61 | % |
Fund at Market Price | | | — | | | | 24.03 | | | | 16.23 | | | | 6.72 | |
MSCI World Index | | | — | | | | 25.77 | % | | | 13.33 | % | | | 6.56 | % |
BofA Merrill Lynch Fixed Rate Preferred Securities Index | | | — | | | | –2.48 | | | | 9.94 | | | | 1.79 | |
| | | | |
| | | | | | | | | | | | | | | | |
| % Premium/Discount to NAV4 | | | | | | | | | | | | |
| | | | | | | | | | | | | | | –7.76 | % |
| | | | |
| | | | | | | | | | | | | | | | |
| Distributions5 | | | | | | | | | | | | |
Total Distributions per share for the period | | | | | | | | | | | | | | $ | 1.230 | |
Distribution Rate at NAV | | | | | | | | | | | | | | | 7.07 | % |
Distribution Rate at Market Price | | | | | | | | | | | | | | | 7.67 | % |
| | | | |
| | | | | | | | | | | | | | | | |
| % Total Leverage6 | | | | | | | | | | | | |
Borrowings | | | | | | | | | | | | | | | 24.26 | % |
See Endnotes and Additional Disclosures in this report.
Past performance is no guarantee of future results. Returns are historical and are calculated by determining the percentage change in net asset value (NAV) or market price (as applicable) with all distributions reinvested and includes management fees and other expenses. Fund performance at market price will differ from its results at NAV due to factors such as changing perceptions about the Fund, market conditions, fluctuations in supply and demand for Fund shares, or changes in Fund distributions. Investment return and principal value will fluctuate so that shares, when sold, may be worth more or less than their original cost. Performance less than one year is cumulative. Performance is for the stated time period only; due to market volatility, current Fund performance may be lower or higher than the quoted return. For performance as of the most recent month end, please refer to www.eatonvance.com.
Eaton Vance
Tax-Advantaged Global Dividend Income Fund
October 31, 2013
Fund Profile
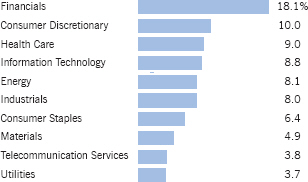
Common Stock Sector Allocation (% of total investments)
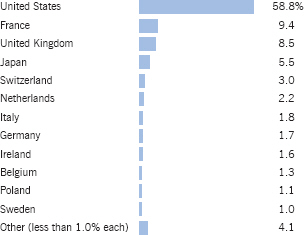
Country Allocation (% of total investments)
Top 10 Common Stock Holdings (% of total investments)
| | | | |
Sanofi | | | 2.2 | % |
| |
Occidental Petroleum Corp. | | | 2.2 | |
| |
Microsoft Corp. | | | 1.8 | |
| |
United Technologies Corp. | | | 1.8 | |
| |
Societe Generale | | | 1.7 | |
| |
BNP Paribas SA | | | 1.7 | |
| |
Roche Holding AG PC | | | 1.7 | |
| |
Accenture PLC, Class A | | | 1.7 | |
| |
National Grid PLC | | | 1.6 | |
| |
Wells Fargo & Co. | | | 1.6 | |
| |
Total | | | 18.0 | % |
See Endnotes and Additional Disclosures in this report.
Eaton Vance
Tax-Advantaged Global Dividend Income Fund
October 31, 2013
Endnotes and Additional Disclosures
| 1 | The views expressed in this report are those of the portfolio manager(s) and are current only through the date stated at the top of this page. These views are subject to change at any time based upon market or other conditions, and Eaton Vance and the Fund(s) disclaim any responsibility to update such views. These views may not be relied upon as investment advice and, because investment decisions are based on many factors, may not be relied upon as an indication of trading intent on behalf of any Eaton Vance fund. This commentary may contain statements that are not historical facts, referred to as “forward looking statements”. The Fund’s actual future results may differ significantly from those stated in any forward looking statement, depending on factors such as changes in securities or financial markets or general economic conditions, the volume of sales and purchases of Fund shares, the continuation of investment advisory, administrative and service contracts, and other risks discussed from time to time in the Fund’s filings with the Securities and Exchange Commission. |
| 2 | Dow Jones Industrial Average is a price-weighted average of 30 blue- chip stocks that are generally the leaders in their industry. S&P 500 Index is an unmanaged index of large-cap stocks commonly used as a measure of U.S. stock market performance. MSCI World Index is an unmanaged index of equity securities in the developed markets. MSCI Europe Index is an unmanaged index designed to measure the developed equity market performance of Europe. MSCI All Country Pacific Index is a free float-adjusted, market capitalization-weighted index that is designed to measure the equity market performance of the developed and emerging markets in the Pacific region. MSCI Golden Dragon Index is an unmanaged index of common stocks traded in China, Hong Kong and Taiwan. MSCI Emerging Markets Index is an unmanaged index of emerging markets common stocks. MSCI indices are net of foreign withholding taxes. Source: MSCI. MSCI data may not be reproduced or used for any other purpose. MSCI provides no warranties, has not prepared or approved this report, and has no liability hereunder. NASDAQ Composite Index is a market capitalization-weighted index of all domestic and international securities listed on NASDAQ. BofA Merrill Lynch Fixed Rate Preferred Securities Index is an unmanaged index of fixed-rate, preferred securities issued in the U.S. BofA Merrill Lynch® indices not for redistribution or other uses; provided “as is”, without warranties, and with no liability. Eaton Vance has prepared this report, BofAML does not endorse it, or guarantee, review, or endorse Eaton Vance’s products. Unless otherwise stated, index returns do not reflect the effect of any applicable sales charges, commissions, expenses, taxes or leverage, as applicable. It is not possible to invest directly in an index. |
| 3 | Performance results reflect the effects of leverage. Performance since inception for an index, if presented, is the performance since the Fund’s or oldest share class’ inception, as applicable. |
| 4 | The shares of the Fund often trade at a discount or premium from their net asset value. The discount or premium of the Fund may vary over time and may be higher or lower than what is quoted in this report. For up-to-date premium/discount information, please refer to http:// eatonvance.com/closedend. |
| 5 | The Distribution Rate is based on the Fund’s last regular distribution per share in the period (annualized) divided by the Fund’s NAV or market price at the end of the period. The Fund’s distributions may be comprised of amounts characterized for federal income tax purposes as qualified and non-qualified ordinary dividends, capital gains distributions and nondividend distributions, also known as return of capital. For additional information about nondividend distributions, please refer to Eaton Vance Closed-End Fund Distribution Notices (19a) posted on our website, eatonvance.com. The Fund will determine the federal income tax character of distributions paid to a shareholder after the end of the calendar year. This is reported on the IRS form 1099- DIV and provided to the shareholder shortly after each year-end. The Fund’s distributions are determined by the investment adviser based on its current assessment of the Fund’s long-term return potential. As portfolio and market conditions change, the rate of distributions paid by the Fund could change. |
| 6 | Total leverage is shown as a percentage of the Fund’s aggregate net assets plus borrowings outstanding. The Fund employs leverage through borrowings. Use of leverage creates an opportunity for income, but creates risks including greater price volatility. The cost of borrowings rises and falls with changes in short-term interest rates. The Fund may be required to maintain prescribed asset coverage for its leverage and may be required to reduce its leverage at an inopportune time. |
| | Fund profile subject to change due to active management. |
| | Important Notice to Shareholders |
| | Effective November 21, 2013, the portfolio management team of the Fund includes new managers Michael A. Allison, CFA, and Walter A. Row, III, CFA, CMT, and continuing manager John H. Croft, CFA. Judith A. Saryan will continue serving as a portfolio manager of the Fund until her retirement from the Eaton Vance organization on December 20, 2013. Aamer Khan, CFA, formerly a member of the Fund’s portfolio management team, will focus on other investment responsibilities in Eaton Vance’s equity group. |
Eaton Vance
Tax-Advantaged Global Dividend Income Fund
October 31, 2013
Portfolio of Investments
| | | | | | | | |
| Common Stocks — 105.2% | |
| | |
| | | | | | | | |
| Security | | Shares | | | Value | |
| | | | | | | | |
|
Aerospace & Defense — 3.9% | |
Boeing Co. (The) | | | 164,000 | | | $ | 21,402,000 | |
United Technologies Corp.(1) | | | 290,000 | | | | 30,812,500 | |
| | | | | | | | | |
| | | $ | 52,214,500 | |
| | | | | | | | | |
|
Automobiles — 2.9% | |
Honda Motor Co., Ltd. | | | 343,500 | | | $ | 13,716,944 | |
Toyota Motor Corp. | | | 377,000 | | | | 24,443,991 | |
| | | | | | | | | |
| | | $ | 38,160,935 | |
| | | | | | | | | |
|
Beverages — 1.7% | |
Anheuser-Busch InBev NV(1) | | | 212,000 | | | $ | 21,976,685 | |
| | | | | | | | | |
| | | $ | 21,976,685 | |
| | | | | | | | | |
|
Chemicals — 5.0% | |
CF Industries Holdings, Inc. | | | 90,000 | | | $ | 19,404,000 | |
LyondellBasell Industries NV, Class A(1) | | | 282,000 | | | | 21,037,200 | |
PPG Industries, Inc.(1) | | | 145,000 | | | | 26,474,100 | |
| | | | | | | | | |
| | | $ | 66,915,300 | |
| | | | | | | | | |
|
Commercial Banks — 12.3% | |
BNP Paribas SA | | | 403,000 | | | $ | 29,730,574 | |
Mitsubishi UFJ Financial Group, Inc. | | | 2,225,000 | | | | 14,169,386 | |
Mizuho Financial Group, Inc. | | | 6,975,000 | | | | 14,640,957 | |
Natixis | | | 3,500,000 | | | | 18,821,594 | |
PNC Financial Services Group, Inc. (The)(1) | | | 373,088 | | | | 27,433,161 | |
Societe Generale | | | 535,000 | | | | 30,221,884 | |
Wells Fargo & Co. | | | 643,461 | | | | 27,469,350 | |
| | | | | | | | | |
| | | $ | 162,486,906 | |
| | | | | | | | | |
|
Communications Equipment — 1.2% | |
Cisco Systems, Inc. | | | 704,000 | | | $ | 15,840,000 | |
| | | | | | | | | |
| | | $ | 15,840,000 | |
| | | | | | | | | |
|
Computers & Peripherals — 2.4% | |
Apple, Inc. | | | 28,000 | | | $ | 14,625,800 | |
Hewlett-Packard Co. | | | 731,000 | | | | 17,814,470 | |
| | | | | | | | | |
| | | $ | 32,440,270 | |
| | | | | | | | | |
|
Construction & Engineering — 1.0% | |
Vinci SA | | | 200,000 | | | $ | 12,797,235 | |
| | | | | | | | | |
| | | $ | 12,797,235 | |
| | | | | | | | | |
| | | | | | | | |
| Security | | Shares | | | Value | |
| | | | | | | | |
|
Consumer Finance — 1.4% | |
Discover Financial Services | | | 350,000 | | | $ | 18,158,000 | |
| | | | | | | | | |
| | | $ | 18,158,000 | |
| | | | | | | | | |
|
Diversified Financial Services — 4.3% | |
Bank of America Corp. | | | 964,594 | | | $ | 13,465,732 | |
Citigroup, Inc.(1) | | | 355,000 | | | | 17,316,900 | |
JPMorgan Chase & Co.(1) | | | 498,000 | | | | 25,666,920 | |
| | | | | | | | | |
| | | $ | 56,449,552 | |
| | | | | | | | | |
|
Diversified Telecommunication Services — 4.3% | |
Bezeq Israeli Telecommunication Corp., Ltd. | | | 4,384,921 | | | $ | 7,624,028 | |
BT Group PLC(1) | | | 2,888,881 | | | | 17,479,547 | |
Deutsche Telekom AG | | | 750,000 | | | | 11,786,029 | |
Nippon Telegraph & Telephone Corp. | | | 195,000 | | | | 10,136,163 | |
Telenor ASA | | | 440,000 | | | | 10,572,152 | |
| | | | | | | | | |
| | | $ | 57,597,919 | |
| | | | | | | | | |
|
Electric Utilities — 1.3% | |
Edison International | | | 350,000 | | | $ | 17,160,500 | |
| | | | | | | | | |
| | | $ | 17,160,500 | |
| | | | | | | | | |
|
Electrical Equipment — 1.8% | |
Emerson Electric Co. | | | 365,000 | | | $ | 24,444,050 | |
| | | | | | | | | |
| | | $ | 24,444,050 | |
| | | | | | | | | |
|
Electronic Equipment, Instruments & Components — 1.4% | |
Corning, Inc. | | | 1,065,000 | | | $ | 18,200,850 | |
| | | | | | | | | |
| | | $ | 18,200,850 | |
| | | | | | | | | |
|
Energy Equipment & Services — 1.4% | |
Schlumberger, Ltd. | | | 200,000 | | | $ | 18,744,000 | |
| | | | | | | | | |
| | | $ | 18,744,000 | |
| | | | | | | | | |
|
Food Products — 2.6% | |
Mondelez International, Inc., Class A(1) | | | 675,000 | | | $ | 22,707,000 | |
Nestle SA(1) | | | 110,000 | | | | 7,940,230 | |
Orkla ASA | | | 445,000 | | | | 3,607,248 | |
| | | | | | | | | |
| | | $ | 34,254,478 | |
| | | | | | | | | |
|
Health Care Equipment & Supplies — 3.1% | |
Abbott Laboratories | | | 200,000 | | | $ | 7,310,000 | |
Covidien PLC | | | 420,000 | | | | 26,926,200 | |
Medtronic, Inc. | | | 128,000 | | | | 7,347,200 | |
| | | | | | | | | |
| | | $ | 41,583,400 | |
| | | | | | | | | |
| | | | |
| | 6 | | See Notes to Financial Statements. |
Eaton Vance
Tax-Advantaged Global Dividend Income Fund
October 31, 2013
Portfolio of Investments — continued
| | | | | | | | |
| Security | | Shares | | | Value | |
| | | | | | | | |
|
Hotels, Restaurants & Leisure — 2.8% | |
Compass Group PLC | | | 500,000 | | | $ | 7,190,598 | |
InterContinental Hotels Group PLC | | | 475,000 | | | | 13,839,949 | |
McDonald’s Corp.(1) | | | 168,000 | | | | 16,215,360 | |
| | | | | | | | | |
| | | $ | 37,245,907 | |
| | | | | | | | | |
|
Household Products — 2.4% | |
Reckitt Benckiser Group PLC(1) | | | 186,000 | | | $ | 14,463,186 | |
Svenska Cellulosa AB SCA, Class B | | | 634,286 | | | | 17,982,769 | |
| | | | | | | | | |
| | | $ | 32,445,955 | |
| | | | | | | | | |
|
Industrial Conglomerates — 1.0% | |
Koninklijke Philips NV | | | 357,853 | | | $ | 12,646,774 | |
| | | | | | | | | |
| | | $ | 12,646,774 | |
| | | | | | | | | |
|
Insurance — 4.9% | |
Aflac, Inc.(1) | | | 215,000 | | | $ | 13,970,700 | |
AXA SA | | | 580,000 | | | | 14,450,951 | |
MetLife, Inc. | | | 210,000 | | | | 9,935,100 | |
Powszechny Zaklad Ubezpieczen SA | | | 128,000 | | | | 19,470,390 | |
Swiss Reinsurance Co., Ltd.(2) | | | 83,000 | | | | 7,285,957 | |
| | | | | | | | | |
| | | $ | 65,113,098 | |
| | | | | | | | | |
|
IT Services — 2.5% | |
Accenture PLC, Class A(1) | | | 395,000 | | | $ | 29,032,500 | |
International Business Machines Corp.(1) | | | 24,000 | | | | 4,301,040 | |
| | | | | | | | | |
| | | $ | 33,333,540 | |
| | | | | | | | | |
|
Machinery — 1.0% | |
Caterpillar, Inc. | | | 158,000 | | | $ | 13,170,880 | |
| | | | | | | | | |
| | | $ | 13,170,880 | |
| | | | | | | | | |
|
Media — 2.8% | |
Walt Disney Co. (The)(1) | | | 300,000 | | | $ | 20,577,000 | |
WPP PLC | | | 770,000 | | | | 16,355,506 | |
| | | | | | | | | |
| | | $ | 36,932,506 | |
| | | | | | | | | |
|
Metals & Mining — 1.3% | |
Freeport-McMoRan Copper & Gold, Inc. | | | 485,000 | | | $ | 17,828,600 | |
| | | | | | | | | |
| | | $ | 17,828,600 | |
| | | | | | | | | |
|
Multi-Utilities — 3.6% | |
National Grid PLC(1) | | | 2,230,000 | | | $ | 28,023,832 | |
Sempra Energy(1) | | | 215,000 | | | | 19,595,100 | |
| | | | | | | | | |
| | | $ | 47,618,932 | |
| | | | | | | | | |
| | | | | | | | |
| Security | | Shares | | | Value | |
| | | | | | | | |
|
Oil, Gas & Consumable Fuels — 9.1% | |
Chevron Corp.(1) | | | 19,000 | | | $ | 2,279,240 | |
ENI SpA(1) | | | 975,000 | | | | 24,752,250 | |
Exxon Mobil Corp. | | | 75,000 | | | | 6,721,500 | |
Marathon Oil Corp. | | | 400,000 | | | | 14,104,000 | |
Occidental Petroleum Corp.(1) | | | 397,000 | | | | 38,143,760 | |
Phillips 66(1) | | | 317,500 | | | | 20,456,525 | |
Total SA | | | 235,000 | | | | 14,417,940 | |
| | | | | | | | | |
| | | $ | 120,875,215 | |
| | | | | | | | | |
|
Pharmaceuticals — 8.7% | |
AstraZeneca PLC | | | 210,000 | | | $ | 11,117,427 | |
Merck & Co., Inc. | | | 347,000 | | | | 15,646,230 | |
Pfizer, Inc.(1) | | | 655,000 | | | | 20,095,400 | |
Roche Holding AG PC(1) | | | 105,800 | | | | 29,257,444 | |
Sanofi(1) | | | 362,000 | | | | 38,597,571 | |
| | | | | | | | | |
| | | $ | 114,714,072 | |
| | | | | | | | | |
|
Real Estate Investment Trusts (REITs) — 0.8% | |
AvalonBay Communities, Inc.(1) | | | 82,322 | | | $ | 10,294,366 | |
| | | | | | | | | |
| | | $ | 10,294,366 | |
| | | | | | | | | |
|
Road & Rail — 1.3% | |
Union Pacific Corp. | | | 117,000 | | | $ | 17,713,800 | |
| | | | | | | | | |
| | | $ | 17,713,800 | |
| | | | | | | | | |
|
Semiconductors & Semiconductor Equipment — 0.9% | |
Analog Devices, Inc.(1) | | | 235,000 | | | $ | 11,585,500 | |
| | | | | | | | | |
| | | $ | 11,585,500 | |
| | | | | | | | | |
|
Software — 3.0% | |
Microsoft Corp.(1) | | | 900,000 | | | $ | 31,815,000 | |
Oracle Corp. | | | 250,000 | | | | 8,375,000 | |
| | | | | | | | | |
| | | $ | 40,190,000 | |
| | | | | | | | | |
|
Specialty Retail — 3.3% | |
Home Depot, Inc. (The) | | | 250,000 | | | $ | 19,472,500 | |
Industria de Diseno Textil SA(1) | | | 80,000 | | | | 13,139,110 | |
Kingfisher PLC | | | 1,730,000 | | | | 10,465,535 | |
| | | | | | | | | |
| | | $ | 43,077,145 | |
| | | | | | | | | |
|
Textiles, Apparel & Luxury Goods — 1.3% | |
Adidas AG(1) | | | 150,000 | | | $ | 17,091,827 | |
| | | | | | | | | |
| | | $ | 17,091,827 | |
| | | | | | | | | |
| | | | |
| | 7 | | See Notes to Financial Statements. |
Eaton Vance
Tax-Advantaged Global Dividend Income Fund
October 31, 2013
Portfolio of Investments — continued
| | | | | | | | |
| Security | | Shares | | | Value | |
| | | | | | | | |
|
Tobacco — 1.6% | |
British American Tobacco PLC | | | 162,000 | | | $ | 8,937,903 | |
Japan Tobacco, Inc. | | | 344,500 | | | | 12,465,278 | |
| | | | | | | | | |
| | | $ | 21,403,181 | |
| | | | | | | | | |
|
Trading Companies & Distributors — 0.4% | |
Mitsui & Co., Ltd. | | | 380,000 | | | $ | 5,428,651 | |
| | | | | | | | | |
| | | $ | 5,428,651 | |
| | | | | | | | | |
|
Wireless Telecommunication Services — 0.5% | |
Vodafone Group PLC ADR | | | 196,000 | | | $ | 7,216,720 | |
| | | | | | | | | |
| | | $ | 7,216,720 | |
| | | | | | | | | |
| |
Total Common Stocks
(identified cost $1,110,489,268) | | | $ | 1,395,351,249 | |
| | | | | | | | | |
|
| Preferred Stocks — 18.3% | |
| | |
| | | | | | | | |
| Security | | Shares | | | Value | |
|
Banks — 1.1% | |
AgriBank FCB, 6.875% to 1/1/24(2)(3)(4) | | | 50,890 | | | $ | 5,112,410 | |
Lloyds Banking Group PLC, 6.657% to 5/21/37(1)(3)(5) | | | 9,897 | | | | 9,793,939 | |
| | | | | | | | | |
| | | $ | 14,906,349 | |
| | | | | | | | | |
|
Capital Markets — 0.6% | |
Affiliated Managers Group, Inc., 6.375% | | | 50,800 | | | $ | 1,188,288 | |
Bank of New York Mellon Corp. (The), 5.20% | | | 79,333 | | | | 1,651,713 | |
Goldman Sachs Group, Inc. (The), Series I, 5.95% | | | 91,800 | | | | 2,056,320 | |
Goldman Sachs Group, Inc. (The), Series J,
5.50% to 5/10/23(3) | | | 123,450 | | | | 2,818,364 | |
| | | | | | | | | |
| | | $ | 7,714,685 | |
| | | | | | | | | |
|
Commercial Banks — 6.7% | |
Barclays Bank PLC, 7.625%(1) | | | 2,560 | | | $ | 2,733,796 | |
Citigroup, Inc., Series B, 5.90% to 2/15/23(3) | | | 3,340 | | | | 3,226,549 | |
CoBank ACB, Series F, 6.25% to 10/1/22(3)(5) | | | 51,100 | | | | 5,087,644 | |
Credit Agricole SA, 8.125% to 9/19/18(3)(5) | | | 1,795 | | | | 1,925,998 | |
Deutsche Bank Contingent Capital Trust III, 7.60% | | | 109,856 | | | | 2,916,677 | |
Farm Credit Bank of Texas,
6.75% to 9/15/23(3)(5) | | | 7,600 | | | | 761,663 | |
Farm Credit Bank of Texas,
Series 1, 10.00%(1) | | | 4,453 | | | | 5,431,268 | |
First Tennessee Bank, 3.75%(5)(6) | | | 2,570 | | | | 1,873,691 | |
HSBC Capital Funding LP, Series 2, 10.176% to 6/30/30(1)(3)(5) | | | 2,517 | | | | 3,691,691 | |
JPMorgan Chase & Co., Series 1, 7.90% to 4/30/18(1)(3) | | | 3,025 | | | | 3,338,893 | |
JPMorgan Chase & Co., Series O, 5.50% | | | 125,773 | | | | 2,728,016 | |
| | | | | | | | |
| Security | | Shares | | | Value | |
| | | | | | | | |
|
Commercial Banks (continued) | |
JPMorgan Chase & Co., Series Q, 5.15% to 5/1/23(3) | | | 3,100 | | | $ | 2,904,373 | |
JPMorgan Chase & Co., Series R, 6.00% to 8/1/23(3) | | | 2,509 | | | | 2,478,474 | |
KeyCorp, Series A, 7.75% | | | 46,185 | | | | 5,912,142 | |
Regions Financial Corp., Series A, 6.375% | | | 254,618 | | | | 5,830,752 | |
Royal Bank of Scotland Group PLC, Series 1, 7.648% to 9/30/31(3) | | | 2,190 | | | | 2,313,923 | |
Royal Bank of Scotland Group PLC, Series T, 7.25% | | | 69,005 | | | | 1,660,950 | |
Standard Chartered PLC,
7.014% to 7/30/37(1)(3)(5) | | | 77.32 | | | | 8,318,471 | |
SunTrust Banks, Inc., Series E, 5.875% | | | 181,521 | | | | 3,937,463 | |
Synovus Financial Corp., Series C, 7.875% to 8/1/18(3) | | | 96,540 | | | | 2,669,572 | |
Texas Capital Bancshares, Inc., 6.50% | | | 147,850 | | | | 3,325,146 | |
Texas Capital Bancshares, Inc., Series A, 6.50% | | | 25,800 | | | | 574,308 | |
Webster Financial Corp., Series E, 6.40% | | | 103,265 | | | | 2,358,831 | |
Wells Fargo & Co., Series L, 7.50% | | | 6,980 | | | | 7,950,220 | |
Zions Bancorporation, Series G,
6.30% to 3/15/23(3) | | | 106,375 | | | | 2,517,098 | |
Zions Bancorporation, Series J,
7.20% to 9/15/23(3) | | | 2,275 | | | | 2,316,177 | |
| | | | | | | | | |
| | | $ | 88,783,786 | |
| | | | | | | | | |
|
Consumer Finance — 1.0% | |
Ally Financial, Inc., Series A, 8.50% to 5/15/16(3) | | | 119,552 | | | $ | 3,219,834 | |
Capital One Financial Corp., Series B, 6.00% | | | 184,900 | | | | 4,121,421 | |
Discover Financial Services, Series B, 6.50% | | | 235,600 | | | | 5,650,277 | |
| | | | | | | | | |
| | | $ | 12,991,532 | |
| | | | | | | | | |
|
Diversified Financial Services — 2.1% | |
Bank of America Corp., Series U,
5.20% to 6/1/23(3) | | | 2,480 | | | $ | 2,317,450 | |
General Electric Capital Corp., Series A, 7.125% to 6/15/22(1)(3) | | | 50.22 | | | | 5,743,855 | |
General Electric Capital Corp., Series B, 6.25% to 12/15/22(1)(3) | | | 27.60 | | | | 2,954,453 | |
KKR Financial Holdings, LLC, Series A, 7.375% | | | 207,500 | | | | 5,135,625 | |
RBS Capital Funding Trust VII, Series G, 6.08% | | | 232,720 | | | | 5,096,568 | |
UBS AG, 7.625%(1) | | | 5,100 | | | | 5,901,912 | |
| | | | | | | | | |
| | | $ | 27,149,863 | |
| | | | | | | | | |
|
Electric Utilities — 1.7% | |
Electricite de France SA, 5.25% to 1/29/23(1)(3)(5) | | | 6,500 | | | $ | 6,488,252 | |
Entergy Arkansas, Inc., 4.90% | | | 52,980 | | | | 1,069,534 | |
Entergy Arkansas, Inc., 6.45% | | | 51,243 | | | | 1,247,449 | |
Entergy Louisiana, LLC, 6.95% | | | 2,855 | | | | 287,284 | |
NextEra Energy Capital Holdings, Inc., Series G, 5.70% | | | 60,500 | | | | 1,323,438 | |
NextEra Energy Capital Holdings, Inc., Series I, 5.125% | | | 84,855 | | | | 1,672,619 | |
Southern California Edison Co., Series D, 6.50% | | | 34,321 | | | | 3,421,375 | |
Southern California Edison Co., Series E, 6.25% to 2/1/22(1)(3) | | | 2,656 | | | | 2,829,049 | |
Virginia Electric and Power Co., 6.12% | | | 47 | | | | 4,795,309 | |
| | | | | | | | | |
| | | $ | 23,134,309 | |
| | | | | | | | | |
| | | | |
| | 8 | | See Notes to Financial Statements. |
Eaton Vance
Tax-Advantaged Global Dividend Income Fund
October 31, 2013
Portfolio of Investments — continued
| | | | | | | | |
| Security | | Shares | | | Value | |
| | | | | | | | |
|
Food Products — 0.8% | |
Dairy Farmers of America, 7.875%(5) | | | 86,230 | | | $ | 9,372,123 | |
Ocean Spray Cranberries, Inc., 6.25%(5) | | | 18,430 | | | | 1,643,726 | |
| | | | | | | | | |
| | | $ | 11,015,849 | |
| | | | | | | | | |
|
Insurance — 1.4% | |
Aspen Insurance Holdings, Ltd.,
5.95% to 7/1/23(3) | | | 38,700 | | | $ | 927,252 | |
Aspen Insurance Holdings, Ltd., 7.25% | | | 95,970 | | | | 2,400,210 | |
Aspen Insurance Holdings, Ltd.,
7.401% to 1/1/17(3) | | | 47,350 | | | | 1,231,573 | |
Endurance Specialty Holdings, Ltd.,
Series B, 7.50% | | | 98,835 | | | | 2,501,514 | |
Montpelier Re Holdings, Ltd., 8.875% | | | 290,735 | | | | 7,884,733 | |
Prudential PLC, 6.50%(1) | | | 3,263 | | | | 3,305,455 | |
| | | | | | | | | |
| | | $ | 18,250,737 | |
| | | | | | | | | |
|
Machinery — 0.5% | |
Stanley Black & Decker, Inc., 5.75% | | | 274,918 | | | $ | 6,194,260 | |
| | | | | | | | | |
| | | $ | 6,194,260 | |
| | | | | | | | | |
|
Multi-Utilities — 0.2% | |
DTE Energy Co., Series C, 5.25% | | | 106,673 | | | $ | 2,224,132 | |
| | | | | | | | | |
| | | $ | 2,224,132 | |
| | | | | | | | | |
|
Pipelines — 0.3% | |
NuStar Logistics LP, 7.625% to 1/15/18(3) | | | 155,960 | | | $ | 4,000,764 | |
| | | | | | | | | |
| | | $ | 4,000,764 | |
| | | | | | | | | |
|
Real Estate Investment Trusts (REITs) — 1.3% | |
CapLease, Inc., Series A, 8.125% | | | 106,290 | | | $ | 2,674,256 | |
Cedar Realty Trust, Inc., Series B, 7.25% | | | 103,900 | | | | 2,401,129 | |
Chesapeake Lodging Trust, Series A, 7.75% | | | 112,990 | | | | 2,758,086 | |
DDR Corp., Series J, 6.50% | | | 259,000 | | | | 5,698,000 | |
Sunstone Hotel Investors, Inc.,
Series D, 8.00%(1) | | | 129,500 | | | | 3,323,294 | |
Taubman Centers, Inc., Series K, 6.25% | | | 38,900 | | | | 839,462 | |
| | | | | | | | | |
| | | $ | 17,694,227 | |
| | | | | | | | | |
|
Telecommunications — 0.1% | |
Centaur Funding Corp., 9.08%(5) | | | 1,321 | | | $ | 1,627,720 | |
| | | | | | | | | |
| | | $ | 1,627,720 | |
| | | | | | | | | |
|
Thrifts & Mortgage Finance — 0.5% | |
Elmira Savings Bank FSB (The), 8.998% to 12/31/17(3) | | | 2,545 | | | $ | 2,289,991 | |
EverBank Financial Corp., Series A, 6.75% | | | 206,800 | | | | 4,547,532 | |
| | | | | | | | | |
| | | $ | 6,837,523 | |
| | | | | | | | | |
| |
Total Preferred Stocks
(identified cost $238,137,967) | | | $ | 242,525,736 | |
| | | | | | | | | |
| | | | | | | | |
| Corporate Bonds & Notes — 5.8% | |
| | |
| | | | | | | | |
| Security | | Principal
Amount
(000’s omitted) | | | Value | |
| | | | | | | | |
|
Chemicals — 0.1% | |
Sinochem Group, 5.00% to 11/2/18, 12/29/49(3)(5) | | $ | 1,290 | | | $ | 1,222,275 | |
| | | | | | | | | |
| | | $ | 1,222,275 | |
| | | | | | | | | |
|
Commercial Banks — 0.8% | |
Banco do Brasil SA, 6.25% to 4/15/24, 12/29/49(3)(5) | | $ | 1,200 | | | $ | 1,011,000 | |
Citigroup Capital III, 7.625%, 12/1/36 | | | 2,515 | | | | 2,816,800 | |
Credit Suisse AG, 6.50%, 8/8/23(5) | | | 2,574 | | | | 2,753,923 | |
Groupe BPCE, 12.50% to 9/30/19,
8/29/49(1)(3)(5) | | | 3,153 | | | | 4,063,429 | |
Regions Financial Corp., 7.375%, 12/10/37 | | | 290 | | | | 315,234 | |
SunTrust Preferred Capital I, 4.00%, 6/29/49(6) | | | 400 | | | | 311,000 | |
| | | | | | | | | |
| | | $ | 11,271,386 | |
| | | | | | | | | |
|
Diversified Financial Services — 0.5% | |
Textron Financial Corp., 6.00% to 2/15/17, 2/15/67(1)(3)(5) | | $ | 7,458 | | | $ | 6,674,910 | |
| | | | | | | | | |
| | | $ | 6,674,910 | |
| | | | | | | | | |
|
Diversified Telecommunication Services — 0.3% | |
Koninklijke KPN NV, 7.00% to 3/28/23, 3/28/73(3)(5) | | $ | 4,417 | | | $ | 4,552,589 | |
| | | | | | | | | |
| | | $ | 4,552,589 | |
| | | | | | | | | |
|
Electric Utilities — 1.1% | |
Enel S.p.A., 8.75% to 9/24/23,
9/24/73(3)(5) | | $ | 5,000 | | | $ | 5,435,250 | |
PPL Capital Funding, Inc., Series A, 6.70% to 3/30/17, 3/30/67(1)(3) | | | 8,600 | | | | 8,692,527 | |
| | | | | | | | | |
| | | $ | 14,127,777 | |
| | | | | | | | | |
|
Insurance — 2.3% | |
Allstate Corp. (The), Series B, 5.75% to 8/15/23, 8/15/53(3) | | $ | 3,862 | | | $ | 3,956,136 | |
MetLife Capital Trust IV,
7.875%, 12/15/67(5) | | | 437 | | | | 505,828 | |
MetLife, Inc., 10.75% to 8/1/39,
8/1/69(1)(3) | | | 2,569 | | | | 3,847,077 | |
QBE Capital Funding II, LP, 6.797% to 6/1/17, 6/29/49(1)(3)(5) | | | 2,115 | | | | 2,141,438 | |
QBE Capital Funding III, Ltd., 7.25% to 5/24/21, 5/24/41(1)(3)(5) | | | 3,513 | | | | 3,702,807 | |
Swiss Re Capital I, LP, 6.854% to 5/25/16, 5/25/49(1)(3)(5) | | | 4,758 | | | | 5,091,060 | |
XL Capital, Ltd., Series E, 6.50% to 4/15/17, 12/29/49(1)(3) | | | 10,964 | | | | 10,810,504 | |
| | | | | | | | | |
| | | $ | 30,054,850 | |
| | | | | | | | | |
| | | | |
| | 9 | | See Notes to Financial Statements. |
Eaton Vance
Tax-Advantaged Global Dividend Income Fund
October 31, 2013
Portfolio of Investments — continued
| | | | | | | | |
| Security | | Principal
Amount
(000’s omitted) | | | Value | |
| | | | | | | | |
|
Pipelines — 0.7% | |
DCP Midstream, LLC, 5.85% to 5/21/23, 5/21/43(3)(5) | | $ | 3,016 | | | $ | 2,835,040 | |
Energy Transfer Partners, LP, 3.283%, 11/1/66(5)(6) | | | 3,324 | | | | 3,024,840 | |
Enterprise Products Operating, LLC, 7.00% to 6/1/17, 6/1/67(1)(3) | | | 2,920 | | | | 3,053,733 | |
| | | | | | | | | |
| | | $ | 8,913,613 | |
| | | | | | | | | |
| |
Total Corporate Bonds & Notes
(identified cost $69,692,305) | | | $ | 76,817,400 | |
| | | | | | | | | |
|
| Short-Term Investments — 0.9% | |
| | |
| | | | | | | | |
| Description | | Interest
(000’s omitted) | | | Value | |
Eaton Vance Cash Reserves Fund, LLC, 0.14%(7) | | $ | 12,596 | | | $ | 12,595,710 | |
| | | | | | | | | |
| |
Total Short-Term Investments
(identified cost $12,595,710) | | | $ | 12,595,710 | |
| | | | | | | | | |
| |
Total Investments — 130.2%
(identified cost $1,430,915,250) | | | $ | 1,727,290,095 | |
| | | | | | | | | |
| |
Other Assets, Less Liabilities — (30.2)% | | | $ | (400,391,169 | ) |
| | | | | | | | | |
| |
Net Assets — 100.0% | | | $ | 1,326,898,926 | |
| | | | | | | | | |
The percentage shown for each investment category in the Portfolio of Investments is based on net assets.
| | | | |
| ADR | | – | | American Depositary Receipt |
| PC | | – | | Participation Certificate |
| (1) | Security has been segregated as collateral with the custodian for borrowings under the Committed Facility Agreement. |
| (2) | Non-income producing security. |
| (3) | Security converts to floating rate after the indicated fixed-rate coupon period. |
| (4) | When-issued security. |
| (5) | Security exempt from registration pursuant to Rule 144A under the Securities Act of 1933. These securities may be sold in certain transactions (normally to qualified institutional buyers) and remain exempt from registration. At October 31, 2013, the aggregate value of these securities is $93,599,307 or 7.1% of the Fund’s net assets. |
| (6) | Variable rate security. The stated interest rate represents the rate in effect at October 31, 2013. |
| (7) | Affiliated investment company, available to Eaton Vance portfolios and funds, which invests in high quality, U.S. dollar denominated money market instruments. The rate shown is the annualized seven-day yield as of October 31, 2013. |
| | | | | | | | |
| Country Concentration of Portfolio | |
| | |
| | | | | | | | |
| Country | | Percentage of
Total Investments | | | Value | |
United States | | | 58.8 | % | | $ | 1,016,252,314 | |
France | | | 9.4 | | | | 163,101,178 | |
United Kingdom | | | 8.5 | | | | 146,545,092 | |
Japan | | | 5.5 | | | | 95,001,370 | |
Switzerland | | | 3.0 | | | | 52,328,614 | |
Netherlands | | | 2.2 | | | | 38,236,563 | |
Italy | | | 1.8 | | | | 30,187,500 | |
Germany | | | 1.7 | | | | 28,877,856 | |
Ireland | | | 1.6 | | | | 26,926,200 | |
Belgium | | | 1.3 | | | | 21,976,685 | |
Poland | | | 1.1 | | | | 19,470,390 | |
Sweden | | | 1.0 | | | | 17,982,769 | |
Bermuda | | | 0.9 | | | | 14,945,282 | |
Norway | | | 0.8 | | | | 14,179,400 | |
Spain | | | 0.8 | | | | 13,139,110 | |
Cayman Islands | | | 0.7 | | | | 12,438,224 | |
Israel | | | 0.4 | | | | 7,624,028 | |
Australia | | | 0.3 | | | | 5,844,245 | |
China | | | 0.1 | | | | 1,222,275 | |
Brazil | | | 0.1 | | | | 1,011,000 | |
| | | | | | | | | |
Total Investments | | | 100.0 | % | | $ | 1,727,290,095 | |
| | | | | | | | | |
| | | | |
| | 10 | | See Notes to Financial Statements. |
Eaton Vance
Tax-Advantaged Global Dividend Income Fund
October 31, 2013
Statement of Assets and Liabilities
| | | | |
| Assets | | October 31, 2013 | |
Unaffiliated investments, at value (identified cost, $1,418,319,540) | | $ | 1,714,694,385 | |
Affiliated investment, at value (identified cost, $12,595,710) | | | 12,595,710 | |
Cash | | | 41,371 | |
Restricted cash* | | | 1,560,000 | |
Foreign currency, at value (identified cost, $8,037,409) | | | 7,993,878 | |
Dividends and interest receivable | | | 4,664,049 | |
Interest receivable from affiliated investment | | | 975 | |
Receivable for investments sold | | | 21,009,936 | |
Receivable for open forward foreign currency exchange contracts | | | 955,419 | |
Tax reclaims receivable | | | 4,249,175 | |
Total assets | | $ | 1,767,764,898 | |
| |
| Liabilities | | | | |
Notes payable | | $ | 425,000,000 | |
Payable for investments purchased | | | 8,998,945 | |
Payable for when-issued securities | | | 5,096,803 | |
Payable to affiliates: | | | | |
Investment adviser fee | | | 1,239,216 | |
Trustees’ fees | | | 5,453 | |
Accrued expenses | | | 525,555 | |
Total liabilities | | $ | 440,865,972 | |
Net Assets | | $ | 1,326,898,926 | |
| |
| Sources of Net Assets | | | | |
Common shares, $0.01 par value, unlimited number of shares authorized, 76,300,214 shares issued and outstanding | | $ | 763,002 | |
Additional paid-in capital | | | 1,447,517,855 | |
Accumulated net realized loss | | | (421,315,686 | ) |
Accumulated undistributed net investment income | | | 2,320,747 | |
Net unrealized appreciation | | | 297,613,008 | |
Net Assets | | $ | 1,326,898,926 | |
| |
| Net Asset Value | | | | |
($1,326,898,926 ÷ 76,300,214 common shares issued and outstanding) | | $ | 17.39 | |
| * | Represents restricted cash on deposit at the custodian for open derivative contracts. |
| | | | |
| | 11 | | See Notes to Financial Statements. |
Eaton Vance
Tax-Advantaged Global Dividend Income Fund
October 31, 2013
Statement of Operations
| | | | |
| Investment Income | | Year Ended October 31, 2013 | |
Dividends (net of foreign taxes, $7,973,666) | | $ | 109,001,145 | |
Interest | | | 4,504,263 | |
Interest income allocated from affiliated investment | | | 13,743 | |
Expenses allocated from affiliated investment | | | (1,606 | ) |
Total investment income | | $ | 113,517,545 | |
| |
| Expenses | | | | |
Investment adviser fee | | $ | 13,982,212 | |
Trustees’ fees and expenses | | | 63,943 | |
Custodian fee | | | 558,667 | |
Transfer and dividend disbursing agent fees | | | 19,015 | |
Legal and accounting services | | | 113,342 | |
Printing and postage | | | 137,146 | |
Interest expense and fees | | | 3,717,127 | |
Miscellaneous | | | 224,435 | |
Total expenses | | $ | 18,815,887 | |
Deduct — | | | | |
Reduction of custodian fee | | $ | 65 | |
Total expense reductions | | $ | 65 | |
| |
Net expenses | | $ | 18,815,822 | |
| |
Net investment income | | $ | 94,701,723 | |
| |
| Realized and Unrealized Gain (Loss) | | | | |
Net realized gain (loss) — | | | | |
Investment transactions | | $ | 116,045,930 | |
Investment transactions allocated from affiliated investment | | | 478 | |
Proceeds from securities litigation settlements | | | 796,180 | |
Foreign currency and forward foreign currency exchange contract transactions | | | (2,332,886 | ) |
Net realized gain | | $ | 114,509,702 | |
Change in unrealized appreciation (depreciation) — | | | | |
Investments | | $ | 81,140,180 | |
Foreign currency and forward foreign currency exchange contracts | | | 978,783 | |
Net change in unrealized appreciation (depreciation) | | $ | 82,118,963 | |
| |
Net realized and unrealized gain | | $ | 196,628,665 | |
| |
Net increase in net assets from operations | | $ | 291,330,388 | |
| | | | |
| | 12 | | See Notes to Financial Statements. |
Eaton Vance
Tax-Advantaged Global Dividend Income Fund
October 31, 2013
Statements of Changes in Net Assets
| | | | | | | | |
| | | Year Ended October 31, | |
| Increase (Decrease) in Net Assets | | 2013 | | | 2012 | |
From operations — | | | | | | | | |
Net investment income | | $ | 94,701,723 | | | $ | 89,200,431 | |
Net realized gain from investment, foreign currency, forward foreign currency exchange contract transactions and proceeds from securities litigation settlements | | | 114,509,702 | | | | 17,039,150 | |
Net change in unrealized appreciation (depreciation) from investments, foreign currency and forward foreign currency exchange contracts | | | 82,118,963 | | | | 19,884,740 | |
Net increase in net assets from operations | | $ | 291,330,388 | | | $ | 126,124,321 | |
Distributions to shareholders — | | | | | | | | |
From net investment income | | $ | (93,849,264 | ) | | $ | (93,849,264 | ) |
Total distributions | | $ | (93,849,264 | ) | | $ | (93,849,264 | ) |
| | |
Net increase in net assets | | $ | 197,481,124 | | | $ | 32,275,057 | |
| | |
| Net Assets | | | | | | | | |
At beginning of year | | $ | 1,129,417,802 | | | $ | 1,097,142,745 | |
At end of year | | $ | 1,326,898,926 | | | $ | 1,129,417,802 | |
| | |
Accumulated undistributed net investment income
included in net assets | | | | | | | | |
At end of year | | $ | 2,320,747 | | | $ | 3,180,111 | |
| | | | |
| | 13 | | See Notes to Financial Statements. |
Eaton Vance
Tax-Advantaged Global Dividend Income Fund
October 31, 2013
Statement of Cash Flows
| | | | |
| Cash Flows From Operating Activities | | Year Ended October 31, 2013 | |
Net increase in net assets from operations | | $ | 291,330,388 | |
Adjustments to reconcile net increase in net assets from operations to net cash provided by operating activities: | | | | |
Investments purchased | | | (1,700,511,450 | ) |
Investments sold | | | 1,709,823,462 | |
Increase in short-term investments, net | | | (3,939,314 | ) |
Net amortization/accretion of premium (discount) | | | 67,568 | |
Increase in restricted cash | | | (865,505 | ) |
Decrease in dividends and interest receivable | | | 247,399 | |
Decrease in interest receivable from affiliated investment | | | 78 | |
Increase in receivable for open forward foreign currency exchange contracts | | | (952,535 | ) |
Increase in tax reclaims receivable | | | (349,282 | ) |
Decrease in payable for open forward foreign currency exchange contracts | | | (3,744 | ) |
Increase in payable to affiliate for investment adviser fee | | | 111,204 | |
Increase in payable to affiliate for Trustees’ fees | | | 465 | |
Decrease in accrued expenses | | | (246,799 | ) |
Net change in unrealized (appreciation) depreciation from investments | | | (81,140,180 | ) |
Net realized gain from investments | | | (116,045,930 | ) |
Net cash provided by operating activities | | $ | 97,525,825 | |
| |
| Cash Flows From Financing Activities | | | | |
Distributions paid, net of reinvestments | | $ | (93,849,264 | ) |
Proceeds from notes payable | | | 425,000,000 | |
Repayment of notes payable | | | (425,000,000 | ) |
Net cash used in financing activities | | $ | (93,849,264 | ) |
| |
Net increase in cash* | | $ | 3,676,561 | |
| |
Cash at beginning of year(1) | | $ | 4,358,688 | |
| |
Cash at end of year(1) | | $ | 8,035,249 | |
| |
| Supplemental disclosure of cash flow information: | | | | |
Cash paid for interest and fees on borrowings | | $ | 3,874,210 | |
| (1) | Balance includes foreign currency, at value. |
| * | Includes net change in unrealized appreciation (depreciation) on foreign currency of $(87,465). |
| | | | |
| | 14 | | See Notes to Financial Statements. |
Eaton Vance
Tax-Advantaged Global Dividend Income Fund
October 31, 2013
Financial Highlights
| | | | | | | | | | | | | | | | | | | | |
| | | Year Ended October 31, | |
| | | 2013 | | | 2012 | | | 2011 | | | 2010 | | | 2009 | |
Net asset value — Beginning of year | | $ | 14.800 | | | $ | 14.380 | | | $ | 15.150 | | | $ | 13.890 | | | $ | 14.340 | |
| | | | | |
| Income (Loss) From Operations | | | | | | | | | | | | | | | | | | | | |
Net investment income(1) | | $ | 1.241 | (2) | | $ | 1.169 | | | $ | 1.333 | | | $ | 1.242 | | | $ | 1.114 | |
Net realized and unrealized gain (loss) | | | 2.579 | | | | 0.481 | | | | (0.873 | ) | | | 1.248 | | | | (0.108 | ) |
| | | | | |
Total income from operations | | $ | 3.820 | | | $ | 1.650 | | | $ | 0.460 | | | $ | 2.490 | | | $ | 1.006 | |
| | | | | |
| Less Distributions | | | | | | | | | | | | | | | | | | | | |
From net investment income | | $ | (1.230 | ) | | $ | (1.230 | ) | | $ | (1.230 | ) | | $ | (1.230 | ) | | $ | (1.456 | ) |
| | | | | |
Total distributions | | $ | (1.230 | ) | | $ | (1.230 | ) | | $ | (1.230 | ) | | $ | (1.230 | ) | | $ | (1.456 | ) |
| | | | | |
Net asset value — End of year | | $ | 17.390 | | | $ | 14.800 | | | $ | 14.380 | | | $ | 15.150 | | | $ | 13.890 | |
| | | | | |
Market value — End of year | | $ | 16.040 | | | $ | 14.010 | | | $ | 13.340 | | | $ | 14.340 | | | $ | 12.550 | |
| | | | | |
Total Investment Return on Net Asset Value(3) | | | 27.29 | % | | | 12.64 | % | | | 3.45 | % | | | 19.46 | % | | | 11.37 | % |
| | | | | |
Total Investment Return on Market Value(3) | | | 24.03 | % | | | 14.94 | % | | | 1.39 | % | | | 25.06 | % | | | 17.40 | % |
| | | | | |
| Ratios/Supplemental Data | | | | | | | | | | | | | | | | | | | | |
Net assets, end of year (000’s omitted) | | $ | 1,326,899 | | | $ | 1,129,418 | | | $ | 1,097,143 | | | $ | 1,155,754 | | | $ | 1,059,505 | |
Ratios (as a percentage of average daily net assets): | | | | | | | | | | | | | | | | | | | | |
Expenses excluding interest and fees(4) | | | 1.24 | % | | | 1.26 | % | | | 1.17 | % | | | 1.10 | % | | | 1.07 | % |
Interest and fee expense | | | 0.30 | % | | | 0.48 | % | | | 0.38 | % | | | 0.41 | % | | | 0.87 | % |
Total expenses(4) | | | 1.54 | % | | | 1.74 | % | | | 1.55 | % | | | 1.51 | % | | | 1.94 | % |
Net investment income | | | 7.73 | %(2) | | | 8.08 | % | | | 8.69 | % | | | 8.71 | % | | | 9.06 | % |
Portfolio Turnover | | | 105 | % | | | 120 | % | | | 95 | % | | | 103 | % | | | 87 | % |
Senior Securities: | | | | | | | | | | | | | | | | | | | | |
Total notes payable outstanding (in 000’s) | | $ | 425,000 | | | $ | 425,000 | | | $ | 425,000 | | | $ | 402,000 | | | $ | 339,000 | |
Asset coverage per $1,000 of notes payable(5) | | $ | 4,122 | | | $ | 3,657 | | | $ | 3,582 | | | $ | 3,875 | | | $ | 4,125 | |
| (1) | Computed using average shares outstanding. |
| (2) | Net investment income per share reflects special dividends which amounted to $0.260 per share. Excluding special dividends, the ratio of net investment income to average daily net assets would have been 6.11%. |
| (3) | Returns are historical and are calculated by determining the percentage change in net asset value or market value with all distributions reinvested. Distributions are assumed to be reinvested at prices obtained under the Fund’s dividend reinvestment plan. |
| (4) | Excludes the effect of custody fee credits, if any, of less than 0.005%. |
| (5) | Calculated by subtracting the Fund’s total liabilities (not including the notes payable) from the Fund’s total assets, and dividing the result by the notes payable balance in thousands. |
| | | | |
| | 15 | | See Notes to Financial Statements. |
Eaton Vance
Tax-Advantaged Global Dividend Income Fund
October 31, 2013
Notes to Financial Statements
1 Significant Accounting Policies
Eaton Vance Tax-Advantaged Global Dividend Income Fund (the Fund) is a Massachusetts business trust registered under the Investment Company Act of 1940, as amended (the 1940 Act), as a diversified, closed-end management investment company. The Fund’s investment objective is to provide a high level of after-tax total return consisting primarily of tax-advantaged dividend income and capital appreciation. The Fund pursues its objective by investing primarily in dividend-paying common and preferred stocks.
The following is a summary of significant accounting policies of the Fund. The policies are in conformity with accounting principles generally accepted in the United States of America.
A Investment Valuation — The following methodologies are used to determine the market value or fair value of investments.
Equity Securities. Equity securities (including common shares of closed-end investment companies) listed on a U.S. securities exchange generally are valued at the last sale or closing price on the day of valuation or, if no sales took place on such date, at the mean between the closing bid and asked prices therefore on the exchange where such securities are principally traded. Equity securities listed on the NASDAQ Global or Global Select Market generally are valued at the NASDAQ official closing price. Unlisted or listed securities for which closing sales prices or closing quotations are not available are valued at the mean between the latest available bid and asked prices or, in the case of preferred equity securities that are not listed or traded in the over-the-counter market, by a third party pricing service that will use various techniques that consider factors including, but not limited to, prices or yields of securities with similar characteristics, benchmark yields, broker/dealer quotes, quotes of underlying common stock, issuer spreads, as well as industry and economic events. The value of preferred equity securities that are valued by a pricing service on a bond basis will be adjusted by an income factor, to be determined by the investment adviser, to reflect the next anticipated regular dividend.
Debt Obligations. Debt obligations (including short-term obligations with a remaining maturity of more than sixty days) are generally valued on the basis of valuations provided by third party pricing services, as derived from such services’ pricing models. Inputs to the models may include, but are not limited to, reported trades, executable bid and asked prices, broker/dealer quotations, prices or yields of securities with similar characteristics, benchmark curves or information pertaining to the issuer, as well as industry and economic events. The pricing services may use a matrix approach, which considers information regarding securities with similar characteristics to determine the valuation for a security. Short-term obligations purchased with a remaining maturity of sixty days or less are generally valued at amortized cost, which approximates market value.
Derivatives. Forward foreign currency exchange contracts are generally valued at the mean of the average bid and average asked prices that are reported by currency dealers to a third party pricing service at the valuation time. Such third party pricing service valuations are supplied for specific settlement periods and the Fund’s forward foreign currency exchange contracts are valued at an interpolated rate between the closest preceding and subsequent settlement period reported by the third party pricing service.
Foreign Securities and Currencies. Foreign securities and currencies are valued in U.S. dollars, based on foreign currency exchange rate quotations supplied by a third party pricing service. The pricing service uses a proprietary model to determine the exchange rate. Inputs to the model include reported trades and implied bid/ask spreads. The daily valuation of exchange-traded foreign securities generally is determined as of the close of trading on the principal exchange on which such securities trade. Events occurring after the close of trading on foreign exchanges may result in adjustments to the valuation of foreign securities to more accurately reflect their fair value as of the close of regular trading on the New York Stock Exchange. When valuing foreign equity securities that meet certain criteria, the Fund’s Trustees have approved the use of a fair value service that values such securities to reflect market trading that occurs after the close of the applicable foreign markets of comparable securities or other instruments that have a strong correlation to the fair-valued securities.
Affiliated Fund. The Fund may invest in Eaton Vance Cash Reserves Fund, LLC (Cash Reserves Fund), an affiliated investment company managed by Eaton Vance Management (EVM). The value of the Fund’s investment in Cash Reserves Fund reflects the Fund’s proportionate interest in its net assets. Cash Reserves Fund generally values its investment securities utilizing the amortized cost valuation technique in accordance with Rule 2a-7 under the 1940 Act. This technique involves initially valuing a portfolio security at its cost and thereafter assuming a constant amortization to maturity of any discount or premium. If amortized cost is determined not to approximate fair value, Cash Reserves Fund may value its investment securities in the same manner as debt obligations described above.
Fair Valuation. Investments for which valuations or market quotations are not readily available or are deemed unreliable are valued at fair value using methods determined in good faith by or at the direction of the Trustees of the Fund in a manner that fairly reflects the security’s value, or the amount that the Fund might reasonably expect to receive for the security upon its current sale in the ordinary course. Each such determination is based on a consideration of relevant factors, which are likely to vary from one pricing context to another. These factors may include, but are not limited to, the type of security, the existence of any contractual restrictions on the security’s disposition, the price and extent of public trading in similar securities of the issuer or of comparable companies or entities, quotations or relevant information obtained from broker/dealers or other market participants, information obtained from the issuer, analysts, and/or the appropriate stock exchange (for exchange-traded securities), an analysis of the company’s or entity’s financial condition, and an evaluation of the forces that influence the issuer and the market(s) in which the security is purchased and sold.
B Investment Transactions — Investment transactions for financial statement purposes are accounted for on a trade date basis. Realized gains and losses on investments sold are determined on the basis of identified cost.
C Income — Dividend income is recorded on the ex-dividend date for dividends received in cash and/or securities. However, if the ex-dividend date has passed, certain dividends from foreign securities are recorded as the Fund is informed of the ex-dividend date. Withholding taxes on foreign dividends and
Eaton Vance
Tax-Advantaged Global Dividend Income Fund
October 31, 2013
Notes to Financial Statements — continued
capital gains have been provided for in accordance with the Fund’s understanding of the applicable countries’ tax rules and rates. Interest income is recorded on the basis of interest accrued, adjusted for amortization of premium or accretion of discount.
D Federal Taxes — The Fund’s policy is to comply with the provisions of the Internal Revenue Code applicable to regulated investment companies and to distribute to shareholders each year substantially all of its net investment income, and all or substantially all of its net realized capital gains. Accordingly, no provision for federal income or excise tax is necessary.
At October 31, 2013, the Fund, for federal income tax purposes, had a capital loss carryforward of $418,855,597 which will reduce its taxable income arising from future net realized gains on investment transactions, if any, to the extent permitted by the Internal Revenue Code, and thus will reduce the amount of distributions to shareholders, which would otherwise be necessary to relieve the Fund of any liability for federal income or excise tax. Such capital loss carryforward will expire on October 31, 2016 ($175,153,567), October 31, 2017 ($211,946,849) and October 31, 2018 ($31,755,181). In addition, such capital loss carryforward cannot be utilized prior to the utilization of new capital losses, if any, created after October 31, 2013.
During the year ended October 31, 2013, a capital loss carryforward of $116,675,728 was utilized to offset net realized gains by the Fund.
As of October 31, 2013, the Fund had no uncertain tax positions that would require financial statement recognition, de-recognition, or disclosure. The Fund files a U.S. federal income tax return annually after its fiscal year-end, which is subject to examination by the Internal Revenue Service for a period of three years from the date of filing.
E Expense Reduction — State Street Bank and Trust Company (SSBT) serves as custodian of the Fund. Pursuant to the custodian agreement, SSBT receives a fee reduced by credits, which are determined based on the average daily cash balance the Fund maintains with SSBT. All credit balances, if any, used to reduce the Fund’s custodian fees are reported as a reduction of expenses in the Statement of Operations.
F Foreign Currency Translation — Investment valuations, other assets, and liabilities initially expressed in foreign currencies are translated each business day into U.S. dollars based upon current exchange rates. Purchases and sales of foreign investment securities and income and expenses denominated in foreign currencies are translated into U.S. dollars based upon currency exchange rates in effect on the respective dates of such transactions. Recognized gains or losses on investment transactions attributable to changes in foreign currency exchange rates are recorded for financial statement purposes as net realized gains and losses on investments. That portion of unrealized gains and losses on investments that results from fluctuations in foreign currency exchange rates is not separately disclosed.
G Use of Estimates — The preparation of the financial statements in conformity with accounting principles generally accepted in the United States of America requires management to make estimates and assumptions that affect the reported amounts of assets and liabilities at the date of the financial statements and the reported amounts of income and expense during the reporting period. Actual results could differ from those estimates.
H Indemnifications — Under the Fund’s organizational documents, its officers and Trustees may be indemnified against certain liabilities and expenses arising out of the performance of their duties to the Fund. Under Massachusetts law, if certain conditions prevail, shareholders of a Massachusetts business trust (such as the Fund) could be deemed to have personal liability for the obligations of the Fund. However, the Fund’s Declaration of Trust contains an express disclaimer of liability on the part of Fund shareholders and the By-laws provide that the Fund shall assume the defense on behalf of any Fund shareholders. Moreover, the By-laws also provide for indemnification out of Fund property of any shareholder held personally liable solely by reason of being or having been a shareholder for all loss or expense arising from such liability. Additionally, in the normal course of business, the Fund enters into agreements with service providers that may contain indemnification clauses. The Fund’s maximum exposure under these arrangements is unknown as this would involve future claims that may be made against the Fund that have not yet occurred.
I Forward Foreign Currency Exchange Contracts — The Fund may enter into forward foreign currency exchange contracts for the purchase or sale of a specific foreign currency at a fixed price on a future date. The forward foreign currency exchange contracts are adjusted by the daily exchange rate of the underlying currency and any gains or losses are recorded as unrealized until such time as the contracts have been closed. Risks may arise upon entering these contracts from the potential inability of counterparties to meet the terms of their contracts and from movements in the value of a foreign currency relative to the U.S. dollar.
J When-Issued Securities and Delayed Delivery Transactions — The Fund may purchase or sell securities on a delayed delivery or when-issued basis. Payment and delivery may take place after the customary settlement period for that security. At the time the transaction is negotiated, the price of the security that will be delivered is fixed. The Fund maintains security positions for these commitments such that sufficient liquid assets will be available to make payments upon settlement. Securities purchased on a delayed delivery or when-issued basis are marked-to-market daily and begin earning interest on settlement date. Losses may arise due to changes in the market value of the underlying securities or if the counterparty does not perform under the contract.
K Statement of Cash Flows — The cash amount shown in the Statement of Cash Flows of the Fund is the amount included in the Fund’s Statement of Assets and Liabilities and represents the unrestricted cash on hand at its custodian and does not include any short-term investments.
Eaton Vance
Tax-Advantaged Global Dividend Income Fund
October 31, 2013
Notes to Financial Statements — continued
2 Distributions to Shareholders
The Fund intends to make monthly distributions of net investment income to common shareholders. In addition, at least annually, the Fund intends to distribute all or substantially all of its net realized capital gains (reduced by available capital loss carryforwards from prior years). Distributions are recorded on the ex-dividend date. The Fund distinguishes between distributions on a tax basis and a financial reporting basis. Accounting principles generally accepted in the United States of America require that only distributions in excess of tax basis earnings and profits be reported in the financial statements as a return of capital. Permanent differences between book and tax accounting relating to distributions are reclassified to paid-in capital. For tax purposes, distributions from short-term capital gains are considered to be from ordinary income.
The tax character of distributions declared for the years ended October 31, 2013 and October 31, 2012 was as follows:
| | | | | | | | |
| | | Year Ended October 31, | |
| | | 2013 | | | 2012 | |
| | |
Distributions declared from: | | | | | | | | |
Ordinary income | | $ | 93,849,264 | | | $ | 93,849,264 | |
During the year ended October 31, 2013, accumulated net realized loss was decreased by $1,711,823 and accumulated undistributed net investment income was decreased by $1,711,823 due to differences between book and tax accounting, primarily for foreign currency gain (loss), accretion of market discount, investments in partnerships and distributions from real estate investment trusts (REITs). These reclassifications had no effect on the net assets or net asset value per share of the Fund.
As of October 31, 2013, the components of distributable earnings (accumulated losses) and unrealized appreciation (depreciation) on a tax basis were as follows:
| | | | |
Undistributed ordinary income | | $ | 1,912,473 | |
Capital loss carryforward | | $ | (418,855,597 | ) |
Net unrealized appreciation | | $ | 295,561,193 | |
The differences between components of distributable earnings (accumulated losses) on a tax basis and the amounts reflected in the Statement of Assets and Liabilities are primarily due to wash sales, distributions from REITs, accretion of market discount, investments in partnerships and foreign currency transactions.
3 Investment Adviser Fee and Other Transactions with Affiliates
The investment adviser fee is earned by EVM as compensation for management and investment advisory services rendered to the Fund. Pursuant to the investment advisory agreement and subsequent fee reduction agreement between the Fund and EVM, the fee is computed at an annual rate of 0.85% of the Fund’s average daily gross assets up to and including $1.5 billion, 0.83% over $1.5 billion up to and including $3 billion, and at reduced rates on daily gross assets over $3 billion, and is payable monthly. Gross assets as referred to herein represent net assets plus obligations attributable to investment leverage. The fee reduction cannot be terminated without the consent of a majority of Trustees and a majority of shareholders. For the year ended October 31, 2013, the Fund’s investment adviser fee amounted to $13,982,212, or 0.85% of the Fund’s average daily gross assets. The Fund invests its cash in Cash Reserves Fund. EVM does not currently receive a fee for advisory services provided to Cash Reserves Fund. EVM also serves as administrator of the Fund, but receives no compensation.
Trustees and officers of the Fund who are members of EVM’s organization receive remuneration for their services to the Fund out of the investment adviser fee. Trustees of the Fund who are not affiliated with EVM may elect to defer receipt of all or a percentage of their annual fees in accordance with the terms of the Trustees Deferred Compensation Plan. For the year ended October 31, 2013, no significant amounts have been deferred. Certain officers and Trustees of the Fund are officers of EVM.
4 Purchases and Sales of Investments
Purchases and sales of investments, other than short-term obligations, aggregated $1,699,344,478 and $1,722,875,062, respectively, for the year ended October 31, 2013.
5 Common Shares of Beneficial Interest
The Fund may issue common shares pursuant to its dividend reinvestment plan. There were no common shares issued by the Fund for the years ended October 31, 2013 and October 31, 2012.
Eaton Vance
Tax-Advantaged Global Dividend Income Fund
October 31, 2013
Notes to Financial Statements — continued
6 Federal Income Tax Basis of Investments
The cost and unrealized appreciation (depreciation) of investments of the Fund at October 31, 2013, as determined on a federal income tax basis, were as follows:
| | | | |
| |
Aggregate cost | | $ | 1,431,988,117 | |
| |
Gross unrealized appreciation | | $ | 307,842,991 | |
Gross unrealized depreciation | | | (12,541,013 | ) |
| |
Net unrealized appreciation | | $ | 295,301,978 | |
7 Financial Instruments
The Fund may trade in financial instruments with off-balance sheet risk in the normal course of its investing activities. These financial instruments may include forward foreign currency exchange contracts and may involve, to a varying degree, elements of risk in excess of the amounts recognized for financial statement purposes. The notional or contractual amounts of these instruments represent the investment the Fund has in particular classes of financial instruments and do not necessarily represent the amounts potentially subject to risk. The measurement of the risks associated with these instruments is meaningful only when all related and offsetting transactions are considered.
A summary of obligations under these financial instruments at October 31, 2013 is as follows:
| | | | | | | | | | | | | | | | | | |
| Forward Foreign Currency Exchange Contracts | |
| Settlement Date | | Deliver | | In Exchange For | | Counterparty | | Unrealized
Appreciation | | | Unrealized
(Depreciation) | | | Net Unrealized
Appreciation | |
| | | | | | |
| 11/29/13 | | Euro
16,710,000 | | United States Dollar
22,964,236 | | Citibank NA | | $ | 274,992 | | | $ | — | | | $ | 274,992 | |
| 11/29/13 | | Euro
16,710,000 | | United States Dollar
22,967,611 | | Standard Chartered Bank | | | 278,367 | | | | — | | | | 278,367 | |
| 11/29/13 | | Euro
16,710,000 | | United States Dollar
22,964,286 | | State Street Bank and Trust Co. | | | 275,042 | | | | — | | | | 275,042 | |
| 11/29/13 | | Japanese Yen
9,297,650,000 | | United States Dollar
94,693,675 | | Standard Chartered Bank | | | 127,018 | | | | — | | | | 127,018 | |
| | | | | | |
| | | | | | | | | $ | 955,419 | | | $ | — | | | $ | 955,419 | |
At October 31, 2013, the Fund had sufficient cash and/or securities to cover commitments under these contracts.
The Fund is subject to foreign exchange risk in the normal course of pursuing its investment objective. Because the Fund holds foreign currency denominated investments, the value of these investments and related receivables and payables may change due to future changes in foreign currency exchange rates. To hedge against this risk, the Fund enters into forward foreign currency exchange contracts. The Fund also enters into such contracts as a substitute for the purchase of securities or currencies.
The Fund enters into forward foreign currency exchange contracts that may contain provisions whereby the counterparty may terminate the contract under certain conditions, including but not limited to a decline in the Fund’s net assets below a certain level over a certain period of time, which would trigger a payment by the Fund for those derivatives in a liability position. At October 31, 2013, the Fund had no open derivatives with credit-related contingent features in a net liability position. The aggregate fair value of assets pledged as collateral by the Fund was $1,560,000 at October 31, 2013.
The non-exchange traded derivatives in which the Fund invests, including forward foreign currency exchange contracts, are subject to the risk that the counterparty to the contract fails to perform its obligations under the contract. At October 31, 2013, the maximum amount of loss the Fund would incur due to counterparty risk was $955,419, representing the fair value of such derivatives in an asset position, with the highest amount from any one counterparty being $405,385. To mitigate this risk, the Fund has entered into master netting agreements with substantially all its derivative counterparties, which allows it and a counterparty to aggregate amounts owed by each of them for derivative transactions under the agreement into a single net amount payable by either the Fund or the counterparty. Counterparties may be required to pledge collateral in the form of cash, U.S. Government securities or highly-rated bonds for the benefit of the Fund if the net amount due from the counterparty with respect to a derivative contract exceeds a certain threshold. The amount of collateral posted by the counterparties with respect to such contracts would also reduce the amount of any loss incurred.
Eaton Vance
Tax-Advantaged Global Dividend Income Fund
October 31, 2013
Notes to Financial Statements — continued
The fair value of open derivative instruments (not considered to be hedging instruments for accounting disclosure purposes) and whose primary underlying risk exposure is foreign exchange risk at October 31, 2013 was as follows:
| | | | | | | | |
| | | Fair Value | |
| Derivative | | Asset Derivative | | | Liability Derivative | |
| | |
Forward foreign currency exchange contracts | | $ | 955,419 | (1) | | $ | — | |
| (1) | Statement of Assets and Liabilities location: Receivable for open forward foreign currency exchange contracts; Net unrealized appreciation. |
The effect of derivative instruments (not considered to be hedging instruments for accounting disclosure purposes) on the Statement of Operations and whose primary underlying risk exposure is foreign exchange risk for the year ended October 31, 2013 was as follows:
| | | | | | | | |
| Derivative | | Realized Gain (Loss)
on Derivatives Recognized
in Income | | | Change in Unrealized
Appreciation (Depreciation) on
Derivatives Recognized in Income | |
| | |
Forward foreign currency exchange contracts | | $ | (2,311,426 | )(1) | | $ | 956,279 | (2) |
| (1) | Statement of Operations location: Net realized gain (loss) – Foreign currency and forward foreign currency exchange contract transactions. |
| (2) | Statement of Operations location: Change in unrealized appreciation (depreciation) – Foreign currency and forward foreign currency exchange contracts. |
The average notional amount of forward foreign currency exchange contracts outstanding during the year ended October 31, 2013, which is indicative of the volume of this derivative type, was approximately $134,810,000.
8 Committed Facility Agreement
Effective February 6, 2013, the Fund entered into a Committed Facility Agreement (the Agreement) with a major financial institution that allows it to borrow up to $500 million over a rolling 180 calendar day period. Interest is charged at a rate above 1-month LIBOR and is payable monthly. The Fund is charged a commitment fee of 0.25% per annum on the unused portion of the commitment if outstanding borrowings are less than 85% of the borrowing limit. Under the terms of the Agreement, the Fund is required to satisfy certain collateral requirements and maintain a certain level of net assets. Prior to February 6, 2013, the Fund had a Committed Facility Agreement with another major financial institution to borrow up to $466 million. Under the terms of such agreement, the Fund was charged interest at a rate above 3-month LIBOR and was payable monthly. The Fund was charged a commitment fee of 0.55% per annum on the unused portion of the commitment. At October 31, 2013, the Fund had borrowings outstanding under the Agreement of $425 million at an interest rate of 0.77%. The carrying amount of the borrowings at October 31, 2013 approximated its fair value. If measured at fair value, borrowings under the Agreement would have been considered as Level 2 in the fair value hierarchy (see Note 10) at October 31, 2013. For the year ended October 31, 2013, the average borrowings under the agreements and the average interest rate (excluding fees) were $425 million and 0.86%, respectively.
9 Risks Associated with Foreign Investments
Investing in securities issued by companies whose principal business activities are outside the United States may involve significant risks not present in domestic investments. For example, there is generally less publicly available information about foreign companies, particularly those not subject to the disclosure and reporting requirements of the U.S. securities laws. Certain foreign issuers are generally not bound by uniform accounting, auditing, and financial reporting requirements and standards of practice comparable to those applicable to domestic issuers. Investments in foreign securities also involve the risk of possible adverse changes in investment or exchange control regulations, expropriation or confiscatory taxation, limitation on the removal of funds or other assets of the Fund, political or financial instability or diplomatic and other developments which could affect such investments. Foreign securities markets, while growing in volume and sophistication, are generally not as developed as those in the United States, and securities of some foreign issuers (particularly those located in developing countries) may be less liquid and more volatile than securities of comparable U.S. companies. In general, there is less overall governmental supervision and regulation of foreign securities markets, broker/dealers and issuers than in the United States.
10 Fair Value Measurements
Under generally accepted accounting principles for fair value measurements, a three-tier hierarchy to prioritize the assumptions, referred to as inputs, is used in valuation techniques to measure fair value. The three-tier hierarchy of inputs is summarized in the three broad levels listed below.
| Ÿ | | Level 1 – quoted prices in active markets for identical investments |
Eaton Vance
Tax-Advantaged Global Dividend Income Fund
October 31, 2013
Notes to Financial Statements — continued
| Ÿ | | Level 2 – other significant observable inputs (including quoted prices for similar investments, interest rates, prepayment speeds, credit risk, etc.) |
| Ÿ | | Level 3 – significant unobservable inputs (including a fund’s own assumptions in determining the fair value of investments) |
In cases where the inputs used to measure fair value fall in different levels of the fair value hierarchy, the level disclosed is determined based on the lowest level input that is significant to the fair value measurement in its entirety. The inputs or methodology used for valuing securities are not necessarily an indication of the risk associated with investing in those securities.
At October 31, 2013, the hierarchy of inputs used in valuing the Fund’s investments and open derivative instruments, which are carried at value, were as follows:
| | | | | | | | | | | | | | | | |
| Asset Description | | Level 1 | | | Level 2 | | | Level 3 | | | Total | |
| | | | |
Common Stocks | | | | | | | | | | | | | | | | |
Consumer Discretionary | | $ | 56,264,860 | | | $ | 116,243,460 | | | $ | — | | | $ | 172,508,320 | |
Consumer Staples | | | 22,707,000 | | | | 87,373,299 | | | | — | | | | 110,080,299 | |
Energy | | | 100,449,025 | | | | 39,170,190 | | | | — | | | | 139,619,215 | |
Financials | | | 163,710,229 | | | | 148,791,693 | | | | — | | | | 312,501,922 | |
Health Care | | | 77,325,030 | | | | 78,972,442 | | | | — | | | | 156,297,472 | |
Industrials | | | 107,543,230 | | | | 30,872,660 | | | | — | | | | 138,415,890 | |
Information Technology | | | 151,590,160 | | | | — | | | | — | | | | 151,590,160 | |
Materials | | | 84,743,900 | | | | — | | | | — | | | | 84,743,900 | |
Telecommunication Services | | | 7,216,720 | | | | 57,597,919 | | | | — | | | | 64,814,639 | |
Utilities | | | 36,755,600 | | | | 28,023,832 | | | | — | | | | 64,779,432 | |
| | | | |
Total Common Stocks | | $ | 808,305,754 | | | $ | 587,045,495 | * | | $ | — | | | $ | 1,395,351,249 | |
| | | | |
Preferred Stocks | | | | | | | | | | | | | | | | |
Consumer Staples | | $ | — | | | $ | 11,015,849 | | | $ | — | | | $ | 11,015,849 | |
Energy | | | — | | | | 4,000,764 | | | | — | | | | 4,000,764 | |
Financials | | | 75,958,812 | | | | 118,369,890 | | | | — | | | | 194,328,702 | |
Industrials | | | — | | | | 6,194,260 | | | | — | | | | 6,194,260 | |
Telecommunication Services | | | — | | | | 1,627,720 | | | | — | | | | 1,627,720 | |
Utilities | | | 2,224,132 | | | | 23,134,309 | | | | — | | | | 25,358,441 | |
| | | | |
Total Preferred Stocks | | $ | 78,182,944 | | | $ | 164,342,792 | | | $ | — | | | $ | 242,525,736 | |
| | | | |
Corporate Bonds & Notes | | $ | — | | | $ | 76,817,400 | | | $ | — | | | $ | 76,817,400 | |
Short-Term Investments | | | — | | | | 12,595,710 | | | | — | | | | 12,595,710 | |
| | | | |
Total Investments | | $ | 886,488,698 | | | $ | 840,801,397 | | | $ | — | | | $ | 1,727,290,095 | |
| | | | |
Forward Foreign Currency Exchange Contracts | | $ | — | | | $ | 955,419 | | | $ | — | | | $ | 955,419 | |
| | | | |
Total | | $ | 886,488,698 | | | $ | 841,756,816 | | | $ | — | | | $ | 1,728,245,514 | |
| * | Includes foreign equity securities whose values were adjusted to reflect market trading of comparable securities or other correlated instruments that occurred after the close of trading in their applicable foreign markets. |
Level 3 investments at the beginning and/or end of the period in relation to net assets were not significant and accordingly, a reconciliation of Level 3 assets for the year ended October 31, 2013 is not presented. At October 31, 2013, the value of investments transferred between Level 1 and Level 2 during the year then ended was not significant.
Eaton Vance
Tax-Advantaged Global Dividend Income Fund
October 31, 2013
Report of Independent Registered Public Accounting Firm
To the Trustees and Shareholders of Eaton Vance Tax-Advantaged Global Dividend Income Fund:
We have audited the accompanying statement of assets and liabilities of Eaton Vance Tax-Advantaged Global Dividend Income Fund (the “Fund”), including the portfolio of investments, as of October 31, 2013, and the related statements of operations and cash flows for the year then ended, the statements of changes in net assets for each of the two years in the period then ended, and the financial highlights for each of the five years in the period then ended. These financial statements and financial highlights are the responsibility of the Fund’s management. Our responsibility is to express an opinion on these financial statements and financial highlights based on our audits.
We conducted our audits in accordance with the standards of the Public Company Accounting Oversight Board (United States). Those standards require that we plan and perform the audit to obtain reasonable assurance about whether the financial statements and financial highlights are free of material misstatement. The Fund is not required to have, nor were we engaged to perform, an audit of its internal control over financial reporting. Our audits included consideration of internal control over financial reporting as a basis for designing audit procedures that are appropriate in the circumstances, but not for the purpose of expressing an opinion on the effectiveness of the Fund’s internal control over financial reporting. Accordingly, we express no such opinion. An audit also includes examining, on a test basis, evidence supporting the amounts and disclosures in the financial statements, assessing the accounting principles used and significant estimates made by management, as well as evaluating the overall financial statement presentation. Our procedures included confirmation of securities owned as of October 31, 2013, by correspondence with the custodian and brokers; where replies were not received from brokers, we performed other auditing procedures. We believe that our audits provide a reasonable basis for our opinion.
In our opinion, such financial statements and financial highlights referred to above present fairly, in all material respects, the financial position of Eaton Vance Tax-Advantaged Global Dividend Income Fund as of October 31, 2013, the results of its operations and its cash flows for the year then ended, the changes in its net assets for each of the two years in the period then ended, and the financial highlights for each of the five years in the period then ended, in conformity with accounting principles generally accepted in the United States of America.
DELOITTE & TOUCHE LLP
Boston, Massachusetts
December 16, 2013
Eaton Vance
Tax-Advantaged Global Dividend Income Fund
October 31, 2013
Federal Tax Information (Unaudited)
The Form 1099-DIV you receive in January 2014 will show the tax status of all distributions paid to your account in calendar year 2013. Shareholders are advised to consult their own tax adviser with respect to the tax consequences of their investment in the Fund. As required by the Internal Revenue Code and/or regulations, shareholders must be notified regarding the status of qualified dividend income for individuals and the dividends received deduction for corporations.
Qualified Dividend Income. The Fund designates approximately $102,507,023, or up to the maximum amount of such dividends allowable pursuant to the Internal Revenue Code, as qualified dividend income eligible for the reduced tax rate of 15%.
Dividends Received Deduction. Corporate shareholders are generally entitled to take the dividends received deduction on the portion of the Fund’s dividend distribution that qualifies under tax law. For the Fund’s fiscal 2013 ordinary income dividends, 39.47% qualifies for the corporate dividends received deduction.
Eaton Vance
Tax-Advantaged Global Dividend Income Fund
October 31, 2013
Annual Meeting of Shareholders (Unaudited)
The Fund held its Annual Meeting of Shareholders on August 23, 2013. The following action was taken by the shareholders:
Item 1: The election of Scott E. Eston, Benjamin C. Esty, Allen R. Freedman and Lynn A. Stout as Class I Trustees of the Fund for a three-year term expiring in 2016.
| | | | | | | | |
Nominee for Trustee Elected by All Shareholders | | Number of Shares | |
| | For | | | Withheld | |
Scott E. Eston | | | 65,321,534 | | | | 1,510,742 | |
Benjamin C. Esty | | | 65,268,996 | | | | 1,563,280 | |
Allen R. Freedman | | | 65,207,156 | | | | 1,625,120 | |
Lynn A. Stout | | | 64,797,115 | | | | 2,035,161 | |
Eaton Vance
Tax-Advantaged Global Dividend Income Fund
October 31, 2013
Dividend Reinvestment Plan
The Fund offers a dividend reinvestment plan (Plan) pursuant to which shareholders may elect to have distributions automatically reinvested in common shares (Shares) of the Fund. You may elect to participate in the Plan by completing the Dividend Reinvestment Plan Application Form. If you do not participate, you will receive all distributions in cash paid by check mailed directly to you by American Stock Transfer & Trust Company (AST) as dividend paying agent. On the distribution payment date, if the NAV per Share is equal to or less than the market price per Share plus estimated brokerage commissions, then new Shares will be issued. The number of Shares shall be determined by the greater of the NAV per Share or 95% of the market price. Otherwise, Shares generally will be purchased on the open market by AST, the Plan agent (Agent). Distributions subject to income tax (if any) are taxable whether or not Shares are reinvested.
If your Shares are in the name of a brokerage firm, bank, or other nominee, you can ask the firm or nominee to participate in the Plan on your behalf. If the nominee does not offer the Plan, you will need to request that the Fund’s transfer agent re-register your Shares in your name or you will not be able to participate.
The Agent’s service fee for handling distributions will be paid by the Fund. Plan participants will be charged their pro rata share of brokerage commissions on all open-market purchases.
Plan participants may withdraw from the Plan at any time by writing to the Agent at the address noted on the following page. If you withdraw, you will receive Shares in your name for all Shares credited to your account under the Plan. If a participant elects by written notice to the Agent to sell part or all of his or her Shares and remit the proceeds, the Agent is authorized to deduct a $5.00 fee plus brokerage commissions from the proceeds.
If you wish to participate in the Plan and your Shares are held in your own name, you may complete the form on the following page and deliver it to the Agent. Any inquiries regarding the Plan can be directed to the Agent at 1-866-439-6787.
Eaton Vance
Tax-Advantaged Global Dividend Income Fund
October 31, 2013
Application for Participation in Dividend Reinvestment Plan
This form is for shareholders who hold their common shares in their own names. If your common shares are held in the name of a brokerage firm, bank, or other nominee, you should contact your nominee to see if it will participate in the Plan on your behalf. If you wish to participate in the Plan, but your brokerage firm, bank, or nominee is unable to participate on your behalf, you should request that your common shares be re-registered in your own name which will enable your participation in the Plan.
The following authorization and appointment is given with the understanding that I may terminate it at any time by terminating my participation in the Plan as provided in the terms and conditions of the Plan.
Please print exact name on account:
Shareholder signature Date
Shareholder signature Date
Please sign exactly as your common shares are registered. All persons whose names appear on the share certificate must sign.
YOU SHOULD NOT RETURN THIS FORM IF YOU WISH TO RECEIVE YOUR DISTRIBUTIONS IN CASH. THIS IS NOT A PROXY.
This authorization form, when signed, should be mailed to the following address:
Eaton Vance Tax-Advantaged Global Dividend Income Fund
c/o American Stock Transfer & Trust Company
P.O. Box 922
Wall Street Station
New York, NY 10269-0560
Number of Employees
The Fund is organized as a Massachusetts business trust and is registered under the Investment Company Act of 1940, as amended, as a closed-end management investment company and has no employees.
Number of Shareholders
As of October 31, 2013, Fund records indicate that there are 50 registered shareholders and approximately 54,864 shareholders owning the Fund shares in street name, such as through brokers, banks, and financial intermediaries.
If you are a street name shareholder and wish to receive Fund reports directly, which contain important information about the Fund, please write or call:
Eaton Vance Distributors, Inc.
Two International Place
Boston, MA 02110
1-800-262-1122
New York Stock Exchange symbol
The New York Stock Exchange symbol is ETG.
Eaton Vance
Tax-Advantaged Global Dividend Income Fund
October 31, 2013
Management and Organization
Fund Management. The Trustees of Eaton Vance Tax-Advantaged Global Dividend Income Fund (the Fund) are responsible for the overall management and supervision of the Fund’s affairs. The Trustees and officers of the Fund are listed below. Except as indicated, each individual has held the office shown or other offices in the same company for the last five years. The “Noninterested Trustees” consist of those Trustees who are not “interested persons” of the Fund, as that term is defined under the 1940 Act. The business address of each Trustee and officer is Two International Place, Boston, Massachusetts 02110. As used below, “EVC” refers to Eaton Vance Corp., “EV” refers to Eaton Vance, Inc., “EVM” refers to Eaton Vance Management, “BMR” refers to Boston Management and Research and “EVD” refers to Eaton Vance Distributors, Inc. EVC and EV are the corporate parent and trustee, respectively, of EVM and BMR. EVD is a wholly-owned subsidiary of EVC. Each officer affiliated with Eaton Vance may hold a position with other Eaton Vance affiliates that is comparable to his or her position with EVM listed below. Each Trustee oversees 190 portfolios in the Eaton Vance Complex (including all master and feeder funds in a master feeder structure). Each officer serves as an officer of certain other Eaton Vance funds. Each Trustee serves for a three year term. Each officer serves until his or her successor is elected.
| | | | | | |
| Name and Year of Birth | | Position(s)
with the
Fund | | Term of Office;
Length of
Service | | Principal Occupation(s) and Directorships
During Past Five Years and Other Relevant Experience |
Interested Trustee |
| | | |
Thomas E. Faust Jr. 1958 | | Class II Trustee | | Until 2014. 3 years. Trustee since 2007. | | Chairman, Chief Executive Officer and President of EVC, Director and President of EV, Chief Executive Officer and President of EVM and BMR, and Director of EVD. Trustee and/or officer of 190 registered investment companies. Mr. Faust is an interested person because of his positions with EVM, BMR, EVD, EVC and EV, which are affiliates of the Fund. Directorships in the Last Five Years.(1) Director of EVC and Hexavest Inc. |
| | | |
| | | | | | |
Noninterested Trustees |
| | | |
Scott E. Eston 1956 | | Class I Trustee | | Until 2016. 3 years. Trustee since 2011. | | Private investor. Formerly held various positions at Grantham, Mayo, Van Otterloo and Co., L.L.C. (investment management firm) (1997-2009), including Chief Operating Officer (2002-2009), Chief Financial Officer (1997-2009) and Chairman of the Executive Committee (2002-2008); President and Principal Executive Officer, GMO Trust (open-end registered investment company) (2006-2009). Former Partner, Coopers and Lybrand L.L.P. (now PricewaterhouseCoopers) (public accounting firm) (1987-1997). Directorships in the Last Five Years. None. |
| | | |
Benjamin C. Esty 1963 | | Class I Trustee | | Until 2016. 3 years. Trustee since 2005. | | Roy and Elizabeth Simmons Professor of Business Administration and Finance Unit Head, Harvard University Graduate School of Business Administration. Directorships in the Last Five Years.(1) None. |
| | | |
Allen R. Freedman 1940 | | Class I Trustee | | Until 2016. 3 years. Trustee since 2007. | | Private Investor. Former Chairman (2002-2004) and a Director (1983-2004) of Systems & Computer Technology Corp. (provider of software to higher education). Formerly, a Director of Loring Ward International (fund distributor) (2005-2007). Former Chairman and a Director of Indus International, Inc. (provider of enterprise management software to the power generating industry) (2005-2007). Former Chief Executive Officer of Assurant, Inc. (insurance provider) (1979-2000). Directorships in the Last Five Years.(1) Director of Stonemor Partners, L.P. (owner and operator of cemeteries). Formerly, Director of Assurant, Inc. (insurance provider) (1979-2011). |
| | | |
William H. Park 1947 | | Class II Trustee | | Until 2014. 3 years. Trustee since 2003. | | Consultant and private investor. Formerly, Chief Financial Officer, Aveon Group L.P. (investment management firm) (2010-2011). Formerly, Vice Chairman, Commercial Industrial Finance Corp. (specialty finance company) (2006-2010). Formerly, President and Chief Executive Officer, Prizm Capital Management, LLC (investment management firm) (2002-2005). Formerly, Executive Vice President and Chief Financial Officer, United Asset Management Corporation (investment management firm) (1982-2001). Formerly, Senior Manager, Price Waterhouse (now PricewaterhouseCoopers) (an independent registered public accounting firm) (1972-1981). Directorships in the Last Five Years.(1) None. |
| | | |
Ronald A. Pearlman 1940 | | Class III Trustee | | Until 2015. 3 years. Trustee since 2003. | | Professor of Law, Georgetown University Law Center. Formerly, Deputy Assistant Secretary (Tax Policy) and Assistant Secretary (Tax Policy), U.S. Department of the Treasury (1983-1985). Formerly, Chief of Staff, Joint Committee on Taxation, U.S. Congress (1988-1990). Directorships in the Last Five Years.(1) None. |
Eaton Vance
Tax-Advantaged Global Dividend Income Fund
October 31, 2013
Management and Organization — continued
| | | | | | |
| Name and Year of Birth | | Position(s) with the
Fund | | Term of Office;
Length of
Service | | Principal Occupation(s) and Directorships
During Past Five Years and Other Relevant Experience |
Noninterested Trustees (continued) |
| | | |
Helen Frame Peters 1948 | | Class III Trustee | | Until 2015. 3 years. Trustee since 2008. | | Professor of Finance, Carroll School of Management, Boston College. Formerly, Dean, Carroll School of Management, Boston College (2000-2002). Formerly, Chief Investment Officer, Fixed Income, Scudder Kemper Investments (investment management firm) (1998-1999). Formerly, Chief Investment Officer, Equity and Fixed Income, Colonial Management Associates (investment management firm) (1991-1998). Directorships in the Last Five Years.(1) Formerly, Director of BJ’s Wholesale Club, Inc. (wholesale club retailer) (2004-2011). Formerly, Trustee of SPDR Index Shares Funds and SPDR Series Trust (exchange traded funds) (2000-2009). Formerly, Director of Federal Home Loan Bank of Boston (a bank for banks) (2007-2009). |
| | | |
Lynn A. Stout 1957 | | Class I Trustee | | Until 2016. 3 years. Trustee since 2003. | | Distinguished Professor of Corporate and Business Law, Jack G. Clarke Business Law Institute, Cornell University Law School. Formerly, the Paul Hastings Professor of Corporate and Securities Law (2006-2012) and Professor of Law (2001-2006), University of California at Los Angeles School of Law. Directorships in the Last Five Years.(1) None. |
| | | |
Harriett Tee Taggart 1948 | | Class II Trustee | | Until 2014. 2 years. Trustee since 2011. | | Managing Director, Taggart Associates (a professional practice firm). Formerly, Partner and Senior Vice President, Wellington Management Company, LLP (investment management firm) (1983-2006). Directorships in the Last Five Years. Director of Albemarle Corporation (chemicals manufacturer) (since 2007) and The Hanover Group (specialty property and casualty insurance company) (since 2009). Formerly, Director of Lubrizol Corporation (specialty chemicals) (2007-2011). |
| | | |
Ralph F. Verni 1943 | | Chairman of the Board and Class III Trustee | | Until 2015. 3 years. Chairman of the Board since 2007 and Trustee since 2005. | | Consultant and private investor. Formerly, Chief Investment Officer (1982-1992), Chief Financial Officer (1988-1990) and Director (1982-1992), New England Life. Formerly, Chairperson, New England Mutual Funds (1982-1992). Formerly, President and Chief Executive Officer, State Street Management & Research (1992-2000). Formerly, Chairperson, State Street Research Mutual Funds (1992-2000). Formerly, Director, W.P. Carey, LLC (1998-2004) and First Pioneer Farm Credit Corp. (2002-2006). Directorships in the Last Five Years.(1) None. |
| | | |
| | | | | | |
Principal Officers who are not Trustees |
| Name and Year of Birth | | Position(s)
with the
Fund | | Length of Service | | Principal Occupation(s) During Past Five Years |
Walter A. Row, III
1957 | | President | | Since 2013 | | Vice President of EVM and BMR. |
| | | |
Maureen A. Gemma 1960 | | Vice President, Secretary and Chief Legal Officer | | Vice President since 2011, Secretary since 2007 and Chief Legal Officer since 2008 | | Vice President of EVM and BMR. |
| | | |
James F. Kirchner(2) 1967 | | Treasurer | | Since 2013 | | Vice President of EVM and BMR. |
| | | |
Paul M. O’Neil 1953 | | Chief Compliance Officer | | Since 2004 | | Vice President of EVM and BMR. |
| (1) | During their respective tenures, the Trustees (except Mr. Eston and Ms. Taggart) also served as Board members of one or more of the following Eaton Vance funds (which operated in the years noted): Eaton Vance Credit Opportunities Fund (launched in 2005 and terminated in 2010); Eaton Vance Insured Florida Plus Municipal Bond Fund (launched in 2002 and terminated in 2009); and Eaton Vance National Municipal Income Trust (launched in 1998 and terminated in 2009). |
| (2) | Prior to 2013, Mr. Kirchner served as Assistant Treasurer of the Fund since 2007. |
Eaton Vance Funds
IMPORTANT NOTICES
Privacy. The Eaton Vance organization is committed to ensuring your financial privacy. Each of the financial institutions identified below has in effect the following policy (“Privacy Policy”) with respect to nonpublic personal information about its customers:
| Ÿ | | Only such information received from you, through application forms or otherwise, and information about your Eaton Vance fund transactions will be collected. This may include information such as name, address, social security number, tax status, account balances and transactions. |
| Ÿ | | None of such information about you (or former customers) will be disclosed to anyone, except as permitted by law (which includes disclosure to employees necessary to service your account). In the normal course of servicing a customer’s account, Eaton Vance may share information with unaffiliated third parties that perform various required services such as transfer agents, custodians and broker-dealers. |
| Ÿ | | Policies and procedures (including physical, electronic and procedural safeguards) are in place that are designed to protect the confidentiality of such information. |
| Ÿ | | We reserve the right to change our Privacy Policy at any time upon proper notification to you. Customers may want to review our Privacy Policy periodically for changes by accessing the link on our homepage: www.eatonvance.com. |
Our pledge of privacy applies to the following entities within the Eaton Vance organization: the Eaton Vance Family of Funds, Eaton Vance Management, Eaton Vance Investment Counsel, Eaton Vance Distributors, Inc., Eaton Vance Trust Company, Eaton Vance Management’s Real Estate Investment Group and Boston Management and Research. In addition, our Privacy Policy applies only to those Eaton Vance customers who are individuals and who have a direct relationship with us. If a customer’s account (i.e., fund shares) is held in the name of a third-party financial advisor/broker-dealer, it is likely that only such advisor’s privacy policies apply to the customer. This notice supersedes all previously issued privacy disclosures. For more information about Eaton Vance’s Privacy Policy, please call 1-800-262-1122.
Delivery of Shareholder Documents. The Securities and Exchange Commission (SEC) permits funds to deliver only one copy of shareholder documents, including prospectuses, proxy statements and shareholder reports, to fund investors with multiple accounts at the same residential or post office box address. This practice is often called “householding” and it helps eliminate duplicate mailings to shareholders. Eaton Vance, or your financial advisor, may household the mailing of your documents indefinitely unless you instruct Eaton Vance, or your financial advisor, otherwise. If you would prefer that your Eaton Vance documents not be householded, please contact Eaton Vance at 1-800-262-1122, or contact your financial advisor. Your instructions that householding not apply to delivery of your Eaton Vance documents will be effective within 30 days of receipt by Eaton Vance or your financial advisor.
Portfolio Holdings. Each Eaton Vance Fund and its underlying Portfolio(s) (if applicable) will file a schedule of portfolio holdings on Form N-Q with the SEC for the first and third quarters of each fiscal year. The Form N-Q will be available on the Eaton Vance website at www.eatonvance.com, by calling Eaton Vance at 1-800-262-1122 or in the EDGAR database on the SEC’s website at www.sec.gov. Form N-Q may also be reviewed and copied at the SEC’s public reference room in Washington, D.C. (call 1-800-732-0330 for information on the operation of the public reference room).
Proxy Voting. From time to time, funds are required to vote proxies related to the securities held by the funds. The Eaton Vance Funds or their underlying Portfolios (if applicable) vote proxies according to a set of policies and procedures approved by the Funds’ and Portfolios’ Boards. You may obtain a description of these policies and procedures and information on how the Funds or Portfolios voted proxies relating to portfolio securities during the most recent 12-month period ended June 30, without charge, upon request, by calling 1-800-262-1122 and by accessing the SEC’s website at www.sec.gov.
Share Repurchase Program. On November 11, 2013, the Fund’s Board of Trustees approved a share repurchase program authorizing the Fund to repurchase up to 10% of its currently outstanding common shares in open-market transactions at a discount to net asset value. The repurchase program does not obligate the Fund to purchase a specific amount of shares. The Fund’s repurchase activity, including the number of shares purchased, average price and average discount to net asset value, will be disclosed in the Fund’s annual and semi-annual reports to shareholders.
Additional Notice to Shareholders. If applicable, a Fund may redeem or purchase its outstanding auction preferred shares (APS) in order to maintain compliance with regulatory requirements, borrowing or rating agency requirements or for other purposes as it deems appropriate or necessary.
Closed-End Fund Information. Eaton Vance closed-end funds make fund performance data and certain information about portfolio characteristics available on the Eaton Vance website shortly after the end of each month. The funds’ net asset value per share is readily accessible on the Eaton Vance website. Portfolio holdings for the most recent month-end are also posted to the website approximately 30 days following the end of the month. This information is available at www.eatonvance.com on the fund information pages under “Individual Investors — Closed-End Funds”.
This Page Intentionally Left Blank
This Page Intentionally Left Blank
This Page Intentionally Left Blank
Investment Adviser and Administrator
Eaton Vance Management
Two International Place
Boston, MA 02110
Custodian
State Street Bank and Trust Company
200 Clarendon Street
Boston, MA 02116
Transfer Agent
American Stock Transfer & Trust Company
6201 15th Avenue
Brooklyn, NY 11219
Independent Registered Public Accounting Firm
Deloitte & Touche LLP
200 Berkeley Street
Boston, MA 02116-5022
Fund Offices
Two International Place
Boston, MA 02110
Item 2. Code of Ethics
The registrant has adopted a code of ethics applicable to its Principal Executive Officer, Principal Financial Officer and Principal Accounting Officer. The registrant undertakes to provide a copy of such code of ethics to any person upon request, without charge, by calling 1-800-262-1122.
Item 3. Audit Committee Financial Expert
The registrant’s Board has designated William H. Park, an independent trustee, as its audit committee financial expert. Mr. Park is a certified public accountant who is a consultant and private investor. Previously, he served as the Chief Financial Officer of Aveon Group, L.P. (an investment management firm), as the Vice Chairman of Commercial Industrial Finance Corp. (specialty finance company), as President and Chief Executive Officer of Prizm Capital Management, LLC (investment management firm), as Executive Vice President and Chief Financial Officer of United Asset Management Corporation (an institutional investment management firm) and as a Senior Manager at Price Waterhouse (now PricewaterhouseCoopers) (an independent registered public accounting firm).
Item 4. Principal Accountant Fees and Services
(a) –(d)
The following table presents the aggregate fees billed to the registrant for the registrant’s fiscal years ended October 31, 2012 and October 31, 2013 by the registrant’s principal accountant, Deloitte & Touche LLP (“D&T”), for professional services rendered for the audit of the registrant’s annual financial statements and fees billed for other services rendered by D&T during such periods.
| | | | | | | | |
Fiscal Years Ended | | 10/31/12 | | | 10/31/13 | |
Audit Fees | | $ | 80,440 | | | $ | 65,670 | |
Audit-Related Fees(1) | | $ | 0 | | | $ | 0 | |
Tax Fees(2) | | $ | 11,170 | | | $ | 12,510 | |
All Other Fees(3) | | $ | 1,240 | | | $ | 0 | |
| | | | | | | | |
Total | | $ | 92,850 | | | $ | 78,180 | |
| | | | | | | | |
| (1) | Audit-related fees consist of the aggregate fees billed for assurance and related services that are reasonably related to the performance of the audit of the registrant’s financial statements and are not reported under the category of audit fees. |
| (2) | Tax fees consist of the aggregate fees billed for professional services rendered by the principal accountant relating to tax compliance, tax advice, and tax planning and specifically include fees for tax return preparation and other related tax compliance/planning matters. |
| (3) | All other fees consist of the aggregate fees billed for products and services provided by the registrant’s principal accountant other than audit, audit-related, and tax services. |
(e)(1) The registrant’s audit committee has adopted policies and procedures relating to the pre-approval of services provided by the registrant’s principal accountant (the “Pre-Approval Policies”). The Pre-Approval Policies establish a framework intended to assist the audit committee in the proper discharge of its pre-approval responsibilities. As a general matter, the Pre-Approval Policies (i) specify certain types of audit, audit-related, tax, and other services determined to be pre-approved by the audit committee; and (ii) delineate specific procedures governing the mechanics of the pre-approval process, including the approval and monitoring of audit and non-audit service fees. Unless a service is specifically pre-approved under the Pre-Approval Policies, it must be separately pre-approved by the audit committee.
The Pre-Approval Policies and the types of audit and non-audit services pre-approved therein must be reviewed and ratified by the registrant’s audit committee at least annually. The registrant’s audit committee maintains full responsibility for the appointment, compensation, and oversight of the work of the registrant’s principal accountant.
(e)(2) No services described in paragraphs (b)-(d) above were approved by the registrant’s audit committee pursuant to the “de minimis exception” set forth in Rule 2-01 (c)(7)(i)(C) of Regulation S-X.
(f) Not applicable.
(g) The following table presents (i) the aggregate non-audit fees (i.e., fees for audit-related, tax, and other services) billed to the registrant by D&T for the registrant’s fiscal years ended October 31, 2012 and October 31, 2013; and (ii) the aggregate non-audit fees (i.e., fees for audit-related, tax, and other services) billed to the Eaton Vance organization by D&T for the same time periods.
| | | | | | | | |
Fiscal Years Ended | | 10/31/12 | | | 10/31/13 | |
Registrant | | $ | 12,410 | | | $ | 12,510 | |
Eaton Vance(1) | | $ | 566,619 | | | $ | 526,385 | |
| (1) | The investment adviser to the registrant, as well as any of its affiliates that provide ongoing services to the registrant, are subsidiaries of Eaton Vance Corp. |
(h) The registrant’s audit committee has considered whether the provision by the registrant’s principal accountant of non-audit services to the registrant’s investment adviser and any entity controlling, controlled by, or under common control with the adviser that provides ongoing services to the registrant that were not pre-approved pursuant to Rule 2-01(c)(7)(ii) of Regulation S-X is compatible with maintaining the principal accountant’s independence.
Item 5. Audit Committee of Listed Registrants
The registrant has a separately-designated standing audit committee established in accordance with Section 3(a)(58)(A) of the Securities and Exchange Act of 1934, as amended. William H. Park (Chair), Scott E. Eston, Ronald A. Pearlman, Helen Frame Peters and Ralph F. Verni are the members of the registrant’s audit committee.
Item 6. Schedule of Investments
Please see schedule of investments contained in the Report to Stockholders included under Item 1 of this Form N-CSR.
Item 7. Disclosure of Proxy Voting Policies and Procedures for Closed-End Management Investment Companies
The Board of Trustees of the Trust has adopted a proxy voting policy and procedure (the “Fund Policy”), pursuant to which the Trustees have delegated proxy voting responsibility to the Fund’s investment adviser and adopted the investment adviser’s proxy voting policies and procedures (the “Policies”) which are described below. The Trustees will review the Fund’s proxy voting records from time to time and will annually consider approving the Policies for the upcoming year. In the event that a conflict of interest arises between the Fund’s shareholders and the investment adviser, the administrator, or any of their affiliates or any affiliate of the Fund, the investment adviser will generally refrain from voting the proxies related to the companies giving rise to such conflict until it consults with the Board’s Special Committee except as contemplated under the Fund Policy. The Board’s Special Committee will instruct the investment adviser on the appropriate course of action.
The Policies are designed to promote accountability of a company’s management to its shareholders and to align the interests of management with those shareholders. An independent proxy voting service (“Agent”), currently Institutional Shareholder Services, Inc., has been retained to assist in the voting of
proxies through the provision of vote analysis, implementation and recordkeeping and disclosure services. The investment adviser will generally vote proxies through the Agent. The Agent is required to vote all proxies and/or refer them back to the investment adviser pursuant to the Policies. It is generally the policy of the investment adviser to vote in accordance with the recommendation of the Agent. The Agent shall refer to the investment adviser proxies relating to mergers and restructurings, and the disposition of assets, termination, liquidation and mergers contained in mutual fund proxies. The investment adviser will normally vote against anti-takeover measures and other proposals designed to limit the ability of shareholders to act on possible transactions, except in the case of closed-end management investment companies. The investment adviser generally supports management on social and environmental proposals. The investment adviser may abstain from voting from time to time where it determines that the costs associated with voting a proxy outweighs the benefits derived from exercising the right to vote or the economic effect on shareholders interests or the value of the portfolio holding is indeterminable or insignificant.
In addition, the investment adviser will monitor situations that may result in a conflict of interest between the Fund’s shareholders and the investment adviser, the administrator, or any of their affiliates or any affiliate of the Fund by maintaining a list of significant existing and prospective corporate clients. The investment adviser’s personnel responsible for reviewing and voting proxies on behalf of the Fund will report any proxy received or expected to be received from a company included on that list to the personnel of the investment adviser identified in the Policies. If such personnel expects to instruct the Agent to vote such proxies in a manner inconsistent with the guidelines of the Policies or the recommendation of the Agent, the personnel will consult with members of senior management of the investment adviser to determine if a material conflict of interests exists. If it is determined that a material conflict does exist, the investment adviser will seek instruction on how to vote from the Special Committee.
Information on how the Fund voted proxies relating to portfolio securities during the most recent 12 month period ended June 30 is available (1) without charge, upon request, by calling 1-800-262-1122, and (2) on the Securities and Exchange Commission’s website at http://www.sec.gov.
Item 8. Portfolio Managers of Closed-End Management Investment Companies
Michael A. Allison, John H. Croft, Walter A. Row, III and Judith A. Saryan (until her retirement on December 20, 2013) and other Eaton Vance Management (“EVM”) investment professionals comprise the investment team responsible for the overall and day-to-day management of the Fund’s investments as well as allocations of the Fund’s assets between common and preferred stocks. Messrs. Allison, Croft and Rowe, and Ms. Saryan are the portfolio managers responsible for the day-to-day management of specific segments of the Fund’s investment portfolio.
Mr. Allison is a Vice President of EVM and co-manages other EVM registered investment companies. He is a member of the Equity Strategy Committee and first joined EVM’s equity group in 2000. Mr. Croft has been with EVM since 2004, is a Vice President and co-manages other EVM registered investment companies. Mr. Rowe is a Vice President of EVM and the Director of Structured Equity Portfolios. He is a member of the Equity Strategy Committee and co-manages other EVM registered investment companies. He joined EVM’s equity group in 1996. Ms. Saryan has been an EVM portfolio manager since 1999, is a Vice President and co-manages other EVM registered investment companies. This information is provided as of the date of filing this report.
The following table shows, as of the Fund’s most recent fiscal year end, the number of accounts each portfolio manager managed in each of the listed categories and the total assets (in millions of dollars) in the accounts managed within each category. The table also shows the number of accounts with respect to which the advisory fee is based on the performance of the account, if any, and the total assets (in millions of dollars) in those accounts.
| | | | | | | | | | | | | | | | |
| | | Number
of All
Accounts | | | Total Assets of All Accounts | | | Number of
Accounts Paying a
Performance Fee | | | Total Assets of
Accounts Paying a
Performance Fee | |
Michael A. Allison | | | | | | | | | | | | | | | | |
Registered Investment Companies | | | 7 | | | $ | 16,099.5 | | | | 0 | | | $ | 0 | |
Other Pooled Investment Vehicles | | | 14 | | | $ | 7,767.0 | * | | | 0 | | | $ | 0 | |
Other Accounts | | | 0 | | | $ | 0 | | | | 0 | | | $ | 0 | |
John H. Croft | | | | | | | | | | | | | | | | |
Registered Investment Companies | | | 5 | | | $ | 1,576.8 | | | | 0 | | | $ | 0 | |
Other Pooled Investment Vehicles | | | 0 | | | $ | 0 | | | | 0 | | | $ | 0 | |
Other Accounts | | | 9 | | | $ | 143.1 | | | | 0 | | | $ | 0 | |
Walter A. Row, III | | | | | | | | | | | | | | | | |
Registered Investment Companies | | | 9 | | | $ | 9,797.1 | | | | 0 | | | $ | 0 | |
Other Pooled Investment Vehicles | | | 0 | | | $ | 0 | | | | 0 | | | $ | 0 | |
Other Accounts | | | 0 | | | $ | 0 | | | | 0 | | | $ | 0 | |
Judith A. Saryan | | | | | | | | | | | | | | | | |
Registered Investment Companies | | | 6 | | | $ | 5,609.9 | | | | 0 | | | $ | 0 | |
Other Pooled Investment Vehicles | | | 0 | | | $ | 0 | | | | 0 | | | $ | 0 | |
Other Accounts | | | 0 | | | $ | 0 | | | | 0 | | | $ | 0 | |
| * | Certain of these “Other Pooled Investment Vehicles” invest a substantial portion of their assets either in a registered investment company or in a separate unregistered pooled investment vehicle managed by this portfolio manager. |
The following table shows the dollar range of Fund shares beneficially owned by each portfolio manager as of the Fund’s most recent fiscal year end.
| | |
| Portfolio Manager | | Dollar Range of Equity Securities Owned in the Fund |
Michael A. Allison | | None |
| |
John H. Croft | | None |
Walter A. Row, III | | None |
| |
Judith A. Saryan | | None |
Potential for Conflicts of Interest. It is possible that conflicts of interest may arise in connection with a portfolio manager’s management of the Fund’s investments on the one hand and investments of other accounts for which a portfolio manager is responsible on the other. For example, a portfolio manager may have conflicts of interest in allocating management time, resources and investment opportunities among the Fund and other accounts he or she advises. In addition, due to differences in the investment strategies or restrictions between the Fund and the other accounts, a portfolio manager may take action with respect to another account that differs from the action taken with respect to the Fund. In some cases, another account managed by a portfolio manager may compensate the investment adviser based on the performance of the securities held by that account. The existence of such a performance based fee may create additional conflicts of interest for a portfolio manager in the allocation of management time, resources and investment opportunities. Whenever conflicts of interest arise, a portfolio manager will endeavor to exercise his or her discretion in a manner that he or she believes is equitable to all interested persons. EVM has adopted several policies and procedures designed to address these potential conflicts including a code of ethics and policies which govern the investment adviser’s trading practices, including among other things the aggregation and allocation of trades among clients, brokerage allocation, cross trades and best execution.
Compensation Structure for EVM
Compensation of EVM’s portfolio managers and other investment professionals has three primary components: (1) a base salary, (2) an annual cash bonus, and (3) annual stock-based compensation consisting of options to purchase shares of EVC’s nonvoting common stock and/or restricted shares of EVC’s nonvoting common stock. EVM’s investment professionals also receive certain retirement, insurance and other benefits that are broadly available to EVM’s employees. Compensation of EVM’s investment professionals is reviewed primarily on an annual basis. Cash bonuses, stock-based compensation awards, and adjustments in base salary are typically paid or put into effect at or shortly after the October 31st fiscal year end of EVC.
Method to Determine Compensation. EVM compensates its portfolio managers based primarily on the scale and complexity of their portfolio responsibilities and the total return performance of managed funds and accounts versus the benchmark(s) stated in the prospectus, as well as an appropriate peer group (as described below). In addition to rankings within peer groups of funds on the basis of absolute performance, consideration may also be given to relative risk-adjusted performance. Risk-adjusted performance measures include, but are not limited to, the Sharpe Ratio. Performance is normally based on periods ending on the September 30th preceding fiscal year end. Fund performance is normally evaluated primarily versus peer groups of funds as determined by Lipper Inc. and/or Morningstar, Inc. When a fund’s peer group as determined by Lipper or Morningstar is deemed by EVM’s management not to provide a fair comparison, performance may instead be evaluated primarily
against a custom peer group or market index. In evaluating the performance of a fund and its manager, primary emphasis is normally placed on three-year performance, with secondary consideration of performance over longer and shorter periods. For funds that are tax-managed or otherwise have an objective of after-tax returns, performance is measured net of taxes. For other funds, performance is evaluated on a pre-tax basis. For funds with an investment objective other than total return (such as current income), consideration will also be given to the fund’s success in achieving its objective. For managers responsible for multiple funds and accounts, investment performance is evaluated on an aggregate basis, based on averages or weighted averages among managed funds and accounts. Funds and accounts that have performance-based advisory fees are not accorded disproportionate weightings in measuring aggregate portfolio manager performance.
The compensation of portfolio managers with other job responsibilities (such as heading an investment group or providing analytical support to other portfolios) will include consideration of the scope of such responsibilities and the managers’ performance in meeting them.
EVM seeks to compensate portfolio managers commensurate with their responsibilities and performance, and competitive with other firms within the investment management industry. EVM participates in investment-industry compensation surveys and utilizes survey data as a factor in determining salary, bonus and stock-based compensation levels for portfolio managers and other investment professionals. Salaries, bonuses and stock-based compensation are also influenced by the operating performance of EVM and its parent company. The overall annual cash bonus pool is based on a substantially fixed percentage of pre-bonus operating income. While the salaries of EVM’s portfolio managers are comparatively fixed, cash bonuses and stock-based compensation may fluctuate significantly from year to year, based on changes in manager performance and other factors as described herein. For a high performing portfolio manager, cash bonuses and stock-based compensation may represent a substantial portion of total compensation.
Item 9. Purchases of Equity Securities by Closed-End Management Investment Company and Affiliated Purchasers
No such purchases this period.
Item 10. Submission of Matters to a Vote of Security Holders
No material changes.
Item 11. Controls and Procedures
(a) It is the conclusion of the registrant’s principal executive officer and principal financial officer that the effectiveness of the registrant’s current disclosure controls and procedures (such disclosure controls and procedures having been evaluated within 90 days of the date of this filing) provide reasonable assurance that the information required to be disclosed by the registrant has been recorded, processed, summarized and reported within the time period specified in the Commission’s rules and forms and that the information required to be disclosed by the registrant has been accumulated and communicated to the registrant’s principal executive officer and principal financial officer in order to allow timely decisions regarding required disclosure.
(b) There have been no changes in the registrant’s internal controls over financial reporting during the second fiscal quarter of the period covered by this report that has materially affected, or is reasonably likely to materially affect, the registrant’s internal control over financial reporting.
Item 12. Exhibits
| (a)(1) | Registrant’s Code of Ethics – Not applicable (please see Item 2). |
| (a)(2)(i) | Treasurer’s Section 302 certification. |
| (a)(2)(ii) | President’s Section 302 certification. |
| (b) | Combined Section 906 certification. |
Signatures
Pursuant to the requirements of the Securities Exchange Act of 1934 and the Investment Company Act of 1940, the registrant has duly caused this report to be signed on its behalf by the undersigned, thereunto duly authorized.
Eaton Vance Tax-Advantaged Global Dividend Income Fund
| | |
| By: | | /s/ Walter A. Row, III |
| | Walter A. Row, III |
| | President |
| |
| Date: | | December 6, 2013 |
Pursuant to the requirements of the Securities Exchange Act of 1934 and the Investment Company Act of 1940, this report has been signed below by the following persons on behalf of the registrant and in the capacities and on the dates indicated.
| | |
| By: | | /s/ James F. Kirchner |
| | James F. Kirchner |
| | Treasurer |
| |
| Date: | | December 6, 2013 |
| |
| By: | | /s/ Walter A. Row, III |
| | Walter A. Row, III |
| | President |
| |
| Date: | | December 6, 2013 |