2017 Updated Preliminary Economic Assessment on the Ann Mason Project
Nevada, U.S.A
Nevada, U.S.A
Prepared for:
Entrée Gold Inc.
and
Mason Resources Corp.
Prepared by:
Greg Kulla, P.Geo., Principal Geologist (Amec Foster Wheeler)
Peter Oshust, P.Geo., Principal Geologist (Amec Foster Wheeler)
Joseph Rosaire Pierre Desautels, P.Geo., Principal Resource Geologist (AGP)
Jay Melnyk, P.Eng., Principal Mining Engineer (AGP)
Gordon Zurowski, P.Eng., Principal Mining Engineer (AGP)
Lyn Jones, P.Eng., Senior Associate Metallurgist (AGP)
Mario Colantonio, P.Eng., Manager/Principal (PES).
Effective Date: 03 March 2017
AGP Mining Consultants Inc. and
Amec Foster Wheeler Americas Limited.
Amec Foster Wheeler Americas Limited.
 |  |
2017 Updated Preliminary Economic Assessment on the Ann Mason Project
Nevada, U.S.A.
IMPORTANT NOTICE
This report was prepared as a National Instrument 43-101 Technical Report for Entrée Gold Inc. (Entrée) and Mason Resources Corp. (Mason Resources) by AGP Mining Consultants Inc. (AGP) and Amec Foster Wheeler Americas Limited (Amec Foster Wheeler or AFW). The quality of information, conclusions, and estimates contained herein is consistent with the level of effort involved in AGP’s and AFW’s services, based on: i) information available at the time of preparation, ii) data supplied by outside sources, and iii) the assumptions, conditions, and qualifications set forth in this report. This report is intended for use by Entrée and Mason Resources subject to the terms and conditions of their respective contracts with AGP and AFW. Their contracts permit Entrée Gold Inc. and Mason Resources Corp. to each file this report as a Technical Report with Canadian Securities Regulatory Authorities pursuant to National Instrument 43-101, Standards of Disclosure for Mineral Projects. Except for the purposes legislated under applicable Canadian provincial, United States of America state and federal securities law, any other uses of this report by any third party is at that party’s sole risk.
 | | |
| 10/03/2017 |
2017 Updated Preliminary Economic Assessment on the Ann Mason Project
Nevada, U.S.A.
Contents
| 1 | SUMMARY | 1-1 | ||
| 1.1 | Geology | 1-4 | ||
| 1.1.1 | Regional Geology | 1-5 | ||
| 1.1.2 | Ann Mason Deposit | 1-5 | ||
| 1.1.3 | Blue Hill Deposit | 1-7 | ||
| 1.2 | Resource Statement | 1-8 | ||
| 1.2.1 | Ann Mason | 1-8 | ||
| 1.2.2 | Blue Hill | 1-10 | ||
| 1.3 | Geotechnical | 1-12 | ||
| 1.4 | Mining | 1-14 | ||
| 1.5 | Metallurgy and Process | 1-15 | ||
| 1.5.1 | Ann Mason | 1-15 | ||
| 1.5.2 | Blue Hill | 1-17 | ||
| 1.6 | Infrastructure and Site Layout | 1-17 | ||
| 1.7 | Capital and Operating Costs | 1-18 | ||
| 1.7.1 | Capital Costs | 1-18 | ||
| 1.7.2 | Operating Costs | 1-19 | ||
| 1.8 | Economic Analysis | 1-20 | ||
| 1.9 | Environmental | 1-25 | ||
| 1.10 | Proposed Budget | 1-26 | ||
| 1.10.1 | Summary | 1-26 | ||
| 2 | INTRODUCTION AND TERMS OF REFERENCE | 2-1 | ||
| 2.1 | General | 2-1 | ||
| 2.2 | Terms of References | 2-1 | ||
| 2.3 | Qualified Persons | 2-3 | ||
| 2.4 | Site Visits and Responsibility | 2-3 | ||
| 2.5 | Effective Dates | 2-5 | ||
| 2.6 | Previous Technical Reports | 2-5 | ||
| 3 | RELIANCE ON OTHER EXPERTS | 3-1 | ||
| 3.1 | Mineral Tenure, Underlying Agreements, and Royalties | 3-1 | ||
| 3.1.1 | Surface Rights | 3-1 | ||
| 3.1.2 | Permitting | 3-1 | ||
| 3.1.3 | Environmental Liabilities | 3-1 | ||
| 3.1.4 | Social and Community Impacts | 3-1 | ||
| 3.1.5 | Taxation | 3-1 | ||
| 4 | PROPERTY DESCRIPTION AND LOCATION | 4-1 | ||
| 4.1 | Location | 4-1 | ||
| 4.2 | Tenure | 4-2 | ||
| 4.3 | Underlying Agreements and Royalties | 4-7 | ||
| | |
| 10/03/2017 |
TOC i
2017 Updated Preliminary Economic Assessment on the Ann Mason Project
Nevada, U.S.A.
| 4.3.1 | Mining Lease and Option to Purchase Agreement | 4-7 | ||
| 4.3.2 | Option Agreement with Eurasian Minerals | 4-7 | ||
| 4.3.3 | Corrective Special Warranty Deed with Reserved Net Smelter Returns Royalty | 4-7 | ||
| 4.3.4 | Option to Purchase Agreement with Custom Details | 4-7 | ||
| 4.3.5 | Royalty Agreement with Sandstorm Gold Ltd. | 4-8 | ||
| 4.4 | Surface Rights and Easements | 4-8 | ||
| 4.5 | Environmental Considerations and Exploration Permitting | 4-8 | ||
| 4.5.1 | Ann Mason Plan of Operations | 4-8 | ||
| 4.5.2 | Notices of Intent | 4-10 | ||
| 4.6 | Environmental Liabilities | 4-11 | ||
| 4.7 | Permit Requirements | 4-11 | ||
| 5 | ACCESSIBILITY, CLIMATE, LOCAL RESOURCES, INFRASTRUCTURE, AND PHYSIOGRAPHY | 5-1 | ||
| 5.1 | Accessibility | 5-1 | ||
| 5.2 | Climate | 5-3 | ||
| 5.3 | Local Resources | 5-3 | ||
| 5.4 | Infrastructure | 5-3 | ||
| 5.5 | Physiography | 5-4 | ||
| 6 | HISTORY | 6-1 | ||
| 6.1 | Yerington Mining District | 6-1 | ||
| 6.2 | Ann Mason Project | 6-1 | ||
| 6.2.1 | General | 6-1 | ||
| 6.2.2 | Anaconda, 1956–1981 | 6-4 | ||
| 6.2.3 | Superior Oil Company | 6-4 | ||
| 6.2.4 | Iso Nevada Limited, 1970-1971 | 6-4 | ||
| 6.2.5 | Arimetco, 1990 | 6-5 | ||
| 6.2.6 | Phelps Dodge Corporation, ~1995 | 6-5 | ||
| 6.2.7 | Mount Isa Mines, 2002–2003 | 6-5 | ||
| 6.2.8 | Giralia Resources NL, 2003 | 6-5 | ||
| 6.2.9 | Lincoln Gold Corporation, 2004–2005 | 6-5 | ||
| 6.2.10 | PacMag, 2005–2010 | 6-6 | ||
| 6.2.11 | Honey Badger Exploration Inc., 2007–2009 | 6-8 | ||
| 6.2.12 | Bronco Creek Exploration Inc. | 6-9 | ||
| 6.3 | Historical Production | 6-9 | ||
| 7 | GEOLOGICAL SETTING & MINERALIZATION | 7-1 | ||
| 7.1 | Regional Geology | 7-1 | ||
| 7.2 | Local Geology | 7-1 | ||
| 7.3 | Ann Mason Deposit | 7-2 | ||
| 7.3.1 | Geology | 7-2 | ||
| 7.3.2 | Structure | 7-9 | ||
| 7.3.3 | Mineralization | 7-9 | ||
| 7.3.4 | Sulphide Zoning | 7-11 | ||
| 7.3.5 | Alteration | 7-14 | ||
| | |
| 10/03/2017 |
TOC ii
2017 Updated Preliminary Economic Assessment on the Ann Mason Project
Nevada, U.S.A.
| 7.4 | Blue Hill Deposit | 7-18 | ||
| 8 | DEPOSIT TYPES | 8-1 | ||
| 8.1 | Porphyry Copper Deposits | 8-1 | ||
| 8.1.1 | Yerington District | 8-2 | ||
| 8.2 | Supergene Oxide Copper Deposits | 8-2 | ||
| 9 | EXPLORATION | 9-1 | ||
| 9.1 | Introduction | 9-1 | ||
| 9.2 | Topography, Coordinate System, and Satellite Imagery | 9-1 | ||
| 9.3 | Geology | 9-4 | ||
| 9.3.1 | Compilation Work, 2011 | 9-4 | ||
| 9.3.2 | Blackjack Oxide Mapping, 2012 | 9-4 | ||
| 9.3.3 | Geological and Alteration Mapping, 2012-2016 | 9-4 | ||
| 9.4 | Geochemistry | 9-4 | ||
| 9.4.1 | Rock Sampling | 9-4 | ||
| 9.4.2 | Soil Geochemistry – Blue Hill and Ann Mason Compilation | 9-5 | ||
| 9.4.3 | Soil Geochemistry – Roulette | 9-8 | ||
| 9.5 | Geophysics | 9-10 | ||
| 9.5.1 | Airborne Geophysics | 9-10 | ||
| 9.5.2 | Ground Geophysics | 9-12 | ||
| 9.6 | Petrographic Work | 9-15 | ||
| 9.7 | Drilling | 9-15 | ||
| 10 | DRILLING | 10-1 | ||
| 10.1 | Previous Operator Drilling Methods | 10-2 | ||
| 10.2 | Entrée Drilling Methods | 10-2 | ||
| 10.2.1 | Ann Mason Deposit and Periphery | 10-4 | ||
| 10.2.2 | Blue Hill Deposit and Periphery | 10-13 | ||
| 10.2.3 | Roulette | 10-19 | ||
| 10.2.4 | Blackjack IP (Northeast) | 10-20 | ||
| 11 | SAMPLE PREPARATION, ANALYSES, AND SECURITY | 11-1 | ||
| 11.1 | Sample Preparation and Analyses | 11-1 | ||
| 11.1.1 | Diamond Drill Core Sampling | 11-1 | ||
| 11.1.2 | Reverse Circulation Drill Sampling | 11-2 | ||
| 11.2 | Assay Quality Control | 11-6 | ||
| 11.2.1 | Assessment of Precision 2013-2015 | 11-6 | ||
| 11.2.2 | Assessment of Accuracy 2013-2015 | 11-10 | ||
| 11.2.3 | Assessment of Contamination 2013-2015 | 11-13 | ||
| 11.3 | Database Quality | 11-14 | ||
| 11.4 | Sample Security | 11-15 | ||
| 11.4.1 | Pre 2009 | 11-15 | ||
| 11.4.2 | Entrée (2010 to Present) Core Drilling | 11-15 | ||
| 11.4.3 | Entrée (2010 to Present) RC Drilling | 11-15 | ||
| 11.5 | Bulk Density Sampling | 11-15 | ||
| | |
| 10/03/2017 |
TOC iii
2017 Updated Preliminary Economic Assessment on the Ann Mason Project
Nevada, U.S.A.
| 11.5.1 | Entrée (2011-2012) | 11-15 | ||
| 11.5.2 | Entrée (2013) | 11-16 | ||
| 11.5.3 | Entrée (2014–2015) | 11-16 | ||
| 11.5.4 | QP Comments | 11-17 | ||
| 12 | DATA VERIFICATION | 12-1 | ||
| 12.1 | Verification by Amec Foster Wheeler | 12-1 | ||
| 12.1.1 | Ann Mason Data Verification | 12-1 | ||
| 12.2 | Verification by AGP | 12-1 | ||
| 12.2.1 | Blue Hill Database Verification | 12-1 | ||
| 12.2.2 | Site Visit | 12-2 | ||
| 13 | MINERAL PROCESSING AND METALLURGICAL TESTING | 13-1 | ||
| 13.1 | Introduction | 13-1 | ||
| 13.2 | The Anaconda Company, 1970 | 13-1 | ||
| 13.3 | Metcon Research, 2011 | 13-3 | ||
| 13.3.1 | Head Characterization | 13-3 | ||
| 13.3.2 | Rougher Flotation Tests | 13-3 | ||
| 13.3.3 | Cleaner Flotation Tests | 13-5 | ||
| 13.3.4 | Locked Cycle Testing | 13-6 | ||
| 13.3.5 | Cu/Mo Separation | 13-7 | ||
| 13.3.6 | Minor Element Analysis | 13-7 | ||
| 13.4 | Metcon Research, 2012 | 13-8 | ||
| 13.4.1 | Grindability Study | 13-9 | ||
| 13.4.2 | Variability Testing: Low-Grade, Cpy-Py Zone | 13-9 | ||
| 13.5 | SGS Minerals Services, 2015 | 13-11 | ||
| 13.5.1 | Sample Selection | 13-11 | ||
| 13.5.2 | Grindability | 13-12 | ||
| 13.5.3 | Rougher Flotation | 13-13 | ||
| 13.5.4 | Cleaner Flotation | 13-14 | ||
| 13.5.5 | Locked Cycle Testing | 13-15 | ||
| 13.5.6 | Cu-Mo Separation | 13-16 | ||
| 13.5.7 | Variability | 13-17 | ||
| 13.5.8 | Settling Testwork | 13-18 | ||
| 13.6 | Metallurgical Projection | 13-18 | ||
| 14 | MINERAL RESOURCE ESTIMATES | 14-1 | ||
| 14.1 | Ann Mason Mineral Resource Estimate | 14-1 | ||
| 14.1.1 | Geological Wireframe Models | 14-1 | ||
| 14.1.2 | Assay Compositing | 14-4 | ||
| 14.1.3 | Exploratory Data Analysis | 14-5 | ||
| 14.1.4 | Contact Analysis | 14-9 | ||
| 14.1.5 | Outlier Analysis and Capping | 14-11 | ||
| 14.1.6 | Variography | 14-11 | ||
| 14.1.7 | Block Model Dimensions | 14-12 | ||
| 14.1.8 | Block Model Assignments | 14-13 | ||
| 14.1.9 | Block Model Grade Estimate | 14-14 | ||
| | |
| 10/03/2017 |
TOC iv
2017 Updated Preliminary Economic Assessment on the Ann Mason Project
Nevada, U.S.A.
| 14.1.10 | Block Model Validation | 14-17 | ||
| 14.1.11 | Mineral Resource Classification | 14-24 | ||
| 14.1.12 | Reasonable Prospects for Eventual Economic Extraction | 14-26 | ||
| 14.1.13 | Mineral Resource Statement | 14-27 | ||
| 14.1.14 | QP Comment | 14-29 | ||
| 14.2 | Blue Hill Mineral Resource Estimate | 14-30 | ||
| 14.2.1 | Current Estimate | 14-30 | ||
| 14.2.2 | Basis of Resource Estimate | 14-31 | ||
| 14.2.3 | Sample Database | 14-31 | ||
| 14.2.4 | Domaining | 14-33 | ||
| 14.2.5 | Data Analysis | 14-36 | ||
| 14.2.6 | Treatment of High-Grade Outliers | 14-39 | ||
| 14.2.7 | Compositing | 14-39 | ||
| 14.2.8 | Block Model Parameters | 14-40 | ||
| 14.2.9 | Estimation/Interpolation Methods | 14-41 | ||
| 14.2.10 | Block Model Validation | 14-43 | ||
| 14.2.11 | Classification of Mineral Resources | 14-43 | ||
| 14.2.12 | Resource Pit Constraints | 14-43 | ||
| 14.2.13 | Mineral Resource Statement | 14-44 | ||
| 15 | MINERAL RESERVE ESTIMATES | 15-1 | ||
| 16 | MINING METHODS | 16-1 | ||
| 16.1 | Geotechnical | 16-1 | ||
| 16.1.1 | Data Compilation and Review | 16-1 | ||
| 16.1.2 | District Geology – Geotechnical Perspective | 16-3 | ||
| 16.1.3 | Rock Mass Character of the Ann Mason Deposit | 16-4 | ||
| 16.1.4 | Structural Geology of the Ann Mason Deposit | 16-4 | ||
| 16.1.5 | Hydrogeology | 16-5 | ||
| 16.1.6 | Preliminary Open Pit Slope Angles | 16-7 | ||
| 16.2 | Open Pit Mining | 16-11 | ||
| 16.2.1 | Introduction | 16-11 | ||
| 16.2.2 | Geological Model Importation | 16-12 | ||
| 16.2.3 | Resource Model Sensitivity Analysis | 16-12 | ||
| 16.2.4 | Economic Pit Shell Development | 16-13 | ||
| 16.2.5 | Pit Design and Phase Development | 16-15 | ||
| 16.2.6 | Production Rate Evaluation | 16-24 | ||
| 16.2.7 | 2017 PEA Mine Schedule | 16-24 | ||
| 16.2.8 | Waste Rock Management Facility Design | 16-30 | ||
| 17 | RECOVERY METHODS | 17-1 | ||
| 17.1 | Introduction | 17-1 | ||
| 17.2 | Process Flowsheet | 17-1 | ||
| 17.3 | Design Criteria | 17-3 | ||
| �� | 17.4 | Process Description | 17-3 | |
| 17.4.1 | Process Summary | 17-3 | ||
| 17.4.2 | Detailed Process Description | 17-5 | ||
| | |
| 10/03/2017 |
TOC v
2017 Updated Preliminary Economic Assessment on the Ann Mason Project
Nevada, U.S.A.
| 18 | PROJECT INFRASTRUCTURE | 18-1 | ||
| 18.1 | Infrastructure and Site Layout | 18-1 | ||
| 18.1.1 | Mine/Mill Site Operations | 18-1 | ||
| 18.1.2 | Concentrate Storage | 18-1 | ||
| 18.1.3 | Warehouse, Office, and Dry | 18-3 | ||
| 18.1.4 | Fuel Storage and Handling | 18-3 | ||
| 18.1.5 | Explosives Storage and Handling | 18-3 | ||
| 18.1.6 | Roads | 18-3 | ||
| 18.1.7 | Water Balance System | 18-3 | ||
| 18.1.8 | Service/Potable Water | 18-3 | ||
| 18.1.9 | Sewage Treatment | 18-4 | ||
| 18.1.10 | Refuse Management | 18-4 | ||
| 18.1.11 | Power Supply and Distribution | 18-4 | ||
| 18.2 | Tailings Management Facility | 18-5 | ||
| 18.2.1 | General | 18-5 | ||
| 18.2.2 | Design Basis and Operating Criteria | 18-5 | ||
| 18.2.3 | Tailings Management Facility Embankments | 18-5 | ||
| 18.2.4 | Tailings Distribution and Reclaim Water Systems | 18-6 | ||
| 18.2.5 | Water Management | 18-6 | ||
| 18.3 | Plant/Mine Site Water Management | 18-7 | ||
| 18.4 | Waste Rock Management Facility | 18-7 | ||
| 19 | MARKET STUDIES AND CONTRACTS | 19-1 | ||
| 19.1 | General Considerations | 19-1 | ||
| 19.2 | Terms and Conditions Discussion | 19-3 | ||
| 19.2.1 | Accountable Metals | 19-3 | ||
| 19.2.2 | Smelting and Refining Charges | 19-3 | ||
| 20 | ENVIRONMENTAL STUDIES, PERMITTING, AND SOCIAL OR COMMUNITY IMPACT | 20-1 | ||
| 20.1 | Environmental Studies | 20-1 | ||
| 20.2 | Project Permitting Requirements | 20-2 | ||
| 20.2.1 | Plan of Operations (PlanOp) | 20-2 | ||
| 20.2.2 | BMRR Water Pollution Control Permit | 20-5 | ||
| 20.2.3 | BMRR Reclamation Permit | 20-6 | ||
| 20.2.4 | BAPC Air Quality Permit | 20-6 | ||
| 20.2.5 | Lyon County/Douglas County Permits | 20-7 | ||
| 20.3 | Waste and Tailing Management | 20-8 | ||
| 20.4 | Social/Community Issues | 20-8 | ||
| 20.5 | Mine Closure | 20-8 | ||
| 21 | CAPITAL AND OPERATING COSTS | 21-1 | ||
| 21.1 | Capital Costs | 21-1 | ||
| 21.1.1 | Summary | 21-1 | ||
| 21.1.2 | Open Pit Mining Capital | 21-2 | ||
| 21.1.3 | Process Plant Capital Cost | 21-3 | ||
| 21.1.4 | Basis for Estimation | 21-4 | ||
| | |
| 10/03/2017 |
TOC vi
2017 Updated Preliminary Economic Assessment on the Ann Mason Project
Nevada, U.S.A.
| 21.1.5 | Infrastructure Capital Cost | 21-5 | ||
| 21.1.6 | Environmental | 21-7 | ||
| 21.1.7 | Indirects | 21-8 | ||
| 21.1.8 | Contingency | 21-9 | ||
| 21.2 | Operating Costs | 21-9 | ||
| 21.2.1 | Summary | 21-9 | ||
| 21.2.2 | Open Pit Mining | 21-11 | ||
| 21.2.3 | Process Plant Operating Cost | 21-15 | ||
| 21.2.4 | General and Administrative | 21-19 | ||
| 21.2.5 | Concentrate Transportation | 21-20 | ||
| 21.2.6 | Port Charges | 21-21 | ||
| 21.2.7 | Shipping | 21-21 | ||
| 21.2.8 | Mine Labour Force | 21-21 | ||
| 22 | ECONOMIC ANALYSIS | 22-1 | ||
| 22.1 | Discounted Cash Flow Analysis | 22-1 | ||
| 22.2 | Sensitivity Analysis | 22-7 | ||
| 22.3 | Detailed Cash Flow | 22-9 | ||
| 22.4 | Taxes and Royalties | 22-9 | ||
| 23 | ADJACENT PROPERTIES | 23-1 | ||
| 23.1 | MacArthur and Yerington Projects | 23-1 | ||
| 23.1.1 | MacArthur Project | 23-1 | ||
| 23.1.2 | Yerington Project | 23-3 | ||
| 23.2 | Mason Valley Copper Project | 23-4 | ||
| 23.3 | Minnesota Mine | 23-4 | ||
| 24 | OTHER RELEVANT DATA AND INFORMATION | 24-1 | ||
| 25 | INTERPRETATION AND CONCLUSIONS | 25-1 | ||
| 25.1 | Property Summary | 25-1 | ||
| 25.2 | Geology, Alteration, and Mineralization | 25-1 | ||
| 25.2.1 | Ann Mason | 25-1 | ||
| 25.2.2 | Blue Hill | 25-3 | ||
| 25.3 | Exploration | 25-4 | ||
| 25.4 | Mineral Resource Estimate | 25-6 | ||
| 25.4.1 | Ann Mason Deposit | 25-7 | ||
| 25.4.2 | Blue Hill Deposit | 25-7 | ||
| 25.5 | Geotechnical | 25-8 | ||
| 25.6 | Open Pit Mining | 25-9 | ||
| 25.7 | Metallurgy and Process | 25-10 | ||
| 25.7.1 | Ann Mason | 25-10 | ||
| 25.7.2 | Blue Hill | 25-11 | ||
| 25.8 | Infrastructure and Site Layout | 25-12 | ||
| 25.9 | Economic Analysis | 25-13 | ||
| | |
| 10/03/2017 |
TOC vii
2017 Updated Preliminary Economic Assessment on the Ann Mason Project
Nevada, U.S.A.
| 26 | RECOMMENDATIONS | 26-1 | ||
| 26.1 | Introduction | 26-1 | ||
| 26.2 | Drilling | 26-1 | ||
| 26.2.1 | Stage 1 In-Pit Drilling | 26-1 | ||
| 26.2.2 | Stage 2 In-pit Drilling | 26-1 | ||
| 26.2.3 | Regional Exploration Drilling and Core Resampling | 26-2 | ||
| 26.3 | Prefeasibility Work | 26-3 | ||
| 26.4 | Geotechnical | 26-4 | ||
| 26.4.1 | Geotechnical Drilling | 26-4 | ||
| 26.4.2 | Borehole Televiewer Surveys | 26-4 | ||
| 26.4.3 | Hydrogeology Field Assessments | 26-5 | ||
| 26.4.4 | Laboratory Testing | 26-5 | ||
| 26.4.5 | Groundwater Monitoring | 26-5 | ||
| 26.4.6 | Geotechnical Mapping | 26-5 | ||
| 26.4.7 | Geological Modelling | 26-5 | ||
| 26.4.8 | Geotechnical Model Development and Open Pit Slope Designs | 26-6 | ||
| 26.4.9 | Review the Potential for Toppling Failure Mode | 26-6 | ||
| 26.4.10 | Hydrogeological Model and Pit Dewatering Assessments | 26-6 | ||
| 26.5 | Open Pit Mining | 26-6 | ||
| 26.6 | Metallurgy and Processing | 26-7 | ||
| 26.7 | Infrastructure and Site Layout | 26-7 | ||
| 26.8 | Waste and Water Management | 26-8 | ||
| 26.9 | Environmental | 26-8 | ||
| 27 | REFERENCES | 27-1 | ||
| 27.1 | Websites | 27-5 | ||
| 28 | CERTIFICATE OF AUTHORS | 28-1 | ||
| 28.1 | Gregory Kenneth Kulla, P.Geo. | 28-1 | ||
| 28.2 | Peter Anthony Oshust, P.Geo. | 28-2 | ||
| 28.3 | Joseph Rosaire Pierre Desautels, P.Geo. | 28-3 | ||
| 28.4 | Jay Melnyk, P.Eng. | 28-4 | ||
| 28.5 | Gordon Zurowski, P.Eng. | 28-5 | ||
| 28.6 | Lyn Jones, P.Eng. | 28-6 | ||
| 28.7 | Mario Colantonio, P.Eng. | 28-7 | ||
| 29 | SIGNATURE PAGE | 29-1 | ||
| | |
| 10/03/2017 |
TOC viii
2017 Updated Preliminary Economic Assessment on the Ann Mason Project
Nevada, U.S.A.
| Table 1-1: | Mineral Resource Statement for the Ann Mason Deposit based on a 0.20% Cu Cut off | 1-8 |
| Table 1-2: | Blue Hill Inferred Mineral Resources (effective date March 3, 2017) | 1-12 |
| Table 1-3: | DCF Tonnes and Grade by Phase and Category | 1-15 |
| Table 1-4: | Projected Grades and Recoveries for the Copper and Molybdenum Concentrates. | 1-16 |
| Table 1-5: | Summary of Ann Mason 2017 PEA Capital Cost Estimates | 1-19 |
| Table 1-6: | Summary of Ann Mason Operating Costs Year 1 – 21 | 1-20 |
| Table 1-7: | Metal Prices by Scenario | 1-21 |
| Table 1-8: | Discounted Cash Flow Results | 1-22 |
| Table 1-9: | Ann Mason Key Metal Production Statistics and Cash Costs | 1-23 |
| Table 2-1: | Date of Site Visits and Areas of Responsibility | 2-4 |
| Table 4-1: | Ann Mason Project Claims | 4-3 |
| Table 6-1: | Ann Mason Project – Historical Exploration | 6-2 |
| Table 7-1: | Sulphide Domains at Ann Mason Deposit | 7-11 |
| Table 9-1: | Summary of Work Completed on the Ann Mason Project since 2009 | 9-2 |
| Table 9-2: | Summary of Ann Mason/Blue Hill Soil Surveys, Ann Mason Project | 9-5 |
| Table 10-1: | Ann Mason Project Drilling Summary | 10-1 |
| Table 10-2: | Entrée Drilling Summary: 2010 to 2015 | 10-3 |
| Table 10-3: | Ann Mason Deposit and Periphery – Significant Drill Intercepts | 10-5 |
| Table 10-4: | Blue Hill Deposit and Periphery: Significant Drill Intercepts | 10-17 |
| Table 11-1: | Summary of Ann Mason Project Prep and Analytical Procedures | 11-4 |
| Table 11-2: | Duplicate Results 2013 | 11-8 |
| Table 11-3: | Duplicate Results 2014-2015 Infill | 11-8 |
| Table 11-4: | Duplicate Results 2015 Exploration Drilling | 11-9 |
| Table 11-5: | 2013 Summary Bias in Standards by element for Ann Mason and Blue Hill | 11-11 |
| Table 11-6: | 2014-2015 Infill Drilling Summary Bias in Standards by element for Ann Mason | 11-11 |
| Table 11-7: | 2015 Exploration Summary Bias in Standards by element for Ann Mason and Blue Hill | 11-12 |
| Table 11-8: | 2014-2015 Infill Drilling Check Assay RMA Regression Statistics (Outliers Removed) | 11-12 |
| Table 11-9: | Ann Mason Deposit – Entrée Bulk Density Determinations 2013-2015 (Bold texts shows rock types analysed by ALS) | 11-17 |
| Table 12-1: | Blue Hill Check Sample Results | 12-5 |
| Table 12-2: | Ann Mason Check Sample Results | 12-5 |
| Table 12-3: | Collar Coordinate Verification | 12-6 |
| Table 13-1: | Averaged Flotation Results from 21 Metallurgical Composites | 13-2 |
| Table 13-2: | Head Analysis of the Composite Samples | 13-3 |
| Table 13-3: | Grades and recoveries for the last four cycles of the Locked Cycle Test on composite EG-AM-11-003 | 13-6 |
| Table 13-4: | Grades and recoveries for the last four cycles of the Locked Cycle Test on composite EG-AM-11-009. | 13-6 |
| Table 13-5: | Minor Element Analysis for the Cu-Mo Separation Tests Final Products | 13-8 |
| Table 13-6: | Grindability Results for the Ann Mason Composite Sample | 13-9 |
| | |
| 10/03/2017 |
TOC ix
2017 Updated Preliminary Economic Assessment on the Ann Mason Project
Nevada, U.S.A.
| Table 13-7: | Head Analysis of the Low-Grade and Mid-Grade Composite Samples | 13-9 |
| Table 13-8: | Average Grades and Recoveries for the last four cycles of the Locked Cycle Test on the Low-Grade and Mid-Grade Composites | 13-11 |
| Table 13-9: | Head Analysis for the Zone Composites | 13-12 |
| Table 13-10: | Summary of hardness testing results for the Zone and Drop Weight Composites | 13-12 |
| Table 13-11: | Summary of Locked Cycle Flotation Results for the Zone Composites | 13-15 |
| Table 13-12: | Summary of Variability Composites | 13-17 |
| Table 13-13: | Projected Grades and Recoveries for the Copper and Molybdenum Concentrates from the Ann Mason Deposit | 13-19 |
| Table 14-1: | Logging Codes and Grouped Codes for Lithological Modelling | 14-2 |
| Table 14-2: | Copper Grade Composite Capping Choice and Statistics | 14-11 |
| Table 14-3: | Gold, Molybdenum, and Silver Grade Composite Capping Choice and Statistics | 14-11 |
| Table 14-4: | A Summary of Variogram Parameters | 14-12 |
| Table 14-5: | The Rotated Variogram Azimuth and Dip Directions | 14-12 |
| Table 14-6: | Block Model Dimensions | 14-12 |
| Table 14-7: | A Summary of the Block Grade Estimation Plan for Copper | 14-15 |
| Table 14-8: | A Summary of the Block Grade Estimation Plan for Gold, Molybdenum, and Silver | 14-16 |
| Table 14-9: | The Global Bias Check | 14-19 |
| Table 14-10: | Predicted Copper Metal Loss Due to Grade Capping | 14-20 |
| Table 14-11: | Predicted Gold, Molybdenum, and Silver Metal Loss Due to Grade Capping | 14-20 |
| Table 14-12: | Economic and Technical Assumptions used to prepare a Constraining Pit | 14-27 |
| Table 14-13: | Mineral Resource Statement for the Ann Mason Deposit based on a 0.20% Cu Cut off(*) | 14-28 |
| Table 14-14: | Sensitivity of the Ann Mason Deposit Mineral Resource to Changes in the Cut-off Grade (Base Case in Bold Text) | 14-29 |
| Table 14-15: | Number of Samples per Campaign by Drill Hole Type | 14-33 |
| Table 14-16: | Median Bulk Density by Domain | 14-39 |
| Table 14-17: | Descriptive Statistics of Original and Capped Copper Grades in Raw Assays | 14-39 |
| Table 14-18: | Descriptive Statistics of Composite Grades | 14-40 |
| Table 14-19: | Block Model Geometry | 14-41 |
| Table 14-20: | Blue Hill Inferred Mineral Resource Estimate (Effective Date: March 3, 2017) | 14-45 |
| Table 14-21: | Blue Hill Inferred Mineral Resource Sensitivity to Copper Cut-off Changes within the Constraining Shell (Effective Date: March 3, 2017) | 14-45 |
| Table 16-1: | Ann Mason Rock Mass Properties | 16-2 |
| Table 16-2: | Ann Mason Design Cases | 16-8 |
| Table 16-3: | Examples of Large Copper Porphyry Mine Slope Geometries | 16-9 |
| Table 16-4: | Model Boundaries | 16-12 |
| Table 16-5: | Model Comparison LG Shell Results – reported at 0.20 Cu% Cut-off | 16-13 |
| Table 16-6: | Metallurgical Recoveries | 16-13 |
| Table 16-7: | Economic Pit Shell Costs | 16-14 |
| Table 16-8: | Phase 5 LG Shell Replication Metal Prices | 16-14 |
| Table 16-9: | Production Rate Trade-off – Metal Prices | 16-24 |
| Table 16-10: | Production Rate Trade-off Comparison (7.5% Discount Rate) | 16-24 |
| Table 16-11: | Value per Tonne Calculation Parameters | 16-25 |
| Table 16-12: | Mill feed Tonnes and Grade by Phase and Category | 16-27 |
| | |
| 10/03/2017 |
TOC x
2017 Updated Preliminary Economic Assessment on the Ann Mason Project
Nevada, U.S.A.
| Table 17-1: | Summary of Process Design Criteria | 17-3 |
| Table 19-1: | Smelting and Refining Terms | 19-4 |
| Table 21-1: | Ann Mason Project Capital Cost Summary | 21-10 |
| Table 21-2: | Capital Category Indirect and Contingency Percentages | 21-10 |
| Table 21-3: | Major Equipment – Capital Cost, Full Lease Cost and Lease Down Payment | 21-11 |
| Table 21-4: | Mining Capital by Period – Lease Down Payment | 21-11 |
| Table 21-5: | Summary of Process Plant Capital Costs | 21-12 |
| Table 21-6: | Infrastructure Capital Costs | 21-15 |
| Table 21-7: | Indirect Percentages Applied | 21-17 |
| Table 21-8: | Capital Cost Category Contingency Percentages | 21-18 |
| Table 21-9: | Total Operating Costs | 21-19 |
| Table 21-10: | Major Mine Equipment Requirements | 21-21 |
| Table 21-11: | Drill Pattern Specification | 21-21 |
| Table 21-12: | Drill Productivity Criteria | 21-22 |
| Table 21-13: | Design Powder Factors | 21-22 |
| Table 21-14: | Loading Parameters | 21-23 |
| Table 21-15: | Major Equipment Hourly Operating Rates | 21-23 |
| Table 21-16: | Open Pit Mine Operating Costs | 21-24 |
| Table 21-17: | Operating Cost Estimate for the Ann Mason Processing Plant | 21-25 |
| Table 21-18: | Process Plant Labour Cost Summary | 21-26 |
| Table 21-19: | Process Plant Electricity Cost Estimate | 21-26 |
| Table 21-20: | Summary of Estimated Reagent Operating Costs | 21-27 |
| Table 21-21: | Grinding Media and Liner Operating Costs | 21-27 |
| Table 21-22: | G&A Cost Calculation (Year 2) | 21-29 |
| Table 22-1: | Mill Feed Classification Percentages | 22-1 |
| Table 22-2: | DCF Tonnes and Grade by Phase and Category | 22-3 |
| Table 22-3: | Metal Prices by Scenario | 22-4 |
| Table 22-4: | Cash Flow Results | 22-5 |
| Table 22-5: | Smelting and Refining Terms Applied | 22-5 |
| Table 22-6: | Metal Production Statistics, Cash Cost Calculations and Key Economic Parameters | 22-6 |
| Table 22-7: | Detailed Cash Flow (Year -3 to Year 7) | 22-10 |
| Table 22-8 | Detailed Cash Flow (Year 8 – Year 17) | 22-11 |
| Table 22-9 | Detailed Cash Flow (Year 18 – Year 28) | 22-12 |
| Table 23-1: | MacArthur Project Mineral Resources (M3 Engineering, May 2012) | 23-2 |
| Table 26-1: | Ann Mason Stage 1 and 2 Drilling Recommended Budget | 26-2 |
| Table 26-2: | Regional Exploration Drilling and Core Resampling Recommended Budget | 26-3 |
Figures
| Figure 1 1: | Ann Mason Project Location Map, Nevada, USA | 1-2 |
| Figure 1 2: | Proposed Site Layout | 1-3 |
| Figure 1 3: | Spider Graph of Sensitivity of NPV at 7.5% (Post-Tax) | 1-24 |
| Figure 1 4: | Spider Graph of IRR Sensitivity (Post-Tax) | 1-24 |
| | |
| 10/03/2017 |
TOC xi
2017 Updated Preliminary Economic Assessment on the Ann Mason Project
Nevada, U.S.A.
| Figure 4 1: | Ann Mason Project Location Map | 4-1 |
| Figure 4 2: | Ann Mason Project Mineral Claim Map | 4-5 |
| Figure 4 3: | Map of Permitted Work Areas within the Ann Mason Project | 4-12 |
| Figure 5 1: | Ann Mason Project, Access, and Physiography | 5-2 |
| Figure 6 1: | Ann Mason Project – Historical Drilling | 6-3 |
| Figure 7 1: | Ann Mason Project Geology | 7-3 |
| Figure 7 2: | Ann Mason Deposit Geology | 7-4 |
| Figure 7 3: | Ann Mason Cross-Section 4,317,700 N Showing Geology and Sulphide Domains | 7-13 |
| Figure 7 4: | Ann Mason Cross-Section 4,317,700 N Showing Alteration | 7-17 |
| Figure 9 1: | Entrée Exploration Areas at the Ann Mason Project | 9-3 |
| Figure 9 2: | Soil Samples Location, Ann Mason – Blue Hill Area | 9-6 |
| Figure 9 3: | Gridded Copper in Soils, Ann Mason – Blue Hill – Blackjack Oxide Area | 9-9 |
| Figure 9 4: | Ann Mason Project – Anaconda Aeromagnetic Data Reduced to the Pole (Windels, 2013) | 9-11 |
| Figure 9 5: | Ann Mason Project Chargeability at 600 m Depth | 9-13 |
| Figure 10 1: | Ann Mason Deposit – Drill Plan | 10-11 |
| Figure 10 2: | Ann Mason Deposit – Section 4,317,700 N | 10-12 |
| Figure 10 3: | Blue Hill: Drill Plan | 10-15 |
| Figure 10 4: | Blue Hill: Section 4319090N | 10-16 |
| Figure 10 5: | Ann Mason Project: Exploration Drilling | 10-21 |
| Figure 11 1: | Ann Mason – Control Chart Standard AM-8–Cu (%) | 11-7 |
| Figure 11 2: | Ann Mason Copper in Pulp Duplicate Samples | 11-10 |
| Figure 11 3: | Cu in ALS Check Samples (outliers excluded) | 11-13 |
| Figure 11 4: | Ann Mason – Plot of Copper in 2014-2015 Infill Drilling Coarse Blanks | 11-14 |
| Figure 12 1: | Site Visit Photos | 12-6 |
| Figure 13-1: | Effect of Grind Size on Copper and Molybdenum Recovery in Rougher Flotation (label 003 corresponds to composite sample EG-AM-11-003) | 13-4 |
| Figure 13 2: | Effect of Regrind Size on Copper and Molybdenum Recovery in Cleaner Flotation | 13-5 |
| Figure 13-3: | Molybdenum Grade-Recovery Curves for the Cu-Mo Separation | 13-7 |
| Figure 13-4: | Rougher Flotation Kinetic Curves for Different Collector Combinations | 13-13 |
| Figure 13-5: | Effect of Primary Grind Size on Rougher Tailings Copper Grade | 13-14 |
| Figure 13-6: | Grade-Recovery Curves for the Cleaner Flotation Tests | 13-15 |
| Figure 13-7: | Grade-Recovery Curves for the Cu-Mo Separation Tests | 13-16 |
| Figure 13-8: | Grade-Recovery Curves for the Variability Cleaner Flotation Tests | 13-18 |
| Figure 14 1: | A 3D Cut-Away View of the Lithological Model (View Looking Northwest) | 14-2 |
| Figure 14 2: | Traces of the Faults Used in the Construction of the Geological Model at 1460 masl | 14-3 |
| Figure 14 3: | An Image of the 0.15% Cu (Blue) and 0.40% Cu (Red) Grade Shells (View Looking Northeast) | 14-4 |
| Figure 14 4: | Box plots and Summary Statistics for Uncapped Cu by Lithological (LFLG) Category | 14-6 |
| Figure 14 5: | Box plots and Summary Statistics for Uncapped Cu by Grade Shell | 14-7 |
| Figure 14 6: | Arithmetic and Logarithmic Histograms and Probability Plots of Uncapped copper Composites Outside of the Copper Grade Shells | 14-8 |
| Figure 14 7: | Arithmetic and Logarithmic Histograms and Probability Plots of Uncapped Copper Composites inside the Combined 0.15% Cu and 0.40% Cu Grade Shells | 14-9 |
| |
| 10/03/2017 |
TOC xii
2017 Updated Preliminary Economic Assessment on the Ann Mason Project
Nevada, U.S.A.
| Figure 14 8: | Copper Grade Composite Contact Plot From Outside to Inside the 0.15% Cu Grade Shell Boundary | 14-10 |
| Figure 14 9: | The Boxplots for the Grouped Logged Lithological Units | 14-13 |
| Figure 14 10: | Copper Composites and Copper Block Grades in Planview at 1320 Elevation | 14-17 |
| Figure 14 11: | Copper Composites and Copper Block Grades in Section at 304,500 E Looking West | 14-18 |
| Figure 14 12: | Copper Composites and Copper Block Grades in Section at 4,317,700 N Looking North | 14-19 |
| Figure 14 13: | Copper Swath Plots Using Measured and Indicated Blocks | 14-21 |
| Figure 14 14: | HERCO Grade vs. Tonnage Curves for Copper | 14-23 |
| Figure 14 15: | Relative Difference in Grade, Tonnage, and Metal Derived from the Copper GT Curves | 14-23 |
| Figure 14 16: | Mineral Resource Classification – Planview at 1320 Elevation | 14-25 |
| Figure 14 17: | Mineral Resource Classification. Section at 304,500 E Looking West | 14-26 |
| Figure 14 18: | 2013-2015 Drilling in Relation to the 2012 Estimate | 14-32 |
| Figure 14 19: | Oblique View of the Blue Hill Wireframe Model Looking Northeast | 14-35 |
| Figure 14 20: | Section NE-3 Illustrating Blue Hill Wireframes Looking Northeast | 14-36 |
| Figure 14 21: | Compilation Probability Plots of Raw Assays by Domain | 14-37 |
| Figure 16 1: | Ann Mason Geotechnical Considerations | 16-6 |
| Figure 16 2: | Open Pit Slope Geometry Definitions | 16-8 |
| Figure 16 3: | Plan View Image of Phase 1 | 16-16 |
| Figure 16 4: | Plan View Image of Phase 2 | 16-17 |
| Figure 16 5: | Plan View Image of Phase 3 | 16-18 |
| Figure 16 6: | Plan View Image of Phase 4 | 16-19 |
| Figure 16 7: | Plan View Image of Phase 5 | 16-20 |
| Figure 16 8: | Plan View Image of Phase 6 | 16-21 |
| Figure 16 9: | Plan View Image of Phase 7 | 16-22 |
| Figure 16 10: | East-West Section at Northing 4,317,720 | 16-23 |
| Figure 16 11: | Plant Feed Tonnages by Year | 16-28 |
| Figure 16 12: | Plant Feed Grades LOM | 16-29 |
| Figure 16 13: | Waste Tonnage Movement by Phase | 16-29 |
| Figure 16 14: | Waste Rock Management Facility Access | 16-32 |
| Figure 16 15: | Waste Rock Management Facility in Overall Site Layout | 16-33 |
| Figure 17-1: | Flowsheet for the Ann Mason Processing Plant | 17-2 |
| Figure 18 1: | Plant Site | 18-2 |
| Figure 21 1: | Annual Labour Force Levels | 21-31 |
| Figure 22 1: | Spider Graph of Sensitivity of NPV at 7.5% (Post-Tax) | 22-8 |
| Figure 22 2: | Spider Graph of IRR Sensitivity (Post-Tax) | 22-8 |
| | |
| 10/03/2017 |
TOC xiii
2017 Updated Preliminary Economic Assessment on the Ann Mason Project
Nevada, U.S.A.
Glossary
| Units of Measure |
| Annum (year) | a |
| Billion | B |
| Billion tonnes | Bt |
| Centimetre | cm |
| Cubic centimetre | cm3 |
| Cubic metre | m3 |
| Day | d |
| Days per week | d/wk |
| Days per year (annum) | d/a |
| Dead weight tonnes | DWT |
| Degree | ° |
| Degrees Celsius | °C |
| Dollar (United States) | $ |
| Dry metric tonne | dmt |
Foot | ft |
| Gigajoule | GJ |
| Gram | g |
Grams per litre | g/L |
Grams per tonne | g/t |
| Greater than | > |
Greater than or equal to | ≥ |
Hectare (10,000 m2) | ha |
| Hour | h |
| Hours per day | h/d |
| Hours per week | h/wk |
| Hours per year | h/a |
| Inch | " |
| Kilo (thousand) | k |
| Kilogram | kg |
Kilograms per cubic metre | kg/m3 |
| Kilograms per hour | kg/h |
| Kilograms per square metre | kg/m2 |
| Kilometre | km |
| Kilometres per hour | km/h |
| Kilovolt | kV |
| Kilovolt-ampere | kVA |
| Kilowatt | kW |
| Kilowatt hour | kWh |
| Kilowatt hours per tonne (metric) | kWh/t |
| Kilowatt hours per year | kWh/a |
| Less than | < |
| | |
| 10/03/2017 |
TOC xiv
2017 Updated Preliminary Economic Assessment on the Ann Mason Project
Nevada, U.S.A.
| Litre | L |
| Litres per minute | L/min |
| Megabytes per second | Mb/sec |
| Metre | m |
| Metres per minute | m/min |
| Metres per second | m/sec |
| Microns | µm |
| Milligram | mg |
| Milligrams per litre | mg/L |
| Millilitre | mL |
| Millimetre | mm |
| Million | M |
| Million tonnes | Mt |
| Million short tons | Mst |
| Minute (plane angle) | ' |
| Minute (time) | min |
| Troy ounce | oz |
| Parts per million | ppm |
| Parts per billion | ppb |
| Percent | % |
| Pound(s) | lb |
| Second (plane angle) | " |
| Second (time) | sec |
| Short ton | st |
| Specific gravity | SG |
| Square centimetre | cm2 |
| Square kilometre | km2 |
| Square metre | m2 |
| Three Dimensional | 3D |
| Tonne (1,000 kg) | t |
| Tonnes per day | t/d |
| Tonnes per hour | t/h |
| Tonnes per year | t/a |
| Total | T |
| Volt | V |
| Week | wk |
| Weight/weight | w/w |
| Wet metric tonne | wmt |
Abbreviations and Acronyms
| | |
| 10/03/2017 |
TOC xv
2017 Updated Preliminary Economic Assessment on the Ann Mason Project
Nevada, U.S.A.
| Canadian Institute of Mining, Metallurgy and Petroleum | CIM |
| Caterpillar's® Fleet Production and Cost Analysis software | FPC |
| Coefficient of Variation | CV |
| Copper | Cu |
| Copper equivalent | CuEq |
| Counter-current decantation | CCD |
| Cyanide Soluble | CN |
| Direct Leach | DL |
| Discounted cash flow | DCF |
| Entrée Gold (US) Inc. | Entrée US |
| Environmental Assessment | EA |
| Environmental Impact Study | EIS |
| Environmental Management System | EMS |
| Gemcom International Inc. | Gemcom |
| General and administration | G&A |
| Gold | Au |
| Induced Polarization | IP |
| Inductively Coupled Plasma Atomic Emission Spectroscopy | ICP-AES |
| Inductively Coupled Plasma | ICP |
| Internal Rate of Return | IRR |
| Inverse Distance Weighted to the Second Power | ID2 |
| Lerchs-Grossman | LG |
| Life-of-mine | LOM |
| Metres North | mN |
| M.I.M. (U.S.A.) Inc. | MIM |
| Molybdenum | Mo |
| National Environmental Policy Act | NEPA |
| National Instrument 43-101 | NI 43-101 |
| Nearest Neighbour | NN |
| Net Present Value | NPV |
| Net Smelter Return | NSR |
| Neutralization Potential | NP |
| Nevada Bureau of Mining Regulation and Reclamation | BMRR |
| Nevada Division of Environmental Protection | NDEP |
| PacMag Metals Limited | PacMag |
| Porcupine Engineering Services | PES |
| Preliminary Assessment | PA |
| Preliminary Economic Assessment | PEA |
| Prefeasibility Study | PFS |
| Qualified Persons | QPs |
| Quality Assurance | QA |
| Quality Control | QC |
| Quantitative Group | QG |
| Reverse circulation | RC |
| Rock Mass Rating | RMR |
| Rock Quality Designation | RQD |
| | |
| 10/03/2017 |
TOC xvi
2017 Updated Preliminary Economic Assessment on the Ann Mason Project
Nevada, U.S.A.
| Selective mining unit | SMU |
| Semi-autogenous Grinding | SAG |
| Silver | Ag |
| Tailings Management Facility | TMF |
| Terrestrial Ecosystem Mapping | TEM |
| U.S. Environmental Protection Agency | EPA |
| Waste Rock Management Facility | WRMF |
| Work Breakdown Structure | WBS |
| X-Ray Fluorescence Spectrometer | XRF |
Note Regarding Non-U.S. GAAP Performance Measurement
"Cash Costs" and all-in sustaining cost (AISC) are non-U.S. GAAP Performance Measurements. These performance measurements are included because these statistics are widely accepted as the standard of reporting cash costs of production in North America. These performance measurements do not have a meaning within U.S. GAAP and, therefore, amounts presented may not be comparable to similar data presented by other mining companies. These performance measurements should not be considered in isolation as a substitute for measures of performance in accordance with U.S. GAAP.
Forward Looking Statements
This Technical Report, including the economics analysis, contains forward-looking statements within the meaning of the United States Private Securities Litigation Reform Act of 1995 and forward-looking information within the meaning of applicable Canadian securities laws. While these forward-looking statements are based on expectations about future events as at the effective date of this Report, the statements are not a guarantee of Entrée Gold Inc.'s or Mason Resources Corp.'s future performance and are subject to risks, uncertainties, assumptions and other factors, which could cause actual results to differ materially from future results expressed or implied by such forward-looking statements. Such risks, uncertainties, factors and assumptions include, amongst others but not limited to metal prices, mineral resources, smelter terms, labour rates, consumable costs and equipment pricing. There can be no assurance that forward-looking statements will prove to be accurate, as actual results and future events could differ materially from those anticipated in such statements.
| | |
| 10/03/2017 |
TOC xvii
2017 Updated Preliminary Economic Assessment on the Ann Mason Project
Nevada, U.S.A.
| 1 | Summary |
This Technical Report was prepared for Entrée Gold Inc. (Entrée or Company) and Entrée's newly incorporated wholly-owned subsidiary, Mason Resources Corp. (Mason Resources) for the Ann Mason Project (Project) in Nevada. On February 28, 2017, Entrée announced that its board of directors had approved a plan of arrangement (Arrangement) pursuant to which all of Entrée's interest in the Project will be transferred to Mason Resources. Shareholders of Entrée will receive common shares in Mason Resources in proportion to their shareholdings in Entrée. Completion of the Arrangement is subject to certain conditions including receipt of all necessary securityholder, court and regulatory approvals.
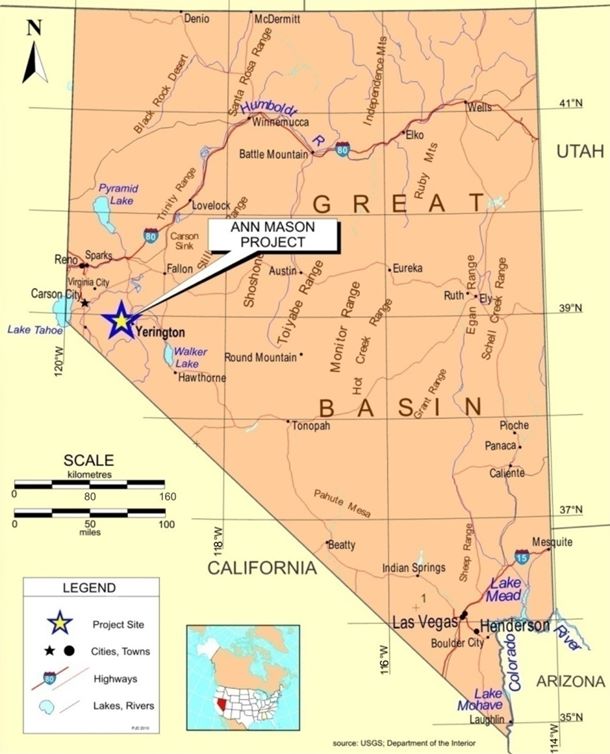
The Project is located in west-central Nevada, approximately 75 km southeast of Reno, 45 km southeast of Carson City (the capital of Nevada), and 7 km west of the town of Yerington (Figure 1‑1). The eastern side of the Project is situated within the Yerington Mining District, a historical copper mining district in Lyon County.
Since 2009, through a merger between Entrée Gold Inc. ("Entrée" or "the Company") and PacMag, option agreements, purchases and ground staking, Entrée has consolidated a group of mineral claims west of the town of Yerington, Nevada, comprising 1,658 unpatented lode mining claims and 33 patented lode mining claims, covering a total area of approximately 12,735 ha. Together these claims now form the Ann Mason Project. In 2014, the Ann South and the Shamrock properties were folded into the Ann Mason Project, following a staking campaign which made most claims contiguous.
The Project hosts two known mineral deposits: Ann Mason and Blue Hill. Both are copper-molybdenum porphyries although Blue Hill is predominantly an oxide copper deposit. Similar to the previously reported preliminary economic assessment (PEA) on the Project (2015 PEA), this 2017 Updated Preliminary Economic Assessment on the Ann Mason Project, Nevada, USA ("2017 PEA") also envisions an open pit and conventional sulphide flotation milling operation with a proposed mill throughput of 120,000 t/d. The proposed location of required infrastructure, mining, and processing facilities for the Project are shown in Figure 1‑2.
The 2017 PEA incorporates the results of the Company's detailed infill drilling program completed during 2014-2015 and subsequent resource estimate, which resulted in approximately 95% of the mineralization constrained within the ultimate PEA pit (Phase 5) being classified as either Measured or Indicated Mineral Resources and the remaining 5% as Inferred Mineral Resources. The 2017 PEA also includes final results of a detailed metallurgical program, designed to better characterize the metallurgical processes and recoveries in the 2017 PEA and to support a future prefeasibility study (PFS).
| |
| 10/03/2017 |
Page 1 - 1
2017 Updated Preliminary Economic Assessment on the Ann Mason Project
Nevada, U.S.A.
| Figure 1‑1: | Ann Mason Project Location Map, Nevada, USA |
| |
| 10/03/2017 |
Page 1 - 2
2017 Updated Preliminary Economic Assessment on the Ann Mason Project
Nevada, U.S.A.
| Figure 1‑2: | Proposed Site Layout |

| |
| 10/03/2017 |
Page 1 - 3
2017 Updated Preliminary Economic Assessment on the Ann Mason Project
Nevada, U.S.A.
The 2017 PEA was completed by AGP Mining Consultants Inc. (AGP), an independent Canadian-based engineering firm and the updated mineral resource estimate was prepared by Amec Foster Wheeler Americas Limited (Amec Foster Wheeler). The mineral resources conform to the Canadian Institute of Mining, Metallurgy and Petroleum (CIM) Definition Standards for Mineral Resources and Mineral Reserves (May 10, 2014) whose definitions are incorporated by reference into National Instrument 43-101 Standards of Disclosure for Mineral Projects (NI 43-101).
The scenario chosen by AGP and Entrée (Base Case) in the 2017 PEA uses base case metal prices to support the economic model, as follows: $3.00/lb Cu, $1,200/oz Au, $11.00/lb Mo and $20.00/oz Ag. Also, the impact of the 0.4% NSR royalty granted to Sandstorm Gold Ltd. in 2013, is reflected in the economic analysis. The pit design incorporates metal price assumptions (Engineering Design Prices) of $2.50/lb Cu, $13.50/lb Mo, $15/oz Ag, and $1,100/oz Au. All costs, unless otherwise noted, are in Q2 2015 United States (US) dollars. The pricing was verified for this update and is considered current for Q1 2017. No material change was noted based on that review. Cost estimates were developed for all disciplines, both in operating and capital requirements. AGP concludes that the Ann Mason Project has the potential to yield a Base Case pre-tax net present value (NPV) (7.5% discount rate) of $1,158 million with an internal rate of return (IRR) of 15.8%. The Base Case post-tax NPV (7.5% discount rate) is estimated to be $770 million with an IRR of 13.7%. The pre-tax payback is anticipated to be 6.4 years, and the post-tax payback to be 6.9 years.
The 2017 PEA is preliminary in nature and includes Inferred Mineral Resources, which are considered too speculative geologically to have economic considerations applied to them that would enable them to be categorized as Mineral Reserves. There is no certainty that the results in this 2017 PEA will be realized. Mineral resources are not mineral reserves and do not have demonstrated economic viability.
AGP recommends that the Ann Mason Project advance to the next levels of engineering and trade-off studies, with infill and exploration drilling, engineering, and environmental field programs required to support the necessary level of engineering for a PFS. Advanced planning of this work is a critical component to its success; therefore, recommendations by discipline are provided to ensure sufficient information is available going forward.
With the current level of information for the Project, AGP does not foresee Mineral Resources, potential economics, or environment issues that would inhibit the Project from advancing to further levels of study.
| 1.1 | Geology |
The Project area comprises two main mineralized deposits: Ann Mason, a copper-molybdenum porphyry hosted by granodiorite and quartz monzonite; and Blue Hill, a copper oxide and sulphide deposit, located approximately 1.5 km northwest of the Ann Mason deposit. Several other under-explored copper oxide and sulphide targets are located throughout the Project area.
| | |
| 10/03/2017 |
Page 1 - 4
2017 Updated Preliminary Economic Assessment on the Ann Mason Project
Nevada, U.S.A.
Since acquiring the Project, Entrée's exploration work has focused on increasing and upgrading the Mineral Resources of the Ann Mason deposit, defining initial Mineral Resources at Blue Hill and identifying and drill testing new copper targets on other areas of the Project. Based on the favourable exploration results at Ann Mason, Entrée has recently shifted the focus towards the completion of the 2017 PEA on the Ann Mason deposit and advancing towards a PFS.
| 1.1.1 | Regional Geology |
Ann Mason is hosted by several phases of the Jurassic-age Yerington batholith, and younger quartz monzonite porphyry dykes (Jqmp-a, Jqmp-b and Jqmp-c). Copper mineralization primarily occurs within a broad zone of main-stage potassic alteration containing chalcopyrite and bornite. An assemblage of chalcopyrite-epidote or chalcopyrite-epidote-quartz mineralization locally overprints main-stage potassic alteration and copper mineralization.
Within the Yerington district, Tertiary volcanic rocks, Mesozoic host rocks and copper-molybdenum porphyry deposits have been rotated 60 degrees to 90 degrees westward by Miocene normal faulting and extension. As a result, mineralized intercepts in vertical drill holes through Ann Mason represent approximately horizontal intervals across the original pre-tilt geometry of the deposit.
| 1.1.2 | Ann Mason Deposit |
The Ann Mason deposit has the characteristics of a typical, large copper-molybdenum porphyry system. Projected to the surface, the 0.15% Cu envelope covers an area approximately 2.8 km northwest and up to 1.3 km northeast. At depth, this envelope extends more than a kilometre below surface. The mineralization remains open in most directions.
Within the 0.15% Cu envelope the highest grades occur within a 200 m to 800 m thick, west-plunging zone that surrounds the intrusive contact between granodiorite (Jgd) and porphyritic quartz monzonite (Jpqm). Within this zone, copper grade is dependent on vein density, sulphide species, frequency and relative age of quartz monzonite porphyry dykes and the mafic content of the granodiorite. Mineralization is closely associated with quartz monzonite porphyry dykes (Jqmp-a, -b and -c). The top of the mineralized envelope is truncated by the Singatse Fault and much of the southwest edge is truncated by the northwest-trending Fault 1A.
Sulphide zoning is that of a typical porphyry copper with an outer pyritic shell, and concentric zones of increasing chalcopyrite and decreasing pyrite progressing inward to a central zone of chalcopyrite-bornite.
| | |
| 10/03/2017 |
Page 1 - 5
2017 Updated Preliminary Economic Assessment on the Ann Mason Project
Nevada, U.S.A.
Within the northeast, southeast, and southwest quadrants of the deposit chalcopyrite and chalcopyrite-bornite are the primary sulphide domains and are the most dominant in terms of overall deposit tonnage. Little or no overlap occurs between pyrite and bornite or between pyrite and molybdenite. In the northwest quadrant the primary sulphide domain is chalcopyrite ≥ pyrite; a domain that forms thick intervals of >0.3% Cu, with only minor bornite present at depth, near the granodiorite-porphyritic quartz monzonite contact.
Chalcopyrite occurs as individual grains in veins and disseminated in rock, as fillings in brecciated pyrite grains, attached to or included in pyrite grains, and attached to or included in bornite. Bornite occurs as separate grains in veins, and disseminated in rock and attached to chalcopyrite. Sparse chalcocite occurs as replacement rims on chalcopyrite, but more commonly as replacement rims or exsolution replacement of bornite.
Molybdenum occurs as molybdenite in quartz and quartz-chalcopyrite veins and on fracture or shear surfaces as molybdenum paint. Within quartz veins, molybdenite occurs as disseminations, centerline segregations and discontinuous selvages. Molybdenum within a 0.005% Mo grade shell occurs largely within the 0.15% Cu grade shell. Where late albite alteration has reduced copper grade, molybdenum mineralization is mobilized into fractures and shear zones and extends to greater depth than copper.
Silver ≥0.6 g/t and gold ≥0.06 g/t are closely associated with the occurrence of bornite within the chalcopyrite-bornite sulphide domain.
Hydrothermal alteration associated with porphyry copper and molybdenum mineralization at Ann Mason is similar to alteration described in many porphyry copper deposits. Voluminous sodic-calcic alteration zones on the flanks of the Yerington district deposits may have been leached of copper and iron, possibly providing those components to mineralizing fluids (Dilles and Proffett, 1995).
Alteration assemblages include an outer propylitic zone (chlorite±epidote±pyrite), widespread potassic alteration (secondary biotite, secondary biotite+K-feldspar or K-feldspar) associated with main-stage copper-molybdenum mineralization, and more restricted late-stage zones of chlorite±epidote±albite, sodic (albite±chlorite), and sericitic alteration. Molybdenum mineralization is not significantly affected by the late sodic alteration, beyond partial remobilization from veins into nearby fractures and shears.
Two prominent structures form structural boundaries to the Ann Mason Mineral Resource. The relatively flat Singatse Fault truncates the upper surface of the 0.15% Cu envelope over a portion of the deposit and juxtaposes sterile Tertiary volcanic rocks on top of the mineralized intrusives. The high-angle, northwest-trending, southwest dipping Fault 1A marks the current southwest margin of >0.15% Cu mineralization in the deposit, juxtaposing propylitically altered rocks with pyrite mineralization in the hanging wall against potassically-altered rocks with copper-molybdenum mineralization in the footwall. Fault 1A and other northwest-trending structures offset the intrusive contact between granodiorite (Jgd) and porphyritic quartz monzonite (Jpqm) to successively deeper levels towards the west and southwest. Copper-molybdenum mineralization in the footwall of the fault remains open at depth along the entire strike length of the fault.
| | |
| 10/03/2017 |
Page 1 - 6
2017 Updated Preliminary Economic Assessment on the Ann Mason Project
Nevada, U.S.A.
| 1.1.3 | Blue Hill Deposit |
The Blue Hill deposit is approximately 1.5 km northwest of Ann Mason and occurs in a very similar geologic environment, but in a separate fault block. Blue Hill is not included in the 2017 PEA.
Two main styles of porphyry mineralization have been identified:
| 1) | near surface, oxide and mixed oxide-sulphide copper mineralization |
| 2) | underlying copper-molybdenum sulphide mineralization. |
Both styles of mineralization are hosted by quartz monzonite with lesser amounts of porphyritic quartz monzonite and quartz monzonite porphyry. The low-angle, southeast dipping Blue Hill Fault strikes northeast through the middle of the target, cutting off a portion of the near-surface oxide mineralization. However, oxide and sulphide mineralization continues below the fault to the southeast.
The oxide zone is exposed on surface and has been traced by drilling as a relatively flat-lying zone covering an area of about 900 m x 450 m, and continuing for several hundred metres further to the west in narrow intervals. Significant copper oxides, encountered in both reverse circulation (RC) and core drill holes extend from surface to an average depth of 124 m. Oxide copper mineralization consists of malachite, chrysocolla, rare azurite, black copper-manganese oxides, copper sulphates, and copper-bearing limonites. Mineralization occurs primarily on fracture surfaces and in oxidized veins or veinlets. A zone of mixed oxide-sulphide mineralization with minor chalcocite is present below the oxide mineralization to depths of up to 185 m. The copper oxide zone remains open to the northwest and southeast.
Oxide copper mineralization at Blue Hill is interpreted to be the result of in-place oxidation of copper sulphides with only minor transport of copper into vugs, fractures, and faults or shear zones. No significant zones of secondary enrichment have been observed.
The copper-mineralized sulphide zone underlies the southern half of the oxide mineralization and continues to depth towards the southeast, below the Blue Hill Fault. Mineralization consists of varying quantities of pyrite, chalcopyrite, and molybdenite. Local, higher-grade sulphide mineralization commonly occurs within zones of sheeted veins containing chalcopyrite, magnetite and secondary biotite. Significant amounts of disseminated molybdenum mineralization have been observed locally, often in contact with dykes. To the northwest, below the oxides only a few holes have tested the sulphide potential; however, in this direction the sulphides appear to be increasingly pyritic with only minor amounts of copper.
| | |
| 10/03/2017 |
Page 1 - 7
2017 Updated Preliminary Economic Assessment on the Ann Mason Project
Nevada, U.S.A.
Alteration assemblages are similar to Ann Mason except that original zoning is difficult to discern in areas of pervasive oxidation. Within zones of sulphide mineralization, propylitic alteration is more widespread and potassic alteration is more restricted to quartz monzonite porphyry dykes and immediately adjacent rocks of the Yerington batholith. Late stage sodic alteration locally reduces copper grades, similar to what has been observed at Ann Mason.
The sulphide mineralization remains open is several directions, most importantly, to the southeast, towards Ann Mason.
| 1.2 | Resource Statement |
| 1.2.1 | Ann Mason |
The mineral resource estimate presented in the 2017 PEA is the same estimate that Amec Foster Wheeler, Vancouver, Canada prepared for the 2015 PEA. The current Mineral Resource estimate is based on approximately 56,268 m of Entrée drilling in 78 holes (including 40 infill drill holes completed in 2014-2015) and approximately 49,000 m of historical drilling in 116 holes. The resource database also includes re-assaying of 6,142 samples from 44 historical Anaconda core holes, to allow molybdenum, gold, and silver values to be estimated. No new drilling or sampling has been completed at Ann Mason since the 2015 PEA. At a base case cut-off of 0.20% Cu, the deposit is estimated to contain the following Mineral Resources (Table 1-1):
| · | Measured; 412 Mt at 0.33% Cu, 0.006% Mo, 0.03 g/t Au and 0.64 g/t Ag |
| · | Indicated; 988 Mt at 0.31% Cu, 0.006% Mo, 0.03 g/t Au and 0.66 g/t Ag |
| · | Inferred; 623 Mt at 0.29% Cu, 0.007% Mo, 0.03 g/t Au and 0.66 g/t Ag. |
Table 1-1: Mineral Resource Statement for the Ann Mason Deposit based on a 0.20% Cu Cut‑off
| Notes: | Effective Date 3 March 2017, Peter Oshust, P.Geo. 1. Mineral Resources are reported within constraining pit shell developed using Whittle™ software. Assumptions include metal prices of $3.74/lb for copper, $13.23/lb for molybdenum, $1,495/oz for gold, and $23.58/oz for silver, process recoveries of 92% for copper, 50% for molybdenum, 50% for gold, and 55% for silver, mining cost of $1.09/t + $0.02/bench below 1605 m, $5.82/t for processing, and $0.30/t for G&A. 2. Assumptions include 100% mining recovery. 3. An external dilution factor was not considered during this Mineral Resource estimation. 4. Internal dilution within a 20 m x 20 m x 15 m SMU was considered. 5. The 0.4% NSR royalty held by Sandstorm Gold Ltd. was not considered during the preparation of the constraining pit. |
| |
| 10/03/2017 |
Page 1 - 8
2017 Updated Preliminary Economic Assessment on the Ann Mason Project
Nevada, U.S.A.
Mineral Resources are not Mineral Reserves and do not have demonstrated economic viability.
The Ann Mason Mineral Resource estimate is based on all scientific and technical information as of 3 March 2017 and therefore has an effective date of 3 March 2017. The mineral resource model and the Mineral Resource estimate have not changed since 9 September 2015, the effective date of the previous Mineral Resource estimate. There has been no additional drilling or other scientific or technical information collected since 9 September 2015 to present. The assumptions used in 2015 to assess reasonable prospects of eventual economic extraction including metal prices, mining, processing and G&A cost metallurgical recoveries and pit slopes remain the same and are still considered reasonable.
Peter Oshust, P.Geo., Principal Geologist of Amec Foster Wheeler prepared the Mineral Resource estimate. Mr. Oshust is a Qualified Person for the purposes of NI 43-101 and is independent of the Company. The Mineral Resource estimate was prepared in accordance with the May 2014 CIM Definition Standards for Mineral Resources and Mineral Reserves. Geological interpretation completed by Company geologists was used as the basis for a three dimensional model created by Amec Foster Wheeler using Leapfrog™ geological modelling software. Three lithological units were modelled as well as three significant faults. Analysis of assay data within the lithological models demonstrated no significant lithological control over the grade distribution. A 0.15% grade shell was used as the primary control for the interpolation of copper.
A block model was constructed in Vulcan™ software with block dimensions of 20 m × 20 m x 15 m high. Copper, gold, silver, and molybdenum grades were interpolated into the blocks by ordinary kriging in three passes. Blocks were classified based on a combination of factors including the number of holes used for each block and the distance to the nearest composites. Validation of the estimated block model revealed no significant global or local grade biases.
Outlier analysis was completed on the copper, molybdenum, gold, and silver composites. Capping thresholds with the 0.15% grade shell are as follows: copper, 0.6%; molybdenum, 0.09%; gold, 0.27 g/t; silver, 4.6 g/t. Outlier restrictions were also applied to copper values outside of the 0.15% grade shell.
To assess reasonable prospects for eventual economic extraction, Amec Foster Wheeler assumed that the Ann Mason deposit would be mined utilizing open pit mining methods and conventional flotation recovery methods. The Whittle™ pit optimiser software was utilized to prepare a conceptual pit design, constrained within property boundaries, with inputs on mining, processing, G&A, transportation and smelting and refining. Preparation of the pit was based on economic and technical assumptions listed below. These assumptions were used in the 2012 PEA and Amec Foster Wheeler is of the opinion they remain reasonable for supporting the 2017 Ann Mason mineral resource estimate:
| | |
| 10/03/2017 |
Page 1 - 9
2017 Updated Preliminary Economic Assessment on the Ann Mason Project
Nevada, U.S.A.
The general parameters of the LG pit are as follows:
| · | metal prices of: $3.74/lb Cu, $13.23/lb Mo, $1,495/oz Au and $23.58/oz Ag |
| · | metallurgical recovery assumptions of 92% for copper, 50% for molybdenum, 50% for gold and 55% for silver |
| · | operating costs of $1.09/t for mining (plus $0.02/bench below 1,605 m); $5.82/t for processing; and $0.30/t for G&A |
| · | smelting, refining and transportation costs per tonne concentrate of $80.00, $0.08 and $88.00, respectively |
| · | pit slopes of 52 degrees in the overlying volcanics and 44 degrees in the porphyry units |
| · | Mineral Resources were tabulated within the pit at a cut-off grade of 0.20% Cu. This is above an operating breakeven cut-off grade (approximately 0.11% copper) that covers mining, process and G&A costs. |
| 1.2.2 | Blue Hill |
The Blue Hill Mineral Resource estimate remains the same as the estimate published in the 2012 and 2015 PEA's. Mineral Resources at Blue Hill were estimated by Michael Waldegger, P.Geo. under the supervision of Pierre Desautels, P.Geo. of AGP. The estimate is based on copper, molybdenum, gold, and silver drill hole sample grades collected from 6 core and 24 RC drill holes completed by Entrée, and also from 20 historical core and RC drill holes completed by Anaconda and PacMag.
A total of 10 holes drilled in 2013 and 2015 were subsequently added to the database. Four of those holes were located in close proximity to the Blue Hill Mineral Resource but were considered not material to the overall Ann Mason Project; therefore, the Blue Hill Mineral Resource estimate was not updated and remains the same as in the 2012 PEA. No new drilling or sampling has been completed at Blue Hill since the 2015 PEA.
The Blue Hill Mineral Resource estimate is based on all scientific and technical information as of 3 March 2017 and therefore has an effective date of 3 March 2017. The mineral resource model and the Mineral Resource estimate have not changed since 31 July, 2012, the effective date of the previous Mineral Resource estimate. The assumptions used in 2012 to assess reasonable prospects of eventual economic extraction including metal prices, mining, processing and G&A cost metallurgical recoveries and pit slopes remain the same and are still considered reasonable.
The key parameters of the estimate are as follows:
| |
| 10/03/2017 |
Page 1 - 10
2017 Updated Preliminary Economic Assessment on the Ann Mason Project
Nevada, U.S.A.
| · | Domains were modelled in 3D to separate oxide, mixed, and primary mineralization from surrounding waste rock. The domains were modelled to a nominal 0.075% Cu cut-off. |
| · | High-grade outliers in the drill hole assay database were capped to 0.75% for copper, 0.03 g/t for gold, and 2 g/t for silver prior to compositing. No capping was applied to molybdenum. |
| · | Drill hole assays were composited to 5 m lengths interrupted by the overall mineralization boundary. |
| · | Block grades for copper, molybdenum, gold, and silver were estimated from the drill hole composites using inverse distance weighted to the second power (ID2) into 40 mx 40 m x 15 m blocks coded by domain. Molybdenum, gold, and silver were estimated for sulphide blocks only. |
| · | Dry bulk density was estimated globally for each domain from drill core samples collected throughout the deposit. The oxide and mixed zones were assigned a density of 2.57 t/m3 and the sulphide zone was assigned 2.62 t/m3. |
| · | All blocks were classified as Inferred Mineral Resources in accordance with CIM definitions. |
Mineral Resources were reported within an LG pit shell, generated by AGP, above a copper cut-off of 0.10% for the oxide and mixed zones and 0.15% for the sulphide zone. AGP believes these cut-offs are still valid for resource reporting.
The general parameters of the LG pit are as follows:
| · | average gross metal values of: |
| - | $3.32/lb Cu for oxide and mixed material |
| - | $3.16/lb Cu, $12.12/lb Mo, $1,057/oz Au, and $13.58/oz Ag for sulphide material |
| · | metallurgical recoveries of: |
| - | 81.7% leachable oxide copper |
| - | 75% for mixed material |
| - | 92% Cu, 50% Mo, 50% Au and 55% Ag for sulphide material |
| · | mining costs: |
| - | oxide and mixed feed material - $1.30/t |
| - | sulphide feed material - $1.13/t |
| - | all waste costs - $1.13/t |
| · | process and general management and administration (G&A) costs of: |
| - | $5.06/t for oxide and mixed material |
| - | $6.22/t for sulphide material |
| · | pit slopes of 40 degrees in both the overlying volcanic and in the mineralized granodiorite. |
| | |
| 10/03/2017 |
Page 1 - 11
2017 Updated Preliminary Economic Assessment on the Ann Mason Project
Nevada, U.S.A.
Table 1-2: Blue Hill Inferred Mineral Resources (effective date March 3, 2017)
| Zone | Cu Cut-off (%) | Tonnes (Mt) | Grade Cu (%) | Contained Cu (Mlb) | Mo (%) | Au (g/t) | Ag (g/t) |
| Oxide Zone | 0.10 | 47.44 | 0.17 | 179.37 | - | - | - |
| Mixed Zone | 0.10 | 24.69 | 0.18 | 98.12 | - | - | - |
| Oxide + Mixed Zones | 0.10 | 72.13 | 0.17 | 277.49 | - | - | - |
| Sulphide Zone | 0.15 | 49.86 | 0.23 | 253.46 | 0.005 | 0.01 | 0.3 |
| Notes: | 1. Mineral resources are classified in accordance with the 2014 CIM Definition Standards for Mineral Resources and Mineral Reserves. 2. Mineral Resources do not include external dilution, nor was the tabulation of contained metal adjusted to reflect metallurgical recoveries. 3. Tonnages are rounded to the nearest 10,000 tonnes, and grades are rounded to two decimal places. 4. Rounding as required by reporting guidelines may result in apparent summation differences between tonnes, grade, and contained metal content. 5. Material quantities and grades are expressed in metric units, and contained metal in imperial units. |
Mineral Resources that are not Mineral Reserves do not have demonstrated economic viability.
| 1.3 | Geotechnical |
Entrée retained BGC Engineering Inc. (BGC) in association with AGP to undertake a geotechnical review of the proposed Ann Mason open pit. To accomplish this, BGC completed a site visit in February/March 2012. During the site visit, rock mass characterization was completed by reviewing available core, by visiting the Yerington pit, located on an adjacent property owned by Quaterra Resources Inc. (Quaterra), and by examining the Ann Mason site with Entrée personnel.
The drill core that was reviewed from the Ann Mason deposit was primarily located in the area of mineralization; no drill core was available in the area of the proposed pit slopes. In addition, much of the drill core reviewed had been cut and sampled for assays. Drill core was HQ diameter and recovered with the "double tube" method, typical of exploration geology drilling. This method is adequate for geology logging and assay; however, the core can be disturbed and broken by the drilling process. As such, rock quality designations (RQD) logged by Entrée as part of their basic data collection may under-represent the in-situ quality of rock mass due to this disturbance. BGC supplemented Entrée's data with observations of rock strength, fracture spacing, longest stick, and joint conditions for the sections of core reviewed.
Geotechnical data relevant to the open pit slopes is limited at this stage of study, typical of most mine development projects at the PEA stage. Entrée's work on the geology of the site appears to be of good quality and their development of a fault model at this stage of study is commendable. The major data limitation identified in the review is a lack of geotechnical drilling information outside of the mineralized zone or proposed wall slopes. Geotechnical data in the area of the proposed pit slopes will be needed for future geotechnical evaluations.
| | |
| 10/03/2017 |
Page 1 - 12
2017 Updated Preliminary Economic Assessment on the Ann Mason Project
Nevada, U.S.A.
The rock mass of the Ann Mason deposit was divided into three main geotechnical units:
| 1) | Tertiary volcanics (Domain I) |
| 2) | Granodiorite of the Yerington batholith (Domain II) |
| 3) | Quartz monzonite porphyry of the Yerington batholith (Domain II). |
The overlying volcanics have limited the weathering of the underlying granodiorites and monzonites.
Bedding is the main geological structure observed in the volcanic rocks of the Ann Mason deposit. The bedding dips on average at 62 degrees to the west. This west dip of the bedding is a result of the regional tilting due to the rotation of normal faulting. The main faults of the Ann Mason deposit are the Singatse Fault, the Montana Yerington Fault (1.5 km east of pit), and several possible southeast-striking normal faults.
Pit slope configurations were provided to AGP by BGC for pit design work. This included overall slope angle, inter-ramp angle by domain, bench height, safety bench spacing, and width and bench face angles. The maximum inter-ramp height is limited at this stage of study to 150 m in the Ann Mason deposit. Each 150 m, an extra width "geotechnical berm" is to be applied which has a width of 32 m.
The pit slope design indicated the following:
| · | Volcanics (Domain I) |
| - | inter-ramp angle = 52 degrees |
| - | bench face angle = 67 degrees |
| - | height between safety benches = 30 m (double benched) |
| - | width of safety bench = 11 m |
| · | Porphyry (Domain II) |
| - | inter-ramp angle = 39 degrees |
| - | bench face angle = 63 degrees |
| - | height between safety benches = 15 m (single benched) |
| - | width of safety bench = 11 m. |
These have been incorporated in the current design.
BGC recommends the following:
| | |
| 10/03/2017 |
Page 1 - 13
2017 Updated Preliminary Economic Assessment on the Ann Mason Project
Nevada, U.S.A.
| · | Future geotechnical studies should focus on geotechnical specific drill holes targeting the proposed wall rocks of the pit. A minimum of four inclined holes should be completed each of which may be up to 800 m long. All holes should be "triple tube" coring system holes with splits in the core tube. HQ3 diameter core is preferred. |
| · | Due to poorer rock mass quality throughout the deposit, all geotechnical holes should be surveyed with a borehole televiewer system. |
| · | The hydrogeological system needs to be investigated going forward in the next study. Geotechnical mapping needs to be completed as well. |
| · | Future geologic models should include interpretations of the main rock types, alteration zones, depth of weathered zones and major geological structures. |
| 1.4 | Mining |
Ann Mason is envisioned as a large-scale conventional open pit mine, involving the development of a single pit with five pit phases. The mine life consists of a three-year pre-production period, followed by a 21-year production life, feeding the mill at a rate of 120,000 t/d. An increased mill throughput of 120,000 t/d (versus the 2012 PEA's 100,000 t/d) allows better utilization of the lower grade mill feed resulting in a more logical mining sequence and better mine fleet capital utilization.
Mining will use conventional rotary drilling, blasting, and loading with large 56 m3 cable shovels and 360-tonne trucks working on 15 m benches.
The total mill throughput in the 2017 PEA mine plan is estimated to be 835 Mt at 0.30% Cu, 0.005% Mo, 0.03 g/t Au and 0.59 g/t Ag of Measured and Indicated material, and 42 Mt at 0.27% Cu, 0.005% Mo, 0.03 g/t Au and 0.58 g/t Ag of Inferred material. To capture the value of the multi metals, a net value per tonne was estimated for each block for Lerchs- Grossman (LG) shell generation and cut-off application. The net value per tonne incorporates grade and recovery data for the four payable metals (copper, molybdenum, gold, and silver), smelter terms and downstream costs. The net value cut-off used for mine planning approximates a 0.145% Cu-only cut-off.
The mine plan targeted a 20 to 25 year mine life and as such represents a near surface, relatively low strip ratio, subset of the updated mineral resources. Some material previously categorized as waste has now been upgraded to mill feed, as a result of the recent drilling and the new resource model. The life-of-mine (LOM) waste to mill feed strip ratio is now 2.01:1 (including pre-strip) compared to 2.16:1 in the 2012 PEA. Pit slopes are variable depending on the geotechnical parameters of the rock types and range from 50 degrees in the overlying volcanic rocks, to 37 degrees in rocks that host the porphyry mineralization.
The high ratio of Measured plus Indicated to Inferred material in the mine plan emphasizes the high confidence of the resource base used in the 2017 PEA mine plan and demonstrates the limited amount of additional drilling required prior to proceeding to a Pre-Feasibility level. The relative quantities of each classification by pit phase are shown in Table 1-3.
| | |
| 10/03/2017 |
Page 1 - 14
2017 Updated Preliminary Economic Assessment on the Ann Mason Project
Nevada, U.S.A.
Table 1-3: DCF Tonnes and Grade by Phase and Category
| Phase | Measured (%) | Indicated (%) | Inferred (%) |
| 1 | 94.9 | 4.9 | 0.2 |
| 2 | 73.4 | 24.0 | 2.6 |
| 3 | 40.5 | 52.7 | 6.8 |
| 4 | 40.6 | 55.9 | 3.5 |
| 5 | 23.9 | 66.7 | 9.4 |
| Total | 43.9 | 51.3 | 4.9 |
Operating costs for the open pit are expected to average $1.50/t total material over the LOM or $4.13/t of mill feed. At the peak of material movement in Years 1 to 7, the major equipment fleet is expected to consist of seven 311 mm drills, two 41 m3 front-end loaders, four 58 m3 electric cable shovels and forty 360-tonne trucks. A typical fleet of support equipment (track dozers, rubber tired dozers, graders) are utilized to assist development and maintenance of the mining operation.
Pre-stripping operations will begin in Year -3 and by Year 1, 9.6 Mt of mill feed will have been stockpiled in preparation for the mill start up. This stockpile will be rehandled to the mill in Year 1. For year 1, a plant capacity of 88,000 t/d or 32 Mt/a was used to allow for ramp up. Subsequent years will be at the nominal capacity of 120,000 t/d or 43 Mt/a.
Waste material will be placed to the southwest of the Ann Mason pit in a waste rock management facility (WRMF). For this study, waste materials have been assumed to be non-acid generating based upon a review of sulphur present in the deposit. This assumption will need to be confirmed in subsequent levels of study beyond this 2017 PEA. Waste material mined during the pre-stripping phase will also be directed to two of the tailings dams to reduce quarrying costs during construction.
Reclamation of the WRMF will be concurrent with mining. The final height of this facility will be at elevation 1680 for an overall maximum height of 210 m.
| 1.5 | Metallurgy and Process |
| 1.5.1 | Ann Mason |
Metallurgical testwork conducted in 2011 at Metcon Research and more detailed studies conducted in 2015 at SGS Canada (SGS) have indicated that the Ann Mason mineralized material is amenable to concentration by conventional grinding and froth flotation.
| | |
| 10/03/2017 |
Page 1 - 15
2017 Updated Preliminary Economic Assessment on the Ann Mason Project
Nevada, U.S.A.
The SGS program scope included a comprehensive grindability study, including JK drop-weight testing, which will provide input parameters for process modelling of the SAG/ball mill circuit. Downstream flowsheet optimization consists of locked cycle flotation testing, a liquid/solid separation study for tailings and concentrate, and final product characterisation.
Results from the SGS locked cycle tests completed to date on the domain composites show very similar metal recoveries as those used in the 2012 PEA; however, the 2015 flotation testwork has shown that a coarser grind size (P80 155 µm) than previously used in the 2012 PEA (P80 120 µm) can be used with a minor impact on average copper recovery. This has significantly improved the process operating costs by lowering power requirements, as well as decreasing the consumption of grinding media and liners in the ball mill. Further reduction in operating costs has also been achieved through simplification of the reagent scheme.
In addition, grindability work has confirmed that the feed material is of moderate hardness, with average Bond Rod Work Index and Bond Ball Work Index values of 15.6 kWh/t and 15.5 kWh/t, respectively.
Locked cycle flotation testing has demonstrated that a simple flotation flow sheet with moderate grinds, three stages of cleaning, and low reagent additions is able to generate a saleable copper concentrate, with no penalty elements identified.
The proposed flowsheet for the processing plant consists of a conventional SAG/Ball milling circuit to generate a flotation feed product P80 of approximately 155 µm. The flotation circuit would produce separate copper and molybdenum concentrate products for dewatering and shipment to third party smelters. LOM average mill feed would consist primarily of material from the chalcopyrite (46%) and bornite (41%) domains, with a lesser amount from the pyrite zone (13%). Table 1-4 presents a summary of the metallurgical projection for the Ann Mason deposit. Grades and recoveries are based on the results of the locked-cycle flotation tests from the 2011 Metcon and 2015 SGS testwork programs.
Table 1-4: Projected Grades and Recoveries for the Copper and Molybdenum Concentrates.
Product | Grade | Recovery (%) | ||||||
Cu % | Mo % | Au g/t | Ag g/t | Cu | Mo | Au | Ag | |
Copper Concentrate | 30.0 | 0.1 | 1.65 | 36.0 | 92.0 | 17.1 | 57.0 | 55.0 |
Molybdenum Concentrate | 2.5 | 50.0 | 0.6 | 15.0 | 0.1 | 50.0 | 0.2 | 0.2 |
At present, molybdenum recovery is estimated at 50% to a separate concentrate product. An accurate estimate of molybdenum recovery at the lab scale has been hampered by the very low head grade of the feed. Both the 2012 and 2015 test programs have been successful at demonstrating the potential for a separate concentrate, but have not been able to confirm the final grade and recovery numbers.
| Page | |
| 10/03/2017 |
Page 1 - 16
2017 Updated Preliminary Economic Assessment on the Ann Mason Project
Nevada, U.S.A.
Based on the results of the testwork, a PEA-level plant design was completed to process the Ann Mason sulphide material at a nominal rate of 120,000 t/d. The design combines industry standard unit process operations consisting of primary crushing, SAG milling, closed circuit ball milling, copper-molybdenum bulk rougher flotation, concentrate regrinding, copper-molybdenum cleaner flotation, copper-molybdenum separation flotation, and product and tailings dewatering.
| 1.5.2 | Blue Hill |
Preliminary column leaching tests were carried out on oxide and mixed oxide-sulphide composites from the Blue Hill deposit in 2012. Results indicated that good copper extractions, averaging 84.8%, were achievable after 91 days of acid leaching at a moderate crush size P80 of ¾". Acid consumption for the column tests averaged 11.95 kg/kg Cu, or 18.04 kg/t.
Additional column leach testing of the Blue Hill oxide zone is recommended.
| 1.6 | Infrastructure and Site Layout |
The mill is to be constructed to the northeast of the open pit and consists of a process plant and the supporting infrastructure for mining operations. A mining equipment shop, as well as mine dry, offices, and warehouse, are also included in the site complex. Access to the site will be via an upgraded access road to the northeast of the Project.
The anticipated power demand will be 105 MW during peak production. Power will come from the existing NV Energy 120 kV transmission line in service just east of the town of Yerington. A tap from this line will be constructed along with 10 km of new 120 kV line to service the site. The line will feed two main substation transformers.
The proposed tailings management facility (TMF) is illustrated in Figure 1‑2. This arrangement provided the lowest height for the tailings dams and added security by keying the tailings dams into rock contacts for increased stability. Further study on this layout is required in later levels of study.
The principal objective of the TMF is to provide secure containment of all the tailings solids generated by the milling process. The facility must accommodate 685.5 Mm3 of tailings.
The tailings dam design for this study considers four separate structures. Three of these will be constructed entirely of rock fill with the fourth a combination of rockfill and cyclone tailings. The South Dam will be the dam with the combination of materials. The volume in the South Dam is estimated at 94.6 Mm3 of which 21.8 Mm3 will be rock. This dam is active the entire mine life.
| Page | |
| 10/03/2017 |
Page 1 - 17
2017 Updated Preliminary Economic Assessment on the Ann Mason Project
Nevada, U.S.A.
The tailings slurry will be pumped via a 5 km pipeline from the plant to the south tailings dam. Tailings will be distributed to a series of cyclones on the dam crest and used to construct the dam further. Process water will be reclaimed from the TMF pond and returned to the plant via a dedicated reclaim water pumpset and pipeline.
The design height of the South Dam is the 1,650 m level, which results in a maximum height of 125 m. End of mine life freeboard has been designed at 5 m.
The TMF pond plays a key role in the site water management by providing buffering of process water, direct precipitation, and runoff.
Surface diversion ditches along the western edge of the TMF have been included to capture and divert water away from the TMF without contact and released back into the environment. Seepage collection ponds and pumping systems are considered in the costing for each of the dams. This seepage will be returned to the process plant via the reclaim water system or returned to the TMF.
The effect of evaporation and a final water balance have not been completed for this study, but will be required in the next levels of study as the Project advances.
The plant site drainage will be collected in a settling pond with disposal to the process water pond. Wash bay drainage will be directed to an adjacent settling pond and pumped to the TMF. Mine water collection will be pumped to a small settling pond near the primary crusher. The water will be used for dust control on the road surfaces. Excess water will be sent to the TMF. Surface drainage will be diverted away from the mine where possible to ensure contact with active mining areas does not occur. If contact does occur, it will be directed to the mine-settling pond.
| 1.7 | Capital and Operating Costs |
| 1.7.1 | Capital Costs |
Figure 1‑4 shows a summary of the capital costs for the Ann Mason Project.
The pre-production capital cost estimate includes the open pit mine capital expenditures, capitalized pre-production stripping, a 120,000 t/d processing plant, infrastructure (including a tailings facility, power improvements, water and roads), environmental costs, owner's and indirect costs and contingency. The open pit mine equipment is assumed leased; therefore, only the down-payment portion and lease payments during pre-stripping activities are considered in the mine capital costs.
Sustaining capital cost includes the down payment portion of LOM mine equipment replacement, tailings expansions, infrastructure upgrades and reclamation costs.
| |
| 10/03/2017 |
Page 1 - 18
Development capital costs show a slight increase (5.5%) over the 2012 PEA capital ($1,351 million versus $1,283 million). This is attributed to the increase from 100,000 t/d to 120,000 t/d throughput, but offset by leasing of key mine equipment. Capital costs over the life of mine have now been reduced by 16.8%, compared to the 2012 PEA ($1,542 million versus $1,845 million). This again is primarily attributed to leasing of the mine equipment.
Initial capital and sustaining capital costs summarized below in Table 1-5, were estimated using Q2 2015 data and pricing. The pricing was verified for this update and is considered current for Q1 2017. No material change was noted based on that review.
Table 1-5: Summary of Ann Mason 2017 PEA Capital Cost Estimates
| Category | Pre-Production and Year 1 Capital ($M) | Sustaining Capital (Years 2-21) ($M) | Total Capital ($M) |
| Open Pit | 450.6 | 88.7 | 539.3 |
| Processing | 452.2 | 4.5 | 456.7 |
| Infrastructure | 180.7 | 24.5 | 205.1 |
| Environmental | 2.1 | 68.5 | 70.6 |
| Owner's and Indirect Costs | 162.7 | 1.6 | 164.3 |
| Contingency | 102.8 | 3.2 | 106.0 |
| Total | 1,351.0 | 191.0 | 1,542.0 |
| Note: | Total reported values in table are rounded. |
| 1.7.2 | Operating Costs |
Operating costs were developed for a 120,000 t/d mining and milling operation with a 21‑year milling life. The pre-strip requirements add an additional three years prior to milling commencement.
Total Years 1 to 21 operating costs for the Project are estimated to be $9.92/t of mill feed on a pre-tax basis (post-tax $11.34/t). Mining costs were estimated as $1.50/t mined, inclusive of equipment lease payments. LOM copper pre-tax cash costs are $1.72/lb on a copper only basis (post-tax $1.96/lb), or $1.49/lb net of by-product (molybdenum, gold and silver) credits (post-tax $1.74/lb). LOM AISC are $1.79/lb on a copper only basis (post-tax $2.04/lb), or $1.57/lb net of by-product (molybdenum, gold and silver) credits (post-tax $1.81/lb). Table 1-6 shows a breakdown of the operating cost categories for Years 1 to 21 on an average cost per tonne of mill feed basis.
All prices in the2017 PEA study are quoted in Q2 2015 United State dollars unless otherwise noted. These prices were reviewed and found to be very similar and continue to form the basis of the analysis. No material change was noted. Diesel fuel pricing is estimated at $0.80/L using a $75/barrel reference price. This estimate was derived from a price quotation for off-road diesel fuel delivered to site with applicable taxes considered. The price for electrical power was set at $0.064/kWh, based on current Nevada industrial pricing.
| | |
| 10/03/2017 |
Page 1 - 19
G&A costs are based on an average of 53 people; 16 staff and 37 hourly. Additional charges, such as public relations, recruitment, logistics, and busing, are also included in the G&A costs. Mine employees will be located in the immediate area, and no camp will be provided or required.
Concentrate transportation costs are estimated using values from logistics firms. Delivery of the concentrate will be by bulk trailers and hauled either to the port of Stockton, California, or by truck/rail to Coos Bay, Oregon, or Vancouver, Washington, for delivery to customers overseas. The molybdenum concentrate will be stored in tote bags and delivered to locations in the United States, either Arizona or Pennsylvania.
Port costs consider the handling of the bulk material, assaying, and cost of the referee on the concentrate grade.
Shipping to smelter cost is based on current seaborne rates for delivery to various smelters in the Pacific Rim for the copper concentrate.
A summary of all the operating cost categories on a cost per tonne mill feed basis over the total mill feed tonnage is shown in Table 1-6. Costs associated with those items directly attributable to the concentrate are reported in cost per tonne of concentrate.
| Table | 1-6: Summary of Ann Mason Operating Costs Year 1 – 21 |
Category | Mined ($/t) | Mill Feed ($/t) | Cu Concentrate ($/t) |
| Mining (mill feed and waste) | 1.50 | 4.13 | 455 |
| Processing | - | 4.59 | 506 |
| G&A | - | 0.26 | 29 |
| Subtotal On-Site Costs | - | 8.98 | 990 |
| Transportation, Port Costs, Shipping | - | 0.87 | 96 |
| Royalties | - | 0.07 | 7 |
| Total Pre-Tax Operating Cost | - | 9.92 | 1,093 |
| Taxes | - | 1.42 | 157 |
| Total Post-Tax Operating Cost | - | 11.34 | 1,250 |
| 1.8 | Economic Analysis |
The 2017 PEA is preliminary in nature and it includes Inferred Mineral Resources that are considered too speculative geologically to have the economic considerations applied to them that would enable them to be categorized as Mineral Reserves. There is no certainty that the 2017 PEA will be realized. Mineral Resources that are not Mineral Reserves do not have demonstrated economic viability.
| |
| 10/03/2017 |
Page 1 - 20
The analysis is based on a LOM plan for 21 years at a processing rate of 120,000 t/d. An increased mill throughput of 120,000 t/d (versus the 2012 PEA's 100,000 t/d) allows better utilization of the lower grade mill feed resulting in a more logical mining sequence and better mine fleet capital utilization. The capital increase to support the larger throughput is approximately 5% higher than that reported in the 2012 PEA, offset by a 12.5% increase in average annual copper production, a nearly 10% increase in average annual post-tax free cash flow and a 12% increase in Project NPV. New metallurgical process parameters resulted in significant savings in processing operating costs-per-tonne ($5.13/t in the 2012 PEA versus $4.59/t in the 2017 PEA).
All prices are quoted in Q2 2015 US dollars unless otherwise noted. These prices were verified with the vendors and considered valid for Q1 2017 due to their similarity. No material change was noted.
The tonnes and grades from the five-phase design for the open pit phases were used in the discounted cash flow (DCF) analysis. The breakdown of Measured, Indicated, and Inferred material utilized in the analysis is shown in Table 1-3 to highlight the percentage of material currently in the Measured and Indicated category. A total of 95.1% of the material in the DCF is currently in the Measured and Indicated category. Two additional phases were designed, complete with access, but while still economic, did not benefit the NPV of the overall Project at current metal prices. These demonstrate upside potential for the mine.
| Table | 1-7: Metal Prices by Scenario |
Metal | Unit | Low Case | Base Case | High Case |
Copper | $/lb | 2.75 | 3.00 | 3.25 |
Molybdenum | $/lb | 9.00 | 11.00 | 13.00 |
Silver | $/oz | 15.00 | 20.00 | 25.00 |
Gold | $/oz | 1,100.00 | 1,200.00 | 1,300.00 |
The Base Case is the scenario chosen by AGP and Entrée, with the other scenarios used for price sensitivities. The pre-tax results for the Base Case indicate the potential for a NPV at a 7.5% discount rate of $1,158 million with an IRR of 15.8%. The payback period is 6.4 years, with payback occurring in the seventh year of production (Table 1-8). The post-tax results for the Base Case indicate the potential for a NPV at a 7.5% discount rate of $770 million with an IRR of 13.7%. The payback period is 6.9 years, with payback occurring in the seventh year of production (Table 1-8).
| |
| 10/03/2017 |
Page 1 - 21
2017 Updated Preliminary Economic Assessment on the Ann Mason Project
Nevada, U.S.A.
Table 1-8: Discounted Cash Flow Results
| Cost Category | Unit | Low Case | Base Case | High Case |
| Operating Costs | ||||
| Open Pit Mining | ($M) | 3,625.0 | 3,625.0 | 3,625.0 |
| Processing | ($M) | 4,027.3 | 4,027.3 | 4,027.3 |
| G&A | ($M) | 254.8 | 254.8 | 254.8 |
| Concentrate Trucking | ($M) | 521.8 | 521.8 | 521.8 |
| Port Costs | ($M) | 43.3 | 43.3 | 43.3 |
| Shipping to Smelter | ($M) | 199.0 | 199.0 | 199.0 |
| Subtotal Operating Costs | ($M) | 8,671.2 | 8,671.2 | 8,671.2 |
| Capital Costs | ||||
| Open Pit Mining | ($M) | 539.3 | 539.3 | 539.3 |
| Processing | ($M) | 456.7 | 456.7 | 456.7 |
| Infrastructure | ($M) | 205.1 | 205.1 | 205.1 |
| Environmental Costs | ($M) | 70.6 | 70.6 | 70.6 |
| Indirect | ($M) | 164.3 | 164.3 | 164.3 |
| Contingency | ($M) | 106.0 | 106.0 | 106.0 |
| Subtotal Capital Costs | ($M) | 1,542.0 | 1,542.0 | 1,542.0 |
| Revenue (after smelting, refining, roasting, payables) | ($M) | 13,840.2 | 15,285.5 | 16,730.7 |
| Royalties (0.4%) | ($M) | 52.3 | 58.1 | 63.9 |
| Net Revenue( less Royalties) | ($M) | 13,787.9 | 15,227.4 | 16,666.9 |
| Pre-Tax Net Cash Flow (Revenue-Operating-Capital) | ($M) | 3,574.7 | 5,014.2 | 6,453.7 |
| Total Tax | ($M) | 844.8 | 1,241.4 | 1,659.1 |
| Post-Tax Net Cash Flow | ($M) | 2,730.0 | 3,772.8 | 4,794.6 |
| Net Present Value (Pre-Tax) | ||||
| NPV @ 5% | ($M) | 1,184 | 1,937 | 2,690 |
| NPV @ 7.5% | ($M) | 591 | 1,158 | 1,724 |
| NPV @ 10% | ($M) | 205 | 641 | 1,078 |
| IRR | (%) | 11.9 | 15.8 | 19.4 |
| Payback Period | Years (Year paid) | 8.3 (Yr 9) | 6.4 (Yr 7) | 5.2 (Yr 6) |
| Net Present Value (Post-Tax) | ||||
| NPV @ 5% | ($M) | 815 | 1,379 | 1,928 |
| NPV @ 7.5% | ($M) | 339 | 770 | 1,189 |
| NPV @ 10% | ($M) | 30 | 366 | 694 |
| IRR | (%) | 10.3 | 13.7 | 16.8 |
| Payback Period | Years (Year paid) | 8.7 (Yr 9) | 6.9 (Yr 7) | 5.7 (Yr 6) |
Potential revenue from the various metal streams with the Base Case pricing had copper as the dominant value from the deposit at $14.2 billion or 92.6% of the total revenue. This is followed by gold at $509 million for 3.3% of the revenue, molybdenum at $453 million for 3.0% of the revenue, and silver at $168 million (1.1%).
The metal terms considered copper smelting to cost $80/dmt and refining to cost $0.080/lb for an average concentrate grade of 30%. The molybdenum roasting fees would be $1.15/lb with 99% payable. Silver and gold would both be payable at 97% with refining charges of $1.00/oz Ag and $10.00 /oz Au. Table 1-9 shows other key production statistics developed as part of the analysis.
Page 1 - 22
Table 1-9: Ann Mason Key Metal Production Statistics and Cash Costs
Cost Category | Unit | Value | |
Mill Feed | |||
Rate | t/d | 120,000 | |
Grade | Cu% | 0.30 | |
Total Operating Cost | ($/t mill feed) | 9.92 | |
Mine Life | (years) | 21 | |
Initial Capital Costs (Year -3, Year -2, Year -1) | ($M) | 1,177.7 | |
Year 1 Capital Costs | ($M) | 173.4 | |
Sustaining Capital Cost | ($M) | 191.0 | |
Total Mine Capital | ($M) | 1,542.0 | |
Payable Copper | |||
Initial 5 Years Average Annual Production | (Mlb) | 229 | |
Average Annual Production – LOM | (Mlb) | 241 | |
Total LOM Production | (Mlb) | 5,065 | |
Payable Molybdenum | |||
Initial 5 Years Average Annual Production | (Mlb) | 2.2 | |
Average Annual Production – LOM | (Mlb) | 2.2 | |
Total LOM Production | (Mlb) | 46.0 | |
Recovered Precious Metals | Gold | Silver | |
Initial 5 years Average Annual Production | (oz) | 13,500 | 302,200 |
Average Annual Production - LOM | (oz) | 21,000 | 434,400 |
Total LOM Production | (oz) | 441,300 | 9,122,800 |
Copper Concentrate | |||
Initial 5 Years Average Annual Production | (dmt) | 360,000 | |
Average Annual Production – LOM | (dmt) | 379,100 | |
Total LOM Production | (dmt) | 7,961,600 | |
Molybdenum Concentrate | |||
Initial 5 Years Average Annual Production | (dmt) | 1,900 | |
Average Annual Production – LOM | (dmt) | 1,800 | |
Total LOM Production | (dmt) | 38,400 | |
Cash Costs – Year 1 to Year 5 | Pre-tax | Post-tax | |
Copper Cash Cost without Credits (Mo, Au, Ag) | ($/lb) | 2.08 | 2.13 |
Copper Cash Cost with Credits (Mo, Au, Ag) | ($/lb) | 1.89 | 1.94 |
All In Sustaining Cost (AISC) without Credits (Mo, Au, Ag) | ($/lb) | 2.28 | 2.32 |
All In Sustaining Cost (AISC) with Credits (Mo, Au, Ag) | ($/lb) | 2.09 | 2.13 |
Cash Costs – Year 1 to Year 21 | Pre-tax | Post-tax | |
Copper Cash Cost without Credits (Mo, Au, Ag) | ($/lb) | 1.72 | 1.96 |
Copper Cash Cost with Credits (Mo, Au, Ag) | ($/lb) | 1.49 | 1.74 |
All In Sustaining Cost (AISC) without Credits (Mo, Au, Ag) | ($/lb) | 1.78 | 2.03 |
All In Sustaining Cost (AISC) with Credits (Mo, Au, Ag) | ($/lb) | 1.56 | 1.81 |
Cash Costs – LOM | Pre-tax | Post-tax | |
Copper Cash Cost without Credits (Mo, Au, Ag) | ($/lb) | 1.72 | 1.96 |
Copper Cash Cost with Credits (Mo, Au, Ag) | ($/lb) | 1.49 | 1.74 |
All In Sustaining Cost (AISC) without Credits (Mo, Au, Ag) | ($/lb) | 1.79 | 2.04 |
All In Sustaining Cost (AISC) with Credits (Mo, Au, Ag) | ($/lb) | 1.57 | 1.81 |
Net Annual Cash Flow | Pre-tax | Post-tax | |
Year 1 to Year 5 | ($M) | 161.6 | 151.3 |
Year 1 to Year 21 | ($M) | 297.9 | 238.4 |
LOM | ($M) | 200.6 | 150.9 |
| | |
| 10/03/2017 |
Page 1 - 23
2017 Updated Preliminary Economic Assessment on the Ann Mason Project
Nevada, U.S.A.
Sensitivity to various inputs was examined on the Base Case. The items varied were recovery, metal prices, capital cost, and operating cost. The results of that analysis are shown in Figure 22‑1 and Figure 22‑2.
Figure 1‑3: Spider Graph of Sensitivity of NPV at 7.5% (Post-Tax)
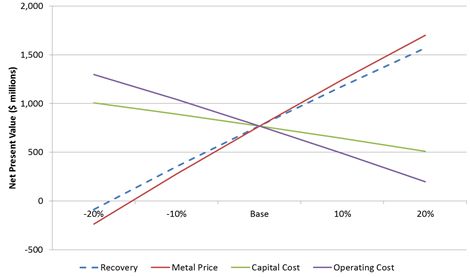
The greatest sensitivity in the Project is metal prices. The Base Case prices that are used consider a price of copper at $3.00/lb. A 10% reduction in metal price to $2.70 brings the NPV of the Project to $279 million. A 10% increase in the copper price to $3.30 yields an NPV of $1,245 million. The -20% sensitivity on metal prices is roughly equivalent to a copper price of $2.40.
The second most sensitive parameter is recovery. To calculate the sensitivity to recovery, a percentage factor was applied to each metal recovery in the same proportion. Therefore, while sensitivity exists, actual practice may show less fluctuation than is considered in this analysis. Recovery testwork has not indicated recoveries in the range of 74% which the -20% change in recovery would represent. As copper represents 92.2% of the revenue, this large a swing in recovery has the obvious effect of influencing the Project, but may not be realistic.
The operating cost is the next most sensitive item. With the mine being a bulk mining operation, focus on this cost is instrumental to maintaining attractive Project economics. Any opportunity to shorten waste hauls would have a positive impact on the Project economics.
The least most sensitive item is capital cost. While changes in the cost have an effect, in comparison to the other three parameters, its effect is more muted. If the capital costs go up by 20%, the post-tax NPV change from the Base Case drops to $508 million from $770 million.
A 0.4% NSR royalty is applicable for the Project, and included in the 2017 PEA.
Page 1 - 24
2017 Updated Preliminary Economic Assessment on the Ann Mason Project
Nevada, U.S.A.
| 1.9 | Environmental |
Over the past several years, Entrée has continually focussed on advancing environmental studies and permitting for Ann Mason. Baseline environmental studies, including Biology (vegetation and wildlife), Cultural Resources, and Waters of the United States & Wetland Delineation, have been completed on approximately 4,063 ha (10,040 acres) of the Project area. Reports on the survey results have been submitted to the Bureau of Land Management (BLM) and the US Army Corps of Engineers for review. On April 1, 2016, the Company received an approved Waters of the US/Wetlands ("WOUS/Wetlands") jurisdictional determination from the Regulatory Division of the U.S. Army Corps of Engineers ("USACE"). According to USACE, the water drainages on the Ann Mason Project are considered "isolated waters with no apparent interstate or foreign commerce connection" and as a result, no permit under Section 404 of the Clean Water Act is required for Ann Mason. No significant obstacles to the development of Ann Mason were identified in any of other the baseline environmental studies completed to date.
Permits required for the development of Ann Mason include an approved Mining Plan of Operations from the BLM, Water Pollution Control and Reclamation Permits from the Nevada Bureau of Mining Regulation and Reclamation, an Air Quality Permit from the Nevada Bureau of Air Pollution Control and Conditional Use/Special Use Permits from Lyon and Douglas Counties.
| | |
| 10/03/2017 |
Page 1 - 25
2017 Updated Preliminary Economic Assessment on the Ann Mason Project
Nevada, U.S.A.
Results of the baseline environmental studies will form part of an Environmental Impact Study (EIS) of the Project, as required by the National Environmental Policy Act (NEPA). Once Entrée completes a PFS of the Ann Mason Project and submits its Mining Plan of Operations to the BLM for approval, an EIS will be required as part of the approval process. The BLM will be the lead agency under NEPA rules, and will only issue a final EIS after considering comments from the public and other agencies including the U.S. Environmental Protection Agency.
| 1.10 | Proposed Budget |
| 1.10.1 | Summary |
The project development options are sufficiently understood and the project shows positive economics to support a decision to proceed to a PFS. As part of the preparation for a PFS, a two-stage, drill program is recommended to bring the Mineral Resources within the current Phase 5 pit to a minimum Indicated Mineral Resource category and to complete a program of wide-spaced, drilling within the pit, but outside of the current 0.15% copper grade shell.
A second program of exploration drilling is also recommended to test several of thekey target areas within the Property boundaries.. The recommendations and associated budgets for this work are described in the sections below. The overall budget to complete the recommended work is summarized as follows:
| · | Stage 1 and 2 In-Pit Drilling $2.32 million |
| · | Regional Exploration Drilling $2.07 million |
Blue Hill and the peripheral oxide targets remain as very strong priorities for Entrée that will see a portion of the regional exploration drilling. Although not included in the 2017 PEA, results of future work could determine whether the Blue Hill deposit should be included in future PFS work.
| Stage 1 and 2 Drilling |
Amec Foster Wheeler and AGP recommend a Stage 1 program of infill drilling to upgrade the the remaining Inferred Mineral Resources within the Phase 5 pit to an Indicated or Measured category, in order to support the PFS.
It is estimated that approximately 5,000 m (combined core and RC) in 12 holes averaging about 400 m in length will be required. Most of these holes will have RC pre-collars through the overlying volcanic rock.
| | |
| 10/03/2017 |
Page 1 - 26
2017 Updated Preliminary Economic Assessment on the Ann Mason Project
Nevada, U.S.A.
Amec Foster Wheeler also recommends a second stage of drilling outside of the current Mineral Resource, but still within the Phase 5 pit. These holes will be drilled on an approximate 200 m x 200 m to 400 m x 400 m grid spacing to test for extensions of the current Mineral Resource in all directions. Similar to the infill program, the holes will be core, but those collared in the volcanic rock will have RC pre-collars. Amec Foster Wheeler estimates that 3,800 m (combined core and RC) in 16 holes averaging 240 m in length will be required.
| Regional Exploration Drilling |
Amec Foster Wheeler recommends that the following regional exploration drilling be completed:
| · | Ann Mason/Blue Hill Exploration (1,150 m) – two core holes, with RC pre-collars, averaging approximately 575 m in depth to explore for sulphide mineralization to the south and west of the Ann Mason deposit. |
| · | Blackjack IP Target (3,800 m) – approximately 5 widely spaced core holes with RC pre-collars, 700 to 900 m in depth to test the east-west trending Blackjack IP anomaly for porphyry-style mineralization. |
| · | Blue Hill/Ann Mason Oxide Targets (2,700 m) – approximately 15 widely spaced RC holes to test for shallow, oxide-copper mineralization to the west and northwest of Blue Hill, near Blue Hill hole EG-BH-11-031 and east of the Blackjack IP zone. |
| · | Blue Hill Sulphide Targets (400 m) – one hole, about 400 m deep to extend previously drilled RC hole EG-BH-10-001, to test extensions of the Blue Hill sulphide mineralization. |
AGP also recommends Entrée extend its historical core re-sampling program to the historical drilling completed by Anaconda at Blue Hill, which did not include the analysis of molybdenum, silver, and gold. This will be important to validate the historical copper values and update the database with these new copper grades as well as molybdenum, gold, and silver. AGP believes that the additional data will increase confidence in the model.
It is estimated that re-sampling should include approximately 2,400 m of Anaconda core (about 1,200 samples, including QC).
AGP also recommends collecting bulk density samples in the Tertiary volcanic rocks to the east of the Blue Hill Fault, which is currently inside the Mineral Resource constraining pit shell and has only been sampled by RC drilling.
Completion of the above drilling and re-sampling programs will help to establish if potentially viable targets occur at depth in these areas that would require further drilling, and further guide the placement of proposed infrastructure, related to the Ann Mason Project.
| | |
| 10/03/2017 |
Page 1 - 27
2017 Updated Preliminary Economic Assessment on the Ann Mason Project
Nevada, U.S.A.
| Prefeasibility Work |
AGP recommends that Entrée develop a thorough PFS scope and detailed budget. AGP estimates that a PFS for Ann Mason would be approximately $9 to $11 million to complete. Proceeding with the activities that would allow completion of a PFS would be contingent upon Entrée receiving board approval to complete the PFS and Entrée having the required funding in place. The PFS would cover areas such as:
| · | resource estimate update |
| · | geotechnical studies |
| · | condemnation drilling |
| · | tailings management facility design and site geotechnical |
| · | environmental management studies and data collection |
| · | concentrate marketing and sales studies |
| · | capital and operating cost estimation |
| · | financial evaluation |
| · | project management and administration. |
Subject to approval and funding, aspects of the study can take place concurrent with the Stage 1 and 2 drilling programs. Environmental and social work and some of the geotechnical and metallurgical work could also occur at this time.
| | |
| 10/03/2017 |
Page 1 - 28
2017 Updated Preliminary Economic Assessment on the Ann Mason Project
Nevada, U.S.A.
| 2 | Introduction and Terms of Reference |
| 2.1 | General |
Entrée Gold Inc. (Entrée or Company) is a British Columbia resource company, based in Vancouver, and publicly traded on the Toronto Stock Exchange (TSX), NYSE MKT, and the Frankfurt Stock Exchange. Entrée is a junior mineral exploration company with a focus on the worldwide mineral exploration and development of copper and gold prospects. Entrée Gold (US) Inc. (Entrée US) and M.I.M. (U.S.A.) Inc. (MIM) are indirect wholly-owned subsidiaries of the Company operating in the United States. Mason Resources Corp. (Mason Resources) is a newly formed, wholly-owned, Canadian-based subsidiary of the Company.
Since 2009, through the acquisition of PacMag Metals Limited (PacMag), option agreements, purchase and sale agreements, and ground staking, Entrée has consolidated a group of mineral claims west of the town of Yerington, Nevada. These claims form the Ann Mason Project (Project), which includes the Ann Mason copper-molybdenum porphyry deposit, the Blue Hill copper deposit (located 1.5 km northwest of the Ann Mason deposit), and other copper targets.
Since acquiring the Project, Entrée's exploration work has focused on increasing and upgrading the Mineral Resources of the Ann Mason deposit, defining Mineral Resources at Blue Hill, and identifying and drill testing new copper targets on other areas of the Project.
| 2.2 | Terms of References |
This National Instrument 43-101 – Standards of Disclosure for Mineral Projects (NI 43-101) Technical Report on the Ann Mason Project (Technical Report or Report) was independently prepared by AGP Mining Consultants Inc. (AGP) and Amec Foster Wheeler Americas Limited (Amec Foster Wheeler or AFW). This Technical Report was prepared for Entrée and Mason Resources to update the 2015 Preliminary Economic Assessment (2015 PEA) of the Ann Mason Project. The Mineral Resource estimate for the Ann Mason deposit and the Blue Hill deposit are re-stated with new effective dates in this Technical Report. The Blue Hill deposit is not part of the 2017 PEA. The Technical Report will be filed with Canadian Securities Administrators on SEDAR to support material information about the Project contained in the Company's Annual Information Form for its financial year ended December 31, 2016..
| | |
| 10/03/2017 |
Page 2 - 1
2017 Updated Preliminary Economic Assessment on the Ann Mason Project
Nevada, U.S.A.
On February 28, 2017 Entrée announced a strategic reorganization of its business (the Arrangement). Pursuant to the Arrangement, all of Entrée's interest in the Project will be transferred to Mason Resources by way of a transfer of the shares of Entrée U.S. Holdings Inc., the Canadian subsidiary that holds the shares of Entrée US and MIM. Shareholders of Entrée (Shareholders) will receive common shares in Mason Resources (Mason Common Shares) in proportion to their shareholdings in Entrée. There will be no change to Shareholders' existing interests in Entrée. It is intended that, as part of the Arrangement, the Shareholders will receive Mason Common Shares by way of a share exchange, pursuant to which each existing share of Entrée (an Entrée Common Share) is exchanged for one "new" share of Entrée and 0.45 of a Mason Common Share. Optionholders (Optionholders) and warrantholders (Warrantholders) of Entrée will receive replacement options and warrants of Entrée and options and warrants of Mason which are proportionate to, and reflective of the terms of, their existing options and warrants of Entrée. The reorganization will be effected by way of a plan of arrangement under the Business Corporations Act (British Columbia) (Plan of Arrangement) and must be approved by the Supreme Court of British Columbia (Court) and by the affirmative vote of 66 2/3% of the Shareholders, as well as the Shareholders, Optionholders and Warrantholders (collectively, Securityholders) voting together as a single class. A meeting of Securityholders to approve, among other things, the Arrangement, will be held on May 1, 2017 (Meeting).
Once the Arrangement becomes effective, the result will be two separate and focused, well-capitalized entities, each with a high quality advanced project providing new and existing shareholders with optionality as to investment strategy and risk profile.
Entrée currently has a treasury of approximately $18.5 million, of which $8.75 million will be transferred to Mason Resources as part of the Arrangement. It is expected that transferring the Project from Entrée to Mason Resources will help accelerate development of the Project.
Additional details of the spin-out transaction will be included in an information circular to be mailed to Securityholders on or about March 24, 2017 in connection with the Meeting. Subject to receipt of all required Securityholder, Court and regulatory approvals, the Arrangement is expected to close by May 30, 2017.
The Ann Mason and Blue Hill Mineral Resource estimates are based on all scientific and technical information as of 3 March 2017 and therefore have an effective date of 3 March 2017.
The Ann Mason mineral resource model and the Mineral Resource estimate have not changed since 9 September 2015, the effective date of the previous Mineral Resource estimate. There has been no additional drilling or other scientific or technical information collected since 9 September 2015 to present. The assumptions used in 2015 to assess reasonable prospects of eventual economic extraction including metal prices, mining, processing and G&A cost metallurgical recoveries and pit slopes remain the same and are still considered reasonable.
| | |
| 10/03/2017 |
Page 2 - 2
2017 Updated Preliminary Economic Assessment on the Ann Mason Project
Nevada, U.S.A.
The Blue Hill mineral resource model and the Mineral Resource estimate have not changed since 31 July 2012, the effective date of the previous Mineral Resource estimate. There have been no material amounts of additional drilling or other scientific or technical information collected since 31 July 2012 to present. The assumptions used in 2012 to assess reasonable prospects of eventual economic extraction including metal prices, mining, processing and G&A cost metallurgical recoveries and pit slopes remain the same and are still considered reasonable.
Initial capital and sustaining capital costs and operating costs used in the 2017 PEA were estimated using Q2 2015 data and pricing. The various costs and pricing was verified for this update and are considered current for Q1 2017. No material change was noted based on that review.
All measurement units used in this report are metric (unless otherwise noted), and currency is expressed in United States dollars unless stated otherwise.
| 2.3 | Qualified Persons |
The Qualified Persons (QPs) responsible for the preparation of this Report, as defined in NI 43-101, are the following:
| · | Greg Kulla, P.Geo., Principal Geologist (Amec Foster Wheeler) |
| · | Peter Oshust, P.Geo., Principal Geologist (Amec Foster Wheeler) |
| · | Joseph Rosaire Pierre Desautels, P.Geo., Principal Resource Geologist (AGP) |
| · | Jay Melnyk, P.Eng., Principal Mining Engineer (AGP) |
| · | Gordon Zurowski, P.Eng., Principal Mining Engineer (AGP) |
| · | Lyn Jones, P.Eng., Senior Associate Metallurgist (AGP) |
| · | Mario Colantonio, P.Eng., Manager/Principal (PES). |
All QPs of Amec Foster Wheeler, PES, and AGP are independent of Entrée, or of any company associated with Entrée.
| 2.4 | Site Visits and Responsibility |
AGP, PES, and Amec Foster Wheeler have conducted site visits to the Project as shown in Table 2-1.
| | |
| 10/03/2017 |
Page 2 - 3
2017 Updated Preliminary Economic Assessment on the Ann Mason Project
Nevada, U.S.A.
Table 2-1: Date of Site Visits and Areas of Responsibility
QP Name | Site Visit Dates | Area of Responsibility |
Greg Kulla | December 6 and 7, 2014 | Responsible for Sections 6, 7.1 to 7.3.5, 8, 9, all of Section 10 except 10.2.2, and Sections 11 and 12.1, and those portions of the Summary, Interpretations and Conclusions, and Recommendations that pertain to those sections of the Technical Report. |
Peter Oshust | No site visit, relying on site visit of Greg Kulla | Responsible for the preparation of Section 14.1 of the Technical Report and for subsection 1.2.1 of the Summary and subsection 25.4.1 of the Interpretations and Conclusions. |
Pierre Desautels | February 27–March 1, 2012 | Responsible for Sections 7.4, 10.2.2, 12.2, 14.2.1 to 14.2.11, 14.2.13, and those portions of the Summary, Interpretations and Conclusions, and Recommendations that pertain to those sections. |
Jay Melnyk | February 27 – March 1, 2012 | Responsible Sections 14.2.12, 15, 16, and those portions of the Summary, Interpretations and Conclusions, and Recommendations that pertain to those Sections. |
Gordon Zurowski | No site visit, relying on site visit of Jay Melnyk | Responsible for Sections 1, 2, 3, 4, 5, 19, 20, 21, 22, 23, 24, 27 and those portions of the Summary, Interpretations and Conclusions, and Recommendations that pertain to those Sections. |
Lyn Jones | No site visit | Responsible for Sections 13 and 17, and those portions of the Summary, Interpretations and Conclusions, and Recommendations that pertain to those Sections. |
Mario Colantonio | February 27–March 1, 2012 | Responsible Section 18 and those portions of the Summary, Interpretations and Conclusions, and Recommendations that pertain to that Section. |
Mr. Derek Kinakin, Mr. Warren Newcomen of BGC Engineering Inc. (BGC), and Mr. Jay Melnyk of AGP visited the Project site between February 27 and March 1, 2012. Mr. Kinakin contributed to the geotechnical components of this Report. Mr. Melnyk accepts responsibility for the geotechnical contribution provided by BGC and Mr. Kinakin and Mr. Newcomen. While on site, these gentlemen reviewed the overall geology of the the Ann Mason and Blue Hill properties, toured the former Yerington pit located near the Ann Mason property, and examined a representative selection of core for geotechnical and mining consideration.
Mr. Desautels while on site reviewed the overall property geology, examined representative core for modelling purposes of Blue Hill and Ann Mason and collected representative samples for independent assay verification.
Mr. Colantonio reviewed topographic features in the vicinity of the proposed pit for locating potential mine infrastructure. He also communicated with local sources regarding power, water and transportation considerations.
Mr. Jones did not attend the site but has visited the laboratory where metallurgical testwork was performed to ensure conformance to industry standards.
| | |
| 10/03/2017 |
Page 2 - 4
2017 Updated Preliminary Economic Assessment on the Ann Mason Project
Nevada, U.S.A.
| 2.5 | Effective Dates |
| · | The effective date of the2017 PEA for the Ann Mason Project is March 3, 2017. |
| · | The effective date of the Mineral Resource estimate at Ann Mason is March 3, 2017. |
| · | The effective date of the Mineral Resource estimate at Blue Hill is March 3, 2017. |
| 2.6 | Previous Technical Reports |
Previous NI 43-101 technical reports on the Ann Mason Project are listed below:
| 4) | Morrison, R.S., 2010. Ann Mason Project Resource Estimate. Report to Entrée Gold Inc. Wardrop Document No. 1055270200-REP-R0001-05. Effective Date: January 25, 2010. |
| 5) | Morrison, R.S., and Cann, R.M., 2011. NI 43-101 Compliant Technical Report on the Ann Mason Property, Nevada, U.S.A. Report to Entrée Gold Inc. Effective Date: March 11, 2011. |
| 6) | Jackson, S., Cinits, R., and Jones, L., 2012. Technical Report and Updated Mineral Resource Estimate on the Ann Mason Project, Nevada, U.S.A. Report to Entrée Gold Inc. Effective Date: March 26, 2012. |
| 7) | Jackson, S., Desautels, J.R.P., Melnyk, J., Zurowski, G., Jones, L., and Colantonio, M., 2014. Amended and Restated Preliminary Economic Assessment on the Ann Mason Project, Nevada, U.S.A. Report to Entrée Gold Inc. Effective Date: 24 October 2012, amended October 15, 2014. |
| 8) | Kulla, G., Oshust, P., Desautels, J.R.P., Melnyk, J., Zurowski, G., Jones, L., Colantonio, M., 2015. Updated Preliminary Economic Assessment on the Ann Mason Project, Nevada, U.S.A. Report to Entrée Gold Inc. Effective Date: 9 September 2015. |
These reports are on file on the SEDAR website (www.sedar.com). Background information and a portion of the technical data for this Technical Report were obtained from these reports.
| | |
| 10/03/2017 |
Page 2 - 5
2017 Updated Preliminary Economic Assessment on the Ann Mason Project
Nevada, U.S.A.
| 3 | Reliance on Other Experts |
The QPs have relied upon and disclaim responsibility for information provided by the Company concerning legal, political, environmental and tax matters relevant to the Technical Report in a letter titled Ann Mason Project, Nevada, dated February 23, 2017, from the Company to AGP and AMEC Foster Wheeler.
| 3.1 | Mineral Tenure, Underlying Agreements, and Royalties |
The QPs have not reviewed the mineral tenure, nor independently verified the legal status or ownership of the Project area or underlying property agreements. The QPs have relied on information provided by Entrée through the above-cited document. This information is used in Sections 4.2, 4.3 and 14 of the Report.
| 3.1.1 | Surface Rights |
The QPs have relied on information regarding the status of the current surface rights, road access, and permits supplied by Entrée through the above-cited document. This information is used in Sections 4.4 and 14 of the Report.
| 3.1.2 | Permitting |
The QPs have relied on information regarding the status of the current surface rights, road access and permits through opinions and data supplied by Entrée through the above-cited document. This information is used in Sections 4.4, 4.5, 14, and 20 of the Report.
| 3.1.3 | Environmental Liabilities |
The QPs have relied on information regarding environmental liabilities supplied by Entrée through the above-cited document. This information is used in Sections 4.6 and 14 of the Report.
| 3.1.4 | Social and Community Impacts |
The QPs have relied on information regarding the status of social and community impacts supplied by Entrée through the above-cited document. This information is used in Sections 14 and 20 of the Report.
| 3.1.5 | Taxation |
The QPs have relied on information regarding taxation supplied by the accounting firm MNP LLP and incorporated in the cash flow. This information is used in Sections 22 of this Report.
| | |
| 10/03/2017 |
Page 3 - 1
2017 Updated Preliminary Economic Assessment on the Ann Mason Project
Nevada, U.S.A.
| 4 | Property Description and Location |
| 4.1 | Location |
The Ann Mason Project is located in west-central Nevada, approximately 75 km southeast of Reno, 45 km southeast of Carson City (the capital of Nevada), and 7 km west of the town of Yerington (Figure 4‑1). It is centred at approximately latitude 39°00' N and longitude 119°18' W, in both Douglas and Lyon counties. The Project is situated within the Yerington Mining District, a historical copper mining district that covers the eastern side of the Project in Lyon County.
Figure 4‑1: Ann Mason Project Location Map
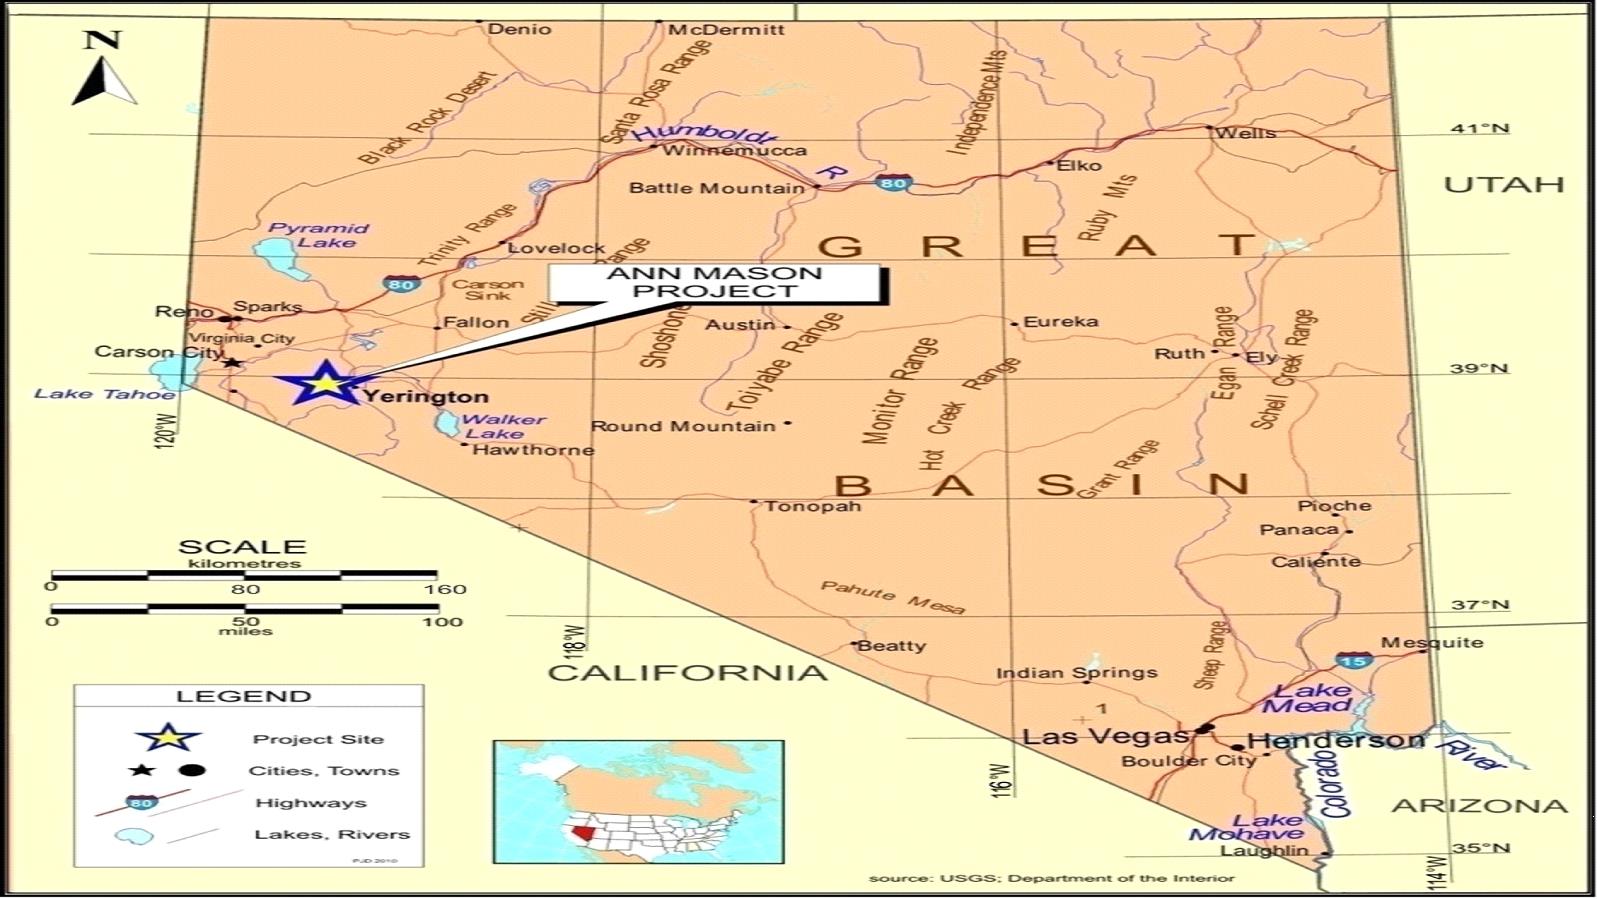
| | |
| 10/03/2017 |
Page 4 - 1
| 4.2 | Tenure |
The Ann Mason Project is currently defined by the mineral rights to 1,658 unpatented lode mining claims on public land administered by the BLM, and title to 33 patented lode mining claims. Together, these cover an area of approximately 12,735 ha (31,468 acres). An additional 21 unpatented placer mining claims, overlapping some of the above unpatented lode claims, are also included in the Project. The claims are listed in Table 4-1, and shown on Figure 4‑2.
Entrée has consolidated land surrounding the Ann Mason deposit through a combination of staking and a series of transactions undertaken since July 2009, including the acquisition of PacMag, an Australian company, in June 2010. In 2014, the Ann South and the Shamrock properties were folded into the Ann Mason Project, following a staking campaign which made most claims contiguous.
The Company's operations in Nevada are conducted by its wholly owned subsidiary Entrée Gold (US) Inc. (Entrée US). Except where otherwise indicated below, the patented and unpatented mining claims that comprise the Project are owned by Entrée US or by M.I.M. (U.S.A.) Inc. (MIM). MIM is also a wholly owned subsidiary of the Company.
The Ann Mason Project claims can be itemized as follows:
| · | 425 unpatented and 13 patented lode mining claims are owned and held by MIM. Of the 425 unpatented claims, 235 are subject to a 0.4% net smelter returns (NSR) royalty in favor of Sandstorm Gold Ltd. (Sandstorm). |
| · | 962 unpatented and 20 patented lode mining claims are held by Entrée US. Of the 962 unpatented claims, 171 are beneficially owned by McIntosh Exploration LLC (McIntosh Exploration) and are subject to a mining lease and option to purchase agreement with McIntosh Exploration (MLOPA). Of the 20 patented claims, 17 are subject to a 2% NSR royalty granted to AngloGold Ashanti (Nevada) Corp. (AngloGold). |
| · | 216 unpatented lode mining claims are beneficially owned and held by Bronco Creek Exploration Inc. (BCE), a wholly-owned subsidiary of Eurasian Minerals Inc. (Eurasian Minerals). Entrée US is earning an 80% interest in the claims through an option agreement with BCE (Option Agreement). |
| · | 55 unpatented lode mining claims are beneficially owned and held by McIntosh Exploration and are subject to the MLOPA. |
| · | 21 unpatented placer mining claims are beneficially owned and held by Custom Details, LLC (Custom Details) and are subject to an option to purchase agreement with Custom Details (Placer OPA). |
| | |
| 10/03/2017 |
Page 4 - 2
Table 4-1: Ann Mason Project Claims
Number of Claims | Area (acres) | Area (ha) | Registered Owner(5) | Entrée Interest (%) | Comments | |
Unpatented Lode Mining Claims | ||||||
AM 1-6, 7A, 8, 9A, 10, 11A, 12, 13A, 14, 16, 17A-20A, 22-44, 45A, 46, 47A-50A, 51-99, 100A, 101-111, 112A-115A, 116-124, 125A, 126, 127A-134A, 135-144, 145A, 146, 147A-150A, 151, 152A, 153, 154A, 155, 156A, 157-161, 162A-165A, 166, 167A, 168-176, 187A, 188-197, 199-265, 267-276 | 262 | 4,727 | 1,913 | MIM | 100(1) | |
AM 277-825 | 549 | 10,569 | 4,277 | Entrée US | 100 | Staked in 2014 |
Ann 31-33 | 3 | 61 | 25 | MIM | 100(1) | |
AS 1-14 | 14 | 204 | 83 | MIM | 100 | Formerly Ann South |
BJ 1-3 | 3 | 17 | 7 | Entrée US | 100(2) | MLOPA(2) (1 claim) |
BN 1-10, 11B, 12A, 13B, 14A, 16-44, 46-53 | 51 | 918 | 372 | MIM | 100 | |
CCP 1-137, 138A, 139A, 140, 143-207, 211, 218-224, 226A, 227, 228 | 216 | 4,281 | 1,732 | BCE | Earning 80(3) | Option Agreement(3) |
CCP 208-210, 212, 213, 214A, 215-217 | 9 | 119 | 48 | Entrée US | 100(2) | MLOPA(2) (7 claims) |
Grand Tour 1-55 | 55 | 1,034 | 418 | McIntosh | 100(2) | MLOPA(2) |
HB 124-138 | 15 | 223 | 90 | Entrée US | 100 | |
HB N1-28, 29A, 30-69, 70A, 71-74, 119-123 | 79 | 1,891 | 765 | Entrée US | 100 | |
HB-N 124-143 | 20 | MIM | ||||
LC 1-17 | 17 | 264 | 107 | MIM | 100 | |
MC 1-18 | 18 | 315 | 127 | MIM | 100 | Formerly Shamrock |
MM 1-16 | 16 | 281 | 114 | MIM | 100 | |
Nick 1-12, 16-26 | 23 | 352 | 142 | MIM | 100 | Formerly Shamrock |
Peanut | 1 | 19 | 8 | Entrée US | 100 | |
Stone Mountain A | 1 | 10 | 4 | Entrée US | 100 | |
Sylvia 1 | 1 | 20 | 8 | MIM | 100(1) | |
Taubert A | 1 | 14 | 6 | Entrée US | 100 | |
WA 1-280, 283-306 | 304 | 5,507 | 2,229 | Entrée US | 100(2) |
| | |
| 10/03/2017 |
Page 4 - 3
Total – Unpatented | 1,658 | 30,826 | 12,475 | |||
Patented Lode Mining Claims | ||||||
Bachelor No. 2, Bachelor No. 3, Bachelor No. 5, Dewey, Edwin No. 3, Enterprise, Eureka, Lucky Boy, Spring, Sure Shot, Twentieth Century, Twentieth Century No. 2, Wonder Fraction | 13 | 230 | 93 | MIM | 100 | Formerly Shamrock |
Jim Copper, Brann Copper, Opher Copper | 3 | 61 | 25 | Entrée US | 100 | |
Veta Granda 1-5, 7 | 17 | 351 | 142 | Entrée US | 100(1) | |
Yellow Metal 1-4, 6, 7 , 9-11, 13, 14 | ||||||
Total Patented | 33 | 642 | 260 | |||
Unpatented Placer Mining Claims | ||||||
Bovard 1-10, Bovie-Lew 11-21 | 21 | 417 | 169 | Custom | 100(4) | Placer OPA(4) |
| Notes: | (1) The Veta Granda and Yellow Metal patented claims are subject to a 2% NSR royalty in favor of AngloGold Ashanti (Nevada), and the following 235 unpatented lode claims are subject to a 0.4% NSR royalty in favor of Sandstorm Gold Ltd.: Ann 31-33; Sylvia 1; AM 1-6, 7A, 8, 9A, 10, 11A, 12, 13A, 14, 16, 17A-20A, 22-44, 45A, 46, 47A-50A, 51-99, 100A, 101-111, 112A-115A, 116-124, 125A, 126, 127A-134A, 135-144, 145A, 146, 147A-150A, 151, 152A, 153, 154A, 155, 156A, 157-161, 162A-165A, 166, 167A, 201-265, 267. (2) The following claims are subject to the MLOPA but title is held by Entrée US: WA 6-56, 66, 68-106, 108, 110, 229-248, 253-264, 267-280, 283-306; BJ 1; CCP 210, 212, 213, 214A, 215-217. All Grand Tour claims are held by McIntosh Exploration and are subject to the MLOPA. When and if Entrée US exercises its option, it will have a 100% interest in the claims subject to a 3% NSR royalty, which may be bought down to a 1% NSR royalty. (3) This group of claims is subject to the Option Agreement with BCE, a wholly subsidiary of Eurasian Minerals. When and if Entrée exercises its option, it will have 80% interest in the claims. (4) The Bovard and Bovie-Lew claims are subject to the Placer OPA with Custom Details, LLC. When and if Entrée US exercises its option, it will have a 100% interest in the claims. (5) The following registered owners were abbreviated for clarity: Bronco Creek Exploration (BCE), McIntoch Exploration LLC (McIntosh), Custom Details, LLC (Custom). |
| | |
| 10/03/2017 |
Page 4 - 4
2017 Updated Preliminary Economic Assessment on the Ann Mason Project
Nevada, U.S.A.
Figure 4‑2: Ann Mason Project Mineral Claim Map
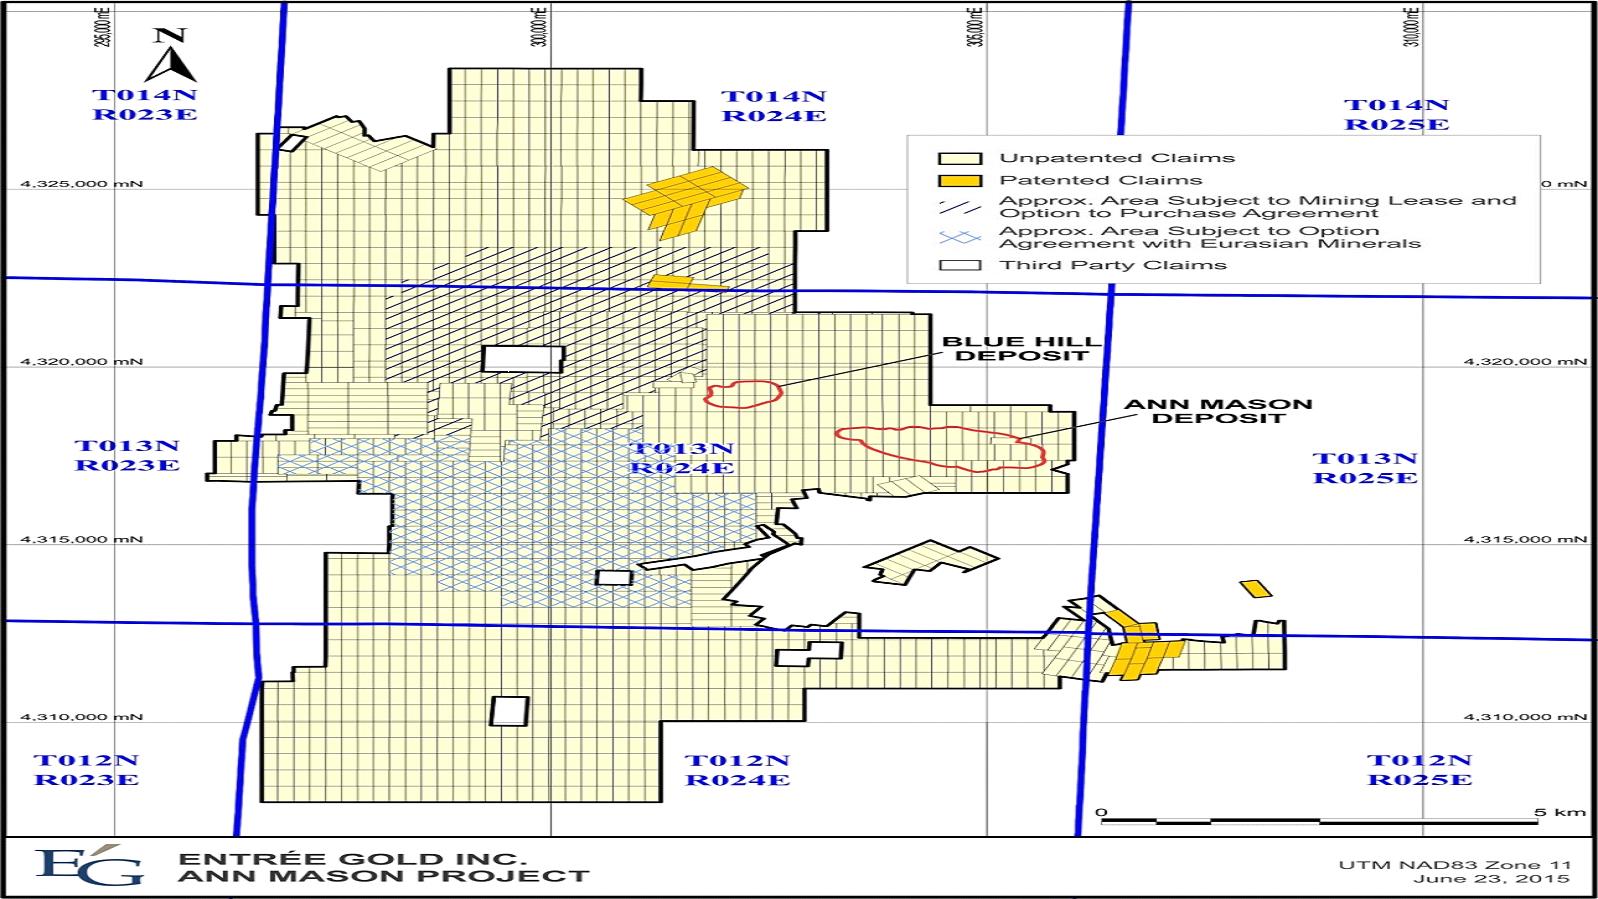
| | |
| 10/03/2017 |
Page 4 - 5
2017 Updated Preliminary Economic Assessment on the Ann Mason Project
Nevada, U.S.A.
The Ann Mason Project comprises a combination of public land administered by the BLM, Carson City District Office, Sierra Front Field Office (the 1,658 unpatented lode claims and the 21 unpatented placer claims), and land that Entrée holds title to (the 33 patented claims). These claims are all in good standing.
The unpatented claims are situated in the following Townships and Ranges, all of the Mount Diablo Meridian:
| · | T12N, R24E (Township 12 North, Range 24 East) |
| · | T12N, R25E |
| · | T13N, R23E |
| · | T13N, R24E |
| · | T13N, R25E |
| · | T14N, R23E |
| · | T14N, R24E |
The unpatented claims have been located and maintained in accordance with state and federal mining law, and the claims are presently valid and defensible. In order to maintain the claims in good standing, it is necessary for claim owners or their lessees to perform the following acts annually: (1) on or before September 1 (the beginning of the assessment year), the owner/lessee must pay a claim maintenance fee of $155 per claim to the State Office of the BLM in which the claim is located; and (2) on or before November 1, the owner/lessee must record an Affidavit and Notice of Intent to Hold in the county in which the claim is situated. The Affidavit and Notice of Intent to Hold must be accompanied by a fee equal to $10.50 per claim plus a nominal fee for county document recording.
A Notice of Intent to Hold has been recorded with Douglas and Lyon Counties for the 2017 annual assessment year which began at noon on September 1, 2016, and ends at noon on September 1, 2017. The required annual mining claim maintenance fees in the amount of $155 per claim and the appropriate recording fees have been paid to the BLM and Lyon and Douglas Counties for the 2017 assessment year.
The patented mining claims are situated in:
| · | T12N, R25E (Township 12 North, Range 25 East) |
| · | T13N, R24E |
| · | T13N, R25E |
| · | T14N, R24E |
All property taxes payable to Lyon County have been timely paid and are current.
| | |
| 10/03/2017 |
Page 4 - 6
2017 Updated Preliminary Economic Assessment on the Ann Mason Project
Nevada, U.S.A.
| 4.3 | Underlying Agreements and Royalties |
| 4.3.1 | Mining Lease and Option to Purchase Agreement |
A total of 226 of the Project's unpatented lode mining claims are subject to the MLOPA with McIntosh Exploration, dated June 7, 2006 as amended on July 20, 2009, August 26, 2009, July 27, 2011 and April 28, 2016 (Claims WA 6-56, 66, 68-106, 108, 110, 229-248, 253-264, 267-280, and 283-306; BJ 1; CCP 210, 212, 213, 214A, 215-217 and Grand Tour 1-55: see Table 4-1). Under the MLOPA, Entrée US leases the mining claims and is granted the option to purchase the claims for $500,000. The initial term of the MLOPA was ten years, and has been extended for one additional ten-year term expiring June 6, 2026. In the event Entrée US exercises its option to purchase the claims, McIntosh Exploration will retain a 3% NSR royalty, which may be bought down to a 1% NSR royalty for $2 million. The MLOPA provides for annual advance royalty payments of US$27,000 until sustained commercial production begins. The advance royalty paymentsh may be credited towards future royalty payments or the buy down of the royalty. Entrée US has made the required advance royalty payments through to June 7, 2016 and the MLOPA is currently in good standing.
| 4.3.2 | Option Agreement with Eurasian Minerals |
A total of 216 of the Project's unpatented lode mining claims are subject to the Option Agreement dated September 24, 2009 with BCE, a wholly-owned subsidiary of Eurasian Minerals, pursuant to which Entrée US may acquire an 80% interest in the claims (claims CCP 1-137, 138A, 139A, 140, 143-207, 211, 218-224, 226A, 227, and 228: see Table 4-1). Under the terms of the Option Agreement, Entrée US may acquire an 80% interest in the property by: (a) incurring expenditures of $1,000,000, making cash payments of $140,000, and issuing 85,000 shares of the Company within three years (completed); (b) making aggregate advance royalty payments totalling $375,000 between the fifth and tenth anniversaries ($150,000 paid to date); and (c) delivering a bankable feasibility study before the tenth anniversary of the agreement. The Option Agreement is currently in good standing.
| 4.3.3 | Corrective Special Warranty Deed with Reserved Net Smelter Returns Royalty |
Pursuant to a Corrective Special Warranty Deed With Reserved Net Smelter Returns Royalty dated effective August 2, 2012, Entrée US acquired 17 patented lode mining claims from AngloGold (Yellow Metal and Veta Granda claims: see Table 4-1). The claims are subject to a 2% NSR royalty granted in favour of AngloGold.
| | |
| 10/03/2017 |
Page 4 - 7
2017 Updated Preliminary Economic Assessment on the Ann Mason Project
Nevada, U.S.A.
| 4.3.4 | Option to Purchase Agreement with Custom Details |
Twenty-one unpatented placer mining claims are subject to the Placer OPA with Custom Details, dated April 30, 2014, as amended on July 13, 2015 (Bovard 1-10 and Bovie-Lew 11-21 claims: see Table 4-1). In consideration of the option and a grant of access over the placer claims for the purpose of locating its own unpatented lode claims, Entrée US paid $35,000 and delivered 250,000 common shares of the Company to Custom Details. Entrée US may extend the option period to a maximum of five years, by making additional payments of $35,000 each on the six-month (paid), first (paid), second (paid), third and fourth anniversaries of the effective date of the agreement. Entrée US may exercise the option at any time by paying a purchase price of $500,000. All cash option payments made by Entrée US will be credited towards the purchase price. The Placer OPA is currently in good standing.
| 4.3.5 | Royalty Agreement with Sandstorm Gold Ltd. |
A total of 235 of the unpatented lode mining claims (claims Ann 31-33; Sylvia 1; AM 1-6, 7A, 8, 9A, 10, 11A, 12, 13A, 14, 16, 17A-20A, 22-44, 45A, 46, 47A-50A, 51-99, 100A, 101-111, 112A-115A, 116-124, 125A, 126, 127A-134A, 135-144, 145A, 146, 147A-150A, 151, 152A, 153, 154A, 155, 156A, 157-161, 162A-165A, 166, 167A, 201-265, 267), including the claims that cover the Ann Mason and Blue Hill deposits, are subject to a Royalty Agreement with Sandstorm Gold Ltd. dated February 14, 2013. Consideration for the 0.4% NSR royalty was $5 million.
| 4.4 | Surface Rights and Easements |
Surface rights to the areas covered by unpatented Iode mining claims are vested with the BLM, which regulates surface management.
Exploration permits issued by the BLM and Nevada Division of Environmental Protection (NDEP) are required for all exploration operations that include drilling or result in surface disturbance. Where surface disturbance is 5 acres (2 ha) or less per year, the operator must file a notice advising the BLM of the anticipated work. An approved Notice of Intent is required, including a determination of the required reclamation cost and acceptance of an approved financial assurance instrument. Where surface disturbance from mining activity covers more than 5 acres, it must be done under a detailed plan of operation filed with the appropriate BLM field office. Bonding is required to ensure proper reclamation. Reclamation bonds remain in place until all reclamation work is complete and the Nevada Bureau of Mining Regulation and Reclamation (BMRR) of the NDEP and BLM have signed off on re-vegetation of drill sites and access roads.
Entrée US owns the surface rights to the Project's 33 patented claims.
| 4.5 | Environmental Considerations and Exploration Permitting |
| 4.5.1 | Ann Mason Plan of Operations |
In December 2007, an Exploration Plan of Operations (Plan) and Application for a Nevada Reclamation Permit (Permit)(Record number NVN-084570/Reclamation Permit No. 0291, respectively) was submitted by MIM to the NDEP, the BMRR, and the BLM. The Plan was revised in March 2009, and covers an area of approximately 835 ha surrounding the Ann Mason and Blue Hill deposits. In conjunction with the Plan submittal, MIM retained the BLM and Enviroscientists Inc. of Reno, Nevada, to conduct an Environmental Assessment (EA) in 2009. The EA was completed in December 2009 (BLM, 2009) and the "Finding of No Significant Impact and Decision Record" approving the Plan is dated January 19, 2010. The Plan allows for a total of up to 50 acres (20.2 ha) of surface disturbance. An $84,132 phased cash bond was accepted by the Nevada State Office of the BLM on March 2, 2010, for exploration surface disturbance totalling 19.11 acres (7.77 ha).
| | |
| 10/03/2017 |
Page 4 - 8
2017 Updated Preliminary Economic Assessment on the Ann Mason Project
Nevada, U.S.A.
Following the acquisition of MIM by the Company in June 2010, a Change of Operator form was filed with the BLM. Effective August 3, 2010, Entrée US was approved as operator and added as a co-principal on the bond.
In January 2011, Entrée US submitted an Amendment (Amendment #1) to the Plan, and a minor modification to the Permit to the BLM and BMRR. In Amendment #1, an increase in the approved work area of approximately 65 ha was proposed, with no change to the approved surface disturbance of 50 acres, or exploration techniques. The BLM Sierra Front Field Office accepted the application to amend as complete on June 15, 2011 and Amendment #1 was approved on June 28, 2011. The financial guarantee was set at $147,568 for reclamation disturbances totalling 19.11 acres (7.77 ha) conducted under the approved Plan. To cover the financial guarantee, an additional bond of $63,436 was posted by Entrée US and was accepted by the BLM on July 5, 2011.
In July 2013, Entrée US submitted a second Amendment (Amendment #2) to the Plan and minor Permit modification to the BLM and BMRR to disturb an additional area of approximately 10.68 acres. Amendment #2 proposed to expand exploration activities described in the existing Plan by adding 16 exploration drill sites, 10 groundwater monitor well sites and one production water well site outside of the previously approved Plan area, and three groundwater monitor well sites within the approved Plan area. No change to the approved surface disturbance of 50 acres, or exploration technique was proposed. The BLM approved Amendment #2 on May 21, 2014. An additional reclamation bond in the amount of $31,276 was posted by Entrée US in the form of a personal bond and Time Deposit, and accepted by the BLM on June 30, 2014.
Entrée US received approval for two minor modifications to Amendment #2 in September 2014 and March 2015. The September 2014 modification allowed for the drilling of 40 infill prefeasibility holes at Ann Mason. An additional reclamation bond in the amount of $34,903 was posted and accepted by the Nevada State Office of the BLM. The March 2015 modification allows for the drilling of three additional exploration holes. An additional reclamation bond in the amount of $3,628 was posted on March 9, 2015.
| e | |
| 10/03/2017 |
Page 4 - 9
2017 Updated Preliminary Economic Assessment on the Ann Mason Project
Nevada, U.S.A.
At the end of 2015, drill sites, sumps and selected access roads for 18 of the Ann Mason holes completed by Entrée US and four of the six Ann Mason drill sites, sumps and access roads constructed by MIM had been re-contoured and seeded. In addition drill sites, sumps and selected access roads for 22 of the 41 Blue Hill holes drilled by Entrée US had been re-contoured and seeded and all 9 of the Blue Hill drill sites, sumps and access roads constructed by MIM had been re-contoured and seeded. During the period August 1, 2016 to November 30, 2016, drill sites, sumps and access roads for an additional 42 Ann Mason drill holes and 13 Blue Hill drill holes, totalling approximately 9.6 acres were re-contoured and seeded. Inspection of completed reclamation work and confirmation of re-vegetation is required prior to release of the bond by the BLM.
To date, a total of 33.4 acres of surface disturbance has occurred or has been approved and bonded through amendments to the Plan. The Plan allows for exploration activities for a total of up to 50 acres of surface disturbance. The remaining 16.6 acres of surface disturbance will be implemented and bonded in subsequent phases. It is expected that the Company will receive credit for the number of acres that have been concurrently reclaimed in order to remain under the 50 acres of approved surface disturbance.
| 4.5.2 | Notices of Intent |
Two areas within the Project were originally permitted for exploration by Entrée US, through Notices of Intent.
A Notice to conduct geophysical work and drilling was submitted by Entrée US to the BLM's Sierra Front Field Office on February 18, 2010 (Record Number NVN-088217) and was accepted on April 14, 2010. The Notice covers an area west and northwest of the Plan area. A cash bond, in the amount of $51,050.70, paid by Entrée US, was accepted by the BLM on May 3, 2010. The Notice allows for a maximum disturbance of 5 acres. All surface disturbance related to drilling and access roads for drilling has been re-contoured and re-seeded. BLM has completed a site inspection of the property and released the reclamation bond. Funds will be released to Entrée upon the renewal anniversary of the Certificate of Deposit held by Bank of the West, Golden, Colorado in March 2017.
The second permitted area was located on the unpatented lode mining claims covered by the Option Agreement. BCE submitted to the BLM a Notice to conduct exploration trenching and drilling on April 1, 2010 and it was accepted on April 23, 2010 (Record Number NVN-85205). Entrée US provided to BCE the reclamation funds specified by the BLM in the amount of $27,113. The cash bond was accepted by the BLM on May 10, 2010 and Entrée US was added as bond co-principal in order to extend the coverage of the bond to include liabilities for operations conducted by Entrée US under the Notice NVN-085205. Entrée US amended the proposed drilling program for NVN-085205 on July 7, 2010. A revised bond amount of $12,607 was determined on July 8, 2010. A total of $14,506 is available for future amendments to NV-085205. The Notice allows for a maximum disturbance of 5 acres. All surface disturbance has been reclaimed and re-seeded. The reclamation bond remains in place pending a future transfer to the Plan.
| | |
| 10/03/2017 |
Page 4 - 10
2017 Updated Preliminary Economic Assessment on the Ann Mason Project
Nevada, U.S.A.
| 4.6 | Environmental Liabilities |
In the course of considering the Plan, the BLM prepared an EA that considered the potential impact of the Plan on the environment. The BLM determined that no significant impact to the human environment would occur due to the proposed exploration work.
Substantial environmental studies were conducted in the preparation of the 2009 EA. These studies documented that historic and prehistoric cultural resources, habitat of certain special interest species of plants and/or wildlife, and other concerns exist or could exist in the vicinity of Ann Mason. Recent environmental studies are described in Section 20. Through coordination with the regulatory agencies, conducting additional comprehensive environmental studies, prudent Project planning and design, and avoiding and/or mitigating potential Project environmental impacts, the Company anticipates being able to obtain all necessary permits for Ann Mason and to operate Ann Mason in an environmentally acceptable manner. There are no known environmental issues that could materially affect Ann Mason.
| 4.7 | Permit Requirements |
The approved Plan dated January 19, 2010, and amended June 28, 2011, May 21, 2014, September 4, 2014 and March 2, 2015, allows up to 50 acres of surface disturbance within the Plan area and on the approved sites outside of the Plan area, as shown on Figure 4‑3.
To date, a total of 33.4 acres of surface disturbance has occurred or has been approved and bonded through amendments to the Plan. The remaining 16.6 acres of surface disturbance will be implemented and bonded in subsequent phases.
Permitting of Stage 1 and Stage 2 drilling and a portion of the recommended exploration drilling included as part of the recommended work in Section 26 will require an amendment to the Plan and Permit. Furthermore if the project advances towards PFS the additional geotechnical and condemnation drilling will require further amendments. No change to the approved surface disturbance of 50 acres is anticipated. Application to amend the Plan and Permit will require posting of additional bonding for reclamation of surface disturbance. Additional concurrent reclamation work including re‑contouring and re-seeding of selected drill sites, sumps and access roads will be required to remain under the 50-acre limit on total surface disturbance. The costs for the recommended work shown in Section 26.2 include funds for additional reclamation bonding and concurrent reclamation costs.
| | |
| 10/03/2017 |
Page 4 - 11
Figure 4‑3: Map of Permitted Work Areas within the Ann Mason Project
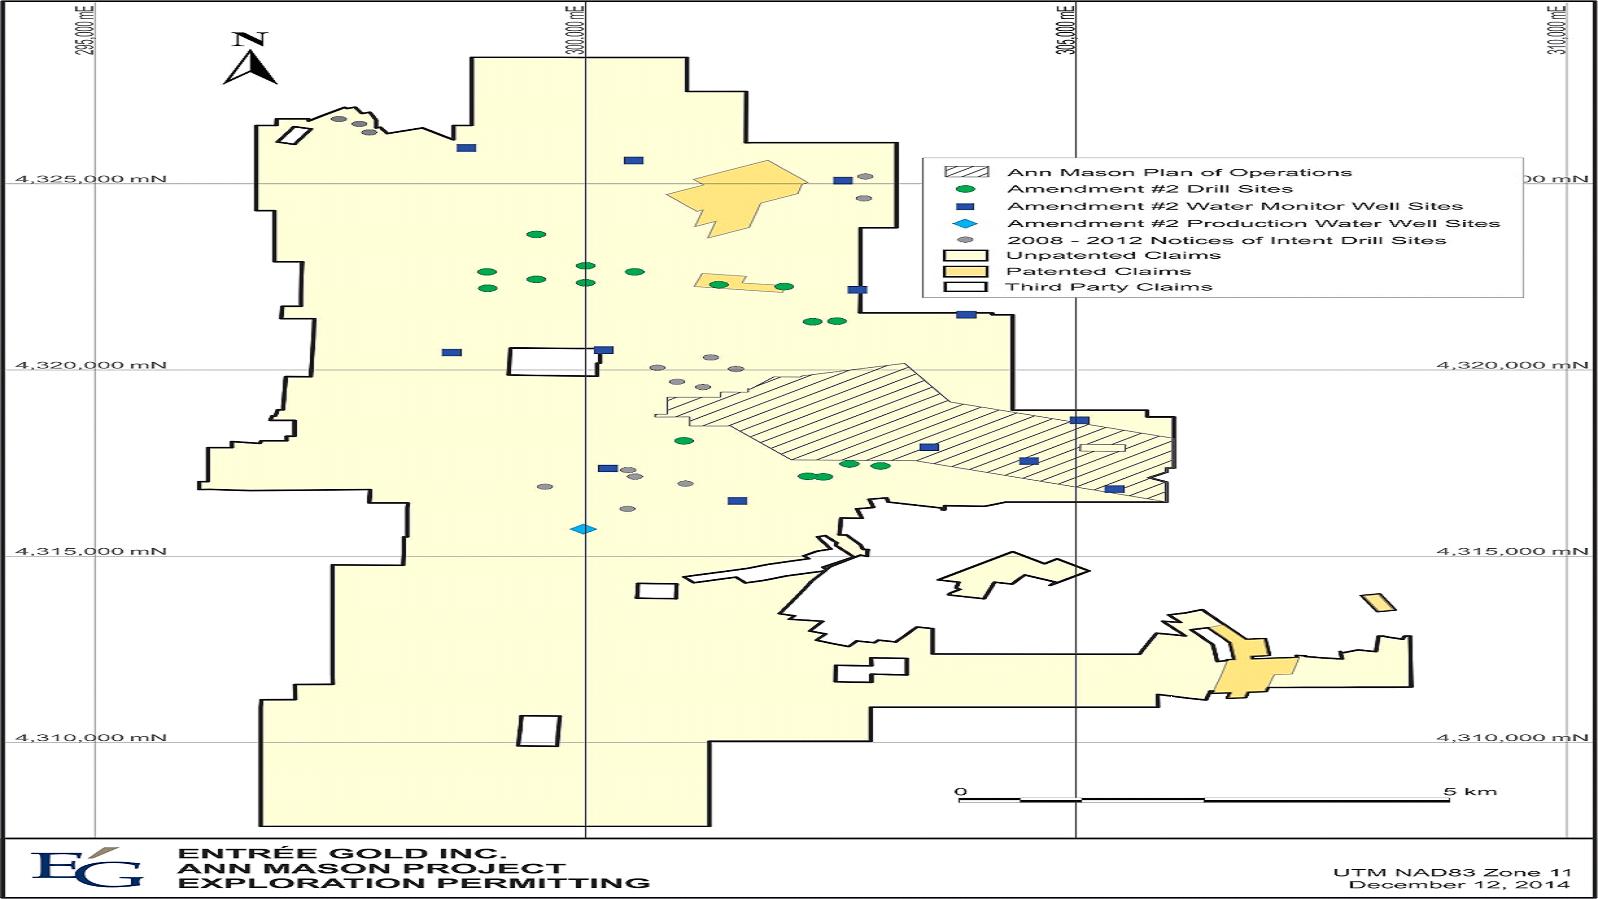
| | |
| 10/03/2017 |
Page 4 - 12
2017 Updated Preliminary Economic Assessment on the Ann Mason Project
Nevada, U.S.A.
| 5 | Accessibility, Climate, Local Resources, Infrastructure, and Physiography |
| 5.1 | Accessibility |
The Project is situated approximately 75 km direct distance southeast from Reno, the third largest city in Nevada and a tourist entertainment resort city. The Project is easily accessible from Reno via the main highway network.
There are regularly scheduled flights to Reno from many major centres in the U.S.A. and some international destinations. From Reno International Airport, the Project can be accessed by road following:
| · | Highway 395 north for approximately 3.5 km to the off-ramp, to join |
| · | Interstate Highway 80 east for approximately 50 km to the turnoff into Fernley, to join |
| · | West Main Street south and east for 2 km, to join |
| · | Highway 95 south for approximately 70 km to Yerington to join |
| · | Burch Drive southwest, toward the town site of Weed Heights for approximately 3 km, to join |
| · | Austin Street south, becoming Belmont Street, for 500 m, to join |
| · | Mead Avenue, which becomes Mickey Pass Road, for approximately 4 km west to turnoffs north and south, to join |
| · | The access roads to the Ann Mason Project site; there are several unpaved roads that allow further access to the Project. |
The highways and roads to Yerington and Weed Heights are paved. The road past Weed Heights to the Project is an all-weather dirt road. The drive from Reno to the Project is typically one and a half to two hours. The drive from Yerington is roughly 20 minutes.
Two alternate routes to the Project from Yerington are: 1) via the MacArthur deposit and Mason Pass Road, and 2) from the north via Campbell Lane and Gallagher Pass (Figure 5‑1).
| | |
| 10/03/2017 |
Page 5 - 1
2017 Updated Preliminary Economic Assessment on the Ann Mason Project
Nevada, U.S.A.
Figure 5‑1: Ann Mason Project, Access, and Physiography
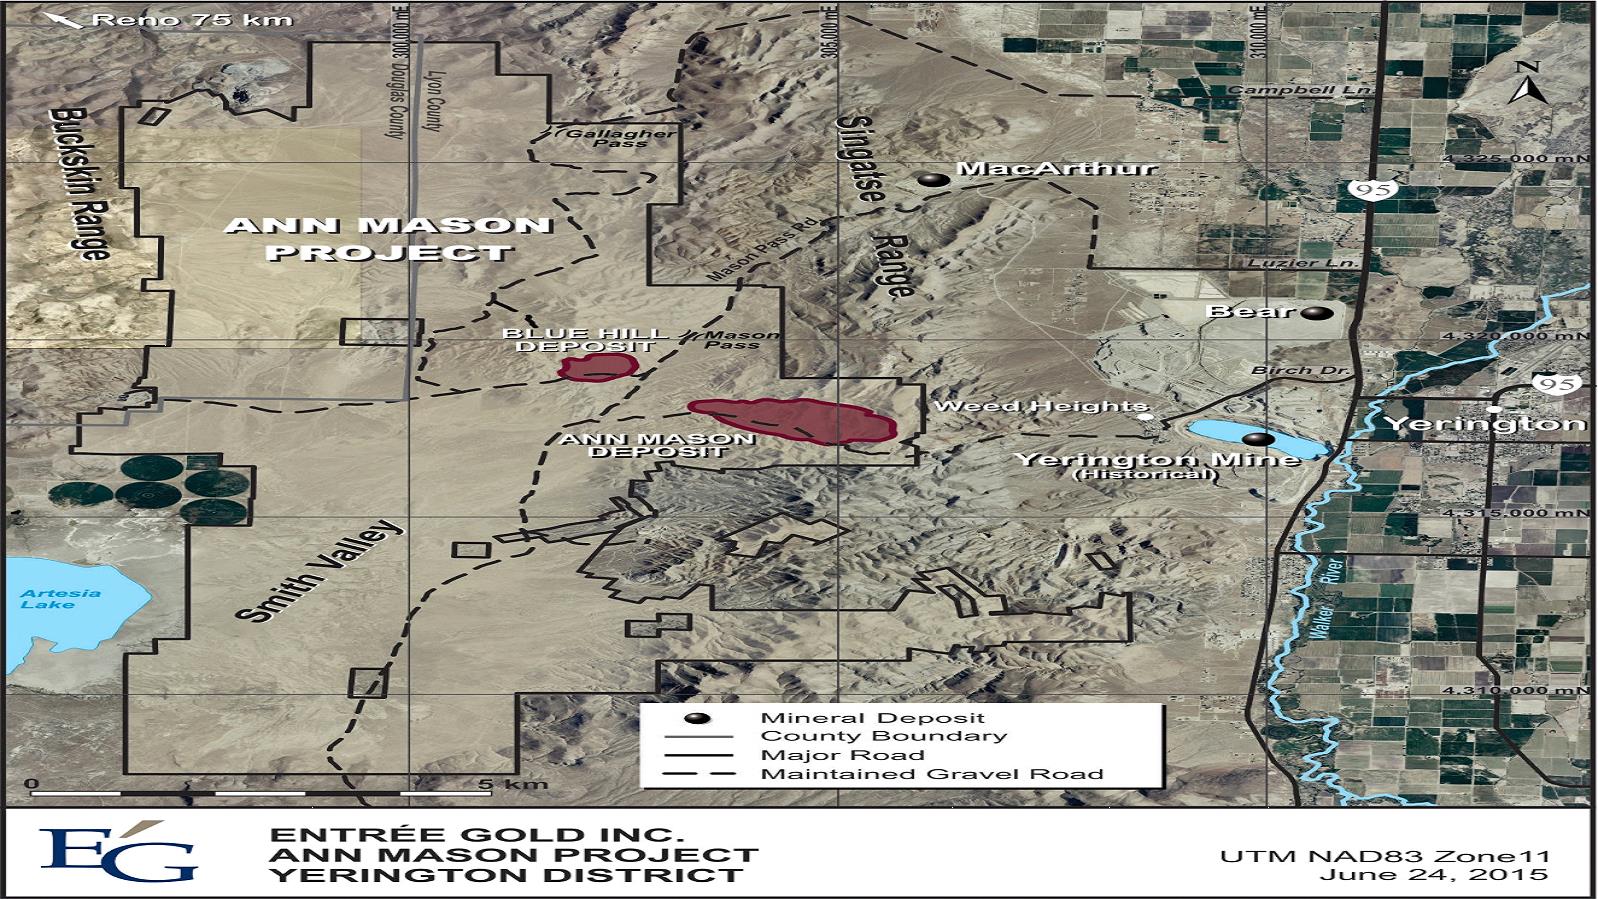
| |
| 10/03/2017 |
Page 5 - 2
2017 Updated Preliminary Economic Assessment on the Ann Mason Project
Nevada, U.S.A.
| 5.2 | Climate |
West-central Nevada is characterized by a high altitude temperate climate, with warm to hot summers and cool winters. The high altitude and Sierra Nevada mountain ranges place the Project in an area of rain shadow where precipitation is minimal, and is mainly in the form of snow in winter.
Mean temperatures in summer vary between 19°C and 23°C; mean temperatures in winter vary between 0°C and 4°C. Maximum temperatures average 33°C in the summer, and minimum temperatures average -7°C in the winter.
Average yearly precipitation in Yerington is 135 mm, with the mean monthly precipitation varying between 6 mm (Sep.) and 16 mm (May). Total snowfall per year averages 170 mm from October to May, (Western Regional Climate Center, http://www.wrcc.dri.edu/).
Work can be conducted throughout the year, with only minor stoppages during winter months due to heavy snowfall or unsafe travel conditions when roads are particularly muddy.
| 5.3 | Local Resources |
The City of Yerington is the closest urban centre to the Project, with a population of approximately 3,100 inhabitants. The town is the main seat for Lyon County and has been primarily a regional ranching and farming centre for most of its history. Most basic consumables are available in Yerington.
The State of Nevada has a long history of mining and a well-developed mining industry. Most mining supplies and equipment can be sourced from Reno/Sparks, Carson City, or Elko, Nevada.
| 5.4 | Infrastructure |
Northwest Nevada has a well-developed network of paved highways and secondary roads. Highway 95 (Figure 5‑1) in Yerington is the main artery that connects the town to the interstate highway system.
The nearest access to the Union Pacific rail network (Mina and Thorne Branch) is located in Wabuska, situated 19 km north of Yerington.
There is an uncontrolled airport in Yerington, with a 1.8 km paved runway but no regularly scheduled flights. The nearest major airport is located in Reno, approximately 130 km by road to the northwest.
| | |
| 10/03/2017 |
Page 5 - 3
2017 Updated Preliminary Economic Assessment on the Ann Mason Project
Nevada, U.S.A.
NV Energy services the majority of Nevada. The service area covers approximately 50% of Nevada State and the majority of the populated areas. Yerington is connected to the state grid and there is a power substation in Weed Heights, located adjacent to the former Yerington mine, 3 km east of the Project. A 226-MW NV Energy plant (Fort Churchill) is located near Wabuska, approximately 18 km northeast of the Project.
All water within Nevada belongs to the public and is subject to appropriation for beneficial uses, such as mining. The State Engineer is responsible for administering and enforcing Nevada water law, which includes the appropriation of surface and ground water in the State. Water rights may be acquired in one or both of the following ways:
| · | by making application to the State Engineer to acquire new water rights |
| · | by leasing or purchasing existing water rights from a third party. Water rights may be purchased as personal property or as an appurtenance in a real-estate transaction. |
The nearest sources of surface water are Mason Valley, located 7 km east of the Project, or the northern part of Smith Valley, located 8 km southwest of Ann Mason. There are no active streams or springs on the Project area. All gulches that traverse the area are dry.
To date, water for drilling has been sourced from the city of Yerington. The water is trucked from the standpipe located at the Yerington airport to the drills on an as-needed basis.
There is available land on the Ann Mason Project for potential TMF, WRMF, and process plant site. Details are discussed in Section 18.
| 5.5 | Physiography |
The topography of the Ann Mason Project is characterized by mountain ranges surrounded by wide, open valleys. The Singatse Mountain Range runs through the eastern portion of the Project, while the Buckskin Range borders its western edge. In between the two ranges is the Smith Valley, filling the Project area to the south and southwest. The Ann Mason deposit lies along the western flank of the Singatse Range (Figure 5‑1). Elevations on the Project vary from 1,400 m in Smith Valley to 1,940 m at Singatse Peak. The relief profile of the Project is low rolling hills to moderately steep slopes at higher elevations.
Vegetation throughout the Project consists of interspersed sagebrush and low profile desert shrubs. There are no trees on the Project. A thin layer of overburden dominantly covers the area, generally less than 2 m thick in areas of outcropping rock, and locally up to 40 m in some valleys. In the southern area of the Project, within the Smith Valley, overburden can reach more than 600 m in thickness.
| | |
| 10/03/2017 |
Page 5 - 4
2017 Updated Preliminary Economic Assessment on the Ann Mason Project
Nevada, U.S.A.
| 6 | History |
| 6.1 | Yerington Mining District |
The eastern portion of the Ann Mason Project lies within the historic Yerington Mining District, an area of early discovery and production of copper in Nevada. In addition to copper, other known commodities in the district are gold, turquoise, iron, and nickel (Tingley, 1998).
Mining in the Yerington District dates back as far as 1865, when copper sulphate and oxide ores were first mined from several deposits located along the flanks of the Singatse Range (Ludwig, Mason Valley, and Bluestone Mines). In the early 1900s, companies started to consolidate properties in the district and began exploration and development. A smelter was built at Thompson, north of Wabuska, and the Nevada Copper Belt Railroad was constructed from the smelter to service the copper mines. The smelter operated intermittently between 1912 and 1928. Several small mines operated during this time: Bluestone, Douglas, Mason Valley, McConnell, and Casting Copper (Tingley 1990, Arimetco, 1991).
In 1941, the Anaconda Company (Anaconda) acquired the Empire Nevada property (now the Yerington property), a past-producing copper oxide mine, and began exploration. From 1953 to 1965, Anaconda open pit mined the oxide ore, and in 1965, a mill and concentrator were constructed to process sulphide ore (Tingley, 1990).
Over a 25 year period from 1953 to 1978, the Yerington mine processed approximately 162 Mst grading 0.55% Cu (Arimetco, 1991).
The Atlantic Richfield Company (ARCO) purchased all of the assets of Anaconda in 1976, shut off dewatering pumps in the pit and closed the Yerington Mine in 1979. The NDEP assumed operation of the site in early 2000. The U.S. Environmental Protection Agency (EPA) has taken over the lead management role. The open pit, currently held by Quaterra Resources Inc. (Quaterra), through Singatse Peak Services LLC., is approximately 3 km to the east of the Ann Mason deposit.
| 6.2 | Ann Mason Project |
| 6.2.1 | General |
Three historical mines are located within the Ann Mason Project (Figure 6‑1). The McConnell and the Western Nevada Mines are both skarn type deposits that produced an estimated 20,000 st and 4,000 st respectively of 3% Cu (Arimetco, 1991). These mines operated during the first half of the 1900s. The Nevada Denver Mine is not well documented.
| | |
| 10/03/2017 |
Page 6 - 1
2017 Updated Preliminary Economic Assessment on the Ann Mason Project
Nevada, U.S.A.
Early exploration work on the Ann Mason Project was conducted by Anaconda from the 1950s through the 1970s, with regional mapping and targeted programs, primarily on the Ann Mason deposit. Other companies carried out exploration programs within the Project; Table 6-1 shows the list of companies and their involvement. The following sections briefly describe the exploration activities carried out by these companies. Locations of historical drill holes and targets are illustrated in Figure 6‑1. It should be noted that Entrée does not have complete drilling data for a small number of the historical drill holes. All available data from historical drilling has been incorporated into Entrée's database and used in the geological interpretation of the Ann Mason and Blue Hill deposits. Historical drilling information is summarized in Section 10 of this report.
Table 6-1: Ann Mason Project – Historical Exploration
Company | Date | Exploration Target/Area | Exploration Work |
The Anaconda Company (after 1977 Atlantic Richfield) | 1956–1981 | Ann Mason | Geophysics, Drilling, Resource |
Blue Hill | Geophysics, Reconnaissance Mapping, Drilling | ||
Superior Oil | 1968 | Blue Hill | Geophysics |
Iso Nevada Limited | 1970-1971 | Shamrock | Drilling |
Arizona Metals Company (Arimetco) | 1990 | Ann Mason | Drilling |
Phelps Dodge Corporation | ~1995 | Blue Hill | Drilling |
Mount Isa Mines | 2002–2003 | Ann Mason | Mapping, Geophysics, Drilling |
Giralia Resources NL | 2003 | Ann Mason | No Exploration Work |
Lincoln Gold Corporation | 2004–2005 | Area approx. 2 km northwest of Blue Hill | Soil Geochemistry, Drilling |
Pacific Magnesium Corporation Ltd. (PacMag Metals Limited) | 2005–2010 | Ann Mason | Drilling, Resource, Scoping Study |
Ann South | Geophysics | ||
Blue Hill | Drilling | ||
Buckskin | Geophysics | ||
Minnesota | Geophysics, Drilling | ||
Shamrock | Drilling | ||
Honey Badger Exploration Inc. (formerly Telkwa Gold Corporation) | 2007–2009 | Broad area west of Ann Mason and Blue Hill, incl. Roulette | Airborne Geophysics, Rock and Soil Geochemistry |
Bronco Creek Exploration Inc. (Eurasian Minerals Inc.)* | 2007–2012* | Roulette | No Historical Exploration Work |
| Note: | *Entrée has an option to acquire an 80% interest in the Roulette property through the Option Agreement with BCE, a subsidiary of Eurasian Minerals Inc. |
| | |
| 10/03/2017 |
Page 6 - 2
2017 Updated Preliminary Economic Assessment on the Ann Mason Project
Nevada, U.S.A.
Figure 6‑1: Ann Mason Project – Historical Drilling

| | |
| 10/03/2017 |
Page 6 - 3
2017 Updated Preliminary Economic Assessment on the Ann Mason Project
Nevada, U.S.A.
| 6.2.2 | Anaconda, 1956–1981 |
Anaconda explored the Ann Mason Project area between 1956 and 1975, with the bulk of the work focused on the Ann Mason deposit. During 1969 and 1970, approximately 23,775 m of core drilling delineated a bulk tonnage low-grade copper deposit (Arimetco, 1991). Anaconda conducted an airborne magnetic study in the early 1970s that indicated a trend of magnetic lows westward from Ann Mason, and an IP survey conducted in the 1970s that indicated a broad zone of anomalous chargeability, trending north-northwest along the western margin of Ann Mason (Pyle, 2003). A re-evaluation of the geology was conducted from 1973 to 1976, and an additional 10,370 m of core drilling was completed in 27 drill holes. Diamond drill core was re-logged for drill holes located along eleven drill sections between mine grid coordinates 10,500 to 15,300E (UTM Coordinates 303,450E to 304,900E). Structure, rock type, and sulphide mineralization were re-examined, and the above referenced drill sections reinterpreted to determine factors controlling the distribution of mineralization in the deposit (Souviron, 1976). Anaconda outlined reserves on the Ann Mason deposit in 1971 (Gustafson, 1971), 1973 (Howard, 1973) and 1976 (Souviron, 1976).
On the Blue Hill area, Anaconda conducted mapping programs in 1956 (Langerfeldt, 1956) and 1970 (Gustavson, 1970). In 1968 and 1970, Anaconda drilled 13 holes at Blue Hill to evaluate the copper oxide potential. Eleven of the 13 Anaconda holes have been used to estimate the current Blue Hill resource.
Exploration drilling was also carried out in other areas within the Project.
In 1977, Atlantic Richfield Company (ARCO) acquired Anaconda and its mineral rights. Anaconda continued to evaluate the Ann Mason deposit, and by 1981, over 42,000 m of drilling was completed. Results of this drilling have been incorporated into Entrée's database.
| 6.2.3 | Superior Oil Company |
In 1968, Superior Oil conducted frequency IP survey over parts of Blue Hill and in areas to the northwest and north of Blue Hill. This data has not been incorporated in Entrée's work.
| 6.2.4 | Iso Nevada Limited, 1970-1971 |
In 1970, Iso Nevada Limited (Iso Nevada) conducted a drilling program to evaluate the potential for a northern extension of the Western Nevada mine mineralized zone. This program, along with the geology of the area, was reviewed and recorded by Anaconda geologist Marco T. Einaudi in 1971, after Iso Nevada dropped their option. Eighteen holes totalling 3,162 m were drilled, with results summarized by Einaudi (1971). Iso Nevada drilling is partially shown in Figure 6‑1, for collars found by PacMag geologist in 2008. Results of this drilling have not been incorporated into Entrée's database.
| | |
| 10/03/2017 |
Page 6 - 4
2017 Updated Preliminary Economic Assessment on the Ann Mason Project
Nevada, U.S.A.
| 6.2.5 | Arimetco, 1990 |
Arizona Metals Company (Arimetco) acquired the mineral rights to the Yerington Mine and the Ann Mason deposit in 1989. The following year, a 170 m confirmation and assessment hole was drilled at the Ann Mason deposit (Arimetco, 1991). No information is available on the location, core, or assays from this hole. Arimetco conducted no further work.
| 6.2.6 | Phelps Dodge Corporation, ~1995 |
Phelps Dodge Corporation carried out a four-hole drill program in the Blue Hill area of the Project circa 1995 to test potential oxide copper mineralization. Data available from the drilling is limited to drill hole locations and summary results for intervals of oxide copper mineralization encountered in three of the drill holes.
| 6.2.7 | Mount Isa Mines, 2002–2003 |
In June 2002, Australian-based Mount Isa Mines, through their subsidiary MIM, acquired Arimetco's claims around the Ann Mason deposit through bankruptcy court, and staked an additional six claims (Pyle, 2003). MIM completed a work program that included geological mapping, an IP geophysical survey using MIM's proprietary 3D MIM digital acquisition system (MIMDAS), and reverse circulation (RC) drilling. MIMDAS was designed to acquire networked multi-channel electrical and electromagnetic (EM) and induced polarization (IP) geophysical data.
Results from the MIMDAS IP survey indicated that the main zone of mineralization in the drilled resource area is located on the eastern flank of a chargeability anomaly (Pyle, 2003).
MIM conducted an RC drilling program to test for shallow mineralization on the northwest portion of the chargeability anomaly. A total of 925 m of drilling was completed in five holes. Each of the holes encountered anomalous copper, zones of intense phyllic alteration, and scattered zones of potassic alteration (Pyle, 2003). Results of this drilling have been incorporated into Entrée's database.
| 6.2.8 | Giralia Resources NL, 2003 |
Giralia Resources NL (Giralia), an Australian-based, publicly listed junior mining company, acquired MIM's Ann Mason Project in October 2003, following the acquisition of Australian-based Mount Isa Mines by Xstrata. Giralia did not conduct any exploration activities on the project.
| 6.2.9 | Lincoln Gold Corporation, 2004–2005 |
In 2004–2005, Lincoln Gold Corporation (Lincoln Gold) had an option to earn 100% interest in a property located near the centre of the Ann Mason Project area (Lincoln Flat property). In 2005, Lincoln Gold explored the property for gold by completing a soil survey (188 samples over two grids); followed by a drill program consisting of nine RC holes for a total of 1,568 m. Scattered intercepts of gold in the order of 150 to 330 ppb Au were encountered in the drill holes. Results of this drilling have been incorporated into Entrée's database.
| | |
| 10/03/2017 |
Page 6 - 5
2017 Updated Preliminary Economic Assessment on the Ann Mason Project
Nevada, U.S.A.
| 6.2.10 | PacMag, 2005–2010 |
In November 2005, Pacific Magnesium Corporation Ltd. acquired the mineral rights to Giralia's Ann Mason Project when the companies entered into a merger agreement that included the outright purchase of Giralia's Ann Mason Project. On June 29, 2006, Pacific Magnesium Corporation Ltd. changed its name to PacMag Metals Limited (PacMag). In 2006, and 2007, PacMag acquired additional mineral claims contiguous to the Ann Mason deposit mineral claims and covering the Blue Hill deposit, as well as other groups of claims adjacent to the Buckskin (gold), Minnesota (iron), Ludwig (copper) and Casting Copper (copper) historical mines. PacMag also entered into an option agreement to acquire mineral claims covering the McConnell (copper) and Western Nevada (copper) historical mines in 2008. Exploration programs were carried out on the Ann Mason deposit, the Blue Hill deposit, and other copper targets as summarized below.
Ann Mason Deposit
Between 2006 and 2008, PacMag drilled 11 holes for a total of 6,754 m on the Ann Mason deposit area. Most drill holes were initially pre-collared by RC drilling, followed by diamond drilling with HQ and NQ sized drill rods. Results of this drilling have been incorporated into Entrée's database.
In November 2006, PacMag retained Golder Associates Inc. (Golder) to complete a resource estimate on the Ann Mason deposit (Golder, 2006). The resource estimate was classified in compliance with the Australasian Code for Reporting of Exploration Results, Mineral Resources and Ore Reserves, the JORC Code 2004 Edition (JORC Code, 2004). Golder considered the Inferred resource classification appropriate, based on drill hole spacing, sample intervals, and geological interpretation of the Anaconda historical data. PacMag's drill holes Ann06001 and Ann06002 were included in the resource estimate.
In November 2007, Metallurgical Project Consultants Pty. Ltd. (MPC, 2007) completed a scoping study.
Blue Hill Deposit
In 2006, 2008, and 2010, PacMag completed three soil geochemical programs on the Blue Hill deposit. The strongest anomalies these programs detected are located immediately northwest of the Blue Hill Fault.
During 2007 and 2008, PacMag completed seven RC holes and two core holes on the Blue Hill deposit totalling 3,438 m. The two core holes were pre-collared by RC drilling.
| | |
| 10/03/2017 |
Page 6 - 6
2017 Updated Preliminary Economic Assessment on the Ann Mason Project
Nevada, U.S.A.
Buckskin and Ann South Targets
In November and December 2006, a 3D Induced Polarization survey was conducted by SJ Geophysics Ltd., for PacMag, over three survey areas: Buckskin, Ann South and Ann Mason (Sheldrake and Rastad, 2006). A test survey was carried out over the Ann Mason deposit, with the goal of determining the IP response from it and use it to compare the response acquired at Buckskin. The detection of a porphyry system similar to Ann Mason was the focus of the Buckskin survey grid. At Ann South, the target was a copper gold skarn replacement at a dacite limestone contact intersected by dykes.
The Ann Mason test survey consisted of three 1,600 m lines, 50 m apart with 50 m station interval. The Ann South survey consisted of two receiver lines and three transmitting lines, 150 m part and oriented at an azimuth of approximately 54°. The receiver lines were 1,600 m long while the transmitting lines were 2,400 m long. The grid was surveyed in with 50 m stations. Buckskin had the largest of the grids with 7 lines, 200 m apart, and a nominal station interval of 100 m. The survey lines were oriented UTM north-south. In total, 29.6 line‑km were surveyed.
In an internal memo summarizing the survey's interpretations at Buckskin, PacMag concluded that there are two target styles that potentially exist at Buckskin: a lode style copper-gold vein and a porphyry copper similar to the Ann Mason deposit (PacMag, 2007).
Minnesota Target
In August 2007, PacMag located sixteen claims on the Minnesota prospect to cover a large positive aeromagnetic anomaly. The Minnesota iron mine is a copper-iron skarn-related deposit, which produced high-grade magnetite ore from open pit operations from 1952–1966. The mine is located adjacent to these claims on the northern flank of the magnetic anomaly. Although the Minnesota prospect was primarily developed as an iron mine, it was originally worked as an underground copper mine, with minor copper ore production during World War I.
Magee Geophysical Services conducted a ground magnetic survey on the Minnesota prospect in July 2007 (Magee, 2007). The survey consisted of 21 line-km along seven 3 km profiles, and was merged with a previous profile surveyed in May 2007 (one 3 km profile). The survey confirmed the size, shape, and amplitude of the magnetic anomaly. SJ Geophysics Ltd. (Lindner, 2007) subsequently conducted a 3D IP survey on the prospect. The IP survey consisted of 11 lines totalling 17.05 km, and identified two discrete chargeability anomalies with locally coincident conductive zones, both on the western flank of the magnetic anomaly.
In 2008, PacMag completed an initial three-hole RC drilling program, totalling 561 m. The first two holes targeted the two IP chargeability anomalies, and encountered considerable pyrite (commonly 2% to 5%, locally >10%), but no significant copper or iron-oxide mineralization. The third hole tested the apex of the magnetic high, but again drilled mineralization dominated by pyrite, with only narrow intervals of 1% to 2% magnetite, and no significant copper. The source of the magnetic high anomaly remains untested at depth.
| | |
| 10/03/2017 |
Page 6 - 7
2017 Updated Preliminary Economic Assessment on the Ann Mason Project
Nevada, U.S.A.
Shamrock Target
In 2008, PacMag optioned a group of 13 patented claims and 23 unpatented claims in an area, referred to as the Shamrock project, covering the McConnell and Western Nevada copper historical mines. Entrée has since completed the option agreement and has a 100% interest in the claims. PacMag completed a 12 hole RC program in June and July of 2009, over an area of approximately 250 m x 150 m. The program confirmed the geology and mineralization previously intersected by Iso Nevada in 1970. Both copper oxide and sulphide mineralization were intersected in drilling. Results include 33.6 m of 1.72% Cu from a depth of 15.2 m, including 4.1 m of 7.75% Cu and 7.1 m of 2.04% Cu. These lengths may not reflect true width of mineralization. Results of this drilling have been incorporated into Entrée's database.
| 6.2.11 | Honey Badger Exploration Inc., 2007–2009 |
Between 2006 and 2008, Telkwa Gold Corporation (Telkwa Gold) consolidated a group of mineral claims west of PacMag's Ann Mason and Blue Hill mineral claims. The area was referred to as Yerington West, and comprised the former Blackjack (Iron Cap) property and the Roulette property. Telkwa Gold Corporation changed its name to Honey Badger Exploration Inc. (Honey Badger) in June 2008 (Honey Badger Website).
Telkwa Gold carried out a soil geochemical and prospecting program northwest of Blue Hill. Results included a wide distribution of anomalous copper samples, with numerous grab samples returning copper values between 5,000 to 50,000 ppm Cu, and three grab samples that returned 216, 356, and 840 ppb Au. A significant, multi-line, gold-in-soil anomaly was also identified, along with several zones of anomalous copper from the same soil survey (Honey Badger Website).
Fugro Airborne Surveys (Fugro, 2008) conducted a high-resolution magnetic and time-domain electromagnetic (TEM) airborne survey over the project in March and April of 2008. During March 2009, Geotech Ltd. carried out a helicopter-borne tri-axis electromagnetic and magnetic survey over two blocks covering Honey Badger's project area, past producing mines, and known porphyry copper and copper oxide deposits in the immediate area (Geotech, 2009). Both surveys are described in exploration Section 9.5 Geophysics.
In 2009, a hand-held XRF soil survey and geologic mapping program was completed in the north area of the Project by BCE on behalf of Honey Badger. In total, 3,320 XRF analyses were taken from 962 field stations, and geologic maps were produced for portions of the property, including the western flank of the northern Singatse Range and the eastern flank of the northern Buckskin Range. The XRF data did not reveal any significant new soil anomalies. Reconnaissance mapping was carried out in the northern Singatse Range, the northern Buckskin Mountains, and areas around Wishart Hill. Mapping was focused in the areas covered by the soil survey, but a few traverses were conducted in adjacent areas as well (BCE, 2009). Mapping of multiple structural repetitions of key lithologic units, combined with alteration mapping, provides a better understanding of structural relationships and potential exploration targets in the northwestern part of the Yerington district.
| | |
| 10/03/2017 |
Page 6 - 8
2017 Updated Preliminary Economic Assessment on the Ann Mason Project
Nevada, U.S.A.
| 6.2.12 | Bronco Creek Exploration Inc. |
Entrée has an option to acquire an 80% interest in the Roulette property through the Option Agreement with BCE, a wholly owned subsidiary of Eurasian Minerals. The Company is not aware of any exploration program carried out by BCE on this portion of the Project prior to Entrée's involvement in 2010.
| 6.3 | Historical Production |
There has been no production from the areas encompassed by the Ann Mason and the Blue Hill Mineral Resources.
In other areas of the Project, the McConnell and the Western Nevada Mines produced an estimated 20,000 st and 4,000 st, respectively, of 3% Cu (Arimetco, 1991). Production at the historical Nevada Denver Mine is not well documented.
| | |
| 10/03/2017 |
Page 6 - 9
2017 Updated Preliminary Economic Assessment on the Ann Mason Project
Nevada, U.S.A.
| 7 | Geological Setting & Mineralization |
| 7.1 | Regional Geology |
The Yerington district is located in west-central Nevada, 80 km east of the Sierra Nevada batholith, and within a portion of the Basin and Range province, which consists of an early-Mesozoic volcanic-arc terrane (Speed, 1978). The area is believed to be underlain by Precambrian or late-Paleozoic oceanic crust and Paleozoic continental margin-arc volcanic rocks and volcaniclastic sedimentary rocks (Stewart, 1972 and 1980; Speed, 1979). This package of rocks lies north and west of an inferred Precambrian craton; (Dilles, 1987).
| 7.2 | Local Geology |
The oldest rock formations mapped in the Yerington district include the 1,300 m-thick sequence of intermediate composition Triassic McConnell Canyon Volcanic rocks (TRv, TRr, TRa) and an overlying 1,800 m-thick sequence of carbonate, volcaniclastic, tuffaceous, and argillaceous sedimentary rocks of Late Triassic to Middle Jurassic age (Dilles, 1987). The Late Triassic to Middle Jurassic formations include the Malachite Mine Formation (TRll,TRla, TRvl), the Tuff of Western Nevada Mine (TRad), the Mason Valley Limestone (TRl, TRlb), the Gardnerville Formation (JTRvc, JTRcl), the Ludwig Mine Formation (Jl, Jgy, Jq), and the Artesia Lake Volcanics (Jaf) (Proffett and Dilles, 2008). Dacitic to latitic rocks of the Jurrassic Fulstone Spring Volcanics (Jf) unconformably overlie the Artesia Lake Volcanics (Hudson and Oriel, 1979).
The Yerington batholith, informally named by Carten (1986), was originally emplaced as a 12 km x 15 km composite pluton, intruding the McConnell Canyon Volcanics and overlying Late Triassic to Middle Jurassic volcanic and sedimentary rocks (Dilles, 1987). The batholith is comprised of three successively younger intrusive phases, including granodiorite (Jgd) and gabbro (Jgb) of the McLeod Hill Suite, quartz monzonite (Jqm, Jbqm) of the Bear Suite, and porphyritic quartz monzonite (Jpqm) and quartz monzonite porphyry (Jqmp) of the Luhr Hill Suite. U-Pb zircon dates range from 169 Ma for early granodiorite to 168 Ma for late quartz monzonite porphyry.
Along the southern margin of the Yerington district, quartz monzonite of the Shamrock batholith (165 Ma) intrudes Triassic volcanic rocks of McConnell Canyon, Late Triassic to Middle Jurassic sedimentary and volcanic rocks, and the Yerington batholith. Andesite dykes of Jurassic age are common within the district, and cross-cut all phases of the Yerington batholith.
| | |
| 10/03/2017 |
Page 7 - 1
2017 Updated Preliminary Economic Assessment on the Ann Mason Project
Nevada, U.S.A.
Up to 120 m of well-rounded pebble, cobble, and boulder conglomerates (Tcg) were deposited on a pre-Tertiary erosional surface characterized by red, deeply weathered phases of the Yerington batholith and adjacent andesitic wall rocks. Clasts within the conglomerate consist of Mesozoic and Tertiary lithologies.
Silicic, Oligocene ignimbrites and Miocene andesitic volcanic rocks, including the Mickey Pass, Singatse, Bluestone Mine, and Blue Sphinx tuffs and the Hornblende andesite of Lincoln Flat, unconformably overlie all Mesozoic rocks (Proffett and Dilles, 1984; Dilles, 1987). Small plugs and dykes of the Hornblende andesite of Lincoln Flat intrude Oligocene to Miocene volcanic rocks and rocks of the Yerington batholith. Miocene andesitic units and all older rocks have been rotated 60° to 90° to the west by Miocene and younger Basin and Range faulting and related extension (Dilles, 1987). As a result, the district has been segmented into a series of gently east-dipping fault blocks containing Tertiary volcanic rocks and pre-Tertiary rocks of the Shamrock and Yerington batholiths and adjacent andesitic and sedimentary wall rocks. Figure 7‑1 shows the simplified Project geology.
| 7.3 | Ann Mason Deposit |
| 7.3.1 | Geology |
The Ann Mason deposit is largely concealed by Tertiary ignimbrites and andesitic volcanic rocks present in the hanging wall of the Singatse Fault and by Quaternary alluvium and eolian deposits that occupy the valley west of Mickey Pass (Figure 7‑2). Surface indications of the deposit, consisting of secondary biotite replacing mafic minerals in Jqmp dykes and limonite after chalcopyrite, are exposed in an L-shaped trench located at the southern margin of the deposit. Limonites indicative of copper mineralization and minor copper oxide minerals are present on fracture surfaces in Jqmp dykes that outcrop south of the Singatse Fault.
In the immediate vicinity of the deposit, Tertiary (Oligocene and Miocene) volcanic rocks in the hanging wall of the Singatse Fault include Hornblende andesite of Lincoln Flat (Tha and Thai) and the Bluestone Mine, Singatse and Mickey Pass Tuffs. These rocks generally strike 10° and dip 60° to 90° WNW. Granodiorite of the McLeod Hill suite of rocks, and porphyritic quartz monzonite and quartz monzonite porphyry dykes of the Luhr Hill suite, comprise the major rock types present at Ann Mason. Granodiorite, cut by various quartz monzonite porphyry dykes, outcrops south and west of the Singatse Fault. Quartz monzonite, interpreted to be part of the Bear suite of rocks, has been logged in a few drill holes located along the north margin of the deposit and in outcrops southwest of the deposit. The detailed rock descriptions that follow are taken primarily from Souviron (1976), with modifications based on observations from Entrée's drilling at Ann Mason.
| | |
| 10/03/2017 |
Page 7 - 2
2017 Updated Preliminary Economic Assessment on the Ann Mason Project
Nevada, U.S.A.
Figure 7‑1: Ann Mason Project Geology
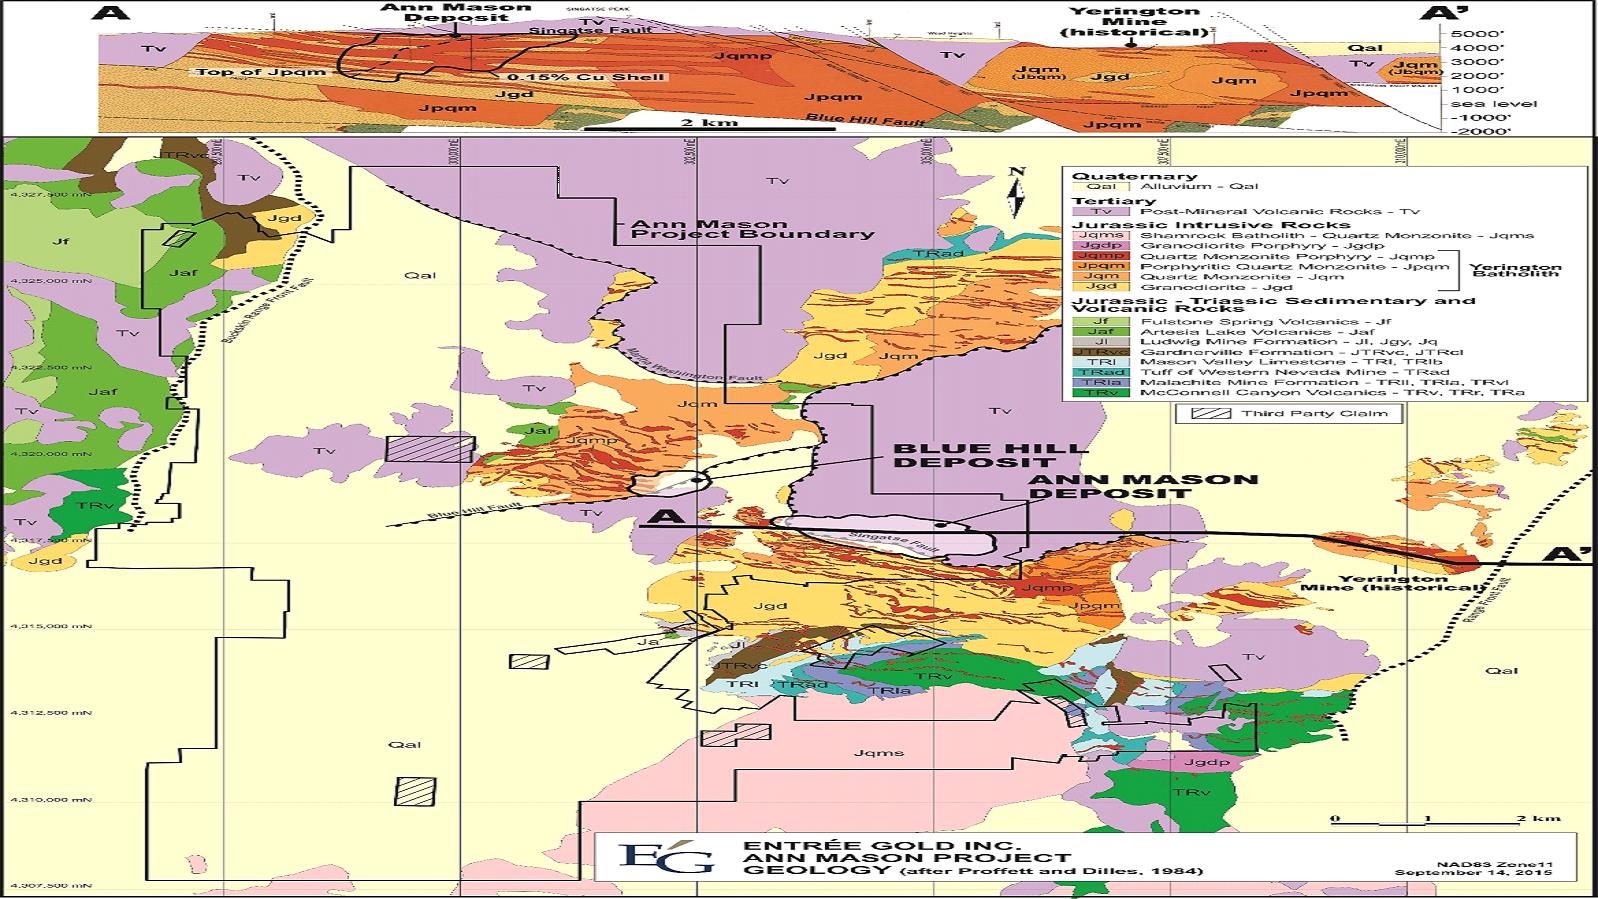
| | |
| 10/03/2017 |
Page 7 - 3
Figure 7‑2: Ann Mason Deposit Geology
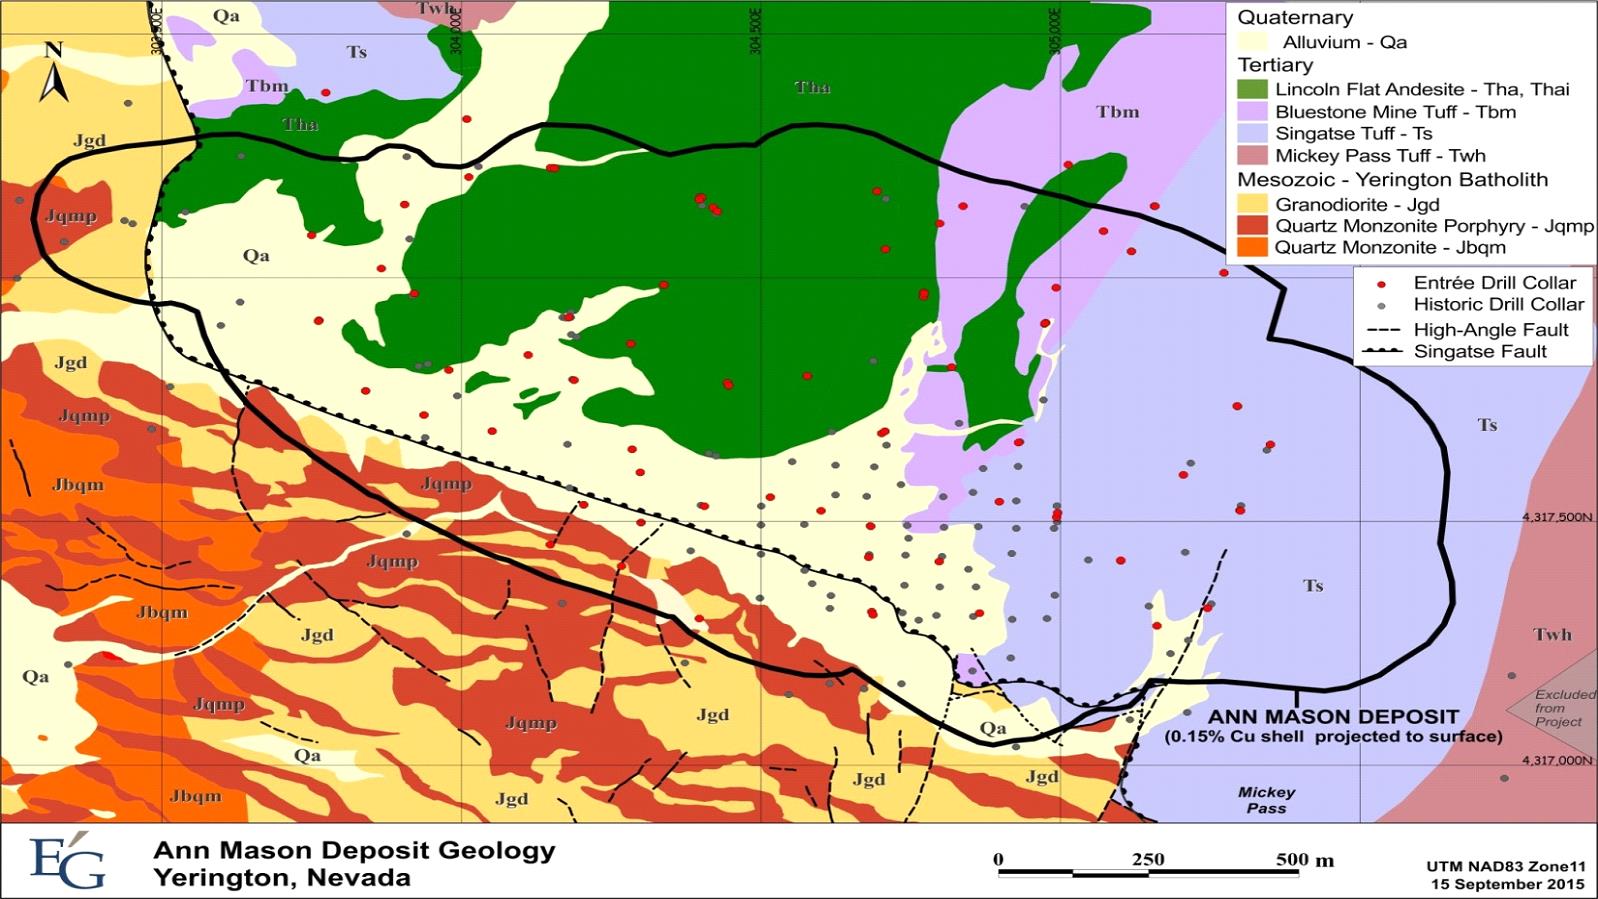
| |
| 10/03/2017 |
Page 7 - 4
2017 Updated Preliminary Economic Assessment on the Ann Mason Project
Nevada, U.S.A.
McLeod Hill Suite
Granodiorite (Jgd)
Granodiorite is the main component of the Yerington batholith that outcrops south and west of the Singatse Fault. In the immediate vicinity of the Ann Mason deposit, granodiorite tends towards mafic quartz monzonite, and is characterized by more abundant graphic quartz than in normal granodiorite, plagioclase greater than alkali feldspar (K-feldspar), and 15% to 20% shreddy mafics (mostly secondary biotite after hornblende). Texturally, the granodiorite is fine-grained and tends to be sub-porphyritic. The granodiorite is intruded by all younger phases of the batholith.
Gabbro (Jgb)
Small amounts of gabbro occur mostly within deeper portions of the batholith (>3 km) at Ann Mason and near Luhr Hill in the eastern portion of the district (Dilles, 1984). According to Dilles, igneous layering within gabbro and adjacent granodiorite is nearly parallel and the two rock types mutually intrude one another. At Ann Mason, a similar rock has been logged as mafic porphyry (mp). A few shallow exposures associated with granodiorite have been observed towards the western margin of the deposit. Mafic porphyry at Ann Mason is characteristically fine-grained, with ≥60% granular groundmass composed primarily of small biotite books and hornblende, sparse phenocrysts of biotite and plagioclase, up to 3% quartz eyes, and occasional K-feldspar phenocrysts.
Bear Suite
Quartz Monzonite (Jqm, Jbqm)
The quartz monzonite (Jqm) is medium-grained and equigranular to weakly porphyritic. Plagioclase and orthoclase in roughly equal amounts are the major constituents, constituting 60% to 70% of the rock. Other components include 20% to 25% quartz and 5% to 10% mafics, with the rest made up of accessory minerals such as sphene, apatite, and magnetite.
Border quartz monzonite (Jbqm) is mineralogically similar, but finer grained, contains more quartz, and tends to be sub-porphyritic.
Quartz monzonite occurs in drill holes along the northern portion of the Ann Mason deposit area, primarily east of 304,600 E. West of this section the quartz monzonite grades to fine-grained border quartz monzonite (Jbqm), which is last seen at 303,450 E. Border quartz monzonite also outcrops southwest of the Ann Mason deposit.
Quartz monzonite and border quartz monzonite also occur at the Blue Hill deposit and Roulette target.
| | |
| 10/03/2017 |
Page 7 - 5
2017 Updated Preliminary Economic Assessment on the Ann Mason Project
Nevada, U.S.A.
Luhr Hill Suite
Porphyritic Quartz Monzonite (Jpqm)
Porphyritic quartz monzonite, interpreted by previous workers in the district as forming the cupola of the Ann Mason porphyry system, intrudes granodiorite (Jgd) and is present directly beneath the Singatse Fault in the eastern portion of the deposit. The intrusive contact between granodiorite and porphyritic quartz monzonite, an important control on the distribution of mineralization, plunges to the west and southwest from where it is truncated by the Singatse Fault The texture of porphyritic quartz monzonite varies from an equigranular matrix of plagioclase, quartz, and K-feldspar, with sparse and fairly large K-feldspar phenocrysts, to a weak porphyritic texture with an incipient groundmass development and abundant K-feldspar phenocrysts. The mafic content averages between 5% and 10%, with approximately 30% biotite books. Quartz eyes are absent.
Jqmp-a and Jqmp-ab
Jqmp-a and -ab are porphyry dykes with surface exposures indicating east-west to north-westerly trends and dips to the south, which is consistent with the information developed by drilling. Jqmp-a has 40% to 60% medium-grained aplitic groundmass with occasional patches of graphic material, 5% fine-grained and shreddy mafics, 5% quartz eyes, no large K-feldspar phenocrysts, and 30% to 40% feldspar phenocrysts, generally smaller than 5 mm.
In the subsurface, Jqmp-a dykes occur and are primarily preserved along the intrusive contact between granodiorite and porphyritic quartz monzonite.
Jqmp-ab is similar, excepting that it contains large K-feldspar phenocrysts.
Jqmp-a porphyry dykes cut granodiorite (Jgd) and porphyritic quartz monzonite (Jpqm) and most commonly occur in proximity to the granodiorite/porphyritic quartz monzonite intrusive contact.
Jqmp-b, Jqmp-bq, Jqmp-bm and Jqmp-c
Jqmp-b is the most abundant of the porphyries. On surface, it strikes N 50° W to N 70° W and dips 35° to 55° to the north. Jqmp-b is generally characterized by 50% very fine-grained groundmass containing small feldspar phenocrysts and hornblende, 5% to 10% coarse mafics with many biotite books, less than 5% quartz eyes, and 5% to 10% large K-feldspar phenocrysts. The "root zone" Jqmp-b differs from the above in that it has a coarser, granular groundmass, which occasionally tends towards an aplitic texture. It can be distinguished from Jqmp-ab by its characteristic books of primary biotite.
Jqmp-bq differs from Jqmp-b in that it contains 10% or more quartz eyes. In the root zone Jqmp-bq develops a granular groundmass, and the quartz eyes tend to be more irregular and to have less euhedral outlines. On surface, Jqmp-bq develops mostly in the western portion of the Ann Mason area, strikes northwesterly, and dips to the north.
| | |
| 10/03/2017 |
Page 7 - 6
2017 Updated Preliminary Economic Assessment on the Ann Mason Project
Nevada, U.S.A.
Jqmp-bm appears irregularly on surface, but generally tends to subparallel Jqmp-b, and is characterized by abundant, small, and needle-like laths of hornblende in the groundmass, making the overall composition more mafic. This groundmass is very fine-grained, and makes up 50% of the rock. Coarse mafics (mainly hornblende laths) total 10%, quartz eyes 10% to 15%, and large K-feldspar phenocrysts up to 5%.
Jqmp-c chilled porphyries are generally found along the borders of quartz monzonite porphyries, within the porphyries themselves, and where quartz monzonite porphyry dykes cut granodiorite, porphyritic quartz monzonite, or quartz monzonite. Jqmp-c porphyries are interpreted as chilled margins of Jqmp-b, Jqmp-bq, and Jqmp-bm dykes.
The differences between the various quartz monzonite porphyries are quite clear in the western and central parts of the deposit where they occur in dyke form, cross-cutting granodiorite, quartz monzonite, porphyritic quartz monzonite, and each other. To the east, the dykes converge into a root zone interpreted to be the deeper (pre-tilt) portions of the deposit, where they merge with porphyritic quartz monzonite, forming a large mass in which their individual characteristics become much less distinct.
Jqmp-b, -bq, -bm, and -c dykes cut granodiorite, porphyritic quartz monzonite, and Jqmp-a and Jqmp-ab porphyry dykes.
Jqmp-d
Jqmp-d is oriented N 70° W, and dips 30° to 60° north. Jqmp-d normally has a lower groundmass content (less than 50%) than other porphyries, and this groundmass tends to be aphanitic and crowded with small feldspar phenocrysts. Mafics, mostly hornblende, make up 10% or more of the rock, quartz eyes generally less than 5% to occasionally 10%, large K-feldspar phenocrysts 5% to 10%, and abundant sphene (usually altered to quartz-rutile) is a common accessory mineral. The difference between Jqmp-b and Jqmp-d is not always clear cut, and in certain cases an intermediate rock-type labelled Jqmp-bd has been mapped. Jqmp-d, as logged by Anaconda, is much more prevalent than occurrences identified in recent drill holes completed by Entrée. Rare examples observed in the current drilling commonly contain disseminated pyrite, and almost no sulphide mineralization in the form of veins, and low copper values.
Jqmp-d porphyry dykes are interpreted to be younger than all other porphyry dykes based on the absence of vein type mineralization and low copper values.
Porphyritic Aplite (Jpa)
Porphyritic aplite is found only rarely, and is closely associated with Jqmp-a and -ab. It is an aplitic rock, with minor phenocrysts of quartz and feldspar and occasional mafics. Age relations show the aplite cutting granodiorite, porphyritic quartz monzonite, and Jqmp-b porphyry dykes, but it is most common cutting porphyritic quartz monzonite.
| | |
| 10/03/2017 |
Page 7 - 7
2017 Updated Preliminary Economic Assessment on the Ann Mason Project
Nevada, U.S.A.
Jqmp
Some quartz monzonite porphyries do not fit classifications described above and have been labelled Jqmp.
Other Intrusive Rock Types
Igneous Breccia (ibx)
Igneous Breccia, found in eighteen diamond drill holes, is composed mainly of a matrix of granodiorite or quartz monzonite porphyry and fragments of granodiorite, aplite, mafic porphyry, and Jqmp (probably types -a and -b). Truncated quartz veinlets are also commonly found. In drill hole EG-AM-11-020, igneous breccia occurs at the contact between Jgd or Jpqm and Jqmp-b dykes. Occurrences in holes D-234 and EG-AM-11-020 are strongly mineralized with chalcopyrite.
Diorite (Jd)
Three small diorite intrusive bodies, intersected in 11 drill holes (D-176, D-222, D-234, Ann07004, EG-AM-11-008, -014 and -024, and EG-AM-14-041, -043, -050 and -076), occur in the north-central part of the deposit. This rock type is weakly pyritized and postdates the main phase of copper mineralization. The rock contains 20% to 30% hornblende, and less than 5% quartz.
Andesite Dykes (Ja)
Andesite dykes, commonly less than 1 m thick, cut quartz monzonite porphyries and all earlier phases of the Yerington batholith. On surface, these dykes have various orientations, ranging from east-west to northwesterly. The subsurface intersections indicate a probable steep northerly dip. The andesite is fine-grained and fresh to chloritized, with weak pyrite mineralization.
Tertiary Volcanic Rocks
Tertiary volcanic rocks post-date copper-molybdenum mineralization in the Yerington district, and were deposited unconformably on the pre-Tertiary erosion surface developed on the Yerington batholith and adjacent wall rocks. In their present configuration, the volcanic rocks are in depositional contact with older rocks within individual fault blocks or in fault contact along various low-angle faults, including the Singatse, Blue Hill, and Fulstone Spring faults.
Proffett and Proffett (1976) and Proffett and Dilles (1984) described and mapped the stratigraphy of Tertiary volcanic rocks of the Yerington district in detail. For the purpose of this report, post-mineral volcanic rocks are not described in detail.
| | |
| 10/03/2017 |
Page 7 - 8
2017 Updated Preliminary Economic Assessment on the Ann Mason Project
Nevada, U.S.A.
| 7.3.2 | Structure |
The current extent of the Ann Mason deposit is contained entirely within the Ann Mason fault block, which is bounded above by the Singatse Fault and below by the underlying Blue Hill Fault. Miocene normal faulting and extension have rotated deposits in the Yerington district, including Ann Mason, 60° to 90° to the west. As a result, north-south cross-sections are approximately equivalent to level plans in the pre-tilt geometry of the deposit. East-west cross-sections remain roughly equivalent to vertical sections through the deposit, except that they are rotated approximately 90° west.
Surface exposures of Tertiary conglomerate (Tcg), in contact with granodiorite (Jgd) rocks in the hanging wall of the Singatse Fault are offset approximately 4 km to the east relative to the footwall. Based on Entrée's drilling at Ann Mason and Blue Hill, the Blue Hill Fault is projected to be 50 m to 100 m below the current depth of drilling at Ann Mason on the northwest margin of the deposit (Hole EG-AM-11-015), and 200 m to 600 m below the current depth of drilling in the central and eastern portions of the deposit (Holes EG-AM-11-007 and -009).
Sixteen high-angle faults (Faults 1, 1A, 1B, 2 through 4, 4A, 5 through 12 and 14) have been identified within the Ann Mason deposit by integrating historical structural data with Entrée's logging of faults interpreted to have significant amounts of displacement. These high-angle faults, which all occur in the footwall of the Singatse Fault, have strike directions of approximately 300° and dip 60° to 70° southwest. The criteria used to identify significant amounts of displacement include thickness of clay gouge, changes in rock type across structures, and the presence of fault breccia or slickensides. Displacement on these faults ranges from <50 m to as much as 500 m along Fault 1A which marks the southwest boundary of the 0.15% Cu grade shell at Ann Mason. The high-angle structures were mapped in cross-section using north-south sections at 50 m spacing and transferred to east-west sections and level plans for final interpretation. These northwest-trending structures offset the intrusive contact between granodiorite (Jgd) and porphyritic quartz monzonite (Jpqm) to successively deeper levels towards the west and southwest. Overall, the successive offsets result in an apparent dip of the Jgd/Jpqm contact from 15° to as much as 50° to the southwest, from where it is truncated by the Singatse Fault.
The Singatse Fault is offset by at least one northeast-striking, high-angle fault located near the southeast corner of the deposit.
| 7.3.3 | Mineralization |
Copper-molybdenum mineralization, accompanied by potentially economic concentrations of silver and gold, represents the primary economic mineralization at Ann Mason. At the time of discovery and while Ann Mason was being explored by Anaconda (1967 to 1981), copper was the primary commodity of interest. In 2002, MIM analyzed historical drill core from Anaconda's drilling and found potentially economic concentrations of molybdenum. Gold and silver were also found during this re-assaying program, but were never considered for inclusion in resource models due to the limited number of gold and silver assays contained in the historical database.
| | |
| 10/03/2017 |
Page 7 - 9
2017 Updated Preliminary Economic Assessment on the Ann Mason Project
Nevada, U.S.A.
Copper mineralization at Ann Mason is concentrated within a >0.15% Cu grade envelope with fairly sharp boundaries between mineralized and unmineralized rock. When projected to surface, the envelope covers an area of approximately 2.8 km northwest by 1.3 km northeast and extends more than 1.2 km vertically. The envelope plunges to the west-southwest and extends from 200 m to as much as 800 m above and below the intrusive contact between granodiorite (Jgd) and younger porphyritic quartz monzonite (Jpqm). Within this envelope, copper grade is dependent on vein density, sulphide species, frequency and relative age of quartz monzonite porphyry dykes, and the availability of mafic mineral sites within granodiorite favourable for deposition of disseminated mineralization. The top of the mineralized envelope is truncated by the Singatse Fault and much of the southwest edge is truncated by the northwest-trending Fault 1A. Although the sense of movement and amount of displacement on the 1A Fault is unknown, it is possible that copper mineralization continues southwest of the fault, either at depth or along strike.
Copper occurs primarily as copper sulphides, including chalcopyrite, bornite, minor chalcocite, and rare examples of covellite. Oxide copper mineralization, consisting of malachite, black copper-manganese oxides, and copper-bearing limonite, is only present in a few holes within the Ann Mason deposit; the largest intercept being a 22 m interval near the top of hole EG-AM-11-016. Molybdenum occurs as molybdenite in quartz- and quartz-chalcopyrite veins, and as molybdenum paint on fractures and shear planes. Distribution of molybdenite is generally coincident with the distribution of the chalcopyrite-bornite sulphide domain but occurs independent of copper in areas of strong sodic alteration.
Mineralization occurs in all intrusive units of the Yerington batholith except Jqmp-d. Deposition of copper is closely associated with intrusion of Jqmp-a, Jqmp-b and Jqmp-c porphyry dykes into granodiorite (Jgd) and porphyritic quartz monzonite (Jpqm) (Figure 7‑3). Anaconda geologists interpreted Jqmp-a dykes at Ann Mason as the earliest and best mineralized of the Luhr Hill suite of rocks. Spatially, Jqmp-a dykes primarily occur along the intrusive contact between granodiorite (Jgd) and porphyritic quartz monzonite (Jpqm). Contrary to previous geological models, copper mineralization does not appear to be distributed conformably around Jqmp-b porphyry dykes, which generally strike AZ 296° and dip 45° NE.
Identification of the granodiorite/porphyritic quartz monzonite intrusive contact as a deposit-scale control on the distribution of copper mineralization is the result of deeper infill and step-out drilling conducted by the Company between 2010 and 2015. The observed empirical relationship between copper distribution and the intrusive contact is supported by mapping of the top of the chalcopyrite-bornite sulphide assemblage in close proximity to the intrusive contact and the presence of higher-grade copper mineralization (≥0.4% Cu) ranging from 100 m to 300 m above and below the contact.
| | |
| 10/03/2017 |
Page 7 - 10
2017 Updated Preliminary Economic Assessment on the Ann Mason Project
Nevada, U.S.A.
Of the sixteen high angle faults identified within the Ann Mason deposit, Fault 1A marks the current southwest margin of >0.15% Cu mineralization in the deposit, juxtaposing propylitically altered rocks with pyrite mineralization in the hanging wall against potassically-altered rocks with copper-molybdenum mineralization in the footwall. Copper-molybdenum mineralization in the footwall of the fault remains open at depth along the entire length of the fault. Late, high-angle faults, with or without late-stage sodic (albite) or sericitic alteration, are known to locally reduce copper grade within the deposit.
Veining at Ann Mason carries a closer relation to copper and mineralization than previously recognized. Sulphide veins are logged as to mineral assemblage, form, thickness, and type and width of selvage. Up to five vein types are used to characterize vein mineral assemblages. In general, veining observed at Ann Mason represents typical porphyry style veins as described by Dilles and Einaudi (1992) for Ann Mason, which includes types A, AB, B, C, and D. Higher copper grades are commonly associated with dark, cross-cutting, and sometimes irregular or discontinuous veins containing quartz, secondary biotite and K-feldspar, chalcopyrite, and/or bornite. Dark selvages, ranging in width from millimetres to centimetres, typically contain the same mineral assemblages. Molybdenum occurs primarily as molybdenite in quartz- and quartz-chalcopyrite veins, and on fracture or shear surfaces as molybdenum paint. In quartz veins, molybdenum occurs as disseminations, centreline segregations, and borders or selvages.
| 7.3.4 | Sulphide Zoning |
Ann Mason sulphide domains include an outer pyrite-dominated shell and sulphide domains characterized by varying ratios of pyrite>chalcopyrite, chalcopyrite-pyrite, and chalcopyrite-bornite (Figure 7‑3). Table 7-1 shows the ratios used by Anaconda geologists and by Entrée to define sulphide domains.
Table 7-1: Sulphide Domains at Ann Mason Deposit
Sulphide Facies | Sulphide Mineralization Code | Logged As | Ratio with Respect to Pyrite (py) |
Pyrite | py | py ≥ 3:cp 1 | > 3:1 py |
Pyrite-Chalcopyrite | py cp | py3:cp1 to cp3:py1 | 3:1 py to 1:3 py |
Chalcopyrite | cp | cp ≥ 3:py 1 | 1:3 py |
Bornite | bn | cp bn |
The copper sulphide zoning is that of a typical porphyry copper with an outer pyritic shell, and concentric zones of increasing chalcopyrite and decreasing pyrite progressing inward to a central zone of chalcopyrite-bornite.
| | |
| 10/03/2017 |
Page 7 - 11
2017 Updated Preliminary Economic Assessment on the Ann Mason Project
Nevada, U.S.A.
Within the northeast, southeast, and southwest quadrants of the deposit, little or no overlap occurs between pyrite and bornite or between pyrite and molybdenite. Chalcopyrite and chalcopyrite-bornite are the primary sulphide domains in these portions of the deposit.
The primary sulphide domain in the northwest quadrant of the deposit (west of UTM 304,300E and north of UTM 4,317,700N) is chalcopyrite ≥ pyrite, a domain that forms thick intervals of >0.3% Cu, with only minor bornite present at depth, near the granodiorite-porphyritic quartz monzonite contact. Copper mineralization >0.15% Cu in this portion of the deposit coincides with a pyrite:chalcopyrite ratio below 7:1.
In thin section, chalcopyrite occurs as individual grains in veins and disseminated in rock, as fillings in brecciated pyrite grains, attached to or included in pyrite grains, and attached to or included in bornite; bornite occurs as separate grains in veins, and disseminated in rock and attached to chalcopyrite. Chalcocite occurs as replacement rims on chalcopyrite, but more commonly as replacement rims or exsolution replacement of bornite.
Molybdenum occurs as molybdenite in quartz- and quartz-chalcopyrite veins and on fracture or shear surfaces as molybdenite paint. Within quartz veins, molybdenite occurs as disseminations, centerline segregations and discontinuous selvages. Molybdenum within a 0.005% Mo grade shell occurs largely within the 0.015% Cu grade shell. Where late albite alteration has reduced copper grade, molybdenum mineralization is mobilized into fractures and shear zones and extends to greater depth than copper.
Silver ≥0.6 g/t and gold ≥0.06 g/t are closely associated with the occurrence of bornite within the chalcopyrite-bornite sulphide domain.
| | |
| 10/03/2017 |
Page 7 - 12
2017 Updated Preliminary Economic Assessment on the Ann Mason Project
Nevada, U.S.A.
Figure 7‑3: Ann Mason Cross-Section 4,317,700 N Showing Geology and Sulphide Domains
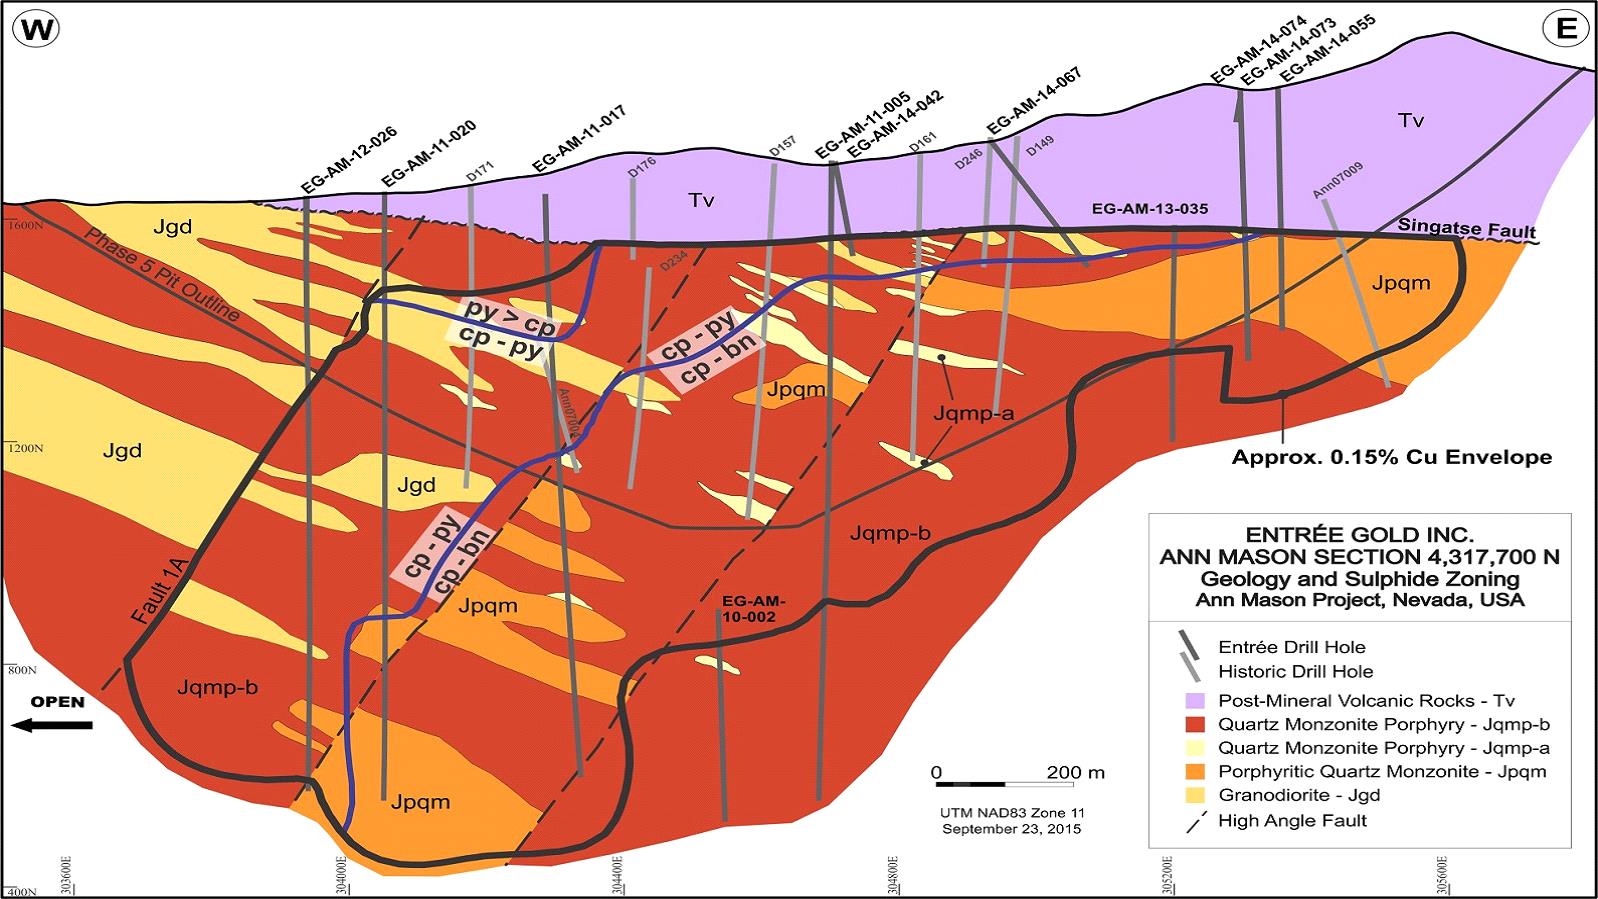
| | |
| 10/03/2017 |
Page 7 - 13
2017 Updated Preliminary Economic Assessment on the Ann Mason Project
Nevada, U.S.A.
| 7.3.5 | Alteration |
Hydrothermal alteration associated with porphyry copper and molybdenum mineralization is similar to alteration described in many porphyry copper deposits. Voluminous sodic-calcic alteration zones on the flanks of the Yerington district deposits may have been leached of copper and iron, possibly providing those components to mineralizing fluids (Dilles and Proffett, 1995).
Alteration assemblages include an outer propylitic zone (chlorite±epidote±pyrite), widespread potassic alteration (secondary biotite, secondary biotite+K-feldspar or K-feldspar) associated with main-stage copper-molybdenum mineralization, and more restricted late-stage zones of chlorite±epidote±albite, sodic (albite±chlorite), and sericitic alteration.
Propylitic
Assemblages of chlorite and epidote, locally with oligoclase, form the outer propylitic zone, in conjunction with 1% to 7% pyrite as the primary sulphide. Propylitic alteration has characteristically high magnetic susceptibility relative to other main stage alteration types. Along the southwest margin of the deposit, propylitic alteration is in fault contact (along Fault 1A) with mineralized and potassically altered rocks.
Potassic
Secondary biotite and secondary bioite+K-feldspar constitute the bulk of the main-stage potassic alteration. Where it occurs with secondary biotite, K-feldspar is generally grey and occurs as veins and replacing plagioclase phenocrysts and rock groundmass. Secondary biotite and biotite+K-feldspar occur in approximately even abundance in the upper portions of the deposit. At deeper levels, secondary biotite is the dominant form of potassic alteration. Occurrences of biotite+K-feldspar are located along the northwest and southeast margins of the deposit. K-feldspar only is volumetrically minor at all levels but slightly more abundant at depth. Pink to salmon-coloured secondary K-feldspar occurs as veins and patchy replacement of rock groundmass within the deposit and locally within zones of propylitic alteration.
Chlorite±Epidote±Albite
Chlorite±epidote±albite alteration forms a weak to moderate overprint on potassic alteration where chlorite replaces biotite, albite alteration of feldspar phenocrysts (K-feldspar and plagioclase) ranges from replacing rims to complete replacement, and epidote replaces mafic minerals and albite. In thin section, chlorite and epidote have a granular texture distinct from the intergrown texture observed in zones of propylitic alteration. Chlorite-epidote-albite alteration is common in the upper portions of the deposit but more restricted and structurally controlled at depth.
| | |
| 10/03/2017 |
Page 7 - 14
2017 Updated Preliminary Economic Assessment on the Ann Mason Project
Nevada, U.S.A.
Sodic
Sodic (albite) alteration ranges from incipient replacement (evidenced by white rims surrounding feldspar phenocrysts) to pervasive replacement that partially or completely obliterates rock texture. At logged concentrations of <10% by volume, albite alteration has little or no effect on copper mineralization. Moderate, pervasive albitization (10% to 15%) where rock texture is still discernible may reduce bornite content while leaving chalcopyrite partly or completely intact. At higher concentrations of albite, most copper mineralization is removed, and rock texture is largely destroyed. Resulting copper grades are <0.2%, and locally <0.05%. Epidote is generally absent in zones of strong albite alteration, a characteristic that helps distinguish albite alteration from zones of chlorite±epidote±albite alteration. Molybdenum mineralization is not significantly impacted by albitization beyond remobilization of molybdenite from quartz-molybdenum and quartz-chalcopyrite-molybdenum veins into fractures and shear zones. Sodic alteration is the dominant assemblage of overprinted alteration in the lower portions of the deposit.
Sericite
Quartz-sericite alteration is the youngest alteration assemblage that is texturally destructive and reduces copper grade at higher levels of intensity. Quartz-sericite and quartz-sericite-pyrite veins and vein selvages overlap into pervasive zones of alteration, especially within and adjacent to faults. Weak, fine-grained sericite, where it replaces secondary and primary biotite and partially replaces plagioclase phenocrysts, does not have a pronounced effect on copper grade. Vein orientation studies and cross section interpretations suggest quartz-sericite-pyrite zones dip shallowly to the southeast within much of the deposit, steepening at depth and in the southeast portion of the deposit. Quartz-sericite-pyrite alteration is most abundant in the northwest portion of the deposit.
Other Alteration
Zeolite is rarely present as fracture fillings and, in one example, forms a matrix interstitial to plagioclase phenocrysts.
Gypsum occurs in a discontinuous, 700 m x 1,200 m x 200 m-thick, relatively flat-lying zone in the footwall of the Singatse Fault and within the chalcopyrite-pyrite and pyrite>chalcopyrite sulphide portions of the deposit. Gypsum cements the rock as fracture fillings, veins, and pervasive alteration, producing long pieces of intact core. Gypsum is largely absent within the chalcopyrite-bornite sulphide domain. Because it cements highly fractured rock and, locally, fault zones, gypsum alteration is considered to postdate Miocene faulting, extension, and structural rotation. Isolated gypsum occurrences, observed at depths up to 1,200 m below surface, are believed to be controlled by high-angle fractures or fault zones. Anhydrite is rare and unrelated to gypsum, occurring primarily at deeper (pre-tilt) levels near the northeast and southeast margins of the resource.
| | |
| 10/03/2017 |
Page 7 - 15
Fluorite has been observed rarely, occurring as light green, blue, or purple fracture-fillings, and mm to cm-sized veins at a rate of a few veins per drill hole in 10 of the 77 holes Entrée has completed at the Ann Mason deposit.
Copper mineralization, associated with three main sulphide domains: pyrite>chalcopyrite, chalcopyrite-pyrite and chalcopyrite-bornite, occurs within main-stage potassic alteration, including secondary biotite and secondary biotite+K-feldspar. Chalcopyrite occurs with epidote or epidote+quartz, where potassic alteration is overprinted by the chlorite±epidote±albite alteration assemblage (Figure 7‑4).
| | |
| 10/03/2017 |
Page 7 - 16
Figure 7‑4: Ann Mason Cross-Section 4,317,700 N Showing Alteration
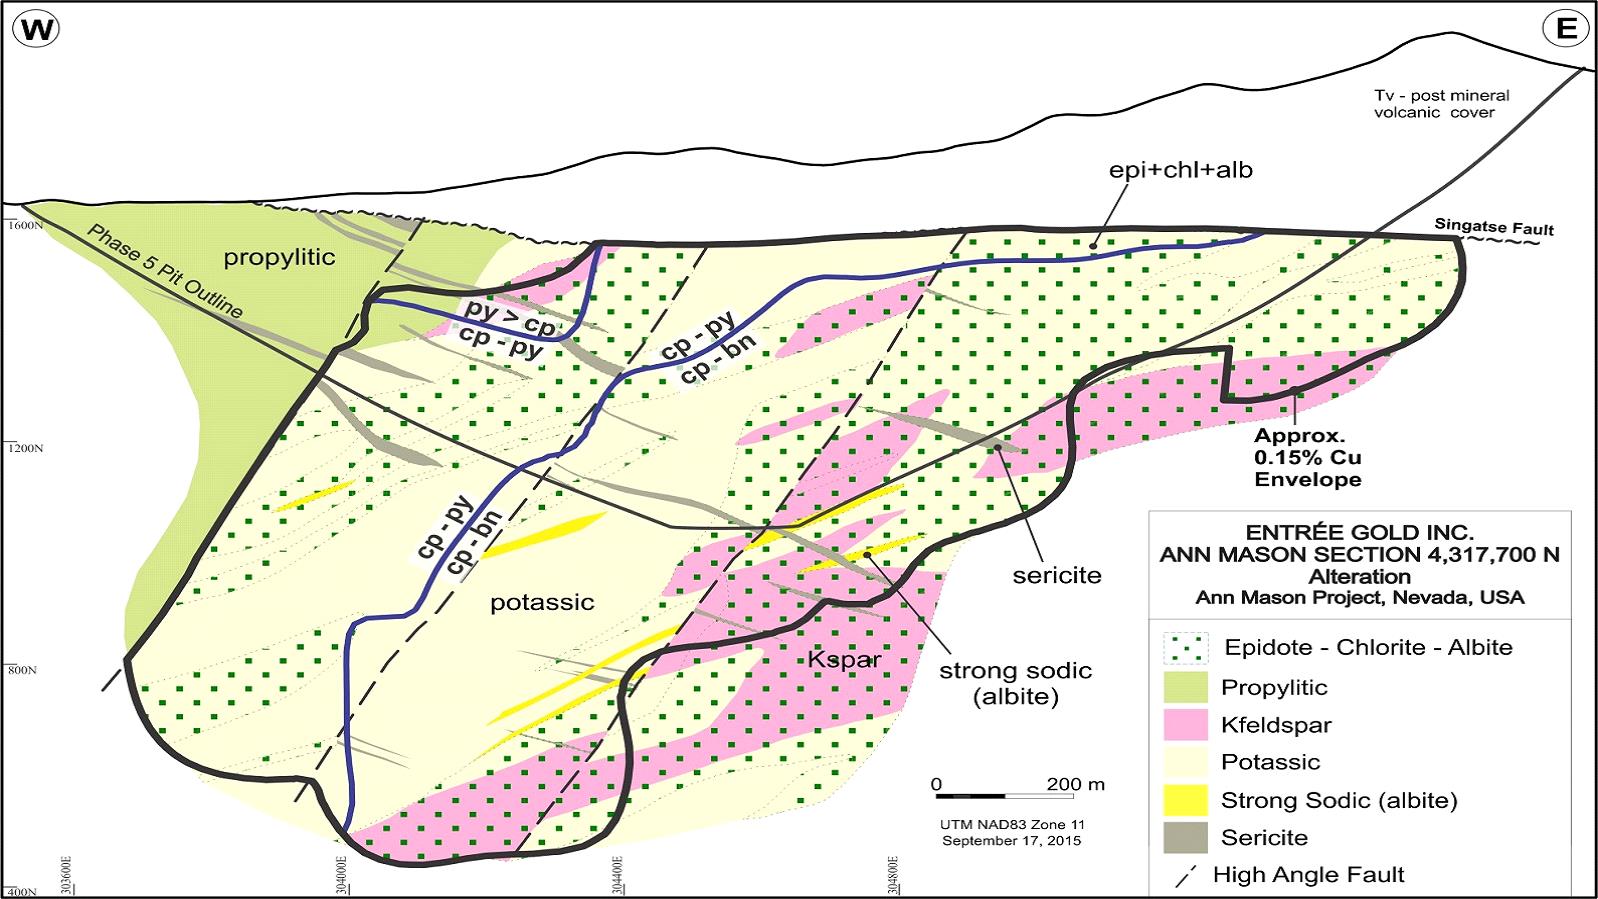
| | |
| 10/03/2017 |
Page 7 - 17
2017 Updated Preliminary Economic Assessment on the Ann Mason Project
Nevada, U.S.A.
| 7.4 | Blue Hill Deposit |
Similar to the setting at Ann Mason, post-mineral volcanic rocks of Tertiary age are present in the hanging wall of the low-angle, southeast-dipping Blue Hill Fault.
Quartz monzonite (Jqm) and quartz monzonite porphyry dykes (Jqmp-b) in the footwall of the Blue Hill fault comprise the main lithologies of the Yerington batholith at Blue Hill. Lesser amounts of quartz monzonite porphyry (Jpqm) have been mapped in outcrop (Proffett and Dilles, 1984) and occur in the subsurface. Although similar to the quartz monzonite porphyry present at Ann Mason, there is insufficient data to determine if the Blue Hill portion is part of the same Jpqm body or a separate intrusive. Higher copper-molybdenum grades in sulphide zones generally coincide with quartz monzonite porphyry dykes. Faulting, possibly structures that parallel the Blue Hill Fault, also control the distribution of mineralization. Sulphide mineralization occurs as pyrite, chalcopyrite, and molybdenite. Closely spaced, sheeted veins with chalcopyrite are common in zones of higher copper grades.
Alteration associated with sulphide mineralization includes broad areas of propylitic (chlorite and epidote) and more restricted potassic (secondary biotite > k-feldspar) assemblages, cut by zones of late albite and locally overprinted by chlorite±albite±epidote alteration.
The Blue Hill deposit consists of copper oxide and mixed oxide/sulphide mineralization and, to the southeast, an underlying and adjacent zone of copper-molybdenum sulphide mineralization that extends beneath the southeast-dipping Blue Hill Fault.
Copper oxide mineralization extends from surface to an average depth of 124 m and over an area of 900 m by 450 m, and continues over several hundred metres to the west in narrow intervals (Figure 10‑3 and Figure 10‑4). The copper minerals (black oxides, malachite, blue/green sulphates, and chrysocolla) occur with abundant iron oxides. Mixed oxide/sulphide mineralization with minor chalcocite is present below the oxide mineralization to maximum depths of 185 m. The copper oxide zone remains open to the northwest and southeast.
Copper sulphide mineralization, encountered at the bottom of several holes drilled to date, indicates the presence of underlying porphyry-style sulphide mineralization similar to that found in PacMag drill holes BH08001 and BH08003. Significant molybdenum mineralization was also intersected in drill holes EG-BH-10-005 and -009, and EG-BH-11-019.
RC intervals averaging >0.1% total copper (TCu) were analyzed for acid-soluble copper (SolCu). The average ratio of SolCu to TCu for intervals of oxide copper mineralization is 0.68.
| | |
| 10/03/2017 |
Page 7 - 18
2017 Updated Preliminary Economic Assessment on the Ann Mason Project
Nevada, U.S.A.
| 8 | Deposit Types |
| 8.1 | Porphyry Copper Deposits |
The following description of copper porphyries is taken from Panteleyev (1995).
Porphyry copper deposits commonly form in orogenic belts at convergent plate boundaries, linked to subduction-related magmatism. They can also form in association with the emplacement of high-level stocks during extensional tectonism, which is related to strike-slip faulting and back-arc spreading following continent margin accretion. Host rocks are typically intrusions, which range from coarse-grained phaneritic to porphyritic stocks, batholiths and dyke swarms. Intrusive rock compositions range from calc-alkaline quartz diorite to granodiorite and quartz monzonite. There are multiple intrusive phases that are successively emplaced, and a large variety of breccias are typically developed.
Stockworks of quartz veinlets, quartz veins, closely-spaced fractures and breccias containing pyrite and chalcopyrite with lesser molybdenite, bornite and magnetite occur in large zones of economically bulk-mineable mineralization in, or adjoining, porphyritic intrusions and related breccia bodies. The mineralization is spatially, temporally, and genetically associated with hydrothermal alteration of the hostrock intrusions and wallrocks. Zones where fracturing is most intensely developed can give rise to economic-grade vein stockworks, notably where there are coincident or intersecting multiple mineralized fracture sets. Disseminated sulphide minerals are present, generally in subordinate amounts. Typical minerals include pyrite, chalcopyrite, molybdenite, lesser bornite and rare (primary) chalcocite, with lesser tetrahedrite/tennantite, enargite and minor gold, electrum and arsenopyrite. Late-stage veins can contain galena and sphalerite in a gangue of quartz, calcite and barite.
Alteration commonly takes the form of different assemblages that are gradational and can overprint earlier phases. Potassic-altered zones (K-feldspar and biotite) commonly coincide with mineralization. This alteration can be flanked in volcanic host rocks by biotite-rich rocks that grade outward into propylitic rocks. The biotite is a fine-grained, secondary mineral that is commonly referred to as a "biotite hornfels." The early biotite and potassic assemblages can be partially to completely overprinted by later biotite and K-feldspar alteration, zoning outwards to quartz–sericite–pyrite (phyllic) alteration, then, less commonly, argillic zones, and rarely, in the uppermost parts of some deposits, kaolinite–pyrophyllite, or advanced argillic, alteration.
Porphyry copper deposits can be subdivided into three styles on the basis of copper, gold, and molybdenum metal content ratios. Typical tonnages and grades for the three styles are:
| | |
| 10/03/2017 |
Page 8 - 1
2017 Updated Preliminary Economic Assessment on the Ann Mason Project
Nevada, U.S.A.
| · | Porphyry Cu: averages 140 Mt at 0.54% Cu, <0.002% Mo, <0.02 g/t Au and <1 g/t Ag |
| · | Porphyry Cu–Au: averages 100 Mt at 0.5% Cu, <0.002% Mo, 0.38 g/t Au and 1 g/t Ag |
| · | Porphyry Cu–Mo: averages 500 Mt at 0.42% Cu, 0.016% Mo, 0.012 g/t Au and 1.2 g/t Ag. |
| 8.1.1 | Yerington District |
According to Dilles (1984), the age and chemical character of the plutonic and volcanic rocks in the Yerington district suggest they are part of a middle Jurassic "calc-alkaline" magmatic arc. The Ann Mason deposit has the characteristics of a subduction-related calcalkaline copper-molybdenum-gold porphyry deposit.
| 8.2 | Supergene Oxide Copper Deposits |
The following description of supergene oxidation is from Sillitoe, 2005. It is applicable to the oxide copper mineralization at Blue Hill.
Supergene leaching, oxidation and chalcocite enrichment in porphyry and related copper deposits takes place in the weathering environment to depths of several hundred meters. [...]
Sulphide oxidation takes place above the water table as an electrochemical process mediated by acidophyllic, Fe- and S-oxidizing bacteria. Where acidic conditions prevail, Cu is efficiently leached and transferred downward to the reduced environment. [...]
Several local and regional controls optimize supergene profile development. Orebodies should be vertically extensive and contain a well-developed array of steep faults and fractures, elevated pyrite/Cu-bearing sulphide ratios to maximize acidity of the supergene solutions, and nonreactive advanced argillic and sericitic alteration assemblages to minimize neutralization of the acidity. Porphyry Cu deposits pass through a natural supergene cycle in which leaching and mature enrichment in advanced argillic and sericitic zones give way during eventual exposure of deeper potassic zones to in situ oxidation without attendant enrichment. Mature oxidation and enrichment are promoted by the following: uninterrupted supergene activity for at least 0.5 m.y. but typically minima of 3 to 9 m.y.; tectonically or isostatically induced surface uplift responsible for depression of water tables and exposure of sulfides to oxidative weathering; and hot, semiarid to pluvial climates so long as erosion rates remain in balance with rather than outpacing supergene processes. [...]
| | |
| 10/03/2017 |
Page 8 - 2
2017 Updated Preliminary Economic Assessment on the Ann Mason Project
Nevada, U.S.A.
Leached cappings are traditionally subdivided on the basis of their dominant limonite component into hematitic above mature enrichment, goethitic above hypogene ore or protore where Cu leaching is limited, and jarositic above pyrite-rich mineralization. Major oxidized Cu orebodies are developed either in situ where pyrite contents and leaching are minimal or as exotic accumulations located lateral to enriched zones. Oxidized ore comprises Cu minerals and mineraloids of both green and black color, with the latter, such as Cu wad, Cu pitch, and neotocite, being poorly characterized and tending to typify low-grade rock volumes. Among the green Cu species, chrysocolla dominates most high-grade ores of both in situ and exotic origin, hydrated sulfates and hydroxysulfates typify oxidation of pyrite-bearing enriched zones, and prevalence of hydroxychlorides in northern Chile testifies to exceptionally arid supergene conditions. Enrichment, by factors of three or even more, generates chalcocite and other Cu-rich sulfides in proximity to the overlying water table but lower grade covellite mineralization at depth. Gold and Mo do not normally undergo significant enrichment. Oxidized and enriched zones undergo pervasive supergene argillic alteration, with kaolinite, accompanied under arid to semiarid conditions by alunite, dominating leached and enriched deposits; smectite is more common in zones of in situ sulphide oxidation. Dissolution of hypogene anhydrite typifies the supergene profiles of porphyry Cu deposits and extends deeper than all significant enrichment. Geologic context and mesoscopic textural criteria facilitate distinction between hypogene and supergene Cu sulfides, limonite, clay, and alunite. [...]
Supergene transformations of the upper parts of many Cu and related Au deposits are beneficial because the ores are either upgraded or can be more easily and cheaply processed, commonly using heap-leaching technology. Nevertheless, heap-leaching efficiency is highly dependent on the oxide and sulphide mineralogy.
| | |
| 10/03/2017 |
Page 8 - 3
2017 Updated Preliminary Economic Assessment on the Ann Mason Project
Nevada, U.S.A.
| 9 | Exploration |
| 9.1 | Introduction |
Entrée has been actively exploring the Ann Mason Project since early 2010, with a focus on upgrading and expanding the copper-molybdenum resources of the Ann Mason deposit and identifying resources at Blue Hill. Other exploration areas on the Project include Blackjack IP, Blackjack Oxide, Roulette, Minnesota and Shamrock (Figure 9‑1).
Exploration programs carried out on the Ann Mason Project since November 2009 are listed in Table 9-1 and summarized in this section, with the exception of drilling, which is described in Section 10. All programs were conducted by, or on behalf of, Entrée. Earlier work is described in Section 6.
| 9.2 | Topography, Coordinate System, and Satellite Imagery |
In May 2012, Pacific Geomatics Ltd. of Vancouver, BC, Canada, completed a satellite-based, high-detail, digital elevation model (DEM), and base map (1 m contour intervals), covering most of the current Project area. The high-resolution satellite imagery was sourced from GeoEye-1, producing a final full colour image with 50 cm resolution. The DEM provides topographic and digital elevation data for use in current and future engineering and environmental analysis.
All of Entrée's maps and surveying, including drill holes, use UTM coordinates in metres and a NAD83, UTM Zone 11N datum and coordinate system. Digital elevation and topographic contours provided by Pacific Geomatics Ltd and elevations for drill hole collar surveys have a vertical datum of NAVD88.
| | |
| 10/03/2017 |
Page 9 - 1
2017 Updated Preliminary Economic Assessment on the Ann Mason Project
Nevada, U.S.A.
Table 9-1: Summary of Work Completed on the Ann Mason Project since 2009
Year | Exploration | Description |
2016 | Mapping | · Geological mapping at Blue Hill and Ann Mason |
2015 | Drilling | · 4 holes totalling 2,061 m (EG-AM-15-079 to -082) and 1 RC precollar at Ann Mason (EG-AM-15-083) · 1 hole at Blue Hill (EG-BH-15-041, 558 m) |
Mapping | · Geological mapping at Blue Hill | |
Petrography | · 21 thin sections | |
2014 | Drilling | · 40 holes totalling 19,738 m (EG-AM-14-040 to -078; 12-031 deepened) at Ann Mason |
Mapping | · Geological mapping over Blackjack IP and west of Blue Hill | |
Petrography | · 114 thin sections | |
2013 | Drilling1 | · 7 holes totalling 3,333 m at Ann Mason (EG-AM-13-033 to -39) · 9 holes totalling 1,088 m (EG-BH-13-032 to -040) and 2 holes deepened (-10-003 and -11-027; 332 m) at Blue Hill |
Geophysics | · IP/Resistivity Survey | |
Mapping | · Geological mapping Blackjack IP | |
2012 | Drilling1 | · 5 holes totalling 5,355 m (EG-AM-12-026 to -030) and 2 RC precollars (-31 and -32, 264 m) at Ann Mason · 1 hole totalling 171 m (EG-R-10-005A) and 1 hole deepened 277.68 (-005) at Roulette · 1 hole deepened 723 m at Blue Hill (EG-BH-11-031) |
Geochemistry | · Rock and soil sampling program at Ann Mason/Blue Hill, and Blackjack Oxide · Re-assaying of 13,750 m of Anaconda core from 44 holes (6,142 samples) | |
Topography | · Digital Elevation Model and 1 m contour interval map covering the Project | |
Mapping | · Blackjack Oxide Target Mineralization | |
Petrography | · 29 polished thin sections from Ann Mason core samples | |
2011 | Drilling | · 22 holes totalling 23,943 m at Ann Mason (EG-AM-11-004 to -025) · 17 holes totalling 4,490 m at Blue Hill (EG-BH-11-015 to -031) |
Compilation | · Geological compilation of Anaconda data for Ann Mason and Blue Hill | |
Geophysics | · NSAMT Survey over Ann Mason: 9 lines covering 15.4 km | |
2010 | Drilling | · 3 holes totalling 3,585 m at Ann Mason deposit (EG-AM-10-001 to -003) · 19 holes totalling 4,314 m at Blue Hill (EG-B-10-003 to -007; EG-BH-10-001 to -014) · 6 holes totalling 1,860 m at Roulette EG-R-10-001 to -004, -004A, and -005) · 2 holes totalling 871 m at Blackjack IP Northeast (EG-B-10-001 and -002) |
Geophysics | · CRIP survey over Blackjack and Blackjack Northeast: 9 lines covering 43.5 km · NSAMT survey over Roulette: 1 line covering 3 km · IP Survey over Ann Mason and Blue Hill: 10 lines covering 52.2 km | |
Compilation | · Soil geochemistry compilation (PacMag and Telkwa Gold Data), Blue Hill area · IP/Resistivity and Magnetics compilation (Anaconda, Honey Badger), Project area | |
2009 | Geochemistry | · Soil Geochemistry and soil pH Survey over Roulette |
| Note: | 1Drill holes overlapping two calendar years are listed within the year started, along with their total lengths. |
| | |
| 10/03/2017 |
Page 9 - 2
2017 Updated Preliminary Economic Assessment on the Ann Mason Project
Nevada, U.S.A.
Figure 9‑1: Entrée Exploration Areas at the Ann Mason Project

| | |
| 10/03/2017 |
Page 9 - 3
2017 Updated Preliminary Economic Assessment on the Ann Mason Project
Nevada, U.S.A.
| 9.3 | Geology |
| 9.3.1 | Compilation Work, 2011 |
A compilation of Anaconda geological mapping and cross-sections over the Ann Mason deposit and Blue Hill exploration areas was completed in 2011.
| 9.3.2 | Blackjack Oxide Mapping, 2012 |
In August of 2012, mapping of the Blackjack Oxide target was carried out with the objectives of studying the details of the oxide mineralization, its relationship with lithology, alteration, and geophysical signatures. Seven initial targets were outlined based on the results of geologic mapping and sampling of surface outcrops, pits and trenches. It was determined that copper showings are localized, structurally controlled and hosted in variably albitized Jurassic Quartz Monzonite. Most of the copper oxide mineral seen on surface is likely brochantite. Two of the targets were deemed of interest for drilling for a potential copper mineralized system at depth, based on their alteration assemblages, mineralization and geophysics (Foster, 2012).
| 9.3.3 | Geological and Alteration Mapping, 2012-2016 |
In addition to the more focused approach of the above mapping, Entrée carried out lithology and alteration mapping at a scale of 1:3,000 over an irregular area of approximately 5,050 acres (2,044 ha) in 2012, 2013, 2014 and 2015. The area covered by this mapping extends from north of the Blackjack Oxide target to Blue Hill target and south of the Ann Mason deposit. In 2016 two areas within the above mapped area totaling approximately 590 acres (239 Ha) in Blackjack west of the Blue Hill Target and in an area west of the Ann Mason deposit were outcrop mapped for lithology, alteration, and structures in greater detail, and were analyzed with a handheld xrf at a scale of 1:2,000 and larger.
| 9.4 | Geochemistry |
| 9.4.1 | Rock Sampling |
In August and September of 2012, Entrée carried out a rock sampling program to the south of the Ann Mason deposit and within the Blackjack Oxide exploration areas. A total of 186 grab samples were collected to characterize mineralization and alteration. Seventy-four of these samples returned copper assays ranging from 1.08% to 13.73%.
| | |
| 10/03/2017 |
Page 9 - 4
2017 Updated Preliminary Economic Assessment on the Ann Mason Project
Nevada, U.S.A.
| 9.4.2 | Soil Geochemistry – Blue Hill and Ann Mason Compilation |
General
Three, partly overlapping conventional soil surveys were completed, one each by Honey Badger (Telkwa Gold) and PacMag between 2006 and 2010, and one by Entrée in 2012. The historical and current surveys comprise a total of 1,617 samples over an irregular area extending from south of the Ann Mason deposit to 3 km north of the Blue Hill deposit (Table 9-2 and Figure 9‑2).
Table 9-2: Summary of Ann Mason/Blue Hill Soil Surveys, Ann Mason Project
Operator | Date | No. Samples | Laboratory | Analytical Protocol |
Honey Badger (Telkwa) | 2006–2007 | 760 | ALS Chemex | Au-AA21 and multi-element ME-MS41 |
PacMag Metals | 2006/2008/2010 | 269 | ALS Chemex | Au-ST43 and multi-element ME-MS61 |
Entrée | 2012 | 619 | Skyline | Multi-element TE-3 |
Honey Badger carried out soil sampling programs in 2006 and 2007 over a 2.4 km2 area to the west and northwest of the Blue Hill deposit. In total, 760 samples were collected, mostly at 60 m x 60 m intervals, with some infill sampling. Samples were submitted to ALS in Reno for gold and multi-element analyses. Samples were collected with shovels from pits generally ranging from 0.3 m to 1 m deep. In most cases the survey targeted the soil immediately below a narrow zone of very fine, clayey, silty material, yet remaining above the underlying regolith or C horizon. Samples were screened to -10 mesh in the field and averaged about one kilogram in weight.
The PacMag Blue Hill soil sampling program was carried out in three stages. The first 19 orientation samples were collected in 2006 on a 200 m x 200 m grid, but the initial 200 m program was not completed until 2008, when an additional 79 samples were collected. Encouraging results from the southern part of the soil survey resulted in a more detailed 2010 follow-up survey with a 100 m grid spacing and collection of an additional 72 samples. All samples were submitted to ALS for Au-ST43 and copper and 47 additional elements by the ME-MS61 method (inductively coupled plasma/mass spectrometer (ICP/MS)).
On Ann Mason, PacMag conducted a reconnaissance soil sampling program in 2006 comprising 99 samples on a 200 m x 200 m grid to the south and west of the Ann Mason deposit. Entrée conducted a program of follow-up soil sampling in this area in 2012. PacMag samples were submitted to ALS in Reno, where gold was analyzed using the Au-ST43 method, and copper and 47 additional elements were analyzed by the ME-MS61 method (ICP/MS).
| | |
| 10/03/2017 |
Page 9 - 5
2017 Updated Preliminary Economic Assessment on the Ann Mason Project
Nevada, U.S.A.
Figure 9‑2: Soil Samples Location, Ann Mason – Blue Hill Area
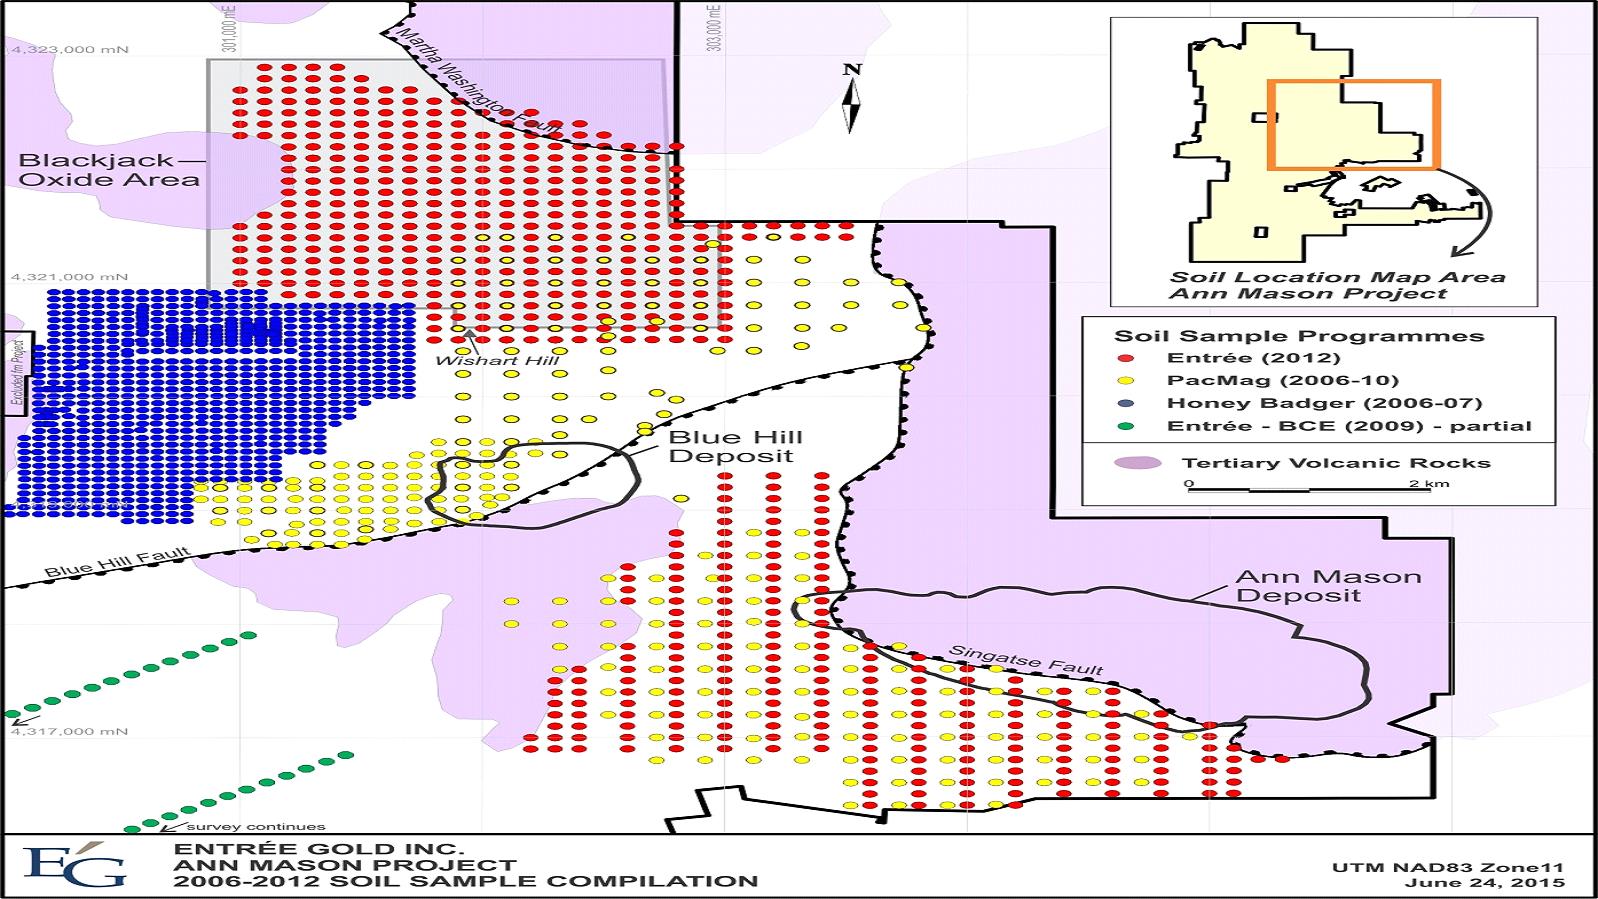
| | |
| 10/03/2017 |
Page 9 - 6
2017 Updated Preliminary Economic Assessment on the Ann Mason Project
Nevada, U.S.A.
PacMag sample sites were located in the field using a handheld Garmin GPS receiver, which is generally accurate to within three meters. Sampling was restricted to areas of soil developed over in situ Jurassic granitic bedrock. Grid sites that fell in areas of transported alluvium (Qal) or post-mineral Tertiary volcanic rockss were excluded or moved to the nearest Jurassic rock outcrop area. Samples were collected with a rock hammer from depths of 10 cm to 20 cm whenever possible, or from the bottom few centimetres of soil where bedrock depths were <10 cm. Soil material was sifted through a -10 mesh sieve in the field, and the +10 mesh fraction was discarded. Approximately 250 g of -10 mesh-sieved soil was retained in a 4.5" x 6" Hubco cloth soil sample bag for each sample. All efforts were made to avoid contamination, but a few samples contained a significant fraction of eolian sand, which was noted in the sample field notes (as were the dominant lithology and alteration of the bedrock and/or float).
The 2012 Entrée soil sampling was completed between July and September, and covered a number of copper oxide showings located 2 km to 3 km north of the Blue Hill deposit (Blackjack Oxide Target), and also to the south and west of the Ann Mason deposit, to fill in and expand the original 2006 PacMag survey (Figure 9‑2). A total of 397 samples were collected covering a combined area of 762 ha. Samples taken to the north were on a nominal 100 m x 100 m grid, while samples taken around the Ann Mason deposit were taken on a 100 m x 200 m grid.
Entrée soil sample sites were located in the field using a handheld Garmin GPS receiver. Sampling was restricted to areas of soil developed over in situ Jurassic granitic bedrock or thin alluvium (Qal). Grid sites falling on disturbed ground (trenches, prospect pits, and mine dumps), eolian sand, or stream beds were moved to adjacent undisturbed or residual soil. Grid sites that fell in areas of post-mineral Tertiary volcanic rocks were excluded. Sampling protocol was the same as that used by PacMag and described above. All samples were delivered to Skyline Assayers & Laboratories (Skyline) in Sparks, Nevada, for sample preparation by sieving to -80 mesh and analyses by Skyline's TE-3 49 element ICP/MS analytical package.
Soil Results
Contoured copper in soil results are shown in Figure 9‑3. Molybdenum results have not been presented but, except for being more subdued, largely mirror copper results. Results are discussed by area below.
Ann Mason Area
Entrée soil sampling, together with PacMag sampling, covers approximately 410 ha wrapping around the south and west sides of the Ann Mason deposit. Anomalous copper results to the south of the Ann Mason deposit generally wrap around or partly overlie the deposit. Strongest results (200 to 960 ppm Cu) are located where the deposit surfaces to the south of the Singatse Fault. Other anomalous areas located south of the northwest and southeast ends of the deposit are within the area of alteration related to Ann Mason and require follow-up surface investigation.
| | |
| 10/03/2017 |
Page 9 - 7
2017 Updated Preliminary Economic Assessment on the Ann Mason Project
Nevada, U.S.A.
Blue Hill Area
The Blue Hill deposit is well-defined by a 1.5 km-wide zone of anomalous copper values which overlie the deposit and extends for 750 m to the southwest. Sampling and associated results are truncated to the east by the Blue Hill Fault, which places mainly barren Tertiary volcanic rocks over mineralized Jurassic intrusive rocks. This broad zone of anomalous values extends northwest from the Blue Hill deposit for 2 km, and covers an area largely underlain by Jurassic quartz monzonite and porphyritic dykes. The northwest part of the copper anomaly has been partly tested by Entrée drill holes EG-B-10-003, -004, -006, and -007, in which mineralization was dominantly pyritic, although sporadic low-grade copper mineralization was intersected (i.e., 20 m of 0.20% Cu from 136 m in hole -004; Figure 10‑5).
Blackjack Oxide Area
Recent Entrée soil sampling over the Blackjack oxide area covers 352 ha to the north of Wishart Hill, and is located at the east end of the Blackjack IP anomaly. Sampling is limited on the north side and to the west by overlying barren Tertiary volcanic rocks, while most of the gridded area is underlain by variably altered locally copper-mineralized Jurassic quartz monzonite and porphyritic dykes.
Five zones of interest can be defined based on copper in soil results, old mine workings and copper mineralization/alteration exposed in numerous historical trenches. In general, the mainly oxide copper mineralization in the northern zones (I and II) appears to be related to east-west trending, albitized and sericitized shears. The southern zones (III/IV/V) are generally more related to pervasive alteration and disseminated sulphide and/or quartz-sulphide veining. All targets in this area warrant follow-up evaluation.
| 9.4.3 | Soil Geochemistry – Roulette |
On the Roulette property, a deep penetrating soil geochemistry and a soil pH survey was carried out from November 8 to 12, 2009 by Heberlein Geoconsulting (Heberlein, 2009). Soil samples were collected at 100 m intervals along two northeast-southwest lines for a total length of 7.2 km. Two additional samples were collected for soil pH measurements at each site. Based on soil pH and analytical (Cu, Mo, Au, and As) results, the report recommended further investigation over one feature (feature B) located in the northern area of the Roulette target. Drilling in this area subsequently encountered porphyry style copper mineralization (20.7 m of 0.14% Cu starting at 497.3 m) in hole EG-R-10-003 (Figure 10‑5).
| | |
| 10/03/2017 |
Page 9 - 8
2017 Updated Preliminary Economic Assessment on the Ann Mason Project
Nevada, U.S.A.
Figure 9‑3: Gridded Copper in Soils, Ann Mason – Blue Hill – Blackjack Oxide Area
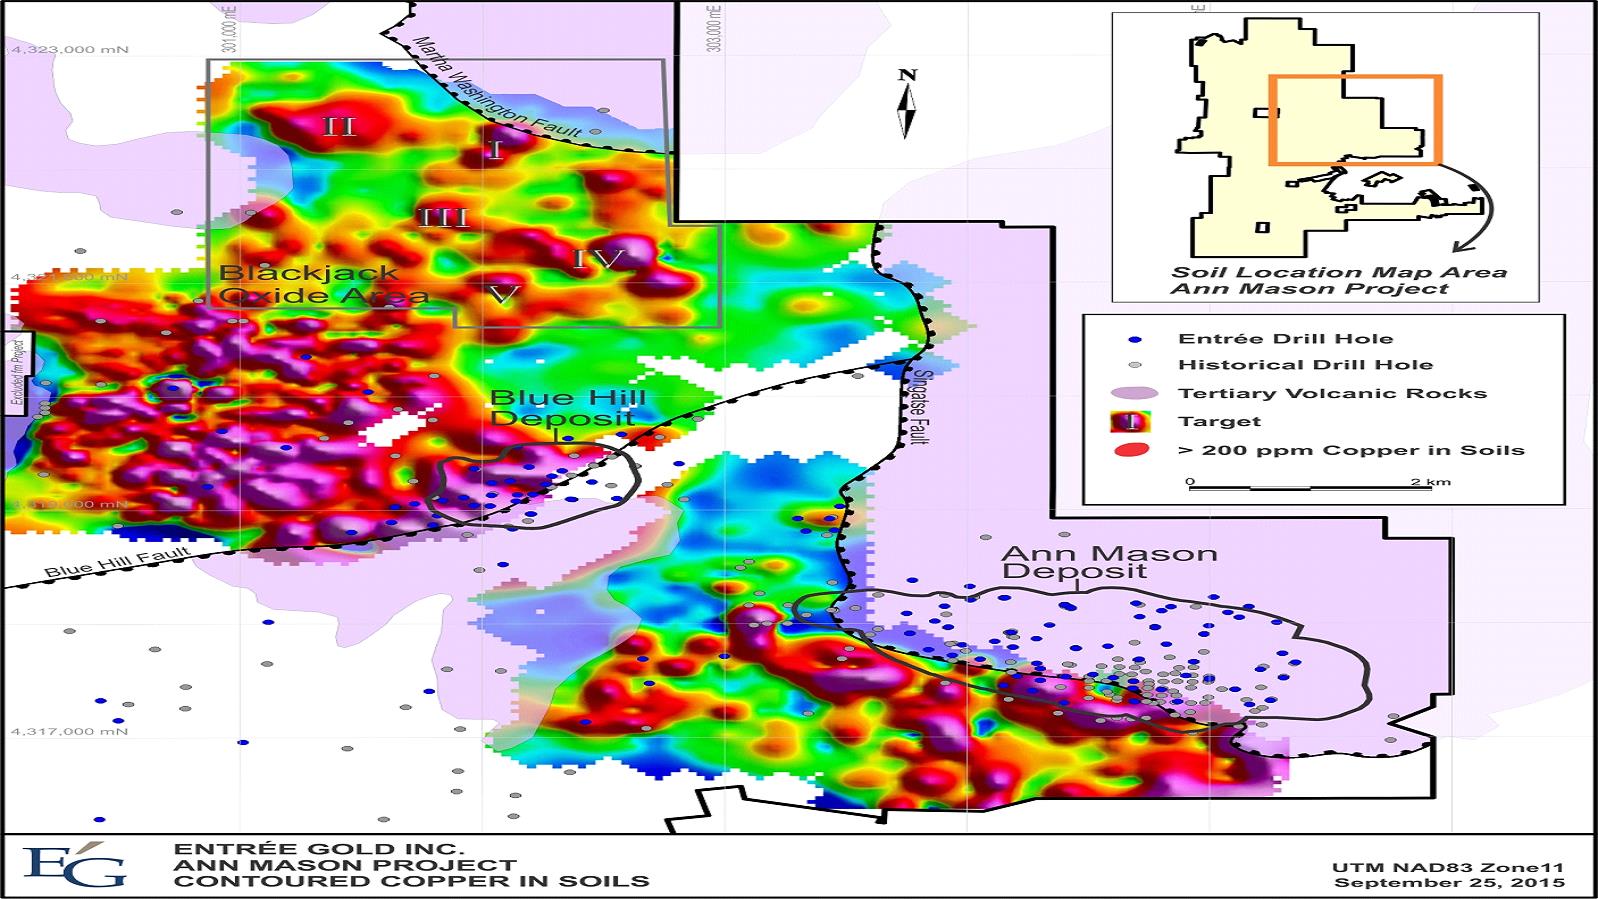
| | |
| 10/03/2017 |
Page 9 - 9
2017 Updated Preliminary Economic Assessment on the Ann Mason Project
Nevada, U.S.A.
| 9.5 | Geophysics |
Historical geophysical data, consisting of IP/Resistivity surveys acquired by Anaconda and Superior Oil and magnetic data acquired by Anaconda, show responses similar to recent, more detailed surveys conducted by Honey Badger and Entrée US. These surveys are described below.
| 9.5.1 | Airborne Geophysics |
A high-resolution magnetic and Time Domain Electromagnetic (TEM) airborne survey was conducted over the central area of the Project in March and April 2008 by Fugro on behalf of Honey Badger (Fugro, 2008). A total of 91 traverse lines were flown, ranging in length from 7 km to 12.9 km, with a spacing of 100 m between lines. Fourteen tie lines were flown with a spacing of 1 km between lines. The survey totalled approximately 1,063 line-km of data acquisition. Altitude averaged 120 m. The airborne geophysical data showed a pronounced magnetic low approximately 1.5 km northwest of the Blue Hill deposit, as well as a strong magnetic high in the centre of the Roulette property (Honey Badger, 2009). These anomalies were partially drill tested by Entrée.
Also on behalf of Honey Badger, Geotech Ltd. carried out a helicopter-borne geophysical survey in 2009, covering the central area of the Project. The survey used a Tri-Axis Electromagnetic (AirMt) system, and a cesium magnetometer. A total of 1,123 line-km were flown, generally at a 200 m line spacing (Geotech, 2009). The survey was flown at an average height of 152 m above ground. Two separate AirMt anomalies were identified by the survey. One is located at the northeast corner of the Project, occurs coincident with an IP anomaly at depth, and was subsequently drilled by Entrée with hole EG-B-10-001 and EG-B-10-002. Results are discussed in Section 10.2. The second anomaly, located at the southwest corner of the Roulette property, was deemed too deep to be tested by drilling without having additional supporting data (Honey Badger, 2009).
In 2009 and 2013, Entrée contracted with Carl Windels of Arvada, Colorado to digitize and model the results of the 875 km² portion of a 1966 Anaconda aeromagnetic survey that covers the Yerington mining district. The aeromagnetic survey was acquired and compiled on Anadonda's behalf by Aero Service Corporation and flown on a nominal ¼-mile (402 m) line spacing and at an altitude of 500 ft (152 m). The original survey area covered much of the Como, Wabuska, Weber Reservoir, Wellington, Yerington and Walker Lake USGS 15' Quadrangles, totalling approximately 2,640 km2. The 1966 survey provides complete aeromagnetic coverage of the Yerington district and Ann Mason Project area. Magnetic lows are present at Ann Mason, northwest of Blue Hill and in the vicinity of the northeast Blackjack IP anomaly. A strong magnetic high is present in the centre of the Roulette target area.
| |
| 10/03/2017 |
Page 9 - 10
2017 Updated Preliminary Economic Assessment on the Ann Mason Project
Nevada, U.S.A.
Figure 9‑4 shows the reduced-to-pole magnetic intensity obtained from the digitized 1966 Anaconda aeromagnetic survey.
Figure 9‑4: Ann Mason Project – Anaconda Aeromagnetic Data Reduced to the Pole (Windels, 2013)
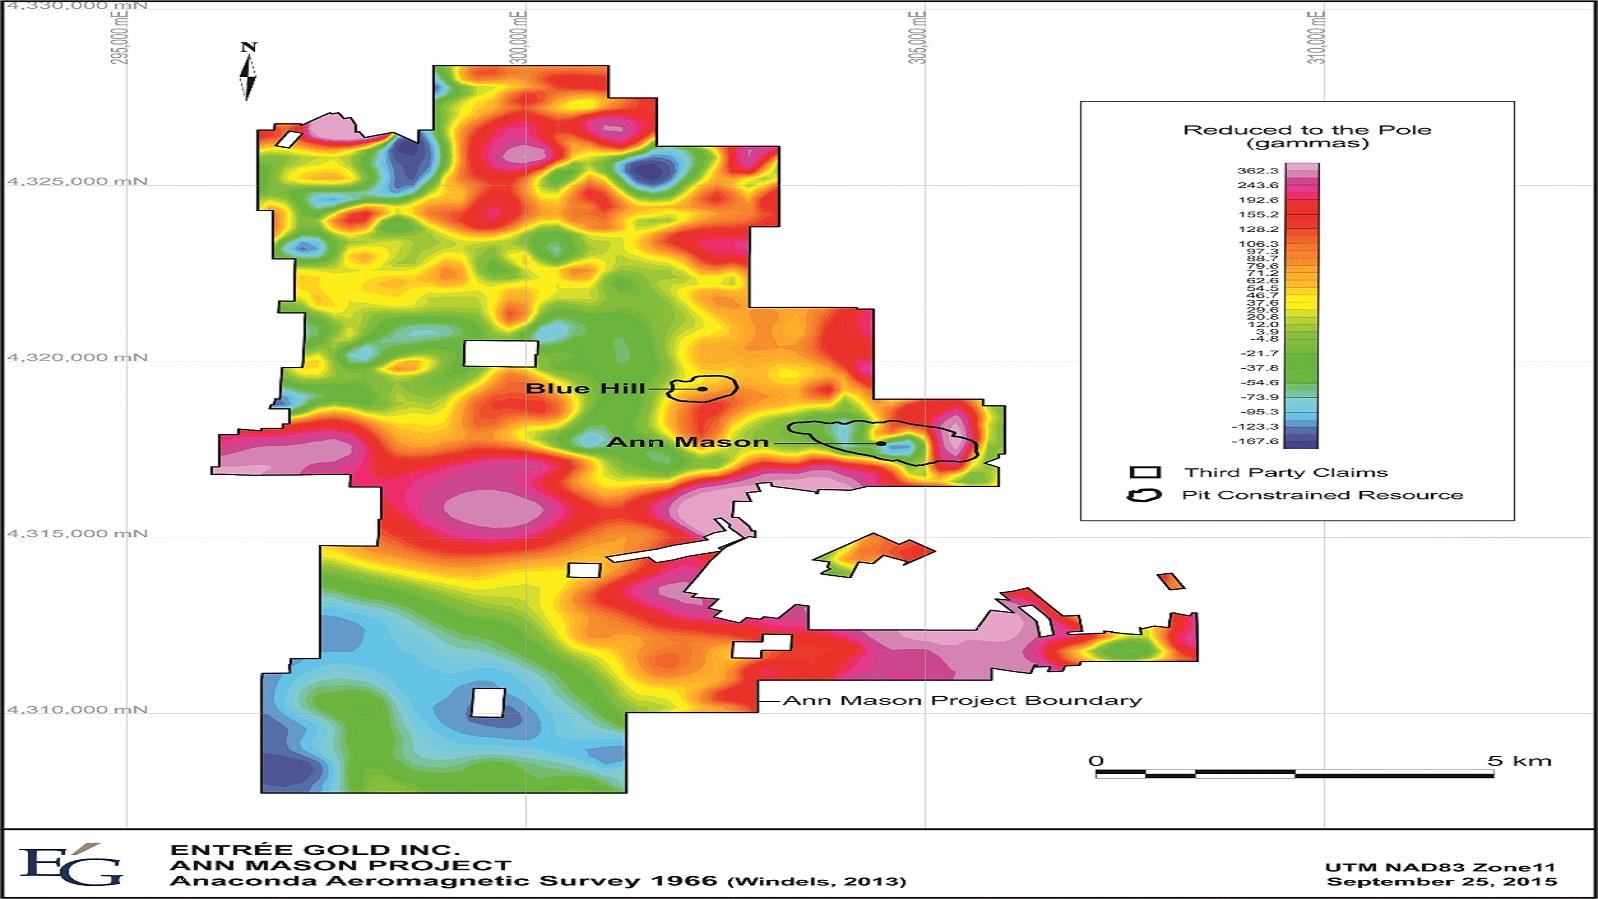
| | |
| 10/03/2017 |
Page 9 - 11
2017 Updated Preliminary Economic Assessment on the Ann Mason Project
Nevada, U.S.A.
| 9.5.2 | Ground Geophysics |
Five geophysical surveys were conducted for Entrée on the Ann Mason Project in 2010, 2011 and 2013: Complex Resistivity Induced Polarization (CRIP) and Natural Source Audio Magnetotelluric (NSAMT) surveys were conducted over the west portion of the project in April 2010 (formerly the Blackjack project and portions of the Roulette property); a dipole-dipole IP survey was conducted over the Ann Mason/Blue Hill areas in July and August 2010; an NSAMT survey was conducted over the Ann Mason deposit area in January 2011; and an infill dipole-dipole IP survey was conducted in 2013 to extend coverage west of Blue Hill and provide continuity between previous surveys. The surveys were contracted to Zonge Engineering and Research Organization (Zonge). The objective of the surveys was to locate and identify zones of enhanced chargeability or resistivity that may be associated with metallic mineralization.
Figure 9‑5 shows the chargeability results at 600 m depth from the compilation of the three surveys described above: the 2010 Blackjack CRIP survey (in blue on map), the 2010 Ann Mason/Blue Hill survey (in red) and the 2013 infill survey (in black).
CRIP and NSAMT Surveys (2010)
Between April 5 and 19, 2010, Zonge conducted a dipole-dipole CRIP survey and an NSAMT geophysical investigation on the west portion of the Project (Zonge, 2010a). Dipole-dipole CRIP data were acquired along nine lines oriented N-S (Lines 2 through 10) for a total coverage of 43.5 line-km at 154 stations. NSAMT data were acquired along one line (Line 1) for a total of 3 line-km at 31 stations. Line 1 is oriented southwest-northeast, starting at UTM point 297363mE/4313563mN and ending at UTM point 299557mE/4315609mN.
Line 1 NSAMT results were unable to map resistive or conductive zones potentially related to porphyry mineralization or alteration at depth, due to very high conductivity values at surface, possibly caused by saline groundwater in Quaternary alluvium. In addition, the NSAMT data was not able to substantiate possible uplift on the northeast side of a northwest-trending structure located near the southwest corner of the Roulette block. The structure, interpreted from the Honey Badger AirMT survey, could have placed potential porphyry targets at shallower depths than was interpreted from drill thicknesses of Quaternary alluvium.
At Blue Hill, chargeability responses are interpreted to be primarily caused by pyrite mineralization located adjacent to oxide and sulphide copper mineralization.
| | |
| 10/03/2017 |
Page 9 - 12
2017 Updated Preliminary Economic Assessment on the Ann Mason Project
Nevada, U.S.A.
Figure 9‑5: Ann Mason Project Chargeability at 600 m Depth

| | |
| 10/03/2017 |
Page 9 - 13
2017 Updated Preliminary Economic Assessment on the Ann Mason Project
Nevada, U.S.A.
The CRIP survey also defined an east-west, 5.4 km-long IP anomaly located in the northern portion of the Ann Mason Project area. The main body of the anomaly, observed on lines 2 through 9, is interpreted as a possible separate porphyry system. Georeferenced plots of inverted IP sections, in conjunction with geologic cross-sections, indicate that the main body of the IP target occurs in volcanic and sedimentary wall rocks to the west of the Yerington batholith and beneath Quaternary alluvium and Tertiary volcanic rocks.
IP Survey (2010)
Between July 29 and August 19, 2010, Zonge conducted a dipole-dipole Induced Polarization (IP) survey over the Ann Mason and Blue Hill areas (Zonge, 2010b). Data were acquired along ten lines (lines 11 through 20) for a total coverage of 52.2 line-km, with 184 stations at 300 m intervals. Lines 11 and 14 overlapped and extended line 9 and line 10 (respectively) of the previous survey. Details of this survey were described in Morrison and Cann (2011).
Chargeability responses observed on lines over the Ann Mason deposit and extending westward towards Blue Hill are coincident with a combination of copper sulphides in the central and eastern portions of the Ann Mason deposit, and pyrite, pyrite-chalcopyrite, and chalcopyrite-pyrite domains to the west. Between Ann Mason and Blue Hill, chargeability responses in the Ann Mason fault block obscure possible responses that might be located in the underlying Blue Hill Fault block.
NSAMT Survey (2011)
Between January 20 and 29, 2011, Zonge conducted a NSAMT geophysical survey over the Ann Mason deposit area of the Project to add to the previous survey of July and August 2010 (Zonge, 2011). Data were acquired along 9 lines covering 15.4 km. The survey repeated selected portions of lines 14, 15, 16, 17, 18, and 19 of the prior survey, and added segments 16.5, 17.5, and 18.5.
The NSAMT survey was conducted in an attempt to better define conductive zones observed in the Ann Mason IP/Resistivity survey that have an apparent spatial association with the Ann Mason copper resource. The distribution of copper mineralization at Ann Mason does not appear to coincide directly with conductive zones mapped by the NSAMT data. A general association between the overall distribution of copper mineralization at Ann Mason and the relatively conductive zones detected by the IP/Resistivity survey may still exist.
Infill IP Survey (2013)
From May 29 through June 6, 2013, Zonge conducted an IP and resistivity survey on the Ann Mason Project, extending four lines of the IP data that were acquired in 2010 (Lines 7, 8, 12 and 13) and adding a new line (Line 21) to the existing coverage (Zonge, 2013). Data were acquired using the same parameters as the previous surveys, using the dipole-dipole array and a station spacing of 300 m. Readings were made in increments of one n-spacing from n=1 to n=6 on all lines, and to n=11 where geometrically possible. All data were acquired with Zonge model GDP-32II receivers. The 2013 lines covered 31.2 km, portions of which repeated some of the 2010 stations.
| | |
| 10/03/2017 |
Page 9 - 14
2017 Updated Preliminary Economic Assessment on the Ann Mason Project
Nevada, U.S.A.
Infill Line 21 and the northern extensions of Lines 12 and 13 better defined the Blue Hill portion of the Ann Mason-Blue Hill chargeability anomaly and the northeastern portion of the Blackjack chargeability anomaly. Lines 7 and 8 extend the Ann Mason-Blue Hill chargeability anomaly to the west where it becomes wider and increases in amplitude relative to the response over the Blue Hill resource. This confirms the presence of a strong, north-northeast trending anomaly first defined by Anaconda in 1970. The 6-km long Ann Mason-Blue Hill chargeability anomaly remains open to the west.
| 9.6 | Petrographic Work |
A petrographic study by L.T. Larson was completed on twenty-nine polished thin sections from selected Ann Mason core samples in January 2012 (Larson, 2012). The petrographic report provides information on rock types, alteration, and mineralization present within the deposit. Key findings are included in Sections 7.3 and 7.4. Entrée geologists re-examined the twenty-nine thin sections from the Larson 2012 study and completed petrographic descriptions of 135 additional thin sections in 2014 and 2015. The primary focus of the additional petrographic work has been to develop a better understanding of the main alteration assemblages observed at Ann Mason and Blue Hill. Alteration assemblages for the Ann Mason deposit have been interpreted on cross-sections and level plans.
| 9.7 | Drilling |
Entrée completed 137 drill holes totalling 72,963 m on the Ann Mason Project from June 2, 2010 to April 20, 2015.
Most of the drilling was carried out on the Ann Mason deposit, and was designed to increase tonnage and confidence in the Mineral Resources by step-out and infill drilling. A total of 82 drill holes totalling 58,279 m were completed at the Ann Mason deposit and adjacent areas.
At the Blue Hill deposit and periphery, 31 RC and 15 diamond drill holes totalling 11,505 m were completed. The drilling programs at Blue Hill were designed to test for shallow copper oxide and deeper sulphide mineralization, to define resources and to test for possible extensions of the known mineralization.
Seven holes (two RC pre-collar, three diamond with RC pre-collars, and two diamond daughter holes) were drilled on the Roulette target in 2010 and 2012 for a total length of 2,308 m. The holes were sited based on a strong aeromagnetic high revealed in Honey Badger's 2009 geophysical survey and the results of the soil geochemical and soil pH survey described in Section 9.4.3.
Finally, on the Blackjack IP (Northeast) target, two holes (one diamond with RC pre-collar, and one RC pre-collar) totalling 871 m were drilled in 2010 to test the AirMt target interpreted in Honey Badger's 2009 airborne survey, which is coincident with the 2010 Blackjack IP (Northeast) anomaly
Drilling programs and results are described in Section 10.
| | |
| 10/03/2017 |
Page 9 - 15
2017 Updated Preliminary Economic Assessment on the Ann Mason Project
Nevada, U.S.A.
10 | DRILLING |
Anaconda, who explored the area from the 1950s through 1981, first drilled the Ann Mason Project in the early 1960s. Anaconda's drilling focused on the Ann Mason deposit, but also included other areas encompassing the Blue Hill deposit and the current Roulette and Blackjack IP/oxide exploration areas. In the 1990s and 2000s, several other companies carried out drilling programs at both deposits and other targets within the Project (Figure 6‑1).
All available data from the historical drilling has been incorporated into Entrée's database and used in the geological interpretation of the Ann Mason and Blue Hill deposits. Table 10-1 shows the drill information as entered in Entrée's database. The 'areas' used in the database are broad, to include exploration holes by Anaconda in proximity to deposits and targets.
Table 10-1: Ann Mason Project Drilling Summary
Area | Company | Years | No. of Drill Holes | Length (m) |
Ann Mason | Anaconda | 1960-1981 | 112 | 42,603 |
MIM | 2002 | 5 | 925 | |
PacMag | 2006-2008 | 11 | 6,754 | |
Entrée | 2010-2015 | 82 | 58,279 | |
Blue Hill | Anaconda | 1970 | 18 | 3,925 |
Phelps Dodge | 1995 | 3 | 599 | |
PacMag | 2007-2008 | 9 | 3,438 | |
Entrée | 2010-2015 | 46 | 11,505 | |
Blackjack IP/ oxide | Anaconda | N/A | 12 | 943 |
Lincoln Gold | 2005 | 9 | 1,568 | |
Entrée (Blackjack IP) | 2010 | 2 | 871 | |
Roulette | Anaconda | 1974-1977 | 26 | 4,751 |
Entrée | 2010/2012 | 7 | 2,308 | |
Minnesota | PacMag | 2008 | 3 | 561 |
Shamrock | PacMag | 2009 | 12 | 1,660 |
Ann Mason Project Total | 357 | 140,691 | ||
| Note: | Some of the Anaconda drill holes included in the number of holes are located only (no data available). Total does not agree due to rounding. |
All Entrée drill holes are prefixed with "EG" and then "AM" for Ann Mason, "BH" for Blue Hill, "R" for Roulette, or "B" for Blackjack (within the former Blackjack project), followed by the year commenced (2 digits), followed by a sequential hole number. Seven Blackjack holes ("B"-prefixed) have been reallocated to the Blue Hill periphery and the Blackjack IP (Northeast) exploration areas.
| | |
| 10/03/2017 |
Page 10 - 1
2017 Updated Preliminary Economic Assessment on the Ann Mason Project
Nevada, U.S.A.
Historical Anaconda drilling is prefixed with a "D," followed by a three digit hole number, or "ANN," followed by a one digit hole number, and PacMag drilling is prefixed with "BH" for Blue Hill or "Ann" for Ann Mason, followed by the year (2 digits), followed by a three digit hole number. The 2002 MIM drilling is labelled AM0201 to AM0205. Phelps Dodge Holes are labelled "WH."
A total of 198 drill holes were used to complete the model and estimate at Ann Mason, including 120 historical holes from Anaconda, PacMag and MIM, and 78 holes completed by Entrée. At Blue Hill, 50 drill holes were used to complete the model and estimate grade, including 20 historical drill holes from Anaconda and PacMag and 30 drill holes completed by Entrée.
| 10.1 | Previous Operator Drilling Methods |
Previous operators completed 220 drill holes totalling 67,728 m on the Ann Mason Project prior to 2010. Documentation supporting drill equipment, hole size, collar and down-hole survey methods and core recovery for this period is not available. Inspection of drill logs and archived samples show that drill programs were carried out using rotary, diamond, or a combination of both types of drilling. Core diameters varied with drill programs and were generally NQ or BQ. Rotary hole diameters for these drill programs were not recorded. Collar coordinates were likely surveyed by theodolite. Most holes have multiple down hole surveys with varying azimuth and dip. Downhole survey methods and instruments are not reported. Inspection of available archived core indicates reasonably good core recovery.
| 10.2 | Entrée Drilling Methods |
Entrée completed 137 drill holes totalling approximately 72,963 m on the Ann Mason Project from June 2, 2010, to April 20, 2015. Drilling programs were carried out on the Ann Mason deposit and periphery, the Blue Hill deposit and periphery, Roulette, and Blackjack IP (Northeast) exploration areas using RC, diamond, or a combination of both types of drilling (Table 10-2). All targets were explored for porphyry copper mineralization.
Reverse circulation drilling was contracted to Diversified Drilling LLC of Missoula, Montana, using a DLD1200 track-mounted rig, and Boart Longyear Company of Salt Lake City, Utah, using a D40K truck-mounted rig or Foremost Explorer 1500 buggy-mounted rig. The hole diameters for pre-collars and shallow exploration holes were 15.8 cm or 16.5 cm.
| | |
| 10/03/2017 |
Page 10 - 2
2017 Updated Preliminary Economic Assessment on the Ann Mason Project
Nevada, U.S.A.
Table 10-2: Entrée Drilling Summary: 2010 to 2015
Exploration Area | No. of Holes | Length (m) | Hole Type | |
Ann Mason | deposit | 77 | 56,163 | 76 diamond, including 63 with RC pre-collar; 1 RC hole |
periphery | 5 | 2,117 | 3 diamond with RC pre-collar; 2 RC | |
Blue Hill | deposit | 34 | 7,701 | 8 diamond, including 3 with RC pre-collar; 26 RC |
periphery | 12 | 3,804 | 7 diamond; 5 RC | |
Blackjack IP (Northeast) | 2 | 871 | 1 diamond with RC pre-collar; 1 RC pre-collar, | |
Roulette | 7 | 2,308 | 3 diamond with RC pre-collar; 2 diamond daughter holes; 2 RC pre-collar | |
Total | 137 | 72,963 | ||
Diamond drilling was contracted to Ruen Drilling Incorporated of Clark Fork, Idaho who used DE710 and DMW100 track-mounted rigs, a truck-mounted LF-230 drill or LF-230 track-mounted rigs, to Boart Longyear Company of Elko, Nevada who used an LS244 truck-mounted rig and a LS-240 track-mounted rig, and to Tonatec Drilling of Salt Lake City, Utah using a CS 4002 truck-mounted rig. All holes recovered HQ size (6.35 cm) core, and 3 holes (EG-AM-11-009, EG-BH-11-021, and EG-R-10-004A) were reduced to NQ (4.76 cm) core at depth. Hole EG-R-10-005A recovered only NQ size core. Hole EG-AM-15-079 was drilled with PQ size (8.5 cm) core to provide material suitable for drop-weight and grindability testing conducted as part of the 2015 metallurgical program.
At the Ann Mason deposit, 63 of the 76 diamond holes were pre-collared with RC drilling from surface to the approximate depth of the Singatse Fault, the upper limit of the deposit.
Collar and elevation data, except drill hole EG-R-10-005, were determined by differential GPS surveys performed by Mineral Exploration Services, Ltd. of Reno or Desert Engineering of Yerington, Nevada. Drill hole EG-R-10-005 was surveyed by hand-held GPS with elevation determined from published USGS 7.5' topographic mapping. All coordinates are NAD83 UTM Zone 11N and vertical datum of NAVD88 and reported in metres. Historical drill hole locations were converted to NAD83 UTM Zone 11N from the Anaconda Mine Grid. Entrée field-checked select locations using a hand-held GPS to confirm drill hole locations. PacMag drill holes were located using NAD27 UTM Zone 11N using differential GPS by Mineral Exploration Services, Ltd., and converted to NAD83, UTM Zone 11N.
Core was recovered with standard wireline equipment and conventional core barrels, with the exception of two Ann Mason drill holes: holes EG-AM-11-008 and -011 were partially drilled using a triple-tube core barrel for the purpose of obtaining core samples of Tertiary volcanic rocks suitable for geotechnical logging and to improve core recovery in portions of EG-AM-11-008.
| | |
| 10/03/2017 |
Page 10 - 3
2017 Updated Preliminary Economic Assessment on the Ann Mason Project
Nevada, U.S.A.
Core recovery at Ann Mason, Blue Hill, and Blackjack was generally good (90% or better), while recovery at Roulette was lower, averaging 80%. Core was commonly quite broken. RQD values for Ann Mason, Blackjack, and Roulette were often zero, and averaged 15%; RQD values for core recovered from the Blue Hill deposit and EG-BH-11-031 (periphery) were also often zero, and averaged 15%; RQD values for holes EG-B-10-003 to 007 (Blue Hill periphery) averaged 55%.
Downhole surveys at Ann Mason, Blue Hill, Blackjack, and Roulette were conducted using a Reflex EZ shot borehole instrument. Digital readings were collected at 300 ft (91 m) intervals.
Core from Entrée's 2010 through 2015 drilling is stored in locked and fenced areas adjoining the Company's office and core logging facility and nearby leased warehouses in Yerington, Nevada. Historical core from Ann Mason and Blue Hill is stored in two warehouse buildings leased by Entrée in Yerington, along with all rejects and pulps from Entrée's 2010 through 2015 drilling.
| 10.2.1 | Ann Mason Deposit and Periphery |
Entrée completed 82 drill holes totalling 58,279 m on the Ann Mason deposit (77 holes) and its periphery (5 holes) to date. Significant intercepts for this drilling are summarized in Table 10-3.
Ann Mason Deposit
Drilling at the Ann Mason deposit has concentrated on expanding and upgrading the Mineral Resources within the 0.15% Cu envelope, and defining zones of higher-grade mineralization. Resource estimates were released in March and October 2012 to include Inferred and Indicated Mineral Resources, the latter estimate forming the base of the 2012 PEA. In 2013, core drilling was designed to test for extensions of mineralization, primarily along the northeast and northwest margins of the deposit. In 2014, an infill drill program was designed to upgrade the Mineral Resources contained in the 2012 PEA Phase 5 pit from Indicated and Inferred to a mix of Measured and Indicated categories. The infill drill program commenced in August 2014 and was completed in late January 2015. It comprised 40 holes and a total of approximately 19,738 m combined RC pre-collars and core. Results have been incorporated in the drilling and assay database used as the basis for the current Ann Mason resource estimate and the 2017 PEA. The drilling is shown in plan view in Figure 10‑1 and on cross section 4,317,700 N in Figure 10‑2.
In 2015, one hole (EG-AM-15-079) was drilled in the central portion of the deposit, in close proximity to hole EG-AM-11-016, to provide samples for drop weight and grindability testing.
Entrée has expanded the known limits of mineralization both laterally and at depth. The deposit remains open to the north and to the west, and along several sections to the east and south. Known mineralization now covers an ellipsoidal west-northwest-trending area of 1.3 km x 2.8 km to a depth of over 1.2 km.
| | |
| 10/03/2017 |
Page 10 - 4
2017 Updated Preliminary Economic Assessment on the Ann Mason Project
Nevada, U.S.A.
A detailed description of the mineralization of the Ann Mason deposit is provided in Section 7.3.3.
Ann Mason Periphery
In 2013, two shallow RC holes (EG-AM-13-038 and 039) were completed about 500 m and 900 m west of the Ann Mason deposit to test an oxide copper target. Narrow intervals of 0.16% to 0.20% oxide copper were intercepted. Minor amounts of chalcopyrite are present near the bottom of both holes.
A small exploration drilling program was carried out from January to April 2015 to the southwest of Ann Mason and to the south of Blue Hill. Holes EG-AM-15-080, -081 and 082, totalling 1,937 m of RC pre-collar and diamond drilling, tested for extensions of the Ann Mason deposit in both the hanging wall and footwall of the Blue Hill Fault. Hole EG-AM-15-083 was pre-collared to a depth of 201 m but not deepened with core. EG-AM-15-080 intersected 3.05 m of 0.15% Cu (oxide) at a depth of 38.1 m, 24 m of 0.22% Cu and 0.053 g/t Au (sulphide) at 546 m and 2 m of 0.68% Cu, 0.9 g/t Ag and 1.67 g/t Au at 636 m. EG-AM-15-081 intersected 9.5 m of 0.31% Cu (chalcocite), 0.334 g/t Ag and 0.029 g/t Au at a depth of 24.38 m.
Exploration holes in periphery of the Ann Mason deposit are shown on Figure 10‑5.
| | |
| 10/03/2017 |
Page 10 - 5
Table 10-3: Ann Mason Deposit and Periphery – Significant Drill Intercepts
Hole Number | From (m) | To (m) | Length (m) | Cu (%) | Au (g/t) | Ag (g/t) | Mo (%) |
EG-AM-10-001 | 214.0 | 1201.8 | 987.8 | 0.31 | 0.04 | 0.76 | 0.010 |
including | 472.0 | 812.0 | 340.0 | 0.40 | 0.06 | 1.10 | 0.016 |
including | 608.0 | 646.0 | 38.0 | 0.60 | 0.12 | 2.09 | 0.018 |
EG-AM-10-002 | 86.0 | 670.0 | 584.0 | 0.34 | 0.03 | 0.79 | 0.006 |
EG-AM-10-003 | 436.0 | 1078.0 | 642.0 | 0.35 | 0.03 | 0.65 | 0.012 |
including | 714.0 | 838.0 | 124.0 | 0.58 | 0.06 | 1.32 | 0.021 |
EG-AM-10-004 | 62.0 | 780.0 | 718.0 | 0.31 | 0.03 | 0.64 | 0.012 |
including | 492.0 | 570.0 | 78.0 | 0.37 | 0.07 | 1.23 | 0.021 |
EG-AM-11-005 | 138.8 | 496.0 | 357.2 | 0.39 | 0.05 | 1.01 | 0.004 |
including | 318.0 | 450.0 | 132.0 | 0.52 | 0.09 | 1.66 | 0.002 |
EG-AM-11-007 | 552.0 | 1072.0 | 520.0 | 0.37 | 0.02 | 0.55 | 0.009 |
including | 818.0 | 882.0 | 64.0 | 0.55 | 0.04 | 0.99 | 0.016 |
EG-AM-11-008 | 240.0 | 688.0 | 448.0 | 0.39 | 0.05 | 0.80 | 0.003 |
722.0 | 788.0 | 66.0 | 0.29 | 0.06 | 0.91 | 0.004 | |
830.0 | 858.0 | 28.0 | 0.53 | 0.12 | 2.09 | 0.014 | |
EG-AM-11-009 | 66.0 | 768.0 | 702.0 | 0.41 | 0.03 | 0.96 | 0.011 |
including | 268.0 | 396.0 | 128.0 | 0.52 | 0.02 | 0.74 | 0.012 |
and | 554.0 | 768.0 | 214.0 | 0.48 | 0.07 | 1.92 | 0.017 |
| | |
| 10/03/2017 |
Page 10 - 6
2017 Updated Preliminary Economic Assessment on the Ann Mason Project
Nevada, U.S.A.
Hole Number | From (m) | To (m) | Length (m) | Cu (%) | Au (g/t) | Ag (g/t) | Mo (%) |
EG-AM-11-010 | 252.0 | 902.0 | 650.0 | 0.33 | 0.03 | 0.71 | 0.010 |
including | 702.0 | 902.0 | 200.0 | 0.40 | 0.05 | 1.21 | 0.012 |
EG-AM-11-011 | 166.0 | 980.0 | 814.0 | 0.28 | 0.02 | 0.51 | 0.012 |
including | 706.0 | 798.0 | 92.0 | 0.48 | 0.07 | 1.58 | 0.015 |
and | 956.0 | 980.0 | 24.0 | 0.48 | 0.10 | 1.58 | 0.021 |
EG-AM-11-012 | 658.0 | 1096.0 | 438.0 | 0.38 | 0.01 | 0.46 | 0.004 |
including | 696.0 | 910.0 | 214.0 | 0.47 | 0.01 | 0.58 | 0.005 |
EG-AM-11-013 | 80.0 | 764.0 | 684.0 | 0.34 | 0.04 | 0.88 | 0.016 |
including | 290.0 | 558.0 | 268.0 | 0.41 | 0.05 | 1.24 | 0.023 |
and | 680.0 | 764.0 | 84.0 | 0.40 | 0.09 | 1.69 | 0.012 |
EG-AM-11-014 | 203.0 | 1048.0 | 845.0 | 0.30 | 0.05 | 1.14 | 0.004 |
including | 570.0 | 784.0 | 214.0 | 0.40 | 0.07 | 2.24 | 0.005 |
and | 910.0 | 1010.0 | 100.0 | 0.37 | 0.07 | 1.31 | 0.011 |
EG-AM-11-015 including and and | 240.0 332.0 644.0 944.0 | 1138.0 488.0 720.0 1024.0 | 898.0 156.0 76.0 80.0 | 0.32 0.41 0.41 0.58 | 0.01 0.02 0.01 0.02 | 0.37 0.63 0.45 0.69 | 0.004 0.004 0.006 0.002 |
EG-AM-11-016 including and and | 12.0 204.0 530.0 682.0 | 1046.0 438.0 612.0 890.0 | 1034.0 234.0 82.0 208.0 | 0.29 0.39 0.37 0.34 | 0.02 0.02 0.02 0.04 | 0.45 0.40 0.27 0.76 | 0.009 0.005 0.016 0.014 |
EG-AM-11-017 including | 210.0 292.0 | 1073.0 618.0 | 863.0 326.0 | 0.25 0.35 | 0.02 0.02 | 0.38 0.42 | 0.008 0.009 |
EG-AM-11-018 including | 148.0 286.0 | 660.0 470.0 | 512.0 184.0 | 0.24 0.32 | 0.04 0.06 | 0.64 0.83 | 0.006 0.002 |
EG-AM-11-019 including | 692.0 696.0 | 1090.0 980.0 | 398.0 284.0 | 0.33 0.39 | 0.01 0.01 | 0.34 0.31 | 0.002 0.003 |
EG-AM-11-020 | 334.0 | 1093.0 | 759.0 | 0.45 | 0.02 | 0.35 | 0.007 |
EG-AM-11-021 | 192.0 | 1044.0 | 852.0 | 0.35 | 0.01 | 0.42 | 0.005 |
EG-AM-11-022 including | 90.0 90.0 | 818.0 638.0 | 728.0 548.0 | 0.31 0.35 | 0.04 0.04 | 0.73 0.78 | 0.008 0.008 |
EG-AM-11-023 including and | 132.0 314.0 736.0 | 1030.0 408.0 892.0 | 898.0 94.0 156.0 | 0.33 0.41 0.51 | 0.02 0.02 0.06 | 0.44 0.33 1.06 | 0.011 0.006 0.023 |
EG-AM-11-024 including | 244.0 244.0 | 1026.5 528.0 | 782.5 284.0 | 0.35 0.54 | 0.03 0.04 | 0.49 0.54 | 0.009 0.003 |
EG-AM-11-025 including | 326.0 614.0 750.0 | 484.0 1130.0 840.0 | 158.0 516.0 90.0 | 0.27 0.34 0.54 | 0.02 0.01 0.02 | 0.22 0.23 0.26 | 0.004 0.007 0.010 |
EG-AM-12-026 including and and | 314.0 542.0 660.0 804.0 | 1032.0 592.0 710.0 1020.0 | 718.0 50.0 50.0 216.0 | 0.37 0.56 0.48 0.48 | 0.01 0.02 0.01 0.01 | 0.41 0.70 0.35 0.46 | 0.006 0.013 0.007 0.009 |
EG-AM-12-027 including and | 484.0 548.0 696.0 | 1054.0 658.0 840.0 | 570.0 110.0 144.0 | 0.38 0.47 0.44 | 0.02 0.02 0.02 | 0.48 0.63 0.41 | 0.005 0.007 0.006 |
| | |
| 10/03/2017 |
Page 10 - 7
2017 Updated Preliminary Economic Assessment on the Ann Mason Project
Nevada, U.S.A.
Hole Number | From (m) | To (m) | Length (m) | Cu (%) | Au (g/t) | Ag (g/t) | Mo (%) |
EG-AM-12-028 including and | 308.0 308.0 902.0 | 1100.0 570.0 1022.0 | 792.0 262.0 120.0 | 0.23 0.28 0.33 | 0.03 0.02 0.05 | 0.50 0.32 1.00 | 0.016 0.009 0.033 |
EG-AM-12-029 including | 192.0 608.0 | 1072.0 780.0 | 880.0 172.0 | 0.24 0.36 | 0.02 0.03 | 0.28 0.51 | 0.002 0.001 |
EG-AM-12-030 | 256.0 | 1016.0 | 760.0 | 0.29 | 0.02 | 0.58 | 0.004 |
Including | 600.0 | 872.0 | 272.0 | 0.38 | 0.02 | 0.67 | 0.003 |
EG-AM-12-031* | 214.0 | 270.0 | 56.0 | 0.27 | 0.04 | 0.54 | 0.017 |
298.0 | 342.0 | 44.0 | 0.18 | 0.02 | 0.35 | 0.007 | |
406.0 | 462.1 | 56.1 | 0.17 | 0.03 | 0.57 | 0.015 | |
EG-AM-13-033 | 286.0 | 596.0 | 310.0 | 0.21 | 0.02 | 0.58 | 0.014 |
including | 430.0 | 596.0 | 166.0 | 0.24 | 0.02 | 0.66 | 0.011 |
EG-AM-13-034 | 412.0 | 586.0 | 174.0 | 0.16 | 0.01 | 0.34 | 0.003 |
including | 412.0 | 458.0 | 46.0 | 0.27 | 0.01 | 0.70 | 0.002 |
EG-AM-13-035 | 262.1 | 482.0 | 219.9 | 0.30 | 0.07 | 1.70 | 0.003 |
including | 358.0 | 458.0 | 100.0 | 0.43 | 0.11 | 2.75 | 0.003 |
EG-AM-13-036 | 396.0 | 432.0 | 36.0 | 0.13 | 0.01 | 0.28 | 0.005 |
680.0 | 686.0 | 6.0 | 0.25 | 0.01 | 0.23 | NS | |
EG-AM-13-038 | 22.9 | 29.0 | 6.1 | 0.16 | 0.01 | NS | NS |
EG-AM-14-040* including and and | 186.0 246.0 370.0 520.0 | 643.8 312.0 462.0 584.0 | 457.8 66.0 92.0 64.0 | 0.31 0.36 0.39 0.39 | 0.02 0.03 0.02 0.03 | 0.62 0.54 0.78 0.61 | 0.005 0.003 0.003 0.007 |
EG-AM-14-041 including and and and | 290.0 350.0 472.0 540.0 600.0 | 680.0 410.0 520.0 574.0 644.0 | 390.0 60.0 48.0 34.0 44.0 | 0.35 0.55 0.50 0.44 0.38 | 0.05 0.06 0.07 0.14 0.09 | 0.84 0.74 1.05 2.15 1.73 | 0.003 0.004 0.002 0.001 0.001 |
EG-AM-14-042* | 147.8 | 581.9 | 434.1 | 0.28 | 0.02 | 0.50 | 0.002 |
including | 198.0 | 266.0 | 68.0 | 0.46 | 0.05 | 0.83 | 0.001 |
EG-AM-14-043* | 210.3 | 242.0 | 31.7 | 0.33 | 0.01 | 0.38 | 0.002 |
including | 210.3 | 226.0 | 15.7 | 0.49 | 0.02 | 0.56 | 0.003 |
290.0 | 698.9 | 408.9 | 0.35 | 0.06 | 1.01 | 0.002 | |
including | 290.0 | 376.0 | 86.0 | 0.45 | 0.06 | 0.69 | 0.003 |
and | 490.0 | 656.0 | 166.0 | 0.37 | 0.08 | 1.46 | 0.002 |
and | 672.0 | 698.9 | 26.9 | 0.48 | 0.13 | 2.27 | 0.002 |
EG-AM-14-044 | 224.0 | 310.0 | 86.0 | 0.39 | 0.02 | 0.64 | 0.010 |
388.0 | 436.0 | 48.0 | 0.20 | 0.03 | 0.56 | 0.009 | |
488.0 | 516.0 | 28.0 | 0.20 | 0.01 | 0.34 | 0.018 | |
EG-AM-14-045 | 232.0 | 412.0 | 180.0 | 0.30 | 0.06 | 1.21 | 0.006 |
including | 350.0 | 396.0 | 46.0 | 0.58 | 0.15 | 2.77 | 0.007 |
EG-AM-14-046* | 271.3 | 383.6 | 112.3 | 0.34 | 0.05 | 1.21 | 0.011 |
including | 302.0 | 372.0 | 70.0 | 0.40 | 0.07 | 1.66 | 0.012 |
EG-AM-14-047 | 324.0 | 406.0 | 82.0 | 0.24 | 0.01 | 0.29 | 0.003 |
| | |
| 10/03/2017 |
Page 10 - 8
2017 Updated Preliminary Economic Assessment on the Ann Mason Project
Nevada, U.S.A.
Hole Number | From (m) | To (m) | Length (m) | Cu (%) | Au (g/t) | Ag (g/t) | Mo (%) |
EG-AM-14-048* | 306.0 | 517.3 | 211.3 | 0.34 | 0.02 | 0.46 | 0.007 |
including | 342.0 | 378.0 | 36.0 | 0.37 | 0.02 | 0.48 | 0.005 |
and | 402.0 | 432.0 | 30.0 | 0.41 | 0.02 | 0.49 | 0.014 |
and | 448.0 | 517.3 | 69.3 | 0.43 | 0.02 | 0.59 | 0.008 |
EG-AM-14-050 | 234.0 | 410.0 | 176.0 | 0.35 | 0.02 | 0.46 | 0.004 |
including | 276.0 | 330.0 | 54.0 | 0.42 | 0.01 | 0.44 | 0.004 |
and | 384.0 | 410.0 | 26.0 | 0.50 | 0.05 | 1.31 | 0.009 |
522.0 | 558.0 | 36.0 | 0.35 | 0.10 | 1.70 | 0.003 | |
EG-AM-14-051 | 286.0 | 300.0 | 14.0 | 0.20 | 0.01 | 0.29 | 0.001 |
314.0 | 324.0 | 10.0 | 0.22 | 0.01 | 0.22 | 0.018 | |
EG-AM-14-052* | 140.2 | 224.0 | 83.8 | 0.24 | 0.02 | 0.25 | 0.002 |
266.0 | 296.0 | 30.0 | 0.65 | 0.02 | 0.60 | 0.002 | |
364.0 | 499.9 | 135.9 | 0.40 | 0.02 | 0.36 | 0.005 | |
including | 416.0 | 494.0 | 78.0 | 0.51 | 0.03 | 0.43 | 0.006 |
EG-AM-14-053* | 174.0 | 204.0 | 30.0 | 0.19 | 0.02 | 0.34 | 0.005 |
234.0 | 274.9 | 40.9 | 0.22 | 0.02 | 0.40 | 0.002 | |
EG-AM-14-054* | 256.0 | 268.0 | 12.0 | 0.23 | 0.01 | 0.35 | 0.001 |
316.0 | 325.5 | 9.5 | 0.20 | 0.01 | 0.32 | 0.003 | |
EG-AM-14-055* | 286.0 | 439.1 | 153.1 | 0.22 | 0.04 | 0.92 | 0.005 |
Including | 330.0 | 384.0 | 54.0 | 0.27 | 0.06 | 1.41 | 0.007 |
EG-AM-14-056* | 204.1 | 451.7 | 247.6 | 0.32 | 0.06 | 1.38 | 0.004 |
Including | 322.0 | 451.7 | 129.7 | 0.44 | 0.10 | 2.31 | 0.003 |
EG-AM-14-057* | 197.5 | 524.9 | 327.4 | 0.38 | 0.08 | 1.48 | 0.003 |
Including | 197.5 | 240.0 | 42.5 | 0.49 | 0.03 | 0.68 | 0.007 |
And | 304.0 | 504.0 | 200.0 | 0.42 | 0.12 | 2.02 | 0.001 |
EG-AM-14-058 | 115.0 | 234.0 | 119.0 | 0.22 | 0.01 | 0.24 | 0.001 |
296.0 | 396.0 | 100.0 | 0.35 | 0.01 | 0.31 | 0.002 | |
including | 306.0 | 350.0 | 44.0 | 0.58 | 0.01 | 0.50 | 0.004 |
EG-AM-14-059* | 179.8 | 646.0 | 466.2 | 0.31 | 0.05 | 0.98 | 0.001 |
including | 181.4 | 244.0 | 62.6 | 0.39 | 0.04 | 0.57 | 0.002 |
and | 268.0 | 338.0 | 70.0 | 0.46 | 0.08 | 1.58 | 0.002 |
and | 354.0 | 412.0 | 58.0 | 0.50 | 0.10 | 1.79 | 0.001 |
and | 582.0 | 630.0 | 48.0 | 0.38 | 0.09 | 1.80 | 0.001 |
EG-AM-14-060 | 268.0 | 456.0 | 188.0 | 0.27 | 0.01 | 0.28 | 0.004 |
including | 340.0 | 420.0 | 80.0 | 0.34 | 0.01 | 0.35 | 0.004 |
EG-AM-14-061 | 272.0 | 360.0 | 88.0 | 0.20 | 0.01 | 0.19 | 0.008 |
386.0 | 422.0 | 36.0 | 0.29 | 0.01 | 0.27 | 0.005 | |
EG-AM-14-062* | 48.8 | 86.0 | 37.2 | 0.18 | 0.01 | 0.50 | 0.001 |
108.0 | 160.0 | 52.0 | 0.20 | 0.01 | 0.36 | 0.001 | |
214.0 | 280.0 | 66.0 | 0.28 | 0.01 | 0.17 | 0.002 | |
294.0 | 434.0 | 140.0 | 0.26 | 0.02 | 0.41 | 0.009 | |
including | 296.0 | 358.0 | 62.0 | 0.33 | 0.02 | 0.37 | 0.007 |
EG-AM-14-063* | 193.5 | 212.0 | 18.5 | 0.30 | 0.01 | 0.33 | 0.012 |
296.0 | 572.0 | 276.0 | 0.27 | 0.05 | 0.85 | 0.006 |
| |
| 10/03/2017 |
Page 10 - 9
2017 Updated Preliminary Economic Assessment on the Ann Mason Project
Nevada, U.S.A.
Hole Number | From (m) | To (m) | Length (m) | Cu (%) | Au (g/t) | Ag (g/t) | Mo (%) |
including | 358.0 | 394.0 | 36.0 | 0.35 | 0.07 | 1.08 | 0.002 |
and | 406.0 | 468.0 | 62.0 | 0.33 | 0.08 | 1.20 | 0.004 |
and | 540.0 | 568.0 | 28.0 | 0.33 | 0.07 | 1.24 | 0.009 |
EG-AM-14-064* | 207.3 | 464.0 | 256.7 | 0.19 | 0.03 | 0.53 | 0.003 |
including | 207.3 | 230.0 | 22.7 | 0.29 | 0.02 | 0.54 | 0.012 |
524.0 | 611.2 | 87.2 | 0.18 | 0.03 | 0.80 | 0.001 | |
EG-AM-14-065* | 221.0 | 884.9 | 663.9 | 0.29 | 0.04 | 0.75 | 0.004 |
including | 221.0 | 264.0 | 43.0 | 0.33 | 0.02 | 0.42 | 0.004 |
and | 298.0 | 380.0 | 82.0 | 0.38 | 0.03 | 0.82 | 0.002 |
and | 510.0 | 604.0 | 94.0 | 0.44 | 0.05 | 0.82 | 0.003 |
and | 674.0 | 824.0 | 150.0 | 0.38 | 0.09 | 1.54 | 0.007 |
EG-AM-14-066 | 142.0 | 210.0 | 68.0 | 0.21 | 0.02 | 0.30 | 0.013 |
258.0 | 280.0 | 22.0 | 0.42 | 0.06 | 1.51 | 0.015 | |
EG-AM-14-067* | 198.3 | 574.9 | 376.6 | 0.32 | 0.06 | 1.35 | 0.003 |
including | 198.3 | 268.0 | 69.7 | 0.37 | 0.03 | 0.59 | 0.005 |
and | 296.0 | 318.0 | 22.0 | 0.44 | 0.08 | 1.37 | 0.001 |
and | 368.0 | 442.0 | 74.0 | 0.43 | 0.11 | 2.58 | 0.001 |
and | 508.0 | 552.0 | 44.0 | 0.36 | 0.09 | 2.08 | 0.003 |
EG-AM-14-068* | 414.0 | 425.5 | 11.5 | 0.24 | 0.02 | 0.47 | 0.007 |
EG-AM-14-069* | 230.0 | 242.0 | 12.0 | 0.23 | 0.01 | 0.33 | 0.003 |
320.0 | 409.4 | 89.4 | 0.22 | 0.03 | 0.60 | 0.027 | |
EG-AM-14-070* | 202.7 | 559.3 | 356.6 | 0.22 | 0.03 | 0.65 | 0.010 |
including | 204.2 | 214.0 | 9.8 | 0.36 | 0.02 | 0.61 | 0.019 |
and | 302.0 | 328.0 | 26.0 | 0.26 | 0.03 | 0.53 | 0.032 |
and | 406.0 | 426.0 | 20.0 | 0.35 | 0.05 | 0.87 | 0.007 |
and | 468.0 | 559.3 | 91.3 | 0.32 | 0.06 | 1.48 | 0.007 |
EG-AM-14-071 | 272.0 | 500.0 | 228.0 | 0.24 | 0.04 | 0.81 | 0.007 |
including | 330.0 | 350.0 | 20.0 | 0.41 | 0.07 | 1.37 | 0.010 |
EG-AM-14-072 | 98.8 | 116.0 | 17.2 | 0.23 | 0.01 | 0.22 | 0.003 |
156.0 | 238.0 | 82.0 | 0.20 | 0.02 | 0.33 | 0.008 | |
296.0 | 430.0 | 134.0 | 0.22 | 0.02 | 0.40 | 0.015 | |
EG-AM-14-073* | 248.4 | 477.3 | 228.9 | 0.28 | 0.06 | 1.43 | 0.003 |
including | 288.0 | 390.0 | 102.0 | 0.36 | 0.08 | 1.90 | 0.003 |
and | 414.0 | 440.0 | 26.0 | 0.40 | 0.07 | 2.07 | 0.004 |
EG-AM-14-074 | 294.0 | 454.0 | 160.0 | 0.20 | 0.03 | 0.71 | 0.022 |
including | 400.0 | 442.0 | 42.0 | 0.25 | 0.04 | 1.03 | 0.033 |
EG-AM-14-075* | 296.0 | 344.0 | 48.0 | 0.15 | 0.02 | 0.46 | 0.013 |
EG-AM-14-076 | 302.0 | 492.0 | 190.0 | 0.34 | 0.02 | 0.49 | 0.003 |
556.0 | 736.0 | 180.0 | 0.38 | 0.06 | 1.09 | 0.002 | |
EG-AM-14-077* | 278.0 | 324.9 | 46.9 | 0.21 | 0.02 | 0.35 | 0.003 |
EG-AM-14-078* | 276.0 | 559.3 | 283.3 | 0.30 | 0.02 | 0.47 | 0.010 |
including | 346.0 | 402.0 | 56.0 | 0.37 | 0.01 | 0.56 | 0.012 |
and | 426.0 | 518.0 | 92.0 | 0.34 | 0.02 | 0.59 | 0.012 |
| Note: | Holes marked with "*" ended in mineralization. Hole EG-AM-12-031 was pre-collared in 2012 and completed in 2014. The intercept in EG-AM-13-038 is within oxide mineralization; all other intercepts are within sulphide mineralization. Non-significant results (NS) are defined as: less than 0.0005% Mo and less than 0.10 g/t Ag. Drill intersections are based on drilled core lengths and may not reflect the true width of mineralization. |
| | |
| 10/03/2017 |
Page 10 - 10
2017 Updated Preliminary Economic Assessment on the Ann Mason Project
Nevada, U.S.A.
Figure 10‑1: Ann Mason Deposit – Drill Plan
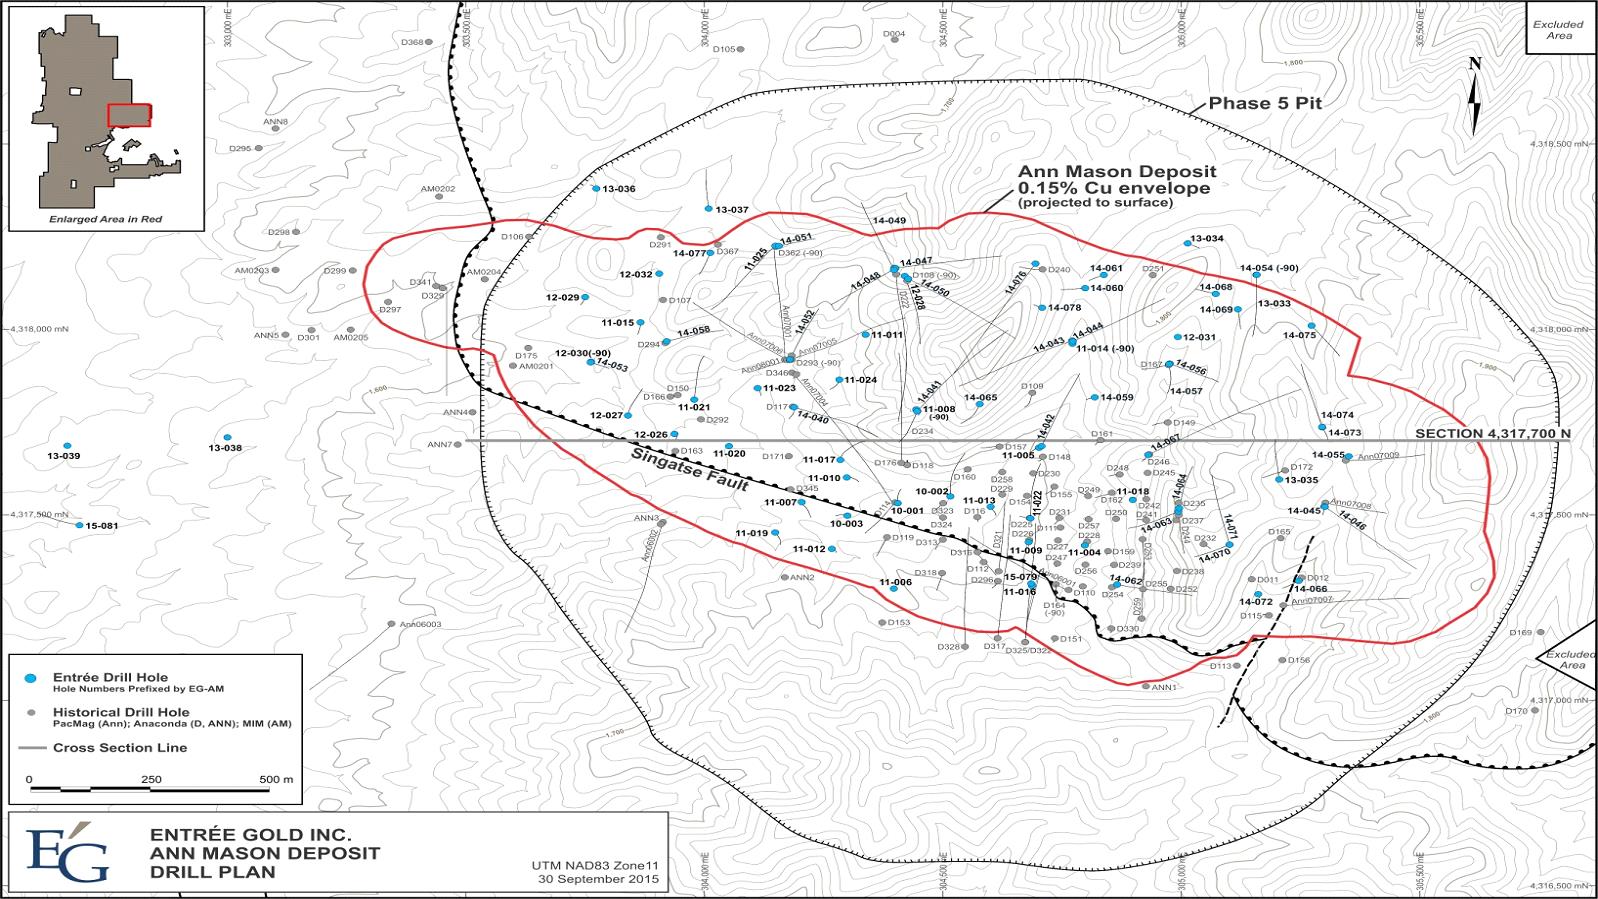
| | |
| 10/03/2017 |
Page 10 - 11
2017 Updated Preliminary Economic Assessment on the Ann Mason Project
Nevada, U.S.A.
Figure 10‑2: Ann Mason Deposit – Section 4,317,700 N
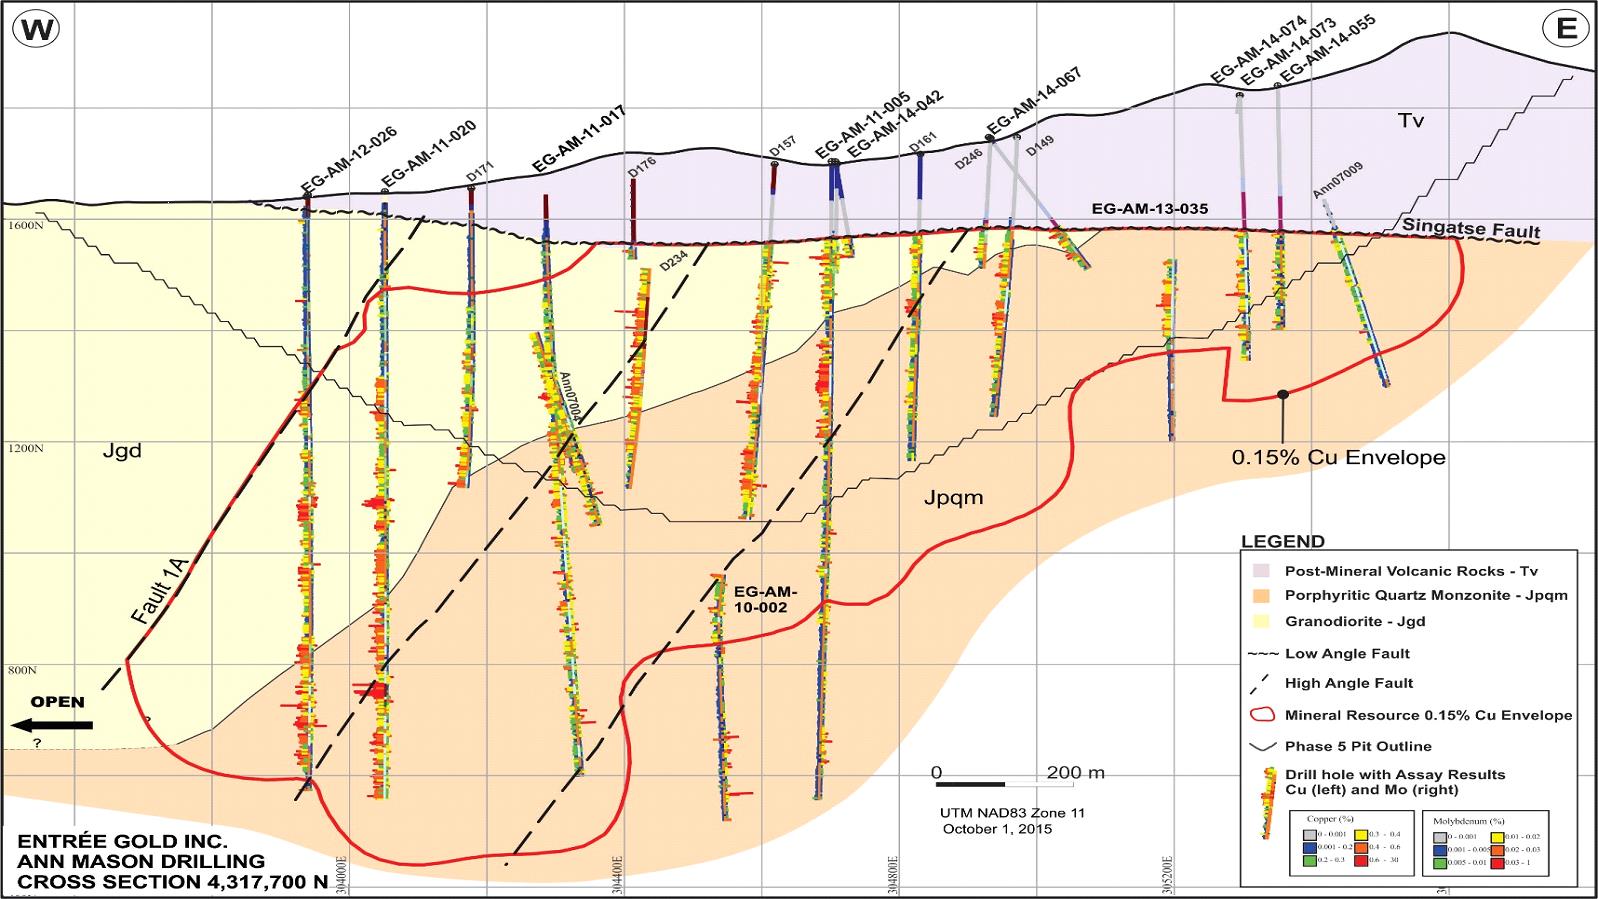
| | |
| 10/03/2017 |
Page 10 - 12
2017 Updated Preliminary Economic Assessment on the Ann Mason Project
Nevada, U.S.A.
| 10.2.2 | Blue Hill Deposit and Periphery |
Entrée completed 46 drill holes totalling 11,505 m at the Blue Hill deposit (34 holes) and in adjacent areas (12 holes) to date.
Significant intercepts for all holes at the Blue Hill deposit and adjacent areas are shown in Table 10-4.
Blue Hill Deposit
At the Blue Hill deposit, drilling was designed to test the extent of shallow copper oxide mineralization identified by soil geochemistry and outcropping oxide copper mineralization, and to test the potential for deeper, sulphide mineralization. Thirty-four RC and diamond drill holes totalling 7,701 m were completed at the Blue Hill deposit.
In 2010, Entrée completed a RC drill program (14 holes, EG-BH-10-001 to -014) to test for shallow copper oxide mineralization. An additional 16 holes (diamond and RC; EG-BH-11-015 to -030) were drilled in 2011 to continue testing for shallow oxide mineralization, and also to investigate the deeper sulphide mineralization discovered by PacMag in 2008. The results of the 2010 and 2011 drilling, along with results from historical drilling completed by Anaconda and PacMag were used to estimate the mineral resources at Blue Hill in 2012 (Jackson et al, 2012b).
In 2013, four RC drill holes (EG-BH-13-036 to -039) tested for westward extensions of the deposit and two previously drilled RC holes (EG-BH-10-003 and -11-027) were also deepened with core (161 and 171 m respectively) to test underlying sulphide mineralization. These holes were located in close proximity to the 2012 resource estimate but were considered not material to the overall Ann Mason Project, therefore the Blue Hill resource estimate has not been updated and remains the same as the 2012 study.
The oxide deposit is exposed on surface and has been traced by drilling as a relatively flat-lying zone, covering an area of about 900 m x 450 m, and continuing for several hundred metres to the west as a thinner zone. Oxide mineralization extends from surface to an average depth of 124 m, where a zone of mixed oxide/sulphide mineralization is present to maximum depths of 185 m. The copper oxide zone remains open to the northwest and southeast. Copper sulphide mineralization encountered in widely-spaced holes D177, 200, 223, 233, 236, and 261, PacMag holes BH08001 and 003, and Entrée holes EG-BH-11-019 and -020 is more restricted as compared to Ann Mason but requires additional drilling to determine the extent of mineralization. Higher-grade copper mineralization was observed in zones of sheeted veins containing chalcopyrite, magnetite, and secondary biotite and with quartz monzonite porphyry (qmp-b) dykes.
| | |
| 10/03/2017 |
Page 10 - 13
2017 Updated Preliminary Economic Assessment on the Ann Mason Project
Nevada, U.S.A.
Most of the drilling was vertical, and intersected mineralization perpendicular to the broad, flat-lying oxide and mixed/oxide mineralization. Figure 10‑3 illustrates the location of all drill holes, and Figure 10‑4 illustrates the drilling on vertical section with respect to the mineralization. No drilling, sampling, or recovery factors that could materially affect the accuracy and reliability of the results were observed.
A detailed description of the mineralization of the Blue Hill deposit is provided in Section 7.4.
| | |
| 10/03/2017 |
Page 10 - 14
2017 Updated Preliminary Economic Assessment on the Ann Mason Project
Nevada, U.S.A.
Figure 10‑3: Blue Hill: Drill Plan

| | |
| 10/03/2017 |
Page 10 - 15
2017 Updated Preliminary Economic Assessment on the Ann Mason Project
Nevada, U.S.A.
Figure 10‑4: Blue Hill: Section 4319090N
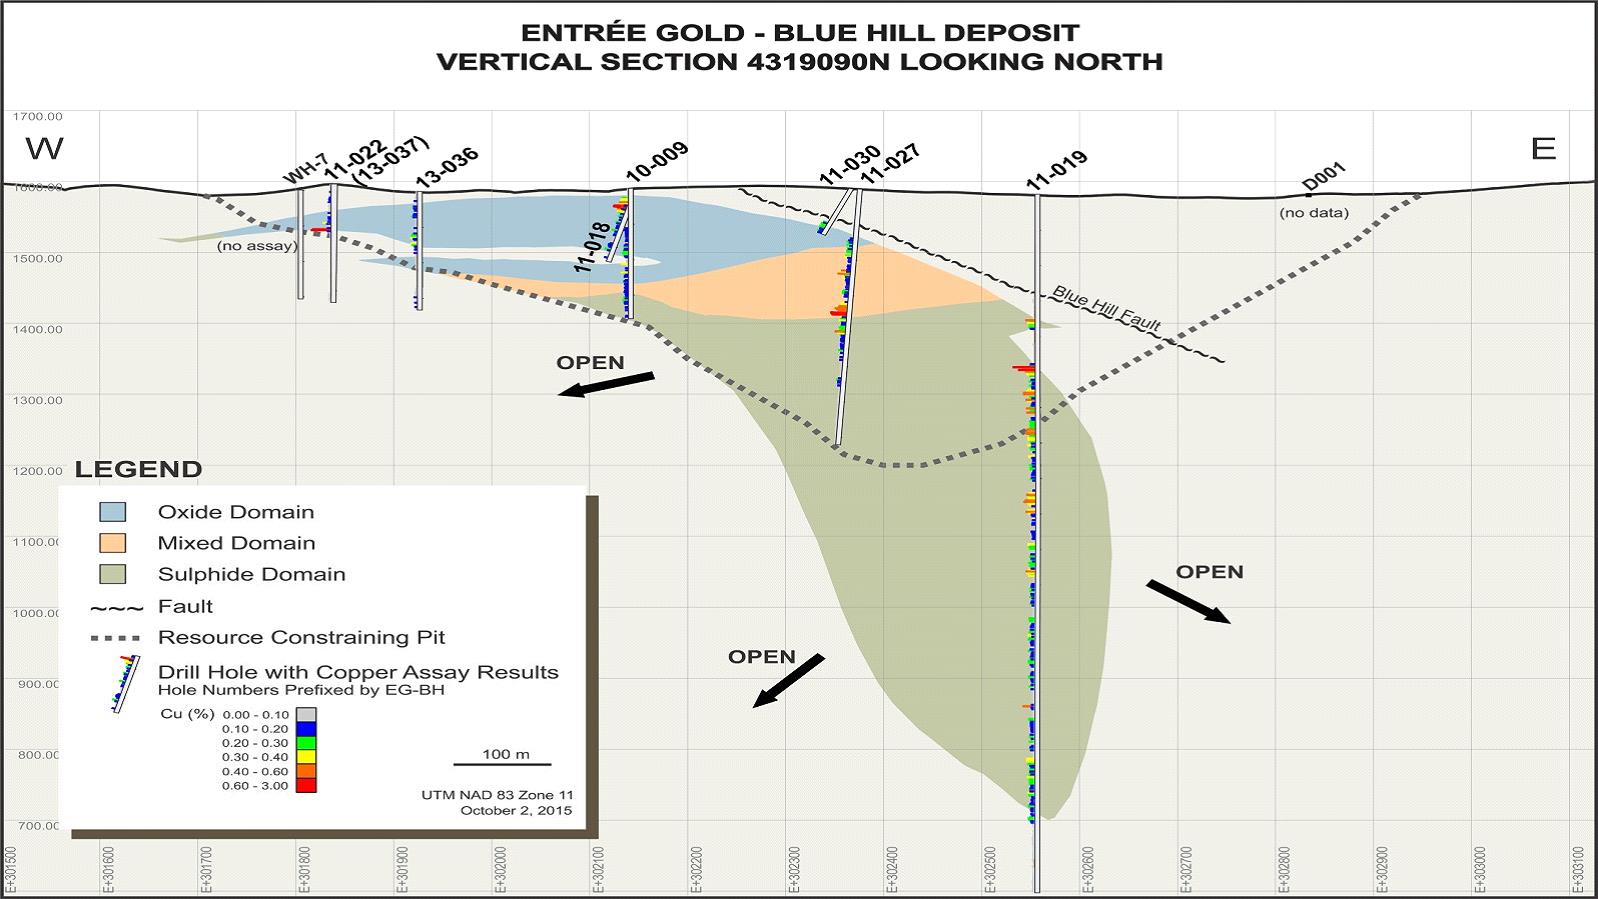
| | |
| 10/03/2017 |
Page 10 - 16
2017 Updated Preliminary Economic Assessment on the Ann Mason Project
Nevada, U.S.A.
Blue Hill – Periphery
Exploration holes in periphery of the Blue Hill deposit are shown on Figure 10‑5.
Five diamond drill holes (EG-B-10-003 to -007), located 0.7 to 1.4 km northwest of the Blue Hill deposit, were completed in June and July of 2010 to test a combination of IP, soil geochemical, and geological targets. The upper portions of all five holes are strongly oxidized and iron-rich, with occasional copper minerals noted. Drill holes EG-B-10-003 and -004 intersected narrow intervals of anomalous copper sulphide mineralization. The area tested by these five drill holes contains primarily pyritic mineralization to a depth of approximately 350 m.
Five RC and diamond holes (EG-BH-11-031, 13-032 to 13-035) were completed to test surface oxide mineralization and a conductive geophysical target located approximately 750 m east of the Blue Hill deposit. The geophysical target is located on the north flank of the Ann Mason/Blue Hill IP chargeability anomaly, and interpreted to be in the footwall of the Blue Hill Fault. Rock and soil sampling conducted by Anaconda encountered anomalous copper mineralization in this area. Oxide copper mineralization was encountered in holes -031, 13-032 and -035. Oxide mineralization remains open to the north and to the west. In addition, sulphide copper was intersected in hole -031 at a depth of 406 m.
EG-BH-13-040, located 750 m west of the current Blue Hill resource was collared on the edge of a largely untested, strong IP anomaly. The hole encountered several thin zones of oxide copper mineralization grading between 0.13 and 0.14% copper over widths ranging between 3 m and 35 m. In addition, 11 m of 0.24% copper sulphide mineralization was intersected at the bottom of the hole.
In 2015, a previously drilled RC pre-collar was deepened with core (EG-BH-15-041) to a final depth of 557.88 m to test a portion of an IP anomaly in the footwall of the Blue Hill Fault. EG-BH-15-041 intersected 12 m of 0.13% Cu (sulphide) at a depth of 440 m. The hole intersected a 165 m zone of py>cpy mineralization within the Ann Mason/Blue Hill IP chargeability anomaly. As a result, Blue Hill sulphide mineralization remains open to the southeast towards Ann Mason in both the hanging wall and footwall of the Blue Hill Fault.
Table 10-4: Blue Hill Deposit and Periphery: Significant Drill Intercepts
Hole Number | From (m) | To (m) | Width (m) | Cu (%) | Au (g/t) | Ag (g/t) | Mo (%) | Comment |
EG-B-10-003 | 218.00 | 230.00 | 12.00 | 0.18 | 0.01 | 0.16 | 0.002 | Sulphide |
EG-B-10-004 | 136.00 | 156.00 | 20.00 | 0.20 | NS | 0.10 | NS | Sulphide |
including | 136.00 | 150.00 | 14.00 | 0.24 | NS | 0.10 | NS | Sulphide |
EG-B-10-006 | 0.28 | 4.00 | 3.72 | 0.36 | 0.01 | 0.29 | 0.004 | Oxide |
EG-B-10-007 | 96.00 | 106.00 | 10.00 | 0.12 | NS | NS | NS | Mixed |
EG-BH-10-001* | 18.29 | 182.88 | 164.59 | 0.18 | 0.01 | 0.23 | 0.001 | Oxide/Mixed/Sulphide |
including | 18.29 | 44.20 | 25.91 | 0.26 | NS | 0.26 | 0.001 | Oxide |
| | |
| 10/03/2017 |
Page 10 - 17
2017 Updated Preliminary Economic Assessment on the Ann Mason Project
Nevada, U.S.A.
Hole Number | From (m) | To (m) | Width (m) | Cu (%) | Au (g/t) | Ag (g/t) | Mo (%) | Comment |
and | 59.44 | 99.06 | 39.62 | 0.21 | 0.01 | 0.23 | 0.001 | Oxide |
and | 105.16 | 109.73 | 4.57 | 0.31 | 0.03 | 0.27 | 0.001 | Oxide |
and | 164.59 | 172.21 | 7.62 | 0.38 | 0.03 | 0.52 | 0.001 | Sulphide |
EG-BH-10-002 | 39.62 | 51.82 | 12.20 | 0.23 | 0.02 | 0.27 | 0.001 | Oxide |
including | 45.72 | 51.82 | 6.10 | 0.34 | 0.03 | 0.33 | 0.002 | Oxide |
74.68 | 147.83 | 73.15 | 0.15 | 0.02 | 0.22 | NS | Oxide/Mixed/Sulphide | |
including | 74.68 | 115.82 | 41.14 | 0.15 | 0.02 | 0.20 | NS | Oxide |
and | 126.49 | 147.83 | 21.34 | 0.19 | 0.01 | 0.26 | NS | Sulphide |
EG-BH-10-003* | 7.62 | 68.58 | 60.96 | 0.19 | NS | 0.15 | 0.001 | Oxide |
including | 56.39 | 64.01 | 7.62 | 0.38 | NS | 0.15 | NS | Oxide |
129.54 | 156.97 | 27.43 | 0.28 | NS | 0.29 | 0.003 | Mixed/Sulphide | |
176.78 | 184.40 | 7.62 | 0.13 | 0.01 | 0.21 | NS | Sulphide | |
EG-BH-10-004* | 88.39 | 121.92 | 33.53 | 0.17 | 0.01 | 0.27 | 0.002 | Mixed |
EG-BH-10-005 | 85.34 | 106.68 | 21.34 | 0.40 | 0.01 | 0.53 | 0.013 | Sulphide |
including | 92.96 | 106.68 | 13.72 | 0.48 | 0.01 | 0.63 | 0.017 | Sulphide |
EG-BH-10-008 | 12.19 | 105.16 | 92.97 | 0.15 | NS | 0.18 | 0.001 | Oxide/Mixed |
including | 12.19 | 32.00 | 19.81 | 0.30 | 0.01 | 0.38 | 0.005 | Oxide |
EG-BH-10-009 | 12.19 | 163.07 | 150.88 | 0.18 | 0.01 | 0.18 | 0.002 | Oxide/Mixed/Sulphide |
including | 12.19 | 39.62 | 27.43 | 0.36 | 0.01 | 0.18 | 0.001 | Oxide |
and | 111.25 | 118.87 | 7.62 | 0.15 | NS | 0.17 | 0.017 | Oxide |
EG-BH-10-010 | 44.20 | 118.87 | 74.67 | 0.12 | NS | 0.11 | 0.001 | Oxide |
including | 44.20 | 54.86 | 10.66 | 0.15 | NS | NS | NS | Oxide |
134.11 | 143.26 | 9.15 | 0.13 | 0.01 | 0.15 | NS | Mixed | |
172.21 | 179.83 | 7.62 | 0.15 | NS | 0.15 | NS | Sulphide | |
EG-BH-10-011 | 0.00 | 36.58 | 36.58 | 0.17 | 0.01 | 0.17 | 0.001 | Oxide |
57.91 | 65.53 | 7.62 | 0.15 | NS | 0.15 | 0.001 | Oxide | |
132.59 | 146.3 | 13.71 | 0.15 | NS | 0.12 | 0.001 | Mixed | |
156.97 | 161.54 | 4.57 | 0.29 | NS | 0.26 | 0.003 | Sulphide | |
EG-BH-11-015* | 18.00 | 184.00 | 166.00 | 0.18 | N/A | N/A | 0.002 | Oxide/Mixed |
184.00 | 191.26 | 7.26 | 0.31 | N/A | N/A | 0.022 | Sulphide | |
EG-BH-11-016* | 18.00 | 198.00 | 180.00 | 0.18 | N/A | N/A | 0.001 | Oxide/Mixed |
198.00 | 214.28 | 16.28 | 0.13 | N/A | N/A | 0.001 | Sulphide | |
EG-BH-11-017 | 8.00 | 144.00 | 136.00 | 0.16 | N/A | N/A | 0.001 | Oxide/Mixed |
including | 8.00 | 78.00 | 70.00 | 0.21 | N/A | N/A | 0.001 | Oxide |
and | 106.00 | 144.00 | 38.00 | 0.15 | N/A | N/A | 0.001 | Mixed |
EG-BH-11-018 | 4.00 | 108.00 | 104.00 | 0.17 | N/A | N/A | 0.001 | Oxide |
including | 4.00 | 82.00 | 78.00 | 0.19 | N/A | N/A | 0.001 | Oxide |
EG-BH-11-019 | 176.00 | 190.00 | 14.00 | 0.24 | 0.01 | 0.27 | 0.001 | Sulphide |
238.00 | 882.00 | 644.00 | 0.19 | 0.01 | 0.30 | 0.008 | Sulphide | |
including | 238.00 | 452.00 | 214.00 | 0.24 | 0.01 | 0.25 | 0.008 | Sulphide |
and | 764.00 | 882.00 | 118.00 | 0.18 | 0.01 | 0.35 | 0.017 | Sulphide |
EG-BH-11-020 | 51.82 | 57.91 | 6.09 | 0.17 | N/A | N/A | 0.001 | Oxide |
EG-BH-11-021 | 218.00 | 484.00 | 266.00 | 0.18 | NS | 0.22 | 0.003 | Sulphide |
including | 364.00 | 484.00 | 120.00 | 0.24 | 0.01 | 0.22 | 0.003 | Sulphide |
532.00 | 588.00 | 56.00 | 0.04 | NS | NS | 0.046 | Sulphide | |
EG-BH-11-022 | 45.72 | 67.06 | 21.34 | 0.26 | N/A | N/A | 0.001 | Oxide |
EG-BH-11-023 | 10.67 | 59.44 | 48.77 | 0.16 | N/A | N/A | 0.003 | Oxide |
126.49 | 147.83 | 21.34 | 0.14 | N/A | N/A | 0.001 | Mixed | |
EG-BH-11-024 | 105.16 | 128.02 | 22.86 | 0.16 | N/A | N/A | 0.001 | Mixed |
199.65 | 205.74 | 6.09 | 0.17 | N/A | N/A | 0.001 | Mixed |
| | |
| 10/03/2017 |
Page 10 - 18
2017 Updated Preliminary Economic Assessment on the Ann Mason Project
Nevada, U.S.A.
Hole Number | From (m) | To (m) | Width (m) | Cu (%) | Au (g/t) | Ag (g/t) | Mo (%) | Comment |
EG-BH-11-025 | 134.11 | 138.69 | 4.58 | 0.17 | N/A | N/A | 0.001 | Sulphide |
EG-BH-11-026 | 67.06 | 152.40 | 85.34 | 0.21 | N/A | N/A | 0.001 | Oxide/Mixed |
EG-BH-11-027 | 68.58 | 179.83 | 111.25 | 0.23 | N/A | N/A | 0.001 | Oxide/Mixed |
179.83 | 188.98 | 9.15 | 0.24 | N/A | N/A | 0.001 | Sulphide | |
189.0 | 232.0 | 43.0 | 0.19 | 0.01 | 0.19 | 0.004 | Sulphide | |
EG-BH-11-028* | 114.30 | 140.21 | 25.91 | 0.24 | N/A | N/A | 0.001 | Mixed |
140.21 | 152.40 | 12.19 | 0.26 | N/A | N/A | 0.001 | Sulphide | |
EG-BH-11-029 Including | 57.91 57.91 179.83 | 179.83 117.35 207.27 | 121.92 59.44 27.44 | 0.19 0.27 0.23 | N/A | N/A | 0.001 | Oxide/Mixed Oxide Mixed/Sulphide |
including | 57.91 | 117.35 | 59.44 | 0.27 | N/A | N/A | 0.001 | Oxide |
179.83 | 207.27 | 27.44 | 0.23 | N/A | N/A | 0.001 | Mixed/Sulphide | |
EG-BH-11-030 | 54.86 | 198.12 | 143.26 | 0.21 | N/A | N/A | 0.001 | Oxide/Mixed |
including | 54.86 | 135.64 | 80.78 | 0.25 | N/A | N/A | 0.001 | Oxide/Mixed |
201.17 | 240.79 | 39.62 | 0.18 | N/A | N/A | 0.001 | Sulphide | |
EG-BH-11-031* | 22.22 | 36.00 | 13.78 | 0.28 | 0.01 | 1.01 | 0.001 | Oxide |
406.00 | 448.00 | 42.00 | 0.31 | 0.02 | 0.19 | 0.002 | Sulphide | |
EG-BH-13-036 | 19.8 | 36.6 | 16.8 | 0.16 | 0.01 | 0.26 | 0.001 | Oxide |
59.4 | 76.2 | 16.8 | 0.21 | 0.01 | 0.17 | 0.001 | Oxide | |
EG-BH-13-037 | 18.3 | 47.2 | 28.9 | 0.14 | 0.01 | 0.61 | 0.004 | Oxide |
62.5 | 70.1 | 7.6 | 0.17 | NS | NS | NS | Oxide | |
EG-BH-13-039 | 3.00 | 7.6 | 4.6 | 0.13 | NS | NS | NS | Oxide |
EG-BH-13-040 | 47.2 | 82.3 | 35.1 | 0.13 | NS | NS | 0.001 | Oxide |
111.3 | 121.9 | 10.7 | 0.24 | 0.01 | 0.24 | NS | Sulphide |
| Note: | Holes marked with "*" ended in mineralization. Non-significant results (NS) are defined as less than 0.005 g/t Au, less than 0.0005% Mo and less than 0.10 g/t Ag. N/A denotes intervals that were not analyzed for gold and silver. Drill intersections are based on drilled core lengths and may not reflect the true width of mineralization. |
| 10.2.3 | Roulette |
As initially described by BCE, the primary exploration target at Roulette is a covered, high-grade zone of copper mineralization in wall rocks outside of contact skarn, developed outboard of the intrusive contact between the Yerington batholith and adjacent volcanic and sedimentary wall rocks.
In 2010, Entrée completed six holes (three RC pre-collar, two diamond with RC pre-collars, and one diamond daughter hole) at Roulette (EG-R-10-001 to -003, -004 and -004A and -005, Figure 10‑5). The holes were sited based on a strong aeromagnetic high, the results of a soil geochemical and pH survey, and a structural analysis of the target as completed by BCE. One of the pre-collared holes was completed in April 2012 after deepening the hole with core (005) and one additional daughter hole as completed (-005A). Approximately 2,308 m of drilling has been completed to date at Roulette.
| | |
| 10/03/2017 |
Page 10 - 19
2017 Updated Preliminary Economic Assessment on the Ann Mason Project
Nevada, U.S.A.
Hole EG-R-10-003 successfully reached target and was completed at 619.82 m. It intersected 20.7 m, averaging 0.14% Cu, from a depth of 497.3 m. This intercept is based on core length, and may not reflect the true width of mineralization. Mineralization occurs as chalcopyrite-pyrite in strongly altered granodiorite cut by quartz-K-feldspar and quartz-chlorite veins.
This copper occurrence is interpreted as representative of a separate porphyry system located near the southwest margin of the Yerington batholith. Disseminated magnetite, associated with K-feldspar alteration, is interpreted to be the cause of the strong magnetic anomaly. Exploration potential of the target had been previously dismissed by Anaconda, after drilling into a magnetic Tertiary-age andesite beneath Quaternary alluvium, but in the hanging wall of the Blue Hill Fault. Mineralization and the source of the magnetic high is interpreted to be in the footwall of the Blue Hill Fault. Additional, displaced mineralized zones may be present in the hanging wall of the Blue Hill Fault to the southeast of EG-R-10-003.
Holes EG-R-10-001 and -002 were cased to a depth of 211.72 m and 125 m respectively, but were not deepened by diamond drilling. Holes EG-R-10-004 and EG-R-10-004A were collared approximately 1,000 m northeast of EG-R-10-003, but failed to penetrate the Blue Hill Fault after several attempts to drill though highly faulted volcanic rocks and were abandoned. An RC pre-collar (EG-R-10-005) was drilled and cased to a depth of 329.18 m.
In 2012, the RC pre-collar EG-R-10-005 was deepened with core to a depth of 606.86 m. The hole penetrated the Blue Hill Fault and encountered strongly faulted and sheared granodiorite at 563.16 m, but was lost due to caving of highly faulted volcanic rocks located above the Blue Hill Fault. Weak pyrite mineralization, with trace amounts of chalcopyrite and disseminated magnetite, are present in the granodiorite within zones of chlorite and potassic alteration. Hole EG-R-10-005A wedged off hole -005 at 541.94 m, and was drilled to a depth of 712.93 m. The hole was abandoned after consistently poor recovery, slow and expensive drilling, and weak mineralization. Highly faulted and sheared granodiorite cut by Jurassic andesite dykes and one quartz monzonite porphyry (qmp) dyke, is present in the footwall of the Blue Hill Fault. Weak to moderate pyrite mineralization, with weak chalcopyrite and minor amounts of disseminated magnetite, are present throughout the granodiorite, and occur with zones of chlorite-epidote and potassic alteration.
| 10.2.4 | Blackjack IP (Northeast) |
On the Blackjack IP (Northeast) exploration area, two holes (one diamond with RC pre-collar and one RC pre-collar) totalling 870.67 m were drilled in June 2010 to test the AirMT target interpreted from Honey Badger's 2009 airborne survey (Figure 10‑5). The Blackjack IP Northeast target is coincident with a chargeability anomaly defined by Entrée's initial 2010 IP survey.
| | |
| 10/03/2017 |
Page 10 - 20
2017 Updated Preliminary Economic Assessment on the Ann Mason Project
Nevada, U.S.A.
Figure 10‑5: Ann Mason Project: Exploration Drilling
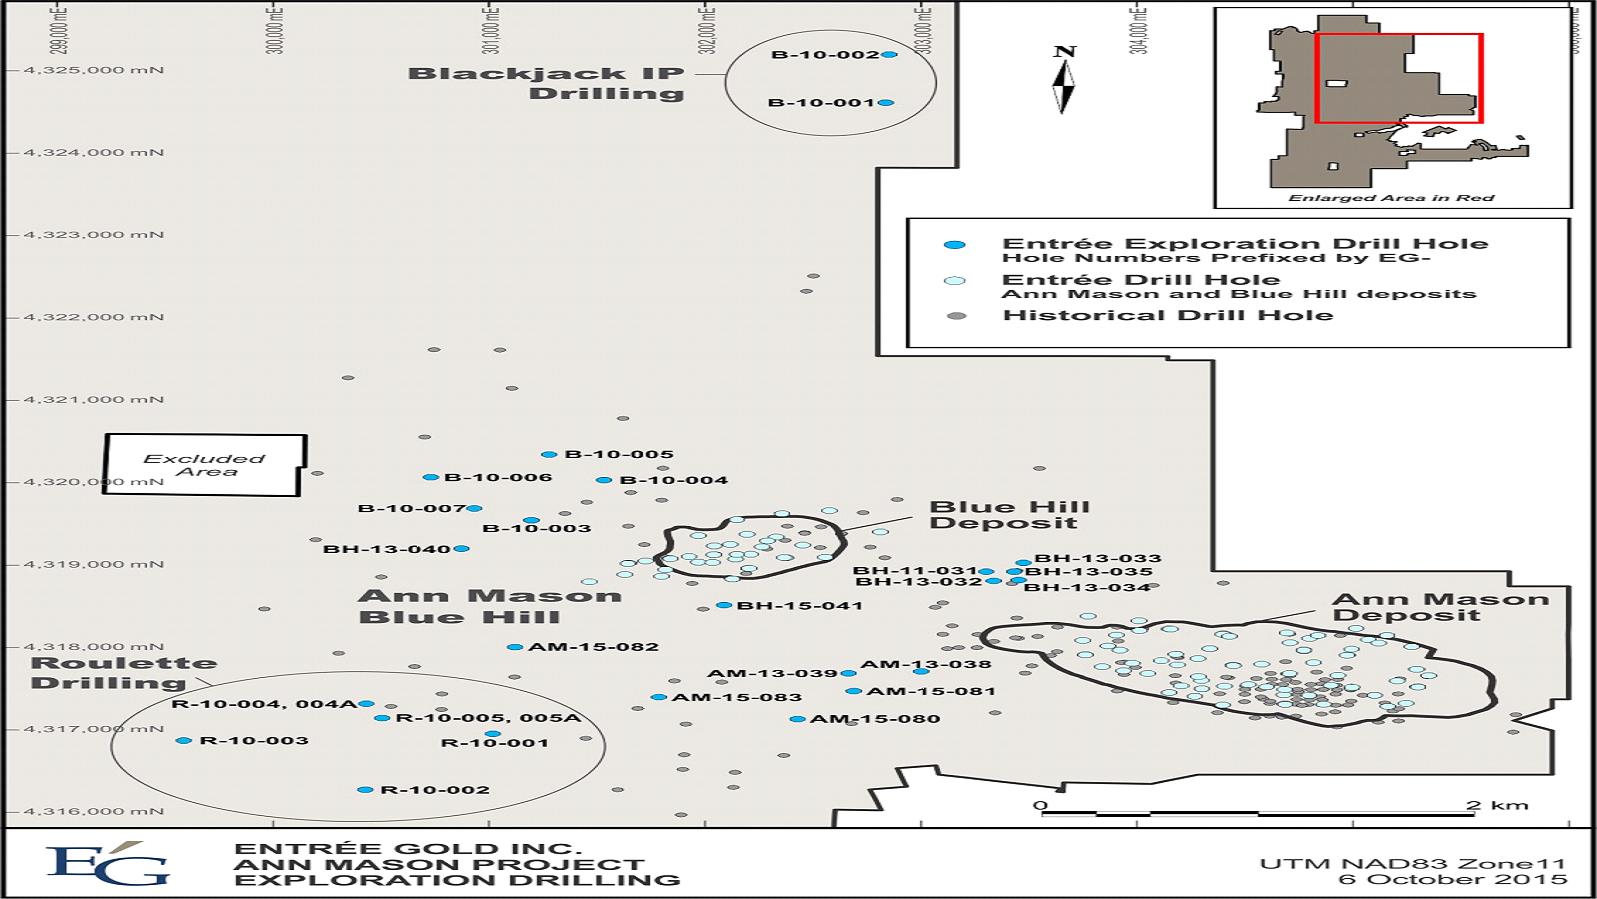
| | |
| 10/03/2017 |
Page 10 - 21
2017 Updated Preliminary Economic Assessment on the Ann Mason Project
Nevada, U.S.A.
Narrow intervals of copper mineralization in drill hole EG-B-10-001 occur as coarse chalcopyrite in silicified breccias. Hole EG-B-10-001 confirmed the presence of porphyry-style sulphide mineralization (predominantly pyrite) in granodiorite intruded by quartz monzonite porphyry dykes at the eastern limit of a 5-km-long, east-west-trending IP anomaly. Drill hole EG-B-10-001 intersected 4.0 m averaging 0.44% Cu from a depth of 444.0 m. This intercept is based on core length, and may not reflect the true width of mineralization.
EG-B-10-002 was cased to a depth of 262.5 m, but subsequently abandoned based on the determination the hole would be too deep to test the Blackjack Northeast IP anomaly below EG-B-10-001.
| | |
| 10/03/2017 |
Page 10 - 22
2017 Updated Preliminary Economic Assessment on the Ann Mason Project
Nevada, U.S.A.
| 11 | Sample Preparation, Analyses, and Security |
| 11.1 | Sample Preparation and Analyses |
Sampling programs on the Ann Mason Project date back to the 1950s. No written documentation is available describing the sample preparation, analysis, and security procedures for this work completed by Anaconda, MIM, or Phelps Dodge. Anaconda's exploration programs from 1956-1981 contributed the largest body of historical work on the project.
No written documentation is available for the historical drilling and related sampling, analytical, or quality assurance/quality control (QA/QC) work by Anaconda, MIM, or Phelps Dodge, and therefore these programs are not discussed in detail in this section.
Since acquiring the Project, Entrée has dedicated a significant amount of effort towards validating the Anaconda historical drilling database, through various programs of core re-logging and re-assaying. This work is described below and in Entrée's 2012 PEA ("Amended & Restated Preliminary Economic Assessment on the Ann Mason Project, Nevada, U.S.A." with an effective date of October 24, 2012, amended October 15, 2014) and has allowed Entrée to incorporate the majority of this data into the current Ann Mason and Blue Hill Mineral Resource estimates.
| 11.1.1 | Diamond Drill Core Sampling |
Pre-2005
Anaconda's exploration programs from 1956-1981 contributed the largest body of work on the project. Generally, all core recovered within the host Jurassic porphyry units was sampled and assayed for copper on intervals equal to the core run, averaging around 1 m. Molybdenum, gold and silver were only analyzed selectively. Anaconda's sampling of core was done by mechanical splitter to obtain samples of half core.
PacMag (2005-2009)
Sample preparation, analysis and security of samples processed during PacMag's drill programs between 2006-2008 is detailed in Entrée's 2012 PEA ("Amended & Restated Preliminary Economic Assessment on the Ann Mason Project, Nevada, U.S.A." with an effective date of October 24, 2012, amended October 15, 2014) but are additionally summarized below.
| · | In the 2006 program, all drill core was logged by PacMag geologists for lithology, alteration, structure, and sulphide species. Geotechnical logging included RQD, fracture frequency, magnetic susceptibility and other parameters sufficient to formulate a rock mass rating (RM78). Drill core was also subjected to point load index strength tests (axial and diametral) at regular downhole intervals (approximately every 3.05 m) and was photographed. |
| | |
| 10/03/2017 |
Page 11 - 1
2017 Updated Preliminary Economic Assessment on the Ann Mason Project
Nevada, U.S.A.
| · | In general, core samples were saw-cut over approximately 1.5 m to 3.05 m intervals, at an average length of 3.03 m. |
Entrée (2010 to Present)
Entrée's personnel and contractors follow the core sampling procedure described below:
| · | Entrée personnel transport the core from the rig in secure covered boxes to Yerington core logging/sampling facility. |
| · | Core is washed and photographed. |
| · | Geotechnical information includes core recovery, RQD and magnetic susceptibility. |
| · | Core logging includes lithology, alteration, mineralization, structure, and veining. |
| · | Sample is in 2 m intervals unless conforming to contacts of major rock or alteration types. |
| · | All geotechnical, logging, and sampling data is entered into the Fusion (Datamine) database. |
| · | Core is sampled by sawing competent pieces of core in half, or collecting half of the rock in areas of highly broken core; then bagged and sealed. Once logged and split, the core is stored on racks or stacked on pallets in a secure storage facility. |
| · | Assay samples are kept in a secure facility prior to being picked up by the laboratory. |
| · | Sample shipments are picked up by laboratory personnel. Strict chain of custody procedures are maintained during the transporting of the samples to the labs. Any indication of tampering or discrepancies between samples received and samples shipped would be reported to Entrée by the lab. |
| · | Pulps and coarse rejects are returned to Entrée's Yerington facility, where they are catalogued and stored on site. |
| 11.1.2 | Reverse Circulation Drill Sampling |
Entrée (2010 to Present)
Entrée used RC drilling for most of the drilling at Blue Hill. In addition, many of the Ann Mason holes use RC drilling to pre-collar through the sterile overlying volcanic rocks; however, these portions of the holes were not analyzed on a regular basis. Entrée's personnel and contractors follow the RC sampling procedure described below:
| · | RC samples are collected at the drill; all RC drilling is conducted with air and/or water as the drilling medium. |
| | |
| 10/03/2017 |
Page 11 - 2
2017 Updated Preliminary Economic Assessment on the Ann Mason Project
Nevada, U.S.A.
| · | Assay samples consist of an approximate quarter-split of all cuttings and water returned from each 5 ft interval, and are collected in an 18" x 24" MicroPor cloth sample bag, resulting in 6 kg to 10 kg samples when dry. |
| · | Assay duplicates are collected at the drill by using approximate 1/8 splits for both the assay sample and duplicate. |
| · | Samples are allowed to drain at the drill site, and are transported to Entrée's secure core and sample facility by Company employees each day. Samples are then allowed to air dry in a fenced and locked facility prior to being submitted to the laboratory for analysis. |
Information regarding known sample preparation, assaying and analytical procedures used, the name and location of the analytical laboratories, and the quality control sample insertions are summarized in Table 11-1.
Bureau Veritas Minerals Laboratories (formerly Acme Laboratories) provided global commercial laboratory services. The Vancouver based laboratory received ISO/IEC 17025:2005 accreditation in 2005.
ALS Minerals (formerly ALS Chemex) provides global commercial laboratory services. The Vancouver laboratory received ISO/IEC 17025:2005 accreditation in 2005.
American Assay Laboratories is a commercial laboratory based in Reno, Nevada. They report participating in all CANMET proficiency testing studies since their inception in 1998 and received ISO/IEC 17025:2005 accreditation in 2014.
Skyline Assayers and Laboratories is a commercial laboratory based in Tucson, Arizona. They received ISO/IEC 17025:2005 accreditation in 2014.
These laboratories are independent from Entrée.
| | |
| 10/03/2017 |
Page 11 - 3
2017 Updated Preliminary Economic Assessment on the Ann Mason Project
Nevada, U.S.A.
Table 11-1: Summary of Ann Mason Project Prep and Analytical Procedures
| Year | Sample Preparation Facility | Sample Preparation Procedure | Primary Sample Assaying Lab | Sample Assaying Procedures/Elements | Geological QA/QC |
Prior 2005 (Various Operators) | Unknown | Unknown | Unknown | Unknown | Unknown |
2005–2006 (Operator - PacMag) | ALS Chemex Reno, Nevada | Unknown | ALS-Chemex Vancouver, BC Except Au in Reno, Nevada | · 61 element ICP-AES and MS after 4-acid digestion (MEICP61a) · Samples Mo >300 ppm have additional Re and 47 elements ICP analysis (ME-MS61) · Au by fire assay with AAS finish (30 g sample weight) (Av-AA23) | · SRMs (1/50) · External Assay Checks (up to 5%) |
2007–2008 (Operator - PacMag) | American Assay Laboratories (AAL) Reno, Nevada | · >70% passing -2 mm · Riffle splitting · 1,000 g split pulverized to >85% passing 75 µm | American Assay Laboratories (AAL) Reno, Nevada | · 61 element ICP-AES and MS after 4-acid digestion (ICP-4a) · Cu >1% additional ore-grade Cu analysis · Au by fire assay with AAS finish (30 g sample wt) (FA-30) | · SRMs (1/50) · Check assays - 100 pulp samples · External assay checks (up to 5%) |
2010–Mid 2011 (Operator - Entrée) | ALS Chemex Reno, Nevada | · >70% passing -2 mm · Riffle splitting · 250 g split pulverized to >85% passing 75 µm | ALS-Chemex Vancouver, BC Except Au in Reno, Nevada | · 51 element ICP-AES and ICP-MS after 4-acid digestion (ME-MS51) · Ore Grade Cu and Mo: ICP-AAS after 4-acid digestion (OG-62) · Au by fire assay with FA-AAS finish (30 g sample t) (Au-AA21) · BH oxide and mixed zones if >0.1% TCu (Cu-AA05)-additional leached Cu analysis | · Core sampling: SRM 1/30; Blanks 1/30; field duplicates 1/30 · RC sampling: SRM 1/40; Blanks 1/20; field duplicates 1/20 · External assay checks 307 core samples and 114 RC samples |
| | |
| 10/03/2017 |
Page 11 - 4
2017 Updated Preliminary Economic Assessment on the Ann Mason Project
Nevada, U.S.A.
| Year | Sample Preparation Facility | Sample Preparation Procedure | Primary Sample Assaying Lab | Sample Assaying Procedures/Elements | Geological QA/QC |
Mid 2011–2012 (Operator - Entrée) | Skyline Assayers and Laboratories Battle Mountain, Nevada | · 75% passing -10 mesh · Riffle splitting · 250-300 g split pulverized to >95% passing ‑150 mesh | Skyline Assayers and Laboratories Tuscon, Arizona | · 49 element ICP-MS after aqua regia digestion(TE-3); process changed to 4-acid digestion & 24 element ICP-OES (TE-4) · Ore Grade Cu and Mo: 4-acid digestion using conventional ICP-OES (CuMo-MEA) · Au by fire assay with FA-AAS finish (30 g sample wt) (FA-1) · Ag by FA from March 2012 (FA-08) | · Core sampling: SRM 1/30; Blanks 1/30; field duplicates 1/30 · RC sampling: SRM 1/40; Blanks 1/20; field duplicates 1/20 · External assay checks 731 samples |
July-August 2013 (Operator - Entrée) | Acme Elko, Nevada | · Crush · Riffle splitting · 250 g split pulverized to >80% passing ‑200 mesh | ACME Vancouver, BC | · 45 element ICP- MS after 4-acid digestion (1EX) · Au by fire assay fusion by ICP-ES (30 g sample wt) (FA-330-Au) · Oxide Cu samples - additional G801 using 5% H2SO4 leech | · SRM 1/30; Blanks 1/30; field duplicates 1/30 · No external checks |
2014–2015 (Operator - Entrée) | Acme Elko or Reno, Nevada | · Crush · Riffle splitting · 250 g split pulverized to >80% passing ‑200 mesh | ACME Vancouver, BC | · 45 element ICP- MS after 4-acid digestion (MA-200) · Au by fire assay fusion by ICP-ES (30 g sample wt) (FA-330-Au) | · SRM 1/30; Blanks 1/30; core twin, coarse reject, and pulp duplicates 1/30 · External assay checks 319 samples |
| | |
| 10/03/2017 |
Page 11 - 5
| 11.2 | Assay Quality Control |
Pre-2010
Quality control procedures used prior to 2005 are unknown. Approximately 36% of the samples used to support the Ann Mason Mineral Resource estimate were assayed prior to Entrée's involvement in the Project in 2010. Approximately 31% pre-dates 1990. Most of the historical data was collected by major mining companies. Entrée completed core re-assaying programs, along with rigorous quality control protocols in place, and database quality checks to support the use of this historical data for Mineral Resource estimation. Details of these checks are documented in Entrée's 2012 PEA ("Amended & Restated Preliminary Economic Assessment on the Ann Mason Project, Nevada, U.S.A." with an effective date of October 24, 2012, amended October 15, 2014).
2010 to 2011
During the 2010 and 2011 drilling programs Entrée submitted control samples with each drill sample batch. Pulp check samples were also sent to a secondary laboratory. These control samples were used to assess sample precision, accuracy, and contamination. Quality control checks completed by Entrée for this period are summarized in Table 11-1 and results are documented in Entrée's 2012 PEA ("Amended & Restated Preliminary Economic Assessment on the Ann Mason Project, Nevada, U.S.A." with an effective date of October 24, 2012, amended October 15, 2014).
2012 to 2015
Entrée's quality control program improved in an effort to assess and minimize error that might occur through sample collection and splitting procedures; laboratory sample preparation and sub-sampling procedures; analytical accuracy, precision, and contamination. Quality control checks completed by Entrée for this period are summarized in Table 11-1 and results are documented below.
| 11.2.1 | Assessment of Precision 2013-2015 |
CRM Precision
Ten different CRMs were used; all CRM copper values and all but two CRM molybdenum values are certified. The remainder are provisional or indicated.
Copper and molybdenum CRM results were used to pass or fail assay batches; gold and silver CRM results were used to provide a general guide regarding the precision and accuracy of the results.
The CRM results were plotted in chronological order on graphs depicting the mean grade of the standards being reviewed, as well as mean ± 2 and ±3 times the standard deviation of the dataset, and a moving average of the mean grade. To measure CRM precision two or more consecutive results outside two standard deviations, or one result outside of three standard deviations from the mean were flagged as failures and generally triggered a request to reanalyse the standard and two or three samples before and after the standard in the sample stream. A few intervals were re-analysed throughout the programs, in each case the subsequent results passed and the database was updated. Copper, molybdenum, gold, and silver show reasonably good precision for each standard used between 2013 and 2015. Figure 11‑1 shows an example control chart for standard AM-8 for copper.
| | |
| 10/03/2017 |
Page 11 - 6
2017 Updated Preliminary Economic Assessment on the Ann Mason Project
Nevada, U.S.A.
Figure 11‑1: Ann Mason – Control Chart Standard AM-8–Cu (%)

Duplicate Precision
Min Max scatter plots were prepared for each type of duplicate control sample type (core twins, coarse and pulp duplicates). Duplicate pair assays were plotted such that the minimum of each pair was the X value and the maximum was the Y value. A curve was also plotted on this graph representing a targeted maximum relative error for a duplicate pair as follows:
| · | twin samples and RC field duplicates – a relative error of 30% |
| · | coarse duplicates – a relative error of 20% |
| · | pulp duplicates – a relative error of 10%. |
This curve was derived from a hyperbolic function, which allows for a greater error tolerance near the detection limit. The degree of this allowance was determined from the labs' stated detection limits or from an analysis of the practical detection limit. Points plotting above the hyperbolic relative error curve were considered out-of-specification (OOS) pairs. Precision was measured in terms of percent of OOS pairs. The protocol for duplicates calls for no more than 10% OOS pairs.
| |
| 10/03/2017 |
Page 11 - 7
2017 Updated Preliminary Economic Assessment on the Ann Mason Project
Nevada, U.S.A.
Table 11-2: Duplicate Results 2013
Duplicate Type | Ann Mason AM | Blue Hill BH | Total Samples | ||
Failures | % Fail | Failures | % Fail | ||
Core Twins (Dup) | AM 30 | BH 41 | 71 | ||
Copper | 6 | 20.0 | 5 | 12.2 | |
Molybdenum | 2 | 6.7 | 0 | 0 | |
Silver | 0 | 0 | 0 | 0 | |
Gold | 1 | 3.3 | 0 | 0 | |
Dup Crush (Coarse) | AM 22 | BH 4 | 26 | ||
Copper | 0 | 0 | 0 | 0 | |
Molybdenum | 0 | 0 | 0 | 0 | |
Silver | 1 | 4.5 | 0 | 0 | |
Gold | 1 | 4.5 | 0 | 0 | |
Dup Pulp | AM 20 | BH 3 | 23 | ||
Copper | 1 | 5.0 | 0 | 0 | |
Molybdenum | 0 | 0 | 0 | 0 | |
Silver | 0 | 0 | 0 | 0 | |
Gold | 0 | 0 | 0 | 0 | |
Total Duplicates | 120 | ||||
Table 11-3: Duplicate Results 2014-2015 Infill
Duplicate Type | Failures | % Fail | Total Samples |
Core Twins (Dup) | |||
Copper | 11 | 8.3 | 133 |
Molybdenum | 12 | 9.0 | 133 |
Silver | 0 | 0 | 133 |
Gold | 4 | 3.0 | 133 |
Dup Crush (Coarse) | |||
Copper | 5 | 4.1 | 122 |
Molybdenum | 7 | 5.7 | 122 |
Silver | 1 | 1.0 | 122 |
Gold | 0 | 0 | 122 |
Dup Pulp | |||
Copper | 5 | 4.4 | 113 |
Molybdenum | 8 | 7.1 | 113 |
Silver | 5 | 4.0 | 113 |
Gold | 4 | 3.5 | 113 |
Total Duplicates | 368 |
| | |
| 10/03/2017 |
Page 11 - 8
2017 Updated Preliminary Economic Assessment on the Ann Mason Project
Nevada, U.S.A.
Table 11-4: Duplicate Results 2015 Exploration Drilling
Duplicate Type | Failures | % Fail | Total Samples |
Core Twins (Dup) | |||
Copper | 1 | 6 | 18 |
Molybdenum | 0 | 0 | 18 |
Silver | 0 | 0 | 18 |
Gold | 0 | 0 | 18 |
Dup Crush (Coarse) | |||
Copper | 0 | 0 | 16 |
Molybdenum | 0 | 0 | 16 |
Silver | 0 | 0 | 16 |
Gold | 0 | 0 | 16 |
Dup Pulp | |||
Copper | 5 | 35.7 | 14 |
Molybdenum | 0 | 0 | 14 |
Silver | 0 | 0 | 14 |
Gold | 0 | 0 | 14 |
Total Duplicates | 48 |
Copper, molybdenum, gold, and silver show reasonably good precision for each duplicate type used between 2013 and 2015. Large variations in the results (fails that were well away from the fail lines) were investigated to verify the data and followed up with a review of the remaining half core interval to determine if the style of mineralization was likely the cause. A number of fails in the copper and molybdenum plots were from zones of irregular veining or intense faulting that may be responsible for the poor duplication results. Other fails were low grade and occur very close to the failure line so did not warrant further follow-up.
An example Min-Max chart for copper duplicate pulps from the 2014-2015 Ann Mason infill drilling program is shown in Figure 11‑2.
During the 2015 regional exploration drilling the failure rate was 35.7% in copper duplicate pulps. Although this rate is higher than typically accepted, these were not investigated any further as the database was very small and four of the five samples are very low grade (<100 ppm Cu) and all are very near the fail line so were not deemed problematic. The holes were not drilled into the Ann Mason deposit but well outside deposit limits testing new exploration targets.
| | |
| 10/03/2017 |
Page 11 - 9
2017 Updated Preliminary Economic Assessment on the Ann Mason Project
Nevada, U.S.A.
Figure 11‑2: Ann Mason Copper in Pulp Duplicate Samples
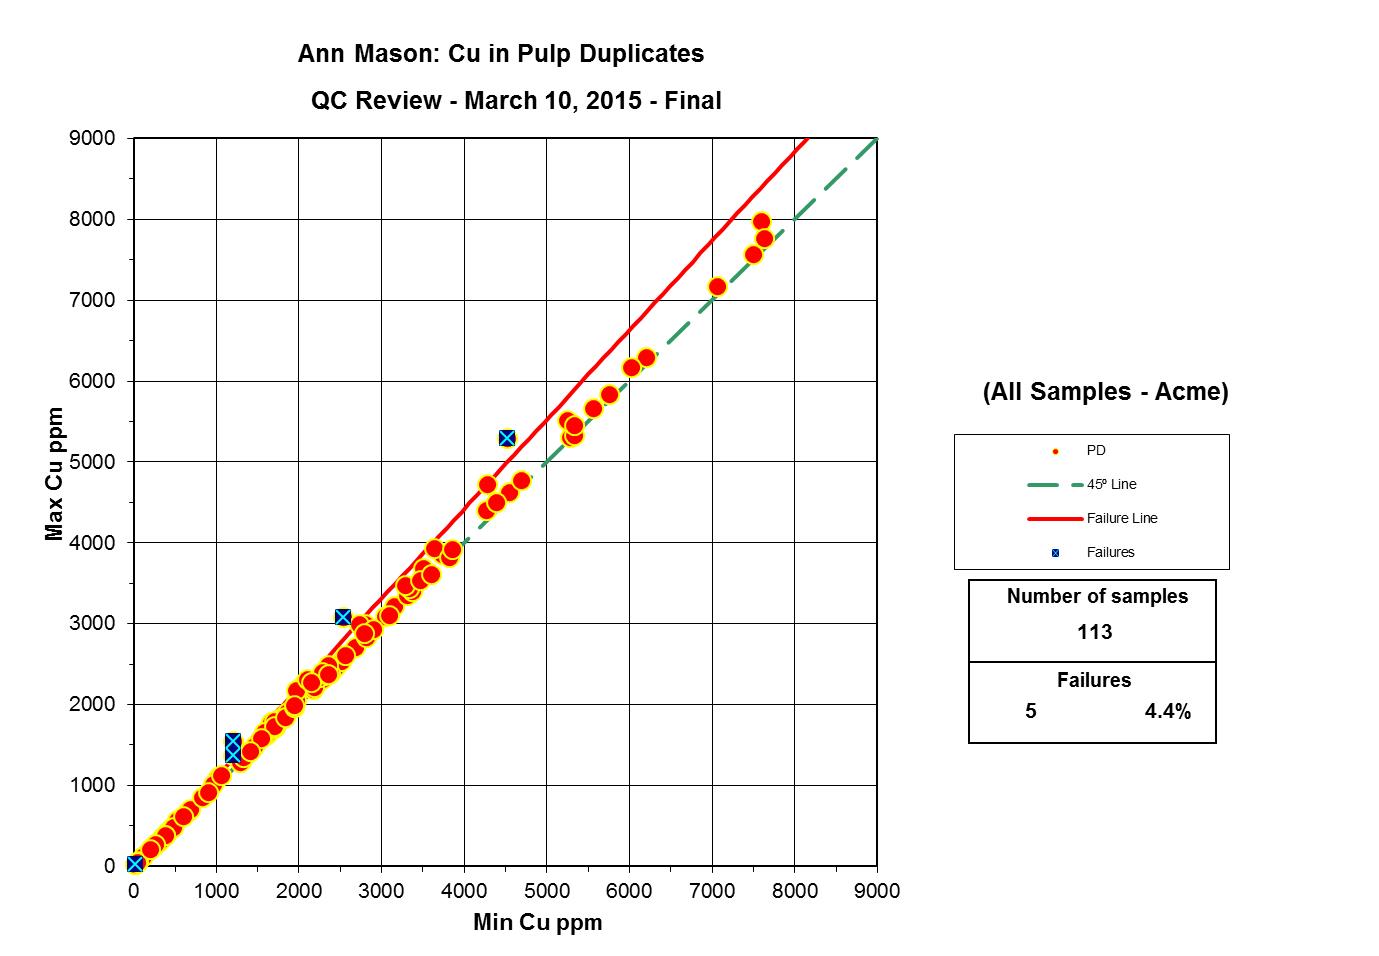
| 11.2.2 | Assessment of Accuracy 2013-2015 |
CRM Accuracy
Once the precision of the CRM was considered acceptable, the CRM mean grades were compared against the certified grade or "best value" (BV). The following criteria were used to evaluate the accuracy of the standard:
good : 0 to ±5% bias
reasonable : ±5–10% bias
unacceptable: >±10% bias
where Bias (%) = (Mean/Best Value) – 1.
Table 11-5 to Table 11-7 show summary CRM statistics for all data. Copper, molybdenum, gold, and silver show good to reasonable accuracy.
| · | 2013: Copper and molybdenum show good accuracy for each standard with one exception of 11.2% for Mo for AM-5. Calculated biases for gold and silver show a lack of accuracy for these metals. Attaining targeted accuracy for gold and silver at such low grades may be difficult. |
| · | 2014-2015: Copper and molybdenum show good to reasonable accuracy for each standard with one exception of 23.9% for Mo for AM-5. Gold and silver also show good to reasonable accuracy with the exception of AM1 and AM5. Insertion rates for these CRMs were insufficient to allow for statistically meaningful results. |
| · | 2015 Exploration Drilling: Copper shows good accuracy; molybdenum good to reasonable accuracy for each standard. Given the coarser nature of the molybdenum mineralization and more variable assay results these bias values are as expected. Gold and silver bias values were within the limits required. |
| | |
| 10/03/2017 |
Page 11 - 10
2017 Updated Preliminary Economic Assessment on the Ann Mason Project
Nevada, U.S.A.
Table 11-5: 2013 Summary Bias in Standards by element for Ann Mason and Blue Hill
Standard | No. of Samples | Outliers Cu | Relative Bias (%) Cu | Outliers Mo | Relative Bias (%) Mo | Outliers Au | Relative Bias (%) Au | Outliers Ag | Relative Bias (%) Ag |
Ann Mason | |||||||||
AM-1 | 13 | 0 | -1.9 | 0 | -2.2 | 0 | 13.0 | 0 | -16.3 |
AM-2 | 14 | 0 | -0.7 | 0 | 1.1 | 0 | 10.9 | 0 | 0.0 |
AM-3 | 2 | 0 | -2.0 | 0 | 3.8 | 0 | -3.4 | 0 | 6.6 |
AM-4 | 20 | 0 | -1.0 | 0 | -1.0 | 1 | 3.7 | 0 | -11.0 |
AM-5 | 9 | 0 | 0.9 | 0 | 11.2 | 0 | 16.8 | 0 | 0.0 |
AM-6 | 13 | 0 | -2.2 | 0 | 0.0 | 0 | 8.5 | 0 | 10.3 |
Blue Hill | |||||||||
AM-1 | 2 | 0 | -0.9 | 0 | 3.2 | 0 | 10.2 | 0 | -11.8 |
AM-2 | 16 | 0 | -1.5 | 0 | -0.2 | 1 | 1.5 | 1 | 18.8 |
AM-4 | 14 | 0 | -2.6 | 0 | -2.4 | 0 | -1.5 | 0 | -5.4 |
AM-6 | 13 | 0 | -3.1 | 0 | -0.7 | 0 | -0.4 | 1 | 10.3 |
Table 11-6: 2014-2015 Infill Drilling Summary Bias in Standards by element for Ann Mason
Standard | No. of Samples | Outliers Cu | Relative Bias (%) Cu | Outliers Mo | Relative Bias (%) Mo | Outliers Au | Relative Bias (%) Au | Outliers Ag | Relative Bias (%) Ag |
AM-1 | 3 | 0 | 6.3 | 0 | 6.1 | 0 | 17.7 | 0 | -2.0 |
AM-4 | 4 | 0 | 0.9 | 0 | -0.3 | 0 | 4.1 | 0 | -8.3 |
AM-5 | 2 | 0 | 6.1 | 0 | 23.9 | 0 | 17.1 | 0 | 0.0 |
AM-7 | 128 | 5 | 3.2 | 0 | 6.6 | 3 | 6.2 | 1 | -4.9 |
AM-8 | 76 | 0 | 2.8 | 1 | 7.2 | 2 | 3.8 | 1 | 6.0 |
AM-9 | 93 | 0 | 2.4 | 0 | 4.7 | 2 | -0.1 | 2 | -0.8 |
AM-10 | 69 | 0 | 1.8 | 0 | 5.7 | 1 | 7.1 | 3 | -0.6 |
| | |
| 10/03/2017 |
Page 11 - 11
2017 Updated Preliminary Economic Assessment on the Ann Mason Project
Nevada, U.S.A.
Table 11-7: 2015 Exploration Summary Bias in Standards by element for Ann Mason and Blue Hill
Standard | No. of Samples | Relative Bias (%) Cu | Relative Bias (%) Mo | Relative Bias (%) Au | Relative Bias (%) Ag |
AM-7 | 9 | 1.4 | 9.8 | 11.6 | 0.8 |
AM-8 | 10 | 0.9 | 7.6 | 9.2 | 4.7 |
AM-9 | 15 | 0.2 | 2.6 | -1.1 | -1.3 |
AM-10 | 14 | 1.5 | 7.1 | 10.2 | -4.8 |
Check Sample Accuracy
A further check of laboratory accuracy at the primary lab was evaluated through a program of second splits of the final pulps re-assayed at a secondary lab (check samples). In 2014, during the Ann Mason infill drilling the primary lab was Acme and the secondary lab was ALS. No check assays were submitted for the 2013 or 2015 regional exploration drill programs.
The results for the check samples were plotted on X-Y scatter plots and assessed using Reduced to Mean Axis (RMA) analysis. It provides an unbiased fit of the data between two sets of assay results assuming independence between a sample pair. The following criteria were used to evaluate the results:
good: 0 to ±5% Bias
reasonable: ±5–10% Bias
unacceptable: >±10% Bias
where Bias is measured in terms of the slope of the RMA line after exclusion of outliers.
Table 11-8 shows summary RMA statistics with the outliers removed, for the check assay program on the 2014-2015 infill drilling. The RMA plots indicate good to reasonable between-lab bias was achieved for copper, molybdenum, gold, and silver; Figure 11‑4 shows the 2014 infill drilling check assay RMA plot for copper.
Table 11-8: 2014-2015 Infill Drilling Check Assay RMA Regression Statistics (Outliers Removed)
Element | Ann Mason - RMA Parameters - Check Samples-No Outliers | |||||||||
R2 | Accepted | Outliers | % Outliers | m | Error (m) | b | Error (b) | RMA Equation | Bias | |
Cu (%) | 0.993 | 319 | 0 | 0.0% | 0.989 | 0.005 | 0.000 | 0.002 | RMA: y=0.989x+0 | 1.1% |
Mo (%) | 0.998 | 316 | 3 | 0.9% | 0.954 | 0.003 | 0.000 | 0.000 | RMA: y=0.954x0 | 4.6% |
Au (g/t) | 0.988 | 314 | 5 | 1.6% | 1.013 | 0.006 | -0.002 | 0.001 | RMA: y=1.013x-0.002 | -1.3% |
Ag (g/t) | 0.992 | 313 | 6 | 1.9% | 0.939 | 0.005 | -0.002 | 0.010 | RMA: y=0.939x-0.002 | 6.1% |
| | |
| 10/03/2017 |
Page 11 - 12
2017 Updated Preliminary Economic Assessment on the Ann Mason Project
Nevada, U.S.A.
Figure 11‑3: Cu in ALS Check Samples (outliers excluded)
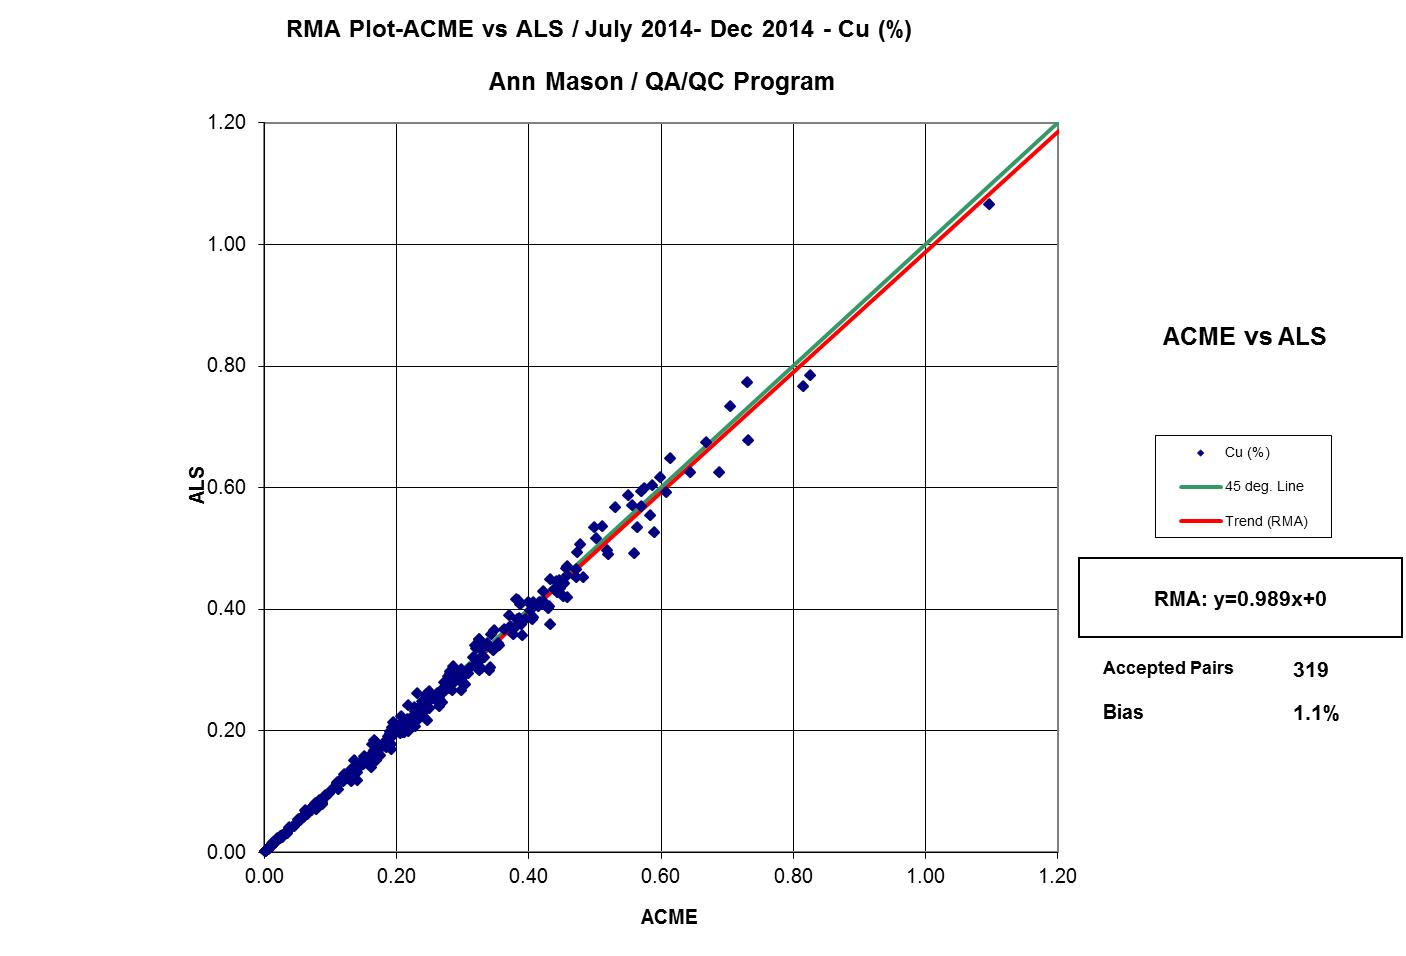
The check sample batches also included pulp duplicates, standards, and pulp blanks in a proportion of approximately 5% each, in order to assess the precision, accuracy, and contamination, respectively, at the secondary laboratory. A review of these results indicated that the secondary laboratory (ALS) had acceptable accuracy and precision during the check assay program.
As part of the check assay program, Entrée requested that ALS check the quoted pulverization protocols of Acme lab (85% passing -200 mesh) by completing sieve checks on approximately 20% of the pulps submitted for the check assays. The overall average for the sieve checks were 89.8% of the pulps were sieved at -200 mesh (75 µm) or better with a range between 70.3% to 98.3%. A total of 13 samples (17%) were below 85% for an 83% passing rate.
| 11.2.3 | Assessment of Contamination 2013-2015 |
X-Y sample plots were used to evaluate coarse blank results. These plots show the results in date order along the X-axis and the grade of the blank along the Y-axis.
| | |
| 10/03/2017 |
Page 11 - 13
2017 Updated Preliminary Economic Assessment on the Ann Mason Project
Nevada, U.S.A.
Prior to being used as control samples, the blanks were tested and showed no values above the 0.01% Cu lower detection limit used during the testing. The analytical methods used for the 2013–2015 drilling programs have a lower detection limit and show the blanks average approximately 42 ppm Cu. While not completely devoid of copper the blank copper values are considered low enough to allow detection of any significant carryover. In this review copper fail was set at 90 ppm, approximately two times the average grade of the blanks. Entrée is considering a replacement blank material that is sufficiently devoid of copper and molybdenum for future drill programs.
Blank failure values for molybdenum, gold and silver were generally set at five times the lower detection for each element reviewed. Samples above this threshold were considered as potential contamination events.
All samples were below required limits in Cu and Mo; an example is shown in Figure 11‑4.
Figure 11‑4: Ann Mason – Plot of Copper in 2014-2015 Infill Drilling Coarse Blanks
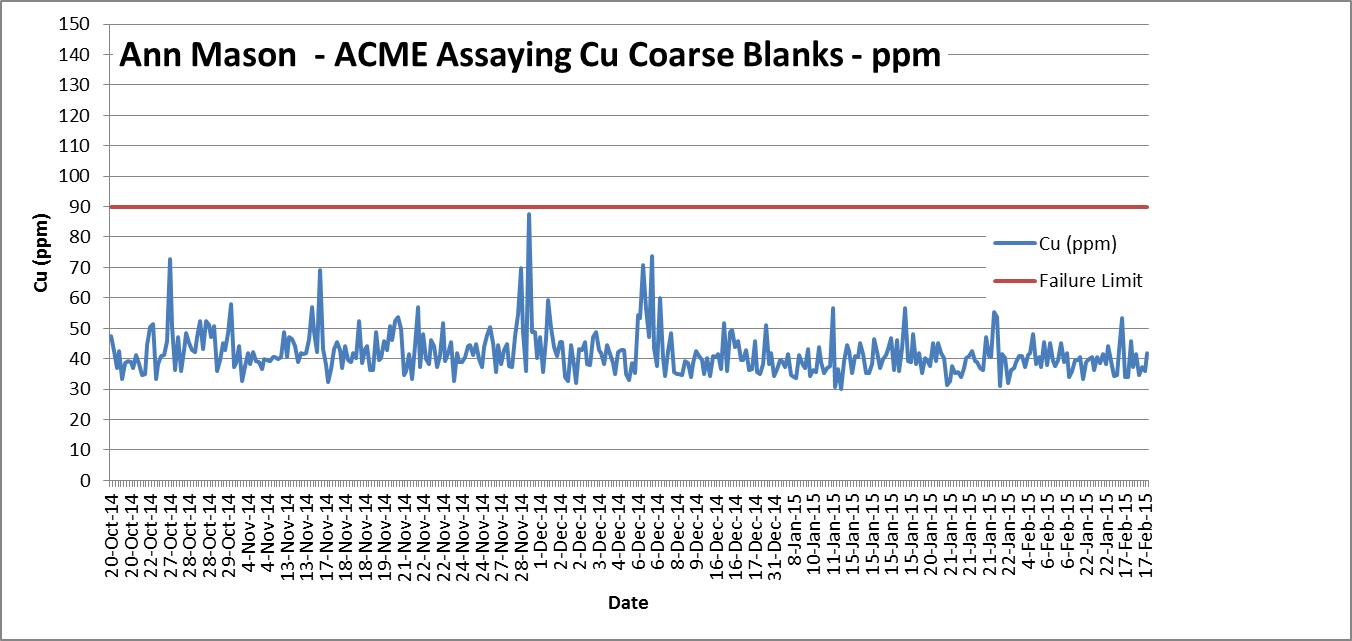
| 11.3 | Database Quality |
In July 2012, Entrée completed a double data entry validation program to validate historical Anaconda data, originally hand-entered into the drill hole database. Copper values from a random 6% selection (2,162 samples) of assay records related to the Ann Mason Project were re-entered into an Excel spread sheet and compared to copper results reported in the drill hole database. Twelve data errors were identified representing approximately a 0.6% error rate. Most of the errors identified are from poorly documented or illegible entries in the original data, however these types of errors are rare and do not represent a significant percentage of the overall database.
2014 infill drilling information, including assay, collar, downhole survey and lithology data were also subjected to a data verification program. Acceptable error rates were achieved.
| | |
| 10/03/2017 |
Page 11 - 14
2017 Updated Preliminary Economic Assessment on the Ann Mason Project
Nevada, U.S.A.
| 11.4 | Sample Security |
| 11.4.1 | Pre 2009 |
After drilling was completed Anaconda core was stored in buildings (behind a locked gate) on the Yerington mine site. PacMag acquired the property in late 2005 and kept the core in the same secure location until Entrée became the operator in 2009. Entrée moved the core to one of Entrée's locked warehouses in Yerington. PacMag core and pulps were also stored in various locked storage units in Yerington until retrieved by Entrée in 2010 and moved to one of Entrée's locked warehouses.
| 11.4.2 | Entrée (2010 to Present) Core Drilling |
Entrée's personnel and contractors log and sample the drill core. All geotechnical, logging, and sampling data are entered into the Fusion (Datamine) database. Samples are kept in a secure facility prior to being picked up by the laboratory.
The sample shipments are picked up by laboratory personnel. Strict chain of custody procedures are maintained during the transporting of the samples to the laboratories. An Entrée Sample Submittal Form and Order for Analytical Services is transmitted with each sample shipment, with a copy retained by Entrée. All sample shipments are made by Entrée laboratory vehicles and personnel. Pulps and coarse rejects are returned to Entrée's Yerington facility, where they are catalogued and stored on site.
| 11.4.3 | Entrée (2010 to Present) RC Drilling |
Entrée's personnel and contractors log and sample the drill cuttings. RC samples are collected at the drill. Samples are allowed to drain at the drill site, and are transported to Entrée's secure core and sample facility by Company employees at the end of each day of drilling. Samples are then allowed to air dry in a fenced and locked facility prior to being submitted to the laboratory for analysis.
| 11.5 | Bulk Density Sampling |
| 11.5.1 | Entrée (2011-2012) |
Dry bulk density measurements were completed by Entrée on drill core at both Ann Mason (4,181 samples) and Blue Hill (411 samples). Entrée tested all the samples in the Yerington core logging facility during 2011 and 2012, using a wax-coated immersion procedure. The procedure is summarized as follows:
| · | samples consist of 10 cm to 15 cm long core pieces |
| · | sample is oven-dried at 100°C for about one hour to remove any remnant moisture |
| | |
| 10/03/2017 |
Page 11 - 15
2017 Updated Preliminary Economic Assessment on the Ann Mason Project
Nevada, U.S.A.
| · | oven dried sample is weighed in air with a 0.1 g precision balance (A, or dry weight in air) |
| · | sample is well coated with a thin layer of molten paraffin with density dpar (0.82 g/cm3), and weighed in air (B, or coated weight) |
| · | sample is weighed on a submerged plate, completely covered by water (C, or submerged weight). |
With this method, the bulk density (d) was calculated by: d = A/{B - C-[(B-A)/dpar]}
The total range of mean values by rock type at Ann Mason is between 2.08 and 2.73 g/cm3. At Blue Hill, these range between 2.25 and 2.83 g/cm3. Results at Blue Hill were further subdivided to look at the rock types within the oxide, mixed, and sulphide mineralized domains. There is an increasing trend with depth through the oxide and mixed zones, with bulk density values ranging as shown below. The density value for the waste material is similar to that of the sulphide mineralized rock and is also shown below:
| · | oxide: 2.33 to 2.63 g/cm3 (average 2.55 g/cm3) |
| · | mixed: 2.44 to 2.63 g/cm3 (average 2.56 g/cm3) |
| · | sulphide: 2.30 to 2.82 g/cm3 (average 2.62 g/cm3) |
| · | Waste: 2.14 to 2.89 g/cm3 (average 2.61 g/cm3). |
On January 30, 2012, Entrée submitted to ALS in Reno, Nevada, a suite of 30 rock samples for independent bulk density checks. The samples tested by ALS were not the same pieces used by Entrée, due to the residual wax coating remaining on original samples; instead, an adjacent sample from the same lithology and alteration type was used. ALS used a similar wax immersion technique, and the results showed a reasonable correlation with no significant bias noted between the two sets of results.
| 11.5.2 | Entrée (2013) |
Entrée completed specific gravity tests on 222 samples in the Yerington core logging facility during the 2013 program using the wax-coated immersion procedure as used in 2011 and 2012. The total range of mean values by rock type is between 2.09 and 2.76 g/cm3.
| 11.5.3 | Entrée (2014–2015) |
Entrée completed specific gravity tests on 1,204 samples in the Yerington core logging facility during the 2014–2015 infill drilling program using the wax-coated immersion procedure as used in 2011 and 2012.
An additional 50 bulk density measurements were completed as a check of Entrée's on-site measurements at ALS labs in Reno, Nevada. The samples tested by ALS were adjacent to those analysed by Entrée and were the same lithology and alteration as those tested on-site. This was due to the residual wax coating remaining on the original samples. The ALS samples were analysed by method code OA-GRA09as (bulk density after wax coating). Measurements were done on four rock types, Jgd, Jpqm, Qmp-b and Twh. The total range of mean values by rock type is between 2.27 and 2.62 g/cm3. ALS used a similar wax immersion technique, and the results showed a reasonable correlation with no significant bias noted between the two sets of results.
| | |
| 10/03/2017 |
Page 11 - 16
2017 Updated Preliminary Economic Assessment on the Ann Mason Project
Nevada, U.S.A.
Table 11-9 summarizes the results of the bulk density determinations from the 50 ALS samples and the on-site measurements by Entrée for 2013–2015 programs.
Table 11-9: Ann Mason Deposit – Entrée Bulk Density Determinations 2013-2015
(Bold texts shows rock types analysed by ALS)
(Bold texts shows rock types analysed by ALS)
Rock Type | Entrée No of Samples | Entrée Average SG | ALS No of Samples | ALS Average SG |
Dio | 26 | 2.76 | ||
FAULT | 16 | 2.49 | ||
FAULT BX | 7 | 2.45 | ||
ibx | 7 | 2.09 | ||
Ja | 18 | 2.72 | ||
Jbqm | 22 | 2.59 | ||
Jgd (qtz monzodiorite) | 286 | 2.62 | 16 | 2.62 |
Jpa | 1 | 2.50 | ||
Jpqm (porphyritic granite) | 294 | 2.57 | 17 | 2.55 |
PQM-b | 4 | 2.59 | ||
qmp-a | 12 | 2.49 | ||
qmp-b (porphyry) | 636 | 2.57 | 15 | 2.60 |
qmp-bm | 39 | 2.61 | ||
qmp-bq | 6 | 2.61 | ||
qmp-c | 17 | 2.61 | ||
qmp-d | 4 | 2.64 | ||
Tbm | 1 | 2.09 | ||
Td | 1 | 2.29 | ||
Tha | 1 | 2.45 | ||
Thai | 2 | 2.30 | ||
Trt | 4 | 2.23 | ||
Ts | 10 | 2.35 | ||
Twh (Tertiary?) | 12 | 2.29 | 2 | 2.27 |
Total | 1,426 | 50 |
Note: *refer to Section 7 for rock type descriptions.
| | |
| 10/03/2017 |
Page 11 - 17
2017 Updated Preliminary Economic Assessment on the Ann Mason Project
Nevada, U.S.A.
| 11.5.4 | QP Comments |
Entrée's sample preparation, security, and analytical procedures applied for the Ann Mason and Blue Hill data meet and in some cases exceed current industry accepted standards. QA/QC procedures applied have resulted in acceptable precision, accuracy, and contamination for the sampling completed by Entrée. Re-assay checks of historical data and database entry checks did not identify any significant biases or database quality issues. The wax-coat water immersion procedure used by Entrée to measure specific gravity is an appropriate method. The selection of samples for SG measurement provides an adequate assessment of the variety of rock types encountered at Ann Mason. Comparison of Entrée SG results with SG measurements made by independent commercial laboratories did not identify any significant biases.
| | |
| 10/03/2017 |
Page 11 - 18
2017 Updated Preliminary Economic Assessment on the Ann Mason Project
Nevada, U.S.A.
| 12 | Data Verification |
| 12.1 | Verification by Amec Foster Wheeler |
| 12.1.1 | Ann Mason Data Verification |
Mr. Greg Kulla visited the Ann Mason Project and Entrée's office in Yerington, Nevada on the 6th and 7th of December, 2014.
Entrée provided Amec Foster Wheeler with files prepared by Entrée, and its consultants' supporting sample collection, preparation and analysis procedures and quality control assessment. Amec Foster Wheeler reviewed these reports and made the following checks:
| · | Reviewed drilling, logging, sampling, analysis, and data storage procedures |
| · | Reviewed geological interpretations on cross sections and plan maps |
| · | Quick-logged several drill holes and compared with archived drill logs |
| · | Resurveyed several drill collar northings and eastings with a hand-held GPS and compared with database records |
| · | Inspected outcrops and compared with surface geology maps |
| · | Reviewed down hole survey records for unrealistic kinks |
| · | Reproduced statistics assessing sample assay accuracy and precision for several drill campaigns. |
These checks helped Mr. Kulla develop an understanding of the mineralization styles and geological controls of the Ann Mason deposit and allowed for an assessment of the quality of data.
Mr. Kulla concludes the drilling logging and sampling procedures are appropriate for the style of mineralization at Ann Mason, that the assay data is reasonably accurate, and that the database is reasonably free of errors and is suitable to support estimation of mineral resources.
| 12.2 | Verification by AGP |
| 12.2.1 | Blue Hill Database Verification |
AGP checked the drill hole assay database for missing intervals, out of sequence intervals, non-numerical values, negative values, and min and max values. No errors were observed. Only one missing sample interval of 4.5 m in length was observed in the database in drill hole EG-BH-11-025, but was located in the overlying non-mineralized volcanic rocks. Sixteen missing intervals in historical holes were observed in non-mineralized rocks and three missing intervals were observed within the sulphide mineralization. Compositing routines substituted these missing intervals with zero grades.
| | |
| 10/03/2017 |
Page 12 - 1
2017 Updated Preliminary Economic Assessment on the Ann Mason Project
Nevada, U.S.A.
AGP selected four drill holes from the 2010/11 drilling for verification of the assay database against the assay results provided directly to AGP by ALS Minerals. A total of 759 samples results were crosschecked against the certificates that represents 20% of the total samples collected. AGP checked total copper, oxide copper, molybdenum, gold, and silver; however, not all samples were tested for all elements. No discrepancy was observed.
AGP also selected four drill holes from the historical drilling for verification of the assay database. A total of 984 sample results representing 35% of the historical assay database were cross checked against drill hole logs for two holes completed by Anaconda, and against laboratory certificates supplied by Entrée for two holes completed by PacMag. AGP checked total copper, molybdenum, gold, and silver; however, not all samples were tested for all elements. Only copper was checked for the Anaconda holes. No discrepancy was observed.
AGP did not cross check geology logs with lithological data in the database. As a grade shell was used to constrain the resource estimate, any errors in geological coding in the database would not be considered material to the results.
AGP did not cross check down hole survey measurements with the data in the database. As most holes were vertical, any errors would be minor in their impact.
| 12.2.2 | Site Visit |
Mr. Pierre Desautels visited the Project between February 27 and March 1, 2012, accompanied by Mr. Mario Colantonio of PES, Mr. Derek Kinakin and Mr. Warren Newcomen of BGC Engineering, and Mr. Jay Melnyk of AGP Mining Consultants. The visit was hosted by Mr. Rob Cinits, Director of Technical Services, Mr. Thomas Watkins, U.S. Exploration Manager, and Mr. Norman Page, Senior Geologist for Entrée. One drill rig was active during the site inspection.
The 2012 site visit entailed brief reviews of the following:
| · | overview of the geology and exploration history of the Project |
| · | current exploration program on the Project |
| · | infill drill program for resource category conversion |
| · | visits to drill site and drill hole collars check survey |
| · | drill rig procedures, including core handling discussion |
| · | surveying (topography, collar, and downhole deviations) |
| · | sample collection protocols at the core logging facility |
| · | sample transportation and sample chain of custody and security |
| | |
| 10/03/2017 |
Page 12 - 2
2017 Updated Preliminary Economic Assessment on the Ann Mason Project
Nevada, U.S.A.
| · | core recovery |
| · | QA/QC program (insertion of standards, blanks, duplicates, etc.) |
| · | monitoring of the QA/QC program |
| · | review of diamond drill core, core logging sheets, and core logging procedures (including commentary on typical lithologies, alteration and mineralization styles, and contact relationships at the various lithological boundaries) |
| · | specific gravity sample collection and determination |
| · | geological and geotechnical database structure, and all procedures associated with populating the final assay database with information returned from the laboratory. |
Geological Model
An interpretation of the geological model for Blue Hill was in progress at the time of the site visit. A set of cross-sectional interpretations drawn on paper and reconciled in two azimuths (similar to a fence diagram) was near completion. The interpreted model was supported mostly by reverse circulation holes, with a few diamond drill core holes. Well-organized chip trays facilitated the examination of the data collected.
Core Logging
The core handling was observed to be very efficient. The core is stored at the Entrée exploration office in Yerington, Nevada. The complex consists of a large warehouse with offices inside a fully fenced yard. Entrée also leases two nearby warehouses to store the RC chips, sample rejects, sample pulp, and Anaconda core.
The drill core boxes are marked in feet by the driller, and drill rods are also assumed to be imperial lengths. The core is collected daily by a geologist and brought to the Entrée exploration office. The core is placed onto a logging table, measured in metric units, and logged for lithology, mineralization, alteration, veining, structure, magnetic susceptibility, and RQD. Observations are recorded on paper forms, which are then transcribed into a computer. The geologist logging the core can visually identify the mineral assemblages in the mineralized zone. AGP observed the lithology and ICP assay results plotted on graphic logs, and the drill hole log was being adjusted as necessary by Entrée's geologists. AGP found that Entrée's core logging and validation procedure resulted in consistency between drill hole logs, which is important since the domains used in the resource model rely in part on the visual determination of the mineralized assemblages.
Core recovery in a number of core boxes examined by AGP showed rubble material, caused by weak fracture planes that break into small pieces when the core is emptied from the core barrel. This is evidenced by angular features of the recovered pieces. Sampling activity intensifies the core deterioration. Since solid core was recovered for these intersections, the measured core length is subject to interpretation by the logger. Entrée experimented with a triple tube core barrel, without much success considering the added cost. AGP recommends conducting a trial study to determine if core recovery is being estimated accurately in zones that are heavily fractured. AGP suggest estimating the core recovery by weighing the recovered contents of each run of a drill hole and dividing the results by an assumed weight of a full run of core with 100% recovery. The methodology assumes a constant SG. AGP recommends comparing the estimates with recoveries using the standard technique of measuring the length of the recovered core.
| | |
| 10/03/2017 |
Page 12 - 3
2017 Updated Preliminary Economic Assessment on the Ann Mason Project
Nevada, U.S.A.
AGP considered the core logging and core handling procedures to be industry standard.
Core Sampling
AGP observed core cutting by diamond saw blade. The saw blade was continuously cooled by fresh water. A decant tank was used to prevent the rock cuttings from leaking into the environment. During the site visit, core was often observed to be heavily fractured, and in these zones, the technician collected approximately half of the broken pieces.
Once cut, the core was tagged and sampled by a locally hired technician, who also inserted the required QA/QC control samples. The drill hole samples were individually bagged in 6 mil plastic bags and loaded in woven polypropylene sacks for shipment. The samples are picked up by the laboratory truck and driver at Entrée's warehouse. AGP found the security and chain of custody to be industry standard or better.
QA/QC Review
Quarter core twin samples were collected by re-sawing the half-core samples destined for delivery to the laboratory. The twin samples have a sample volume half that of the regular samples however, the twin samples are of equal volume to each other. AGP does not consider this an issue, as the grade is relatively consistent.
Packets of standard reference material were inserted in the sample chain without the suppliers' tags but with the regular sample tags used in the sample sequence.
Entrée uses crushable coarse blank material consisting of volcanic rock from a landscape supply store sourced in Reno, Nevada. The samples are inserted into the sample sequence to test for contamination at the sample preparation stage.
AGP observed QA/QC procedures exceeding industry standard.
Specific Gravity
Specific gravity laboratory equipment included a 0.1 g precision A&D GF8000 scale that is calibrated daily. SG is determined on dried, wax-coated core samples. Entrée uses a specific gravity standard to check the precision of the scale as part of the calibration process. The formula used by Entrée was found by AGP to be applied correctly.
| | |
| 10/03/2017 |
Page 12 - 4
2017 Updated Preliminary Economic Assessment on the Ann Mason Project
Nevada, U.S.A.
Independent Collection of Core Samples
Seven drill hole samples were collected by AGP during the site; four from Blue Hill and three from Ann Mason. Samples consisted of quarter-core splits and core fragments, except for two Blue Hill samples (89957 and 89958), which consisted of reverse circulation chips. The sample intervals replicated Entrée's intervals. AGP packaged the samples on site, and then shipped via courier directly to Activation Laboratories Ltd., Ancaster, Ontario, an independent laboratory not previously used by Entrée.
Samples were analyzed for gold using fire assay with an AA finish (code 1A2-50); copper, silver, and molybdenum were assayed using a four-acid digestion followed by ICP-OES (Code 8). The Blue Hill samples were also submitted for CN soluble copper and acid soluble copper analysis. All samples showed negligible gold, silver, or molybdenum values. Three of the Blue Hill samples indicated that most of the total copper is acid soluble, while one sample (89958) indicated total copper, which was mostly CN soluble and not acid soluble. From the assay results shown in Table 12-1 and Table 12-2, AGP concluded that the general range of values returned by the character samples collected during the site visit correspond well with those reported by Entrée.
Table 12-1: Blue Hill Check Sample Results
Hole ID | EG-BH-11-017 | EG-BH-11-016 | EG-BH-10-001 | EG-BH-10-005 | ||||
Sample number (AGP/Entrée) | 89955 / 620329 | 89956 / 620168 | 89957 / 609515 | 89958 / 610177 | ||||
Au (ppb) | <5 | - | 6 | - | <5 | <5 | <5 | <5 |
Ag (ppm) | <3 | - | <3 | - | <3 | <0.2 | <3 | 0.6 |
Cu (%) | 0.249 | 0.326 | 0.371 | 0.364 | 0.074 | 0.055 | 0.749 | 0.651 |
Mo (%) | <0.003 | 0.005 | <0.003 | 0.001 | <0.003 | <0.001 | 0.005 | 0.005 |
Cu-CN-Sol (%) | 0.002 | - | 0.005 | - | 0.002 | - | 0.314 | - |
Cu-Acid-Sol (%) | 0.228 | 0.285 | 0.303 | 0.268 | 0.053 | - | 0.098 | 0.057 |
Table 12-2: Ann Mason Check Sample Results
Hole ID | EG-AM-11-014 | EG-AM-11-022 | EG-AM-11-010 | |||
Sample number (AGP/Entrée) | 89954 / 639347 | 89959 / 643934 | 89960 / 619241 | |||
Au (ppb) | 250 | 237 | 195 | 194 | 7 | 11 |
Ag (ppm) | 4 | 3.9 | <3 | 4.3 | <3 | 0.7 |
Cu (%) | 0.878 | 0.760 | 0.959 | 1.060 | 0.280 | 0.418 |
Mo (%) | <0.003 | 0.005 | <0.003 | <0.001 | < 0.003 | 0.002 |
Collar Coordinate Validation
Collar coordinates were verified with the aid of a handheld Garmin GPS Map, Model 60CSx. A series of collars were randomly selected, and the GPS position was recorded. As shown in Table 12-3, results indicated an average difference in the X-Y plane of 2.5 m for the five holes where the instrument was located on the collar. On the Z plane, an average difference of 1.2 m was recorded. The differences observed are well within the accuracy of the hand held GPS unit used.
| | |
| 10/03/2017 |
Page 12 - 5
2017 Updated Preliminary Economic Assessment on the Ann Mason Project
Nevada, U.S.A.
Table 12-3: Collar Coordinate Verification
Gems Database Entry | GPS Point Recorded During Site Visit | Differences between Gems and GPS | |||||||
Point-ID | East | North | Elev. | Origin | East | North | Elev. | X-Y plane (m) | Z plane (m) |
BH-10-003 | 302041.9 | 4319125.7 | 1589 | AGP | 302041 | 4319125 | 1590 | 1.1 | -1.3 |
BH-10-001 | 302264.5 | 4319222.3 | 1599 | AGP | 302262 | 4319224 | 1596 | 3.0 | 2.8 |
AM-12-028 | 304420 | 4318144 | 1681 | AGP | 304418 | 4318143 | 1681 | 2.2 | 0.2 |
AM-12-027 | 303839.6 | 4317767.2 | 1622 | AGP | 303839 | 4317767 | 1618 | 0.7 | 4.3 |
D114 | 304399.7 | 4317533.6 | 1674 | AGP | 304397 | 4317529 | 1674 | 5.3 | -0.1 |
Average difference | 2.5 | 1.2 | |||||||
Site Visit Photos
Figure 12‑1 displays a photographs taken during the 2012 site visit.
Figure 12‑1: Site Visit Photos
Core Cutting in Progress | SG sample – hole BH-11-031 @ 586.75 m |
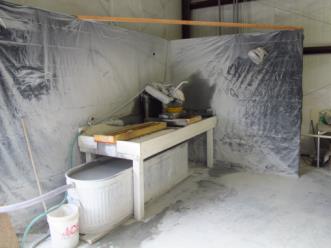 | 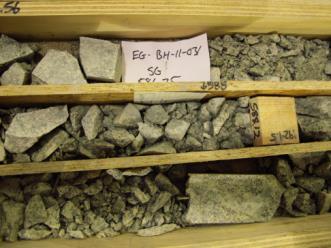 |
| | |
| 10/03/2017 |
Page 12 - 6
2017 Updated Preliminary Economic Assessment on the Ann Mason Project
Nevada, U.S.A.
Entrée main warehouse | Drill collar BH-10-003 |
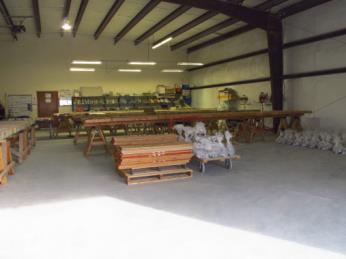 |  |
RC chip tray – Hole BH-10-013 | AGP Sample BH-11-016, 30-32 m |
 |  |
| |
| 10/03/2017 |
Page 12 - 7
2017 Updated Preliminary Economic Assessment on the Ann Mason Project
Nevada, U.S.A.
| 13 | Mineral Processing and Metallurgical Testing |
| 13.1 | Introduction |
Bench-scale metallurgical testwork programs on samples from the Ann Mason deposit were first carried out by The Anaconda Company in 1970, and more recently at Metcon Research in 2011/2012 and SGS in 2015. The objective in all of the work conducted to date has been to evaluate the response of the material to conventional sulphide concentration by froth flotation. A summary of the results of these programs now follows.
| 13.2 | The Anaconda Company, 1970 |
The earliest available testwork results on samples from the Ann Mason deposit date back to a 1970 report written by M.J. Noakes of The Anaconda Company. Diamond drill core assay reject samples, described to be "in good condition," were used for this work. The program consisted of head characterisation, mineralogy, and preliminary rougher and cleaner flotation tests.
In total, 21 samples from 9 different drill holes were crushed down to minus 10 mesh and split into 500 g charges. A single charge from each sample was combined to form one overall master composite described as "MN/AM-1." Polished sections were prepared from two samples taken from separate holes in the deposit: one from a chalcopyrite zone, and the other from a chalcopyrite-bornite zone. The Geophysical Division of The Anaconda Company carried out mineralogical examination by optical characterization and point counting. The results indicated that the material has a "simple mineralogy" with no significant interlocking between sulphides, although very little pyrite was detected in either sample. The report also characterizes the gangue as "unaltered" and unlikely to result in excessive slime generation.
A grinding series was conducted on the overall composite to determine the effect of particle size distribution on copper recovery in rougher flotation. The series consisted of six tests with lab mill grinding times ranging from 2 to 30 minutes. Results indicated that grinding finer than a P80 of 100 µm did not improve copper recovery, and that the optimum grind size lies somewhere between 185 µm (5 minute grind) and 100 µm (10 minute grind). Size-by-size assays on the tailings samples indicated that a significant increase in mineral liberation was not achieved beyond 10 minutes of lab mill grinding. As a result, all subsequent tests used a target grind P80 of 100 µm.
A standard test procedure was applied to each of the 21 individual composites. The flowsheet consisted of a 100 µm grind, followed by rougher flotation for 6 minutes at pH 10.5 using Dow Z-11 as a collector and MIBC, and a single stage of cleaning for 3 minutes, also at pH 10.5. There was no regrind step prior to cleaning. Arithmetic averages of the results of these tests are presented in Table 13-1.
| | |
| 10/03/2017 |
Page 13 - 1
2017 Updated Preliminary Economic Assessment on the Ann Mason Project
Nevada, U.S.A.
Table 13-1: Averaged Flotation Results from 21 Metallurgical Composites
Product | Weight (%) | Assays, % | Distribution, % | |||||
Cu | Mo | Fe | S | Weight | Cu | Mo | ||
Cleaner Concentrate | 1.5 | 25.8 | 0.198 | - | - | 1.5 | 85.9 | - |
Rougher Concentrate | 4.3 | 9.42 | 0.073 | - | - | 4.3 | 94.5 | 69.5 |
Rougher Tailing | 95.8 | 0.024 | 0.0014 | - | - | 95.8 | 5.5 | 30.5 |
Calculated Head | 100.0 | 0.415 | 0.0043 | - | - | 100 | 100 | 100 |
Head Sample | - | 0.409 | 0.0039 | 1.64 | 0.71 | - | - | - |
The results of the flotation testwork on the individual composites are consistent with those from the master composite MN/AM-1. Rougher copper recovery ranged from 91.5% to 99.8%, and averaged 94.5%. Mass recovery to the rougher concentrate ranged from 3.0% to 7.8%.
Single stage, open circuit cleaning without a regrind resulted in an average cleaner copper recovery of 85.9%. It is reasonable to expect that losses to the first cleaner tails could be reduced through optimization of the 1st cleaner stage, addition of a regrind step, and/or the addition of a cleaner scavenger.
Cleaner concentrate grades averaged an acceptable 25.8% Cu, but varied widely: from 8.4% Cu to 38.7% Cu. The poorest grades were associated with two samples that showed much higher than average S:Cu ratios, on the order of 5:1 to 6:1. These samples likely contained elevated concentrations of activated pyrite that diluted the concentrate. Conversely, final concentrate grades exceeding 38% Cu were seen for two of the composites whose S:Cu ratios were well below 1.0. The presence of bornite in these samples is believed to contribute to the high copper grades.
Molybdenum head grades in the flotation composites ranged from 5 ppm to 88 ppm. Rougher recovery averaged 69.5% to a concentrate grading 730 ppm Mo. Molybdenum recoveries to the cleaner concentrate were not reported, but the grade averaged 1,590 ppm Mo. Copper/molybdenum separation testing was not attempted due to the low head grade of the sample and the limited mass of sample available.
In addition to molybdenum, a small amount of silver, averaging 1 ppm, was identified in the head samples. Flotation results indicated that the silver follows the copper and molybdenum.
| |
| 10/03/2017 |
Page 13 - 2
2017 Updated Preliminary Economic Assessment on the Ann Mason Project
Nevada, U.S.A.
| 13.3 | Metcon Research, 2011 |
In July 2011, assay reject samples from the Ann Mason deposit arrived at Metcon Research in Tuscon, Arizona for metallurgical testing. The purpose of the program was to conduct a preliminary flotation study leading to the development of a process flowsheet for optimal concentration of the Ann Mason material.
| 13.3.1 | Head Characterization |
Two metallurgical composites, each representing assay reject samples from a single drill hole from two separate mineralized domains within the Ann Mason deposit, were generated. The first composite was from core drill hole EG-AM-11-003 and included 19 contiguous 2 m intervals between 768 m and 806 m depth within the chalcopyrite-bornite domain. The second composite was from core drill hole EG-AM-11-009 and included 18 contiguous 2 m intervals between 194 and 230 m depth within the chalcopyrite domain. Table 13-2 provides a summary of the head assays for the composites.
Table 13-2: Head Analysis of the Composite Samples
Sample | Assays, %, g/t | ||||||
Cu | Mo | Ag | Au | ST | Fe | Insol. | |
EG-AM-11-003 | 0.46 | 0.0160 | 0.90 | 0.071 | 0.33 | 0.58 | 91.74 |
EG-AM-11-009 | 0.37 | 0.0084 | 0.30 | 0.018 | 0.36 | 1.69 | 87.42 |
Copper and molybdenum grades for the new composites were comparable to those from the Anaconda work in 1970. The sulphur to copper ratios ranged from 1.0 (EG-AM-11-009) to 0.7 (EG-AM-11-009), and were at the lower end of the scale compared to the earlier work.
Quantitative mineralogical study of the composite head samples was conducted by Mineral Liberation Analyzer (MLA) at the Center for Advanced Mineral and Metallurgical Processing at The University of Montana. The results indicated that copper mineralization for the EG-AM-11-003 composite consisted of both chalcopyrite (64%) and bornite (36%), whereas for the EG-AM-11-009 composite the copper was almost entirely (>99%) chalcopyrite.
Mineral locking data indicates that chalcopyrite particles are well liberated in all size fractions, with the exception of the minus 37 µm particles for composite EG-AM-11-003. Where present, bornite showed a strong association with chalcopyrite.
| 13.3.2 | Rougher Flotation Tests |
A series of batch rougher flotation tests were carried out on 1.5 kg charges of each composite. The purpose of these tests was to identify optimum flotation conditions for copper and molybdenum recovery. Variables evaluated during this testwork included primary grind size, pH, collector type, and collector dosage.
| | |
| 10/03/2017 |
Page 13 - 3
2017 Updated Preliminary Economic Assessment on the Ann Mason Project
Nevada, U.S.A.
Rougher flotation recoveries at varying primary grind sizes are presented in Figure 13-1. The results indicate only a very slight increase in recovery with finer grinding, within the P80 range of 74 µm to 149 µm, for both composites. In comparison, coarser grinding appears to favour higher molybdenum recoveries, possibly due to increased smearing of molybdenite at longer grind times. Based on these results, a primary grind P80 of 105 µm was selected for all subsequent testwork in this program.
Figure 13-1: Effect of Grind Size on Copper and Molybdenum Recovery in Rougher Flotation
(label 003 corresponds to composite sample EG-AM-11-003)
(label 003 corresponds to composite sample EG-AM-11-003)

A series of tests was carried out to evaluate the effect of pulp pH on rougher flotation kinetics. The tests compared the natural pH (~7.5) of the material with pH adjusted to 9.0, 10.0, and 11.0 through the addition of lime. For both composites, the overall mass pulled to concentrate decreased as pulp pH increased, but copper, molybdenum, and sulphur recovery was essentially unchanged. It should be noted however, that pH may be an important means of maintaining selectivity against pyrite for zones demonstrating higher S:Cu ratios than those of the composites tested here.
Collector types and dosages were looked at by comparing combinations of C-3330 (SIPX) and fuel oil, with MX-3045 (a xanthate ester blend). Similar to the effect of grind size and pH, changes in collector had little if any influence on copper recovery under the conditions tested, with recoveries ranging from 95.5% to 96.5%. Slightly more variability was observed in the recoveries for molybdenum and silver between tests, but these differences may be more attributable to very low head grades and analytical uncertainty, rather than any change in the test conditions themselves.
| | |
| 10/03/2017 |
Page 13 - 4
2017 Updated Preliminary Economic Assessment on the Ann Mason Project
Nevada, U.S.A.
Based on the results of the collector series, reagent additions of 10 g/t C-3330 and 28 g/t fuel oil were selected for the rougher circuit.
The addition of a surfactant, Triton, was found to have no impact on molybdenum recovery.
| 13.3.3 | Cleaner Flotation Tests |
Batch cleaner flotation tests were carried out to evaluate the effect of sodium silicate and rougher concentrate regrinding on rejecting gangue minerals, and to evaluate flotation kinetics in the first and second cleaning stages.
For both composites, the addition of sodium silicate (in dosages from 100 g/t to 300 g/t) had a negative impact on 1st cleaner concentrate copper grade, with no effect on recovery.
The effect of regrinding prior to cleaner flotation on metal recovery is presented in Figure 13‑2. The results indicate that for both composites optimum results were achieved with a regrind size P80 of 44 µm.
Figure 13‑2: Effect of Regrind Size on Copper and Molybdenum Recovery in Cleaner Flotation
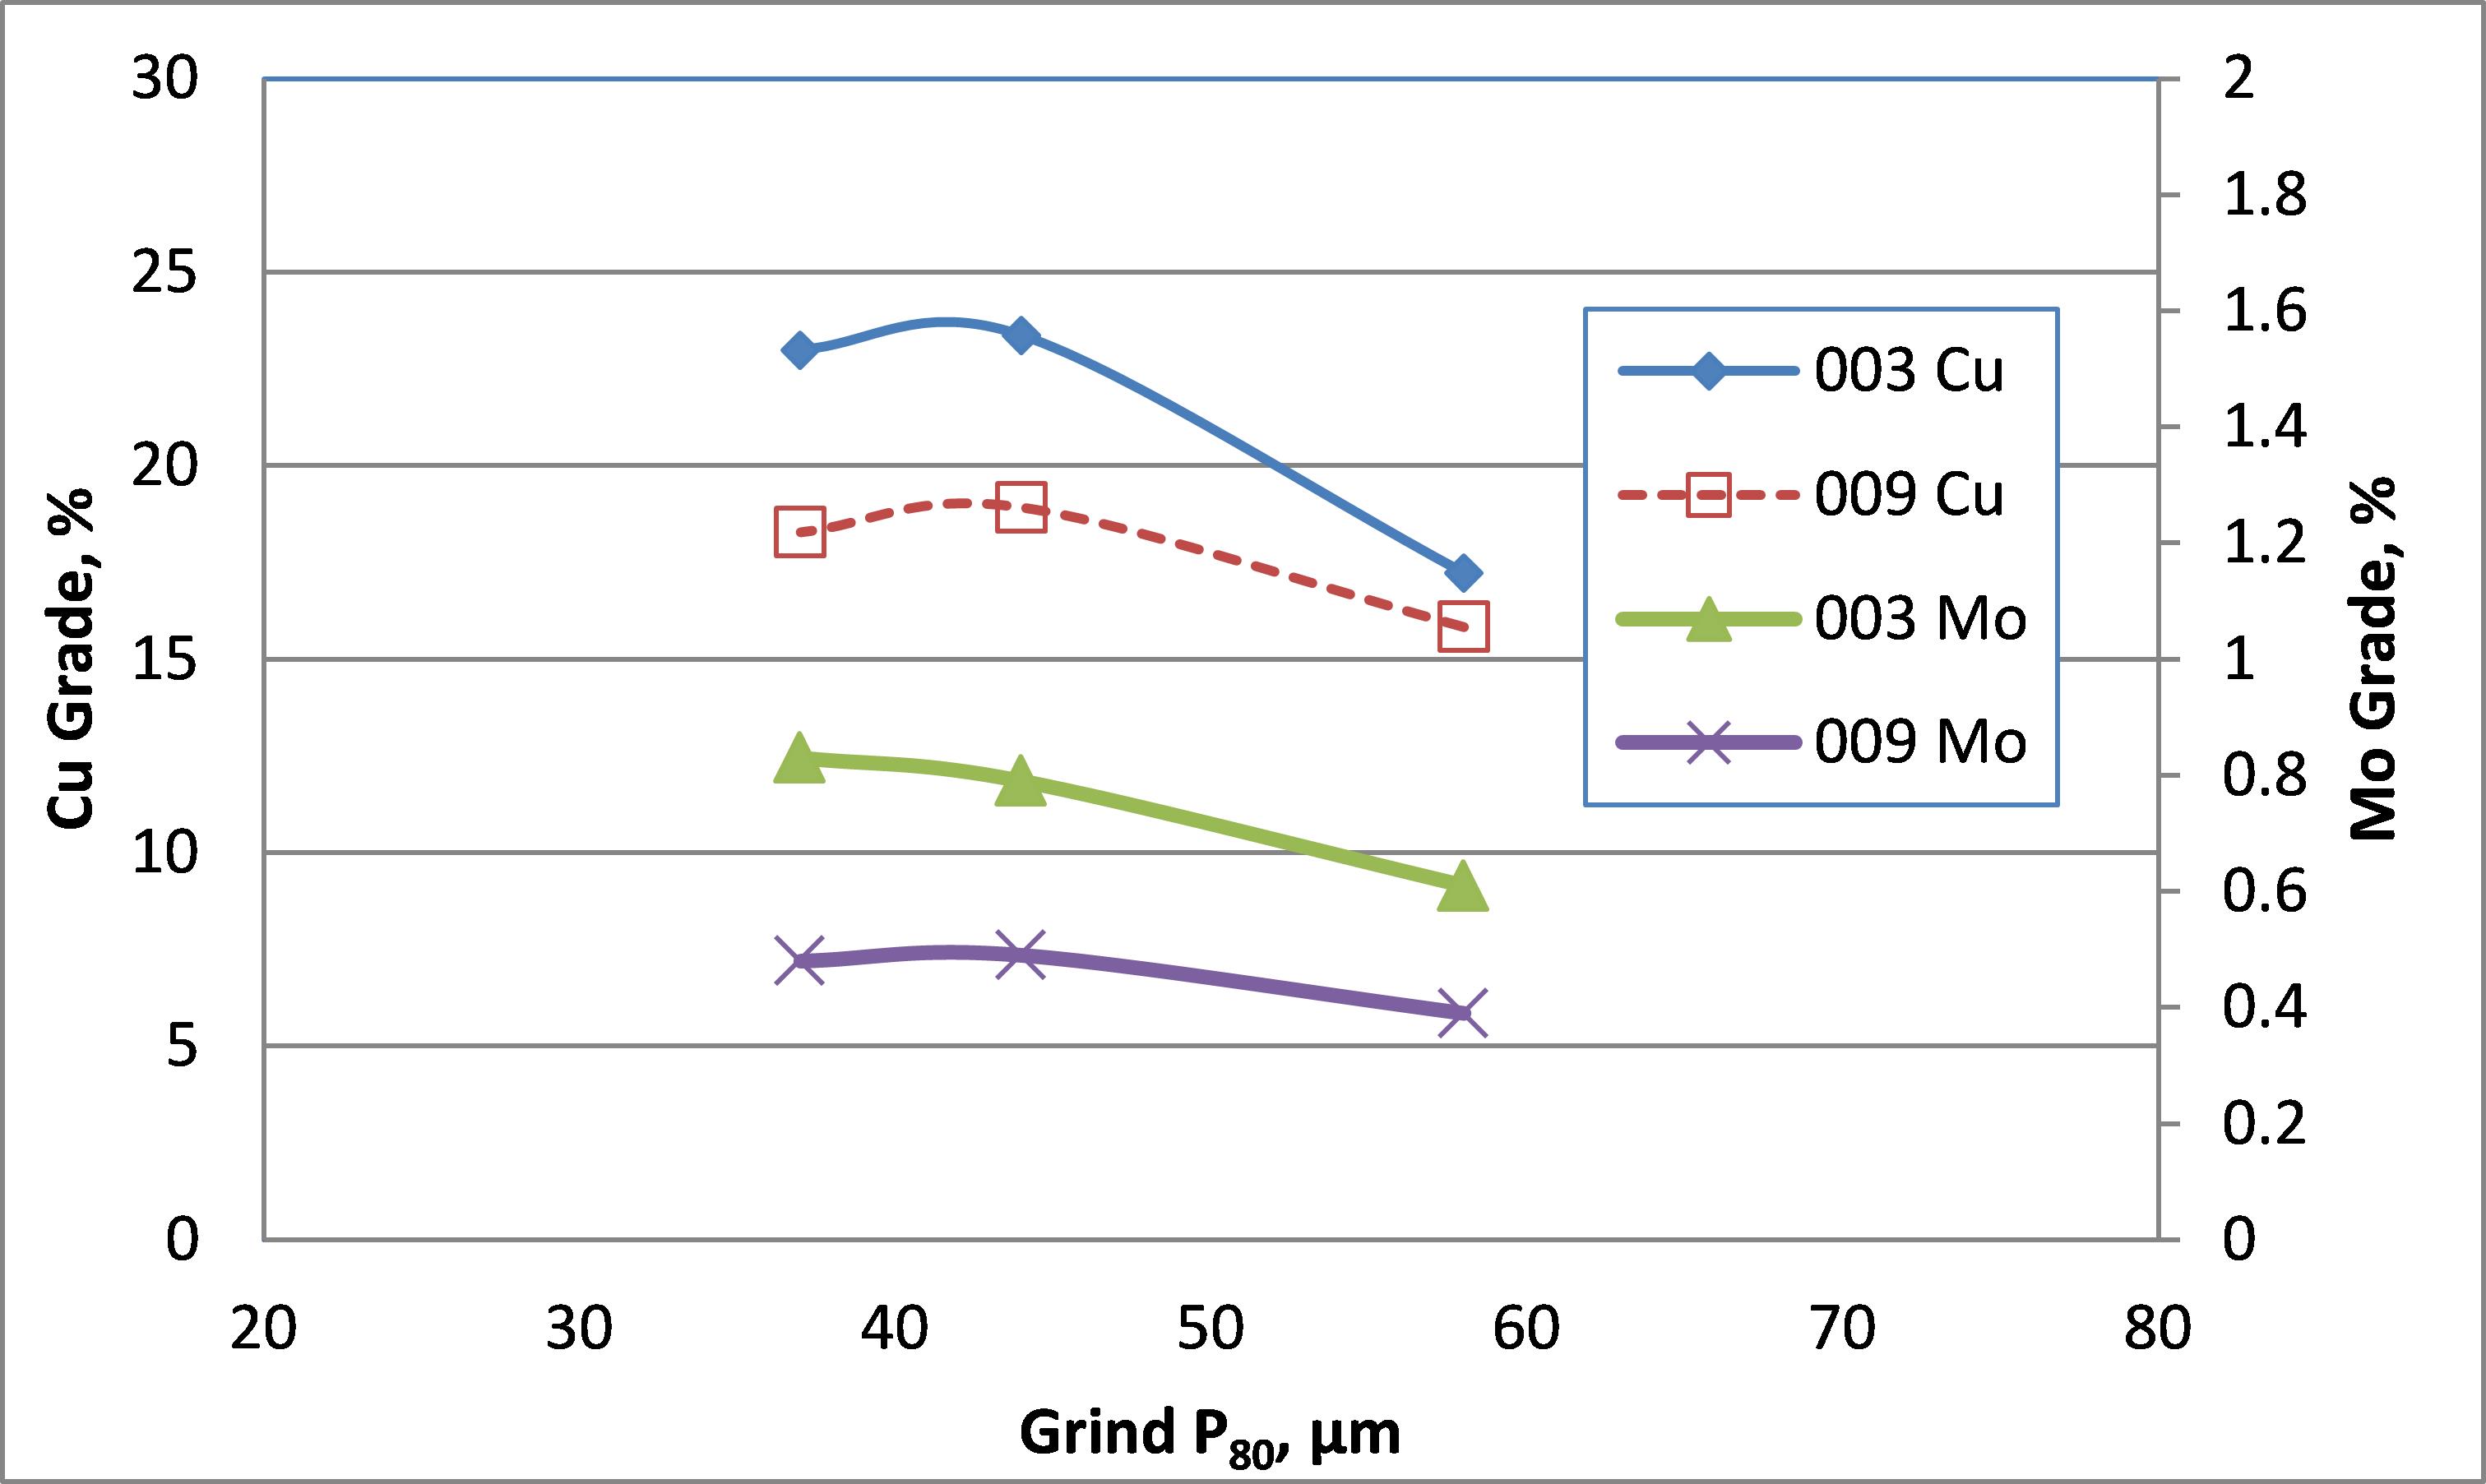
Kinetic sampling of the cleaner circuit revealed that moderate flotation times: 1st cleaner – 6 minutes; 1st cleaner scavenger – 4 minutes; and second cleaner – 4 minutes, are sufficient for batch flotation using the equipment tested. For composite EG-AM-11-003 an open circuit copper grade of 34.8% was achieved at a recovery of 87.1%. In comparison, composite EG-AM-11-003 generated a grade of 28.6% Cu at a recovery of 91.7%.
| | |
| 10/03/2017 |
Page 13 - 5
2017 Updated Preliminary Economic Assessment on the Ann Mason Project
Nevada, U.S.A.
| 13.3.4 | Locked Cycle Testing |
The optimized rougher and cleaner flotation conditions discussed in the previous two sections were used to carry out a six-cycle cleaner flotation test on each of the composite samples. The test was "locked" by recycling the rougher scavenger and cleaner scavenger concentrates from each cycle to the rougher conditioner stage of the subsequent cycle. In a similar fashion, the second cleaner tailings were recycled to the first cleaner feed.
Both tests demonstrated reasonably good stability between cycles in terms of mass and metal recovery to final concentrate. Table 13-3 and Table 13-4 provide a summary of grades and recoveries for the last four cycles from each test.
Table 13-3: Grades and recoveries for the last four cycles of the Locked Cycle Test
on composite EG-AM-11-003
on composite EG-AM-11-003
FT-C3-22 Cycle | Grade, %, g/t | Recovery, % | ||||||||||
Cu | Mo | Ag | Au | ST | Insol. | Cu | Mo | Ag | Au | ST | Insol. | |
C | 36.3 | 1.10 | 69 | 3.9 | 17.6 | 12.4 | 93.3 | 74.8 | 70.5 | 79.7 | 61.6 | 0.18 |
D | 35.1 | 1.19 | 70 | 3.6 | 20.9 | 14.1 | 93.8 | 77.1 | 73.0 | 77.2 | 72.3 | 0.21 |
E | 36.6 | 1.18 | 70 | 4.0 | 17.6 | 13.4 | 93.7 | 78.5 | 67.5 | 78.1 | 66.9 | 0.20 |
F | 35.2 | 1.12 | 68 | 3.8 | 18.7 | 14.4 | 93.9 | 77.1 | 70.3 | 78.1 | 73.1 | 0.21 |
Average | 35.8 | 1.15 | 69 | 3.8 | 18.7 | 13.6 | 93.7 | 76.9 | 70.3 | 78.2 | 68.5 | 0.20 |
Table 13-4: Grades and recoveries for the last four cycles of the Locked Cycle Test
on composite EG-AM-11-009.
on composite EG-AM-11-009.
FT-C9-22 Cycle | Grade, %, g/t | Recovery, % | ||||||||||
Cu | Mo | Ag | Au | ST | Insol. | Cu | Mo | Ag | Au | ST | Insol. | |
C | 27.0 | 0.68 | 22 | 0.94 | 23.8 | 16.5 | 92.9 | 63.4 | 38.3 | 45.9 | 84.5 | 0.27 |
D | 27.8 | 0.72 | 20 | 1.11 | 24.3 | 14.8 | 93.7 | 64.2 | 36.1 | 45.8 | 85.1 | 0.23 |
E | 26.3 | 0.68 | 23 | 1.09 | 27.9 | 18.1 | 94.0 | 67.3 | 42.5 | 48.4 | 82.3 | 0.31 |
F | 25.5 | 0.67 | 22 | 0.99 | 22.0 | 17.6 | 93.3 | 68.5 | 38.5 | 38.8 | 80.1 | 0.29 |
Average | 26.7 | 0.69 | 22 | 1.03 | 24.5 | 16.7 | 93.5 | 65.8 | 38.8 | 44.7 | 83.0 | 0.28 |
Locked cycle copper grades for both composites were similar to the open circuit results. The achieved copper grades, 35.8% for EG-AM-11-003 and 26.7% for EG-AM-11-009, can be considered as saleable. In addition, both composites resulted in a copper recovery to final concentrate of greater than 93%.
Molybdenum, silver, and gold recoveries for the higher grade EG-AM-11-003 composite were 77%, 70%, and 78%, respectively.
| | |
| 10/03/2017 |
Page 13 - 6
2017 Updated Preliminary Economic Assessment on the Ann Mason Project
Nevada, U.S.A.
| 13.3.5 | Cu/Mo Separation |
In an effort to evaluate the potential for molybdenum recovery as a separate concentrate, a 30 kg charge of each composite was used to generate a bulk sample of second cleaner concentrate for a copper-molybdenumb separation test. The molybdenum circuit employed a conventional reagent scheme consisting of NaSH conditioning and nitrogen sparging to depress the copper minerals, with fuel oil added to collect the molybdenite.
Figure 13-3 presents the results of successive cleaning stages on grade and recovery to the open circuit concentrate. The tests had to be halted before marketable concentrate grades were reached due to low sample weight. For the higher grade EG-AM-11-003 composite this was after three cleaner stages, for the lower grade composite only two cleaners were possible. From the results presented here, it appears that five stages of cleaning would likely be required to reach a 50% Mo grade in the final concentrate. This would represent a typical configuration for a copper-molybdenum separation circuit.
Figure 13-3: Molybdenum Grade-Recovery Curves for the Cu-Mo Separation
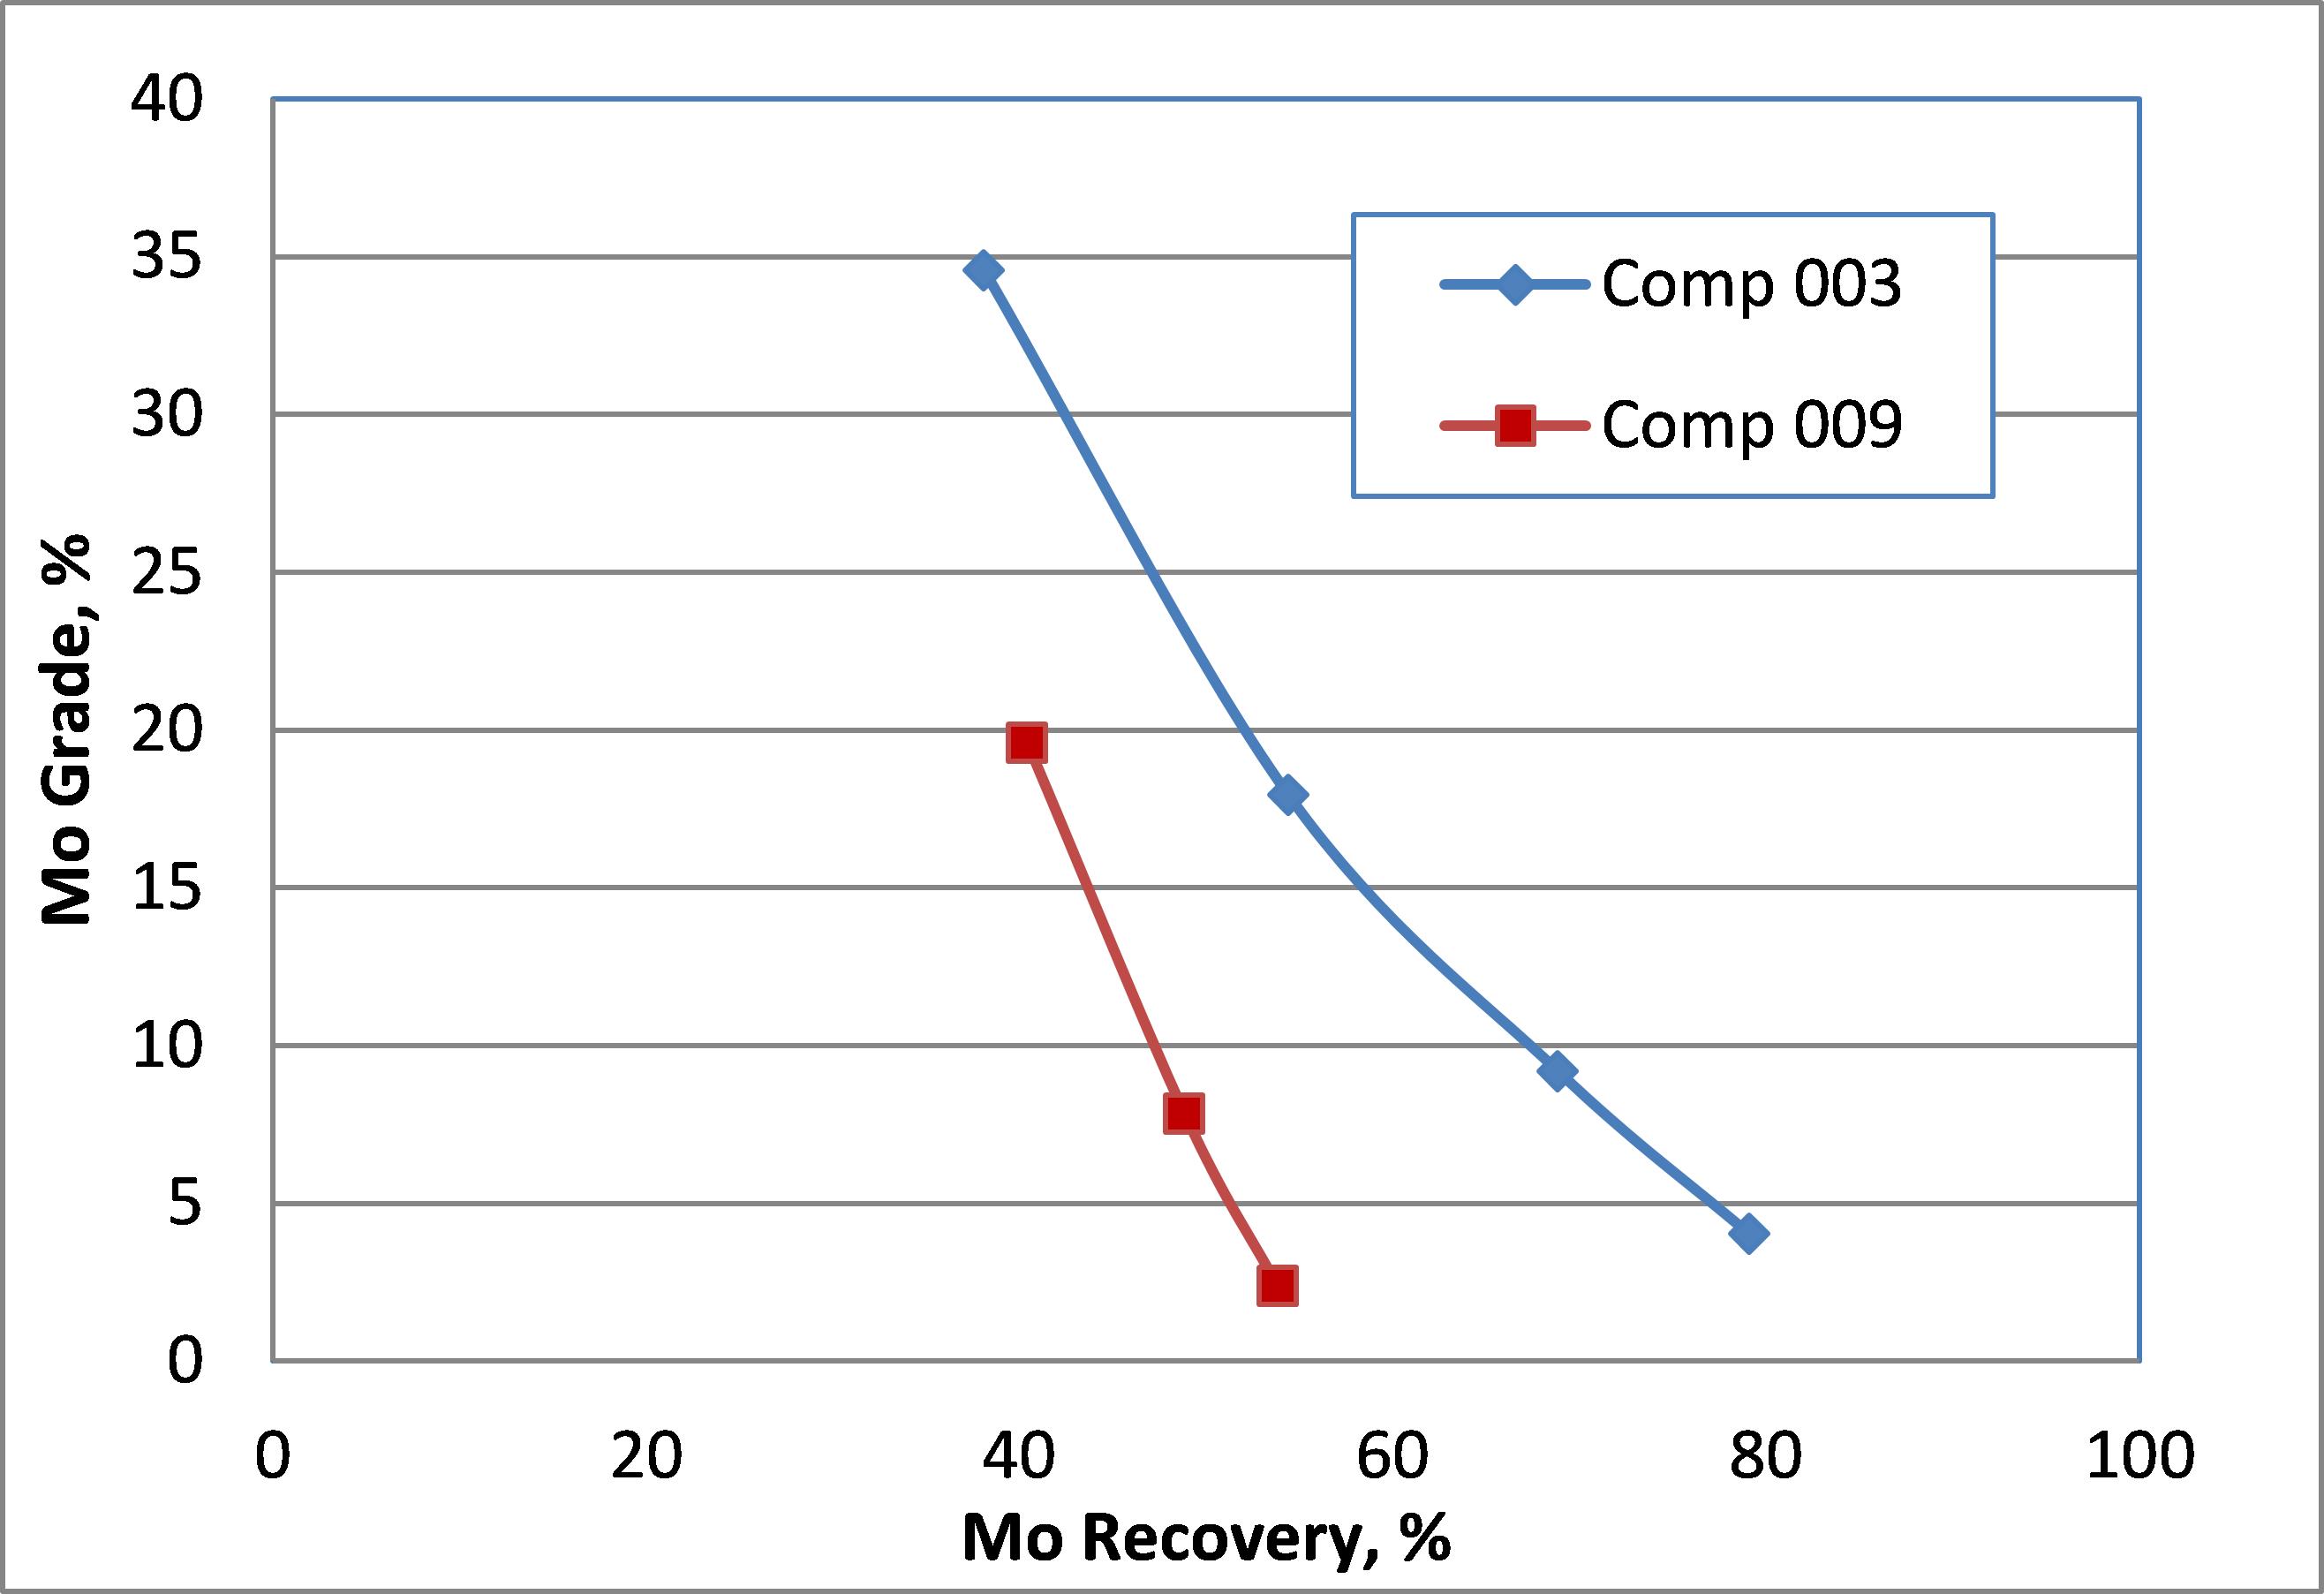
| 13.3.6 | Minor Element Analysis |
Samples of both final concentrates for the copper-molybdenum separation tests were submitted for an ICP multi-element scan to evaluate the products for potential deleterious components that might affect marketing. Results of the scans are presented in Table 13-5.
| | |
| 10/03/2017 |
Page 13 - 7
2017 Updated Preliminary Economic Assessment on the Ann Mason Project
Nevada, U.S.A.
Table 13-5: Minor Element Analysis for the Cu-Mo Separation Tests Final Products
Element | Unit | EG-AM-11-003 | EG-AM-11-009 | ||
Mo Conc. | Cu Conc. | Mo Conc. | Cu Conc. | ||
Al | % | 0.5 | 1.44 | 1.83 | 1.93 |
As | ppm | 388 | <1 | 220 | <1 |
Ba | ppm | 146 | 168 | 118 | 229 |
Bi | ppm | <1 | <1 | <1 | <1 |
Ca | % | 1.15 | 1 | 0.95 | 0.71 |
Cd | ppm | 19 | <1 | 6 | <1 |
Co | ppm | <1 | 5 | <1 | 97 |
Cr | ppm | 133 | 459 | 379 | 312 |
Fe | % | 9.35 | 22.8 | 16.2 | 26.5 |
Hg | ppm | <1 | <1 | <1 | <1 |
K | % | 0.12 | 0.33 | 0.43 | 0.48 |
La | ppm | <1 | 4 | <1 | 3 |
Mg | % | 0.13 | 0.12 | 0.35 | 0.27 |
Mn | ppm | 34 | 67 | 74 | 62 |
Na | % | 0.32 | 0.66 | 0.71 | 0.75 |
Ni | ppm | 78 | 277 | 210 | 212 |
P | ppm | nss | 538 | nss | 174 |
Pb | ppm | <1 | 618 | 39 | 451 |
Sb | ppm | <1 | 102 | <1 | 33 |
Sc | ppm | <1 | <1 | <1 | <1 |
Sr | ppm | 63 | 187 | 116 | 210 |
Ti | ppm | 175 | 724 | 942 | 1,416 |
Tl | ppm | <1 | 3 | <1 | <1 |
V | ppm | <1 | <1 | <1 | <1 |
W | ppm | <1 | <1 | <1 | <1 |
Zn | ppm | 266 | 10 | 229 | <1 |
Zr | ppm | 7 | 32 | 30 | 38 |
The analysis revealed no elements of concern. Arsenic levels in the molybdenum concentrates were elevated, but are still likely below penalty concentrations. Repeat assays were required for phosphorous due to a suspected analytical interference on the original measurement, unfortunately an insufficient quantity of the molybdenum final concentrates were available to carry out the second analysis.
| 13.4 | Metcon Research, 2012 |
Follow-up metallurgical testwork was carried out at Metcon research between February and July 2012, with the objective of completing additional study in two areas: a preliminary characterisation of Ann Mason material grindability, and variability flotation testing on a lower-grade, high pyrite zone of the deposit.
| | |
| 10/03/2017 |
Page 13 - 8
2017 Updated Preliminary Economic Assessment on the Ann Mason Project
Nevada, U.S.A.
| 13.4.1 | Grindability Study |
A single, 30 kg, composite comprised of samples from four drill holes in the Ann Mason deposit was submitted to Phillips Enterprises, via Metcon Research, for grindability testing. The samples consisted of 2 m sections of split drill core from each of the four holes.
Testwork included a Crushing Work Index (CWI), Abrasion Index (AI), and Bond Ball Work Index (BBWI) at a closing size of 100 mesh (150 µm). Results of the grindability testwork are presented in Table 13-6.
Table 13-6: Grindability Results for the Ann Mason Composite Sample
Test | Ai (g) | Wi (kWh/tonne) |
Crusher Work Index | - | 7.25 |
Bond Ball Work Index | 15.65 | |
Abrasion Index | 0.2830 | - |
Results of the grindability testing indicate that the composite tested can be characterised as being of average hardness and abrasivity, as compared to other low-grade sulphide deposits.
| 13.4.2 | Variability Testing: Low-Grade, Cpy-Py Zone |
New split core samples, representing the chalcopyrite-pyrite zone of the deposit, were delivered to Metcon Research in March 2012. The samples were combined to form two variability composites: a Low-Grade Composite (LG), and a Mid-Grade Composite (MG). Head analysis of the variability composites is presented in Table 13-7.
Table 13-7: Head Analysis of the Low-Grade and Mid-Grade Composite Samples
Sample | Assays, %, g/t | |||||
Cu | Mo | Ag | Au | ST | Fe | |
Low-Grade Comp | 0.197 | 0.0013 | 1.1 | 0.016 | 3.12 | 2.49 |
Mid-Grade Comp | 0.279 | 0.0061 | 1.0 | 0.020 | 0.73 | 1.56 |
Head analysis revealed that both composites are lower than the Mineral Resource estimate copper grade of 0.33%. In addition, the sulphur to copper ratio, which for the main zone composites was on the order of 1:1, is much higher here, in particular for the Low-Grade sample.
| | |
| 10/03/2017 |
Page 13 - 9
2017 Updated Preliminary Economic Assessment on the Ann Mason Project
Nevada, U.S.A.
The Anaconda work summarized in an earlier section identified that for samples with S:Cu ratios exceeding 5:1 the final concentrate copper grade dropped below 10% due to the presence of activated pyrite. With a S:Cu ratio of more than 15:1, the Low-Grade Composite could be expected to present some challenges achieving a saleable concentrate grade.
Rougher flotation testwork indicated that, unlike the main zone composites, the Cpy-Py composites demonstrated improved recovery at higher pH. Specifically, at a pulp pH of 10.0, the combined rougher + scavenger copper recoveries for the LG and MG composites were 94.9% and 95.7%, respectively, which compares well with the main zone rougher results at natural pH.
Initial cleaning tests were carried out under the conditions optimized in the earlier program. As anticipated, difficulty was encountered in rejecting pyrite in the cleaner circuit, which resulted in poor 2nd cleaner concentrate grades. For the LG composite the final concentrate graded 10.4% Cu and 42.8% S, indicating the extent of the pyrite problem. Results for the MG composite were better, but the open-circuit final concentrate grade only reached 19.5% Cu.
Efforts to depress pyrite in the cleaner circuit included the addition of HQS (sodium silicate, sodium phosphate, and quebracho), adding a third cleaner, and increasing the pulp pH in successive cleaner stages to pH 12.0. No effect was observed with the addition of HQS, but the additional cleaning and higher pH in the cleaners did improve the LG final concentrate copper grade from 10.4% to 23.9%.
A further change to the reagent scheme was introduced with the elimination of xanthate in the roughers, leaving only the more copper-selective dithiophosphate reagent A-238 as a collector. This had the effect of significantly reducing pyrite recovery in the rougher flotation stage, and resulted in an increase of the final concentrate grade for the LG composite to 27.4%, at improved open-circuit recovery. The addition of a small amount of fuel oil to the primary grind was also observed to have a positive effect on copper and molybdenum recovery. Maximum final concentrate copper grades for the LG and MG composites were found to be 28.8% and 31.1%, respectively.
Locked cycle testing was conducted on the two composites under the optimized reagent and flowsheet conditions. Each test consisted of six cycles and included the third cleaner stage shown to be beneficial in the open-circuit testing. Table 13-8 provides a summary of the locked cycle test results for the variability composites.
| | |
| 10/03/2017 |
Page 13 - 10
2017 Updated Preliminary Economic Assessment on the Ann Mason Project
Nevada, U.S.A.
Table 13-8: Average Grades and Recoveries for the last four cycles of the Locked Cycle Test on the Low-Grade and Mid-Grade Composites
Composite | Grade, %, g/t | Recovery, % | ||||||||||
Cu | Mo | Ag | Au | ST | Insol. | Cu | Mo | Ag | Au | ST | Insol. | |
LG | 21.2 | 0.107 | 29 | 1.3 | 24.1 | 8.93 | 92.1 | 16.6 | 21.2 | 59.7 | 10.8 | 0.08 |
MG | 25.9 | 0.457 | 32 | 1.6 | 20.6 | 9.35 | 92.4 | 57.9 | 26.4 | 71.1 | 39.8 | 0.11 |
The average concentrate grades for the locked cycle tests were found to be somewhat lower than those achieved in the open-circuit testing. This may indicate that further small refinements are required in terms of reagent additions or flotation times in order to properly optimize the circuit. Given the low grade of the sample, a larger cycle charge size might also improve performance through better "froth crowding" in the cleaner stages.
The work summarized here indicates that a potential activated pyrite problem associated with the high S:Cu ratios in the Cpy-Py domain can be mitigated through minor reagent changes and the addition of a third cleaner stage. The extent to which these changes would need to be incorporated into the plant flowsheet or operating procedures is dependent on the relative distribution of the domains, the mining plan, and the potential for material blending to achieve an average S:Cu ratio in the plant feed. Additional testwork in the next phase of the program is expected to provide more insight in those areas.
| 13.5 | SGS Minerals Services, 2015 |
A comprehensive metallurgical test program was started in April 2015 at SGS Minerals Services in Lakefield, ON. The objective of the program was to further advance metallurgical understanding of the Ann Mason deposit by selecting and testing a series of geometallurgical domain and production composites. In addition, a variability program was designed to anticipate the likely range of metallurgical performance from the developed flowsheet.
| 13.5.1 | Sample Selection |
A total of 1,700 kg of split core and assay reject samples were shipped from the Ann Mason deposit to SGS in Lakefield, ON. The samples were selected at random from the database of available core and assay reject intervals within the Phase 5 pit shell. Samples were organized by domain, with ~500 kg of sample representing each of the Chalcopyrite, Bornite, and Pyrite zones. In addition, 200 kg of large diameter, PQ core was collected to serve as feed for a JK Drop-Weight test.
Each set of domain samples were organized into three production horizons: Years 1 to 3, Years 4 to 9, and Year 10+. Half of the samples available from each horizon were combined to form a domain composite. From the remaining samples, production composites were generated for the Years 1 to 3 and Years 4 to 9 periods, according to the domain ratios predicted by the mine plan.
| | |
| 10/03/2017 |
Page 13 - 11
2017 Updated Preliminary Economic Assessment on the Ann Mason Project
Nevada, U.S.A.
The composites were blended and sampled as required to provide test charges for grindability testwork. Reject fractions were crushed to -10# and freezer stored to serve as feed for flotation testing. Table 13-9 provides a summary of the head assays for the Zone Composites.
Table 13-9: Head Analysis for the Zone Composites
Element | Unit | Comp A1 Cpy Zone | Comp A2 Bn Zone | Comp A3 Py Zone |
Cu | % | 0.32 | 0.30 | 0.20 |
Mo | % | 0.004 | 0.006 | 0.003 |
Au | g/t | 0.04 | 0.05 | 0.02 |
Ag | g/t | 0.5 | 1.1 | 0.4 |
Fe | % | 1.74 | 0.93 | 2.41 |
S | % | 1.04 | 0.34 | 1.60 |
S= | % | 0.70 | 0.24 | 1.04 |
| 13.5.2 | Grindability |
Test charges from the domain and production composites were submitted for hardness testing by Bond Ball Work Index (BBWI), Bond Rod Work Index (BRWI), and SAG Mill Competency (SMC) testing. In addition, the large diameter core sample was submitted for a full JK Drop-Weight test as well as Crushing Work Index (CWi). Table 13-10 presents a summary of the results of the grindability work.
Table 13-10: Summary of hardness testing results for the Zone and Drop Weight Composites
Composite | BRWI (kWh/t) | BBWI (kWh/t) | JKDW | SMC A x b | |
A x b | ta | ||||
Chalcopyrite Zone | 16.7 | 15.9 | - | - | - |
Bornite Zone | 14.6 | 14.9 | - | - | - |
Pyrite Zone | 15.5 | 16.8 | - | - | - |
Drop Weight | - | - | 49.4 | 0.78 | 42.6 |
The Axb values obtained put the sample as tested in the Medium range for SAG milling. The ta number is a measure of the abrasiveness of the material, and a value of 0.78 puts it in the Soft to Moderately Soft range. The Bond WI numbers for the Py Zone composite are comparable to the results of the other two zones, and are in the medium-hard range indicated by the results of hardness testing in 2012.
| | |
| 10/03/2017 |
Page 13 - 12
2017 Updated Preliminary Economic Assessment on the Ann Mason Project
Nevada, U.S.A.
| 13.5.3 | Rougher Flotation |
Development testwork for the rougher circuit was focused primarily on the Chalcopyrite zone composite as this domain represents the majority of feed to the mill, particularly during the early years of production. Confirmatory tests were run on the Bornite and Pyrite Zone composites to provide additional support to the flowsheet.
Reagent Series
The initial series of tests focused on collector selection and addition. In the 2012 testwork the optimized flowsheet used sodium isopropyl xanthate (SIPX), MX-3045, and A-238 as collectors, and this was used as a starting point here. In addition, the effect of fuel oil and A3894 were also investigated. In Figure 13-4, the rougher kinetics curves for four different collector combinations are presented. The results indicate similar performance in all four tests, with a slight improvement in recovery with the fuel oil/SIPX test. Subsequent testwork focused on the fuel oil/SIPX combination due to favourable results compared to the specialty collectors, and lower operating cost.
Figure 13-4: Rougher Flotation Kinetic Curves for Different Collector Combinations
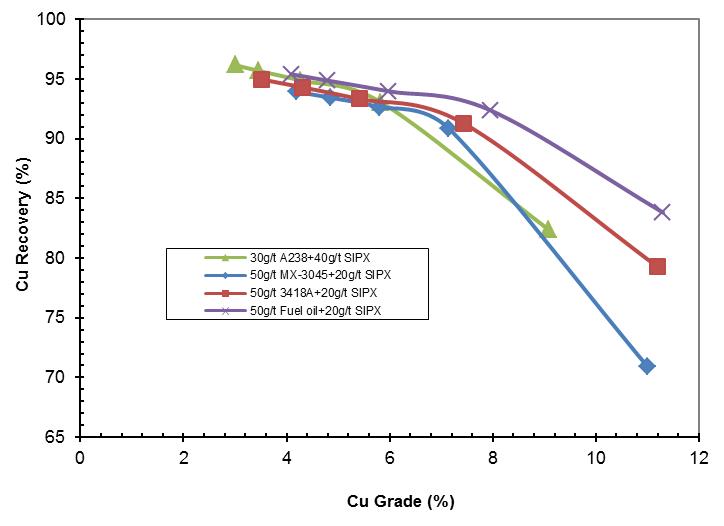
Grind Size series
A series of rougher kinetics flotation tests were conducted to investigate the effect of primary grind size on copper and molybdenum recovery. A range of grind size P80's, from 116 µm to 193 µm, were tested with the effect of this parameter on the final tailings copper grade depicted in Figure 13-5.
| |
| 10/03/2017 |
Page 13 - 13
2017 Updated Preliminary Economic Assessment on the Ann Mason Project
Nevada, U.S.A.
Figure 13-5: Effect of Primary Grind Size on Rougher Tailings Copper Grade
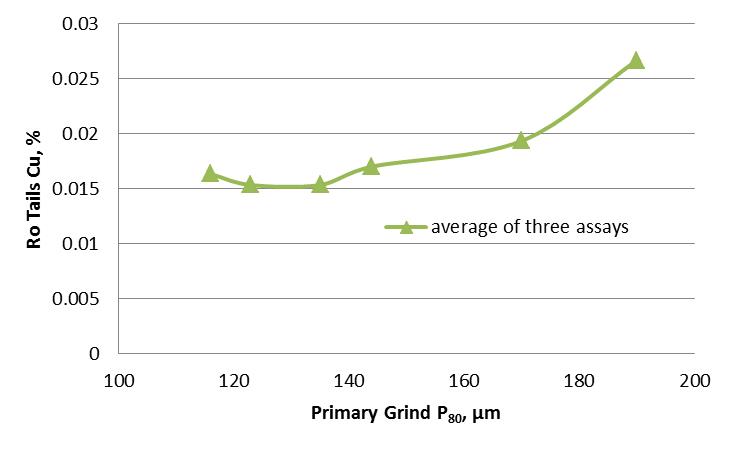
Due to the low copper levels in the tailings and the potential for small errors to have a large effect on the results, the tailings samples were assayed in triplicate. The trend observed in the average values indicates a slight increase in copper grade with grind size up until about 160 µm, after which the effect becomes more pronounced. Based on these results a target primary grind of ~150 µm to 170 µm was selected.
| 13.5.4 | Cleaner Flotation |
A conventional cleaner circuit was developed similar to that from the 2012 program, except that an additional 3rd cleaner stage was included and a small amount of CMC 7LT was added to improve dispersion and reject non-sulphide gangue.
Optimal regrind size was found to be at a P80 of ~25 µm, and Figure 13-6 illustrates the grade recovery curves achieved for selected tests on the Cpy, Bn, and Py Zone composites. In general, the 3rd cleaner concentrate grades averaged 28% to 32% Cu at open circuit recoveries of 80% to 90%. Molybdenum grades in the final concentrate were lower than in the 2011 program, due to lower initial head grades, though recoveries to cleaner concentrate were comparable.
| | |
| 10/03/2017 |
Page 13 - 14
2017 Updated Preliminary Economic Assessment on the Ann Mason Project
Nevada, U.S.A.
Figure 13-6: Grade-Recovery Curves for the Cleaner Flotation Tests

| 13.5.5 | Locked Cycle Testing |
A series of locked cycle tests was conducted to evaluate the effect of recirculating streams on the proposed flowsheet. Each test consisted of six 2-kg batch flotation tests run in series, with the intermediate streams from one cycle serving as feed to the next.
A summary of the results of the four locked cycle tests is presented in Table 13-11. The first two tests, LCT-1 and LCT-2, were run at a primary grind target of 170 µm. This target was lowered in LCT-3 and LCT-4 to optimize the copper recovery. In addition, a rougher scavenger flotation stage was added to further reduce losses to the rougher tailings stream.
Table 13-11: Summary of Locked Cycle Flotation Results for the Zone Composites
Test # | LCT-1 | LCT-2 | LCT-3 | LCT-4 | LCT-5 |
Conditions | |||||
Feed Composite | Cpy | Py | Cpy | Bn | Py |
Target 1° Grind P80, µm | 170 | 170 | 155 | 155 | 155 |
Target 2° Grind P80, µm | 25 | 25 | 25 | 25 | 25 |
Rougher Scavenger | n | n | y | y | y |
Final Concentrate | |||||
Cu Grade, % | 28.0 | 26.9 | 27.4 | 31.5 | 25.0 |
Cu Recovery, % | 90.9 | 84.2 | 92.2 | 91.3 | 85.0 |
Mo Grade, % | 0.28 | 0.20 | 0.27 | 0.58 | 0.21 |
Mo Recovery, % | 58.1 | 39.2 | 63.0 | 75.0 | 46.2 |
Au Grade, g/t | 1.47 | 0.95 | 1.28 | 3.03 | 0.61 |
Au Recovery, % | 41.3 | 44.0 | 49.7 | 66.4 | 36.6 |
Ag Grade, g/t | 36.5 | 22.9 | 31.6 | 65.0 | 18.4 |
Ag Recovery, % | 69.6 | 32.5 | 50.6 | 64.2 | 27.8 |
| | |
| 10/03/2017 |
Page 13 - 15
2017 Updated Preliminary Economic Assessment on the Ann Mason Project
Nevada, U.S.A.
All of the locked cycle tests conducted demonstrated good stability, with no build-up of activated pyrite or other potential concentrate diluent building up in the cleaner circuit. The pyrite composite resulted in lower copper recovery to concentrate, but this is attributable to the significantly lower head grade of this feed, as indicated in Table 13-9.
| 13.5.6 | Cu-Mo Separation |
A bulk flotation test was carried out on a 1.5 tonne composite sample to generate sufficient copper concentrate for copper-molybdneum separation testwork. The objective of the work was to build upon the initial development testwork in 2012, which was limited by feed sample size. The program consisted of pilot-scale continuous primary grinding and rougher flotation, followed by batch regrinding and cleaning in a 10kg flotation cell, and then separation tests in a 2kg flotation cell.
The grade recovery curves for selected Cu-Mo separation tests are presented in Figure 13-7. The best results were achieved in test Mo-6, where a 28% Mo grade was realized at an 78% stage recovery after three open-circuit cleaning stages.
Figure 13-7: Grade-Recovery Curves for the Cu-Mo Separation Tests

Overall, the operation of the pilot roughers and batch copper cleaner stages was not sufficiently optimized and resulted in a lower molybdenum grade and recovery to the final concentrate, as well as a limited mass of sample to work with for the separation testwork. Despite adjustments to reagent additions, grind size, and cleaning stages, the batch tests on the bulk concentrate were unsuccessful at improving upon the results of the 2012 program, summarized in Figure 13-3.
Future testwork should focus on large-scale batch tests, i.e. 100kg test charges, to ensure both sufficient metal units to complete the test and manageable sample size for accurate sampling and testing purposes.
| | |
| 10/03/2017 |
Page 13 - 16
2017 Updated Preliminary Economic Assessment on the Ann Mason Project
Nevada, U.S.A.
| 13.5.7 | Variability |
In total, 11 variability composites were prepared from the remaining core samples shipped for the testwork program. Table 13-12provides a summary of the composites produced. The composites represented varying grades, lithologies, and areas of the deposit. Composite V1 was made up from low grade samples from the Pyrite zone and achieved a copper head grade of 0.16%; composites V2, V3, and V4 represent different lithologies; and V5 and V6 are made up from samples at depth in the deposit, targeting higher and lower head grades, respectively.
Samples representing the East, West, and Central areas of the deposit were used for composites V7 to V9, whereas gypsum and non-gypsum bearing samples from the mid and lower zones of the deposit were used for composites V10 and V11.
Table 13-12: Summary of Variability Composites
Comp | Description | No. of | wt | Estimated Assays | |||
Intervals | kg | Cu, % | Mo, % | Au, g/t | Ag, g/t | ||
V1 | Pyrite - Low Grade | 13 | 42.3 | 0.16 | 0.004 | 0.01 | 0.23 |
V2 | Quartz monzonite | 15 | 42.2 | 0.28 | 0.003 | 0.02 | 0.44 |
V3 | Granodiorite | 14 | 42.3 | 0.29 | 0.003 | 0.03 | 0.55 |
V4 | Porphyritic Quartz Monzonite | 7 | 16.9 | 0.32 | 0.007 | 0.04 | 0.96 |
V5 | Yr 10+, Low Grade | 6 | 20.2 | 0.18 | 0.008 | 0.01 | 0.29 |
V6 | Yr 10+, High Grade | 6 | 19.5 | 0.49 | 0.004 | 0.03 | 0.88 |
V7 | East Zone | 6 | 19.6 | 0.29 | 0.005 | 0.04 | 0.68 |
V8 | West Zone | 5 | 16.4 | 0.29 | 0.003 | 0.02 | 0.24 |
V9 | Central Zone | 15 | 39.9 | 0.30 | 0.004 | 0.03 | 0.70 |
V10 | Yr 4+ Gypsum | 11 | 40.2 | 0.24 | 0.003 | 0.01 | 0.30 |
V11 | Yr 4+ Non-Gypsum | 10 | 28.3 | 0.10 | 0.001 | 0.01 | 0.20 |
Of the composites produced, V1-V10 were used for the flotation variability and subjected to a test grind followed by a cleaner flotation test under the optimized flotation conditions developed earlier in the program. In total, six of the variability composites were submitted for hardness testing: V1-V3, and V9-V11. The hardness testing consisted of BBWI, BRWI, AI, and SMC. Variability composites V4-V8 were not submitted for grindability testwork due to low sample weight, as well as the inclusion of assay reject material in some of those composites, which result in excess fines in the test feed. Hardness testwork values were found to be comparable to the domain composites.
| | |
| 10/03/2017 |
Page 13 - 17
2017 Updated Preliminary Economic Assessment on the Ann Mason Project
Nevada, U.S.A.
Figure 13-8: Grade-Recovery Curves for the Variability Cleaner Flotation Tests

Results of the cleaner flotation tests on the variability composites are presented in Figure 13-8. The curves are generally comparable to those of the domain and production composites. As expected, the lower head grade samples (V1, V5, V10) resulted in lower 3rd Cleaner concentrate head grades. Overall, the results are consistent with those from the domain composites.
| 13.5.8 | Settling Testwork |
Settling and filtration testwork was conducted on both the tailings and concentrate products from the program. Both product streams demonstrated good settling characteristics with reasonable reagent consumptions.
| 13.6 | Metallurgical Projection |
The proposed flowsheet for the processing plant consists of a conventional SAG/Ball milling circuit to generate a flotation feed product P80 of ~155 µm. The flotation circuit would produce separate copper and molybdenum concentrate products for dewatering and shipment to 3rd party smelters.
Table 13-13 presents a summary of the metallurgical projection for the Ann Mason deposit. Grades and recoveries are based primarily on the results of the locked-cycle flotation tests from the 2015 SGS program.
| | |
| 10/03/2017 |
Page 13 - 18
2017 Updated Preliminary Economic Assessment on the Ann Mason Project
Nevada, U.S.A.
Table 13-13: Projected Grades and Recoveries for the Copper and Molybdenum Concentrates from the Ann Mason Deposit
Product | Weight % | Grade | Recovery, % | ||||||
Cu, % | Mo, % | Au, g/t | Ag, g/t | Cu | Mo | Au | Ag | ||
Cu Concentrate | 0.9 | 30.0 | 0.1 | 1.65 | 36.0 | 92.0 | 17.1 | 57.0 | 55.0 |
Mo Concentrate | 0.005 | 2.5 | 50.0 | 0.6 | 15 | 0.1 | 50.0 | 0.2 | 0.2 |
Tailings | 99.0 | 0.023 | 0.002 | 0.012 | 0.27 | 7.9 | 32.9 | 42.8 | 44.8 |
Average Plant Feed | 100 | 0.29 | 0.005 | 0.027 | 0.58 | 100 | 100 | 100 | 100 |
It should be noted that the grade and recovery to the molybdenum concentrate are, at this point, only estimates. The Cu-Mo separation testwork in the 2012 program successfully demonstrated that a separate molybdenum concentrate was achievable, but the target grade of 50% Mo was not reached during three stages of cleaning. Additional stages were not possible due to the small mass of the 3rd cleaner concentrate. The follow up work in 2015 again demonstrated potential, but encountered technical limitations with the lab procedure that prevented higher concentrate grades being achieved. As a result, the projection includes only an estimate of molybdenum recovery to concentrate of 50%. The next phase of testwork is expected to provide additional characterisation of the relationship between grade and recovery for the molybdenum product.
| | |
| 10/03/2017 |
Page 13 - 19
2017 Updated Preliminary Economic Assessment on the Ann Mason Project
Nevada, U.S.A.
| 14 | Mineral Resource Estimates |
The Project contains Mineral Resources at the Ann Mason and Blue Hill deposits. The two deposits are not connected, and each was estimated independent of the other. Ann Mason is a sulphide-hosted copper-molybdenum porphyry deposit, and Blue Hill is an oxide- and sulphide-hosted copper-porphyry deposit.
Mineral resources at Ann Mason were estimated by Peter Oshust, P.Geo. of Amec Foster Wheeler, and those at Blue Hill by Michael Waldegger, P.Geo. under the supervision of Pierre Desautels, P.Geo. of AGP.
The estimates are in compliance with CIM Definition Standards for Mineral Resources and Mineral Reserves (May 10, 2014), whose definitions are incorporated by reference into NI 43-101.
| 14.1 | Ann Mason Mineral Resource Estimate |
Geological logging and results from sampling of diamond drill core from 198 diamond drill holes totalling 106,452.1 m completed by Entrée geologists were used as the basis for preparation of three dimensional models of lithological units and grade and mineralization envelopes. The 3D wireframe models were prepared by Amec Foster Wheeler in Leapfrog Geo™ software.
A block model was constructed in Vulcan™ software with block dimensions of 20 m × 20 m x 15 m high. Copper, gold, molybdenum, and silver grades were interpolated into the blocks by ordinary kriging (OK) in three passes. Blocks were classified based on a combination of factors including the number of drill holes used for each block and the distance to the nearest composites. Validation of the estimated block model revealed no significant global or local grade biases.
| 14.1.1 | Geological Wireframe Models |
Lithological Wireframe Models
Wireframe models of the main lithological units at the Ann Mason deposit were constructed in Leapfrog Geo™ software. The logged drill core intervals were grouped according to one of five principal lithologies to facilitate modelling. Alluvium and Tertiary volcanic rocks are grouped together as one rock type. The list of logging codes and grouped lithological codes is provided in Table 14-1. Minor rock types such as quartz veining were ignored. A 3D cut-away view of the lithological model is provided in Figure 14‑1.
| | |
| 10/03/2017 |
Page 14 - 1
2017 Updated Preliminary Economic Assessment on the Ann Mason Project
Nevada, U.S.A.
Table 14-1: Logging Codes and Grouped Codes for Lithological Modelling
Logged Identifier | Total Core Length (m) | Grouped Identifier | Logged Identifier | Core Length (m) | Grouped Identifier |
Qa | 206.11 | Alluvium | qmp-a | 2,435.54 | Qmp |
Qaf | 15.24 | Alluvium | qmp-ab | 1,666.55 | Qmp |
Qc | 304.2 | Alluvium | qmp-b | 30,215.41 | Qmp |
Qg | 18.15 | Alluvium | qmp-bm | 3,233.83 | Qmp |
Qs | 357.07 | Alluvium | qmp-bq | 2,485.13 | Qmp |
Qtc | 21.4 | Alluvium | qmp-c | 1,265.2 | Qmp |
Dio | 462.5 | Diorite | qmp-d | 1,661.05 | Qmp |
ibx | 223.55 | Jgd | qsp | 52.7 | Qmp |
Ja | 402.13 | Jgd | Tba | 3.96 | Tertiary |
Jbqm | 1,366.12 | Jgd | Tbm | 4,377.14 | Tertiary |
Jgd | 18,488.8 | Jgd | Td | 470.17 | Tertiary |
Jqm | 1,168.75 | Jgd | Tgm | 315.1 | Tertiary |
Jr | 6.68 | Jgd | Tha | 4,852.72 | Tertiary |
Jpa | 304.52 | Jpqm | Thai | 488.4 | Tertiary |
Jpqm | 12,961.68 | Jpqm | Trt | 616.82 | Tertiary |
Jpqm-b | 46.63 | Jpqm | Tru | 64.8 | Tertiary |
PQM-b | 31.26 | Jpqm | Ts | 7,601.35 | Tertiary |
mp | 146.54 | Qmp | Tvu | 322 | Tertiary |
mqm | 285.48 | Qmp | Twh | 1,387.4 | Tertiary |
qmp | 4,410.05 | Qmp | - | - | - |
Figure 14‑1: A 3D Cut-Away View of the Lithological Model (View Looking Northwest)
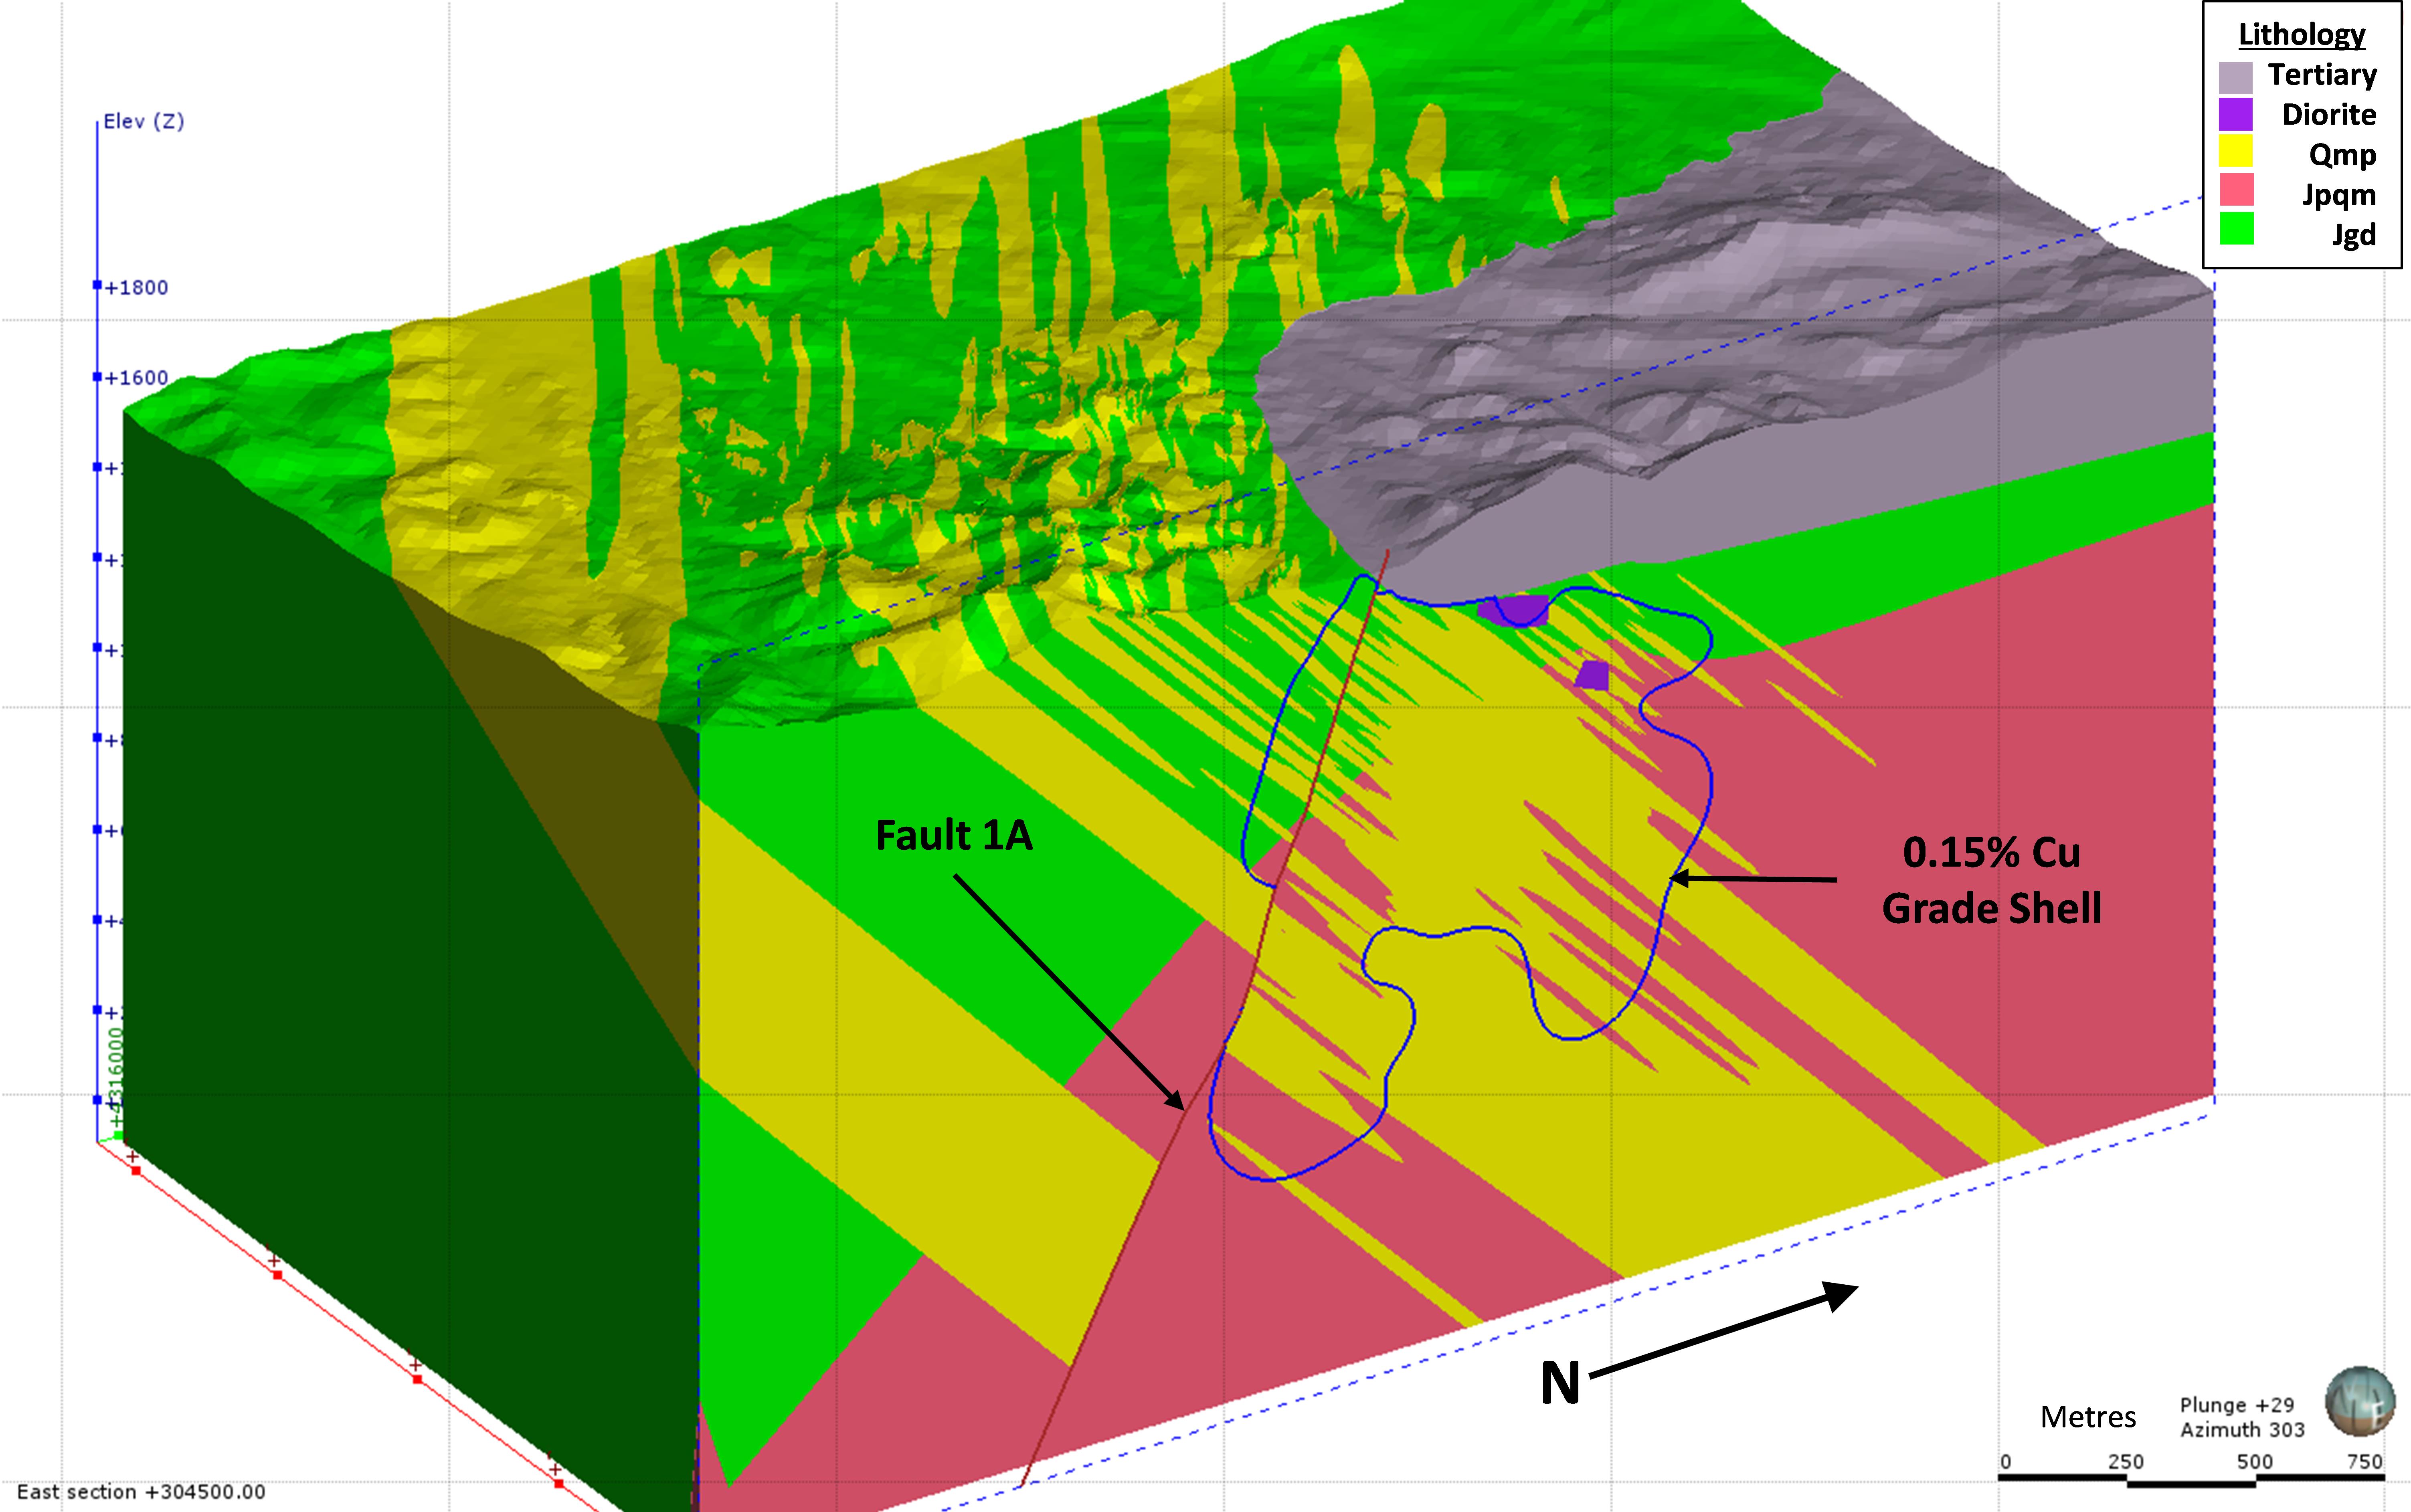
| Source: | Amec Foster Wheeler (Sep. 2015) |
| | |
| 10/03/2017 |
Page 14 - 2
2017 Updated Preliminary Economic Assessment on the Ann Mason Project
Nevada, U.S.A.
Structural Model
The rocks of the Yerington district have been subjected to uplift, rotation, and faulting resulting in a complex structural environment. Entrée geologists have modelled nearly twenty faults and splays in at least preliminary form. Three faults have been used in the construction of the geological model in Leapfrog™: the Singatse, Fault 1A, and Fault B. The Singatse Fault forms an unconformable boundary between the Jurassic intrusive rocks and the Mesozoic volcanic rocks and sedimentary rocks. Fault 1A is a NW-SE trending fault dipping to the southwest at approximately 70 degrees. Fault B trends NNE-SSW and dips steeply to the northwest. The traces of the fault used in the construction of the geological model are shown in plan view at 1,460 masl in Figure 14‑2.
Figure 14‑2: Traces of the Faults Used in the Construction of the Geological Model at 1460 masl
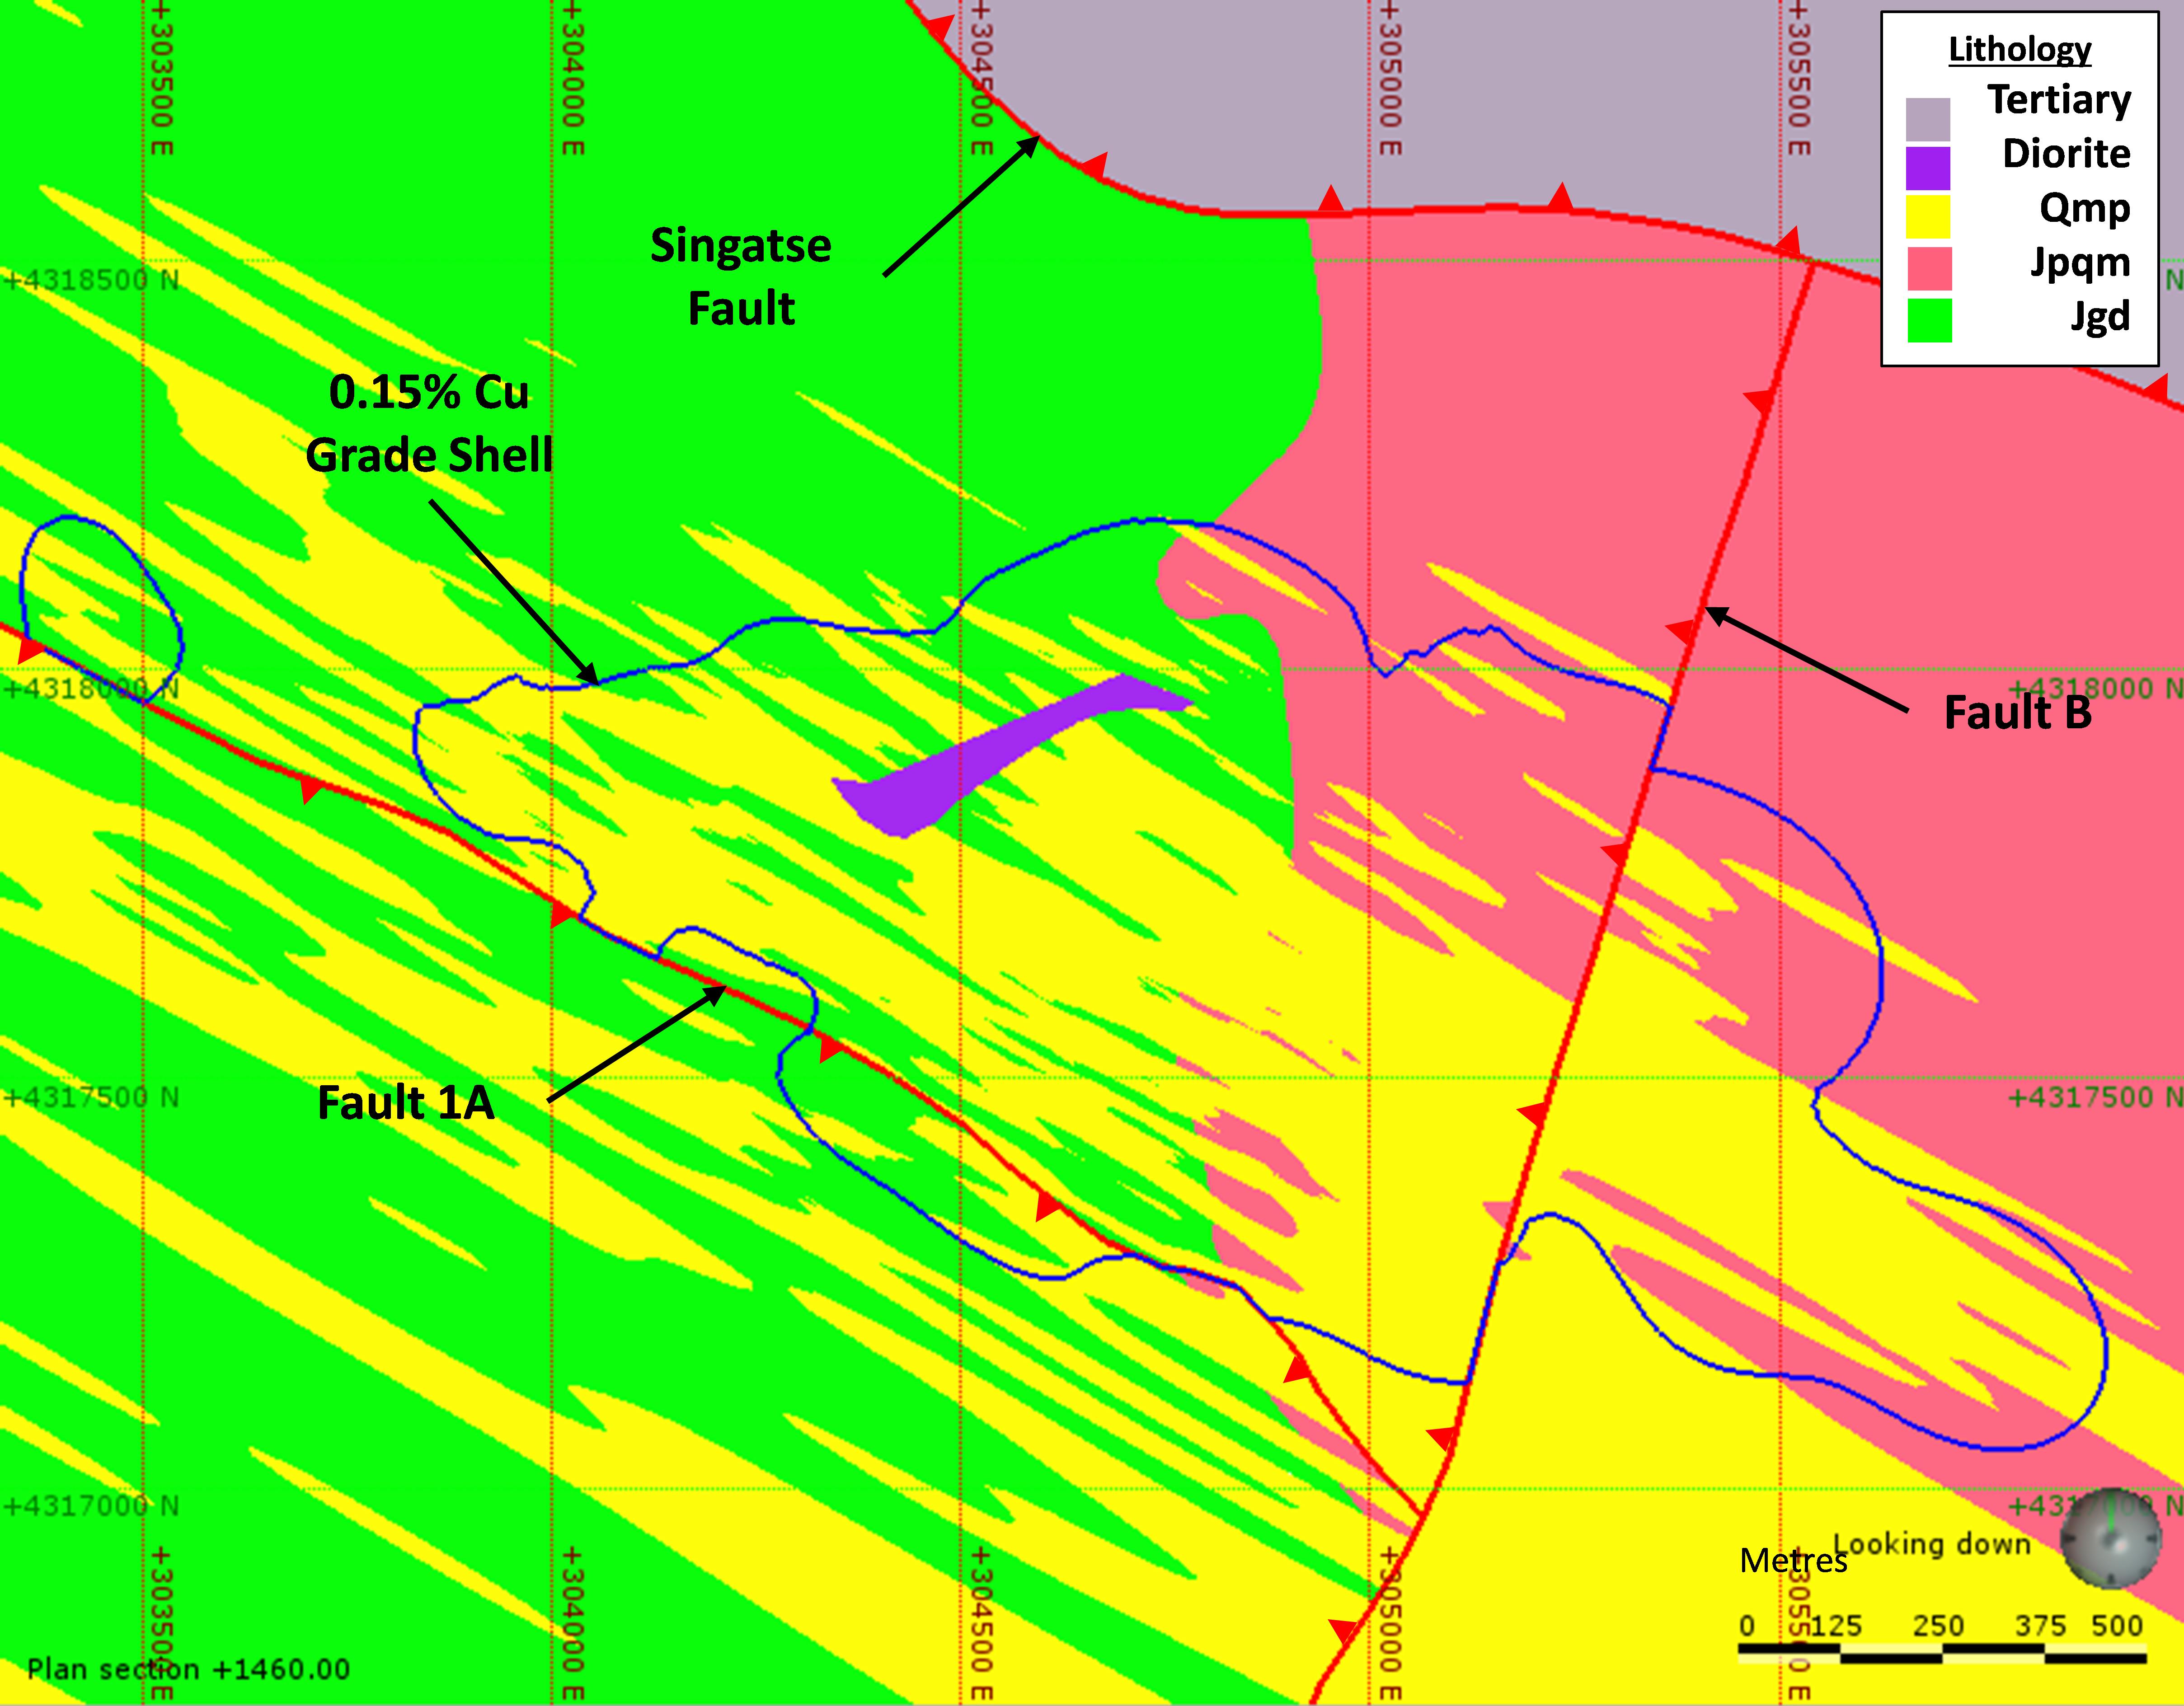
| Source: | Amec Foster Wheeler (Sep. 2015) |
Copper Grade Shell Model
A wireframe model of the 0.15% Cu grade shell was constructed in Leapfrog Geo™. The selection of the copper grade thresholds for modelling was based on visual inspection of the spatial and statistical grade distribution. The original assay intervals were composited to 15 m on-the-fly in Leapfrog™. These composites were only used in the generation of the grade shell. A graphic of the 0.15% Cu grade shell wireframe is provided in Figure 14‑3.
| | |
| 10/03/2017 |
Page 14 - 3
2017 Updated Preliminary Economic Assessment on the Ann Mason Project
Nevada, U.S.A.
Figure 14‑3: An Image of the 0.15% Cu (Blue) and 0.40% Cu (Red) Grade Shells
(View Looking Northeast)
(View Looking Northeast)
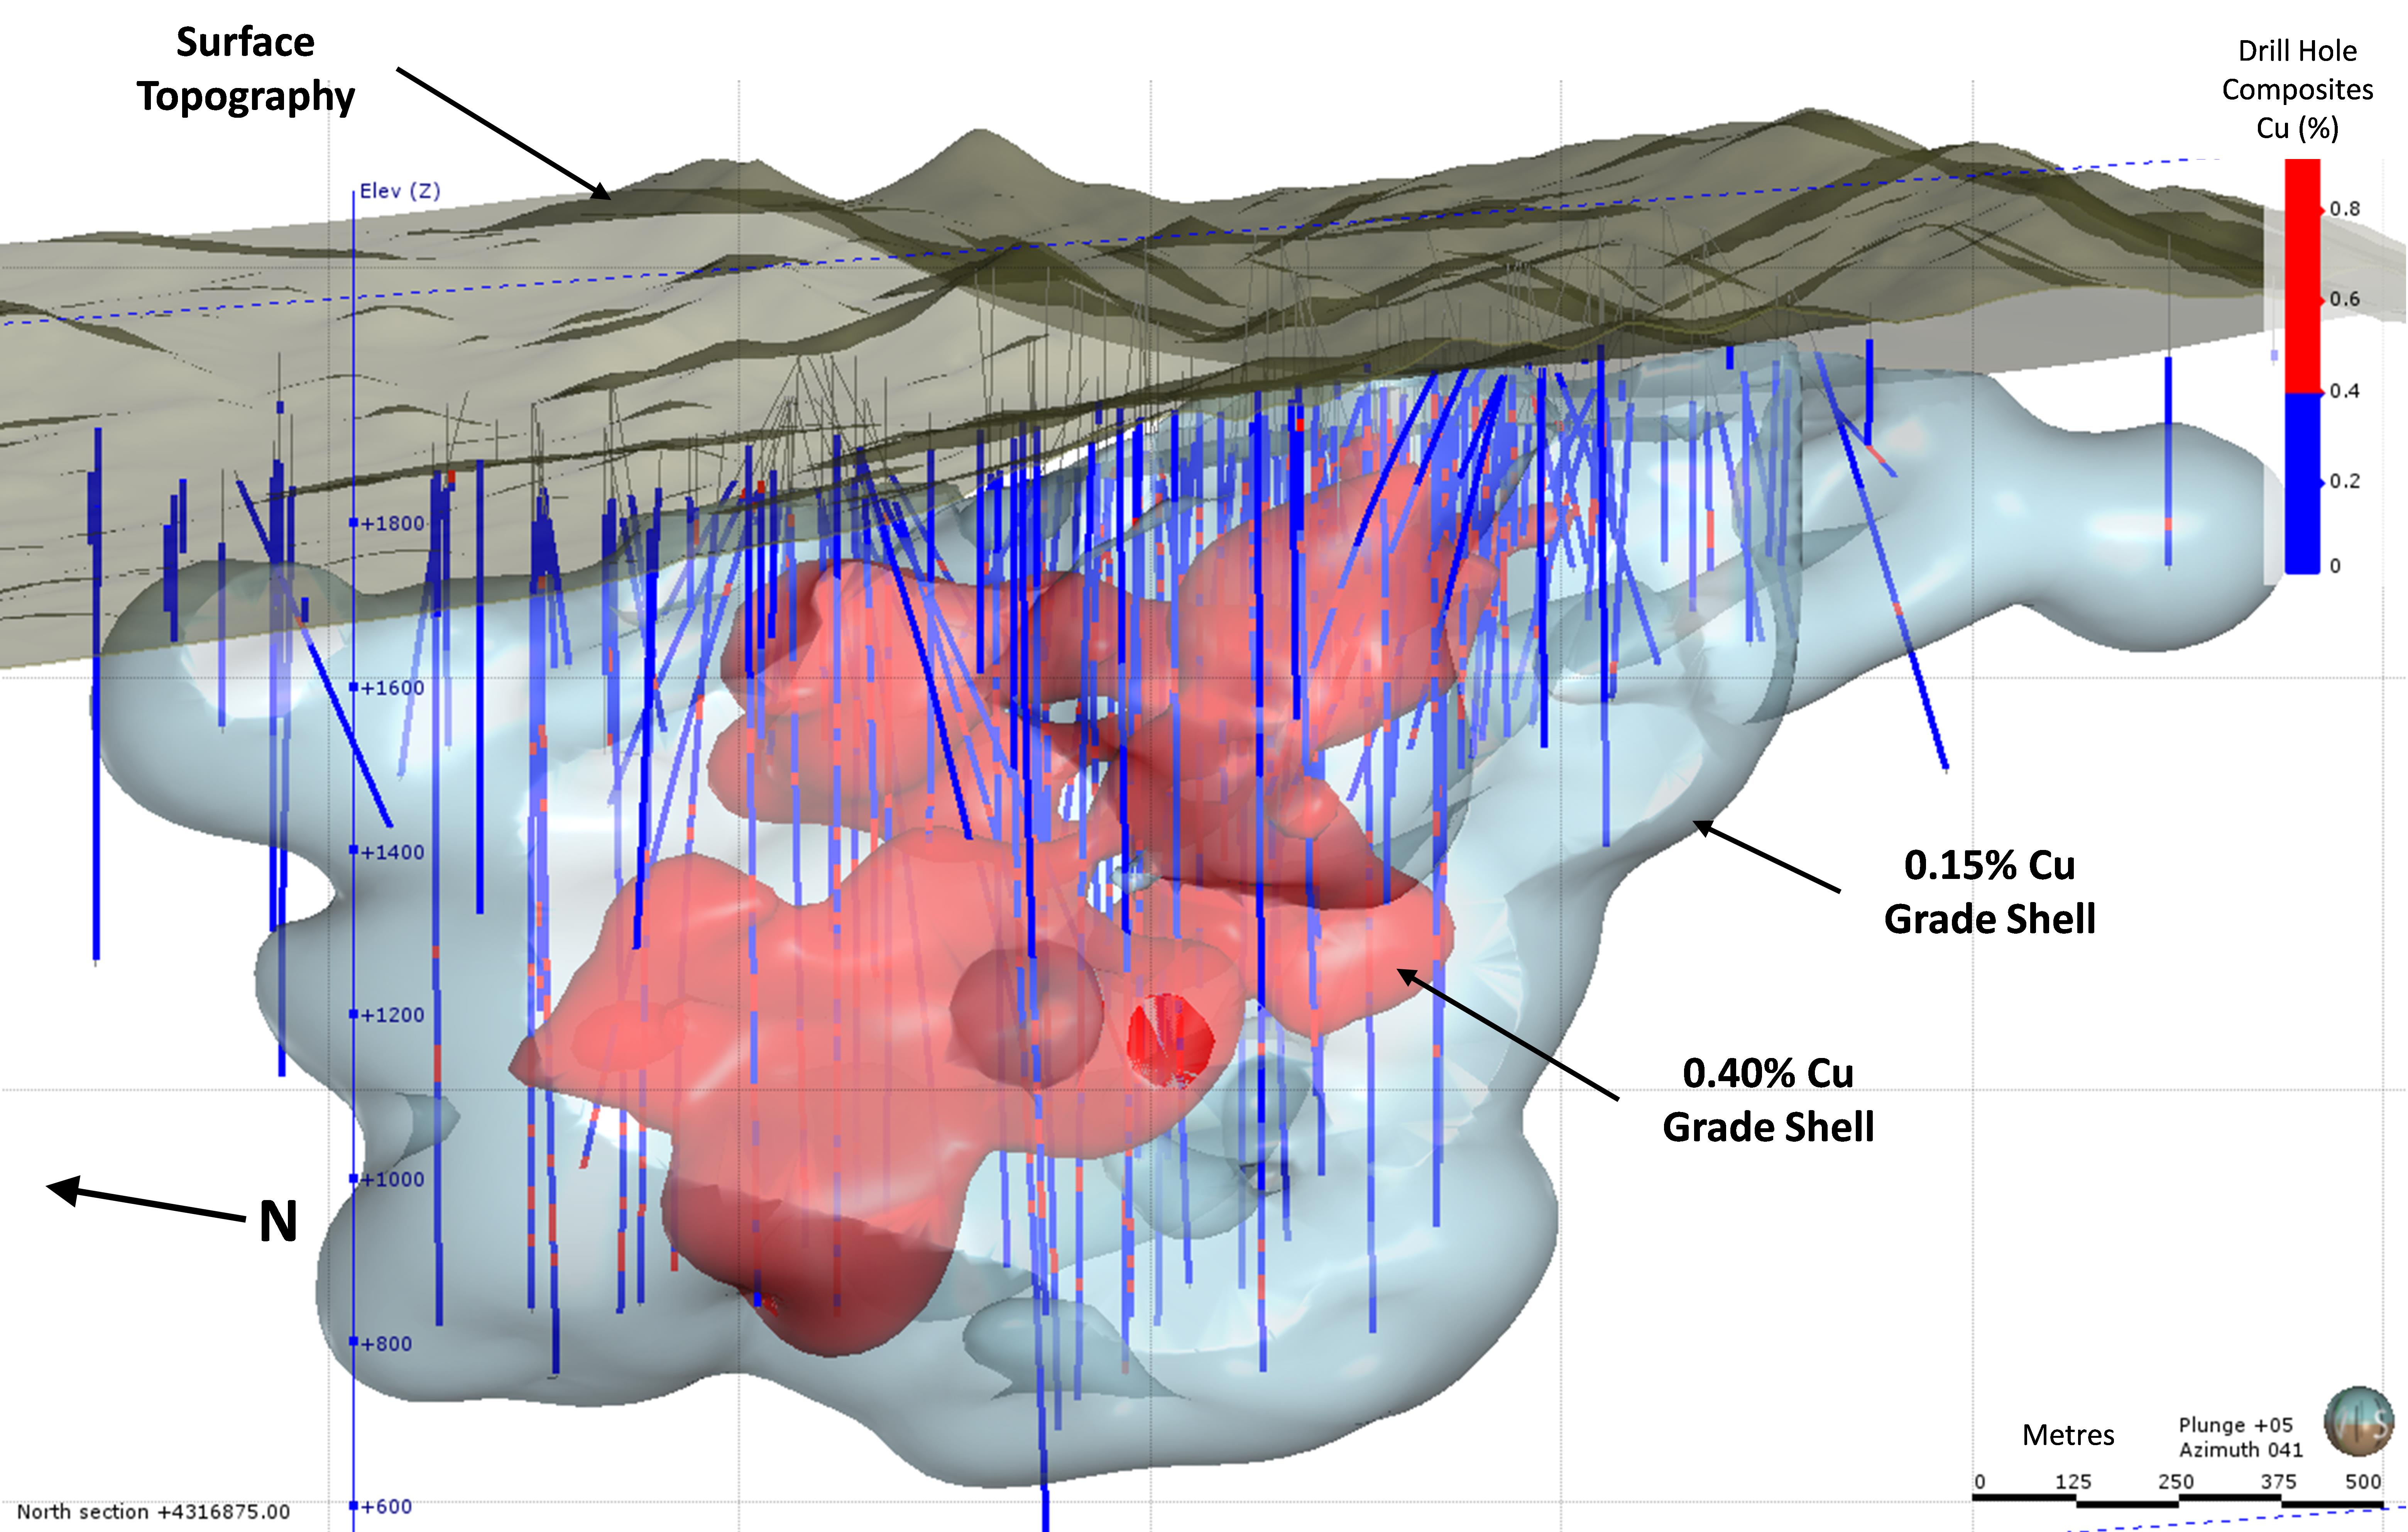
| Source: | Amec Foster Wheeler (Sep. 2015) |
Amec Foster Wheeler also prepared wireframe models for a 0.40% Cu grade shell, and for Au (0.1 g/t), Mo (0.005%), and Ag (0.6 g/t) grade shells, as well as for bornite, chalcopyrite, and pyrite-dominant domains, and gypsum-dominant domains. These envelopes were used for data analysis but were not used in the block grade estimation plan.
The copper grade shell wireframe constructed by implicit modelling in Leapfrog™ compares well to the 0.15% Cu grade shell used in 2012. A volume bias check was completed for the 2015 0.15% Cu grade shell by comparing block volumes of a nearest-neighbour (NN) indicator estimate of composites greater than 0.15% Cu with block volumes based on assignment from the 0.15% Cu grade shell. The comparison was made at incremental distances from the block to the nearest sample. The copper grade shell is similar to the NN indicator volumes at distances up to 30 m and is generally smaller compared to the NN interpolation at distances greater 30 m. The 2015 wireframe model of the copper grade shell is considered reasonable and appropriate for use as a boundary constraint in block grade estimation.
| 14.1.2 | Assay Compositing |
Drill core assay intervals for copper, gold, molybdenum, and silver were composited down hole in Vulcan™ to a fixed length of 5.0 m from the top of the drill holes. These composites were used in grade estimation. Composite intervals were not broken at geological boundaries. Composite intervals at the ends of the holes with lengths less than 2.5 m were appended to the previous composite.
| | |
| 10/03/2017 |
Page 14 - 4
2017 Updated Preliminary Economic Assessment on the Ann Mason Project
Nevada, U.S.A.
Composite intervals for non-sampled core were created during the compositing process. The resulting composite intervals were assigned a default background value for each grade element. The assignment of background grades to un-sampled intervals assures that composites are available to prevent extrapolation in areas of negligible mineralization during block grade estimation. In a small number of cases, for example, where drill core recovery was lost, the background value was assigned where mineralization may have occurred. Amec Foster Wheeler is of the opinion that the small number of composite intervals that this represents is not material to the Mineral Resource estimate.
The default background values assigned to composites created for un-sampled intervals are as follows:
| · | Cu – 0.0001% |
| · | Au – 0.001 ppm |
| · | Mo – 0.0001% |
| · | Ag – 0.005 ppm. |
The composites were assigned a logged group code (LGRP code) based on a majority rule. LGRP codes are based on the five principal lithologies shown in Table 14-1.The composite intervals were back-tagged with a lithology flag code (LFLG code) and copper grade-shell (GSH code) based on the wireframe models. The back-tagged codes are used during grade estimation. Checks were made to ensure back-tagging worked as expected.
| 14.1.3 | Exploratory Data Analysis |
Exploratory data analysis (EDA), including preparation of box plots, histograms and probability plots, swath plots, outlier analysis, and variography was undertaken to help develop an estimation plan for block grade estimation. An EDA envelope enclosing the drill hole information in the main deposit area of interest was defined to eliminate spatial outliers not relevant to the analysis.
Box Plots
Box plots for copper, gold, molybdenum, and silver composites grouped by back-tagged lithology (LFLG) were prepared. The copper box plot is shown in Figure 14‑4. The differences in mean copper grade between the main mineralized lithologies Jgd, Jpqm, and Qmp are low. These main units show greater variability for gold, molybdenum, and silver; however, the differences in the mean grades are nonetheless low and the overall grades are very low. The analysis indicates that no domain constraints are warranted across Jgd, Jpqm, and Qmp boundaries during grade estimation. Dio and Tert coded composites confirm the generally unmineralized nature of these units and are assigned zero value during estimation.
| | |
| 10/03/2017 |
Page 14 - 5
2017 Updated Preliminary Economic Assessment on the Ann Mason Project
Nevada, U.S.A.
Figure 14‑4: Box plots and Summary Statistics for Uncapped Cu by Lithological (LFLG) Category

Box plots for composites grouped by back-tagged grade shells were also prepared. The copper box plots by grade shell are shown in Figure 14‑5. There is almost an order of magnitude difference in the mean grade outside the 0.15% Cu grade shell compared to inside the 0.15% grade shell (Out vs. pt15 in Figure 14‑5). The mean difference between the 0.15% and 0.40% grade shell is less pronounced (pt15-pt4 vs. pt4 in Figure 14‑5).
| | |
| 10/03/2017 |
Page 14 - 6
2017 Updated Preliminary Economic Assessment on the Ann Mason Project
Nevada, U.S.A.
Figure 14‑5: Box plots and Summary Statistics for Uncapped Cu by Grade Shell
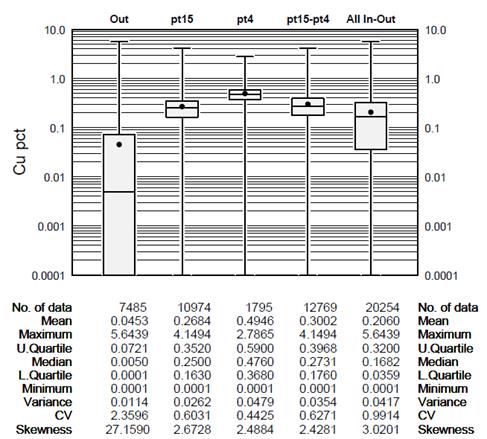
Histograms and Probability Plots
Histograms and probability plots were prepared for copper, gold, molybdenum, and silver composites. The copper plots were grouped as either outside or inside the copper grade shells. Copper plots shown in Figure 14‑6 and Figure 14‑7 demonstrate marked differences in mean grades inside and outside of the copper grade shells. The copper grade distribution inside the combined 0.15% Cu and 0.40% Cu grade shells is positively skewed, is near lognormal, and the coefficient of variation is low.
| | |
| 10/03/2017 |
Page 14 - 7
2017 Updated Preliminary Economic Assessment on the Ann Mason Project
Nevada, U.S.A.
Figure 14‑6: Arithmetic and Logarithmic Histograms and Probability Plots of Uncapped copper Composites Outside of the Copper Grade Shells
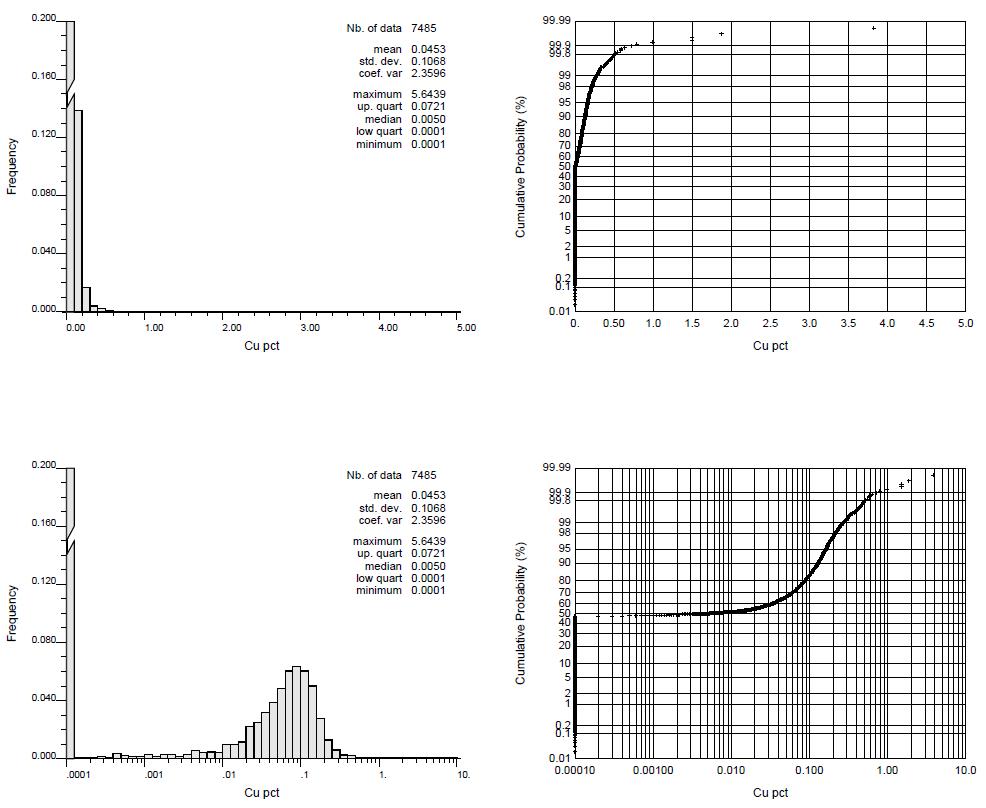
| | |
| 10/03/2017 |
Page 14 - 8
2017 Updated Preliminary Economic Assessment on the Ann Mason Project
Nevada, U.S.A.
Figure 14‑7: Arithmetic and Logarithmic Histograms and Probability Plots of Uncapped Copper Composites inside the Combined 0.15% Cu and 0.40% Cu Grade Shells

The histograms and probability plots of the uncapped minor grade elements, gold, molybdenum, and silver composites (not shown) are also positively skewed and have low to moderate coefficients of variation. The summary statistics for copper, gold, molybdenum, and silver are provided in Table 14-2 and Table 14-3.
Swath Plots
Swath plots were prepared in three directions for copper, gold, molybdenum, and silver composites. The copper composite swath plots are provided in Section 14.1.10 (Local Grade Bias Check) together with those of the NN interpolation and OK block grade distributions. No significant grade trends were observed that would negatively impact variography and block grade estimation.
| 14.1.4 | Contact Analysis |
A contact plot was prepared for copper composites grouped inside or outside the 0.15% Cu grade shell. This plot provided in Figure 14‑8 shows a firm boundary condition. The decision taken was not to use lithological or grade shell boundaries for block grade estimation of the minor grade elements due to their low grades and low contribution to project value.
| | |
| 10/03/2017 |
Page 14 - 9
2017 Updated Preliminary Economic Assessment on the Ann Mason Project
Nevada, U.S.A.
Figure 14‑8: Copper Grade Composite Contact Plot From Outside to Inside the 0.15% Cu Grade Shell Boundary

Box plots and histograms support the use of grade constraints for copper at the 0.15% Cu boundary. The contact plot suggests limited sharing of composites across the outside of the 0.15% Cu grade domain boundary is warranted. Constraint across 0.4% Cu boundary and the lithological boundaries is not warranted.
Grade distribution supports the use of a linear grade interpolation method such as ordinary kriging for copper and the minor grade elements.
| | |
| 10/03/2017 |
Page 14 - 10
2017 Updated Preliminary Economic Assessment on the Ann Mason Project
Nevada, U.S.A.
| 14.1.5 | Outlier Analysis and Capping |
Outlier analysis was completed on the copper, gold, molybdenum, and silver composites. Copper composites were grouped inside and outside the 0.15% grade shell. Analyses on gold, molybdenum, and silver were completed inside the EDA envelope ignoring grade shells. Analysis included inspection of histograms, probability plots, cutting statistics, and decile analysis. Summary composite statistics and proposed capping thresholds are summarized for copper and gold, molybdenum, and silver in Table 14-2 and Table 14-3. The low number of composites identified for capping is considered appropriate. The predicted metal reduction due to the proposed capping thresholds of all metals is also reasonable.
Table 14-2: Copper Grade Composite Capping Choice and Statistics
Cu Grade Shell | Sample Count | Uncapped Statistics | Capping Details | Capped Statistics | Predicted Metal Loss (%) | ||||
Mean | CV | Capping Value | Sample Count | Sample (%) | Mean | CV | |||
Outside | 3,788 | 0.0854 | 1.3685 | 0.6 | 6 | 0.2 | 0.0837 | 0.8335 | 2.0 |
Inside | 12,769 | 0.3002 | 0.6271 | 1.5 | 8 | 0.1 | 0.2994 | 0.6044 | 0.3 |
Table 14-3: Gold, Molybdenum, and Silver Grade Composite Capping Choice and Statistics
Metal | Sample Count | Uncapped Statistics | Capping Details | Capped Statistics | Predicted Metal Loss (%) | ||||
Mean | CV | Capping Value | Sample Count | Sample (%) | Mean | CV | |||
Au (ppm) | 14,007 | 0.0240 | 1.8958 | 0.27 | 14 | 0.1 | 0.0236 | 1.2919 | 1.7 |
Mo (%) | 14,008 | 0.0059 | 1.5983 | 0.09 | 18 | 0.1 | 0.0058 | 1.4852 | 2.7 |
Ag (ppm) | 14,010 | 0.5366 | 1.1227 | 4.6 | 13 | 0.1 | 0.5353 | 1.0107 | 0.2 |
| 14.1.6 | Variography |
Variogram maps, down-the-hole and directional correlograms for copper, gold, molybdenum, and silver capped composites were prepared. The directional correlograms were computed from all data within the EDA envelope ignoring grade shells. Two exponential structures (practical range) plus nugget effect were used to fit the experimental correlograms. The nugget effects were modelled from the down-the-hole correlograms. A summary of the variogram parameters is provided in Table 14-4 and Table 14-5.
The anisotropies apparent in the variograms for all metals are generally similar to the anisotropy observed in the grade shells modelled in Leapfrog™. The copper variogram anisotropy appears to mimic the contact between the Jgd and the Jpqm.
| | |
| 10/03/2017 |
Page 14 - 11
2017 Updated Preliminary Economic Assessment on the Ann Mason Project
Nevada, U.S.A.
Table 14-4: A Summary of Variogram Parameters
Variogram | Nugget | Type | Rotation | Range 1st Structure (m) | Range 2nd Structure (m) | ||||||||
C0 | C1 | C2 | Z | X | Y | Y | X | Z | Y | X | Z | ||
Cu | 0.150 | 0.334 | 0.516 | Exp | -23 | 45 | -40 | 33 | 56 | 37 | 376 | 233 | 597 |
Ag | 0.200 | 0.389 | 0.411 | Exp | -75 | -13 | 24 | 26 | 42 | 49 | 759 | 366 | 417 |
Au | 0.500 | 0.369 | 0.131 | Exp | -184 | -5 | -12 | 30 | 76 | 71 | 737 | 830 | 481 |
Mo | 0.420 | 0.138 | 0.442 | Exp | -56 | 37 | -15 | 17 | 47 | 49 | 682 | 201 | 895 |
| Note: | LH Rotation about the Z axis RH Rotation about the X' axis LH Rotation about the Y' axis Rotations for the 1st and 2nd structures are the same. |
The rotated azimuth and dip directions are provided in Table 14-5.
Table 14-5: The Rotated Variogram Azimuth and Dip Directions
Variogram | Major (Y) | Semi-Major (X) | Minor (Z) | |||
Azimuth | Dip | Azimuth | Dip | Azimuth | Dip | |
Cu | 337 | 45 | 37 | -27 | 108 | 33 |
Ag | 285 | -13 | 10 | 24 | 222 | 63 |
Au | 176 | -5 | 267 | -12 | 242 | 77 |
Mo | 304 | 37 | 24 | -12 | 99 | 50 |
| 14.1.7 | Block Model Dimensions |
The block model consists of non-rotated regular blocks. The block model framework parameters are listed in Table 14-6.
Table 14-6: Block Model Dimensions
Axis | Origin* | Block Size (m) | No. of Blocks | Model Extension (m) |
X | 302,500 | 20 | 216 | 4,320 |
Y | 4,316,000 | 20 | 170 | 3,400 |
Z | 0 | 15 | 136 | 2,040 |
| Note: | *Origin is defined as the bottom southwest corner of the model, located at the lowest combined northing and easting coordinates (UTM NAD83) and the lowest elevation (masl). |
| | |
| 10/03/2017 |
Page 14 - 12
2017 Updated Preliminary Economic Assessment on the Ann Mason Project
Nevada, U.S.A.
| 14.1.8 | Block Model Assignments |
Lithology
Blocks were assigned lithology and grade domain codes using the wireframes prepared in Leapfrog™. Block assignment was based on majority rule. Wireframe and block volumes were compared by domain and showed good agreement.
Specific Gravity
Blocks were assigned a dry bulk density based on the mean value of specific gravity (SG) measurements of the main lithological domains. This method is considered reasonable and appropriate for the resource estimate as the CVs of the main mineralized units Jgd, Jpqm, and Qmp are very low (0.03). A value of zero was assigned to air blocks. The SG values for the lithologies are provided in Figure 14‑9.
Figure 14‑9: The Boxplots for the Grouped Logged Lithological Units
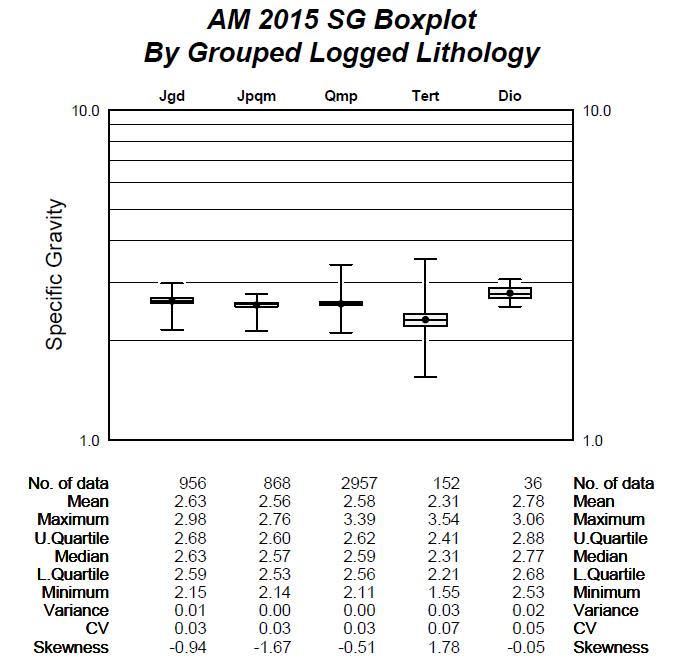
| | |
| 10/03/2017 |
Page 14 - 13
2017 Updated Preliminary Economic Assessment on the Ann Mason Project
Nevada, U.S.A.
| 14.1.9 | Block Model Grade Estimate |
The copper, gold, molybdenum, and silver block grade values were interpolated using an OK estimator. A three-pass estimation approach was used with each successive pass having greater search distances and less restrictive sample selection requirements.
A firm boundary approach using the 0.15% Cu grade shell was employed for the copper block grade estimate. No boundary constraints were used for gold, molybdenum, or silver. The rotation angles of the search ellipse for all grade elements are based on the copper search ellipse and are the same for each pass. The correlograms used for sample weighting during kriging are those modelled for each grade element. An anisotropic search with weighted distances was used for sample selection in the first estimation pass. The anisotropic weighting factors are the ratios of the distances in the major, semi-major and minor directions. An anisotropic search ellipse with true distances was used for the second and third passes. Outlier search restrictions, in addition to capping, were applied in order to mitigate high-grade "blow-outs" that were identified during visual validation of the block grade estimate. A summary of the copper estimation plan is provided in Table 14-7. A summary of the estimation plan for gold, molybdenum, and silver is provided in Table 14-8.
| | |
| 10/03/2017 |
Page 14 - 14
2017 Updated Preliminary Economic Assessment on the Ann Mason Project
Nevada, U.S.A.
Table 14-7: A Summary of the Block Grade Estimation Plan for Copper
Outside Cu Grade Shells | Inside 0.15% Cu Grade Shell | Inside 0.40% Cu Grade Shell | ||||||||
Pass 1 | Pass 2 | Pass 3 | Pass 1 | Pass 2 | Pass 3 | Pass 1 | Pass 2 | Pass 3 | ||
Rotation (Vulcan LRL) | About Z | -23 | -23 | -23 | -23 | -23 | -23 | -23 | -23 | -23 |
About X | 45 | 45 | 45 | 45 | 45 | 45 | 45 | 45 | 45 | |
About Y | -40 | -40 | -40 | -40 | -40 | -40 | -40 | -40 | -40 | |
Search Distance | Major (Rotated Y) | 75 | 125 | 375 | 75 | 125 | 375 | 75 | 125 | 375 |
Semi Major (Rotated X) | 65 | 110 | 330 | 65 | 110 | 330 | 65 | 110 | 330 | |
Minor (Rotated Z) | 100 | 150 | 450 | 100 | 150 | 450 | 100 | 150 | 450 | |
Grade Sample Selection | Minimum Composites | 9 | 6 | 4 | 9 | 6 | 4 | 9 | 6 | 4 |
Maximum Composites | 15 | 12 | 12 | 15 | 12 | 12 | 15 | 12 | 12 | |
Maximum Composites/Hole | 4 | 4 | 4 | 4 | 4 | 4 | 4 | 4 | 4 | |
Implicit Minimum Holes | 3 | 2 | 1 | 3 | 2 | 1 | 3 | 2 | 1 | |
Implicit Maximum Holes | 5 | 4 | 3 | 5 | 4 | 3 | 5 | 4 | 3 | |
Block Discretization | X, Y, Z | 4, 4, 3 | 4, 4, 3 | 4, 4, 3 | 4, 4, 3 | 4, 4, 3 | 4, 4, 3 | 4, 4, 3 | 4, 4, 3 | 4, 4, 3 |
Outlier Search Restriction | Cu% Threshold | - | 0.15 | 0.15 | - | - | 0.4 | - | - | - |
Distance (X, Y, Z) | - | 75, 50, 100 | 75, 50, 100 | - | - | 200, 125, 250 | - | - | - | |
Firm Boundary Condition | Cu domain to Share | Inside the Cu Grade Shells | Outside the Cu Grade Shells | Outside the Cu Grade Shells | ||||||
Distance (X, Y, Z) | 60, 40, 60 | 60, 40, 60 | 60, 40, 60 | 60, 40, 60 | 60, 40, 60 | 60, 40, 60 | 60, 40, 60 | 60, 40, 60 | 60, 40, 60 | |
Rotation (Z, X, Y) | -23, 45, -40 | -23, 45, -40 | -23, 45, -40 | -23, 45, -40 | -23, 45, -40 | -23, 45, -40 | -23, 45, -40 | -23, 45, -40 | -23, 45, -40 | |
| | |
| 10/03/2017 |
Page 14 - 15
2017 Updated Preliminary Economic Assessment on the Ann Mason Project
Nevada, U.S.A.
Table 14-8: A Summary of the Block Grade Estimation Plan for Gold, Molybdenum, and Silver
Outside Cu Grade Shells | Inside 0.15% Cu Grade Shell | Inside 0.40% Cu Grade Shell | ||||||||
Pass 1 | Pass 2 | Pass 3 | Pass 1 | Pass 2 | Pass 3 | Pass 1 | Pass 2 | Pass 3 | ||
Rotation (Vulcan LRL) | About Z | -23 | -23 | -23 | -23 | -23 | -23 | -23 | -23 | -23 |
About X | 45 | 45 | 45 | 45 | 45 | 45 | 45 | 45 | 45 | |
About Y | -40 | -40 | -40 | -40 | -40 | -40 | -40 | -40 | -40 | |
Search Distance | Major (Rotated Y) | 75 | 125 | 375 | 75 | 125 | 375 | 75 | 125 | 375 |
Semi Major (Rotated X) | 65 | 110 | 330 | 65 | 110 | 330 | 65 | 110 | 330 | |
Minor (Rotated Z) | 100 | 150 | 450 | 100 | 150 | 450 | 100 | 150 | 450 | |
Grade Sample Selection | Minimum Composites | 9 | 6 | 4 | 9 | 6 | 4 | 9 | 6 | 4 |
Maximum Composites | 15 | 12 | 12 | 15 | 12 | 12 | 15 | 12 | 12 | |
Maximum Composites/Hole | 4 | 4 | 4 | 4 | 4 | 4 | 4 | 4 | 4 | |
Implicit Minimum Holes | 3 | 2 | 1 | 3 | 2 | 1 | 3 | 2 | 1 | |
Implicit Maximum Holes | 5 | 4 | 3 | 5 | 4 | 3 | 5 | 4 | 3 | |
Block Discretization | X, Y, Z | 4, 4, 3 | 4, 4, 3 | 4, 4, 3 | 4, 4, 3 | 4, 4, 3 | 4, 4, 3 | 4, 4, 3 | 4, 4, 3 | 4, 4, 3 |
Outlier Search Restriction | None | None | None | |||||||
Firm Boundary Condition | None | None | None | |||||||
| | |
| 10/03/2017 |
Page 14 - 16
2017 Updated Preliminary Economic Assessment on the Ann Mason Project
Nevada, U.S.A.
| 14.1.10 | Block Model Validation |
The block model grade estimates were validated by visual inspection comparing composite grades to block grades, statistical checks, and selectivity checks.
Visual Validation
Visual validation comprised inspection of composite grades and block grades on vertical sections and plan views. The copper grade composites, block grades, 0.15% Cu grade shell, PEA Phase 5 pit shell, and the resource pit shell are shown in plan view at 1320 elevation in Figure 14‑10, on vertical section looking west at 304,500 E in Figure 14‑11, and on section looking north at 4,317,700 N in Figure 14‑12. The block model grades generally honour the composite data well and grade extrapolation is controlled where sufficient data exist.
Figure 14‑10: Copper Composites and Copper Block Grades in Planview at 1320 Elevation
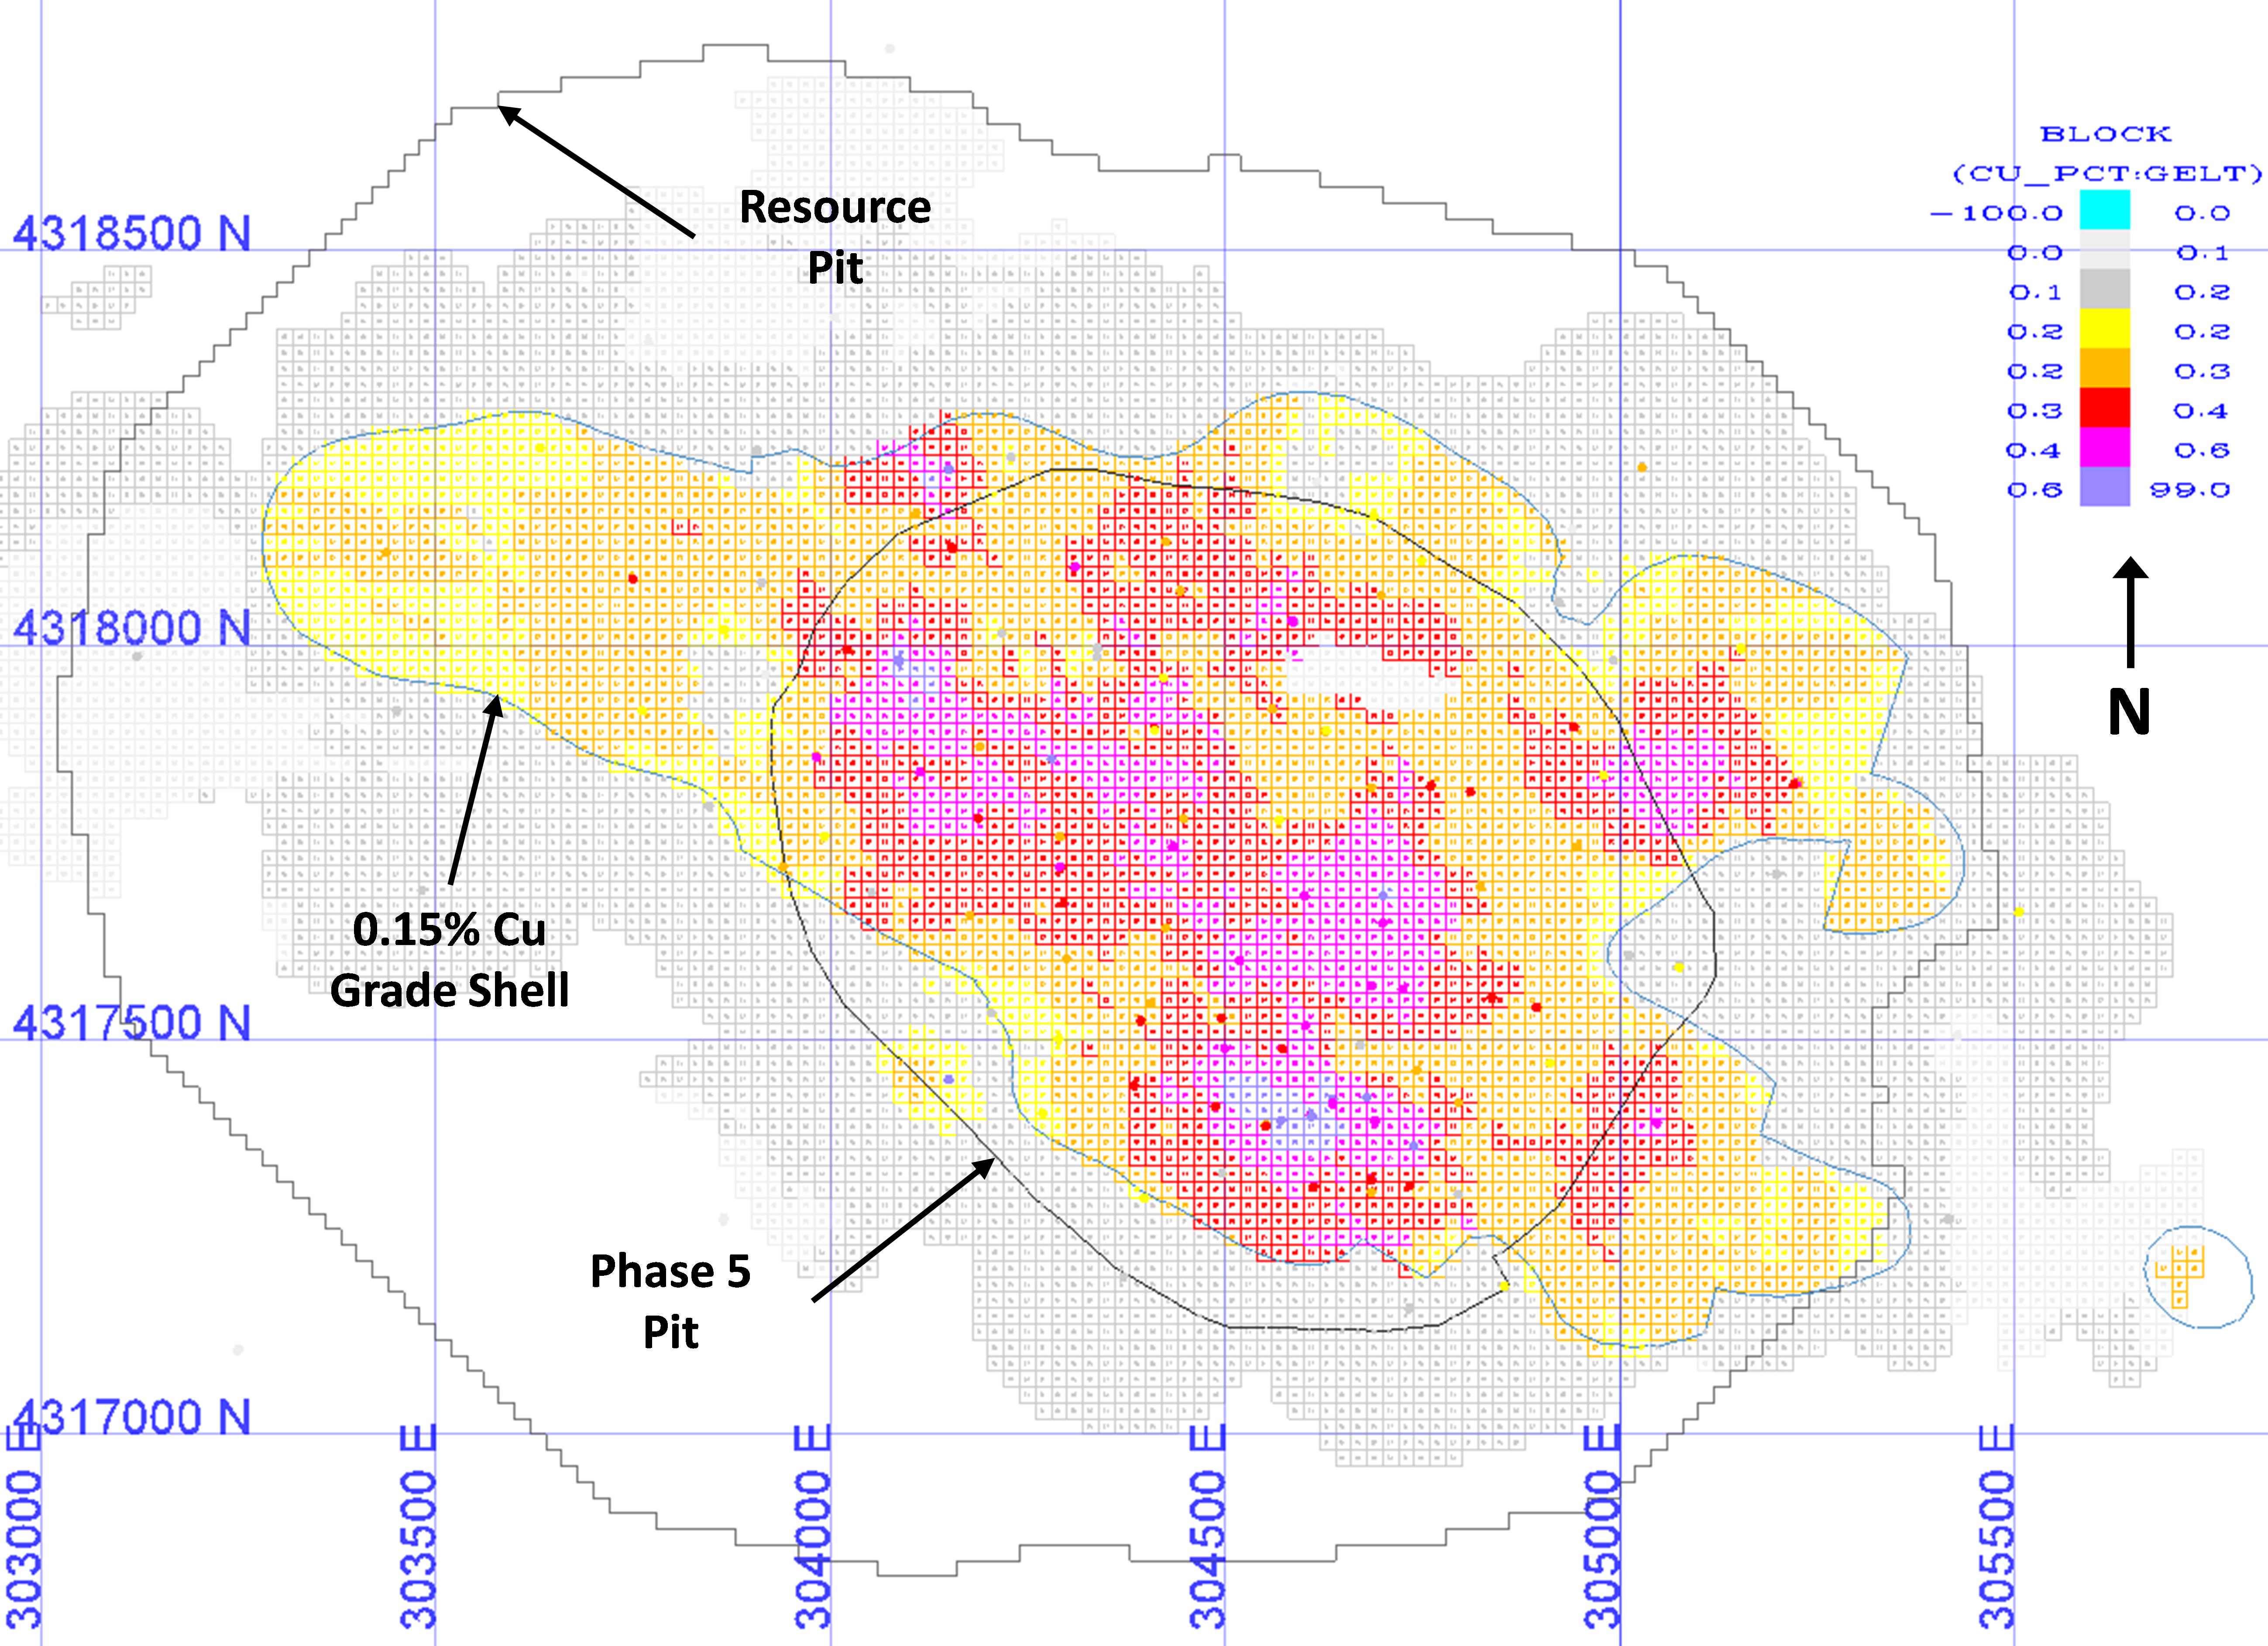
| Source: | Amec Foster Wheeler (Sep. 2015) |
| | |
| 10/03/2017 |
Page 14 - 17
2017 Updated Preliminary Economic Assessment on the Ann Mason Project
Nevada, U.S.A.
Figure 14‑11: Copper Composites and Copper Block Grades in Section at 304,500 E Looking West

| | |
| 10/03/2017 |
Page 14 - 18
2017 Updated Preliminary Economic Assessment on the Ann Mason Project
Nevada, U.S.A.
Figure 14‑12: Copper Composites and Copper Block Grades in Section at 4,317,700 N Looking North

Global Grade Bias Check
Block grade estimates were checked for global bias by comparing the average grades (with no cut-off) with those obtained from NN model estimates. The NN grade model is a declustered composite grade distribution and provides a globally unbiased estimate of the average value when no cut-off grade is imposed. Results summarized in Table 14-9 show relative differences in mean grades between the OK and NN model are well within the target of ±5%.
Table 14-9: The Global Bias Check
Metal | NN Model (Declustered) | OK Estimate | OK to NN Difference in Mean (%) | ||
Count | Mean | Count | Mean | ||
Cu | 351,080 | 0.2875 | 351,080 | 0.2894 | 0.7 |
Au | 351,080 | 0.0270 | 351,080 | 0.0269 | -0.4 |
Mo | 351,080 | 0.0063 | 351,080 | 0.0063 | 0.0 |
Ag | 351,080 | 0.5920 | 351,080 | 0.5925 | 0.1 |
| | |
| 10/03/2017 |
Page 14 - 19
2017 Updated Preliminary Economic Assessment on the Ann Mason Project
Nevada, U.S.A.
Predicted Metal Loss
A comparison of global means of capped and uncapped OK models show in Table 14-10 and Table 14-11 demonstrates the amount of metal removed by capping is close to, and is generally lower than, the expected metal reduction predicted in the capping study. Outlier search restrictions were used in the uncapped copper block grade estimate for consistency in the block estimation plan.
Table 14-10: Predicted Copper Metal Loss Due to Grade Capping
Cu Grade Shell | Uncapped | Capped | Metal Loss (%) | ||
Count | Mean | Count | Mean | ||
Outside | 39,965 | 0.0826 | 39,965 | 0.0818 | 1.0 |
Inside 0.15% + 0.40% | 117,622 | 0.2896 | 117,622 | 0.2890 | 0.2 |
All Inside and Outside | 157,587 | 0.2369 | 157,587 | 0.2362 | 0.3 |
Table 14-11: Predicted Gold, Molybdenum, and Silver Metal Loss Due to Grade Capping
Metal | Uncapped | Capped | Metal Loss (%) | ||
Count | Mean | Count | Mean | ||
Gold | 157,581 | 0.0226 | 157,581 | 0.0223 | 1.3 |
Molybdenum | 157,581 | 0.0056 | 157,581 | 0.0055 | 1.8 |
Silver | 157,581 | 0.5006 | 157,581 | 0.4995 | 0.2 |
Local Grade Bias Check
Swath plots were prepared to compare grade profiles for the OK and NN block estimates, and composites in east-west, north-south, and vertical swaths or increments. Swath intervals are 60 m in both the northerly and easterly directions, and 30 m vertically. The comparison was limited to Measured and Indicated blocks, which are reasonably well informed during estimation.
Swath plots for copper are provided in Figure 14‑13. The grade profiles are generally in very good agreement. As expected, the OK and NN grade profiles diverge slightly where block counts fall. The swath plots indicate that no systematic local bias has been introduced in the block grade estimate.
| | |
| 10/03/2017 |
Page 14 - 20
2017 Updated Preliminary Economic Assessment on the Ann Mason Project
Nevada, U.S.A.
Figure 14‑13: Copper Swath Plots Using Measured and Indicated Blocks

| | |
| 10/03/2017 |
Page 14 - 21
2017 Updated Preliminary Economic Assessment on the Ann Mason Project
Nevada, U.S.A.
Selectivity Check
Selectivity analysis for copper was completed using the Discrete Gaussian Model for change of support from composite size to a selective mining unit (SMU) size. This was done using Amec Foster Wheeler's in-house software (HERCO). The aim of this analysis was to assess whether the estimated resource reasonably represents the recoverable resources (represented by grade and tonnage curves) relative to the proposed mining method. The selectivity analysis assumed a 20 m x 20 m x 15 m block as the SMU size and a 100,000 t/d production scenario for the Ann Mason deposit.
A correlogram was calculated and modelled from the copper grade composite data within the combined 0.15% and 0.40% Cu grade shell boundary. The new correlogram model was used as an input in the Amec Foster Wheeler proprietary Single-Block Kriger (SBK) application in order to calculate the variance adjustment factor for the blocks inside the combined grade shell.
The results of the HERCO analysis are generally discussed in terms of smoothness. An over-smoothed model may over-estimate the tonnes and under-estimate the grade. The model with an appropriate amount of smoothing will follow the HERCO grade and tonnage (GT) curves for values corresponding to different economic, or grade cut-offs. The target amount of smoothing is 5% or less relative difference between the estimated block tonnes and grade and the corrected Herco tonnes and grade. As with swath plots, the HERCO analysis was limited to Measured and Indicated blocks that are reasonably well informed during estimation.
HERCO GT curves are shown in Figure 14‑14 and Figure 14‑15. This analysis shows that the OK copper model is approximately 6% smooth for grades near a cut-off of 0.2% Cu. This degree of smoothing in the copper block grade model is higher than the target. However, Amec Foster Wheeler concludes a reasonable amount of selectivity has been achieved.
| | |
| 10/03/2017 |
Page 14 - 22
2017 Updated Preliminary Economic Assessment on the Ann Mason Project
Nevada, U.S.A.
Figure 14‑14: HERCO Grade vs. Tonnage Curves for Copper
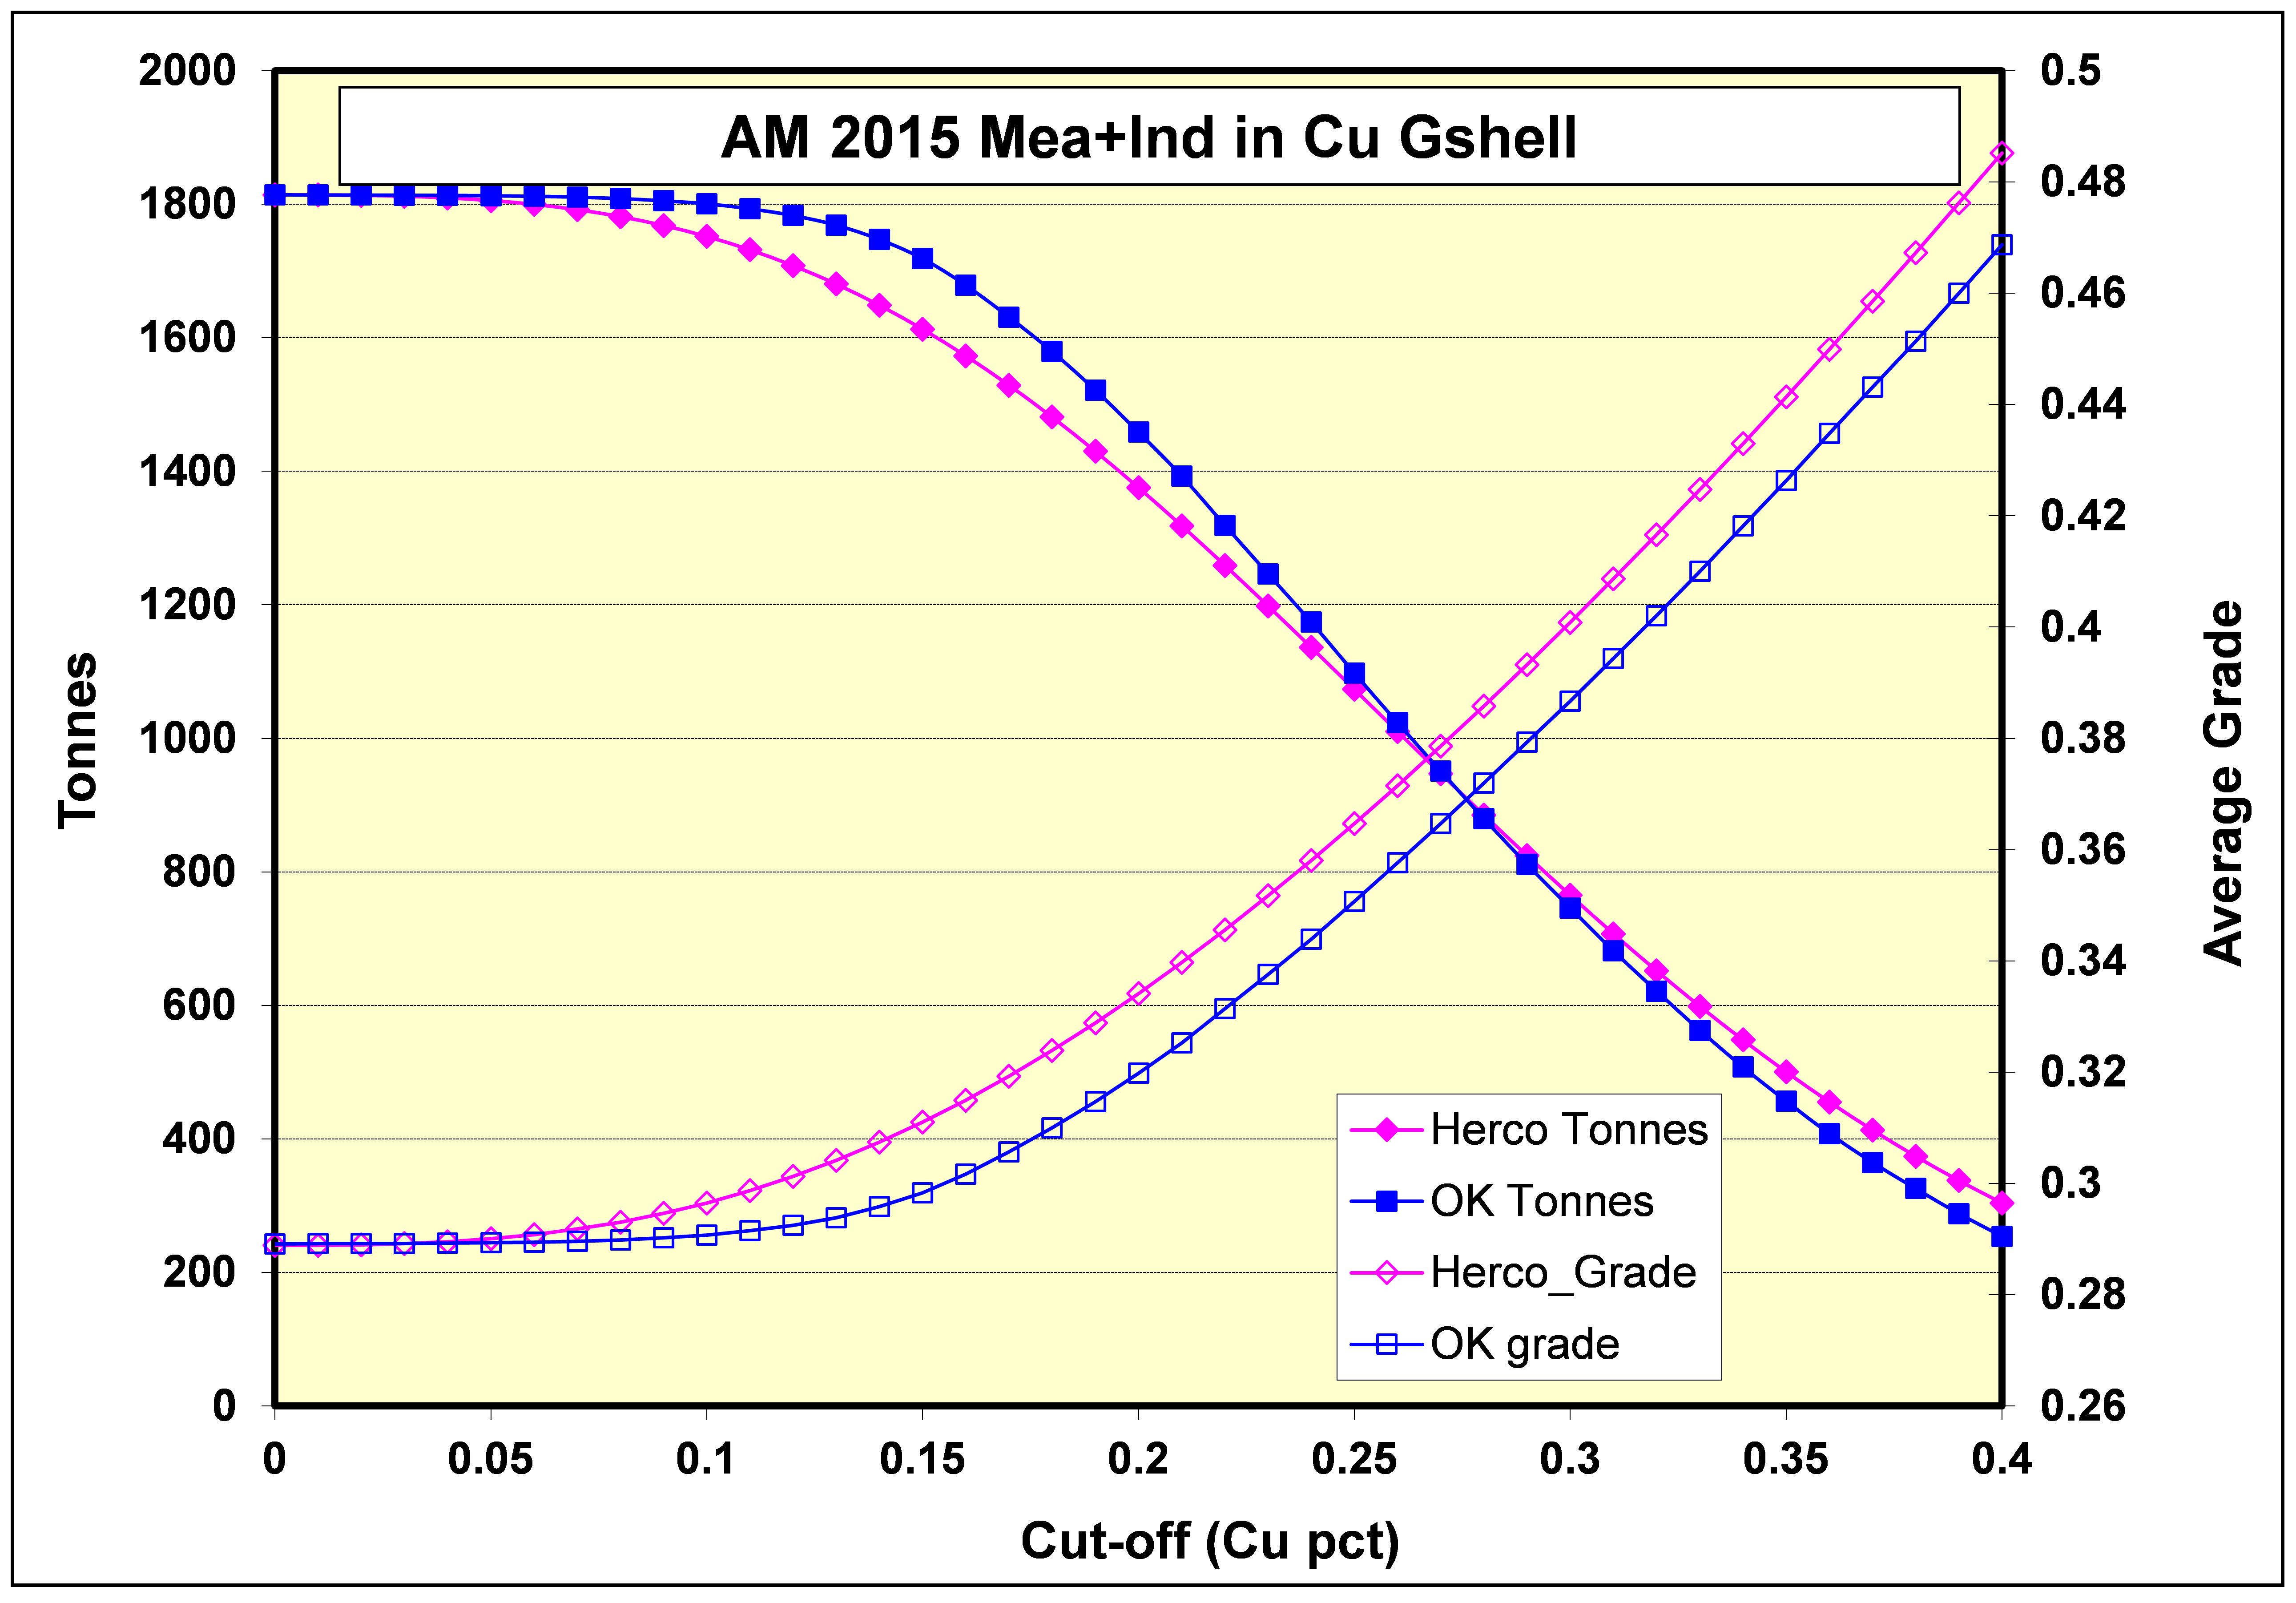
Figure 14‑15: Relative Difference in Grade, Tonnage, and Metal Derived from the Copper GT Curves

| | |
| 10/03/2017 |
Page 14 - 23
2017 Updated Preliminary Economic Assessment on the Ann Mason Project
Nevada, U.S.A.
| 14.1.11 | Mineral Resource Classification |
The Mineral Resource is classified in accordance with the CIM Definition Standards for Mineral Resources and Mineral Reserves (10 May 2014).
In addition to criteria such as sufficient geological continuity, grade continuity, and data integrity, another guideline that Amec Foster Wheeler uses for resource classification is to have drill hole spacing sufficient to predict potential production with reasonable probability of precision over a selected period of time. As such, Amec Foster Wheeler conducted drill hole spacing studies taking into account both grade continuity and resource tonnage / volume uncertainty. Based on the drill-hole spacing studies the following criteria for classification of Mineral Resources at the Ann Mason deposit were established:
Inferred Mineral Resources:
| · | a minimum of one drill hole |
| · | the distance to the closest composite is less than 200 m. |
Indicated Mineral Resources:
| · | a minimum of two drill holes within 195 m |
| · | the distance to the closest composite is less than 75 m |
| · | the distance to the second closest composite less than 150 m. |
Measured Mineral Resources:
| · | a minimum three drill holes within 110 m |
| · | the distances to the two closest composites less than 70 m. |
The resulting preliminary classification was reviewed visually on vertical sections and plan views. A small number of "spots" or discontinuous groups of blocks, were flipped to the classification of surrounding blocks by polygon flagging. An illustration of the Mineral Resource classification is shown with the 0.15% Cu grade shell, resource pit shells, and grade composites at the 1320 elevation in Figure 14‑16 and at section 304,500 E in Figure 14‑17.
| | |
| 10/03/2017 |
Page 14 - 24
2017 Updated Preliminary Economic Assessment on the Ann Mason Project
Nevada, U.S.A.
Figure 14‑16: Mineral Resource Classification – Planview at 1320 Elevation
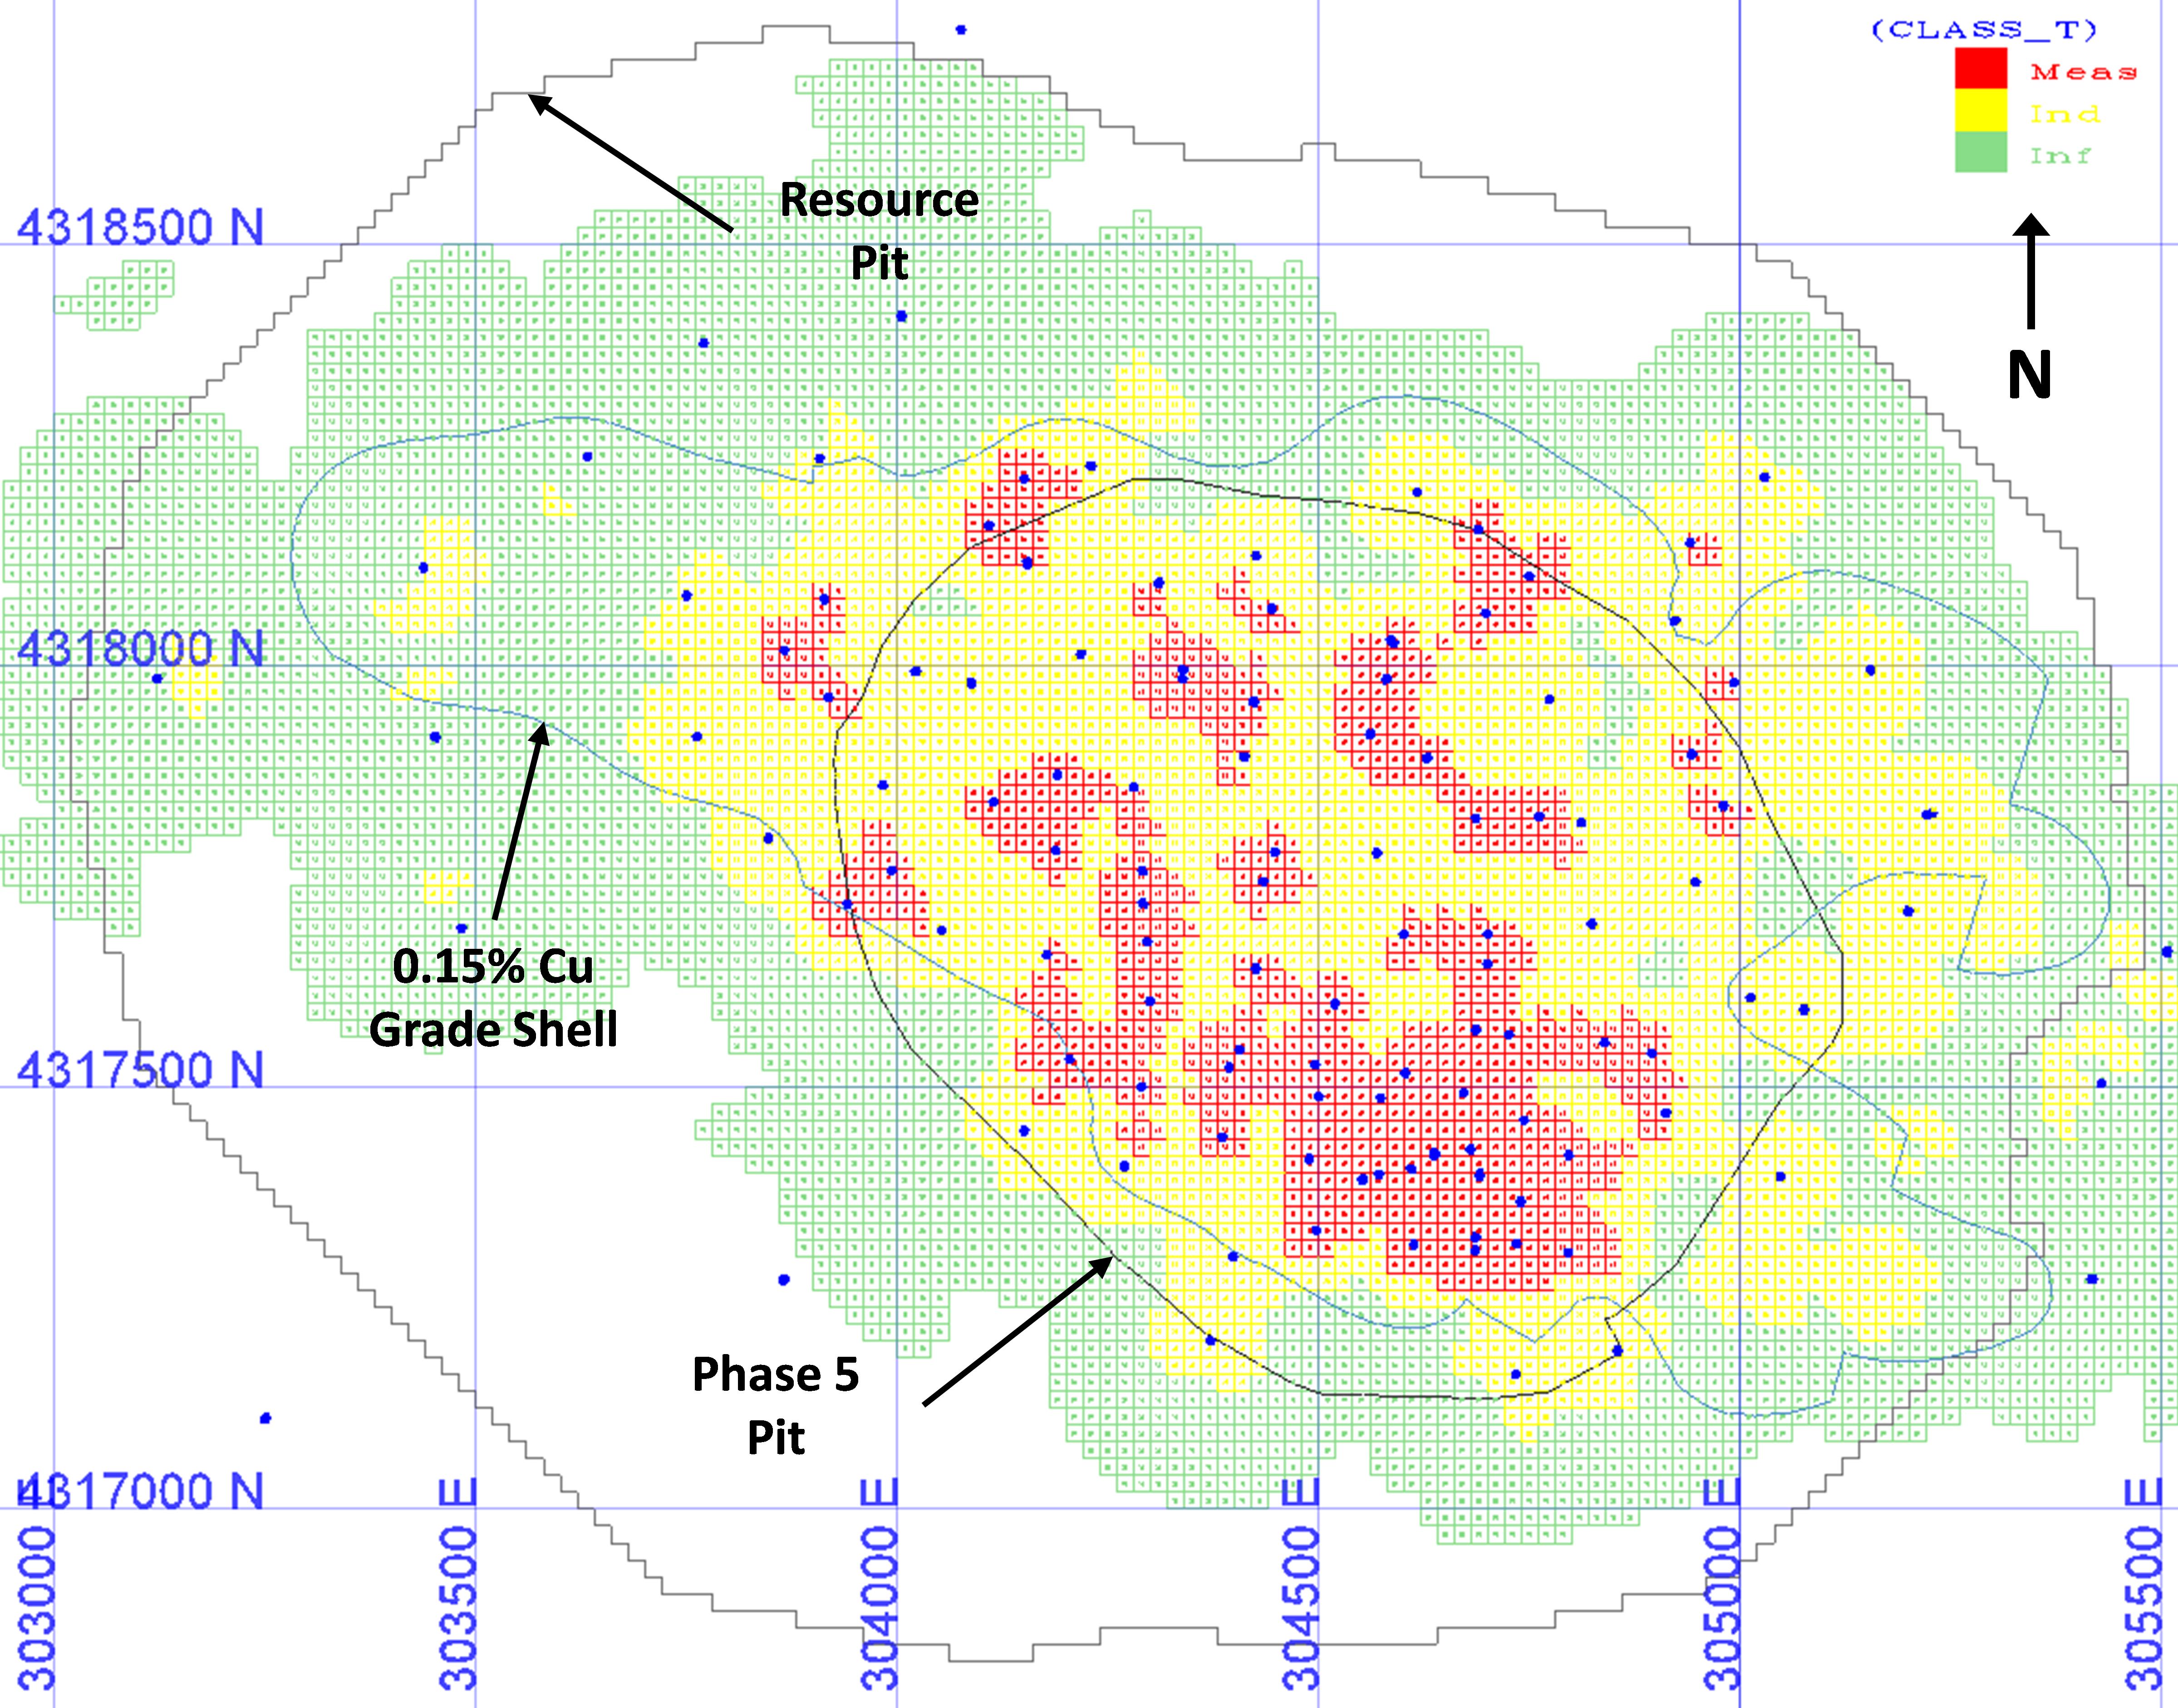
| | |
| 10/03/2017 |
Page 14 - 25
2017 Updated Preliminary Economic Assessment on the Ann Mason Project
Nevada, U.S.A.
Figure 14‑17: Mineral Resource Classification. Section at 304,500 E Looking West
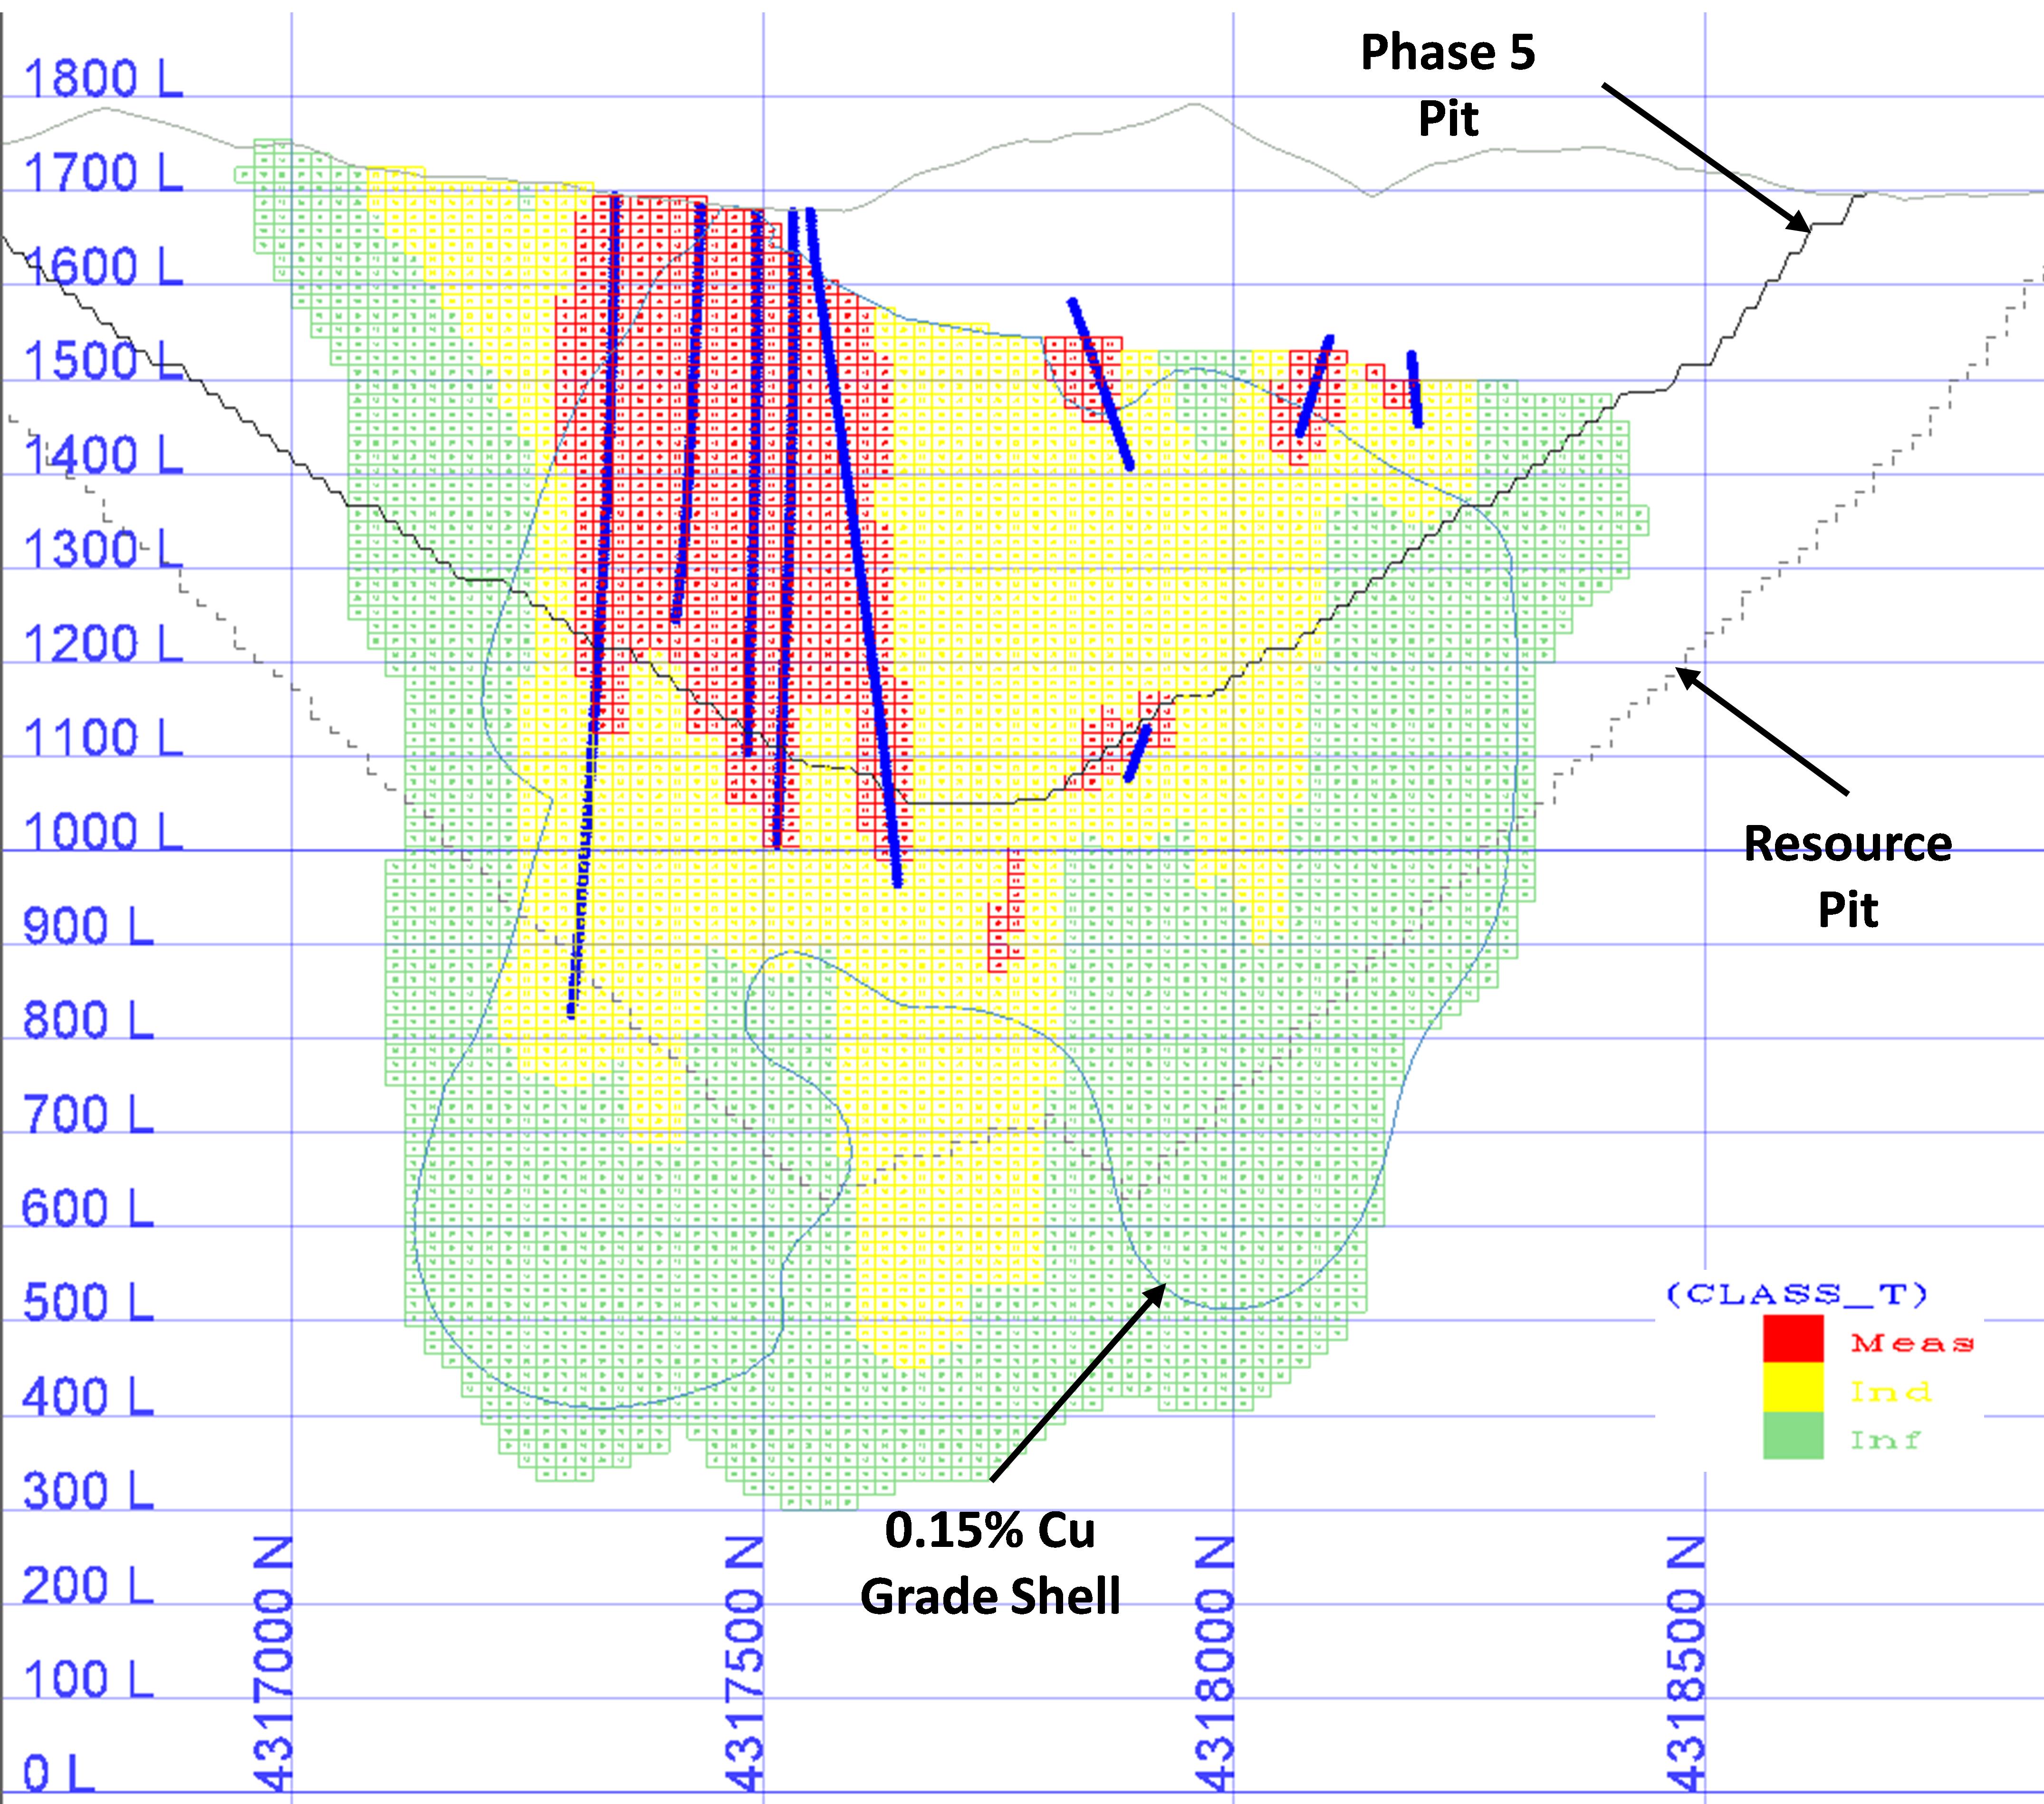
| 14.1.12 | Reasonable Prospects for Eventual Economic Extraction |
To assess reasonable prospects for eventual economic extraction, Amec Foster Wheeler assumed that the Ann Mason deposit would be mined utilizing open pit mining methods under a conceptual scenario of 100,000 t/d production using conventional flotation to produce 27% Cu and 55% Mo concentrates.
Whittle™ pit optimiser was utilized to prepare a conceptual pit designed as a constraining pit shell, with inputs on mining, processing, G&A, transportation and smelting and refining. Preparation of the pit was based on economic and technical assumptions listed in Table 14-12. The price assumptions used to develop the constraining pit shell are more optimistic than those used in the economic analysis of the 2017 PEA. The objective is to develop a constraining pit such that the Mineral Resources used in the 2017 PEA are a sub set of the total Mineral Resources. Amec Foster Wheeler is of the opinion that the economic and technical assumptions are reasonable.
| | |
| 10/03/2017 |
Page 14 - 26
2017 Updated Preliminary Economic Assessment on the Ann Mason Project
Nevada, U.S.A.
Table 14-12: Economic and Technical Assumptions used to prepare a Constraining Pit
Description | Unit | Cu | Mo | Au | Ag | |
Metal Price | US$/lb | 3.74 | 13.23 | - | - | |
US$/oz | - | - | 1,495 | 23.58 | ||
Mill Recovery | % | 92 | 50 | 50 | 55 | |
Transit Losses | % | 0.5 | 0.5 | - | - | |
Concentrate Moisture | % | 8 | - | - | ||
Concentrate Grade | % | 27 | 55 | - | - | |
Transportation | US$/t wet | 90 | 65 | - | - | |
Smelting and Refining | - | - | - | - | ||
Smelter charges | US$/t dry | 65 | - | - | - | |
Refining charges | US$/lb | 0.065 | - | - | - | |
US$/oz | - | - | 10.3 | 1 | ||
Smelter losses | US$/lb | - | 0.05 | - | - | |
Smelter recovery | % | 96.3 | 99 | 97 | 97 | |
The conceptual pit was constrained within property boundaries and also used the following assumptions:
| · | pit slope of 52° in the overlying volcanic rocks; 44° in the porphyry units |
| · | US$1.09/t of mining + $0.02/bench below 1,605 m elevation |
| · | US$5.82/t for processing |
| · | US$0.30/t for G&A. |
The Mineral Rresource constraining pit slopes are steeper than pit slopes used in the 2017 PEA to ensure that the 2017 PEA pit is a sub set of the Mineral Resource pit. The $1.09/t mining cost with $0.02/bench increment is approximately equivalent to $1.20/t over the life of all Mineral Resources included in the 2017 PEA production plan.
Mineral Resources were tabulated within the pit at a cut-off grade of 0.20% Cu. This is above the operating breakeven cost.
| 14.1.13 | Mineral Resource Statement |
Table 14-13 shows the estimated Mineral Resources reported at a 0.20% Cu cut-off. Mineral Resources that are not Mineral Reserves do not have demonstrated economic viability.
| | |
| 10/03/2017 |
Page 14 - 27
2017 Updated Preliminary Economic Assessment on the Ann Mason Project
Nevada, U.S.A.
Table 14-13: Mineral Resource Statement for the Ann Mason Deposit based on a 0.20% Cu Cut‑off(*)
Classification | Tonnage (Mt) | Grade | Contained Metal | ||||||
Cu (%) | Mo (%) | Au (g/t) | Ag (g/t) | Cu (Mlb) | Mo (Mlb) | Au (Moz) | Ag (Moz) | ||
Measured | 412 | 0.33 | 0.006 | 0.03 | 0.64 | 3,037.6 | 58.1 | 0.37 | 8.46 |
Indicated | 988 | 0.31 | 0.006 | 0.03 | 0.66 | 6,853.3 | 128.5 | 0.97 | 21.00 |
Measured and Indicated | 1,400 | 0.32 | 0.006 | 0.03 | 0.65 | 9,890.9 | 186.6 | 1.33 | 29.46 |
Inferred | 623 | 0.29 | 0.007 | 0.03 | 0.66 | 3,987.2 | 96.2 | 0.58 | 13.16 |
| Notes: | (*) Effective Date 3 March 2017, Peter Oshust, P Geo |
| 1. | Mineral Resources are reported within a constraining pit shell developed using Whittle™ software. Assumptions include metal prices of $3.74/lb for copper, $13.23/lb for molybdenum, $1,495/oz for gold, and $23.58/oz for silver, process recoveries of 92% for copper, 50% for molybdenum, 50% for gold, and 55% for silver, mining cost of $1.09/t + $0.02/bench below 1,605 m, $5.82/t for processing, and $0.30/t for G&A |
| 2. | Assumptions include 100% mining recovery |
| 3. | An external dilution factor was not considered during this Mineral Resource estimation |
| 4. | Internal dilution within a 20 m x 20 m x 15 m SMU was considered |
| 5. | The 0.4% NSR royalty held by Sandstorm Gold Ltd. was not considered during the preparation of the constraining pit |
The Ann Mason Mineral Resource estimate is based on all scientific and technical information as of 3 March 2017 and therefore has an effective date of 3 March 2017. The mineral resource model and the Mineral Resource estimate have not changed since 9 September 2015, the effective date of the previous Mineral Resource estimate. There has been no additional drilling or other scientific or technical information collected since 9 September 2015 to present. The assumptions used in 2015 to assess reasonable prospects of eventual economic extraction including metal prices, mining, processing and G&A cost metallurgical recoveries and pit slopes remain the same and are still considered reasonable.
Table 14-14 shows the sensitivity of the Ann Mason Mineral Resource to changes in copper cut-off grade.
| | |
| 10/03/2017 |
Page 14 - 28
2017 Updated Preliminary Economic Assessment on the Ann Mason Project
Nevada, U.S.A.
Table 14-14: Sensitivity of the Ann Mason Deposit Mineral Resource to Changes in the Cut-off Grade
(Base Case in Bold Text)
(Base Case in Bold Text)
Cut-off (Cu%) | Tonnage (Mt) | Grade | Contained Metal | ||||||
Cu (%) | Mo (%) | Au (g/t) | Ag (g/t) | Cu (Mlb) | Mo (Mlb) | Au (Moz) | Ag (Moz) | ||
Measured Mineral Resources | |||||||||
0.10 | 508 | 0.30 | 0.006 | 0.03 | 0.57 | 3,367.5 | 67.2 | 0.41 | 9.37 |
0.15 | 470 | 0.32 | 0.006 | 0.03 | 0.60 | 3,263.7 | 64.2 | 0.40 | 9.08 |
0.20 | 412 | 0.33 | 0.006 | 0.03 | 0.64 | 3,037.6 | 58.1 | 0.37 | 8.46 |
0.25 | 329 | 0.36 | 0.007 | 0.03 | 0.69 | 2,621.8 | 47.8 | 0.32 | 7.32 |
0.30 | 237 | 0.40 | 0.007 | 0.03 | 0.76 | 2,065.6 | 35.5 | 0.25 | 5.76 |
0.35 | 153 | 0.44 | 0.007 | 0.04 | 0.82 | 1,465.9 | 23.6 | 0.18 | 4.05 |
Indicated Mineral Resources | |||||||||
0.10 | 1,347 | 0.27 | 0.006 | 0.03 | 0.58 | 8,051.0 | 172.2 | 1.15 | 25.01 |
0.15 | 1,182 | 0.29 | 0.006 | 0.03 | 0.62 | 7,608.2 | 156.3 | 1.08 | 23.40 |
0.20 | 988 | 0.31 | 0.006 | 0.03 | 0.66 | 6,853.3 | 128.5 | 0.97 | 21.00 |
0.25 | 730 | 0.35 | 0.006 | 0.03 | 0.72 | 5,572.2 | 95.0 | 0.77 | 16.83 |
0.30 | 485 | 0.38 | 0.006 | 0.04 | 0.78 | 4,089.8 | 64.1 | 0.55 | 12.13 |
0.35 | 290 | 0.42 | 0.006 | 0.04 | 0.84 | 2,696.1 | 39.6 | 0.36 | 7.84 |
Measured and Indicated Mineral Resources | |||||||||
0.10 | 1,855 | 0.28 | 0.006 | 0.03 | 0.58 | 11,418.5 | 239.4 | 1.56 | 34.38 |
0.15 | 1,652 | 0.30 | 0.006 | 0.03 | 0.61 | 10,871.9 | 220.6 | 1.48 | 32.47 |
0.20 | 1,400 | 0.32 | 0.006 | 0.03 | 0.65 | 9,890.9 | 186.6 | 1.33 | 29.46 |
0.25 | 1,059 | 0.35 | 0.006 | 0.03 | 0.71 | 8,194.0 | 142.8 | 1.09 | 24.15 |
0.30 | 722 | 0.39 | 0.006 | 0.03 | 0.77 | 6,155.4 | 99.6 | 0.80 | 17.90 |
0.35 | 442 | 0.43 | 0.006 | 0.04 | 0.84 | 4,162.0 | 63.2 | 0.53 | 11.89 |
Inferred Mineral Resources | |||||||||
0.10 | 966 | 0.24 | 0.007 | 0.02 | 0.54 | 5,071.7 | 138.5 | 0.75 | 16.85 |
0.15 | 781 | 0.27 | 0.007 | 0.03 | 0.59 | 4,601.8 | 118.9 | 0.66 | 14.93 |
0.20 | 623 | 0.29 | 0.007 | 0.03 | 0.66 | 3,987.2 | 96.2 | 0.58 | 13.16 |
0.25 | 400 | 0.33 | 0.007 | 0.03 | 0.71 | 2,874.1 | 60.8 | 0.40 | 9.14 |
0.30 | 217 | 0.37 | 0.007 | 0.03 | 0.75 | 1,775.4 | 33.0 | 0.23 | 5.25 |
0.35 | 117 | 0.41 | 0.007 | 0.03 | 0.78 | 1,065.4 | 18.1 | 0.13 | 2.95 |
| 14.1.14 | QP Comment |
Other than the risks identified in this Technical Report, Amec Foster Wheeler is not aware of any other environmental, permitting, legal, title, taxation, socioeconomic, marketing, political, or other relevant factors that could materially affect the Mineral Resource estimate.
| | |
| 10/03/2017 |
Page 14 - 29
2017 Updated Preliminary Economic Assessment on the Ann Mason Project
Nevada, U.S.A.
Amec Foster Wheeler concludes the following:
| · | The construction of the Ann Mason Mineral Resource Model is consistent with CIM Estimation of Mineral Resources and Mineral Reserves Best Practice Guidelines. |
| · | The modelling and grade estimation process used is appropriate for a porphyry-style copper-molybdenum-gold-silver deposit and the resource model is suitable to support mine planning for a large-scale open pit mine. |
| · | The Mineral Resource estimates meet the definition of Mineral Resources under CIM Definition Standards for Mineral Resources and Mineral Reserves (May 10, 2014). |
Amec Foster Wheeler makes the following recommendations:
| · | The structural geology in the Ann Mason deposit area is complex. A number of faults with offsets have been identified and modelled by Entreé geologists. Three of the many faults were incorporated into the geological and grade shell models. The positions and offsets across the remaining identified faults require further study. Amec Foster Wheeler is of the opinion that the accuracy of the grade shell and geological models, hence the modelled volume of mineralized material, can be improved by a better understanding of the structural geology. Relogging of drill core, modelling and, potentially, further drilling, to identify and model faults is recommended. |
| · | Visual examination of the block grades for copper, molybdenum, gold, and silver together with the modelled mineralization envelopes for bornite and chalcopyrite suggests that there are correlations between grades and the sulphide mineralization. These relationships were not used for the current Mineral Resource estimate. Amec Foster Wheeler recommends that the relationships between the grade elements with sulphide mineralization are studied further for potential use in refining the copper grade shell model and to develop grade shell models for the minor grade elements in future Mineral Resource estimates. |
| 14.2 | Blue Hill Mineral Resource Estimate |
| 14.2.1 | Current Estimate |
The Blue Hill Mineral Resource estimate remains the same as the estimate published in the 2012 and 2015 PEAs. The Blue Hill Mineral Resource estimate is based on all scientific and technical information as of 3 March 2017 and therefore has an effective date of 3 March 2017. The mineral resource model and the Mineral Resource estimate have not changed since 31 July, 2012, the effective date of the previous Mineral Resource estimate. The assumptions used in 2012 to assess reasonable prospects of eventual economic extraction including metal prices, mining, processing and G&A cost metallurgical recoveries and pit slopes remain the same and are still considered reasonable.
| | |
| 10/03/2017 |
Page 14 - 30
2017 Updated Preliminary Economic Assessment on the Ann Mason Project
Nevada, U.S.A.
The following text was sourced from the 2012 PEA, subject to minor edits.
| 14.2.2 | Basis of Resource Estimate |
Copper, molybdenum, gold, and silver grades from drill hole samples formed the basis of the Blue Hill Mineral Resource estimate. Drill holes from the historical drilling completed by Anaconda and PacMag and Entrée's drill holes were used in the estimate.
Mineral Resources were estimated using Gems 3D mining software version 6.3 (Gems) supplied by Gemcom Software International, and were reported within a Mineral Resource constraining pit shell prepared by Mr. Zurowski.
| 14.2.3 | Sample Database |
AGP received drill hole data from Entrée for historical and recent drilling programs, and imported them into a Gems drill hole database. The data was provided to AGP in MS Excel workbook format, and included collar location, down hole survey, sample assay, lithology and oxidation, RQD and core recovery, and bulk density data.
A total of 57 holes comprise the drill hole database provided by Entrée; however, 50 were used to complete the model and estimate grade. The twenty historical drill holes used in the model, were completed between 1960 and 2007, and consisted of diamond drilling and reverse circulation drilling. Thirty drill holes were completed by Entrée in 2010 and 2011, mostly by reverse circulation, with six holes completed as diamond drill holes. The seven holes that were not used in the Mineral Resource estimate are either historical holes with no useful sampling data or were sufficiently far from the deposit that they could be ignored.
Since 2013, Entrée added 6 RC and 4 diamond drill holes to the dataset. Four of those holes (Figure 14‑18) were located in close proximity to the Mineral Resource but were considered not material to the overall Ann Mason Project therefore the Blue Hill Mineral Resource estimate was not updated and remains the same as in the 2012 PEA.
| | |
| 10/03/2017 |
Page 14 - 31
Figure 14‑18: 2013-2015 Drilling in Relation to the 2012 Estimate
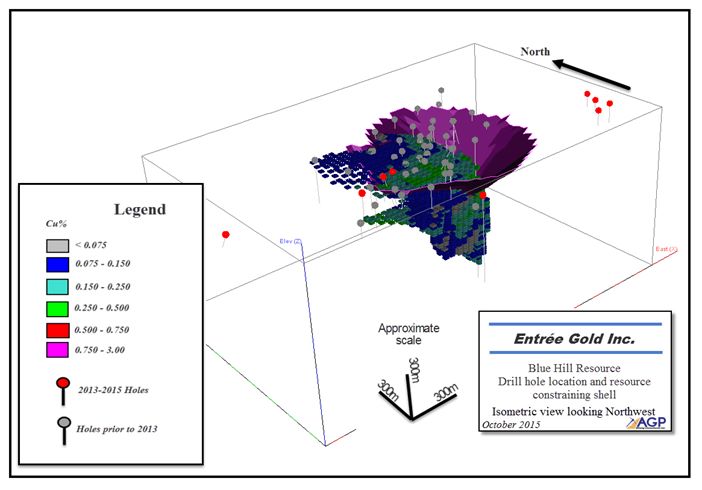
| | |
| 10/03/2017 |
Page 14 - 32
The Anaconda sampling was tested for total copper only. PacMag sampling was tested for copper, molybdenum, gold, and silver. All Entrée samples were tested for copper and molybdenum, and the majority of the sulphide intersections were tested for gold and silver. Acid soluble copper was tested for select intervals in the Entrée holes as well. The number and type of sample (RC or core) are presented in Table 14-15.
Table 14-15: Number of Samples per Campaign by Drill Hole Type
Test Type | Anaconda | PacMag | Entrée | Total | ||||
DD | RC | DD | RC | DD | RC | DD | RC | |
Total Cu | 1,893 | 5 | 347 | 642 | 1,207 | 2,548 | 3,447 | 3,195 |
Acid Soluble Cu | - | - | - | - | 407 | 1,440 | 407 | 1,440 |
Mo | - | - | 347 | 642 | 1,207 | 2,548 | 1,554 | 3,190 |
Au | - | - | 347 | 642 | 800 | 1,552 | 1,147 | 2,194 |
Ag | - | - | 347 | 642 | 800 | 1,552 | 1,147 | 2,194 |
Bulk Density | 1251 | - | - | - | 286 | - | 411 | - |
| Note: | 1Bulk density sampling was completed by Entrée on historical core. |
| 14.2.4 | Domaining |
AGP modelled mineralization at Blue Hill based on all the available core and RC drill hole data.
Sectional interpretations outlining a zone above a cut-off of 0.1% Cu within the oxide and mixed material zones were provided by Entrée; AGP modified this interpretation to include material above 0.075% Cu, and included sulphide material below the limits of the original interpretation at the same 0.075% cut-off.
The mineralization was defined by polylines prepared on NW-SE cross–sections, which roughly correspond to the drill hole sections, and the vertices of the lines were snapped to the drill hole traces, honouring their locations in 3D. The interpretation was cross-checked on perpendicular sections, and modified locally to enhance the smoothness of the model in 3D. The section lines were then tied together to form a closed triangulated wireframe, which represented the mineralization. The model captured most of the assays above the cut-off. Some samples that assayed above the cut-off were excluded from the model on the basis of lacking continuity of mineralization.
Two sub-horizontal triangulated surfaces were modelled from drill hole data and used to subdivide the initial wireframe into primary, mixed, and oxide wireframes. The ratio between acid-soluble copper and total copper was used as a guide for modelling the boundary between sulphide and overlying mixed material. Twenty-five of the thirty drill holes completed by Entrée in 2010 and 2011 were assayed for acid-soluble copper. A sharp increase in the ratio of acid-soluble to total copper was used as a modelling parameter to define the change from sulphide material to mixed material. Preliminary interpretations of mineralogy type, which were based on observed mineral assemblages, were within a few metres for most holes, indicating that the logger adequately identified the mineral assemblage. Five holes completed by Entrée, plus twenty historical drill holes, were not assayed for acid-soluble copper; interpretations of the boundary between primary and mixed material for these holes was developed on the basis of mineral assemblages observed in the core or chips. The boundary between mixed and oxide material was developed based only on mineral assemblages observed in the core or chips.
| | |
| 10/03/2017 |
Page 14 - 33
2017 Updated Preliminary Economic Assessment on the Ann Mason Project
Nevada, U.S.A.
A surface representing the Blue Hill Fault was modelled by AGP and used to cut-off the mineralization from barren material in the hanging wall to the southeast. The modelling of the fault was based on an interpretation provided by Entrée that was supported by field mapping and drilling.
A non-mineralized dyke was modelled in the northeastern portion of the deposit that cross‑cut mineralization.
AGP's interpretation of the mineralized zone was reviewed and cross-checked against that prepared by Entrée, and was concluded to be reasonable to use as a constraint in the preparation of the Mineral Resource estimate. The final wireframes are illustrated in Figure 14‑19 and Figure 14‑20.
| | |
| 10/03/2017 |
Page 14 - 34
2017 Updated Preliminary Economic Assessment on the Ann Mason Project
Nevada, U.S.A.
Figure 14‑19: Oblique View of the Blue Hill Wireframe Model Looking Northeast
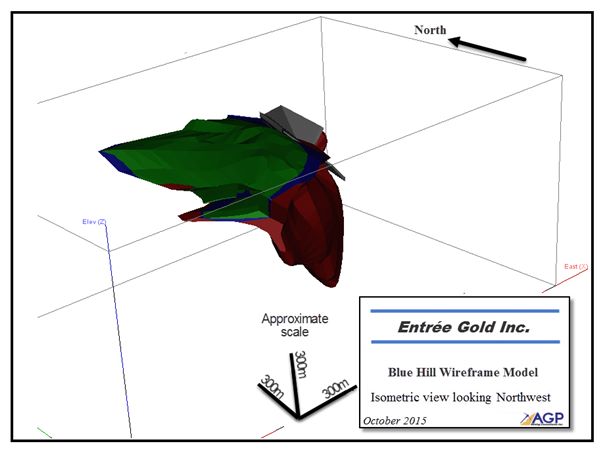
| | |
| 10/03/2017 |
Page 14 - 35
2017 Updated Preliminary Economic Assessment on the Ann Mason Project
Nevada, U.S.A.
Figure 14‑20: Section NE-3 Illustrating Blue Hill Wireframes Looking Northeast

| 14.2.5 | Data Analysis |
Sample Grade
Histograms, probability plots, scatter plots, and contact plots, along with summary statistics and correlation charts, were used to analyze the raw assay data within the domains. These tools were useful in characterizing grade distributions, evaluating domain boundary modelling, and identifying high-grade outliers.
| | |
| 10/03/2017 |
Page 14 - 36
2017 Updated Preliminary Economic Assessment on the Ann Mason Project
Nevada, U.S.A.
Compilation probability plots illustrating the distribution of copper and molybdenum by domain are presented in Figure 14‑21. The top left plot clearly shows that the distribution of copper is similar in all three domains. The top right plot shows that the sulphide domain is the only domain with molybdenum mineralization, albeit low grade. Both the bottom left and right plots demonstrate that gold and silver are not present in significant quantities.
Figure 14‑21: Compilation Probability Plots of Raw Assays by Domain
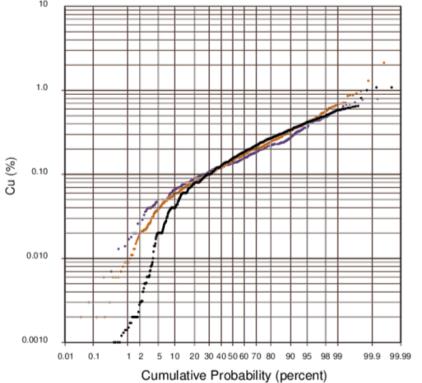
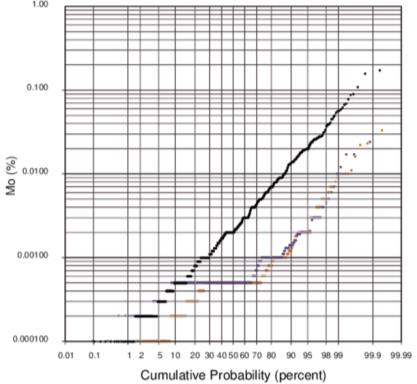

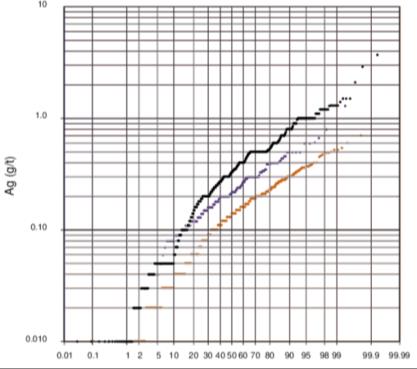
| Note: | The black markers represent sulphide, purple for mixed, and orange for oxide samples. |
Contact profiles were reviewed to assess the continuity of copper grade across domain boundaries. A soft boundary was observed between the oxide and mixed zones, as well as between the mixed and sulphide zones. The change in grade from within the mineralized zone to outside of the zone is sharp, and supports the overall approach to modelling the mineralization above the 0.075% Cu cut-off.
| | |
| 10/03/2017 |
Page 14 - 37
2017 Updated Preliminary Economic Assessment on the Ann Mason Project
Nevada, U.S.A.
RC vs. Diamond Drilling
AGP compared basic descriptive statistics of a selection of RC holes completed by Entrée, which were near core drill holes also completed by Entrée. AGP compared copper assays using box and whisker plots, and the means of the two groups of samples and observed no obvious bias between the RC and diamond drill core assays in the oxide and mixed domains. The holes selected for the comparison did not extend deep enough to complete an analysis in the sulphide domain. RC holes EG-BH-10-001, 002, 003, 008, and 009 were compared to core holes EG-BH-11-015, 016, 017, and 018.
Twins of Historical Holes
Entrée drilled two twin holes to assess bias between the historical results and their own recent drilling. One core drill hole and one RC drill hole (EG-BH-10-011 and EG-BH-11-015) were completed as twins of a historical diamond drill holes drilled by Anaconda (D177 and D200). The number of available samples is not considered by AGP to be statistically significant. AGP compared composited assay data and observed the overall trend of mineralization to be visually similar; however, there was an overall bias. AGP observed that over the same intervals (three mineralized intervals were compared), the recent twins have average grades 10% to 30% lower than their historical twins do. However, after ignoring one high grade composite from a historical hole (D177), the average grades over the interval compared well with the average grade from the twin hole.
To determine if there is a systematic negative bias in the recent drilling compared to the historical drilling, AGP recommends first resampling a portion of the twin historical core (D177 and D200) using the current primary laboratory to perform the assay testwork. If the new results are closer to Entrée's twin hole sample results, then AGP recommends resampling all of the historical holes and using those results for resource estimation. If the new sampling returns similar results to the original tests, then AGP recommends drilling a few more twin holes to confirm the findings.
Core Recovery
Core recovery data was available for the seven diamond drill holes completed by Entrée. The distributions of sample recovery were compared by domain in a box and whisker plot, and the mean core recovery for each of the domains was 95%. No issue regarding core recovery was observed by AGP in the data, and all samples were treated with equal prominence.
Bulk Density
Bulk density testwork was completed by Entrée on eleven diamond drill holes. AGP analyzed the data through the use of histograms, box plots, and summary statistics. The oxide and mixed domains were observed to have similar bulk density distributions, as did the sulphide and waste domains. Table 14-16 presents the median bulk density by domain.
| | |
| 10/03/2017 |
Page 14 - 38
2017 Updated Preliminary Economic Assessment on the Ann Mason Project
Nevada, U.S.A.
Table 14-16: Median Bulk Density by Domain
Domain | Median Bulk Density (g/cm3) | No. of Samples |
Oxide | 2.57 | 69 |
Mixed | 2.56 | 29 |
Sulphide | 2.62 | 170 |
Waste | 2.62 | 142 |
| 14.2.6 | Treatment of High-Grade Outliers |
AGP reviewed histograms and probability plots to determine the potential risk of grade distortion from higher-grade samples. AGP capped copper assays at 0.75%, which had very little effect on the sample mean, while only slightly reducing the CV. Descriptive statistics of original and capped copper grades in raw assays are presented in Table 14-17. The capping level was supported by a natural break in the grade distribution, as evident in Figure 14‑21, and less than 1% of the samples were capped. AGP also capped gold at 0.03 g/t and silver at 2 g/t. No capping was applied to molybdenum.
Table 14-17: Descriptive Statistics of Original and Capped Copper Grades in Raw Assays
Cu (%) | Capped Cu (%) | Au (g/t) | Capped Au (g/t) | Ag (g/t) | Capped Ag (g/t) | |
Count | 3,529 | 3,529 | 1,038 | 1,038 | 1,038 | 1,038 |
Mean | 0.173 | 0.172 | 0.008 | 0.008 | 0.4 | 0.4 |
Standard Deviation | 0.13 | 0.12 | 0.008 | 0.006 | 0.30 | 0.28 |
Variation Coefficient | 0.74 | 0.70 | 1.1 | 0.8 | 0.8 | 0.8 |
Minimum | 0.0005 | 0.0005 | 0.0015 | 0.0015 | 0.01 | 0.01 |
5th percentile | 0.027 | 0.027 | 0.0015 | 0.0015 | 0.04 | 0.04 |
25th percentile | 0.090 | 0.090 | 0.0025 | 0.0025 | 0.17 | 0.17 |
Median | 0.141 | 0.141 | 0.006 | 0.006 | 0.3 | 0.3 |
75th percentile | 0.224 | 0.224 | 0.01 | 0.01 | 0.5 | 0.5 |
95th percentile | 0.407 | 0.407 | 0.019 | 0.019 | 1 | 1 |
Maximum | 2.140 | 0.750 | 0.134 | 0.03 | 3.7 | 2 |
| Note: | Gold and silver statistics are on samples within the sulphide domain only. |
| 14.2.7 | Compositing |
AGP composited the raw drill hole assays to 5 m lengths, starting at the drill hole collars, and broken by the waste-to-mineralized-domain boundary. Composites were not broken by internal boundaries between oxide, mixed, and sulphide domains, since the grade profiles across these zones demonstrated that they were soft boundaries.
| | |
| 10/03/2017 |
Page 14 - 39
2017 Updated Preliminary Economic Assessment on the Ann Mason Project
Nevada, U.S.A.
Entrée sampled diamond core at 2 m intervals, and RC samples were 1.53 m long. Historical holes sampled by PacMag were on 3.05 m intervals. Historical holes sampled by Anaconda were variable, and most of the holes had samples ranging from as small as 0.03 m to 7.62 m in length; however, one hole (D261) had much longer sample intervals, ranging from 3.4 m to 26.4 m.
There were very few missing intervals of copper assay results in the sampling sequence of small lengths, which were treated as zero grade during the calculation of composites. On the other hand, there are holes that were not tested for molybdenum, gold, and silver in the sulphide domain where these elements were estimated. Composites were not created where these elements were not tested.
Composites less than 2.5 m in length were added to the previous composite, thereby creating a dataset of composites ranging from 2.5 m to 7.5 m in length.
The effect of compositing reduced the sample variability while having very little effect on the mean grade of the sample population. Descriptive statistics of capped copper grades in composites are presented in Table 14-18.
Table 14-18: Descriptive Statistics of Composite Grades
Capped Cu (%) | Uncapped Mo (%) | Capped Au (g/t) | Capped Ag (g/t) | |
Count | 1,285 | 517 | 488 | 488 |
Mean | 0.174 | 0.0057 | 0.008 | 0.4 |
Standard Deviation | 0.101 | 0.009 | 0.005 | 0.3 |
Variation Coefficient | 0.580 | 1.6 | 0.6 | 0.7 |
Minimum | 0 | 0.0001 | 0.0015 | 0.01 |
5th percentile | 0.049 | 0.0004 | 0.003 | 0.05 |
25th percentile | 0.105 | 0.0012 | 0.004 | 0.2 |
Median | 0.152 | 0.0027 | 0.007 | 0.3 |
75th percentile | 0.225 | 0.0062 | 0.010 | 0.5 |
95th percentile | 0.367 | 0.0227 | 0.017 | 1.0 |
Maximum | 0.709 | 0.0975 | 0.028 | 1.51 |
| Note: | Valid Cases (N) = 1,285 |
| 14.2.8 | Block Model Parameters |
The block model was set up with a block size of 40 m x 40 m x 15 m, aligned with the UTM grid (i.e., no rotation), and with variables including, but not limited to, the following:
| · | rock type |
| · | grade models for copper, molybdenum, gold, and silver |
| | |
| 10/03/2017 |
Page 14 - 40
2017 Updated Preliminary Economic Assessment on the Ann Mason Project
Nevada, U.S.A.
| · | bulk density |
| · | pass number used to estimate grade for the block |
| · | resource classification. |
The size of the blocks was selected to match the block model used in the Mineral Resource estimate at Ann Mason (described in Section 14.1). It is supported at Blue Hill by the data spacing, the size and geometry of the geological domains, and consideration of the selective mining unit (SMU). The block model geometry is detailed in Table 14-19.
Table 14-19: Block Model Geometry
Resource Model Items | Parameters |
Easting (X) Range | 301,100–303,380 |
Northing (Y) Range | 4,318,430–4,320,110 |
Elevation (Z) Range (m) | 675–1,710 |
Rotation Angle | 0 |
Block Size (X, Y, Z in m) | 40 x 40 x 15 |
Number of Blocks in the X Direction | 57 |
Number of Blocks in the Y Direction | 42 |
Number of Blocks in the Z direction | 70 |
The wireframes were used to code to the rock type block model. Any block with at least 50% of its volume filled by a wireframe was coded with an integer code representing that wireframe.
| 14.2.9 | Estimation/Interpolation Methods |
Copper Grade
Blocks coded from the domains representing the mineralized domains were interpolated from the drill hole composites.
For all domains, capped inverse distance (ID), uncapped ID, and capped NN copper grades were all stored in blocks. ID grades were also estimated for uncapped molybdenum, and capped and uncapped gold and silver.
AGP did not evaluate the spatial continuity of grades using variography, as the spacing of the data is too great to give meaningful results.
To ensure local reproduction of composite grade trends, and to help control grade smearing, the Mineral Resource model was interpolated using multiple passes with successively restrictive search criteria. Two passes were used to estimate copper grades in the mineralized domain, both utilizing the same search ellipse; however, the first pass required only two composites as a minimum, while the second required a minimum of five composites. Both passes used only the 20 closest composites in the estimate and not more than four composites from a single hole. The search ellipse was isotropic in plan view, with major and intermediate axes both 200 m (theoretically including up to five section lines of drill hole data at 100 m spaced lines) and a minor (vertical) axis of 100 m. The ellipse was sized in the horizontal direction to find enough data, and its flattened shape was representative of the overall shape of the mineralized zone in the oxide and mixed zones.
| | |
| 10/03/2017 |
Page 14 - 41
2017 Updated Preliminary Economic Assessment on the Ann Mason Project
Nevada, U.S.A.
The low minimum composite requirement in the first pass enabled the estimator to interpolate grades of blocks using data from at least one drill hole. The second pass overwrote blocks only if data from a minimum of two holes was within the search ellipse.
In the oxide and mixed domains, 99.9% of the blocks were estimated with a copper grade in the first pass, and 98.4% of them were subsequently overwritten by the second pass. The few blocks not overwritten in the second pass were located at the perimeter of the domains where mineralization was relatively narrow. Only one block was not estimated.
In the sulphide domain, 96.5% of the blocks were estimated with a copper grade in the first pass, and 37% of them were subsequently overwritten by the second pass, mostly near the boundary between mixed and sulphide, where drill hole data support is greater than at depth. Only 3.5%, or 175 of the total sulphide blocks, were not estimated with a copper grade.
For copper grade estimation, soft boundaries were applied between all mineralized domains for both passes, and no composite outside of the mineralized domains were considered during grade estimation. Molybdenum, gold, and silver were estimated for blocks in the sulphide domain only and no composite outside of the sulphide domain was considered during grade estimation.
In the sulphide domain, several short drill hole intersections from Entrée holes were not assayed for gold or silver, and none of the Anaconda drill holes were tested for gold, silver or molybdenum. When estimating grades for these elements, the untested holes were ignored and not replaced with zero grades. Fewer blocks were estimated with grades for these elements due to missing data.
Bulk Density
Too few samples have been collected to interpolate bulk density on a block-by-block basis; global bulk density values were assigned to all blocks on a domain-by-domain basis. A value of 2.57 was assigned to all blocks in the oxide and mixed domains, and 2.62 were assigned to all blocks in the sulphide and waste domains.
| | |
| 10/03/2017 |
Page 14 - 42
2017 Updated Preliminary Economic Assessment on the Ann Mason Project
Nevada, U.S.A.
| 14.2.10 | Block Model Validation |
Four validation exercises were completed on the Blue Hill Mineral Resource model:
| · | Visual comparison of block and composite grades on sections. No discrepancies between block and composite grades were observed. |
| · | Global comparison of contained metal between the ID and the NN models. The NN model reported 11% fewer copper pounds above a 0.075% Cu cut-off. |
| · | Global comparison of contained metal between the capped ID and uncapped ID models. The capping removed less than 1% Cu metal above a 0.075% Cu cut-off. |
| · | Local comparison of ID block grade to NN block grades using swath plots. The ID blocks generally honour the distribution of the nearest neighbour block grades, indicating that no local bias was observed in the model. Any deviations noted corresponded to areas where there are only a small number of blocks. |
No errors were observed with the model that would affect Mineral Resource estimation.
| 14.2.11 | Classification of Mineral Resources |
Mineral Resources were classified in accordance with the May 10th 2014 CIM Definition Standards for Mineral Resources and Mineral Reserves. In determining the appropriate classification criteria for Blue Hill, several factors were considered:
| · | observations of grade and geological continuity on section |
| · | quality of input data and verification of historical results |
| · | NI 43-101/CIM requirements and guidelines. |
The deposit is at an early stage of investigation. Spacing of drill holes was sufficient to reasonably assume continuity of mineralization between drill holes; however, more drilling at tighter spacing is required in order to better understand local variability in grades and controls on mineralization. AGP concluded that blocks within the wireframe representing the mineralized domains could be classified as Inferred Mineral Resources, and AGP did not classify any block as Indicated or Measured.
| 14.2.12 | Resource Pit Constraints |
Mineral Resources were reported within a Lerchs-Grossman (LG) pit shell, generated by AGP, above a copper cut-off of 0.10% for the oxide and mixed zones and 0.15% for the sulphide zone. The general parameters of the LG pit are as follows:
| · | gross metal values of$3.61/lb Cu, $13.50/lb Mo, $1,100/oz Au and $15/oz Ag were used; after adjustment for payables, smelting, refining, roasting and transportation charges, and transit losses as appropriate, the net metal prices are: |
| | |
| 10/03/2017 |
Page 14 - 43
2017 Updated Preliminary Economic Assessment on the Ann Mason Project
Nevada, U.S.A.
| - | $3.32/lb Cu for oxide and mixed material |
| - | $3.16/lb Cu, $12.12/lb Mo, $1,057/oz Au, and $13.58/oz Ag for sulphide material |
| · | metallurgical recoveries of: |
| - | 81.7% leachable oxide material (60-day column leach value) |
| - | 75% for leachable mixed material (60-day column leach value) |
| - | 92% Cu, 50% Mo, 50% Au and 55% Ag flotation recoveries for sulphide material |
| · | mining costs: |
| - | oxide and mixed feed material - $1.30/t |
| - | sulphide feed material - $1.13/t |
| - | all waste costs - $1.13/t |
| · | combined process and G&A costs of: |
| - | $5.06/t for oxide and mixed feed material |
| - | $6.22/t for sulphide feed material |
| · | pit slopes of 40° in both the overlying volcanic and in the mineralized granodiorite. |
| 14.2.13 | Mineral Resource Statement |
The Blue Hill Inferred Mineral Resource estimate has an effective date of March 3, 2017. Mr. Desautels was the QP for the estimate. The estimate is summarized in Table 14-20, above marginal copper cut-offs, and within a Mineral Resource constraining shell.
The sensitivity of the Mineral Resource estimate to changes in the copper cut-off is presented in Table 14-21. Mineral Resources that are not Mineral Reserves do not have demonstrated economic viability.
Other than the risks identified in this Technical Report, AGP is not aware of any other environmental, permitting, legal, title, taxation, socioeconomic, marketing, political, or other relevant factors that could materially affect the Mineral Resource estimate.
| | |
| 10/03/2017 |
Page 14 - 44
2017 Updated Preliminary Economic Assessment on the Ann Mason Project
Nevada, U.S.A.
Table 14-20: Blue Hill Inferred Mineral Resource Estimate (Effective Date: March 3, 2017)
Zone | Cu Cut-off (%) | Tonnes (Mt) | Grade Cu (%) | Contained Cu (Mlb) | Mo (%) | Au (g/t) | Ag (g/t) |
Oxide Zone | 0.10 | 47.44 | 0.17 | 179.37 | - | - | - |
Mixed Zone | 0.10 | 24.69 | 0.18 | 98.12 | - | - | - |
Oxide + Mixed Zone | 0.10 | 72.13 | 0.17 | 277.49 | - | - | - |
Sulphide Zone | 0.15 | 49.86 | 0.23 | 253.46 | 0.005 | 0.01 | 0.3 |
| Note: | The following notes should be read in conjunction with Table 14-20 and Table 14-21: 1. Mineral Resources are classified in accordance with the 2014 CIM Definition Standards for Mineral Resources and Mineral Reserves. 2. Mineral Resources are reported within a Mineral Resource constraining shell. 3. Mineral Resources do not include external dilution, nor was the tabulation of contained metal adjusted to reflect metallurgical recoveries. 4. Tonnages are rounded to the nearest 10,000 tonnes, and grades are rounded to two decimal places. Rounding as required by reporting guidelines may result in apparent summation differences between tonnes, grade, and contained metal content. 5. Material quantities and grades are expressed in metric units, and contained metal in imperial units. 6. The Blue Hill Mineral Resource is shown at multiple cut-offs to assess the sensitivity to cut-off grade. |
Table 14-21: Blue Hill Inferred Mineral Resource Sensitivity to Copper Cut-off Changes within the Constraining Shell (Effective Date: March 3, 2017)
Zone | Cu Cut-off (%) | Tonnes (Mt) | Cu (%) | Contained Cu (Mlb) | Mo (%) | Au (g/t) | Ag (g/t) |
Oxide Phase | 0.25 | 3.33 | 0.28 | 20.85 | - | - | - |
0.2 | 12.42 | 0.24 | 65.03 | - | - | - | |
0.15 | 28.40 | 0.20 | 125.55 | - | - | - | |
0.1 | 47.44 | 0.17 | 179.37 | - | - | - | |
Mix Phase | 0.25 | 1.30 | 0.31 | 8.90 | - | - | - |
0.2 | 7.32 | 0.24 | 38.09 | - | - | - | |
0.15 | 19.22 | 0.19 | 82.35 | - | - | - | |
0.1 | 24.69 | 0.18 | 98.12 | - | - | - | |
Primary Phase | 0.25 | 16.59 | 0.31 | 111.93 | 0.007 | 0.011 | 0.3 |
0.2 | 29.31 | 0.27 | 173.87 | 0.006 | 0.010 | 0.3 | |
0.15 | 49.86 | 0.23 | 253.46 | 0.005 | 0.010 | 0.3 | |
0.1 | 57.82 | 0.22 | 276.80 | 0.004 | 0.009 | 0.3 |
| | |
| 10/03/2017 |
2017 Updated Preliminary Economic Assessment on the Ann Mason Project
Nevada, U.S.A.
| 15 | Mineral Reserve Estimates |
The Ann Mason Project is at a PEA level of study and therefore has no reserves at this time.
| | |
| 10/03/2017 |
Page 15 - 1
2017 Updated Preliminary Economic Assessment on the Ann Mason Project
Nevada, U.S.A.
| 16 | Mining Methods |
| 16.1 | Geotechnical |
Entrée retained BGC in association with AGP to undertake a geotechnical review of the proposed open pit. This was completed in 2012 and no changes to this work were completed for the 2017 PEA.
The geotechnical review was limited to:
| · | a compilation and review of the available data relevant to geotechnical evaluations of the open pit slopes |
| · | a summary of the project setting, including the engineering geology and hydrogeology of the study area based on the available data |
| · | estimates of ranges of overall pit slope angles, based on existing open pits in similar geologic units, for use in the PEA-level pit optimizations carried out by AGP |
| · | recommendations for geotechnical assessments of the proposed open pits, to be undertaken as part of a pre-feasibility level study. |
The details of each component of the geotechnical review are provided below.
| 16.1.1 | Data Compilation and Review |
Data available for estimating open pit slope angles for the Ann Mason deposit was limited to the following:
| · | rock core from exploration drilling |
| · | the performance of the slopes of the nearby Yerington Pit |
| · | geological interpretations of the project area |
| · | groundwater elevations. |
Mr. Derek Kinakin and Mr. Warren Newcomen of BGC visited the project site from February 28, 2012 to March 1, 2012. Available exploration drill core from five holes in the Ann Mason deposit was reviewed and logged for geotechnical parameters. The drill holes available for review were mainly located in the mineralized zones, in the centre of the proposed open pits. Drill core from the proposed pit slope areas was not available. In addition, much of the drill core reviewed had already been cut and sampled for assays.
Note that the drill core was HQ diameter and recovered with "double tube" methods, typical of exploration geology drilling. This drilling method is adequate for the recovery of core for geology logging and assay; however, the core can be disturbed and broken by the drilling process. As such, RQDs logged by Entrée as part of their basic data collection may under-represent the in situ quality of the rock mass due to this disturbance. BGC supplemented Entrée's data with observations of rock strength, fracture spacing, longest stick, and joint condition for the sections of drill core reviewed (Table 16-1).
| | |
| 10/03/2017 |
Page 16 - 1
2017 Updated Preliminary Economic Assessment on the Ann Mason Project
Nevada, U.S.A.
Table 16-1: Ann Mason Rock Mass Properties
Zone | Geotechnical Unit | Length Observed (m) | Case | RQD (%)1 | Intact Strength | RMR (1976)3 | ||
Strength Grade (R)2 | Description | Rating | Description | |||||
Ann Mason (AM) | Fault Zone (FLTZ) | 52 | Lower Range | 0 | 1.0 | Very Weak | 22 | Poor |
Median | 0 | 1.5 | Very Weak/Weak | 25 | Poor | |||
Upper Range | 14 | 2.0 | Weak | 25 | Poor | |||
Volcanics (VOL) | 229 | Lower Range | 17 | 3.0 | Medium Strong | 38 | Poor | |
Median | 37 | 3.0 | Medium Strong | 44 | Poor | |||
Upper Range | 55 | 4.0 | Strong | 52 | Fair | |||
Porphyries (QMP) | 583 | Lower Range | 0 | 2.0 | Weak | 31 | Poor | |
Median | 11 | 3.0 | Medium Strong | 37 | Poor | |||
Upper Range | 30 | 3.0 | Medium Strong | 44 | Fair | |||
Granodiorite (GD) | 151 | Lower Range | 0 | 2.0 | Weak | 31 | Poor | |
Median | 0 | 2.5 | Weak/Medium Strong | 34 | Poor | |||
Upper Range | 27 | 3.5 | Medium Strong/Strong | 39 | Poor | |||
| Notes: | 1. RQD logged by Entrée staff and based on core retrieved using double tube drilling techniques. 2. Strength grade logged by BGC staff. 3. The rock mass rating (RMR) was estimated based on available RQD data and supplementary core logging by BGC. |
During the site visit by BGC in 2012, a tour of the Yerington Pit, in an adjacent property was conducted with Mr. George Eliopulos of Quaterra. The Yerington Pit was mined from 1953 to 1978 and extracted copper oxide and sulphide ore hosted in rocks similar to the Ann Mason Project. The Yerington Pit is approximately 250 m deep, with slopes developed in alluvium, and poor to fair quality weathered intrusive bedrock. Observed inter-ramp angles in the weathered bedrock varied from 40° up to 48° for inter-ramps heights of approximately 100 m, exposed above the current pit lake level. Toppling instabilities were observed in the some of the inter-ramp scale slopes. In general, the performance of the pit slopes appeared to be adequate, considering the age of the slopes and the lack of ongoing maintenance (i.e., pit dewatering, water management, etc.).
An overview of the geological interpretations for the Ann Mason Project area was provided to BGC by Mr. T. Watkins and Mr. R. Cinits of Entrée. Building on the work of Proffett and Dilles (1984), Entrée has developed 3D interpretations of the main rock units and faults of the area. BGC was provided with DXF files for these 3D geological interpretations. Entrée also provided PDF copies of preliminary geological cross-sections for the Ann Mason and Blue Hill deposit for their review.
| | |
| 10/03/2017 |
Page 16 - 2
2017 Updated Preliminary Economic Assessment on the Ann Mason Project
Nevada, U.S.A.
Entrée drilled a well in the Ann Mason deposit in July 2011 in an attempt to provide a nearby source of water for drilling. Efforts to complete the well were unsuccessful and the Company continued to utilize water purchased from the City of Yerington. The details of the well are available in the State of Nevada Division of Water Resources well log database. Water levels for the well have been provided from a U.S. Geological Survey water resources data report (USGS, 2012). Two measurements of the depth to water in this well are available.
Geotechnical data relevant to the open pit slopes is limited at this stage of study, which is typical of most mine development projects at the PEA stage. Entrée's work on the geology of the site appears to be of good quality and their development of a fault model at this stage of study is commendable. The major data limitation identified is a lack of geotechnical drilling information outside of the mineralized zone. Geotechnical data in the area of the proposed pit slopes will be needed for future geotechnical evaluations.
| 16.1.2 | District Geology – Geotechnical Perspective |
The geological units of the Yerington District include Quaternary alluvium, Cenozoic volcanic rocks, and Mesozoic intrusive rocks of the Yerington batholith. The bedrock of the district is transected by a series of faults, which resulted in tilting and rotation of the rocks from their original attitudes. The mapping compilation of Proffett and Dilles (1984) provides a good overview and serves as the basis of ongoing interpretive work done by Entrée.
The Quaternary alluvial deposits include silts, sands, and gravels from lakes, floodplains, and fans. This unit overlies the volcanic and intrusive rocks of the district. In the area of the Ann Mason Project, the thickness of these units ranges from 5 m to 15 m. A limited portion of the first bench on the west-northwest wall of the proposed Ann Mason open pit may encounter alluvium. Slope design parameters for the alluvial deposits have not been estimated as part of the current scope of work, and are not considered material to the geotechnical study of the overall open pit slopes.
A series of Tertiary-aged volcanic rocks, including ignimbrites, tuffs, and lava flows, have blanketed the Yerington District. These rocks are exposed in the area of the Ann Mason Project, and overlie rocks of the Yerington batholith. The volcanic rocks and underlying rocks of the batholiths are tilted westward due to the regional faulting. The volcanics are unmineralized, and represent waste rock to be stripped during mining. The volcanic rocks are mainly observed overlying the Ann Mason deposit, and are separated from the rocks of the Yerington Batholith by the shallow-dipping Singatse Fault. The thickness of the volcanic rocks varies from less than 20 m to a maximum of 300 m (average 100 m) in the area of the Ann Mason deposit.
A summary of the regional geology and structure is provided in Section 7.
| | |
| 10/03/2017 |
Page 16 - 3
2017 Updated Preliminary Economic Assessment on the Ann Mason Project
Nevada, U.S.A.
| 16.1.3 | Rock Mass Character of the Ann Mason Deposit |
The rock mass of the Ann Mason deposit may be divided into three main geotechnical units:
| 9) | Tertiary volcanics (AM-VOL) |
| 10) | granodiorite of the Yerington batholith (AM-GD) |
| 11) | quartz monzonite porphyry of the Yerington batholith (AM-QMP). |
The AM-VOL geotechnical unit is composed of Tertiary volcanic rocks. From core logging observations, the intact strength of the AM-VOL unit was estimated to be medium strong (R3) to strong (R4) (Table 16-1). The "joint condition" (Bienawski, 1976) ranged from 6 to 16, with a median value of 12, and the RQD (Deere and Deere, 1988) was generally Poor. Based on the estimated rock mass properties, the qualitative rock mass rating (RMR) of AM-VOL is Fair.
The overlying volcanic rocks have limited the weathering of the underlying granodiorites and quartz monzonites, and as a result, there are no well-developed oxides in the Ann Mason deposit. The AM-GD geotechnical unit is composed of unweathered Jurassic granodiorite rocks. This unit forms the south and west walls of the proposed Ann Mason pit, and is expected to be up to 700 m high. From core logging observations, the intact strength of the AM-GD unit was estimated to be Weak (R2) to Medium Strong/Strong (R3.5). The "joint condition" ranged from 6 to 16, with a median value of 12, and the RQD was generally Very Poor. Based on the estimated rock mass properties, the qualitative rock mass rating (RMR) of AM-GD is interpreted to be Poor.
The AM-QMP geotechnical unit is composed of Jurassic porphyritic quartz monzonite rocks of the Yerington batholith. This unit forms the north and east walls of the proposed Ann Mason pit, and is expected to be up to 1,000 m high. From core logging observations, the intact strength of the AM-QMP unit was estimated to be Weak (R2) to Medium Strong (R3). The "joint condition" ranged from 12 to 20, with a median value of 12, and the RQD was generally Very Poor. Based on the estimated rock mass properties, the qualitative rock mass rating (RMR) of AM-QMP is interpreted to be Poor.
| 16.1.4 | Structural Geology of the Ann Mason Deposit |
Bedding is the main geological structure observed in the volcanic rocks of the Ann Mason deposit. The bedding dips on average at 62° to the west. This west dip of the bedding is a result of the regional tilting due to the rotation of normal faulting.
The main faults of the Ann Mason deposit are the Singatse Fault, the Montana Yerington Fault (1.5 km east of pit), and several possible southeast-striking normal faults. The flat, extensional, concave Singatse Fault dips east at about 12° or less. Originally a moderately-dipping normal fault, it has been tilted by younger phases of faulting. The Singatse Fault typically comprises an oxidized red gouge material. The Montana Yerington fault is located at the eastern edge of the study area, between the Ann Mason deposit and Yerington Pit. This fault dips approximately 50° to the east, and is an example of the younger regional basin and range style normal faults. Up to ten southeast-striking normal faults have been interpreted by Entrée near the centre of the Ann Mason deposit, and are included in the 3D geological model. These faults strike approximately 145° and dip 60° to 80° south; seven of the ten faults are interpreted over a distance of 330 m to 450 m (Figure 16‑1). If the spacing and continuity of these faults observed in the centre of the Ann Mason deposit is also found in the area of the ultimate walls, toppling instabilities could develop in southwest walls of a potential open pit.
| | |
| 10/03/2017 |
Page 16 - 4
2017 Updated Preliminary Economic Assessment on the Ann Mason Project
Nevada, U.S.A.
All of the identified faults may include significant zones of highly fractured rock and gouge, which have slicken sided discontinuity surfaces. The intact strength of the rock in the fault zones was typically Very Weak (R1) to Weak (R2). The RQD was generally Very Poor to Poor. Based on the estimated rock mass properties, the qualitative rock mass rating (RMR) of the fault zones is interpreted to be Poor.
| 16.1.5 | Hydrogeology |
One 118 m deep attempted well was drilled by Entrée within the Ann Mason deposit. Measurements taken in July and August 2011 indicated that the water levels ranged between 66 m and 35 m below the current ground surface. The well was plugged and abandoned following an unsuccessful attempt to complete the well for the purpose of providing water for exploration drilling. The recorded water level measurements are not believed to be representative of the hydrology of the Ann Mason deposit. At this stage of study, no information is available regarding the hydraulic conductivity of the rock mass of the Ann Mason Project.
| | |
| 10/03/2017 |
Page 16 - 5
2017 Updated Preliminary Economic Assessment on the Ann Mason Project
Nevada, U.S.A.
Figure 16‑1: Ann Mason Geotechnical Considerations
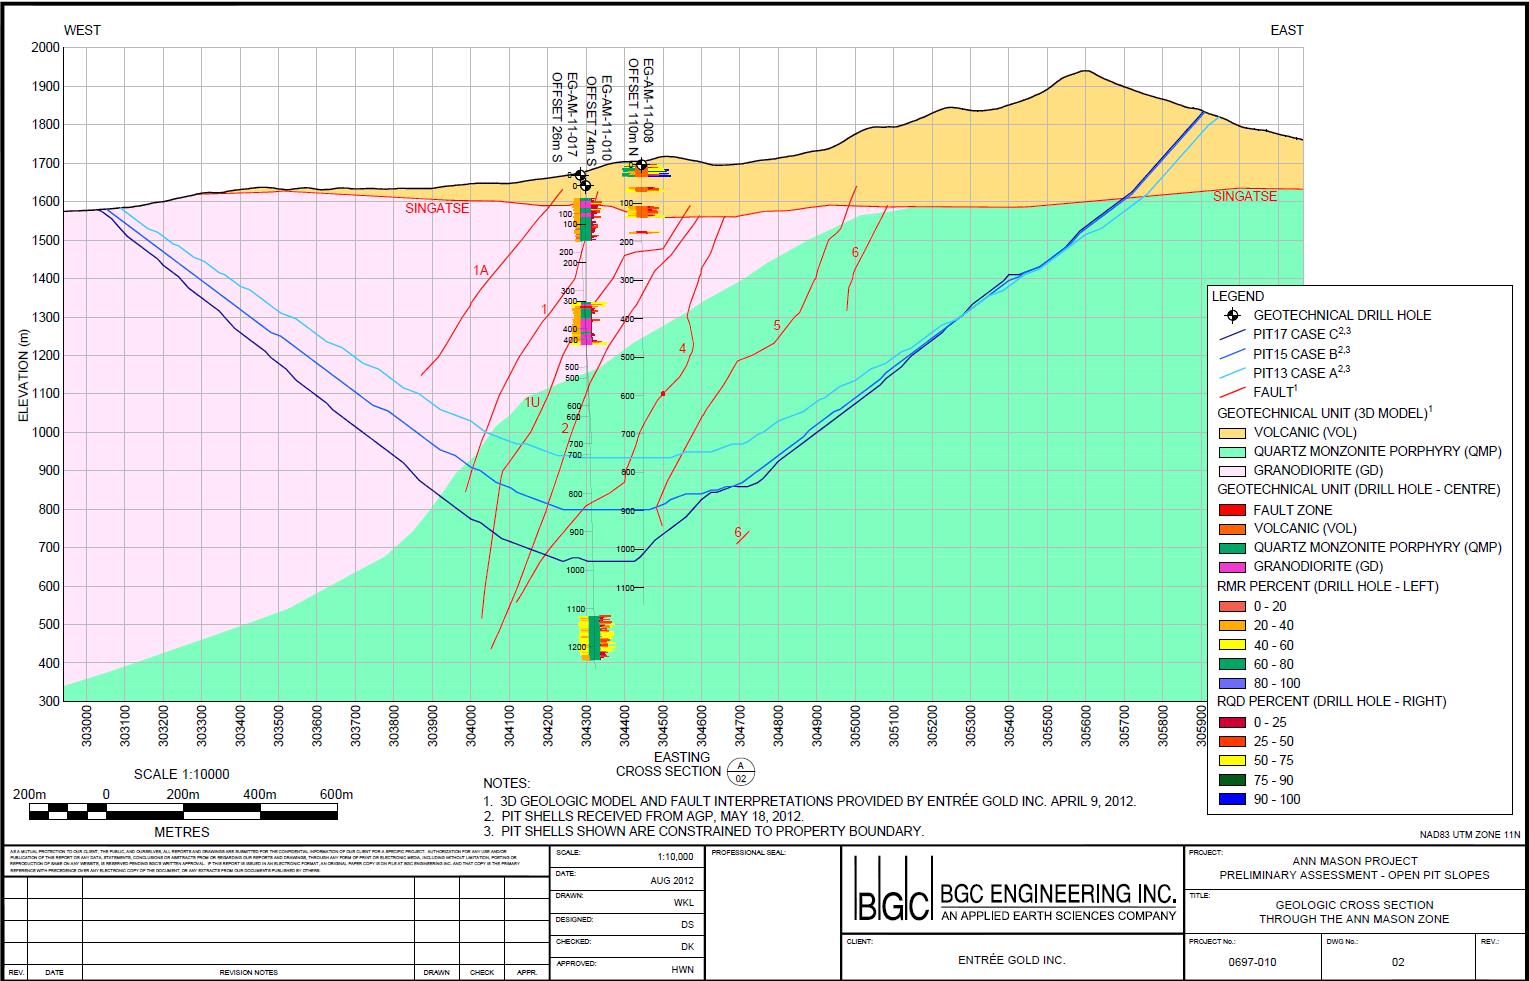
| | |
| 10/03/2017 |
Page 16 - 6
2017 Updated Preliminary Economic Assessment on the Ann Mason Project
Nevada, U.S.A.
| 16.1.6 | Preliminary Open Pit Slope Angles |
At this preliminary stage of study, BGC has estimated pit slope angles for the Ann Mason deposit based on:
| · | Rock mass quality data from available drill holes; however, considering the limited data, the drill holes' location in the centre of the zones, and the general disturbance of core from drilling, drill core data alone is insufficient to develop slope designs at this stage of study. |
| · | Comparison of the Ann Mason deposit to existing open pit mines. The open pit mines selected as analogues ( |
| · | Table 16-6) have similar settings and sizes to that proposed for Ann Mason. |
| · | Field observations of the Yerington Pit, particularly the bench and inter-ramp scale slopes observed by BGC during the field visit. |
Slope design recommendations have been provided for the bench, inter-ramp, and overall slope scales. With consideration of the preliminary stage of study, the proposed size of open pit for the Ann Mason deposit, and the associated economic impacts of the pit slope angles, a range of slope angles (Cases A, B, and C, shown in Figure 16‑1) were provided for use by the mine planners.
The bench and inter-ramp scale designs (Table 16-2) represent a possible slope configuration that could achieve the overall slope angle (Figure 16‑2); other configurations may be possible, depending on the selection of equipment and the ramp access into the pit. The maximum inter-ramp height is limited at this stage of study to 150 m in the Ann Mason deposit; each slope segment is assumed to be separated by ramps or geotechnical berms that may be wider than the standard berms. For the current work, ramps and geotechnical berms are assumed to be the same width. The ramps or geotechnical berms must be wide enough to provide access for the installation and maintenance of dewatering wells, piezometers, slope-monitoring prisms, or other geotechnical instrumentation. Limiting the inter-ramp slope height also serves to limit the maximum size of potential inter-ramp scale slope failures.
In addition to the slope angles, BGC has summarized some of the typical activities undertaken at large open pit mines to manage the slopes and achieve the recommended slope designs. These activities may have capital and or operating costs associated with them. Costs are not provided for these activities as part of the current work; however, future stages of work may estimate costs associated with these activities.
| | |
| 10/03/2017 |
Page 16 - 7
2017 Updated Preliminary Economic Assessment on the Ann Mason Project
Nevada, U.S.A.
Table 16-2: Ann Mason Design Cases
Case | Domain | Catch Bench Geometry | Inter-Ramp Geometry | Overall Geometry | ||||
Height (m) | Angle (°) | Width (m) | Max. Height (m) | Angle (°) | Assumed Height (m) | Angle (°) | ||
A | I | 30 | 67 | 11 | 150 | 52 | 300 | 50 |
II | 15 | 63 | 14 | 150 | 35 | 1,050 | 33 | |
B | I | 30 | 67 | 11 | 150 | 52 | 300 | 50 |
II | 15 | 63 | 11 | 150 | 39 | 1,050 | 37 | |
C | I | 30 | 67 | 11 | 150 | 52 | 300 | 50 |
II | 15 | 63 | 8 | 150 | 44 | 1,050 | 41 | |
| Note: | Overall geometry assumes one 32 m ramp for every bench stack height. |
Figure 16‑2: Open Pit Slope Geometry Definitions
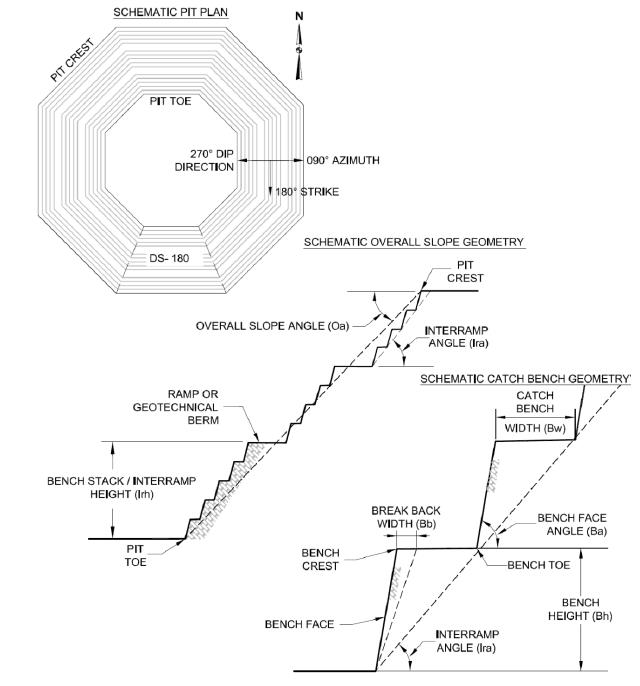
| | |
| 10/03/2017 |
Page 16 - 8
2017 Updated Preliminary Economic Assessment on the Ann Mason Project
Nevada, U.S.A.
Open Pit Database
BGC maintains a database of the slope heights and overall angles of operating open pit mines from around the world. From the 148 slopes in the database, 72 are from open pits that mine porphyry-related ore bodies; of those, five examples were identified of large (>700 m high) slopes in mines which target copper porphyry ore zones hosted in granitic rocks (Table 16-3). While the rock mass quality in each mine is variable, the available descriptions of each mine from the literature (Sjoberg, 1996) and BGC's observations of the Ann Mason deposit drill core suggests that the selected cases are appropriate analogues for the current work.
| Table 16-3: | Examples of Large Copper Porphyry Mine Slope Geometries |
Company | Pit | Overall Slope Angle (°) | Overall Slope Height (m) | Location | Rock Type | Comments (Sjoberg, 1996) |
Bougainville Copper Ltd. | Bougainville Mine | 35 | 950 | PNG | Diorite and granodiorites | "Intensively fractured" rock mass with "very low" strength |
Codelco | Chuquicamata (East Wall) | 42 | 780 | Chile | Granodiorites | "Fairly competent" rock mass with intact strengths from 60 to 80 MPa |
Codelco | Chuquicamata (West Wall) | 32 | 750 | Chile | Granodiorites | Continuously toppling overall slope; intact strengths vary from 30 to 100 MPa |
Freeport-McMoran | Grasberg | 34 | 800 | Indonesia | Diorites and volcanics | RMR in proposed bloc caving area below the current open pit varies from 40 to 70 with an average of 59 |
Rio Tinto Group | Bingham Canyon (Mail Hill) | 37 | 850 | Utah | Quartz monzonite | UCS varies from 1 to 140 MPa; generally "very" fractured. Rock mass friction angles vary from 28° to 46° with average cohesion of 0.1 MPa. |
Ann Mason Deposit Open Pit Slope Angles
The Ann Mason deposit is divided into two domains for estimating open pit slope angles
(Table 16-2):
(Table 16-2):
| · | slopes within the AM-VOL geotechnical unit (Domain I) |
| · | slopes within the AM-GD and AM-QMP geotechnical units (Domain II). |
Based on the apparent rock mass quality and expected slope heights, the achievable overall angles in Domain I will be limited by the bench scale slope geometry. Bench face angles of 65° to 70° (67° on average) are assumed based on the generally fair rock mass quality in this domain. A single bench height of 15 m has been used, based on guidance from AGP; double benching may be possible in Domain I due to the Fair rock mass quality, resulting in a final bench height of 30 m. With an estimated minimum catch bench width of 11 m to manage potential rock fall hazards, the maximum inter-ramp angle is 52°. Assuming that the proposed 300 m high overall slope in this domain/rock type would be split into two 150 m-high inter-ramp segments by a double lane haul ramp, the maximum overall slope angle would be approximately 50°.
| | |
| 10/03/2017 |
Page 16 - 9
2017 Updated Preliminary Economic Assessment on the Ann Mason Project
Nevada, U.S.A.
The achievable overall slope angles in Domain II are expected to be limited by the rock mass quality, and have been estimated for three cases (Cases A, B, and C) based on the range of overall slope angles represented in the database compiled by BGC. Domain II is anticipated to be 1,050 m high; from existing pits with heights approaching this shown in Table 16-3, overall angles of 33°, 37°, and 41° have been assumed for Cases A, B, and C, respectively, to reflect the range of industry-achieved pit slope angles in similar deposit types. Bench face angles may range from 60° to 65° (63° on average) for these cases, based on our experience with benches in other mines and our observations from the Yerington Pit.
A single bench height of 15 m has been used; Domain II should be limited to single benches, considering the generally Poor quality of the rock mass observed during our review of the drill core. Assuming a maximum inter-ramp height of 150 m so that pit dewatering objectives can be achieved, a 14 m catch bench width is required for Case A (35° inter-ramp angle), an 11 m catch bench width is required for Case B (39° inter-ramp angle), and an 8 m catch bench width is required for Case C (44° inter-ramp angle).
Open Pit Slope Management
Blasting
Controlled blasting should be assumed for all final rock slopes in the Ann Mason deposit. Controlled blasting techniques may include trim and buffer blasting or pre-split blasting. The goal of the blast design should be to limit disturbance of the rock mass remaining in the final pit slope.
Slope Monitoring
The current state of practice for slope monitoring in open pit mines in North America is based on a multi-tiered system, which may include the following:
| · | visual inspections |
| · | theodolites (robotic or manual) and a network of survey prisms |
| · | mobile or fixed slope stability radar equipment |
| · | wire extensometers and inclinometers |
| · | piezometers. |
Considering the proposed size of the Ann Mason open pit, multiple robotic theodolites would be required to survey the pit slopes. Depending on the number of active mining fronts, two or three slope stability radar systems may also be required. This quantity of equipment is comparable to existing large open pit operations, such as Goldstrike or Bingham Canyon.
| | |
| 10/03/2017 |
Page 16 - 10
2017 Updated Preliminary Economic Assessment on the Ann Mason Project
Nevada, U.S.A.
Pit Dewatering and Slope Depressurization
Dewatering of the open pits is required to:
| · | reduce the potential for wet blast holes |
| · | provide a dry pit floor for good working conditions. |
The proposed pit will likely be developed below the groundwater table, and dewatering will be required.
In addition to pit dewatering, a certain level of depressurization of the walls of the open pits will be required to maintain the stability of the overall slopes. In general, depressurization of bench scale and inter-ramp scale geological structures, which could contribute to potential kinematic failures should be undertaken via vertical wells or horizontal drains, as appropriate. Horizontal drains may be particularly useful for depressurizing the pit slopes if the steeply dipping faults (1 to 8) interpreted in the centre of the Ann Mason deposit are found in the final walls. Considering the size of the proposed open pit, a dedicated drill rig for the installation of horizontal drain holes may be required. Vertical in-pit and perimeter wells will be required, and some of these wells may have to be replaced as the pit expands and mines them out.
Geotechnical Support Staff
Bench marking of large mines undertaken by Flores and Karzulovic (2002) suggests that the size of the geotechnical team required to manage a large open pit excavation varies with production rate. Open pit mines with production rates of less than 75,000 t/d generally require no more than five staff on average. Mines with higher production rates may require significantly more staff for geotechnical support. It is assumed that the geotechnical team includes engineers, geologists, and technicians responsible for ongoing data collection, slope monitoring, and slope design optimizations. At this stage of study, a minimum five person geotechnical group should be assumed as needed to manage the day-to-day geotechnical and hydrogeological work during operation of the proposed Ann Mason open pit.
| 16.2 | Open Pit Mining |
| 16.2.1 | Introduction |
This section discusses the updates to the mine planning performed for the original 2012 PEA study. The mine planning has not changed from that presented in the 2015 PEA Update. Open pit mining was selected as the method to examine the Ann Mason deposit based on the size of the resource and the tenor of the grade. The grades are considered insufficient to support bulk underground mining.
| | |
| 10/03/2017 |
Page 16 - 11
2017 Updated Preliminary Economic Assessment on the Ann Mason Project
Nevada, U.S.A.
| 16.2.2 | Geological Model Importation |
The resource model developed by Amec Foster Wheeler using Vulcan software (Section 14) is used as the basis for the examination of the open pit potential of the Ann Mason deposit. From this model AGP created an engineering block model in MineSight with additional items for use in block valuation and economic pit shell generation.
Table 16-4 shows the boundaries used for the model.
Table 16-4: Model Boundaries
Model Type | X | Y | Z |
Minimum | 302,500 | 4,316,000 | 0 |
Maximum | 306,820 | 4,319,400 | 2,040 |
Dimension (m) | 20 | 20 | 15 |
All the grade items in the engineering model remain the same as in the geological model. A volumetric verification analysis showed the tonnes and grade of the mineralized material to be identical, confirming a proper capture of the model information from Vulcan to MineSight.
The resource model includes a 'minerialization type' item that delineates the following styles of mineralization: bornite-chalcopyrite, chalcopyrite-pyrite, pyrite-chalcopyrite and Gypsum. This item was used to identify the approximate blends of mineralization that would be processed at different times through the mine life, which in turn was used to guide sample selection and composite development for the 2015 met testwork.
| 16.2.3 | Resource Model Sensitivity Analysis |
In order to quantify the potential effect of the new resource model on mine planning, LG shells were generated on the old and new resource models using the 2012 PEA 100kt/d economic parameters with the metal prices used for resource constraint and establishing set back distances for infrastructure. The volumetric results of the two pit shells are shown in Table 16-5.
| | |
| 10/03/2017 |
Page 16 - 12
2017 Updated Preliminary Economic Assessment on the Ann Mason Project
Nevada, U.S.A.
Table 16-5: Model Comparison LG Shell Results – reported at 0.20 Cu% Cut-off
Input Parameter | Unit | 2012 Resource Model | 2015 Resource Model |
Mill Feed | Mt | 2,009.7 | 1,967.7 |
Copper | % | 0.31 | 0.31 |
Moly | % | 0.005 | 0.006 |
Gold | g/t | 0.028 | 0.030 |
Silver | g/t | 0.61 | 0.66 |
Waste | Mt | 5,300.9 | 5,824.9 |
Total | Mt | 7,310.6 | 7,792.6 |
Strip Ratio | 2.64 | 2.96 |
The comparison showed very similar tonnes and grades. A follow-up volumetric check was also performed, within the ultimate 2012 PEA pit design (referred to as the Phase 5 pit), that also showed a very close volumetric match. Based on these comparisons, AGP concluded that the mining evaluation approach used in 2012 was still appropriate for the deposit, and that the pit phase designs developed in 2012 could be re-used for 2015 mine planning.
| 16.2.4 | Economic Pit Shell Development |
The 2012 PEA ultimate pit (Phase 5) was guided by an LG shell generated using $2.00/lb Cu, $13.50/lb Mo, $1,100/oz Au and $15.00/oz Ag. As a final confirmation check of this pit design, AGP re-ran the $2.00/lb Cu LG shell using the new resource model and the 2012 economic and technical parameters as listed below:
Table 16-6 shows the metallurgical recoveries used.
Table 16-6: Metallurgical Recoveries
Metal | Recovery (%) |
Copper | 92 |
Molybdenum | 50 |
Silver | 55 |
Gold | 50 |
A base operating cost of $1.09/t was developed for material above the 1570 level, the design entrance to the pit. The incremental haulage cost below the 1570 level was estimated to be $0.02/15 m bench of lift.
| | |
| 10/03/2017 |
Page 16 - 13
2017 Updated Preliminary Economic Assessment on the Ann Mason Project
Nevada, U.S.A.
The G&A costs used included salaried and hourly personnel associated with the overall administration of the operation, plus estimates for bussing of employees, environmental monitoring, recruitment, and training, and other overhead expenses.
Table 16-7 summarizes the operating costs used for the LG shell development.
Table 16-7: Economic Pit Shell Costs
Operating Cost | Unit | 100,000 t/d |
Base Mining | $/t | 1.09 |
Incremental | $/t | 0.02 |
Processing Cost | $/t feed | 5.82 |
G&A Cost | $/t feed | 0.30 |
Table 16-8 show the metal prices used. To these prices, smelter or roasting terms and transportation costs are applied to generate a net metal price. The smelter, refining and roasting terms used for the copper concentrate were based on the 2012 PEA and shown below:
| 1) | Transportation costs = $60/t (wet) for truck haulage to the port, |
| 2) | Port costs = $5/t (wet), |
| 3) | Ocean freight = $23/t (wet) |
| 4) | Smelting charge = $65/t (dry) |
| 5) | Refining charge = $0.065/lb. |
For the molybdenum concentrate, a truck haulage cost of $65/t was used. Note that the treatment charge (TC) and refining charge (RC) costs were increased to $80/dmt of concentrate and $0.08/lb of copper respectively in the financial analysis discussed in Section 22.
Table 16-8: Phase 5 LG Shell Replication Metal Prices
Input Parameter | Unit | Metal Prices |
Copper | $/lb | 2.00 |
Molybdenum | $/lb | 13.50 |
Silver | $/oz | 15.00 |
Gold | $/oz | 1,100.00 |
Net Price (after smelting/roasting and refining) | ||
Copper | $/lb | 1.60 |
Molybdenum | $/lb | 12.13 |
Silver | $/oz | 13.58 |
Gold | $/oz | 1,057.00 |
| | |
| 10/03/2017 |
Page 16 - 14
2017 Updated Preliminary Economic Assessment on the Ann Mason Project
Nevada, U.S.A.
The geotechnical parameters provided by BGC were used for the LG shell generation and pit phase design. Case B was used as design guidance as it represents average possible conditions. Two geotechnical zones were outlined: volcanics and intrusive. The volcanics have an inter-ramp angle of 52°, with a maximum height of 150 m, between 32 m wide geotechnical berms. The intrusive has an inter-ramp angle of 39°, with the same 150 m height, between 32 m wide geotechnical berms.
An examination of the Ann Mason deposit indicated that a maximum height of 320 m was possible in the volcanics, and that the intrusive may be mined to a depth of 800 m below the volcanics. These slope heights were used to determine geotechnical berm / ramp requirements and incorporated into flattened overall slope estimates for LG shell development. Overall slope angles of 48° for volcanics and 35.5° for intrusives were used.
The resulting LG shell matched well to the shape of the previously developed Phase 5 pit design, confirming its suitability for use in the 2015 mine plan. Phases 1 through 5 are described below.
| 16.2.5 | Pit Design and Phase Development |
Using nested LG shells as design guidance, a series of seven fully concentric phases were designed in 2012. These phases were sized based on targeting tonnage for several years of mill feed, and sufficient width to accommodate the large mining equipment envisaged. This meant a minimum pushback or phase width of 80 m, with normal widths of 130 m or more.
The detailed pit designs were based on Case B of BGC's slope recommendations. The inter-ramp angles were 52° in the volcanics and 39° in the intrusive. To achieve these angles, the volcanics were double benched, while the intrusive was single benched, with both using an 11 m berm width. Every 150 m vertically, an extra width geotechnical berm of 32 m was required in the overall design.
Haul road design criteria was based on the use of 360-tonne trucks. This size of truck requires a ramp width of 38 m to allow double lane traffic. Double lane traffic in this case refers to three times the operating width of the trucks, plus room for berms and ditches. Ramp grades would be 10% for uphill loaded configurations, and 8% for downhill loaded (mining of the volcanics).
The seven designed pit phases are shown in Figure 16‑3 through Figure 16‑9.
| | |
| 10/03/2017 |
Page 16 - 15
2017 Updated Preliminary Economic Assessment on the Ann Mason Project
Nevada, U.S.A.
Phase 1
Phase 1 development utilizes the existing dry gulches as access to the higher portions of the pit phase. These drainages are at 8% or less, making them ideal for mining access roads. The intent of Phase 1 is to initiate the mining and establish a small amount of feed for plant start-up (approximately 1.3 years of mill feed at 120,000 t/d). Access to the upper benches is maintained in the pit slope to ease development of Phase 2.
Figure 16‑3: Plan View Image of Phase 1

| | |
| 10/03/2017 |
Page 16 - 16
2017 Updated Preliminary Economic Assessment on the Ann Mason Project
Nevada, U.S.A.
Phase 2
Phase 2 advances the mining to the north, utilizing the access left from mining Phase 1. The overall pit is deepened to provide approximately 2.4 years of feed material to the mill at a 2.23:1 strip ratio. The strip ratio drops slightly relative to Phase 1, as a larger block of mill feed is exposed, and less pre-stripping is required.
Figure 16‑4: Plan View Image of Phase 2
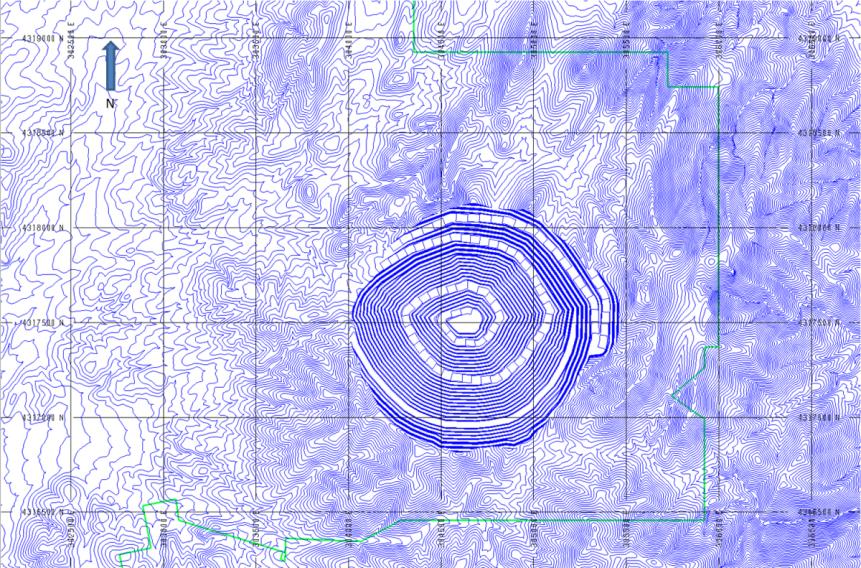
| | |
| 10/03/2017 |
Page 16 - 17
2017 Updated Preliminary Economic Assessment on the Ann Mason Project
Nevada, U.S.A.
Phase 3
Phase 3 continues the expansion of the pit in the northern direction with further deepening. The highest point of the property is reached with this phase. As is the case in the previous two phases, the entry point for the pit is at the 1665 level. This phase contains approximately four years of mill feed at a strip ratio of 1.85:1.
Figure 16‑5: Plan View Image of Phase 3

| | |
| 10/03/2017 |
Page 16 - 18
2017 Updated Preliminary Economic Assessment on the Ann Mason Project
Nevada, U.S.A.
Phase 4
Phase 4 predominantly develops to the northwest. The entry point for this phase is at the 1605 level, slightly lower than the previous phases as a result of the pit expanding westward down the valley. Phase 4 contains approximately seven years of feed material at a strip ratio at 1.71:1.
Figure 16‑6: Plan View Image of Phase 4

| | |
| 10/03/2017 |
Page 16 - 19
2017 Updated Preliminary Economic Assessment on the Ann Mason Project
Nevada, U.S.A.
Phase 5
Phase 5 again mines deeper and further to the northwest. The 1605 level is used to enter the pit area. Mining at the height of land is lower than in the previous phases, as the intersection of the pit and topography has passed the mountain crest. Phase 5 contains approximately six years of mill feed at a strip ratio of 1.92:1. The LG shell used to guide this phase design was generated with a copper price of $2.00/lb. Phase 5 represents the ultimate pit for the 2012 original, 2015 updated PEA mine plan, as well as the 2017 PEA.
Figure 16‑7: Plan View Image of Phase 5
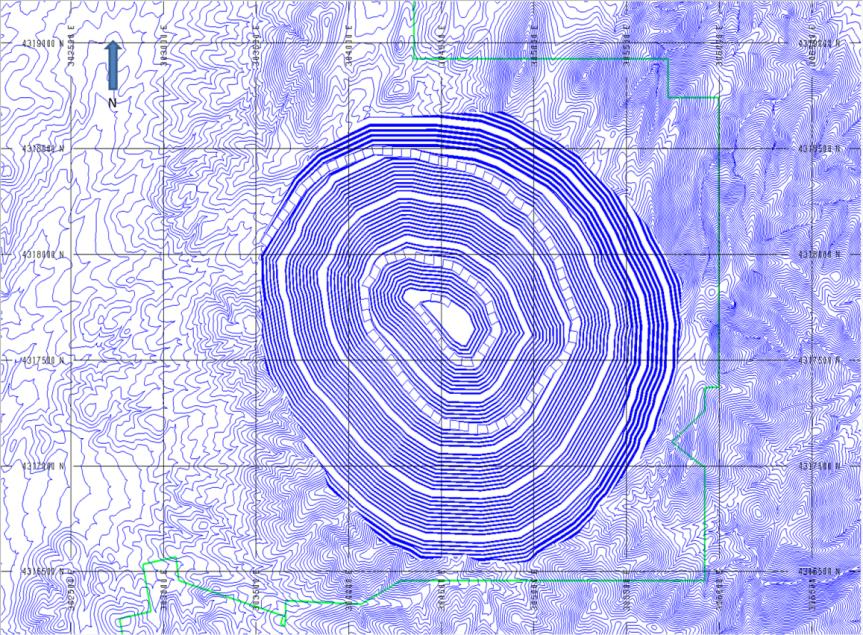
| | |
| 10/03/2017 |
Page 16 - 20
2017 Updated Preliminary Economic Assessment on the Ann Mason Project
Nevada, U.S.A.
Phase 6
Phase 6 is a concentric expansion of the existing pit. No predominant direction is developed, but the overall depth of the pit is increased. The phase contains approximately 7.5 years of potential mill feed material at a 2.10:1 strip ratio. Significant pre-stripping is required before feed from this phase is available for the mill. With the selected long-range metal prices and economic parameters, mining schedules incorporating this phase had positive cash flow but did not improve project NPV (7.5%). For this reason, this phase and Phase 7 discussed below, were not included in the 2017 PEA mine plan. Phases 6 & 7 represent upside potential for the deposit.
Figure 16‑8: Plan View Image of Phase 6
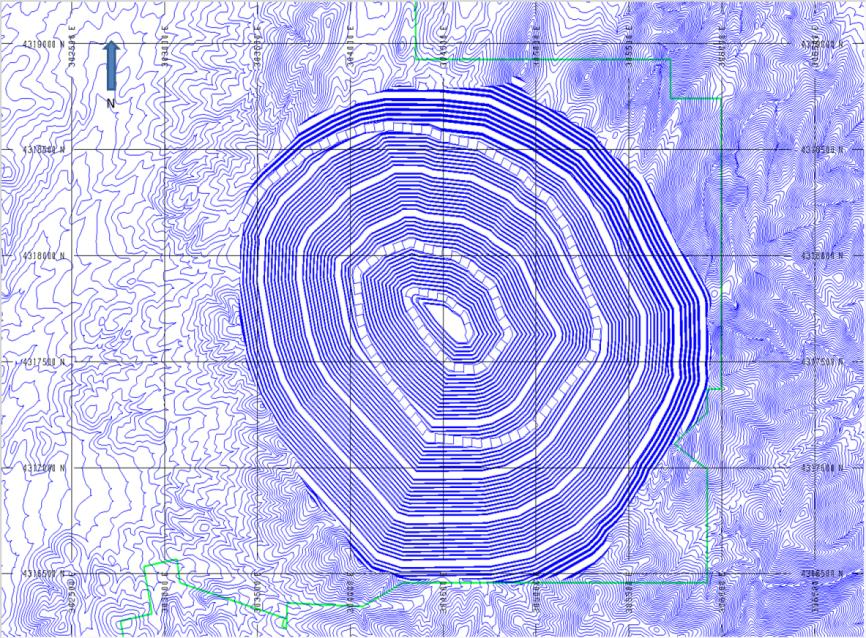
| | |
| 10/03/2017 |
Page 16 - 21
2017 Updated Preliminary Economic Assessment on the Ann Mason Project
Nevada, U.S.A.
Phase 7
Phase 7 is the final phase designed for this property. It is constrained by the property boundary (shown in green in Figure 16-9 below) on three sides (north, east, and south). The pre-dominate direction for development in this phase is to the west. Access is still maintained at the 1605 level as in Phase 6. The phase contains approximately 7.5 years of potential mill feed at a strip ratio of 2.92:1. The LG shell used to guide this phase design is equivalent to a pit shell with a copper price of $2.50/lb. As mentioned in the Phase 6 discussion above, this phase design was not included in the 2017 PEA mine plan, but represents upside potential for the deposit.
Figure 16‑9: Plan View Image of Phase 7
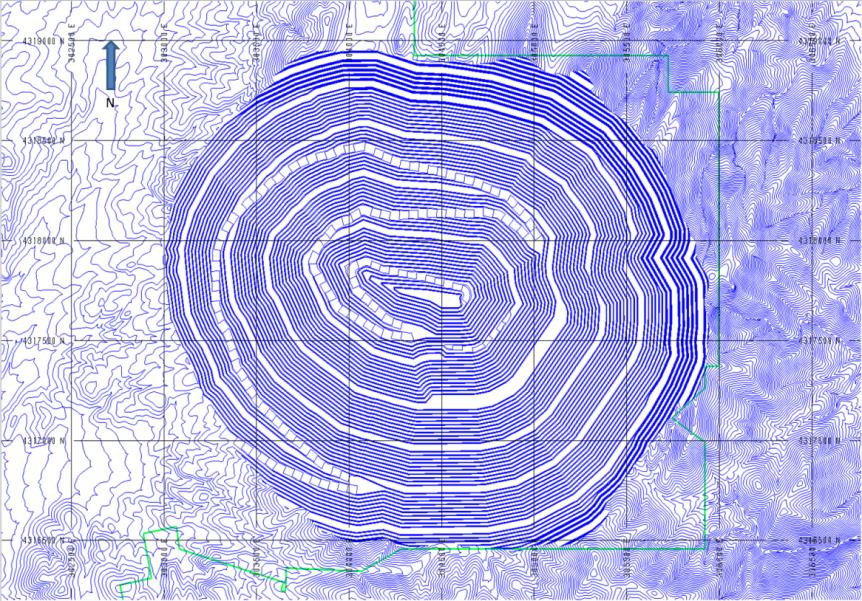
An east-west cross-section at Northing 4,317,720 is shown in Figure 16‑10 with the copper grades greater than 0.1%. Each of the phases is shown in this section. Phase 1 contains mill feed, even though this particular section does not show any. This section intersects the Phase 7 pit at its deepest point. The phase shapes highlight the deepening of the pit, initially followed by the westward expansion to target the higher-grade portions of the deposit.
| | |
| 10/03/2017 |
Page 16 - 22
2017 Updated Preliminary Economic Assessment on the Ann Mason Project
Nevada, U.S.A.
Figure 16‑10: East-West Section at Northing 4,317,720
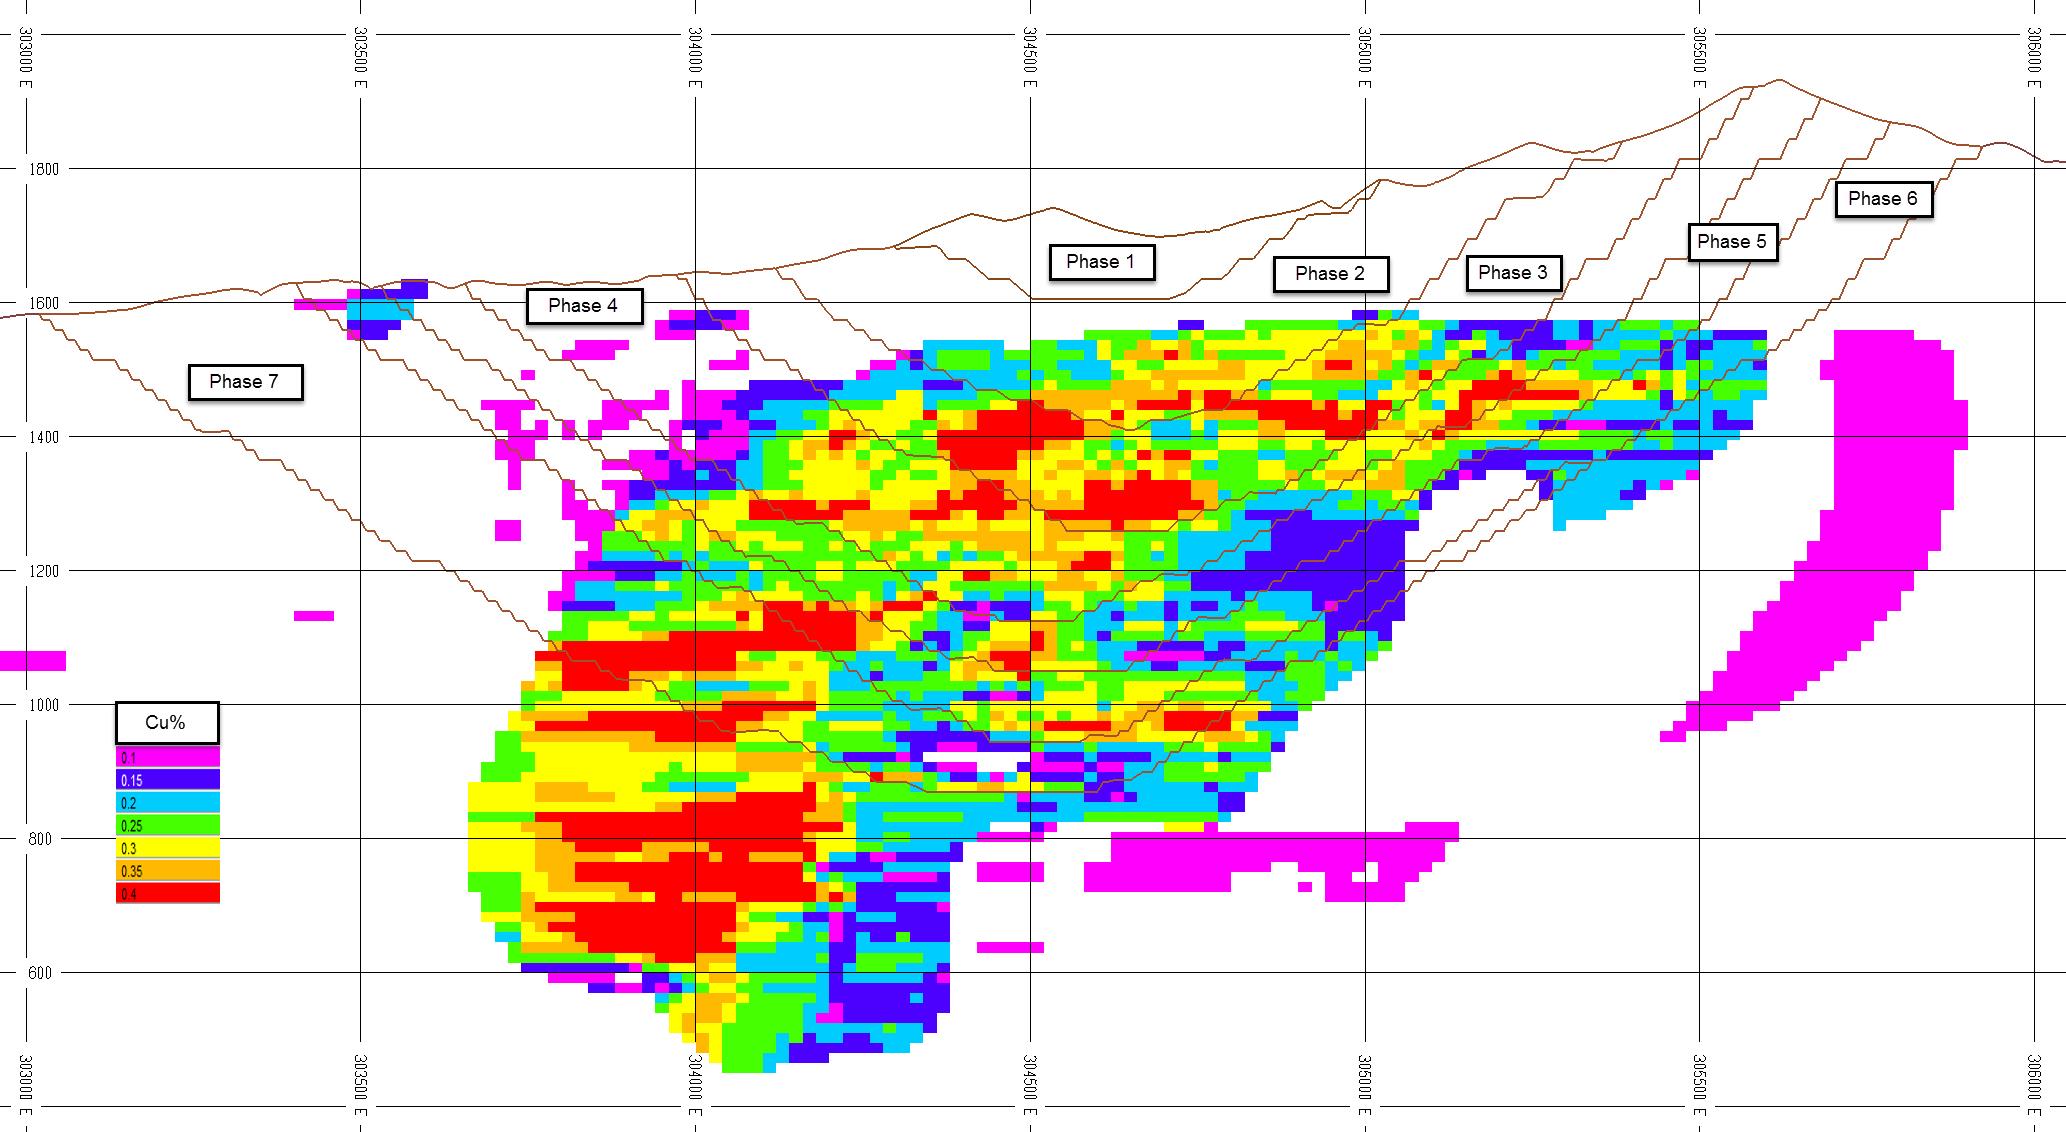
| | |
| 10/03/2017 |
Page 16 - 23
2017 Updated Preliminary Economic Assessment on the Ann Mason Project
Nevada, U.S.A.
| 16.2.6 | Production Rate Evaluation |
Using the pit phase designs described above, mine schedules were created for rates of 100,000 t/d and 120,000 t/d. For each of the production rates, operating costs were determined and capital cost estimates were estimated for the mine, mill, and infrastructure.
For the NPV calculation, the metal prices shown in Table 16-9 were used as a basis of comparison.
Table 16-9: Production Rate Trade-off – Metal Prices
Input Parameter | Unit | Production Rate Prices |
Copper | $/lb | 3.00 |
Molybdenum | $/lb | 11.00 |
Silver | $/oz | 20.00 |
Gold | $/oz | 1,200.00 |
Mine capital expenditures include a standard support fleet using track dozers, graders, welding trucks, and other. The number of units was estimated annually for proper capital costing purposes.
Each of the cash flows was compared using a 7.5% discount rate. Table 16-10 shows the results of this analysis. The net present value increased as the production rate increased, as expected with bringing revenue forward. The 120,000 t/d case showed a higher NPV due to the increased copper and reduced stockpile rehandle costs.
Table 16-10: Production Rate Trade-off Comparison (7.5% Discount Rate)
Production Option | Post – Tax NPV ($M) | IRR (%) | Mine Life (years) | Initial Capital ($M) | Total Capital ($M) |
100,000 t/d – Phase 1-5 | 655 | 12.6 | 24 | 1,288 | 1,485 |
120,000 t/d – Phase 1-5 | 770 | 13.7 | 21 | 1,351 | 1,542 |
From the 2012 PEA analysis, the higher strip ratio Phases 6 and 7 demonstrated they did not improve the initial 100,000 t/d case NPV due to the advanced stripping required. They were not included for the 2012 PEA or the 2015 PEA. Based on this, the 120,000 t/d Phases 1 to 5 case was chosen to advance forward in this study.
| 16.2.7 | 2017 PEA Mine Schedule |
The 2017 PEA mining schedule was developed using the existing Phase 1 through 5 mining shapes described above, and the new resource model. High-grade mill feed, low-grade mill feed and waste were delineated using two cut-offs:
| | |
| 10/03/2017 |
Page 16 - 24
2017 Updated Preliminary Economic Assessment on the Ann Mason Project
Nevada, U.S.A.
| · | low grade – a value per tonne cut-off (approximately 0.145% Cu) |
| · | high grade – 0.20% Cu cut-off. |
The value per tonne block estimate was used to define the lower end cut-off, as a simple copper only cut-off would not capture the economic contribution from molybdenum, silver, and gold. The above stated copper cut-off of 0.145% Cu is an approximation of what a straight copper cut-off would be. This lowest cut-off is a breakeven milling (or internal) cut-off considers includes all site costs except for the mining operating cost. The milling cut-off is based on the premise that once the pit is defined, and you are effectively committed to mining all the contained material, the material routed to the mill need only cover the process and G&A costs. Table 16-11 shows the parameters used to calculate the value per tonne for each block.
Table 16-11: Value per Tonne Calculation Parameters
Input Parameter | Unit | Engineering Design Price |
Metal Price | ||
Copper | $/lb | 2.50 |
Molybdenum | $/lb | 13.50 |
Silver | $/oz | 15.00 |
Gold | $/oz | 1,100.00 |
Net Price (after smelting/roasting) | ||
Copper | $/lb | 2.07 |
Molybdenum | $/lb | 12.13 |
Silver | $/oz | 13.58 |
Gold | $/oz | 1,057.00 |
Recoveries | ||
Copper | % | 92 |
Molybdenum | % | 50 |
Silver | % | 55 |
Gold | % | 50 |
Process Cost | $/t mill feed | 5.82 |
G&A Cost | $/t mill feed | 0.30 |
The net metal prices were determined by subtracting off site costs, converted to the appropriate costs per unit of sellable metal. These include smelting, refining, and roasting terms (Table 19-1) and the cost of transportation of the concentrates to its final destination. The copper concentrate has haulage to port costs of $60 /t, port costs of $5/t and ocean freight of $23/t. The molybdenum concentrate has a cost of $65/t for haulage applied.
Using the lower cut-off and the new resource model, the volumetrics within the five pit phases are shown in Table 16-12.
| | |
| 10/03/2017 |
Page 16 - 25
2017 Updated Preliminary Economic Assessment on the Ann Mason Project
Nevada, U.S.A.
The values for mill feed have been shown as in situ grades, but are considered to be sufficiently diluted. The model block size is 20 m (E) x 20 m (N) x 15 m (elevation), which is larger than the anticipated selective mining unit for the equipment considered for mining. Contact dilution in the porphyry is expected to be minimal, due to the gradational nature of the contact between mill feed and waste. As such, no further dilution or mining loss adjustments were made.
The 120,000 t/d schedule assumes annual production requirements of 43.2 Mt of mill feed. The initial year of plant production is assumed to be only 32.4 Mt, due to production start-up and commissioning. All other years are scheduled at full plant capacity.
Five of the seven designed phases are mined for the final schedule, resulting in a mine life of 21 years. As the bottom of Phase 5 is being mined, full production to the plant cannot be maintained. Therefore, starting in Year 20, reclaim of stockpiled low-grade material is required to maintain the plant at full capacity. In Year 20, a total of 4.4 Mt stockpile is reclaimed. The final year of processing, Year 21 is completed with only Phase 5 material; the plant will run for just over six months.
Three years of pre-strip are required prior to plant commissioning. Phases 1 and 2 start in Year -3, followed by Phase 3 in Year -2. This early start is required to ensure sufficient feed material is available for the mill. The waste rock will be used as construction material for the two tailings dams near the open pit and for haul roads around the site.
| | |
| 10/03/2017 |
Table 16-12: Mill feed Tonnes and Grade by Phase and Category
Phase | Mill Feed (Mt) | Cu (%) | Mo (%) | Au (g/t) | Ag (g/t) | Mill Feed (Mt) | Cu (%) | Mo (%) | Au (g/t) | Ag (g/t) | Mill Feed (Mt) | Cu (%) | Mo (%) | Au (g/t) | Ag (g/t) | Mill Feed (Mt) | Cu (%) | Mo (%) | Au (g/t) | Ag (g/t) | Waste (Mt) | Strip Ratio |
Measured | Indicated | Measured + Indicated | Inferred | |||||||||||||||||||
1 | 53.5 | 0.29 | 0.004 | 0.01 | 0.35 | 2.7 | 0.21 | 0.002 | 0.01 | 0.27 | 56.2 | 0.29 | 0.004 | 0.01 | 0.35 | 0.1 | 0.17 | - | - | 0.01 | 141.8 | 2.52 |
2 | 76.7 | 0.31 | 0.006 | 0.20 | 0.50 | 25.1 | 0.27 | 0.003 | 0.02 | 0.33 | 101.7 | 0.30 | 0.006 | 0.02 | 0.46 | 2.7 | 0.21 | 0.002 | 0.01 | 0.14 | 233.3 | 2.23 |
3 | 71.9 | 0.34 | 0.005 | 0.03 | 0.68 | 93.6 | 0.32 | 0.003 | 0.03 | 0.62 | 165.5 | 0.33 | 0.004 | 0.03 | 0.64 | 12.1 | 0.27 | 0.004 | 0.02 | 0.45 | 328.5 | 1.85 |
4 | 121.9 | 0.31 | 0.005 | 0.02 | 0.56 | 168.1 | 0.29 | 0.004 | 0.03 | 0.59 | 290.0 | 0.30 | 0.004 | 0.03 | 0.58 | 10.5 | 0.25 | 0.005 | 0.03 | 0.62 | 513.0 | 1.71 |
5 | 63.7 | 0.29 | 0.007 | 0.03 | 0.68 | 177.8 | 0.26 | 0.005 | 0.03 | 0.66 | 241.5 | 0.27 | 0.006 | 0.03 | 0.67 | 25.0 | 0.25 | 0.006 | 0.03 | 0.61 | 520.8 | 1.95 |
Total | 387.6 | 0.31 | 0.005 | 0.02 | 0.56 | 467.3 | 0.28 | 0.004 | 0.03 | 0.61 | 854.9 | 0.29 | 0.005 | 0.03 | 0.59 | 50.4 | 0.25 | 0.005 | 0.03 | 0.55 | 1,737.4 | 1.92 |
43.9% | 51.3% | 95.1% | 4.9% | |||||||||||||||||||
| | |
| 10/03/2017 |
Page 16 - 27
2017 Updated Preliminary Economic Assessment on the Ann Mason Project
Nevada, U.S.A.
Mined material is maintained at its highest level in Years 1 to Year 7. During this period, total material moved averages 163 Mt/a. This is primarily due to the overlying volcanics above the deposit. Total material moved then drops to an average level of 130 Mt/a for Years 8 to 13. After Year 13, the stripping requirements drop off until Year 21, at which time no further waste is mined and the bottom of the pit is above cut-off material. Plant feed tonnages are shown in Figure 16‑11, and plant feed grades in Figure 16‑12. Figure 16‑13 illustrates the waste tonnage movement rate on an annual basis by phase.
Figure 16‑11: Plant Feed Tonnages by Year
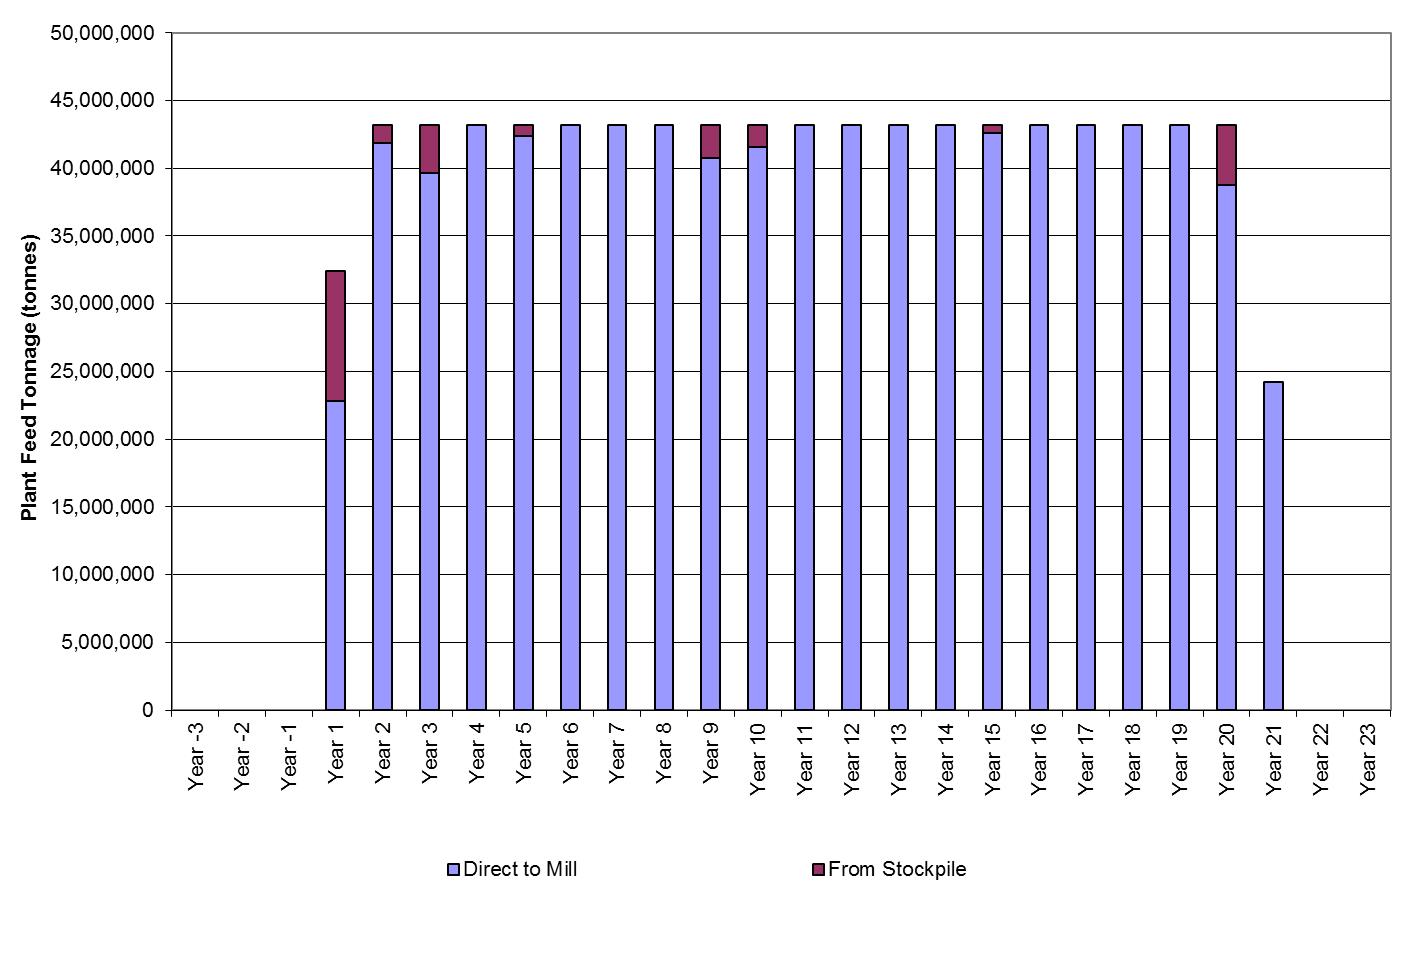
| | |
| 10/03/2017 |
Page 16 - 28
2017 Updated Preliminary Economic Assessment on the Ann Mason Project
Nevada, U.S.A.
Figure 16‑12: Plant Feed Grades LOM
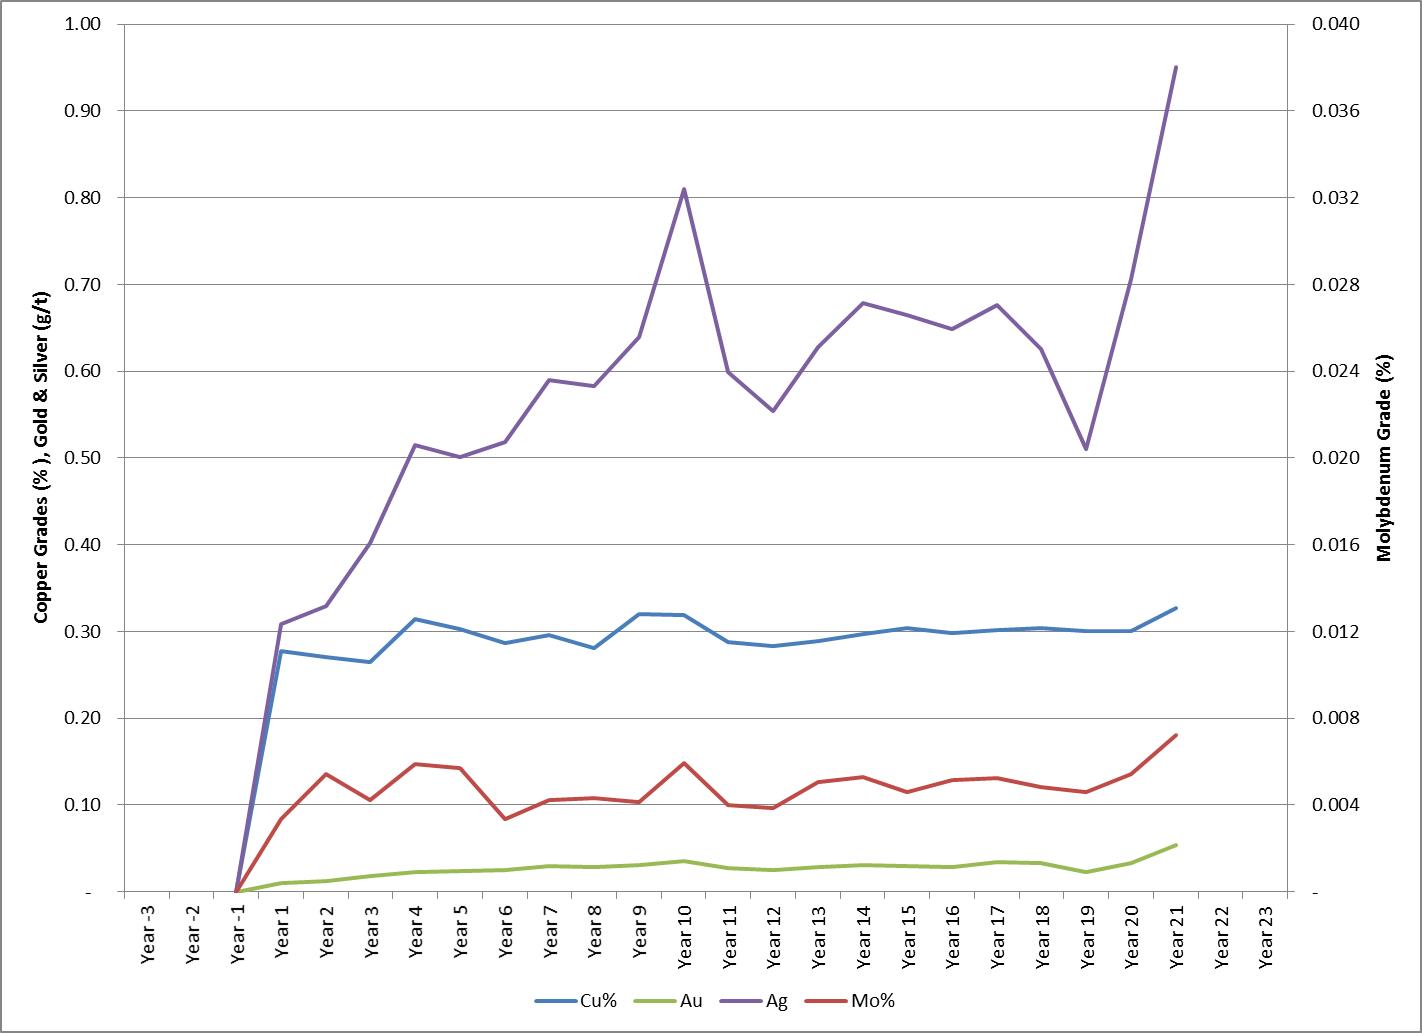
Figure 16‑13: Waste Tonnage Movement by Phase

| | |
| 10/03/2017 |
Page 16 - 29
2017 Updated Preliminary Economic Assessment on the Ann Mason Project
Nevada, U.S.A.
| 16.2.8 | Waste Rock Management Facility Design |
For the purposes of this study, waste material from the Ann Mason deposit has been assumed to be non-acid generating. A brief review of the sulphur and neutralizing mineral content was completed in 2012 by Lawrence Consulting Ltd. It concluded:
Residual sulphide concentrations in waste rock, exposed pit walls and tailings will therefore also be correspondingly low or very low. Calcite and other acid-neutralizing minerals, however, are also in low abundance and it is expected that some rock in waste piles, pit walls and other mine components, as well as some of the tailings, will be classified as potentially acid generating (PAG). However, the net potential for acid generation, if it exists, will be low and should be mitigated to a large degree by the climatic conditions at the site. The project area is arid, with evaporation exceeding precipitation for a large part of the year. Under these conditions, there will likely be insufficient water to provide significant transport of any soluble products of reaction through or away from waste rock piles or other mine components.
In summary, the overall effects of ARD in waste piles and the tailings facility are likely to be small and readily controllable. However, detailed characterization of all geological materials to be disturbed during mining operations is required to allow the development of mining and waste management plans that will mitigate risks of any environmental impact.
A staged waste rock characterization program will be required to support the next stage of study.
Waste rock is scheduled to be hauled to the waste rock management facility (WRMF) to the southwest of the open pit for storage. The initial platform elevation is designed at the 1605 level. The concept is to expand waste material to the southwest and also connect to the proposed south tailings dam of the TMF at the same level. In this manner, waste rock from the mine may be utilized for construction in the two southern dams minimizing quarried material. The rock will still require crushing and screening for placement in filters, but the incremental cost of the haul is estimated to be less expensive than quarrying separate material. With a large component of the waste rock scheduled in the early years, being volcanics above the Singatse fault, this material should provide suitable rock for dam construction.
The 1605 level of the WRMF is developed until Year 6. The facility will then start to increase in height after Year 6, reaching a maximum level of 1680.
| | |
| 10/03/2017 |
Page 16 - 30
2017 Updated Preliminary Economic Assessment on the Ann Mason Project
Nevada, U.S.A.
The haulage profiles for the waste rock from the upper levels of Ann Mason have been scheduled as downhill hauls, with reduced travel speeds. The remaining hauls are flat from the pit entrance, with a later uphill component.
Waste volumes for the facility are determined using a 30% swell factor. The SG of the material is used to determine the bank volume, and then the swell factor applied to obtain the loose volume required for storage in the WRMF.
The location of the TMF relative to the open pit is illustrated in Figure 16‑14. The two southern dams will benefit from the proximity of the mine for their waste rock requirements. The dam near the plant site will be constructed entirely of rock fill from the mine, while the southern dam will be a mixture of waste rock and cyclone tailings.
The northern dam will require a quarry for its construction. That dam will be constructed entirely of rock fill. Due to the distance from the plant, this was assumed to be the method of construction. Later stages of study for the Ann Mason Project will need to consider if that estimate is the most cost effective for the overall project. The smaller dams on the east side of the TMF are constructed entirely from rock fill.
All waste rock in the WRMF will be concurrently re-sloped and reclaimed. The vertical spacing of the lifts (30 m) allows for efficient re-sloping.
AGP notes that the southwest portion of the WRMF is adjacent to ground covered by a group of unpatented claims held by Bronco Creek Exploration, Inc., shown in Figure 16‑15. Entrée has entered an option agreement in which they may acquire an 80% interest in the property by: (a) incurring expenditures of $1,000,000, making cash payments of $140,000, and issuing 85,000 shares of the Company within three years (completed); (b) making aggregate advance royalty payments totalling $375,000 between the fifth and tenth anniversaries; and (c) delivering a bankable feasibility study before the tenth anniversary of the agreement. The agreement is currently in good standing.
The location of the WRMF has been adjusted in the event Entrée does not exercise its option or the joint venture management committee does not agree to the use of that portion of the joint venture grounds for the WRMF.
| | |
| 10/03/2017 |
Page 16 - 31
2017 Updated Preliminary Economic Assessment on the Ann Mason Project
Nevada, U.S.A.
Figure 16‑14: Waste Rock Management Facility Access

| | |
| 10/03/2017 |
Page 16 - 32
2017 Updated Preliminary Economic Assessment on the Ann Mason Project
Nevada, U.S.A.
Figure 16‑15: Waste Rock Management Facility in Overall Site Layout
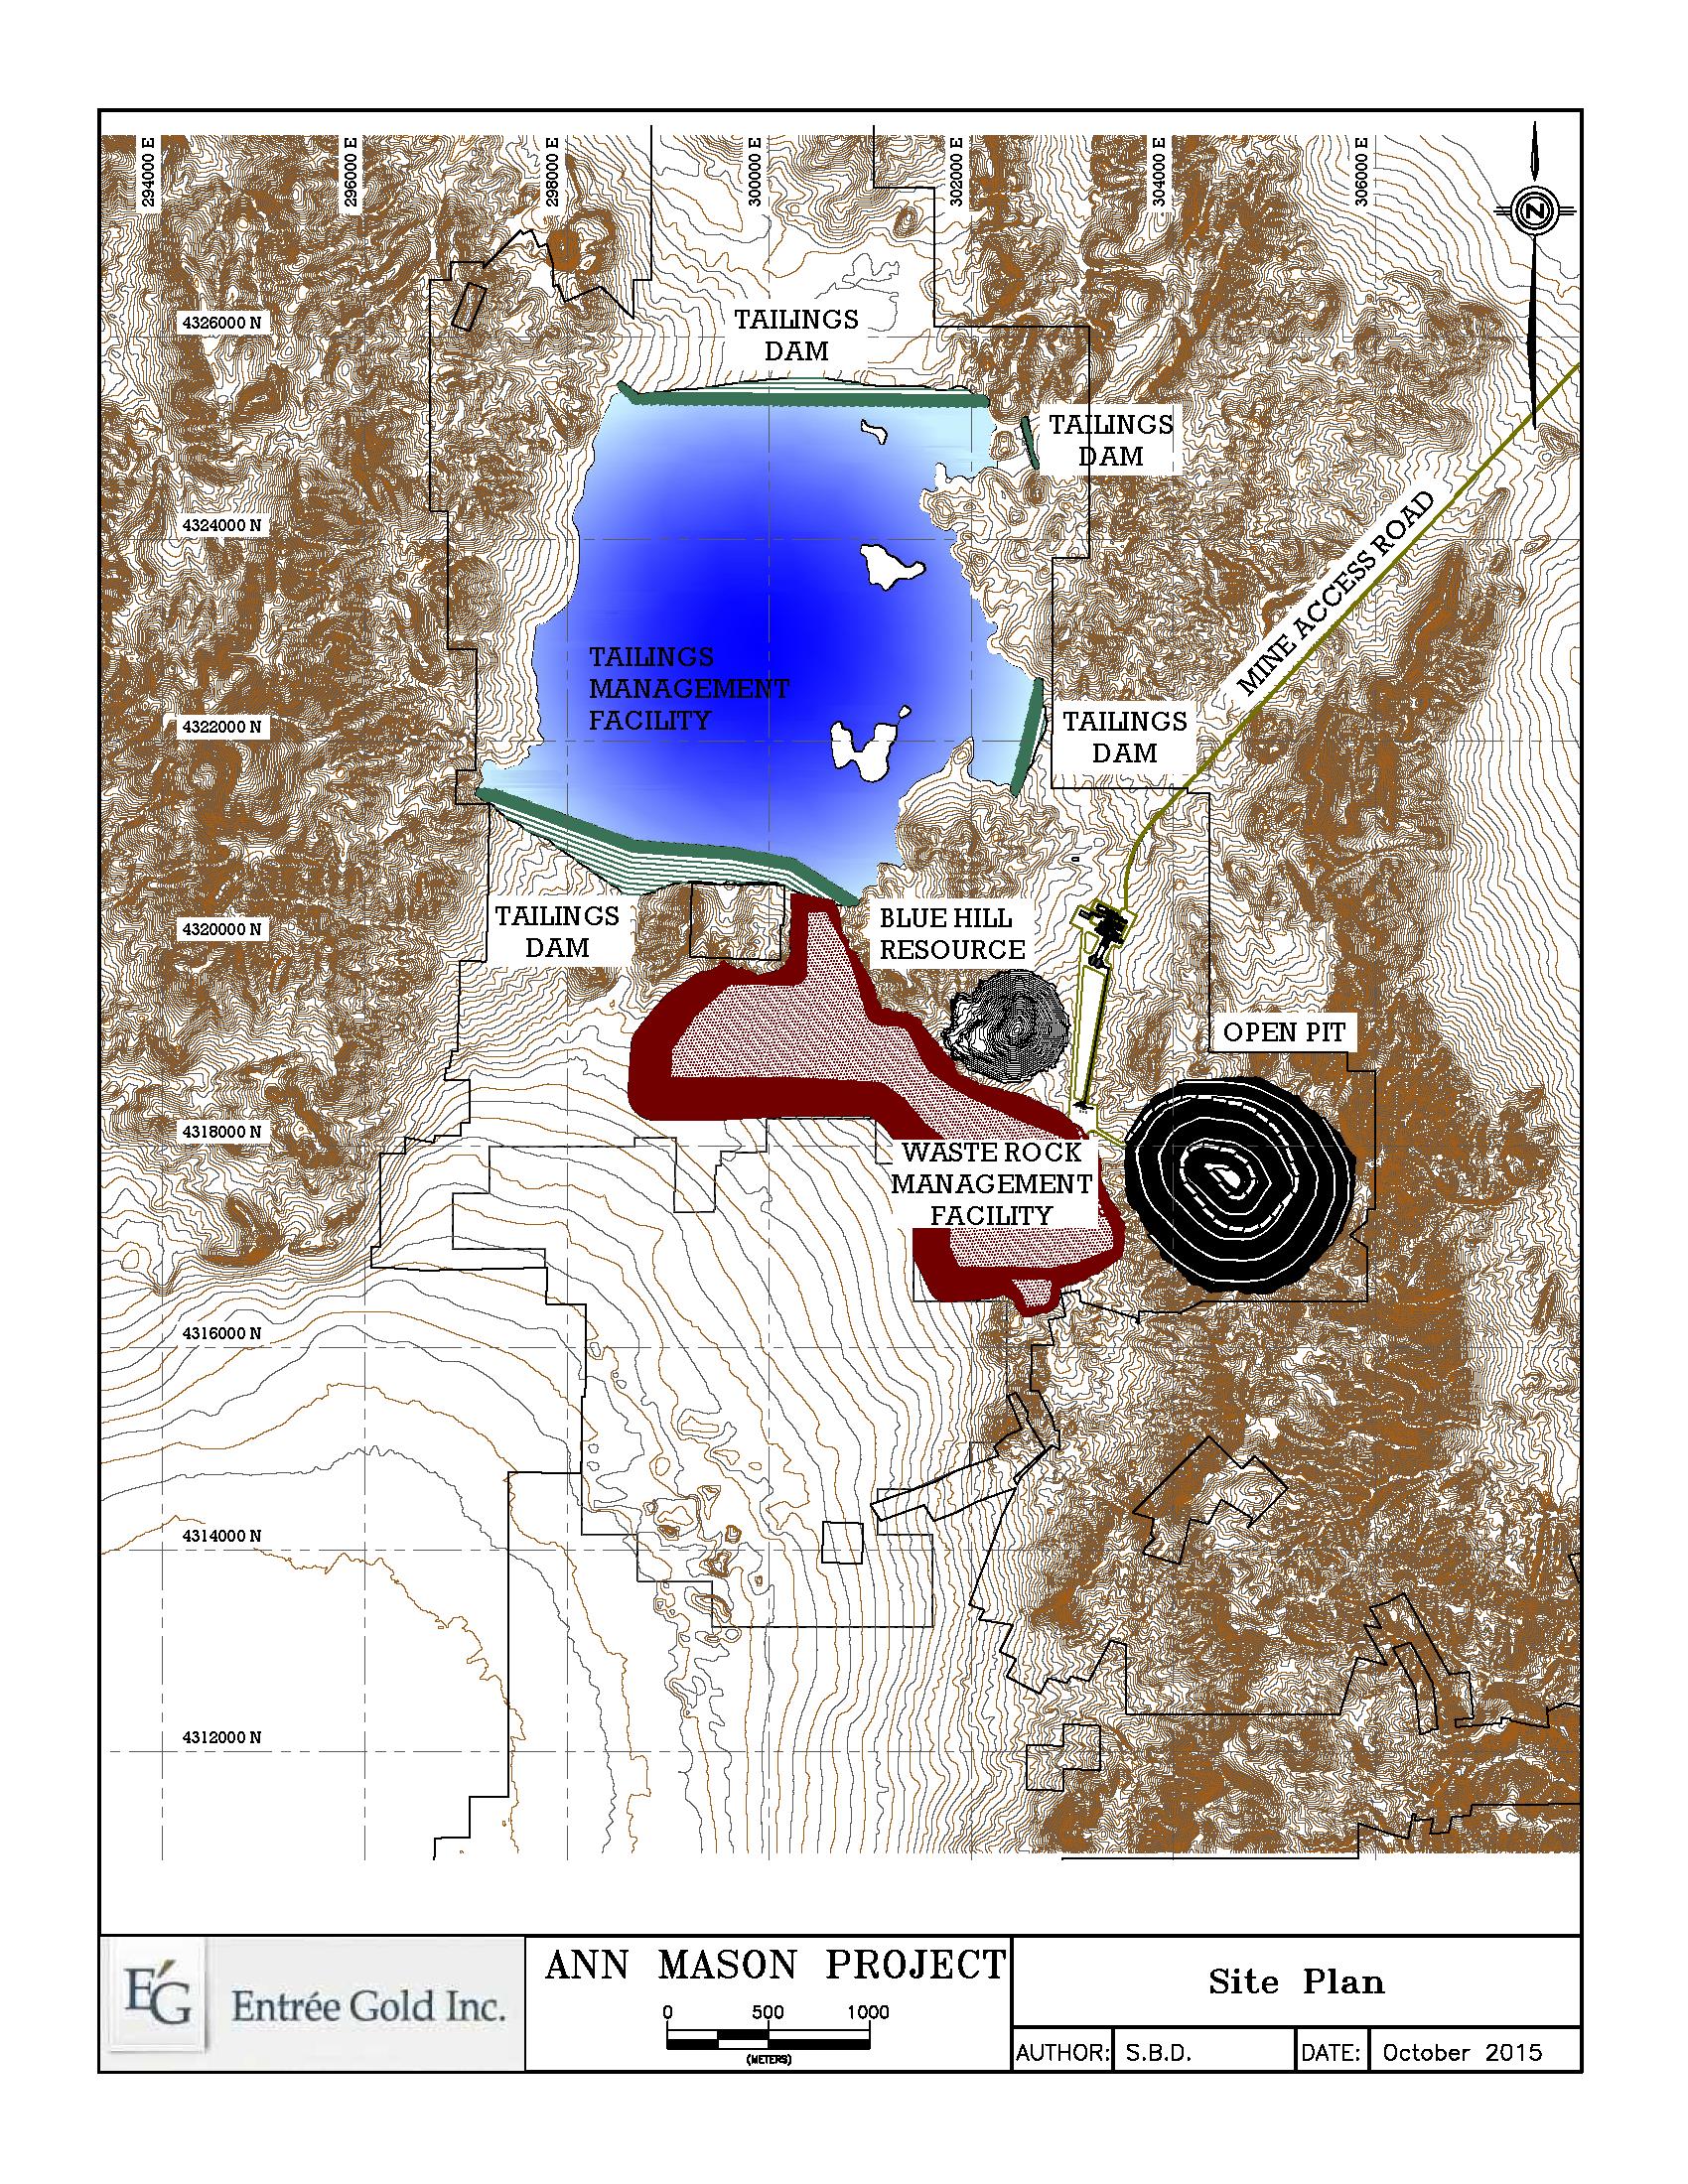
| | |
| 10/03/2017 |
Page 16 - 33
2017 Updated Preliminary Economic Assessment on the Ann Mason Project
Nevada, U.S.A.
| 17 | Recovery Methods |
| 17.1 | Introduction |
The proposed method of copper and molybdenum recovery from the Ann Mason deposit consists of conventional crushing and milling, followed by rougher and cleaner froth flotation. A copper-molybdenum separation step generates final product copper and molybdenum concentrate products. This section describes the flowsheet, design criteria, and process description for a 100,000 t/d processing plant. Note that the process plant capital cost presented in section 21 is based on this throughput, and then scaled to the 120,000 t/d case used in the economic model.
| 17.2 | Process Flowsheet |
From the testwork conducted, a flowsheet was developed consisting of primary crushing, SAG and ball mill grinding, froth flotation, concentrate dewatering, and tailings thickening. A schematic of the proposed flowsheet is presented in Figure 17-1.
| | |
| 10/03/2017 |
Page 17 - 1
2017 Updated Preliminary Economic Assessment on the Ann Mason Project
Nevada, U.S.A.
Figure 17-1: Flowsheet for the Ann Mason Processing Plant
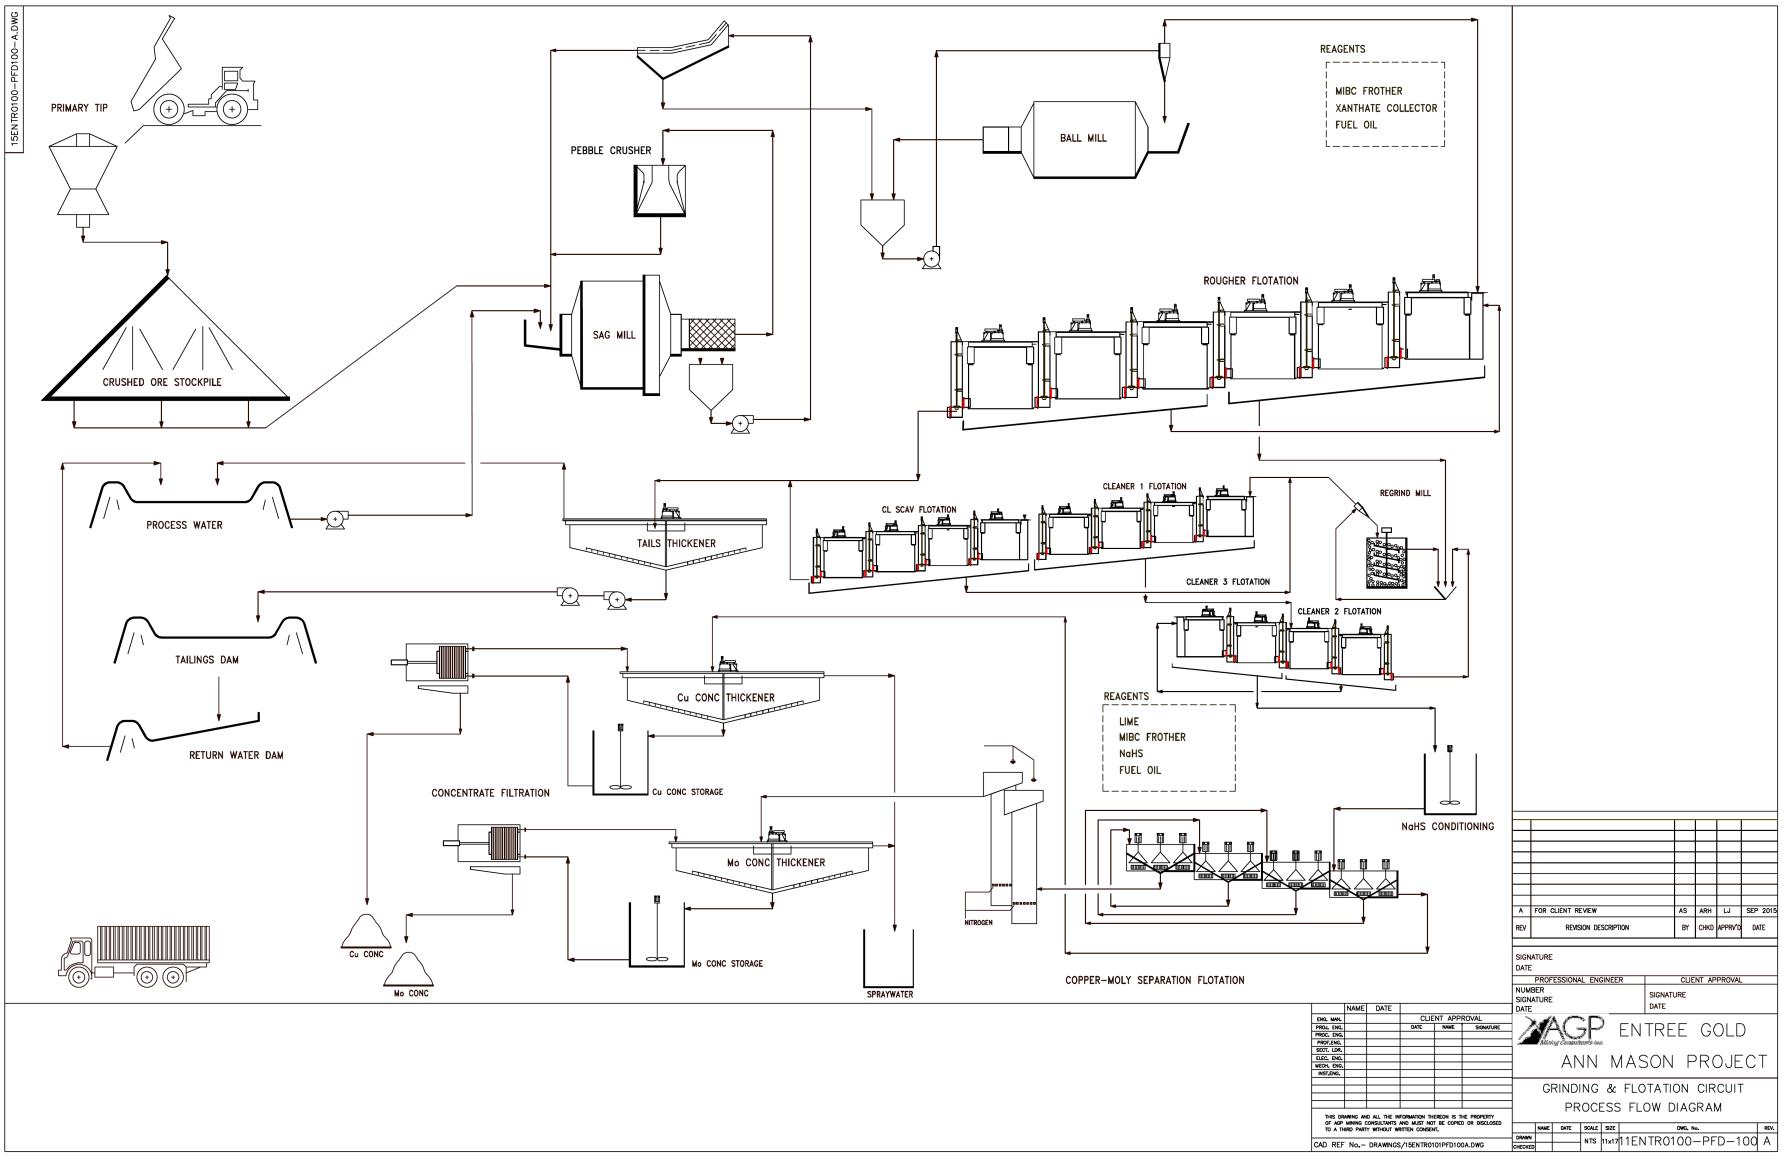
| | |
| 10/03/2017 |
Page 17 - 2
2017 Updated Preliminary Economic Assessment on the Ann Mason Project
Nevada, U.S.A.
| 17.3 | Design Criteria |
Based on the available testwork, a set of preliminary plant design criteria was developed which provides all the specific unit operation process detail required for the equipment sizing and selection. A summary of some of the key criteria is presented in Table 17-1.
Table 17-1: Summary of Process Design Criteria
Parameter | Unit | Design Data |
Copper Head Grade | % | 0.2925 |
Molybdenum Head Grade | % | 0.005 |
Sulphur Head Grade | % | 1.0 |
Plant Throughput | t/d | 100,000 |
Crushing Circuit Availability | % | 86.0 |
Grind/Float Circuit Availability | % | 92.0 |
SAG Mill Feed Size, F100 | mm | 20 |
SAG Mill Transfer Size, T100 | mm | 1. |
Primary Grind size, P80 | µm | 155 |
Rougher/Scavenger Float Time | min | 45 |
Regrind Size, P80 | µm | 25 |
1st Cleaner Flotation Time | min | 18 |
2nd Cleaner Flotation Time | min | 12 |
3rd Cleaner Flotation Time | min | 9 |
Cu-Mo Separation Rougher Float Time | min | 10 |
Number of Mo Cleaner Stages | no. | 5 |
Cu Recovery to Cu Flotation Concentrate | % | 92.0 |
Cu Grade of Cu Flotation Concentrate | % | 30.0 |
Mo Recovery to Mo Flotation Concentrate | % | 50.0 |
Mo Grade of Mo Flotation Concentrate | % | 50.0 |
Process Plant Fresh Water Consumption | m3/t | 0.53 |
Process Plant Power Consumption | kW/t | 23.1 |
| 17.4 | Process Description |
This section describes the parameters used to design a new copper/molybdenum concentrator for the Ann Mason Project near Yerington, Nevada, for the base-case operating scenario of 100,000 t/d.
| 17.4.1 | Process Summary |
The Ann Mason concentrator is designed as a nominal 3,000,000 tonne per month plant. Mine haul trucks will tip into twin primary gyratory crusher stations that are designed for 86% availability. Surge capacity between the mill and crusher stations is handled by two ~40,000 tonne stockpiles.
| | |
| 10/03/2017 |
Page 17 - 3
2017 Updated Preliminary Economic Assessment on the Ann Mason Project
Nevada, U.S.A.
Material is drawn off the stockpiles using apron feeders. SAG mill feed control would consist of variable speed feeders plus mill feed size distribution measurement. The SAG mill discharge classification is achieved as follows:
| · | Trommel screen (40 mm) directs oversize to a series of recycle conveyors and allows undersize to gravitate to the SAG mill discharge sump. |
| · | Trommel screen undersize material is further classified by a vibrating, multi-angle scalping screen which cuts at 1.5 mm, oversize recycling back to the SAG mill, undersize feeding forward to the ball mill circuit. |
Scalping screen undersize flows by gravity to the ball milling circuit. The ball mill operates in closed circuit with cyclones. The cyclone pack cuts at a P80 of ~155 µm, providing the required liberation for good flotation.
The cyclone overflow reports to the feed box of the rougher flotation circuit. The rougher/scavenger flotation plant consists of nine tank cells in series. Each cell would have independent air flow control.
Rougher flotation concentrate is reground in a ball mill to an 80% passing size of 45 µm. The ball mill operates in closed circuit with a cyclone cluster. Cyclone overflow reports to the 1st Cleaner feed box.
The 1st Cleaner/Scavenger circuit consists of eight tank cells in series. 1st Cleaner Scavenger tailings are fed by gravity into the rougher scavenger concentrate pump box. The 2nd and 3rd Cleaner circuits consist of five and four tank cells in series, respectively.
The third cleaner concentrate is pumped to the conditioning tank in the copper-molybdenum separation circuit. The molybdenum roughers consist of six tank cells in series. The molybdenum rougher concentrate proceeds through five stages of cleaning, with the last two stages in column cells. The tailings are fed counter-currently to the feed box of the previous stage.
Molybdenum concentrate product from the fifth cleaner stage of separation circuit, and copper concentrate (molybdenum rougher tailings) are thickened and press filtered. The copper concentrate is loaded onto trucks and/or stockpiled, while the molybdenum concentrate is rotary dried and loaded into drums.
Flotation tailings from the rougher-scavenger circuit are thickened and pumped to the TMF.
| | |
| 10/03/2017 |
Page 17 - 4
2017 Updated Preliminary Economic Assessment on the Ann Mason Project
Nevada, U.S.A.
Reagents are stored, mixed and distributed from a central reagents area. Frother, collector, and depressant are pumped from the reagents area to head tanks in the flotation section from where peristaltic reagent pumps accurately dose to the process.
| 17.4.2 | Detailed Process Description |
Crushing – Area 100
Mill feed will be delivered to one of two primary tip locations by 360-tonne haul trucks at a frequency averaging seven trucks per hour. Peak delivery rate is assumed to be 5,500 dmt/h. Mill feed is discharged directly into the primary crusher throat. This area is served by a hydraulic rock breaker to handle oversize rocks.
The primary crusher can accept 1,000 mm top size and will run with a 200 mm open side setting. Grizzly oversize enters the crusher and discharges by gravity after crushing into a 30‑tonne rail lined surge pocket. An apron feeder is used to withdraw crushed mill feed from the surge pocket onto a short sacrificial conveyor. This conveyor discharges onto the main stockpile feed conveyor, which in turn feeds up to one of two crushed mill feed stockpiles.
The crushed mill feed stockpiles provide a live capacity equivalent to ~18 hours of plant production. Mill feed is withdrawn from the stockpile via two lined discharge chutes and two apron feeders (one operating, one standby). Each apron feeder is variable speed and capable of providing the entire mill feed rate. Each apron feeder discharges via a discharge chute onto the SAG mill feed conveyor. The two SAG mill feed conveyors feed two separate lines consisting of SAG milling, ball milling, and rougher/scavenger flotation.
Spillage and run-off in both the primary crusher building and the stockpile feeders tunnel is pumped to surface for appropriate handling. The primary crusher is served by an overhead maintenance crane of 20-tonne capacity.
SAG Milling – Area 200
From the stockpile discharge feeder, mill feed is withdrawn in measured quantities onto the mill feed conveyor. This conveyor discharges via head chute and into the mill feed hopper. The SAG mill feed material size distribution will be monitored and/or controlled using a high-speed camera system.
Each SAG mill (two total) is a 40 ft diameter by 24 ft long, grate discharge, semi-autogenous grinding mill. Slurry and pebbles exit the mill after passing through the mill discharge grate and pebble ports onto a trommel screen fixed to the mill discharge trunnion. Trommel screen oversize material (pebbles) is directed by chute onto the SAG mill pebble conveyor for re-cycling. Trommel screen undersize gravitates into the mill discharge sump where it is further diluted with water. From the discharge sump, coarse slurry is pumped to the SAG mill scalping screen via a distributor box. Screen undersize slurry gravitates via the screen underpan through a sampling plant to the ball mill circuit. Screen oversize material gravitates via the oversize chute back to the SAG mill for re-grinding.
| | |
| 10/03/2017 |
Page 17 - 5
2017 Updated Preliminary Economic Assessment on the Ann Mason Project
Nevada, U.S.A.
SAG mill slurry spillage is collected in a drive-in sump and then returned to process by a submersible slurry pump.
The milling area is served by an overhead crane. Relining is achieved using the common relining machine.
SAG mill grinding media is stored in a ball bunker located part-way along the mill feed belt. The bunker is served with a small spillage pump and a ball loading crane and magnet. Balls are added to mill feed at timed intervals via a ball loading chute.
Ball Milling – Area 220
After SAG milling, the particle size is further reduced to 80% -155 µm by conventional, closed circuit milling, in two 27 ft diameter by 48 ft long overflow discharge ball mills.
The scalping screen undersize from each SAG mill is fed by gravity to a ball mill discharge sump. The undersize combines with dilution water and ball mill discharge before being pumped to the cyclone classification cluster. The clusters consist of a total of twelve 840 mm cyclones, 10 operating and 2 standby.
Cyclone underflow gravitates to the feed chute of the ball mill. The cyclone overflow reports to a linear trash screen for removal of woodchips and other tramp material prior to flotation. The screened cyclone overflow stream gravitates to the flotation circuit. The stream of woodchips and tramp plastic from the linear screen is dewatered by a woodchip sieve bend before being dumped in a storage area.
The screened cyclone overflow reports to a sampling station that consists of a sampling launder and an automatic sampler. Spillage contained in the ball mill area is pumped to the mill discharge sump for re-treatment.
Ball mill grinding media is delivered to the plant in bulk and is stored in the ball mill ball bunker. The ball bunker is serviced by a crawl and electric hoist arrangement allowing balls to be lifted into a kibble using the ball loading magnet and tipped into the mill via a ball loading chute.
Rougher Flotation– Area 300
Screened cyclone overflow serves as feed to the rougher flotation section. Each rougher/scavenger bank (four banks total) consists of nine 300 m3 cells, operating in series. Flotation air to each cell is supplied by flotation blowers via a low pressure manifold and is flow controlled by modulating valves and vent-captor type flow meters. Pulp level is maintained by modulating dart valves.
| | |
| 10/03/2017 |
Page 17 - 6
2017 Updated Preliminary Economic Assessment on the Ann Mason Project
Nevada, U.S.A.
Rougher concentrate is collected in a common launder from the first six cells in the bank and pumped to the regrind mill discharge sump. Scavenger concentrate is collected in a common launder from the last three cells in the bank and pumped back to the rougher feed box. Tailings from the final scavenger cell report to a sampling launder, primary sampler, and then the rougher/scavenger tailings thickener.
Spillage in the rougher section is collected in a common sump and pumped back into the first rougher cell using a submersible spillage pump.
Rougher Concentrate Regrind – Area 320
Rougher concentrate from the four flotation lines are fed to the discharge box of two 12 ft x 20 ft regrind ball mills. Each mill discharge is pumped to a dedicated cluster of eight 380 mm cyclones (7 operating, 1 standby). Cyclone overflow, with a target P80 of 25 µm, flows by gravity to the feed box of the 1st cleaner flotation cells, while the cyclone underflow goes to the mill feed inlet.
A spillage pump is used to pump the contents of the area sump back into the regrind mill.
Cleaner Flotation - Area 330
The 1st Cleaner/scavenger bank consists of eight 20 m3 tank cells in series. Flotation air is supplied from a low-pressure manifold and pulp level is maintained by modulating dart valves.
Concentrate from the 1st Cleaner is collected from the first six cells in a common launder and pumped to the 2nd Cleaner feed box. The 1st Cleaner Scavenger concentrate is collected from the last two cells in the bank into a common launder and gravitates to the regrind mill pump box. Cleaner Scavenger tails slurry gravitates via a sampling launder and sampler to the Rougher Scavenger concentrate pump box.
The 2nd and 3rd Cleaner banks consist of five and four 10 m3 tank cells, respectively. Flotation air is supplied from a low pressure manifold and is flow controlled by modulating valves.
Concentrate from the 3rd Cleaner concentrate collected in a common launder and pumped to the copper-molybdenum separation conditioning tank. The 3rd Cleaner tails flow by gravity into the 2nd Cleaner feed box. The 2nd Cleaner tails flow by gravity into the Regrind Mill discharge sump.
The Cleaner area spillage is collected in bermed areas and directed into the cleaner area spillage pump, which pumps back to the Regrind Mill discharge sump.
| | |
| 10/03/2017 |
Page 17 - 7
2017 Updated Preliminary Economic Assessment on the Ann Mason Project
Nevada, U.S.A.
Copper-molybdenum Separation – Area 340
Second cleaner concentrate is pumped to a 3 m3 agitated conditioning tank where sodium hydrosulphide (NaHS) and fuel oil are added. The conditioned pulp overflows to a bank of six 10 m3 tank cells in series that constitute the molybdenum rougher stage. The molybdenum rougher concentrate is pumped forward through five stages of cleaning, with the underflow of each stage feeding by gravity to the previous cleaner bank. All of the flotation cells in the copper-molybdenum separation circuit are sparged with nitrogen gas, instead of air, from a low-pressure manifold.
The first, second, and third cleaning stages consist of three DR24 trough flotation cells in series. The working volume of each cell is 1.4 m3, and level control is achieved by dart valves at the end of each bank.
The fourth and fifth cleaner stages each consist of a single flotation column, 0.91 m in diameter and 6 m high. Each column includes a cavitation tube air sparging system, wash water system, and level control. Concentrate collected from the fifth cleaner column cell is pumped to the molybdenum concentrate thickener.
A spillage pump is used to pump the contents of the area sump back into the conditioning tank.
Concentrate Dewatering – Area 400
Final copper concentrate, in the form of molybdenum rougher tailings, is pumped to the copper concentrate thickener sampling box and sampler before entering the copper concentrate thickener for dewatering. This thickener is equipped with rake lift, bed level detection and bed mass monitoring. Thickener overflow gravitates to the spraywater tank for recycling, while the thickener underflow is withdrawn from the cone by a centrifugal underflow pump and pumped forward to the copper concentrate storage tank, or recycled to the thickener feed if of insufficient density.
The copper concentrate is pumped from the mechanically agitated storage tank to the pressure filter for dewatering. Filtrate from the pressure filter is directed to the concentrate thickener for re-cycling. Manifold flush pumps withdraw filtrate from the filtrate tank and flush the filter feed manifold between cycles. Flushed manifold product gravitates to the filtrate transfer pump and is re-cycled to thickener feed. A cloth wash tank and pumps allow high pressure washing of the filter cloth at the end of each cycle.
Copper filter cake is discharged from the press via two cake discharge chutes onto the cake transfer belt, which transfers cake to the concentrate storage shed. A front-end loader serves the cake stockpile and loads cake into side tipping trucks, which transport the concentrate to a toll smelter. Trucks are weighed and auger-sampled at the weighbridge prior to dispatch.
Molybdenum concentrate, from the overflow of the molybdenum 5th cleaner column cell, is pumped to the molybdenum concentrate thickener-sampling box and sampler before entering the molybdenum concentrate thickener for dewatering. This thickener is equipped with rake lift, bed level detection and bed mass monitoring. Thickener overflow gravitates to the spraywater tank for recycling, while the thickener underflow is withdrawn from the cone by a centrifugal underflow pump and pumped forward to the molybdenum concentrate storage tank, or recycled to the thickener feed if of insufficient density.
| | |
| 10/03/2017 |
Page 17 - 8
2017 Updated Preliminary Economic Assessment on the Ann Mason Project
Nevada, U.S.A.
The molybdenum concentrate is pumped from the mechanically agitated storage tank to the pressure filter for dewatering. Filtrate from the pressure filter is directed to the concentrate thickener for re-cycling.
Molybdenum filter cake is discharged from the press via two cake discharge chutes onto the cake transfer belt, which transfers cake to the rotary screw dryer. The dryer includes an indirect, diesel fired heater, inert gas blanketing system, and a wet gas scrubber. Dried concentrate is discharged to the feed hopper of a drum filling station. The loaded drums are auger sampled, sealed, weighed, and shipped by truck to a toll smelter.
Concentrate dewatering area spillage is recovered by pumping back to the respective concentrate thickener.
Tailings Dewatering – Area 450
The rougher scavenger tailings from two process lines and the corresponding 1st cleaner scavenger tailings from that section are pumped to the feed launder for one of two 45 m diameter high rate thickeners.
Thickener overflow gravitates to the process water tank, while thickener underflow is pumped to the final tailings tank. Four centrifugal pumps (two operating, two standby) transfer the tailings slurry from the tailings tank to the tailings dam. Each tailings pump is served by a dedicated progressive cavity, high pressure gland service water pump pumping clean water from the HP clean water tank. Area spillage is returned to process by the spillage pump.
Services – Area 500
Process water is stored in two, insulated 500 m3 tanks and is distributed to the plant by the process water pumps. Plant hosing/flushing water is provided by the hose-down water supply pumps.
The process water tank is also used to feed the diesel powered firewater pump from a separate (lower) offtake, thus guaranteeing availability.
Clean water is piped into the plant from wells and stored in the plant clean water tank. From the storage tank, water is pumped around the plant for use as reagent mixing water, slurry pump gland seal water and as required for mill lubrication system cooling.
| | |
| 10/03/2017 |
Page 17 - 9
2017 Updated Preliminary Economic Assessment on the Ann Mason Project
Nevada, U.S.A.
Two compressors provide plant and instrument air. A filter maintains air quality. Instrument air is dried using a refrigeration drier. An air receiver is provided for compressed and instrument air lines, to allow for surges in demand.
Low pressure air is supplied to the flotation plant by two separate blowers. The blowers are fixed speed, with manifold pressure controlled by a modulating valve on an exhaust line.
Reagents – Area 600
Collector – C3330
Sodium isopropyl xanthate (SIPX) pellets are delivered to site in 1-tonne bags and stored in the reagent storage area. Bags are added to the mixing tank via the reagent area hoist and collector loading chute. Collector is mixed to 10% solution strength within the tank, and then transferred to the storage tank, ready for distribution. The storage tank capacity and solution strength allow a batch to be mixed every 8 hours.
From the storage tank, collector solution is continuously pumped to the collector head tank which in turn overflows back to the mixing tank. Peristaltic hose pumps meter collector solution to several addition points throughout the plant.
Reagent spillage is pumped to the tailings tank for disposal on the tailings dam. The reagent area is served by a safety shower.
Collector – Fuel Oil
Diesel oil will be delivered to the reagents area by the site fuel truck. The diesel will be pumped from the truck into the reagent area diesel storage tank and distributed to the Ball Milling and copper-molybdenum separation circuits by dedicated peristaltic pumps.
Frother – MIBC
Liquid Methyl Isobutyl Carbinol (MIBC) is delivered to site in 1 m3 totes. As delivered (100% Strength) MIBC is pumped directly to the dosing points by dedicated peristaltic pumps.
Flocculant – Magnafloc 10
Flocculant powder is delivered to site in 1-tonne bags and stored in the reagent storage area. Bags are lifted by the reagent area crane and added to the flocculant powder hopper. Powder is withdrawn by the flocculant screw feeder and blown through a venturi to a wetting head located on top of the mechanically agitated mixing tank.
From the mixing tank, mixed flocculant can be fed forward to the storage tanks, or recycled back into the mixing tank to aid mixing. Once mixed, the flocculant should be left for several hours to hydrate. A storage tank provides sufficient volume for storage of flocculant while the mixed batch hydrates in the mixing tank. From the storage tank, flocculant is pumped directly to the tailings and concentrate thickeners.
| | |
| 10/03/2017 |
Page 17 - 10
2017 Updated Preliminary Economic Assessment on the Ann Mason Project
Nevada, U.S.A.
Sparging Gas – Nitrogen
Liquid nitrogen is delivered in bulk form in tanker trucks. The nitrogen is pumped from the truck to an on-site storage tank where it will be vaporized into a gas and distributed through a low-pressure manifold for use in the flotation circuit.
Depressant – NaHS
Sodium Hydrosulphide (NaHS) will be delivered to site as a 40% solution in tanker trucks. The NaHS will be off-loaded by pump transferring into the NaHS storage tanks.
| | |
| 10/03/2017 |
Page 17 - 11
2017 Updated Preliminary Economic Assessment on the Ann Mason Project
Nevada, U.S.A.
| 18 | Project Infrastructure |
| 18.1 | Infrastructure and Site Layout |
The Ann Mason Project infrastructure consists of the following:
| · | open pit |
| · | concentrate storage |
| · | process plant, mobile equipment, and maintenance shops |
| · | office/administration and dry complex |
| · | waste rock management facility |
| · | tailings management facility |
| · | electrical substation and distribution. |
This infrastructure is required to support the 120,000 t/d open pit operation.
| 18.1.1 | Mine/Mill Site Operations |
The mill is to be located to the northwest of the open pit, northeast of the waste rock management facility and south of the tailings management facility. The primary crusher, situated near the rim of the open pit, will feed material to the mill complex via an approximately 1.5 km overland conveyor. Built in close proximity to the mill building will be buildings containing offices, warehousing, welding shops, a services shop, a mine equipment/maintenance shop, and concentrate storage. Refer to site plan Figure 18‑1.
| 18.1.2 | Concentrate Storage |
The concentrate storage building will be designed to store approximately one-week worth of concentrate production (approximately 10,000 tonnes). The storage building will be unheated, and will consist of reinforced concrete floors and walls covered by an uninsulated fabric structure to prevent windblown contamination.
| | |
| 10/03/2017 |
Page 18 - 1
2017 Updated Preliminary Economic Assessment on the Ann Mason Project
Nevada, U.S.A.
Figure 18‑1: Plant Site
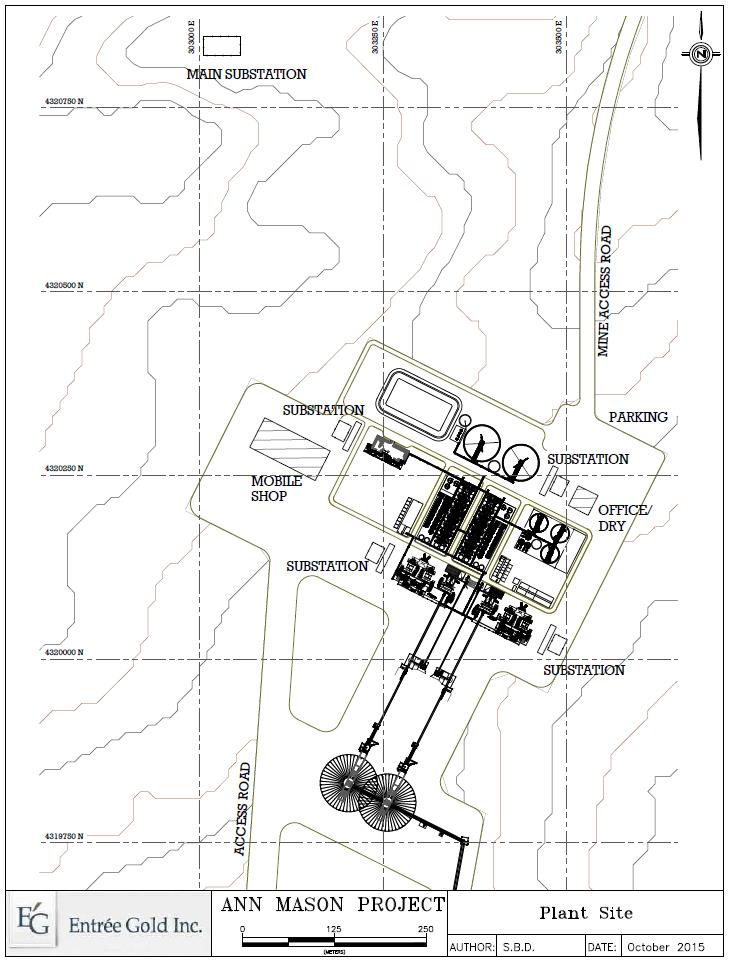
| | |
| 10/03/2017 |
Page 18 - 2
2017 Updated Preliminary Economic Assessment on the Ann Mason Project
Nevada, U.S.A.
| 18.1.3 | Warehouse, Office, and Dry |
The main warehouse, office, and dry will be located near the mill building. The office section will accommodate administrative staff and warehouse personnel. The dry will accommodate all mine and process plant personnel. The initial years of mining will see the peak in labour force. The average number of persons on the payroll for the first 10 years is expected to average 620, with a peak of 683 in Year 4.
| 18.1.4 | Fuel Storage and Handling |
The maximum fuel consumption early in the LOM will be approximately 77,000 L/d, projected to increase later in the LOM to 128,000 L/d. Tank farm storage capacity will initially be 300,000 L at the beginning of the LOM, increasing to 500,000 L in year five as demand increases. The fuel storage tank area will be equipped with containment and spill basins.
| 18.1.5 | Explosives Storage and Handling |
The explosives storage and manufacturing facility will occupy an area of approximately 100 m x 100 m located along the tailings access road at least 500 m from the mill. All explosive related structures will be located within an appropriately barricaded and fenced area in accordance with Federal Mine Safety and Health Administration (MSHA) standards.
| 18.1.6 | Roads |
The site access road is approximately 16 km (10 miles) from U.S. Highway 95-Alternate; approximately 5 km (3 miles) are paved, with the remainder unpaved. The roughly 10 km long, unpaved portion of the road will require upgrading or rerouting of sections where necessary. The site will be provided with roads connecting the open pit to the main processing plant, service complex areas, and tailings facility.
| 18.1.7 | Water Balance System |
Approximately 63,600 m3/d of fresh water will be required to satisfy water demand for the process plant. Tailings recycle water will make up to 35% of plant process water requirements, with the remainder coming from a series of wells.
| 18.1.8 | Service/Potable Water |
Water required for site services will be pumped from the well(s) to a water storage tank, treated, then pumped to the locations where service water is required. Potable water will be provided in bottled containers throughout the site.
| | |
| 10/03/2017 |
Page 18 - 3
2017 Updated Preliminary Economic Assessment on the Ann Mason Project
Nevada, U.S.A.
| 18.1.9 | Sewage Treatment |
The sewage and waste water treatment plant will be a self-contained rotating biological contactor (RBC) treatment plant, complete with clarifiers on both intake and outlet. The treated effluent will be discharged into the designated tailings impoundment area during the construction period. Once the mill begins operation, the treated sewage effluent will discharge into the mill tailings system.
| 18.1.10 | Refuse Management |
A recycling policy to minimize both industrial and domestic refuse will be implemented. Recyclable products will be stored at an appropriate site storage facility and removed on a regular basis. Waste products will be transported to a suitable landfill on site.
| 18.1.11 | Power Supply and Distribution |
Electrical power for the site will be supplied from the existing NV Energy 120 kV transmission line in service just east of the town of Yerington, Nevada. A tap from this transmission line will be constructed along with roughly 10 km (6 miles) of new 120 kV line to service the site. This transmission line, rated for approximately 110 MW, will arrive at the main substation at site, and will feed the two main substation transformers. Each of the two main substation transformers will be rated 90/120 MVA, and will be connected to secondary switchgear at 44 kV in such a way that either or both would be able to supply power to the site, as needed.
The 44 kV secondary voltage will be distributed throughout the site by a combination of cable ducts and aerial lines. The mill will be serviced by five substations, located strategically to accommodate high load concentration areas; the majority of these substations will be fed from high voltage cable ducts originating at the main substation. A separate 44 kV substation will be provided for the primary crusher facility using redundant aerial feeds from the main substation. Pit loads will be supplied by twin aerial lines originating at the main substation, and will feature drop locations where portable pit power distribution substations (for shovel/drill loads) can be connected. The remainder of the site loads (office, shops, warehouse, reclaim, wells, etc.) will be serviced from a separate 44 kV aerial line networked throughout the site.
Backup power will be provided for any essential services of the mill as well as for other facilities at site deemed essential. It is envisioned that the backup power requirements will be provided by three or four stand-alone diesel generators strategically located within the site.
| | |
| 10/03/2017 |
Page 18 - 4
2017 Updated Preliminary Economic Assessment on the Ann Mason Project
Nevada, U.S.A.
| 18.2 | Tailings Management Facility |
| 18.2.1 | General |
The proposed TMF is illustrated in Figure 16‑15. This arrangement provided the lowest height for the tailings dams and added security by keying the tailings dams into rock contacts for increased stability. Further study on this layout is required in later levels of study.
| 18.2.2 | Design Basis and Operating Criteria |
The principal objective of the TMF is to provide secure containment of all the tailings solids generated by the milling process. The mill throughput is planned at 120,000 t/d with total mill throughput in the PEA mine plan is estimated to be 835 Mt of Measured and Indicated material, and 42 Mt of Inferred material. There is a 21-year processing plan. Using a 1.28 t/m3 tailings density, the facility must accommodate 685.5 Mm3 of tailings.
The TMF facility capacity at all stages of the mine life considers that a minimum of 10 m of freeboard is available to the dam crest. The end of mine freeboard is designed to be 5 m.
| 18.2.3 | Tailings Management Facility Embankments |
The tailings dam design for this study considers a total of four separate structures. Three of these will be constructed entirely of rock fill with the fourth a combination of rockfill and cyclone tailings.
The four dams are named:
| · | South Dam |
| · | North Dam |
| · | Middle Dam |
| · | Saddle Dam. |
The South Dam is the largest of the all the dams with a final length of almost 4 km. It is located at the south end of the TMF. The base of the dam is at the 1525 elevation with the final height at 1650 elevation, yielding an overall height of 125 m. The volume of this dam when complete is estimated to be 94.6 Mm3, of which 21.8 Mm3 is rock. This rock will be furnished by extending the haul of the mine trucks in the early years to develop the starter dams. The South Dam will be active for the duration of the mine life and is required at the start of the mine production.
The North Dam is the second largest of the dams with a final length of 3.5 km and located at the north end of the TMF. The base of the dam is at 1585 elevation with the top at 1650 elevation resulting in an overall height of 65 m. The volume required for this dam is 26.5 Mm3. The North dam is not required until the start of Year 3, but once active is active for the duration of the mine life.
| | |
| 10/03/2017 |
Page 18 - 5
2017 Updated Preliminary Economic Assessment on the Ann Mason Project
Nevada, U.S.A.
The Middle Dam is adjacent to the plant area and the third largest dam. The dam is 1.3 km long with a base at 1625 elevation and a top at 1650 elevation, providing an overall height of 25 m. The volume of rock required is 3.3 Mm3. The dam is not required until Year 16 when the level of the tailings approaches the 1625 elevation. Once active, it will remain thus until the end of the mine life.
The final dam is the Saddle dam in the northeast corner of the TMF. This is necessary to ensure sufficient freeboard will exist after mine closure. The dam is entirely rock with a requirement of only 61,400 m3. It will be constructed in the final years.
The downstream and upstream slopes of the dams are designed at 3.5:1 (H:V).
| 18.2.4 | Tailings Distribution and Reclaim Water Systems |
The tailings slurry will be pumped via a 5 km pipeline from the plant to the South Tailings Dam. Tailings will be distributed to a series of cyclones on the dam crest and used to construct the dam further. Process water will be reclaimed from the TMF pond and returned to the plant via a dedicated reclaim water pumpset and pipeline.
Both the tailings and water reclaim line will follow an access road from the plant to the tailings facility.
| 18.2.5 | Water Management |
The TMF pond plays a key role in the site water management by providing buffering of process water, direct precipitation, and runoff. The impact of evaporation and a final water balance have not been completed for this study, but will be required in the next levels of study as the project advances.
Costing for surface diversion ditches along the western edge of the TMF has been included in the capital costing. This is to capture and divert water away from the TMF without contact and released back into the environment.
Seepage collection ponds and pumping systems are considered in the costing for each of the dams. This seepage will be returned to the process plant via the reclaim water system or returned to the TMF.
| | |
| 10/03/2017 |
Page 18 - 6
2017 Updated Preliminary Economic Assessment on the Ann Mason Project
Nevada, U.S.A.
| 18.3 | Plant/Mine Site Water Management |
The plant site drainage will be collected in a settling pond with disposal to the process water pond. Wash bay drainage will be directed to an adjacent settling pond and pumped to the TMF.
Mine water collection will be pumped to a small settling pond near the primary crusher. The water will be used for dust control on the road surfaces. Excess water will be sent to the TMF.
Surface drainage will be diverted away from the mine where possible to ensure contact with active mining areas does not occur. If contact does occur, it will be directed to the mine settling pond.
| 18.4 | Waste Rock Management Facility |
The waste rock management facility is discussed in depth in Section 16.2.8.
| | |
| 10/03/2017 |
Page 18 - 7
2017 Updated Preliminary Economic Assessment on the Ann Mason Project
Nevada, U.S.A.
| 19 | Market Studies and Contracts |
This section examines potential smelting and refining terms for the copper and molybdenum concentrates expected to be generated from the Ann Mason deposit, elements that may affect the Project's net revenue flow.
Increasing demand for copper in the Asian markets, commencing during the late 1990s, has stimulated the expansion of processing capacities for copper raw materials in Asia, and rationalized reduction and/or elimination of similar existing processing capacities elsewhere in the international market. The balancing of supply and demand is expected to continue where newly created processing capacity should absorb much of the new copper concentrate production capacity that will be realized.
The quality of the mine's product will influence the targeted regions for consumption, therefore stressing the importance of the Asian smelting and refining growth on the overall copper concentrate market.
The quantity and estimated value of the mine's product will allow movement of product to multiple regions; therefore, the regions and consumers providing the least commercial risk and the optimum return to the Project should be considered.
The objective is to establish the estimated smelting and refining terms and conditions for the mine's products, based on the analysis provided, and to predict the estimated value for the Project.
| 19.1 | General Considerations |
The consolidation of major participants in the copper mining, smelting, and refining market will influence the characteristics of the copper market, but should not adversely affect market demand for the mine's product. The product will be clean, with an average copper content of 30%, and the possibility of higher concentrate grades as the mine matures. The annual quantity of product is average, and the mine life is long-term, estimated at twenty-one years. The molybdenum concentrate, at 55%, is again average, and should pose no issues for marketability.
The mine should not compete directly with major producers such as BHP-B, RTZ, Codelco, Freeport, Vale, Anglo, Teck, Antofagasta, Xstrata, or Grupo Mexico; however, it will be influenced by this group's interaction with the major consumers in China, India, Japan, Korea, and the Philippines. Many of the above producers control or influence the operations of copper smelting and refining complexes.
| | |
| 10/03/2017 |
Page 19 - 1
2017 Updated Preliminary Economic Assessment on the Ann Mason Project
Nevada, U.S.A.
AGP recommends that the mine focus upon selective smelting and refining complexes that currently process copper concentrates along the Pacific Rim or the United States to reduce transportation costs, but terms offered for silver and gold content could determine a different direction. The anticipated silver and gold values indicate that it may be sufficient to cover the majority of the transportation costs.
The dried molybdenum concentrates will be contained in tote bags, which assist in the overall transportation of the concentrate. Handling considerations will be slightly different, but discussions on overall grade accountability and transit losses are applicable for both the copper and molybdenum concentrates.
This Report suggests that the mine consider distributing the sale of product among at least three smelters to minimize operational disruptions risk and maximize leverage of negotiations. Unless Entrée desires to link product sales with potential financing, the above strategy is highly recommended.
Logistics must be examined; however, freight costs should not greatly influence the value of the concentrate. The product value dictates minimization of the amount of in-process inventory at the mine, in-transit inventory from mine to port, inventory in storage awaiting shipment at the port, and inventory in-transit from shipping port to receiving discharge port.
Normal deviations in moisture content and the methods established to sample and determine the settlement dry weight must be closely examined and controlled. Moisture samples should be taken when product is weighed and sampled for assays at the trailer or car discharge in the storage area designated for loading the carrying vessels. Care must be taken to immediately seal the moisture samples, and to follow the established procedures for drying and determination of dry weight. Sampling for assay determination should be examined, but will likely follow normal procedures. Samples are taken from the transit trailers or cars when departing the mine area, and absolutely upon loading of the carrying vessel. Here, a frequently calibrated static scale will be utilized before the trailers or cars are discharged at the storage area, prior to loading of the vessel. The trailers or cars must be recorded for tare weight, as well as total weight. The storage area for loading the carrying vessels must be very secure, and covered to protect from weather conditions as best as is possible.
Assaying, exchange of assay results, and the splitting limits for determination of settlement results must be professionally managed. Dust control and wash-down facilities for trucks and rail should be examined, as the Project should avoid unnecessary losses in handling and transport. Similar facilities install wash-down facilities for trucks prior to departing the loading area at the mine, as well as at the discharging area prior to loading onto carrying vessels. Transit trailers must be tightly covered to avoid wind losses during transit.
| | |
| 10/03/2017 |
Page 19 - 2
2017 Updated Preliminary Economic Assessment on the Ann Mason Project
Nevada, U.S.A.
AGP suggests shipment in the smallest vessels conducive for the movements required, in order to minimize the in-process inventory. The alternative is to demand advanced provisional payments from consumers upon loading of the carrying vessel; however, this procedure may not be acceptable to some or all consumers, and the consumer (smelter) will attempt to adjust the terms and conditions to reflect the loss of interest and risk.
Professional surveyors are recommended at loading and discharge ports. Professional support is suggested for the Project to assist in negotiating and drafting the commercial sales Purchase agreements for the product with the various consumers. This practice would reduce the exposure to a number of critical elements within the commercial agreements and define how best to manage and control the liquidation process.
Potential smelting facilities for the copper concentrate include the Pacific Rim and the United States. Smelting facilities exist within Mexico, but their selection would be dependent upon their precious metal accountabilities and overall economics. Pacific Rim countries would be accessed via the port of Stockton, California.
| 19.2 | Terms and Conditions Discussion |
| 19.2.1 | Accountable Metals |
The actual recovery of payable metals varies by smelting processes; treatment of precious metals and by-product streams; concentration of payable elements within the standard smelting bed (the desired blend of concentrates entering the process); and the impact of deleterious elements on processing efficiency, payable metal recovery, and deleterious element containment costs. A smelter with minimal precious metal in their overall feedstock will struggle to achieve modest recovery of the precious metals when compared to a smelter with above average precious metals in their feedstock. Some smelters have efficient slag cleaning furnaces, while older facilities are not physically able to improve precious metal recovery.
For the purposes of this study, the assumption was made that the precious metals of silver and gold contained within the copper concentrate would be payable at 97% of the contained metal.
| 19.2.2 | Smelting and Refining Charges |
The proposed smelting and refining terms for each product are consistent with anticipated market trends, reflecting a rise in mine production to compensate for the immediate market shortages, and higher than usual prices for each accountable metal. No direct contact or definitive smelter agreements have been obtained for the concentrate, although, after independent review, the concentrate would not be difficult to market. This is due in part to the higher copper grade in the copper concentrate and apparent lack of deleterious elements. No penalties need to be applied in the terms for the concentrate.
| | |
| 10/03/2017 |
Page 19 - 3
2017 Updated Preliminary Economic Assessment on the Ann Mason Project
Nevada, U.S.A.
Table 19-1 shows the terms applied to the Ann Mason study for determining net metal values and metal revenue. These terms are considered reasonable for the purposes of the 2017 PEA.
Table 19-1: Smelting and Refining Terms
Term | Unit | Copper | Molybdenum | Silver | Gold |
Cu Minimum Deduction | % | 1.0 | - | - | - |
Base Smelting Charge | $/dmt | 80.00 | - | - | - |
Cu Refining Charge | $/lb payable | 0.080 | - | - | - |
Mo Payable | % | - | 99.0 | - | - |
Mo Roasting Charge | $/lb payable | - | 1.15 | - | - |
Payable Silver and Gold | % | - | - | 97.0 | 97.0 |
Refining Charge | $/oz | - | - | 1.00 | 10.00 |
Concentrate Grade | % | 30 | 55 | - | - |
Concentrate Moisture | % | 8 | 4 | - | - |
| | |
| 10/03/2017 |
Page 19 - 4
2017 Updated Preliminary Economic Assessment on the Ann Mason Project
Nevada, U.S.A.
| 20 | Environmental Studies, Permitting, and Social or Community Impact |
| 20.1 | Environmental Studies |
Mining activities in Nevada are regulated by the Nevada Division of Environmental Protection (NDEP) and by the Bureau of Land Management (BLM) where they occur on public land. The Ann Mason Project is located on both private and public land.
MIM and Entrée US have conducted exploration activities on the area surrounding the Ann Mason deposit under an approved Exploration Plan of Operations (Plan). In December 2009, the BLM and Enviroscientists Inc. completed an Environmental Assessment (DOI-BLM-NV-C020-2010-0002-EA) that considered the potential impact of the Plan on the environment. The BLM determined that no significant impact to the human environment would occur due to the Plan. A Finding of No Significant Impact (FONSI) and Decision Record (DR) approving the Plan was issued January 19, 2010.
Substantial environmental studies were conducted in the preparation of the 2009 Environmental Assessment. These studies documented that historic and pre-historic cultural resources, habitat of certain special interest species of plants and wildlife, and other concerns exist or could exist in the vicinity of the Project.
Subsequent to the preparation of the 2009 Environmental Assessment, baseline environmental studies, including Biology (vegetation and wildlife), Cultural Resources, and Waters of the United States & Wetland Delineation, have been completed on approximately 10,040 acres of the Project area. Great Basin Ecology, Inc. of Elko, Nevada completed the Biological Survey and Report on vegetation, wildlife, noxious weeds and raptors in December 2014. As required by the U.S. Fish and Wildlife Service, the raptor survey included the area within a 10-mile radius of the 10,040-acre baseline survey area. The Biological Survey and Report was submitted to the BLM in February 2015. Priority habitat for the Greater Sage-grouse Bi-State Distinct Population, identified in the BLM Resource Management Plan (RMP) and located within the Project area, is restricted to a small segment of the Buckskin Range at the northwest corner of the Ann Mason Project. None of the identified habitat occurs within the 10,400 acres proposed for infrastructure development. Far Western Anthropological Research Group, Inc. of Davis, California submitted a draft Class III Cultural Resources Inventory of the Ann Mason Project, Lyon and Douglas Counties, Nevada to the BLM in December 2014. A Preliminary Waters of the United States & Wetland Delineation, conducted by 7Q10 of Reno, Nevada, was submitted to the Utah Regulatory Office of the U.S. Army Corps of Engineers (USACE) in August 2013. At the request of USACE, supplemental materials were submitted by 7Q10 in July 2014. On April 1, 2016, the Company received an approved Waters of the US/Wetlands ("WOUS/Wetlands") jurisdictional determination from the Regulatory Division of the U.S. Army Corps of Engineers ("USACE"). According to USACE, the water drainages on the Ann Mason Project are considered "isolated waters with no apparent interstate or foreign commerce connection" and as a result, no permit under Section 404 of the Clean Water Act is required for Ann Mason. No significant obstacles to the development of Ann Mason were identified in any of the other baseline environmental studies completed to date, and there are no known environmental issues that could materially impact the Project.
| | |
| 10/03/2017 |
Page 20 - 1
2017 Updated Preliminary Economic Assessment on the Ann Mason Project
Nevada, U.S.A.
Through coordination with the regulatory agencies, conducting additional comprehensive environmental studies, prudent Project planning and design, and avoiding and/or mitigating potential Project environmental and socio-economic impacts, the Company anticipates being able to obtain all necessary permits for the Project and to operate the Project in an environmentally acceptable manner. All aspects of the Project must be designed and operated to avoid and/or minimize environmental impacts as required by those permits. Air and water quality and operating parameters will be monitored as required by those permits.
| 20.2 | Project Permitting Requirements |
Mining has been a significant business in Nevada for many years, and many mines have been permitted on the public lands in Nevada. Consequently, the regulatory agencies are familiar with mining activities, and complying with the respective agency permit application requirements allows permits to be issued in a predictable manner.
The most important, time consuming, and costly permits/approvals required for the Ann Mason Project are:
| · | Mining Plan of Operations (PlanOp) approval by the BLM |
| · | Water Pollution Control Permit from the NDEP – Bureau of Mining Regulation and Reclamation (BMRR) |
| · | Reclamation Permit from the BMRR |
| · | Air Quality Permit from the NDEP – Bureau of Air Pollution Control (BAPC) |
| · | Permits from Lyon and Douglas Counties. |
Other permits are necessary, but do not require as much time or effort to acquire and can be acquired during the time period the above permits are pending.
| 20.2.1 | Plan of Operations (PlanOp) |
Entrée US will require BLM approval of a detailed PlanOp in connection with development and operation of the mine. The PlanOp provides a detailed description of the construction, operation and eventual reclamation of the mine and also an estimate of the eventual closure and reclamation costs.
| | |
| 10/03/2017 |
Page 20 - 2
2017 Updated Preliminary Economic Assessment on the Ann Mason Project
Nevada, U.S.A.
Approval of the PlanOp is considered an action by the Federal Government, and, as such, is subjected to review under the National Environmental Policy Act (NEPA). Federal actions fall into one of five categories of NEPA review:
| 12) | actions which are exempt from NEPA |
| 13) | actions which are categorically excluded from NEPA review |
| 14) | actions which are covered by an existing NEPA review |
| 15) | actions which require the development of an EA to determine if the potential impact would be significant (if not significant then a Finding of No Significant Impact or FONSI is reached through a Decision Record (DR)) |
| 16) | if the potential impact is considered to be significant, then an Environmental Impact Statement (EIS) is produced to determine the impacts and the finding is documented in a Record of Decision (ROD). |
Development of the Ann Mason Project would most certainly fall into the last category requiring an EIS, and Entrée US will request that an EA review not be undertaken. Preparation of an EIS can be completed by an approved, third-party contractor operating under a Memorandum of Understanding with the BLM and funded by the Company. An EIS is first issued as a draft for public and agency review. The BLM will be the Lead Agency under NEPA rules and will request review of the EIS by the U.S. Environmental Protection Agency (EPA). A 2008 Memorandum of Understanding between the BLM and the EPA is intended to facilitate the review and coordination of EIS level NEPA documents.
Other agencies (such as the NDEP and Lyon and Douglas Counties) will also participate and cooperate with the BLM in the preparation and review of the NEPA documents. The BLM will consider all public and agency comments and issue a Final EIS.
The PlanOp must provide sufficient detail to identify and disclose potential environmental issues for the NEPA review. Project components that must be described in the PlanOp, as appropriate, include:
· mining method (open pit/underground) · mine waste rock storage facilities · mill feed storage/handling facilities · crushing facilities · processing methodology and facilities · process ponds · tailings disposal facilities · haul roads · other onsite roads · water supply ponds · employee information (number/shifts/travel/training) | · water wells · pipelines · surface drainage control facilities · electrical generation and transmission facilities · other surface disturbances · chemical storage facilities · explosive magazines · fuel storage/handling facilities · noise · light. |
| | |
| 10/03/2017 |
Page 20 - 3
2017 Updated Preliminary Economic Assessment on the Ann Mason Project
Nevada, U.S.A.
Detailed environmental and engineering information must be included in the PlanOp, and in other technical reports, describing the following environmental elements:
· air quality · cultural resources · environmental justice · floodplains · geology and geochemistry · land use authorization · livestock grazing management · meteorology · migratory birds · minerals · Native American religious concerns · paleontological resources | · social and economic values · soils · special status plants and animals · threatened and endangered species · vegetation · visual resources · wastes (solid and hazardous) · water (surface and ground) · wild horses and burros · wildlife · noxious weeds, invasive, and non-native species. |
To address seasonal variability, up to 12 months of baseline data may be required for some of the above elements (such as water quality and air quality). Data acquisition for other elements (such as cultural resources) may require extensive fieldwork. Seasonal aspects for some environmental elements such as vegetation and wildlife must also be considered. Baseline data must be submitted with the PlanOp.
As described in Section 23.1, baseline environmental studies, including Biology (vegetation and wildlife), Cultural Resources, and Waters of the United States & Wetland Delineation, have been completed on the approximately 10,040 acres of the Project area expected to be utilized for the development of Ann Mason. Portions of the completed baseline environmental studies (raptor survey) will require updating prior to submitting an application for the PlanOp.
Typically an EIS for a large mining project in Nevada can be expected to take 24 to 36 months to complete. Entrée understands the EIS process and the BLM requirements and is committed to submit the necessary documentation in a timely manner to reduce as much as possible the time required for the review. However, depending on circumstances out of Entrée's control, the time required to prepare an EIS for a Project the size of Ann Mason may take three to five years. No major, insurmountable issues are currently anticipated in the EIS NEPA review for the Ann Mason Project.
| | |
| 10/03/2017 |
Page 20 - 4
2017 Updated Preliminary Economic Assessment on the Ann Mason Project
Nevada, U.S.A.
The BLM Carson City District (CCD) is currently finalizing a comprehensive Resource Management Plan (RMP) and associated EIS to guide management of BLM administered public lands (surface lands and federal minerals) within the CCD. The RMP/EIS is being prepared as a dynamic and flexible plan to allow management to reflect the changed needs of the planning area and will replace the existing Carson City Field Office Consolidated Resource Management Plan (2001) and amendments.
The need for the CCD RMP/EIS is to respond to new policies, including but not limited to, energy, demand for limited resources, appropriate protection of sensitive resources, increases in conflict between competing resource values and land uses, and other issues that have surfaced since approval of the existing RMPs. The overall objective of the RMP/EIS planning effort is to provide a collaborative planning approach that assists the BLM in updating the management decisions of the current RMPs. The planning process commenced in February 2012.
The BLM is currently working to review public comments received regarding the draft RMP/EIS and to prepare a proposed RMP/Final EIS. Release of the proposed RMP/Final EIS, originally scheduled for Spring 2017, may be delayed until Fall 2017. The release of the proposed documents will trigger a 60-day consistency review by the Governor followed by a 30-day protest period prior to BLM issuing a Record of Decision and Approved Resource Management Plan in Fall 2017 or Spring 2018.
Mining is a large part of the BLM's resource activities in the CCD, including the Sierra Front Field Office, which has direct management over the public lands surrounding the Ann Mason Project. Major changes in how the BLM manages mineral development activities on the public lands are not anticipated.
| 20.2.2 | BMRR Water Pollution Control Permit |
The Regulatory Branch, BMRR of NDEP, administers water Pollution Control Permits.
The Water Pollution Control Permit typically requires a zero discharge of potential water contaminants, which effectively requires containment of all process fluids. The application for a Water Pollution Control Permit requires a large, comprehensive amount of material. Much of the required information would be included in the PlanOp, but more specific information is required by the BMRR for some facilities. The information must be sufficiently detailed to allow the agency to determine the potential sources of water pollution, the methods to prevent water pollution, and the monitoring methods to ensure pollution does not occur. The information required includes:
| | |
| 10/03/2017 |
Page 20 - 5
2017 Updated Preliminary Economic Assessment on the Ann Mason Project
Nevada, U.S.A.
| · | a description of the area of review including hydrology (surface water and groundwater), topography (watershed), meteorology, water wells, and potential effects of flooding |
| · | an engineering report that includes specifications for fluid management, process components, topographic maps showing process and mine facilities (including waste rock disposal areas and tailings facilities), which could be a source of water pollution and description of water pollution control features, such as pond liners |
| · | methods of inspecting, monitoring, testing, and quality assurance and quality control of all process facilities, which could be a source of water pollution. |
| 20.2.3 | BMRR Reclamation Permit |
Reclamation Permits are administered by the Reclamation Branch, BMRR of NDEP.
Reclamation requirements will be a substantial part of the PlanOp to be approved by the BMRR and BLM. Entrée US will prepare a reclamation plan for the BMRR, which will satisfy both agencies. The reclamation plan must include maps and drawings of all facilities and methods to reclaim each facility commensurate with that facility. It is important that measures be undertaken to salvage, store and protect topsoil/growth medium; prevent wind and water erosion; ensure long-term stability of reclaimed structures; and return disturbed lands to a productive post-mining land use approved by the BLM.
A reclamation bond must be posted with the BLM prior to surface disturbance and prior to the construction of facilities. The bond may be placed in stages depending on the particular mine phase. The bond may also be recovered in stages as reclamation of mine facilities no longer needed for operations are reclaimed to agency satisfaction.
| 20.2.4 | BAPC Air Quality Permit |
The EPA has delegated the authority to issue Air Quality Permits to the state of Nevada through the Nevada State Implementation Plan (SIP). The SIP insures compliance with the federal Clean Air Act.
The permitting branches in the Bureau of Air Pollution Control issue air quality operating permits to stationary and temporary mobile sources that emit regulated pollutants to ensure that these emissions do not harm public health or cause significant deterioration in areas that presently have clean air. This is achieved by stipulating specific permit conditions designed to limit the amount of pollutants that sources may emit into the air as a regular part of their business processes.
Any process activity that is an emission source requires an Air Quality Permit. An emission source is defined as "any property, real or personal, which directly emits or may emit any air contaminant." An air contaminant is defined as "any substance discharged into the atmosphere except water vapor and droplets."
The following thresholds are a guide to the various air quality permit types:
| | |
| 10/03/2017 |
Page 20 - 6
2017 Updated Preliminary Economic Assessment on the Ann Mason Project
Nevada, U.S.A.
| · | Class 1 – Typically for facilities that emit more than 100 st/a for any one regulated pollutant or emit more than 25 st/a total hazardous air pollutant (HAP) or emit more than 10 st/a of any one HAP or is a Prevention of Significant Deterioration (PSD) source or major Maximum Achievable Control Technology (MACT) source. |
| · | Class 2 – Typically for facilities that emit less than 100 st/a for any one regulated pollutant and emit less than 25 st/a total HAP and emit less than 10 st/a of any one HAP. |
| · | Class 3 – Typically for facilities that emit 5 st/a or less in total of regulated air pollutants and emit less than one-half ton of lead per year, and must not have any emission units subject to Federal Emission Standards. |
| · | SAD – Surface Area Disturbance of >5 acres. |
The Project will require a SAD permit for surface disturbing activities. Depending on the amount of air pollutant emissions for all sources of the Project, a Class 1 or Class 2 permit will be required. Determination of the type of permit required will be conducted early in the design stage of the mine. A Class 1 permit application requires the collection of substantial meteorology data and ambient air quality data, and also emission modelling. Entrée US began recording precipitation data from a location near the proposed Ann Mason plant site in June 2013. No data is recorded during periods of expected freezing temperatures. Extensive meteorological data for the region is also available from multiple recoding stations located in the Yerington, Nevada area. The air quality permitting effort would run concurrently within the time frame of the PlanOp approval process.
Entrée US currently holds an active Class 2 SAD permit to cover exploration operations permitted under the current Plan.
| 20.2.5 | Lyon County/Douglas County Permits |
A Conditional Use Permit will be required for mining operations in Lyon County. The permit application will undergo a public process involving the County Planning Commission and the County Commissioners for approval. Public input is allowed. The permitting process can be expected to take up to three months after a complete application is filed with the County. Entrée US has been actively involved in providing input on proposed changes to the Mining Chapter of the Lyon County Development Code currently being considered. Most permit requirements included in the proposed Development Code can be satisfied by providing the County with copies of applications provided to and approved permits or modified permits received from BLM and NDEP. Additional information specific to county needs (e.g., transportation plans, noise, lighting and emergency response plans) will also be required.
Lyon County is supportive of mineral development within the County and has promulgated the following policy:
| | |
| 10/03/2017 |
Page 20 - 7
2017 Updated Preliminary Economic Assessment on the Ann Mason Project
Nevada, U.S.A.
Lyon County recognizes that the development of its abundant Mineral Resources is desirable and necessary to the state and the nation. Therefore, it is the policy of Lyon County to encourage mineral exploration and development consistent with custom and culture and to eliminate unreasonable barriers to such exploration and development, except for those that arise naturally from a recognition of secured private property rights and free market conditions.
Under the current study, only a portion of the tailings impoundment would be located in Douglas County; however, mining uses, as defined in Section 20.660.070 of the Douglas County Consolidated Development Code, include mineral processing. Furthermore, all land disturbing activities in Douglas County require a Development Permit.
Permitting in Douglas County can be expected to follow the same general procedure as permitting in Lyon County. The Lyon County/Douglas County permitting efforts would run concurrently within the time frame of the PlanOp approval and the NDEP permitting processes.
| 20.3 | Waste and Tailing Management |
Seepage control and monitoring of the TMF, as discussed in Section 18, will continue post-closure. Seepage at the base of the WRMF will also be contained and monitored. If after analysis the seepage is suitable for discharge to the environment, it will be discharged. In the event that the seepage quality is not sufficient, it will be returned to the TMF.
The TMF closure strategies are to be determined upon completion of detail designs in the PFS after additional testwork on tailings and the ground water regime have been completed.
| 20.4 | Social/Community Issues |
In general, Lyon County and the state of Nevada are receptive to metal mining activities, and mining provides a large part of local and state revenue. Entrée will work with Lyon and Douglas Counties and nearby towns including Yerington, Weed Heights, Mason, and communities in Smith Valley to reduce potential impacts. The Conditional Use Permit and Development Permit required by Lyon and Douglas Counties, respectively, combined with permits required by BLM and NDEP and results of the EIS are anticipated to specify conditions aimed at reducing impacts on the Counties. Entrée does not anticipate any substantial impacts to social or community issues.
| 20.5 | Mine Closure |
As described above, reclamation of mine activities will be a significant part of the PlanOp and the Nevada BMRR permits, and plans for closure must be approved by both agencies prior to initiation of mining activities. Entrée will work with both agencies to develop cost effective reclamation methods including reclamation concurrently with mine operations as appropriate.
| | |
| 10/03/2017 |
Page 20 - 8
2017 Updated Preliminary Economic Assessment on the Ann Mason Project
Nevada, U.S.A.
Reclamation costs will be developed along with detailed mine development plans, and an acceptable reclamation bond sufficient for post-closure reclamation of disturbed areas will be posted with the BLM.
| | |
| 10/03/2017 |
Page 20 - 9
2017 Updated Preliminary Economic Assessment on the Ann Mason Project
Nevada, U.S.A.
| 21 | Capital and Operating Costs |
| 21.1 | Capital Costs |
| 21.1.1 | Summary |
The capital costs for the Ann Mason Project are summarized in Table 21-1. The costs are based on the estimate for a 120,000 t/d processing plant using a standard flotation circuit with molybdenum separation. The mine has a 21-year processing life.
Table 21-1: Ann Mason Project Capital Cost Summary
Capital Category | Total Capital ($M) | Preproduction Capital Year -3 to Year -1 ($M) | Production Capital Year 1 ($M) | Sustaining Capital Year 2+ ($M) |
Open Pit Mining | 539.3 | 437.2 | 13.4 | 88.7 |
Processing | 456.7 | 361.8 | 90.4 | 4.5 |
Infrastructure | 205.1 | 164.4 | 16.3 | 24.5 |
Environmental | 70.6 | 1.3 | 0.8 | 68.5 |
Indirects | 164.3 | 135.0 | 27.7 | 1.6 |
Contingency | 106.0 | 78.0 | 24.8 | 3.2 |
Total | 1,542.0 | 1,177.7 | 173.4 | 191.0 |
Initial capital requirements (pre-production) are estimated to be $1,177.7 million and include pre-stripping of the pits ($380 million). Production starts in Year 1 and the tail end of the start-up capital requirements will be partially offset by revenue in that year. Capital requirements for Year 1 total $173.4 million. Leasing is applied to the overall mine capital requirements and only the 20% down payment of the initial capital cost is reflected in the mining capital cost summary. The indirect and contingency values vary by capital cost item; the values referred to in Table 21-2 are percentages of the direct capital numbers.
Table 21-2: Capital Category Indirect and Contingency Percentages
Capital Category | Indirects (%) | Contingency (%) |
Open Pit Mining | 5.0 | 5.0 |
Processing | 17.3 | 15.8 |
Infrastructure | 20.0 | 15.0 |
Environmental | 5.0 | 10.0 |
| | |
| 10/03/2017 |
Page 21 - 1
2017 Updated Preliminary Economic Assessment on the Ann Mason Project
Nevada, U.S.A.
| 21.1.2 | Open Pit Mining Capital |
The capital costs for the open pit mine are based on conventional open pit equipment for copper porphyries. Rotary drills with 311 mm bits will be used for the production drilling. Haulage trucks with 360-tonne capacity were matched with 58.3 m3 electric cable shovels. Support equipment includes track dozers, graders, rubber-tired dozers, and additional ancillary equipment. Table 21-3 and Table 21-4 show the open pit capital breakdowns, full lease cost and capitalized down payments by equipment and by period, respectively.
Indirect and contingency costs for the open pit mine were estimated at 5% each. Initial capital (Year -3 to Year 1) represents 36% of the LOM equipment capital requirements, not including the capitalized pre-strip. Pre-production mining costs were treated as a capital cost and totalled $380 million.
Table 21-3: Major Equipment – Capital Cost, Full Lease Cost and Lease Down Payment
Equipment | Unit | Capacity | Unit Capital Cost ($) | Full Lease Cost ($) | Lease Down Payment ($) |
Production Drill | mm | 311 | 4,214,000 | 4,652,000 | 843,000 |
Front-End Loader | m3 | 40.5 | 6,160,000 | 6,801,000 | 1,232,000 |
Cable Shovel | m3 | 55.8 | 36,030,000 | 39,777,000 | 7,206,000 |
Breaker Loader | m3 | 11.5 | 2,984,000 | 3,294,000 | 597,000 |
Haulage Truck | t | 360 | 5,281,000 | 5,830,000 | 1,056,000 |
Tracked Dozer – Large | kW | 433 | 1,748,000 | 1,930,000 | 350,000 |
Tracked Dozer – Small | kW | 231 | 728,000 | 804,000 | 146,000 |
Grader | kW | 233 | 1,008,000 | 1,113,000 | 202,000 |
Rubber-Tired Dozer | kW | 350 | 1,209,000 | 1,334,000 | 242,000 |
Table 21-4: Mining Capital by Period – Lease Down Payment
Equipment | Total Capital ($) | Preproduction Capital Year -3 to Year -1 ($) | Production Capital Year 1 ($) | Sustaining Capital Year 2+ ($) |
Production Drill | 21,070,000 | 5,057,000 | 843,000 | 15,170,000 |
Front-End Loader | 7,692,000 | 5,128,000 | - | 2,564,000 |
Cable Shovel | 28,824,000 | 21,618,000 | 7,206,000 | - |
Breaker Loader | 1,790,000 | 597,000 | - | 1,193,000 |
Haulage Truck | 76,046,000 | 16,899,000 | 5,281,000 | 53,866,000 |
Tracked Dozer – Large | 4,546,000 | 1,399,000 | - | 3,147,000 |
Tracked Dozer – Small | 1,166,000 | 291,000 | - | 875,000 |
Grader | 2,622,000 | 807,000 | - | 1,815,000 |
Rubber-Tire Dozer | 1,934,000 | 483,000 | - | 1,451,000 |
Support Equipment | 13,608,000 | 4,941,000 | 42,000 | 8,625,000 |
Pre-Production Stripping | 379,996,000 | 379,996,000 | - | - |
Total Mine Capital | 539,294,000 | 437,216,000 | 13,372,000 | 88,706,000 |
| | |
| 10/03/2017 |
Page 21 - 2
2017 Updated Preliminary Economic Assessment on the Ann Mason Project
Nevada, U.S.A.
| 21.1.3 | Process Plant Capital Cost |
AGP has developed a capital cost estimate for the process plant as described in Section 17, at the base case throughput rate of 100,000 t/d. This estimate was subsequently adjusted using generally accepted estimating practices to align with the optimized throughput of 120,000 t/d. The 120,000 t/d process plant capital cost estimate is summarized in Table 21-5. The total direct cost for the process plant is $452.2 million. Sustaining costs are estimated at 1% of initial capital cost ($4.5 million). Indirect costs total $78.4M, with the main sub components being the EPCM contract ($40.7 million), Consumables and Spares ($14.3 million), and site establishment ($9.5 million). A contingency equivalent to 15.8% of the direct costs has also been included. The capital cost estimate for the processing plant is based on the proposed flowsheet, as described in Section 17.
Table 21-5 provides a breakdown of the construction estimate for the process plant.
Table 21-5: Summary of Process Plant Capital Costs
Area | Cost ($M) |
Civil & Earthworks | 69.4 |
Mechanicals – Supply | 189.4 |
Mechanicals – Installation | 41.3 |
Structural – Supply | 30.3 |
Structural – Installation | 16.7 |
Platework – Supply | 12.3 |
Platework – Installation | 7.4 |
Piping | 28.6 |
Electrical & Instrumentation | 43.5 |
Buildings | 13.3 |
Subtotal | 452.2 |
Indirects | 78.4 |
Contingency | 71.7 |
Sustaining Capital (1%) | 4.5 |
Total | 606.8 |
The estimation method for the processing plant described in this study is presented in the following section.
| | |
| 10/03/2017 |
Page 21 - 3
2017 Updated Preliminary Economic Assessment on the Ann Mason Project
Nevada, U.S.A.
| 21.1.4 | Basis for Estimation |
Mechanical Equipment
| · | Estimated costs for mechanical equipment (i.e., crusher, mills, conveyors, thickeners, float cells, pumps, agitators etc.) were taken from budget quotes and from database information. |
| · | An installation rate for each piece of mechanical equipment was based on an estimate of man-hours required and rates from similar projects in North America. |
| · | Transportation costs for each piece of equipment using recent quotations for 20 ft and 40 ft containers. All equipment shipped trans-continentally is assumed to be packed in 40 ft containers. Transportation cost per item assumes a percent of container volume, and thus cost. |
Civil Works
| · | An estimate of civil works costs was made by factoring from the mechanical equipment cost based on recent projects of similar size and scope. |
Structural
| · | An estimate of structural costs was made by factoring from the mechanical equipment supply cost based on recent projects of similar size and scope |
| · | The direct cost includes transportation to site |
| · | Erection costs are factored from the structural supply cost. |
Platework
| · | An estimate of platework costs was made by factoring from the mechanical equipment supply cost based on recent projects of similar size and scope. |
| · | The direct cost includes transportation to site |
| · | Erection costs are factored from the platework supply cost. |
Piping
| · | Factored using database information from other studies |
| · | The direct cost includes transportation to site and installation. |
Electrical and Instrumentation
| · | Factored using database information from other studies |
| · | The direct cost includes transportation to site and installation. |
| | |
| 10/03/2017 |
Page 21 - 4
2017 Updated Preliminary Economic Assessment on the Ann Mason Project
Nevada, U.S.A.
Building Costs
| · | Factored using database information from other studies |
| · | The direct cost includes transportation to site and installation. |
Factorization of Capital
The estimating methods described above were used to arrive at a 100,000 t/d base case capital cost. This estimate was subsequently factored to the 120,000 t/d scenario using widely accepted cost scale up factors, specifically:

| 21.1.5 | Infrastructure Capital Cost |
The infrastructure capital costs required by the mining and milling operations are listed in Table 21-6. These costs are based on information from vendor quotations, and work on similar operations.
| | |
| 10/03/2017 |
Page 21 - 5
2017 Updated Preliminary Economic Assessment on the Ann Mason Project
Nevada, U.S.A.
Table 21-6: Infrastructure Capital Costs
Capital Category | Total Capital ($M) | Capital, Year -3 to Year -1 ($M) | Production Capital Year 1 ($M) | Sustaining Capital Year 2+ ($M) |
Transmission Line Tap | 1.2 | 1.2 | - | - |
Power Line | 3.5 | 3.5 | - | - |
Site Main Substation | 16.3 | 16.3 | - | - |
Site MV Distribution | 3.6 | 3.6 | - | - |
Misc. Surface Substations | 1.5 | 1.5 | - | - |
Mill Substations | 24.0 | 24.0 | - | - |
Concentrate Storage | 4.4 | 4.4 | - | - |
Explosives Storage Area | 0.4 | 0.4 | - | - |
Fuel Storage | 4.1 | 2.5 | - | 1.6 |
Maintenance Facility | 24.0 | 24.0 | - | - |
Fresh Water and Pumping | 5.0 | 5.0 | - | - |
South Tailings Dam | 28.2 | 28.2 | - | - |
South Dam – filters, placement | 3.0 | 3.0 | - | - |
North Tailings Dam | 31.6 | - | 15.8 | 15.8 |
North Dam – filters, placement | 1.0 | - | 0.5 | 0.5 |
Middle Tailings Dam | 3.3 | - | - | 3.3 |
Middle Dam – filters, placement | 1.0 | - | - | 1.0 |
Saddle Tailings Dam | 0.6 | - | - | 0.6 |
Saddle Dam – filters, placement | 0.1 | - | - | 0.1 |
Tailings Pipeline and Sewage | 10.0 | 10.0 | - | - |
Electrical for Dam Pumps | 3.2 | 3.2 | - | - |
Geotechnical Instrumentation | 0.3 | 0.3 | - | - |
Diversion Ditches/Dams | 4.0 | 4.0 | - | - |
Site Mobile Equipment | 3.0 | 1.5 | - | 1.5 |
Communications | 0.2 | 0.2 | - | - |
Office/Dry/Warehouse | 3.6 | 3.6 | - | - |
Overland Feed Conveyor | 14.0 | 14.0 | - | - |
Access Roads to Site | 5.0 | 5.0 | - | - |
Site Roads | 5.0 | 5.0 | - | - |
Total | 205.1 | 164.4 | 16.3 | 24.4 |
To the infrastructure direct capital costs, an indirect percentage of 20% was applied as well as a contingency of 15%.
A 10 km power line needs to be built from the main power line at an estimated cost of $350,000/km. A tap off the main line will cost in the order of $1.2 million. A number of substations will be required throughout the mine and mill area in addition to the distribution system. This amounts to a total of $45.4 million for electrical transmission, distribution, and substation infrastructure.
| | |
| 10/03/2017 |
Page 21 - 6
2017 Updated Preliminary Economic Assessment on the Ann Mason Project
Nevada, U.S.A.
The equipment maintenance facility has been sized to accommodate the mobile equipment fleet. Maintenance on the shovels and drills will be handled in the field as required. The shop will be a 15 bay configuration with electrical, welding, and tire areas to accommodate the large equipment fleet.
The tailings dam component of the infrastructure cost is the initial construction costs of the dams. In the case of the North, Middle, and Saddle dams, the entire dams will be constructed of rock fill. The South Dam will be constructed of both rock fill and cyclone tailings.
The final total volume of material required for the South Dam is 94.6 Mm3. Of this, 30% will be rock fill with the remainder from cyclone tailings. The rock fill will be directed from mining operations in the pre-strip phase of the pit. The tonnage required is based on 28.4 Mm3 of rock; using an SG of 2.59 t/m3 and a 30% swell, this equates to 56.5 Mt. An incremental cost of $0.50/t has been applied to the rock fill from the mine to determine the capital cost. This equates to a value of $28.2 million. Additional to this is the cost of sand and gravel filters inside the dam to avoid buildup of the phreatic surface. The cost to crush and screen waste rock from the mine has been estimated at $3 million. The total cost of the initial South Dam is the sum of these two costs, $31.2 million.
The North Dam has a required volume of 26.5 Mm3 of material. Using a rock specific gravity of 2.59 t/m3 and swell of 30%, a total of 15.8 Mt will be required. A quarry cost of $2/t has been applied to this for the cost of dam construction, for a cost of $31.6 million. As part of the dam, a series of filters and sized material will be used. An estimate of $1 million in additional cost is included. The dam is not required to be complete until the end of Year 2, when the tailings level rises to the point of needing the dam.
The Middle Dam, adjacent to the plant site, is also constructed out of pure rock fill. In this case the material will be provided by the open pit, with only an incremental haulage cost of $0.50/t over the cost to haul to the waste rock management facility. The volume required for construction has been estimated at 3.3 Mm3. Using the same density of the rock and swell, that equates to a tonnage of 6.6 Mt. With a $0.50/t incremental cost, the rock portion of the dam is expected to cost $3.3 million. The sand and gravel filters from sizing a portion of the rock hauled will add an additional $1 million to the cost. This dam is not required until Year 15 when the tailings level rises to that elevation.
The small Saddle Dam is constructed near the end of the mine life in Year 21. This dam only requires a total of 61,400 m3 of rock or 122,000 tonne. Due to its small-scale nature, a construction cost of $5/t was estimated, for a dam cost of $611,000. Filters add an additional $100,000 to the cost of the Saddle Dam.
The tailings pipeline and reclaim water lines, extending electrical power to the dam, and dam geotechnical instrumentation, have been estimated to cost in the order of $13.5 million.
| | |
| 10/03/2017 |
Page 21 - 7
2017 Updated Preliminary Economic Assessment on the Ann Mason Project
Nevada, U.S.A.
Diversion ditches and small dams to divert the surface runoff were estimated to cost in the order of $4 million.
An overland conveyor is included in the infrastructure capital. This conveyor is designed for 120,000 t/d and will extend level for 1.4 km. This conveyor allows the primary crusher to be placed near the pit to reduce the truck requirements for mill feed transportation.
Access roads to and around the site have been considered at a PEA level for costing. The cost of the roads was estimated considering 10 km of roads needing to be built, and existing roads to be diverted at a cost of $500,000/km. The estimated 5 km of on-site roads, with their larger width requirements and gradients, are expected to cost in the order of 5 km at $1/km or $5 million.
| 21.1.6 | Environmental |
Daily environmental monitoring is included in the G&A cost category as an operating cost. Concurrent waste rock management facility re-sloping is considered a best practice for mining operations, and has been assumed and included as part of the mine operating cost. It is anticipated that, as lifts are developed, lower lifts and sections will undergo re-sloping. The final sloping and closure of the mine is shown as a capital cost item. This cost was estimated at $32.2 million. This includes fencing of the open pit upon closure, final re-sloping and seeding of the waste rock management area, removal of infrastructure and reclamation of site areas, and reclamation associated with the tailings management area.
Financial assurance regarding the reclamation has also been estimated, based on disturbed land on an annual basis. It is expected to cost $38.3 million for the bond interest.
| 21.1.7 | Indirects |
The indirect costs, as previously noted, vary between capital cost categories. Table 21-7 shows the percentages that were applied to each category. This is to account for various items, including construction supervision, erection of equipment, first fills, construction offices, and others. Also included in the indirect costs are an estimate of some of the owner's costs associated with water rights and land purchases.
Table 21-7: Indirect Percentages Applied
Capital Category | Indirects (%) |
Open Pit Mining | 5.0 |
Processing | 17.3 |
Infrastructure | 20.0 |
Environmental | 5.0 |
| | |
| 10/03/2017 |
Page 21 - 8
2017 Updated Preliminary Economic Assessment on the Ann Mason Project
Nevada, U.S.A.
| 21.1.8 | Contingency |
Contingency costs have been estimated using various percentages by category and applied to the direct capital cost of a particular category. Table 21-8 shows the percentages, which illustrates the level of confidence in each of the direct capital cost estimates.
Table 21-8: Capital Cost Category Contingency Percentages
Capital Category | Contingency (%) |
Open Pit Mining | 5.0 |
Processing | 15.8 |
Infrastructure | 15.0 |
Environmental | 10.0 |
| 21.2 | Operating Costs |
| 21.2.1 | Summary |
Operating costs were developed for a 120,000 t/d mining and milling operation with a 21‑year milling life. The pre-strip requirements add an additional three years prior to milling commencement.
All prices in the 2017 PEA are quoted in 2Q 2015 United States dollars unless otherwise noted. For this update, the input costs were verified and found to be very similar. Therefore, no changes to cost inputs were required. Diesel fuel pricing is estimated at $0.80/L. This estimate was derived from a price quotation for off-road diesel fuel delivered to site with applicable taxes considered and an estimate of oil at $75/barrel. The price for electrical power was set at $0.064/kWh, based on current Nevada industrial pricing.
The Ann Mason pit will be developed using conventional open pit technology, with large-scale equipment. This includes rotary drills with large electric cable shovels loading 360‑tonne haul trucks. The open pit has a LOM strip ratio of 2.01:1, with three years of pre-stripping required to prepare sufficient material for continuous plant operation. The total mill throughput in the 2017 PEA mine plan is estimated to be 835 Mt at 0.30% Cu, 0.005% Mo, 0.03 g/t Au and 0.59 g/t Ag of Measured and Indicated material, and 42 Mt at 0.27% Cu, 0.005% Mo, 0.03 g/t Au and 0.58 g/t Ag of Inferred material over the 21‑year processing life. A further 1,737.3 Mt of material will be placed in the waste rock management facility.
Mill feed material will be available from Year -1 and stockpiled adjacent to the proposed primary crusher. A total of 9.6 Mt will be stockpiled and reclaimed in Year 1. Processing will be at a 120,000 t/d rate, with a brief ramp up period in Year 1, which assumes 75% capacity from the mill in Year 1.
| | |
| 10/03/2017 |
Page 21 - 9
2017 Updated Preliminary Economic Assessment on the Ann Mason Project
Nevada, U.S.A.
Stockpiling of lower grade material (<0.2% Cu) will start in Year 1 and continue at variable rates, depending upon higher-grade availability, until Year 21. This material will be reclaimed in Year 20 finishing in Year 21.
The plant will use conventional grinding and flotation with a molybdenum separation circuit to make separate copper and molybdenum concentrates. Tailings will be pumped horizontally 5 km to the tailings management area, where a portion will be cycloned to be used in the construction of the South Dam.
G&A costs are based on an average of 53 people; 16 staff and 37 hourly. Additional charges for public relations, recruitment, logistics, bussing, etc. are also included in the G&A costs. Mine employees will be located in the immediate area, and no camp will be provided or required.
Concentrate transportation costs are estimated using values from logistics firms. Delivery of the concentrate will be by bulk trailers and hauled either to the port of Stockton, California, or by truck/rail to Coos Bay, Oregon, or Vancouver, Washington, for delivery to customers overseas. The molybdenum concentrate will be stored in tote bags and delivered to locations in the United States, either Arizona or Pennsylvania. An alternative to be examined in the PFS stage would be to build a rail spur from the railway at Wabuska.
Port costs consider the handling of the bulk material, assaying, and cost of the referee on the concentrate grade.
Shipping to smelter cost is based on current seaborne rates for delivery to various smelters in the Pacific Rim for the copper concentrate.
Table 21-9 shows a summary of all the operating cost categories on a cost per tonne mill feed basis over the total mill feed tonnage. Costs associated with those items directly attributable to the concentrate are reported in cost per tonne of concentrate.
Table 21-9: Total Operating Costs
Cost Category | Total ($M) | Cost per Tonne ($/t Mill Feed) | Cost per wmt Concentrate ($/t Concentrate) |
Open Pit Mining – Mill Feed and Waste | 3,625.0 | 4.13 | - |
Processing | 4,027.3 | 4.59 | - |
G&A | 254.8 | 0.29 | - |
Subtotal On-site Costs | 7,907.1 | 9.01 | - |
Concentrate Trucking | 521.8 | - | 60.02 |
Port Cost | 43.3 | - | 4.98 |
Shipping to Smelter/Roaster | 199.0 | - | 22.89 |
Subtotal Off-site Costs | 764.1 | - | 87.89 |
Total | 8,671.2 | - | - |
| | |
| 10/03/2017 |
Page 21 - 10
2017 Updated Preliminary Economic Assessment on the Ann Mason Project
Nevada, U.S.A.
| 21.2.2 | Open Pit Mining |
Mine operating costs were developed from base principles using vendor rates on equipment and current production rates from North American operations.
Key inputs into the mine operating cost estimate are fuel, electricity, and labour. The diesel fuel cost for this study was estimated at $0.80/L based on a local quotation and using a world price of $75/barrel. Electricity uses the current Nevada industrial rate of $0.064/kWh.
Labour costs for the various job classifications were estimated using InfoMine U.S.A. Inc. 2014 "Cost Mine" information from large scale mines currently in operation in Nevada. Burdens were calculated to average 40% for both salaried and hourly personnel, based on a review of current practices at Nevada operating mines. Mine shifts are using a 12-hour shift schedule.
Open pit mining uses proven technology and equipment. Rock drilling is accomplished with the use of 311 mm rotary blasthole drills. Material loading is primarily accomplished with electric cable shovels with dipper capacities of 58.3 m3. Supplementary loading capacity will be provided by large front-end loaders with 40.5 m3 buckets. Rock haulage is completed with a fleet of 360-tonne trucks. To assist in and around the primary crusher, a 14.5 m3 front-end loader will be used to keep the area clean and help with temporary stockpiles. The large equipment is required to maintain reasonable operating costs. Track dozers, graders, and rubber-tired dozers round out the major equipment list. Support equipment includes water trucks, small backhoes with rock hammers, utility loaders, pickup trucks, mechanics' and welders' trucks, pumps, and light plants.
Mine equipment requirements are highest in the early years with the initial removal of the volcanics overlying the deposit. This peak stripping period requires the full fleet from Year 1 to Year 10. This includes forty 360-tonne trucks, four cable shovels, and two large loaders. As the haulage distance increases (both in distance and lift), the strip ratio improves sufficiently that the capital replacement of trucks after 10 years does not require replacement of the full fleet.
The large loaders are brought in initially in Year -3 to prepare the working areas prior to the arrival of the larger and more efficient cable shovels. As the mine matures in its development after the peak, the loader responsibility will fall to 10% of the mill feed tonnage and 10% of the waste tonnage, although there are periods of higher utilization that will coincide with new phase establishment or the first 10 years of production.
| | |
| 10/03/2017 |
Page 21 - 11
2017 Updated Preliminary Economic Assessment on the Ann Mason Project
Nevada, U.S.A.
Table 21-10: Major Mine Equipment Requirements
Equipment | Unit | Capacity | Year -3 | Year -2 | Year -1 | Year 1 to 21 |
Production Drill | mm | 311 | 2 | 4 | 6 | 6–7 |
Front-End Loader | m3 | 40.5 | 2 | 2 | 2 | 1–2 |
Cable Shovel | m3 | 58.3 | - | 2 | 3 | 4 |
Breaker Loader | m3 | 14.5 | - | - | - | 1 |
Haulage Truck | t | 360 | 6 | 16 | 21 | 32–40 |
Tracked Dozer | kW | 433 | 4 | 4 | 4 | 4 |
Tracked Dozer | kW | 231 | 2 | 2 | 2 | 2 |
Grader | kW | 233 | 4 | 4 | 4 | 4 |
Rubber-Tired Dozer | kW | 350 | 2 | 2 | 2 | 2 |
The smaller front-end loader will be used at the primary crusher, tramming material from temporary piles to ensure the primary crusher/conveyor system is properly charged. They would also be used for general work around the crusher.
Mine engineering and general operating costs are included in the mine operating cost. This covers the mine operations department, both supervision and staff, and the mine engineering and geology costs.
The blasting drilling pattern size varies, depending on whether it is for mill feed or waste to assist the plant operations. The drill pattern parameters are shown in Table 21-11.
Table 21-11: Drill Pattern Specification
Specification | Unit | Mill Feed | Waste |
Bench Height | m | 15 | 15 |
Sub-Drill | m | 2.9 | 3.0 |
Blasthole Diameter | mm | 311 | 311 |
Pattern Spacing – Staggered | m | 11.3 | 11.5 |
Pattern Burden – Staggered | m | 9.8 | 10.0 |
Hole Depth | m | 17.9 | 18.0 |
The slightly wider pattern for waste material was designed to provide coarser rock for the waste management facility. The greater sub-drill was included to allow for caving of the holes in the weaker zones, avoiding re-drilling of the holes or short holes that would affect bench floor conditions, thereby increasing tire and overall maintenance costs.
Table 21-12 outlines the parameters used for estimating drill productivity.
| | |
| 10/03/2017 |
Page 21 - 12
2017 Updated Preliminary Economic Assessment on the Ann Mason Project
Nevada, U.S.A.
Table 21-12: Drill Productivity Criteria
Drill Activity | Unit | Mill Feed | Waste |
Pure Penetration Rate | m/min | 0.39 | 0.39 |
Hole Depth | m | 17.9 | 18.0 |
Drill Time | min | 45.9 | 46.15 |
Move, Spot, and Collar Blasthole | min | 3.00 | 3.00 |
Level Drill | min | 0.75 | 0.75 |
Add Steel | min | - | - |
Pull Drill Rods | min | 0.75 | 0.75 |
Total Setup/Breakdown Time | min | 4.50 | 4.50 |
Total Drill Time per Hole | min | 50.4 | 50.7 |
Drill Productivity | m/h | 21.3 | 21.3 |
A heavy ANFO product was considered in the costing of explosives. The powder factors used in the explosives calculation are shown in Table 21-13.
Table 21-13: Design Powder Factors
Unit | Mill Feed | Waste | |
Powder Factor | kg/m3 | 0.63 | 0.61 |
Powder Factor | kg/t | 0.24 | 0.23 |
Loading costs were estimated using the cable shovels as the primary material movers. The front-end loaders play a key role in the first couple of years in the pre-strip and preparation of the phases for the shovels. The first two shovels start production in Year -2, with the addition of a shovel each in both Year -1 and Year 1. The average loading percentages by loading unit are shown in Table 21-14.
The trucks present at the loading unit refers to the percentage of time that a truck is available to be loaded. To maximize truck productivity and reduce operating costs, it is more efficient to slightly under-truck the shovel. The single largest operating cost item is the haulage, and minimizing this cost by maximizing truck productivity is crucial to lower operating costs. The value of 80% comes from the standby time shovels typical encounter due to a lack of trucks.
| | |
| 10/03/2017 |
Page 21 - 13
2017 Updated Preliminary Economic Assessment on the Ann Mason Project
Nevada, U.S.A.
Table 21-14: Loading Parameters
Unit | Front-End Loader | Cable Shovel | |
Waste Tonnage Loaded | % | 10 | 90 |
Mill Feed Tonnage Mined | % | 30 | 70 |
Bucket Fill Factor | % | 90 | 95 |
Cycle Time | Sec | 40 | 30 |
Trucks Present at the Loading Unit | % | 80 | 80 |
Loading Time | min | 4.03 | 2.20 |
Haulage profiles were determined for each pit phase for the primary crusher or the waste rock management facility destinations. From these profiles, Caterpillar's FPC software (FPC) was used to determine haulage cycle times. These cycle times were applied to the appropriate yearly tonnage by destination and phase to estimate the haulage costs.
Support equipment costs were determined using a percentage applied to either the truck hours or the loading hours. As indicated earlier, these percentages resulted in the need for four large track dozers, four smaller track dozers, four graders, and two rubber-tired dozers. Their tasks include cleanup of the shovel face, roads, dumps, and blast patterns. The graders will maintain the plant feed and waste haul routes. In addition, three large water trucks have responsibility for patrolling the haul roads and controlling fugitive dust for safety and environmental reasons.
The equipment rates applied, less the operating labour costs, are shown in Table 21-15. All rates include consumables such as fuel, electricity, tires, drill steel, bits, and required maintenance parts. Maintenance parts are estimated from quotations of the local vendors. Fuel consumption is estimated from basic principles and, where possible, with the FPC software as a check. Operating labour is calculated separately.
Table 21-15: Major Equipment Hourly Operating Rates
Equipment | Hourly Rate ($/h) |
Production Drill | 319 |
Front-End Loader | 439 |
Cable Shovel | 535 |
Breaker Loader | 206 |
Haulage Truck | 356 |
Tracked Dozer – Large | 153 |
Grader | 84 |
Rubber-Tire Dozer | 107 |
| | |
| 10/03/2017 |
Page 21 - 14
2017 Updated Preliminary Economic Assessment on the Ann Mason Project
Nevada, U.S.A.
Leasing of the mining fleet was included in the operating cost estimate. If the fleet is leased, initial mine capital is reduced but the operating cost increases for the associated lease payments. The leasing terms were based on 20% down payment, 5-year term and interest assumed at 5.06% for the 2017 PEA. The entire major mine equipment was leased and the majority of the support equipment where it was considered reasonable. If the equipment had a life greater than the five year lease term, then the sixth year onwards of the lease does not have a lease payment applied. In the case of the mine trucks, with an approximate 10-year working life, the lease would be complete and the trucks would just incur operating costs after that time. For this reason, the operating cost would vary annually depending on the equipment replacement schedule and timing of the leases.
The mining cost is calculated by year to take into account changing haulage routes, and the resulting equipment requirements. Sampling costs were added to the mine operating cost. It was assumed that every blasthole was sampled to help identify mill feed boundaries. A cost of $40 per sample was applied.
The LOM average cost for the total material moved is shown in Table 21-16.
Table 21-16: Open Pit Mine Operating Costs
Open Pit Operating Category | LOM Cost ($/t Total Material) |
General Mine and Engineering | 0.08 |
Drilling | 0.09 |
Blasting | 0.17 |
Loading | 0.13 |
Hauling | 0.62 |
Support | 0.14 |
Leasing | 0.25 |
Sampling | 0.01 |
Total | 1.49 |
| | |
| 10/03/2017 |
Page 21 - 15
2017 Updated Preliminary Economic Assessment on the Ann Mason Project
Nevada, U.S.A.
| 21.2.3 | Process Plant Operating Cost |
Milling
The process plant operating cost is estimated at $186.9 M/a, or $4.34/t processed. The majority of costs are confined to three areas: power, reagents, and grinding media. A breakdown of these costs by area is provided in Table 21-17.
Details of the estimating methods used for each of the major cost areas are discussed below.
Labour
Labour costs were calculated using typical plant staffing levels. Pay scales were based on recent database rates. The plant schedule is assumed to be 12-hour shifts, with two shifts at site and two shifts on leave at all times. Table 21-18 shows the estimated labour breakdowns.
The mill is estimated to require a total complement of 148 persons at an annual cost of $10.5 million or $0.25/t.
Table 21-17: Operating Cost Estimate for the Ann Mason Processing Plant
Area | Cost | |
($/a) | ($/t) | |
Labour | ||
Plant Management | 1,080,000 | 0.03 |
Plant Operation | 5,605,000 | 0.13 |
Plant Maintenance | 2,760,000 | 0.06 |
Assay Lab | 1,104,000 | 0.03 |
Power | 48,598,000 | 1.12 |
Reagents | 32,200,000 | 0.75 |
Mill Balls | 47,073,000 | 1.09 |
Mill Liners | 21,781,000 | 0.50 |
Plant Maintenance Spares | 17,383,000 | 0.40 |
Electrical/Instrumentation | 3,600,000 | 0.08 |
Piping | 3,456,000 | 0.08 |
Shipping Supplies | 910,000 | 0.02 |
Lubricants | 777,000 | 0.01 |
Plant Assay Laboratory | 300,000 | 0.01 |
Safety Equipment | 250,000 | 0.01 |
Primary Crusher Conveyor | 1,440,000 | 0.04 |
Total | 188,317,000 | 4.34 |
| | |
| 10/03/2017 |
Page 21 - 16
2017 Updated Preliminary Economic Assessment on the Ann Mason Project
Nevada, U.S.A.
Table 21-18: Process Plant Labour Cost Summary
Area | No. of Persons | Shifts | Total Persons | Total Cost ($/a) |
Plant Management/Admin | ||||
Plant Manager/Supt. | 1 | 1 | 1 | 180,000 |
Met. Clerk | 1 | 2 | 2 | 119,840 |
Plant General Foreman | 1 | 1 | 1 | 108,900 |
Metallurgical Engineer | 1 | 2 | 1 | 141,000 |
Plant Metallurgist | 1 | 4 | 4 | 530,400 |
Plant Operation | ||||
Plant Foreman (Shift) | 2 | 4 | 8 | 720,000 |
Control Room Operators | 4 | 4 | 16 | 1,066,240 |
Plant Operators | 8 | 4 | 32 | 2,132,480 |
Reagent Operators | 2 | 4 | 8 | 533,120 |
Labourers | 5 | 4 | 20 | 1,153,600 |
Maintenance | ||||
Maintenance Lead | 1 | 4 | 4 | 336,000 |
Millwright | 2 | 4 | 8 | 600,320 |
Electrician | 2 | 4 | 8 | 600,320 |
Instrument/Control Tech | 2 | 2 | 4 | 300,160 |
Labourers | 4 | 4 | 16 | 922,880 |
Laboratory | ||||
Chief Chemist | 1 | 1 | 1 | 105,000 |
Chemist | 1 | 2 | 2 | 168,000 |
Analytical | 2 | 4 | 8 | 600,320 |
Samplers | 1 | 4 | 4 | 230,720 |
Total | 148 | 10,549,300 | ||
Mill Electricity
Electricity is the largest single operating cost, accounting for roughly 26% of the overall total. A summary of the total cost calculation is presented in Table 21-19.
| Table 21-19: | Process Plant Electricity Cost Estimate |
Item | Unit | Value |
Total Connected Power | kW | 115,800 |
Load Factor | % | 82.3 |
Estimated Power Consumed | kW | 95,276 |
Annual Running Time | h | 7,970 |
Annual Consumption | MWh | 759,347 |
Cost per MWh | $ | 64 |
Total | $ | 48,598,000 |
| | |
| 10/03/2017 |
Page 21 - 17
2017 Updated Preliminary Economic Assessment on the Ann Mason Project
Nevada, U.S.A.
The total connected power is taken from the mechanical equipment list, with load factors applied for each piece of equipment. A power supply rate of $64/MWh has been provided by the client. This equates to an annual operating cost of $1.12/t of mill feed treated.
Reagents
Reagent costs were estimated using unit costs from vendors and consumption rates from the lab testwork. A summary of the costs for each reagent is presented in Table 21-20. The total reagent cost amounts to $0.75/t of mill feed, or roughly 17% of the total operating cost for the plant.
Table 21-20: Summary of Estimated Reagent Operating Costs
Reagent Consumption | Cost | |
($/a) | ($/t) | |
Lime | 7,017,000 | 0.16 |
C-3330 (SIPX) | 1,750,000 | 0.04 |
MIBC | 6,048,000 | 0.14 |
CMC-7LT | 4,018,000 | 0.09 |
Fuel Oil | 1,562,000 | 0.04 |
NaSH | 3,421,000 | 0.08 |
Flocculant | 4,860,000 | 0.11 |
Liquid Nitrogen | 3,525,000 | 0.08 |
Subtotal | 32,200,000 | 0.75 |
Balls and Liners
Table 21-21 shows the cost of grinding balls and crusher/mill liners which were estimated using quoted supply rates and consumption estimates from similar projects.
Table 21-21: Grinding Media and Liner Operating Costs
Steel Consumption | Annual Cost ($) |
SAG Mill Balls | 17,107,000 |
Ball Mill Balls | 27,086,000 |
Regrind Mill Balls | 2,880,000 |
Primary Crusher Liners | 5,842,000 |
SAG Mill Liners | 9,751,000 |
Ball Mill Liners | 4,951,000 |
Regrind Mill Liners | 1,238,000 |
Total | 68,854,000 |
| | |
| 10/03/2017 |
Page 21 - 18
2017 Updated Preliminary Economic Assessment on the Ann Mason Project
Nevada, U.S.A.
Maintenance and Supplies
An allowance for plant maintenance was factored from the mechanical supply cost for each area. The cost includes transportation, but labour costs for replacement, installation, and maintenance are included in the labour allowance shown earlier in this section.
Similar amounts were factored from the overall mechanical supply cost to cover electrical/instrumentation maintenance and piping.
Fixed allowances were included to cover minor costs associated with lubricants, assay lab supplies, and safety equipment. Costs in this area include training, monitoring equipment, first aid supplies, and personal protective equipment. Shipping supplies covers the costs of drums for molybdenum concentrate shipment.
Conveyor
The conveyor will cover a length of 1,400 m from the primary crusher to the plant site. Costs to operate the conveyor include power ($1,095,000/a) and maintenance and wear parts ($345,000), including repair splices.
Tailings
The tailings management cost is independent of the process plant cost. The cost for the tailings covers the expected cost from the outlet at the plant to the TMF and the TMF's operations. The annual cost is expected to be $10.8 million, or $0.25/t. This will cover the cost of the cycloning of the tailings, water reclaim to the mill and maintenance of the tailings dam and subsequent raising of the dam as the mine progresses.
| 21.2.4 | General and Administrative |
G&A costs include the cost of the 16 staff and 37 hourly employees. Employees will be located in the immediate area, and no camp is planned or required.
The G&A cost in the cash flow starts in Year -3 at a slightly reduced rate during mine start-up, but reaches a maximum value of $10.9 M/a. The cost for G&A in Year 2 is $0.25/t mill feed, but the LOM average is $0.29/t mill feed, due to the G&A cost in the pre-strip period with no offsetting production (Table 21-22). As pre-production G&A costs were treated as an operating cost, they were not capitalized.
| | |
| 10/03/2017 |
Page 21 - 19
2017 Updated Preliminary Economic Assessment on the Ann Mason Project
Nevada, U.S.A.
Table 21-22: G&A Cost Calculation (Year 2)
Category | Annual Costs Year 2 ($) |
Salaried Staff | 2,030,000 |
Hourly Personnel | 3,282,000 |
Site Operations and Maintenance Supplies | 300,000 |
Site Power | 300,000 |
Information Systems (hardware/software) | 100,000 |
Communications | 85,000 |
Public/Community Relations | 100,000 |
Recruitment and Training | 250,000 |
Safety and Medical Supplies | 85,000 |
Consultants | 340,000 |
Legal and Audit Fees | 400,000 |
Taxes and Insurance | 1,600,000 |
Logistics | 490,000 |
Office Supplies | 220,000 |
Bussing for Workers | 400,000 |
Environmental Monitoring | 400,000 |
Subtotal | 10,382,000 |
Sustaining Site Capital @ 5% of Operating | 519,000 |
Total G&A | 10,901,000 |
Tonnage Milled (Year 2) | 43,200,000 |
G&A Costs ($/t) | 0.25 |
| 21.2.5 | Concentrate Transportation |
The copper concentrate is a bulk product. An average of 379,000 dmt of concentrate will be produced annually, the initial five years having an average production of 360,000 dmt. The first five years average 986 t/d of copper concentrate, with the LOM average at 1,038 t/d. It is a 310 km haul from the mine to the port facility at Stockton, California. The cost to transport the concentrate to the port is estimated at $60/t. The port at Stockton is a bulk facility and can accommodate the concentrate, plus it reduces the losses from transferring the material from trucks to rail cars.
Other options include hauling the concentrate by truck to the rail siding near Reno, Nevada, and then railing it to either Coos Bay, Oregon, or Vancouver, Washington. These remain viable options for the concentrate as well.
| | |
| 10/03/2017 |
Page 21 - 20
2017 Updated Preliminary Economic Assessment on the Ann Mason Project
Nevada, U.S.A.
A third potential, although not considered in this study, is to extend the rail line to Yerington to reduce the truck haulage. This may work well in conjunction with Nevada Copper's Pumpkin Hollow project.
The copper concentrate will have on average a copper grade of 30% and have a moisture percentage of 8%.
The quantity of molybdenum concentrate will be significantly less than that of the copper concentrate, with a LOM average annual production of 1,829 tonnes. The molybdenum concentrate will be stored in 1-tonne super sacks, and different existing shipping possibilities include hauling it to Freeport's roaster in Green Valley, Arizona, or to Pennsylvania for roasting at the Thompson Creek facility.
The molybdenum grade is estimated at 55% with a 4% concentrate moisture.
| 21.2.6 | Port Charges |
The port charge has been estimated at $5/t of concentrate.
| 21.2.7 | Shipping |
The copper concentrate is expected to be shipped overseas to countries in the Pacific Rim. Current shipping rates are in the $23/tonne range for 10,000 wmt units. This has been applied to the study.
| 21.2.8 | Mine Labour Force |
Labour force requirements for the Ann Mason Project vary from year to year by department, depending on the level of waste stripping. The detail on the labour force has been discussed in the appropriate sections, but a summary is presented graphically in Figure 21‑1.
| | |
| 10/03/2017 |
Page 21 - 21
2017 Updated Preliminary Economic Assessment on the Ann Mason Project
Nevada, U.S.A.
Figure 21‑1: Annual Labour Force Levels

| | |
| 10/03/2017 |
Page 21 - 22
2017 Updated Preliminary Economic Assessment on the Ann Mason Project
Nevada, U.S.A.
| 22 | Economic Analysis |
| 22.1 | Discounted Cash Flow Analysis |
This 2017 PEA is preliminary in nature, and it includes Inferred Mineral Resources that are considered too speculative geologically to have the economic considerations applied to them that would enable them to be categorized as Mineral Reserves. There is no certainty that the 2017 PEA will be realized. Mineral Resources that are not Mineral Reserves do not have demonstrated economic viability.
The results of the economic analysis constitute forward-looking statements within the meaning of the United States Private Securities Litigation Reform Act of 1995 and forward-looking information within the meaning of applicable Canadian securities laws. While these forward-looking statements are based on expectations about future events as at the effective date of this Report, the statements are not a guarantee of the Company's future performance and are subject to risks, uncertainties, assumptions and other factors which could cause actual results to differ materially from future results expressed or implied by such forward-looking statements. Such risks, uncertainties, factors and assumptions include, amongst others but not limited to metal prices, mineral resources, smelter terms, labour rates, consumable costs and equipment pricing. There can be no assurance that forward-looking statements will prove to be accurate, as actual results and future events could differ materially from those anticipated in such statements.
The tonnes and grades reported in Section 16 for the open pit phases were used in the discounted cash flow (DCF) analysis. The breakdown of Measured, Indicated, and Inferred material utilized in the analysis is shown in Table 22-1 for the benefit of the reader to highlight the percentage of material currently in the various categories.
Table 22-1: Mill Feed Classification Percentages
Phase | Measured (%) | Indicated (%) | Inferred (%) |
1 | 94.9 | 4.9 | 0.2 |
2 | 73.4 | 24.0 | 2.6 |
3 | 40.5 | 52.7 | 6.8 |
4 | 40.6 | 55.9 | 3.5 |
5 | 23.9 | 66.7 | 9.4 |
Total | 43.9 | 51.3 | 4.9 |
| | |
| 10/03/2017 |
Page 22 - 1
2017 Updated Preliminary Economic Assessment on the Ann Mason Project
Nevada, U.S.A.
As shown above, 95.1% of the material in the DCF is currently in the Measured and Indicated categories with the earlier phases having a higher percentage of Measured material. The tonnes, grade and classification by phase has been shown in Table 22-2.
All prices are quoted in 2Q 2015 United States dollars unless otherwise noted. The prices used have been verified against current 1Q 2017 prices and found to be similar and are not considered to be of significant impact. No price changes were required for this update.
A decision to use 120,000 t/d as the production rate with a five-phase sequence was determined earlier in the study. This provided a reasonable NPV while maintaining LOM capital below $2 billion. The waste management facility and other infrastructure have been designed to allow further expansion of the mine design to include Phases 6 and 7 should it be decided in the future to include them without incurring rehandling costs.
| | |
| 10/03/2017 |
Page 22 - 2
2017 Updated Preliminary Economic Assessment on the Ann Mason Project
Nevada, U.S.A.
Table 22-2: DCF Tonnes and Grade by Phase and Category
Phase | Mill Feed (Mt) | Cu (%) | Mo (%) | Au (g/t) | Ag (g/t) | Mill Feed (Mt) | Cu (%) | Mo (%) | Au (g/t) | Ag (g/t) | Mill Feed (Mt) | Cu (%) | Mo (%) | Au (g/t) | Ag (g/t) | Mill Feed (Mt) | Cu (%) | Mo (%) | Au (g/t) | Ag (g/t) | Waste (Mt) | Strip Ratio |
Measured | Indicated | Measured + Indicated | Inferred | |||||||||||||||||||
1 | 53.5 | 0.29 | 0.004 | 0.01 | 0.35 | 2.7 | 0.21 | 0.002 | 0.01 | 0.27 | 56.2 | 0.29 | 0.004 | 0.01 | 0.35 | 0.1 | 0.17 | - | - | 0.01 | 141.8 | 2.52 |
2 | 76.7 | 0.31 | 0.006 | 0.20 | 0.50 | 25.1 | 0.27 | 0.003 | 0.02 | 0.33 | 101.7 | 0.30 | 0.006 | 0.02 | 0.46 | 2.7 | 0.21 | 0.002 | 0.01 | 0.14 | 233.3 | 2.23 |
3 | 71.9 | 0.34 | 0.005 | 0.03 | 0.68 | 93.6 | 0.32 | 0.003 | 0.03 | 0.62 | 165.5 | 0.33 | 0.004 | 0.03 | 0.64 | 12.1 | 0.27 | 0.004 | 0.02 | 0.45 | 328.5 | 1.85 |
4 | 121.9 | 0.31 | 0.005 | 0.02 | 0.56 | 168.1 | 0.29 | 0.004 | 0.03 | 0.59 | 290.0 | 0.30 | 0.004 | 0.03 | 0.58 | 10.5 | 0.25 | 0.005 | 0.03 | 0.62 | 513.0 | 1.71 |
5 | 63.7 | 0.29 | 0.007 | 0.03 | 0.68 | 177.8 | 0.26 | 0.005 | 0.03 | 0.66 | 241.5 | 0.27 | 0.006 | 0.03 | 0.67 | 25.0 | 0.25 | 0.006 | 0.03 | 0.61 | 520.8 | 1.95 |
Total | 387.6 | 0.31 | 0.005 | 0.02 | 0.56 | 467.3 | 0.28 | 0.004 | 0.03 | 0.61 | 854.9 | 0.29 | 0.005 | 0.03 | 0.59 | 50.4 | 0.25 | 0.005 | 0.03 | 0.55 | 1,737.4 | 1.92 |
43.9% | 51.3% | 95.1% | 4.9% | |||||||||||||||||||
| Note: | A total of 24 Mt of stockpile material was not processed at the end of the mine life due to economic considerations. |
| | |
| 10/03/2017 |
Page 22 - 3
2017 Updated Preliminary Economic Assessment on the Ann Mason Project
Nevada, U.S.A.
All mine development work was completed using what is termed as engineering base case metal prices as described in Section 16. The DCF analysis was completed using different metal prices with low, base, and high price cases examined. The case metal prices have been highlighted in Table 22-3.
Table 22-3: Metal Prices by Scenario
Metal | Unit | Low Case | Base Case | High Case |
Copper | $/lb | 2.75 | 3.00 | 3.25 |
Molybdenum | $/lb | 9.00 | 11.00 | 13.00 |
Silver | $/oz | 15.00 | 20.00 | 25.00 |
Gold | $/oz | 1,100.00 | 1,200.00 | 1,300.00 |
The Base Case is the scenario chosen by AGP and Entrée, with the other scenarios showing price sensitivities. The results of the DCF analysis are shown in Table 22-4. The detailed cash flow sheet has been included in Section 22.3.
The results for the Base Case indicate the potential for a pre-tax NPV at a 7.5% discount rate of $1,158 million with an internal rate of return (IRR) of 15.8%. The payback period is 6.4 years, with payback occurring in the seventh year of production. The post-tax NPV at a 7.5% discount rate is $770 million with an internal IRR of 13.7%. The post-tax payback is 6.9 years.
Potential revenue from each of the metals produced, using Base Case pricing, has copper as the dominant value from the Project at $14.2 billion or 92.6% of the total revenue. This is followed by gold at $509 million for 3.3% of the revenue, molybdenum at $453 million for 3.0% of the revenue and silver at $168 million (1.1%).
For the calculation of the metal revenue, the metal terms, as shown in Table 22-5, were applied for smelting, roasting, and refining. Various production estimates pertaining to the metals produced have been tabulated in Table 22-6. This includes cash costs anticipated for copper and molybdenum.
| | |
| 10/03/2017 |
Page 22 - 4
2017 Updated Preliminary Economic Assessment on the Ann Mason Project
Nevada, U.S.A.
Table 22-4: Cash Flow Results
Cost Category | Unit | Low Case | Base Case | High Case |
Operating Costs | ||||
Open Pit Mining | (M$) | 3,625.0 | 3,625.0 | 3,625.0 |
Processing | (M$) | 4,027.3 | 4,027.3 | 4,027.3 |
G&A | (M$) | 254.8 | 254.8 | 254.8 |
Concentrate Trucking | (M$) | 521.8 | 521.8 | 521.8 |
Port Costs | (M$) | 43.3 | 43.3 | 43.3 |
Shipping to Smelter | (M$) | 199.0 | 199.0 | 199.0 |
Subtotal Operating Costs | (M$) | 8,671.2 | 8,671.2 | 8,671.2 |
Capital Costs | ||||
Open Pit Mining | (M$) | 539.3 | 539.3 | 539.3 |
Processing | (M$) | 456.7 | 456.7 | 456.7 |
Infrastructure | (M$) | 205.1 | 205.1 | 205.1 |
Environmental Costs | (M$) | 70.6 | 70.6 | 70.6 |
Indirect | (M$) | 164.3 | 164.3 | 164.3 |
Contingency | (M$) | 106.0 | 106.0 | 106.0 |
Subtotal Capital Costs | (M$) | 1,542.0 | 1,542.0 | 1,542.0 |
Revenue (after smelting, refining, roasting, payables) | (M$) | 13,840.2 | 15,285.5 | 16,730.7 |
Royalties (0.4%) | (M$) | 52.3 | 58.1 | 63.9 |
Net Revenue( less Royalties) | (M$) | 13,787.9 | 15,227.4 | 16,666.9 |
Pre-Tax Net Cash Flow (Revenue-Operating-Capital) | (M$) | 3,574.7 | 5,014.2 | 6,453.7 |
Total Tax | (M$) | 844.8 | 1,241.4 | 1,659.1 |
Post-Tax Net Cash Flow | (M$) | 2,730.0 | 3,772.8 | 4,794.6 |
Net Present Value (Pre-Tax) | ||||
NPV @ 5% | (M$) | 1,184 | 1,937 | 2,690 |
NPV @ 7.5% | (M$) | 591 | 1,158 | 1,724 |
NPV @ 10% | (M$) | 205 | 641 | 1,078 |
IRR | (%) | 11.9 | 15.8 | 19.4 |
Payback Period | Years (Year paid) | 8.3 (Yr 9) | 6.4 (Yr 7) | 5.2 (Yr 6) |
Net Present Value (Post-Tax) | ||||
NPV @ 5% | (M$) | 815 | 1,379 | 1,928 |
NPV @ 7.5% | (M$) | 339 | 770 | 1,189 |
NPV @ 10% | (M$) | 30 | 366 | 694 |
IRR | (%) | 10.3 | 13.7 | 16.8 |
Payback Period | Years (Year paid) | 8.7 (Yr 9) | 6.9 (Yr 7) | 5.7 (Yr 6) |
Table 22-5: Smelting and Refining Terms Applied
Term | Unit | Copper | Molybdenum | Silver | Gold |
Cu Minimum Deduction | (%) | 1 | - | - | - |
Base Smelting Charge | ($/dmt) | 80 | - | - | - |
Cu Refining Charge | ($/lb payable) | 0.08 | - | - | - |
Mo Payable | (%) | - | 99 | - | - |
Mo Roasting Charge | ($/lb payable) | - | 1.15 | - | - |
Payable Silver and Gold | (%) | - | - | 97 | 97 |
Refining Charge | ($/oz) | - | - | 1 | 10 |
Concentrate Grade | (%) | 30 | 55 | - | - |
Concentrate Moisture | (%) | 8 | 4 | - | - |
| | |
| 10/03/2017 |
Page 22 - 5
2017 Updated Preliminary Economic Assessment on the Ann Mason Project
Nevada, U.S.A.
Table 22-6: Metal Production Statistics, Cash Cost Calculations and Key Economic Parameters
Cost Category | Unit | Value | |
Mill Feed | |||
Rate | t/d | 120,000 | |
Grade | Cu% | 0.30 | |
Total Operating Cost | ($/t mill feed) | 9.92 | |
Mine Life | (years) | 21 | |
Initial Capital Costs (Year -3, Year -2, Year -1) | (M$) | 1,177.7 | |
Year 1 Capital Costs | (M$) | 173.4 | |
Sustaining Capital Cost | (M$) | 191.0 | |
Total Mine Capital | (M$) | 1,542.0 | |
Payable Copper | |||
Initial 5 Years Average Annual Production | (Mlb) | 229 | |
Average Annual Production – LOM | (Mlb) | 241 | |
Total LOM Production | (Mlb) | 5,065 | |
Payable Molybdenum | |||
Initial 5 Years Average Annual Production | (Mlb) | 2.2 | |
Average Annual Production – LOM | (Mlb) | 2.2 | |
Total LOM Production | (Mlb) | 46.0 | |
Recovered Precious Metals | Gold | Silver | |
Initial 5 years Average Annual Production | (oz) | 13,500 | 302,200 |
Average Annual Production - LOM | (oz) | 21,000 | 434,400 |
Total LOM Production | (oz) | 441,300 | 9,122,800 |
Copper Concentrate | |||
Initial 5 Years Average Annual Production | (dmt) | 360,000 | |
Average Annual Production – LOM | (dmt) | 379,100 | |
Total LOM Production | (dmt) | 7,961,600 | |
Molybdenum Concentrate | |||
Initial 5 Years Average Annual Production | (dmt) | 1,900 | |
Average Annual Production – LOM | (dmt) | 1,800 | |
Total LOM Production | (dmt) | 38,400 | |
Cash Costs – Year 1 to Year 5 | Pre-tax | Post-tax | |
Copper Cash Cost without Credits (Mo, Au, Ag) | ($/lb) | 2.08 | 2.13 |
Copper Cash Cost with Credits (Mo, Au, Ag) | ($/lb) | 1.89 | 1.94 |
All In Sustaining Cost (AISC) without Credits (Mo, Au, Ag) | ($/lb) | 2.28 | 2.32 |
All In Sustaining Cost (AISC) with Credits (Mo, Au, Ag) | ($/lb) | 2.09 | 2.13 |
Cash Costs – Year 1 to Year 21 | Pre-tax | Post-tax | |
Copper Cash Cost without Credits (Mo, Au, Ag) | ($/lb) | 1.72 | 1.96 |
Copper Cash Cost with Credits (Mo, Au, Ag) | ($/lb) | 1.49 | 1.74 |
All In Sustaining Cost (AISC) without Credits (Mo, Au, Ag) | ($/lb) | 1.78 | 2.03 |
All In Sustaining Cost (AISC) with Credits (Mo, Au, Ag) | ($/lb) | 1.56 | 1.81 |
Cash Costs – LOM (includes reclamation costs) | Pre-tax | Post-tax | |
Copper Cash Cost without Credits (Mo, Au, Ag) | ($/lb) | 1.72 | 1.96 |
Copper Cash Cost with Credits (Mo, Au, Ag) | ($/lb) | 1.49 | 1.74 |
All In Sustaining Cost (AISC) without Credits (Mo, Au, Ag) | ($/lb) | 1.79 | 2.04 |
All In Sustaining Cost (AISC) with Credits (Mo, Au, Ag) | ($/lb) | 1.57 | 1.81 |
Net Annual Cash Flow | Pre-tax | Post-tax | |
Year 1 to Year 5 | (M$) | 161.6 | 151.3 |
Year 1 to Year 21 | (M$) | 297.9 | 238.4 |
| | |
| 10/03/2017 |
Page 22 - 6
2017 Updated Preliminary Economic Assessment on the Ann Mason Project
Nevada, U.S.A.
Note Regarding Non-U.S. GAAP Performance Measurement: "Cash Costs" and all-in sustaining cost (AISC) are non-U.S. GAAP Performance Measurements. These performance measurements are included because these statistics are widely accepted as the standard of reporting cash costs of production in North America. These performance measurements do not have a meaning within U.S. GAAP and, therefore, amounts presented may not be comparable to similar data presented by other mining companies. These performance measurements should not be considered in isolation as a substitute for measures of performance in accordance with U.S. GAAP.
| 22.2 | Sensitivity Analysis |
The Project sensitivity to various inputs was examined on the Base Case. The items that were varied were recovery, metal prices, capital cost, and operating cost.
The results of the analysis are shown in two spider diagrams, Figure 22‑1 and Figure 22‑2.
The greatest sensitivity in the Project is metal prices. The Base Case uses a $3.00/lb Cu price. A 10% reduction in copper price to $2.70/lb brings the NPV of the Project to $279 million. A 10% increase in the copper price to $3.30/lb yields an NPV of $1,245 million. The -20% sensitivity on metal prices is roughly equivalent to a copper price of $2.40/lb.
The second most sensitive parameter is recovery. To calculate the sensitivity to recovery, a percentage factor was applied to each metal recovery in the same proportion. Therefore, while sensitivity exists, actual practice may show less fluctuation than is considered in this analysis. Recovery testwork has not indicated recoveries in the range of 74% which the -20% change in recovery would represent. As copper represents 92.6% of the revenue, this large a swing in recovery has the obvious effect of influencing the Project, but may not be realistic.
The operating cost is the next most sensitive item. With the mine being a bulk mining operation, focus on this cost is instrumental to maintaining attractive Project economics. Any opportunity to shorten waste hauls would have a positive impact on the Project economics.
The least most sensitive item is capital cost. While changes in the cost have an effect, in comparison to the other three parameters, its effect is more muted. If the capital costs go up by 20%, the post-tax NPV drops to $508 million from the Base Case of $770 million.
| | |
| 10/03/2017 |
Page 22 - 7
2017 Updated Preliminary Economic Assessment on the Ann Mason Project
Nevada, U.S.A.
Figure 22‑1: Spider Graph of Sensitivity of NPV at 7.5% (Post-Tax)

Figure 22‑2: Spider Graph of IRR Sensitivity (Post-Tax)

| | |
| 10/03/2017 |
Page 22 - 8
2017 Updated Preliminary Economic Assessment on the Ann Mason Project
Nevada, U.S.A.
| 22.3 | Detailed Cash Flow |
The Base Case cash flow has been included in Table 22-7 and Table 22-8. This includes the mine schedule, concentrate calculations, operating and capital costs, revenue estimates, and cumulative cash flow on which the NPV and IRR have been determined on both a pre-tax and post-tax basis.
| 22.4 | Taxes and Royalties |
Federal and Nevada State taxes have been considered applying, among other matters, the appropriate depreciation and depletion calculations.
Taxable income for income tax purposes is as defined in the Internal Revenue Code and regulations issued by the Department of Treasury and the Internal Revenue Service. The Federal income tax rate is approximately 35% in accordance with Internal Revenue Service Publication 542.
Nevada does not have a State corporate income tax.
Nevada has a Net Proceeds of Mining Tax, which is an ad valorem property tax assessed on minerals mined or produced in Nevada when they are sold or removed from the State. The tax is separate from, and in addition to, any property tax paid on land, equipment and other assets. In general, while the tax rate applied to the net proceeds is based on a sliding scale depending on the net proceeds as a percentage of gross proceeds, the effective rate is 5%.
A royalty equal to 0.4% of NSR has been applied to all of the metals. The 0.4% NSR royalty was granted to Sandstorm Gold Ltd. in 2013.
| | |
| 10/03/2017 |
Page 22 - 9
2017 Updated Preliminary Economic Assessment on the Ann Mason Project
Nevada, U.S.A.
| Table 22-7: Detailed Cash Flow (Year -3 to Year 7) | ||||||||||||
| Total | Year -3 | Year -2 | Year -1 | Year 1 | Year 2 | Year 3 | Year 4 | Year 5 | Year 6 | Year 7 | ||
| Mill Feed - Measured | tonnes | 385,008,577 | - | - | - | 27,470,408 | 34,863,290 | 31,965,853 | 29,400,012 | 17,756,860 | 14,720,486 | 14,790,029 |
| Copper | % | 0.309 | - | - | - | 0.29 | 0.27 | 0.27 | 0.34 | 0.35 | 0.27 | 0.30 |
| Moly | % | 0.005 | - | - | - | 0.00 | 0.01 | 0.00 | 0.01 | 0.01 | 0.00 | 0.00 |
| Gold | g/t | 0.024 | - | - | - | 0.01 | 0.01 | 0.02 | 0.03 | 0.03 | 0.02 | 0.03 |
| Silver | g/t | 0.559 | - | - | - | 0.33 | 0.34 | 0.44 | 0.58 | 0.55 | 0.48 | 0.55 |
| Mill Feed - Indicated | tonnes | 449,809,395 | - | - | - | 3,058,975 | 7,886,001 | 10,712,444 | 11,829,371 | 20,489,723 | 24,553,871 | 26,436,646 |
| Copper | % | 0.287 | - | - | - | 0.231 | 0.257 | 0.261 | 0.252 | 0.275 | 0.294 | 0.296 |
| Moly | % | 0.004 | - | - | - | 0.002 | 0.003 | 0.003 | 0.005 | 0.004 | 0.003 | 0.005 |
| Gold | g/t | 0.030 | - | - | - | 0.008 | 0.012 | 0.015 | 0.017 | 0.023 | 0.026 | 0.032 |
| Silver | g/t | 0.613 | - | - | - | 0.232 | 0.279 | 0.309 | 0.391 | 0.474 | 0.546 | 0.611 |
| Mill Feed - Inferred | tonnes | 42,583,839 | - | - | - | 1,870,617 | 450,709 | 521,703 | 1,970,617 | 4,953,417 | 3,925,643 | 1,973,325 |
| Copper | % | 0.267 | - | - | - | 0.213 | 0.227 | 0.213 | 0.237 | 0.247 | 0.317 | 0.265 |
| Moly | % | 0.005 | - | - | - | 0.001 | 0.006 | 0.000 | 0.004 | 0.004 | 0.003 | 0.007 |
| Gold | g/t | 0.028 | - | - | - | 0.004 | 0.015 | 0.004 | 0.015 | 0.022 | 0.023 | 0.028 |
| Silver | g/t | 0.575 | - | - | - | 0.103 | 0.311 | 0.084 | 0.336 | 0.423 | 0.487 | 0.575 |
| Moly Concentrate | ||||||||||||
| Total Moly Concentrate | wet tonnes | 40,015 | - | - | - | 1,023 | 2,219 | 1,736 | 2,401 | 2,328 | 1,364 | 1,727 |
| Delivered to Roaster (less losses) | dry tonnes | 38,337 | - | - | 980 | 2,126 | 1,663 | 2,300 | 2,231 | 1,307 | 1,654 | |
| Payable Pounds of Moly | pounds | 46,020,409 | - | - | 1,176,844 | 2,551,732 | 1,996,572 | 2,761,186 | 2,677,808 | 1,568,704 | 1,985,990 | |
| Copper Concentrate | ||||||||||||
| Total Copper Concentrate | wet tonnes | 8,653,898 | - | - | - | 299,043 | 388,841 | 380,490 | 451,959 | 436,160 | 413,177 | 426,587 |
| Concentrate Delivered to Smelter (less losses) | dry tonnes | 7,921,778 | - | - | 273,744 | 355,945 | 348,301 | 413,723 | 399,261 | 378,222 | 390,498 | |
| Payable Pounds of Copper | pounds | 5,064,662,176 | - | - | 175,013,543 | 227,567,631 | 222,680,593 | 264,507,232 | 255,260,932 | 241,810,315 | 249,658,555 | |
| Silver Ounces | ounces | 9,122,772 | - | - | - | 176,652 | 251,407 | 306,668 | 393,482 | 382,716 | 396,286 | 450,718 |
| Gold Ounces | ounces | 441,295 | - | - | - | 5,727 | 10,204 | 14,114 | 18,239 | 19,200 | 19,689 | 23,748 |
| Mine Production - Open Pit | ||||||||||||
| Feed to Mill | tonnes | 853,028,569 | - | - | - | 22,835,284 | 41,884,527 | 39,667,235 | 43,200,000 | 42,409,716 | 43,200,000 | 43,200,000 |
| Feed to Stockpile | tonnes | 48,429,888 | - | 54,914 | 9,319,437 | 6,209,579 | - | - | 946,856 | - | 1,807,290 | 1,138,794 |
| Stockpile to Mill | tonnes | 24,373,242 | - | - | - | 9,564,716 | 1,315,473 | 3,532,765 | - | 790,284 | - | - |
| Waste | tonnes | 1,737,356,302 | 26,233,625 | 88,242,683 | 124,521,361 | 130,429,689 | 122,012,500 | 124,200,672 | 119,623,754 | 121,402,512 | 118,703,191 | 119,537,597 |
| Total Material | tonnes | 2,663,188,001 | 26,233,625 | 88,297,597 | 133,840,798 | 169,039,268 | 165,212,500 | 167,400,671 | 163,770,610 | 164,602,512 | 163,710,481 | 163,876,391 |
| Strip Ratio | 1.98 | - | - | - | 4.03 | 2.82 | 2.88 | 2.77 | 2.81 | 2.75 | 2.77 | |
| Operating Cost | Capitalized Prestrip | |||||||||||
| Open Pit Mining | dollars | 3,625,047,339 | 237,300,800 | 250,408,269 | 255,300,022 | 247,317,922 | 210,134,903 | 203,040,218 | 204,681,186 | |||
| Processing | dollars | 4,027,274,313 | 0 | 0 | 0 | 148,716,000 | 198,288,002 | 198,287,998 | 198,288,000 | 198,288,000 | 198,288,000 | 198,288,000 |
| G&A | dollars | 254,752,000 | 4,029,000 | 10,901,000 | 10,901,000 | 10,901,000 | 10,901,000 | 10,901,000 | 10,901,000 | 10,901,000 | 10,901,000 | 10,901,000 |
| Concentrate Trucking | dollars | 521,834,846 | 0 | 0 | 0 | 18,009,064 | 23,474,663 | 22,942,263 | 27,273,583 | 26,320,932 | 24,879,278 | 25,707,471 |
| Port Costs | dollars | 43,269,490 | 0 | 0 | 0 | 1,495,213 | 1,944,204 | 1,902,452 | 2,259,794 | 2,180,799 | 2,065,885 | 2,132,936 |
| Shipping to Smelter | dollars | 199,039,655 | 0 | 0 | 0 | 6,877,978 | 8,943,337 | 8,751,278 | 10,395,052 | 10,031,676 | 9,503,070 | 9,811,504 |
| Subtotal Operating | dollars | 8,671,217,642 | 4,029,000 | 10,901,000 | 10,901,000 | 423,300,055 | 493,959,475 | 498,085,013 | 496,435,351 | 457,857,309 | 448,677,451 | 451,522,097 |
| Capital Cost | Capitalized Prestrip | |||||||||||
| Open Pit Mining | dollars | 539,293,584 | 65,849,661 | 164,902,141 | 206,464,437 | 13,371,340 | 11,776,112 | 3,143,353 | 6,455,037 | 7,910,929 | 1,140,780 | 1,348,100 |
| Processing | dollars | 456,722,000 | 0 | 135,660,000 | 226,100,000 | 90,440,000 | 0 | 0 | 452,200 | 0 | 452,200 | 0 |
| Infrastructure | dollars | 205,111,600 | 40,020,000 | 72,080,000 | 52,260,000 | 16,300,000 | 16,300,000 | 0 | 0 | 1,640,000 | 0 | 2,150,000 |
| Environment Costs | dollars | 70,550,000 | 251,073 | 472,341 | 557,524 | 801,268 | 963,568 | 1,057,850 | 1,120,605 | 1,225,412 | 1,332,333 | 1,377,826 |
| Indirect | dollars | 164,309,778 | 17,327,810 | 57,012,095 | 60,706,412 | 27,654,462 | 0 | 0 | 0 | 0 | 0 | 0 |
| Contingency | dollars | 106,009,448 | 6,521,710 | 33,742,646 | 37,742,880 | 24,784,213 | 0 | 0 | 0 | 0 | 0 | 0 |
| Subtotal Capital | dollars | 1,541,996,410 | 129,970,253 | 463,869,223 | 583,831,252 | 173,351,283 | 29,039,680 | 4,201,202 | 8,027,842 | 10,776,340 | 2,925,313 | 4,875,926 |
| Revenue (after smelter & refining + losses) | ||||||||||||
| Moly | dollars | 453,301,029 | - | - | 11,591,914 | 25,134,559 | 19,666,232 | 27,197,683 | 26,376,411 | 15,451,739 | 19,561,998 | |
| Copper | dollars | 14,155,071,294 | - | - | 489,140,063 | 636,021,896 | 622,363,260 | 739,263,271 | 713,421,066 | 675,828,345 | 697,763,151 | |
| Silver | dollars | 167,859,003 | - | - | 3,250,405 | 4,625,896 | 5,642,697 | 7,240,076 | 7,041,967 | 7,291,654 | 8,293,217 | |
| Gold | dollars | 509,254,491 | - | - | 6,608,631 | 11,775,228 | 16,287,995 | 21,048,074 | 22,156,505 | 22,721,376 | 27,404,673 | |
| Subtotal | 15,285,485,817 | - | - | - | 510,591,013 | 677,557,579 | 663,960,184 | 794,749,104 | 768,995,950 | 721,293,113 | 753,023,040 | |
| less Royalty | dollars | 58,085,367 | - | - | - | 1,936,835 | 2,572,781 | 2,521,457 | 3,019,283 | 2,921,850 | 2,739,380 | 2,861,485 |
| Net Revenue | dollars | 15,227,400,450 | 0 | 0 | 0 | 508,654,178 | 674,984,798 | 661,438,728 | 791,729,821 | 766,074,100 | 718,553,733 | 750,161,556 |
| Pre-Tax Cashflow | ||||||||||||
| Operating Cost | dollars | 8,667,186,000 | 4,029,000 | 10,901,000 | 10,901,000 | 423,300,000 | 493,959,000 | 498,085,000 | 496,435,000 | 457,857,000 | 448,677,000 | 451,522,000 |
| Capital Cost | dollars | 1,412,023,000 | 129,970,000 | 463,869,000 | 583,831,000 | 173,351,000 | 29,040,000 | 4,201,000 | 8,028,000 | 10,776,000 | 2,925,000 | 4,876,000 |
| Revenue | dollars | 15,227,403,000 | 0 | 0 | 0 | 508,654,000 | 674,985,000 | 661,439,000 | 791,730,000 | 766,074,000 | 718,554,000 | 750,162,000 |
| Pre-Tax Cashflow | dollars | 5,014,195,000 | -133,999,000 | -474,770,000 | -594,732,000 | -87,997,000 | 151,986,000 | 159,153,000 | 287,267,000 | 297,441,000 | 266,952,000 | 293,764,000 |
| Pre-Tax Cumulative | dollars | -133,999,000 | -608,769,000 | -1,203,501,000 | -1,291,498,000 | -1,139,512,000 | -980,359,000 | -693,092,000 | -395,651,000 | -128,699,000 | 165,065,000 | |
| Post-Tax Cashflow | ||||||||||||
| Nevada Taxes | dollars | 268,311,310 | - | - | - | - | 2,372,100 | 2,713,095 | 9,612,282 | 10,563,371 | 9,501,202 | 12,051,502 |
| Federal Taxes | dollars | 973,090,692 | - | - | - | - | 829,909 | 954,346 | 3,452,361 | 20,681,027 | 34,151,828 | 43,396,034 |
| Total Tax | dollars | 1,241,402,001 | - | - | - | - | 3,202,008 | 3,667,441 | 13,064,643 | 31,244,398 | 43,653,030 | 55,447,536 |
| Post-Tax Cashflow | dollars | 3,772,792,999 | -133,999,000 | -474,770,000 | -594,732,000 | -87,997,000 | 148,783,992 | 155,485,559 | 274,202,357 | 266,196,602 | 223,298,970 | 238,316,464 |
| Post-Tax Cumulative | dollars | -133,999,000 | -608,769,000 | -1,203,501,000 | -1,291,498,000 | -1,142,714,008 | -987,228,449 | -713,026,092 | -446,829,491 | -223,530,520 | 14,785,944 | |
| | |
| 10/03/2017 |
Page 22 - 10
2017 Updated Preliminary Economic Assessment on the Ann Mason Project
Nevada, U.S.A.
| Table 22-8: Detailed Cash Flow (Year 8 to Year 17) | ||||||||||||
| Total | Year 8 | Year 9 | Year 10 | Year 11 | Year 12 | Year 13 | Year 14 | Year 15 | Year 16 | Year 17 | ||
| Mill Feed - Measured | tonnes | 385,008,577 | 17,716,421 | 20,355,906 | 20,969,053 | 15,968,997 | 14,356,746 | 14,593,757 | 13,136,215 | 15,132,018 | 16,361,310 | 13,110,485 |
| Copper | % | 0.309 | 0.28 | 0.35 | 0.35 | 0.31 | 0.32 | 0.31 | 0.32 | 0.34 | 0.32 | 0.31 |
| Moly | % | 0.005 | 0.00 | 0.00 | 0.01 | 0.00 | 0.00 | 0.00 | 0.00 | 0.00 | 0.01 | 0.01 |
| Gold | g/t | 0.024 | 0.02 | 0.03 | 0.03 | 0.03 | 0.02 | 0.02 | 0.02 | 0.03 | 0.03 | 0.03 |
| Silver | g/t | 0.559 | 0.48 | 0.64 | 0.84 | 0.59 | 0.51 | 0.52 | 0.56 | 0.64 | 0.67 | 0.73 |
| Mill Feed - Indicated | tonnes | 449,809,395 | 23,677,717 | 22,359,448 | 20,802,949 | 25,160,967 | 26,398,933 | 26,373,713 | 27,630,510 | 26,224,723 | 25,619,786 | 26,494,740 |
| Copper | % | 0.287 | 0.282 | 0.292 | 0.297 | 0.278 | 0.271 | 0.282 | 0.287 | 0.286 | 0.285 | 0.301 |
| Moly | % | 0.004 | 0.005 | 0.004 | 0.005 | 0.004 | 0.004 | 0.005 | 0.006 | 0.005 | 0.005 | 0.004 |
| Gold | g/t | 0.030 | 0.032 | 0.032 | 0.037 | 0.027 | 0.025 | 0.031 | 0.034 | 0.032 | 0.029 | 0.033 |
| Silver | g/t | 0.613 | 0.634 | 0.629 | 0.792 | 0.582 | 0.547 | 0.682 | 0.730 | 0.696 | 0.630 | 0.645 |
| Mill Feed - Inferred | tonnes | 42,583,839 | 1,805,861 | 484,645 | 1,427,998 | 2,070,036 | 2,444,322 | 2,232,530 | 2,433,274 | 1,843,259 | 1,218,904 | 3,594,775 |
| Copper | % | 0.267 | 0.279 | 0.290 | 0.229 | 0.260 | 0.245 | 0.256 | 0.268 | 0.252 | 0.291 | 0.265 |
| Moly | % | 0.005 | 0.006 | 0.003 | 0.005 | 0.005 | 0.005 | 0.009 | 0.008 | 0.005 | 0.003 | 0.003 |
| Gold | g/t | 0.028 | 0.045 | 0.044 | 0.028 | 0.043 | 0.037 | 0.030 | 0.033 | 0.024 | 0.040 | 0.036 |
| Silver | g/t | 0.575 | 0.901 | 0.934 | 0.625 | 0.843 | 0.803 | 0.660 | 0.728 | 0.464 | 0.784 | 0.716 |
| Moly Concentrate | ||||||||||||
| Total Moly Concentrate | wet tonnes | 40,015 | 1,760 | 1,684 | 2,419 | 1,638 | 1,583 | 2,072 | 2,168 | 1,889 | 2,112 | 2,143 |
| Delivered to Roaster (less losses) | dry tonnes | 38,337 | 1,687 | 1,613 | 2,318 | 1,569 | 1,517 | 1,985 | 2,077 | 1,810 | 2,024 | 2,054 |
| Payable Pounds of Moly | pounds | 46,020,409 | 2,024,597 | 1,936,721 | 2,782,601 | 1,884,019 | 1,820,853 | 2,382,724 | 2,492,954 | 2,172,211 | �� 2,429,544 | 2,465,120 |
| Copper Concentrate | ||||||||||||
| Total Copper Concentrate | wet tonnes | 8,653,898 | 404,153 | 460,347 | 459,023 | 413,812 | 408,655 | 416,398 | 427,728 | 437,527 | 428,962 | 434,026 |
| Concentrate Delivered to Smelter (less losses) | dry tonnes | 7,921,778 | 369,962 | 421,401 | 420,189 | 378,803 | 374,083 | 381,171 | 391,542 | 400,512 | 392,672 | 397,307 |
| Payable Pounds of Copper | pounds | 5,064,662,176 | 236,529,248 | 269,416,305 | 268,641,365 | 242,181,927 | 239,163,834 | 243,695,302 | 250,326,121 | 256,060,788 | 251,048,334 | 254,011,950 |
| Silver Ounces | ounces | 9,122,772 | 444,994 | 488,184 | 619,164 | 457,474 | 422,829 | 479,833 | 518,367 | 507,919 | 495,508 | 516,740 |
| Gold Ounces | ounces | 441,295 | 22,679 | 23,997 | 28,008 | 22,075 | 19,641 | 22,184 | 24,674 | 23,310 | 22,313 | 26,688 |
| Mine Production - Open Pit | ||||||||||||
| Feed to Mill | tonnes | 853,028,569 | 43,200,000 | 40,752,730 | 41,551,695 | 43,200,000 | 43,200,000 | 43,200,000 | 43,200,000 | 42,570,467 | 43,200,000 | 43,200,000 |
| Feed to Stockpile | tonnes | 48,429,888 | 2,641,999 | - | - | 1,364,019 | 3,862,025 | 2,985,983 | 1,049,613 | - | 2,458,941 | - |
| Stockpile to Mill | tonnes | 24,373,242 | - | 2,447,270 | 1,648,305 | - | - | - | - | 629,533 | - | - |
| Waste | tonnes | 1,737,356,302 | 89,663,873 | 87,997,290 | 86,999,809 | 83,704,179 | 85,134,312 | 80,242,006 | 67,967,990 | 21,864,475 | 17,164,468 | 11,090,276 |
| Total Material | tonnes | 2,663,188,001 | 135,505,872 | 131,197,290 | 130,199,809 | 128,268,198 | 132,196,336 | 126,427,988 | 112,217,603 | 65,064,475 | 62,823,409 | 54,290,276 |
| Strip Ratio | 1.98 | 2.08 | 2.04 | 2.01 | 1.94 | 1.97 | 1.86 | 1.57 | 0.51 | 0.40 | 0.26 | |
| Operating Cost | ||||||||||||
| Open Pit Mining | dollars | 3,625,047,339 | 177,905,061 | 171,083,297 | 170,528,546 | 176,522,850 | 197,504,883 | 196,747,654 | 187,890,329 | 128,992,847 | 123,766,990 | 103,008,252 |
| Processing | dollars | 4,027,274,313 | 198,288,000 | 198,288,000 | 198,288,002 | 198,288,000 | 198,288,000 | 198,288,000 | 198,288,000 | 198,288,000 | 198,288,000 | 198,288,000 |
| G&A | dollars | 254,752,000 | 10,901,000 | 10,901,000 | 10,901,000 | 10,901,000 | 10,901,000 | 10,901,000 | 10,901,000 | 10,901,000 | 10,901,000 | 10,901,000 |
| Concentrate Trucking | dollars | 521,834,846 | 24,363,624 | 27,730,269 | 27,698,629 | 24,935,197 | 24,622,209 | 25,118,535 | 25,804,563 | 26,374,359 | 25,875,021 | 26,180,864 |
| Port Costs | dollars | 43,269,490 | 2,020,767 | 2,301,734 | 2,295,114 | 2,069,060 | 2,043,275 | 2,081,989 | 2,138,639 | 2,187,633 | 2,144,809 | 2,170,128 |
| Shipping to Smelter | dollars | 199,039,655 | 9,295,526 | 10,587,977 | 10,557,522 | 9,517,675 | 9,399,065 | 9,577,150 | 9,837,739 | 10,063,110 | 9,866,122 | 9,982,591 |
| Subtotal Operating | dollars | 8,671,217,642 | 422,773,978 | 420,892,278 | 420,268,812 | 422,233,782 | 442,758,431 | 442,714,328 | 434,860,270 | 376,806,947 | 370,841,942 | 350,530,836 |
| Capital Cost | ||||||||||||
| Open Pit Mining | dollars | 539,293,584 | 3,951,380 | 2,377,761 | 10,948,188 | 6,688,448 | 13,826,704 | 5,458,848 | 4,403,756 | 4,402,664 | 1,077,800 | 595,000 |
| Processing | dollars | 456,722,000 | 452,200 | 0 | 452,200 | 0 | 452,200 | 0 | 452,200 | 0 | 452,200 | 0 |
| Infrastructure | dollars | 205,111,600 | 2,150,000 | 0 | 0 | 750,000 | 750,000 | 0 | 0 | 0 | 0 | 0 |
| Environment Costs | dollars | 70,550,000 | 1,377,826 | 1,415,843 | 1,415,843 | 1,454,992 | 1,454,992 | 1,473,140 | 1,489,517 | 1,539,240 | 1,539,240 | 1,668,293 |
| Indirect | dollars | 164,309,778 | 0 | 0 | 0 | 0 | 0 | 0 | 0 | 0 | 0 | 0 |
| Contingency | dollars | 106,009,448 | 0 | 0 | 0 | 0 | 0 | 0 | 0 | 0 | 0 | 0 |
| Subtotal Capital | dollars | 1,541,996,410 | 7,931,406 | 3,793,604 | 12,816,231 | 8,893,440 | 16,483,896 | 6,931,988 | 6,345,474 | 5,941,905 | 3,069,240 | 2,263,293 |
| Revenue (after smelter & refining + losses) | ||||||||||||
| Moly | dollars | 453,301,029 | 19,942,283 | 19,076,700 | 27,408,620 | 18,557,582 | 17,935,402 | 23,469,832 | 24,555,596 | 21,396,283 | 23,931,010 | 24,281,435 |
| Copper | dollars | 14,155,071,294 | 661,068,449 | 752,983,491 | 750,817,633 | 676,866,951 | 668,431,774 | 681,096,636 | 699,628,912 | 715,656,559 | 701,647,404 | 709,930,324 |
| Silver | dollars | 167,859,003 | 8,187,896 | 8,982,592 | 11,392,624 | 8,417,524 | 7,780,058 | 8,828,926 | 9,537,946 | 9,345,710 | 9,117,348 | 9,508,020 |
| Gold | dollars | 509,254,491 | 26,172,039 | 27,692,353 | 32,321,338 | 25,475,064 | 22,665,181 | 25,600,213 | 28,473,800 | 26,899,337 | 25,749,188 | 30,798,413 |
| Subtotal | 15,285,485,817 | 715,370,668 | 808,735,136 | 821,940,215 | 729,317,121 | 716,812,415 | 738,995,607 | 762,196,255 | 773,297,890 | 760,444,950 | 774,518,192 | |
| less Royalty | dollars | 58,085,367 | 2,718,763 | 3,072,461 | 3,125,556 | 2,771,181 | 2,722,991 | 2,808,872 | 2,897,661 | 2,938,691 | 2,890,236 | 2,944,738 |
| Net Revenue | dollars | 15,227,400,450 | 712,651,905 | 805,662,675 | 818,814,659 | 726,545,941 | 714,089,423 | 736,186,735 | 759,298,593 | 770,359,198 | 757,554,714 | 771,573,453 |
| Pre-Tax Cashflow | ||||||||||||
| Operating Cost | dollars | 8,667,186,000 | 422,774,000 | 420,892,000 | 420,269,000 | 422,234,000 | 442,758,000 | 442,714,000 | 434,860,000 | 376,807,000 | 370,842,000 | 350,531,000 |
| Capital Cost | dollars | 1,412,023,000 | 7,931,000 | 3,794,000 | 12,816,000 | 8,893,000 | 16,484,000 | 6,932,000 | 6,345,000 | 5,942,000 | 3,069,000 | 2,263,000 |
| Revenue | dollars | 15,227,403,000 | 712,652,000 | 805,663,000 | 818,815,000 | 726,546,000 | 714,089,000 | 736,187,000 | 759,299,000 | 770,359,000 | 757,555,000 | 771,573,000 |
| Pre-Tax Cashflow | dollars | 5,014,195,000 | 281,947,000 | 380,977,000 | 385,730,000 | 295,419,000 | 254,847,000 | 286,541,000 | 318,094,000 | 387,610,000 | 383,644,000 | 418,779,000 |
| Pre-Tax Cumulative | dollars | 447,012,000 | 827,989,000 | 1,213,719,000 | 1,509,138,000 | 1,763,985,000 | 2,050,526,000 | 2,368,620,000 | 2,756,230,000 | 3,139,874,000 | 3,558,653,000 | |
| Post-Tax Cashflow | ||||||||||||
| Nevada Taxes | dollars | 268,311,310 | 12,311,143 | 16,930,488 | 17,571,310 | 12,966,758 | 11,269,593 | 12,374,497 | 14,029,386 | 17,638,206 | 17,439,502 | 19,262,554 |
| Federal Taxes | dollars | 973,090,692 | 44,356,019 | 61,223,162 | 63,698,126 | 46,682,231 | 40,572,771 | 44,576,050 | 50,446,722 | 64,689,407 | 64,027,128 | 79,562,653 |
| Total Tax | dollars | 1,241,402,001 | 56,667,163 | 78,153,650 | 81,269,436 | 59,648,989 | 51,842,364 | 56,950,547 | 64,476,109 | 82,327,612 | 81,466,630 | 98,825,206 |
| Post-Tax Cashflow | dollars | 3,772,792,999 | 225,279,837 | 302,823,350 | 304,460,564 | 235,770,011 | 203,004,636 | 229,590,453 | 253,617,891 | 305,282,388 | 302,177,370 | 319,953,794 |
| Post-Tax Cumulative | dollars | 240,065,781 | 542,889,131 | 847,349,695 | 1,083,119,706 | 1,286,124,342 | 1,515,714,795 | 1,769,332,686 | 2,074,615,074 | 2,376,792,444 | 2,696,746,237 | |
| | |
| 10/03/2017 |
Page 22 - 11
2017 Updated Preliminary Economic Assessment on the Ann Mason Project
Nevada, U.S.A.
| Table 22-9: Detailed Cash Flow (Year 18 to Year 28) | |||||||||||||
| Total | Year 18 | Year 19 | Year 20 | Year 21 | Year 22 | Year 23 | Year 24 | Year 25 | Year 26 | Year 27 | Year 28 | ||
| Mill Feed - Measured | tonnes | 385,008,577 | 10,909,873 | 13,030,118 | 18,006,365 | 10,394,374 | - | - | - | - | - | - | - |
| Copper | % | 0.309 | 0.31 | 0.32 | 0.30 | 0.33 | - | - | - | - | - | - | - |
| Moly | % | 0.005 | 0.01 | 0.01 | 0.01 | 0.01 | - | - | - | - | - | - | - |
| Gold | g/t | 0.024 | 0.04 | 0.02 | 0.03 | 0.05 | - | - | - | - | - | - | - |
| Silver | g/t | 0.559 | 0.70 | 0.53 | 0.72 | 0.94 | - | - | - | - | - | - | - |
| Mill Feed - Indicated | tonnes | 449,809,395 | 28,356,467 | 27,953,314 | 24,001,436 | 13,787,659 | - | - | - | - | - | - | - |
| Copper | % | 0.287 | 0.305 | 0.293 | 0.297 | 0.321 | - | - | - | - | - | - | - |
| Moly | % | 0.004 | 0.004 | 0.004 | 0.004 | 0.006 | - | - | - | - | - | - | - |
| Gold | g/t | 0.030 | 0.031 | 0.024 | 0.036 | 0.057 | - | - | - | - | - | - | - |
| Silver | g/t | 0.613 | 0.602 | 0.502 | 0.702 | 0.960 | - | - | - | - | - | - | - |
| Mill Feed - Inferred | tonnes | 42,583,839 | 3,933,660 | 2,216,568 | 1,192,199 | 19,778 | - | - | - | - | - | - | - |
| Copper | % | 0.267 | 0.277 | 0.290 | 0.363 | 0.323 | - | - | - | - | - | - | - |
| Moly | % | 0.005 | 0.004 | 0.005 | 0.003 | 0.002 | - | - | - | - | - | - | - |
| Gold | g/t | 0.028 | 0.028 | 0.025 | 0.031 | 0.076 | - | - | - | - | - | - | - |
| Silver | g/t | 0.575 | 0.574 | 0.480 | 0.552 | 1.396 | - | - | - | - | - | - | - |
| Moly Concentrate | |||||||||||||
| Total Moly Concentrate | wet tonnes | 40,015 | 1,984 | 1,890 | 2,213 | 1,660 | - | - | - | - | - | - | - |
| Delivered to Roaster (less losses) | dry tonnes | 38,337 | 1,901 | 1,811 | 2,120 | 1,591 | - | - | - | - | - | - | - |
| Payable Pounds of Moly | pounds | 46,020,409 | 2,281,881 | 2,173,568 | 2,545,362 | 1,909,417 | - | - | - | - | - | - | - |
| Copper Concentrate | |||||||||||||
| Total Copper Concentrate | wet tonnes | 8,653,898 | 437,873 | 432,180 | 433,521 | 263,437 | - | - | - | - | - | - | - |
| Concentrate Delivered to Smelter (less losses) | dry tonnes | 7,921,778 | 400,829 | 395,618 | 396,846 | 241,150 | - | - | - | - | - | - | - |
| Payable Pounds of Copper | pounds | 5,064,662,176 | 256,263,709 | 252,931,940 | 253,716,864 | 154,175,689 | - | - | - | - | - | - | - |
| Silver Ounces | ounces | 9,122,772 | 477,803 | 389,942 | 539,256 | 406,828 | - | - | - | - | - | - | - |
| Gold Ounces | ounces | 441,295 | 25,827 | 18,428 | 26,662 | 23,888 | - | - | - | - | - | - | - |
| Mine Production - Open Pit | |||||||||||||
| Feed to Mill | tonnes | 853,028,569 | 43,200,000 | 43,200,000 | 38,755,104 | 24,201,811 | - | - | - | - | - | - | - |
| Feed to Stockpile | tonnes | 48,429,888 | - | 12,044,004 | - | 2,546,435 | - | - | - | - | - | - | - |
| Stockpile to Mill | tonnes | 24,373,242 | - | - | 4,444,896 | - | - | - | - | - | - | - | - |
| Waste | tonnes | 1,737,356,302 | 8,025,158 | 2,380,144 | 129,719 | 85,020 | - | - | - | - | - | - | - |
| Total Material | tonnes | 2,663,188,001 | 51,225,158 | 57,624,148 | 43,329,719 | 26,833,266 | - | - | - | - | - | - | - |
| Strip Ratio | 1.98 | 0.19 | 0.06 | 0.00 | 0.00 | - | - | - | - | - | - | - | |
| Operating Cost | |||||||||||||
| Open Pit Mining | dollars | 3,625,047,339 | 96,717,540 | 128,321,738 | 96,642,858 | 57,351,909 | 2,609,074 | 1,236,925 | 33,267 | 0 | 0 | 0 | 0 |
| Processing | dollars | 4,027,274,313 | 198,288,000 | 198,288,000 | 198,287,999 | 111,086,312 | 0 | 0 | 0 | 0 | 0 | 0 | 0 |
| G&A | dollars | 254,752,000 | 10,901,000 | 10,901,000 | 10,901,000 | 10,901,000 | 0 | 0 | 0 | 0 | 0 | 0 | 0 |
| Concentrate Trucking | dollars | 521,834,846 | 26,401,361 | 26,053,663 | 26,155,147 | 15,914,151 | 0 | 0 | 0 | 0 | 0 | 0 | 0 |
| Port Costs | dollars | 43,269,490 | 2,189,366 | 2,160,901 | 2,167,607 | 1,317,186 | 0 | 0 | 0 | 0 | 0 | 0 | 0 |
| Shipping to Smelter | dollars | 199,039,655 | 10,071,084 | 9,940,147 | 9,970,994 | 6,059,057 | 0 | 0 | 0 | 0 | 0 | 0 | 0 |
| Subtotal Operating | dollars | 8,671,217,642 | 344,568,351 | 375,665,449 | 344,125,605 | 202,629,616 | 2,609,074 | 1,236,925 | 33,267 | 0 | 0 | 0 | 0 |
| Capital Cost | |||||||||||||
| Open Pit Mining | dollars | 539,293,584 | 1,517,863 | 1,646,480 | 36,800 | 0 | 0 | 0 | 0 | 0 | 0 | 0 | 0 |
| Processing | dollars | 456,722,000 | 452,200 | 452,200 | 452,200 | 0 | 0 | 0 | 0 | 0 | 0 | 0 | 0 |
| Infrastructure | dollars | 205,111,600 | 711,600 | 0 | 0 | 0 | 0 | 0 | 0 | 0 | 0 | 0 | 0 |
| Environment Costs | dollars | 70,550,000 | 1,668,293 | 1,758,738 | 1,760,214 | 10,219,480 | 10,874,648 | 8,282,036 | 5,998,933 | 5,998,933 | 0 | 0 | 0 |
| Indirect | dollars | 164,309,778 | 0 | 0 | 402,250 | 402,250 | 804,500 | 0 | 0 | 0 | 0 | 0 | 0 |
| Contingency | dollars | 106,009,448 | 0 | 0 | 804,500 | 804,500 | 1,609,000 | 0 | 0 | 0 | 0 | 0 | 0 |
| Subtotal Capital | dollars | 1,541,996,410 | 4,349,956 | 3,857,419 | 3,455,964 | 11,426,230 | 13,288,148 | 8,282,036 | 5,998,933 | 5,998,933 | 0 | 0 | 0 |
| Revenue (after smelter & refining + losses) | |||||||||||||
| Moly | dollars | 453,301,029 | 22,476,532 | 21,409,649 | 25,071,814 | 18,807,754 | - | - | - | - | - | - | - |
| Copper | dollars | 14,155,071,294 | 716,223,698 | 706,911,838 | 709,105,599 | 430,900,974 | - | - | - | - | - | - | - |
| Silver | dollars | 167,859,003 | 8,791,579 | 7,174,926 | 9,922,306 | 7,485,634 | - | - | - | - | - | - | - |
| Gold | dollars | 509,254,491 | 29,804,255 | 21,265,919 | 30,768,388 | 27,566,521 | - | - | - | - | - | - | - |
| Subtotal | 15,285,485,817 | 777,296,063 | 756,762,332 | 774,868,107 | 484,760,884 | - | - | - | - | - | - | - | |
| less Royalty | dollars | 58,085,367 | 2,954,537 | 2,874,430 | 2,946,297 | 1,845,882 | - | - | - | �� - | - | - | - |
| Net Revenue | dollars | 15,227,400,450 | 774,341,526 | 753,887,901 | 771,921,810 | 482,915,002 | 0 | 0 | 0 | 0 | 0 | 0 | 0 |
| Pre-Tax Cashflow | |||||||||||||
| Operating Cost | dollars | 8,667,186,000 | 344,568,000 | 375,665,000 | 344,126,000 | 202,630,000 | 2,609,000 | 1,237,000 | 33,000 | 0 | 0 | 0 | 0 |
| Capital Cost | dollars | 1,412,023,000 | 4,350,000 | 3,857,000 | 3,456,000 | 11,426,000 | 13,288,000 | 8,282,000 | 5,999,000 | 5,999,000 | 0 | 0 | 0 |
| Revenue | dollars | 15,227,403,000 | 774,342,000 | 753,888,000 | 771,922,000 | 482,915,000 | 0 | 0 | 0 | 0 | 0 | 0 | 0 |
| Pre-Tax Cashflow | dollars | 5,014,195,000 | 425,424,000 | 374,366,000 | 424,340,000 | 268,859,000 | -15,897,000 | -9,519,000 | -6,032,000 | -5,999,000 | 0 | 0 | 0 |
| Pre-Tax Cumulative | dollars | 3,984,077,000 | 4,358,443,000 | 4,782,783,000 | 5,051,642,000 | 5,035,745,000 | 5,026,226,000 | 5,020,194,000 | 5,014,195,000 | 0 | 0 | 0 | |
| Post-Tax Cashflow | |||||||||||||
| Nevada Taxes | dollars | 268,311,310 | 19,739,541 | 17,221,326 | 19,734,992 | 13,008,462 | - | - | - | - | - | - | - |
| Federal Taxes | dollars | 973,090,692 | 90,300,671 | 74,191,490 | 90,636,439 | 62,454,281 | - | - 606,563 | - 3,546,128 | - 3,501,539 | - 41,570 | - 15,269 | - 80,895 |
| Total Tax | dollars | 1,241,402,001 | 110,040,212 | 91,412,816 | 110,371,431 | 75,462,743 | - | - 606,563 | - 3,546,128 | - 3,501,539 | - 41,570 | - 15,269 | - 80,895 |
| Post-Tax Cashflow | dollars | 3,772,792,999 | 315,383,788 | 282,953,184 | 313,968,569 | 193,396,257 | -15,897,000 | -8,912,437 | -2,485,872 | -2,497,461 | 41,570 | 15,269 | 80,895 |
| Post-Tax Cumulative | dollars | 3,012,130,025 | 3,295,083,209 | 3,609,051,778 | 3,802,448,035 | 3,786,551,035 | 3,777,638,598 | 3,775,152,726 | 3,772,655,265 | 3,772,696,835 | 3,772,712,104 | 3,772,792,999 | |
| | |
| 10/03/2017 |
Page 22 - 12
2017 Updated Preliminary Economic Assessment on the Ann Mason Project
Nevada, U.S.A.
| 23 | Adjacent Properties |
The information presented below has not been verified by the authors of this Technical Report, and is not necessarily indicative of the mineralization on the Ann Mason Project.
| 23.1 | MacArthur and Yerington Projects |
Quaterra, through its wholly-owned subsidiary, Singatse Peak Services, LLC (SPS) holds rights to the Yerington, MacArthur and Bear properties, which are contiguous in a north-south direction, and are adjacent to the east side of Entrée's Ann Mason Project. These properties cover roughly 13,200 ha and host three principal mineralized deposits: Yerington, MacArthur, and Bear (Figure 5‑1). In June 2014, Quaterra and SPS signed an option agreement with Freeport-McMoRan Nevada LLC (Freeport), whereby Freeport can earn up to a 75% interest in the properties by spending approximately $138.6 million. Under the terms of the agreement, after conducting due diligence over one year, Freeport can earn an initial 55% interest in SPS by providing funds to SPS to complete three staged investigation and work programs totalling US$38.6 million. Freeport completed the first stage of work by providing funding of US$2.5 million through June of 2015 and committed to second stage funding of US$7.1 million to conduct drilling on the Bear deposit for the period July 2015 through June 2016. Freeport can earn a further 20% interest in SPS by funding SPS an additional US$100 million of spending, or by completing a feasibility study.
In June 2016 Freeport extended Stage 2 of the option agreement for up to two years by Freeport Nevada making option payments totalling $5.75 million.
The following is mainly summarized from two Technical Reports (Tetra Tech, 2014 and M3 Engineering, 2014) available on the www.sedar.com website and completed on behalf of Quaterra. Many of the lengths are originally reported in feet, but have been converted to metres for consistency within this report.
| 23.1.1 | MacArthur Project |
Quaterra acquired the MacArthur project in 2007 and has since completed over 62,000 m of drilling in 401 drill holes (58 core and 343 RC). The drilling has outlined a 15 m to 46 m thick tabular zone of secondary copper (oxides and/or chalcocite) covering an area of approximately 3.8 km2. The western edge of the defined mineralization occurs approximately 1.5 km east of the Ann Mason Project boundary. According to Quaterra, the mineralized zone has only been partially delineated, and remains open for extension to the west and north.
The most common copper mineral is chrysocolla, with minor neotocite and traces of cuprite and tenorite. The flat-lying zones of oxide copper mirror topography, exhibit strong fracture control, and range in thickness from 15 m to 30 m. Secondary chalcocite mineralization forms a blanket up to 15 m thick that is mixed with, and underlies, the oxide copper. Primary chalcopyrite mineralization has been intersected in several locations mixed with and below the chalcocite, but its extent is unknown, as most of the drill holes bottomed at 122 m or less.
| | |
| 10/03/2017 |
Page 23 - 1
2017 Updated Preliminary Economic Assessment on the Ann Mason Project
Nevada, U.S.A.
The current PEA for MacArthur (amended in 2014 with an effective date of May 23, 2012) is based on the resource estimates shown in Table 23-1. The PEA presents a solvent extraction and electrowinning (SX/EW) mining scenario with the following highlights:
| · | An open pit mine based on a subset of the acid-soluble Measured and Indicated Mineral Resources of 159 Mst at 0.212% Cu, and an Inferred Mineral Resource of 243 Mst at 0.201% Cu. |
| · | Recovery of 747.7 Mlb of copper over the 18-year mine life at an average mining rate of 15 Mt/a. |
| · | Initial capital expenditure of $232.75 million with an additional $147.57 million in sustaining capital. |
| · | Average LOM operating costs of $1.89/lb of recovered copper and includes mining, solvent extraction / electrowinning, sulfuric acid plant, general and administrative cost, and cost to transport the final cathode copper product to market. |
| · | An after tax NPV of $201.57 million at an 8% discount rate, and a base case copper price of $3.48/lb. The project breaks even at a copper price of $2.56/lb, and at $2.23/lb after the first three years when the capital is paid off. |
| · | An after tax IRR of 24.2%, with a 3.1-year pay back. |
Table 23-1: MacArthur Project Mineral Resources (M3 Engineering, May 2012)
Cut-Off Grade (% TCu) | Tonnage (st x '000s) | Average Grade (% TCu) | Contained Copper (lb x '000s) | |
Measured and Indicated | ||||
Oxide and Chalcocite | 0.12 | 159,094 | 0.212 | 675,513 |
Primary Material | 0.15 | 1,098 | 0.292 | 6,408 |
Inferred | ||||
Oxide and Chalcocite | 0.12 | 243,417 | 0.201 | 979,510 |
Primary Material | 0.15 | 134,900 | 0.283 | 764,074 |
| Note: | Tonnage is reported in short tons, as in the PEA |
The MacArthur PEA is preliminary in nature and includes Inferred Mineral Resources, which are considered too speculative geologically to have economic considerations applied to them that would enable them to be categorized as Mineral Reserves. There is no certainty that the results in the MacArthur PEA will be realized.
| | |
| 10/03/2017 |
Page 23 - 2
2017 Updated Preliminary Economic Assessment on the Ann Mason Project
Nevada, U.S.A.
Mineral resources that are not mineral reserves do not have demonstrated economic viability.
| 23.1.2 | Yerington Project |
The Yerington project comprises the historical Anaconda Yerington pit, approximately 3 km east of the Ann Mason Project boundary. Quaterra acquired the Yerington Project from Arimetco in April 2011, and in the same year carried out a drill program that tested extensions and zones of oxide copper, chalcocite enrichment and primary sulphide mineralization. The program included 18 twin holes and 24 exploration holes and successfully verified assay data for 558 historical holes through records research, data capture, and the re-assay of selected remaining core from 45 Anaconda drill holes. An additional 232 Anaconda drill holes were subsequently added to the database for the current resource estimate.
Mineralized porphyry dykes in the Yerington deposit are associated with three phases of intrusive activity related to the Yerington batholith, and form an elongate body of mineralization that extends over 2,200 m along a strike of N62°W. The mineralization has an average width of 600 m, and has been defined by drilling to an average depth of 76 m below the Yerington Mine pit bottom at the 1,160 m elevation. Because of the economic constraints of low copper prices at the time, many of the 558 historical Anaconda drill holes used in the Quaterra study were stopped in mineralization, and very few were drilled below the 1,035 m level, where the porphyry system remains poorly explored.
Tetra Tech, Inc. (Tetra Tech) of Golden, Colorado, has completed a NI 43-101 independent Mineral Resource estimate for mineralization, in and around the historic Yerington Mine. Using a cut-off of 0.15% TCu, the Yerington mine's Measured and Indicated primary copper Mineral Resource totals 105 Mst averaging 0.30% TCu (633 M lb of copper), and an Inferred primary copper Mineral Resource of 128 Mst averaging 0.23% TCu (600 Mlb of copper). Using a cut-off of 0.12% TCu, the acid-soluble oxide/chalcocite mineralization includes a Measured and Indicated Mineral Resource of 23.5 Mst averaging 0.25% TCu (118 Mlb of copper), and an Inferred Mineral Resource of 25.9 Mst averaging 0.23% TCu (118 Mlb of copper).
The Yerington project also includes a portion of the Bear deposit, another of the known copper deposits located in the Yerington District, located about 4.5 km to the north of the Yerington pit. The Bear deposit was discovered in 1961 by Anaconda during condemnation drilling in the sulphide tailings disposal area. The Bear deposit does not outcrop, and chalcopyrite mineralization is hosted in a porphyry system below 150 m to 300 m of alluvium and unmineralized bedrock, and below the low-angle Bear Fault (Doebrich et al., 1996). The primary copper mineralization of the Bear deposit, located partially in the northeast corner of the Yerington property, is related to micaceous veining rather than A-type quartz veining common in the Yerington Mine porphyry system. Anaconda and Phelps Dodge drilled 49 holes (approximately 38,000 m of drilling) in the Bear deposit. Dilles and Proffett (1995) reported more than 500 Mst of mineralized material averaging 0.4% Cu at the Bear deposit. These figures are reported as historic, are not NI 43-101 compliant and should not be construed to reflect a calculated Mineral Resource (Inferred, Indicated or Measured) under current standards of NI 43-101. The deposit is known to extend beyond the boundaries of SPS property, and the percentage of the deposit controlled by SPS is unknown.
| | |
| 10/03/2017 |
Page 23 - 3
2017 Updated Preliminary Economic Assessment on the Ann Mason Project
Nevada, U.S.A.
| 23.2 | Mason Valley Copper Project |
The Mason Valley Copper property is located approximately 4.5 km southeast of the Yerington Mine and adjoins Entrée's land holdings to the northeast of the Shamrock area (McConnell and Western Nevada mines; Figure 6‑1). Three historic underground copper mines—Bluestone, Mason Valley and Malachite mines—are present on the property which covers approximately 1,000 ha.
In February 2015, Mason Valley Copper announced an option agreement with Metalbank Limited (Metalbank) in which Metalbank committed to an initial investment of $1 million including a cash payment of $0.25 million. After the initial investment, Metalbank may elect to form a joint venture with the right to earn up to 80% by spending a total of $14 million, completing a bankable feasibility study and making additional payments of $9.5 million in cash and shares.
Metalbank commenced an initial program of exploration comprised of surface sampling and mapping, IP/CSAMT geophysical surveys and drilling in Q2 2015, but eventually pulled out of the joint venture in April 2016.
| 23.3 | Minnesota Mine |
The Minnesota iron mine is immediately (less than 100 m) to the north of the Ann Mason Project area, in the extreme northwest corner (Figure 6‑1). The following information is taken from Moore (1971).
The mine was originally developed as a copper deposit; however, only a small amount of copper was produced during World War I. It was not until World War II that iron was mined, and between 1943 and 1945 about 1,500 st were mined and used as high-density aggregate in cement for ship ballast. From 1952 to 1966, Standard Slag Company produced about 4 Mst of iron ore for the steel industry. Initially, high-grade direct ship ore was produced for the steel industry in Japan. A magnetic concentrating plant was built in 1957, after which concentrate was shipped.
In the Minnesota Mine, magnetite with minor pyrite and chalcopyrite, replaces dolomitic marble of the Late Triassic Mason Valley Limestone (Dilles and Proffett, 1995). This unit dips sub-vertically in the mine area, trends north-south, and is approximately 150 m thick. Weakly altered Jurassic porphyritic dykes are common throughout the area. Magnetite ore is reported to have averaged 0.07% Cu and local molybdenite with quartz veining and silicification is reported at deeper levels.
| | |
| 10/03/2017 |
Page 23 - 4
2017 Updated Preliminary Economic Assessment on the Ann Mason Project
Nevada, U.S.A.
| 24 | Other Relevant Data and Information |
There is no other information or explanation necessary to make the Technical Report understandable and not misleading.
| | |
| 10/03/2017 |
Page 24 - 1
2017 Updated Preliminary Economic Assessment on the Ann Mason Project
Nevada, U.S.A.
| 25 | Interpretation and Conclusions |
| 25.1 | Property Summary |
Since 2009, through a company merger with PacMag, option agreements, purchases and ground staking, Entrée has consolidated a group of mineral claims west of the town of Yerington, Nevada comprising 1,658 unpatented lode mining claims and 33 patented lode mining claims, covering a total area of approximately 12,735 ha. Together these claims now form the Ann Mason Project and cover a significant area on the west side of the Yerington Mining District, a historical copper mining district that covers the eastern side of the Project in Lyon County.
The Ann Mason deposit is a copper-molybdenum porphyry hosted by granodiorite and quartz monzonite. Blue Hill is a copper oxide and sulphide deposit located at approximately 1.5 km northwest of the Ann Mason deposit. These and several other copper oxide and sulphide targets are located throughout the Project area.
Since acquiring the Project, Entrée's exploration work has focused on increasing and upgrading the Mineral Resources of the Ann Mason deposit, defining initial Mineral Resources at Blue Hill, completing metallurgical studies at both deposits, and identifying and drill testing new copper targets on other areas of the Project. The results have been incorporated into an initial 2012 PEA and updated for the 2015 PEA and reviewed for this current 2017 PEA.
| 25.2 | Geology, Alteration, and Mineralization |
| 25.2.1 | Ann Mason |
The Ann Mason deposit has the characteristics of a typical, large copper-molybdenum porphyry system. Projected to the surface, the 0.15% Cu envelope covers an area approximately 2.8 km northwest and up to 1.3 km northeast. At depth, this envelope extends more than 1.2 km below surface. The mineralization remains open in most directions.
The deposit is hosted by several phases of the Jurassic Yerington batholith, including, granodiorite (Jgd), porphyritic quartz monzonite (Jpqm), quartz monzonite (Jqm) and younger quartz monzonite porphyry dykes (Jqmp-a, Jqmp-b and Jqmp-c). Copper mineralization primarily occurs within a broad zone of main-stage potassic alteration containing chalcopyrite and bornite and an assemblage of chalcopyrite-epidote or chalcopyrite-epidote-quartz mineralization that locally overprints main-stage potassic alteration and copper mineralization.
| | |
| 10/03/2017 |
Page 25 - 1
2017 Updated Preliminary Economic Assessment on the Ann Mason Project
Nevada, U.S.A.
Within the Yerington district, Mesozoic host rocks and copper-molybdenum porphyry deposits have been rotated 60° to 90° westward by Miocene age normal faulting and extension. As a result, mineralized intercepts in vertical drill holes through Ann Mason represent approximately horizontal intervals across the original pre-tilt geometry of the deposit.
Within the 0.15% Cu envelope the highest grades occur within a 200 m to 800 m thick, west-plunging zone that surrounds the intrusive contact between granodiorite and porphyritic quartz monzonite. Within this zone, copper grade is dependent on vein density, sulphide species, frequency and relative age of quartz monzonite porphyry dykes and the mafic content of the granodiorite. Mineralization is also closely associated with Qmp-a and Qmp-b quartz monzonite porphyry dykes.
The copper sulphide zoning is that of a typical porphyry copper with an outer pyritic shell, and concentric zones of increasing chalcopyrite and decreasing pyrite progressing inward to a central zone of chalcopyrite-bornite.
Within the northeast, southeast, and southwest quadrants of the deposit, chalcopyrite and chalcopyrite-bornite are the primary sulphide domains. This mineralization is the most dominant in terms of overall deposit tonnage and continues to the drilled depth of the deposit. In the northwest quadrant, the primary sulphide domain is chalcopyrite ≥ pyrite; a domain that forms thick intervals of >0.3% Cu, with only minor bornite present at depth, near the granodiorite-porphyritic quartz monzonite contact. Copper mineralization >0.15% Cu in this northwest portion of the deposit coincides with a pyrite:chalcopyrite ratio of less than 7:1.
Chalcopyrite occurs as individual grains in veins and disseminated in rock, as fillings in brecciated pyrite grains, attached to or included in pyrite grains, and attached to or included in bornite; bornite occurs as separate grains in veins, and disseminated in rock and attached to chalcopyrite. Chalcocite occurs as replacement rims on chalcopyrite, but more commonly as replacement rims or exsolution replacement of bornite.
Molybdenum occurs as molybdenite in quartz and quartz-chalcopyrite veins and on fracture or shear surfaces as molybdenum paint. In the current resource model molybdenum is constrained within a >0.005% Mo grade envelope that occurs almost entirely within the 0.15% Cu envelope and extending further below, where sodic (albite) alteration has removed copper mineralization, leaving molybdenum largely in place. The molybdenum mineralization also remains open towards the north.
Silver ≥0.6 g/t and gold ≥0.06 g/t are closely associated with the occurrence of bornite within the chalcopyrite-bornite sulphide domain.
| | |
| 10/03/2017 |
Page 25 - 2
2017 Updated Preliminary Economic Assessment on the Ann Mason Project
Nevada, U.S.A.
Alteration types include a broad, main-stage zone of potassic alteration (secondary biotite, K-feldspar), an outer propylitic zone (chlorite±epidote±pyrite) and restricted late-stage overprints of chlorite±oligoclase±epidote, sodic (albite±chlorite) and sericitic alteration.
Late-stage sodic and sericite alteration occur along late, high-angle faults and as local, pervasive alteration of rocks. In areas of strong (>15%) albite or sericite alteration, the copper grades can locally be greatly reduced, resulting in copper grades < 0.2% and in places, < 0.05%. Molybdenum mineralization is not significantly affected by the late sodic alteration, beyond partial remobilization from veins into nearby fractures and shears.
Two prominent faults form structural boundaries to the Ann Mason resource:
| · | The relatively flat Singatse Fault truncates the upper surface of the 0.15% Cu envelope over portions of the deposit and juxtaposes sterile, Tertiary volcanic rocks on top of the mineralized intrusives. |
| · | Fault 1A: a high-angle, northwest-trending, southwest dipping located along the southwest margin of the resource juxtaposes propylitically altered rocks (chlorite±epidote±pyrite) in the hanging wall against potassically-altered rocks with copper-molybdenum mineralization in the footwall. Fault 1A and other northwest-trending structures offset the intrusive contact between granodiorite (Jgd) and porphyritic quartz monzonite (Jpqm) to successively deeper levels towards the west and southwest. Copper-molybdenum mineralization in the footwall of the fault remains open at depth along the entire strike length of the fault. |
| 25.2.2 | Blue Hill |
The Blue Hill deposit is about 1.5 km northwest of Ann Mason and occurs in a very similar geologic environment, but in a separate fault block. Two main styles of porphyry mineralization have been identified here:
| · | near surface, oxide and mixed oxide-sulphide copper mineralization |
| · | underlying copper-molybdenum sulphide mineralization. |
Both styles of mineralization are hosted primarily by quartz monzonite with lesser amounts of porphyritic quartz monzonite and quartz monzonite porphyry. The low-angle, southeast dipping Blue Hill Fault strikes northeast through the middle of the target, cutting off a portion of the near-surface oxide mineralization. However, sulphides continue below the fault to the southeast.
The oxide zone is exposed on surface and has been traced by drilling as a relatively flat-lying zone covering an area of about 900 m x 450 m, and continuing for several hundred metres further to the west in narrow intervals. Significant copper oxides, encountered in both RC and core drill holes extends from surface to an average depth of 124 m. Oxide copper mineralization consists of malachite, chrysocolla, rare azurite, black copper-manganese oxides, copper sulphates, and copper-bearing limonites. Mineralization occurs primarily on fracture surfaces and in oxidized veins or veinlets. A zone of mixed oxide/sulphide mineralization with minor chalcocite is present below the oxide mineralization up to depths of 185 m. The copper oxide zone remains open to the northwest and southeast.
| | |
| 10/03/2017 |
Page 25 - 3
2017 Updated Preliminary Economic Assessment on the Ann Mason Project
Nevada, U.S.A.
Oxide copper mineralization at Blue Hill is interpreted to be the result of in-place oxidation of copper sulphides with only minor transport of copper into vugs, fractures, and faults or shear zones. No significant zones of secondary enrichment have been observed.
The copper-mineralized sulphide zone underlies the southern half of the oxide mineralization and continues to depth towards the southeast below the Blue Hill Fault. Mineralization consists of varying quantities of pyrite, chalcopyrite, and molybdenite. Local, higher-grade sulphide mineralization commonly occurs within zones of sheeted veins containing chalcopyrite, magnetite, and secondary biotite. Significant amounts of disseminated molybdenum mineralization have been observed locally, often in contact with dykes. To the northwest, below the oxides only a few holes have tested the sulphide potential, however in this direction the sulphides appear to be increasingly pyritic with only minor amounts of copper.
Alteration assemblages are similar to the Ann Mason deposit except that original zoning is difficult to discern in areas of pervasive oxidation. Within zones of sulphide mineralization, propylitic alteration is more widespread and potassic alteration is more restricted to quartz monzonite porphyry dykes and immediately adjacent rocks of the Yerington batholith. Late stage sodic alteration locally reduces copper grades, similar to what has been observed at the Ann Mason deposit.
The sulphide mineralization remains open is several directions, most importantly, to the southeast, towards the Ann Mason deposit.
| 25.3 | Exploration |
Entrée has been actively exploring the Ann Mason Project continuously since early 2010, focused primarily on drilling at the Ann Mason and Blue Hill deposit areas.
At the Ann Mason deposit, drilling has concentrated on expanding and upgrading the Mineral Resources within the 0.15% Cu envelope, and defining zones of higher-grade mineralization. At Blue Hill, drilling was primarily RC, designed to test the extent of shallow oxide copper mineralization, but also to establish the potential for deeper, sulphide mineralization.
Entrée's sample preparation, security, and analytical procedures applied for the Ann Mason and Blue Hill data meet and in some cases exceed current industry accepted standards. QA/QC procedures applied have resulted in acceptable precision, accuracy, and contamination for the sampling completed by Entrée.
| | |
| 10/03/2017 |
Page 25 - 4
2017 Updated Preliminary Economic Assessment on the Ann Mason Project
Nevada, U.S.A.
In August 2010, a 52.2 line km dipole-dipole IP and resistivity survey was conducted by Zonge on the Ann Mason and Blue Hill deposit areas. The chargeability results at 600 m depth show a strong 1.5 km wide anomaly extending northwestward from Ann Mason to beyond Blue Hill. The current 0.15% Cu envelope at Ann Mason occurs at the southeastern limit of the chargeability anomaly and then continues northwest along the central portion of the anomaly. Blue Hill occurs in the central portion of the anomaly. A large portion of the anomaly between Ann Mason and Blue Hill remains untested by drilling. Further northwest, the Blackjack IP anomaly covers an area 3.0 km east-west by 1.2 km north-south. The anomaly has not been drill tested and remains a priority exploration target for Entrée.
In 2012, Entrée embarked on a soil and rock geochemical sampling and geological mapping program over areas to the north of Blue Hill and to the south of Ann Mason, covering approximately 750 ha. The soil geochemistry (619 samples) extends and infills sampling done by previous operators between 2006 and 2010. A total of 186 selected rock samples were collected to characterize alteration and mineralization. The work resulted in the definition of three high priority target areas for future exploration: Ann Mason South, Blackjack Oxide, and the area between the Ann Mason and Blue Hill deposits. Each of these areas has potential to host additional near-surface oxide and/or sulphide mineralization, which could add to the current Mineral Resources at both Ann Mason and Blue Hill. Positive evaluation of the oxide copper targets could result in one or more satellite deposits and provide additional material for a potential heap leach and SX/EW operation at Blue Hill. Additional sulphide mineralization around the Ann Mason could reduce the current strip ratio in the Ann Mason 2017 PEA mine design and help to enhance Project economics.
The recently completed diamond drill program at Ann Mason was designed to convert the majority of the Inferred Mineral Resources within the Phase 5 pit to a combination of Measured and Indicated Mineral Resources. The Mineral Resources, constrained within the Phase 5 pit are now classified 95% as Measured and Indicated, with the remaining 5% Inferred. To date, 82 Entrée holes totalling 58,279 m have been completed at the Ann Mason deposit and periphery. Of these holes, 78 have been incorporated into the current Mineral Resource estimate. All sampling from Entrée's drilling includes copper, molybdenum, gold, and silver analyses.
Entrée has completed 31 RC holes and 15 core holes on the Blue Hill copper oxide deposit and adjacent areas. The Blue Hill drill program has successfully outlined copper oxide mineralization over an area of 900 by 450 m, and has defined a sulphide mineralized porphyry target that partially underlies the oxides and remains open to the southeast.
| | |
| 10/03/2017 |
Page 25 - 5
2017 Updated Preliminary Economic Assessment on the Ann Mason Project
Nevada, U.S.A.
All Entrée drilling has been accompanied by a thorough QA/QC program, which currently includes the regular insertion of coarse blanks, core twins, coarse duplicates, pulp duplicates and standards with each batch. A review of the regular QC data indicates that the copper and molybdenum assays are of acceptable precision and accuracy to be used in the Mineral Resource estimate. At the completion of the assaying, a percentage of the pulps are sent to an independent secondary laboratory for check assays, which indicate no significant bias exists between the primary and secondary labs for copper, molybdenum and gold grades.
Approximately 41% of the Anaconda historical core from holes at Ann Mason has been re-assayed through programs initiated by both PacMag, and more recently by Entrée, and no significant bias was noted for either copper or molybdenum between the various sampling campaigns. The re-assay work has also increased the database of molybdenum, gold, and silver assays and to allow these to be brought into the current estimates.
| 25.4 | Mineral Resource Estimate |
The Project contains Mineral Resources at both the Ann Mason and Blue Hill deposits. The two deposits are not connected, and each was estimated independent of the other. Ann Mason is a sulphide-hosted copper-molybdenum porphyry deposit, and Blue Hill is an oxide- and sulphide-hosted copper-porphyry deposit. Although the Blue Hill Mineral Resources are included in this Report, they were not evaluated as part of the 2017 PEA.
Amec Foster Wheeler concludes the following:
| · | The work performed by Entrée with regards to the Ann Mason deposit has been completed in a professional manner and meets and sometimes exceeds current industry practice. The geology of the deposit is well understood and the drill database used to develop wireframe models and estimate grades was checked through appropriate QAQC procedures to ensure it is accurate. |
| · | The construction of the 2015 Ann Mason Resource Model is consistent with CIM Estimation of Mineral Resources and Mineral Reserves Best Practice Guidelines. |
| · | The modelling and grade estimation process used is appropriate for a porphyry-style copper-molybdenum-gold-silver deposit and the resource model is suitable to support mine planning for a large-scale open pit mine. |
| · | The Mineral Resource estimates meet the definition of Mineral Resources under CIM Definition Standards for Mineral Resources and Mineral Reserves (May 10, 2014). |
Mineral Resources at Ann Mason were estimated by Mr. Peter Oshust, P.Geo., Amec Foster Wheeler.
AGP concludes the following:
| · | The work performed by Entrée with regards to the Blue Hill deposit has been completed in a professional manner and meets and sometimes exceeds current industry practice. The drill database used to develop wireframe models and estimate grades was checked through appropriate QA/QC procedures to ensure it is accurate. |
| | |
| 10/03/2017 |
Page 25 - 6
2017 Updated Preliminary Economic Assessment on the Ann Mason Project
Nevada, U.S.A.
| · | The construction of the 2012 Blue Hill Resource Model is consistent with CIM Estimation of Mineral Resources and Mineral Reserves Best Practice Guidelines. |
| · | The modelling and grade estimation process used is appropriate for a porphyry-style copper-molybdenum-gold-silver deposit and the resource model is suitable to support mine planning for a large-scale open pit mine. |
| · | The Mineral Resource estimates meet the definition of Mineral Resources under CIM Definition Standards for Mineral Resources and Mineral Reserves (May 10, 2014). |
| · | The resource model should be updated after completion of the next drill program at Blue Hill in order to incorporate the five drill holes not currently in the estimate and any additional drill holes. |
Mineral Resources at Blue Hill were estimated by Mr. Pierre Desautels, P.Geo. of AGP.
Mineral Resources that are not Mineral Reserves do not have demonstrated economic viability.
| 25.4.1 | Ann Mason Deposit |
The current pit-constrained Mineral Resource estimate at Ann Mason is based on approximately 106,452 m of drilling including 78 Entrée holes and 120 historical holes. The resource database also includes re-assaying by Entrée of 6,142 samples from 44 historical Anaconda core holes, to allow molybdenum, gold and silver values to be estimated. At a base case cut-off of 0.20% Cu, the deposit is estimated to contain Measured and Indicated Mineral Resources of 1,400 Mt at 0.32% Cu, 0.006% Mo, 0.03 g/t Au and 0.65 g/t Ag and Inferred Mineral Resources of 623 Mt at 0.29% Cu, 0.007% Mo, 0.03 g/t Au and 0.66 g/t Ag.
| 25.4.2 | Blue Hill Deposit |
The current pit-constrained Mineral Resource estimate at Blue Hill was completed by AGP, based on Entrée's drilling of 30 RC and core holes totalling approximately 6,822 m. In addition, the estimate incorporates approximately 2,381 m of RC drilling (7 holes) and 1,057 m of core drilling (2 holes) completed by PacMag, and 10 historical Anaconda RC and core holes totalling approximately 2,927 m. At a base case cut-off of 0.10% Cu, the deposit is estimated to contain 72.13 Mt averaging 0.17% Cu of combined oxide and mixed material containing 277.5 Mlb of copper. Underlying the oxides and mixed styles of mineralization is an additional 49.86 Mt of sulphide mineralization averaging 0.23% Cu (at a 0.15% Cu cut-off) containing 253.5 Mlb of copper. The sulphide mineralization remains open in most directions, most importantly, to the southeast towards Ann Mason.
A total of 10 holes drilled in 2013 and 2015 were added to the database. Four of those holes were located in close proximity to the Blue Hill Mineral Resource estimate but were considered not material to the overall Ann Mason Project, therefore the Blue Hill Mineral Resource estimate was not updated and remains the same as in the 2012 PEA.
| | |
| 10/03/2017 |
Page 25 - 7
2017 Updated Preliminary Economic Assessment on the Ann Mason Project
Nevada, U.S.A.
| 25.5 | Geotechnical |
Entrée retained BGC in association with AGP to undertake a geotechnical review of the proposed open pit.
The geotechnical review was limited to:
| · | a compilation and review of the available data relevant to geotechnical evaluations of the open pit slopes |
| · | a summary of the Project setting, including the engineering geology and hydrogeology of the study area based on the available data |
| · | estimates of ranges of overall pit slope angles, based on existing open pits in similar geologic units, for use in the PEA-level pit optimizations carried out by AGP |
| · | recommendations for geotechnical assessments of the proposed open pits, to be undertaken as part of a PFS. |
The rock mass of the Ann Mason deposit may be divided into three main geotechnical units:
| · | Tertiary volcanics (AM-VOL) |
| · | granodiorite of the Yerington batholith (AM-GD) |
| · | quartz monzonite porphyry of the Yerington batholith (AM-QMP). |
Bedding is the main geological structure observed in the volcanic rocks of the Ann Mason deposit. The bedding dips on average at 62° to the west. This west dip of the bedding is a result of the regional tilting due to the rotation of normal faulting.
The main faults of the Ann Mason deposit are the Singatse Fault, the Montana Yerington Fault (1.5 km east of pit), and several possible southeast-striking normal faults. The flat, extensional, concave Singatse Fault dips east at about 12° or less.
Slope design recommendations have been provided to AGP by BGC for the bench, inter-ramp, and overall slope scales. With consideration of the preliminary stage of study, the proposed size of open pit for the Ann Mason deposit, and the associated economic impacts of the pit slope angles, a range of slope angles (Cases A, B, and C) were provided for use by the mine planners. Case B was ultimately chosen by the mine planners.
The Ann Mason deposit is divided into two domains for estimating open pit slope angles:
| | |
| 10/03/2017 |
Page 25 - 8
2017 Updated Preliminary Economic Assessment on the Ann Mason Project
Nevada, U.S.A.
| · | slopes within the volcanics (AM-VOL) geotechnical unit (Domain I) |
| · | slopes within the granodiorite (AM-GD) and quartz monzonite porphyry (AM-QMP) geotechnical units (Domain II). |
The maximum inter-ramp height is limited at this stage of study to 150 m in the Ann Mason deposit; each slope segment is assumed to be separated by ramps or geotechnical berms, which may be wider than the standard berms. The ramps or geotechnical berms must be wide enough to provide access for the installation and maintenance of dewatering wells, piezometers, slope-monitoring prisms, or other geotechnical instrumentation. Limiting the inter-ramp slope height also serves to limit the maximum size of potential inter-ramp scale slope failures.
Based on the apparent rock mass quality and expected slope heights, the achievable overall angles in Domain I will be limited by the bench scale slope geometry. Bench face angles of 65° to 70° (67° on average) are assumed based on the generally fair rock mass quality in this domain. A single bench height of 15 m has been used. Double benching may be possible in Domain I due to the Fair rock mass quality, resulting in a final bench height of 30 m. With an estimated minimum catch bench width of 11 m to manage potential rock fall hazards, the maximum inter-ramp angle is 52°.
The achievable overall slope angles in Domain II are expected to be limited by the rock mass quality. Bench face angles may range from 60° to 65° (63° on average) for these cases, based on BGC's experience with benches in other mines and BGC's observations from the Yerington Pit. A single bench height of 15 m has been used. Domain II should be limited to single benches, considering the generally Poor quality of the rock mass observed during BGC's review of the drill core. Assuming a maximum inter-ramp height of 150 m so that pit dewatering objectives can be achieved, an 11 m catch bench width is required for Case B (39° inter-ramp angle).
| 25.6 | Open Pit Mining |
The Ann Mason Project uses Measured, Indicated and Inferred Mineral Resources in the overall mine plan. Inferred Mineral Resources are considered too speculative geologically to have the economic considerations applied to them that would enable them to be categorized as Mineral Reserves. The open pit plans described in this study are preliminary in nature and there is no certainty that the plans will be realized. Mineral Resources that are not Mineral Reserves do not have demonstrated economic viability.
The LOM mill feed percentages are 44% Measured Mineral Resources, 51% Indicated Mineral Resources and 5% Inferred Mineral Resources.
| | |
| 10/03/2017 |
Page 25 - 9
2017 Updated Preliminary Economic Assessment on the Ann Mason Project
Nevada, U.S.A.
The total mill throughput in the 2017 PEA mine plan is estimated to be 835 Mt at 0.30% Cu, 0.005% Mo, 0.03 g/t Au and 0.59 g/t Ag of Measured and Indicated material, and 42 Mt at 0.27% Cu, 0.005% Mo, 0.03 g/t Au and 0.58 g/t Ag of Inferred material. The strip ratio for the life of the mine is 2.01:1. A period of three years prior to milling commencing will be required to ensure that sufficient material is available for continuous milling operation. Waste stripping is at its highest level from Years -1 to Year 7 with an average of 163 Mt/a mined. The stripping level then drops to 130 Mt/a for Years 8 to 13. After Year 13, the waste stripping requirements tail off until Year 21 at which time all the remaining material in the pit is above cut-off grade. The pit design is comprised of five phases all with detailed accesses included in the designs. The fifth phase was designed using a LG shell that had used a $2.00/lb Cu price to define the limits.
Operating costs for the open pit are expected to average $1.50/t total material over the LOM or $4.13/t of mill feed. At the peak of material movement in Years 1 to 7, the major equipment fleet is expected to consist of seven 311 mm drills, two 40.5 m3 front-end loaders, four 55.8 m3 electric cable shovels and forty 360-tonne trucks. Normal support equipment (track dozers, rubber tired dozers, graders) would also be part of the fleet to maintain normal mining operations.
The rock in the Project is assumed to be non-acid generating. This assumption needs to be verified in further levels of study but is not expected to be a concern. Waste material will be stored in the WRMF located on the southwest side of the open pit. A portion of the waste material from the pre-stripping operation will be directed to the South Dam of the TMF to prepare the facility rather than quarrying. The WRMF will have an elevation of 1,605 m until Year 6 after which time it will start to add lifts. Final design elevation is 1,680 m. Concurrent resloping and reclamation of the WRMF will occur to minimize final reclamation requirements.
Additional geotechnical review is required to enhance the pit slopes by sector with consideration for design ramps.
Condemnation drilling is required in all areas currently proposed for waste or tailings placement.
| 25.7 | Metallurgy and Process |
Samples from the Ann Mason Project have been submitted for two metallurgical testwork programs over the last four years, in 2011/2012 at Metcon Research and in 2015 at SGS Minerals Services. Both studies indicate that Ann Mason mineralization is amenable to concentration using conventional mineral processing methods, namely SAG and ball milling, followed by froth flotation.
| 25.7.1 | Ann Mason |
Scoping and results from PFS level studies have indicated that the Ann Mason sulphide feed is amenable to concentration using a conventional SAG mill/ball mill grinding circuit, followed by flotation to produce a saleable copper concentrate, with no penalty elements identified.
| | |
| 10/03/2017 |
Page 25 - 10
2017 Updated Preliminary Economic Assessment on the Ann Mason Project
Nevada, U.S.A.
The following conclusions regarding the metallurgical response of Ann Mason mineralization may be drawn from the metallurgical testwork completed to date:
Grindability testing of a composite sample from the Ann Mason deposit revealed a moderate Bond Ball Work Index average of 15.9 kWh/t, and JK Drop-weight Axb and ta parameters of 49.4 and 0.78, respectively.
The composite samples were found to be amenable to conventional concentration using froth flotation across a range of grinds and reagent dosages, with preferred economics found to exist at a primary grind P80 range of 150 µm to 160 µm.
A final copper concentrate of saleable grade (30% Cu) at a copper recovery of 92% was found to be achievable for the composites tested.
No potential penalty elements have been detected in the final concentrates as tested.
Initial tests show that the production of a separate molybdenum concentrate may be achievable by conventional copper/molybdenum separation flotation. From the testwork conducted, a flowsheet was developed consisting of primary crushing, SAG milling, closed circuit ball milling, copper-molybdenum bulk rougher flotation, concentrate regrinding, copper-molybdenum cleaner flotation, copper-molybdenum separation flotation, and product and tailings dewatering A Cu-Mo separation step generates final copper and molybdenum concentrate products for shipment to third party smelters. Based on the results of the testwork, a scoping level plant design was completed to process the Ann Mason sulphide feed at a nominal rate of 100,000 t/d and then scaled to the 120,000 t/d case used in the economic model. The design combines industry standard unit process operations into a flowsheet that can be considered to be of low to medium complexity.
Variability testing on 11 composite samples representing varying grades, lithologies, and areas of the deposit confirmed the hardness and flotation response indicated by the domain composites.
| 25.7.2 | Blue Hill |
Preliminary testwork conducted on composite samples from the Blue Hill oxide deposit has indicated that:
| · | Blue Hill composites are amenable to copper extraction by sulphuric acid heap leaching |
| · | four composite samples were evaluated by standard column testing at a crush size P80 of ¾" with copper recoveries averaging 84.8 % after 91 days of leaching |
| · | acid consumption for the column tests averaged 11.95 kg/kgCu, or 18.04 kg/t. |
| | |
| 10/03/2017 |
Page 25 - 11
2017 Updated Preliminary Economic Assessment on the Ann Mason Project
Nevada, U.S.A.
| 25.8 | Infrastructure and Site Layout |
The infrastructure and site plan designs are based on information from published data and from previous work on similar operations. Several assumptions were made in the costing of this portion of the Project, and subsequent testing will provide more accurate data for refining the site plan design and associated infrastructure costs.
The site for the mill and operations was chosen for the following reasons:
| · | relative proximity to the open pit |
| · | site is on top of a relatively flat height of land |
| · | proximity to existing electrical infrastructure and water sources. |
For the purposes of this study, water sources required for operations will be supplied by nearby wells, recycle water from the tailings area, and water from mine dewatering operations.
This study assumed that the electrical capacity at point of connection to the NV Energy grid can support the load associated with this Project. It is anticipated that this load is approximately 110 MW. Other potential projects in this area of the grid are being evaluated, and residual grid power is available on a first-come, first-served basis.
The TMF is located to the west of the Ann Mason pit. It is required to provide secure containment for the planned 685.5 Mm³ of tailings. A tailings density of 1.28 t/m3 was used for the volume calculation and slopes of 3.5:1 (H:V).
The TMF will ultimately require four separate dams and their parameters are:
| · | South Dam |
| · | 4 km long, 125 m high (rock fill and tailings) |
| · | 94.6 Mm3 total volume with 21.8 M of rock fill |
| · | North Dam |
| · | 3.5 km long, 65 m high (rock fill) |
| · | 26.5 Mm3 |
| · | Middle Dam |
| · | 1.3 km long, 25 m high (rock fill) |
| · | 3.3 Mm3 |
| · | Saddle Dam (61,400 m3). |
| | |
| 10/03/2017 |
Page 25 - 12
2017 Updated Preliminary Economic Assessment on the Ann Mason Project
Nevada, U.S.A.
The freeboard during operation is set at 10 m and the end of mine freeboard is designed for 5 m.
Tailings slurry will be pumped via a 5 km pipeline from the plant to the South tailings dam. Cyclones will be used to construct the upper portion of the South Dam by segregating coarse and fine material. Process water will be reclaimed from the TMF and returned to the plant via a dedicated reclaim water pumpset and pipeline.
The TMF plays a key role in site water management by providing buffering of process water, direct precipitation and runoff. The detailed water balance has not been completed for this study. Costing for surface diversion ditches along the western edge of the TMF has been included in the capital costing. This is to capture and divert water from the TMF without direct contact to mine activity.
Seepage collection ponds and pumping systems are considered in the costing for each of the dams and will be returned to the process plant via the reclaim water system or to the TMF.
The plant site drainage will be collected in a settling pond with disposal to the process water pond. Mine water collection will be pumped to a small settling pond near the primary crusher. This water will be used to water the roads with excess water sent to the TMF. Surface drainage will be diverted away from the mine where possible to ensure direct contact with active mining areas does not occur. If contact does occur, it will be directed to the mine settling pond.
| 25.9 | Economic Analysis |
The 2017 PEA has shown that a mine life of 21 years is possible with a 120,000 t/d operation. The Project has a pre-tax NPV of $1,158 million with a 7.5% discount rate (post-tax $770 million). The IRR for the Project is 15.8% on a pre-tax basis (post-tax 13.7%). The metal prices used to determine the above Base Case values were $3.00/lb for copper, $11.00/lb for molybdenum, $1,200/oz for gold and $20/oz for silver. The pre-tax payback period is estimated at 6.4 years with payback occurring in Year 7 from the start of milling operations (post –tax 6.9 years).
The greatest sensitivity in the Project is metal prices. The Base Case uses a $3.00/lb Cu price. The three-year trailing average price for copper as of October 16, 2015 was $3.09/lb. The current three-year trailing average copper price is only $2.60/lb but trending upwards again. The 10-year trailing average price is $3.08/lb which may be more realistic for a long life project such as Ann Mason which would encounter various points in the typical copper price cycle. Entrée believes that longer-term copper prices will recover to the Base Case ranges provided in this Technical Report.
| | |
| 10/03/2017 |
Page 25 - 13
2017 Updated Preliminary Economic Assessment on the Ann Mason Project
Nevada, U.S.A.
The second most sensitive parameter is recovery. To calculate the sensitivity to recovery, a percentage factor was applied to each metal recovery in the same proportion. Therefore, while sensitivity exists, actual practice may show less fluctuation than is considered in this analysis. Recovery testwork has not indicated recoveries in the range of 75% which the -20% change in recovery would represent. As copper represents 92.6% of the revenue (using Base Case metal prices), this large a swing in recovery has the obvious effect of influencing the Project, but may not be realistic.
The project development options are sufficiently understood and the project shows positive economics to support a decision to proceed to a PFS.
The 2017 PEA is preliminary in nature, it includes Inferred Mineral Resources that are considered too speculative geologically to have the economic considerations applied to them that would enable them to be categorized as Mineral Reserves and there is no certainty that the 2017 PEA will be realized. Mineral Resources that are not Mineral Reserves do not have demonstrated economic viability.
The results of the economic analysis constitute forward-looking statements within the meaning of the United States Private Securities Litigation Reform Act of 1995 and forward-looking information within the meaning of applicable Canadian securities laws. While these forward-looking statements are based on expectations about future events as at the effective date of this Report, the statements are not a guarantee of the Company's future performance and are subject to risks, uncertainties, assumptions and other factors, which could cause actual results to differ materially from future results expressed or implied by such forward-looking statements. Such risks, uncertainties, factors and assumptions include, amongst others but not limited to metal prices, mineral resources, smelter terms, labour rates, consumable costs and equipment pricing. There can be no assurance that forward-looking statements will prove to be accurate, as actual results and future events could differ materially from those anticipated in such statements.
| | |
| 10/03/2017 |
Page 25 - 14
2017 Updated Preliminary Economic Assessment on the Ann Mason Project
Nevada, U.S.A.
| 26 | Recommendations |
| 26.1 | Introduction |
The project development options are sufficiently understood and the project shows positive economics to support a decision to proceed to a PFS. As an intitial step, two stages of in-pit drilling and a program of regional exploration are recommended by Amec Foster Wheeler. Stage 1 is designed to bring most of the remaining Inferred Mineral Resources within the current Phase 5 pit to a minimum Indicated category. Stage 2 would test the area outside of the 0.15% Cu grade shell within the Phase 5 pit. Finally, a program of exploration drilling is recommended to test several priority targets on other parts of the property. The recommendations and associated budgets are described in the sections below.
Blue Hill and several shallow, peripheral oxide targets remain as very strong priorities for Entrée that will be further explored during the regional exploration phase of drilling. Although not included in the 2017 PEA, Blue Hill remains an attractive target for exploration and Mineral Resource development having the potential to provide a source of near-surface, oxide copper mineralization, which could potentially be recovered through a solvent extraction/electrowinning (SXEW) process. Below the oxide mineralization, these targets also have the potential to provide additional sulphide mill feed to Ann Mason.
| 26.2 | Drilling |
| 26.2.1 | Stage 1 In-Pit Drilling |
A drilling progame to upgrade the Inferred Mineral Resources within the Phase 5 pit to Indicated or Measured to support the PFS is a priority for Entrée. Currently approximately 5% of the Mineral Resources within the Phase 5 pit are classified as Inferred, with the remaining 95% classified as Measured plus Indicated. Amec Foster Wheeler recommends an infill drill program of approximately 5,000 m (combined core and RC) in 12 holes averaging about 400 m in length to achieve this goal. RC pre-collars will be used through the overlying volcanic rock.
| 26.2.2 | Stage 2 In-pit Drilling |
Amec Foster Wheeler also recommends a phase of additional drilling outside of the current Mineral Resource, but still within the Phase 5 pit. These holes will be drilled on an approximate 200 m x 200 m to 400 m x 400 m grid spacing to test for extensions of the current Mineral Resource in all directions. Similar to the infill program, the holes will be core, but those collared in the volcanic will have RC pre-collars. This phase will require approximately 3,800 m of drilling (combined core and RC) in 16 core holes averaging 240 m in length.
| | |
| 10/03/2017 |
Page 26 - 1
2017 Updated Preliminary Economic Assessment on the Ann Mason Project
Nevada, U.S.A.
Table 26-1 shows the proposed budget for Phase 1 and Phase 2 in-pit drilling.
Table 26-1: Ann Mason Stage 1 and 2 Drilling Recommended Budget
Stage 1 and Stage 2 Drilling Program | Approx. Cost ($) | |
Stage 1 Core Drilling* (12 holes, including mobilization/demobilization) | 3,100 m @ $270/m | 837,000 |
Stage 1 RC pre-collars (11 holes, including mobilization/demobilization) | 2,000 m @ $90/m | 180,000 |
Stage 2 Core Drilling* (10 holes, including mobilization/ demobilization) | 1,800 m @ $270/m | 486,000 |
Stage 2 RC pre-collars (9 holes, including mobilization/demobilization) | 01,600 m @ $75/m | 144,000 |
Stage 2 RC holes (2 holes, including mobilization/demobilization) | 400 m @ $75/m | 30,000 |
Analytical (including QA/QC) | 3,125 samples @ $40/sample | 125,000 |
Travel, accommodation, etc. – 3.5 mo.) | - | 125,000 |
Drill site preparation, reclamation, water, supplies | - | 205,000 |
Consultants | - | 192,000 |
Total Stages 1 and 2 | 2,324,000 |
| Note: | Many of the core holes have RC collars, which is included in the total metres for RC drilling. Cost estimates based on Entrée previous expenditures. Costs rounded to nearest $1,000. |
| 26.2.3 | Regional Exploration Drilling and Core Resampling |
Entrée has developed a regional exploration program designed to test known mineralization and geophysical targets. Amec Foster Wheeler recommends a drill program of approximately 8,000 m combined core and RC to test these targets as follows:
| · | Ann Mason/Blue Hill Exploration (1,150 m) – two core holes with RC pre-collars averaging approximately 575 m in depth to explore for extensions of Ann Mason mineralization south and west of the Ann Mason deposit. |
| · | Blackjack IP Target (3,800 m) – approximately 5 widely spaced core holes with RC pre-collars, 700 to 900 m in depth to test the east-west trending Blackjack IP anomaly for porphyry-style mineralization. |
| · | Blue Hill/Ann Mason Oxide Targets (2,700 m) – approximately 15 widely spaced RC holes to test for shallow, oxide-copper mineralization to the west and northwest of Blue Hill ,near Blue Hill hole EG-BH-11-031 and east of the Blackjack IP zone. |
| · | Blue Hill Sulphide Targets (400 m) – one hole, about 400 m deepto extend previously drilledRC hole EG-BH-10-001, to test extensions of the Blue Hill sulphide mineralization. |
| | |
| 10/03/2017 |
Page 26 - 2
2017 Updated Preliminary Economic Assessment on the Ann Mason Project
Nevada, U.S.A.
Completion of the Ann Mason exploration drilling, the Blue Hill deposit and Blackjack target oxide drilling, the Blackjack IP anomaly drilling and Roulette drilling will establish if potentially viable targets occur at depth in these areas that would require further drilling, and further guide the placement of proposed infrastructure, related to the Ann Mason Project.
Core Re-Sampling at Blue Hill
Since the historical drilling completed by Anaconda at Blue Hill did not include the analysis of molybdenum, silver, and gold, AGP recommends Entrée extend its core re-sampling program to test for these elements. This will be important to validate the historical copper values and update the database with these new copper grades as well as molybdenum, gold, and silver. AGP believes that the additional data will increase confidence in the model.
It is estimated that re-sampling should include approximately 2,400 m of Anaconda core (about 1,200 samples, including QC).
AGP also recommends collecting bulk density samples in the Tertiary volcanics to the east of the Blue Hill Fault, which is currently inside the Mineral Resource constraining pit shell and has only been sampled by RC drilling.
Table 26-2 shows the proposed budget for exploration drilling and core resampling.
Table 26-2: Regional Exploration Drilling and Core Resampling Recommended Budget
Regional Exploration | Approx. Cost ($) | |
Core Drilling* (8 holes, including mobilization/demobilization) | 3,900 m @ $270/m | 1,053,000 |
RC Pre-collar Drilling (5 holes, including mobilization/demobilization) | 1,275 m @ $90/m | 115,000 |
RC Drilling (15 holes, including mobilization/demobilization) | 2,900 m @ $75/m | 219,000 |
Drilling Analytical (including QA/QC) | 4,025 samples @ $40/sample | 161,000 |
Core Re-Sampling Analytical (including QA/QC) | 1,200 samples @ $40/sample | 48,000 |
travel, accommodation, etc. – 4 mo.) | 100,000 | |
Drill site preparation, reclamation, water, supplies | 185,000 | |
Consultants | 192,000 | |
Total | 2,073,000 |
| Note: | Costs rounded to nearest $10,000. |
| 26.3 | Prefeasibility Work |
AGP recommends that Entrée develop a thorough PFS scope and detailed budget. AGP estimates that in addition to the budget for the two stages of in-pit drilling and regional exploration recommended above, a PFS for Ann Mason would be approximately $9 to $11 million to complete. Proceeding with the activities that would allow completion of a PFS would be contingent upon Entrée receiving board approval to complete the PFS and Entrée having the required funding in place. The PFS would cover areas such as:
| | |
| 10/03/2017 |
Page 26 - 3
2017 Updated Preliminary Economic Assessment on the Ann Mason Project
Nevada, U.S.A.
| · | updated Mineral Resource estimate |
| · | geotechnical studies |
| · | condemnation drilling |
| · | tailings management facility design and site geotechnical |
| · | environmental management studies and data collection |
| · | concentrate marketing and sales studies |
| · | capital and operating cost estimation |
| · | financial evaluation |
| · | project management and administration. |
Aspects of the study could take place concurrently with the drilling programs described in Sections 26.2.1 to 26.2.3. Environmental and social work and some of the geotechnical work could occur at this time.
The following subsections provide some detail on some of the components of the PFS.
| 26.4 | Geotechnical |
The following work is recommended at the PFS level stage of study to support the estimation of open pit slope angles for the Ann Mason deposit, based on site-specific data.
| 26.4.1 | Geotechnical Drilling |
Rock mass quality and structural geology data are needed for the proposed wall rocks of the Ann Mason deposit. This includes geotechnical drilling in the area of the final slopes. A minimum of four inclined core holes should be completed, each of which may be up to 800 m long. All holes should be completed using a "triple tube" coring system with splits in the core tube. HQ3 diameter core would be preferred. All core should be logged for the appropriate geotechnical parameters.
| 26.4.2 | Borehole Televiewer Surveys |
As the rock mass quality may be generally poor throughout the Ann Mason deposit, traditional core orientation tools are not expected to provide good structural geology data. As a result, all geotechnical drill holes should be surveyed with a borehole televiewer system. Geological structures can be identified from the resulting images; the orientation and frequency of these structures are an important input into PFS level slope stability assessments of the proposed open pits.
| | |
| 10/03/2017 |
Page 26 - 4
2017 Updated Preliminary Economic Assessment on the Ann Mason Project
Nevada, U.S.A.
| 26.4.3 | Hydrogeology Field Assessments |
Packer testing should be undertaken in each of the geotechnical drill holes to estimate the hydraulic conductivity of the rock mass. In addition, piezometers should be installed in each drill hole to monitor the seasonal fluctuations in the groundwater elevation of the site. Grouted-in vibrating wire piezometers are preferred for the inclined drill holes. The data resulting from these field assessments will be used in PFS level assessments of the groundwater inflows to the proposed pits and the preliminary design of a pit dewatering system.
| 26.4.4 | Laboratory Testing |
Core samples should be selected from the geotechnical drill holes for laboratory testing. Uniaxial compressive strength, tensile strength, and small scale direct shear strength testing should be undertaken. The results of these tests are required to further characterize the rock masses of the pit proposed for the Ann Mason Project, and to conduct stability assessments of the open pit slopes.
| 26.4.5 | Groundwater Monitoring |
An initial phase of 14 groundwater monitor wells, some with piezometers and some designed for water sampling and future pump tests are included in the PFS budget and have received preliminary approval from NDEP. The proposed wells are located in and on the periphery of the Ann Mason pit, the periphery of the waste rock and tailings management facilities and on the east flank of the Singatse Range.
| 26.4.6 | Geotechnical Mapping |
Geotechnical mapping of outcrop should be carried out in the proposed pit areas to provide additional data for rock mass characterization and structural geology assessments. Outcrops of the volcanic rocks are accessible and should yield very good data. The potential for mapping outcrops of the intrusive rocks should be reviewed.
| 26.4.7 | Geological Modelling |
Entrée has developed a preliminary three-dimensional model for the Ann Mason deposit. Interpretations of the main rock types, alteration zones, depth of weathered zones, and major geological structures should be advanced. The extents of the model should encompass the outer limits of the largest proposed Ann Mason pit. This geological model is required for future slope stability and hydrogeological assessments as the stability of the slopes is closely related to the geologic and hydrogeologic models, as discussed below.
| | |
| 10/03/2017 |
Page 26 - 5
2017 Updated Preliminary Economic Assessment on the Ann Mason Project
Nevada, U.S.A.
| 26.4.8 | Geotechnical Model Development and Open Pit Slope Designs |
Based on the results of the geotechnical drilling, laboratory testing, and updated geological modelling, a preliminary geotechnical model of the study area should be developed. The geotechnical model includes the characterization of the geotechnical units and the development of structural domains. These will be combined into geotechnical domains, which will serve as the basis for PFS level open pit slope designs. Open pit slope designs should be completed for the Ann Mason deposit based on the compiled project specific data. These designs would be used by the mine planners for pit optimizations and the layout of the open pit phases.
| 26.4.9 | Review the Potential for Toppling Failure Mode |
There is insufficient data at this stage of study to assess the potential for toppling instabilities in the final walls of the proposed Ann Mason pit. However, considering the structural geology of the area and some of observations of toppling in the Yerington Pit, the potential for toppling slopes should be reviewed at the next stage of design. Specifically, the proposed southwest walls of the Ann Mason open pit should be assessed for toppling with consideration of the southeast striking normal faults interpreted by Entrée.
| 26.4.10 | Hydrogeological Model and Pit Dewatering Assessments |
A conceptual hydrogeological model should be developed for the project area based on the geological model and available hydrogeological field data. Pit inflow estimates should be made based on this model and the proposed open pit phases. These estimates may be made via a 3D numerical hydrogeological model or using an analytical solution. The results of this work will be needed for the overall project water balance and the preliminary design of the in-pit water management infrastructure.
Based on the results of the slope stability assessments a slope depressurization system may be required for the Ann Mason pit. A 3D numerical model can be used to estimate the distribution of pore pressure in the open pit slopes and assist in the preliminary design of a slope depressurization system.
| 26.5 | Open Pit Mining |
ARD testwork needs to be completed on the material from the pit and potential quarry sites to ensure that there are no long-term waste storage issues that may exist. From this, variations in the waste storage options would need to be considered. Humidity cell testwork takes six months or longer to develop accurate predictions.
Other areas for waste storage that may improve haulage times need to be examined for their suitability.
| | |
| 10/03/2017 |
Page 26 - 6
2017 Updated Preliminary Economic Assessment on the Ann Mason Project
Nevada, U.S.A.
Rock strength parameters suitable for accurate blasting estimation needs to be undertaken. The fragmentation size possible will then be used to assist in the design of the primary crusher and other milling functions.
Comprehensive costing of labour, explosives, and equipment needs to be undertaken. Further examination of in-pit or near-pit crushing should be considered for plant feed and potentially waste to reduce operating and capital cost requirements.
Condemnation drilling needs to be considered under all waste storage locations, including the tailings dams, plus the plant site and around Blue Hill.
| 26.6 | Metallurgy and Processing |
To complement the results presented here, additional metallurgical characterization of the Ann Mason deposit is recommended as follows:
| · | Modelling of the comminution circuit to more accurately size crushing, SAG milling, and ball milling equipment. |
| · | Further optimisation of the Cu-Mo separation circuit to verify final concentrate grade and recovery, and determine reagent requirements and circuit configuration. |
| · | Mineralogical study of optimized flowsheet tailings to characterise metal losses and identify potential opportunities for additional recovery. |
Recommendations for future work on samples from the Blue Hill deposit include:
| · | Further study of the effect of crush size, acid addition, and column height on copper extraction and acid consumption. |
| · | Additional characterization and column leach testing of the mixed zone of the deposit. |
| · | Ongoing mineralogical study of the Blue Hill oxide deposit to improve the understanding of the constituent minerals, their variability in the deposit, and their effect on copper extraction and acid consumption. |
| 26.7 | Infrastructure and Site Layout |
Additional testing and data is required to further define the infrastructure and site layout requirements and associated costs in these areas:
| · | Topographical information to provide more detail for infrastructure design, including power line routing, access road rehabilitation, and building placement. |
| · | Geotechnical testing and data to further develop construction requirements for the mill, tailings and services sites. |
| | |
| 10/03/2017 |
Page 26 - 7
2017 Updated Preliminary Economic Assessment on the Ann Mason Project
Nevada, U.S.A.
| · | Hydrogeology and water quality testing on water sources surrounding the mine site to determine available volumes and quality of water required to support the mill and services infrastructure. |
| · | Additional electrical study is necessary in order to validate the conceptual design and the assumed load capacity at the NV Energy grid connection. The local electrical utility (NV Energy) can perform an Electrical Service Agreement (ESA) study in order to model the effect of this connection and provide comment on any stability concerns. In the event that changes to the NV Energy grid are required to support this connection, the ESA will provide a cost estimate for the necessary capital upgrades. |
| · | Materials testing and quarry location scoping for design and construction cost estimates. |
| · | Foundation testing, quarry placement, and material suitability studies need to be completed for the plant site and all the tailings dam locations. |
| · | Alternate tailings location study for proper sizing and locating of the tailings facility. |
| · | Condemnation drilling under the plant, WRM, and tailings areas. |
| · | Environmental and socioeconomic studies. |
| 26.8 | Waste and Water Management |
A complete hydrogeological review of water in the mining area needs to be undertaken. This entails both quantity and quality sufficient for operation of the process plant and mine. In addition, the precipitation and drainage areas need to be determined for proper estimating of diversion dam/ditches to minimize contact of fresh water with mining areas.
The tailings management facility and waste rock management facility areas need to have complete hydrological evaluations completed for surface runoff, ground water, and seepage.
ARD and metal leaching testwork needs to be developed and completed for proper waste rock characterization and development of storage options.
| 26.9 | Environmental |
Entrée's Exploration Plan of Operations (Plan) for the Ann Mason Project focused on exploration activities and in minimizing and mitigating the impact on the environment. With the 2017 PEA completed and some understanding of the potential size and scope of the Project now understood, the data collection and testwork can begin in earnest to prepare for the next stage of study and ultimately permit applications.
Basic data collection needs to commence immediately covering a wide range of diverse subjects, including: weather, water flows, vegetation, wildlife, and socio-economic. A comprehensive program will need to be established to collect the required information necessary to comply with the respective agency permit application requirements. This is of critical importance to ensure that the permits may be issued in a timely manner. Baseline environmental studies, including Biology (vegetation and wildlife), Cultural Resources, and Waters of the United States & Wetland Delineation, have been completed on approximately 4,063 ha (10,040 acres) of the Project area. Reports on the survey results have been submitted to the Bureau of Land Management (BLM) and the US Army Corps of Engineers for review.
| | |
| 10/03/2017 |
Page 26 - 8
2017 Updated Preliminary Economic Assessment on the Ann Mason Project
Nevada, U.S.A.
A detailed PFS plan will also be required to build upon the other information collected. These two items will require advancing forward in parallel with the technical experts providing input into the permit application process. Detailed environmental and engineering information must be collected in at least the following areas:
· air quality · cultural resources · environmental justice · floodplains · geology and geochemistry · land use authorization · livestock grazing management · meteorology · migratory birds · minerals · native American religious concerns · paleontological resources | · noxious weeds, invasive, and non-native species · social and economic values · soils · special status plants and animals · threatened and endangered species · vegetation · visual resources · wastes (solid and hazardous) · water (surface and ground) · wild horses and burros · wildlife. |
Seasonal data of at least 12 months may be required for some of the elements above. The programs should start as soon as possible.
| | |
| 10/03/2017 |
Page 26 - 9
2017 Updated Preliminary Economic Assessment on the Ann Mason Project
Nevada, U.S.A.
| 27 | References |
Arimetco, 1991. Report on the Ann Mason Property, Lyon County, Nevada. March 1991. 61 pages.
Bieniawsli, Z.T., 1976. Rock mass classification in rock engineering. In: Proceedings of the Symposium on Exploration for rock Engineering. pp 92-106.
BLM, 2009. Environmental Assessment, NV-C020-2010-0002-EA. MIM (USA), INC., Ann Mason Exploration Project, Lyon County, Nevada. Bureau of Land Management, Carson City District Office. December 2009. 51 pages.
Carten, R.B., 1986. Sodium-calcium metasomatism: chemical, temporal, and spatial relationships at the Yerington, Nevada, porphyry copper deposit; Economic Geology v.81, pp.1495-1519.
Deere, D.U. and Deere, D.W. 1988. The rock quality designation (RQD) index in practice. In: Rock Classification Systems for Engineering Purposes, AST STP 984. pp 91-101.
Dilles, J.H., 1984. The petrology and geochemistry of the Yerington batholith and the Ann Mason porphyry copper deposit, western Nevada: Unpub. Ph.D. thesis, Stanford Univ., 389 p.
Dilles, J.H., 1987. Petrology of the Yerington Batholith, Nevada: evidence for evolution of porphyry copper ore fluids; Economic Geology, V. 82, pp. 1750-1789.
Dilles, J.H., and Einaudi, M.T., 1992. Wall-rock alteration and hydrothermal flow paths about the Ann-Mason porphyry copper deposit, Nevada – A 6 km vertical reconstruction: Economic Geology, v. 87, p. 1963-2001
Dilles, J.H., and Proffett, J.M., 1995. Metallogenesis of the Yerington batholith, Nevada, in Porphyry Copper Deposits of the American Cordillera, Pierce, F.W. and Bolm, J.G., editors, Arizona Geological Society Digest 20, pp. 306-315.
Doebrich, J.L ., Garside, L.J., Shawe, D.R. 1996. Characterization of mineral deposits in rocks of the Triassic to Jurassic magmatic arc of western Nevada and eastern California: U.S. Geological Survey Bulletin. Open File Report 96-9. 107 pages.
Einaudi, M.T., 1971. Skarn-Type Copper Mineralization in the McConnell mine – Western Navada Mine Area, Yerington District, Lyon County, Nevada. The Anaconda Company, Geological Department. May 1971. 22 pages.
| | |
| 10/03/2017 |
Page 27 - 1
2017 Updated Preliminary Economic Assessment on the Ann Mason Project
Nevada, U.S.A.
Flores, G. and Karzulovic, A. 2002. Geotechnical guidelines for a transition from open pit to underground mining – Main activity 1: Bench marking report. ICS-II, Task 4. 85 pages.
Foster, J. R., 2012: Blue Hills Mineralization Mapping Exercise – August 2012, 17 October 2012, Unpublished Memo. 49 pages.
Fugro Airborne Surveys, 2008. Logistics and Processing Report, Airborne Magnetic and GEOTEM Survey, Yerington West and Eagle Flat, Nevada, June 2008, 85 pages.
Geotech Ltd., 2009. Report on a Helicopter-Borne Tri-Axis Electromagnetic (AirMt) and Aeromagnetic Geophysical Survey, Copper and Honey Blocks, Lyon County, Nevada, May 2009. 35 pages.
Golder, 2006. Report on Ann Mason Resource Estimation. Report submitted to PacMag Metals Limited. November 2006. 27 pages.
Gustavson, D.L., 1970. Blue Hill Project, Yerington Mining District, Lyon County, Nevada. The Anaconda Company, Geological Department. March 11, 1970. 6 pages.
Gustavson, D.L., 1971. Summary Report for the Ann-Mason Pass Project. The Anaconda Company, Geological Department. July 14, 1971. 51 pages. (Anaconda Document Collection – American Heritage Center, University of Wyoming).
Heberlein, D., 2009. Roulette Project, Nevada, Final Report on Field Work carried out November 8th to 12th, 2009. 18 pages.
Honey Badger Exploration Inc., 2009. Yerington West Project, Proposed Exploration Program. August 20, 2009. 11 pages. Unpublished document.
Howard, K.L., 1973. Progress Report, Ann-Mason Pass Project, Reinterpretation of Ann-Mason Grade Pattern. August 3, 1973. 7 pages. (Anaconda Document Collection – American Heritage Center, University of Wyoming).
Hudson D.H. and Oriel, W.M., 1979. Geologic map of the Buckskin Range, Nevada; Nevada Bureau of Mines and Geology, Map 64, scale 1:18,000.
Jackson, S., Cinits, R. and Jones, L., 2012. Technical Report and Updated Mineral Resource Estimate on the Ann Mason Project, Nevada, USA. Report to Entrée Gold Inc. March 26, 2012. 196 pages.
Jackson, S., Waldegger, M., Desautels, J.R.P., Zurowski, G., Jones, L., and Colantonio, M., 2012. Amended and Restated Preliminary Economic Assessment on the Ann Mason Project, Nevada, U.S.A. Report to Entrée Gold Inc. Effective Date: 24 October 2012. Amended October 15, 2014.
| | |
| 10/03/2017 |
Page 27 - 2
2017 Updated Preliminary Economic Assessment on the Ann Mason Project
Nevada, U.S.A.
Kulla, G., Oshust, P., Desautels, J.R.P., Melnyk, J., Zurowski, G., Jones, L., Colantonio, M., 2015. Updated Preliminary Economic Assessment on the Ann Mason Project, Nevada, U.S.A. Report to Entrée Gold Inc. Effective Date: 9 September 2015.
Langerfeldt, H.C., 1956. Summary of reconnaissance mapping and report on the Blue Hill area, Northwest Yerington District, Lyon County, Nevada. The Anaconda Company, Geological Department. October 1956. 21 pages.
Larson, L.T., 2012. Petrographic Report. January 7, 2012
Lindner, J., 2007. Logistics Report for PacMag Metals Ltd. 3D Induced Polarization Survey on the Minnesota Grid. 8 pages.
M3 Engineering and Technology Corporation, 2014. MacArthur Copper Project, Amended NI 43-101 Technical Report, Preliminary Economic Assessment, Lyon County, Nevada, U.S.A. January 17, 2014. 239 pages
Magee, C., 2007. Ground Magnetic Survey over the Minnesota Prospect, Douglas County, Nevada. July 2007. 6 pages.
Metcon, 2012a: Ann Mason Project, Flotation Study on Composite Samples (Phase 1). Metcon Research, February 2012.
Metcon, 2012b: Ann Mason Project, Flotation Study on Composite Samples (Variability Flotation Study), Metcon Research, June 2012.
Metcon, 2012c: Blue Hill Oxide Project, Column Leach Study on Composite Samples, Metcon Research, July 2012
Moore, L, 1971. Economic Evaluation of California-Nevada Iron Resources and Iron Ore Markets: U.S. Bureau of Mines Information Circular 8511, 207 p.
Morrison, R.S. and Cann, R.M., 2011. NI 43-101 Compliant Technical Report on the Ann Mason Property, Nevada, USA. Report to Entrée Gold Inc. March 11, 2011. 161 pages. (technical report filed under NI 43-101, SEDAR).
Morrison, R.S., 2010. Ann Mason Project Resource Estimate. Report to Entrée Gold Inc. Wardrop Document No. 1055270200-REP-R0001-05. January 2010. 102 pages. (technical report filed under NI 43-101, SEDAR).
MPC, 2007. PacMag Metals Ltd. Ann Mason Copper Project, Scoping Study. Project 6004. 76 pages. February 2007.
| | |
| 10/03/2017 |
Page 27 - 3
2017 Updated Preliminary Economic Assessment on the Ann Mason Project
Nevada, U.S.A.
Noakes, M.J., 1970. Summary Report: Ann-Mason Pass. Project No. 70-7. Intra Office Correspondence, The Anaconda Company, April 23, 1970, 19 pages
PacMag, 2007. The Buckskin Project, Nevada, USA. Unauthored summary on the Buckskin Project including interpretation of the 2006 IP survey.
Panteleyev, A., 1995. Porphyry Cu±Mo±Au. in Selected British Columbia Mineral Deposit Profiles, Volume 1 – Metallics and Coal, Lefebure, D.V. and Ray, G.E., Editors, British Columbia Ministry of Energy of Employment and Investment, Open File 1995-20, pp 87-92.
Proffett, J.M. and Dilles, J.H., 1984. Geologic Map of the Yerington District, Nevada. Nevada Bureau of Mines and Geology. Map 77.
Proffett, J.M. and Dilles, J.H., 2008. Lower Mezozoic sedimentary and volcanic rocks of the Yerington region, Nevada, and their regional context, in Wright, J.E., and Shervais, J.W. eds., Ophiolites, Arcs, and Batholiths: A Tribute to Cliff Hopson: Geological Society of America Special Paper 438, p. 251-288.
Proffett, J.M. and Proffett, B.H., 1976. Stratigraphy of the Tertiary ash-flow tuffs in the Yerington District, Nevada: Nevada Bureau of Mines and Geology Report 27. 28 pages.
Pyle, P. 2003. Summary Report, Ann Mason Project, Yerington Mining District, Lyon County, Nevada. MIM (USA) Inc. January 2003. 48 pages.
Sheldrake, R.F. and Rastad, S. 2006. 3D Induced Polarization Survey, Geophysical Report for PacMag Metals Limited on the Buckskin, Ann South and Ann Mason Projects, Lyon county, Yerington, Nevada. Survey conducted by SJ Geophysiscs Ltd. 8 pages.
Sillitoe, R.H., 2005. Supergene oxidized and enriched porphyry copper and related deposits. Economic Geology 100th Anniversary Volume, pp 723-768.
Sjoberg, J. 1996. Large scale slope stability in open pit mining – A review. Technical Report – Division of Rock Mechanics. Lulea University of Technology, Sweden. 299 pages.
Souviron, A., 1976. Progress Report on the Ann-Mason Project. Tucson, Arizona. February 1976. 20 pages. (Anaconda Document Collection – American Heritage Center, University of Wyoming).
Speed, R.C., 1979. Collided Paleozoic microplate in the western United States; Journal of Geology, v.87, pp.279-292.
| | |
| 10/03/2017 |
Page 27 - 4
2017 Updated Preliminary Economic Assessment on the Ann Mason Project
Nevada, U.S.A.
Speed, R.C.,1978. Paleogeographic and plate tectonic evolution of the early Mesozoic marine province of the western Great Basin, in Howell, D. G. and McDougall, K. A., eds., Mesozoic Paleogeography of the Western United States; Society of Economic Paleontologists and Mineralogists, Pacific Section, Pacific Coast Paleogeography Symposium, v.2, pp.250-270.
Stewart, J.H., 1972. Initial deposits in the Cordilleran Geosyncline: evidence of a Late Precambrian (<850 m.y.) continental separation; Geological Society of America Bulletin, v. 83 no. 5, pp. 1345-1360.
Stewart, J.H., 1980. Geology of Nevada: A discussion to accompany the Geologic Map of Nevada; Nevada Bureau of Mines and Geology Special Publication 4, 136p.
Tetra Tech, 2014. NI 43-101 Technical Report, Mineral Resource Update, Yerington Copper Project, Lyon County, Nevada. Report prepared for Singatse Peak Services, LLC.
Tingley, J.V. 1990. Mineral Resource Inventory, Nevada Bureau of Mines and Geology Open File Report 90-1, Bureau of Land Management, Carson City District, Nevada. 257 pages.
Tingley, J.V., 1998. Mining Districts of Nevada (second edition): Nevada Bureau of Mines and Geology Report 47, 128 pages, 1:1,000,000.
Zonge, 2010a. Dipole – Dipole Complex Resistivity/IP and NSAMT Survey, Blackjack Project, Yerington, Nevada, Zonge Job# 10050, unpublished report for Entrée Gold Inc. May 2010. 48 pages.
Zonge, 2010b. Dipole-dipole resistivity and IP, Ann Mason – Blue Hills Project, Yerington, Nevada, Zonge Job# 10134, unpublished logistical report for Entrée Gold Inc. December 30, 2010. 41 pages.
Zonge, 2011. Logistical Report, Natural Source Audio-Frequency Magnetotellurics Survey, Ann Mason Project, Yerington, Nevada, Zonge Job # 11007, unpublished report for Entrée Gold Inc. April 19, 2011. 16 pages.
Zonge, 2013. Ann Mason – Blue Hill Fill-in, Yerington, Nevada, Zonge Job# 13069, unpublished logistical report for Entrée Gold Inc. September 1, 2013, 22 pages.
| 27.1 | Websites |
Association of Mineral Exploration of British Columbia, Porphyry Deposit Description: http://earthsci.org/mineral/mindep/depfile/por_dep.htm
Honey Badger Exploration Inc.: http://www.honeybadgerexp.com/
| ��| |
| 10/03/2017 |
Page 27 - 5
2017 Updated Preliminary Economic Assessment on the Ann Mason Project
Nevada, U.S.A.
Quaterra Resources Inc.: http://www.quaterraresources.com/
United States Environmental Protection Association (EPA), History of the Yerington Mine: http://yosemite.epa.gov/r9/sfund/r9sfdocw.nsf/ce6c60ee7382a473882571af007af70d/59d0b332e173da4288257007005e9464!OpenDocument
United States Environmental Protection Association (EPA), Status of the Yerington Mine: http://yosemite.epa.gov/r9/sfund/r9sfdocw.nsf/ce6c60ee7382a473882571af007af70d/59d0b332e173da4288257007005e9464!OpenDocument
Western Regional Climate Center: http://www.wrcc.dri.edu
| | |
| 10/03/2017 |
Page 27 - 6
2017 Updated Preliminary Economic Assessment on the Ann Mason Project
Nevada, U.S.A.
| 28 | Certificate of Authors |
| 28.1 | Gregory Kenneth Kulla, P.Geo. |
This is to certify that I, Gregory Kenneth Kulla, P.Geo., am employed as a Principal Geologist with Amec Foster Wheeler Americas Limited located at 111 Dunsmuir St., Vancouver, BC, V6B 5W3 Canada.
This certificate applies to the technical report titled "2017 Updated Preliminary Economic Assessment on the Ann Mason Project, Nevada, U.S.A." that has an effective date of March 3rd, 2017 (the "Technical Report").
| · | I am a member of the Association of Professional Engineers and Geoscientists of British Columbia, of the Association of Professional Engineers and Geoscientists of Manitoba, and Newfoundland and Labrador Professional Engineers and Geoscientists. I graduated from the University of British Columbia with a Bachelor of Science in Geology degree in 1988. |
| · | I have practiced my profession continuously since 1988 and have been involved in exploration, interpretation, geological modelling, and deposit evaluation of precious and base metal disseminated sulphide deposit assessments in Canada, United States, Australia, Mexico, Chile, Peru, and India. |
| · | As a result of my experience and qualifications, I am a "qualified person" for purposes of National Instrument 43–101 Standards of Disclosure for Mineral Projects (NI 43–101). |
| · | I visited the Ann Mason property on the 6-7 December 2014. |
| · | I am responsible for Sections 6, 7.1 to 7.3.5, 8, 9, all of Section 10 except 10.2.2, and Sections 11 and 12.1, and those portions of the Summary, Interpretations and Conclusions, and Recommendations that pertain to those sections of the Technical Report. |
| · | I am independent of both Entrée Gold Inc. and Mason Resources Corp. as described in Section 1.5 of NI 43–101. |
| · | I was a QP and author of the 2015 PEA report with an effective date of 09 September, 2015. |
| · | I have read NI 43–101 and the Technical Report has been prepared in compliance with that Instrument. |
| · | At the effective date of the Technical Report, to the best of my knowledge, information and belief, the parts of the Technical Report that I am responsible for contain all scientific and technical information that is required to be disclosed to make the Technical Report not misleading. |
Signed and dated this 10th day of March 2017, at Vancouver, BC.
| "Original Document Signed and Sealed" |
| Gregory Kenneth Kulla, P.Geo. |
| | |
| 10/03/2017 |
Page 28 - 1
2017 Updated Preliminary Economic Assessment on the Ann Mason Project
Nevada, U.S.A.
| 28.2 | Peter Anthony Oshust, P.Geo. |
This is to certify that I, Peter Anthony Oshust, P.Geo., am employed as a Principal Geologist with Amec Foster Wheeler Americas Limited located at 111 Dunsmuir St., Vancouver, BC, V6B 5W3 Canada.
This certificate applies to the Technical Report titled "2017 Updated Preliminary Economic Assessment on the Ann Mason Project, Nevada, U.S.A" that has an effective date of March 3rd, 2017 (the "Technical Report").
| · | I am a member of the Association of Professional Engineers and Geoscientists of British Columbia and of the Association of Professional Geoscientists of Ontario. I graduated from Brandon University with a Bachelor of Science (Specialist) degree in Geology and Economics in 1987. |
| · | I have practiced in my profession since 1988 and have been involved in geological modelling and resource estimation for a variety of base and precious metals and diamond deposits across North America since 2001. Prior to the Ann Mason project, I was involved in the geological modelling and resource estimation of the Oyut and Hugo North porphyry-style deposits at Oyu Tolgoi in Mongolia. |
| · | As a result of my experience and qualifications, I am a Qualified Person as defined in National Instrument 43–101 Standards of Disclosure for Mineral Projects (NI 43–101). |
| · | I did not visit the Ann Mason property. |
| · | I am responsible for the preparation of Section 14.1 of the Technical Report and for subsection 1.2.1 of the Summary and subsection 25.4.1 of the Interpretations and Conclusions. |
| · | I am independent of both Entrée Gold Inc. and Mason Resources Corp. as independence is described in Section 1.5 of NI 43‑101. |
| · | I was a QP and author of the 2015 PEA report with an effective date of 09 September, 2015. |
| · | I have read NI 43–101 and this Technical Report has been prepared in compliance with that Instrument. |
At the effective date of the Technical Report, to the best of my knowledge, information, and belief, the parts of the Technical Report that I am responsible for contain all scientific and technical information that is required to be disclosed to make the Technical Report not misleading.
Signed and dated this 10th day of March 2017, at Vancouver, BC.
| "Original Document Signed and Sealed" |
| Peter Oshust, P.Geo. |
| | |
| 10/03/2017 |
Page 28 - 2
2017 Updated Preliminary Economic Assessment on the Ann Mason Project
Nevada, U.S.A.
| 28.3 | Joseph Rosaire Pierre Desautels, P.Geo. |
I, Joseph Rosaire Pierre Desautels of Barrie, Ontario, as a QP of this technical report titled "2017 Updated Preliminary Economic Assessment on the Ann Mason Project, Nevada, U.S.A.", with an effective date of March 3rd, 2017 (the "Technical Report"), do hereby certify that and make the following statements:
| · | I am a Principal Resource Geologist with AGP Mining Consultants Inc. with a business address at #246-132 Commerce Park Dr., Unit K, Barrie, ON, L4N 0Z7. |
| · | I am a graduate of Ottawa University (B.Sc. Hons., 1978). |
| · | I am a member in good standing of the Association of Professional Geoscientists of Ontario (Registration #1362). |
| · | I have practiced my profession in the mining industry continuously since graduation. |
| · | I have read the definition of "qualified person" set out in National Instrument 43-101 (NI 43-101 or the Instrument) and certify that, by reason of my education, affiliation with a professional association (as defined in NI 43‑101), and past relevant work experience, I fulfill the requirements to be a "qualified person" for the purpose of NI 43-101. |
| · | My relevant experience with respect to resource modelling includes 31 years' experience in the mining sector covering database, mine geology, grade control, and resource modelling. I was involved in numerous projects around the world in both base metals and precious metals deposits. |
| · | I have visited the property on February 27 to March 1, 2012. |
| · | I am responsible for Sections 7.4, 10.2.2, 12.2, 14.2.1 to 14.2.11, 14.2.13, and those portions of the Summary, Interpretations and Conclusions, and Recommendations that pertain to those sections. |
| · | I was a QP and author of the original PEA technical report on the Ann Mason Project, with an effective date of 24 October 2012 and amended October 15, 2014. I was also a QP and author of the 2015 PEA report with an effective date of 09 September, 2015. |
| · | At the effective date of the Technical Report, to the best of my knowledge, information, and belief, the parts of the Technical Report that I am responsible for contain all scientific and technical information that is required to be disclosed to make the Technical Report not misleading. |
| · | I am independent of both Entrée Gold Inc. and Mason Resources Corp. as defined by Section 1.5 of the Instrument. |
| · | I have read NI 43-101 and the Technical Report has been prepared in compliance with NI 43‑101 and Form 43-101F1. |
Signed and dated this 10th day of March 2017, at Barrie, Ontario.
| "Original Document Signed and Sealed" |
| Pierre Desautels, P.Geo. |
| | |
| 10/03/2017 |
Page 28 - 3
2017 Updated Preliminary Economic Assessment on the Ann Mason Project
Nevada, U.S.A.
| 28.4 | Jay Melnyk, P.Eng. |
I, Jay Melnyk of Surrey, BC, as a QP of this technical report titled "2017 Updated Preliminary Economic Assessment on the Ann Mason Project, Nevada, U.S.A.", with an effective date of March 3rd, 2017, (the "Technical Report"), do hereby certify that and make the following statements:
| · | I am a Principal Engineer with AGP Mining Consultants Inc., with a business address at #246-132 Commerce Park Dr., Unit K, Barrie, ON, L4N 0Z7. |
| · | I graduated from the Montana Tech of the University of Montana with a Bachelor of Mining Engineering degree in 1988 and from the British Columbia Institute of Technology with a Diploma in Mining Technology in 1984. |
| · | I am a member in good standing of the Association of Professional Engineers and Geoscientists of British Columbia (Registration # 25975). |
| · | I have read the definition of "qualified person" set out in National Instrument 43‑101 (NI 43‑101 or the Instrument) and certify that, by reason of my education, affiliation with a professional association (as defined in NI 43-101) and past relevant work experience, I fulfill the requirements to be a "qualified person" for the purpose of NI 43-101. |
| · | I have practiced my profession for 25 years. I have been directly involved in open pit mining operations, and design of open pit mining operations in Argentina, Canada, Chile, Eritrea, Indonesia, Iran, Mexico, Perú, and the United States. |
| · | I am responsible Sections 14.2.12, 15, 16, and those portions of the Summary, Interpretations and Conclusions, and Recommendations that pertain to those Sections. |
| · | I was a QP and author of the original PEA technical report on the Ann Mason Project, with an effective date of 24 October 2012 and amended October 15, 2014. I was also a QP and author of the 2015 PEA report with an effective date of 09 September, 2015. |
| · | I visited the property described in this report from February 27 to March 1, 2012. |
| · | At the effective date of the Technical Report, to the best of my knowledge, information, and belief, the parts of the Technical Report that I am responsible for contain all scientific and technical information that is required to be disclosed to make the Technical Report not misleading. |
| · | I am independent of both Entrée Gold Inc. and Mason Resources Corp. as defined by Section 1.5 of the Instrument. |
| · | I have read National Instrument 43-101 and the Technical Report has been prepared in compliance with National Instrument 43-101 and Form 43-101F1. |
Signed and dated this 10th day of March 2017, at Vancouver, British Columbia.
| "Original Document Signed and Sealed" |
| Jay Melnyk, P.Eng. |
| | |
| 10/03/2017 |
Page 28 - 4
2017 Updated Preliminary Economic Assessment on the Ann Mason Project
Nevada, U.S.A.
| 28.5 | Gordon Zurowski, P.Eng. |
I, Gordon Zurowski, P.Eng., of Stouffville, Ontario, as a QP of this technical report titled "2017 Updated Preliminary Economic Assessment on the Ann Mason Project, Nevada, U.S.A.", with an effective date of March 3rd, 2017 (the "Technical Report") do hereby certify the following statements:
| · | I am a Principal Mining Engineer with AGP Mining Consultants Inc., with a business address at #246-132 Commerce Park Dr., Unit K, Barrie, ON, L4N 0Z7. |
| · | I am a graduate of the University of Saskatchewan, B.Sc. Geological Engineering, 1989. |
| · | I am a member in good standing of the Association of Professional Geoscientists of Ontario, Registration #100077750. |
| · | I have practiced my profession in the mining industry continuously since graduation. |
| · | I have read the definition of "qualified person" set out in National Instrument 43‑101 (NI 43‑101 or the Instrument) and certify that, by reason of my education, affiliation with a professional association (as defined in NI 43-101) and past relevant work experience, I fulfill the requirements to be a "qualified person" for the purpose of NI 43-101. |
| · | My relevant experience includes the design and evaluation of open pit mines for the last 20 years. |
| · | I have not conducted a site visit of the property. |
| · | I am responsible for Sections 1, 2, 3, 4, 5, 19, 20, 21, 22, 23, 24, 27 and those portions of the Summary, Interpretations and Conclusions, and Recommendations that pertain to those Sections |
| · | I contributed to the internal Order of Magnitude study for the Ann Mason Project in 2011/2012, and was a QP and author of the original PEA technical report on the Ann Mason Project, with an effective date of 24 October 2012 and amended October 15, 2014. I was also a QP and author of the 2015 PEA report with an effective date of 09 September, 2015. |
| · | At the effective date of the Technical Report, to the best of my knowledge, information and belief, the parts of the Technical Report that I am responsible for contain all scientific and technical information that is required to be disclosed to make the Technical Report not misleading. |
| · | I am independent of both Entrée Gold Inc. and Mason Resources Corp. as defined by Section 1.5 of the Instrument. |
| · | I have read NI 43-101 and the Technical Report has been prepared in compliance with NI 43‑101 and Form 43-101F1. |
Signed and dated this 10th day of March 2017, at Barrie, Ontario.
| "Original Signed and Sealed" |
| Gordon Zurowski, P.Eng. |
| | |
| 10/03/2017 |
Page 28 - 5
2017 Updated Preliminary Economic Assessment on the Ann Mason Project
Nevada, U.S.A.
| 28.6 | Lyn Jones, P.Eng. |
I, Lyn Jones of Peterborough, Ontario, as a QP of this technical report titled "2017 Updated Preliminary Economic Assessment on the Ann Mason Project, Nevada, U.S.A.", with an effective date of March 3rd, 2017, (the "Technical Report"), do hereby certify that and make the following statements:
| · | I am a Senior Metallurgical Associate with AGP Mining Consultants Inc. with a business address at #246-132 Commerce Park Dr., Unit K, Barrie, ON, L4N 0Z7. |
| · | I am a graduate of the University of British Columbia, Metals and Materials Engineering, 1998. |
| · | I am a member in good standing of the Association of Professional Engineers of Ontario, Registration No. 100067095. |
| · | I have practiced my profession continuously since graduation. |
| · | I have read the definition of "qualified person" set out in National Instrument 43‑101 (NI 43‑101 or the Instrument) and certify that, by reason of my education, affiliation with a professional association (as defined in NI 43-101) and past relevant work experience, I fulfill the requirements to be a "qualified person" for the purpose of NI 43-101. |
| · | My relevant experience with respect to metallurgy and process design includes 14 years of work experience in plant operations, metallurgical testing, flowsheet development, and process engineering. |
| · | I am responsible for Sections 13 and 17, and those portions of the Summary, Interpretations and Conclusions, and Recommendations that pertain to those Sections. |
| · | I have not conducted a site visited of the property. |
| · | I was QP and author of three previous technical reports on the Ann Mason Project, a first dated March 26, 2012, and a second amended October 15, 2014, with an effective date of 24 October 2012, and a third report with an effective date of 09 September, 2015. |
| · | At the effective date of the Technical Report, to the best of my knowledge, information, and belief, the parts of the Technical Report that I am responsible for contain all scientific and technical information that is required to be disclosed to make the Technical Report not misleading. |
| · | I am independent of both Entrée Gold Inc. and Mason Resources Corp. as defined by Section 1.5 of the Instrument. |
| · | I have read National Instrument 43-101 and the Technical Report has been prepared in compliance with National Instrument 43-101 and Form 43-101F1. |
Signed and dated this 10th day of March 2017, at Peterborough, Ontario.
| "Original Document Signed and Sealed" |
| Lyn Jones, P.Eng. |
| | |
| 10/03/2017 |
Page 28 - 6
2017 Updated Preliminary Economic Assessment on the Ann Mason Project
Nevada, U.S.A.
| 28.7 | Mario Colantonio, P.Eng. |
I, Mario Colantonio of Timmins, Ontario, as a QP of this technical report titled "2017 Updated Preliminary Economic Assessment on the Ann Mason Project, Nevada, U.S.A.", with an effective date of March 3rd, 2017 (the "Technical Report"), do hereby certify that and make the following statements:
| · | I am an Engineering Manager/Principal with Porcupine Engineering Services Inc. with a business address at 316 Spruce St. south, Timmins, ON, P4N 2M9. |
| · | I am a graduate of Queens University, Civil Engineering Program, 1985. |
| · | I am a member in good standing of the Association of Professional Engineers of Ontario, Registration No. 8869554. |
| · | I have practiced my profession continuously since graduation. |
| · | I have read the definition of "qualified person" set out in National Instrument 43‑101 (NI 43‑101 or the Instrument) and certify that, by reason of my education, affiliation with a professional association (as defined in NI 43-101) and past relevant work experience, I fulfill the requirements to be a "qualified person" for the purpose of NI 43-101. |
| · | My relevant experience with respect to Project Infrastructure includes the design and construction review of mining and milling infrastructure systems throughout 24 years working as a consulting engineer in the mining industry. I have held the position of engineering manager for consulting engineering firms in Northern Ontario for the last 15 years and in that role have overseen the work of teams of mechanical, electrical, civil and structural engineers on several mine and mill projects. |
| · | I am responsible Section 18 and those portions of the Summary, Interpretations and Conclusions, and Recommendations that pertain to that Section. |
| · | I was a QP and author of the original technical report on the Ann Mason Project, with an effective date of 24 October 2012 and amended October 15, 2014. I was also a QP and author of the 2015 PEA report with an effective date of 09 September, 2015. |
| · | I visited the property described in this report on February 27 to March 1, 2012. |
| · | At the effective date of the Technical Report, to the best of my knowledge, information, and belief, the parts of the Technical Report that I am responsible for contain all scientific and technical information that is required to be disclosed to make the Technical Report not misleading. |
| · | I am independent of both Entrée Gold Inc. and Mason Resources Corp. as defined by Section 1.5 of the Instrument. |
| · | I have read National Instrument 43-101 and the Technical Report has been prepared in compliance with National Instrument 43-101 and Form 43-101F1. |
Signed and dated this 10th day of March 2017, at Timmins, Ontario.
| "Original Document Signed and Sealed" |
| Mario Colantonio, P.Eng. |
| | |
| 10/03/2017 |
Page 28 - 7
2017 Updated Preliminary Economic Assessment on the Ann Mason Project
Nevada, U.S.A.
| 29 | Signature Page |
The effective date of this report titled "2017 Updated Preliminary Economic Assessment for the Ann Mason Project, Nevada, U.S.A." is March 3rd, 2017. It has been prepared for Entrée Gold Inc. and Mason Resources Corp. by Greg Kulla, P.Geo.; Peter Oshust, P.Geo.; Joseph Rosaire Pierre Desautels, P.Geo; Jay Melnyk, P.Eng.; Gordon Zurowski, P.Eng.; Lyn Jones, P.Eng.; Mario Colantonio, P.Eng.; each of whom are qualified persons as defined by NI 43-101.
Signed this 10th day of March 2017.
SIGNED
"Signed and Sealed" | "Signed and Sealed" | |
Greg Kulla, P.Geo. Principal Geologist Amec Foster Wheeler | Peter Oshust, P.Geo. Principal Geologist Amec Foster Wheeler | |
"Signed and Sealed" | "Signed and Sealed" | |
Joseph Rosaire Pierre Desautels, P.Geo. Principal Resource Geologist AGP Mining Consultants Inc. | Jay Melnyk, P.Eng. Principal Mining Engineer AGP Mining Consultants Inc. | |
"Signed and Sealed" | "Signed and Sealed" | |
Gordon Zurowski, P.Eng. Principal Mining Engineer AGP Mining Consultants Inc. | Lyn Jones, P.Eng Senior Associate Metallurgist AGP Mining Consultants Inc. | |
"Signed and Sealed" | ||
Mario Colantonio, P.Eng. Manager/Principal Porcupine Engineering Services |
| | |
| 10/03/2017 |