Exhibit 99.1

Link to searchable text of slide shown above
Link to searchable text of slide shown above
Link to searchable text of slide shown above
Link to searchable text of slide shown above
Link to searchable text of slide shown above

Link to searchable text of slide shown above

Link to searchable text of slide shown above

Link to searchable text of slide shown above

Link to searchable text of slide shown above

Link to searchable text of slide shown above

Link to searchable text of slide shown above
Link to searchable text of slide shown above
Link to searchable text of slide shown above
Link to searchable text of slide shown above

Link to searchable text of slide shown above

Link to searchable text of slide shown above

Link to searchable text of slide shown above

Link to searchable text of slide shown above

Link to searchable text of slide shown above

Link to searchable text of slide shown above

Link to searchable text of slide shown above
Link to searchable text of slide shown above
Link to searchable text of slide shown above
Link to searchable text of slide shown above

Link to searchable text of slide shown above
Link to searchable text of slide shown above

Link to searchable text of slide shown above
Link to searchable text of slide shown above

Link to searchable text of slide shown above
Link to searchable text of slide shown above

Link to searchable text of slide shown above

Link to searchable text of slide shown above
Link to searchable text of slide shown above
Link to searchable text of slide shown above
Link to searchable text of slide shown above

Link to searchable text of slide shown above

Link to searchable text of slide shown above
Link to searchable text of slide shown above

Link to searchable text of slide shown above
Link to searchable text of slide shown above
Link to searchable text of slide shown above
Searchable text section of graphics shown above
Securitization Program Update
April 2005
[LOGO] | | www.FieldstoneInvestment.com |
[LOGO]
Disclaimer
The information contained herein has been prepared solely for informational purposes and is not an offer to buy or sell or a solicitation of an offer to buy or sell any security or instrument or to participate in any trading strategy. Any offer of securities is and shall be made pursuant to a definitive prospectus or other appropriate offering document prepared by or on behalf of Fieldstone which would contain material information not contained herein and which does and shall supersede, amend and or supplement this information in its entirety. Any decision to invest in Fieldstone’s securities should be made after reviewing such definitive prospectus or other offering document, conducting such investigations as the investor deems necessary and consulting the investor’s own legal, accounting and tax advisors in order to make an independent determination of the suitability and consequences of an investment in the securities.
Neither the Securities and Exchange Commission nor any state securities commission has approved or disapproved of the securities described herein or passed upon the adequacy or accuracy of the information contained herein. Any representation to the contrary is a criminal offense.
Neither Fieldstone, nor any of its affiliates, makes any representation or warranty, express or implied, as to the accuracy or completeness of the information contained herein and nothing contained herein shall be relied upon as a promise or representation whether as to past or future performance. The information may include estimates and projections that involve significant elements of subjective judgment and analysis. No representations are made as to the accuracy of such estimates or projections or that all assumptions relating to such estimates or projections have been considered or stated or that such projections will be realized. Much of the information contained herein is of a general nature intended to provide a broad overview of Fieldstone’s business. Fieldstone disclaims any and all liability relating to this information, including, without limitation any express or implied representation or warranty for statements contained in and omissions from this information. Fieldstone does not expect to update or otherwise revise the information contained herein.
This presentation may contain forward-looking statements. Any forward-looking statement would be subject to certain risks and uncertainties that could cause actual results to differ materially from those anticipated. Individuals should not place undue reliance on forward-looking statements and are advised to conduct their own independent analysis and make their own independent determination. Neither Fieldstone nor any of its affiliates undertakes any obligations to revise publicly any forward-looking statements to reflect subsequent events or circumstances. For a further discussion of potential factors that could impact Fieldstone’s future results, performance or achievements, please see the documents filed by Fieldstone from time to time with the Securities and Exchange Commission, and in particular the section titled, “Risk Factors” in the company’s Annual Report on Form 10-K for the year ended December 31, 2004.
2
Table of Contents
3
I. Introduction to Fieldstone
4
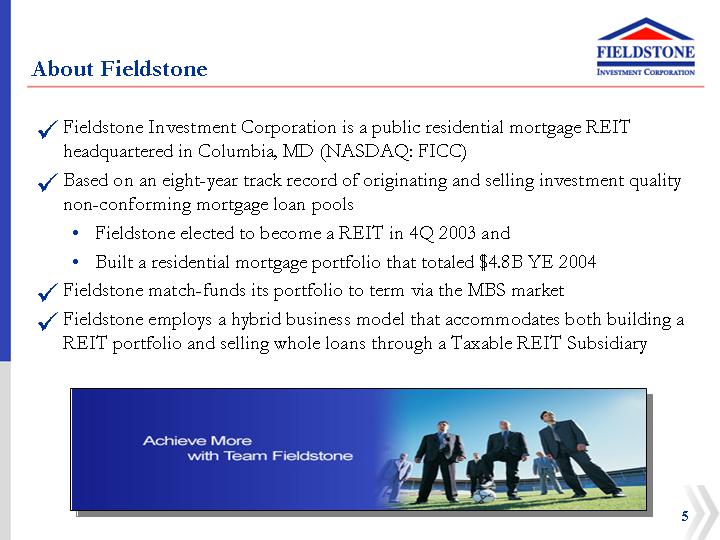
About Fieldstone
• Fieldstone Investment Corporation is a public residential mortgage REIT headquartered in Columbia, MD (NASDAQ: FICC)
• Based on an eight-year track record of originating and selling investment quality non-conforming mortgage loan pools
• Fieldstone elected to become a REIT in 4Q 2003 and
• Built a residential mortgage portfolio that totaled $4.8B YE 2004
• Fieldstone match-funds its portfolio to term via the MBS market
• Fieldstone employs a hybrid business model that accommodates both building a REIT portfolio and selling whole loans through a Taxable REIT Subsidiary
[GRAPHIC]
5
Fieldstone Timeline
• June 1995 – Founded by Michael Sonnenfeld (President and CEO) to buy closed, nonconforming credit loans
• March 1996 – Transitioned strategy from purchasing closed loans to originating loans through wholesale brokers
• 2000 – Acquired two conforming originators in 1Q 2000, expanded to 44 offices nationally, and grew its subprime originations
• October 2003 – Launched securitization program with $489MM FMIC 2003-1
• November 2003 – Raised $707MM equity in a REIT 144A offering, generating $467MM in tangible equity after redemption of initial venture investors
• 2004 Built $4.8B portfolio, executed five securitizations, Bloomberg Ticker – FMIC
• February 2005 – Listed on NASDAQ: Ticker – FICC
• Not a new company
• 9+ years of operating experience, originating $23.8B during this period
• Sold whole loans exclusively until launch of securitization program in 2003
Initial strategy to acquire closed nonconforming credit loans only | | | | | | | | | | Acquired two conforming origination businesses and grew nonconforming credit origination | | | | | | Launched securitization program in October with $489MM FMIC 2003-1 | | Built $4.8B Portfolio | | |
| | | | | | | | | | | | | | | | | | | | |
1995 | | 1996 | | 1997 | | 1998 | | 1999 | | 2000 | | 2001 | | 2002 | | 2003 | | 2004 | | 2005 |
| | | | | | | | | | | | | | | | | | | | |
| | Initiated wholesale originations | | | | | | | | | | | | | | Raised $707MM
REIT 144A in
November | | | | Listed on NASDAQ:FICC |
6
Business Summary
• Fieldstone Investment Corporation: REIT
• Holds a portfolio of non-conforming loans on-balance sheet:
• $4.8 Billion at December 2004 with an average FICO of 650
• Match-funds portfolio for life of loans with MBS
• Paid $1.09 of pre-tax dividends to shareholders for 2004, an an additional $0.47 in 1Q 2005
• Fieldstone Mortgage Company: Taxable REIT Subsidiary
• Performs loan origination and underwriting
• $6.2 billion of non-conforming loans in 2004
• $1.3 billion of conforming loans in 2004
• Maintains 15 regional wholesale non-conforming operations centers
• Manages the quality of loans for REIT portfolio
• Sells: non-conforming fixed rate, 2nds and certain hybrid loans, and all conforming loans
• Interim servicer for loans held for sale
• Can retain any after-tax earnings from loan sales
7
Corporate Structure and Strategy
Fieldstone Investment Corporation
Mortgage REIT on NASDAQ: FICC
$4.8 billion portfolio of loans originated by Fieldstone
$526 million equity: leverage portfolio by issuance of mortgage-backed securities
100% ownership
Fieldstone Mortgage Company
Taxable REIT Subsidiary
Established in 1995
Non-Conforming Division
• Originated $6.2 billion in 2004
• Originated $1.5 billion in 4Q of 2004
• 652 average credit score
• Originating via wholesale (89%) and retail channels (11%)
• 66% funded by REIT for Investment Portfolio
Conforming Division
• Originated $1.3 billion in 2004
• Originated $314 million in 4Q of 2004
• Originating via wholesale (71%) and retail (29%) channels
• All product sold via whole loan sales
8
Non-Conforming Divisions
[GRAPHIC]
| | Missouri Offices: | Iowa Offices: | |
| | | | |
| | Independence | Davenport | |
| | Springfield | Cedar Rapids | |
| | St. Louis | Des Moines | |
9
Fieldstone’s 2004 Financial Highlights
GAAP Earnings (Millions)
| | 2003 | | 2004 | |
| | | | | |
NIM after provision | | $ | 41.7 | | $ | 135.7 | |
Swap net cash settlements | | — | | (11.7 | ) |
Adjusted NIM | | 41.7 | | 124.0 | |
| | | | | |
Other income | | (0.2 | ) | 24.2 | |
Gain on sale | | 117.9 | | 52.1 | |
Total revenue | | 159.4 | | 200.3 | |
| | | | | |
SG&A | | (114.2 | ) | (130.8 | ) |
Net income before taxes | | 45.2 | | 69.5 | |
| | | | | |
Tax (expense) benefit | | 2.6 | | (3.9 | ) |
Net income | | $ | 47.8 | | $ | 65.6 | |
| | | | | |
EPS | | $ | 2.47 | | $ | 1.34 | |
Loan Originations
[CHART]
Revenue Components
[CHART]
10
REIT Portfolio Strategy
Focused Strategy to Create Stable and High Yielding Cash Flows
Consistent Portfolio Growth
[CHART]
Consistent Net Interest Income
• FMIC 2003-1 Caps at Forward LIBOR
• FMIC 2004-1 Swap at 1.94%
• FMIC 2004-2 Swap at 2.08%
• FMIC 2004-3 Swap at 3.29%
• FMIC 2004-4 Utilized Cap Corridor
• FMIC 2004-5 Swap at 2.89%
• FMIC 2005-1 Swap at 3.53%
Consistent Issuance of MBS Debt
• | FMIC 2003-1 | | |
| • | | Size: | | $488,923,000 |
| • | | Priced: | | 10/3/03 |
| • | | AAA: | | LIBOR + 35bps |
| • | | BBB: | | LIBOR + 325bps |
• | FMIC 2004-1 | | |
| • | | Size: | | $663,157,000 |
| • | | Priced: | | 2/6/04 |
| • | | AAA: | | LIBOR + 31bps |
| • | | BBB: | | LIBOR + 180bps |
• | FMIC 2004-2 | | |
| • | | Size: | | $857,120,000 |
| • | | Priced: | | 4/16/04 |
| • | | AAA: | | LIBOR +25bps |
| • | | BBB: | | LIBOR +215bps |
• | FMIC 2004-3 | | |
| • | | Size: | | $986,500,000 |
| • | | Priced: | | 6/23/04 |
| • | | AAA: | | LIBOR + 28bps |
| • | | BBB: | | LIBOR + 215bps |
• | FMIC 2004-4 | | |
| • | | Size: | | $874,308,000 |
| • | | Priced: | | 9/27/04 |
| • | | AAA: | | LIBOR + 33bps |
| • | | BBB: | | LIBOR + 170bps |
• | FMIC 2004-5 | | |
| • | | Size: | | $892,350,000 |
| • | | Priced: | | 11/10/04 |
| • | | AAA: | | LIBOR + 33bps |
| • | | BBB: | | LIBOR + 185bps |
• | FMIC 2005-1 | | |
| • | | Size: | | $743,625,000 |
| • | | Priced: | | 2/14/05 |
| • | | AAA: | | LIBOR + 23bps |
| • | | BBB: | | LIBOR + 135bps |
11
Portfolio Strategy
• Originate high quality non-conforming ARM loans for REIT portfolio
• 2/28 hybrid ARMs primarily
• 650 average credit score
• Interest only 2/28 ARM loans, fully amortize after five years
• Reduced documentation and higher LTV at higher credit score
• Finance portfolio with long-term securitization debt
• On-balance sheet financing
• No “gain on sale” non-cash gains on securitization
• Committed financing with strong asset-liability management
• Retain Fieldstone loans to assure quality and minimize basis risk
• Current Target portfolio leverage of 11 X Equity (8.33% equity to assets)
12
Financing Strategy
• Finance loans prior to securitization or sale with a diverse group of Wall Street and bank lenders under $1.9 billion of committed warehouse lines
• Use mortgage-backed securities (MBS) to finance REIT portfolio
• Provides long-term financing for portfolio without margin calls
• MBS market highly liquid
• Structure securitizations to cash flow from month one
• Not issuing “NIM” securities
• Focus on issuing bonds rated BBB or higher
• Not reliant upon selling low rated and less liquid (BBB- or BB) bonds
• Highly efficient - weighted average bond spread of LIBOR + 37 bps on 2005-1
[GRAPHIC]
13
Servicing Strategy
• Fieldstone performs key loan set-up and initial quality control functions on all loans
• Highly rated sub-servicer: Chase Home Finance, LLC
• Fitch: RPS1- and RSS1- (primarily subprime and special servicing, respectively)
• Moody’s: SQ1 (subprime servicing)
• S&P: “STRONG” and on its select servicer list
• Wells Fargo Bank as:
• Master Servicer
• Bond Administrative Agent
• Servicer Oversight
• Ultimately, Fieldstone will look to build or acquire a significant servicing capacity
14
FMIC Program Distinguishing Characteristics
• Strong servicer – Chase Home Finance, LLC maintains the highest servicer ratings from the rating agencies
• Strong Master Servicer / Servicing Oversight – Wells Fargo Bank, N.A.
• Reduced Basis Risk
• 100% ARM collateral with no 2nd liens
• Interest rate swaps or other hedge instruments pledged to the trust during hybrid period
• Fieldstone completely aligns its interests with those of investors
• Retains BBB- rated notes
• Retains full residual / “equity” in pool
• Funds OC up-front even though not selling NIM
• Treats securitization as a financing on balance sheet
15
II. Product Summary
16
Fieldstone Portfolio as of Dec. 31, 2004
FIC as of 12/31/04
Principal Balance | | $ | 4,735,062,847 | |
Percentage ARM | | 99.2 | % |
Average Balance | | $ | 194,830 | |
WA Coupon | | 6.8 | % |
WA Gross Margin | | 5.7 | % |
| | | |
Product Type | | | |
2/28 Hybrid | | 92.2 | % |
3/27 Hybrid | | 4.9 | % |
5/1 Hybrid | | 2.0 | % |
Fixed Rate/Other | | 0.9 | % |
Credit Score | | | |
WA FICO | | 650 | |
FICO < 600 | | 21.6 | % |
600-649 | | 24.2 | % |
650-699 | | 33.6 | % |
700 or greater | | 20.6 | % |
LTV | | | |
WA LTV | | 82.3 | % |
LTV>90% | | 3.5 | % |
| | | |
WA CLTV | | 92.3 | % |
Full Documentation | | 46.3 | % |
Interest Only (5 year) | | 60.1 | % |
Owner Occupied | | 93.4 | % |
Single Family / PUD | | 89.7 | % |
Prepayment Fee Coverage | | 86.6 | % |
State Concentration | | CA - 47.3 | % |
Loan Purpose | | | |
Purchase | | 59.6 | % |
Cash Out Refinance | | 40.4 | % |
Collateral Highlights
High FICO | | 650 | |
| | | |
First Lien | | 99.9 | % |
| | | |
Hybrid ARMS | | 99.2 | % |
| | | |
Predominately Owner Occupied | | 93.4 | % |
| | | |
High Prepayment Fee Coverage | | 86.6 | % |
| | | |
Majority Purchase Money | | 59.6 | % |
Product Mix by Credit Score
[CHART]
17
Credit Risk Management – Portfolio Characteristics
Portfolio Composition by Credit Score
[CHART]
Weighted Average Credit Score: 650
18
Credit Risk Management
Credit Score by Income Documentation Level
4Q 2004 Non-Conforming Originations
[CHART]
19
Credit Risk Management-Risk-Based Pricing
Portfolio Composition - Risk-Based Pricing
[CHART]
Weighted Average Coupon: 6.8%
20
III. Underwriting Summary
21
Underwriting Summary
Fieldstone’s Investigative Underwriting Process is designed to deter fraud and limit default frequency and loss severity.
• Full credit underwriting completed on all loans prior to funding
• Default Frequency control
• Full doc loans require execution of 4506 T
• Stated loans
• require authentication of self-employment documents (licenses, CPA letters)
• credit history and assets appropriate for income stated
• income stated is compared to on-line data bases for appropriate income
• Purchase loans require 24 month chain of title to detect flip transactions
• Refinance transactions require written borrower benefit analysis to deter predatory lending
• Loans processed through Fieldscore (Fieldstone’s automated pre-qualification engine) to insure borrower is placed in the most appropriate product and to reduce errors
• All credit reports are generated by Fieldstone. Credit reports are tri-merged credit reports containing fraud alert, OFAC, previous employment and residence information.
22
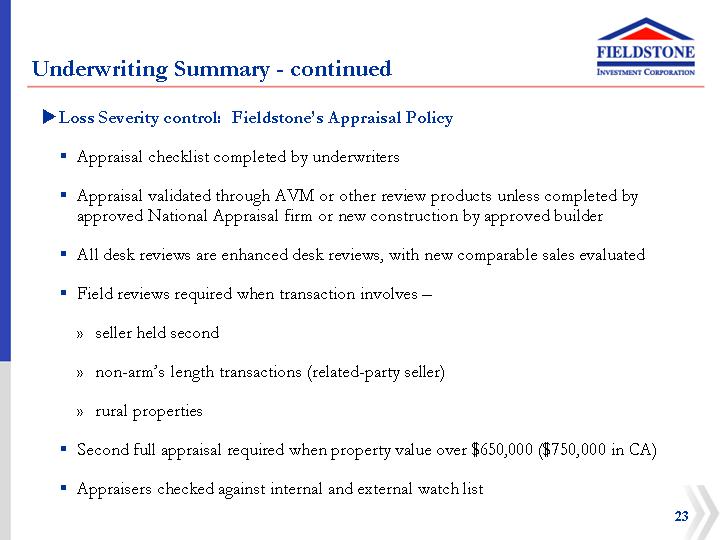
• Loss Severity control: Fieldstone’s Appraisal Policy
• Appraisal checklist completed by underwriters
• Appraisal validated through AVM or other review products unless completed by approved National Appraisal firm or new construction by approved builder
• All desk reviews are enhanced desk reviews, with new comparable sales evaluated
• Field reviews required when transaction involves –
• seller held second
• non-arm’s length transactions (related-party seller)
• rural properties
• Second full appraisal required when property value over $650,000 ($750,000 in CA)
• Appraisers checked against internal and external watch list
23
Controls
• Underwriting completed in regional offices
• Provides strong knowledge of local statutes
• Better knowledge of local real estate values
• Credit approval authorities are assigned to each underwriter by the Chief Credit Officer
• Underwriter performance tracked monthly via Underwriters’ Report Card
• Post closing QC completed by internal staff and third party due diligence re-verifies process
• Responses including corrective actions are due monthly
• Monthly audit findings reported to senior management
• 6 month trending reporting to executive management
• Loan Origination System contains edits for internal and regulatory compliance
• Fieldstone does not fund Section 32 , high cost or covered loans in any jurisdictions
• Pending statutes monitored by compliance department
• Worksheets created by internal compliance and reviewed by outside counsel
• Edits created by IS, checked by compliance and 3rd party, and imbedded in LOS
• Exceptions not made for LTV/CLTV or Credit Score
• Common exceptions include bankruptcy seasoning, appraisal seasoning, cash out amount and loan amount
24
Income Documentation Requirements
Fieldstone Offers Five Documentation Levels. Verbal Verification of Employment Is Always Obtained by FMC Within Five Days of Closing
• Full Documentation
• Current pay stubs and most recent year’s W-2s for wage earners; two-years tax returns (business and personal) for self-employed borrowers
• Hourly and self-employment income is averaged, no declining income is allowed
• All borrowers receiving fixed income of any kind must fully verify all income used for qualifying
• 24-Months’ Bank Statements (all employment types allowed)
• 24-months’ personal bank statements allow for 100% of average deposits toward qualifying. If using bank statements, 75% of average deposits is used for qualifying
• 12-Months’ Bank Statements (self-employed borrowers only)
• Same credit for deposits as 24-months program
25
• Limited Documentation
• Wage Earners: Borrower must provide most recent YTD pay stub; average YTD income used to qualify; must verify two years in the same profession
• 1099 Employees: Most recent year’s 1099 and YTD statement of earnings required. 75% of average income used to qualify
• Self-Employed: Six months of personal bank statements using 100% average deposits to qualify or six months of business bank statements using 75% of average deposits. Borrowers must provide evidence they owned and operated the business at least two years
• Stated Documentation
• Wage Earners: Income is stated on the 1003 and file must include a written VOE from current employer that does not provide income info, but does show dates of employment, position, if employment is likely to continue and average hours worked per week. Borrower must document two years in the same profession. Income must be reasonable for borrower’s profession
• Self-Employed: Income is stated on the 1003 and file must include evidence that borrower has owned and operated the business for at least two years
26
IV. Fieldstone Performance to Date
27
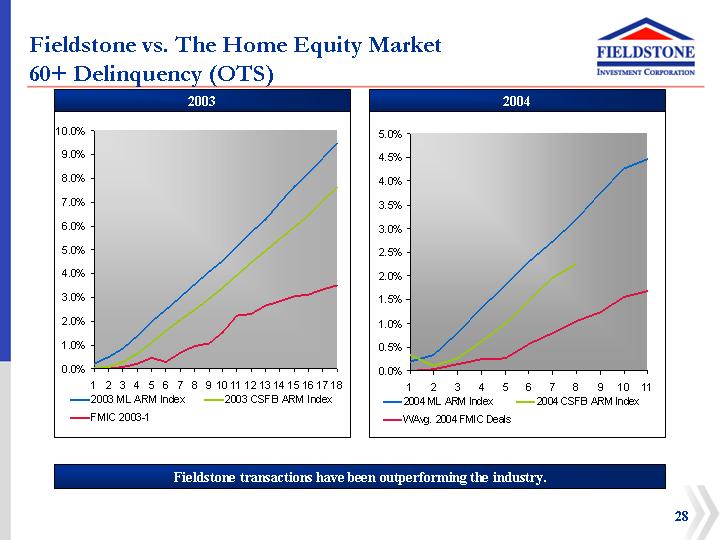
Fieldstone vs. The Home Equity Market
60+ Delinquency (OTS)
2003 | | 2004 |
| | |
[CHART] | | [CHART] |
Fieldstone transactions have been outperforming the industry.
28
Prepayment Summary
1-month CPRs for 2003 Vintage
[CHART]
1-month CPRs for 2004 Vintage
[CHART]
29
Appendix A: Culture & Management
30
Fieldstone’s Culture
• Each employee takes personal accountability for the success of the Team
• Focus on long term relationships with market professionals where “value added” enables rational pricing and loan quality
“All of us that are a part of Fieldstone work together, share a commitment to quality and integrity and are willing to devote ourselves to the success of the entire organization.”
Michael J. Sonnenfeld | |
| |
President and Chief Executive Officer | |
31
Management Experience
• Michael Sonnenfeld, President and Chief Executive Officer
• 18+ years of experience in mortgage banking and mortgage securities
• Former Director of the Subprime Residential Mortgage Conduit of Nomura Securities Int’l
• Former President of Saxon Mortgage Funding and Saxon Capital Corp.
• Walter Buczynski, EVP Secondary Marketing
• 20+ years of experience in mortgage banking
• Former SVP for Secondary GE Capital Mortgage Services Inc.
• Former EVP for Secondary Chase Mortgage Corp.
• Former EVP for Secondary Margarettan Mortgage Corp.
• Robert Partlow, SVP Chief Financial Officer
• 15+ years of experience in financial services
• Former CFO of Saxon Capital
• Former Tax Consultant of KPMG
• Former Bank Examiner of Federal Reserve Bank of Richmond
• John Kendall, SVP Investment Portfolio
• 13+ years of experience in mortgage capital markets
• Former Director Public Fixed Income, MBS/ABS Portfolio; Northwestern Mutual Life Insurance Co.
• Former First Vice President, Asset Finance Group; Kidder Peabody& Co. / Paine Webber, Inc.
• Former Vice President, Capital Markets Group; Greenwich Capital Markets
• Gary Uchino, SVP Chief Credit Officer
• 20+ years of experience in subprime lending
• Former Vice President of Credit Administration – Security Pacific Financial Services
• Former Director of Associates of Financial Services Japan
• Jim Hagan, EVP Non-conforming Wholesale Division of FMC
• 20+ years of experience in mortgage banking
• Former RVP for Subprime Division of American Residential Mortgage Corp.
• Former Senior Vice President of Long Beach Mortgage
32
Appendix B: Underwriting Matrices
33
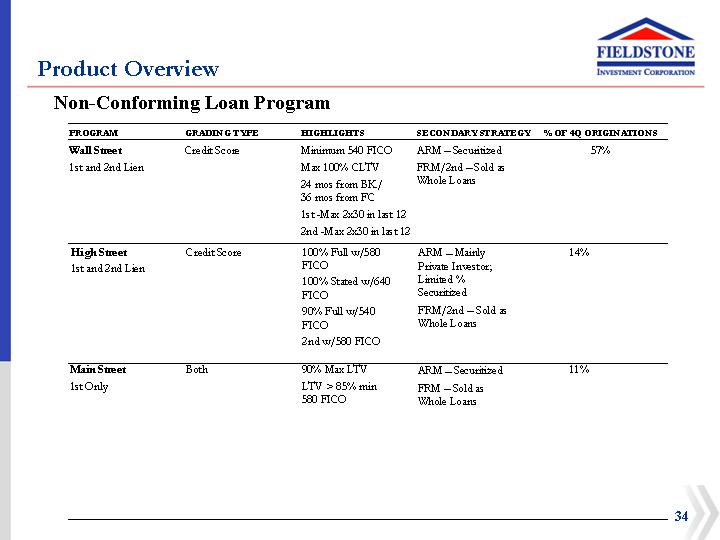
Product Overview
Non-Conforming Loan Program
PROGRAM | | GRADING TYPE | | HIGHLIGHTS | | SECONDARY STRATEGY | | % OF 4Q ORIGINATIONS | |
Wall Street | | Credit Score | | Minimum 540 FICO | | ARM – Securitized | | 57 | % |
1st and 2nd Lien | | | | Max 100% CLTV | | FRM/2nd – Sold as | | | |
| | | | 24 mos from BK/ | | Whole Loans | | | |
| | | | 36 mos from FC | | | | | |
| | | | 1st -Max 2x30 in last 12 | | | | | |
| | | | 2nd -Max 2x30 in last 12 | | | | | |
| | | | | | | | | |
High Street | | Credit Score | | 100% Full w/580 | | ARM – Mainly | | 14 | % |
1st and 2nd Lien | | | | FICO | | Private Investor; | | | |
| | | | 100% Stated w/640 | | Limited % | | | |
| | | | FICO | | Securitized | | | |
| | | | 90% Full w/540 | | FRM/2nd – Sold as | | | |
| | | | FICO | | Whole Loans | | | |
| | | | 2nd w/580 FICO | | | | | |
| | | | | | | | | |
Main Street | | Both | | 90% Max LTV | | ARM – Securitized | | 11 | % |
1st Only | | | | LTV > 85% min | | FRM – Sold as | | | |
| | | | 580 FICO | | Whole Loans | | | |
34
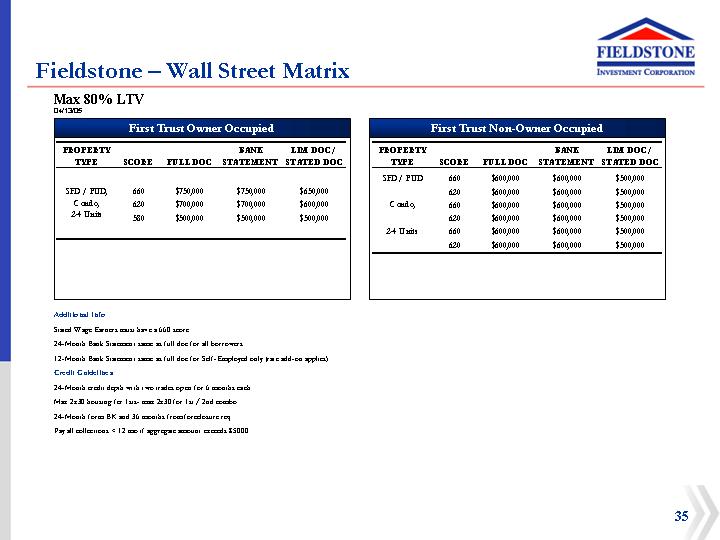
Fieldstone – Wall Street Matrix
Max 80% LTV
04/13/05
First Trust Owner Occupied
PROPERTY | | | | | | BANK | | LIM DOC / | |
TYPE | | SCORE | | FULL DOC | | STATEMENT | | STATED DOC | |
| | | | | | | | | |
SFD / PUD, | | | 660 | | $ | 750,000 | | $ | 750,000 | | $ | 650,000 | |
Condo, | | | 620 | | $ | 700,000 | | $ | 700,000 | | $ | 600,000 | |
2-4 Units | | | 580 | | $ | 500,000 | | $ | 500,000 | | $ | 500,000 | |
First Trust Non-Owner Occupied
PROPERTY | | | | | | BANK | | LIM DOC / | |
TYPE | | SCORE | | FULL DOC | | STATEMENT | | STATED DOC | |
| | | | | | | | | | |
SFD / PUD | | | 660 | | $ | 600,000 | | $ | 600,000 | | $ | 500,000 | |
| | 620 | | $ | 600,000 | | $ | 600,000 | | $ | 500,000 | |
Condo, | | | 660 | | $ | 600,000 | | $ | 600,000 | | $ | 500,000 | |
| | 620 | | $ | 600,000 | | $ | 600,000 | | $ | 500,000 | |
2-4 Units | | | 660 | | $ | 600,000 | | $ | 600,000 | | $ | 500,000 | |
| | 620 | | $ | 600,000 | | $ | 600,000 | | $ | 500,000 | |
Additional Info
Stated Wage Earners must have a 660 score
24-Month Bank Statement same as full doc for all borrowers
12-Month Bank Statement same as full doc for Self-Employed only (rate add-on applies)
Credit Guidelines
24-Month credit depth with two trades open for 6 months each
Max 2x30 housing for 1sts- max 2x30 for 1st / 2nd combo
24-Month form BK and 36 months from foreclosure req.
Pay all collections < 12 mo if aggregate amount exceeds $5000
35
Fieldstone – High Street Matrix
Max 90% LTV
04/13/05
First Trust Owner Occupied
PROPERTY | | | | | | BANK | | LIM DOC / | |
TYPE | | SCORE | | FULL DOC | | STATEMEN | | STATED | |
| | | | | | | | | |
SFD / PUD, | | | 660 | | $ | 625,000 | | $ | 625,000 | | $ | 500,000 | |
Condo, | | | 600 | | $ | 625,000 | | $ | 625,000 | | $ | 400,000 | |
2-4 Units | | | 540 | | $ | 400,000 | | $ | 400,000 | | N/A | |
Max 80% LTV
First Trust Non-Owner Occupied
PROPERTY | | | | | | BANK | | LIM DOC / | |
TYPE | | SCORE | | FULL DOC | | STATEMEN | | STATED | |
| | | | | | | | | |
SFD / PUD | | | 660 | | $ | 625,000 | | $ | 625,000 | | N/A | |
| | | | | | | | | | |
Condo, | | | 580 | | $ | 500,000 | | $ | 500,000 | | N/A | |
| | | | | | | | | | |
2-4 Units | | | 540 | | $ | 400,000 | | $ | 400,000 | | N/A | |
Additional Info
Stated Wage Earners must have a 640 score
24-Month Bank Statement same as full doc for self-employed only
12-Month Bank Statement same as full doc for Self-Employed only (rate add-on applies)
Max Debt Ration is 55%
Seller held financing on 2nd liens note allowed
First time homebuyers reduce LTV by 5% on stated income loans
Credit Guidelines
24-Month credit depth with three trade lines required. One with high credit of $1500,
One with activity reported in the last 6 months, one with no specific requirements
Max 2x60 housing for 1sts- max 3x30 for 1st / 2nd combo
24-Month from BK and 36 months from foreclosure req. if borrower has 0x30 or 1x30
Housing history
Pay all collections < 12 mo if aggregate amount exceeds $5000
36
Fieldstone - Main Street Matrix
03/25/04
| | HOUSING | | BK / FORECLOSURE | | CONSUMER | | MAX D/R (FULL & BANK ST.) | | MAX D/R (LIM & STATED) | |
A | | 1 x 30 | | 24 mos. | | 30’s, No 60s OR 600 score | | >85% = 50% | | < 85% = 55% | | 50 | % |
A- | | 3 x 30 | | 24mos. | | 30’s, Isolated 60’s OR 580 score | | >85% = 50% | | < 85% = 55% | | 50 | % |
B | | 1 x 60 | | 18mos. | | 60’s, Isolated 90’s OR 560 score | | 55% | | 50 | % |
C | | 1 x 90 | | 12mos. | | 90s, Isolated 120’s OR 540 score | | 55% | | 50 | % |
D | | No NOD | | Less than 12 mos. | | 500 score | | 55% | | 50 | % |
24-Month Bank Statements same as full doc for all borrowers. 12-Month Bank Statement same as full doc for Self-Employed
Limited Doc reduce by 5%. Stated Doc reduces by 10% on Owner Occ.
O/O 3-4 Unit, and Rural reduce by 5%. N/O/O 3-4 Unit reduce by 5%. N/O/O Rural not available
For scores 500-524 all of the following apply: Full Doc, Owner Occupied only with Max LTV 75% and Max credit grade of “C”.
| | OWNER OCCUPIED | | NON-OWNER OCCUPIED (STATED INCOME NOT AVAILABLE) | |
| | LTV / CLTV | | LOAN AMOUNT | | CASH-OUT | | LTV / CLTV | | LOAN AMOUNT | | CASH-OUT | |
A | | 90/100 | | $ | 500,000 | | $ | 200,000 | | 85/95 | | $ | 500,000 | | $ | 100,000 | |
A- | | 90/100 | | $ | 500,000 | | $ | 150,000 | | 80/95 | | $ | 500,000 | | $ | 100,000 | |
B | | 85/100 | | $ | 400,000 | | $ | 100,000 | | 75/95 | | $ | 400,000 | | $ | 75,000 | |
C | | 80/100 | | $ | 400,000 | | $ | 75,000 | | 70/95 | | $ | 400,000 | | $ | 50,000 | |
D | | 70/100 | | $ | 400,000 | | $ | 50,000 | | N/A | | N/A | | N/A | |
Credit Blending
HOUSING HISTORY – | | CONSUMER CREDIT – | | | |
PRIMARY BORROWER | | PRIMARY BORROWER | | FINAL CREDIT GRADE | |
0x30 | | B | | A | |
0x30 | | C | | A- (max 85% LTV) | |
1x30 | | B | | A- | |
1x30 | | C | | B | |
1x30 | | D | | B (max 80% LTV) | |
3x30 | | C | | B (max 80% LTV) | |
3x30 | | D | | C | |
Additional Info
For first liens LTV between 70.01 – 90%: 12 month credit depth and 2 tradelines required
Each tradeline must be open for minimum of 6 months with activity reported in the last 12 Months
For first liens LTV<70 (no combos): 12 month credit depth, but no tradelines required Special 55% DTI Exception allowed on Full Doc up to 90%. Ask your rep for details.
37
Appendix C: Interest Only Loans
38
Interest Only Loans
• After an interest only period, IO loans fully amortize to maturity and borrowers’ payments increase to include principal in addition to interest
• No principal is scheduled to amortize or be repaid for an initial agreed period
• The borrower pays simple interest on the original loan balance until amortization commences
• Fieldstone’s Interest Only periods are five years; the IO period in the market generally varies from 2 to 10 years
• IO loans appeal to payment sensitive, purchase money borrowers, often in housing markets that have witnessed significant home price appreciation
• A 5 year IO term introduces the additional payment shock to the hybrid borrower well after they have weathered prior payment changes related to rate resets when the payment change matters little from a present value perspective and is smaller in inflation-adjusted terms
• Payment changes related to the initial hybrid ARM rate reset and the commencement of principal amortization are staggered in order to avoid multiple simultaneous payment shocks to the borrower
• A 2 year IO term exacerbates inherent payment shock at rate reset and will likely increase post reset defaults
• Refinancing alternatives for IO hybrid borrowers will include Fixed Rate Mortgages, teased Hybrids and teased Short Reset ARMS
39
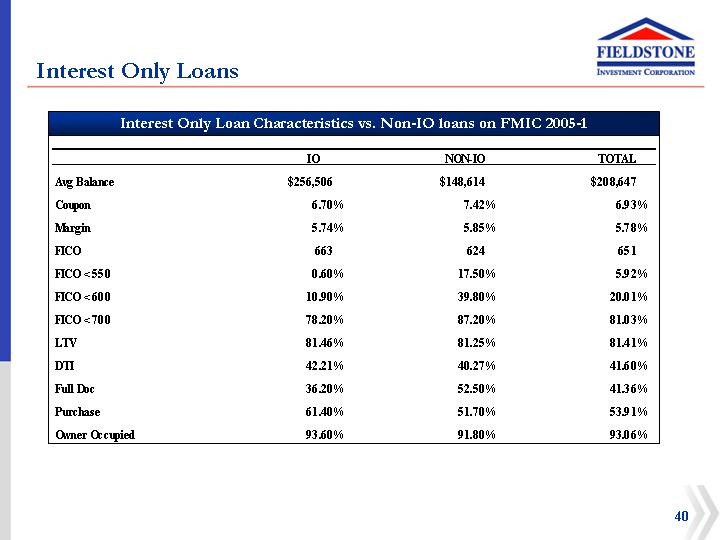
Interest Only Loans
Interest Only Loan Characteristics vs. Non-IO loans on FMIC 2005-1
| | IO | | NON-IO | | TOTAL | |
Avg Balance | | $ | 256,506 | | $ | 148,614 | | $ | 208,647 | |
Coupon | | 6.70 | % | 7.42 | % | 6.93 | % |
Margin | | 5.74 | % | 5.85 | % | 5.78 | % |
FICO | | 663 | | 624 | | 651 | |
FICO < 550 | | 0.60 | % | 17.50 | % | 5.92 | % |
FICO < 600 | | 10.90 | % | 39.80 | % | 20.01 | % |
FICO < 700 | | 78.20 | % | 87.20 | % | 81.03 | % |
LTV | | 81.46 | % | 81.25 | % | 81.41 | % |
DTI | | 42.21 | % | 40.27 | % | 41.60 | % |
Full Doc | | 36.20 | % | 52.50 | % | 41.36 | % |
Purchase | | 61.40 | % | 51.70 | % | 53.91 | % |
Owner Occupied | | 93.60 | % | 91.80 | % | 93.06 | % |
| | | | | | | | | | |
40
Securitization Program Update
April 2005
www.FieldstoneInvestment.com
[LOGO]