


Searchable text section of graphics shown above
Review of Business Strategy and Results
1st Quarter 2005
[LOGO] |
| www.FieldstoneInvestment.com |
|
|
|
As of May 4, 2005 |
|
|
Business Summary |
| [LOGO] |
• Fieldstone Investment Corporation: (NASDAQ: FICC): REIT
• Building a portfolio of non-conforming loans on-balance sheet:
• $5.1 billion at March 31, 2005 with an average FICO of 651
• Issued $5.0 billion of MBS to match-fund portfolio for life of loans
• Paid $1.09 of pre-tax dividends to shareholders for 2004
• Paid 1st Quarter 2005 dividend of $0.47
• Fieldstone Mortgage Company: Taxable REIT Subsidiary
• Performs loan origination and underwriting
• $6.2 billion of non-conforming loans in 2004
• $1.3 billion of conforming loans in 2004
• Opened 4 regional non-conforming operation centers in 2004
• Manage the quality of loans for REIT portfolio
• Sell non-conforming fixed rate, 2nds and certain hybrid loans, and all conforming loans
• Interim servicer for loans held for sale
• Can retain any after-tax earnings from loan sales to generate capital internally
*As of May 4, 2005*
2
Fieldstone’s Financial Highlights
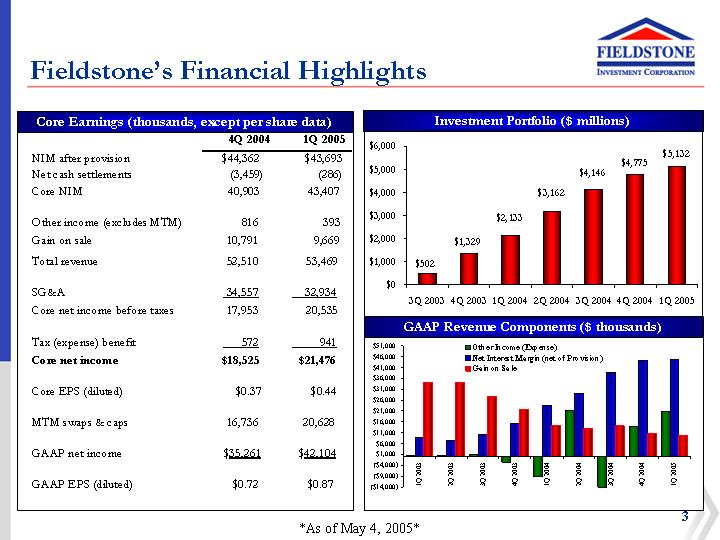
Core Earnings (thousands, except per share data)
|
| 4Q 2004 |
| 1Q 2005 |
| ||
NIM after provision |
| $ | 44,362 |
| $ | 43,693 |
|
Net cash settlements |
| (3,459 | ) | (286 | ) | ||
Core NIM |
| 40,903 |
| 43,407 |
| ||
|
|
|
|
|
| ||
Other income (excludes MTM) |
| 816 |
| 393 |
| ||
Gain on sale |
| 10,791 |
| 9,669 |
| ||
Total revenue |
| 52,510 |
| 53,469 |
| ||
|
|
|
|
|
| ||
SG&A |
| 34,557 |
| 32,934 |
| ||
Core net income before taxes |
| 17,953 |
| 20,535 |
| ||
|
|
|
|
|
| ||
Tax (expense) benefit |
| 572 |
| 941 |
| ||
Core net income |
| $ | 18,525 |
| $ | 21,476 |
|
|
|
|
|
|
| ||
Core EPS (diluted) |
| $ | 0.37 |
| $ | 0.44 |
|
|
|
|
|
|
| ||
MTM swaps & caps |
| 16,736 |
| 20,628 |
| ||
|
|
|
|
|
| ||
GAAP net income |
| $ | 35,261 |
| $ | 42,104 |
|
|
|
|
|
|
| ||
GAAP EPS (diluted) |
| $ | 0.72 |
| $ | 0.87 |
|
Investment Portfolio ($ millions)
[CHART]
GAAP Revenue Components ($ thousands)
[CHART]
3
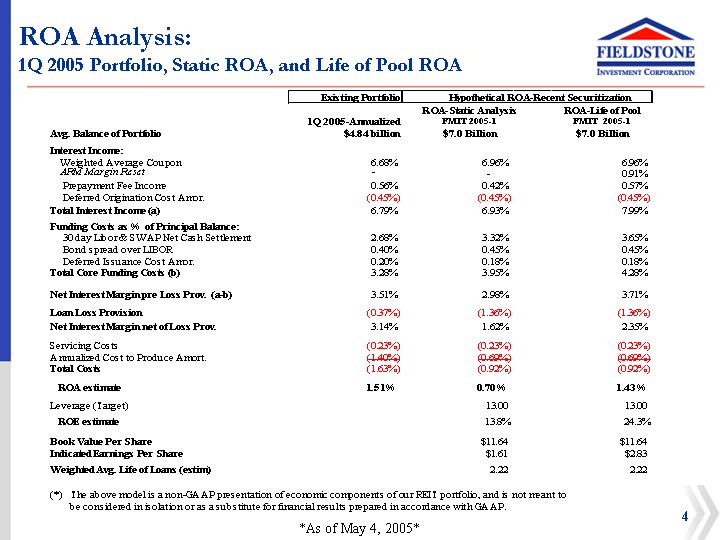
ROA Analysis:
1Q 2005 Portfolio, Static ROA, and Life of Pool ROA
|
|
|
| Hypothetical ROA-Recent Securitization |
| |||||
|
| Existing Portfolio |
| ROA-Static Analysis |
| ROA-Life of Pool |
| |||
|
| 1Q 2005-Annualized |
| FMIT 2005-1 |
| FMIT 2005-1 |
| |||
Avg. Balance of Portfolio |
| $ | 4.84 billion |
| $ | 7.0 Billion |
| $ | 7.0 Billion |
|
Interest Income: |
|
|
|
|
|
|
| |||
Weighted Average Coupon |
| 6.68 | % | 6.96 | % | 6.96 | % | |||
ARM Margin Reset |
| — |
| — |
| 0.91 | % | |||
Prepayment Fee Income |
| 0.56 | % | 0.42 | % | 0.57 | % | |||
Deferred Origination Cost Amor. |
| (0.45 | )% | (0.45 | )% | (0.45 | )% | |||
Total Interest Income (a) |
| 6.79 | % | 6.93 | % | 7.99 | % | |||
|
|
|
|
|
|
|
| |||
Funding Costs as% of Principal Balance: |
|
|
|
|
|
|
| |||
30 day Libor & SWAP Net Cash Settlement |
| 2.68 | % | 3.32 | % | 3.65 | % | |||
Bond spread over LIBOR |
| 0.40 | % | 0.45 | % | 0.45 | % | |||
Deferred Issuance Cost Amor. |
| 0.20 | % | 0.18 | % | 0.18 | % | |||
Total Core Funding Costs (b) |
| 3.28 | % | 3.95 | % | 4.28 | % | |||
|
|
|
|
|
|
|
| |||
Net Interest Margin pre Loss Prov. (a-b) |
| 3.51 | % | 2.98 | % | 3.71 | % | |||
|
|
|
|
|
|
|
| |||
Loan Loss Provision |
| (0.37 | )% | (1.36 | )% | (1.36 | )% | |||
Net Interest Margin net of Loss Prov. |
| 3.14 | % | 1.62 | % | 2.35 | % | |||
|
|
|
|
|
|
|
| |||
Servicing Costs |
| (0.23 | )% | (0.23 | )% | (0.23 | )% | |||
Annualized Cost to Produce Amort. |
| (1.40 | )% | (0.69 | )% | (0.69 | )% | |||
Total Costs |
| (1.63 | )% | (0.92 | )% | (0.92 | )% | |||
|
|
|
|
|
|
|
| |||
ROA estimate |
| 1.51 | % | 0.70 | % | 1.43 | % | |||
|
|
|
|
|
|
|
| |||
Leverage (Target) |
|
|
| 13.00 |
| 13.00 |
| |||
|
|
|
|
|
|
|
| |||
ROE estimate |
|
|
| 13.8 | % | 24.3 | % | |||
|
|
|
|
|
|
|
| |||
Book Value Per Share |
|
|
| $ | 11.64 |
| $ | 11.64 |
| |
Indicated Earnings Per Share |
|
|
| $ | 1.61 |
| $ | 2.83 |
| |
|
|
|
|
|
|
|
| |||
Weighted Avg. Life of Loans (estim) |
|
|
| 2.22 |
| 2.22 |
| |||
(*) The above model is a non-GAAP presentation of economic components of our REIT portfolio, and is not meant to be considered in isolation or as a substitute for financial results prepared in accordance with GAAP.
4
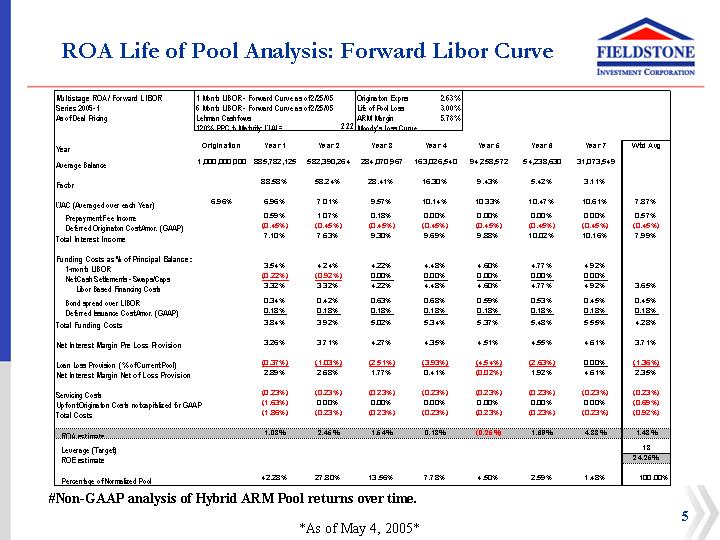
ROA Life of Pool Analysis: Forward Libor Curve
Multistage ROA / Forward LIBOR |
| 1 Month LIBOR - Forward Curve as of 2/25/05 |
| Origination Expns |
| 2.63 | % | 1.18 | % |
Series 2005-1 |
| 6 Month LIBOR - Forward Curve as of 2/25/05 |
| Life of Pool Loss |
| 3.00 | % | 1.35 | % |
As of Deal Pricing |
| Lehman Cashflows |
| ARM Margin |
| 5.78 | % |
|
|
|
| 120% PPC to Maturity: WAL= | 2.22 | Moody’s Loss Curve |
|
|
|
|
|
Year |
| Origination |
| Year 1 |
| Year 2 |
| Year 3 |
| Year 4 |
| Year 5 |
| Year 6 |
| Year 7 |
| Wtd Avg |
|
|
|
|
|
|
|
|
|
|
|
|
|
|
|
|
|
|
|
|
|
Average Balance |
| 1,000,000,000 |
| 885,782,125 |
| 582,390,264 |
| 284,070,967 |
| 163,026,540 |
| 94,258,572 |
| 54,238,630 |
| 31,073,549 |
|
|
|
|
|
|
|
|
|
|
|
|
|
|
|
|
|
|
|
|
|
|
|
Factor |
|
|
| 88.58 | % | 58.24 | % | 28.41 | % | 16.30 | % | 9.43 | % | 5.42 | % | 3.11 | % |
|
|
|
|
|
|
|
|
|
|
|
|
|
|
|
|
|
|
|
|
|
|
WAC (Averaged over each Year) |
| 6.96 | % | 6.96 | % | 7.01 | % | 9.57 | % | 10.14 | % | 10.33 | % | 10.47 | % | 10.61 | % | 7.87 | % |
|
|
|
|
|
|
|
|
|
|
|
|
|
|
|
|
|
|
|
|
Prepayment Fee Income |
|
|
| 0.59 | % | 1.07 | % | 0.18 | % | 0.00 | % | 0.00 | % | 0.00 | % | 0.00 | % | 0.57 | % |
Deferred Origination Cost Amor. (GAAP) |
|
|
| (0.45 | )% | (0.45 | )% | (0.45 | )% | (0.45 | )% | (0.45 | )% | (0.45 | )% | (0.45 | )% | (0.45 | )% |
Total Interest Income |
|
|
| 7.10 | % | 7.63 | % | 9.30 | % | 9.69 | % | 9.88 | % | 10.02 | % | 10.16 | % | 7.99 | % |
|
|
|
|
|
|
|
|
|
|
|
|
|
|
|
|
|
|
|
|
Funding Costs as % of Principal Balance: |
|
|
|
|
|
|
|
|
|
|
|
|
|
|
|
|
|
|
|
1-month LIBOR |
|
|
| 3.54 | % | 4.24 | % | 4.22 | % | 4.48 | % | 4.60 | % | 4.77 | % | 4.92 | % |
|
|
Net Cash Settlements - Swaps/Caps |
|
|
| (0.22 | )% | (0.92 | )% | 0.00 | % | 0.00 | % | 0.00 | % | 0.00 | % | 0.00 | % |
|
|
Libor Based Financing Costs |
|
|
| 3.32 | % | 3.32 | % | 4.22 | % | 4.48 | % | 4.60 | % | 4.77 | % | 4.92 | % | 3.65 | % |
|
|
|
|
|
|
|
|
|
|
|
|
|
|
|
|
|
|
|
|
Bond spread over LIBOR |
|
|
| 0.34 | % | 0.42 | % | 0.63 | % | 0.68 | % | 0.59 | % | 0.53 | % | 0.45 | % | 0.45 | % |
Deferred Issuance Cost Amor. (GAAP) |
|
|
| 0.18 | % | 0.18 | % | 0.18 | % | 0.18 | % | 0.18 | % | 0.18 | % | 0.18 | % | 0.18 | % |
Total Funding Costs |
|
|
| 3.84 | % | 3.92 | % | 5.02 | % | 5.34 | % | 5.37 | % | 5.48 | % | 5.55 | % | 4.28 | % |
|
|
|
|
|
|
|
|
|
|
|
|
|
|
|
|
|
|
|
|
Net Interest Margin Pre Loss Provision |
|
|
| 3.26 | % | 3.71 | % | 4.27 | % | 4.35 | % | 4.51 | % | 4.55 | % | 4.61 | % | 3.71 | % |
|
|
|
|
|
|
|
|
|
|
|
|
|
|
|
|
|
|
|
|
Loan Loss Provision (% of Current Pool) |
|
|
| (0.37 | )% | (1.03 | )% | (2.51 | )% | (3.93 | )% | (4.54 | )% | (2.63 | )% | 0.00 | % | (1.36 | )% |
Net Interest Margin Net of Loss Provision |
|
|
| 2.89 | % | 2.68 | % | 1.77 | % | 0.41 | % | (0.02 | )% | 1.92 | % | 4.61 | % | 2.35 | % |
|
|
|
|
|
|
|
|
|
|
|
|
|
|
|
|
|
|
|
|
Servicing Costs |
|
|
| (0.23 | )% | (0.23 | )% | (0.23 | )% | (0.23 | )% | (0.23 | )% | (0.23 | )% | (0.23 | )% | (0.23 | )% |
Upfront Origination Costs not capitalized for GAAP |
|
|
| (1.63 | )% | 0.00 | % | 0.00 | % | 0.00 | % | 0.00 | % | 0.00 | % | 0.00 | % | (0.69 | )% |
Total Costs |
|
|
| (1.86 | )% | (0.23 | )% | (0.23 | )% | (0.23 | )% | (0.23 | )% | (0.23 | )% | (0.23 | )% | (0.92 | )% |
|
|
|
|
|
|
|
|
|
|
|
|
|
|
|
|
|
|
|
|
ROA estimate |
|
|
| 1.03 | % | 2.45 | % | 1.54 | % | 0.18 | % | (0.25 | )% | 1.69 | % | 4.38 | % | 1.43 | % |
|
|
|
|
|
|
|
|
|
|
|
|
|
|
|
|
|
|
|
|
Leverage (Target) |
|
|
|
|
|
|
|
|
|
|
|
|
|
|
|
|
| 13 |
|
ROE estimate |
|
|
|
|
|
|
|
|
|
|
|
|
|
|
|
|
| 24.25 | % |
|
|
|
|
|
|
|
|
|
|
|
|
|
|
|
|
|
|
|
|
Percentage of Normalized Pool |
|
|
| 42.28 | % | 27.80 | % | 13.56 | % | 7.78 | % | 4.50 | % | 2.59 | % | 1.48 | % | 100.00 | % |
#Non-GAAP analysis of Hybrid ARM Pool returns over time.
5
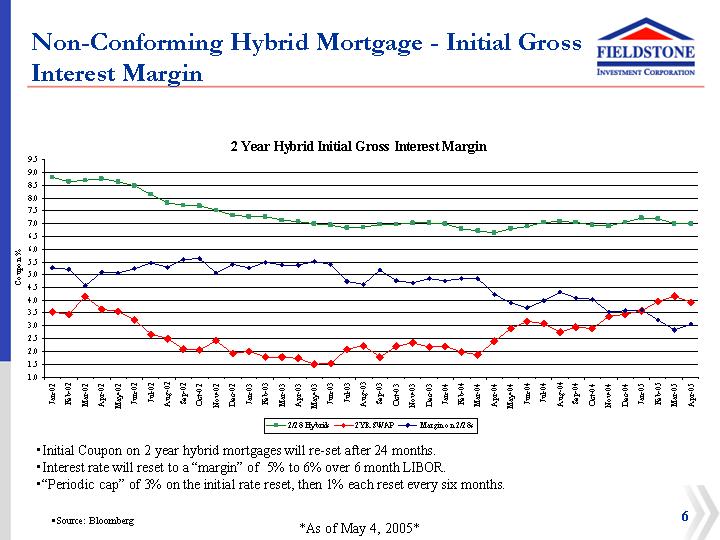
Non-Conforming Hybrid Mortgage - Initial Gross Interest Margin
2 Year Hybrid Initial Gross Interest Margin
[CHART]
• Initial Coupon on 2 year hybrid mortgages will re-set after 24 months.
• Interest rate will reset to a “margin” of 5% to 6% over 6 month LIBOR.
• “Periodic cap” of 3% on the initial rate reset, then 1% each reset every six months. .
• Source: Bloomberg
6
Hybrid Loans Funded with LIBOR Based Debt
Fieldstone Portfolio Hedging Program
Portfolio Weighted Average Swap Rate vs. Forward LIBOR Curve
[CHART]
7
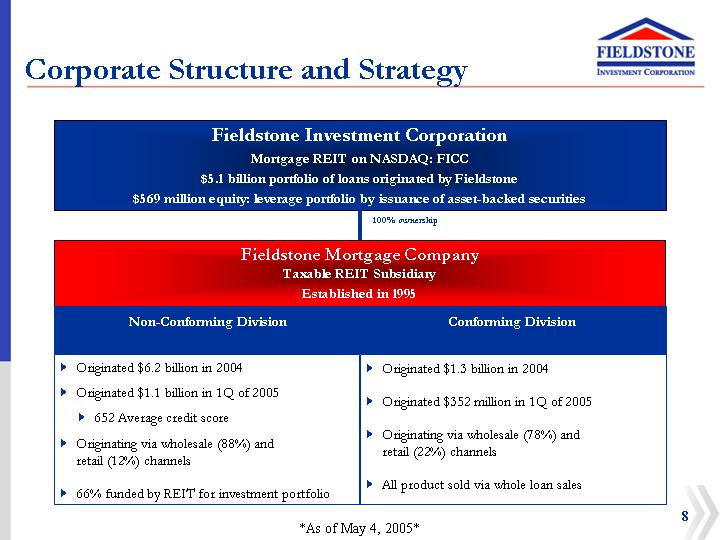
Corporate Structure and Strategy
Fieldstone Investment Corporation
Mortgage REIT on NASDAQ: FICC
$5.1 billion portfolio of loans originated by Fieldstone
$569 million equity: leverage portfolio by issuance of asset-backed securities
| 100% ownership |
Fieldstone Mortgage Company
Taxable REIT Subsidiary
Established in 1995
Non-Conforming Division |
| Conforming Division |
|
|
|
• Originated $6.2 billion in 2004 |
| • Originated $1.3 billion in 2004 |
|
|
|
• Originated $1.1 billion in 1Q of 2005 |
| • Originated $352 million in 1Q of 2005 |
|
|
|
• 652 Average credit score |
| • Originating via wholesale (78%) and retail (22%) channels |
• Originating via wholesale (88%) and retail (12%) channels |
|
|
|
| • All product sold via whole loan sales |
• 66% funded by REIT for investment portfolio |
|
|
8
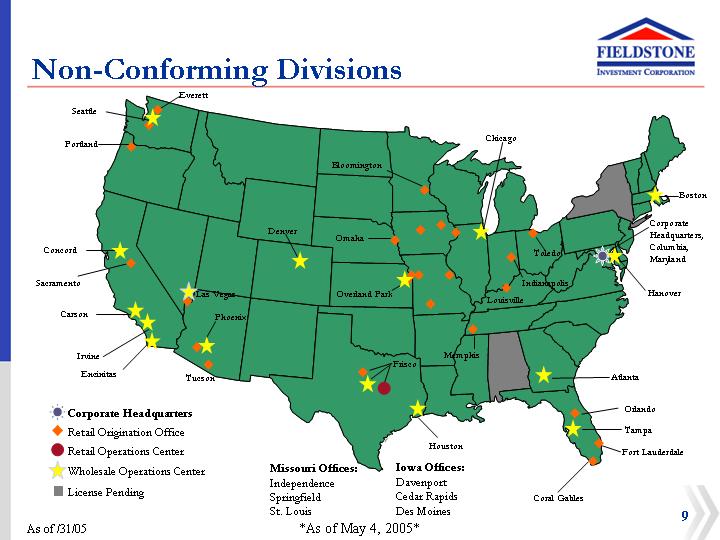
Non-Conforming Divisions
[GRAPHIC]
| Missouri Offices: | Iowa Offices: |
| Independence | Davenport |
| Springfield | Cedar Rapids |
| St. Louis | Des Moines |
9
Portfolio Strategy
• Originate high quality non-conforming ARM loans for REIT portfolio
• 2/28 hybrid ARMs primarily
• 651 average credit score
• Interest only 2/28 ARM loans, fully amortize after five years
• Reduced documentation and higher LTV at higher average credit score
• Finance portfolio with long-term securitization debt
• On-balance sheet financing
• No “gain on sale” non-cash gains on securitization
• Committed financing with strong asset-liability management
• Retain Fieldstone loans to assure quality and minimize cost basis
• Current Target portfolio size of $6 to $7 billion
11
Fieldstone Portfolio as of March 31, 2005
Collateral Characteristics
Average Credit Score |
| 651 |
| |
|
|
|
| |
Hybrid Arms |
| 99.4 | % | |
|
|
|
| |
Average Coupon |
| 6.9 | % | |
|
|
|
| |
Gross Margin |
| 5.7 | % | |
|
|
|
| |
Prepayment Fee Coverage |
| 86.8 | % | |
|
|
|
| |
Full Income Documentation |
| 46.3 | % | |
|
|
|
| |
Interest Only Loans |
| 61.3 | % | |
|
|
|
| |
Weighted Average LTV |
| 82.1 | % | |
|
|
|
| |
-LTV>90% |
| 3.3 | % | |
|
|
|
| |
Weighted Average CLTV |
| 92.5 | % | |
|
|
|
| |
State Concentration-California |
| 45.8 | % | |
|
|
|
| |
Average Loan Size |
| $ | 193,874 |
|
|
|
|
| |
-Avg. Property Value |
| $ | 240,142 |
|
|
|
|
| |
-Avg. Property Value-CA |
| $ | 356,470 |
|
Investment Portfolio Growth ($ millions)
[CHART]
Credit Score Distribution
[CHART]
12
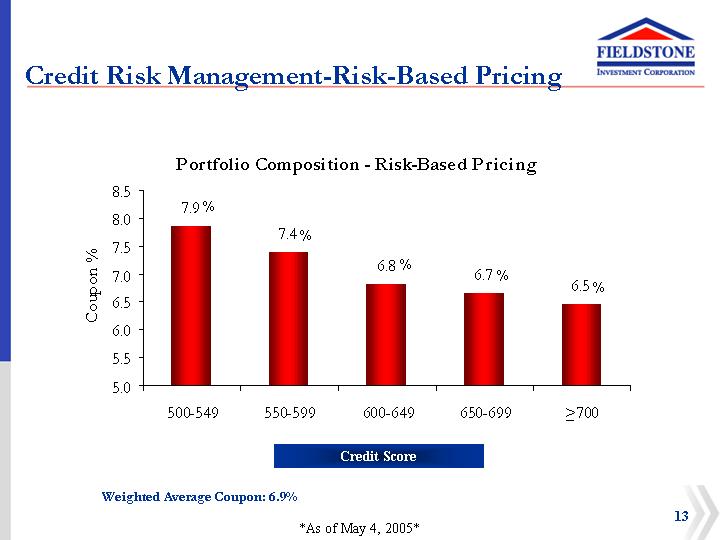
Credit Risk Management-Risk-Based Pricing
Portfolio Composition - Risk-Based Pricing
[CHART]
Weighted Average Coupon: 6.9%
13
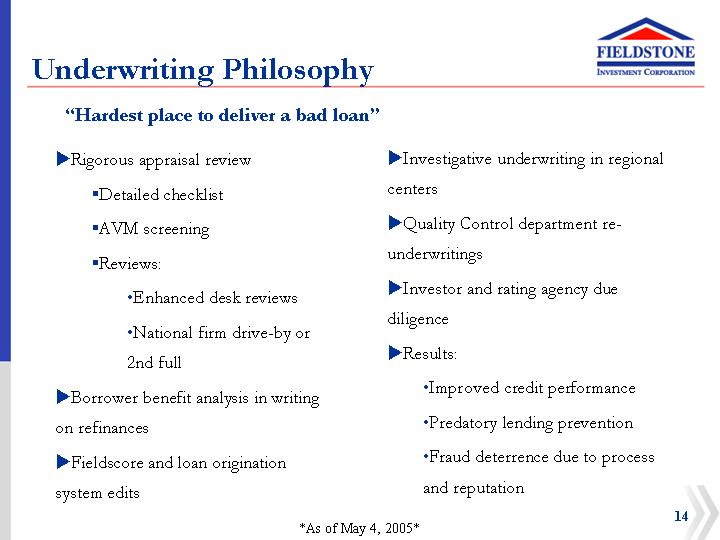
Underwriting Philosophy
“Hardest place to deliver a bad loan”
• Rigorous appraisal review
• Detailed checklist
• AVM screening
• Reviews:
• Enhanced desk reviews
• National firm drive-by or 2nd full
• Borrower benefit analysis in writing on refinances
• Fieldscore and loan origination system edits
• Investigative underwriting in regional centers
• Quality Control department re-underwritings
• Investor and rating agency due diligence
• Results:
• Improved credit performance
• Predatory lending prevention
• Fraud deterrence due to process and reputation
14
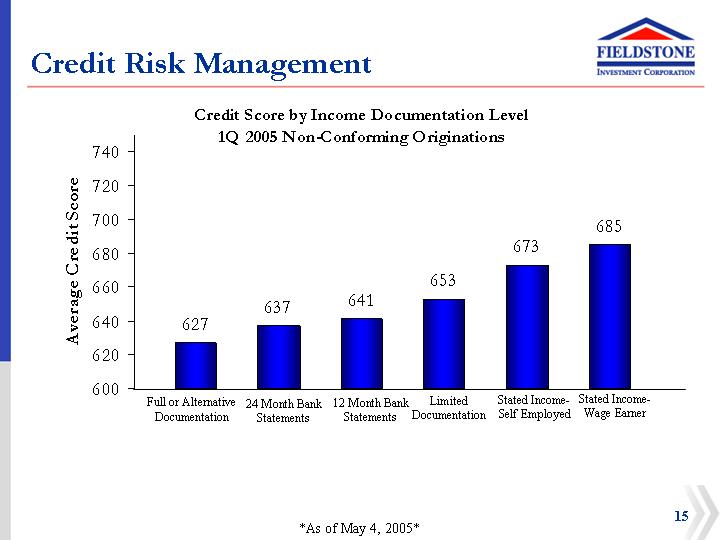
Credit Risk Management
Credit Score by Income Documentation Level
1Q 2005 Non-Conforming Originations
[CHART]
15
Servicing Strategy
• Fieldstone performs key loan set-up and initial quality control functions on all loans
• Highly rated sub-servicer: Chase Home Finance, LLC
• Fitch: RPS1- and RSS1- (primarily subprime and special servicing, respectively)
• Moody’s: SQ1 (subprime servicing)
• S&P: “STRONG” and on its select servicer list
• Wells Fargo Bank as:
• Master Servicer
• Bond Administrative Agent
• Servicer Oversight
• Ultimately, Fieldstone will look to build or acquire a significant servicing capacity
16
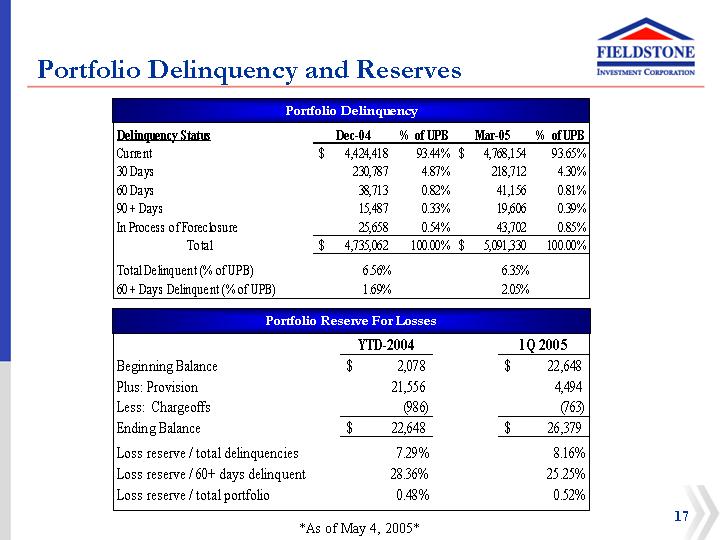
Portfolio Delinquency and Reserves
Portfolio Delinquency
Delinquency Status |
| Dec-04 |
| % of UPB |
| Mar-05 |
| % of UPB |
| ||
Current |
| $ | 4,424,418 |
| 93.44 | % | $ | 4,768,154 |
| 93.65 | % |
30 Days |
| 230,787 |
| 4.87 | % | 218,712 |
| 4.30 | % | ||
60 Days |
| 38,713 |
| 0.82 | % | 41,156 |
| 0.81 | % | ||
90 + Days |
| 15,487 |
| 0.33 | % | 19,606 |
| 0.39 | % | ||
In Process of Foreclosure |
| 25,658 |
| 0.54 | % | 43,702 |
| 0.85 | % | ||
Total |
| $ | 4,735,062 |
| 100.00 | % | $ | 5,091,330 |
| 100.00 | % |
|
|
|
|
|
|
|
|
|
| ||
Total Delinquent (% of UPB) |
| 6.56 | % |
|
| 6.35 | % |
|
| ||
60 + Days Delinquent (% of UPB) |
| 1.69 | % |
|
| 2.05 | % |
|
| ||
Portfolio Reserve For Losses
|
| YTD-2004 |
| 1Q 2005 |
| ||
Beginning Balance |
| $ | 2,078 |
| $ | 22,648 |
|
Plus: Provision |
| 21,556 |
| 4,494 |
| ||
Less: Chargeoffs |
| (986 | ) | (763 | ) | ||
Ending Balance |
| $ | 22,648 |
| $ | 26,379 |
|
|
|
|
|
|
| ||
Loss reserve / total delinquencies |
| 7.29 | % | 8.16 | % | ||
Loss reserve / 60+ days delinquent |
| 28.36 | % | 25.25 | % | ||
Loss reserve / total portfolio |
| 0.48 | % | 0.52 | % | ||
17
Liquidity Risk Management
• Finance loans prior to securitization or sale with a diverse group of Wall Street and bank lenders under $2.0 billion of committed lines
• Use mortgage-backed securities (MBS) to finance REIT portfolio
• Provides long-term financing for portfolio without margin calls
• MBS market highly liquid
• Structure securitizations to cash flow NIM from month one
• Not issuing “NIM” securities
• Focus on issuing bonds rated BBB or higher
• Not reliant upon selling low rated and less liquid (BBB- or BB) bonds
• Highly efficient - weighted average bond spread of LIBOR + 35 bps on 2005-1 (to call)
[GRAPHIC]
20
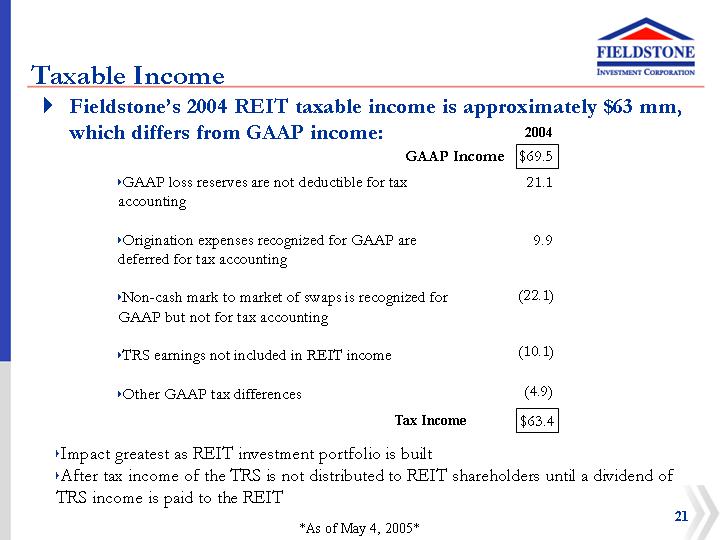
Taxable Income
• Fieldstone’s 2004 REIT taxable income is approximately $63 mm, which differs from GAAP income:
|
| 2004 |
| |
GAAP Income |
| $ | 69.5 |
|
|
|
|
|
|
• GAAP loss reserves are not deductible for tax accounting |
| 21.1 |
| |
|
|
|
| |
• Origination expenses recognized for GAAP are deferred for tax accounting |
| 9.9 |
| |
|
|
|
| |
• Non-cash mark to market of swaps is recognized for GAAP but not for tax accounting |
| (22.1 | ) | |
|
|
|
| |
• TRS earnings not included in REIT income |
| (10.1 | ) | |
|
|
|
| |
• Other GAAP tax differences |
| (4.9 | ) | |
|
|
|
| |
Tax Income |
| $ | 63.4 |
|
• Impact greatest as REIT investment portfolio is built
• After tax income of the TRS is not distributed to REIT shareholders until a dividend of TRS income is paid to the REIT
21
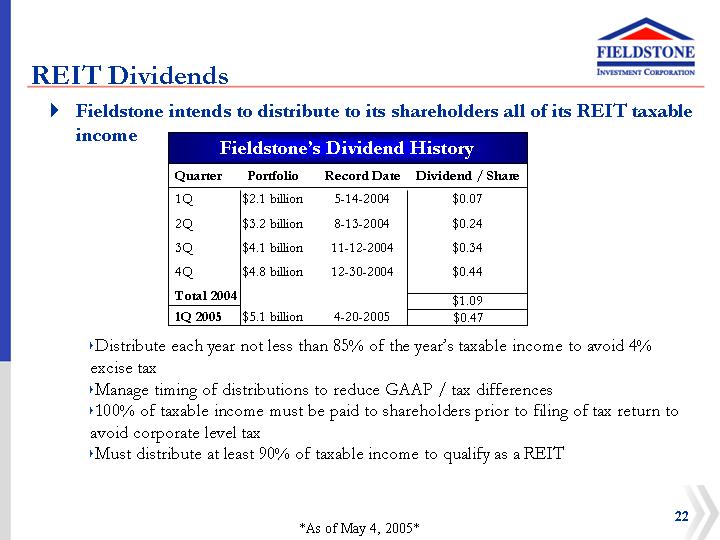
REIT Dividends
• Fieldstone intends to distribute to its shareholders all of its REIT taxable income
Fieldstone’s Dividend History
Quarter |
| Portfolio |
| Record Date |
| Dividend / Share |
| ||
1Q |
| $ | 2.1 billion |
| 5-14-2004 |
| $ | 0.07 |
|
|
|
|
|
|
|
|
|
|
|
2Q |
| $ | 3.2 billion |
| 8-13-2004 |
| $ | 0.24 |
|
|
|
|
|
|
|
|
|
|
|
3Q |
| $ | 4.1 billion |
| 11-12-2004 |
| $ | 0.34 |
|
|
|
|
|
|
|
|
|
|
|
4Q |
| $ | 4.8 billion |
| 12-30-2004 |
| $ | 0.44 |
|
|
|
|
|
|
|
|
| ||
Total 2004 |
|
|
|
|
| $ | 1.09 |
| |
1Q 2005 |
| $ | 5.1 billion |
| 4-20-2005 |
| $ | 0.47 |
|
• Distribute each year not less than 85% of the year’s taxable income to avoid 4% excise tax
• Manage timing of distributions to reduce GAAP / tax differences
• 100% of taxable income must be paid to shareholders prior to filing of tax return to avoid corporate level tax
• Must distribute at least 90% of taxable income to qualify as a REIT
22
Fieldstone’s Culture and Strategy
• Each employee takes personal accountability for the success of the Team
• Focus on long term relationships with market professionals where “value added” enables rational pricing and loan quality
• Fully integrated originator of and investor in quality mortgage loans in a tax-advantaged structure
• Experienced management team focused on:
• Quality of loans and operations
• Portfolio structured for stability in multiple rate environments
• Long-term value
23