Exhibit 99.1

Link to searchable text of slide shown above
Link to searchable text of slide shown above

Link to searchable text of slide shown above

Link to searchable text of slide shown above

Link to searchable text of slide shown above
Link to searchable text of slide shown above
Link to searchable text of slide shown above
Link to searchable text of slide shown above

Link to searchable text of slide shown above
Link to searchable text of slide shown above
Link to searchable text of slide shown above
Link to searchable text of slide shown above

Link to searchable text of slide shown above

Link to searchable text of slide shown above
Link to searchable text of slide shown above

Link to searchable text of slide shown above
Link to searchable text of slide shown above
Link to searchable text of slide shown above
Link to searchable text of slide shown above
Link to searchable text of slide shown above

Link to searchable text of slide shown above

Link to searchable text of slide shown above
Link to searchable text of slide shown above
Link to searchable text of slide shown above
Link to searchable text of slide shown above

Link to searchable text of slide shown above
Link to searchable text of slide shown above
Link to searchable text of slide shown above
Link to searchable text of slide shown above
Link to searchable text of slide shown above
Link to searchable text of slide shown above
Link to searchable text of slide shown above
Link to searchable text of slide shown above
Searchable text section of graphics shown above
Review of Business Strategy and Results
3rd Quarter 2005
[LOGO] | | www.FieldstoneInvestment.com |
FORWARD-LOOKING STATEMENTS
This presentation may contain “forward-looking statements” within the meaning of the federal securities laws and, if so, are being made pursuant to the safe harbor provisions of the Private Securities Litigation Reform Act of 1995. Actual results and the timing of certain events may differ materially from those indicated by such forward-looking statements due to a variety of risks and uncertainties, many of which are beyond Fieldstone’s ability to control or predict, including but not limited to (i) Fieldstone’s ability to successfully implement or change aspects of its portfolio strategy; (ii) interest rate volatility and the level of interest rates generally; (iii) the sustainability of loan origination volumes and current levels of origination costs; (iv) continued availability of credit facilities for the origination of mortgage loans; (v) the ability to sell or securitize mortgage loans; (vi) deterioration in the credit quality of Fieldstone’s loan portfolio; (vii) the nature and amount of competition; (viii) the impact of changes to the fair value of our interest rate swaps on our net income, which will vary based upon changes in interest rates and could cause net income to vary significantly from quarter to quarter; and (ix) other risks and uncertainties outlined in Fieldstone Investment Corporation’s quarterly report on Form
10-Q filed with the Securities and Exchange Commission (“SEC”) on November 14, 2005, its annual report on Form 10-K filed with the SEC on March 25, 2005 and other filings with the SEC. Neither Fieldstone nor any of its affiliates undertakes any obligations to revise publicly any forward-looking statements to reflect subsequent events or circumstances.
REGULATION G DISCLOSURES
Information on core net income, core income before taxes, core earnings per share (diluted), core net interest income after provision, core book value per share, pre-tax margin on non-conforming loans sold, REIT taxable income and REIT taxable income per share appearing elsewhere in this presentation may fall under the SEC’s definition of “non-GAAP financial measures.” Management believes the core financial measures are useful because they include the current period effects of Fieldstone’s economic hedging program but exclude the non-cash mark to market derivative value changes. The portion of the non-cash mark to market amounts excluded from the core financial measures, that ultimately will be a component of future core financial measures, depends on the level of actual interest rates in the future. Management believes the presentation of pre-tax margin on non-conforming loans sold provides useful information to the investors because it discloses the total economic contribution to the Company from the sale of non-conforming loans. Management believes the presentation of REIT taxable income and REIT taxable income per share provides useful information to investors regarding the annual distribution to our investors. As required by Regulation G, a reconciliation of each of these core financial measures to the most directly comparable measure under GAAP is included in this presentation.
2
Corporate Structure and Strategy
Fieldstone Investment Corporation
Mortgage REIT on NASDAQ: FICC
• $568 million shareholders’ equity
• $5.3 billion portfolio of Fieldstone’s loans
• Portfolio financed with $4.3 billion of MBS
• Pay dividends of portfolio earnings, pre-tax
• Dividends since inception of $2.57 per share
• Expect 2005 dividends of $1.98 to $2.04 per share
100% ownership
Fieldstone Mortgage Company
Taxable REIT Subsidiary
Established in 1995
Non-Conforming Division
• Originated $6.2 billion in 2004; $4.6 billion YTD 9/30/05
• Originated $1.8 billion in 3Q of 2005
• Mix of wholesale (90%) and retail (10%) originations
• 56% funded by REIT for investment portfolio
• Sell non-portfolio loans for cash gains on sale
• Interim servicing and initial loan set up
Conforming Division
• Originated $1.3 billion in 2004; $1.2 billion YTD 9/30/05
• Originated $434.0 million in 3Q of 2005
• Mix of wholesale (73%) and retail (27%) originations
• All loans sold for cash gains on sale
3
Fieldstone’s Investment Proposition
• REIT / TRS business model for stable income over time:
• Investment Portfolio currently $5.3 billion, target approximately $6.6 billion in 2006, 13:1 leverage
• TRS with national franchise, originating approximately $6.1 billion N-C loans / year
• Retain after tax cash gains from TRS sales of excess loan originations
• Focus on Portfolio Management:
• Manage liquidity, interest rate, yield curve and prepayment risk
• Cash flow immediately from limited leverage and no NIM sales
• ARM loans primarily, hedge 2/28’s with swaps
• Issue MBS for life-of-loan match funding, current cash flow
• Retain own loans for high quality and low basis in portfolio
• CEO first managed REIT mortgage portfolio in 1988
•�� Market Opportunity:
• Borrowers transition from Conforming to N-C / Alt-A as rates and debt ratios rise
• N-C lending based on RE values, not falling interest rates
• Fieldstone focuses on stable owner-occupied purchase sector
• Residential real estate values will continue to increase over time:
• RE prices supported by strong demand, limited supply
• Fieldstone’s average properties are ~ $245,000, $380,000 in CA
4
Fieldstone Portfolio as of September 30, 2005
Collateral Characteristics
Average Credit Score | | 650 | |
Hybrid ARMs | | 96.2 | % |
Average Current Coupon | | 6.9 | % |
Average Gross Margin | | 5.7 | % |
Prepayment Fee Coverage | | 86.5 | % |
Full Income Documentation | | 45.3 | % |
Interest Only Loans | | 61.2 | % |
Purchase Transactions | | 60.5 | % |
Primary Residences | | 94.8 | % |
Weighted Average LTV | | 82.2 | % |
- LTV>90% | | 4.4 | % |
- Weighted Average CLTV | | 92.6 | % |
State Concentration-California | | 42.8 | % |
Average Loan Size | | $ | 190,219 | |
- Average Property Value | | $ | 244,596 | |
- Average Property Value-CA | | $ | 379,981 | |
Investment Portfolio Growth ($ millions)
[CHART]
Credit Score Distribution
[CHART]
5
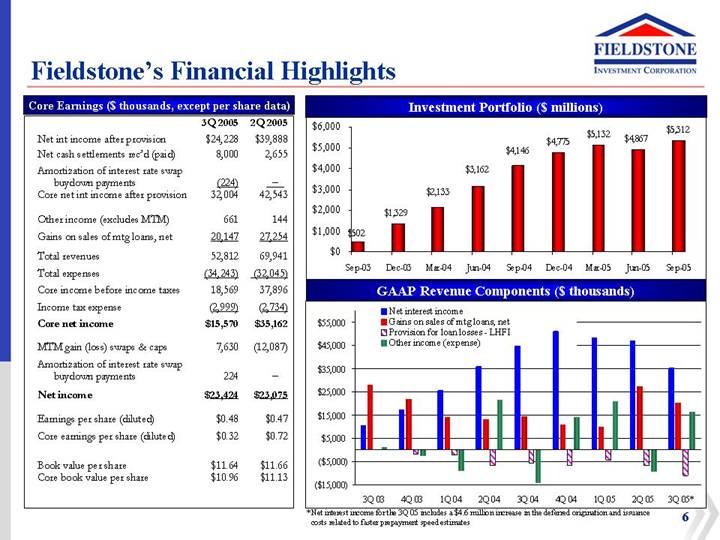
Fieldstone’s Financial Highlights
Core Earnings ($ thousands, except per share data)
| | 3Q 2005 | | 2Q 2005 | |
Net int income after provision | | $ | 24,228 | | $ | 39,888 | |
Net cash settlements rec’d (paid) | | 8,000 | | 2,655 | |
Amortization of interest rate swap buydown payments | | (224 | ) | — | |
Core net int income after provision | | 32,004 | | 42,543 | |
| | | | | |
Other income (excludes MTM) | | 661 | | 144 | |
Gains on sales of mtg loans, net | | 20,147 | | 27,254 | |
Total revenues | | 52,812 | | 69,941 | |
Total expenses | | (34,243 | ) | (32,045 | ) |
Core income before income taxes | | 18,569 | | 37,896 | |
Income tax expense | | (2,999 | ) | (2,734 | ) |
Core net income | | $ | 15,570 | | $ | 35,162 | |
| | | | | |
MTM gain (loss) swaps & caps | | 7,630 | | (12,087 | ) |
Amortization of interest rate swap buydown payments | | 224 | | — | |
Net income | | $ | 23,424 | | $ | 23,075 | |
| | | | | |
Earnings per share (diluted) | | $ | 0.48 | | $ | 0.47 | |
Core earnings per share (diluted) | | $ | 0.32 | | $ | 0.72 | |
| | | | | |
Book value per share | | $ | 11.64 | | $ | 11.66 | |
Core book value per share | | $ | 10.96 | | $ | 11.13 | |
Investment Portfolio ($ millions)
[CHART]
GAAP Revenue Components ($ thousands)
[CHART]
* Net interest income for the 3Q 05 includes a $4.6 million increase in the deferred origination and issuance costs related to faster prepayment speed estimates
6
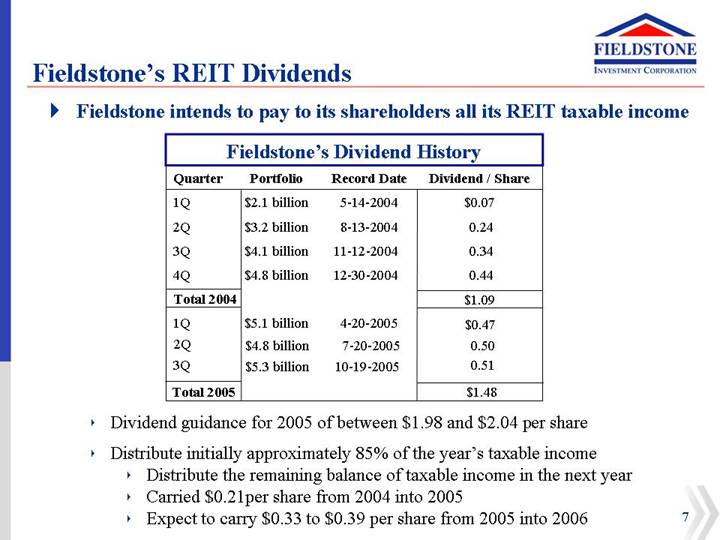
Fieldstone’s REIT Dividends
• Fieldstone intends to pay to its shareholders all its REIT taxable income
Fieldstone’s Dividend History
Quarter | | Portfolio | | Record Date | | Dividend / Share | |
1Q | | $ | 2.1 billion | | 5-14-2004 | | $ | 0.07 | |
2Q | | $ | 3.2 billion | | 8-13-2004 | | 0.24 | |
3Q | | $ | 4.1 billion | | 11-12-2004 | | 0.34 | |
4Q | | $ | 4.8 billion | | 12-30-2004 | | 0.44 | |
Total 2004 | | | | | | $ | 1.09 | |
1Q | | $ | 5.1 billion | | 4-20-2005 | | $ | 0.47 | |
2Q | | $ | 4.8 billion | | 7-20-2005 | | 0.50 | |
3Q | | $ | 5.3 billion | | 10-19-2005 | | 0.51 | |
Total 2005 | | | | | | $ | 1.48 | |
• Dividend guidance for 2005 of between $1.98 and $2.04 per share
• Distribute initially approximately 85% of the year’s taxable income
• Distribute the remaining balance of taxable income in the next year
• Carried $0.21per share from 2004 into 2005
• Expect to carry $0.33 to $0.39 per share from 2005 into 2006
7
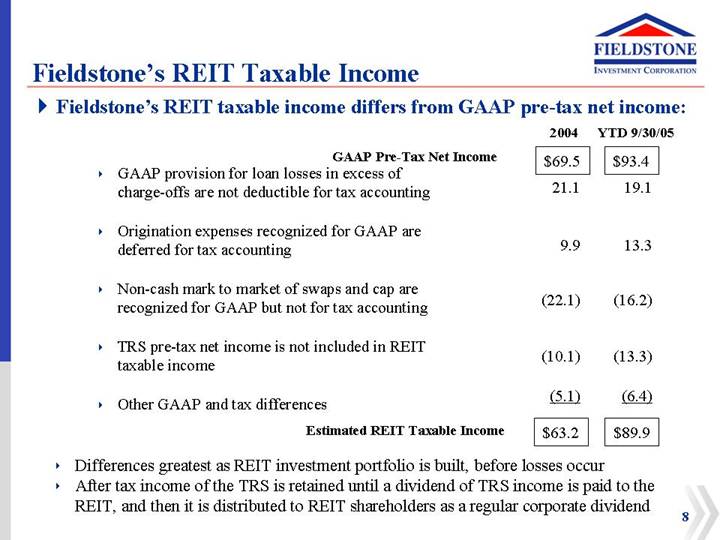
Fieldstone’s REIT Taxable Income
• Fieldstone’s REIT taxable income differs from GAAP pre-tax net income:
| | 2004 | | YTD 9/30/05 | |
GAAP Pre-Tax Net Income | | $ | 69.5 | | $ | 93.4 | |
| | | | | |
• GAAP provision for loan losses in excess of charge-offs are not deductible for tax accounting | | 21.1 | | 19.1 | |
| | | | | |
• Origination expenses recognized for GAAP are deferred for tax accounting | | 9.9 | | 13.3 | |
| | | | | |
• Non-cash mark to market of swaps and cap are recognized for GAAP but not for tax accounting | | (22.1 | ) | (16.2 | ) |
| | | | | |
• TRS pre-tax net income is not included in REIT taxable income | | (10.1 | ) | (13.3 | ) |
| | | | | |
• Other GAAP and tax differences | | (5.1 | ) | (6.4 | ) |
| | | | | |
Estimated REIT Taxable Income | | $ | 63.2 | | $ | 89.9 | |
• Differences greatest as REIT investment portfolio is built, before losses occur
• After tax income of the TRS is retained until a dividend of TRS income is paid to the REIT, and then it is distributed to REIT shareholders as a regular corporate dividend
8
Non-Conforming Hybrid ARM Mortgage - Initial Gross Interest Margin (prior to ARM re-set)
2 Year Hybrid Gross Int. Margin
[CHART]
• Initial Coupon on 2 year hybrid ARM mortgages will re-set after 24 months.
• Interest rate will reset to a “margin” of 5% to 6% over 6 month LIBOR.
• Periodic cap of 3% on the initial rate reset, 1% each reset every six months and 6% life cap.
• Source: Bloomberg
9
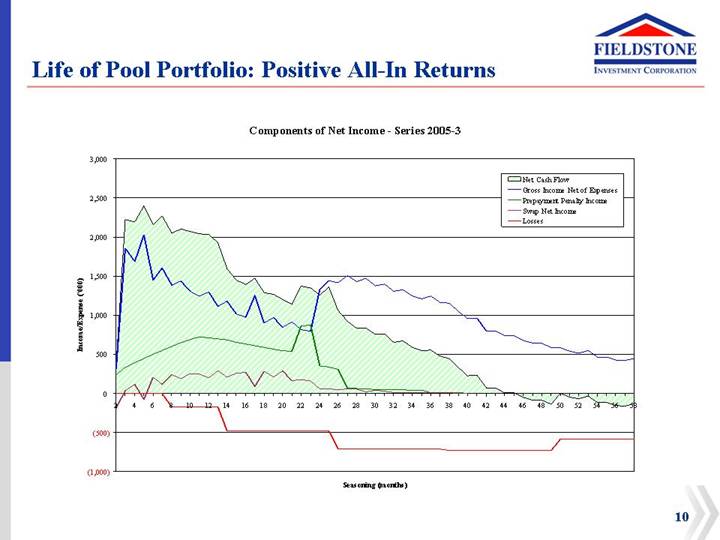
Life of Pool Portfolio: Positive All-In Returns
Components of Net Income - Series 2005-3
[CHART]
10
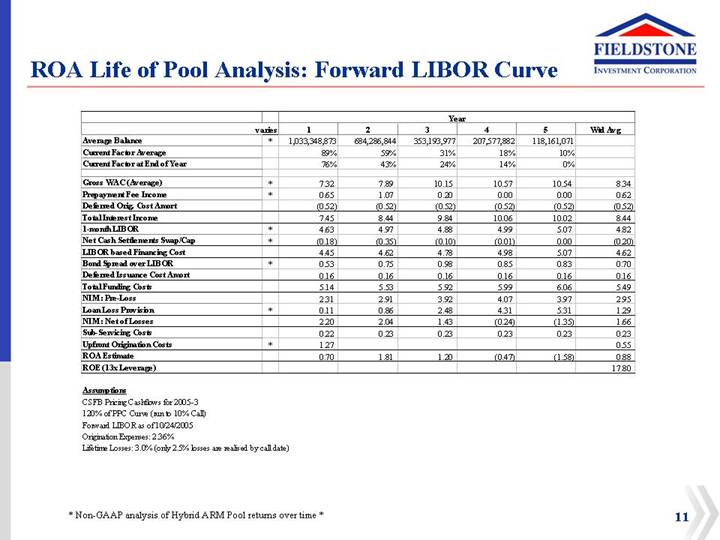
ROA Life of Pool Analysis: Forward LIBOR Curve
| | | | Year | |
| | varies | | 1 | | 2 | | 3 | | 4 | | 5 | | Wtd Avg | |
Average Balance | | * | | 1,033,348,873 | | 684,286,844 | | 353,193,977 | | 207,577,882 | | 118,161,071 | | | |
Current Factor Average | | | | 89 | % | 59 | % | 31 | % | 18 | % | 10 | % | | |
Current Factor at End of Year | | | | 76 | % | 43 | % | 24 | % | 14 | % | 0 | % | | |
| | | | | | | | | | | | | | | |
Gross WAC (Average) | | * | | 7.32 | | 7.89 | | 10.15 | | 10.57 | | 10.54 | | 8.34 | |
Prepayment Fee Income | | * | | 0.65 | | 1.07 | | 0.20 | | 0.00 | | 0.00 | | 0.62 | |
Deferred Orig. Cost Amort | | | | (0.52 | ) | (0.52 | ) | (0.52 | ) | (0.52 | ) | (0.52 | ) | (0.52 | ) |
Total Interest Income | | | | 7.45 | | 8.44 | | 9.84 | | 10.06 | | 10.02 | | 8.44 | |
1-month LIBOR | | * | | 4.63 | | 4.97 | | 4.88 | | 4.99 | | 5.07 | | 4.82 | |
Net Cash Settlements Swap/Cap | | * | | (0.18 | ) | (0.35 | ) | (0.10 | ) | (0.01 | ) | 0.00 | | (0.20 | ) |
LIBOR based Financing Cost | | | | 4.45 | | 4.62 | | 4.78 | | 4.98 | | 5.07 | | 4.62 | |
Bond Spread over LIBOR | | * | | 0.53 | | 0.75 | | 0.98 | | 0.85 | | 0.83 | | 0.70 | |
Deferred Issuance Cost Amort | | | | 0.16 | | 0.16 | | 0.16 | | 0.16 | | 0.16 | | 0.16 | |
Total Funding Costs | | | | 5.14 | | 5.53 | | 5.92 | | 5.99 | | 6.06 | | 5.49 | |
NIM: Pre-Loss | | | | 2.31 | | 2.91 | | 3.92 | | 4.07 | | 3.97 | | 2.95 | |
Loan Loss Provision | | * | | 0.11 | | 0.86 | | 2.48 | | 4.31 | | 5.31 | | 1.29 | |
NIM: Net of Losses | | | | 2.20 | | 2.04 | | 1.43 | | (0.24 | ) | (1.35 | ) | 1.66 | |
Sub-Servicing Costs | | | | 0.22 | | 0.23 | | 0.23 | | 0.23 | | 0.23 | | 0.23 | |
Upfront Origination Costs | | * | | 1.27 | | | | | | | | | | 0.55 | |
ROA Estimate | | | | 0.70 | | 1.81 | | 1.20 | | (0.47 | ) | (1.58 | ) | 0.88 | |
ROE (13x Leverage) | | | | | | | | | | | | | | 17.80 | |
Assumptions
CSFB Pricing Cashflows for 2005-3
120% of PPC Curve (run to 10% Call)
Forward LIBOR as of 10/24/2005
Origination Expenses: 2.36%
Lifetime Losses: 3.0% (only 2.5% losses are realised by call date)
* Non-GAAP analysis of Hybrid ARM Pool returns over time *
11
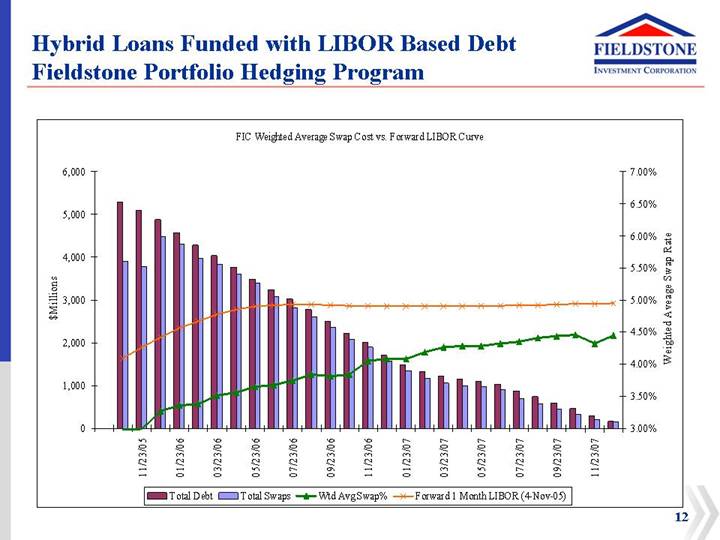
Hybrid Loans Funded with LIBOR Based Debt
Fieldstone Portfolio Hedging Program
FIC Weighted Average Swap Cost vs. Forward LIBOR Curve
[CHART]
12
ROA Analysis: 3Q 2005 Portfolio
| | YTD 12/31/2004 | | YTD 9/30/2005 | | Variance | |
Avgerage balance of portfolio | | $ | 3.07 billion | | $ | 4.82 billion | | $ | 1.75 billion | |
Interest income: | | | | | | | |
Weighted average coupon | | 6.61 | % | 6.66 | % | 0.05 | % |
Prepayment fee income | | 0.39 | % | 0.67 | % | 0.28 | % |
Deferred origination cost amortization | | (0.39 | )% | (0.54 | )% | (0.15 | )% |
Total interest income (a) | | 6.61 | % | 6.79 | % | 0.18 | % |
| | | | | | | |
Funding costs as % of portfolio principal balance: | | | | | | | |
30 day LIBOR and swap net cash settlements | | 1.81 | % | 2.72 | % | (0.91 | )% |
Bond and warehouse spread over LIBOR | | 0.70 | % | 0.44 | % | 0.26 | % |
Deferred issuance cost amortization | | 0.12 | % | 0.24 | % | (0.12 | )% |
Total core funding costs (b) | | 2.63 | % | 3.40 | % | (0.77 | )% |
| | | | | | | |
Net interest margin pre loss provision (a-b) | | 3.98 | % | 3.39 | % | (0.59 | )% |
| | | | | | | |
Loan loss provision | | (0.70 | )% | (0.60 | )% | 0.10 | % |
Net interest margin net of loss provision | | 3.28 | % | 2.79 | % | (0.49 | )% |
| | | | | | | |
Servicing costs | | (0.21 | )% | (0.18 | )% | 0.03 | % |
Current period production costs | | (0.93 | )% | (0.89 | )% | 0.04 | % |
Portfolio and home office expenses | | (0.39 | )% | (0.62 | )% | (0.23 | )% |
Total other costs | | (1.53 | )% | (1.69 | )% | (0.16 | )% |
| | | | | | | |
ROA estimate | | 1.75 | % | 1.10 | % | (0.65 | )% |
| | | | | | | | | | |
13
Prepayment Summary
FMIC Static Pool Prepayment Analysis
[CHART]
14
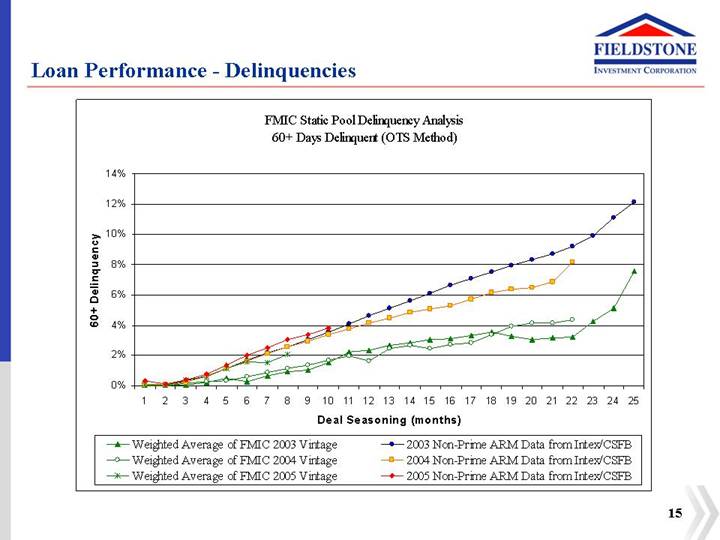
Loan Performance - Delinquencies
FMIC Static Pool Delinquency Analysis
60+ Days Delinquent (OTS Method)
[CHART]
15
Loan Performance – Losses
FMIC Static Pool Cumulative Loss Analysis
[CHART]
16
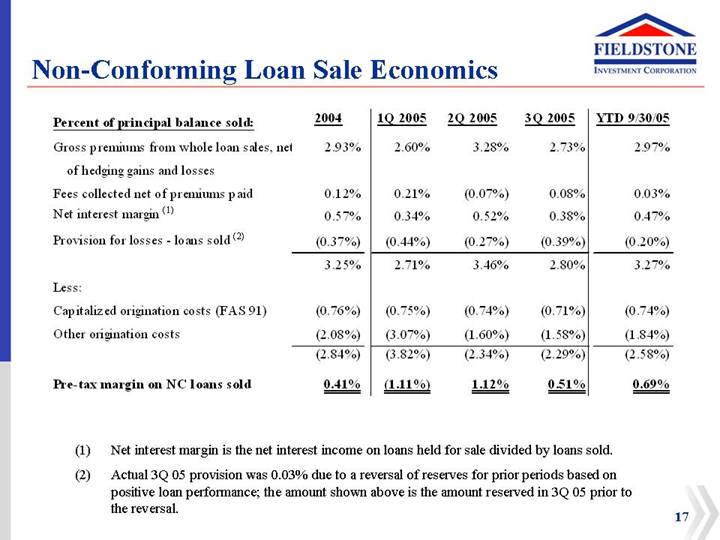
Non-Conforming Loan Sale Economics
Percent of principal balance sold: | | 2004 | | 1Q 2005 | | 2Q 2005 | | 3Q 2005 | | YTD 9/30/05 | |
Gross premiums from whole loan sales, net of hedging gains and losses | | 2.93 | % | 2.60 | % | 3.28 | % | 2.73 | % | 2.97 | % |
Fees collected net of premiums paid | | 0.12 | % | 0.21 | % | (0.07 | )% | 0.08 | % | 0.03 | % |
Net interest margin (1) | | 0.57 | % | 0.34 | % | 0.52 | % | 0.38 | % | 0.47 | % |
Provision for losses - loans sold (2) | | (0.37 | )% | (0.44 | )% | (0.27 | )% | (0.39 | )% | (0.20 | )% |
| | 3.25 | % | 2.71 | % | 3.46 | % | 2.80 | % | 3.27 | % |
Less: | | | | | | | | | | | |
Capitalized origination costs (FAS 91) | | (0.76 | )% | (0.75 | )% | (0.74 | )% | (0.71 | )% | (0.74 | )% |
Other origination costs | | (2.08 | )% | (3.07 | )% | (1.60 | )% | (1.58 | )% | (1.84 | )% |
| | (2.84 | )% | (3.82 | )% | (2.34 | )% | (2.29 | )% | (2.58 | )% |
| | | | | | | | | | | |
Pre-tax margin on NC loans sold | | 0.41 | % | (1.11 | )% | 1.12 | % | 0.51 | % | 0.69 | % |
(1) Net interest margin is the net interest income on loans held for sale divided by loans sold.
(2) Actual 3Q 05 provision was 0.03% due to a reversal of reserves for prior periods based on positive loan performance; the amount shown above is the amount reserved in 3Q 05 prior to the reversal.
17
Market Conditions and Opportunity
• Non-conforming credit mortgage market is stable and growing
• Growing market as consumer debt and interest rates rise
• Prime borrowers “transition” with higher payments and debt ratios
• Originations based on real estate values not changes in interest rates
• Fixed income market provides deep liquidity
• Wide demand for the asset class, supports whole loan sale prices
• Spreads of investment grade MBS are near historic tight margins
• If spreads widen, Fieldstone will benefit as an investor in its loans
• Residential real estate values have continued to increase
• Housing Market driven by increased demand, limited supply
• Purchase market stable: MBA estimate $1.7 trillion in 2006
• Positive total return opportunity in REIT investment portfolio
• Life-of-Pool returns on new ARM loans still attractive
• Forward rates, losses, prepayments and expenses modeled
• Ability to grow capital base and portfolio with TRS earnings
18
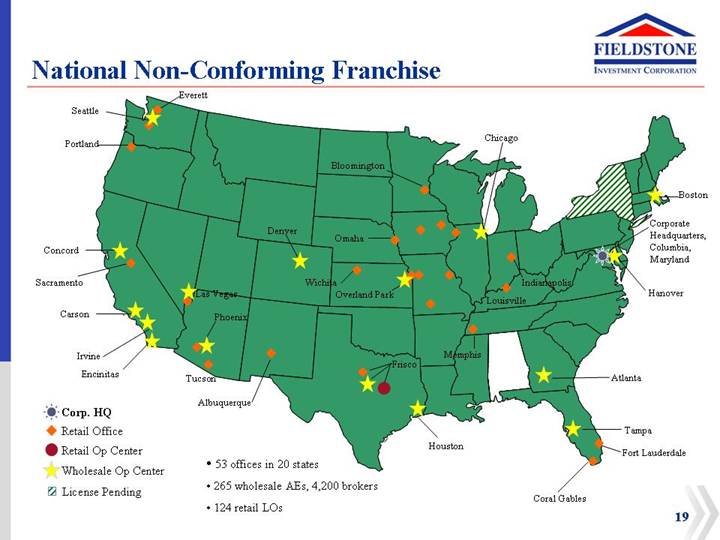
National Non-Conforming Franchise
[GRAPHIC]
• 53 offices in 20 states
• 265 wholesale AEs, 4,200 brokers
• 124 retail LOs
19
Fieldstone’s Origination Franchise
• Established loan origination channels (in TRS) since 1996:
• Focus on loan quality, customer service and operating efficiency
• Opportunistic product development
• Revenue-based commissions
• Quality-based management incentives
• Cultivate a learning organization to enhance
• products
• customer service
• operating efficiencies
• Stable business-to-business sourcing:
• Wholesale originations from professional brokers
• Retail originations from small financial service companies
• Compete on service and integrity, not rate or credit
• Mortgage loan operations driven by technology:
• On-Line loan pre-qualifications and submissions
• Electronic document delivery, funding and imaging
• New origination system to increase loans per person, lower origination cost
20
Underwriting Philosophy
“Hardest place to deliver a bad loan”
• Rigorous appraisal review checklist:
• AVM screening of all loans
• Reviews:
• Enhanced desk reviews
• National firm field review or 2nd full appraisal
• Chain of title on purchase
• Local underwriting to prevent fraud
• SSN validation
• IRS form 4506 on full doc
• Proof of borrower identity
• Data integrity from
• Fieldscore on-line pre-qual
• Loan origination system edits
• Borrower benefit analysis in writing on non-conforming refinances
• Quality Control department tests monthly: 15% sample
• Investor and rating agency due diligence
• Production Manager compensation tied to loan performance
21
Servicing Strategy
• Fieldstone performs key loan set-up and initial quality control functions on all loans
• Highly rated sub-servicer: Chase Home Finance, LLC
• Fitch: RPS1- and RSS1- (primary subprime and special servicing, respectively)
• Moody’s: SQ1 (subprime servicing)
• S&P: “STRONG” and on its select servicer list
• Wells Fargo Bank is engaged on securitizations as:
• Master Servicer
• Bond Administrative Agent
• Servicer Oversight
• Ultimately, Fieldstone will look to build or acquire a significant servicing capacity
• Will allow focus on special servicing, loss mitigation and product refinement
• Source of revenue, but will increase cost of servicing, at least temporarily
22
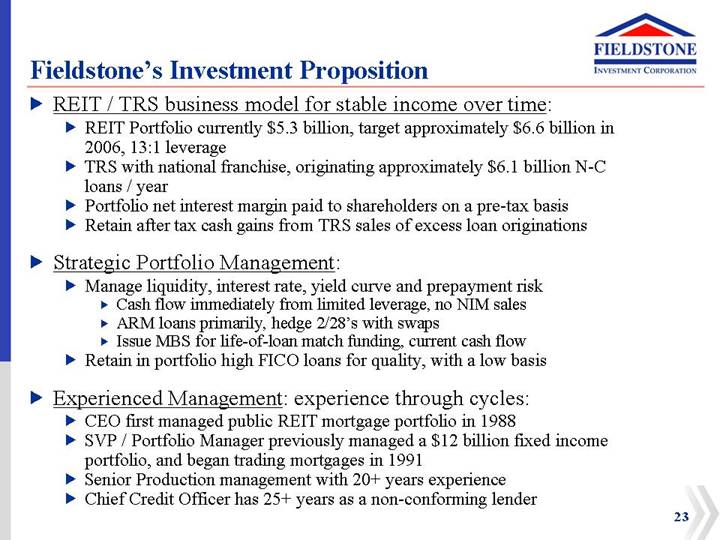
Fieldstone’s Investment Proposition
• REIT / TRS business model for stable income over time:
• REIT Portfolio currently $5.3 billion, target approximately $6.6 billion in 2006, 13:1 leverage
• TRS with national franchise, originating approximately $6.1 billion N-C loans / year
• Portfolio net interest margin paid to shareholders on a pre-tax basis
• Retain after tax cash gains from TRS sales of excess loan originations
• Strategic Portfolio Management:
• Manage liquidity, interest rate, yield curve and prepayment risk
• Cash flow immediately from limited leverage, no NIM sales
• ARM loans primarily, hedge 2/28’s with swaps
• Issue MBS for life-of-loan match funding, current cash flow
• Retain in portfolio high FICO loans for quality, with a low basis
• Experienced Management: experience through cycles:
• CEO first managed public REIT mortgage portfolio in 1988
• SVP / Portfolio Manager previously managed a $12 billion fixed income portfolio, and began trading mortgages in 1991
• Senior Production management with 20+ years experience
• Chief Credit Officer has 25+ years as a non-conforming lender
23
Review of Business Strategy and Results
3rd Quarter 2005
[LOGO] | | www.FieldstoneInvestment.com |
Supplemental Data
3rd Quarter 2005
Life of Pool Portfolio: Cost of Funds and Yield Analysis | | |
[CHART]
[CHART]
S-1
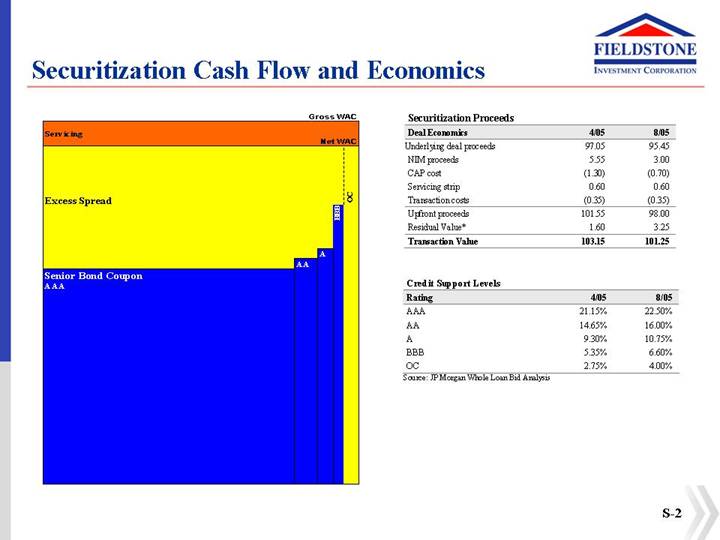
Securitization Cash Flow and Economics
[GRAPHIC]
Securitization Proceeds
Deal Economics | | 4/05 | | 8/05 | |
Underlying deal proceeds | | 97.05 | | 95.45 | |
NIM proceeds | | 5.55 | | 3.00 | |
CAP cost | | (1.30 | ) | (0.70 | ) |
Servicing strip | | 0.60 | | 0.60 | |
Transaction costs | | (0.35 | ) | (0.35 | ) |
Upfront proceeds | | 101.55 | | 98.00 | |
Residual Value* | | 1.60 | | 3.25 | |
Transaction Value | | 103.15 | | 101.25 | |
Credit Support Levels
Rating | | 4/05 | | 8/05 | |
AAA | | 21.15 | % | 22.50 | % |
AA | | 14.65 | % | 16.00 | % |
A | | 9.30 | % | 10.75 | % |
BBB | | 5.35 | % | 6.60 | % |
OC | | 2.75 | % | 4.00 | % |
Source: JP Morgan Whole Loan Bid Analysis
S-2
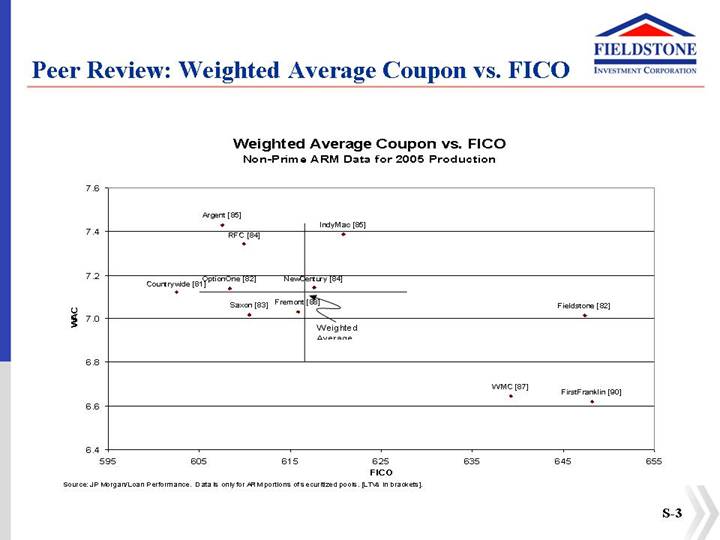
Peer Review: Weighted Average Coupon vs. FICO
Weighted Average Coupon vs. FICO
Non-Prime ARM Data for 2005 Production
[CHART]
Source: JP Morgan/Loan Performance. Data is only for ARM portions of securitized pools. [LTVs in brackets].
S-3
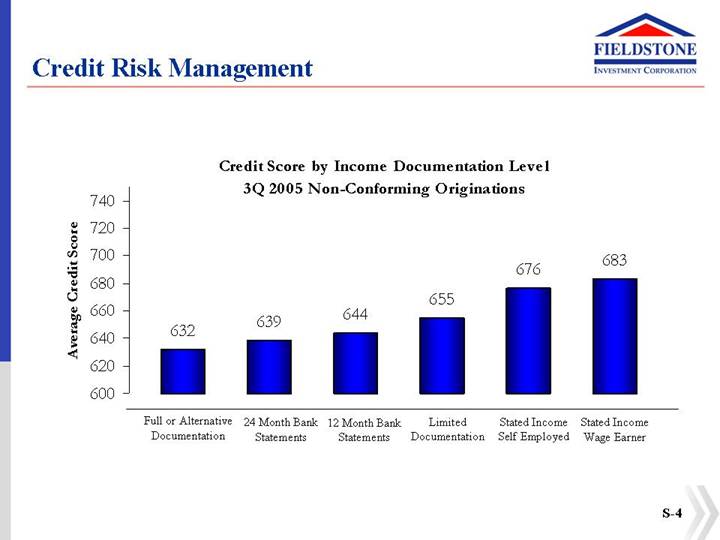
Credit Risk Management
Credit Score by Income Documentation Level
3Q 2005 Non-Conforming Originations
[CHART]
S-4
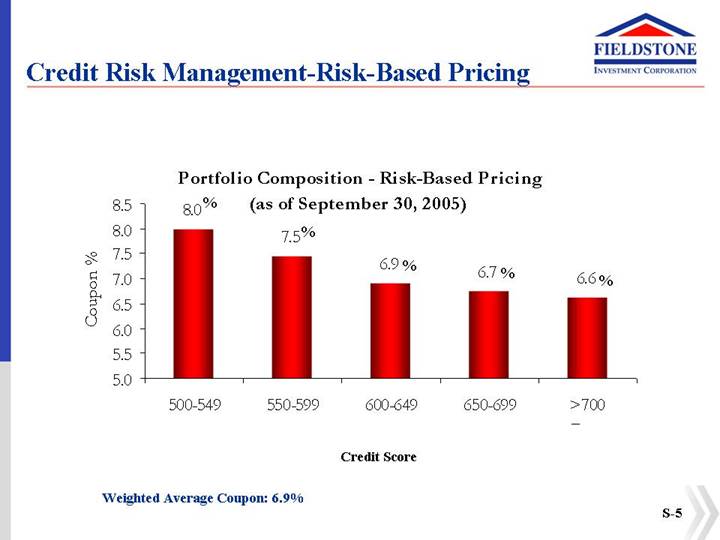
Credit Risk Management-Risk-Based Pricing
Portfolio Composition - Risk-Based Pricing
(as of September 30, 2005)
[CHART]
Weighted Average Coupon: 6.9%
S-5
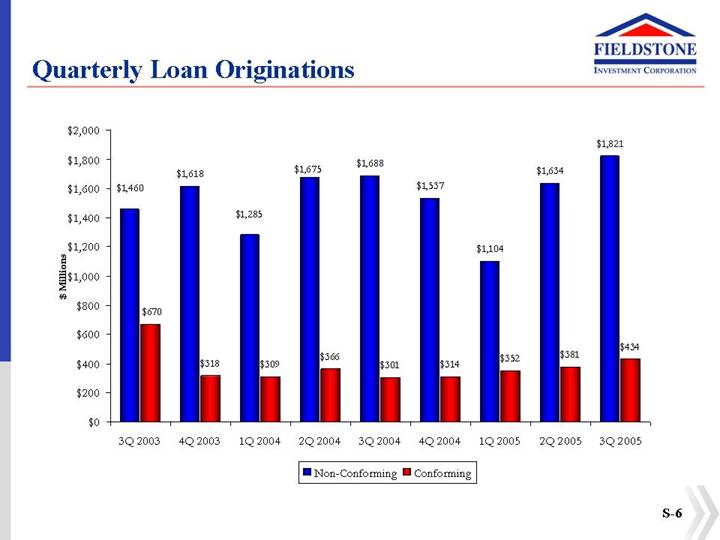
Quarterly Loan Originations
[CHART]
S-6
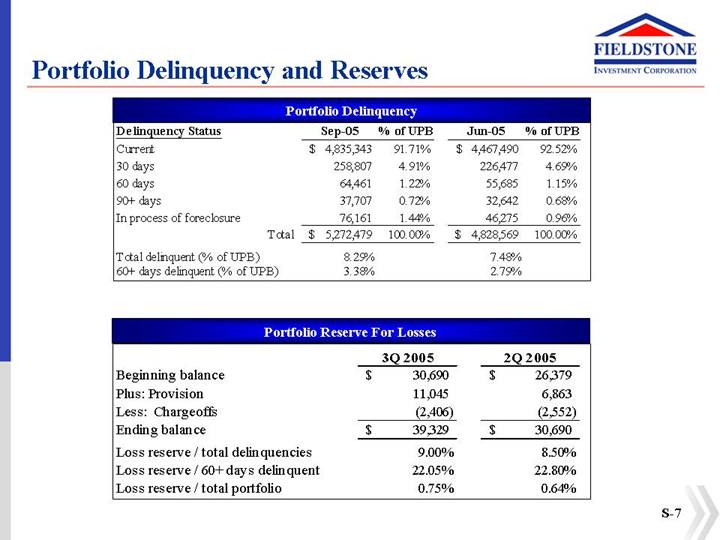
Portfolio Delinquency and Reserves
Portfolio Delinquency
Delinquency Status | | Sep-05 | | % of UPB | | Jun-05 | | % of UPB | |
Current | | $ | 4,835,343 | | 91.71 | % | $ | 4,467,490 | | 92.52 | % |
30 days | | 258,807 | | 4.91 | % | 226,477 | | 4.69 | % |
60 days | | 64,461 | | 1.22 | % | 55,685 | | 1.15 | % |
90+ days | | 37,707 | | 0.72 | % | 32,642 | | 0.68 | % |
In process of foreclosure | | 76,161 | | 1.44 | % | 46,275 | | 0.96 | % |
Total | | $ | 5,272,479 | | 100.00 | % | $ | 4,828,569 | | 100.00 | % |
Total delinquent (% of UPB) | | 8.29 | % | | | 7.48 | % | | |
60+ days delinquent (% of UPB) | | 3.38 | % | | | 2.79 | % | | |
Portfolio Reserve For Losses
| | 3Q 2005 | | 2Q 2005 | |
Beginning balance | | $ | 30,690 | | $ | 26,379 | |
Plus: Provision | | 11,045 | | 6,863 | |
Less: Chargeoffs | | (2,406 | ) | (2,552 | ) |
Ending balance | | $ | 39,329 | | $ | 30,690 | |
Loss reserve / total delinquencies | | 9.00 | % | 8.50 | % |
Loss reserve / 60+ days delinquent | | 22.05 | % | 22.80 | % |
Loss reserve / total portfolio | | 0.75 | % | 0.64 | % |
S-7
Warehouse and Securitization Financing
• Finance loans prior to securitization or sale with a diverse group of Wall Street and bank lenders with approximately $2.2 billion of committed lines
• Use mortgage-backed securities (MBS) to finance REIT portfolio
• Long-term financing for portfolio, no margin calls
• Securitizations cash flow from month one
• Not issuing “NIM” securities
• Retain non-inv. grade bonds
• Limited market risk of spread widening
• Have achieved highly efficient weighted average bond spread:
• LIBOR + 38 bps on 2005-2 (to the 10% call)
[GRAPHIC]
S-8