Securitization Program Update January 2007 www.FieldstoneInvestment.com Exhibit 99.1 |
2 FORWARD-LOOKING STATEMENTS This presentation may contain “forward-looking statements” within the meaning of the federal securities laws including, but not limited to (i) statements regarding the expected building of Fieldstone’s portfolio and origination business in 2007; (ii) the expected achievement of targeted leveraged returns on new loans; (iii) expectations regarding its funding levels, cost to originate, and initiatives on origination growth and cost management; (iv) initiatives designed to mitigate portfolio delinquencies and losses and the results of those initiatives, (v) expectations regarding its competitive position, (vi) opinions with respect to maintenance of its liquidity position, and (vii) statements regarding market condition and opportunity. These statements are being made pursuant to the safe harbor provisions of the Private Securities Litigation Reform Act of 1995. Actual results and the timing of certain events may differ materially from those indicated by such forward-looking statements due to a variety of risks and uncertainties, many of which are beyond Fieldstone’s ability to control or predict, including but not limited to (i) Fieldstone’s ability to successfully implement or change aspects of its portfolio strategy; (ii) interest rate volatility and the level of interest rates generally; (iii) the sustainability of loan origination volumes and levels of origination costs; (iv) continued availability of credit facilities for the liquidity Fieldstone needs to support its origination of mortgage loans; (v) the ability to sell or securitize mortgage loans on favorable economic terms; (vi) deterioration in the credit quality of Fieldstone’s loan portfolio; (vii) the nature and amount of competition; (viii) the impact of changes to the fair value of Fieldstone’s interest rate swaps on its net income, which will vary based upon changes in interest rates and could cause net income to vary significantly from quarter to quarter; and (ix) other risks and uncertainties outlined in Fieldstone Investment Corporation’s periodic reports filed with the Securities and Exchange Commission. The information contained in the presentation materials is summary information that is intended to be considered in the context of Fieldstone’s SEC filings and other public announcements that Fieldstone may make, by press release or otherwise, from time to time. These statements are made as of the date of this presentation, or as otherwise indicated, and Fieldstone undertakes no obligation to publicly update or revise any forward-looking statement, whether as a result of new information, future events or otherwise. BASIS OF PRESENTATION Financial information in this presentation presents the results of Fieldstone’s previous conforming origination business as a discontinued operation, following the sale in the first quarter of 2006 of the assets related to that business. Fieldstone’s continuing operations include its Investment Portfolio, Wholesale, Retail, and Corporate segments. With the exception of net income, the results of operations discussed in this presentation do not include the results of the discontinued operations, unless otherwise indicated. Disclaimer |
3 Table of Contents Page I. Fieldstone Summary 4 II. Portfolio Summary 14 III. Origination Summary 19 IV. Underwriting Summary 22 Supplemental Data : Collateral Performance and Trends 29 Collateral Risk-Adjusted Coupons 33 Management 34 |
4 Strategic Summary Fieldstone’s Business Proposition – Vertically integrated origination of and investment in residential mortgages – Complete dis-intermediation of the sector: pre-tax earnings direct to shareholders – Strong focus on loan quality, portfolio management and liquidity Strategic Imperatives for Fieldstone in 2007 – Lower cost to originate: in the origination branches and in the home office – Increased origination volume of non-prime, alt-A and full value loans – Improved delinquency and loss management of loans held for investment Current Market Conditions – Intense competition for loans in a contracting mortgage market – Low sale margins will continue, and only low-cost originators can profit on sale of loans – Slower Home Price Appreciation will: – increase delinquencies of borrowers that needed appreciation to afford their homes – increase opportunities for purchasers to afford to buy homes – Consolidation of mortgage origination capacity by largest financial service institutions Market Opportunity – Strong economy, job growth and aging and growing population remain positive for home prices – Attractive, risk-adjusted returns continue to be available on leveraged investments in non-prime loans – Non-prime and alt-A market share will increase due to continued growth of consumer debt – Difficult market conditions will eliminate competition from poorly capitalized participants – The most sophisticated participants in the residential market are buying origination capacity |
5 Fieldstone Summary Information Publicly traded on NASDAQ: FICC Fieldstone’s businesses include: Originating residential mortgage loans, in its Taxable REIT Subsidiary (TRS) Investing in a mortgage portfolio in the REIT for net interest income over time Issuing mortgage-backed securities to finance loans in the portfolio Selling non-portfolio loans from the TRS for current period gains REIT Portfolio: Total at 3Q ‘06: $5.9 Billion Primarily 2/28 ARM first liens Match fund with: MBS securities for life of loan Swaps during fixed rate period Origination business: Began operations in 1995 Licensed in 50 states Wholesale and Retail, non-prime and alt-A products 1,100 employees, including 375 AEs/Los at 3Q ‘06 Headquartered in Columbia, Maryland |
6 Current Market Conditions Mortgage originators under significant pressure Intense competition for loans in a contracting mortgage market Increased levels of early payment defaults and repurchase requests Continued imperative to lower costs requires significant investments in systems Volatile interest markets make hedging more difficult Seasonal slowing is compounded by firms “for-sale” driving volume with low rates Increased delinquencies for recent non-conforming credit borrowers generally Slower home price appreciation reduces the ability of borrowers to refinance Lack of equity appreciation in recent vintage loans means more will roll to REO Speculative buying in 2003 to 2006 will result in higher delinquencies and losses Delinquencies and losses on 2005 and 2006 loans higher than for 2002 thru 2004 loans, up to historic levels experienced on loans originated prior to 2002 Home Price Appreciation is expected to continue to be slow nationally Risk highest for investor loans and for largest loans with least demand Incentives for speculative buying have been wrung out of the market Markets that never over-heated should continue steady price increases Median and lower priced primary residences will hold value for the homeowner |
7 Market Opportunity Origination growth positive over the long term Rising consumer debt will drive demand for non-prime and Alt-A products Aging and growing population will support home price appreciation Challenging market will eliminate poorly capitalized originators Sophisticated buyers continue to purchase origination capacity in residential markets Positive total return opportunity in REIT investment portfolio Life-of-Pool risk-adjusted returns on new loans still attractive Forward rates, losses, prepayments and expenses modeled Increased risk premiums for the sector will lower sale margins but improve risk- adjusted portfolio returns Forward yield curve anticipates lower interest rates in the future Positive longer term for housing, mortgage industry and borrower credit Little impact on existing net interest spreads on loans held for investment due to swaps Non-cash charge to income to reduce the carrying value of the swaps as rates fall |
8 Fieldstone’s Strategic Initiatives for 2007 Reduce Cost to Originate Improve Servicing of Loan Portfolio Increase Market Share and Fundings |
9 Fieldstone’s Strategic Initiatives for 2007 Reduce Cost to Originate Reduce number of operations centers Lower premiums paid for wholesale loans Achieve efficiencies from use of new Loan Origination System Train customers on self-serve use of on-line technology Commission plan focused on net revenue, after expenses |
10 Fieldstone’s Strategic Initiatives for 2007 Improve Servicing of Loan Portfolio Accelerated manual intervention on delinquent loans Set-up loans initially with the permanent servicer Engaged delinquency and loss mitigation over-seer for 2006 loans Retain only selected products for portfolio: Already have eliminated weaker products Historically have excluded investor properties and high dollar value properties |
11 Fieldstone’s Strategic Initiatives for 2007 Increase Market Share and Fundings Simplified, discounted rate sheet on-line Focus customers on self-serve use of on-line technology Add sales force in strategic markets Add higher credit products with appropriate revenue opportunities Innovate on non-conforming cash flow features, not credit Real-time automation delivered on hand-held devices |
12 Fieldstone Remains Focused on Loan Quality Appraisal Reviews AVM or review appraisal on all loans Lower tolerances for AVM values in current real estate market Focus on recent sale and listing information for current valuations Borrower Credit FICO-driven underwriting guidelines Focus on debt ratio, disposable income and well-established credit history Eliminate lowest FICO, high CLTV programs Fraud Avoidance “Hawk Alert” and SSN validations on all loans Validate full doc. income using IRS form 4506T Validate reasonableness of stated income Proof of identification required at closing Chain of Title review on all purchase transactions Borrower benefit documented in writing on non-prime refinances Terminate business with brokers with poorly performing loans |
13 Capital Structure and Liquidity Fieldstone maintains: Adequate capital and liquidity $2.25 billion of lines of credit An increase of $500 million over September 30th Long-term, multifaceted relationships with our lenders In compliance with all covenants at September 30th Obtained amendments in December to insure compliance with covenants at year-end 2006 |
14 Fieldstone’s Investment Portfolio: Strategic Proposition Originate high quality non-conforming loans for REIT portfolio 2/28 hybrid ARMs primarily 648 average credit score as of September 30, 2006 Focus on median and lower priced, owner occupied homes Interest Only hybrid ARM ’ s begin amortizing after five years Finance portfolio with long-term securitization debt On-balance sheet financing No “ gain on sale ” non-cash gains on securitization Committed financing with strong asset-liability management Retain Fieldstone loans to assure quality Lock in spreads and return gains to shareholders Protection of current spreads with interest rate swaps Pre-tax REIT taxable income distributed as dividends to shareholders |
15 Credit Score Distribution Fieldstone Portfolio as of September 30, 2006 Investment Portfolio Balance ($ millions) Collateral Characteristics $4,752 $5,526 $5,487 $5,688 $5,855 $4,129 $5,106 $4,836 $5,273 $- $1,000 $2,000 $3,000 $4,000 $5,000 $6,000 $7,000 Sep-04 Dec-04 Mar-05 Jun-05 Sep-05 Dec-05 Mar-06 Jun-06 Sep-06 4% 15% 30% 34% 17% 0% 5% 10% 15% 20% 25% 30% 35% 40% 500-549 550-599 600-649 650-699 >700 Average Credit Score 648 First Lien Hybrid ARMs 89.1% - Average Current Coupon 7.9% - Average Gross Margin 5.2% Fixed Rate Second Liens 4.2% Prepayment Fee Coverage 85.0% Full Income Documentation 43.5% Interest Only Loans 53.3% Purchase Transactions 61.8% Primary Residences 96.6% Weighted Average LTV 82.4% - LTV>90% 6.3% - Weighted Average CLTV 93.3% State Concentration-California 39.0% Average Loan Size $175,109 -Average Property Value $257,679 -Average Property Value-CA $441,067 _ |
16 FMIC 2003-1 Size: $488,923,000 Priced: 10/3/03 AAA: LIBOR + 35bps BBB: LIBOR + 325bps FMIC 2004-1 Size: $663,157,000 Priced: 2/6/04 AAA: LIBOR + 31bps BBB: LIBOR + 180bps Size: $857,120,000 Priced: 4/16/04 AAA: LIBOR +25bps BBB: LIBOR +215bps FMIC 2004-3 Size: $986,500,000 Priced: 6/23/04 AAA: LIBOR + 30bps BBB: LIBOR + 215bps FMIC 2004-4 Size: $874,308,000 Priced: 9/27/04 AAA: LIBOR + 33bps BBB: LIBOR + 170bps FMIC 2004-5 Size: $892,350,000 Priced: 11/10/04 AAA: LIBOR + 34bps BBB: LIBOR + 185bps All of the figures are at deal inception. REIT Portfolio Strategy FMIC 2003-1 Caps at Forward LIBOR FMIC 2004-1 Swap at 1.94% FMIC 2004-2 Swap at 2.08% FMIC 2004-3 Swap at 3.29% FMIC 2004-4 Utilized Cap Corridor FMIC 2004-5 Swap at 2.89% FMIC 2005-1 Swap at 3.53% FMIC 2005-2 Swap at 3.95% FMIC 2005-3 Swap at 4.36% FMIC 2006-1 Swap at 4.79% FMIC 2006-2 Swap at 5.19% FMIC 2006-3 Swap at 5.19% Consistent Net Interest Income Consistent Issuance of MBS Debt Focused Strategy to Create Stable and High Yielding Cash Flows FMIC 2005-1 Size: $743,625,000 Priced: 2/14/05 AAA: LIBOR + 23bps BBB: LIBOR + 135bps FMIC 2005-2 Size: $958,447,000 Priced: 7/15/05 AAA: LIBOR + 25bps BBB: LIBOR + 135bps FMIC 2005-3 Size: $1,156,009,000 Priced: 10/28/05 AAA: LIBOR +24bps BBB: LIBOR + 200bps FMIC 2006-1 Size: $926,936,000 Priced: 3/14/06 AAA: LIBOR +17bps BBB: LIBOR + 230bps FMIC 2006-2 Size: $779,200,000 Priced: 6/29/06 AAA: LIBOR +15bps BBB: LIBOR +190 bps FMIC 2006-3 Size $832,855,000 Priced 10/20/06 AAA: LIBOR +14bps BBB: LIBOR +210 bps |
17 FMIC Program Distinguishing Characteristics Strong servicer – JPMorgan Chase Bank, N.A. maintains the highest servicer ratings from the rating agencies Strong Master Servicer / Servicing Oversight – Wells Fargo Bank, N.A. Reduced Basis Risk Primarily hybrid ARM collateral with limited fixed rate and 2 nd liens Interest rate swaps or other hedge instruments pledged to the trust during hybrid period Fieldstone aligns its interests with those of ABS investors Retains BBB-rated notes Retains full residual / “equity” in pool Funds OC up-front even though not selling NIM Treats securitization as a financing on balance sheet |
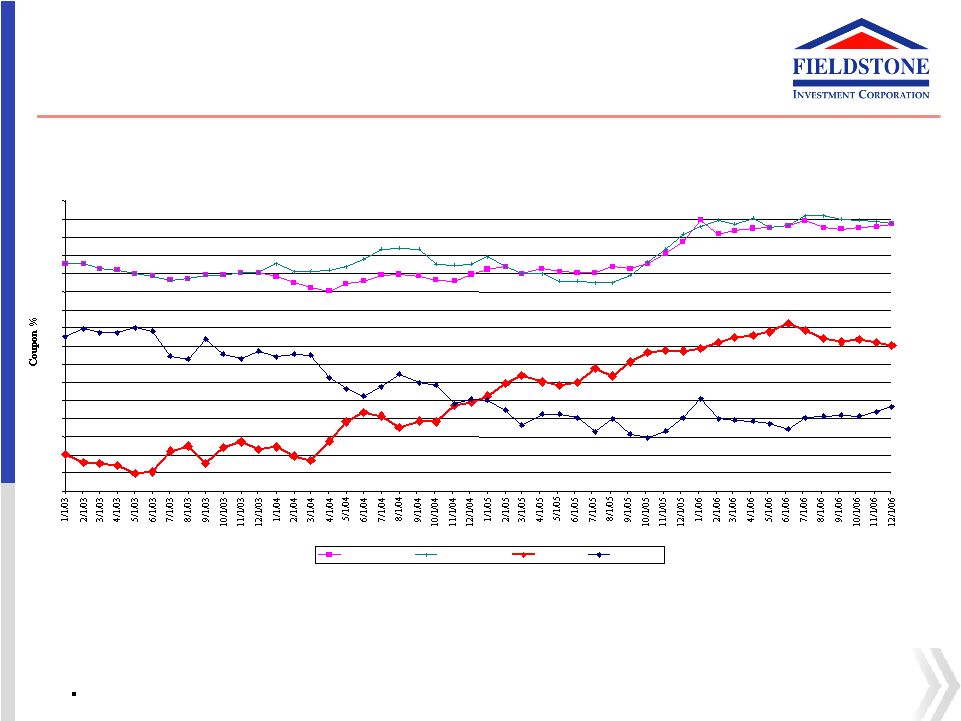
18 Non-Conforming Hybrid ARM Mortgage - Initial Gross Interest Margin (prior to ARM re-set) Source: Bloomberg • Initial Coupon on 2 year hybrid ARM mortgages will re-set after 24 months. • Interest rate will reset at a margin of 5% to 6% over 6 month LIBOR. • Periodic cap of 3% on the initial rate reset, 1% each reset every six months and 6% life cap. Total increase capped at 6%. 2 Year Hybrid Gross Int. Margin 1.0 1.5 2.0 2.5 3.0 3.5 4.0 4.5 5.0 5.5 6.0 6.5 7.0 7.5 8.0 8.5 9.0 2/28 Hybrids HFI 2/28 Hybrids HFS 2YR SWAP HFI v. Swap |
19 Fieldstone’s Origination Strategy Established loan origination channels since 1995 : Focus on loan quality, customer service and operating efficiency Opportunistic product development Net-Revenue based commissions Quality-based management incentives Mortgage loan operations driven by technology : On-Line loan pre-qualifications and submissions Electronic document delivery, funding and imaging Implementing new origination system to increase loans per person, lower origination cost Deliver products and pricing using hand-held technology real-time direct to PDAs Stable business-to-business sourcing : Wholesale originations from professional brokers Retail originations from small financial service companies Compete on service and product design, not rate or credit Cultivate a learning organization to enhance: Products Customer service Operating efficiencies |
20 National Origination Franchise Corp. HQ Retail Office Everett Boston Corporate Headquarters, Columbia, Maryland Ft. Lauderdale Sacramento Seattle Portland Concord Carson Irvine Encinitas Denver Las Vegas Phoenix Houston Bloomington Omaha Frisco Boca Raton Chicago Indianapolis Hanover Tampa Overland Park Memphis • 41 offices in 21 states Wichita Albuquerque Wholesale Office Arlington Plano Atlanta Tempe Springfield Independence Des Moines Cedar Rapids Davenport |
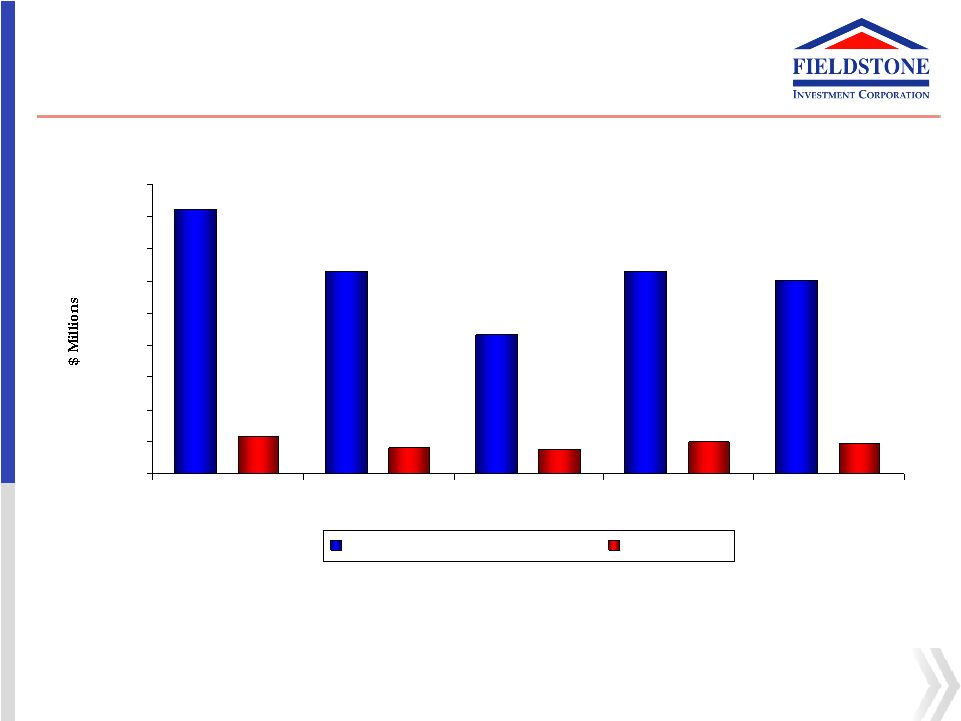
$1,261 $1,207 $165 $151 $196 $188 $1,643 $1,264 $861 $236 $0 $200 $400 $600 $800 $1,000 $1,200 $1,400 $1,600 $1,800 3Q 2005 4Q 2005 1Q 2006 2Q 2006 3Q 2006 Non-Conforming Wholesale Division Retail Division Quarterly Loan Originations 21 |
22 Underwriting Summary Fieldstone’s Investigative Underwriting Process is designed to deter fraud and limit default frequency and loss severity. Full credit underwriting completed on all loans prior to funding Default Frequency control Full doc loans require execution of 4506 T Stated loans » require authentication of self-employment documents (licenses, CPA letters) » credit history and assets appropriate for income stated Purchase loans require 24 month chain of title to detect flip transactions Refinance transactions require written borrower benefit analysis to deter predatory lending Loans processed through Fieldscore (Fieldstone’s automated pre-qualification engine) to insure borrower is placed in an appropriate product and to reduce errors All credit reports are generated by Fieldstone. Credit reports are tri-merged credit reports containing Safescan or HAWK fraud alert, OFAC, previous employment and residence information. |
23 Underwriting Summary - continued Loss Severity control: Fieldstone’s Appraisal Policy Appraisal checklist completed by underwriters Appraisal validated through AVM or other review products unless completed by approved National Appraisal firm or new construction by approved national builder All desk reviews are enhanced desk reviews, with new comparable sales evaluated Field reviews required when transaction involves – » non-arm’s length transactions (related-party seller) » rural properties Second appraisal required when loan amounts exceed $1,000,000 Appraisers checked against internal and external watch list |
24 Controls Underwriting completed in regional offices Provides strong knowledge of local statutes Better knowledge of local real estate values Credit approval authorities are assigned to each underwriter by the Chief Credit Officer Underwriter performance tracked monthly via Underwriters’ Report Card Post closing QC completed by internal staff and third party due diligence re- verifies process Responses including corrective actions are due monthly Monthly audit findings reported to senior management 6 month trending reporting to executive management Loan Origination System contains edits for internal and regulatory compliance Fieldstone does not fund Section 32 , high cost or covered loans in any jurisdictions All loans processed through Clayton’s compliance software Edits created by IS, checked by internal compliance and 3 rd party, and imbedded in LOS Exceptions rarely made for LTV/CLTV or Credit Score Common exceptions include bankruptcy/foreclosure seasoning, cash out amount and seasoning and loan amount |
25 Income Documentation Requirements Fieldstone Offers Five Documentation Levels. Verbal Verification of Employment Is Always Obtained by FMC Within Five Days of Closing Full Documentation Current pay stubs and most recent year’s W-2s for wage earners; two-years tax returns (business and personal) for self-employed borrowers Hourly and self-employment income is averaged, declining income is not allowed All borrowers receiving fixed income must verify all income used for qualifying 24-Months’ Bank Statements (all employment types allowed) 24-months’ personal bank statements, allow for 100% of average deposits toward qualifying. If using business bank statements, 75% of average deposits is used for qualifying 12-Months’ Bank Statements (self-employed borrowers only) Same credit for deposits as 24-months program |
26 Income Documentation Requirements - continued Limited Documentation Wage Earners: Most recent YTD pay stub required; average YTD income used to qualify; must verify two years in the same profession 1099 Employees: Most recent year’s 1099 and YTD statement of earnings required. 75% of average income used to qualify Self-Employed: Six months of personal bank statements using 100% average deposits to qualify or six months of business bank statements using 75% of average deposits. Borrowers must provide evidence they owned and operated the business at least two years Stated Documentation Wage Earners: Income is stated on the 1003 and file must include a written Verification of Employment from current employer that does not provide income information, but does show dates of employment, position, if employment is likely to continue and average hours worked per week. Borrower must document two years in the same profession. Income must be reasonable for borrower’s profession Self-Employed: Income is stated on the 1003 and file must include evidence that borrower has owned and operated the business for at least two years |
27 Selected Recent Guideline Changes • Eliminated seller held second liens • Revised requirements for review appraisals: 8% tolerance (from 12%) • Increased minimum FICO requirements for Wall Street 100% combo loans to 620 for Full Doc and 660 for Stated Income • Eliminated seller concessions below 600 FICO for High Street • Added reserve requirements for First Time Home Buyers • Reduced max LTV for stated wage earners to 95% • Eliminated second liens for stated wage earners • Increased minimum FICO requirement for 12 month bank statements to 640 • Now requiring 3 trade lines for all programs • Eliminated numerous low FICO high LTV / CLTV products |
www.FieldstoneInvestment.com Supplemental Data January 2007 |
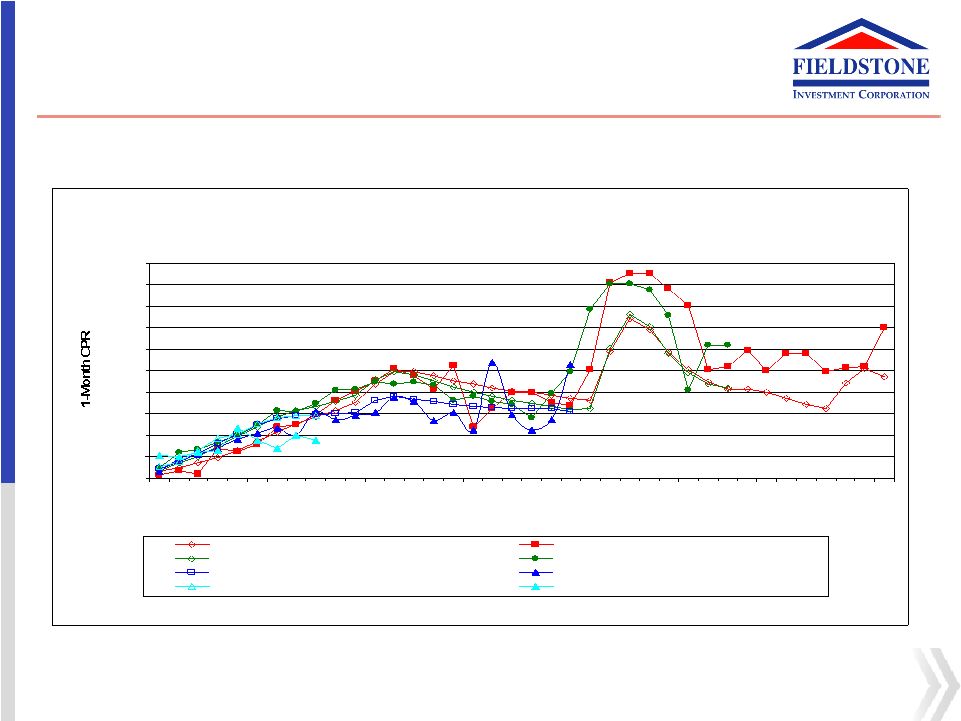
29 FMIC Static Pool Prepayment Analysis Constant prepay rates generally track the market, with spikes around the reset dates as the average life of Fieldstone’s loans is 22 months. FMIC Static Pool Prepayment Analysis 0% 10% 20% 30% 40% 50% 60% 70% 80% 90% 100% 1 3 5 7 9 11 13 15 17 19 21 23 25 27 29 31 33 35 37 Deal Seasoning (months) 2003 Non-Prime ARM Data from LP/CS Weighted Average of FMIC 2003 Vintage 2004 Non-Prime ARM Data from LP/CS Weighted Average of FMIC 2004 Vintage 2005 Non-Prime ARM Data from LP/CS Weighted Average of FMIC 2005 Vintage 2006 Non-Prime ARM Data from LP/CS Weighted Average of FMIC 2006 Vintage Source: Industry Averages from Loan Performance/CS as of 12/25/06 |
30 Source: Industry Averages from Loan Performance/CS as of 12/25/06 Loan Performance - Delinquencies As delinquencies and losses have increased on recent originations as well as due to the overall aging of the portfolio, Fieldstone will focus on loss mitigation initiatives to improve loan performance. FMIC Static Pool Delinquency Analysis 60+ Days Delinquent (OTS Method) 0% 5% 10% 15% 20% 25% 1 3 5 7 9 11 13 15 17 19 21 23 25 27 29 31 33 35 37 Deal Seasoning (months) 2003 Non-Prime ARM Data from LP/CS Weighted Average of FMIC 2003 Vintage 2004 Non-Prime ARM Data from LP/CS Weighted Average of FMIC 2004 Vintage 2005 Non-Prime ARM Data from LP/CS Weighted Average of FMIC 2005 Vintage 2006 Non-Prime ARM Data from LP/CS Weighted Average of FMIC 2006 Vintage |
31 FMIC Static Pool Cumulative Loss Analysis FMIC Static Pool Cumulative Loss Analysis 0.00% 0.10% 0.20% 0.30% 0.40% 0.50% 0.60% 0.70% 0.80% 0.90% 1.00% 1 3 5 7 9 11 13 15 17 19 21 23 25 27 29 31 33 35 37 Deal Seasoning (months) 2003 Non-Prime ARM Data from LP/CS Weighted Average of FMIC 2003 Vintage 2004 Non-Prime ARM Data from LP/CS Weighted Average of FMIC 2004 Vintage 2005 Non-Prime ARM Data from LP/CS Weighted Average of FMIC 2005 Vintage 2006 Non-Prime ARM Data from LP/CS Weighted Average of FMIC 2006 Vintage Source: Industry Averages from Loan Performance/CS as of 12/25/06 |
Credit Risk Management Credit Score by Income Documentation Level Q3 2006 Non-Conforming Originations 622 645 675 674 679 648 600 620 640 660 680 700 720 740 Full or Alternative Documentation 24 Month Bank Statements 12 Month Bank Statements Limited Documentation Stated Income Self Employed Stated Income Wage Earner Weighted Average Credit Score: 652 32 |
Credit Risk Management-Risk-Based Pricing 8.3% 7.9% 7.8% 7.7% 9.4% 5.0% 6.0% 7.0% 8.0% 9.0% 10.0% 500-549 550-599 600-649 650-699 >700 Weighted Average Coupon: 7.9% Credit Score _ Portfolio Composition - Risk-Based Pricing (as of September 30, 2006) 33 |
34 Management Experience Michael Sonnenfeld, President and Chief Executive Officer since 1995 18+ years of experience in mortgage banking and mortgage securities Former Director of the Subprime Residential Mortgage Conduit for Nomura Securities International, Inc. Former President for Saxon Mortgage Funding Corp. and Saxon Mortgage Capital Corp. Nayan Kisnadwala, EVP and Chief Financial Officer since 2006 20+ years of experience in consumer and mortgage finance Former MBNA Senior Executive Vice President and CFO of the Consumer Finance and Business Lending Division, which included the mortgage business Former CFO at American Express in its Global Operations Former positions in Risk Management and Finance at Citicorp, Card Establishment Services and First Data Walter Buczynski, EVP Secondary since 2000 20+ years of experience in mortgage banking Former SVP at GE Capital Mortgage Services, Inc. directing the capital market activities Former EVP of Secondary for Margaretten & Co., now known as Chase Manhattan Mortgage Corp. John Kendall, EVP Investment Portfolio since 2004 15+ years of experience in mortgage capital markets Former Director Public Fixed Income, MBS/ABS Portfolio; Northwestern Mutual Life Insurance Co. Former First Vice President, Asset Finance Group; Kidder Peabody & Co. / Paine Webber, Inc. Former Vice President, Capital Markets Group; Greenwich Capital Markets Gary Uchino, SVP and Chief Credit Officer since 1995 20+ years of experience in subprime lending Former Vice President of Credit Administration for Security Pacific Corp. Former Director for Associates Financial Services Co. of Japan, KK Jim Hagan, EVP Production of FMC since 1996 20+ years of experience in mortgage banking Former RVP of the Subprime Division for American Residential Mortgage Corp. Former Senior Vice President for Long Beach Mortgage Corp. |
Securitization Program Update January 2007 www.FieldstoneInvestment.com |