UNITED STATES
SECURITIES AND EXCHANGE COMMISSION
Washington, D.C. 20549
FORM 10-K
(Mark One)
| x | ANNUAL REPORT PURSUANT TO SECTION 13 OR 15(d) OF THE SECURITIES EXCHANGE ACT OF 1934 |
For the fiscal year ended December 31, 2006
| ¨ | TRANSITION REPORT PURSUANT TO SECTION 13 OR 15(d) OF THE SECURITIES EXCHANGE ACT OF 1934 |
For the transition period from to
Commission File Number: 000-50938
Fieldstone Investment Corporation
(Exact name of registrant as specified in its charter)
| | |
| Maryland | | 74-2874689 |
(State or other jurisdiction of incorporation or organization) | | (I.R.S. Employer Identification No.) |
| | | | |
11000 Broken Land Parkway Columbia, MD | | 21044 | | 410-772-7200 |
| (Address of principal executive offices) | | (Zip Code) | | (Telephone No., including area code) |
Securities registered pursuant to Section 12(b) of the Act:
NONE
Securities registered pursuant to Section 12(g) of the Act:
Common Stock, par value $.01
Indicate by check mark if the registrant is a well-known seasoned issuer, as defined in Rule 405 of the Securities Act. Yes ¨ No x
Indicate by check mark if the registrant is not required to file reports pursuant to Section 13 or Section 15(d) of the Act. Yes ¨ No x
Indicate by check mark whether the registrant (1) has filed all reports required to be filed by Section 13 or 15(d) of the Securities Exchange Act of 1934 during the preceding 12 months (or for such shorter period that the registrant was required to file such reports), and (2) has been subject to such filing requirements for the past 90 days. Yes x No ¨
Indicate by check mark if disclosure of delinquent filers pursuant to Item 405 of Regulation S-K is not contained herein, and will not be contained, to the best of registrant’s knowledge, in definitive proxy or information statements incorporated by reference in Part III of this Form 10-K or any amendment to this Form 10-K. x
Indicate by check mark whether the registrant is a large accelerated filer, an accelerated filer, or a non-accelerated filer. See definition of “accelerated filer and large accelerated filer” in Rule 12b-2 of the Exchange Act.
Large Accelerated Filer ¨ Accelerated Filer x Non-accelerated Filer ¨
Indicate by check mark whether the registrant is a shell company (as defined in Rule 12b-2 of the Act). Yes ¨ No x
The aggregate market value of our common stock held by non-affiliates was $416,322,623 based on the last sale price as reported by the NASDAQ Global Select Market on June 30, 2006. All executive officers and directors of the registrant have been deemed, solely for the purpose of the foregoing calculation, to be “affiliates” of the registrant.
Number of shares of Common Stock outstanding as of March 1, 2007: 46,878,644
DOCUMENTS INCORPORATED BY REFERENCE
Portions of the registrant’s Definitive Proxy Statement to be filed with the Commission pursuant to Regulation 14A in connection with the registrant’s 2007 Annual Meeting of Stockholders, subsequent to the date hereof, are incorporated by reference into Part III of this Report. Such Definitive Proxy Statement will be filed with the Securities and Exchange Commission not later than 120 days after the conclusion of the registrant’s fiscal year ended December 31, 2006.
Table of Contents
i
Cautionary Advice Regarding Forward-Looking Statements
Statements contained in this Form 10-K which are not historical facts may be forward-looking statements within the meaning of Section 21E of the Securities Exchange Act of 1934, as amended (the Exchange Act). We intend such forward-looking statements to be covered by the safe harbor provisions for forward-looking statements contained in Section 21E of the Exchange Act. Readers are cautioned not to place undue reliance on these forward-looking statements, which speak only as of the date this Form 10-K is filed with the SEC, and we undertake no obligation to publicly update or revise any forward-looking statement, whether as a result of new information, future events or otherwise.
The forward-looking statements are based on our beliefs, assumptions and expectations of our future performance, taking into account all information currently available to us. These beliefs, assumptions and expectations can change as a result of many possible events or factors, not all of which are known to us or are within our control. If a change occurs, our business, financial condition and results of operations may vary materially from those expressed in our forward-looking statements. These statements (none of which is intended as a guarantee of performance) are subject to certain risks and uncertainties which could cause our actual future results, achievements or transactions to differ materially from those projected or anticipated. Some of the important factors that could cause our actual results, performance or financial condition to differ materially from expectations are:
| | • | | the satisfaction of the conditions to consummate the merger, including required regulatory and third party consents and the receipt of the required stockholder approval; |
| | • | | the occurrence of any event, change or other circumstances that could give rise to the termination of the merger agreement, including any event, change of circumstance that would reasonably be expected to have a material adverse effect on our company; |
| | • | | the failure of the merger to close for any other reason; |
| | • | | the amount of the costs, fees, expenses and charges related to the merger; |
| | • | | our ability to successfully implement or change aspects of our portfolio strategy; |
| | • | | interest rate volatility and the level of interest rates generally; |
| | • | | the sustainability of loan origination volumes and levels of origination costs; |
| | • | | continued availability of credit facilities for the origination of mortgage loans; |
| | • | | the ability to sell or securitize mortgage loans on favorable economic terms, or at all; |
| | • | | deterioration in the credit quality of our loan portfolio; |
| | • | | deterioration in the performance of our loans sold and the related repurchase activity; |
| | • | | the nature and amount of competition; |
| | • | | the impact of changes to the fair value of our interest rate swaps on our net income, which will vary based upon changes in interest rates and could cause net income to vary significantly from quarter to quarter; and |
| | • | | the other factors referenced in this report, including those set forth under the section entitled Item 1A Risk Factors. |
ii
PART I
Overview
We are a fully integrated mortgage banking company that originates, securitizes, sells and services single-family residential mortgage loans and maintains a portfolio of mortgage loans that we originated. We have elected to be taxed as a real estate investment trust, or REIT, for federal income tax purposes. We originate loans for borrowers nationwide through our operating subsidiary, Fieldstone Mortgage Company (Fieldstone Mortgage or FMC). Fieldstone Mortgage has been operating since 1995, and we believe we have developed processes and criteria that promote sound underwriting and pricing decisions and provide the ability to efficiently approve and fund non-conforming and conforming loans with efficiency and quality.
During 2006, we originated loans through two primary channels: Wholesale and Retail. These two channels constitute our two production segments. Our wholesale segment originates non-conforming loans through its network of independent mortgage brokers as more fully described in the section titled, Wholesale Segment. Our retail segment originates both non-conforming and conforming mortgages through its retail offices as more fully described in the section titled, Retail Segment. Prior to 2006, we structured our business through a non-conforming channel and a conforming channel, each of which had wholesale and retail lending divisions. In early 2006, we sold the assets pertaining to all of our conforming wholesale offices, our conforming operations center and a majority of our conforming retail offices to third parties. We combined our remaining conforming retail personnel, branches and assets into our non-conforming retail division, which will continue to offer both non-conforming and conforming products, and implemented our current channel structure which we believe is more closely aligned with the way we now operate.
In August 2003, we began implementing our current business strategy of retaining a portion of the non-conforming loans that we originate on a long-term basis in a portfolio, financed primarily by issuing mortgage-backed securities secured by these loans. Our goal is to build and manage a portfolio of loans with stable risk-adjusted returns to generate, for our stockholders, stable cash flows and dividends based on managing the credit quality of loans, the interest rate risk of the portfolio and the level of leverage we use to finance our portfolio. From 2003 through 2006, we completed thirteen securitizations totaling $10.0 billion. Our portfolio of loans held for investment as of December 31, 2006 was $5.5 billion. We continue to sell to third parties, on a servicing-released basis, all of the loans that we do not choose to hold for investment.
History and Structure
We were formed on August 20, 2003 as a Maryland corporation and a wholly owned subsidiary of Fieldstone Holdings Corp., a Delaware corporation (Fieldstone Holdings or FHC). In 1998, Fieldstone Holdings acquired Fieldstone Mortgage, a Maryland corporation formed in 1995 that had been originating and selling residential mortgage loans since 1996. On November 14, 2003, we completed a private offering of approximately 47.15 million shares of our common stock pursuant to Rule 144A, Regulation S and Regulation D under the Securities Act of 1933, as amended (referred to herein as the 144A Offering), which yielded net proceeds of approximately $658.1 million. In connection with the 144A Offering, we merged with Fieldstone Holdings. As the surviving entity, we succeeded to all of the assets and liabilities of Fieldstone Holdings, and Fieldstone Mortgage became our wholly owned principal operating subsidiary.
Pursuant to the merger, the shareholders of Fieldstone Holdings received 565.38168 shares of our common stock for each share of common stock of Fieldstone Holdings. Immediately following the closing of the 144A Offering, we redeemed the shares of common stock held by a group of former shareholders of Fieldstone Holdings for approximately $188.1 million of the net proceeds of the 144A Offering.
We have elected to be taxed as a REIT under Sections 856 through 859 of the Internal Revenue Code. Our qualification as a REIT depends upon our ability to meet, on an annual or in some cases quarterly basis, various complex requirements under the Internal Revenue Code relating to, among other things, the sources of our gross income, the composition and values of our assets, our distribution levels and the diversity of ownership of our shares.
We have elected to treat Fieldstone Mortgage as a taxable REIT subsidiary (TRS). Fieldstone Mortgage earns income and engages in activities that are not meant to occur in a REIT. For example, a TRS can earn income from the
1
servicing and origination and sale of loans, income from which would not be qualifying income for purposes of the REIT income tests and could expose the REIT to a penalty tax. A TRS is taxed as a regular corporation, and its net income is, therefore, subject to federal, state and local corporate level tax.
In addition to Fieldstone Mortgage, we have three other wholly owned subsidiaries, Fieldstone Mortgage Ownership Corp. (FMOC) and Fieldstone Servicing Corp. (FSC), which were formed in February 2004 and Fieldstone Mortgage Investment Corporation (FMIC), which was formed in May 2005. Each are Maryland corporations and are treated as qualified REIT subsidiaries. FMOC holds securities and ownership interests in owner trusts and other financing vehicles, including securities issued by us or on our behalf. FMOC holds the equity interests in our securitized pools of mortgage loans, as well as, directly or indirectly, any economic derivatives designated as interest rate hedges related to our securitized debt. FSC holds the rights to direct the servicing of our loans held for investment. FMIC is a limited purpose financing subsidiary formed for the purpose of facilitating the financing and sale of mortgage loans and mortgage-related assets by issuing and selling securities secured primarily by, or evidencing interests in, mortgage loans and mortgage-related assets.
On February 15, 2007, we entered into a definitive Agreement of Merger (Merger Agreement) with Credit-Based Asset Servicing and Securitization LLC, a Delaware limited liability company (C-BASS), and Rock Acquisition Corp., a Maryland corporation and wholly owned subsidiary of C-BASS (Merger Sub). On March 16, 2007, we entered into Amendment No. 1 to the Agreement of Merger. The Merger Agreement, as amended, provides that, upon the terms and subject to the conditions set forth in the Merger Agreement, as amended, Merger Sub will be merged with and into Fieldstone, with Fieldstone continuing as the surviving corporation and a wholly owned subsidiary of C-BASS (the Merger). At the effective time of the Merger, each share of our common stock issued and outstanding immediately prior to the effective time of the Merger and not owned by Fieldstone or its subsidiaries will be converted into the right to receive $4.00 in cash per share, without interest.
In addition, to provide pre-merger liquidity to the Company C-BASS has agreed to purchase, at the Company’s option, certain of our assets, including certain of our retained securities and substantially all of our inventories of non-securitized loans and real estate owned properties, and C-BASS and we have agreed to the forward sale of our future loan production to C-BASS for loans originated on or after March 1, 2007, which is exercisable at our option.
The Merger Agreement, as amended, and the transactions contemplated thereby were approved by our Board of Directors.
The Merger is subject to various closing conditions, including, among others: (i) the approval of the Merger Agreement, as amended, the Merger and the other transactions contemplated by the Merger Agreement, as amended, by the affirmative vote of holders of a majority of the outstanding shares of Fieldstone’s common stock, (ii) the receipt of required regulatory approvals, (iii) the receipt of third party required contractual consents, (iv) the continued effectiveness of certain of the employment and retention arrangements, (v) Fieldstone’s third party servicers and subservicers agreeing to transfer the servicing of Fieldstone’s mortgage loans to C-BASS or its designated subsidiary, (vi) certain of Fieldstone’s lenders agreeing to extend a portion of Fieldstone’s existing financing facilities for at least 90 days after the effectiveness of the Merger, and (vii) no event or circumstance having occurred that has resulted in, or is reasonably expected to result in, a material adverse change to our Company.
Strengths and Strategy
We believe that we possess the following competitive strengths:
| | • | | Corporate Culture of Integrity, Service, Efficiency and Teamwork. We have grown since inception with a focus on the integrity of our personnel and our loans, a commitment to customer service and a commitment to constant improvement of our operations to achieve higher service levels, greater efficiencies, and lower costs. Our entire team, including senior management, regional managers, branch managers, loan originators, processors, underwriters, funders and shippers, together with the quality control, secondary, shipping, servicing, information systems, accounting, legal, human resources, finance, internal audit and treasury employees in our home office, work as a team in the loan origination, sales, interim servicing and securitization processes. Our philosophy is that each aspect of originating a loan, from setting underwriting guidelines, to processing loan applications, to funding loans or to entering loan data, is of equal importance in the origination process. |
| | • | | Disciplined and Efficient Underwriting Guidelines and Supporting Processes and Technology. We believe we have a disciplined approach to underwriting mortgage loans using complex and integrated risk management techniques. We believe that this allows us to make reliable and timely credit underwriting decisions and to offer competitive rates to borrowers. During the second half of 2006, we implemented a new loan origination system that we believe will improve our efficiency, lower our costs, maintain the consistency of our credit decisions, and improve loss mitigation efforts. |
2
| | • | | Quality Customer Service. Our loan officers and account executives work closely with our customers and our processing and underwriting teams to provide high quality service and to be responsive to borrowers’ and brokers’ needs. We believe our focus on service, quality, and efficiency results in increased originations through referrals and repeat business from brokers and other financial service companies. |
| | • | | Comprehensive Product Offering. We offer a wide array of loan products to our customers. We offer first and second lien loan programs as either fixed-rate mortgage loans or adjustable-rate mortgage loans (ARMs), including hybrid ARM loans with an initial fixed interest rate that subsequently converts to an adjustable rate. In addition, we offer fixed and ARM loans with an “interest only” feature for the first five years of the loan. |
| | • | | Management Experience and Expertise. Our management team has an average of over 19 years of experience in mortgage banking, securitization and specialty finance businesses. Our experienced management team has developed the comprehensive origination processes, procedures and technology that we believe help to position us as a high quality, customer-focused residential mortgage loan originator. |
| | • | | Successful Securitizations. From 2003 through 2006, we completed 13 securitizations executed as collateralized debt financings. We use our securitizations to match fund the maturities of our debt with the scheduled repayment of our loans. In connection with these securitizations, we believe that we have (i) established a credible relationship with various nationally recognized credit rating organizations, and (ii) begun to establish a track record with investors in mortgage-backed securities. In addition, to enhance our securitization program, we have developed a loan performance database which we use to monitor the performance characteristics of each of our loan pools, improve risk management, product design, and pricing, and to ensure adequate risk-adjusted returns. We believe that our history of successful securitizations will facilitate our ability to execute future securitizations and create a continued source of competitively priced long-term financing for our portfolio in the future. |
Production Segments
We have been originating mortgage loans since 1996. Beginning in 2006, we aligned our production operations into the wholesale and retail segments. Our wholesale segment originates non-conforming loans through its network of independent mortgage brokers as more fully described in the section titled Wholesale Segment. Our retail segment originates both non-conforming and conforming mortgages through its retail offices, as more fully described in the section titled Retail Segment. The primary difference between wholesale and retail lending is the borrower’s point of contact. For wholesale loans, an independent mortgage broker is the borrower’s primary contact. The broker sends a completed loan application to us for underwriting. For retail loans, we have direct contact with the borrower. For all loans that we fund, we control the credit underwriting, documentation and closings.
Prior to 2006, our origination business was aligned into non-conforming and conforming channels. Loans originated by our conforming channel included conventional and government insured loans which are eligible for purchase by Fannie Mae or Freddie Mac, or loans which generally meet the underwriting standards of these entities, except for the amount of the loan or certain other credit features, referred to as jumbo loans. Loans originated through our non-conforming channel are ineligible for purchase by Fannie Mae or Freddie Mac due to either loan size, credit characteristics of the borrower or documentation standards in connection with the borrower’s income. The credit characteristics that cause a loan to be ineligible include a relatively higher level of debt service carried by the borrower, higher loan-to-value, or LTV, a record of mortgage or consumer credit delinquencies, outstanding judgments, prior bankruptcies by the borrower and other credit items that do not satisfy the Fannie Mae or Freddie Mac underwriting guidelines. Ineligible documentation standards may include borrowers who provide limited or no documentation of their income in connection with the underwriting of the related mortgage loan. Both the non-conforming and conforming channels had wholesale and retail lending divisions, and therefore our business at that time was divided into four production segments: non-conforming wholesale, non-conforming retail, conforming wholesale and conforming retail.
On January 13, 2006, our Board of Directors approved a plan of disposal to sell, close or otherwise dispose of the assets of our conforming retail and conforming wholesale segments due, in part, to the declining trend in the
3
segments’ profitability in 2005 and 2004, as increased competition and depressed margins reduced the funding volumes and income contribution of those segments. In the first quarter of 2006, the assets of the conforming division’s wholesale offices, headquarters, and the majority of our retail conforming offices were sold to third parties. Our pre-tax loss related to these transactions was approximately $0.9 million. Concurrent with the re-alignment of our business into the current segment structure, the remaining conforming retail offices, which were primarily located in Maryland and Virginia, were combined with our non-conforming retail offices to form our current Retail segment, which will offer a range of non-conforming and conforming loan products. This Annual Report on Form 10-K presents the results of our conforming origination business as a discontinued operation, following the sale of the assets related to that business. With the exception of net income and core net income, the results of operations do not include the results of the discontinued operations, unless otherwise indicated.
During 2006, 2005, and 2004, our continuing operations originated approximately $5.4 billion, $6.1 billion, and $6.4 billion, respectively, of mortgage loans, of which 85%, 72% and 74%, respectively, were originated by our wholesale segment. You will find information concerning the financial results of these segments in Management’s Discussion and Analysis of Financial Condition and Results of Operations, in the section entitled Production Segment Results.
Total loan originations in 2006, 2005 and 2004 by production segment are as follows:
| | | | | | | | | | | | | | | | | | |
| | | Year Ended December 31, | |
| | | 2006 | | | 2005 | | | 2004 | |
($ in 000s) | | Fundings | | % of
Total | | | Fundings | | % of
Total | | | Fundings | | % of
Total | |
Wholesale | | $ | 4,642,792 | | 85 | % | | $ | 5,348,385 | | 72 | % | | $ | 5,529,824 | | 74 | % |
Retail | | | 711,651 | | 13 | % | | | 789,261 | | 11 | % | | | 822,982 | | 11 | % |
| | | | | | | | | | | | | | | | | | |
Total continuing operations | | | 5,354,443 | | 98 | % | | | 6,137,646 | | 83 | % | | | 6,352,806 | | 85 | % |
Discontinued operations | | | 127,797 | | 2 | % | | | 1,291,086 | | 17 | % | | | 1,122,441 | | 15 | % |
| | | | | | | | | | | | | | | | | | |
Total fundings | | $ | 5,482,240 | | 100 | % | | $ | 7,428,732 | | 100 | % | | $ | 7,475,247 | | 100 | % |
| | | | | | | | | | | | | | | | | | |
Wholesale Segment
We have wholesale operations centers in Arizona, California, Colorado, Florida, Illinois, Kansas, Maryland, Massachusetts, Minnesota, Texas and Washington. We originate wholesale non-conforming loans through a network of independent mortgage brokers that are solicited by and have contacts with our account executives. Our account executives provide on-site training to broker personnel on the use of our products and services and help facilitate the funding of loans. In the wholesale origination process, brokers identify the prospective borrower, assist the borrower with completion of the loan application, gather necessary documentation and serve as the borrowers’ initial “point of contact.”
We conduct due diligence on independent mortgage brokers with whom we consider doing business. Our due diligence process includes reviewing the broker’s financial condition, running credit checks on its principals, and verifying a good standing status with applicable regulators. Once approved, we require that a mortgage broker sign an agreement that governs the mechanics of doing business with us and sets forth the representations and warranties the broker makes to us regarding each loan.
We review and underwrite every loan application submitted by our broker network, approve or deny each application and set the interest rates, costs, fees and other terms of the loan. Once all conditions to the closing of the loan have been met to our satisfaction, we create the closing documents for the loan, arrange an insured closing with a title company or closing agent and then fund the loan. The brokers conduct all marketing to and manage all contact with the borrowers for our wholesale loans and earn a brokerage fee on the loans they originate, including both fees paid by the borrower directly and premiums we pay directly to the brokers, known as “yield spread premiums.” Our wholesale broker network allows us to increase our volume of loan originations without incurring the significantly greater overhead or marketing expenses associated with direct marketing to consumers.
4
Retail Segment
We have non-conforming retail lending offices in Arizona, California, Florida, Illinois, Indiana, Iowa, Kansas, Minnesota, Missouri, Nebraska, Nevada, New Mexico, Oregon, Tennessee, Texas, and Washington. We market retail loans through a variety of methods, including direct mailings, the Internet, print and telephone directory advertisement, and affinity lending relationships. Our loan officers identify loan applicants and assist the applicants in gathering their loan documentation. Our processors enter the borrower information into our proprietary automated pre-qualification system. We believe that this regional presence enables us to provide better service to our customers and allows us to satisfy the lender criteria that we believe is most important to our customers: speed of approval and funding. We also believe that local loan officers and branch managers are better suited to detect and avoid fraudulent loan applications based on their knowledge of their local market.
5
Loan Originations by Borrower Purpose
Our 2006, 2005 and 2004 non-conforming loan production based on borrower purpose is as follows:
| | | | | | | | | | | | | | | | | | |
| | | Year Ended December 31, | |
($ in 000s) | | 2006 | | | 2005 | | | 2004 | |
| | | Loans
Funded | | Percentage of
Total Loans | | | Loans
Funded | | Percentage of
Total Loans | | | Loans
Funded | | Percentage of
Total Loans | |
Refinance of existing mortgage | | $ | 1,953,176 | | 37 | % | | $ | 2,179,868 | | 37 | % | | $ | 2,519,273 | | 41 | % |
Purchase of home | | | 3,270,479 | | 63 | % | | | 3,761,536 | | 63 | % | | | 3,665,772 | | 59 | % |
| | | | | | | | | | | | | | | | | | |
Total | | $ | 5,223,655 | | 100 | % | | $ | 5,941,404 | | 100 | % | | $ | 6,185,045 | | 100 | % |
| | | | | | | | | | | | | | | | | | |
Our strategy is to focus on lending to borrowers for the purchase of a home. We believe these originations, as well as cash-out refinances, are less dependent on the relative level of interest rates than rate-term refinances.
Geographic Concentration of Originations
The aggregate dollar amounts and the percentage of non-conforming loans we originated in 2006, 2005, and 2004 by state are as follows:
| | | | | | | | | | | | | | | | | | |
| | | Year Ended December 31, | |
($ in 000s) | | 2006 | | | 2005 | | | 2004 | |
State funded | | Amount Funded | | % of Total | | | Amount Funded | | % of Total | | | Amount Funded | | % of Total | |
California | | $ | 1,997,375 | | 38 | % | | $ | 2,420,048 | | 41 | % | | $ | 2,772,306 | | 45 | % |
Texas | | | 537,378 | | 10 | % | | | 293,332 | | 5 | % | | | 262,816 | | 4 | % |
Illinois | | | 380,132 | | 7 | % | | | 498,700 | | 8 | % | | | 495,075 | | 8 | % |
Washington | | | 310,648 | | 6 | % | | | 312,933 | | 5 | % | | | 210,678 | | 3 | % |
Florida | | | 237,029 | | 5 | % | | | 356,719 | | 6 | % | | | 242,680 | | 4 | % |
Arizona | | | 227,002 | | 4 | % | | | 309,381 | | 5 | % | | | 299,392 | | 5 | % |
Colorado | | | 181,774 | | 3 | % | | | 204,802 | | 3 | % | | | 386,843 | | 6 | % |
Missouri | | | 127,501 | | 2 | % | | | 116,779 | | 2 | % | | | 97,948 | | 2 | % |
Georgia | | | 110,333 | | 2 | % | | | 123,716 | | 2 | % | | | 51,273 | | 1 | % |
Nevada | | | 94,964 | | 2 | % | | | 80,405 | | 1 | % | | | 70,508 | | 1 | % |
Other | | | 1,019,519 | | 21 | % | | | 1,224,589 | | 22 | % | | | 1,295,526 | | 21 | % |
| | | | | | | | | | | | | | | | | | |
Total | | $ | 5,223,655 | | 100 | % | | $ | 5,941,404 | | 100 | % | | $ | 6,185,045 | | 100 | % |
| | | | | | | | | | | | | | | | | | |
Our loan originations are concentrated heavily in California because it is the largest mortgage market in the U.S. and accordingly we have designed our underwriting, product design and pricing philosophies to address what we believe to be the needs of California borrowers, including non-standard credit profiles, low downpayment products, payment-focused and higher home values. Several of the origination initiatives that we implemented late in 2006, including the Alt-A products, simplified rate sheet, and revised commission plan, were more successful in California compared to other geographic areas, which may increase the proportion of our loans that are secured by properties in California in future periods.
Loan Products
We offer both fixed-rate loans and adjustable-rate loans, or ARMs, to our borrowers, including hybrid ARM loans with an initial fixed interest rate that subsequently convert to an adjustable rate. The payments on our ARM loans are adjustable from time to time as interest rates change, generally after an initial two-year period during which the loans’ interest rates are fixed and do not change. After an initial fixed rate period, the borrowers’ payments on our ARM loans generally adjust once every six months to a pre-determined margin over a measure of market interest rates, generally the London InterBank Offered Rate (LIBOR) for one-month deposits. In addition, we offer fixed and ARM loans with an “interest only” feature for the first five years of the loan. Borrowers with this loan feature do not
6
begin to re-pay the principal balance of the loans until after the fifth year of the loan. After the fifth year, the borrowers’ payments increase to amortize the entire principal balance owed over the remaining 25 years of the loan. Approximately 41.2%, 55.4%, and 50.6%, respectively, of the loans we originated in 2006, 2005, and 2004 included an “interest only” feature. Our loan products are available at different interest rates and with different origination and application points and fees, depending on the particular borrower’s risk classification. See the Business—Underwriting section. If permitted by applicable law and agreed to by the borrower, in return for a lower interest rate, we may include a prepayment fee that is triggered by a loan’s full or substantial prepayment early in the loan’s term. Approximately 72.6%, 57.8%, and 62.2%, respectively, of the loans we originated in 2006, 2005, and 2004 included some form of prepayment fee. The increase of originated loans with prepayment fees was due to the sale of our conforming division, which did not have many loans with prepayment features.
Non-Conforming Loan Products
We underwrite non-conforming loans that we originate in accordance with our underwriting guidelines. Though there is no generally accepted definition of a “subprime” loan, certain non-conforming residential loans may be referred to as “subprime loans.” Our underwriting guidelines are established by our credit committee, which is comprised of our senior management team, including our President and Chief Executive Officer, Executive Vice President—Secondary, Chief Financial Officer, Chief Credit Officer, Executive Vice President—Investment Portfolio and the Executive Vice President—Production. The credit committee meets on an as-needed basis to review proposed changes to our underwriting guidelines. We have developed underwriting processes and criteria that we believe will generate high quality loans and give us the ability to approve and fund loans quickly. Our guidelines help us evaluate a borrower’s credit history, willingness and ability to repay the loans as well as the value and adequacy of the borrower’s collateral, based on the experience we have had with similar loans in the past, and on industry performance data. Our underwriting guidelines are designed to generate loans that balance the credit risk of the borrower with the loan-to-value (LTV) and interest rate of the loan to provide stable risk-adjusted returns for our portfolio. In addition, our guidelines are designed to afford us the opportunity to sell any of our loan products to two or more institutional buyers of mortgages.
Non-conforming loans are ineligible for purchase by Fannie Mae or Freddie Mac due to either loan size, credit characteristics of the borrower or documentation standards in connection with the borrower’s income. The credit characteristics that cause a loan to be ineligible include a relatively higher level of debt service carried by the borrower, higher loan-to-value, or LTV, a record of mortgage or consumer credit delinquencies, outstanding judgments, prior bankruptcies by the borrower and other credit items that do not satisfy the Fannie Mae or Freddie Mac underwriting guidelines. Ineligible documentation standards may include borrowers who provide limited or no documentation of their income in connection with the underwriting of the related mortgage loan. Approximately 60.1% of the loans we originated in 2006 and 57.2% of the loans in the portfolio, not including first time home buyers, were to borrowers who had no history of missing mortgage payments, but who may not have qualified for conforming loans because they did not satisfy the credit, documentation or other underwriting standards prescribed by conventional mortgage lenders and loan buyers.
We consider a combination of factors in order to assess the borrower’s ability and willingness to repay the loan according to its terms, which is the basis for our underwriting guidelines and risk-based pricing:
| | • | | Credit History: A borrower’s past mortgage payment history, foreclosure history, bankruptcy history, as well as other consumer debt payment history. We obtain a credit report on each borrower from a third party vendor that merges the credit data from the three national credit data repositories (Equifax, TransUnion and Experian). We segment loans based upon risk grades determined by the borrower’s credit history. |
| | • | | Credit Score: Typically referred to as either the “credit score” or “FICO score,” which is a statistical ranking of likely future credit performance developed by Fair Isaac, & Company. We require a minimum credit score, or FICO score, of 500 and use the middle of the three scores (or lower of two) from the three national credit bureaus when classifying a borrower. |
| | • | | Debt-to-Income: The debt-to-income, or DTI, is the ratio of a borrower’s total mortgage and consumer monthly debt payments to total monthly income. The maximum DTI varies based upon the loan-to-value, credit history and income documentation of a particular borrower. |
7
| | • | | Appraisal: We require a full appraisal of each property that is prepared by a licensed, third party, fee-based appraiser. The appraisals include an inspection of the exterior and interior of the subject property. The appraisal contains a market value analysis based upon recent sales of comparable homes in the area and an income analysis (where appropriate). Before we fund any mortgage loan, a non-affiliated appraisal review firm or one of our qualified underwriters reviews every appraisal using additional data to evaluate the appraisal. Except under defined circumstances, we order either automated valuation models (AVMs), desk reviews, field reviews or second full appraisals or use other valuation tools on all of our non-conforming loans to validate the appraisals. |
| | • | | Loan-to-Value: The loan-to-value, or LTV, is the ratio of the amount of the loan to the appraised value. Combined-loan-to-value, or CLTV, is the ratio of first and second lien loans to the appraised value. Our guidelines allow for loans up to 100% LTV or 100% CLTV. As a borrower’s credit history and credit score decline in quality, we reduce the maximum allowable LTV or CLTV available to a borrower. Substantially all of our second lien loans are funded simultaneously with a first lien. |
| | • | | Property Type: Our loans are primarily collateralized by single-family detached homes. We also lend against residential properties up to 4 units, condominiums and planned unit developments. |
| | • | | Owner Occupancy Status: We provide separate requirements depending upon whether the property securing the loan will be the borrower’s primary residence, second home or an investment property, and generally we require a lower LTV and higher interest rate for second homes and investment properties. |
Conforming Loan Products
The most common types of conforming loans we offered were:
| | • | | Conventional Loan: Loans that meet the underwriting standards of Fannie Mae, Freddie Mac or institutional investors. We consider these conventional loans to be of the A+ and A risk classification. |
| | • | | FHA Loans: Loans to buyers who qualify through the Federal Housing Authority’s (FHA) loan mortgage insurance program, designed to help give prospective home buyers the opportunity to qualify for a mortgage when they may not otherwise qualify. The Department of Housing and Urban Development (HUD) assumes some of the risk on the loan by providing levels of guarantees, provided that the loans are underwritten to their guidelines. |
| | • | | VA Loans: Loans guaranteed by the Veterans Administration (VA) pursuant to a loan guarantee program available to qualified veterans of the U.S. armed services. This guarantee provides protection to us and the purchaser of our VA loans against defaults and delinquencies, and enables veterans to obtain mortgages when they might not otherwise qualify, with little to no down payment. |
| | • | | Jumbo Loans: Loans that generally meet the underwriting standards of Fannie Mae and Freddie Mac, except for the amount of the loan or certain other credit features. Fannie Mae and Freddie Mac are prohibited from owning or guaranteeing single-family residential mortgage loans with balances greater than a certain dollar limit which is re-set annually. Loans with balances in excess of this amount, or with certain other credit features, are referred to as jumbo loans. |
Underwriting
Our underwriting process requires a thorough application review and documentation designed to maximize the value of our mortgage loans. If an individual loan application does not meet our formal written underwriting guidelines, but the underwriter has a documented belief both that the borrower has the ability and willingness to pay and that the property provides adequate collateral for the borrower’s obligations, our underwriters can make underwriting exceptions according to our written exception policies and approval authorities. We do not permit underwriting exceptions without significant compensating factors. We may, from time to time, apply underwriting criteria that are either more stringent or more flexible depending upon the economic conditions of a particular market. For lower LTV loans or for borrowers with higher credit scores or lower debt ratios, our underwriting policy is to analyze the overall situation of the borrower and to take into account compensating factors that may be used to offset
8
ways that the loan may rate as more risky. These compensating factors include credit scores, proposed reductions in the borrower’s debt service expense, employment stability, number of years in residence and net disposable income. We then determine loan terms and conditions to produce loans that we believe are appropriately priced relative to principal amount and other factors, meet our quality standards and will provide an appropriate risk-adjusted return. For many of our higher debt ratio and LTV loan programs, we do not allow exceptions to our underwriting guidelines.
During the second half of 2006, we made changes to tighten some of our underwriting guidelines for non-conforming loans due to current market conditions and the performance deterioration of our recent originations. Significant changes include limiting the loans available to borrowers under our stated wage, bank statement, and limited documentation programs, raising minimum FICO scores for second lien loans, eliminating second lien loans on higher risk products, lowering the CLTV available to borrowers in certain situations, limiting the types of loans available on non-owner occupied properties, reducing the types of loans available with our “interest only” feature, and generally raising the FICO score required under most of our programs. We have simultaneously made changes to improve our underwriting procedures, including requiring closer scrutiny of appraisals, reducing tolerances for the automated verification of broker appraisals, and utilizing new technology and resources to identify loans with a high fraud risk prior to origination and flag them for additional manual procedures. We believe that we will begin to see the benefit of these changes in underwriting guidelines and procedures in 2007 in the form of improved performance of our loans generated under these revised guidelines.
All of our non-conforming loans are underwritten by our underwriting staff, and we do not delegate underwriting authority to any broker or third party. Non-conforming loans are underwritten in our regional operations centers. Our loan officers and underwriters are well qualified, experienced employees that are familiar with our underwriting guidelines and receive regular training on changes and emerging trends.
We underwrite and process all of our conforming loans according to the automated underwriting systems or guidelines of Fannie Mae, Freddie Mac, FHA, VA or institutional investors, or these loans are underwritten by our correspondent or the purchaser on a pre-funded basis. In addition, for our conforming loans we review credit scores from one or more nationally recognized credit scoring models. We perform our conforming loan underwriting using our on-staff underwriting personnel or by contract personnel dedicated to one of our branches.
Originated Non-Conforming Loan Characteristics
The characteristics of our total non-conforming loan originations for the year ended December 31, 2006 are as follows:
Income Documentation
| | | | | | | | | | | | | | | | | | | | |
($ in 000s) | | Aggregate
Principal
Balance | | Percent of
Originations | | | Weighted
Average
Coupon | | | Weighted
Average
Credit Score | | Average
Principal
Balance | | Weighted
Average
LTV | | | Weighted
Average
CLTV | |
Full Documentation | | $ | 2,141,273 | | 41.0 | % | | 8.4 | % | | 621 | | $ | 129 | | 86.5 | % | | 93.0 | % |
Stated Income Wage Earner | | | 1,365,702 | | 26.1 | % | | 8.6 | % | | 680 | | | 181 | | 86.7 | % | | 96.0 | % |
Stated Income Self Employed | | | 1,126,302 | | 21.6 | % | | 8.5 | % | | 672 | | | 214 | | 86.0 | % | | 94.3 | % |
24 Month Bank Statements | | | 102,132 | | 2.0 | % | | 8.1 | % | | 636 | | | 190 | | 85.7 | % | | 92.7 | % |
12 Month Bank Statements | | | 475,664 | | 9.1 | % | | 8.4 | % | | 641 | | | 204 | | 86.8 | % | | 95.5 | % |
Limited Documentation | | | 12,582 | | 0.2 | % | | 8.5 | % | | 643 | | | 191 | | 85.4 | % | | 91.9 | % |
| | | | | | | | | | | | | | | | | | | | |
Total | | $ | 5,223,655 | | 100.0 | % | | | | | | | | | | | | | | |
| | | | | | | | | | | | | | | | | | | | |
Weighted Average/Average | | | | | | | | 8.4 | % | | 650 | | $ | 162 | | 86.5 | % | | 94.3 | % |
| | | | | | | | | | | | | | | | | | | | |
9
Credit Score
| | | | | | | | | | | | | | | | | | | | | | | |
($ in 000s) | | Aggregate
Principal
Balance | | Percent of
Originations | | | Weighted
Average
Coupon | | | Weighted
Average Credit
Score | | Average
Principal
Balance | | Weighted
Average
LTV | | | Weighted
Average
CLTV | | | Percent Full
Documentation | |
500 – 549 | | $ | 123,091 | | 2.4 | % | | 9.7 | % | | 535 | | $ | 138 | | 77.8 | % | | 80.0 | % | | 78.7 | % |
550 – 599 | | | 772,738 | | 14.8 | % | | 8.9 | % | | 581 | | | 139 | | 86.4 | % | | 90.3 | % | | 77.9 | % |
600 – 649 | | | 1,761,081 | | 33.7 | % | | 8.5 | % | | 626 | | | 147 | | 86.1 | % | | 94.2 | % | | 54.3 | % |
650 – 699 | | | 1,700,742 | | 32.6 | % | | 8.3 | % | | 672 | | | 177 | | 87.0 | % | | 96.2 | % | | 20.9 | % |
700 or greater | | | 866,003 | | 16.5 | % | | 8.1 | % | | 732 | | | 203 | | 87.4 | % | | 96.2 | % | | 15.1 | % |
| | | | | | | | | | | | | | | | | | | | | | | |
Total | | $ | 5,223,655 | | 100.0 | % | | | | | | | | | | | | | | | | | |
| | | | | | | | | | | | | | | | | | | | | | | |
Weighted Average/Average | | | | | | | | 8.4 | % | | 650 | | $ | 162 | | 86.5 | % | | 94.3 | % | | 41.0 | % |
| | | | | | | | | | | | | | | | | | | | | | | |
Product Type
| | | | | | | | | | | | | | | | | | | | | | | |
($ in 000s) | | Aggregate Principal Balance | | Percent of Originations | | | Weighted
Average Coupon | | | Weighted
Average
Credit Score | | Average
Principal
Balance | | Weighted
Average LTV | | | Weighted
Average CLTV | | | Percent Full
Documentation | |
2/28 LIBOR ARM | | $ | 1,052,716 | | 20.2 | % | | 8.8 | % | | 621 | | $ | 152 | | 84.7 | % | | 92.6 | % | | 53.3 | % |
2/28 LIBOR ARM IO | | | 1,593,726 | | 30.5 | % | | 8.1 | % | | 669 | | | 327 | | 85.5 | % | | 96.7 | % | | 21.3 | % |
3/27 LIBOR ARM | | | 59,203 | | 1.1 | % | | 8.3 | % | | 634 | | | 154 | | 84.5 | % | | 92.0 | % | | 65.1 | % |
3/27 LIBOR ARM IO | | | 109,396 | | 2.1 | % | | 7.6 | % | | 669 | | | 298 | | 84.3 | % | | 96.6 | % | | 41.4 | % |
5/25 Treasury ARM | | | 49,640 | | 1.0 | % | | 8.3 | % | | 655 | | | 224 | | 85.0 | % | | 91.3 | % | | 43.7 | % |
5/25 Treasury ARM IO | | | 259,075 | | 5.0 | % | | 7.4 | % | | 692 | | | 407 | | 84.4 | % | | 95.4 | % | | 19.8 | % |
Fixed Rate | | | 906,530 | | 17.4 | % | | 8.0 | % | | 640 | | | 159 | | 84.0 | % | | 89.1 | % | | 64.1 | % |
Fixed Rate IO | | | 187,316 | | 3.6 | % | | 7.7 | % | | 663 | | | 314 | | 85.5 | % | | 92.8 | % | | 45.0 | % |
6 Month LIBOR ARM | | | 2,671 | | 0.1 | % | | 8.4 | % | | 677 | | | 205 | | 83.0 | % | | 93.7 | % | | 26.2 | % |
6 Month LIBOR ARM IO | | | 4,575 | | 0.1 | % | | 8.3 | % | | 661 | | | 381 | | 81.5 | % | | 93.6 | % | | 0.0 | % |
2ndLiens | | | 475,286 | | 9.1 | % | | 10.9 | % | | 663 | | | 46 | | 99.3 | % | | 99.3 | % | | 33.3 | % |
2/38 LIBOR ARM | | | 495,235 | | 9.4 | % | | 8.5 | % | | 626 | | | 227 | | 87.5 | % | | 94.6 | % | | 49.2 | % |
3/37 LIBOR ARM | | | 21,133 | | 0.3 | % | | 8.6 | % | | 630 | | | 209 | | 88.1 | % | | 94.1 | % | | 58.3 | % |
2/48 LIBOR ARM | | | 6,658 | | 0.1 | % | | 8.0 | % | | 660 | | | 317 | | 90.9 | % | | 97.1 | % | | 52.5 | % |
3/47 LIBOR ARM | | | 495 | | 0.0 | % | | 7.4 | % | | 684 | | | 494 | | 95.0 | % | | 95.0 | % | | 100.0 | % |
| | | | | | | | | | | | | | | | | | | | | | | |
Total | | $ | 5,223,655 | | 100.0 | % | | | | | | | | | | | | | | | | | |
| | | | | | | | | | | | | | | | | | | | | | | |
Weighted Average/Average | | | | | | | | 8.4 | % | | 650 | | $ | 162 | | 86.5 | % | | 94.3 | % | | 41.0 | % |
| | | | | | | | | | | | | | | | | | | | | | | |
10
The characteristics of our total non-conforming loan originations for the year ended December 31, 2005 are as follows:
Income Documentation
| | | | | | | | | | | | | | | | | | | | |
($ in 000s) | | Aggregate
Principal
Balance | | Percent of
Originations | | | Weighted
Average
Coupon | | | Weighted
Average
Credit Score | | Average
Principal
Balance | | Weighted
Average
LTV | | | Weighted
Average
CLTV | |
Full Documentation | | $ | 2,604,981 | | 43.9 | % | | 7.4 | % | | 630 | | $ | 132 | | 84.2 | % | | 92.4 | % |
Stated Income Wage Earner | | | 1,659,811 | | 27.9 | % | | 7.6 | % | | 683 | | | 170 | | 83.9 | % | | 95.5 | % |
Stated Income Self Employed | | | 1,008,103 | | 17.0 | % | | 7.6 | % | | 672 | | | 186 | | 83.1 | % | | 93.6 | % |
24 Month Bank Statements | | | 215,662 | | 3.6 | % | | 7.2 | % | | 638 | | | 203 | | 84.9 | % | | 92.6 | % |
12 Month Bank Statements | | | 430,547 | | 7.2 | % | | 7.4 | % | | 643 | | | 185 | | 84.2 | % | | 93.9 | % |
Limited Documentation | | | 22,300 | | 0.4 | % | | 7.5 | % | | 653 | | | 169 | | 81.4 | % | | 91.6 | % |
| | | | | | | | | | | | | | | | | | | | |
Total | | $ | 5,941,404 | | 100.0 | % | | | | | | | | | | | | | | |
| | | | | | | | | | | | | | | | | | | | |
Weighted Average/Average | | | | | | | | 7.5 | % | | 653 | | $ | 155 | | 84.0 | % | | 93.6 | % |
| | | | | | | | | | | | | | | | | | | | |
Credit Score
| | | | | | | | | | | | | | | | | | | | | | | |
($ in 000s) | | Aggregate
Principal
Balance | | Percent of
Originations | | | Weighted
Average
Coupon | | | Weighted
Average Credit
Score | | Average
Principal
Balance | | Weighted
Average
LTV | | | Weighted
Average
CLTV | | | Percent Full
Documentation | |
500 – 549 | | $ | 167,049 | | 2.8 | % | | 8.7 | % | | 534 | | $ | 154 | | 78.7 | % | | 80.1 | % | | 79.3 | % |
550 – 599 | | | 755,621 | | 12.7 | % | | 7.8 | % | | 580 | | | 138 | | 82.5 | % | | 87.8 | % | | 75.4 | % |
600 – 649 | | | 1,851,204 | | 31.1 | % | | 7.5 | % | | 627 | | | 145 | | 84.2 | % | | 93.5 | % | | 59.3 | % |
650 – 699 | | | 2,099,072 | | 35.4 | % | | 7.4 | % | | 672 | | | 163 | | 84.5 | % | | 95.9 | % | | 27.3 | % |
700 or greater | | | 1,068,458 | | 18.0 | % | | 7.3 | % | | 732 | | | 171 | | 84.5 | % | | 95.6 | % | | 22.0 | % |
| | | | | | | | | | | | | | | | | | | | | | | |
Total | | $ | 5,941,404 | | 100.0 | % | | | | | | | | | | | | | | | | | |
| | | | | | | | | | | | | | | | | | | | | | | |
Weighted Average/Average | | | | | | | | 7.5 | % | | 653 | | $ | 155 | | 84.0 | % | | 93.6 | % | | 43.9 | % |
| | | | | | | | | | | | | | | | | | | | | | | |
Product Type
| | | | | | | | | | | | | | | | | | | | | | | |
($ in 000s) | | Aggregate
Principal
Balance | | Percent of
Originations | | | Weighted
Average
Coupon | | | Weighted
Average Credit
Score | | Average
Principal
Balance | | Weighted
Average
LTV | | | Weighted
Average
CLTV | | | Percent Full
Documentation | |
2/28 LIBOR ARM | | $ | 1,313,441 | | 22.1 | % | | 7.6 | % | | 625 | | $ | 154 | | 83.0 | % | | 92.1 | % | | 54.5 | % |
2/28 LIBOR ARM IO | | | 2,666,444 | | 44.9 | % | | 7.0 | % | | 664 | | | 278 | | 81.9 | % | | 94.6 | % | | 33.6 | % |
3/27 LIBOR ARM | | | 303,903 | | 5.1 | % | | 7.5 | % | | 628 | | | 152 | | 83.1 | % | | 91.4 | % | | 63.7 | % |
3/27 LIBOR ARM IO | | | 507,383 | | 8.6 | % | | 6.8 | % | | 662 | | | 266 | | 81.7 | % | | 92.5 | % | | 49.0 | % |
5/25 Treasury ARM | | | 11,448 | | 0.2 | % | | 6.8 | % | | 670 | | | 212 | | 78.4 | % | | 85.1 | % | | 72.2 | % |
5/25 Treasury ARM IO | | | 55,629 | | 1.0 | % | | 6.6 | % | | 681 | | | 302 | | 79.2 | % | | 88.0 | % | | 56.7 | % |
Fixed Rate | | | 335,386 | | 5.6 | % | | 7.2 | % | | 654 | | | 143 | | 79.2 | % | | 85.3 | % | | 69.5 | % |
Fixed Rate IO | | | 42,794 | | 0.7 | % | | 7.2 | % | | 663 | | | 250 | | 80.7 | % | | 91.0 | % | | 51.9 | % |
6 month LIBOR ARM | | | 1,800 | | 0.0 | % | | 7.1 | % | | 694 | | | 225 | | 84.0 | % | | 96.2 | % | | 20.0 | % |
6 month LIBOR ARM IO | | | 11,900 | | 0.2 | % | | 7.2 | % | | 674 | | | 313 | | 81.2 | % | | 93.4 | % | | 14.7 | % |
2ndLiens | | | 691,276 | | 11.6 | % | | 10.1 | % | | 665 | | | 51 | | 99.0 | % | | 99.0 | % | | 37.1 | % |
| | | | | | | | | | | | | | | | | | | | | | | |
Total | | $ | 5,941,404 | | 100.0 | % | | | | | | | | | | | | | | | | | |
| | | | | | | | | | | | | | | | | | | | | | | |
Weighted Average/Average | | | | | | | | 7.5 | % | | 653 | | $ | 155 | | 84.0 | % | | 93.6 | % | | 43.9 | % |
| | | | | | | | | | | | | | | | | | | | | | | |
11
Regulatory Compliance, Quality Control and Licensing
Regulatory Compliance
We regularly monitor and analyze any changes to the laws, rules and regulations that apply to our business. We integrate many legal and regulatory requirements into our automated loan origination system to reduce the prospect of inadvertent non-compliance due to human error. We also maintain policies and procedures, and summaries and checklists, to help our origination personnel comply with these laws. Our loans and practices are also reviewed regularly in connection with the due diligence that we do and that is performed by the purchasers of our loans, our securitization dealers and our warehouse lenders. State regulators also review our practices and loan files regularly and report the results to us. See Government Regulation below.
Quality Control
Our Quality Control Group, herein referred to as QC, is an integral part of our operations team as well as the legal, licensing and compliance teams. QC’s function is to verify and improve the quality of our operations. Each month, our quality control group selects a random sample of at least 10% of all loans originated during the prior month, and a targeted sample of at least 5% of all loans originated during the prior month. The targeted sample may include loans originated through a branch where there is a loan or loans with a first payment default or early payoff, loans originated by a branch that was recently cited for failing to comply with company policies and procedures, loans originated through a branch where there is a loan or loans that are the subject of an employee or consumer complaint, loans originated by a branch or through an operation center for which management has requested additional reviews about loan quality or others groups of loans.
Once the random and targeted samples are selected, the imaged version of the loan files are forwarded to a recognized third party provider who, using its own personnel, reviews and audits the entire sample for compliance with our underwriting guidelines and applicable regulations. During this time, QC re-verifies 100% of the material facts for all borrowers in the selected samples. Once the audit results are received back from the third party provider, our QC investigates, audits, reviews and re-underwrites loans cited by the third party provider as having errors or irregularities. Occasionally QC will review loans that are not cited with errors. Specifically, the quality control group:
| | • | | re-underwrites these loans, comparing the underwriting at the time of origination with our underwriting guidelines; |
| | • | | investigates any waivers of the underwriting guidelines; |
| | • | | reviews, investigates and analyzes the reverification data received in response to our reverification requests; |
| | • | | reviews borrowers’ signatures for authenticity and consistency; |
| | • | | reviews all closing documents to ensure compliance with State and Federal regulations; |
| | • | | reviews all closing documents to ensure that all closing conditions have been satisfied; |
| | • | | reviews all HUD-1 fees labeling by brokers and title companies to verify regulatory compliance; |
| | • | | reviews documentation (i.e., Borrower Benefit Analysis and High Cost worksheet) to verify our compliance with the relevant regulatory requirements; and |
| | • | | reviews appraisals to ensure collateral values for the loans are supported. |
QC also conducts on-site audits of each of our branch offices. These on-site audits involve an in-person and comprehensive review and determination of compliance in the following areas: data collection, account reconciliation, the content of advertising and its compliance with regulations, a sample of declined and in-process loans, the credit approval process, licensing, and employment practices. In 2006, we conducted on-site audits at all of our branch offices.
QC reports all of its findings on a monthly basis to the respective managers in order to implement corrective actions where necessary. The group’s findings are also reported to members of senior management and to our Board of Directors on a quarterly basis. Management analyzes the results of these audits as well as performance trends and
12
servicing issues. Based upon this analysis, further corrective actions and/or training may be recommended and implemented for a particular branch, operations center or employee. Any costs or expenses incurred as a consequence of an error made by a particular branch or operations center that is discovered in the course of a closed loan or on-site audit by QC is deducted from the internal profit and loss calculation for that branch or operations center. Branch managers’ compensation is tied partly to the QC audits of their respective their branches.
Licensing
We originate all our loans through Fieldstone Mortgage, our primary operating subsidiary. As of December 31, 2006, Fieldstone Mortgage was licensed or exempt from licensing requirements to originate residential mortgages in 50 states and the District of Columbia.
With respect to our portfolio of non-conforming loans held for investment, Fieldstone Mortgage closes the loans using funds advanced by us, with a transfer of the loans to us. As of December 31, 2006, we were licensed or exempt from licensing requirements to fund residential mortgage loans and acquire closed residential mortgage loans in all states in which we conduct business.
Portfolio Strategy—Loans Held for Investment
Our portfolio strategy is to build a portfolio of non-conforming loans with stable risk-adjusted returns, by managing the credit quality of the loans we originate, the interest rate risk associated with our portfolio of loans and the amount of leverage we use to finance our portfolio. We retain primarily non-conforming hybrid ARM loans in our portfolio to reduce the duration of our assets and reduce the interest rate risk inherent in our portfolio. During 2006, we began to hold second lien loans that meet specified return criteria for investment. We utilize derivative contracts, such as interest rate swaps, to mitigate the risk of our LIBOR-based financing costs increasing during the period in which the interest on the hybrid ARM loan is fixed, generally two to three years. As of December 31, 2006 and 2005, 84.7% and 86.0%, respectively, of the loans in our portfolio included a prepayment fee at origination. The inclusion of this fee lowers the borrower’s initial coupon rate and reduces prepayment rates, allowing us to recover our investment in the loan if it prepays in the first two or three years after origination. We manage the credit risk by focusing upon a disciplined loan origination and underwriting process, as well as constructing a portfolio with an average credit score of approximately 648.
For the year ended December 31, 2006, we retained 47% of the non-conforming loans we originated during that period. As of December 31, 2006, we have slightly surpassed our targeted portfolio leverage ratio of approximately 13:1, and we intend to hold loans for investment at a rate that allows us to maintain our current leverage. Depending upon future prepayments and any changes in our investment strategy, we expect to sell a higher percentage of our originations in 2007 than we have in previous years.
Portfolio Loan Characteristics
During 2006, the average principal balance of our portfolio of loans held for investment increased to $5.6 billion and the portfolio generated $89.7 million of net interest income before provision for loan losses, which was 1.6% of the average portfolio balance. During 2005, our average portfolio balance was $5.0 billion and the portfolio generated $145.8 million of net interest income before provision for loan losses, or 2.9% of the average portfolio balance. The decrease in net interest income as a percentage of the average portfolio balance reflects the intense competition for new originations in 2006, which did not allow the coupon interest rate on new loans to increase at as rapid a rate as did the cost of financing the loans.
Our provision for loan losses was $69.1 million and $30.1 million for the years ended December 31, 2006 and 2005, respectively. The non-conforming loans we hold for investment generally are made to higher risk borrowers than borrowers of conforming loans due to a number of factors, including a high level of debt service, high LTV or CLTV ratios, inconsistent or poor credit history or limited or no documentation of the borrower’s income. Accordingly, we expect that a higher percentage of our loans will become delinquent and require foreclosure and sale than would a portfolio of conforming credit loans. We begin to establish a reserve for this risk of loss once a loan becomes 30 days past due. The reserve is based upon our estimate of the borrower’s probability of transitioning to a more serious delinquency category in the future and our estimate of the likelihood that we will ultimately recognize a
13
loss on the defaulted loan resolution. Prior to the second quarter of 2006, we utilized industry loss assumptions for loans similar in credit, loan size, and product type in making estimates regarding the allowance for loan losses because we had limited historical loss data on past originations, all of which were sold servicing-released prior to October 2003. Beginning in the second quarter of 2006, we began to blend our own historical delinquency experiences with industry averages in estimating the percentage of loans that are delinquent 30+ days that will ultimately go to foreclosure. In addition to blending our own historical delinquency experiences with industry averages, we began to utilize historical loss experiences in estimating loss severity for pools for which we have significant realized loss experience during the second quarter of 2006. We continue to use average loss severity estimates for loans originated since the second half of 2006 for which a material level of actual realized loss experience for our own loans is not available. In addition, once a loan becomes 90 days or more delinquent, we place the loan on non-accrual status, which means we will not continue to accrue interest income on the loan due to its non-performance. The increase in the provision for loan losses in 2006 reflects the industry-wide deterioration in the performance of recent originations, as more fully explained under the section entitled Management’s Discussion and Analysis of Financial Condition and Results.
The detail of the mortgage loans held for investment, net as of December 31, 2006 and 2005 is as follows:
| | | | | | | | |
($ in 000s) | | December 31,
2006 | | | December 31,
2005 | |
Principal balance mortgage loans held for investment | | $ | 5,569,740 | | | $ | 5,530,216 | |
Net deferred origination fees and costs | | | 31,457 | | | | 40,199 | |
| | | | | | | | |
Mortgage loans held for investment | | | 5,601,197 | | | | 5,570,415 | |
Allowance for loan losses—loans held for investment | | | (81,859 | ) | | | (44,122 | ) |
| | | | | | | | |
Mortgage loans held for investment, net | | $ | 5,519,338 | | | $ | 5,526,293 | |
| | | | | | | | |
14
The characteristics of the principal balance of our portfolio of loans held for investment as of December 31, 2006 are as follows:
Income Documentation
| | | | | | | | | | | | | | | | | | | | |
($ in 000s) | | Aggregate
Principal
Balance | | Percent of
Mortgage
Pool | | | Weighted
Average
Coupon | | | Weighted
Average
Credit
Score | | Average
Principal
Balance | | Weighted
Average
LTV | | | Weighted
Average
CLTV | |
Full Documentation | | $ | 2,403,816 | | 43.2 | % | | 8.1 | % | | 617 | | $ | 142 | | 82.9 | % | | 91.9 | % |
Stated Income Wage Earner | | | 1,082,135 | | 19.4 | % | | 8.3 | % | | 672 | | | 215 | | 83.1 | % | | 93.9 | % |
Stated Income Self Employed | | | 1,557,060 | | 28.0 | % | | 8.0 | % | | 684 | | | 194 | | 84.0 | % | | 95.2 | % |
24 Month Bank Statements | | | 144,821 | | 2.6 | % | | 8.2 | % | | 627 | | | 208 | | 84.3 | % | | 91.7 | % |
12 Month Bank Statements | | | 359,156 | | 6.4 | % | | 8.2 | % | | 641 | | | 197 | | 84.7 | % | | 94.5 | % |
Limited Documentation | | | 22,752 | | 0.4 | % | | 8.1 | % | | 649 | | | 215 | | 82.5 | % | | 94.7 | % |
| | | | | | | | | | | | | | | | | | | | |
Total | | $ | 5,569,740 | | 100.0 | % | | | | | | | | | | | | | | |
| | | | | | | | | | | | | | | | | | | | |
Weighted Average/Average | | | | | | | | 8.1 | % | | 648 | | $ | 171 | | 83.4 | % | | 93.4 | % |
| | | | | | | | | | | | | | | | | | | | |
Credit Score
| | | | | | | | | | | | | | | | | | | | | | | |
($ in 000s) | | Aggregate
Principal
Balance | | Percent of
Mortgage
Pool | | | Weighted
Average
Coupon | | | Weighted
Average
Credit
Score | | Average
Principal
Balance | | Weighted
Average
LTV | | | Weighted
Average
CLTV | | | Percent Full
Documentation | |
500 – 549 | | $ | 229,787 | | 4.1 | % | | 9.7 | % | | 533 | | $ | 126 | | 79.5 | % | | 81.2 | % | | 82.7 | % |
550 – 599 | | | 834,006 | | 15.0 | % | | 8.4 | % | | 578 | | | 151 | | 81.5 | % | | 87.2 | % | | 76.5 | % |
600 – 649 | | | 1,717,587 | | 30.9 | % | | 8.1 | % | | 625 | | | 159 | | 83.3 | % | | 92.9 | % | | 62.5 | % |
650 – 699 | | | 1,861,796 | | 33.4 | % | | 7.9 | % | | 673 | | | 197 | | 83.9 | % | | 96.2 | % | | 20.5 | % |
700 or greater | | | 926,564 | | 16.6 | % | | 7.9 | % | | 731 | | | 187 | | 85.0 | % | | 97.2 | % | | 13.1 | % |
| | | | | | | | | | | | | | | | | | | | | | | |
Total | | $ | 5,569,740 | | 100.0 | % | | | | | | | | | | | | | | | | | |
| | | | | | | | | | | | | | | | | | | | | | | |
Weighted Average/Average | | | | | | | | 8.1 | % | | 648 | | $ | 171 | | 83.4 | % | | 93.4 | % | | 43.2 | % |
| | | | | | | | | | | | | | | | | | | | | | | |
Product Type
| | | | | | | | | | | | | | | | | | | | | | | |
($ in 000s) | | Aggregate Principal Balance | | Percent of Portfolio | | | Weighted
Average Coupon | | | Weighted
Average
Credit Score | | Average
Principal
Balance | | Weighted
Average LTV | | | Weighted
Average CLTV | | | Percent Full
Documentation | |
2/28 LIBOR ARM | | $ | 1,460,624 | | 26.2 | % | | 8.6 | % | | 616 | | $ | 139 | | 81.7 | % | | 91.0 | % | | 57.4 | % |
2/28 LIBOR ARM IO . | | | 2,408,924 | | 43.2 | % | | 7.7 | % | | 667 | | | 279 | | 83.3 | % | | 95.5 | % | | 29.8 | % |
3/27 LIBOR ARM . | | | 181,096 | | 3.3 | % | | 7.6 | % | | 624 | | | 139 | | 82.5 | % | | 90.8 | % | | 64.0 | % |
3/27 LIBOR ARM IO . | | | 288,563 | | 5.2 | % | | 7.0 | % | | 663 | | | 261 | | 82.1 | % | | 92.9 | % | | 45.0 | % |
5/25 Treasury ARM . | | | 33,122 | | 0.6 | % | | 7.4 | % | | 643 | | | 181 | | 79.5 | % | | 86.9 | % | | 58.0 | % |
5/25 Treasury ARM IO . | | | 111,786 | | 2.0 | % | | 7.2 | % | | 677 | | | 325 | | 83.2 | % | | 92.1 | % | | 42.7 | % |
Fixed Rate . | | | 480,587 | | 8.6 | % | | 7.9 | % | | 638 | | | 149 | | 80.6 | % | | 89.3 | % | | 64.1 | % |
Fixed Rate IO . | | | 18,891 | | 0.3 | % | | 7.6 | % | | 651 | | | 252 | | 82.9 | % | | 91.0 | % | | 63.6 | % |
6 Month LIBOR ARM . | | | 823 | | 0.0 | % | | 8.7 | % | | 679 | | | 165 | | 83.3 | % | | 89.7 | % | | 22.8 | % |
6 Month LIBOR ARM IO | | | 3,159 | | 0.1 | % | | 8.3 | % | | 674 | | | 226 | | 80.1 | % | | 90.0 | % | | 19.3 | % |
2ndLiens .. | | | 291,924 | | 5.2 | % | | 10.8 | % | | 678 | | | 50 | | 99.4 | % | | 99.4 | % | | 23.3 | % |
2/38 LIBOR ARM . | | | 228,450 | | 4.1 | % | | 8.3 | % | | 630 | | | 222 | | 83.6 | % | | 92.7 | % | | 47.0 | % |
3/37 LIBOR ARM . | | | 8,842 | | 0.2 | % | | 8.5 | % | | 640 | | | 201 | | 85.6 | % | | 94.0 | % | | 54.1 | % |
40 Year Fixed . | | | 52,949 | | 1.0 | % | | 8.2 | % | | 630 | | | 207 | | 82.8 | % | | 88.4 | % | | 63.8 | % |
| | | | | | | | | | | | | | | | | | | | | | | |
Total . | | $ | 5,569,740 | | 100.0 | % | | | | | | | | | | | | | | | | | |
| | | | | | | | | | | | | | | | | | | | | | | |
Weighted Average/Average | | | | | | | | 8.1 | % | | 648 | | $ | 171 | | 83.4 | % | | 93.4 | % | | 43.2 | % |
| | | | | | | | | | | | | | | | | | | | | | | |
15
The characteristics of the principal balance of our portfolio of loans held for investment as of December 31, 2005 are as follows:
Income Documentation
| | | | | | | | | | | | | | | | | | | | |
($ in 000s) | | Aggregate
Principal
Balance | | Percent of
Mortgage
Pool | | | Weighted
Average
Coupon | | | Weighted
Average
Credit
Score | | Average
Principal
Balance | | Weighted
Average
LTV | | | Weighted
Average
CLTV | |
Full Documentation | | $ | 2,484,857 | | 44.9 | % | | 7.1 | % | | 620 | | $ | 162 | | 82.0 | % | | 91.1 | % |
Stated Income Wage Earner | | | 1,569,529 | | 28.4 | % | | 7.2 | % | | 689 | | | 212 | | 79.0 | % | | 95.1 | % |
Stated Income Self Employed | | | 948,020 | | 17.1 | % | | 7.2 | % | | 672 | | | 231 | | 79.2 | % | | 93.3 | % |
24 Month Bank Statements | | | 194,089 | | 3.5 | % | | 7.0 | % | | 627 | | | 231 | | 83.4 | % | | 91.3 | % |
12 Month Bank Statements | | | 307,134 | | 5.6 | % | | 7.2 | % | | 636 | | | 222 | | 82.1 | % | | 92.3 | % |
Limited Documentation | | | 26,587 | | 0.5 | % | | 7.1 | % | | 639 | | | 214 | | 79.5 | % | | 93.3 | % |
| | | | | | | | | | | | | | | | | | | | |
Total | | $ | 5,530,216 | | 100.0 | % | | | | | | | | | | | | | | |
| | | | | | | | | | | | | | | | | | | | |
Weighted Average/Average | | | | | | | | 7.1 | % | | 650 | | $ | 190 | | 80.7 | % | | 92.7 | % |
| | | | | | | | | | | | | | | | | | | | |
Credit Score
| | | | | | | | | | | | | | | | | | | | | | | |
($ in 000s) | | Aggregate
Principal
Balance | | Percent of
Mortgage
Pool | | | Weighted
Average
Coupon | | | Weighted
Average
Credit
Score | | Average
Principal
Balance | | Weighted
Average
LTV | | | Weighted
Average
CLTV | | | Percent Full
Documentation | |
500 – 549 | | $ | 298,582 | | 5.4 | % | | 8.2 | % | | 532 | | $ | 135 | | 79.2 | % | | 81.1 | % | | 82.1 | % |
550 – 599 | | | 834,614 | | 15.1 | % | | 7.6 | % | | 577 | | | 159 | | 81.5 | % | | 86.1 | % | | 75.0 | % |
600 – 649 | | | 1,494,317 | | 27.0 | % | | 7.1 | % | | 626 | | | 190 | | 81.8 | % | | 91.6 | % | | 63.3 | % |
650 – 699 | | | 1,871,457 | | 33.8 | % | | 6.9 | % | | 674 | | | 212 | | 80.7 | % | | 95.9 | % | | 25.3 | % |
700 or greater | | | 1,031,246 | | 18.7 | % | | 6.9 | % | | 733 | | | 205 | | 78.9 | % | | 97.1 | % | | 18.9 | % |
| | | | | | | | | | | | | | | | | | | | | | | |
Total | | $ | 5,530,216 | | 100.0 | % | | | | | | | | | | | | | | | | | |
| | | | | | | | | | | | | | | | | | | | | | | |
Weighted Average/Average | | | | | | | | 7.1 | % | | 650 | | $ | 190 | | 80.7 | % | | 92.7 | % | | 44.9 | % |
| | | | | | | | | | | | | | | | | | | | | | | |
Product Type
| | | | | | | | | | | | | | | | | | | | | | | |
($ in 000s) | | Aggregate
Principal
Balance | | Percent of
Mortgage
Pool | | | Weighted
Average
Coupon | | | Weighted
Average
Credit
Score | | Average
Principal
Balance | | Weighted
Average
LTV | | | Weighted
Average
CLTV | | | Percent Full
Documentation | |
2/28 LIBOR ARM | | $ | 1,736,717 | | 31.4 | % | | 7.5 | % | | 622 | | $ | 142 | | 81.2 | % | | 90.7 | % | | 54.9 | % |
2/28 LIBOR ARM IO | | | 2,911,691 | | 52.7 | % | | 6.8 | % | | 665 | | | 258 | | 82.1 | % | | 94.5 | % | | 36.6 | % |
3/27 LIBOR ARM | | | 210,648 | | 3.8 | % | | 7.4 | % | | 623 | | | 145 | | 81.3 | % | | 90.1 | % | | 63.2 | % |
3/27 LIBOR ARM IO | | | 313,594 | | 5.7 | % | | 6.8 | % | | 661 | | | 251 | | 81.3 | % | | 91.6 | % | | 45.5 | % |
5/25 Treasury ARM | | | 22,932 | | 0.4 | % | | 6.5 | % | | 658 | | | 175 | | 77.3 | % | | 85.8 | % | | 65.3 | % |
5/25 Treasury ARM IO | | | 67,286 | | 1.2 | % | | 6.4 | % | | 672 | | | 275 | | 80.6 | % | | 89.3 | % | | 65.0 | % |
Fixed Rate | | | 157,190 | | 2.8 | % | | 7.5 | % | | 644 | | | 146 | | 78.4 | % | | 87.4 | % | | 68.1 | % |
Fixed Rate IO | | | 28,566 | | 0.5 | % | | 7.1 | % | | 668 | | | 234 | | 80.4 | % | | 90.8 | % | | 53.4 | % |
6 Month LIBOR ARM | | | 282 | | 0.0 | % | | 7.5 | % | | 662 | | | 282 | | 80.0 | % | | 100.0 | % | | 0.0 | % |
6 Month LIBOR ARM IO | | | 4,403 | | 0.1 | % | | 6.9 | % | | 683 | | | 210 | | 80.7 | % | | 93.5 | % | | 25.5 | % |
2ndLiens | | | 76,907 | | 1.4 | % | | 10.1 | % | | 715 | | | 56 | | 18.5 | % | | 99.5 | % | | 11.5 | % |
| | | | | | | | | | | | | | | | | | | | | | | |
Total | | $ | 5,530,216 | | 100.0 | % | | | | | | | | | | | | | | | | | |
| | | | | | | | | | | | | | | | | | | | | | | |
Weighted Average/Average | | | | | | | | 7.1 | % | | 650 | | $ | 190 | | 80.7 | % | | 92.7 | % | | 44.9 | % |
| | | | | | | | | | | | | | | | | | | | | | | |
16
Portfolio Financing
We generally finance our portfolio of loans held for investment initially with warehouse debt and then for a longer term, with the mortgage-backed securities that we issue through our periodic securitizations. We structure our securitizations as financings rather than sales of the underlying loans for GAAP and tax accounting purposes. We generate earnings and cash flow from the loans we securitize primarily through net interest income over time, rather than generating a gain or loss at the time of the securitization. Securitized loans remain on our consolidated statement of condition as an asset, while the securitization debt is accounted for as a liability on our consolidated statement of condition. Accordingly, we record interest income generated by the mortgage loans and recognize interest expense on the mortgage-backed securities over the life of the loan.
We have structured each of our securitizations to distribute the net interest spread (interest income on the mortgages less servicing fees, securitization debt interest expense and loan losses) beginning in the month following the securitization by providing the initial credit enhancement for the investment grade securities, through structural subordination and over-collateralization, at the time of securitization. Therefore, we will receive monthly cash flows on these loans, in the form of net interest spread on the securitized loans that we recognize as income for both GAAP and tax purposes as long as certain long-term delinquency and loss tests are met by the loans securing a particular securitization trust. If certain long-term delinquency and loss tests exceed parameters defined in the securitization documents, our net interest spread will be used to replenish required credit enhancement, therefore reducing or eliminating our net interest spread.
Because the securitized loans and their cash flow are collateral for the securitization debt, the cash flow available to us varies depending upon numerous factors, including the following:
| | • | | Credit Enhancement: Our securitizations generally are structured such that the credit enhancement for the senior mortgage-backed securities issued is provided by the excess spread on the securitized loans, over-collateralization and structural subordination. We generally over-collateralize each of our securitizations to the over-collateralization targets established by the applicable rating agencies at the time of issuance. The required level of over-collateralization may be increased or may be prevented from decreasing as would otherwise be permitted if losses and/or delinquencies exceed defined levels. This could have the effect of reducing or even eliminating the net interest income that would otherwise be distributed to us. |
| | • | | Interest Rate Spread: The net interest income we receive from our securitized loans is based upon the spread between the weighted average interest we earn on the mortgage loans and the interest we pay to holders of the mortgage-backed securities. A significant portion of the mortgage-backed securities that we issue are variable-rate securities, the interest expense of which varies monthly based on short-term interest rates, while the interest income we receive from the underlying loans is tied to medium and long-term interest rates. Accordingly, relative changes in short-term interest rates may have a material effect on the net interest income we receive. In addition, the net interest income we receive from securitizations will be reduced according to the terms of the securitization documents if there are significant loan defaults or prepayments of loans with interest rates that are high relative to the rest of our loans. |
We attempt to mitigate net interest income variability by entering into derivative contracts with third parties, such as interest rate swap or cap agreements, for those periods during which our interest income from loans is fixed rather than variable. However, while these hedging strategies provide an effective economic hedge of our interest expense, the change in the fair market value of the economic hedges each period have been required to be recognized in our consolidated statements of operations, and may cause our quarterly results to vary widely. Upon the expiration of the fixed rate period of our mortgage loans held for investment, typically the first two to three years of the loan, the mortgage coupon interest rate will adjust every six months, based upon a six month LIBOR index. The interest payments due to our mortgage-backed security holders will continue to reset monthly, based upon a one month LIBOR index. The difference between the one month LIBOR and six month LIBOR indexes will reduce our net interest income spread from securitizations during periods of rising interest rates, and conversely, may increase our net interest margin when market interest rates are falling.
17
Loan Sales
We sell a portion of the non-conforming and all of the conforming loans that we originate on a whole loan, servicing-released basis. During 2006, 2005 and 2004, we sold $2.7 billion, or 50.0%, $3.1 billion, or 50.6%, and $2.4 billion, or 37.4%, respectively, of our originations.
We attempt to maximize the return on our loan sales by originating loans with credit histories, LTVs, credit scores and other characteristics which we believe will maximize the whole loan sale premiums offered by the institutional purchasers of our loans. Our average sales premium in 2006 was 0.8%, compared to 2.0% in 2005 and 1.8% in 2004. The reduction in sale premiums during 2006 is primarily due to reduced gross sales premiums, a charge to reduce the carrying value of certain second lien loans to the lower of cost or market value recorded during the period, and an increase in the provision recorded for loan repurchases. Intense market competition limited the net interest spread available on new originations in 2006, which in turn limited the premiums we were able to earn from investors on the sales of those loans. During 2006, a significant decline in the market value of second lien loans held for sale due to slowing home price appreciation and a forecast of increased losses by prominent rating agencies necessitated pre-tax charges of $4.2 million to reduce the carrying value of these loans to the lower of cost or market value, which was recorded as a reduction in the gain on sales of mortgage loans, net.
We sell whole loans on a non-recourse basis pursuant to purchase agreements to numerous investors. Our loan sales transactions are subject to standard mortgage industry representations and warranties, including provisions requiring us to repurchase a loan if a borrower fails to make one or more of the early loan payments due on the loan. Material violations of any of these representations and warranties may require us to repurchase some or all of the loans that we sold, or substitute different loans in exchange for the defaulting loans, or pay the investor for the cost incurred as a result of any inaccurate information and indemnify them against any resulting loss. We reacquire the risks of delinquency and default for loans that we repurchase. During 2006, deteriorating loan performance, which was caused by the same factors that negatively impacted the performance of our loans held for investment, caused our estimated loss on repurchases to increase $8.2 million compared to 2005. Compounding the deterioration in loan performance, investors have become increasingly aggressive in regards to requiring the repurchases as a result of prevailing market conditions, and have significantly expedited their requests for the repurchase of such loans. Several of our servicing initiatives address additional procedures we have implemented in our interim servicing of our loans held for sale prior to the date of sale. Also, as described above under the Business-Underwriting section, we modified our underwriting guidelines and procedures during the second half of 2006. We believe that we will begin to see the benefits of these measures in 2007 in the form of improved loan performance and reduced repurchase requests.
The following table presents our loan sales by investor for the years ended December 31, 2006, 2005, and 2004:
| | | | | | | | | | | | | | | | | | |
| | | Year Ended December 31, | |
($ in 000) | | 2006 | | % of Sales
Volume | | | 2005 | | % of Sales Volume | | | 2004 | | % of Sales Volume | |
Bear Stearns | | $ | 645.5 | | 22.2 | % | | $ | 202.1 | | 4.6 | % | | $ | 152.3 | | 4.4 | % |
Lehman Bros. Bank, FSB | | | 527.3 | | 18.2 | % | | | 317.6 | | 7.3 | % | | | 1,031.0 | | 29.5 | % |
HSBC Mortgage Services | | | 491.7 | | 16.9 | % | | | 1,292.1 | | 29.7 | % | | | 647.8 | | 18.5 | % |
Merrill Lynch & Co., Inc. | | | 394.7 | | 13.6 | % | | | 53.2 | | 1.2 | % | | | 403.4 | | 11.5 | % |
Countrywide Home Loans | | | 272.6 | | 9.4 | % | | | 766.8 | | 17.6 | % | | | 468.6 | | 13.4 | % |
Credit Suisse First Boston | | | 150.4 | | 5.2 | % | | | 2.2 | | 0.1 | % | | | 54.2 | | 1.5 | % |
JP Morgan Mortgage Chase | | | 143.0 | | 4.9 | % | | | 1,168.8 | | 26.8 | % | | | — | | — | |
Wells Fargo Funding Inc. | | | 83.0 | | 2.9 | % | | | 361.4 | | 8.3 | % | | | 397.4 | | 11.4 | % |
Washington Mutual | | | 3.7 | | 0.1 | % | | | 23.4 | | 0.5 | % | | | 166.3 | | 4.8 | % |
All others | | | 191.6 | | 6.6 | % | | | 168.0 | | 3.9 | % | | | 178.8 | | 5.0 | % |
| | | | | | | | | | | | | | | | | | |
Total loan sales | | $ | 2,903.5 | | 100.0 | % | | $ | 4,355.6 | | 100.0 | % | | $ | 3,499.8 | | 100.0 | % |
| | | | | | | | | | | | | | | | | | |
As of December 31, 2006 and 2005, mortgage loans held for sale included approximately $6.8 million and $1.7 million, respectively, of loans repurchased pursuant to the above provisions, net of the related valuation allowance. Net realized losses on sold loans, primarily related to early payment defaults, premium recaptures on early payoffs and representation and warranty liability totaled $25.7 million, $3.7 million, and $8.1 million or 0.89%, 0.08%, and 0.23% of total loan sales in 2006, 2005 and 2004, respectively.
We expect to continue our strategy of selling all of our conforming originations and that portion of our non-conforming loans that we do not retain for our portfolio. As of December 31, 2006, we have surpassed our targeted portfolio leverage ratio of approximately 13:1, and therefore expect to sell a higher percentage of our non-conforming originations in 2007 than we have in previous years. We continue to target a 13:1 portfolio leverage ratio.
Loan Servicing
Our loan servicing activities are designed to ensure that each loan is repaid in accordance with its terms. These activities include: collecting and remitting loan payments, making required advances, accounting for principal and interest, holding escrow or impound funds for payment of taxes and insurance and, if applicable, contacting delinquent borrowers and supervising foreclosures and property dispositions in the event of un-remedied defaults. We provide interim servicing on the loans held for sale from the time of funding until the time we transfer the permanent servicing of the loans, which is generally 30 to 45 days after funding of the loans. We place a “welcome call” when a loan is funded and instruct the borrower about the due date of the first payment and where the payment should be mailed. If our servicing department has trouble contacting the borrower, the borrower’s contact information is verified with the originating branch, and, if contact still cannot be made, the loan is investigated for potential fraud. Prior to
18
the permanent servicer of the loan assuming the servicing function, we send a required servicing transfer notice (a “good-bye” letter) and place a “good-bye” call that advises the borrower that the loan has been sold and instructs the borrower where to send future payments. In some cases, where the transfer is completed in less than 30 days, the “welcome” and “good-bye” calls are combined into a single call. In 2007, we entered into a sub-servicing agreement with Litton Loan Services, LLC, (Litton) an affiliate of C-BASS, which is an experienced servicer of non-conforming loans to sub-service the loans we hold for sale.
In connection with our securitization strategy, we believe retaining the servicing rights on our loans held for investment is important to ensure the performance of the loans and to maximize our returns over time. Because we currently do not have the capability to service these loans for the life of the loans, we have contracted with an experienced servicer of non-conforming loans, to “sub-service” these loans for us. Beginning in 2006, we have implemented a number of initiatives in response to increasing delinquencies. These initiatives, which are described more fully under Management’s Discussion and Analysis of Financial Condition and Results, include accelerating intervention on delinquent loans, directly boarding loans held for investment with the sub-servicer, and contracting with a delinquency and loss mitigation monitor for all 2006 originations. In 2007, we entered into a sub-servicing agreement with Litton for it to service our loans held for investment.
Competition
We face intense competition in the business of originating mortgage loans for sale and for our investment portfolio. Our competitors in the non-conforming market include Wall Street firms, consumer finance companies, mortgage banking companies, other mortgage REITs, commercial banks, credit unions and savings and loan companies. Many traditional prime mortgage lenders offer products similar to those we offer to non-conforming borrowers. Our competitors in the conforming market include mortgage banking companies, mortgage brokers, commercial banks, Fannie Mae and Freddie Mac, as well as Internet-based companies.
Many of our competitors, including large financial corporations, are increasingly taking advantage of consolidation opportunities in the industry and are substantially larger and have more capital or greater access to capital, lower cost structures, or greater technical and marketing resources than we have. Efficiencies in the mortgage-backed securities market generally have created a desire for increasingly larger transactions, giving companies with greater volumes of originations a competitive advantage. Large volume originators also may gain a profitability advantage when fixed overhead costs support larger funding volumes.
Competition in the industry can be directed at many components of the mortgage loan process, including interest rates and costs of loans, convenience in obtaining loans, customer service, amounts and terms of loans, and marketing and distribution channels.
The competitive environment in our industry has changed significantly in recent months due to the deteriorating performance of subprime loans in general. Generally, many of our competitors face the same issues regarding loan performance that we have faced. These conditions have led to decreased market capitalization for some our competitors, as well as an increase in merger and acquisition activity within our industry. These recent changes within the industry have led to some of our competitors leaving the subprime lending industry, either voluntarily or involuntarily.
19
Government Regulation
We operate our mortgage lending business in a highly regulated industry. Because we originate loans throughout the United States, we must comply with the laws, rules and regulations, as well as judicial and administrative decisions, of all relevant jurisdictions, as well as an extensive body of federal laws, rules and regulations. The volume of new or modified federal and state laws, rules and regulations has increased in recent years, and, in addition, individual municipalities have begun to enact laws, rules and regulations that restrict loan origination activities and, in some cases, loan servicing activities. The laws, rules and regulations of each of these jurisdictions are different, complex and, in some cases, in direct conflict with each other. We actively monitor changes in the laws, rules, and regulations, and ensure our policies and procedures are updated accordingly. The state and federal laws, rules, and regulations, among other things:
| | · | | impose licensing and financial requirements; |
| | · | | limit interest, finance charges, and other fees that may be charged to and collected from borrowers; |
| | · | | prohibit discrimination; |
| | · | | impose underwriting and origination requirements; |
| | · | | impose disclosure and notification obligations; |
| | · | | impose data collection and reporting requirements; |
| | · | | impose safeguarding rules, and restrict our sharing of personal, non-public information obtained about our customers; |
| | · | | mandate specific corporate governance, internal controls and financial disclosures; |
| | · | | regulate marketing techniques and practices; |
| | · | | regulate collection and foreclosure practices; and |
| | · | | in some cases, impose assignee liability on loan purchasers. |
Our failure to comply with these laws, rules and regulations can lead to:
| | · | | civil and criminal liability, including potential monetary penalties; |
| | · | | loss of state licenses or other approved status required for continued lending and servicing operations; |
| | · | | legal defenses causing delay or otherwise adversely affecting the servicer’s ability to enforce loans, or giving the borrower the right to rescind or cancel the loan transaction; |
| | · | | demands for indemnification or loan repurchases from purchasers of our loans; |
| | · | | class action lawsuits; and |
| | · | | administrative enforcement actions. |
The primary federal laws and regulations applicable to our business include:
| | · | | Real Estate Settlement Procedures Act and Regulation X; |
| | · | | Truth in Lending Act and Regulation Z; |
| | · | | Home Ownership and Equity Protection Act; |
| | · | | Equal Credit Opportunity Act and Regulation B; |
| | · | | Fair Credit Reporting Act; |
| | · | | Fair and Accurate Credit Transactions Act; |
| | · | | Gramm-Leach-Bliley Act and Regulation P; |
20
| | · | | Fair Debt Collection Practices Act; |
| | · | | Home Mortgage Disclosure Act; |
| | · | | Soldiers and Sailors Civil Relief Act; |
| | · | | Telephone Consumer Protection Act; |
| | · | | Telemarketing and Consumer Fraud and Abuse Prevention Act; and |
| | · | | Controlling the Assault of Non-solicited Pornography and Marketing Act. |
Regulatory Developments
Regulation AB. On January 1, 2006, the SEC’s final regulations covering the registration, disclosure, communications, and reporting requirements for asset backed securities (Regulation AB) became effective. The new rules contain several new disclosure requirements, including requirements to provide historical financial data with respect to either previously securitized pools of the same asset class or prior originations and information with respect to the background, experience and roles of the various transaction parties, including those involved in the origination, sale or servicing of the loans in the securitized pool. Moreover, annual assessments of compliance with enhanced servicing criteria by servicers and attestation reports from an independent accounting firm must be obtained with respect to securitized pools of our mortgage loans. Our failure to satisfy the requirements of Regulation AB may impact, among other things, our ability to access the securitization market using our shelf registration.
Privacy. The federal Gramm-Leach-Bliley Act imposes additional obligations on us to safeguard the information we maintain on our borrowers. Regulations have been proposed by several federal agencies that may affect our obligations to safeguard information. In addition, regulations that could affect the content of our notices are being considered by several federal agencies. Also, several states are considering even more stringent privacy legislation. For example, California has passed legislation known as the California Financial Information Privacy Act and the California OnLine Privacy Protection Act. Both pieces of legislation became effective July 1, 2004 and impose additional notification obligations on us that are not pre-empted by existing federal law. If other states choose to follow California and adopt a variety of inconsistent state privacy legislation, our compliance costs could substantially increase.
Fair Credit Reporting Act. The Fair Credit Reporting Act (FCRA) provides federal preemption for lenders to share information with affiliates and certain third parties and to provide pre-approved offers of credit to consumers. Congress acted in late 2003 to make this preemption permanent; otherwise, it would have expired at the end of the year and states could have imposed more stringent and inconsistent regulations regarding the use of pre-approved offers of credit and other information sharing. In December of 2003, Congress also enacted the Fair and Accurate Credit Transaction Act (FACT Act) amending the FCRA, which places, among other things, further restrictions on the use of information shared between affiliates, provides new disclosures to consumers when risk-based pricing is used in the credit decision, and helps protect consumers from identity theft. Although federal regulators have issued regulations implementing some of the FACT Act amendments to FCRA, we are awaiting issuance of additional regulations. All of these new provisions impose additional regulatory and compliance costs on us and reduce the effectiveness of our marketing programs.
Home Mortgage Disclosure Act. In 2002, the Federal Reserve Board adopted changes to Regulation C promulgated under the Home Mortgage Disclosure Act, or HMDA. Among other things, the new regulations require lenders to report pricing data on loans with annual percentage rates that exceed the yield on treasury bills with comparable maturities by 3% for first liens and 5% for second liens. The expanded reporting took effect in 2004. For 2006, approximately 24.0% of our first liens and 10.0% of our second liens were subject to the expanded reporting requirements. The expanded reporting does not provide for additional information related to a loan applicant or borrower’s creditworthiness, such as credit risk, debt-to-income ratio, loan-to-value ratio, income documentation or other salient loan features. As a result, we, and lenders like us, are concerned that the reported information, without reference to credit data, may lead to increased litigation as the information could be misinterpreted by third parties.
Telephone Consumer Protection Act and Telemarketing Consumer Fraud and Abuse Prevention Act. These laws, enacted in 1991 and 1994, respectively, are designed to restrict unsolicited advertising using the telephone and
21
facsimile machine. Since they were enacted, however, telemarketing practices have changed significantly as new technologies make it easier to market to potential customers while, at the same time, making it more cost effective to do so. The Federal Communications Commission (FCC) and the Federal Trade Commission have responsibility for regulating various aspects of these laws, such as regulating unwanted telephone solicitations and the use of automated telephone dialing systems, prerecorded or artificial voice messages, and telephone facsimile machines. In 2003, both agencies adopted “do not call” registry requirements, which, in part, mandate that companies such as us maintain and regularly update lists of consumers who have chosen not to be called. These requirements also mandate that we do not call consumers who have chosen to be on the “do not call” list maintained by the FTC, subject to certain exemptions including an established business relationship exemption. During this same time, over 25 states have also adopted similar laws, with which we must comply. As with other regulatory requirements, these provisions impose additional regulatory and compliance costs on us and reduce the effectiveness of our marketing programs. The Federal Communications Commission amended its rules in 2003 regarding unsolicited faxes. The revised rules provide that it is unlawful to send an unsolicited advertisement to a facsimile machine without the prior written permission of the recipient of the advertisement, regardless of whether there is an established business relationship between the sender of the facsimile and the recipient. The effective date of this restriction was scheduled to be January 9, 2006. However, on July 9, 2005, the President signed into law the Junk Fax Prevention Act of 2005 (JFPA). The JFPA amended the Telephone Consumer Protection Act (TCPA) to expressly allow unsolicited facsimile advertisements to a facsimile of a recipient with whom the sender has an established business relationship as long as (i) the facsimile contains a specific opt out notice meeting the requirements of the JFPA, and (ii) the recipient has not previously opted out or specifically requested that the sender not send future facsimile advertisements to such number. The FCC is expected to amend its regulations implementing the JFPA.
Predatory Lending Legislation. The Federal Home Ownership and Equity Protection Act (HOEPA) identifies a category of mortgage loans as “high cost” and subjects such loans to restrictions not applicable to other mortgage loans. Loans subject to HOEPA consist of loans on which the points and fees or the annual percentage rate (APR) exceed specified levels. Liability for violations of applicable law with regard to loans subject to HOEPA would extend not only to us, but to the purchasers of our loans as well. Our policy is to not make loans that are subject to HOEPA. We anticipate that we will continue to avoid making loans subject to HOEPA, and any lowering of the thresholds beyond which loans become subject to HOEPA may prevent us from making certain loans and may cause us to reduce the APR or the points and fees on loans that we do make. If we inadvertently make a loan subject to HOEPA or if we decide to relax our restrictions on loans subject to HOEPA, we will be subject to greater risks for actual or perceived non-compliance with HOEPA and other applicable laws, including demands for indemnification or loan repurchases from our lenders and loan purchasers in cases of non-compliance, class action lawsuits and administrative enforcement actions, and these loans are ineligible for normal sale or securitization.
Laws, rules and regulations have been adopted, or are under consideration, at the state and local levels that are similar to HOEPA in that they are intended to eliminate certain lending practices, often referred to as “predatory” lending practices. Many of these laws, rules and regulations restrict commonly accepted lending activities. As a result, these new laws, rules and regulations impose additional costly and burdensome compliance requirements on mortgage lenders. These laws, rules and regulations impose restrictions on loans on which certain points and fees or the annual percentage rate (or APR) meet or exceed specified thresholds increasing the risk of litigation and regulatory sanctions. In addition, an increasing number of these laws, rules and regulations seek to impose liability for violations on purchasers of loans, regardless of whether the purchaser knew of or participated in the violation. Accordingly, the companies that buy our loans or provide financing for loan originations may not want, and are not contractually required, to buy or refinance any loans subject to these types of laws, rules and regulations.
Our policy is to avoid originating loans that meet or exceed the APR or “points and fees” thresholds of these laws, rules and regulations, except in the relatively small number of states whose laws, rules and regulations relating to “points and fees” thresholds allow these loans, in our judgment, to be made within our strict legal compliance standards and without undue risk relative to litigation or to the enforcement of the loan according to its terms. Our primary safeguards to avoid inadvertently making a loan in violation of these laws, rules and regulations are:
| | · | | policies and procedures designed to achieve strict compliance with all applicable laws, rules and regulations, including without limitation, policies and procedures designed to ensure that the applicable APR or “points and fees” thresholds are not inadvertently met or exceeded in connection with a loan; |
| | · | | software integrated into our non-conforming loan origination system that “tests” a loan for compliance with The Truth in Lending Act, HOEPA and applicable state high cost lending restrictions; and |
22
| | · | | requiring that our branches prepare a written borrower benefit analysis for each non-conforming refinance loan we originate. |
The continued enactment of these laws, rules and regulations may prevent us from making some loans and may cause us to reduce the APR or the points and fees on loans that we do make. In addition, the difficulty of managing the compliance risks presented by these laws, rules and regulations may decrease the availability of warehouse financing and the overall demand in the secondary market for non-conforming loans. These laws, rules and regulations have increased our cost of doing business as we have been required to develop systems and procedures to ensure that we do not violate any aspect of these new requirements. If we decide to relax further our self-imposed restrictions on our origination of loans subject to these laws, rules and regulations, we may be subject to greater risks for actual or perceived non-compliance with these laws, rules and regulations, including demands for indemnification or loan repurchases from lenders and investors, class action lawsuits, increased defenses to foreclosure of individual loans in default, individual claims for significant monetary damages and administrative enforcement actions. Any of the foregoing could significantly harm our business, financial condition and results of operations.
Guidance on Nontraditional Mortgage Product Risks.On September 29, 2006, the federal financial regulatory agencies (the OCC, Federal Reserve, FDIC, OTS and NCUA) issued final guidance entitled the “Interagency Guidance on Nontraditional Mortgage Product Risks” (the Agencies and Guidance, respectively) to address the risks posed by residential mortgage products that allow borrowers to defer repayment of principal and sometimes interest. These nontraditional mortgage products allow for non-amortization of principal or negative amortization, and thus the Guidance applies to products such as those with “interest only” and “payment option” features. The purpose of the Guidance is to clarify how financial institutions and other lenders can offer these products in a safe and sound manner, and in a way that clearly discloses the risks that borrowers may assume. The Guidance imposes various underwriting standards, risk management requirements, disclosure obligations, and capital requirements. In mid-November, the Conference of State Bank Regulators (CSBR) and the Association of Residential Mortgage Regulators (AARMR) adopted guidance for managing the risks posed by nontraditional mortgage products and distributed it to all state regulators. The guidance issued by the CSBR and AARMR is substantially similar to the Agencies’ Guidance. As of the date of this publication, at least twenty-six (26) state regulators have adopted the CSBR and AARMR guidance. On March 2, 2007, the federal financial regulatory agencies issued the proposed “Statement on Subprime Lending” for a sixty day comment period. The proposed statement augments the Interagency Guidance on Non-Traditional Mortgage Product Risks and addresses four areas of concern: (i) adjustable rate mortgages, (ii) risk management practices, (iii) consumer protection principles, and (iv) control systems. The proposed statement notes that the relevant underwriting and consumer protection principles described in the Interagency Guidance applied to non-traditional mortgages should also be considered for adjustable rate mortgages, including underwriting at the fully indexed amortizing payment. Although these proposed guidelines only apply to financial institutions, it is expected that the CSBR will develop similar standards, and state banking regulators may adopt such standards as many have in the case of non-traditional mortgages. We are currently examining our policies and procedures with respect to our mortgage products in light of the guidance.
Security Breach Notification Legislation. Approximately thirty-five (35) states have passed laws requiring an entity, including a lender, to send notices to consumers in the event there is the unauthorized access of the entity’s computerized data that compromises the security, confidentiality, or integrity of the personal information maintained in such data regarding the consumers. Many states laws do not require immediate notification if law enforcement officials direct the entity to delay notification, or if a reasonable investigation determines that misuse of the information has not occurred and will not likely occur.
Security Freeze Legislation. At least twenty-six (26) states have passed laws allowing consumers to request the credit reporting agencies to place a “freeze” on their consumer reports restricting access if they have been or may be a victim of identity theft. Typically, the law requires the consumer reporting agency to provide the consumer with a unique personal identification number or password so that the consumer can provide that to creditors or others to whom they are authorizing access to their consumer report. The states’ laws vary with respect to the length the freeze remains in place and some contain additional restrictions and requirements.
Environmental Exposure
In the course of our business, we may foreclose and take title to residential properties and, if we take title, we could be subject to environmental liabilities with respect to these properties. From January 1, 2001 through December 31, 2006, we foreclosed on 0.54% of the loans we funded. In those circumstances, we may be held liable to a governmental entity or to third parties for property damage, personal injury, investigation or clean-up costs incurred by these parties in connection with environmental contamination, or we may be required to investigate or clean up hazardous or toxic substances or chemical releases at a property. The costs associated with investigation or remediation activities could exceed the value of the underlying properties.
23
Employees
As of December 31, 2006, we had approximately 1,000 employees. Of these employees, 326 were loan officers or account executives, 408 were operations staff, and 263 were employed in our home office. None of our employees are represented by a union or covered by a collective bargaining agreement. We believe that the compensation and benefits offered to our employees are competitive and that our relations with our employees are good.
Available Information
You may obtain, free of charge, on our web site,www.fieldstoneinvestment.com, a copy of this Form 10-K, our quarterly reports on Form 10-Q, current reports on Form 8-K, Section 16 reports and any amendments to those reports, as soon as reasonably practicable after we electronically file or furnish, as applicable, such reports with the SEC.
24
Executive Officers and Key Employees
Our executive officers and key employees as of March 1, 2007 are as follows:
Michael J. Sonnenfeld, 50, the founder of our company, has been our President and Chief Executive Officer and a director since November 2003. Since July 1995, he has served as President and a director of FMC. From 1994 to 1995, Mr. Sonnenfeld served as Director of the Residential Mortgage Conduit for Nomura Securities International, Inc. Prior to joining Nomura, Mr. Sonnenfeld was the President of Saxon Mortgage Funding Corporation, a subprime and jumbo mortgage originator and conduit, the President of Saxon Mortgage Capital Corporation, an investor in warehouse lines funded through the issuance of commercial paper, and Executive Vice President of Resource Mortgage Investment Corporation, a public REIT with a portfolio of mortgages, mortgage securities and mortgage derivative securities. Mr. Sonnenfeld received his J.D. degree from the University of Michigan Law School and received his B.A. and M.A. from The Johns Hopkins University.
Nayan V. Kisnadwala, 46, is our Executive Vice President—Chief Financial Officer. Mr. Kisnadwala began his career with us in February 2006. Prior to that time, he served as the Senior Executive Vice President and Chief Financial Officer of the Consumer Finance and Business Lending Division of MBNA, Inc., which included the mortgage business, from July 2004 until January 2006. Prior to his tenure at MBNA Inc., Mr. Kisnadwala held the position of Chief Financial Officer at American Express (i) in its Global Operations from February 2004 until June 2004, (ii) in its Japan/Asia Pacific/Australia region and then its Europe region for the Consumer Card and Financial Services Business from December 1999 until January 2004 and (iii) in its International Establishment Services Group from June 1998 until November 1999. Prior to these positions, he held positions in risk management and finance at Citicorp, Card Establishment Services and First Data from 1986 to 1998. Mr. Kisnadwala received a B. Com. in Accounting from Bombay University and an M.B.A. in Finance from New York University. He has also earned the professional designations of Chartered Accountant and CFA.
Walter P. Buczynski,58, is our Executive Vice President—Secondary. He has held this position since January 2003 and prior to that time he served as our Senior Vice President—Secondary Marketing. Prior to joining us in 2000, Mr. Buczynski served as the Chief Operating Officer of First Home Mortgage Corporation from December 1999 to August 2000. From 1997 to 1999, while serving as Senior Vice President, Mr. Buczynski directed the capital market activities of G.E. Capital Mortgage Services, Inc. From 1991 to 1997, Mr. Buczynski served as Executive Vice President of Secondary Marketing for Margaretten & Company, now known as Chase Manhattan Mortgage Corporation. Mr. Buczynski also has served as Chairman of The GNMA Liaison Committee and Vice Chairman of the Freddie Mac Liaison Committee of the Mortgage Bankers Association of America. Mr. Buczynski received his B.S. degree from Rutgers University.
John C. Kendall, 40, is our Executive Vice President—Investment Portfolio. He has served in this position since August 2006. From April 2004 to August 2006, he was Senior Vice President—Investment Portfolio. From July 1999 to April 2004, Mr. Kendall served as Director for Mason Street Advisors, a wholly owned investment management affiliate of The Northwestern Mutual Life Insurance Company, serving as a portfolio manager in the Structured Products Group dedicated to investment in asset-backed and mortgage-backed securities. Prior to joining Northwestern Mutual in 1999, he was an investment banker and structured finance specialist with several firms including Kidder Peabody/PaineWebber, from 1993 to 1996, Greenwich Capital Markets, from 1990 to 1993, and Prudential Securities, from 1988 to 1990. Mr. Kendall received a B.S. from Georgetown University School of Foreign Service majoring in International Economics and an M.M. from the J.L. Kellogg Graduate School of Management at Northwestern University majoring in Finance and Accounting.
John C. Camp, IV, 37, is our Senior Vice President—Chief Information Officer and has served in this position since March 2005. From June 1999 to March 2005, Mr. Camp served as Senior Vice President—Information Systems and Facilities. From May 1994 to May 1999, Mr. Camp served as an instructor and consultant for Chesapeake Computer Consultants and analyzed, developed and implemented various computer systems. From February 1996 to June 1998, Mr. Camp also served as co-owner of Bayserve Technologies Incorporated, where he directed the activities of the systems, facilities and marketing departments. Mr. Camp received his B.S. degree in Computer Science from the University of Maryland.
George D. Colclough, 39, is our Senior Vice President—Director of Portfolio Analytics. He has served in this position since joining us in October 2006. From February 2006 until joining us, Mr. Colclough was a manager in the Quantitative Services group of Deloitte & Touche USA, LLP. He served as a portfolio manager from September 2003 to December 2005 for Euclid Financial Group, Inc. as well as for Forward Capital, LLC from January 1999 to
25
November 2001. Prior to that, he worked as a quantitative analyst in the Fixed Income area for First Union Capital Markets Group from May 1994 to December 1998. Mr. Colclough received a B.S. in mathematics from The University of South Carolina and a masters in applied economics from The Johns Hopkins University.
Timothy B. Ferriter, 32, is our Senior Vice President—Decision Support. He has served in this position since he joined us in July 2006. Prior to joining us, Mr. Ferriter managed the Strategic Finance group for the Auto Finance unit of Wells Fargo & Company. From June 1999 until May 2002 and from July 2003 until March 2006, Mr. Ferriter held positions in various units of MBNA America Bank including the consumer lending and mortgage lending units and from February 2005 until March 2006 was Vice President, Business Financial Officer–Mortgage Lending & Aircraft Lending. Mr. Ferriter was also an Equity Research Associate within the Non-Bank Financials team at Legg Mason Wood Walker, Inc. from May 2002 until July 2003. Mr. Ferriter received a B.B.A. and M.S. in Finance from Loyola College and an M.B.A. in 2002 from the Robert H. Smith School of Business at the University of Maryland concentrating in Finance. He is also a CFA charterholder.
Andrew C. Goresh, 58, is our Senior Vice President—Human Resources. He has served in this position since joining us in October 2006. From 2001 until joining us, Mr. Goresh served as the Senior Vice President–Human Resources for NASD in Washington, D.C. and as Vice President–Human Resources at USA Floral Products, Inc. from 1999 to 2001. Mr. Goresh then spent a year as a human resources consultant for Chartwell Health Management. Prior to that, from 1985 to 1998 he held the position of managing director for T. Rowe Price Associates, Inc., responsible for human resources management, real estate, construction, office services and business process improvements. Mr. Goresh earned a B.A. from The Ohio State University and received his J.D. degree from Washington & Lee University School of Law.
Mark C. Krebs, 46, is our Senior Vice President—Treasurer. He has held this position since joining us in February 2004. From 2003 until joining us, Mr. Krebs was Senior Vice President and Treasurer of American Home Mortgage Investment Corp., a mortgage real estate investment trust. From 1986 to 2003, Mr. Krebs was Senior Vice President, Controller and Treasurer of Columbia National, Inc., a mortgage banking firm. From 1986 to 1994, Mr. Krebs was also Treasurer of Columbia Real Estate Investments, a mortgage real estate investment trust. Prior to that, Mr. Krebs was an auditor with KPMG LLP. He graduated from Towson University in 1982 and is a certified public accountant.
Teresa A. McDermott,45, is our Senior Vice President—Controller. Since February 2004, she has served as our Senior Vice President—Controller and served on an interim basis as our Principal Accounting Officer and Principal Financial Officer from October 2005 until February 2006. From January 2003 to February 2004, she held the position of Vice President and Controller, and from November 2001 to January 2003, she served as Assistant Vice President & Assistant Controller. Prior to joining us, Ms. McDermott served as Chief Financial Officer of PCLoans.com, the successor to Capital Mortgage Bankers, Inc., a national mortgage banking corporation, from 1985 to 1990 and from 1996 to 2001. Prior to PCLoans.com, Ms. McDermott managed the financial reporting and budgeting efforts for Signature Development, Inc. where she served as Senior Vice President and Controller from 1990 through 1996. She also worked as an Accounting Manager for Mercantile Mortgage Corporation. Ms. McDermott received her B.A. degree in Accounting from Loyola College and is a certified public accountant.
Gary K. Uchino, 58, is our Senior Vice President—Chief Credit Officer and has served in this position since May 1998. From December 1995 to May 1998, Mr. Uchino served as Vice President—Credit Manager. From 1993 to December 1995, Mr. Uchino was employed by TransAmerica Finance. From September 1980 to June 1993, Mr. Uchino was employed by Security Pacific Corporation where he served as Vice President of credit administration responsible for underwriting and credit policy. From May 1969 to September 1980, Mr. Uchino was employed by Associates Financial Services Company where he served as director of Associates Financial Services Company of Japan, KK responsible for establishing the operations of its Japan subsidiary. Mr. Uchino attended the University of Hawaii majoring in business administration.
The executive officers and key employees of our subsidiary, Fieldstone Mortgage, as of March 1, 2007, are as follows:
James T. Hagan, Jr., 57, is Executive Vice President—Production and has served in this position since February 2006. From October 2004 until February 2006, he was Executive Vice President—Non-Conforming Wholesale Division. From January 2003 to October 2004, he served as Executive Vice President—West Non-Conforming Division, and from August 1996 to January 2003, he was Senior Vice President—Sales. Prior to joining FMC in August 1996, Mr. Hagan served as Senior Vice President for Long Beach Mortgage Corporation where he developed
26
the prime lending division. In 1994, Mr. Hagan served as Divisional Vice President for American Residential Funding, directing the activities of its sub-prime division. From 1988 to 1994, Mr. Hagan served as Regional Vice President for American Residential Mortgage Corporation. Mr. Hagan received his undergraduate degree in Business Administration from Loyola University.
JD Abts, 44, is Senior Vice President—Retail and has served in this position since February 2005. From January 2003 to January 2005, he served as Regional Vice President—Northwest Retail Region and from September 1999 to January 2003, as Branch Manager for the same region. Prior to joining Fieldstone Mortgage, Mr. Abts worked with a number of mortgage originators and consumer finance companies in the western region of the U.S. Mr. Abts received his B.S. degree in Business Administration from Oregon State University.
John M. Camarena, 40, is Senior Vice President—Southwest Region and has served in this position since January 2003. From October 1996 to January 2003, he was Regional Vice President—Southwest. Prior to joining FMC in October 1996, Mr. Camarena founded Atlantic Pacific Bancorp, a sub-prime brokerage firm, where he served as General Manager. Prior to Atlantic Pacific, Mr. Camarena directed sub-prime production activities for American Residential Mortgage Corporation and originated sub-prime wholesale loans for Long Beach Financial Corporation. He received a B.A. from Colorado University.
Thomas M. Gillen, 44, is Senior Vice President—Secondary Marketing and has held this position since joining us in June 2005. Prior to joining Fieldstone Mortgage, Mr. Gillen served as Senior Vice President–Capital Markets for CoreStar Financial Group, LLC, a national mortgage banking company operating in the retail and wholesale markets, from January 2004 to June 2005. Prior to joining CoreStar, Mr. Gillen served as Administrative Vice President for M&T Bank from January 2003 to January 2004. He also served as Senior Vice President and Director of Risk Management—Secondary Marketing Officer for Columbia National, Inc., a mortgage banking firm from October 1994 to November 2002. Mr. Gillen received his B.S. degree from Duquesne University.
Peter G. Poidomani, 42, is Senior Vice President—Central Region and has served in this position since November 2005. From January 1998 to November 2005, he served as Regional Vice President—Central. Prior to joining Fieldstone Mortgage, Mr. Poidomani worked with a number of mortgage companies in various positions since 1989. Mr. Poidomani received his M.B.A. in Investment Management and his B.A. degree in Finance from Pace University – Lubin School of Business.
Teri A. Rapp, 46, is Senior Vice President—Operations and has held this position since February 2006. From October 2004 to February 2006, she was Senior Vice President—Non-Conforming Wholesale Division Operations. From January 2003 to October 2004, she served as Senior Vice President—West Non-Conforming Division Operations, and from December 1995 to January 2003, she was Vice President—Operations. Prior to joining FMC in December 1995, Ms. Rapp served as Assistant Vice President, Sales Manager with Ford Consumer Finance, where she directed the company’s district credit and sales efforts from 1993 to 1995. Prior to Ford Consumer Finance, Ms. Rapp served as Compliance Manager for Home Loan Funding, Incorporated. From 1978 to 1990, Ms. Rapp served as Assistant Vice President and Operations and Compliance Manager for Wells Fargo Bank. Ms. Rapp attended Diablo Valley College.
H. Joshua Rytz, 34, is Senior Vice President—Los Angeles Region and has served in this position since November 2005. From January 2003 to November 2005, he served as Regional Vice President—LA Region. From January 2000 to December 2002, he served as Production Manager—Wholesale. Mr. Rytz received his B.S. degree from Grand Valley State University.
Edmund J. Stush, 54, is Senior Vice President—West Region and has served in this position since November 2005. From January 2003 to November 2005, he served as Regional Vice President—West. From January 1997 to December 2002, he served as Production Manager—Wholesale. Prior to joining Fieldstone Mortgage, Mr. Stush served as Production Supervisor for First Colony Financial Group from February 1996 to January 1997. He also served as district manager for Ford Consumer Finance Company from November 1990 to February 1996. Mr. Stush received his B.S. degree in Business Management from Gannon University.
27
Investing in our securities involves a high degree of risk. In addition to the other information contained in this report, you should consider the following risk factors before investing in our securities.
Risks Relating to Our Pending Merger with C-BASS
We are subject to business uncertainties and contractual restrictions while our merger with C-BASS is pending.
On February 15, 2007, we entered into a definitive merger agreement, which was subsequently amended on March 16, 2007 with Credit-Based Asset Servicing and Securitization LLC, a Delaware limited liability company (C-BASS), and Rock Acquisition Corp., a Maryland corporation and wholly owned subsidiary of C-BASS. The merger agreement, as amended, provides that, upon the terms and subject to the conditions set forth in the merger agreement, Rock Acquisition Corp. will be merged with and into Fieldstone, with Fieldstone continuing as the surviving corporation and a wholly owned subsidiary of C-BASS.
Uncertainty about the effect of our pending merger with C-BASS on our business operations and employees may have an adverse effect on us. These uncertainties may impair our ability to retain and motivate key personnel until the merger is completed, and could cause our lenders and others that deal with us to defer decisions regarding business relationships with us or other decisions concerning us, or to seek to change existing business relationships with us. If key employees depart because of uncertainty about their future roles with C-BASS,our ability to continue to execute our business and strategic plans could be adversely affected. In addition, the merger agreement generally restricts us, until the merger occurs, from taking actions outside of the ordinary course of business, without the consent of C-BASS. These restrictions could adversely affect our ability to pursue key aspects of our strategic plans prior to the completion of the merger.
Failure to complete the merger with C-BASS could negatively affect our stock price and our future business and financial prospects.
There is no assurance that we will receive all regulatory and contractual consents required to complete our proposed merger with C-BASS, or that we will satisfy the other conditions to the completion of the merger, including retaining key personnel and the condition that no event or circumstance occur that has had, or is reasonably expected to have, a material adverse change on our Company. If the merger is not completed for any reason, we will be subject to several risks, including the following:
| | · | | The current market price of our common stock may reflect a market assumption that the merger is likely to occur, and a failure to complete the merger would likely result in a decline in the market price of our common stock; |
| | · | | Many costs relating to the merger (such as legal, accounting, and a portion of our financial advisory fees) are payable by us if the merger is not completed; |
| | · | | Efforts required under the merger agreement and other pre-closing activities and obligations require substantial commitments of time and resources by our management and employees, which could limit the time and effort available to pursue other business activities that may be important to our operations; and |
| | · | | We would continue to face the risks that we currently face as an independent company in executing our growth and strategic plans, as further described herein. |
If the merger is not completed, the risks described above may occur and materially adversely affect our business, financial results, financial condition, and stock price.
28
The merger agreement limits our ability to pursue alternatives to this merger.
Under the terms of our merger agreement with C-BASS, as amended we are generally precluded from encouraging or participating in any discussions that could lead to an alternative transaction to this merger. Similarly, our Board of Directors is restricted in its ability to withdraw or modify its recommendation that our stockholders approve the merger agreement. In certain circumstances, our Board of Directors may be permitted to terminate the merger agreement and pursue a proposal that it deems to be superior. In those circumstances, we would be required to pay C-BASS a termination fee of $7.4 million.
The effect of these provisions could be to discourage or prevent a party interested in a possible acquisition of our company from pursuing an offer to acquire us.
Risks Related to Our Business
We have a limited operating history with building and managing an investment portfolio of non-conforming mortgage loans held for investment, which limits your ability to evaluate a key component of our business strategy and our growth prospects and increases your investment risk.
In August 2003, we began implementing our portfolio strategy of retaining a substantial portion of the non-conforming loans that we originate. Our portfolio is financed by issuing mortgage-backed securities secured by these loans. For the years ended December 31, 2005 and 2006, we retained 47% of the non-conforming loans we originated during each of those periods. As of December 31, 2006, we had surpassed our portfolio leverage target of approximately 13:1, and accordingly we expect to classify a larger percentage of future originations as held for sale. Loans will only be classified as held for investment to the extent necessary to offset loans currently in the portfolio that are being repaid as we strive to maintain our current leverage, unless we change our targeted leverage or raise additional equity. As we have only been managing our investment portfolio for a little over three years and many of our securitizations have not yet matured, there is limited past performance data upon which to evaluate our business strategy and growth prospects, thus increasing your investment risk.
Our ability to complete securitizations in the future depends in part upon the past performance of our investment pools, which due to our limited history, limits your ability to evaluate our business strategy making your investment risky.
Our ability to complete securitizations in the future will depend upon a number of factors, including the experience and ability of our management team, conditions in the securities markets generally, conditions in the mortgage-backed securities market specifically, and the performance of our portfolio of securitized loans. A lack of investor confidence in the subprime mortgage market or the poor performance of any pool of loans that we securitize could increase the cost of any of our subsequent securitizations. If we are unable to efficiently securitize the loans in our portfolio, then our net revenues from these investments could decline, which would lower our earnings for the time the loans remain in our portfolio. We cannot assure you that we will be able to complete loan securitizations in the future on favorable terms, or at all.
We have recently imposed stricter mortgage loan and borrower requirements, which may result in a decrease in our mortgage loan origination and purchase volumes and, consequently, our loan sale and securitization volumes.
As a result of less favorable economic conditions and an increase in the number of fraudulently obtained loan and borrower defaults, we have tightened our mortgage loan lending and purchase requirements and the processes we undergo to document loans. There may be fewer borrowers and loans that qualify under these revised standards, and we may face increased competition from lenders and loan purchasers with less rigorous standards. As a result, our loan origination and purchase volumes may decline. A decline in our loan origination or purchase volumes would decrease the volume of assets available to us for sale or securitization, which could adversely affect our results of operations and financial condition.
29
We are subject to liquidity risks arising from our dependence upon financing facilities and securitizations and our status as a REIT.
Liquidity risks associated with credit facilities.
Pending sale or securitization of a pool of mortgage loans, we will finance mortgage loans that we originate through borrowings under our warehouse lines and repurchase facilities. We also finance the securities we retain in our securitizations through repurchase facilities. It is possible that our lenders could experience changes in their ability to advance funds to us, independent of our performance or the performance of our loans. In October 1998, the subprime industry faced a liquidity crisis with respect to the availability of short term financing and the availability of prospective investors in securitizations. In the later part of 2006 and the first quarter of 2007, the subprime industry has experienced rising delinquencies and losses, causing some participants to declare bankruptcy or exit the market. These events have put stress on lenders of short-term financing and investors in securitizations, giving rise to another liquidity crisis which could affect our ability to access short-term financing or execute securitizations, which would adversely affect our operations. In addition, if the regulatory capital requirements imposed on our lenders change, our lenders may be required to increase significantly the cost of the lines of credit that they provide to us. Our repurchase facilities are dependent on our counterparties’ ability to re-sell loans or securities originated by us to third parties. If there is a disruption of the repurchase market generally, or if one of our counterparties is itself unable to access the repurchase market, our access to this source of liquidity could be materially adversely affected.
We finance substantially all of our loans and retained securities through seven repurchase facilities. Each of these facilities is cancelable by the lender for cause at any time. As of December 31, 2006, the maximum available outstanding balance under these facilities was $2.65 billion.
On January 26, 2007 and January 31, 2007, we completed amendments to a number of our warehouse line of credit agreements. Upon completing the amendments on January 31, 2007, our committed level of whole loan funding capacity was $1.85 billion, with an additional $400 million available to to finance our retained securities, of which we hold $308 million as of December 31, 2006.
The initial term of each facility is generally 364 days or less (with the exception of our repurchase facilities secured by our retained securities which are open indefinitely but may be terminated by either party upon proper notice) and the facilities mature at various times during the year. We cannot provide any assurances that we will be able to extend these existing facilities on favorable terms, or at all. If we are not able to renew any of these credit facilities or arrange for new financing on terms acceptable to us, or if we default or are otherwise unable to access funds under any of these facilities, we may not be able to originate new loans or continue to fund our operations.
Cash could be required to meet margin calls under the terms of our borrowings in the event that there is a decline in the market value of the loans or retained securities that collateralize our debt, the terms of short-term debt become less attractive, or for other reasons. In the fourth quarter of 2006 and during the first quarter of 2007, we have received margin calls on our loans collateralizing our debt. If we are required to meet significant margin calls, we may not be able to fund such calls, originate new loans or continue to fund our operations. Any of these events could have a material adverse effect on our financial condition, liquidity, and results of operations.
Liquidity risks associated with credit enhancements provided in connection with our securitizations.
In connection with our securitizations, we include credit enhancement for a portion of the mortgage-backed securities that we issue called “senior securities.” The credit enhancement for the senior securities comes primarily from one or more of the following: excess interest and over-collateralization, which may include interest rate swap agreements, designating another portion of the securities we issue as “subordinate securities” (on which the credit risk from the loans is concentrated), cross collateralization, or purchasing financial guaranty insurance policies for the loans. If the performance of the loans pledged to collateralize the mortgage-backed securities is worse than the thresholds set forth in the securitization documents, then the excess interest we would otherwise receive will be used to build over-collateralization to provide additional credit enhancement for the outstanding senior securities reducing the excess interest we receive from the investment pool. In addition, some of the mortgage-backed securities that we have issued and intend to issue in the future to finance our portfolio of loans require, or will require, in the early years after issuance of the mortgage-backed securities that we “lock out” cash flows and receive less than our pro-rata share of cash flows from principal payments. As a result of this, the excess interest we receive may be delayed or reduced, which could materially affect our net income.
30
The market for subordinate securities could become temporarily illiquid or trade at steep discounts, thereby reducing the cash flow we receive over time from the loans securing our mortgage-backed securities. If we purchase financial guaranty insurance policies and the expense of these insurance policies increases, our net income will be reduced as the cost of borrowing increases. While we have used these senior and subordinated credit enhancement features in connection with our previous securitizations, we cannot assure you that these features will be available at costs that would allow us to achieve our desired level of net income from future securitizations.
If prepayments on the loans securitizing any of our mortgage-backed securities slow or our credit quality deteriorates, cash flow that we might otherwise receive in connection with the mortgage-backed securities might be delayed significantly or reduced to cover credit losses.
Liquidity risks associated with our REIT status.
If our minimum distribution required to maintain our REIT status exceeds our cash available for distribution, because our income for tax purposes exceeded our cash flow from operations, we could be forced to borrow funds, sell assets or raise capital on unfavorable terms in order to maintain our REIT status. Additionally, negative cash flow could threaten our continued ability to satisfy the income and assets tests necessary to maintain our status as a REIT or our solvency. See the Tax Risks section.
Dividends distributed to date have exceeded our operating cash flows, and we have used cash and available liquidity, including increased borrowings under our warehouse lines, to pay the dividends required to maintain our REIT status.
Liquidity risks associated with the change in our business strategy.
In August 2003, we began to retain a portion of our non-conforming loans to build a portfolio of non-conforming mortgages and issue mortgage-backed securities, rather than selling these loans for a gain shortly after origination. As indicated above, some of the mortgage-backed securities that we have issued and expect to issue in the future may require that any excess interest from the mortgages that we would otherwise receive be held as over-collateralization reserves to provide additional credit enhancements if the performance of the mortgage-backed securities is worse than certain agreed upon thresholds limiting the excess interest we receive from our securitizations. For some period of time our portfolio of securitized loans may not generate sufficient net interest income to cover our operating expenses, and in this event we will use cash and unborrowed collateral, which totaled approximately $122 million as of December 31, 2006, as we continue to originate new loans for our portfolio. This amount is comprised of the proceeds remaining from the 144A Offering and retained earnings. If we have fully invested all of our cash and unborrowed collateral prior to our portfolio generating sufficient cash for us to fund our operations, if it ever does, then we will need to sell additional shares of capital stock or debt securities to generate additional working capital or, if we are unable to sell additional securities on reasonable terms or at all, we will need to either reduce our origination business or sell a higher portion of our loans. If we sell our loans rather than put them into our investment portfolio, then we will reduce the rate at which we increase our portfolio and we will owe taxes relative to any gains we achieve by selling our loans. In the event that our liquidity needs exceed our available capital, we may need to sell assets at an inopportune time, which may result in a reduction in our earnings.
We may be required to repurchase mortgage loans that we have sold, or repurchase or substitute loans that have been securitized, which could significantly reduce our cash flow, affect our liquidity, and reduce our net income.
When we sell or securitize a loan we make certain representations, warranties and covenants regarding certain characteristics of the loans, the borrowers and the underlying properties, including, without limitation, that:
| | · | | we will deliver all required documentation within the applicable time period for delivery; |
| | · | | we will repurchase the loan in the event of an early payment default (generally defined as a default of the first payment after sale or default of two of the first four payments after sale); and |
| | · | | the borrower’s credit documents submitted for loan underwriting were not falsified, contained no untrue statement of material fact and did not omit any statement of a material fact. |
If we are found to have breached any of our representations or warranties, we may be required to repurchase those loans or, in the case of securitized loans, replace them with substitute loans or cash. If this occurs, we may have
31
to bear any associated losses directly. In addition, in the case of loans that we sold, we may be required to indemnify the purchasers of the loans for losses or expenses incurred as a result of a breach of a representation or warranty. Repurchased loans typically require a significant allocation of capital to carry on our books, and our ability to borrow against these loans is limited. Repurchase requests increased significantly in 2006 due to deteriorating loan performance associated with slowing home price appreciation and rising consumer debt. Any significant repurchases or indemnification payments we make could significantly reduce our cash flow, adversely affect our liquidity, and reduce our net income. See Item 1 Business-Regulatory Compliance, Quality Control and Licensing-Regulatory Compliance.
More recently, the federal regulators have issued similar standards on adjustable rate mortgages. Although these standards, which raise the same concerns described above, are only in the comment phase, if they are adopted by the federal and state regulators, we could experience a decline in origination volume, which could adversely affect our results of operations, liquidity, and financial condition.
We could be harmed if we are forced to sell a greater percentage of our loans at a discount or if we are unable to sell some loans at all.
The proceeds that we receive from whole loan sales in the secondary market are reduced when we are forced to sell loans at a discount, typically due to defects in the documentation of the loans, credit quality of the underlying borrowers, or prevailing market conditions. In recent months, buyers of whole loans have become more cautious about purchasing loans and have been increasingly attentive to loan documentation in their pre-purchase due diligence reviews. Thus, we have increasingly had to sell these loans at discounted prices and the discount amounts have become more severe. Additionally, we may incur greater expenses in marketing and selling these loans and, during that time, we are faced with the market and interest-rate risks with respect to the loans. Furthermore, there has been an increase in the number of loans we have had to repurchase from buyers pursuant to the terms of the sales agreements, including due to early payment defaults due to the current economic conditions. We expect that the trend of selling more of our mortgage loans in whole loan sales, rather than adding the loans to our REIT portfolio, will continue in the near term. Also, if we are unable to find buyers, we will need to retain the loans and find alternative financing, as our repurchase facilities only allow for the short-term financing of these loans. Accordingly, if these trends of reduced prices and increased discounts in our whole loan sales and increased repurchases of previously-sold loans continue, or if we can no longer find buyers to purchase our loans, our liquidity position, results of operations, financial condition and business prospects could be harmed.
Characteristics of the non-conforming mortgage loans we originate and of our portfolio of mortgage loans expose us to a higher risk of default on these loans.
Our primary business is the origination, sale and securitization of non-conforming mortgage loans. Non-conforming, or subprime, mortgage loans generally have higher delinquency and default rates than conforming, or “prime,” mortgage loans. Delinquency interrupts the flow of projected interest income from a mortgage loan and default can ultimately lead to a loss if the net realizable value of the real property securing the mortgage loan is insufficient to cover the principal and interest due on the loan. Also, our cost of financing a delinquent or defaulted loan is generally higher than for a performing loan. We bear the risk of delinquency and default on loans beginning when we originate them until we sell them and we continue to bear the risk of delinquency and default after we securitize loans or sell loans with a retained interest. Loans that become delinquent prior to sale or securitization may become unsaleable or saleable only at a discount, and the longer we hold loans prior to sale or securitization, the greater the chance we will bear the costs associated with the loans’ delinquency. Factors that may increase the time held prior to sale or securitization include the time required to accumulate loans for securitizations or sales of large pools of loans, the amount and timing of third party due diligence in connection with sales or securitizations, and defects in the loans.
We attempt to manage these risks with risk-based mortgage loan pricing and appropriate underwriting policies. However, if such policies are insufficient to control our delinquency and default risks and do not result in appropriate loan pricing, our business, financial condition, liquidity and results of operations could be significantly harmed.
In addition, our portfolio consists almost entirely of adjustable-rate mortgage (ARM) loans, the payments on which are adjustable from time to time as interest rates change, generally after an initial two-year period during which the loans’ interest rates are fixed and do not change. After the initial fixed rate period, the borrowers’ payments on our ARM loans generally adjust once every six months to a pre-determined margin over a measure of market interest rates, generally the LIBOR for one-month deposits. As of December 31, 2006, approximately 51% of our loans held for investment contain ARM loans which also have an “interest only” feature for the first five years of the loan, so that the borrowers do not begin to re-pay the principal balance of the loans until after the fifth year of the loans. After the fifth year, the borrowers’ payments increase to amortize the entire principal balance owed over the remaining years of the loan.
32
These features will likely result in the borrowers’ payments increasing in the future. The interest adjustment feature generally will result in an increased payment after the second year of the loan and the interest only feature will result in an increased payment after the fifth year of the loan. Since these features will increase the debt service requirements of our borrowers, it may increase our risk of default in our investment portfolio for loans that remain in our portfolio for at least two years (relative to the ARM feature) or for five years (relative to the interest only feature).
Our efforts to manage credit risk may not be successful in limiting delinquencies and defaults in underlying loans and, as a result, our results of operations may be affected.
There are many aspects of credit that we cannot control and our quality control and loss mitigation operations may not be successful in limiting future delinquencies, defaults and losses. Our comprehensive underwriting process may not be effective in mitigating our risk of loss on the underlying loans. Further, the value of the homes collateralizing residential loans may decline due to a variety of reasons beyond our control, such as weak economic conditions, natural disasters, over-leveraging of the borrower, and reduction in personal incomes. The frequency of defaults and the loss severity on loans upon default may be greater than we anticipated. Interest-only loans, adjustable-rate loans, reduced documentation loans, subprime loans, and second lien loans may involve higher than expected delinquencies and defaults. Changes in consumer behavior, bankruptcy laws, and other laws may exacerbate loan losses. Expanded loss mitigation efforts in the event that defaults increase could increase our operating costs. To the extent that unforeseen or uncontrollable events increase loan delinquencies and defaults, our results of operations may be adversely affected.
Changes in prepayment rates for our mortgage loans have adversely affected our net interest income and results of operations and may continue to do so for the foreseeable future.
The rate and timing of unscheduled payments and collections of principal on our loans is impossible to predict accurately and will be affected by a variety of factors, including, without limitation, the level of prevailing interest rates, refinancing incentives that are a function of home value changes, restrictions on voluntary prepayments contained in the loans, the availability of lender credit and other economic, demographic, geographic, tax and legal factors. In general, however, if prevailing interest rates fall significantly below the interest rate on a loan, the borrower is more likely to prepay the higher rate loan than if prevailing rates remain at or above the interest rate on the loan. Unscheduled principal prepayments are permitted under all of our loans. Our results of operations could be reduced to the extent that we are unable to reinvest the funds we receive from unscheduled principal prepayments at an equivalent or higher rate, if at all. In addition, a large amount of prepayments, especially prepayments on loans with interest rates that are high relative to the rest of the loan portfolio, will likely decrease the net interest income we receive from the portfolio. Also, elevated prepayment levels will cause the amortization of deferred origination and deferred issuance costs to increase and reduce net interest income. Also, in periods of rising interest rates, prepayments on loans may decrease; in which case, we would not have the prepayment proceeds available to invest in assets with higher yields, which may also adversely affect our results of operations.
Our ability to generate net interest income from our securitized loans is dependent upon the success of our portfolio-based model of securitizations, which is subject to several risks.
The success of our portfolio-based model of securitizations is subject to the effects of fluctuations in interest rates and loan defaults.
We earn a substantial portion of our earnings and cash flow from the non-conforming loans we originate and securitize, primarily through net interest income. A substantial portion of the net interest income generated by our securitized loans is based upon the difference between the weighted average interest earned on the mortgage loans held in our portfolio and the interest payable to holders of the mortgage-backed securities. The interest expense on the mortgage-backed securities is typically adjusted monthly relative to market interest rates. Because the interest expense associated with the mortgage-backed securities typically adjusts faster than the interest income from the mortgage loans, our net interest income can be volatile in response to changes in interest rates. For example, recent increases in interest rates has increased the interest expense on our bonds without offsetting increases in the interest income from the underlying loans, which are predominately fixed-rate loans for an initial 24 month period, decreasing the excess interest we receive from the securitized pools. Also, the recent trend of increasing delinquencies on our securitized pools has decreased the net interest income and cash flow we receive from our securitizations. As a result of these recent trends, our cash flow has been significantly reduced, and could limit our ability to make distributions to you.
33
We are subject to the risk of margin calls while our loans held for investment or retained securities are financed with short term borrowings, and we are obligated to repay the full amount of our debt under our short term borrowings regardless of the value of the mortgage loans or retained securities collateralizing the debt.
Our portfolio-based model is based on our expectation that the interest income we receive from the loans in the portfolio will exceed the interest expense of the debt we incur for financing those loans. However, we are required to repay our portfolio debt regardless of the loans’ performance, which means that our portfolio income is at risk for the expense of repaying our debt as well as for the performance of the loans. This is true both for the short-term debt we incur to finance loans held for investment prior to securitization or our retained securities and for the securitization debt that we incur as long-term financing of our loans held for investment. We are subject to two risks while our loans held for investment and retained securities are financed with short term borrowings that we are not subject to relative to our securitization debt: first, we may be required to make additional payments to our lenders (known as margin calls) relative to our short term financing if the lenders determine that the market value of the mortgage loans or retained securities they hold as collateral has declined, which could happen at any time as a result of market factors, such as increased risk premiums required by investors, increased forecasts of losses on loans, lack of demand for loans or increases in market interest rates; and second, we are obligated to repay the full amount of our debt under our short term borrowings regardless of the value of the mortgage loans or retained securities collateralizing the debt. If we receive a margin call or if we are required to repay our debt under our short-term borrowings prior to securitizing the loans, our cash flows and results of operations may be materially adversely affected. In the fourth quarter of 2006 and during the first quarter of 2007, we have received margin calls on our loans collateralizing our short-term borrowings. Our securitization debt is long-term structured debt on which we never have margin calls and are at risk only for the amount we have invested in the loans, which exceeds the securitization debt.
Credit enhancement requirements may reduce, delay or eliminate our net interest income.
As a relatively new issuer of mortgage-backed securities, we may be required to provide higher levels of credit enhancement on our initial securitizations than more seasoned issuers, which may raise our cost of funds or delay our receipt of net interest income from our securitizations. Even after we have established ourselves as an issuer of mortgage-backed securities, if any of our loan pools fail to perform, our credit enhancement expenses likely will increase. The nature and level of credit enhancement required to achieve specified ratings for a securitization transaction are established in negotiations and discussions among the issuer, underwriter and rating agencies and are based, in significant measure, on the loan characteristics of the securitized pool. To date, we have securitized thirteen separate pools of residential mortgage loans. Our securitizations have been structured to achieve AAA ratings for the most senior classes of issued securities. To achieve those ratings, our securitization transactions have included credit enhancement in the form of structural subordination, over-collateralization and the allocation of excess cash flow to cover pool losses. We have retained the most subordinated interest in each securitized pool. Our securitization transactions generally require an initial credit enhancement percentage of approximately 3.37% of the transaction to support BBB ratings for the most junior classes of securities issued. After the initial 36 months, the required credit enhancement percentage may be reduced in accordance with a prescribed formula, subject to the satisfaction of certain pool performance criteria. Specifically, any reduction in the credit enhancement percentage is conditioned upon satisfaction of certain pool loss and delinquency levels criteria, sometimes referred to as triggers. The loss triggers for our outstanding securitizations require that the credit enhancement percentage not be reduced if pool losses exceed certain percentages, which increase over the life of the pool.
The delinquency triggers for our outstanding transactions require that all principal receipts on the mortgage loans be allocated to senior classes of securities if the percentage of pool mortgage loans that are 60 days or more delinquent represents more than approximately 34% to 41%, depending on the transaction, of the senior credit enhancement percentage available to such senior classes.
As the holder of the ownership certificate and some of the lower rated bonds issued in our securitized pools, we are entitled to distributions from the securitization trusts only to the extent that amounts received in respect of the securitized mortgage loans are not allocated to the payment of any related outstanding class of securities in the case of the ownership certificate and to the more senior classes of bonds in the case of our retained securities. Therefore, the recent trends of increased credit enhancement provisions due to deteriorating loan performance and increased credit losses and delinquencies due to flattening home price appreciation and higher consumer debt have delayed, and could reduce or eliminate, the amounts available for distribution to us from our securitized pools.
34
We may not succeed in developing a portfolio-based model of securitizations.
We expect to rely upon our ability to securitize our non-conforming loans to generate cash proceeds for repayment of our warehouse lines and repurchase facilities and to originate additional mortgage loans. We cannot assure you, however, that we will be successful in securitizing a substantial portion of the non-conforming loans that we accumulate. In the event that it is not possible or economical for us to complete the securitization of a substantial portion of our non-conforming loans, we may continue to hold these loans and bear the risks of interest rate changes and loan defaults and delinquencies, and we may exceed our capacity under our warehouse lines and repurchase facilities and be unable or limited in our ability to originate future mortgage loans. If we determine that we should sell all or part of our non-conforming loans initially funded in our investment portfolio rather than securitizing them, there could be a significant reduction in our net income and stockholder distributions because of the potential application of a 100% tax on gain derived from the sale of loans if such loans are considered not to be held for investment pursuant to the rules governing REITs.
The senior securities that we issue in connection with our securitizations have various ratings and are priced at a fixed rate or at a spread over an identified benchmark rate, such as the yield on United States Treasury bonds, interest rate swaps, or the LIBOR. If the spread that investors demand over the benchmark rate widens and the rates we charge on our non-conforming loans are not commensurately increased, we may experience a decrease in the net interest income from any additional securitizations and therefore experience a reduction in the economic value of the pool of loans in our portfolio.
Recent increases and fluctuations in interest rates have adversely affected our earnings and may limit or eliminate our ability to borrow under our credit facilities and to originate mortgages.
Rising interest rates have affected our ability to originate loans, affected the value of the loans we have originated prior to the time of the change in interest rates, inhibited our ability to securitize our loans, and diminished the value of our retained interests in loan pools, and may continue to do so for the foreseeable future. Because the interest payable on the mortgage-backed securities issued in our securitizations generally adjusts monthly and is based on shorter term floating interest rates, and the interest income we receive from our securitized loans generally is either fixed, adjusts less frequently than monthly or is subject to caps on the rates the borrowers pay, the net interest income generated by our securitized mortgages has decreased in periods of rising interest rates. In addition, when interest rates rise, the variable interest rates that we pay to finance our operations may rise above the interest we collect on our loans.
Fluctuations in interest rates may also affect our profitability in other ways, including the following:
| | • | | lower interest rates may cause prepayments to increase, reducing our net interest income over time from our securitized loans; |
| | • | | higher interest rates may continue to reduce overall demand for mortgage loans, and accordingly reduce our origination of new loans; |
| | • | | increases in short-term or long-term interest rates may continue to reduce the value of loans on our consolidated statement of condition; and |
| | • | | decreases in short-term interest rates will result in a non-cash charge being recognized for income reporting to reflect the mark to market values of the interest rate derivatives hedging the variable rate debt financing our held for investment portfolio. |
In addition, the amount available to us under our credit facilities depends in large part on the lender’s valuation of the mortgage loans or retained securities that secure the facilities. Each credit facility provides the lender the right, under certain circumstances, to re-evaluate the loan collateral or retained securities that secures our outstanding borrowings at any time. In the event the lender determines that the value of the collateral has decreased, it has the right to initiate a margin call. A margin call would require us to provide the lender with additional collateral or to repay a portion of the outstanding borrowings at a time when we may not have a sufficient inventory of loans, retained securities or cash to satisfy the margin call. Accordingly, any failure by us to meet a margin call could cause us to default on our credit facilities and limit or eliminate our ability to borrow and to originate mortgages, which would materially adversely affect our financial condition, liquidity, and results of operations.
35
Our hedging strategies may not be successful in mitigating our risks associated with changes in interest rates.
We use various derivative financial instruments to provide a level of protection against interest rate risks, but no hedging strategy can protect us completely. When interest rates change, we expect the gain or loss on derivatives to be offset by a related but inverse change in the value of loans held for sale. We cannot assure you, however, that our use of derivatives will fully offset the risks related to changes in interest rates. There have been periods, and it is likely that there will be periods in the future, during which we will recognize losses on our derivative financial instruments under required accounting rules that will not be fully offset by gains we recognize on loans held for sale or loans held for investment. The derivative financial instruments that we select may not have the effect of reducing our price risk on our loans, including our interest rate risk. In addition, the nature and timing of hedging transactions may influence the effectiveness of these strategies. Poorly designed strategies, improperly executed transactions or unanticipated market fluctuations could actually increase our risk and losses. In addition, hedging strategies involve transaction and other costs. We cannot assure you that our hedging strategy and the derivatives that we use will adequately offset the risk of interest rate volatility or that our hedging transactions will not result in losses.
Furthermore, we cannot assure you that the period in which the income or expense from the hedging transaction is recognized in our earnings will coincide with the period or periods in which the income or expense from the item we are economically hedging will be recognized in our earnings because we are marking to market our interest rate derivatives economically hedging our variable rate debt through earnings each period. These derivatives are structured to limit the volatility of our current period interest expense due to changes in interest rates over the fixed interest rate period of our loans. The fair market value of the derivatives will incorporate the market’s expected level of interest rates in these future periods. Accordingly, the mark to market of the derivatives through the income statement will bring the market’s expectation about changes in interest rates in the future into current period earnings. As has happened during 2006, it is possible that there will be future periods during which we will recognize non-cash losses on derivative transactions that may result in us reporting a net loss for the period. As a result, without cash flow hedge accounting, our reported earnings will be subject to greater volatility.
Competition in the securitization market may negatively affect our net income.
There is significant competition to originate loans and to sponsor securitizations of the type we focus on from Wall Street broker-dealers, mortgage REITs, investment management companies, and other financial institutions. Over the past year, the industry has seen a number of acquisitions of subprime lenders by large Wall Street broker dealers. The intense competition could reduce our ability to originate mortgage loans at favorable margins as well as erode our securitization margins if we have to pay a higher price for the long-term funding of these assets. To the extent that our origination volumes decline as a result of the competition we face or our securitization margins erode, our results of operations, financial condition and business prospects will be negatively impacted.
Our credit facilities contain covenants that restrict our operations and any default under these credit facilities may inhibit our ability to originate mortgage loans.
Our existing credit facilities generally contain extensive restrictions and covenants and require us to maintain or satisfy specified financial ratios and tests, including among other things, minimum levels of consolidated tangible net worth, liquidity and profitability, maximum ratio of indebtedness to consolidated adjusted tangible net worth and maintenance of asset quality and portfolio performance tests. Failure to meet or satisfy any of these covenants, financial ratios or financial tests could result in an event of default under these agreements. These agreements are secured by our loans prior to sale or securitization, or our retained securities, and also contain cross-default provisions, so that an event of default under any agreement may trigger an event of default under other agreements, giving the lenders the right to declare all amounts outstanding under their particular credit agreement to be immediately due and payable, to enforce their rights by foreclosing on collateral pledged under these agreements and to restrict our ability to make additional borrowings under these agreements. In the event that we were unable to obtain alternative financing, the inability to borrow under these facilities would leave us unable to originate new mortgage loans.
Our credit facilities also restrict our ability to, among other things:
| | • | | acquire all or substantially all of the assets or ownership interests of another entity; and |
36
| | • | | engage in mergers or consolidations. |
These restrictions may interfere with our ability to obtain financing or to engage in other business activities.
In December 2006 and January 2007, we amended many of our credit facilities. These amendments included waivers to certain profitability covenants and reduced the required tangible net worth under the covenant. Given the state of the market, we may need additional waivers or amendments to remain in compliance with our facilities. To the extent that these waivers or amendments are not received, our liquidity and operations may be adversely affected.
If we do not receive the payments from the loans that we anticipate, our revenues may be insufficient to cover our costs to originate, the interest expense and the losses on these loans, as well as the repayment of principal on the securitization used to finance these loans.
We estimate the future payments that we will receive from our loans based on a variety of assumptions, including delinquency rates and loss severities. If we do not receive the payments from the loans that we have anticipated, our revenues may be insufficient to cover our costs to originate, the interest expense and losses on these loans, as well as the repayment of principal on the securitization, used to finance these loans. The greater the difference between our assumptions and actual performance proves to be, the greater the effect will be on our earnings, the interest rates and over-collateralization levels of our mortgage-backed securities, the timing and receipt of our future revenues, the value of the residual interests held on our statement of condition and our cash flow.
Our non-conforming loans are underwritten to non-conforming underwriting standards, which may result in losses or shortfalls on our mortgage-backed securities.
We underwrite all of our non-conforming, or subprime, loans in accordance with our non-conforming credit underwriting standards. A non-conforming mortgage loan is a mortgage loan which is ineligible for purchase by Fannie Mae or Freddie Mac due to either loan size, credit characteristics of the borrower or documentation standards in connection with the underwriting of the borrower’s income. The credit characteristics that cause a loan to be ineligible include those where there is a relatively higher level of debt service carried by the borrower, higher LTV, and loans to borrowers who may have a record of credit write-offs, outstanding judgments, prior bankruptcies and other credit items that do not satisfy the Fannie Mae or Freddie Mac underwriting guidelines. Documentation standards that are not eligible may include borrowers who provide limited or no documentation of their income in connection with the underwriting of the related mortgage loan. Accordingly, mortgage loans underwritten under our non-conforming credit underwriting standards are likely to experience rates of delinquency, foreclosure and loss that are higher, and may be substantially higher, than mortgage loans originated in accordance with Fannie Mae or Freddie Mac underwriting guidelines. We cannot provide assurance that our underwriting criteria or collection methods will afford adequate protection against the higher risks associated with loans made to non-conforming borrowers. As a result, our net interest income from our securitizations may be reduced.
The success of our portfolio management and securitization business will depend upon our ability to service effectively the loans held in our portfolio and in our securitizations.
When we securitize non-conforming loans, we remain named servicer while contracting for master and sub-servicing responsibilities for the servicing rights for those loans, including, but not limited to, all collection, advancing and loan level reporting obligations, maintenance of custodial and escrow accounts, and maintenance of insurance and enforcement of foreclosure proceedings. Historically, we have only serviced loans for the initial interim period between when we fund the loans and when we sell the loans and transfer the servicing at the direction of the purchaser. We have no experience servicing a large portfolio of loans for an extended period of time, and accordingly we must contract with a third party to service the loans for us to fully implement our strategy. We cannot assure you that we will be able to service the loans according to industry standards either now or in the future. Any failure to service the loans properly will harm our operating results. Because we have not built or acquired the servicing capabilities that we need, we presently contract with an experienced servicer of non-conforming mortgage loans to “sub-service” our loans held in the portfolio for us and an experienced master servicer of non-conforming mortgage loans. The aggregate fees paid to our master servicer and sub-servicer, generally between 21 and 25 basis points of the outstanding principal balance, are a component of our general and administrative expenses. Furthermore, our net interest income depends upon the effectiveness of the third party sub-servicer servicing these loans.
37
A prolonged economic slowdown, a lengthy or severe recession or declining real estate values may result in a reduction of mortgage origination activity and an increase in foreclosures, which could limit our ability to grow our loan portfolio and thus our net income.
The current economic environment, particularly the declining real estate values, has had an adverse impact on our operations and our financial condition. Declining real estate values typically reduce the total volume of industry-wide originations because these economic factors reduce borrowers’ ability to use the value of their homes to support new loans and higher levels of borrowings. Declining real estate values have also negatively affected the loan-to-value ratios of our existing loans and have increased the rate of delinquencies and defaults on existing loans and the severity of losses we incur on defaulted loans. Therefore, the recent increases in delinquencies, foreclosures and losses resulting from these economic factors have adversely affected our net interest income from the loans in our portfolio, as well as our ability to originate, sell and securitize loans on favorable terms.
The residential mortgage origination business is a cyclical industry, and we expect that a rise in interest rates may result in a decreased volume of loan originations in the foreseeable future resulting in increased competition for the remaining loans.
The residential mortgage origination business historically has been a cyclical industry, enjoying periods of strong growth and profitability followed by periods of shrinking volumes and industry-wide losses. The residential mortgage industry has experienced rapid growth through 2005 due largely to declining interest rates, but contracted in 2006. The Mortgage Bankers Association of America has predicted that residential mortgage originations will further decrease in 2007 relative to the 2006 levels due to rising interest rates and slowing home price appreciation. During periods of rising interest rates and slowing home price appreciation, refinancing originations decrease, as higher interest rates provide reduced economic incentives for borrowers to refinance their existing mortgages and slowing home price appreciation reduces borrowers’ equity in their existing homes. Due to stable and decreasing interest rates prior to 2006, our performance prior to that time will not be indicative of results in a rising interest rate environment. Decreased loan originations may result in increased competition for the remaining loans. In light of these changes in the economic environment, our historical performance and operating and origination data may be of little relevance in predicting our future performance.
Our business may be significantly affected by the economies of California and Texas, where we conduct a significant amount of our business.
In 2006 approximately 38% of the loans we originated were loans secured by properties located in California, and 10% were loans secured by properties located in Texas. An overall decline in the economy or the residential real estate market, or the occurrence of a natural disaster, such as an earthquake or flood, in California or Texas could adversely affect the value of the mortgaged properties in those states and increase the risk of delinquency, foreclosure, bankruptcy or loss on mortgage loans in our portfolio. This would negatively affect our ability to originate, sell and securitize mortgage loans, which could result in a decrease in our profit on loans sold and our net interest income from retained loans.
We face intense competition that could adversely affect our market share and our revenues.
We face intense competition from finance and mortgage banking companies, other mortgage REITs, Internet-based lending companies where entry barriers are relatively low and from traditional bank and thrift lenders and Wall Street broker dealers that have entered the mortgage industry. As we seek to increase our origination volume, we face a significant number of competitors that may be well established in the markets we seek to penetrate. Some of our competitors are much larger than we are, have better name recognition than we do and have far greater financial and other resources than we do.
In addition to mortgage banking companies, other mortgage REITs, Internet-based lending companies, traditional banks and thrift lenders and government sponsored entities (Fannie Mac and Freddie Mac) may also participate in the mortgage industry. These government-sponsored entities may have a size and cost-of-funds advantage that allows them to purchase loans with lower rates or fees than we are able to offer. While these entities are not legally authorized to originate mortgage loans, they do have the authority to buy loans. These entities impact the dynamics of the industry by virtue of their sheer size, pricing power and the inherent advantages of a government charter. In addition, if as a result of their purchasing practices, Fannie Mae or Freddie Mac experiences significantly higher-than-expected losses, the experience could adversely affect the overall investor perception of the non-conforming mortgage industry. Freddie Mac has recently issued a statement that they intend to reduce future purchases of subprime loans.
38
The intense competition in the non-conforming mortgage industry has also led to rapid technological developments, evolving industry standards and frequent releases of new products and enhancements. As mortgage products are offered more widely through alternative distribution channels, such as the Internet, we may be required to make significant changes to our current retail and wholesale origination structure and information systems to compete effectively. An inability to continue enhancing our current systems and Internet capabilities, or to adapt to other technological changes in the industry, could significantly harm our business, financial condition and results of operations.
Competition in the mortgage industry can take many forms, affecting interest rates, costs of a loan, stringency of underwriting standards, convenience in obtaining a loan, customer service, loan amounts and terms and marketing and distribution channels. The need to maintain mortgage loan volume in a competitive environment may create price competition, which could cause us to lower the interest rates that we charge borrowers, and could lower the value of our loans held for sale or in our portfolio, or credit competition, which could cause us to adopt less stringent underwriting standards. The combination of price competition and credit competition could result in greater loan risk without compensating pricing. If we do not address either or both of these competitive pressures in response to our competitors, we could lose market share, reduce the volume of our loan originations and sales and significantly harm our business, financial condition and results of operations.
An interruption in or breach of our information systems could impair our ability to originate loans on a timely basis and may result in lost business.
We rely heavily upon communications and information systems to conduct our business. Any failure, interruption, or breach in the security of our information systems or the third party information systems that we rely on could cause delays in underwriting, fewer loan applications received or processed and reduced efficiency in loan servicing. We currently contract with a third party, LION, Inc., to provide a software database application to track and provide market valuations for our conforming originations and related derivatives. This contract is renewable annually. We also contract with a third party, Ceridian Corporation, to provide payroll services, including employee pay disbursement, payroll tax deposits and all related federal and state payroll tax reporting requirements. This contract is renewable annually. We cannot assure you that no failures or interruptions will occur or, if they do occur, that we or the third parties on whom we rely will adequately address them. The occurrence of any failures or interruptions could significantly harm our business, financial condition and results of operations.
If we are unable to maintain and expand our network of independent brokers, our loan origination business will decrease.
A significant portion of the mortgage loans that we originate comes from independent brokers. In 2006, our network of brokers was involved in the origination of approximately 87% of our mortgage loans. Our brokers are not contractually obligated to do business with us. Further, our competitors also have relationships with our brokers and actively compete with us in our efforts to obtain loans from our brokers and to expand broker networks. Accordingly, we cannot assure you that we will be successful in maintaining our existing broker relationships or expanding our broker networks. If we are not successful, it could negatively affect the volume and pricing of our loans.
Loss of our key management or the inability to attract and retain key employees may impair our ability to operate successfully.
Our future success depends to a significant extent on the continued services of our senior management and the senior management of Fieldstone Mortgage, particularly, Messrs. Sonnenfeld, our President and Chief Executive Officer, Kisnadwala, our Executive Vice President and Chief Financial Officer, Buczynski, our Executive Vice President– Secondary, Hagan, our Executive Vice President– Production (Fieldstone Mortgage), Kendall, our Executive Vice President–Investment Portfolio and Camp, our Senior Vice President–Chief Information Officer. We do not maintain “key person” life insurance for any of our personnel. The loss of the services of any of our senior managers, or other key employees, could harm our business and our prospects. Further, loss of a key member of our senior management team could be negatively perceived in the capital markets, which could have a negative impact on the market price of our common stock.
39
In addition, we depend on our production managers, account executives and loan officers to attract borrowers by, among other things, developing relationships with mortgage brokers, other financial institutions, mortgage companies, real estate agents and real estate brokers and others. These relationships lead to repeat and referral business. The market for skilled production managers, account executives and loan officers is highly competitive. Competition for qualified production managers, account executives and loan officers may lead to increased hiring and retention costs. If we are unable to attract or retain a sufficient number of skilled production managers, account executives and loan officers at manageable costs, it could harm our business, financial condition and results of operations.
We may be subject to losses due to fraudulent and negligent acts on the part of loan applicants, mortgage brokers, other vendors and our employees.
When we originate mortgage loans, we rely upon information supplied by third parties, including the information contained in the loan application made by the applicant, property appraisal, title information and employment and income documentation. If a third party misrepresents any of this information and we do not discover the misrepresentation prior to funding the loan, the value of the loan may be significantly lower than anticipated. As a practical matter, we generally bear the risk of loss associated with the misrepresentation whether it is made by the loan applicant, the mortgage broker, another third party or one of our employees. A loan that is subject to a material misrepresentation is typically unsaleable or subject to repurchase if it is sold prior to detection of the misrepresentation. Although we may have rights against persons who, or entities that, made, or knew about, the misrepresentation, those persons and entities may be difficult to locate, and it is often difficult to collect from them any monetary losses that we have suffered.
In addition, for approximately 57% of the non-conforming loans that we originate, we receive little or no documentation of the borrowers’ income. Instead, we base our credit decisions on, among other criteria, the borrowers’ credit score and credit history, the collateral value of the property securing the loan and the effect of the loan on the borrowers’ debt service. There is a higher risk of default on loans where there is little or no documentation of the borrower’s income.
The success and growth of our business will depend upon our ability to adapt to and implement technological changes.
Our mortgage loan origination business is dependent upon our ability to interface effectively with our brokers, borrowers and other third parties and to effectively and efficiently process loan applications. The origination process is becoming more dependent upon advanced technology to process applications over the Internet, interface with brokers, borrowers and other third parties through electronic means and underwrite loan applications. We have implemented a new third party software system for our loan origination system. The estimated cost of implementing the new loan origination system was approximately $5.7 million through December 31, 2006. Implementing this new technology and maintaining the effectiveness and efficiency of the technology currently used in our operations may require significant additional capital expenditures and personal resources. There is no guarantee that the implementation of any new technology will be successful. Additionally, any potential failure of the new loan origination system to produce loan documentation that is compliant with applicable federal or state laws and regulations would subject us to federal or state regulatory action or private suits that could materially adversely affect our results of operations and financial condition.
To the extent that we become reliant upon any particular technology or technological solution, we may be harmed to the extent that such technology or technological solution (i) becomes non-compliant with existing industry standards, (ii) fails to meet or exceed the capabilities of our competitors’ equivalent technologies or technological solutions, (iii) becomes increasingly expensive to service, retain and update, or (iv) becomes subject to third party claims of copyright or patent infringement. Any failure to acquire technologies or technological solutions when necessary could limit our ability to remain competitive in our industry and could also limit our ability to increase the cost-efficiencies of our operating model, which would harm our results of operations, financial condition and business prospects.
Our operations are subject to a body of complex laws and regulations at the federal, state and local levels, thereby potentially increasing our exposure to the risks of non-compliance.
Because we originate loans nationwide, we must comply with the laws, rules and regulations, as well as judicial and administrative decisions, of all relevant jurisdictions, as well as an extensive body of federal laws, rules and
40
regulations. The volume of new or modified laws, rules and regulations has increased in recent years, and, in addition, individual municipalities have begun to enact laws, rules and regulations that restrict loan origination activities, and in some cases loan servicing activities. For example, the City of Providence, Rhode Island, recently enacted a Predatory Lending Ordinance that, among other things, restricts a lender or investor from doing business with the City if the lender makes or investor buys loans that violate any provision of the ordinance. The laws, rules and regulations of each of these jurisdictions are different, complex and, in some cases, in direct conflict with each other. It may become increasingly difficult to understand and deal with all of these laws, rules and regulations, thereby potentially increasing our exposure to the risks of non-compliance.
We originate all conforming and non-conforming loans through FMC, which is licensed or exempt from licensing requirements to originate residential mortgages in 50 states and the District of Columbia, although we may choose not to conduct business in all states. With respect to our portfolio of non-conforming loans held for investment, FMC closes the loans in its own name using funds advanced by FIC, and the loan is then transfered to FIC. FIC is licensed or exempt from licensing requirements to fund residential mortgage loans and acquire closed residential mortgage loans in all states in which it operates.
Our failure to comply with these laws, rules and regulations can lead to:
| | • | | legal and regulatory liability, including potential monetary penalties; |
| | • | | loss of state licenses (or exemptions therefrom) or other approved status required for continued lending and servicing operations; |
| | • | | legal defenses causing delay or otherwise adversely affecting the servicer’s ability to enforce loans, or giving the borrower the right to rescind or cancel the loan transaction; |
| | • | | demands for indemnification or loan repurchases from purchasers of our loans; |
| | • | | lawsuits, including class action lawsuits; and |
| | • | | administrative enforcement actions. |
Some states in which we operate may impose regulatory requirements for financial disclosure on our officers and directors and parties holding in excess of 5% of our outstanding shares of stock. If any officer, director or person holding in excess of 5% of our outstanding shares of stock fails to meet or refuses to comply with a state’s applicable regulatory requirements for mortgage lending, we could lose our license or application exemption therefrom to conduct business in that state. If we lost our license or application exemption therefrom to conduct business in a state for this or any other reason, and we were unable to increase our mortgage originations in other states, our residential mortgage originations would decrease.
New legislation, including legislation relating to “high cost” loans, may restrict our ability to make loans or sell existing loans, negatively affecting our revenues and liquidity.
In recent years, federal and many state and local laws, rules and regulations have been adopted, or are under consideration, that are intended to eliminate certain lending practices, often referred to as “predatory” lending practices that are considered to be abusive. Many of these laws, rules and regulations restrict commonly accepted lending activities and impose additional costly and burdensome compliance requirements. These laws, rules and regulations impose restrictions on loans on which various points and fees or the annual percentage rate, or APR, meets or exceeds specified thresholds. Some of these restrictions expose a lender to risks of litigation and regulatory sanction no matter how carefully a loan is underwritten or originated. In addition, an increasing number of these laws, rules and regulations seek to impose liability for violations on purchasers of loans, regardless of whether a purchaser knew of, or participated in, the violation. Accordingly, the companies that buy our loans or provide financing for our loan originations may not want, and are not contractually required, to buy or finance any loans subject to these types of laws, rules and regulations.
41
The continued enactment of these laws, rules and regulations may prevent us from making some loans, selling existing loans that satisfy these characteristics, or reduce the APR or the points and fees on loans that we do make. In addition, the difficulty of managing the compliance risks presented by these laws, rules and regulations may decrease the availability of warehouse financing and the overall demand for non-conforming loans. These laws, rules and regulations have increased our cost of doing business, as we have been required to develop systems and procedures and invest in software to ensure that we do not violate any aspect of these new requirements.
In addition, many of these state laws, rules and regulations are not applicable to the mortgage operations of national banks, or other financial institutions chartered by the federal government, thereby giving the mortgage operations of these institutions a competitive advantage over us.
The federal Home Ownership and Equity Protection Act (HOEPA) identifies a category of mortgage loans as “high cost” and subjects such loans to restrictions not applicable to other mortgage loans. Loans subject to HOEPA consist of loans on which certain points and fees or the APR exceed specified levels. Liability for violations of applicable law with regard to loans subject to HOEPA would extend not only to us, but to the purchasers of our loans as well. Our policy is to not make loans that are subject to HOEPA. If we inadvertently make a loan subject to HOEPA or if we decide to relax our restrictions on loans subject to HOEPA, we will be subject to greater risks for non-compliance with HOEPA and other applicable laws, including demands for indemnification or loan repurchases from our lenders and loan purchasers, class action lawsuits and administrative enforcement actions.
Our policy is to avoid originating loans that are designated as “high cost” by the federal HOEPA law and the various state and local laws, rules and regulations. Although these laws, rules and regulations do not prohibit us from making a “high cost” loan that is covered by these laws, if we do, we are subject to certain additional requirements that, although different from state to state, generally include restrictions on prepayment fees, balloon payments and negative amortization, prohibitions against interest rate increases as a result of default, a decreased ability to accept a loan with a less favorable risk grade or accepting a loan at a higher cost, caps on finance points and fees, and prohibitions against refinancing and “flipping” of loans (a practice involving repeatedly refinancing loans so that the borrower’s equity is depleted by the lender’s fees and making loans without a reasonable expectation that the borrowers will be able to repay the loans).
Laws, rules and regulations have been adopted, or are under consideration, at the state and local levels that attempt to combat abusive lending. Many of these laws are similar to HOEPA in that they impose certain restrictions on loans on which certain points and fees or the APR exceeds specified thresholds.
We may decide to make a loan that is covered by one of these laws, rules or regulations only if, in our judgment, the loan is made in accordance with our strict legal compliance standards and without undue risk relative to litigation or to the enforcement of the loan according to its terms. If we decide to relax our self-imposed restrictions on originating loans subject to these laws, rules and regulations, we will be subject to greater risks for actual or perceived non-compliance with the laws, rules and regulations, including demands for indemnification or loan repurchases from the parties to whom we broker or sell loans, class action lawsuits, increased defenses to foreclosure of individual loans in default, individual claims for significant monetary damages, and administrative enforcement actions. Any of the foregoing could significantly harm our business, financial condition and results of operations.
Regulation AB may create additional liabilities, costs and restrictions for our business.
Effective January 1, 2006, Regulation AB, which covers registration, disclosure, communications, and reporting requirements for asset-backed securities, became effective. Regulation AB contains several new disclosure requirements, including requirements to provide historical financial data with respect to either prior securitized pools of the same asset class or prior originations and information with respect to the background, experience and roles of the various transaction parties, including those involved in the origination, sale or servicing of the loans in the securitized pool. Moreover, annual assessments of compliance with enhanced servicing criteria by servicers and attestation reports from an independent accounting firm must be obtained with respect to securitized pools of our mortgage loans. Complying with Regulation AB may increase our costs of doing business.
In connection with our issuance of mortgage-backed securities, we face liability either directly or indirectly through the indemnification provisions of the transaction documents related to a securitization of our non-conforming loans in our portfolio if we fail to provide the information required by Regulation AB. Furthermore, any failure to comply with the new reporting requirements for asset-backed securities under the Securities Exchange Act of 1934, as amended, may result in the loss of eligibility to register our asset-backed securities on Form S-3, which would
42
increase the costs of and limit our access to the public asset-backed securities market. Also, our loan sale agreements with third parties for the loans that we do not retain in our portfolio may require us to provide certain information with respect to ourselves and historical information with respect to the performance of our mortgage loans to such purchasers. Our failure to provide this information with respect to any of our mortgage loan products may result in a breach of a contractual obligation for which we provide an indemnification. In addition, if we are not able to provide such information, the number of potential purchasers of our mortgage loans may be limited or the transaction sizes of sales of our mortgage loans may be limited, each of which may have a material adverse effect on the price we receive for our mortgage loans.
We are subject to the risk that provisions of our loan agreements may be unenforceable.
Our rights and obligations with respect to our loans are governed by written loan agreements and related documentation. It is possible that a court could determine that one or more provisions of a loan agreement are unenforceable, such as a loan prepayment prohibition or the provisions governing our security interest in the underlying collateral. If this were to happen with respect to a material asset or group of assets, we could be required to repurchase these loans and may not be able to sell or liquidate the loans, which could negatively affect our liquidity and financial condition.
We may become involved in class action lawsuits and regulatory actions that may materially effect us.
Class action lawsuits and regulatory actions alleging improper marketing practices, abusive loan terms and fees, disclosure violations, improper yield spread premiums and other matters are risks faced by all mortgage originators, and particularly subprime lenders. These legal proceedings and regulatory actions can be time-consuming, divert management’s attention and resources and cause us to incur significant expenses. Furthermore, because litigation is inherently unpredictable, there can be no assurance that the results of any of these actions will not have a material adverse effect on our business, results of operations, cash flows, or financial condition.
We are exposed to environmental liabilities with respect to properties to which we take title, which may harm our liquidity and results of operations.
In the course of our business we may foreclose and take title to residential properties and, if we take title, we could be subject to environmental liabilities with respect to these properties. From January 1, 2001 through December 31, 2006, we foreclosed on 0.54% of the loans we funded during that period. In those circumstances, we may be liable to a governmental entity or third parties for property damage, personal injury, investigation or clean-up costs incurred by these parties in connection with environmental contamination, or we may be required to investigate or clean up hazardous or toxic substances or chemical releases at a property. The costs associated with investigation or remediation activities could be substantial and may harm our liquidity and results of operations.
Risks Related to our Organization and Structure
Our organizational documents contain provisions that may inhibit potential acquisition bids that our stockholders may consider favorable, and the market price of our common stock may be lower as a result.
Our organizational documents contain provisions that may have an anti-takeover effect and inhibit a change in our Board of Directors. These provisions include the following:
| | • | | There are ownership limits and restrictions on transferability in our charter. In order to qualify as a REIT, not more than 50% of the value of our outstanding shares (in certain cases taking into account options to acquire shares) may be owned, directly or constructively, by five or fewer individuals at any time during the last half of a taxable year and our shares must be beneficially owned by 100 or more persons during at least 335 days of a taxable year of 12 months or during a proportionate part of a shorter taxable year. To assist us in satisfying these tests, subject to some exceptions, our charter generally prohibits any stockholder from actually or constructively owning more than 9.8% of our outstanding shares of common stock. This restriction may: |
| | • | | discourage a tender offer or other transactions or a change in the composition of our Board of Directors or control that might involve a premium price for our shares or otherwise be in the best interests of our stockholders; or |
| | • | | compel a shareholder who had acquired more than 9.8% of our shares to dispose of the additional shares and, as a result, to forfeit the benefits of owning the additional shares. Any acquisition of our common stock |
43
| | in violation of these ownership restrictions will be voidab initio or will result in automatic transfers of our common stock to a charitable trust, which will be responsible for selling the common stock to permitted transferees and distributing at least a portion of the proceeds to the prohibited transferees. |
| | • | | Our charter permits our Board of Directors to issue preferred stock with terms that may discourage a third party from acquiring us. Our charter permits our Board of Directors to issue up to 10,000,000 shares of preferred stock, having preferences, conversion or other rights, voting powers, restrictions, limitations as to distributions, qualifications or terms or conditions of redemption as determined by our Board. Our Board could authorize the issuance of preferred stock with terms and conditions that could have the effect of discouraging a takeover or other transaction in which holders of some or a majority of our shares might receive a premium for their shares over the then-prevailing market price. |
| | • | | Our charter and bylaws contain other possible anti-takeover provisions. Our charter and bylaws contain other provisions that may have the effect of delaying, deferring or preventing a change in control or the removal of existing directors and, as a result, could prevent our stockholders from being paid a premium for their common stock over the then-prevailing market price. These provisions include advance notice requirements for stockholder proposals and director nominations. |
In addition, Maryland law provides protection for Maryland corporations against unsolicited takeovers by limiting, among other things, the duties of the directors in unsolicited takeover situations. The duties of directors of Maryland corporations do not require them to:
| | • | | accept, recommend or respond to any proposal by a person seeking to acquire control of the corporation; |
| | • | | authorize the corporation to redeem any rights under, or modify or render inapplicable, any stockholder rights plan; |
| | • | | make a determination under the Maryland Business Combination Act or the Maryland Control Share Acquisition Act; or |
| | • | | act or fail to act solely because of the effect that the act or failure to act might have on an acquisition or potential acquisition of control of the corporation or the amount or type of consideration that may be offered or paid to the stockholders in an acquisition. |
Moreover, under Maryland law, the act of the directors of a Maryland corporation relating to or affecting an acquisition or potential acquisition of control is not subject to any higher duty or greater scrutiny than is applied to any other act of a director. Maryland law also contains a statutory presumption that an act of a director of a Maryland corporation satisfies the applicable standards of conduct for directors under Maryland law.
Any one or more of these provisions, singularly or together, may have an anti-takeover effect that discourages potential acquisition bids that our shareholders may consider favorable.
Our rights and the rights of our stockholders to take action against our directors and officers are limited.
Maryland law provides that a director or officer has no liability in that capacity if he or she performs his or her duties in good faith and in a manner that he or she reasonably believes is in the best interests of the corporation and its stockholders and in a manner that an ordinarily prudent person in a like position would use under similar circumstances. Our charter, in the case of directors and officers, requires us to indemnify our directors and officers for actions taken by them in those capacities to the full extent permitted by Maryland law. As a result, we and our stockholders may have more limited rights against our directors and officers than might otherwise exist under common law.
Tax Risks
We may be unable to comply with the requirements applicable to REITs, or compliance with these requirements could adversely affect our financial condition.
Commencing with our short taxable year ended December 31, 2003, which began on November 13, 2003, we believe that we have qualified as a REIT under the Internal Revenue Code. The determination that we qualify as a REIT requires an analysis of various factual matters and circumstances, some of which may not be totally within our control. For example, to qualify as a REIT, at least 75% of our annual gross income must come from real estate sources, including mortgages on real property, and 95% of our annual gross income must come from real estate
44
sources and other sources that are itemized in the REIT tax laws, mainly interest and dividends. We are subject to various limitations on our ownership of investments, including a limitation that the fair market value of our investment in our taxable REIT subsidiary, Fieldstone Mortgage, together with any other investments in taxable REIT subsidiaries, cannot exceed more than 20% of our total assets at the close of any quarter (subject to a 30-day “cure” period following the close of each quarter). Fieldstone Mortgage conducts substantial loan origination and servicing activities and will accumulate some or all of the income from those activities. As of December 31, 2006, the estimated fair market value of our investment in Fieldstone Mortgage was 3.0% of our total assets. In addition to this limitation, at least 75% of our assets at the close of any quarter (subject to the 30-day “cure” period) must be qualified real estate assets, government securities and cash and cash items. Certain other quarterly asset ownership requirements also apply. Our ability to satisfy the asset tests will depend upon our analysis of the fair market values of our assets, some of which are not susceptible to a precise determination. Although we believe that we currently satisfy all of the asset ownership requirements, we cannot provide assurance that the IRS will agree with this determination. The need to comply with the income and asset ownership requirements applicable to REITs may cause us to acquire other assets that are qualified real estate assets for purposes of these requirements (for example, interests in other mortgage loan portfolios) but that are not part of our overall business strategy and might not otherwise be the best investment alternative for us.
There would be adverse consequences to us and our stockholders if we failed to qualify as a REIT.
The requirements for qualification as a REIT are highly technical and complex and even a technical or inadvertent mistake could jeopardize our REIT status. Moreover, legislation, new regulations, administrative interpretations or court decisions may adversely affect, possibly retroactively, our ability to qualify as a REIT or the federal income tax consequences of such qualification.
If we fail to qualify or remain qualified as a REIT in any taxable year and the relief provisions set forth in the Internal Revenue Code do not apply, among other things:
| | · | | we will have to pay federal, state and local tax, including any applicable alternative minimum tax, on our taxable income at regular corporate rates because our distributions will not be deductible by us; |
| | · | | we will not be required to make any distributions to our stockholders; |
| | · | | our securitizations may be subject to an entity level tax, and the cash flows from these securitizations may be diverted to accelerate the repayment of the underlying mortgage-backed securities; |
| | · | | any distributions we make to our stockholders will be taxable to them as dividends to the extent of our current and accumulated earnings and profits, although, subject to limitations of the Internal Revenue Code, corporate distributees may be eligible for the dividends received deduction with respect to these distributions, and individual distributees may be eligible for the capital gains tax rate of 15% or less on such dividends; and |
| | · | | we generally will be disqualified from electing treatment as a REIT for the four taxable years following the year in which our REIT status is lost. |
In addition to the consequences listed above, the tax liability resulting from our failure to qualify as a REIT:
| | · | | would substantially reduce our earnings and our cash available to pay distributions (and, consequently, your yield on your investment in our common stock); |
| | · | | might cause us to borrow funds, liquidate some of our investments or take other steps that could negatively affect our operating results; and |
| | · | | could affect the trading price of our common stock. |
Certain provisions under the Internal Revenue Cost could provide relief in the event we violate a provision of the Internal Revenue Code that would result in our failure to qualify as a REIT. There can be no assurance, however, that these relief provisions would apply to a failure by us to qualify as a REIT since their application would depend upon the factual circumstances for such a failure. If these relief provisions are inapplicable to a particular set of circumstances which otherwise would disqualify us as a REIT, we would fail to qualify as a REIT. Even if these relief provisions apply, we would be subject to a penalty tax of at least $50,000 for each disqualifying event in most cases.
45
Despite our REIT status, we remain subject to various taxes, including substantial contingent tax liabilities.
Similar provisions of the Internal Revenue Code apply to REITs and to S corporations that acquire any assets from a non-REIT C corporation in a carry-over basis transaction. These provisions permit the REIT or S corporation, as applicable, to avoid the recognition of gain and the imposition of corporate level tax with respect to a built-in gain asset acquired in a carry-over basis transaction from a non-REIT C corporation unless and until the REIT or S corporation disposes of that built-in gain asset during the ten-year period following its acquisition. At the time of the disposition, the REIT or S corporation would recognize and be subject to tax at the highest regular corporate rate on the “built-in gain.” Built-in gain is the amount by which an asset’s fair market value exceeds its adjusted tax basis at the time the REIT or S corporation acquires the asset.
On January 1, 2003, the effective date of the S election made by our predecessor, Fieldstone Holdings, a material amount of “franchise value” existed in our business in excess of its book value, which could give rise to a tax liability pursuant to the built-in gain rules described above on a sale of the business prior to December 31, 2012. We inherited the potential tax liability relating to any built-in gain of Fieldstone Holdings as a result of our merger with Fieldstone Holdings on November 14, 2003. Accordingly, if we sell our business or substantially all of our assets during the ten-year period ending December 31, 2012, we will be subject to regular corporate tax on some amount of gain. The total amount of gain on which we can be taxed is limited to the excess of the aggregate fair market value of our assets on January 1, 2003, the effective time of Fieldstone Holdings’ S election, over the adjusted tax bases of those assets at that time. We are currently assessing the tax consequences of our proposed merger with C-BASS, though the proposed merger would not effect any taxable year prior to 2007.
None of the loan sales made by Fieldstone Holdings since January 1, 2003 and prior to our merger, triggered any built-in gains tax because these loans were held for sale, and Fieldstone Holdings was required to use “mark to market” accounting for its tax accounting. Consequently, no gain was attributable to those loans for tax purposes at the time of the S election.
In addition, notwithstanding our status as a REIT, we remain subject to federal, state and local taxes on our income and property. We are subject to income tax to the extent we distribute less than 100% of our REIT taxable income, including capital gain. We may be subject to some state and local income taxes because not all states and localities treat REITs in the same manner that they are treated for federal income tax purposes. In addition, FMC and our other TRSs are subject to regular federal, state and local income tax on all of their income.
We could lack access to funds to meet our dividend and tax obligations.
As a REIT, we are required to distribute at least 90% of our REIT taxable income, excluding capital gain, to maintain our REIT qualification, and we need to distribute 100% of our REIT taxable income, including capital gain, to eliminate federal income tax liability. Moreover, we are subject to a 4% excise tax on the excess of the required distribution over the sum of the amounts actually distributed and amounts retained for which federal income tax was paid, if the amount we distribute during a calendar year (plus excess distributions made in prior years) does not equal at least the sum of 85% of our REIT ordinary income for the year, 95% of our REIT capital gain net income for the year, and any undistributed taxable income from prior taxable years. We also could be required to pay taxes and liabilities attributable to periods and events prior to our REIT election and additional taxes if we were to fail to qualify as a REIT in any given year. The amount of funds, if any, available to us could be insufficient to meet our dividend and tax obligations.
With respect to any undistributed capital gain, we would be subject to U.S. federal income tax on the amount of that gain and you generally would:
| | • | | include in your income your proportionate share of that gain, |
| | • | | be deemed to have paid your proportionate share of the tax that we paid on such undistributed capital gains, |
| | • | | receive a credit or a refund to the extent that your share of the tax paid by us exceeds your tax liability on the undistributed capital gain and |
| | • | | increase the basis in your stock by the difference between the amount of capital gain included in your income and the amount of tax you are deemed to have paid. |
We may not qualify as a REIT if we failed to distribute by the close of 2003 any undistributed earnings and profits that were attributable to a non-REIT C corporation taxable year.
To qualify as a REIT, at the end of any taxable year, we cannot have any undistributed or retained earnings and profits that are attributable to a non-REIT C corporation taxable year (non-REIT C corporation E&P). For certain years prior to January 1, 2003, our predecessor, Fieldstone Holdings, and its wholly owned subsidiary, Fieldstone Mortgage, were taxable as C corporations for federal income tax purposes. Effective January 1, 2003, Fieldstone Holdings elected to be treated as an S corporation, and Fieldstone Mortgage became a “qualified subchapter S subsidiary” of Fieldstone Holdings that was disregarded as separate from Fieldstone Holdings. As of the effective date of Fieldstone Holdings’ S election, Fieldstone Holdings had non-REIT C corporation E&P. We commissioned a national accounting firm to verify our calculation of this E&P. Prior to the merger with Fieldstone Investment Corporation, Fieldstone Holdings made distributions of non-REIT C corporation E&P in 2003 to its shareholders in an amount greater than the amount of non-REIT C corporation E&P as determined by our verified calculations. To the extent, however, that the actual non-REIT C corporation E&P of Fieldstone Holdings exceeded the amount of distributions, we succeeded to that excess non-REIT C corporation E&P and had until December 31, 2003, the close of our first taxable year as a REIT, to distribute it. We believe that, as of the close of 2003, we had no undistributed non-REIT C corporation E&P based on our calculations and the review of those calculations by a national accounting firm.
There can be no assurance, however, that the IRS will not examine our tax returns from our years as a C corporation and propose adjustments to increase our taxable income from those years. If the IRS determines that we failed to distribute all of our non-REIT C corporation E&P by the close of 2003, although the law on this issue is not entirely clear, we may avoid being disqualified as a REIT for each taxable year during which we had non-REIT C corporation E&P, provided that we satisfy certain “deficiency dividend” procedures. Our REIT shareholders would be subject to tax on the dividends at the applicable ordinary income tax rates even though these dividends would be, as a practical matter, a return of a portion of the capital invested in us. For individuals, these distributions would be eligible for the lower capital gains rates. Due to the inherently factual nature of the determination of our earnings and
46
profits, and given the inability of counsel to opine on this issue, there is a risk that the IRS could succeed in challenging our determination that we do not have any undistributed non-REIT C corporation E&P, in which event we either could fail to qualify as a REIT or could be required to satisfy the “deficiency dividend” procedures referenced above.
The tax imposed on REITs for “prohibited transactions” limits our ability to engage in transactions, including certain methods of securitizing our loans that would be treated as sales for federal income tax purposes.
A REIT’s net income from prohibited transactions is subject to a 100% tax. In general, prohibited transactions are sales or other dispositions of property held for sale, other than foreclosure property, but including any mortgage loans held in inventory primarily for sale to customers in the ordinary course of business. Under existing law, whether property is held for sale in the ordinary course of business is generally a question of fact that depends upon all of the facts and circumstances with respect to the particular transaction. We might be subject to this tax if we were to sell a loan or securitize loans in a manner that was treated as a sale of inventory for federal income tax purposes. We cannot guarantee that a sale of a loan or a securitization of a loan would not be subject to the 100% penalty tax unless we comply with certain statutory safe-harbor provisions. Therefore, in order to avoid the prohibited transactions tax, we may choose not to engage in certain sales of loans and may limit the structures used for our securitization transactions even though these sales or structures might otherwise be beneficial for us. In addition, this prohibition may limit our ability to restructure our portfolio of mortgage loans from time to time even if we believe it would be in our best interest to do so. However, loan sales by Fieldstone Mortgage are not subject to this prohibited transaction tax because Fieldstone Mortgage has elected to be treated as a taxable REIT subsidiary, although the net income recognized by Fieldstone Mortgage from any sales is subject to tax at regular federal and state corporate rates.
We and some of our stockholders could have federal income tax liability if we recognize any “excess inclusion income.”
If we own a residual interest in either a real estate mortgage investment conduit, or REMIC, or taxable mortgage pool, we will be required to allocate excess inclusion income among our stockholders to the extent that such amounts exceed our REIT taxable income, excluding any net capital gain. To the extent that a stockholder is allocated a portion of our excess inclusion income, such excess inclusion income (i) would not be allowed to be offset by any net operating losses otherwise available to the stockholder, (ii) would be subject to tax as unrelated business taxable income in the hands of most types of stockholders that are otherwise generally exempt from federal income tax, and (iii) with respect to our foreign stockholders, would be subject to federal withholding tax at the maximum rate (30%), with such stockholders generally being ineligible for a reduction or elimination of such tax under an applicable income tax treaty. Notwithstanding the foregoing sentence, to the extent that we allocate any excess inclusion income to certain “disqualified stockholders” that are not subject to federal income taxation, we would be subject to tax on such excess inclusion income at the highest tax rate. Approximately 68% and 85% of our 2004 and 2005 dividends, respectively, constituted excess inclusion income. Tax-exempt investors, non-U.S. stockholders and stockholders with net operating losses should carefully consider the tax consequences described above and are urged to consult their tax advisors in connection with their decision to invest in our shares of common stock.
47
| ITEM 1B. | UNRESOLVED STAFF COMMENTS. |
None.
Our corporate headquarters is located in Columbia, Maryland and contains approximately 98,364 square feet. The lease for our corporate headquarters expires on May 1, 2010. As of December 31, 2006, we also leased additional property in the following states ranging in size from approximately 200 to 23,700 square feet with original lease terms varying from month-to-month to 55 months: Arizona, California, Colorado, Florida, Georgia, Illinois, Indiana, Iowa, Kansas, Kentucky, Maryland, Massachusetts, Minnesota, Missouri, Nebraska, Nevada, New Jersey, New Mexico, North Carolina, Oregon, Pennsylvania, Tennessee, Texas, and Washington. All of our facility leases are operating leases. We do not consider any specific leased location to be material to our operations. We believe that equally suitable locations are available in all areas where we currently do business.
| ITEM 3. | LEGAL PROCEEDINGS. |
In addition to the proceedings discussed below, we are subject to various legal proceedings in the ordinary course of our business related to foreclosures, bankruptcies, condemnation, title claims, quiet title actions and alleged statutory and regulatory violations. Our management believes that any liability with respect to these various legal actions, individually or in the aggregate, will not have a material adverse effect on the Company’s business, results of operations or financial position. However, if an unfavorable ruling were to occur in one or more of these proceedings, there exists the possibility of a material adverse impact on our financial condition, results of operations, or cash flows.
Shareholder Litigation:
On March 1, 2007, a purported stockholder class action lawsuit related to our proposed merger with C-BASS was filed in the Circuit Court for Howard County, Maryland, naming us, and each of our directors and C-BASS as defendants. The lawsuit,Richard Tibbets v. Fieldstone Investment Corporation, et al (Case No. 13-C-07-68321), alleges, among other things, that $5.53 per share in cash to be paid to our common stockholders in connection with the merger is inadequate, that the individual director defendants breached their fiduciary duties to our common stockholders in negotiating and approving the merger agreement and have breached the duty of candor by failing to provide information adequate for our stockholders to make an informed voting decision in connection with the merger, and that we and C-BASS aided and abetted the director defendants in such alleged breach. The complaint seeks the following relief: (i) a declaration that the lawsuit is properly maintainable as a class action and certification of the plaintiff as a class representative; (ii) a declaration that the director defendants have breached their fiduciary duties owed to the plaintiff and other members of the class, and that we and C-BASS aided and abetted such breaches; (iii) an injunction of the merger; (iv) requiring our Board of Directors to obtain the best possible price in connection with a possible sale of Fieldstone; and (v) an award of attorneys’ and experts’ fees to the plaintiff.
Due to the inherent uncertainties of the judicial process, we are unable to predict the outcome of this matter. While we intend to vigorously defend this claim and believe we have meritorious defenses available to us, there can be no assurance that an adverse outcome would not have a material effect on our results of operations, financial condition, or cash flows.
Hill Litigation:
Hill, et al. v. Fieldstone Mortgage Company, et al. is a class action filed on January 16, 2002 in the Circuit Court for Baltimore City by plaintiffs, who are two individuals who obtained a second mortgage loan from Fieldstone Mortgage in 1998, in the amount of $28,000, secured by their residence, against Fieldstone Mortgage and ten other mortgage lenders that plaintiffs contend are or were the assignees of second mortgage loans in Maryland made by Fieldstone Mortgage. The lawsuit alleges, among other things, that (i) the defendants violated the Maryland Second Mortgage Loan Law, or SMLL, by failing to obtain the necessary license to provide a second mortgage loan and by charging fees unauthorized by the SMLL, and (ii) the defendants violated the Maryland Consumer Protection Act by engaging in conduct contrary to the provisions of the SMLL. The plaintiffs seek a declaratory judgment that their mortgage contract is illegal and, therefore, that they do not need to honor their obligation to repay the second mortgage loan. The plaintiffs also seek monetary damages in the amount of $300,000. Fieldstone Mortgage, and each of the other defendants, filed motions to dismiss asserting that, among other things, the plaintiffs’ claims are barred by the applicable three-year statute of limitations, the plaintiffs’ failed to properly plead a claim under the Maryland Consumer Protection Act, and the plaintiffs’ request for a judicial declaration that their mortgage contract is illegal is not a remedy available under either Maryland statutory or common law. The circuit court heard oral arguments on the motions to dismiss in January 2003. This lawsuit was consolidated with 14 other class actions with identical claims
48
against other mortgage lenders. No motion for class certification has yet been filed in this case. On March 30, 2006, the court held a status conference with regard to this matter and requested supplemental briefings on the outstanding issues from the parties. On August 25, 2006, the court dismissed this case as to all lenders, claiming that plaintiff’s arguments were timed-barred by the Statute of Limitations. The plaintiffs have appealed this ruling.
Due to the inherent uncertainties of the judicial process, we are unable to predict the outcome of this matter. While we intend to continue to vigorously defend this claim and believe we have meritorious defenses available to us, there can be no assurance that an adverse outcome would not have a material effect on our results of operations, financial condition, or cash flows.
Arredondo Litigation:
Arredondo, et al. v. Fieldstone Investment, et al.,is an action filed on August 3, 2004 in the United States District Court for the District of Arizona by nine former employees of Fieldstone Mortgage alleging that their supervisors and co-workers created a hostile work environment resulting from gender discrimination, racial discrimination and retaliation in the workplace pursuant to Title VII of the Civil Rights Act of 1964, 42 U.S.C. §2000e, and the Civil Rights Act of 1866, 42 U.S.C. §1981, as amended by the Civil Rights Act of 1991, 42 U.S.C. §1981(a). Plaintiffs claim that they are entitled to money damages in the form of back pay and front pay and nominal, compensatory and punitive damages, costs and attorney fees and equitable relief. We filed our answer denying all relevant claims on August 25, 2004. In addition, we filed a variety of motions seeking to have some of the plaintiffs dismissed from the lawsuit for failure to exhaust their administrative remedies, to dismiss other claims as not being permitted under the statute, and finally to sever the plaintiffs for trial purposes. Plaintiffs filed a response to our motion to dismiss, sever or in the alternative, bifurcate, and on April 18, 2005, our motion to dismiss was denied. In December 2005, one of the named plaintiffs, Berrinda Arredondo, requested and was dismissed from the litigation. In October 2006, another plaintiff requested to be and was dismissed from the litigation. The discovery cutoff date was May 31, 2006. A trial date, which was originally scheduled for November 2005, has been rescheduled by the court for April 2007. Also in October 2006, the court granted in part our motion to stay the proceedings while the parties proceed with mediation. Mediation is scheduled for mid-March 2007.
Due to the uncertain nature of this litigation at this time, we are unable to estimate the probable outcome of this matter. The plaintiffs in this matter have not fully specified damages sought and therefore we are unable to estimate potential exposure. While we intend to vigorously defend this matter, there can be no assurance that an adverse outcome would not have a material effect on our results of operations, financial condition, or cash flows.
Bass Litigation:
On May 24, 2004, 820 Management Trust, all of our former shareholders whose shares were redeemed following the closing of the 144A Offering (the Former Shareholders), filed an action in the District Court of Tarrant County, Texas, against us, Fieldstone Mortgage and KPMG LLP (KPMG), alleging that the Former Shareholders whose shares were redeemed for approximately $188.1 million, are entitled to an additional post-closing redemption price payment of approximately $19.0 million. On September 9, 2004, KPMG served its response to plaintiffs’ request for disclosure, stating, among other things, that KPMG has determined that the deferred tax asset, which is reflected in our December 31, 2003 audited financial statements, should have been reflected in our financial statements as of November 13, 2003, the day immediately prior to the closing of the 144A Offering.
On October 28, 2005, we served a cross claim against KPMG. Our cross claim asserted, among other claims, that KPMG’s withdrawal of its audit report on the November 13, 2003 balance sheet was improper and that due to this improper withdrawal we suffered damages. In addition, the cross claim asserted that KPMG negligently advised us regarding the November 13, 2003 balance sheet giving rise to this dispute. The cross claim sought a judgment against KPMG in an amount in excess of $1 million, plus prejudgment interest for the attorneys fees and costs incurred in this lawsuit.
On February 14, 2007, Fieldstone and KPMG entered into a Rule 11 Comprise Settlement Agreement and Mutual Release (the Settlement Agreement) with the Former Shareholders relating to the price paid to redeem the Former Shareholders’ shares. Pursuant to the Settlement Agreement, we agreed to pay the Former Shareholders a total of $10.6 million in settlement of all outstanding claims, and all of the parties to the Settlement Agreement agreed to the mutual release of all claims they may have against each other arising out of or in connection with the Rule 144A offering and redemption transaction. On February 21, 2007, we paid the Former Shareholders the foregoing settlement amount in satisfaction of its obligations under the Settlement Agreement. The lawsuit was dismissed with prejudice by the District Court of Tarrant County, Texas, on February 22, 2007.
49
Rhodes Litigation:
On January 9, 2006, a class action lawsuit was filed naming Fieldstone Mortgage in the Northern District of Illinois (Eastern Division) alleging violations of the Fair Credit Reporting Act (FCRA). The class action is entitledRhodes v. Fieldstone Mortgage Company. Plaintiff alleges that Fieldstone Mortgage violated the firm offer of credit guidelines encapsulated in 15 U.S.C. §1681 et seq. during its mail marketing campaign in or around April 2005. Specifically, Plaintiff alleges that Fieldstone Mortgage did not comply with the statutory guidelines in providing a firm offer of credit to the potential consumer. Pursuant to 15 U.S.C. §1681 et seq., statutory damages can range from $100 to $1,000 per mailing in the event that the violation is deemed willful. In August 2006, the parties engaged in a mandatory settlement conference and have agreed to settlement terms. The final terms of the settlement agreement were approved by the trial court on March 7, 2007, and include a payout to the class (including the class representative) and plaintiff’s attorney in an amount of approximately $500,000. We have currently recorded a reserve of $0.5 million with respect to this matter.
| ITEM 4. | SUBMISSION OF MATTERS TO A VOTE OF SECURITY HOLDERS. |
No matters were submitted to a vote of security holders during the fourth quarter of fiscal year 2006.
50
PART II
| ITEM 5. | MARKET FOR REGISTRANT’S COMMON EQUITY, RELATED STOCKHOLDER MATTERS AND ISSUER PURCHASES OF EQUITY SECURITIES. |
Market Information and Holders
The high and low closing sale prices for our common stock as reported on the NASDAQ Global Select Market are as follows:
| | | | | | |
| | | Price Range |
2005 | | High | | Low |
First Quarter(February 3 – March 31) | | $ | 17.00 | | $ | 13.96 |
Second Quarter(April 1 – June 30) | | $ | 14.58 | | $ | 12.00 |
Third Quarter(July 1 – September 30) | | $ | 15.20 | | $ | 11.22 |
Fourth Quarter(October 1 – December 31) | | $ | 12.41 | | $ | 9.68 |
| | |
2006 | | | | |
First Quarter(January 1 – March 31) | | $ | 13.80 | | $ | 10.85 |
Second Quarter(April 1 – June 30) | | $ | 12.31 | | $ | 8.99 |
Third Quarter(July 1 – September 30) | | $ | 9.40 | | $ | 8.18 |
Fourth Quarter(October 1 – December 31) | | $ | 8.90 | | $ | 4.38 |
As of March 1, 2007, there were 76 holders of record of our common stock, including holders who are nominees for an undetermined number of beneficial owners, which exceeds our minimum shareholder requirement for REIT eligibility.
Dividends
To maintain our status as a REIT and to avoid paying federal income tax on our distributed income, we are required to distribute, on an annual basis, 90% of our REIT taxable income. Any distributions we make will be at the discretion of our Board of Directors and will depend upon our REIT taxable earnings and financial condition, maintenance of REIT status, applicable provisions of the Maryland General Corporation Law and such other factors as our Board of Directors deems relevant. Under the Merger Agreement we signed with C-BASS, we are not permitted to declare dividends except as required to maintain our REIT status. Additionally, under our repurchase facilities, we are not able to make dividend distributions during any time at which we are in default under the agreements.
The cash distributions declared per share on our shares of common stock from January 1, 2004 through December 31, 2006 are as follows:
| | | | | | | | | |
2004 | | Declared Per Share Cash Distribution | | Declaration Date | | Record Date | | Payment Date |
First Quarter | | $ | 0.07 | | April 29, 2004 | | May 14, 2004 | | May 28, 2004 |
Second Quarter | | $ | 0.24 | | July 26, 2004 | | August 13, 2004 | | August 27, 2004 |
Third Quarter | | $ | 0.34 | | October 27, 2004 | | November 12, 2004 | | November 26, 2004 |
Fourth Quarter | | $ | 0.44 | | December 17, 2004 | | December 30, 2004 | | January 14, 2005 |
2005 | | Declared Per Share Cash Distribution | | Declaration Date | | Record Date | | Payment Date |
First Quarter | | $ | 0.47 | | April 6, 2005 | | April 20, 2005 | | April 29, 2005 |
Second Quarter | | $ | 0.50 | | July 6, 2005 | | July 20, 2005 | | July 29, 2005 |
Third Quarter | | $ | 0.51 | | October 5, 2005 | | October 19, 2005 | | October 28, 2005 |
Fourth Quarter | | $ | 0.55 | | December 16, 2005 | | December 30, 2005 | | January 18, 2006 |
51
| | | | | | | | | |
2006 | | Declared Per Share Cash Distribution | | Declaration Date | | Record Date | | Payment Date |
First Quarter | | $ | 0.48 | | March 17, 2006 | | March 31, 2006 | | April 28, 2006 |
Second Quarter | | $ | 0.44 | | June 16, 2006 | | June 30, 2006 | | July 31, 2006 |
Third Quarter | | $ | 0.34 | | September 15, 2006 | | September 29, 2006 | | October 27, 2006 |
Fourth Quarter | | $ | 0.05 | | December 20, 2006 | | December 29, 2006 | | January 18, 2007 |
All of our dividends have been classified as ordinary income for tax purposes, rather than capital gains or return of capital. A portion of our dividends may be deemed excess inclusion income for shareholders subject to the Unrelated Business Income Tax. We estimate that approximately $0.80 per share of the total $1.31 per share of 2006 dividends paid will be deemed excess inclusion income. While we are looking at strategies to reduce our dividends classified as excess inclusion income in the future, we currently believe that a substantial portion of our dividends will be classified as excess inclusion income.
Securities Authorized for Issuance under Equity Compensation Plans
Information regarding our equity compensation plans, including both stockholder approved plans and non-stockholder approved plans, is included in Item 12 of this report.
Performance Graph
The following graph shows a comparison of cumulative total returns for an investment in the common stock of Fieldstone Investment Corporation (Fieldstone), the NASDAQ Composite Index, National Association of Real Estate Investment Trusts, Inc. (NAREIT) Mortgage REIT Index and the Fieldstone Peer Group, which consists of the following publicly traded mortgage REITs: Accredited Home Lenders Holding Co., ECC Capital Corporation, Impac Mortgage Holdings, Inc., New Century Financial Corporation and NovaStar Financial, Inc. The Fieldstone Peer Group no longer includes Saxon Capital, Inc. as that company is no longer a publicly traded company. Aames Investment Corporation is also no longer included, as it has merged with Accredited Home Lenders Holding Co., which is already included in the Fieldstone Peer Group.
The total returns reflect stock price appreciation and the reinvestment of dividends for Fieldstone common stock and for each of the comparative indices. This graph is not deemed to be “soliciting material” or to be “filed” with the SEC or to the liabilities of Section 18 of the Securities Exchange Act of 1934, as amended, and the graph shall not be deemed to be incorporated by reference into any prior or subsequent filing by Fieldstone under the Securities Act of 1933, as amended, or the Securities Exchange Act of 1934, as amended.
52
Comparison of 23 Month Cumulative Total Return*
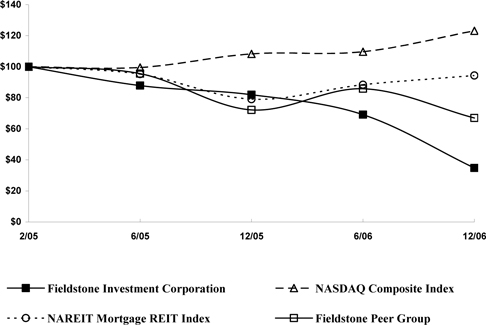
| * | $100 invested on 2/3/05 in stock or on 1/31/05 in index-including reinvestment of dividends. Fiscal year ending December 31. |
| | | | | | | | | | |
| | | Cumulative Total Returns |
| | | 2/05 | | 6/05 | | 12/05 | | 6/06 | | 12/06 |
Fieldstone Investment Corporation | | 100.00 | | 87.88 | | 82.01 | | 69.10 | | 34.70 |
NASDAQ Composite Index | | 100.00 | | 99.51 | | 108.35 | | 109.69 | | 123.20 |
NAREIT Mortgage REIT Index | | 100.00 | | 95.30 | | 79.08 | | 88.45 | | 94.36 |
Fieldstone Peer Group | | 100.00 | | 95.57 | | 72.18 | | 85.85 | | 67.02 |
Purchases of Equity Securities by the Issuer and Affiliated Purchasers
In November 2005, our Board of Directors authorized the repurchase of up to $40.0 million of outstanding common shares through December 31, 2006 under a stock repurchase program as previously disclosed. No repurchases were made during the fourth quarter of 2006. The stock repurchase program expired on December 31, 2006.
| ITEM 6. | SELECTED FINANCIAL DATA. |
The following table sets forth our selected financial and operating information, including for FHC, deemed to be our predecessor for accounting purposes. The financial statements represent our consolidated financial condition and results of operations, which includes our subsidiaries. In addition, the financial data included below for the years
53
ended December 31, 2002 reflect our prior business strategy of selling all of our loans on a whole-loan servicing released basis. The financial and operating data presented have been derived from our consolidated financial statements for each of the periods presented. The following selected financial and operating information should be read in conjunction with Management’s Discussion and Analysis of Financial Condition and Results of Operations, and the financial statements and related notes included elsewhere in this Annual Report on Form 10-K:
Selected Consolidated Financial and Other Data
(In thousands, except per share data)
| | | | | | | | | | | | | | | | | | | | |
| | | Year Ended December 31, | |
($ in 000s) | | 2006 | | | 2005 | | | 2004 | | | 2003 | | | 2002 | |
Operating Data: | | | | | | | | | | | | | | | | | | | | |
Revenues: | | | | | | | | | | | | | | | | | | | | |
Interest income: | | | | | | | | | | | | | | | | | | | | |
Loans held for investment | | $ | 409,675 | | | $ | 344,521 | | | $ | 206,460 | | | $ | 17,749 | | | $ | — | |
Loans held for sale | | | 31,051 | | | | 31,095 | | | | 20,172 | | | | 38,721 | | | | 25,105 | |
| | | | | | | | | | | | | | | | | | | | |
Total interest income | | | 440,726 | | | | 375,616 | | | | 226,632 | | | | 56,470 | | | | 25,105 | |
| | | | | | | | | | | | | | | | | | | | |
Interest expense: | | | | | | | | | | | | | | | | | | | | |
Loans held for investment | | | 319,961 | | | | 198,688 | | | | 69,039 | | | | 5,137 | | | | — | |
Loans held for sale | | | 16,599 | | | | 13,222 | | | | 3,273 | | | | 12,622 | | | | 10,264 | |
Subordinated revolving line of credit | | | — | | | | — | | | | — | | | | 510 | | | | 576 | |
| | | | | | | | | | | | | | | | | | | | |
Total interest expense | | | 336,560 | | | | 211,910 | | | | 72,312 | | | | 18,269 | | | | 10,840 | |
| | | | | | | | | | | | | | | | | | | | |
Net interest income | | | 104,166 | | | | 163,706 | | | | 154,320 | | | | 38,201 | | | | 14,265 | |
Provision for loan losses—loans held for investment | | | 69,062 | | | | 30,065 | | | | 21,556 | | | | 2,078 | | | | — | |
| | | | | | | | | | | | | | | | | | | | |
Net interest income after provision for loan losses | | | 35,104 | | | | 133,641 | | | | 132,764 | | | | 36,123 | | | | 14,265 | |
Gains on sales of mortgage loans, net | | | 17,047 | | | | 61,198 | | | | 42,778 | | | | 93,060 | | | | 60,748 | |
Other income (expense)—portfolio derivatives | | | 14,212 | | | | 33,469 | | | | 8,789 | | | | (3,398 | ) | | | — | |
Other (expense) income | | | (2,462 | ) | | | 932 | | | | 1,901 | | | | 1,862 | | | | 2,206 | |
| | | | | | | | | | | | | | | | | | | | |
Total revenues | | | 63,901 | | | | 229,240 | | | | 186,232 | | | | 127,647 | | | | 77,219 | |
| | | | | | | | | | | | | | | | | | | | |
Expenses: | | | | | | | | | | | | | | | | | | | | |
Salaries and employee benefits | | | 77,995 | | | | 73,720 | | | | 71,969 | | | | 72,964 | | | | 32,526 | |
Other expenses1 | | | 65,669 | | | | 49,749 | | | | 43,847 | | | | 21,977 | | | | 15,744 | |
| | | | | | | | | | | | | | | | | | | | |
Total expenses | | | 143,664 | | | | 123,469 | | | | 115,816 | | | | 94,941 | | | | 48,270 | |
| | | | | | | | | | | | | | | | | | | | |
(Loss) income from continuing operations before income taxes | | | (79,763 | ) | | | 105,771 | | | | 70,416 | | | | 32,706 | | | | 28,949 | |
Income tax benefit (expense) | | | 13,023 | | | | (4,669 | ) | | | (6,284 | ) | | | 10,586 | | | | (12,821 | ) |
| | | | | | | | | | | | | | | | | | | | |
(Loss) income from continuing operations | | | (66,740 | ) | | | 101,102 | | | | 64,132 | | | | 43,292 | | | | 16,128 | |
Discontinued operations, net of income tax | | | (1,645 | ) | | | (1,712 | ) | | | (536 | ) | | | 8,251 | | | | 5,619 | |
| | | | | | | | | | | | | | | | | | | | |
Net (loss) income | | $ | (68,385 | ) | | $ | 99,390 | | | $ | 63,596 | | | $ | 51,543 | | | $ | 21,747 | |
| | | | | | | | | | | | | | | | | | | | |
(Loss) earnings per share of common stock-basic and diluted: | | | | | | | | | | | | | | | | | | | | |
Continuing operations | | $ | (1.42 | ) | | $ | 2.07 | | | $ | 1.31 | | | $ | 2.24 | | | $ | 1.07 | |
Discontinued operations | | | (0.03 | ) | | | (0.03 | ) | | | (0.01 | ) | | | 0.43 | | | | 0.37 | |
| | | | | | | | | | | | | | | | | | | | |
Total | | $ | (1.45 | ) | | $ | 2.04 | | | $ | 1.30 | | | $ | 2.67 | | | $ | 1.44 | |
| | | | | |
Other Data: | | | | | | | | | | | | | | | | | | | | |
Mortgage Loan Fundings: | | | | | | | | | | | | | | | | | | | | |
Wholesale | | $ | 4,642,792 | | | $ | 5,348,385 | | | $ | 5,529,824 | | | $ | 4,477,756 | | | $ | 2,080,526 | |
Retail | | | 711,651 | | | | 789,261 | | | | 822,982 | | | | 885,795 | | | | 557,933 | |
| | | | | | | | | | | | | | | | | | | | |
Subtotal- Continuing operations | | | 5,354,443 | | | | 6,137,646 | | | | 6,352,806 | | | | 5,363,551 | | | | 2,638,459 | |
Discontinued operations | | | 127,797 | | | | 1,291,086 | | | | 1,122,441 | | | | 2,008,499 | | | | 1,377,948 | |
| | | | | | | | | | | | | | | | | | | | |
Total Fundings | | $ | 5,482,240 | | | $ | 7,428,732 | | | $ | 7,475,247 | | | $ | 7,372,050 | | | $ | 4,016,407 | |
| | | | | | | | | | | | | | | | | | | | |
Non-Conforming Mortgage Loan Fundings Statistics | | | | | | | | | | | | | | | | | | | | |
Weighted average interest rate | | | 8.4 | % | | | 7.5 | % | | | 7.2 | % | | | 7.3 | % | | | 8.4 | % |
Weighted average credit score | | | 650 | | | | 653 | | | | 652 | | | | 653 | | | | 645 | |
Weighted average loan-to-value | | | 86.5 | % | | | 84.0 | % | | | 84.5 | % | | | 86.0 | % | | | 85.7 | % |
54
| | | | | | | | | | | | | | | | | | | | |
| | | Year Ended December 31, | |
($ in 000s) | | 2006 | | | 2005 | | | 2004 | | | 2003 | | | 2002 | |
Full documentation | | | 41.0 | % | | | 54.8 | % | | | 59.4 | % | | | 55.0 | % | | | 51.0 | % |
| | | | | |
Mortgage Loan Sales Statistics | | | | | | | | | | | | | | | | | | | | |
Mortgage sales: | | | | | | | | | | | | | | | | | | | | |
Non-conforming wholesales and retail divisions | | $ | 2,903,494 | | | $ | 3,103,598 | | | $ | 2,374,178 | | | $ | 4,215,593 | | | $ | 2,282,344 | |
Discontinued operations | | | 226,380 | | | | 1,251,964 | | | | 1,125,600 | | | | 2,146,924 | | | | 1,211,234 | |
| | | | | | | | | | | | | | | | | | | | |
Total | | $ | 3,129,874 | | | $ | 4,355,562 | | | $ | 3,499,778 | | | $ | 6,362,517 | | | $ | 3,493,578 | |
| | | | | | | | | | | | | | | | | | | | |
Operating Ratios: | | | | | | | | | | | | | | | | | | | | |
Debt to capital | | | 15.8 | | | | 11.2 | | | | 9.2 | | | | 3.0 | | | | 16.2 | |
Return on average equity | | | (14.4 | )% | | | 17.9 | % | | | 12.3 | % | | | 47.8 | % | | | 88.3 | % |
Return on average total assets | | | (1.1 | )% | | | 1.7 | % | | | 1.7 | % | | | 5.1 | % | | | 4.7 | % |
Average total equity as a percentage of average total assets | | | 7.5 | % | | | 9.5 | % | | | 14.4 | % | | | 10.7 | % | | | 5.3 | % |
Book value per share | | $ | 8.13 | | | $ | 10.86 | | | $ | 10.81 | | | $ | 10.59 | | | | N/A | |
| | | | | |
Average Balance Data: | | | | | | | | | | | | | | | | | | | | |
Mortgage loans held for sale | | $ | 387,077 | | | $ | 408,732 | | | | 260,750 | | | | 518,307 | | | | 306,866 | |
Mortgage loans held for investment | | | 5,643,226 | | | | 4,971,731 | | | | 3,072,684 | | | | 266,558 | | | | — | |
Warehouse financing—mortgage loans held for sale | | | 296,660 | | | | 296,406 | | | | 125,406 | | | | 458,010 | | | | 316,330 | |
Warehouse financing—mortgage loans held for investment | | | 588,384 | | | | 482,024 | | | | 616,181 | | | | 102,548 | | | | — | |
Securitization financing | | | 4,981,265 | | | | 4,364,266 | | | | 2,251,980 | | | | 115,822 | | | | — | |
Average total assets | | | 6,342,627 | | | | 5,813,991 | | | | 3,639,683 | | | | 1,005,986 | | | | 464,205 | |
Average total equity | | | 474,696 | | | | 553,901 | | | | 524,286 | | | | 107,869 | | | | 24,632 | |
1 | Represents the accumulation of occupancy, depreciation and amortization, servicing fees and general and administration expense reported within the audited consolidated statements of operations. |
55
| ITEM 7. | MANAGEMENT’S DISCUSSION AND ANALYSIS OF FINANCIAL CONDITION AND RESULTS OF OPERATIONS. |
Recent Developments
On February 15, 2007, we entered into a definitive Agreement of Merger (Merger Agreement) with Credit-Based Asset Servicing and Securitization LLC, a Delaware limited liability company (C-BASS), and Rock Acquisition Corp., a Maryland corporation and wholly owned subsidiary of C-BASS (Merger Sub). On March 16, 2007, we entered into Amendment No. 1 to the Agreement of Merger. The Merger Agreement, as amended, provides that, upon the terms and subject to the conditions set forth in the Merger Agreement, as amended, Merger Sub will be merged with and into Fieldstone, with Fieldstone continuing as the surviving corporation and a wholly owned subsidiary of C-BASS (the Merger). At the effective time of the Merger, each share of our common stock issued and outstanding immediately prior to the effective time of the Merger and not owned by Fieldstone or its subsidiaries will be converted into the right to receive $4.00 in cash per share, without interest.
In addition, to provide pre-merger liquidity to the Company C-BASS has agreed to purchase, at the Company’s option, certain of our assets, including certain of our retained securities and substantially all of our inventories of non-securitized loans, and C-BASS and we have agreed to the forward sale of our future loan production to C-BASS for loans originated on or after March 1, 2007, which is exercisable at our option.
The Merger Agreement, as amended, and the transactions contemplated thereby were approved by our Board of Directors.
The Merger is subject to various closing conditions, including, among others: (i) the approval of the Merger Agreement, as amended, the Merger and the other transactions contemplated by the Merger Agreement, as amended, by the affirmative vote of holders of a majority of the outstanding shares of Fieldstone’s common stock, (ii) the receipt of required regulatory approvals, (iii) the receipt of third party required contractual consents, (iv) the continued effectiveness of certain of the employment and retention arrangements, (v) Fieldstone’s third party servicers and subservicers agreeing to transfer the servicing of Fieldstone’s mortgage loans to C-BASS or its designated subsidiary, (vi) certain of Fieldstone’s lenders agreeing to extend a portion of Fieldstone’s existing financing facilities for at least 90 days after the effectiveness of the Merger, and (vii) no event or circumstance having occurred that has resulted in, or is reasonably expected to result in, a material adverse change to our Company.
Industry and Operational Risks
The subprime lending market in which we predominantly operate experienced significant changes during 2006. Slowing U.S. housing markets led to a decrease in total mortgage originations, generating intense competition among lenders on both price and credit. Flattening and declining home price values, rising interest rates, and increased borrower debt all contributed to significant increases in delinquencies and losses on subprime loans. Losses incurred were also negatively impacted by rising loss severities due to flat and in some cases declining property values. Lenders also experienced increased and accelerated repurchase requests on loans sold as first and early payment defaults increased. Declining subprime loan performance on more recent vintages has contributed to a recent reduction in the liquidity available to our industry, both as it relates to securitizations and credit facilities. Additionally, many subprime lenders have also experienced margin calls on the loans used as collateral. The number of potential investors in subprime securitizations has decreased and the cost of offering these securitizations has increased. These factors adversely impacted our operations as well as the operations of many of our competitors during 2006, and the impact has continued into the first quarter of 2007. As a result, the subprime lending industry has seen a recent increase in both bankruptcies and merger and acquisition activity, including our proposed merger with C-BASS discussed above.
These factors contributed to our net loss of $68.4 million in 2006, which included a $39.0 million increase in our provision for loan losses on loans held for investment and an $8.2 million increase in the provision for losses on loans sold compared to 2005, as well as a $4.2 million charge to reflect the reduced value of loans held for sale as of December 31, 2006. We amended several of our credit facilities during December 2006 and January 2007 to remain in compliance with our profitability and tangible net worth covenants, and we may need to amend the facilities again as discussed below.
We are decreasing our cost structure and working to improve both our originations and loan performance. We have implemented initiatives related to each of these goals. We intend to reduce our cost structure through the consolidation of operations centers, pricing and commission changes, implementation of our new loan origination system, and vendor re-structuring. The initiatives to improve originations include the introduction of new alt-A products, a simplified rate sheet, and a new value-based commission plan. Finally, we initiated steps to improve our loan performance by eliminating products with the most significant losses,
56
limiting the age of appraisals, narrowing acceptable thresholds for the automated verification of broker appraisals, utilizing new technology and resources to flag high risk loans prior to origination for additional manual procedures, implementing accelerated collections efforts on early stage delinquencies, increased internal staffing and focus on servicer work-flow, and directly boarding loans held for investment with the servicer to avoid immediate servicing transfer. We are currently evaluating additional cost management initiatives, including further operations consolidation and a proportional reduction in home office staff, as current market conditions continue to evolve.
Though we expect the current industry turmoil and liquidity constraints to continue in 2007, we believe that the benefits of our initiatives will improve our results of operations in 2007. However, if our 2007 results are comparable to our 2006 results, we may violate the covenants of our credit facilities, which would subject us to increased liquidity risks, including the ability to generate sufficient cash flows to continue supporting current operations. In the event of a breach of a covenant contained in a facility that triggers an event of default, then the lender may accelerate outstanding principal repayment owed under the facility and such acceleration may permit other lenders to accelerate all of the outstanding principal repayment under their facilities. In such a situation, we believe that we would be able to generate sufficient cash from existing operations, maintain sufficient liquidity, and make alternative arrangements, including obtaining waivers or amendments from existing lenders or reach agreement with new lenders, to enable us to continue to meet our obligations for the next twelve months. However, we would need to significantly restructure our operations, which would include further consolidation and workforce reductions to continue to meet our ongoing obligations.
Executive Overview
We are a mortgage real estate investment trust (REIT) that invests in non-conforming loans originated by our wholly owned subsidiary, FMC, which we finance by issuing mortgage-backed securities. Through FMC, we originate, service, and sell non-conforming single-family residential mortgage loans through our wholesale origination channel and both non-conforming and conforming single-family residential mortgage loans through our retail origination channel.
Our primary sources of income are the interest income on our loans held for investment, net of the interest expense of financing those loans, the cash gains on sales of mortgage loans that we choose not to hold for investment which include origination fees collected at funding, and the net interest income on loans held for sale during the period from origination to date of sale.
We reported a net loss of $68.4 million for the year ended December 31, 2006, compared to net income of $99.4 million for the year ended December 31, 2005. The decrease in net income was due primarily to decreases in both our net gains on sale and net interest income due to a decline in net interest margin on loans originated in 2006, increases in our provision for loan losses, and unfavorable fluctuations in results from our derivative contracts. Results of operations were also negatively impacted by $10.6 million of charges related to the settlement of the Bass litigation described in Item 3- Legal Proceedings and a $0.9 million pre-tax loss on the disposal of our discontinued operations during 2006.
Our net interest income decreased to $104.2 million in 2006 from $163.7 million in 2005 due primarily to a decrease in our average interest spread, which is the difference between the coupon interest rate on our loans to borrowers and the interest rate we incur for the debt financing of the loan, which was partially offset by a higher average balance of loans. Net interest margin, including the net cash received on our swaps, declined to 2.24% in 2006 from 3.37% in the previous year. The cost of financing for loans held for investment increased as our weighted average swap rate rose as older, lower rate swaps expired and were replaced with new swaps at current market rates, resulting in an increase in our weighted average swap rate to 4.8% as of December 31, 2006 from 3.2% at the end of 2005. Market competition for new loans remained intense, as total originations have declined in 2006, and did not permit coupons on new originations to increase at the same rate as the increase in our financing costs for the loans, narrowing the spreads available on new loans.
Gains on sales of mortgage loans, net decreased to $17.0 million in 2006, compared with $61.2 million last year due to decreased sales premiums earned during 2006 as a result of the reduction in the net interest spread available on new originations, decreased sales volumes in the current year, and increased investor repurchase requests. Loans held for sale have experienced similar delinquency and loss performance as the loans in the investment portfolio, and we may be required to repurchase loans sold to investors that become delinquent within a specified period of the date of sale, necessitating a reserve for these repurchases, which is recorded as a reduction in gains on sale. The provision for losses on repurchased loans increased by $8.2 million in 2006 compared to 2005. The decreased gains on sales, net, was also caused by a decline in the market value of certain second lien products due to slowing home price appreciation, increased industry-wide defaults on second lien loans, and rating agency forecasts of a decline in second lien performance, which resulted in pre-tax charges of $4.2 million during 2006 to reduce these loans to the lower of cost or market value, which was recorded as a reduction in the gains on sales of mortgage loans, net. During the second half of 2006, we discontinued the origination of those second lien loan products most affected by the market devaluation. We expect sales margins to remain at lower levels into 2007 due to higher forecast losses on subprime loans, lack of investor demand for subprime loans, higher risk premiums charged by investors to purchase subprime loans and intense market competition for new loans.
57
Our provision for loan losses increased to $69.1 million in 2006 from $30.1 million in 2005 as the result of a sharp increase in delinquencies on more recent loan originations, consistent with loan performance throughout the industry compared to the prior year, and the aging of our portfolio. In response to the sharp rise in the delinquency and loss rates, we have accelerated our intervention on delinquent loans, engaged a delinquency and loss mitigation monitor for our 2006 loans, limited the age of appraisals and narrowed acceptable thresholds for the automated verification of property values, ceased originating products with the highest delinquency rates, and initiated plans to directly board our loans held for investment with our servicer to avoid immediate servicing transfer.
We use interest rate swaps and caps to economically hedge the variable rate financing costs for the fixed rate period of our hybrid ARM mortgage loans held for investment. Because these derivatives are not designated as cash flow hedges under Statement of Financial Accounting Standards No. 133, “Accounting for Derivative Instruments and Hedging Activities,”(Statement No. 133) changes in the fair market value of the swaps and caps are recognized in current period earnings and reported in our consolidated statement of operations in “Other income —portfolio derivatives.” Net cash settlements, representing the difference between the swapped interest rate and the actual interest rates, are also recognized in the line item “Other income (expense) – portfolio derivatives” on the consolidated statements of operations. Our policy has been to hedge approximately 90% of the debt collateralizing our loans held for investment during their fixed interest rate period, “locking in” the interest spread for the hedged debt. Results of operations for 2006 include losses of $27.2 million related to the decreases in the fair market value of our derivative contracts compared to gains of $9.0 million included in 2005 results. The mark to market loss on derivative contracts is the result of the decline in the forward LIBOR curve during the period. The current decline in the market value of existing swaps indicates the expectation of an offsetting future decline in bond interest expense, and our net cash flow on the loans and debt outstanding remain the same regardless of whether the forecast changes in interest rates occur. Partially offsetting the unfavorable change in fair value, net cash settlements received on our swaps increased $17.0 million in 2006 compared to the prior year as a result of fluctuations in the swapped interest rate and the actual LIBOR during the period. We cannot predict the future path of interest rates, nor can we predict in a definitive manner the magnitude by which these changes in interest rates may impact our results of operations during periods of interest rate volatility.
Our portfolio of loans held for investment, net, was approximately $5.5 billion as of both December 31, 2006, and 2005. Our portfolio increased consistently throughout the first three quarters of 2006, at which time we exceeded our initial target leverage of 13:1. As a result, the vast majority of loans originated during the fourth quarter of 2006 were classified as held for sale. The portfolio gradually decreased throughout the fourth quarter of 2006 as loans held in the portfolio were repaid, decreasing our leverage. As of December 31, 2006, the financing debt on the loans held in our portfolio was 13.9 times our equity, which approximates our 13:1 portfolio leverage target. The percentage of our originations we retain for the portfolio in any given period will vary based upon our leverage, prepayments during the quarter, and the availability of loans which meet our cash flow, credit, and projected return criteria. As a result of our portfolio leverage at December 31, 2006, we intend to maintain our current strategy of classifying a larger proportion of 2007 originations for sale than has been our historical tendency.
Our continuing operations originated $5.4 billion of mortgage loans during 2006, a 13% reduction from the $6.1 billion originated by our continuing operations during 2005. Industry-wide origination volumes decreased approximately 17% in 2006 compared to 2005, and as a result there was heightened competition for new loan originations on both price and credit. In response to these market conditions, we began to implement a number of initiatives during the third quarter of 2006 to improve originations, including the introduction of new products, which included several new alt-A products and a number of enhancements to our non-prime products, the improvement of our technology throughout the origination cycle, a simplified rate sheet that reflects the actual rates at which we lend, and a new commission plan based on the loan’s net value to us. We began to see the effect of these initiatives in the fourth quarter of 2006, when originations increased 7% compared to the previous quarter.
58
Net cost to produce for our continuing operations was 2.78% in 2006, excluding the $10.6 million of charges related to the Bass settlement, which were non-recurring unrelated to our origination operations, compared to 2.57% in 2005, due primarily to the changes in funding volumes between periods. Our fixed production expenses have generally increased in 2006, due primarily to increased sales personnel salaries and benefits, in an increasingly competitive market for originations. Additionally, although our operating structure had been effective in more favorable market conditions, they had not been streamlined to maximize efficiency as the market continued to deteriorate throughout 2006, which led to an increase in cost to produce compared to 2005. To mitigate our increased cost to produce and improve our ability to compete effectively, we began to execute a number of cost reduction initiatives during the third and fourth quarters of 2006, including pricing and commission changes to reduce the level of premiums paid; increased use of technology, including the rollout of our new loan origination software and incentives for on-line submissions, consolidation of our operations centers, vendor re-structuring and strategic outsourcing for services that are not deemed essential. As part of these initiatives, we began consolidating operations centers late in 2006. These consolidations resulted in the acceleration and recognition of certain costs in 2006 in accordance with GAAP, but will reduce recurring costs in future periods. We are currently evaluating additional cost management initiatives, including further operations consolidation and a proportional reduction in home office staff, as the current market conditions continue to evolve.
In February 2007, we entered into a settlement agreement for the Bass litigation described in Item 3- Legal Proceedings. Under the terms of the settlement, we will pay the Former Shareholders $10.6 million as full settlement of their claim to a purchase price adjustment related to the 144A Offering. Because this settlement was a subsequent event which occurred prior to the release of our consolidated financial statements and provided additional evidence on a matter that existed as of the balance sheet date, we have reflected the settlement in our consolidated financial statements for the year ended December 31, 2006. Prior to the settlement agreement, no accrual had been recorded, due to the uncertainty regarding the outcome of the case and accordingly, the entire settlement amount has been recorded in expense for the year ended December 31, 2006.
In the first quarter of 2006, our Board of Directors approved a plan to sell, close or otherwise dispose of the assets of our conforming retail and conforming wholesale segments. In February 2006, the assets pertaining to these segments’ headquarters, all wholesale offices, and certain of its retail offices were sold to third parties. The remaining assets of the conforming division were combined with our non-conforming retail offices. The pre-tax loss on disposal was $0.9 million and is included in discontinued operations, net of income tax, in the consolidated statements of operations for the year ended December 31, 2006.
Key Components of Financial Results of Operations
Revenues
Our revenues are based primarily on the spread between the interest income we receive from the loans we fund for investment and the interest expense on the debt financing these loans, sale margins on our loans held for sale, prepayments on our mortgage loans held for investment, credit losses on our investment portfolio, and origination volumes. During periods of rising interest rates, we would generally increase the mortgage interest rates we charge on our loan originations, but we will also experience an increase in our costs of borrowing to finance the loans. If the rise in borrowing costs is greater than the increase in the coupon on new originations of loans held for investment, which we have experienced in 2006, net interest income spread will be lower on the new loans replacing the older loans as they prepay. Rising interest rates may lead to decreases in loan prepayments of our hybrid adjustable-rate mortgages during the initial loan period in which our borrowers pay a fixed interest rate, generally during the first two to three years of the loan, but increase prepayments at or near the reset date of the loan, when the coupon resets to a six-month LIBOR-based ARM reflecting the higher market rates. Decreases in prepayment speeds result in lower prepayment fee income, but offer higher net interest income and potential expense reductions in the form of decreases to the rate of amortization of deferred origination costs and bond issuance costs, which are recorded as a reduction in yield. Descriptions of certain key components of our revenues are set forth below.
Interest Income—Loans Held for Investment
Interest income—loans held for investment represents the interest earned on our loans held for investment following the funding of the loans, and includes prepayment fee income collected when a borrower chooses to prepay before a contractual time period. Components of interest income include the gross interest received on our mortgage loans, less the amortization of net deferred direct origination costs. Interest income will be reduced by interest previously accrued on loans which are subsequently placed on non-accrual status. We place individual loans on non-accrual status when they are past-due 90 days or when, in the opinion of management, the collection of principal and interest is in doubt.
59
Interest Income—Loans Held for Sale
Interest income—loans held for sale represents the interest earned on our mortgage loans held for sale during the period from the date of funding to the date of sale.
Interest Expense—Loans Held for Investment
Interest expense—loans held for investment consists of the borrowing costs to finance our portfolio of loans held for investment following the funding of the loans, including both financing under our credit facilities, and our securitization debt. Interest expense includes credit line commitment fees, custodial charges, non-use fees and the amortization of original issue discount and bond issuance costs incurred on our securitization financings.
Interest Expense—Loans Held for Sale
Interest expense—loans held for sale consists of the borrowing costs to finance our mortgage loans during the period from the date of funding to the date of sale, including credit line commitment fees, custodial charges and non-use fees.
Provision for Loan Losses—Loans Held for Investment
Provision for loan losses—loans held for investment represents a charge for our estimate of probable losses inherent in our portfolio of non-conforming mortgage loans held for investment. See the Critical Accounting Policies — Allowance for Loan Losses—Loans Held for Investment section.
Gains on Sales of Mortgage Loans, Net
Gains on sales of mortgage loans, net, includes gross gain on sale of mortgage loans, reduced by the provision for losses on loans sold. Gross gain on sale is generated by selling loans for a premium. Gains on sales also includes any origination, underwriting, discount points and other funding fees received net of other direct origination costs originally capitalized when a loan closes, which are deferred and recognized when the loan is sold. Direct origination costs include the direct costs associated with origination, such as commissions, direct salaries for funded loans, direct general and administrative costs and premiums paid to brokers for loans originated by the wholesale division, which are initially capitalized at loan funding and increase our basis in the loan. Gains on sale is reduced by loans sold at a discount, the provision for losses related to our representation and warranty liabilities for the sold loans, our obligation to rebate a portion of any premium received when a borrower prepays a sold loan before a specified date, and any charges required to reduce held for sale loans to the lower of cost or market value as of the period end date. The provision for loan losses is recorded when loans are sold and is calculated as the estimated fair value of losses reasonably estimated to occur over the life of the loan.
Other Income —Portfolio Derivatives
Other income —portfolio derivatives, includes all cash settlements and any fair value gains or losses from undesignated derivatives used to economically hedge the financing costs of our loans held for investment. The gain or loss is comprised of (i) the change in the periodic mark to market of the future value of the derivative contracts as of period end, (ii) the net cash settlements during the reporting period, and (iii) any net cash gain or loss for terminating a contract before maturity. We enter into interest rate swaps designed to stabilize the interest rates we pay on our variable rate warehouse and securitization financing debt during the period that our mortgage loans have a fixed interest rate, generally during the first two years of the mortgages’ lives. Our derivative contracts are not designated as cash flow hedges in accordance with Statement No. 133 and, therefore, the change in the periodic mark to market value, any net cash received or paid at periodic settlement dates, or net cash exchanged for terminating the contract before maturity will be recorded to “Other income —portfolio derivatives.”
Expenses
The principal factors which lead to changes in our expenses are funding volumes, the number of production facilities we operate, the staffing required to support our origination platform, the balance of our investment portfolio incurring third party servicing fees, and the corporate overhead required to support a public company. As loan volumes increase, we generally would expect salaries, employee benefit expenses, and variable loan related expenses to increase. As a public company, we have also experienced increased costs related to compliance with the Sarbanes-
60
Oxley Act of 2002, SEC reporting, and professional services fees. We have also incurred increased expenses in 2006 related to the implementation of our new loan origination software system. Descriptions of certain key components of our total expenses are set forth below.
Salaries and Employee Benefits
Salaries and employee benefits include salaries, benefits and payroll taxes that have not been designated as direct costs of loan origination, including salaries for managers, administrative positions, corporate personnel and the component of salaries that is deemed to reflect the cost associated with processing applications for loans that are not ultimately funded. Salaries expense includes the fair market value of all equity compensation grants including stock options, restricted shares, and performance shares. Salaries are relatively fixed at any point based on our existing staffing levels, which generally correlates to current and estimated of future loan origination volumes. Benefits include the costs of our self-insurance employee health plan, net of employee contributions, 401k matching contribution, and may fluctuate based upon the actual medical costs incurred by our personnel and the level of employee participation in these plans.
General and Administration Expenses
General and administration expenses consist primarily of costs relating to marketing, quality control, equipment maintenance, delivery and postage, telephone, audit and legal and travel expenses. Variable loan costs such as due diligence fees paid to third parties and appraisal reviews are also included.
Servicing Fees
Servicing fees include the third party servicing expense relating to our portfolio of loans held for investment. Because we do not currently have the servicing capabilities required for a large mortgage portfolio, we presently contract with an experienced servicer of non-conforming loans to “sub-service” our loans for us.
Income Tax Benefit (Expense)
Income tax benefit (expense) represents the federal and state tax impact on the pre-tax loss or earnings, respectively, of FMC, our taxable REIT subsidiary, adjusted for changes in the deferred tax asset related to various timing differences in the recognition of tax expense related to FMC’s loans sold and held for sale, including a deferred tax asset related to inter-company loan sales in 2003 and 2005.
For purposes of determining taxable income of each entity, transactions between the REIT and FMC, including inter-company borrowings, and fees charged by FMC to originate loans to be funded by the REIT, are structured as arms-length transactions with market pricing. Income tax expense related to gain recognized by FMC on inter-company loan sales, wherein the loans remain on the consolidated statement of condition, is deferred and recognized using the level yield method over the life of the related loans.
Critical Accounting Policies
We consider the policies discussed below to be critical to an understanding of our financial statements because their application places the most significant demands on the judgment of our management, with financial reporting results relying on estimates and assumptions about the effects of matters that are inherently uncertain. Specific risks for these critical accounting policies are described in the following paragraphs. While we believe that the estimates and assumptions management utilizes in preparing our financial statements are reasonable, such estimates and assumptions routinely require periodic adjustment. Actual results could differ from our estimates, and these differences could be significant.
Securitizations
We must comply with the provisions of Statement of Financial Accounting Standards No. 140,“Accounting for Transfers and Servicing of Financial Assets and Extinguishments of Liabilities,” (Statement No. 140) relating to each securitization. Depending on the structure of the securitization, it will either be treated as a sale or secured financing for financial statement purposes. We account for our securitizations of mortgage loans as secured financings, and accordingly, we include the securitized mortgage loans on our books as mortgage loans held for investment. The
61
loans are sold to a trust which is a wholly-owned special purpose entity for purposes of credit ratings; however, because the securitizations are designed as secured financings, they are designed not to meet the qualifying special purpose entity criteria of Statement No. 140.
Allowance for Loan Losses—Loans Held for Investment
Because we maintain our loans held for investment on the statements of condition for the life of the loans, we maintain an allowance for loan principal losses based on our estimates of the losses inherent in the portfolio. This is a critical accounting policy because of the subjective nature of the estimates required and potential for imprecision. Two critical assumptions used in estimating the loss reserve are an assumed rate at which the loans go into foreclosure subsequent to initial default and an assumed loss severity rate, which represents the expected rate of realized loss upon disposition of the properties that have been foreclosed. Prior to 2006, we utilized industry loss assumptions for loans similar in credit, loan size, and product type in making estimates regarding the allowance for loan losses because we had limited historical loss data on past originations, all of which were sold servicing-released prior to October 2003. Beginning in the second quarter of 2006, we began to blend our own historical delinquency experiences with industry averages in estimating the percentage of loans that are delinquent 30+ days that will ultimately go to foreclosure. This resulted in an estimate that approximately 25% of the loans 30+ days delinquent will ultimately go to foreclosure. As a result of our actual experience in the current market environment, we also increased our estimate of the proportion of foreclosed properties that will be transferred to real estate owned during 2006. In addition to blending our own historical delinquency experiences with industry averages, we began to utilize historical loss experiences in estimating loss severity for pools for which we have significant realized loss experience. Applying this methodology individually to each pool yielded an estimated average loss severity of approximately 24% for 2003, 2004, 2005 and early 2006 vintage loans. We continue to use average loss severity estimates of 30% for loans originated in the second half of 2006 for which a material level of actual realized loss experience for its own loans is not available. These underlying assumptions and estimates are periodically evaluated and updated to reflect management’s current assessment of the value of the underlying collateral, actual historical loss experience, and other relevant factors impacting portfolio credit quality and inherent losses.
We define the beginning of the loss emergence period for a mortgage loan to be the occurrence of a contractual delinquency greater than 30 days. On a monthly basis, loans meeting this criterion are included in a determination of the allowance for loan losses based on roll rate and loss severity estimates. We assess homogenous groups of loans collectively for impairment. If actual results differ from our estimates, we may be required to adjust our provision accordingly. The use of different estimates or assumptions could produce different provisions for loan losses.
The provision for losses is charged to our consolidated statements of operations. Losses incurred on mortgage loans held for investment are charged to the allowance at the earlier of the time of liquidation or at the time the loan is transferred to real estate owned. Subsequent gains or losses at property disposal are recorded as a component of “Other income” on our consolidated statements of operation.
We place individual loans on non-accrual status when they are 90 days or more past-due or when, in the opinion of management, the collection of principal and interest is in doubt. At the time an individual loan is placed on non-accrual status, all previously accrued but uncollectible interest is reversed against current period interest income. In addition, we reserve for interest income accrued on our pool of homogeneous 30 and 60 day delinquent loans by estimating the interest due on the pool of loans that migrate to non-accrual status in the future on the basis of the same loss roll rate assumptions.
62
The impact on our allowance for loan loss as of December 31, 2006 if the assumptions utilized in our model had been varied are as follows:
| | | | |
($ in 000s) | | Change in
Allowance for Loan Losses | |
Allowance for loan losses—loans held for investment | | $ | 81,859 | |
Foreclosure rate after initial default: | | | | |
Increase in foreclosure rate estimate of 10% | | $ | 5,061 | |
Increase in foreclosure rate estimate of 20% | | | 6,619 | |
Decrease in foreclosure rate estimate of 10% | | | (9,821 | ) |
Decrease in foreclosure rate estimate of 20% | | | (17,986 | ) |
| |
Loss severity rate: | | | | |
Increase in loss severity rate estimate of 10% | | | 8,186 | |
Increase in loss severity rate estimate of 20% | | | 16,372 | |
Decrease in loss severity rate estimate of 10% | | | (8,186 | ) |
Decrease in loss severity rate estimate of 20% | | | (16,372 | ) |
| |
Change in both foreclosure rate and loss severity rate: | | | | |
Increase in foreclosure and loss severity rate estimate of 10% | | | 13,753 | |
Increase in foreclosure and loss severity rate estimate of 20% | | | 24,315 | |
Decrease in foreclosure and loss severity rate estimate of 10% | | | (17,025 | ) |
Decrease in foreclosure and loss severity rate estimate of 20% | | $ | (30,761 | ) |
Amortization of Deferred Loan Origination Costs and Deferred Debt Issuance Costs
Interest income on our mortgage loan portfolio is a combination of the accrual of interest based on the outstanding balance and contractual terms of the mortgage loans, adjusted by the amortization of net deferred origination costs related to originations in our investment portfolio, in accordance with Statement of Financial Accounting Standards No. 91, “Accounting for Nonrefundable Fees and Costs Associated with Originating or Acquiring Loans and Initial Direct Costs of Leases” (Statement No. 91). Our net deferred origination costs consist primarily of premiums, discounts and other net fees or costs directly associated with originating our mortgage loans, including commissions paid on closed loans. For our loans held for investment, these net deferred costs are amortized as adjustments to interest income over the estimated lives of the loans using the effective interest method. Because we hold a large number of similar loans for which prepayments are probable and for which we can reasonably estimate the timing of such prepayments, we use prepayment estimates in determining periodic amortization based on a model that considers actual prepayment experience to-date as well as forecasted prepayments based on the contractual interest rate on the loans, loan age, loan type, prepayment fee coverage and a variety of other factors. Mortgage prepayment forecasts are also affected by the terms and credit grades of the loans, conditions in the housing and financial markets, relative levels of interest rates, and general economic conditions. Prepayment assumptions are reviewed regularly to ensure that actual experience and industry data are supportive of prepayment assumptions used in our model. Updates that are required to be made to these estimates are applied as if the revised estimates had been in place since the origination of the loans and may result in adjustments to the current period amortization recorded to interest income.
Interest expense on our warehouse and securitization financing is a combination of the accrual of interest based on the contractual terms of the financing arrangements and the amortization of bond original issue discounts and issuance costs. The amortization of bond original issue discounts and issuance costs also considers estimated prepayments and is calculated using the effective interest method. The principal balance of the securitization financing is repaid as the related collateral principal balance amortizes, either through receipt of monthly mortgage payments or any loan prepayment. The deferred issuance costs and original issue discounts are amortized through interest expense over the estimated life of the outstanding balance of the securitization financing, utilizing the prepayment assumptions referenced above to estimate the average life of the related debt. Updates that are required to be made to these estimates are applied as if the revised estimates had been in place since the issuance of the related debt and result in adjustments to the period amortization recorded to interest expense.
63
We have sought to partially offset the impact to our net interest income of faster than anticipated prepayment rates by originating mortgage loans with prepayment fees. These fees typically expire two years after origination of a loan. As of December 31, 2006, approximately 84.7% of our mortgage loan portfolio had prepayment fee features. We anticipate that prepayment rates on our portfolio will increase as these predominately adjustable-rate loans reach their initial adjustments, typically 24 months after funding the loans. The varying prepayment rate, referred to on an annualized basis as the constant prepayment rate, or CPR, will be reforecast each quarter to project cash flows based upon historical industry data for similar loan products in the context of the current markets and our actual history to date. The forward-looking expected CPR used in our current assumptions averages 18 CPR during the first 12 months, averages 33 CPR through month 21, and increases to an average of 56 CPR during the months on and around the reset date, declining to an average 39 CPR thereafter. If prepayment speeds increase, our net interest margin would decrease due to the additional cost amortization, which may be partially offset by an increase in prepayment fee income. Conversely, if prepayment speeds decrease, our net interest margin would increase due to the reduced cost amortization, which may be partially offset by a decrease in prepayment fee income.
The following table presents the effects on our net interest income related to changes in our deferred origination cost amortization and deferred issuance cost amortization for the year ended December 31, 2006 under various prepayment rate scenarios. Actual prepayment fee income is recorded as cash, and is not based on CPR assumptions. Therefore, in instances where our CPR increases, we anticipate also having an increase in prepayment fee income that would partially offset the effects shown in the table below.
| | | | |
Year Ended December 31, 2006 | | Change in
Net Interest Income | |
Net interest income | | $ | 104,166 | |
Increase in CPR estimate of 10% | | $ | 2,531 | |
Increase in CPR estimate of 20% | | | 4,970 | |
Decrease in CPR estimate of 10% | | | (2,584 | ) |
Decrease in CPR estimate of 20%. | | $ | (5,373 | ) |
64
Economic Hedges
The economic hedging of our interest rate risk related to our loans held for sale is a critical aspect of our business because of its interest rate sensitivity and the difficulty in estimating which interest rate locks will convert to closed loans as interest rates fluctuate. We use various financial instruments to economically hedge our exposure to changes in interest rates. The financial instruments typically include mandatory delivery forward sale contracts of mortgage-backed securities, mandatory and best efforts whole-loan sale agreements and treasury note forward sales contracts. These financial instruments are intended to mitigate the interest rate risk inherent in providing interest rate lock commitments to prospective borrowers to finance one-to-four family homes and to economically hedge the value of our loans held for sale prior to entering fixed price sale contracts.
The interest rate locks for conforming loans and the mandatory forward sales, which are typically used to economically hedge the interest rate risk associated with these locks, are undesignated derivatives and are marked to market through earnings. For interest rate lock commitments related to conforming loans, mark to market adjustments are recorded from inception of the interest rate lock through the funding date of the underlying loan. The funded loans have not been designated by us as a qualifying hedged asset in accordance with Statement of Financial Accounting Standards No. 133, “Accounting for Derivative Instruments and Hedging Activities” (Statement No. 133). We record the funded loans on the consolidated statements of condition at the lower of cost or market value. The mandatory forward sales, which generally serve as an effective economic hedge from the inception of the interest rate lock through the time of the sale of the loans, remain subject to mark to market adjustments beyond the time the loan funds, and our reported earnings may reflect some non-economic volatility as a result of this differing treatment. The non-cash mark to market valuations of both our interest rate lock commitments and derivative instruments is reported as a component of “Gains on sales of mortgage loans, net.”
The interest rate lock commitments associated with non-conforming loans held for sale and the treasury note forward sales contracts typically used to economically hedge the interest rate risk associated with these locks are also derivatives and are marked to market through earnings. Similar to the conforming loans, the funded non-conforming loans have not been designated as a qualifying hedged asset in accordance with Statement No. 133, and accordingly, we record them at the lower of cost or market value on the consolidated statements of condition. The treasury note forward sales contracts, which do serve as an effective economic hedge prior to the sale of some of our non-conforming loans, remain subject to mark to market adjustments beyond the time the loans fund, and our reported earnings may reflect some non-economic volatility as a result of this differing treatment.
Relative to our loans held for investment, we economically hedge the effect of interest rate changes on our cash flows as a result of changes in LIBOR, our benchmark interest rate on which our interest payments on warehouse financing and securitization financing are based. These derivatives are not classified as cash flow hedges under Statement No. 133. We enter into interest rate swap agreements to economically hedge the financing on mortgage loans held for investment. The change in fair value of the derivative during the hedge period is reported as a component of “Other income —portfolio derivatives.” The periodic net cash settlements and any gain or loss on terminated contracts are also reported as a component of “Other income —portfolio derivatives.” We also entered into an interest rate cap agreement to economically hedge interest rate changes relative to our first securitization in the fourth quarter of 2003. The cap was not designated as a cash flow hedge instrument, and as such, realized and unrealized changes in its fair value are recognized as a component of “Other income (expense)-portfolio derivatives” during the period in which the changes occur. The interest rate cap expired in 2005.
Changes in the forward LIBOR curve during a reporting period will affect the mark to market valuations on our undesignated derivatives. Increases in the forward curve will result in a non-cash credit being recognized in our consolidated statements of operations, while decreases will result in a non-cash charge being recognized in our consolidated statements of operations. Changes in the relationship between the actual LIBOR rates during the period and the fixed rates contained in our swap agreements impact the net cash settlements received or paid during the period.
65
Stock-Based Compensation
We have adopted the fair value method of accounting for stock options and shares of restricted stock as prescribed by Statement of Financial Accounting Standards No. 123R,“Share-Based Payments”(Statement No. 123R). Under Statement No. 123R, compensation cost is measured at the grant date based on the fair value of the award and is recognized as expense on a straight-line basis over the award’s vesting period. The fair value of awards of restricted stock is determined at the date of grant based on the market price of our common stock on that date. For both the stock options and restricted stock, the amount of compensation cost is adjusted for estimated annual forfeitures. The fair value of the stock options is determined using the Black-Scholes option pricing model. Due to the subjective nature and estimates required under Statement No. 123R, we consider this a critical accounting policy.
Prior to the second quarter of 2006, we had previously estimated that 80% of the options granted to employees would ultimately vest, and we recognized expense based on the fair value of these options. During 2006, based on actual forfeiture experience to date, we revised our estimate of forfeitures and we now estimate 70% of the options granted will ultimately vest, and we adjusted stock compensation expense accordingly. This revision in estimate resulted in a decrease in stock compensation expense of $0.1 million 2006.
Reserve for Losses—Loans Sold
We maintain a reserve for our representation and warranty liabilities related to the sale of loans and for our contractual obligation to rebate a portion of any premium paid by a purchaser when a borrower prepays a sold loan within an agreed period. The representations and warranties generally relate to the accuracy and completeness of information related to the loans sold and to the collectibility of the initial payments following the sale of the loan. The reserve, which is recorded as a liability on our consolidated statements of condition, is established when loans are sold and is calculated as the fair value of losses estimated to occur over the life of the loan. The reserve for losses is established through a provision for losses, which is reflected as a reduction of the gain on the loans sold at the time of sale. We forecast future losses on current sales based on our analysis of our actual historical losses, stratified by type of loss, type of loan, lien position, collateral location, and year of sale. This analysis takes into consideration historical information regarding frequency and severity of losses and compares economic and real estate market trends which may have affected historical losses, and the potential impact of these trends to losses on current loans sold. We estimate losses due to premium recaptures on early loan prepayments by reviewing loan product and rate, borrower prepayment fee, if any, and estimates of future interest rate volatility. If the actual loss trend on loans sold varies compared to the loss provision previously forecast, an adjustment to the provision expense will be recorded as a change in estimate.
Real Estate Owned
Real estate owned (REO) results from us foreclosing on delinquent borrowers. These properties are held for sale and carried at the lesser of the carrying value or fair value less estimated selling costs, which requires us to make significant estimates and assumptions, including the accuracy of the appraisal value, the ultimate disposition of the property, and the associated costs. Individual properties are periodically evaluated and additional impairments are recorded, if necessary.
Deferred Tax Assets
We have deferred tax assets related to the net operating loss of our TRS, FMC, and various temporary book to tax differences in accordance with Statement of Financial Accounting Standards No. 109,“Accounting for Income Taxes”(Statement No. 109). We regularly assess the recoverability of these assets based on projections of future operating results and management’s tax planning strategies. Based on this evaluation, we believe that all of the deferred tax assets recorded in our consolidated financial statements at December 31, 2006 are more likely than not of being recoverable. Management did not consider the affects, if any, of the proposed merger with C-BASS when evaluating the recoverability of the deferred tax asset.
Results of Operations
Year Ended December 31, 2006 Compared to Years Ended December 31, 2005 and 2004
Net Income
We reported a net loss of $68.4 million for the year ended December 31, 2006 compared to net income of $99.4 million for the year ended December 31, 2005. The decrease in net income was due primarily to decreases in both our net gains on sale and net interest income due to a decline in net interest margin on loans originated in 2006,
66
increases in our provision for loan losses, and unfavorable fluctuations in results from our derivative contracts. Results of operations for the year ended December 31, 2006 were also negatively impacted by the inclusion of $10.6 million of charges related to the settlement of the Bass litigation described in Item 3- Legal Proceedings and a $0.9 million pre-tax loss on the disposal of our discontinued operations, while no comparable amounts were included in the prior year.
Our net interest income decreased to $104.2 million in 2006 from $163.7 million in 2005 due primarily to a decrease in our average interest spread, which is the difference between the coupon interest rate on our loans to borrowers and the interest rate we incur for the debt financing of the loan, which was partially offset by a higher average balance of loans. Net interest margin, including the net cash received on our swaps, declined to 2.24% in 2006 from 3.37% in the previous year. The cost of financing for loans held for investment increased as our weighted average swap rate rose as older, lower rate swaps expired and were replaced with new swaps at current market rates, resulting in an increase in our weighted average swap rate to 4.8% as of December 31, 2006 from 3.2% at the end of 2005. Market competition for new loans remained intense, as total originations have declined in 2006, and did not permit coupons on new originations to increase at the same rate as the increase in our financing costs for the loans, narrowing the spreads available on new loans.
Gains on sales of mortgage loans, net decreased to $17.0 million in 2006, compared with $61.2 million last year due to decreased sales premiums earned during 2006 as a result of the reduction in the net interest spread available on new originations combined with decreased sales volumes in the current year and investor concerns about repurchase requests. Loans held for sale have experienced similar delinquency and loss performance as the loans in the investment portfolio, and we may be required to repurchase loans sold to investors that become delinquent within a specified period of the date of sale, necessitating a reserve for these repurchases, which is recorded as a reduction in gains on sale. The provision for losses on repurchased loans increased $8.2 million in 2006 compared to 2005. The decreased gains on sales, net, was further exacerbated by a decline in the market value of certain second lien products due to slowing home price appreciation, increased industry-wide defaults on second lien loans, and rating agency forecasts of a decline in second lien performance, which resulted in pre-tax charges of $4.2 million during 2006 to reduce these loans to the lower of cost or market value, which was recorded as a reduction in the gains on sales of mortgage loans, net.
Our provision for loan losses increased to $69.1 million in 2006 from $30.1 million in 2005 as the result of a sharp increase in delinquencies on more recent loan originations and the aging of our portfolio. In response to the sharp rise in the delinquency and loss rates, we have accelerated our intervention on delinquent loans, engaged a delinquency and loss mitigation monitor for our 2006 loans, limited the age of appraisals and narrowed acceptable thresholds for the automated verification of property values, ceased originating products with the highest delinquency rates, and initiated plans to directly board our loans held for investment with our servicer to avoid immediate servicing transfer.
We use interest rate swaps to hedge the variable rate financing costs for the fixed rate period of our hybrid ARM mortgage loans held for investment. Because these derivatives are not designated as cash flow hedges under Statement of Financial Accounting Standards No. 133, “Accounting for Derivative Instruments and Hedging Activities,”(Statement No. 133) changes in the fair market value of the swaps and caps are recognized in current period earnings and reported in our consolidated statement of operations in “Other income — portfolio derivatives.” Net cash settlements, representing the difference between the swapped interest rate and the actual interest rates, are also recognized in the line item “Other income – portfolio derivatives” on the consolidated statements of operations. Our policy has been to hedge approximately 90% of the debt collateralizing our loans held for investment during their fixed interest rate period, “locking in” the interest spread for the hedged debt. Results of operations for 2006 include losses of $27.2 million related to the decreases in the fair market value of our derivative contracts compared to gains of $9.0 million included in 2005 results. The mark to market loss on derivative contracts is the result of the decline in the forward LIBOR curve during the quarter. The current decline in the market value of existing swaps indicates the expectation of an offsetting future decline in bond interest expense, and our net cash flow on the loans and debt outstanding remain the same regardless of whether the forecast changes in interest rates occur. Partially offsetting the unfavorable change in fair value, net cash settlements received on our swaps increased $17.0 million in 2006 compared to the prior year as a result of fluctuations in the swapped interest rate and the actual LIBOR during the period.
67
The $99.4 million net income for 2005 compares to net income of $63.6 million for the year ended December 31, 2004. Results of operations for 2005 compared to 2004 were negatively impacted by the increased provision for loan losses, decreased net yield on loans held for investment, decreased sales premiums on loans held for sale, and increased mark to market losses on our derivative contracts used to economically hedge our portfolio.
Revenues
Net Interest Income after Provision for Loan Losses
The components of net interest income after provision for loan losses for the years ended December 31, 2006, 2005 and 2004 are as follows:
| | | | | | | | | | | | |
| | | Year Ended December 31, | |
($ in 000s) | | 2006 | | | 2005 | | | 2004 | |
Interest income: | | | | | | | | | | | | |
Coupon interest income on loans held for investment | | $ | 412,997 | | | $ | 337,045 | | | $ | 207,138 | |
Coupon interest income on loans held for sale | | | 31,051 | | | | 31,095 | | | | 20,172 | |
Amortization of deferred origination costs | | | (23,276 | ) | | | (25,515 | ) | | | (12,710 | ) |
Prepayment fees | | | 19,954 | | | | 32,991 | | | | 12,032 | |
| | | | | | | | | | | | |
Total interest income | | | 440,726 | | | | 375,616 | | | | 226,632 | |
| | | | | | | | | | | | |
Interest expense: | | | | | | | | | | | | |
Financing interest expense on loans held for investment1 | | | 310,341 | | | | 187,727 | | | | 63,941 | |
Financing interest expense on loans held for sale | | | 16,599 | | | | 13,222 | | | | 3,273 | |
Amortization of deferred bond issuance costs and issue discount | | | 9,620 | | | | 10,961 | | | | 5,098 | |
| | | | | | | | | | | | |
Total interest expense | | | 336,560 | | | | 211,910 | | | | 72,312 | |
| | | | | | | | | | | | |
Net interest income | | | 104,166 | | | | 163,706 | | | | 154,320 | |
Provision for loan losses—loans held for investment | | | 69,062 | | | | 30,065 | | | | 21,556 | |
| | | | | | | | | | | | |
Net interest income after provision for loan losses | | $ | 35,104 | | | $ | 133,641 | | | $ | 132,764 | |
| | | | | | | | | | | | |
1 | Does not include the effect of the interest rate swap and cap agreements which economically hedge our portfolio of financing costs. |
68
The average balances for our loans held for investment and loans held for sale and our related warehouse and securitization financing, along with the corresponding annualized yields for the years ended December 31, 2006, 2005, and 2004 are as follows:
| | | | | | | | | | | | |
| | | Year Ended December 31, | |
($ in 000s) | | 2006 | | | 2005 | | | 2004 | |
Average balances: | | | | | | | | | | | | |
Mortgage loans held for investment | | $ | 5,643,226 | | | $ | 4,971,731 | | | $ | 3,072,684 | |
Securitization financing—loans held for investment | | | 4,981,265 | | | | 4,364,266 | | | | 2,251,980 | |
Warehouse financing—loans held for investment | | | 588,384 | | | | 482,024 | | | | 616,181 | |
Yield analysis—loans held for investment: | | | | | | | | | | | | |
Coupon interest income on loans held for investment | | | 7.22 | % | | | 6.69 | % | | | 6.63 | % |
Amortization of deferred origination costs | | | (0.41 | )% | | | (0.51 | )% | | | (0.41 | )% |
Prepayment fees | | | 0.35 | % | | | 0.65 | % | | | 0.39 | % |
| | | | | | | | | | | | |
Yield on loans held for investment | | | 7.16 | % | | | 6.83 | % | | | 6.61 | % |
Interest expense securitization financing1 | | | 5.45 | % | | | 3.77 | % | | | 2.04 | % |
Interest expense warehouse financing | | | 5.85 | % | | | 4.31 | % | | | 2.74 | % |
Amortization—deferred bond issuance costs and issue discount | | | 0.19 | % | | | 0.25 | % | | | 0.22 | % |
| | | | | | | | | | | | |
Cost of financing for loans held for investment1 | | | 5.67 | % | | | 4.04 | % | | | 2.37 | % |
| | | | | | | | | | | | |
Net yield on loans held for investment | | | 1.57 | % | | | 2.89 | % | | | 4.40 | % |
Provision for loan losses as % of average loan balance | | | (1.21 | )% | | | (0.60 | )% | | | (0.69 | )% |
| | | | | | | | | | | | |
Net yield on loans held for investment after provision for loan losses1 | | | 0.36 | % | | | 2.29 | % | | | 3.71 | % |
| | | | | | | | | | | | |
| | | |
Average balances: | | | | | | | | | | | | |
Mortgage loans held for sale | | $ | 387,077 | | | $ | 408,732 | | | $ | 260,750 | |
Warehouse financing—loans held for sale | | | 296,660 | | | | 296,406 | | | | 125,406 | |
| | | |
Yield analysis—loans held for sale: | | | | | | | | | | | | |
Yield on loans held for sale | | | 7.91 | % | | | 7.50 | % | | | 7.60 | % |
Cost of financing for loans held for sale | | | 5.52 | % | | | 4.40 | % | | | 2.56 | % |
Net yield on loans held for sale2 | | | 3.68 | % | | | 4.31 | % | | | 6.37 | % |
| | | |
Combined yield—net interest income after provision for loan losses, loans held for investment and held for sale | | | 0.58 | % | | | 2.45 | % | | | 3.92 | % |
1 | Does not include the effect of the interest rate swap and cap agreements which economically hedge our portfolio of financing costs. |
2 | Calculated as the annualized net interest income divided by the average daily balance of mortgage loans. The net yield on loans will not equal the difference between the yield on loans and the cost of financing due to the difference in the denominators of the two calculations. |
Net Interest Income after Provision for Loan Losses Earned on Loans Held for Investment
Interest income on loans held for investment increased to $409.7 million in 2006 from $344.5 million in 2005 primarily due to higher coupon rates and a higher average portfolio balance in 2006. Our average portfolio balance increased by approximately $0.7 billion in 2006.
Yield on loans held for investment increased to 7.16% in 2006 from 6.83% in 2005 as a result of higher coupons on new loans added to the portfolio during the year and the increase in the coupon on the loans that reached their resets from fixed to adjustable rates during the period.
Interest expense for both warehouse and securitization financings rose in 2006 compared to 2005 due to higher interest rates and outstanding balances. Our average cost of financing for loans held for investment increased to 5.67% in 2006 compared to 4.04% in 2005.
As discussed above, our cost of financing new loans has increased more rapidly than the rise in coupon rates due to intense competition for new originations in a market environment with declining total origination volume. As a result, new originations during the year generally had a narrower net interest spread, and we expect this to continue into 2007, while we expect loans originated during periods of higher margin spreads to continue to prepay.
69
Prepayment fee income, which constitutes a portion of the net interest margin earned by our portfolio, has declined to 0.35% of our portfolio balance during 2006 compared to 0.65% in 2005 as borrowers are increasingly deferring the prepayment of their loan until after the expiration of their prepay fee period in the current market.
The $89.7 million of net interest income before provision for loan losses earned in 2006 on loans held for investment in 2006 does not include the $41.4 million of net cash settlements received under the terms of the swap agreements used to economically hedge the financing costs of our loans held for investment, which is included in the line item “Other income —portfolio derivatives” in the consolidated statement of operations.
Provision for loan losses increased in 2006 compared to 2005 due primarily to the sharp rise in delinquencies and faster transition to foreclosure experienced on more recent loan originations. The increase in the delinquencies was partially offset by a reduction in our loss severity estimates, as actual life to date loss experience continued to be lower than forecast due to the strategy our subservicer uses in dealing with foreclosures, the housing markets in the geographical regions in which the realized losses have been located, strong home price appreciation in 2003 through early 2005, and faster than anticipated prepayment speeds on older vintages. In response to the sharp rise in the delinquency and loss rates, we have accelerated our intervention on delinquent loans, engaged a delinquency and loss mitigation monitor for our 2006 loans, limited the age of appraisals and narrowed acceptable thresholds for the automated verification of property values, ceased originating products with the highest delinquency rates, and initiated plans to directly board our loans held for investment with our servicer to avoid immediate servicing transfer. We hope to see the impact of these initiatives in 2007.
As a result of the above factors, net interest income after the provision for loan losses on loans held for investment decreased to $35.1 million in 2006 from $133.6 million in 2005.
The increase in net interest income on loans held for investment in 2005 compared to 2004, was primarily due to increased coupon rates on new loans and an increased average portfolio balance, partially offset by increased cost of financing for the loans. Provision for loan losses increased in 2005 compared to 2004 due to the increase in delinquencies as the portfolio aged.
Net Interest Income Earned on Loans Held for Sale
Net interest income earned on loans held for sale includes the net interest spread on our loans held for sale during the period from funding to sale date. Our loans held for sale generated net interest income of $14.5 million in 2006 compared to $17.9 million and $16.9 million, respectively, in 2005 and 2004. The decrease in net interest income in 2006 is due to the decreases in both the average balance of loans held for sale and the net yield. The average balance of loans held for sale decreased due to the decreased origination volume in the current year and the sale of our conforming division in the first quarter of 2006. Net yield declined to 3.68% in 2006 from 4.31% in 2005, reflecting the decreases in the net interest spread available on new loans due to rising market rates, intense competition for new originations, and investor concerns over repurchase requests. We expect this trend to continue into 2007.
Net interest income increased in 2005 compared to 2004 due to an increased average balance of loans held for sale, partially offset by decreased net yield.
70
Gains on Sales of Mortgage Loans, Net
The components of the gains on sale of mortgage loans, net for the years ended December 31, 2006, 2005, and 2004are as follows:
| | | | | | | | | | | | | | | | | | | | | |
| | | Year Ended December 31, | |
($ in 000s) | | 2006 | | | % of Sales Volume | | | 2005 | | | % of Sales Volume | | | 2004 | | | % of Sales Volume | |
Gross premiums—whole loan sales, net of hedging gains or losses | | $ | 46,747 | | | 1.8 | % | | $ | 85,417 | | | 2.8 | % | | $ | 68,245 | | | 2.9 | % |
Fees collected, net of premiums paid1 | | | 7,488 | | | 0.3 | % | | | 3,498 | | | 0.1 | % | | | 3,929 | | | 0.2 | % |
Direct origination costs1 | | | (19,673 | ) | | (0.7 | %) | | | (23,758 | ) | | (0.8 | %) | | | (21,098 | ) | | (0.9 | %) |
| | | | | | | | | | | | | | | | | | | | | |
Subtotal | | | 34,562 | | | 1.4 | % | | | 65,157 | | | 2.1 | % | | | 51,076 | | | 2.2 | % |
Allowance to reduce loans held for sale to the lower of cost or market | | | (4,156 | ) | | (0.1 | %) | | | — | | | — | | | | — | | | — | |
Provision for losses—sold loans | | | (13,361 | ) | | (0.5 | %) | | | (3,959 | ) | | (0.1 | %) | | | (8,298 | ) | | (0.4 | %) |
| | | | | | | | | | | | | | | | | | | | | |
Gains on sales of mortgage loans, net | | $ | 17,047 | | | 0.8 | % | | $ | 61,198 | | | 2.0 | % | | $ | 42,778 | | | 1.8 | % |
| | | | | | | | | | | | | | | | | | | | | |
Loan sales volume | | $ | 2,667,114 | | | | | | $ | 3,103,598 | | | | | | $ | 2,374,178 | | | | |
| | | | | | | | | | | | | | | | | | | | | |
1 | Loan fees collected, premiums paid and direct origination costs are deferred at funding and recognized on settlement of the loan sale. |
The gross premiums on whole loan sales, net of hedging gains or losses, for first and second lien loans sold for the years ended December 31, 2006, 2005, and 2004 are as follows:
| | | | | | | | | |
| | | Year Ended December 31, | |
| | | 2006 | | | 2005 | | | 2004 | |
Gross whole loan sale premiums, net of hedging gains or losses: | | | | | | | | | |
First lien mortgage loans | | 2.0 | % | | 3.1 | % | | 3.0 | % |
Second lien mortgage loans | | 0.1 | % | | 1.5 | % | | 2.5 | % |
Total | | 1.8 | % | | 2.8 | % | | 2.9 | % |
The gains on sales of mortgage loans, net, decreased to $17.0 million in 2006 from $61.2 million in 2005 due primarily to lower sales volumes, decreased sales premiums on loans sold, increased provision for loan losses on loans sold, and a decline in the market value of certain second lien products in 2006 that necessitated a charge to reduce these loans to their lower of cost or market value.
The year over year decrease in sales volumes was due primarily to decreased originations in 2006. The decision to retain second lien loans that met return criteria for investment beginning in the third quarter of 2006 in response to the decline in market value of these types of loans as described below also decreased sales volumes.
Sales premiums earned on first lien mortgages declined to 2.0% in 2006 from 3.1% in 2005, as a result of the market-driven reduction in the net interest spread on new loans sold. We expect gross sale premiums to continue at the lower levels into 2007 as the industry responds to increased competition, triggered in part by a decline in the overall mortgage market, by continuing to originate loans with reduced interest spreads.
As a result of slowing home price appreciation, increased industry-wide defaults on second lien loans, and an increase in the forecast of losses on pools of second lien loans, the market value of second lien loans declined below par value during 2006. As a result, we recognized $4.2 million of pre-tax charges to gains on sales of loans to reduce our second lien loan inventory to their lower of cost or market value. We chose to hold certain second lien loans which met our expected return criteria for investment following these declines in market value. Additionally, we discontinued the origination of lower FICO second lien products whose market value has been the most severely affected.
The reduction in gains on sales, net, during 2006 was also due to a $8.2 million increase in the provision for loan losses on loans sold. Loans held for sale have experienced similar delinquency and loss performance as the loans in the investment portfolio, and we may be required to repurchase loans sold to investors that become delinquent within a specified period of the date of sale, necessitating a reserve for these repurchases, which is recorded as a reduction in gains on sale.
71
The increase in gains on sales of mortgage loans, net, for the year ended December 31, 2005 compared to 2004 is due primarily to the increase in sales volume year over year.
We maintained a $3.6 million valuation allowance on $16.1 million of unsaleable loans with documentation deficiencies or delinquency histories as of December 31, 2006, compared to a $1.1 million valuation allowance on $5.2 million of unsaleable loans as of December 31, 2005. The increase as of December 31, 2006 is due to the increased repurchase requests we received in 2006.
Other Income—Portfolio Derivatives
We use derivative contracts to create economic hedges of the variable rate debt financing of our portfolio of non-conforming mortgages held for investment.
During the period that our loans have a fixed interest rate, generally the first two to three years of the loan, an increase in interest rates will increase our cost of financing for the debt related to those loans without a corresponding increase in the interest income we receive from borrowers. We mitigate the risk of adverse effects of changes in interest rates during this period using interest rate swaps. Under these swap agreements, which are generally for a period of two years, we contract to pay a fixed interest rate on a notional balance to the counterparty in exchange for receiving from them the actual LIBOR on the notional balance. We currently economically hedge approximately 90% of the debt in our portfolio related to the fixed interest rate period of the loans. We do not economically hedge any debt that has a floating interest rate, as any impact of a change in interest rates would have offsetting increases on both our cost of financing and our interest income. Management continues to evaluate our hedging strategy, and may modify our hedging in future periods by utilizing different types of contracts or electing to economically hedge less than 90% of our debt during the fixed interest rate period of the loans.
Changes in the fair value of these agreements, which reflect the potential future cash settlements over the remaining lives of the agreements according to the market’s changing projections of interest rates, are recognized in the line item “Other income —portfolio derivatives” in the consolidated statements of operations. Net cash settlements, which reflect the relationship between the actual benchmark interest rate and the fixed swap rate during the period, are also included in the line item “Other income —portfolio derivatives.”
The amount of cash settlements and non-cash changes in value that were included in “Other income —portfolio derivatives” is as follows for the years ended December 31, 2006, 2005, and 2004 are as follows:
| | | | | | | | | | | |
| | | Year Ended December 31, | |
($ in 000s) | | 2006 | | | 2005 | | 2004 | |
Non-cash changes in fair value | | $ | (27,224 | ) | | $ | 8,999 | | $ | 20,512 | |
Net cash settlements | | | 41,436 | | | | 24,470 | | | (11,723 | ) |
| | | | | | | | | | | |
Other income —portfolio derivatives | | $ | 14,212 | | | $ | 33,469 | | $ | 8,789 | |
| | | | | | | | | | | |
Our portfolio derivatives allow us to “lock-in” the expected financing costs of our investment portfolio over a future contractual time period. At December 31, 2006, 2005, and 2004, the notional balance of our interest rate swaps was $4.2 billion, $5.0 billion, and $3.7 billion, respectively.
We have multiple interest rate swap agreements that aggregate to provide our total hedge coverage, and our interest expense during any given period will be impacted by the weighted average interest rate of the existing swap agreements. Our older, lower rate swaps are expiring and are being replaced by swap agreements that bear higher interest rates, as interest rates have consistently risen throughout 2005 and 2006. The rise in our weighted average swap rate has been partially offset by increased coupon rates on our loans as a result of the rising interest rates.
72
The following chart illustrates the weighted average coupon rate on the loans in our investment portfolio and the weighted average interest rate of our swap agreements for the periods presented:

Our results of operations for 2006 include losses of $27.2 million related to the decreases in the fair market value of our derivative contracts compared to gains of $9.0 million included in 2005 results. The mark to market loss on derivative contracts is the result of the decline in the forward LIBOR curve during the quarter. The current decline in the market value of existing swaps indicates the expectation of an offsetting future decline in bond interest expense, and our net cash flow on the loans and debt outstanding remain the same regardless of whether the forecast changes in interest rates occur. Partially offsetting the unfavorable change in fair value, net cash settlements received on our swaps increased $17.0 million in 2006 compared to the prior year as a result of fluctuations in the swapped interest rate and the actual LIBOR during the period. We cannot predict the future path of interest rates, nor can we predict in a definitive manner the magnitude by which these changes in interest rates may impact our results of operations during periods of interest rate volatility.
Expenses
Total expenses and the percentage change from the prior period, for the years ended December 31, 2006, 2005, and 2004:
| | | | | | | | | | | | |
| | | Year Ended December 31, | |
($ in 000s) | | 2006 | | | 2005 | | | 2004 | |
Salaries and employee benefits | | $ | 77,995 | | | $ | 73,720 | | | $ | 71,969 | |
Occupancy | | | 8,065 | | | | 6,716 | | | | 5,950 | |
Depreciation and amortization | | | 4,241 | | | | 3,317 | | | | 2,550 | |
Servicing fees | | | 10,580 | | | | 8,718 | | | | 6,499 | |
General and administration | | | 42,783 | | | | 30,998 | | | | 28,848 | |
| | | | | | | | | | | | |
Total expenses | | $ | 143,664 | | | $ | 123,469 | | | $ | 115,816 | |
| | | | | | | | | | | | |
Percentage change from prior period | | | 16 | % | | | 7 | % | | | 22 | % |
Total Expenses. Total expenses increased in 2006 compared to 2005 and 2004 due primarily to costs related to the growth of our loan portfolio and development of our corporate infrastructure. The increase in total expenses in 2006 is also due to the inclusion of $10.6 million of charges related to the settlement of the Bass litigation, while no comparable amounts were included in either 2005 or 2004. We have also incurred $1.0 million of costs related to the consolidation of operations centers and increased legal expenses during 2006. The costs related to consolidating operations centers were accelerated and recognized in 2006 in accordance with GAAP, but will reduce recurring costs in future periods. Increases in total expenses in 2006 were also attributable to increases in third party servicing fees on the higher average balance of our loan portfolio, additional corporate office personnel to facilitate
73
compliance with the Sarbanes-Oxley Act of 2002 and development of our infrastructure for other public-company functions, and additional costs to support initiatives related to information technology improvements. To mitigate these increased costs, we have implemented various cost management initiatives, including pricing and commission changes, increased use of technology, vendor restructuring, and consolidation of several operations centers. We realized modest benefit from these initiatives in the fourth quarter of 2006, and we expect to fully realize the impact of these initiatives, as well as additional cost management initiatives we are in the process of evaluating as the current market conditions continue to evolve, including further operations consolidation and a proportional reduction in home office staff, in 2007.
We have replaced our two non-integrated conforming and non-conforming origination software systems with a single, integrated system to serve as both the conforming and non-conforming origination and funding support system, and have upgraded “Fieldscore,” our pre-approval and credit gathering engine. The project involved purchasing, developing, installing, training and supporting the new system, which has been fully implemented. Costs related to these technology enhancements include maintenance, depreciation, and amortization, as well as increased personnel costs due to increased technology staffing levels during the upgrade. We capitalized $5.7 million for these development initiatives, and expensed approximately $1.5 million in 2006. We expect our expenses related to the new technologies to increase in 2007 due to the inclusion of a full year of amortization of all of the capitalized costs related to these initiatives.
Salaries and Employee Benefits.Salaries and benefits include salaries, benefits, and payroll taxes that have not been designated as direct costs of loan origination. Salaries are relatively fixed at any point based on our existing staffing levels, which generally correlate to current and future estimated origination volumes. The increase in salaries and employee benefits for the year ended December 31, 2006 compared to 2005 is due to the additional internal staffing requirements of operating as a public company, including compliance with the Sarbanes-Oxley Act of 2002, and additional information technology personnel to support our ongoing technological enhancements in access and security controls. Also, severance costs increased due to the sale of the conforming division in the first quarter of 2006 and various consolidations throughout the year as part of our cost management initiatives.
Servicing Fees. Servicing fees paid to our third party servicer of the loans in our portfolio increased in 2006 compared to 2005 and 2004. Servicing fees vary with the number of loans held for investment, and all of our loans held for investment are currently serviced by a third party servicer. The increase in servicing fees in 2006 is due primarily to an increase in the average balance of our portfolio. In addition, compensatory interest received from the servicer that was netted against servicing fees decreased to approximately $1.1 million in 2006 compared to approximately $2.0 million in 2005, which included amounts related to periods prior to 2005. These increases were partially offset by lower servicing rates on a per-loan basis negotiated with our third party servicer on recently issued securitization deals.
General and Administration. General and administration expenses increased in 2006 compared to 2005 and 2004 due primarily to the inclusion of the charges related to the Bass settlement as well as increased audit fees for our re-audit of financial results for the years ended December 31, 2004 and 2003, increased professional service fees to facilitate compliance with the Sarbanes-Oxley Act of 2002, the depreciation and amortization of our new loan origination software system, which began in late 2005, and increased legal expenses in 2006 related to outstanding cases during that period. We expect general and administration expenses to decrease in 2007, as our new cost management initiatives, which are described under Total Expenses above, are expected to substantially offset variable loan related costs, and the incremental expenses related to our new loan origination software system. Our expectation of decreased general and administrative costs in 2007 also reflects that we do not expect such expenses to include any amounts comparable to the Bass settlement that was included in 2006.
74
Income Tax Benefit.We qualified to be taxed as a REIT, effective beginning in the fourth quarter of 2003, and we elected to treat our loan origination and sale subsidiary, FMC, as a taxable REIT subsidiary (TRS). A TRS is a corporation that is permitted to engage in non-qualifying REIT activities. Taxable income of our TRS is subject to federal, state, and local income taxes. Income tax expense reflects the following effective tax rates:
| | | | | | | | | | | | |
| | | Year Ended December 31, | |
($ in 000s) | | 2006 | | | 2005 | | | 2004 | |
Income tax benefit (expense) | | $ | 14.1 | | | $ | (3.6 | ) | | $ | (5.9 | ) |
FMC pre-tax net income(loss) | | | (40.0 | ) | | | 9.6 | | | | 10.1 | |
Effective tax rate | | | 36% | | | | 37% | | | | 59% | |
In the fourth quarter of 2003 and the second quarter of 2005, FMC sold non–conforming loans to FIC, for inclusion in our investment portfolio. While the intercompany gains on sale of loans were eliminated in the consolidated statement of operations, the portion of the income tax expense related to those loans which remained on the consolidated statements of condition at reporting period end was deferred and subsequently recognized as an increase to income tax expense over the life of the loans.
The effective tax rates in 2006 and 2005 reflect a 35% federal rate and an approximate 5% state tax rate, net of federal benefit, and include approximately $1.1 million and $0.3 million, respectively, of deferred tax amortization related to the deferral of income tax expense on the intercompany gain on loans sold from FMC to FIC. The higher effective rate in 2004 includes $2.0 million of deferred tax amortization related to the 2003 intercompany sale. Based on the current geographic mix of business, the effective tax rate on FMC’s pretax earnings in 2007 is expected to be approximately 39%, prior to the amortization of the deferred tax asset referenced above.
Consolidated Statements of Condition at December 31, 2006 and 2005
Mortgage Loans Held for Investment
The principal balance of our investment portfolio as of December 31, 2006 and 2005 is as follows:
| | | | | | | | |
| | | Year Ended December 31, | |
($ in 000s) | | 2006 | | | 2005 | |
Beginning principal balance | | $ | 5,530,216 | | | $ | 4,735,063 | |
Loan fundings | | | 2,448,342 | | | | 3,341,911 | |
Payoffs and principal reductions | | | (2,444,971 | ) | | | (1,981,866 | ) |
Transfers to mortgage loans held for sale, net | | | — | | | | (530,830 | ) |
Transfers from mortgage loans held for sale, net | | | 164,454 | | | | — | |
Transfers to real estate owned | | | (128,301 | ) | | | (34,062 | ) |
| | | | | | | | |
Ending principal balance | | | 5,569,740 | | | | 5,530,216 | |
Net deferred loan origination (fees)/costs | | | 31,457 | | | | 40,199 | |
| | | | | | | | |
Ending balance loans held for investment | | | 5,601,197 | | | | 5,570,415 | |
Allowance for loan losses | | | (81,859 | ) | | | (44,122 | ) |
| | | | | | | | |
Ending balance loans held for investment, net | | $ | 5,519,338 | | | $ | 5,526,293 | |
| | | | | | | | |
We originated $2.4 billion in new loans for the portfolio during 2006, and the increase in the portfolio balance is the result of these new fundings exceeding payoffs during the year. The portfolio generated $89.7 million of net interest income before provision for loan losses.
We estimate prepayment speeds based upon historical industry data for similar loan products and actual history to date, which are adjusted for current market assumptions regarding future economic conditions such as home price appreciation and interest rate forecasts. These assumptions for prepayment speeds indicate an average loan life of approximately 23 months. There can be no assurance that this industry data will be reflective of our actual results.
We currently intend to reduce our portfolio leverage from the 13.9:1 as of December 31, 2006 to approach our target leverage of approximately 13:1. Accordingly, we expect to classify a larger proportion of future originations as held for sale than has been our historical tendency, dependent upon the speed at which the loans currently included in the portfolio are repaid.
75
Allowance for Loan Losses—Loans Held for Investment
The allowance for loan loss activity of our investment portfolio for the years ended December 31, 2006 and 2005 was as follows:
| | | | | | | | |
| | | Year Ended December 31, | |
($ in 000s) | | 2006 | | | 2005 | |
Beginning balance allowance for loan losses | | $ | 44,122 | | | $ | 22,648 | |
Provision | | | 69,062 | | | | 30,065 | |
Charge-offs | | | (31,325 | ) | | | (9,438 | ) |
Recoveries | | | — | | | | 847 | |
| | | | | | | | |
Ending balance allowance for loan losses | | $ | 81,859 | | | $ | 44,122 | |
| | | | | | | | |
Ending principal balance, mortgage loans held for investment | | $ | 5,569,740 | | | $ | 5,530,216 | |
Ending allowance balance as % of ending principal balance | | | 1.5 | % | | | 0.8 | % |
The delinquency status of our loans held for investment as of December 31, 2006 and December 31, 2005 was as follows:
| | | | | | | | | | | | | | |
| | | December 31, 2006 | | | December 31, 2005 | |
($ in 000s) | | Principal
Balance | | | Percentage
of Total | | | Principal
Balance | | | Percentage
of Total | |
Current | | $ | 4,348,051 | | | 78.1 | % | | $ | 4,925,656 | | | 89.1 | % |
30 days past due | | | 610,876 | | | 11.0 | % | | | 359,074 | | | 6.5 | % |
60 days past due | | | 234,080 | | | 4.2 | % | | | 93,663 | | | 1.7 | % |
90+ days past due | | | 146,867 | | | 2.6 | % | | | 65,810 | | | 1.2 | % |
In process of foreclosure | | | 229,866 | | | 4.1 | % | | | 86,013 | | | 1.5 | % |
| | | | | | | | | | | | | | |
Total | | $ | 5,569,740 | | | 100.0 | % | | $ | 5,530,216 | | | 100.0 | % |
| | | | | | | | | | | | | | |
Allowance for loan losses | | $ | 81,859 | | | | | | $ | 44,122 | | | | |
| | | | | | | | | | | | | | |
Allowance for loan losses as a % of total delinquent loans (30+ days past due and loans in the process of foreclosure) | | | 6.7 | % | | | | | | 7.3 | % | | | |
| | | | | | | | | | | | | | |
76
Delinquency, life to date loss experience and weighted average coupon of our loans held for investment by securitization pool as of December 31, 2006 and 2005 were as follows:
| | | | | | | | | | | | | | | | | |
| | | As of December 31, 2006 |
($ in 000s) | | Current
Principal
Balance | | Current
Balance as
Factor of
Original
Principal | | | % of Principal
Balance
Seriously
Delinquent | | | % of Cumulative
Realized
Losses | | | Weighted Avg. Coupon | | | Avg. Age
of Loans
from
Funding
(months) |
Loans held for investment-securitized: | | | | | | | | | | | | | | | | | |
FMIT Series 2004-3 | | $ | 161,085 | | 16 | % | | 25.3 | % | | 0.58 | % | | 8.79 | % | | 32 |
FMIT Series 2004-4 | | | 169,979 | | 19 | % | | 27.5 | % | | 0.63 | % | | 9.37 | % | | 29 |
FMIT Series 2004-5 | | | 234,345 | | 26 | % | | 19.7 | % | | 0.56 | % | | 9.11 | % | | 27 |
FMIT Series 2005-1 | | | 333,728 | | 44 | % | | 10.7 | % | | 0.58 | % | | 7.65 | % | | 25 |
FMIT Series 2005-2 | | | 677,886 | | 70 | % | | 10.3 | % | | 0.48 | % | | 7.10 | % | | 19 |
FMIT Series 2005-3 | | | 919,949 | | 79 | % | | 10.2 | % | | 0.31 | % | | 7.28 | % | | 15 |
FMIT Series 2006-1 | | | 803,197 | | 86 | % | | 11.6 | % | | 0.31 | % | | 7.89 | % | | 12 |
FMIT Series 2006-2 | | | 755,241 | | 94 | % | | 10.6 | % | | 0.06 | % | | 8.25 | % | | 6 |
FMIT Series 2006-3 | | | 828,546 | | 96 | % | | 4.6 | % | | 0.00 | % | | 8.40 | % | | 3 |
FMIT Series 2006-S1 | | | 193,282 | | 100 | % | | 0.1 | % | | 0.00 | % | | 10.92 | % | | 3 |
| | | | | | | | | | | | | | | | | |
Total | | | 5,077,238 | | 60 | % | | 10.7 | % | | 0.38 | % | | | | | 14 |
Loans held for investment-to be securitized | | | 375,611 | | | | | 5.0 | % | | 0.23 | % | | 8.34 | % | | 6 |
Loans held for investment-previously securitized | | | 116,891 | | | | | 40.2 | % | | 0.42 | % | | 10.09 | % | | 38 |
| | | | | | | | | | | | | | | | | |
Total loans held for investment | | $ | 5,569,740 | | 60 | % | | 11.0 | % | | 0.39 | % | | 8.11 | % | | 14 |
| | | | | | | | | | | | | | | | | |
| | | | | | | | | | | | | | | | | |
| | | As of December 31, 2005 |
($ in 000s) | | Current
Principal
Balance | | Current
Balance as
Factor of
Original
Principal | | | % of
Principal
Balance
Seriously
Delinquent | | | % of
Cumulative
Realized
Losses | | | Weighted Avg. Coupon | | | Avg. Age
of Loans
from
Funding
(months) |
Loans held for investment-securitized: | | | | | | | | | | | | | | | | | |
FMIC Series 2003-1 | | $ | 83,201 | | 17 | % | | 17.1 | % | | 0.31 | % | | 8.79 | % | | 29 |
FMIT Series 2004-1 | | | 221,352 | | 33 | % | | 9.1 | % | | 0.22 | % | | 8.48 | % | | 25 |
FMIT Series 2004-2 | | | 398,754 | | 45 | % | | 7.0 | % | | 0.30 | % | | 6.83 | % | | 22 |
FMIT Series 2004-3 | | | 556,056 | | 56 | % | | 6.9 | % | | 0.18 | % | | 6.46 | % | | 20 |
FMIT Series 2004-4 | | | 535,681 | | 61 | % | | 7.5 | % | | 0.20 | % | | 6.97 | % | | 17 |
FMIT Series 2004-5 | | | 610,985 | | 68 | % | | 6.7 | % | | 0.07 | % | | 6.80 | % | | 15 |
FMIT Series 2005-1 | | | 562,331 | | 75 | % | | 4.9 | % | | 0.11 | % | | 6.92 | % | | 13 |
FMIT Series 2005-2 | | | 918,831 | | 95 | % | | 3.0 | % | | 0.00 | % | | 7.14 | % | | 7 |
FMIT Series 2005-3 | | | 1,156,571 | | 99 | % | | 0.7 | % | | 0.00 | % | | 7.34 | % | | 3 |
| | | | | | | | | | | | | | | | | |
Total | | | 5,043,762 | | 65 | % | | 4.9 | % | | 0.14 | % | | | | | 13 |
Loans held for investment-to be securitized | | | 486,454 | | 100 | % | | 0.1 | % | | 0.00 | % | | | | | 1 |
| | | | | | | | | | | | | | | | | |
Total loans held for investment | | $ | 5,530,216 | | 67 | % | | 4.4 | % | | 0.13 | % | | 7.13 | % | | 12 |
| | | | | | | | | | | | | | | | | |
The allowance for loan losses increased to $81.9 million as of December 31, 2006 compared to $44.1 million as of December 31, 2005, reflecting significantly higher delinquencies and the seasoning of the portfolio, partially offset by lower than expected realized losses on loans originated in 2003 and 2004. We believe that the rising delinquencies on more recent originations is due to the flattening of home price appreciation, rising
77
interest rates, increases in consumer debt, and a sluggish job market throughout many parts of the country. We have implemented several initiatives late in 2006 in response to the sharp rise in the delinquencies and losses, including accelerating our intervention on delinquent loans, engaging a delinquency and loss mitigation monitor for our 2006 loans, limiting the age of appraisals and narrowing acceptable thresholds for the automated verification of property values, discontinuing products with the highest delinquency rates, and initiating plans to directly board our loans held for investment with our servicer to avoid immediate servicing transfer. Although we anticipate delinquency rates will continue at elevated levels in 2007 relative to historical norms, we expect our servicing and loss mitigation initiatives to favorably impact our delinquency rates relative to our 2006 loan performance.
At December 31, 2006, $610.8 million, or 11.0%, of loans held for investment were seriously delinquent (defined as 60+ days past due or in the process of foreclosure), compared to $245.5 million, or 4.4%, at December 31, 2005. In addition to increasing the provision for loan losses in 2006, this rise in delinquencies has also led to an increase in the balance of the loans placed on non-accrual status for interest income recognition as of December 31, 2006 and a related increase in the amount of accrued interest income that was subsequently reversed.
We sold approximately 530 real estate owned properties previously collateralizing loans held for investment during 2006. At this time, we believe our estimated average loss severity rates are supported by a combination of industry data, our disposal history, and our assessment of economic factors impacting property values. We will continue to review our loss assumptions and update our estimates as required.
Real Estate Owned
Real estate owned is reported at the lower of cost or market value on the condensed consolidated statements of condition. At the time a loan held for investment is foreclosed and the underlying collateral is transferred to real estate owned, any reduction in value from the loan’s previous carrying balance is charged to the allowance for loan losses – loans held for investment. We record gains and losses at disposal of the property to gain (loss) on disposal of real estate owned, a component of “Other income (expense)” on the condensed consolidated statements of operations.
Real estate owned as of December 31, 2006 and 2005 is comprised of the following:
| | | | | | | | |
($ in 000s) | | Year Ended December 31, 2006 | | | Year Ended December 31, 2005 | |
Beginning balance real estate owned | | $ | 14,997 | | | $ | 4,374 | |
Plus: Transfers from mortgage loans held for sale | | | 8,410 | | | | 867 | |
Transfers from mortgage loans held for investment | | | 128,301 | | | | 34,062 | |
Less: Charge-offs | | | (32,751 | ) | | | (9,001 | ) |
Real estate sold | | | (59,521 | ) | | | (15,305 | ) |
| | | | | | | | |
Ending balance real estate owned | | $ | 59,436 | | | $ | 14,997 | |
| | | | | | | | |
The valuation write-down on loans transferred to REO averaged 19% at the time of foreclosure in both 2006 and 2005. Average additional losses of 2% and 7% were recognized upon final disposal of REO properties for the years ended December 31, 2006 and 2005, respectively.
The increase in real estate owned during 2006 is due to increased delinquencies and foreclosures due to deteriorating loan performance in 2006 and the aging of the portfolio.
Mortgage Loans Held for Sale and Related Warehouse Financing—Loans Held for Sale
Mortgage loans held for sale, net and warehouse financing—loans held for sale as of December 31, 2006 and 2005 are as follows:
| | | | | | | | |
| | | As of December 31, | |
($ in 000s) | | 2006 | | | 2005 | |
Total mortgage loans held for sale, net | | $ | 550,520 | | | $ | 594,269 | |
Warehouse financing—mortgage loans held for sale | | $ | 480,376 | | | $ | 434,061 | |
Percentage financed—mortgage loans held for sale | | | 87 | % | | | 73 | % |
The decrease in mortgage loans held for sale, net, at December 31, 2006 compared to December 31, 2005 reflects the inclusion in the December 31, 2005 balance of approximately $149 million of loans for which the settlement date of the sale was extended into the first quarter of 2006, which made the balance unusually large. Excluding the impact of those loans, loans held for sale as of December 31, 2006 represents a larger percentage of originations being classified as held for sale during the fourth quarter of 2006.
78
At December 31, 2006, we had $16.1 million of loans held for sale deemed to be unsaleable at standard sale premiums compared to $5.2 million at December 31, 2005. We have recorded a valuation allowance of $3.6 million and $1.1 million as of December 31, 2006 and December 31, 2005, respectively, for these loans.
Warehouse financing—loans held for sale increased as of December 31, 2006 compared to December 31, 2005. We used increased cash and liquidity for calls of securitization financings during 2006, which was otherwise used to reduce warehouse financings in 2005.
Trustee Receivable
Trustee receivable decreased to $101.4 million as of December 31, 2006 from $130.2 million at December 31, 2005. The decrease reflects lower principal payments and prepaid loan payments received after the cut-off date for the current month bond payments from our ten securitized mortgage pools outstanding as of December 31, 2006 compared to the nine securitized mortgage pools outstanding as of December 31, 2005. The trustee retains funds received after the cut-off date until the following month’s disbursement date.
Derivative Assets and Derivative Liabilities
Derivative assets decreased to $13.7 million at December 31, 2006 from $35.2 million at December 31, 2005. Derivative liabilities, included in “Accounts payable, accrued expenses and other liabilities” in the consolidated statements of condition, decreased to $0.4 million at December 31, 2006 from $0.9 million at December 31, 2005. The change in derivative assets and liabilities primarily relates to the $27.2 million decrease in the fair value of the interest rate swap agreements over the period due to the flattening of the forward LIBOR curve during the period.
Securitization Financing
Outstanding securitization financing by series as of December 31, 2006 and 2005 was as follows:
| | | | | | | | | | | |
| | | | | | Balance as of | |
($ in 000s) | | Bonds Issued | | | December 31,
2006 | | December 31,
2005 | |
FMIT Series 2006-S1 | | $ | 164,763 | | | $ | 164,763 | | $ | — | |
FMIT Series 2006-3 | | | 814,816 | | | | 800,298 | | | — | |
FMIT Series 2006-2 | | | 766,400 | | | | 728,748 | | | — | |
FMIT Series 2006-1 | | | 904,078 | | | | 795,077 | | | — | |
FMIT Series 2005-3 | | | 1,094,246 | | | | 870,905 | | | 1,089,820 | |
FMIT Series 2005-2 | | | 911,081 | | | | 641,172 | | | 872,455 | |
FMIT Series 2005-1 | | | 728,625 | | | | 350,102 | | | 555,650 | |
FMIT Series 2004-5 | | | 863,550 | | | | 233,691 | | | 595,481 | |
FMIT Series 2004-4 | | | 845,283 | | | | 153,971 | | | 518,283 | |
FMIT Series 2004-3 | | | 949,000 | | | | 124,940 | | | 523,296 | |
FMIT Series 2004-21 | | | 843,920 | | | | — | | | 377,500 | |
FMIT Series 2004-12 | | | 652,944 | | | | — | | | 233,977 | |
FMIC Series 2003-13 | | | 488,923 | | | | — | | | 83,308 | |
| | | | | | | | | | | |
| | | 10,027,629 | | | | 4,863,667 | | | 4,849,770 | |
Unamortized bond discount | | | (1,130 | ) | | | — | | | (74 | ) |
| | | | | | | | | | | |
Subtotal securitization bond financing | | | 10,026,499 | | | | 4,863,667 | | | 4,849,696 | |
Liquid Funding repurchase facility | | | — | | | | 111,787 | | | 86,079 | |
Lehman Brothers repurchase facility | | | — | | | | 57,424 | | | 62,845 | |
| | | | | | | | | | | |
Total securitization financing | | $ | 10,026,499 | | | $ | 5,032,878 | | $ | 4,998,620 | |
| | | | | | | | | | | |
1 | Series 2004-2 was called and paid in full in August 2006. |
2 | Series 2004-1 was called and paid in full in April 2006. |
3 | Series 2003-1 was called and paid in full in November 2006. |
During the years ended December 31, 2006 and 2005, we issued approximately $2.7 billion and $2.9 billion, respectively, of mortgage-backed bonds through securitization trusts to finance our portfolio of loans held for
79
investment. Interest rates reset monthly and are indexed to one-month LIBOR. The bonds pay interest monthly based upon a spread over LIBOR. We retain the option to repay the bonds when the remaining unpaid principal balance of the underlying mortgage loans for each pool falls below set thresholds of the original principal balance.
During 2006, the current principal balances of the remaining loans as a percentage of the original principal balances of the underlying mortgage loans collateralizing FMIT Series 2004-1, 2004-2, and 2003-1 fell below 20%, permitting us to exercise our option to repay the related bonds. Management reviewed the economic factors relating to this potential call, and subsequently delivered notice in April 2006, August 2006, and November 2006 respectively, to bondholders to repay the bonds at the next payment date.
As of December 31, 2006 and 2005, the outstanding bonds in our securitizations were cumulatively over-collateralized by $168.6 million and $189.8 million, respectively. The collateral includes mortgage loans, trustee receivables, real estate owned and proceeds from bond pre-fundings which are designated as restricted cash until the mortgage loan collateral is delivered to the trust. We enter into interest rate swap agreements to economically hedge the interest expense associated with the bonds, as described above under Critical Accounting Policies.
In October 2005, Fieldstone Mortgage Ownership Corp. (FMOC) entered into two separate Master Repurchase Agreements with Liquid Funding, Ltd. (Liquid Funding), an affiliate of Bear Stearns Bank plc, and Lehman Brothers Inc. and Lehman Commercial Paper Inc. (together Lehman), respectively. FMOC may borrow up to an aggregate amount of $200 million under each facility by pledging a portfolio of non-prime mortgage-backed securities (Retained Securities) which are among the securities that we retain in our securitizations. The facilities may be terminated by either party at any time upon proper notice, and bear interest at an annual rate of LIBOR plus an additional percentage. As of December 31, 2006, $111.8 million of borrowings are outstanding under the Liquid Funding agreement and $57.4 million of borrowings are outstanding under the Lehman agreement.
Total Shareholders’ Equity
Total shareholders’ equity decreased to $381.3 million at December 31, 2006, from $526.6 million at December 31, 2005. The change in shareholders’ equity primarily reflects the $68.4 million net loss for 2006, the $62.2 million in dividends declared in 2006, and the $16.8 million of shares of common stock repurchased and canceled during the period.
Dividends declared are based on our REIT taxable income, which differs from our net income as described below under REIT Taxable Income. To maintain our status as a REIT, we are required to distribute at least 90% of our REIT taxable income each year to our stockholders. As a result of this requirement and the classification of certain cash flows under GAAP in our consolidated statements of cash flows in the accompanying financial statements, dividends distributed may exceed our operating cash flows. In such situations, we will use cash and available liquidity, including increased borrowings under our warehouse lines, to pay dividends as required to maintain our REIT status.
Dividends declared per share in 2006 are as follows:
| | | | | | |
Declaration Date | | Record Date | | Payment Date | | Dividend |
March 17, 2006 | | March 31, 2006 | | April 28, 2006 | | $ 0.48 |
June 16, 2006 | | June 30, 2006 | | July 31, 2006 | | $ 0.44 |
September 15, 2006 | | September 29, 2006 | | October 27, 2006 | | $ 0.34 |
December 20, 2006 | | December 29, 2006 | | January 18, 2007 | | $ 0.05 |
Business Segment Results
Fieldstone reports on a total of four business segments, which include two production segments and two operating segments. Our production segments include our Wholesale segment, previously designated as Non-conforming Wholesale, and our Retail segment, previously designated as Non-conforming Retail. Our Wholesale segment originates non-conforming loans, while our Retail segment originates both conforming and non-conforming mortgages. Prior to the first quarter of 2006, we reported two additional production segments referred to as our Conforming Wholesale and Conforming Retail segments. In the first quarter of 2006, our Board of Directors approved a plan to dispose of the assets of the Conforming Wholesale and Conforming Retail segments due to the decline in profitability of these segments. In February 2006, the assets pertaining to these divisions’ headquarters, all wholesale offices, and certain of its retail offices were sold to third parties. The remaining assets of the conforming division were combined with our non-conforming retail offices. The following discussion of results reflects our current segment structure, and the results of our former Conforming Wholesale and Conforming Retail segments are reported as discontinued operations.
80
The results of operations of our production segments primarily include an allocation of net interest income for funded loans, direct expenses, and a corporate overhead expense allocation. In addition, segment revenues include an allocation which credits the production segments with the pro forma net gain on sale of all production as if the segments’ fundings were all sold servicing-released concurrent with funding, even though a significant portion of the loans originated will be held for investment. Loans held for investment generate revenue over the life of loan, which currently averages two years, and is recorded as part of our Investment Portfolio segment.
Our operating segments include the Investment Portfolio and Corporate segments. The results of operations of the Investment Portfolio segment primarily include the net interest income after provision for loan losses for our loans held for investment, changes in the fair value and cash settlements on our portfolio derivatives, and direct expenses, including third party servicing fees, related to our loans held for investment. The results of operations of the Corporate segment primarily include direct expenses of the corporate home office, the elimination of the corporate overhead allocated to the production segments, and the income tax provision related to FMC, our taxable REIT subsidiary. The Corporate segment also includes various reconciling amounts necessary to adjust for the retention of a substantial portion of our loans as held for investment and to convert the production segments’ expenses to comply with GAAP reporting under Statement No. 91.
The results of operations reported per segment differ materially from consolidated results due to timing differences in net gain on sale recognition at the time of cash settlement of the sale compared to the revenue allocation which each segment receives at the time of loan funding, the actual whole loan sales prices compared to the pro forma values, the actual net interest margin earned on loans prior to their sale, and the holding for investment of a substantial portion of our non-conforming loans for which actual revenue will consist of net interest income generated over the life of the loan rather than net gain on sale recognized one-time as of the sale date.
81
Operating results by business segment for the year ended December 31, 2006 are as follows:
| | | | | | | | | | | | | | | | | | | | |
| | | Production | | | Investment Portfolio | | | | | | | |
| | | Wholesale | | | Retail | | | | Corporate2 | | | Consolidated | |
Revenues: | | | | | | | | | | | | | | | | | | | | |
Interest income | | $ | 32,634 | | | $ | 4,757 | | | $ | 409,675 | | | $ | (6,340 | ) | | $ | 440,726 | |
Interest expense | | | 21,246 | | | | 3,162 | | | | 319,961 | | | | (7,809 | ) | | | 336,560 | |
| | | | | | | | | | | | | | | | | | | | |
Net interest income | | | 11,388 | | | | 1,595 | | | | 89,714 | | | | 1,469 | | | | 104,166 | |
Provision for loan losses—loans held for investment | | | — | | | | — | | | | (69,062 | ) | | | — | | | | (69,062 | ) |
Gains (losses) on sales of mortgage loans, net | | | 82,276 | | | | 31,239 | | | | — | | | | (96,468 | ) | | | 17,047 | |
Other income—portfolio derivatives | | | — | | | | — | | | | 14,212 | | | | — | | | | 14,212 | |
Other income (expense) | | | — | | | | 1,140 | | | | (3,425 | ) | | | (177 | ) | | | (2,462 | ) |
| | | | | | | | | | | | | | | | | | | | |
Total revenues | | | 93,664 | | | | 33,974 | | | | 31,439 | | | | (95,176 | ) | | | 63,901 | |
| | | | | | | | | | | | | | | | | | | | |
Direct expenses1 | | | 75,463 | | | | 32,902 | | | | 11,592 | | | | 23,707 | | | | 143,664 | |
Corporate overhead allocation | | | 21,824 | | | | 3,406 | | | | — | | | | (25,230 | ) | | | — | |
| | | | | | | | | | | | | | | | | | | | |
Total expenses | | | 97,287 | | | | 36,308 | | | | 11,592 | | | | (1,523 | ) | | | 143,664 | |
| | | | | | | | | | | | | | | | | | | | |
(Loss) income from continuing operations before income taxes | | | (3,623 | ) | | | (2,334 | ) | | | 19,847 | | | | (93,653 | ) | | | (79,763 | ) |
Income tax benefit | | | — | | | | — | | | | — | | | | 13,023 | | | | 13,023 | |
| | | | | | | | | | | | | | | | | | | | |
(Loss) income from continuing operations | | $ | (3,623 | ) | | $ | (2,334 | ) | | $ | 19,847 | | | $ | (80,630 | ) | | | (66,740 | ) |
| | | | | | | | | | | | | | | | | | | | |
Discontinued operations, net of income tax | | | | | | | | | | | | | | | | | | | (1,645 | ) |
| | | | | | | | | | | | | | | | | | | | |
Net loss | | | | | | | | | | | | | | | | | | $ | (68,385 | ) |
| | | | | | | | | | | | | | | | | | | | |
Operating results by business segment for the year ended December 31, 2005 are as follows:
| | | | | | | | | | | | | | | | | | | |
| | | Production | | | Investment | | | | | | | |
| | | Wholesale | | Retail | | | Portfolio | | | Corporate2 | | | Consolidated | |
Revenues: | | | | | | | | | | | | | | | | | | | |
Interest income | | $ | 33,206 | | $ | 4,688 | | | $ | 344,521 | | | $ | (6,799 | ) | | $ | 375,616 | |
Interest expense | | | 19,058 | | | 2,670 | | | | 198,688 | | | | (8,506 | ) | | | 211,910 | |
| | | | | | | | | | | | | | | | | | | |
Net interest income | | | 14,148 | | | 2,018 | | | | 145,833 | | | | 1,707 | | | | 163,706 | |
Provision for loan losses—loans held for investment | | | — | | | — | | | | (30,065 | ) | | | — | | | | (30,065 | ) |
Gains (losses) on sales of mortgage loans, net | | | 117,578 | | | 34,645 | | | | — | | | | (91,025 | ) | | | 61,198 | |
Other income—portfolio derivatives | | | — | | | — | | | | 33,469 | | | | — | | | | 33,469 | |
Other income (expense) | | | — | | | 1,995 | | | | (1,363 | ) | | | 300 | | | | 932 | |
| | | | | | | | | | | | | | | | | | | |
Total revenues | | | 131,726 | | | 38,658 | | | | 147,874 | | | | (89,018 | ) | | | 229,240 | |
| | | | | | | | | | | | | | | | | | | |
Direct expenses1 | | | 77,723 | | | 37,646 | | | | 10,007 | | | | (1,907 | ) | | | 123,469 | |
Corporate overhead allocation | | | 23,067 | | | 3,909 | | | | — | | | | (26,976 | ) | | | — | |
| | | | | | | | | | | | | | | | | | | |
Total expenses | | | 100,790 | | | 41,555 | | | | 10,007 | | | | (28,883 | ) | | | 123,469 | |
| | | | | | | | | | | | | | | | | | | |
Income (loss) from continuing operations before income taxes | | | 30,936 | | | (2,897 | ) | | | 137,867 | | | | (60,135 | ) | | | 105,771 | |
Income tax expense | | | — | | | — | | | | — | | | | (4,669 | ) | | | (4,669 | ) |
| | | | | | | | | | | | | | | | | | | |
Income (loss) from continuing operations | | $ | 30,936 | | $ | (2,897 | ) | | $ | 137,867 | | | $ | (64,804 | ) | | | 101,102 | |
| | | | | | | | | | | | | | | | | | | |
Discontinued operations, net of income tax | | | | | | | | | | | | | | | | | | (1,712 | ) |
| | | | | | | | | | | | | | | | | | | |
Net income | | | | | | | | | | | | | | | | | $ | 99,390 | |
| | | | | | | | | | | | | | | | | | | |
82
Operating results by business segment for the year ended December 31, 2004 are as follows:
| | | | | | | | | | | | | | | | | | | |
| | | Production | | | Investment Portfolio | | | Corporate2 | | | Consolidated | |
| | | Wholesale | | Retail | | | | |
Revenues: | | | | | | | | | | | | | | | | | | | |
Interest income | | $ | 17,210 | | $ | 3,138 | | | $ | 206,460 | | | $ | (176 | ) | | $ | 226,632 | |
Interest expense | | | 2,937 | | | 694 | | | | 69,039 | | | | (358 | ) | | | 72,312 | |
| | | | | | | | | | | | | | | | | | | |
Net interest income | | | 14,273 | | | 2,444 | | | | 137,421 | | | | 182 | | | | 154,320 | |
Provision for loan losses—loans held for investment | | | — | | | — | | | | (21,556 | ) | | | — | | | | (21,556 | ) |
Gains (losses) on sales of mortgage loans, net | | | 134,028 | | | 41,887 | | | | — | | | | (133,137 | ) | | | 42,778 | |
Other income—portfolio derivatives | | | — | | | — | | | | 8,789 | | | | — | | | | 8,789 | |
Other income (expense) | | | — | | | 1,497 | | | | (45 | ) | | | 449 | | | | 1,901 | |
| | | | | | | | | | | | | | | | | | | |
Total revenues | | | 148,301 | | | 45,828 | | | | 124,609 | | | | (132,506 | ) | | | 186,232 | |
| | | | | | | | | | | | | | | | | | | |
Direct expenses1 | | | 81,677 | | | 41,570 | | | | 7,697 | | | | (15,128 | ) | | | 115,816 | |
Corporate overhead allocation | | | 31,508 | | | 4,596 | | | | — | | | | (36,104 | ) | | | — | |
| | | | | | | | | | | | | | | | | | | |
Total expenses | | | 113,185 | | | 46,166 | | | | 7,697 | | | | (51,232 | ) | | | 115,816 | |
| | | | | | | | | | | | | | | | | | | |
Income (loss) from continuing operations before income taxes | | | 35,116 | | | (338 | ) | | | 116,912 | | | | (81,274 | ) | | | 70,416 | |
Income tax expense | | | — | | | — | | | | — | | | | (6,284 | ) | | | (6,284 | ) |
| | | | | | | | | | | | | | | | | | | |
Income (loss) from continuing operations | | $ | 35,116 | | $ | (338 | ) | | $ | 116,912 | | | $ | (87,558 | ) | | | 64,132 | |
| | | | | | | | | | | | | | | | | | | |
Discontinued operations, net of income tax | | | | | | | | | | | | | | | | | | (536 | ) |
| | | | | | | | | | | | | | | | | | | |
Net income | | | | | | | | | | | | | | | | | $ | 63,596 | |
| | | | | | | | | | | | | | | | | | | |
1 | The direct expenses of our Investment Portfolio include the allocation of corporate overhead, which is assessed to that segment through the transfer pricing of loans from the production segments. |
2 | Corporate direct expenses, which includes adjustments necessary to conform with GAAP, vary based on origination volumes and the associated GAAP adjustments. Also, corporate direct expenses in 2006 include the $10.6 million litigation settlement. |
Production Segments
Segment contribution from our production segments decreased in 2006 compared to 2005 and 2004, due primarily to decreased originations from continuing operations and a reduction in the gain on sale revenue allocation per funding dollar, as narrowing interest margins and increasing delinquencies have contributed to reduced sales premiums.
Increased competition for new loans, increasing delinquencies on recent originations, and decreased origination volumes, has caused margin compression on new loan originations, resulting in a decrease in allocated revenues per loan to our production segments. We expect margins to remain at these compressed levels in the near-term.
Wholesale Segment. Our wholesale segment contribution decreased in 2006 compared to 2005 and 2004 due to reduced sales margins and reductions in origination volumes. The industry responded to competitive pressures in an increasing interest rate environment by originating loans with narrower net interest income spreads, which earn reduced sale premiums. Direct expenses increased to 81% of total revenue in 2006, compared to 59% and 55% of total revenue, respectively, in 2005 and 2004, reflecting increased salary costs incurred during the first half of 2006 related to additional account executives hired to sustain funding volumes in a reduced overall mortgage marketplace. Costs incurred in 2006 also includes $1.0 million of costs associated with consolidating operations centers as part of our cost management initiatives that were recognized in the current period in accordance with GAAP, but will reduce recurring costs in future periods. Reduced revenues in 2006, due to decreased funding volumes and a reduction in the revenue allocation per loan, also contributed to increased costs as a percentage of total revenues.
Retail Segment. Our retail segment contribution decreased in 2006 compared to 2005 and 2004 due to reduced sales margins and reductions in origination volumes. These decreases resulted in part from reduced second lien originations, which typically earn lower sale premiums, as a result of our decision to discontinue the origination of certain second lien products whose market value has been the most severely affected by the current market trends as discussed above under Results of Operations. Direct expenses have remained comparable between 2006, 2005 and 2004. Though the origination volume and allocated revenue have also decreased in our Retail segment, originations from the Retail segment are significantly less than from our Wholesale segment as a result of our business strategy. The lower level of originations from our Retail segment mitigates the impact of the fluctuations in origination volume.
83
Operating Segments
Investment Portfolio. The Investment Portfolio contribution decreased in 2006 compared to 2005 and 2004 due to increased provision for loan losses, decreases in net interest income, and fluctuations in the impact of our derivative contracts. The provision for loan losses increased in 2006 due to the significant increase in delinquencies we are experiencing on more recent originations as a result of slowing home price appreciation, rising interest rates, and increasing consumer debt. Net interest income decreased over the same periods as the result of the prepayment of older, higher margin loans while new loans were added to the portfolio at lower margins. The margins available on new loans narrowed, as intense market competition for new loans did not permit coupons on new originations to increase at the same rate as the increase in financing costs for these loans, which are indexed to rising market interest rates. The impact of our derivative contracts fluctuates from period to period based on the forward LIBOR curve, which impacts the non-cash mark to market changes in fair value, and the spread between the actual LIBOR rates during the period and the fixed swap rates. We anticipate contribution from our Investment Portfolio segment to remain at lower levels in the near-term due to narrower net interest margins on the recent loans added to the portfolio compared to older portfolio loans expected to prepay.
Corporate. The direct expenses reported under our corporate segment rose in 2006 compared to 2005 and 2004 as the result of the implementation of Sarbanes-Oxley Act compliance measures, increased professional service fees, and incremental expenses related to our new loan origination system. The costs related to the settlement of the Bass litigation have been included in the Corporate segment for the year ended December 31, 2006, which was also a primary driver of the increase.
Liquidity and Capital Resources
As a mortgage lending company, we borrow substantial sums of money to fund the mortgage loans we originate. After funding, our primary operating subsidiary, FMC, holds all of the conforming loans, and all of the non-conforming loans that are not held for investment, in inventory prior to sale. We hold the remainder of the non-conforming loans for investment in our portfolio. Our primary cash requirements include:
| | • | | premiums paid in connection with loans originated by our Wholesale segment; |
| | • | | interest expense on our credit facilities and securitization financings; |
| | • | | ongoing general and administration expenses; |
| | • | | margin calls on our repurchase facilities; |
| | • | | repurchase requests for breaches of representation and warranties on whole loan trades; |
| | • | | funding the call transactions on our securitizations that fall below certain thresholds; |
| | • | | derivative transactions; and |
| | • | | REIT stockholder distributions – as a REIT, we are required to distribute at least 90% of our REIT taxable income to our shareholders. |
Our primary cash sources include:
| | • | | borrowings from our credit facilities secured by mortgage loans held in inventory and the securities we retain from our securitizations; |
| | • | | proceeds from the issuance of securities collateralized by the loans in our portfolio; |
| | • | | proceeds from whole loan sales; |
| | • | | principal and interest collections relative to the mortgage loans held in inventory; and |
| | • | | points and fees collected from the origination of retail and wholesale loans. |
84
We rely on our securitizations as a primary source of liquidity. As of December 31, 2006, we have completed thirteen securitizations, issuing an aggregate of $10.0 billion of mortgage-backed securities.
Securitizations issued by series during the years ended December 31, 2006 and 2005 are as follows:
| | | | | | | | | | | | | | | | | | | | | |
($ in 000s) | | FMIT 2005-1 | | FMIT 2005-2 | | FMIT 2005-3 | | FMIT 2006-1 | | FMIT 2006-2 | | FMIT 2006-3 | | FMIT 2006-S1 |
Issue date | | | Feb 2005 | | | Aug 2005 | | | Nov 2005 | | | Mar 2006 | | | July 2006 | | | Oct 2006 | | | Dec 2006 |
Bonds issued1 | | $ | 729,000 | | $ | 911,000 | | $ | 1,094,000 | | $ | 904,000 | | $ | 766,000 | | $ | 815,000 | | $ | 165,000 |
Loans pledged | | $ | 750,000 | | $ | 967,000 | | $ | 1,165,000 | | $ | 933,000 | | $ | 800,000 | | $ | 859,000 | | $ | 194,000 |
Bond ratings—Standard and Poor’s | | | AAA–BBB- | | | AAA–A+ | | | AAA–A+ | | | AAA–BBB | | | AAA–BBB | | | AAA–BBB | | | AAA–BBB- |
Bond ratings—Moody’s | | | Aaa–Baa3 | | | Aaa–Baa2 | | | Aaa–Baa2 | | | Aaa–Baa3 | | | Aaa–Baa3 | | | Aaa–Baa3 | | | Aaa–Baa3 |
Financing costs—LIBOR plus | | | 0.12% -2.00% | | | 0.12% -1.35 % | | | 0.12% -1.45 % | | | 0.08% -2.30 % | | | 0.09% -1.90 % | | | 0.07% -2.10 % | | | 0.22% -3.50 % |
Weighted average spread over LIBOR | | | 0.40% | | | 0.38% | | | 0.37% | | | 0.32% | | | 0.29% | | | 0.25% | | | 0.41% |
Transaction fees | | | 0.36% | | | 0.33% | | | 0.30% | | | 0.32% | | | 0.33% | | | 0.31% | | | 0.40% |
1 | Includes non-retained bonds only. |
During, 2006, we completed 4 securitizations in which we issued $2.7 billion of mortgage-backed bonds. The bonds issued in 2006 contain similar provisions to our previous securitizations. One of the 2006 securitizations, FMIT Series 2006-S1, differed from prior securitizations in that it contained only second lien mortgages, following our decision to retain second lien loans that meet specified return criteria for investment in the second half of 2006. The bonds have Standard and Poor’s ratings between AAA-BBB- and Moody’s ratings between Aaa-Baa3. The bonds bear interest at rates between LIBOR plus 0.07% and LIBOR plus 2.30% on the securitizations of first lien loans and at rates between LIBOR plus 0.22% and LIBOR plus 3.50% on FMIT Series 2006-S1, the second lien only securitization. We incurred total issuance costs of approximately $9.4 million on the 2006 securitizations that were deferred and will be amortized over the estimated life of the bonds.
During 2006, the current principal balances of the remaining loans as a percentage of the original principal balances of the underlying mortgage loans collateralizing FMIT Series 2004-1, 2004-2, and 2003-1 fell below 20%, permitting us to exercise our option to repay the related bonds. Management reviewed the economic factors relating to this potential call, and subsequently delivered notice in April 2006, August 2006, and November 2006 respectively, to bondholders to repay the bonds at the next payment date.
We use our various credit facilities to fund substantially all of our loan originations. Fieldstone Mortgage sells the mortgage loans it holds within two or three months of origination and pays down these facilities with the proceeds. We issue mortgage-backed securities to pay down those facilities financing our loans held for investment.
The material terms and features of these credit facilities as of December 31, 2006 are as follows:
| | | | | | | | | | | | | | | | | | |
($ in 000,000s) Lender | | Committed | | Uncommitted | | Maturity Date | | Range of
Allowable
Advances | | Minimum
Consolidated
Tangible Net Worth | | Maximum
Ratio of
Indebtedness
to Adjusted
Tangible Net Worth | | Minimum
Liquidity |
Credit Suisse First Boston Mortgage Capital, LLC | | $ | 400.0 | | $ | — | | April 2007 | | 91%-99% | | $ | 365.0 | | 16:1 | | $ | 15.0 |
Credit Suisse, New York Branch Commercial Paper Facility1 | | | 800.0 | | | — | | July 2007 | | 92.5% | | | 365.0 | | 16:1 | | | 15.0 |
JPMorgan Chase Bank, N.A | | | 150.0 | | | — | | July 2007 | | 94%-98% | | | 365.0 | | 16:1 | | | 20.0 |
Lehman Brothers Bank, FSB2 | | | 500.0 | | | — | | January 2007 | | 91.5%-98.5% | | | 250.0 | | 16:1 | | | 15.0 |
Merrill Lynch Bank USA | | | 400.0 | | | — | | October 2007 | | 91%-98% | | | 375.0 | | 17:1 | | | N/A |
| | | | | | | | | | | | | | | | | | |
Subtotal | | | 2,250.0 | | | — | | | | | | | | | | | | |
Liquid Fundings | | | — | | | 200.0 | | October 2007 | | N/A | | | N/A | | N/A | | | N/A |
Lehman Brothers1 | | | — | | | 200.0 | | Uncommitted | | N/A | | | N/A | | N/A | | | N/A |
| | | | | | | | | | | | | | | | | | |
Total | | $ | 2,250.0 | | $ | 400.0 | | | | | | | | | | | | |
| | | | | | | | | | | | | | | | | | |
1 | Facility remains open indefinitely, but may be terminated by either party at any time. |
2 | The Company amended the facility in January 2007 as described below and extended the facility until January 2008. |
85
Under our warehouse facilities, interest is payable monthly in arrears and outstanding principal is payable upon receipt of loan sale proceeds or transfer of a loan into a securitization trust. Outstanding principal is also repayable upon the occurrence of certain disqualifying events, which include a mortgage loan in default for a period of time, a repaid mortgage loan, a mortgage loan obtained with fraudulent information, or the failure to cure a defect in a mortgage loan’s documentation. Outstanding principal is repayable if the mortgage loan does not close, but had been pledged and funds were advanced. Our warehouse facilities contain terms mandating principal repayment if a loan under the facility remains under the facility after a contractual time period commencing from the date of funding, or on the maturity date of the facility. Under our facilities, advances bear interest at annual rates of LIBOR plus an additional percentage that varies depending upon the type of mortgage loans securing the advance. We are also required to pay non-use fees on unused amounts which exceed certain thresholds relating to the average outstanding balance of the facility. The facilities are secured by substantially all of our non-securitized mortgage loans and contain customary financial and operating covenants that require us to maintain specified levels of liquidity and net worth, attain specified levels of profitability, restrict indebtedness and investments except in certain limited circumstances, restrict our ability to engage in certain mergers and consolidations or substantially change our business, restrict dividend payments during an event of default and require compliance with applicable laws. We were in compliance with all of these covenants at December 31, 2006 and 2005.
During December, 2006 we amended several of our credit facilities, reducing the minimum net worth and minimum levels of profitability required under our covenants to remain in compliance as of December 31, 2006.
On January 26, 2007, we amended our warehouse line of credit agreement with Lehman Brothers Bank, FSB (Lehman Brothers). The amendment extended the agreement until January 25, 2008 and permanently increased the maximum facility amount from $300 million to $400 million, which facility had been temporarily increased to $500 million during the fourth quarter of 2006. In addition, the amendment changed certain definitions and covenants, including the adjusted tangible net worth, which was increased from $250 million to the higher of $350 million or the highest adjusted tangible net worth contained in any of our other warehouse lending agreements.
On January 31, 2007, we completed amendments to several of our remaining warehouse line of credit agreements, including agreements with Credit Suisse First Boston Mortgage Capital LLC (Credit Suisse First Boston), Credit Suisse, New York Branch (Credit Suisse, New York) and JPMorgan Chase Bank, N.A. (JPMorgan Chase). Each of the amendments waived the net profitability covenant through the first quarter of 2007 and lowered the adjusted tangible net worth covenant to $350 million. Additionally, the maximum aggregate purchase price for each of the facilities has been amended as follows (i) the Credit Suisse First Boston facility reduced its maximum aggregate purchase price from $400 million to $300 million, (ii) the Credit Suisse, New York facility reduced its maximum aggregate purchase price from $800 million to $500 million and (iii) the JPMorgan Chase facility increased its maximum aggregate purchase price from $150 million to $250 million. Upon completing the amendments on January 31, 2007, our committed level of whole loan funding capacity was $1.85 billion.
In addition to our traditional credit facilities, in October 2005, FMOC entered into two separate Master Repurchase Agreements with Liquid Funding, Ltd. (Liquid Funding), an affiliate of Bear Stearns Bank plc, and Lehman Brothers Inc. and Lehman Commercial Paper Inc. (together Lehman), respectively. FMOC may borrow up to an aggregate amount of $200 million under each facility by pledging a portfolio of non-prime mortgage-backed securities (Retained Securities) which are among the securities that we retain in our securitizations. The facilities may be terminated by either party at any time upon proper notice, and bear interest at an annual rate of LIBOR plus an additional percentage. As of December 31, 2006, $111.8 million of borrowings are outstanding under the Liquid Funding agreement and $57.4 million of borrowings are outstanding under the Lehman agreement, and we held approximately $308 million of retained securities as eligible collateral.
As discussed in Recent Developments above, we have entered into a definitive Agreement of Merger, as amended, with C-BASS that is subject to various closing conditions. In order to provide pre-merger liquidity to the Company, C-BASS has agreed to purchase, at the Company’s option, certain of our assets, including certain of our retained securities and substantially all of our inventories of loans held for sale and real estate owned properties and C-BASS and we have agreed to the forward sale of our future loan production to C-BASS for loans originated on or after March 1, 2007, which is exercisable at our option. Accordingly, the agreements have increased our liquidity and decreased our dependence on identifying additional buyers for our loans. Management currently expects the proposed merger to close during the second quarter of 2007. However, the failure of this proposed merger to close at that time, or at all, may subject us to increased liquidity risks, including our ability to generate sufficient cash flows to continue supporting our current operations and the potential default of covenants contained in our credit facilities, particularly the minimum adjusted tangible net worth and profitability covenants. In the event of a breach of a covenant contained in a facility that triggers an event of default, then the lender may accelerate outstanding principal repayment owed under the facility and such acceleration may permit other lenders to accelerate all of the outstanding principal repayment under their facilities. Such a series of events could have a material adverse effect on our financial condition. In such a situation, we believe that we would be able to generate sufficient cash from our existing operations, maintain sufficient liquidity, and make alternative arrangements, including obtaining waivers or amendments from existing lenders or reach agreement with new lenders, to enable us to continue to meet our obligations for the next twelve months. However, we would need to significantly restructure our operations, which would include further consolidation and work force reductions to continue to meet our ongoing obligations.
86
A primary component of our liquidity strategy is to finance our mortgage loans through a diverse group of lending counterparties prior to issuing securities collateralized by the loans held for investment and to schedule frequent sales or securitizations of loans so that the average holding period of our inventory of loans generally does not exceed 60 days. As discussed above, we have announced a number of production initiatives to improve our originations. If our originations grow significantly, we may need additional sources of liquidity, which may include increasing the capacity under our existing facilities, adding additional facilities, and issuing securities in the form of debt or equity. We use our excess cash from operations to reduce the advances on our credit facilities. This process reduces our debt outstanding and the corresponding interest expense incurred, and results in a pool of highly liquid mortgage collateral available to secure borrowings to meet our working capital needs. This pool of available collateral totaled approximately $98 million and $199 million as of December 31, 2006 and 2005, respectively. We expect to continue to invest our working capital in our portfolio of loans held for investment.
Our liquidity has decreased significantly in 2006 and has continued to decrease to date in 2007 primarily as a result of margin calls on the collateral for our credit facilities and increased loan repurchases. As the market value of the collateral declines, we are required to increase the amount of collateral held by our lenders to maintain the same amount of borrowings. Increased loan repurchases during 2006 on loans sold as a result of deteriorating loan performance has required us to repurchase or replace the delinquent loans, decreasing the pool of available collateral on which we may borrow, as our ability to borrow against repurchased loans is limited. Margin calls and loan repurchase requests increased during 2006, resulting in our decreased liquidity as of December 31, 2006, and have continued to increase to date in 2007. In addition, due in part to the uncertainty in the subprime market, the number of investors in whole loan sales and securitizations of subprime loans has decreased. This has led in part to lower sales premiums on whole loan sales, and increased interest rates on the bonds issued in securitizations. If this trend continues further, our liquidity could continue to be negatively affected. Many of our lenders also lend to our competitors. To the extent that our lenders are negatively impacted by the conditions in the subprime industry, they may restrict liquidity to any participants in the industry. This may require us to seek other sources of liquidity, which may not be available on terms that are acceptable to us.
To date, we have used a portion of our cash and available liquidity to pay dividends to our shareholders. Dividends declared are based on our REIT taxable income, which differs from our net income as described below under REIT Taxable Income. To maintain our status as a REIT, we are required to distribute at least 90% of our REIT taxable income each year to our stockholders. As a result of this requirement and the classification of certain cash flows under GAAP in our consolidated statements of cash flows in the accompanying financial statements, dividends distributed may exceed our operating cash flows. In such situations, we have used cash and available liquidity, including increased borrowings under our warehouse lines, to pay dividends as required to maintain our REIT status.
The Board of Directors authorized the repurchase of up to $40 million of outstanding common shares during the year ended December 31, 2006 under a stock repurchase program announced on November 28, 2005. As of December 31, 2006, we had repurchased approximately $20.1 million of shares under the program, none of which occurred during the fourth quarter of 2006. As of December 31, 2006, our authorization to repurchase shares expired.
In the first quarter of 2006, our Board of Directors approved a plan to sell, close or otherwise dispose of the assets of our conforming retail and conforming wholesale segments. In February 2006, the assets pertaining to these segments’ headquarters, all wholesale offices, and certain of its retail offices were sold to third parties. The remaining assets of the conforming division were combined with our non-conforming retail offices. This impact did not have a significant impact on the cash flows or liquidity of our continuing operations.
Cash Flows
For the years ended December 31, 2006, our cash flow used in operating activities of our continuing operations was $170.5 million compared to $200.1 million in 2005 and $101.5 million provided by operating activities in 2004. The increase in cash flow from operating activities compared to 2005 is due primarily to the decrease in receivables from our trustee, which represents loan payments received after the monthly cutoff date, as prepayment speeds have slowed in 2006. Cash flows from investing activities of our continuing operations provided $37.6 million of cash in 2006, compared to uses of $738.6 million in 2005 and $3.5 billion in 2004. The increase in cash from investing activities primarily relates to the lower volume of loans funded for investment. Investing cash flows, as presented in our condensed consolidated statements of cash flows, will typically be a use of cash because they exclude the net proceeds from mortgage warehouse financing and securitization financing used to support the increase in our investment in mortgage loans. We are required to show the net proceeds from, or repayments of, mortgage financing in our consolidated statements of cash flows as cash flow from financing activities and not as investing cash flow. Cash flows provided by financing activities of our continuing operations was $102.0 million in 2006 compared to $903.7 million in 2005 and $3.3 billion in 2004. The decrease in cash from financing activities is due primarily to increased repayments on our securitized financings, including calling FMIT series 2004-1, 2004-2, and 2003-1.
87
REIT Taxable Income
To maintain our status as a REIT, we are required to distribute at least 90% of our REIT taxable income each year to our shareholders. Federal tax rules calculate REIT taxable income in a manner that, in certain respects, differs from the calculation of consolidated net income pursuant to GAAP. Our consolidated GAAP net income will differ from our REIT taxable income primarily for the following reasons:
| | • | | the provision for loan loss expense recognized for GAAP purposes is based upon our estimate of probable loan losses inherent in our current portfolio of loans held for investment, for which we have not yet recorded a charge-off (tax accounting rules allow a deduction for loan losses only in the period when a charge-off occurs); |
| | • | | the mark to market valuation changes to our interest rate swap derivatives recognized for GAAP purposes are not recognized for tax accounting; |
| | • | | the interest income on non performing loans is reversed for GAAP purposes, but is included in the calculation of REIT taxable income until the earlier of foreclosure or loan charge-off; |
| | • | | the differences between GAAP and tax methodologies for capitalization of origination expenses; and |
| | • | | income of a TRS is included in the REIT’s earnings for consolidated GAAP purposes; tax rules for REIT taxable income do not provide for a REIT to recognize income of the TRS until a TRS pays a dividend to the REIT. |
Our REIT taxable income will continue to differ from our GAAP consolidated income, particularly during the period in which we build our investment portfolio.
REIT taxable income is a non-GAAP financial measure within the meaning of Regulation G promulgated by the SEC. Management believes that the presentation of REIT taxable income provides useful information to investors regarding the estimated annual distributions to our investors. The presentation of REIT taxable income is not meant to be considered in isolation or as a substitute for financial results prepared in accordance with GAAP.
A reconciliation of GAAP net income to estimated REIT taxable net income for the year ended December 31, 2006 is as follows:
| | | | |
($ in 000,000s) | | Year Ended
December 31,
2006 | |
Consolidated GAAP net loss | | $ | (68.4 | ) |
Non-performing interest in excess of actual charge-offs | | | 17.8 | |
Provision for loan losses in excess of actual charge-offs | | | 37.9 | |
Variance in recognition of net origination expenses | | | (6.7 | ) |
Taxable REIT subsidiary net loss | | | 25.8 | |
Mark to market valuation changes on derivatives | | | 27.2 | |
Non-deductible expenses and miscellaneous other | | | 11.7 | |
| | | | |
Estimated REIT taxable income | | $ | 45.3 | |
| | | | |
Estimated 2006 REIT taxable income is subject to change until we file our REIT federal tax return.
88
Commitments and Contingencies
As of December 31, 2006 and 2005, the Company had origination commitments outstanding to fund approximately $541.5 million and $422.0 million in mortgage loans, respectively. Fixed rate and hybrid ARM mortgages which are fixed for the initial two to three year term of the loan comprised approximately 100% and 97.0%, respectively, of the outstanding origination commitments. The Company had forward delivery commitments of approximately $0.9 billion and $1.3 billion as of December 31, 2006 and 2005, respectively, of which $45.0 million and $26.6 million, respectively, were mandatory sales of mortgage-backed securities and mandatory investor whole loan trades. Treasury note forward contracts, used to economically hedge the interest rate risk of non-conforming loans, comprised $0.9 billion and $0.6 billion of the forward delivery commitments as of December 31, 2006 and 2005, respectively.
Required payments related to our contractual obligations as of December 31, 2006 are as follows:
Contractual Commitments
| | | | | | | | | | | | | | | |
($ in 000s) | | Total | | Less than
1 Year | | 1 – 3 Years | | 4 – 5
Years | | More Than
5 Years |
Warehouse financing facilities1 | | $ | 911,178 | | $ | 911,178 | | $ | — | | $ | — | | $ | — |
Securitization financing1, 2 | | | 4,863,667 | | | 2,262,812 | | | 2,143,222 | | | 450,069 | | | 7,564 |
Deferred compensation | | | 250 | | | 250 | | | | | | — | | | — |
Operating leases | | | 20,913 | | | 7,254 | | | 10,776 | | | 2,833 | | | 50 |
Loan commitments | | | 898,096 | | | 898,096 | | | — | | | — | | | — |
| | | | | | | | | | | | | | | |
Total commitments | | $ | 6,694,104 | | $ | 4,079,590 | | $ | 2,153,998 | | $ | 452,902 | | $ | 7,614 |
| | | | | | | | | | | | | | | |
1 | Includes principal and accrued interest based on the prevailing interest rate at December 31, 2006. |
2 | Includes principal and expected interest based on the prevailing interest rate at December 31, 2006. |
The principal maturity of the securitization financing reflects our estimate of the expected loan prepayments of the mortgage loans securing the debt. Actual maturity may vary from this estimate. We do not have comprehensive performance data on our loans sold to investors. Accordingly, we have utilized historical industry data for our prepayment assumptions based upon characteristics such as the credit, loan size, product type and prepayment fee terms. There can be no assurance that this historical data will be reflective of our actual results.
See a description of our material legal proceedings contained in Part 1, Item 3 of this Annual Report on Form 10-K. Because the nature of our business involves the collection of numerous accounts, the validity of liens and compliance with various state and federal lending and consumer protection laws, we are subject to various legal proceedings in the ordinary course of our business related to foreclosures, bankruptcies, condemnation and quiet title actions and alleged statutory and regulatory violations. We are also subject to other legal proceedings in the ordinary course of business related to employee matters. All of these ordinary course proceedings, taken as a whole, are not expected to have a material adverse effect on our business, financial condition, results of operations, or cash flows. However, if an unfavorable ruling were to occur in one or more of these proceedings, there exists the possibility of a material impact on the Company’s financial condition and results of operations or cash flows.
89
Other Operational Data
Loan Fundings
Total fundings for the years ended December 31, 2006, 2005, and 2004 are as follows:
| | | | | | | | | | | | | | | | | | |
| | | Year Ended December 31, | |
| | | 2006 | | | 2005 | | | 2004 | |
($ in 000s) | | Fundings | | % of
Total | | | Fundings | | % of
Total | | | Fundings | | % of
Total | |
Wholesale | | $ | 4,642,792 | | 85 | % | | $ | 5,348,385 | | 72 | % | | $ | 5,529,824 | | 74 | % |
Retail | | | 711,651 | | 13 | % | | | 789,261 | | 11 | % | | | 822,982 | | 11 | % |
| | | | | | | | | | | | | | | | | | |
Total continuing operations | | | 5,354,443 | | 98 | % | | | 6,137,646 | | 83 | % | | | 6,352,806 | | 85 | % |
Discontinued operations | | | 127,797 | | 2 | % | | | 1,291,086 | | 17 | % | | | 1,122,441 | | 15 | % |
| | | | | | | | | | | | | | | | | | |
Total fundings | | $ | 5,482,240 | | 100 | % | | $ | 7,428,732 | | 100 | % | | $ | 7,475,247 | | 100 | % |
| | | | | | | | | | | | | | | | | | |
Loan fundings from continuing operations decreased to $5.4 billion in the year ended December 31, 2006 from $6.1 billion and $6.4 billion, respectively, in the years ended December 31, 2005 and 2004. The decrease in loan fundings was due primarily to a decline in the overall mortgage market, as 2006 origination volumes decreased 17% from 2005 levels as a result of the slowing housing market coupled with rising interest rates. This decrease in loan fundings directly affected the levels of all of our revenues and many of our operating expenses.
In response to the decline in originations, we introduced several initiatives late in 2006 designed to improve our originations. These include the rollout of several new products and pricing, the introduction of a simplified rate sheet, and a revised commission plan. We began to see the benefit of these initiatives in the fourth quarter of 2006, as our 2006 originations exceeded originations during the comparable period of 2005 for the first time in 2006. We expect to fully realize the benefit of our initiatives in 2007.
Cost to Produce
Cost to produce is a non-GAAP financial measure within the meaning of Regulation G promulgated by the SEC. Management believes that the presentation of cost to produce provides useful information to investors regarding financial performance because this measure includes additional costs to originate mortgage loans, both recognized when incurred and deferred costs, which are not included in total expenses under GAAP. Management uses cost to produce to evaluate the efficiency of its origination operations. The presentation of cost to produce is not meant to be considered in isolation or as a substitute for financial results prepared in accordance with GAAP.
90
As required by Regulation G, a reconciliation of cost to produce, excluding the results of our discontinued conforming segments, to the most directly comparable measure under GAAP, total expenses, for the years ended December 31, 2006, 2005, and 2004 is as follows:
| | | | | | | | | | | | |
Cost to produce1, 2 | | | |
| | | Year Ended December 31, | |
| | | 2006 | | | 2005 | | | 2004 | |
| | | |
($000) | | | | | | | | | | | | |
Branch direct production expense | | $ | 108,365 | | | $ | 115,369 | | | $ | 123,247 | |
Premiums paid to brokers | | | 26,211 | | | | 40,666 | | | | 47,349 | |
Fees collected | | | (33,212 | ) | | | (36,839 | ) | | | (40,283 | ) |
| | | | | | | | | | | | |
Net production costs | | | 101,364 | | | | 119,196 | | | | 130,313 | |
Corporate overhead | | | 47,204 | | | | 38,504 | | | | 31,567 | |
| | | | | | | | | | | | |
Cost to produce1, 2 | | $ | 148,568 | | | $ | 157,700 | | | $ | 161,880 | |
| | | | | | | | | | | | |
Mortgage loan fundings1 | | $ | 5,354,443 | | | $ | 6,137,646 | | | $ | 6,352,806 | |
| |
| | | Year Ended December 31, | |
Cost to produce as % of mortgage loan fundings | | 2006 | | | 2005 | | | 2004 | |
Branch direct production expense | | | 2.03 | % | | | 1.87 | % | | | 1.94 | % |
Premiums paid to brokers | | | 0.49 | % | | | 0.66 | % | | | 0.75 | % |
Fees collected | | | (0.62 | )% | | | (0.60 | )% | | | (0.63 | %) |
| | | | | | | | | | | | |
Net production costs | | | 1.90 | % | | | 1.93 | % | | | 2.06 | % |
Corporate overhead | | | 0.88 | % | | | 0.64 | % | | | 0.50 | % |
| | | | | | | | | | | | |
Cost to produce as % of mortgage loan fundings1, 2 | | | 2.78 | % | | | 2.57 | % | | | 2.56 | % |
| | | | | | | | | | | | |
1 | Excludes cost to produce and mortgage loan fundings relating to discontinued operations. |
2 | Excludes $10.6 million of charges related to the settlement of the Bass litigation recorded in 2006, which were one-time charges unrelated to our origination operations. |
Our cost to produce increased in the year ended December 31, 2006 compared to the years ended December 31, 2005 and 2004 due primarily to (i) an increased allocation of fixed costs on a per-loan basis as a result of lower funding volumes, (ii) increased salaries for additional corporate office staffing associated with compliance with the Sarbanes-Oxley Act of 2002 and various other public company functions, (iii) the cost of implementing our new loan origination system, and (iv) the inclusion of $1.0 million of costs related to the consolidation of operations centers, including severance payments and future lease payments in 2006, which were accelerated and recognized in the current period in accordance with GAAP but will reduce the recurring costs in future periods. Cost to produce, as presented, excludes $10.6 million of charges related to the settlement of the Bass litigation recorded in 2006, which were one-time charges unrelated to our origination operations.
In response to the increase in cost to produce as a percentage of origination volume, we implemented several cost management initiatives during 2006, including pricing and commission reductions, improved use of technology, the aforementioned branch consolidations, and vendor restructuring, to reduce our cost to produce. We are currently evaluating additional cost management initiatives, including further operations consolidation and a proportional reduction in home office staff, as the current market conditions continue to evolve. In addition to our cost management initiatives, we have also introduced production initiatives, including the rollout of several new products, the introduction or a more simplified rate sheet, and a revised commission plan, with a corresponding reduction in cost to produce as a percentage of loan fundings. We expect our cost to produce to improve over time due to these initiatives.
91
Core Financial Measures
The various core financial measures presented below are non-GAAP financial measures within the meaning of Regulation G promulgated by the SEC. Management believes that the presentation of core financial measures is useful to investors because they include the current period cash settlements on our hedging program but exclude the non-cash mark to market valuation changes and the amortization of swap buydown payments, allowing investors more insight into current period earnings and performance. Our hedging program consists of derivative contracts, primarily interest rate swap agreements, to hedge loans held in its portfolio during the fixed rate portion of the loan, when we receive a fixed rate of interest income on the loan but pay a variable rate of interest expense on the debt underlying the loan. The non-cash valuation changes on these derivatives are excluded from core measures because they represent the market’s estimates of future interest rates, which are not directly related to our business operations, and the estimated valuations do not include any off-setting changes in the interest expense on the swapped debt that would be incurred. Cash settlements, representing the difference between the swapped interest rate and the actual interest rates, are included in core financial measures as they are incurred. Both the changes in the fair value and all cash settlements related to these derivative contracts are recognized in the line item “Other income– portfolio derivatives” on the consolidated statements of operations. Management uses the core measures to evaluate our profitability for purposes of personnel incentives, profitability analysis and for covenant compliance with its lenders. The presentation of these measures is not meant to be considered in isolation or as a substitute for financial results prepared in accordance with GAAP. As required by Regulation G, a reconciliation of each core financial measure to the most directly comparable GAAP financial measure is presented below.
| | Core | Net Income and Core Earnings Per Share |
A reconciliation of net income and earnings per share in the consolidated statements of operations, presented in accordance with GAAP, to core net income and core earnings per share for the years ended December 31, 2006, 2005 and 2004 is as follows:
| | | | | | | | | | | | |
| | | Year Ended December 31, | |
($ in 000s) | | 2006 | | | 2005 | | | 2004 | |
Core net income: | | | | | | | | | | | | |
Net (loss) income | | $ | (68,385 | ) | | $ | 99,390 | | | $ | 63,596 | |
Add back: Mark to market loss (gain) on portfolio derivatives included in “Other income – portfolio derivatives” | | | | | | | | | | | | |
Mark to market interest rate swaps . | | | 27,224 | | | | (9,456 | ) | | | (21,934 | ) |
Mark to market interest rate cap | | | — | | | | 457 | | | | 1,422 | |
| | | | | | | | | | | | |
Total mark to market on portfolio derivatives | | | 27,224 | | | | (8,999 | ) | | | (20,512 | ) |
Add back: Amortization of interest rate swap buydown payments | | | (3,140 | ) | | | (755 | ) | | | — | |
| | | | | | | | | | | | |
Core net (loss) income | | $ | (44,301 | ) | | $ | 89,636 | | | $ | 43,084 | |
| | | | | | | | | | | | |
Core (loss) earnings per share | | | | | | | | | | | | |
Net (loss) income | | $ | (68,385 | ) | | $ | 99,390 | | | $ | 63,596 | |
Nonvested restricted stock dividends | | | (342 | ) | | | (591 | ) | | | (571 | ) |
| | | | | | | | | | | | |
Net (loss) income available to common shareholders | | | (68,727 | ) | | | 98,799 | | | | 63,025 | |
| | | |
Add back: Mark to market loss (gain) loss on portfolio derivatives | | | 27,224 | | | | (8,999 | ) | | | (20,512 | ) |
Amortization of interest rate swap buydown payments | | | (3,140 | ) | | | (755 | ) | | | — | |
| | | | | | | | | | | | |
Core net (loss) income available to common shareholders | | $ | (44,643 | ) | | $ | 89,045 | | | $ | 42,513 | |
| | | | | | | | | | | | |
(Loss) earnings per share – basic and diluted | | $ | (1.45 | ) | | $ | 2.04 | | | $ | 1.30 | |
Core (loss) earnings per share – basic and diluted | | $ | (0.94 | ) | | $ | 1.84 | | | $ | 0.88 | |
| | | |
Weighted average common shares outstanding-basic | | | 47,304,189 | | | | 48,449,872 | | | | 48,328,271 | |
Weighted average common shares outstanding-diluted | | | 47,304,189 | | | | 48,464,445 | | | | 48,370,502 | |
We reported a core net loss for the year ended December 31, 2006 compared to core net income for the preceding two years due primarily to decreases in both our net gains on sale and net interest income due to a decline in net interest margin on loans originated in 2006 and increases in our provision for loan losses. The core net loss for
92
2006 also included $10.6 million of charges related to the settlement of the Bass litigation, a $0.9 million pre-tax loss on the disposal of our discontinued operations, and the costs that were accelerated and recognized in 2006 related to our consolidation of operations centers.
| | Core | Net Interest Income and Margin |
A reconciliation of net interest income after provision for loan losses in the consolidated statements of operations, presented in accordance with GAAP, to core net interest income after provision for loan losses for the years ended December 31, 2006, 2005 and 2004 is as follows:
| | | | | | | | | | | |
| | | Year Ended December 31, | |
($ in 000s) | | 2006 | | | 2005 | | | 2004 | |
Core net interest income after provision for loan losses: | | | | | | | | | | | |
Net interest (expense) income after provision for loan losses | | $ | 35,104 | | | $ | 133,641 | | | 132,755 | |
Plus: Net cash settlements received (paid) on portfolio derivatives included in “Other income (expense) – portfolio derivatives” | | | 41,436 | | | | 24,470 | | | (11,723 | ) |
Add back: Amortization of interest rate swap buydown payments | | | (3,140 | ) | | | (755 | ) | | — | |
| | | | | | | | | | | |
Core net interest income after provision for loan losses | | | 73,400 | | | $ | 157,356 | | | 121,032 | |
| | | | | | | | | | | |
Interest income loans held for investment | | | 409,675 | | | $ | 344,521 | | | 206,460 | |
| | | |
Interest expense loans held for investment | | | 319,961 | | | | 198,688 | | | 69,039 | |
Plus: Net cash settlements received (paid) on portfolio derivatives | | | (41,436 | ) | | | (24,470 | ) | | 11,723 | |
Plus: Amortization of interest rate swap buydown payments | | | 3,140 | | | | 755 | | | — | |
| | | | | | | | | | | |
Core interest expense – loans held for investment | | | 281,665 | | | | 174,973 | | | 80,762 | |
| | | | | | | | | | | |
Core net interest income loans held for investment | | | 128,010 | | | | 169,548 | | | 125,698 | |
Provision for loan losses loans held for investment | | | 69,062 | | | | 30,065 | | | 21,556 | |
| | | | | | | | | | | |
Core net interest income loans held for investment after provision for loan losses | | | 58,948 | | | | 139,483 | | | 104,142 | |
| | | |
Net interest income loans held for sale | | | 14,452 | | | | 17,873 | | | 16,899 | |
| | | | | | | | | | | |
Core net interest income after provision for loan losses | | $ | 73,400 | | | $ | 157,356 | | | 121,041 | |
| | | | | | | | | | | |
Core yield analysis: | | | | | | | | | | | |
Core yield analysis – loans held for investment: | | | | | | | | | | | |
Coupon interest income on loans held for investment | | | 7.22 | % | | | 6.69 | % | | 6.63 | % |
Amortization of deferred origination costs | | | (0.41 | )% | | | (0.51 | )% | | (0.41 | )% |
Prepayment fees | | | 0.35 | % | | | 0.65 | % | | 0.39 | % |
| | | | | | | | | | | |
Yield on loans held for investment | | | 7.16 | % | | | 6.83 | % | | 6.61 | % |
| | | | | | | | | | | |
Cost of financing for loans held for investment | | | 5.67 | % | | | 4.04 | % | | 2.37 | % |
Net cash settlements (received) paid on portfolio derivatives | | | (0.73 | )% | | | (0.50 | )% | | 0.40 | % |
Amortization of interest rate swap buydown payments | | | 0.06 | % | | | 0.02 | % | | 0.00 | % |
| | | | | | | | | | | |
Core cost of financing for loans held for investment | | | 5.00 | % | | | 3.56 | % | | 2.77 | % |
| | | | | | | | | | | |
Net yield on loans held for investment | | | 1.57 | % | | | 2.89 | % | | 4.40 | % |
Net cash settlements received (paid) on portfolio derivatives | | | 0.72 | % | | | 0.49 | % | | (0.38 | )% |
Amortization of interest rate swap buydown payments | | | (0.05 | )% | | | (0.01 | )% | | 0.00 | % |
| | | | | | | | | | | |
Core net yield on loans held for investment | | | 2.24 | % | | | 3.37 | % | | 4.02 | % |
Provision for loan losses – loans held for investment | | | (1.21 | )% | | | (0.60 | )% | | (0.69 | )% |
| | | | | | | | | | | |
Core yield on loans held for investment after provision for loan losses | | | 1.03 | % | | | 2.77 | % | | 3.33 | % |
| | | | | | | | | | | |
Core yield analysis – loans held for sale: | | | | | | | | | | | |
Yield on loans held for sale | | | 7.91 | % | | | 7.50 | % | | 7.60 | % |
Cost of financing for loans held for sale | | | 5.52 | % | | | 4.40 | % | | 2.56 | % |
Net yield on loans held for sale | | | 3.68 | % | | | 4.31 | % | | 6.37 | % |
| | | |
Total core yield analysis: | | | | | | | | | | | |
Total yield- net interest income after provision for loan losses | | | 0.57 | % | | | 2.45 | % | | 3.92 | % |
Net cash settlements received (paid) on portfolio derivatives | | | 0.68 | % | | | 0.44 | % | | (0.35 | )% |
Amortization of interest rate swap buydown payments | | | (0.05 | )% | | | (0.01 | )% | | 0.00 | % |
| | | | | | | | | | | |
Core yield – net interest income on loans held for sale and loans held for investment after provision for loan losses | | | 1.20 | % | | | 2.88 | % | | 3.57 | % |
| | | | | | | | | | | |
93
Core net interest income after the provision for loan losses decreased for the year ended December 31, 2006 due primarily to the increased provision for loan losses resulting from the performance of recent originations and the lower net interest spreads available on new loans added to the portfolio during 2006, as older loans economically hedged with lower rate swaps prepaid and were replaced with new loans with coupons that had not increased to the same extent as the increase in our financing costs, including higher interest rate swap rates.
Core Equity and Core Portfolio Leverage
A reconciliation of equity and portfolio leverage, presented in accordance with GAAP, to core equity and core portfolio leverage as of December 31, 2006 and 2005 is as follows:
| | | | | | | |
($ in 000s) | | December 31,
2006 | | | December 31,
2005 |
Core equity: | | | | | | | |
Equity balance at period end | | $ | 381,329 | | | $ | 526,643 |
Less: Cumulative mark to market (loss) gain loss on portfolio derivatives included in “Other income (expense) – portfolio derivatives” | | | (1,111 | ) | | | 26,113 |
Less: Cumulative amortization of interest rate swap buydown payments | | | 3,894 | | | | 755 |
| | | | | | | |
Core equity balance at period end | | $ | 378,546 | | | $ | 499,775 |
| | | | | | | |
Portfolio debt (warehouse financing – loans held for investment and securitization financing) | | $ | 5,460,680 | | | $ | 5,377,327 |
Portfolio leverage (portfolio debt to equity) | | | 14.3:1 | | | | 10.2:1 |
Core portfolio leverage (portfolio debt to core equity) | | | 14.4:1 | | | | 10.8:1 |
Recent Accounting Pronouncements
For discussion of recently issued accounting pronouncements that may impact our operations or financial condition, see Note 1 to our Consolidated Financial Statements.
Off-Balance Sheet Arrangements
As of December 31, 2006, we were not a party to any off-balance sheet arrangements.
Effect of Inflation
Inflation affects us most significantly in the effect it has on interest rates and real estate values. Our level of loan originations is affected by the level and trends of interest rates. Interest rates normally increase during periods of high inflation, or when the Federal Reserve Bank raises short-term interest rates in an attempt to prevent inflation, and decrease during periods of low inflation. In addition, inflation of real estate values increases the equity homeowners have in their homes and increases the volume of refinancing loans we can originate as borrowers draw down on the increased equity in their homes. We believe that real estate inflation will improve the performance of the loans originated by us in the past, reducing delinquencies and defaults, as borrowers protect or borrow against the equity in their homes. We believe the increase in delinquencies and losses on more recent originations currently being experienced throughout the mortgage industry is the result of the slowing of this real estate inflation.
| ITEM 7A. | QUANTITATIVE AND QUALITATIVE DISCLOSURES ABOUT MARKET RISK. |
We carry interest-sensitive assets on our balance sheet that are financed by interest-sensitive liabilities. We are subject to interest rate risk because the interval for re-pricing of the assets and liabilities is not matched. An increase or decrease in interest rates would affect our net interest income and the fair value of our mortgage loans held for
94
investment and held for sale as well as the related financing. We employ hedging strategies to manage the interest-rate risk inherent in our assets and liabilities. These strategies are designed to create gains when movements in interest rates would cause our cash flows or the value of our assets to decline and to result in losses when movements in interest rates cause our cash flows and/or the value of our assets to increase.
The interest rates on our hybrid ARM loans held for investment are fixed for the first two to three years of the loan, after which the interest rates reset every six months to the then-current market rate. The interest rates on the bonds financing these loans reset to current market rates each month during the entire term of the loan. During the period we are receiving fixed rate payments on our loans, we use interest rate swaps to pay fixed rate payments to the swap counter-party for which we receive variable interest rate payments to match the interest rates on our financing interest payment. The swap of “variable for fixed” rates allows us to match fund our loans during the fixed period of the loans.
The following tables illustrate the timing of the re-pricing of our interest-sensitive assets and liabilities as of December 31, 2006 and 2005. We have made certain assumptions in determining the timing of re-pricing of these assets and liabilities. One of the more significant assumptions is that all of our mortgage loans held for sale will be sold within six months of origination. In addition, the timing of re-pricing or maturity of our mortgage loans held for investment and related financing is based on prepayment and loss assumptions which may be affected by changes in interest rates as well as other factors.
As of December 31, 2006
| | | | | | | | | | | | | | | | | | | | | |
Description | | 0-6 Months | | | 6 Months
to 1 Year | | | 1-2 Years | | | 3-4
Years | | 5-6
Years | | Thereafter | | Total | | Fair Value |
| | | (in thousands) |
Interest-sensitive assets: | | | | | | | | | | | | | | | | | | | | | |
Cash and restricted cash | | $ | 32,791 | | | — | | | — | | | — | | — | | — | | 32,791 | | $ | 32,791 |
Mortgage loans held for sale, net | | | 550,520 | | | — | | | — | | | — | | — | | — | | 550,520 | | | 552,730 |
Mortgage loans held for investment, net | | | 1,684,773 | | | 1,753,571 | | | 1,502,462 | | | 578,532 | | — | | — | | 5,519,338 | | | 5,439,798 |
| | | | | | | | | | | | | | | | | | | | | |
Total interest-sensitive assets | | | 2,268,084 | | | 1,753,571 | | | 1,502,462 | | | 578,532 | | — | | — | | 6,102,649 | | | 6,025,319 |
Interest-sensitive liabilities: | | | | | | | | | | | | | | | | | | | | | |
Warehouse financing | | | 908,178 | | | — | | | — | | | — | | — | | — | | 908,178 | | | 908,178 |
Securitization financing | | | 5,032,878 | | | — | | | — | | | — | | — | | — | | 5,032,878 | | | 5,032,878 |
Interest rate swaps | | | (3,084,886 | ) | | 1,286,696 | | | 1,604,701 | | | 201,318 | | — | | — | | 7,829 | | | 7,829 |
| | | | | | | | | | | | | | | | | | | | | |
Total interest-sensitive liabilities | | | 2,856,170 | | | 1,286,696 | | | 1,604,701 | | | 201,318 | | — | | — | | 5,948,885 | | | 5,948,885 |
Excess (short-falls) of interest-sensitive assets over interest-sensitive liabilities | | | (588,086 | ) | | 466,875 | | | (102,239 | ) | | 377,214 | | — | | — | | 153,764 | | | 76,434 |
| | | | | | | | | | | | | | | | | | | | | |
Cumulative net interest-sensitivity gap | | | (588,086 | ) | | (121,211 | ) | | (223,450 | ) | | 153,764 | | 153,764 | | 153,764 | | 153,764 | | $ | 76,434 |
| | | | | | | | | | | | | | | | | | | | | |
95
As of December 31, 2005
| | | | | | | | | | | | | | | | | | | | | | | | |
Description | | 0-6 Months | | | 6 Months
to 1 Year | | | 1-2 Years | | | 3-4
Years | | 5-6
Years | | | Thereafter | | Total | | | Fair Value | |
| | | (in thousands) | |
Interest-sensitive assets: | | | | | | | | | | | | | | | | | | | | | | | | |
Cash and restricted cash | | $ | 41,424 | | | — | | | — | | | — | | — | | | — | | 41,424 | | | $ | 41,424 | |
Mortgage loans held for sale, net | | | 594,269 | | | — | | | — | | | — | | — | | | — | | 594,269 | | | | 602,321 | |
Mortgage loans held for investment, net | | | 1,416,640 | | | 1,449,646 | | | 2,017,150 | | | 642,857 | | — | | | — | | 5,526,293 | | | | 5,526,329 | |
Derivative assets, loans held for sale | | | 9 | | | — | | | — | | | — | | — | | | — | | 9 | | | | 9 | |
| | | | | | | | | | | | | | | | | | | | | | | | |
Total interest-sensitive assets | | | 2,052,342 | | | 1,449,646 | | | 2,017,150 | | | 642,857 | | — | | | — | | 6,161,995 | | | | 6,170,083 | |
Interest-sensitive liabilities: | | | | | | | | | | | | | | | | | | | | | | | | |
Warehouse financing | | | 812,768 | | | — | | | — | | | — | | — | | | — | | 812,768 | | | | 812,768 | |
Securitization financing | | | 4,998,620 | | | — | | | — | | | — | | — | | | — | | 4,998,620 | | | | 4,998,620 | |
Derivative liabilities, loans held for sale | | | 750 | | | — | | | — | | | — | | — | | | — | | 750 | | | | 750 | |
Interest rate swaps | | | (2,995,283 | ) | | 1,264,181 | | | 1,671,069 | | | 25,000 | | (9 | ) | | — | | (35,042 | ) | | | (35,042 | ) |
Interest rate cap | | | (10 | ) | | | | | — | | | — | | — | | | — | | (10 | ) | | | (10 | ) |
| | | | | | | | | | | | | | | | | | | | | | | | |
Total interest-sensitive liabilities | | | 2,816,845 | | | 1,264,181 | | | 1,671,069 | | | 25,000 | | (9 | ) | | — | | 5,777,086 | | | | 5,777,086 | |
Excess (short-falls) of interest-sensitive assets over interest-sensitive liabilities | | | (764,503 | ) | | 185,465 | | | 346,081 | | | 617,857 | | (9 | ) | | — | | 384,909 | | | | 392,997 | |
| | | | | | | | | | | | | | | | | | | | | | | | |
Cumulative net interest-sensitivity gap | | $ | (764,503 | ) | | (579,038 | ) | | (232,957 | ) | | 384,900 | | 384,909 | | | 384,909 | | 384,909 | | | $ | 392,997 | |
| | | | | | | | | | | | | | | | | | | | | | | | |
The cumulative total net interest sensitivity gap as a percent of total interest-sensitive assets as of December 31, 2006 and 2005 was 2.5% and 6.2%, respectively, which is within the 10% threshold management establishes for effective economic hedging of our variable rate financing costs compared to our fixed rate earning mortgage assets. Due to the long-term nature of our interest rate sensitive assets and liabilities and the often unpredictable prepayment speeds of the assets, management chooses to evaluate the cumulative total net interest sensitivity gap of the assets and liabilities as opposed to focusing on the interest sensitivity gap for interim periods. We believe that we have sufficient liquidity available to us to allow us to utilize this strategy.
As discussed above, our policy is to economically hedge the financing of the loans during the period in which the loans are paying a fixed coupon,. During an increasing interest rate environment, our assets may prepay more slowly than expected, requiring us to finance a higher amount of fixed assets with floating rate debt than originally anticipated, at a time when interest rates may be higher, resulting in a decline in our net return. Partially offsetting this decreased yield, decreased prepayments would cause us to amortize the deferred origination costs of our loans over a longer time period, which would serve to increase the yield on these loans. In order to manage our exposure to changes in the prepayment speed of our hybrid loan assets, we regularly monitor the portfolio balance, revise estimated prepayment speeds and adjust the notional balance of our hedging derivatives.
Conversely, during periods of falling interest rates, the rate of prepayment on our mortgage assets may increase during the fixed interest rate portion of the loan. Increased prepayments would cause us to amortize the deferred origination costs of our mortgage assets faster, resulting in a reduced yield on our mortgage assets. Additionally, to the extent proceeds of prepayments cannot be reinvested at a rate of interest at least equal to the rate previously earned on such mortgage assets, our earnings may be adversely affected.
Finally, changes in interest rates may impact total origination volumes. During periods of rising interest rates, there may be lower total loan origination and refinance activity. At the same time, a rising interest rate environment may result in a larger percentage of ARM products being originated, mitigating the impact of lower overall loan origination and refinance activity. Conversely, during a declining interest rate environment, consumers, in general, may favor fixed-rate mortgage products over ARM and hybrid products. A flat or inverted yield curve may shift borrower preference from an ARM mortgage loan to a fixed mortgage loan.
96
| ITEM 8. | FINANCIAL STATEMENTS AND SUPPLEMENTARY DATA. |
Our consolidated financial statements as of December 31, 2006 and 2005 and for each of the three years in the period ended December 31, 2006 and the Report of Independent Registered Public Accounting Firm Deloitte & Touche LLP, are included in this Form 10-K beginning on page F-1.
| ITEM 9. | CHANGES IN AND DISAGREEMENTS WITH ACCOUNTANTS ON ACCOUNTING AND FINANCIAL DISCLOSURE. |
None.
| ITEM 9A. | CONTROLS AND PROCEDURES. |
Disclosure Controls and Procedures
Under the supervision and with the participation of our management, including our principal executive officer and principal financial officer, we conducted an evaluation of the effectiveness as of December 31, 2006 of our disclosure controls and procedures; as such term is defined under Rule 13a-15(e) or Rule 15d-15(e) under the Exchange Act. Based on this evaluation, our principal executive officer and principal financial officer have concluded that our system of disclosure controls and procedure was effective as of December 31, 2006.
Changes in Internal Control over Financial Reporting
There were no changes to our system of internal control over financial reporting, as defined in Rule 13a-15(f) or Rule 15d-15(f) under the Exchange Act, during the three month period ended December 31, 2006 that materially affected or is reasonably likely to materially affect our internal control over financial reporting.
Management’s Annual Report on Internal Control over Financial Reporting
Management of Fieldstone Investment Corporation and subsidiaries (the Company) is responsible for establishing and maintaining adequate internal control over financial reporting and for the assessment of the effectiveness of internal control over financial reporting. As defined by the Securities and Exchange Commission, internal control over financial reporting is a process designed by, or under the supervision of the Company’s principal executive and principal financial officers and effected by the Company’s management and other personnel, to provide reasonable assurance regarding the reliability of financial reporting and the preparation of the consolidated financial statements in accordance with U.S. generally accepted accounting principles.
The Company’s internal control over financial reporting is supported by written policies and procedures that (i) pertain to the maintenance of records that, in reasonable detail, accurately and fairly reflect the Company’s transactions and dispositions of the Company’s assets; (ii) provide reasonable assurance that transactions are recorded as necessary to permit preparation of the consolidated financial statements in accordance with U.S. generally accepted accounting principles, and that receipts and expenditures of the Company are being made only in accordance with authorizations of the Company’s management and directors; and (iii) provide reasonable assurance regarding prevention or timely detection of unauthorized acquisition, use or disposition of the Company’s assets that could have a material effect on the consolidated financial statements.
Because of its inherent limitations, internal control over financial reporting may not prevent or detect misstatements. Also, projections of any evaluation of effectiveness to future periods are subject to the risk that controls may become inadequate because of changes in conditions, or that the degree of compliance with the policies or procedures may deteriorate.
In connection with the preparation of the Company’s annual consolidated financial statements, management has undertaken an assessment of the effectiveness of the Company’s internal control over financial reporting as of December 31, 2006, based on criteria established in Internal Control-Integrated Framework issued by the Committee of Sponsoring Organizations of the Treadway Commission. Management’s assessment included an evaluation of the design of the Company’s internal control over financial reporting and testing of the operational effectiveness of those controls.
Based on this assessment, management has concluded that as of December 31, 2006, the Company’s internal control over financial reporting was effective to provide reasonable assurance regarding the reliability of financial reporting and the preparation of financial statements for external purposes in accordance with U.S. generally accepted accounting principles.
97
Deloitte & Touche LLP, the independent registered public accounting firm that audited the Company’s consolidated financial statements included in this report, has issued an attestation report on management’s assessment of internal control over financial reporting, a copy of which is set forth in Item 8 — Financial Statements and Supplemental Data.
98
| ITEM 9B. | OTHER INFORMATION. |
None.
99
PART III
| ITEM 10. | DIRECTORS, EXECUTIVE OFFICERS AND CORPORATE GOVERNANCE. |
The information required by this item regarding directors is incorporated by reference to our Definitive Proxy Statement to be filed with the Securities and Exchange Commission in connection with the Annual Meeting of Stockholders to be held in 2007 (the 2007 Proxy Statement) under the caption “Election of Directors.”
The information required by this item regarding executive officers is set forth in Item 1 of Part I of this report under the caption “Executive Officers and Key Employees.”
The information required by this item regarding our Audit Committee is incorporated by reference to the 2007 Proxy Statement under the caption “Election of Directors – Audit Committee.”
The information required by this item regarding “Compliance with Section 16(a) of the Exchange Act” is incorporated by reference to the 2007 Proxy Statement under the caption “Section 16(a) Beneficial Ownership Reporting Compliance.”
As part of our system of corporate governance, our Board of Directors has adopted a code of business conduct and ethics that is applicable to all directors, officers and employees, and is available on the corporate governance page of our web site athttp://www.fieldstoneinvestment.com. We intend to satisfy any disclosure requirement under Item 5.05 of Form 8-K regarding an amendment to, or waiver from, a provision of the Code of Business Conduct and Ethics for our executive officers, including our senior financial officers, by posting such information on our web site at the address above.
The information required by this item regarding any material changes to the procedures by which security holders may recommend nominees to our Board of Directors is incorporated by reference to the 2007 Proxy Statement under the caption “Election of Directors-Governance and Nominating Committee.”
| ITEM 11. | EXECUTIVE COMPENSATION. |
The information required by this item is incorporated by reference to the 2007 Proxy Statement under the captions “Executive Compensation” and “Compensation Committee Report on Executive Compensation.”
| ITEM 12. | SECURITY OWNERSHIP OF CERTAIN BENEFICIAL OWNERS AND MANAGEMENT AND RELATED STOCKHOLDER MATTERS. |
The information regarding the security ownership of certain beneficial owners and management is incorporated by reference to the 2007 Proxy Statement under the caption “Security Ownership of the Board of Directors, Executive Officers and Certain Beneficial Owners.”
The information regarding “Securities Authorized for Issuance under Equity Compensation Plans” is incorporated by reference to our 2007 Proxy Statement under the caption “Equity Compensation Plan Information.”
| ITEM 13. | CERTAIN RELATIONSHIPS AND RELATED TRANSACTIONS, AND DIRECTOR INDEPENDENCE. |
The information required by this item is incorporated by reference to the 2007 Proxy Statement under the caption “Certain Relationships and Related Transactions” and “Corporate Governance.”
| ITEM 14. | PRINCIPAL ACCOUNTING FEES AND SERVICES. |
The information required by this item is incorporated by reference to the 2007 Proxy Statement under the caption “Independent Registered Public Accounting Firm Fees and Services.”
100
PART IV
| ITEM 15. | EXHIBITS, FINANCIAL STATEMENT SCHEDULES. |
| | |
| (a) | | Documents filed as part of this report: |
| |
| | 1. The following Financial Statements of the Company are included in Part II, Item 8 of this Annual Report on Form-10K: |
| |
| | Report of Independent Registered Public Accounting Firm; |
| |
| | Consolidated Statements of Condition as of December 31, 2006 and December 31, 2005; |
| |
| | Consolidated Statements of Operations for the Years Ended December 31, 2006, 2005, and 2004 (Restated); |
| |
| | Consolidated Statements of Shareholders’ Equity for the Years Ended December 31, 2006, 2005, and 2004 (Restated); |
| |
| | Consolidated Statements of Cash Flows for the Years Ended December 31, 2006, 2005, and 2004 (Restated); and |
| |
| | Notes to Consolidated Financial Statements. |
| |
| | 2. Schedules to Consolidated Financial Statements: |
| |
| | Schedule IV—Mortgage Loans on Real Estate as of and for the Years Ended December 31, 2006, 2005 and 2004 is included in Part II, Item 8 of this Annual Report on Form 10-K. |
| |
| | 3. Exhibits |
| |
| | See “Exhibit Index.” |
| |
| (b) | | Exhibits |
| |
| | See “Exhibit Index.” |
101
SIGNATURES
Pursuant to the requirements of Section 13 or 15(d) of the Securities Exchange Act of 1934, as amended, the registrant has duly caused this report to be signed on its behalf by the undersigned, thereunto duly authorized.
| | | | | | |
| | | | FIELDSTONE INVESTMENT CORPORATION |
| | | | (registrant) |
| | |
Dated March 19, 2007 | | By: | | /s/ MICHAEL J. SONNENFELD |
| | | | | | Michael J. Sonnenfeld |
| | | | | | President and Chief Executive Officer |
POWER OF ATTORNEY
KNOW ALL MEN BY THESE PRESENTS, that each person whose signature appears below constitutes and appoints Michael J. Sonnenfeld, Nayan V. Kisnadwala, and Thomas S. Brennan, and each of them individually, as his true and lawful attorneys-in-fact and agents, with full power of substitution and resubstitution, for him and his name, place and stead in any and all capacities, to sign the report and any and all amendments to this report, and to file the same, with all exhibits thereto, and other documents in connection therewith, with the Securities and Exchange Commission, granting unto said attorneys-in-fact and agents, full power and authority to perform each and every act and thing requisite and necessary to be done in and about the premises, as fully to all intents and purposes as he might or could do in person, hereby ratifying and confirming all that said attorneys-in-fact and agents, or their substitutes, may lawfully do or cause to be done by virtue thereof.
Pursuant to the requirements of the Securities Exchange Act of 1934, as amended, this report has been signed below by the following persons on behalf of the registrant and in the capacities and on the dates indicated:
| | | | |
Signature | | Title | | Date |
/s/ MICHAEL J. SONNENFELD | | President and Chief Executive Officer, Director | | March 19, 2007 |
Michael J. Sonnenfeld | | (Principal Executive Officer) | | |
| | |
/s/ NAYAN V. KISNADWALA | | Chief Financial Officer | | March 19, 2007 |
Nayan V. Kisnadwala | | (Principal Financial and Accounting Officer) | | |
| | |
/s/ THOMAS D. ECKERT | | Chairman of the Board | | March 19, 2007 |
Thomas D. Eckert | | | | |
| | |
/s/ DAVID S. ENGELMAN | | Director | | March 19, 2007 |
David S. Engelman | | | | |
| | |
/s/ CELIA V. MARTIN | | Director | | March 19, 2007 |
Celia V. Martin | | | | |
| | |
/s/ JONATHAN E. MICHAEL | | Director | | March 19, 2007 |
Jonathan E. Michael | | | | |
| | |
/s/ DAVID A. SCHOENHOLZ | | Director | | March 19, 2007 |
David A. Schoenholz | | | | |
| | |
/s/ JEFFREY R. SPRINGER | | Director | | March 19, 2007 |
Jeffrey R. Springer | | | | |
102
EXHIBIT INDEX
| | |
Exhibit
Number | | Description |
2.1(5) | | Asset Purchase Agreement, dated as of January 13, 2006, by and between Fieldstone Mortgage Company and Wausau Mortgage Corporation |
| |
2.2(20) | | Agreement of Merger, dated as of February 15, 2007, among Credit-Based Asset Servicing and Securitization LLC, Rock Acquisition Corp., and Fieldstone Investment Corporation |
| |
3.1(1) | | Articles of Amendment and Restatement |
| |
3.2(11) | | Bylaws, as amended on August 1, 2006 |
| |
3.3(1) | | Articles of Merger by and between Fieldstone Holdings Corp. and Fieldstone Investment Corporation |
| |
4.1(1) | | Specimen Common Stock Certificate |
| |
4.2(1) | | Registration Rights Agreement, dated as of November 14, 2003, by and between Fieldstone Investment Corporation and Friedman, Billings, Ramsey & Co., Inc. |
| |
10.1(1)† | | Equity Incentive Plan |
| |
10.2(13)† | | Amended and Restated Parameters of Awards of Stock Options and Restricted Shares |
| |
10.3(3)† | | Executive Incentive Compensation Plan |
| |
10.4(11)† | | Form of Performance Share Agreement |
| |
10.5(1)† | | Form of Incentive Stock Option Agreement |
| |
10.6(1)† | | Form of Nonqualified Stock Option Agreement |
| |
10.7(11)† | | Form of Nonqualified Stock Option Agreement for Senior Executives |
| |
10.8(11)† | | Form of Nonqualified Stock Option Agreement with Dividend Equivalents |
| |
10.9(1)† | | Form of Restricted Stock Agreement |
| |
10.10(a)(1)† | | Form of Senior Manager Employment Agreement |
| |
10.10(b)(1)† | | Senior Manager Incentive and Retention Bonus Plan |
| |
10.11(7)† | | Form of Dividend Equivalent Rights Award Agreement |
| |
10.12(a)(11)† | | Form of Extended Severance Benefit Agreement |
| |
10.12(b)(11)† | | Schedule of Potential Payments to Form of Extended Severance Benefit Agreement |
| |
10.13(1)† | | Employment Agreement, dated as of September 1, 2003, between Fieldstone Mortgage Company and Michael J. Sonnenfeld |
| |
10.14(1)† | | Employment Letter Agreement, dated March 10, 2004, from Fieldstone Investment Corporation to John C. Kendall |
| |
10.15(6)† | | Employment Offer Letter, dated February 14, 2006, by and between Nayan V. Kisnadwala and Fieldstone Investment Corporation |
| |
10.16(8)† | | Summary of Board of Directors’ Compensation |
| |
10.17† | | Summary of Named Executive Officers’ 2007 Annual Base Salaries (filed herewith) |
| |
10.18(a)(10) | | Master Repurchase Agreement dated as of July 14, 2006 between JPMorgan Chase Bank, N.A., Fieldstone Investment Corporation and Fieldstone Mortgage Company |
| |
10.18(b)(15) | | Amendment No. 1 to Master Repurchase Agreement, dated as of December 20, 2006, among JPMorgan Chase Bank, N.A., Fieldstone Mortgage Company and Fieldstone Investment Corporation |
| |
10.18(c)(19) | | Amendment No. 2 to Master Repurchase Agreement, dated as of January 31, 2007, among JPMorgan Chase Bank, N.A., Fieldstone Mortgage Company and Fieldstone Investment Corporation |
| |
10.19(a)(2) | | Second Amended and Restated Master Repurchase Agreement, dated as of March 31, 2005, between Credit Suisse First Boston Mortgage Capital LLC, Fieldstone Mortgage Company and Fieldstone Investment Corporation |
| |
10.19(b)(8) | | Amendment No. 1 to Second Amended and Restated Master Repurchase Agreement, dated as of |
103
| | |
Exhibit
Number | | Description |
| | October 21, 2005, among Credit Suisse First Boston Mortgage Capital LLC, Fieldstone Mortgage Company and Fieldstone Investment Corporation |
| |
10.19(c)(7) | | Amendment No. 2 to Second Amended and Restated Master Repurchase Agreement, dated as of February 22, 2006, among Credit Suisse First Boston Mortgage Capital LLC, Fieldstone Mortgage Company and Fieldstone Investment Corporation |
| |
10.19(d)(9) | | Amendment No. 3 to Second Amended and Restated Master Repurchase Agreement, dated as of April 27, 2006, among Credit Suisse First Boston Mortgage Capital LLC, Fieldstone Mortgage Company and Fieldstone Investment Corporation |
| |
10.19(e) | | Amendment No. 4 to Second Amended and Restated Master Repurchase Agreement, dated as of November 30, 2006, among Credit Suisse First Boston Mortgage Capital LLC, Fieldstone Mortgage Company and Fieldstone Investment Corporation (filed herewith) |
| |
10.19(f)(15) | | Amendment No. 5 to Second Amended and Restated Master Repurchase Agreement, dated as of December 20, 2006, among Credit Suisse First Boston Mortgage Capital LLC, Fieldstone Mortgage Company and Fieldstone Investment Corporation |
| |
10.19(g) | | Amendment No. 6 to Second Amended and Restated Master Repurchase Agreement, dated as of December 29, 2006, among Credit Suisse First Boston Mortgage Capital LLC, Fieldstone Mortgage Company and Fieldstone Investment Corporation (filed herewith) |
| |
10.19(h)(19) | | Amendment No. 7 to Second Amended and Restated Master Repurchase Agreement, dated as of January 31, 2007, among Credit Suisse First Boston Mortgage Capital LLC, Fieldstone Mortgage Company and Fieldstone Investment Corporation |
| |
10.20(a)(8) | | Master Repurchase Agreement, dated as of October 11, 2005, among Fieldstone Mortgage Ownership Corp. and Liquid Funding, Ltd. |
| |
10.20(b)(8) | | Guaranty, dated as of October 11, 2005, among Fieldstone Investment Corporation and Liquid Funding, Ltd. |
| |
10.21(a)(8) | | Master Repurchase Agreement, dated as of October 21, 2005, among Fieldstone Mortgage Ownership Corp., Lehman Brothers Inc. and Lehman Commercial Paper Inc. |
| |
10.21(b)(8) | | Guaranty, dated as of October 21, 2005, among Fieldstone Investment Corporation, Lehman Brothers Inc. and Lehman Commercial Paper Inc. |
| |
10.22(a)(14) | | Amended and Restated Master Repurchase Agreement, dated as of November 14, 2006, among Credit Suisse, New York Branch, Fieldstone Investment Corporation, Fieldstone Mortgage Company and the several Group Agents, Conduit Buyers and Committed Buyers party hereto from time to time |
| |
10.22(b)(15) | | Amendment No. 1 to Amended and Restated Master Repurchase Agreement, dated as of December 20, 2006, among Credit Suisse, New York Branch, Fieldstone Mortgage Company and Fieldstone Investment Corporation |
| |
10.22(c)(19) | | Amendment No. 2 to Amended and Restated Master Repurchase Agreement, dated as of January 31, 2007, among Credit Suisse, New York Branch, Fieldstone Mortgage Company and Fieldstone Investment Corporation |
| |
10.23(a)(1) | | Second Amended and Restated Master Repurchase Agreement Governing Purchases and Sales of Mortgage Loans, dated as of December 29, 2004, among Lehman Brothers Bank, FSB, Fieldstone Investment Corporation and Fieldstone Mortgage Company |
| |
10.23(b)(4) | | First Amendment, dated as of December 28, 2005, to the Second Amended and Restated Master Repurchase Agreement Governing Purchases and Sales of Mortgage Loans, by and among Lehman Brothers Bank, FSB, Fieldstone Investment Corporation and Fieldstone Mortgage Company |
104
| | |
Exhibit Number | | Description |
| |
10.23(c)(12) | | Second Amendment, dated as of October 31, 2006, to the Second Amended and Restated Master Repurchase Agreement Governing Purchases and Sales of Mortgage Loans, by and among Lehman Brothers Bank, FSB, Fieldstone Investment Corporation and Fieldstone Mortgage Company |
| |
10.23(d)(15) | | Waiver and Third Amendment, dated as of December 19, 2006, to the Second Amended and Restated Master Repurchase Agreement Governing Purchases and Sales of Mortgage Loans, by and among Lehman Brothers Bank, FSB, Fieldstone Investment Corporation and Fieldstone Mortgage Company |
| |
10.23(e)(16) | | Fourth Amendment, dated as of December 27, 2006, to the Second Amended and Restated Master Repurchase Agreement Governing Purchases and Sales of Mortgage Loans, by and among Lehman Brothers Bank, FSB, Fieldstone Investment Corporation and Fieldstone Mortgage Company |
| |
10.23(f)(18) | | Fifth Amendment, dated as of January 26, 2007, to the Second Amended and Restated Master Repurchase Agreement Governing Purchases and Sales of Mortgage Loans, by and among Lehman Brothers Bank, FSB, Fieldstone Investment Corporation and Fieldstone Mortgage Company |
| |
10.24(a)(12) | | Amended and Restated Master Repurchase Agreement, dated as of October 31, 2006, among Fieldstone Mortgage Company, Fieldstone Investment Corporation and Merrill Lynch Bank USA |
| |
10.24(b)(17) | | Amendment No. 1 to the Amended and Restated Master Repurchase Agreement, dated as of December 29, 2006, by and among Fieldstone Investment Corporation, Fieldstone Mortgage Company and Merrill Lynch Bank USA |
| |
10.25(1) | | Purchase/Placement Agreement, dated November 10, 2003, between Friedman, Billings, Ramsey & Co., Inc., Fieldstone Investment Corporation and Fieldstone Mortgage Company |
| |
10.26(1) | | Voting Agreement, dated as of October 28, 2004, by and among Fieldstone Investment Corporation and Friedman, Billings, Ramsey Group, Inc. |
| |
10.27(1) | | Amended and Restated Engagement Letter, dated October 28, 2004, between Friedman, Billings, Ramsey & Co., Inc. and Fieldstone Investment Corporation |
| |
21.1 | | List of Subsidiaries (filed herewith) |
| |
23.1 | | Consent of Independent Registered Public Accounting Firm (filed herewith) |
| |
24.1 | | Power of Attorney (included on signature page) |
| |
31.1 | | Certification of Chief Executive Officer pursuant to Rule 13a-14(a) under the Securities Exchange Act of 1934 as adopted pursuant to Section 302 of the Sarbanes-Oxley Act of 2002 (filed herewith) |
| |
31.2 | | Certification of Chief Financial Officer pursuant to Rule 13a-14(a) under the Securities Exchange Act of 1934 as adopted pursuant to Section 302 of the Sarbanes-Oxley Act of 2002 (filed herewith) |
| |
32.1 | | Certification of Chief Executive Officer and Chief Financial Officer pursuant to 18 U.S.C. Section 1350 as adopted pursuant to Section 906 of the Sarbanes-Oxley Act of 2002 (furnished herewith) |
(1) | Incorporated by reference to the registrant’s registration statement on Form S-11, File No. 333-114802. |
(2) | Incorporated by reference to the registrant’s Form 8-K filed with the SEC on April 6, 2005. |
(3) | Incorporated by reference to the registrant’s Form 10-Q filed with the SEC on May 16, 2005. |
105
(4) | Incorporated by reference to the registrant’s Form 8-K filed with the SEC on January 4, 2006. |
(5) | Incorporated by reference to the registrant’s Form 8-K filed with the SEC on January 18, 2006. |
(6) | Incorporated by reference to the registrant’s Form 8-K filed with the SEC on February 16, 2006. |
(7) | Incorporated by reference to the registrant’s Form 8-K filed with the SEC on February 27, 2006. |
(8) | Incorporated by reference to the registrant’s Form 10-K filed with the SEC on April 14, 2006. |
(9) | Incorporated by reference to the registrant’s Form 8-K filed with the SEC on April 28, 2006. |
(10) | Incorporated by reference to the registrant’s Form 8-K filed with the SEC on July 20, 2006. |
(11) | Incorporated by reference to the registrant’s Form 8-K filed with the SEC on August 4, 2006. |
(12) | Incorporated by reference to the registrant’s Form 8-K filed with the SEC on November 6, 2006. |
(13) | Incorporated by reference to the registrant’s Form 10-Q filed with the SEC on November 14, 2006. |
(14) | Incorporated by reference to the registrant’s Form 8-K filed with the SEC on November 20, 2006. |
(15) | Incorporated by reference to the registrant’s Form 8-K filed with the SEC on December 22, 2006. |
(16) | Incorporated by reference to the registrant’s Form 8-K filed with the SEC on December 28, 2006. |
(17) | Incorporated by reference to the registrant’s Form 8-K filed with the SEC on January 8, 2007. |
(18) | Incorporated by reference to the registrant’s Form 8-K filed with the SEC on January 29, 2007. |
(19) | Incorporated by reference to the registrant’s Form 8-K filed with the SEC on February 2, 2007. |
(20) | Incorporated by reference to the registrant’s Form 8-K filed with the SEC on February 22, 2007. |
| † | Denotes a management contract or compensatory plan. |
106
FIELDSTONE INVESTMENT CORPORATION AND SUBSIDIARIES
INDEX TO CONSOLIDATED FINANCIAL STATEMENTS
| | |
| | | Page |
| Report of Independent Registered Public Accounting Firm | | F-2 |
| Report of Independent Registered Public Accounting Firm | | F-3 |
| Consolidated Statements of Condition | | F-4 |
| Consolidated Statements of Operations | | F-5 |
| Consolidated Statements of Shareholders’ Equity | | F-6 |
| Consolidated Statements of Cash Flows | | F-7 |
| Notes to Consolidated Financial Statements | | F-8 |
| Schedule IV—Mortgage Loans on Real Estate | | F-41 |
F-1
REPORT OF INDEPENDENT REGISTERED PUBLIC ACCOUNTING FIRM
To the Board of Directors and Shareholders of
Fieldstone Investment Corporation and subsidiaries
Columbia, MD
We have audited management’s assessment, included in the accompanyingManagement’s Annual Report on Internal Control Over Financial Reporting, that Fieldstone Investment Corporation and subsidiaries (the “Company”) maintained effective internal control over financial reporting as of December 31, 2006, based on criteria established inInternal Control—Integrated Framework issued by the Committee of Sponsoring Organizations of the Treadway Commission. The Company’s management is responsible for maintaining effective internal control over financial reporting and for its assessment of the effectiveness of internal control over financial reporting. Our responsibility is to express an opinion on management’s assessment and an opinion on the effectiveness of the Company’s internal control over financial reporting based on our audit.
We conducted our audit in accordance with the standards of the Public Company Accounting Oversight Board (United States). Those standards require that we plan and perform the audit to obtain reasonable assurance about whether effective internal control over financial reporting was maintained in all material respects. Our audit included obtaining an understanding of internal control over financial reporting, evaluating management’s assessment, testing and evaluating the design and operating effectiveness of internal control, and performing such other procedures as we considered necessary in the circumstances. We believe that our audit provides a reasonable basis for our opinions.
A company’s internal control over financial reporting is a process designed by, or under the supervision of, the company’s principal executive and principal financial officers, or persons performing similar functions, and effected by the company’s board of directors, management, and other personnel to provide reasonable assurance regarding the reliability of financial reporting and the preparation of financial statements for external purposes in accordance with generally accepted accounting principles. A company’s internal control over financial reporting includes those policies and procedures that (1) pertain to the maintenance of records that, in reasonable detail, accurately and fairly reflect the transactions and dispositions of the assets of the company; (2) provide reasonable assurance that transactions are recorded as necessary to permit preparation of financial statements in accordance with generally accepted accounting principles, and that receipts and expenditures of the company are being made only in accordance with authorizations of management and directors of the company; and (3) provide reasonable assurance regarding prevention or timely detection of unauthorized acquisition, use, or disposition of the company’s assets that could have a material effect on the financial statements.
Because of the inherent limitations of internal control over financial reporting, including the possibility of collusion or improper management override of controls, material misstatements due to error or fraud may not be prevented or detected on a timely basis. Also, projections of any evaluation of the effectiveness of the internal control over financial reporting to future periods are subject to the risk that the controls may become inadequate because of changes in conditions, or that the degree of compliance with the policies or procedures may deteriorate.
In our opinion, management’s assessment that the Company maintained effective internal control over financial reporting as of December 31, 2006, is fairly stated, in all material respects, based on the criteria established inInternal Control—Integrated Framework issued by the Committee of Sponsoring Organizations of the Treadway Commission. Also in our opinion, the Company maintained, in all material respects, effective internal control over financial reporting as of December 31, 2006, based on the criteria established inInternal Control—Integrated Framework issued by the Committee of Sponsoring Organizations of the Treadway Commission.
We have also audited, in accordance with the standards of the Public Company Accounting Oversight Board (United States), the consolidated financial statements and financial statement schedule as of and for the year ended December 31, 2006 of the Company and our report dated March 19, 2007 expressed an unqualified opinion on those financial statements and financial statement schedule.
/s/ DELOITTE & TOUCHE LLP
McLean, VA
March 19, 2007
F-2
REPORT OF INDEPENDENT REGISTERED PUBLIC ACCOUNTING FIRM
To the Board of Directors and Shareholders of
Fieldstone Investment Corporation and subsidiaries
Columbia, MD
We have audited the accompanying consolidated statements of condition of Fieldstone Investment Corporation and subsidiaries (the “Company”) as of December 31, 2006 and 2005, and the related consolidated statements of operations, shareholders’ equity, and cash flows for each of the three years in the period ended December 31, 2006. Our audits also included the financial statement schedule IV listed at the Index in Item 15. These financial statements and financial statement schedule are the responsibility of the Company’s management. Our responsibility is to express an opinion on the financial statements and financial statement schedule based on our audits.
We conducted our audits in accordance with the standards of the Public Company Accounting Oversight Board (United States). Those standards require that we plan and perform the audit to obtain reasonable assurance about whether the financial statements are free of material misstatement. An audit includes examining, on a test basis, evidence supporting the amounts and disclosures in the financial statements. An audit also includes assessing the accounting principles used and significant estimates made by management, as well as evaluating the overall financial statement presentation. We believe that our audits provide a reasonable basis for our opinion.
In our opinion, such consolidated financial statements present fairly, in all material respects, the financial position of Fieldstone Investment Corporation and subsidiaries as of December 31, 2006 and 2005, and the results of their operations and their cash flows for each of the three years in the period ended December 31, 2006, in conformity with accounting principles generally accepted in the United States of America. Also, in our opinion, such financial statement schedule, when considered in relation to the basic consolidated financial statements taken as a whole, presents fairly, in all material respects, the information set forth therein.
We have also audited, in accordance with the standards of the Public Company Accounting Oversight Board (United States), the effectiveness of the Company’s internal control over financial reporting as of December 31, 2006, based on the criteria established inInternal Control—Integrated Framework issued by the Committee of Sponsoring Organizations of the Treadway Commission and our report dated March 19, 2007 expressed an unqualified opinion on management’s assessment of the effectiveness of the Company’s internal control over financial reporting and an unqualified opinion on the effectiveness of the Company’s internal control over financial reporting.
/s/ DELOITTE & TOUCHE LLP
McLean, VA
March 19, 2007
F-3
FIELDSTONE INVESTMENT CORPORATION AND SUBSIDIARIES
Consolidated Statements of Condition
Years Ended December 31, 2006 and 2005
(In thousands, except share and per share data)
| | | | | | | | |
| | | December 31, 2006 | | | December 31, 2005 | |
| Assets | | | | | | | | |
Cash | | $ | 24,152 | | | $ | 33,536 | |
Restricted cash | | | 8,639 | | | | 7,888 | |
Mortgage loans held for sale, net | | | 550,520 | | | | 594,269 | |
Mortgage loans held for investment | | | 5,601,197 | | | | 5,570,415 | |
Allowance for loan losses—loans held for investment | | | (81,859 | ) | | | (44,122 | ) |
| | | | | | | | |
Mortgage loans held for investment, net | | | 5,519,338 | | | | 5,526,293 | |
| | | | | | | | |
Accounts receivable | | | 27,132 | | | | 7,201 | |
Accrued interest receivable | | | 36,336 | | | | 29,940 | |
Trustee receivable | | | 101,376 | | | | 130,237 | |
Prepaid expenses and other assets | | | 15,597 | | | | 16,200 | |
Real estate owned | | | 59,436 | | | | 14,997 | |
Derivative assets | | | 13,730 | | | | 35,223 | |
Deferred tax asset | | | 26,410 | | | | 17,679 | |
Furniture and equipment, net | | | 8,119 | | | | 10,151 | |
| | | | | | | | |
Total assets | | $ | 6,390,785 | | | $ | 6,423,614 | |
| | | | | | | | |
| | |
| Liabilities and Shareholders’ Equity | | | | | | | | |
Warehouse financing—loans held for sale | | $ | 480,376 | | | $ | 434,061 | |
Warehouse financing—loans held for investment | | | 427,802 | | | | 378,707 | |
Securitization financing | | | 5,032,878 | | | | 4,998,620 | |
Reserve for losses—loans sold | | | 23,052 | | | | 35,082 | |
Dividends payable | | | 2,345 | | | | 26,689 | |
Accounts payable, accrued expenses and other liabilities | | | 43,003 | | | | 23,812 | |
| | | | | | | | |
Total liabilities | | | 6,009,456 | | | | 5,896,971 | |
| | | | | | | | |
Commitments and contingencies (Note 14) | | | — | | | | — | |
Shareholders’ equity: | | | | | | | | |
Common stock $0.01 par value; 90,000,000 shares authorized; 46,882,394 and 48,513,985 shares issued as of December 31, 2006 and 2005, respectively | | | 469 | | | | 485 | |
Paid-in capital | | | 474,411 | | | | 493,603 | |
Accumulated (deficit) earnings | | | (93,551 | ) | | | 37,093 | |
Unearned compensation | | | — | | | | (4,538 | ) |
| | | | | | | | |
Total shareholders’ equity | | | 381,329 | | | | 526,643 | |
| | | | | | | | |
Total liabilities and shareholders’ equity | | $ | 6,390,785 | | | $ | 6,423,614 | |
| | | | | | | | |
See accompanying notes to consolidated financial statements.
F-4
FIELDSTONE INVESTMENT CORPORATION AND SUBSIDIARIES
Consolidated Statements of Operations
Years Ended December 31, 2006, 2005 and 2004
(In thousands, except share and per share data)
| | | | | | | | | | | | |
| | | Year Ended December 31, | |
| | | 2006 | | | 2005 | | | 2004 | |
Revenues: | | | | | | | | | | | | |
Interest income: | | | | | | | | | | | | |
Loans held for investment | | $ | 409,675 | | | $ | 344,521 | | | $ | 206,460 | |
Loans held for sale | | | 31,051 | | | | 31,095 | | | | 20,172 | |
| | | | | | | | | | | | |
Total interest income | | | 440,726 | | | | 375,616 | | | | 226,632 | |
| | | | | | | | | | | | |
Interest expense: | | | | | | | | | | | | |
Loans held for investment | | | 319,961 | | | | 198,688 | | | | 69,039 | |
Loans held for sale | | | 16,599 | | | | 13,222 | | | | 3,273 | |
| | | | | | | | | | | | |
Total interest expense | | | 336,560 | | | | 211,910 | | | | 72,312 | |
| | | | | | | | | | | | |
Net interest income | | | 104,166 | | | | 163,706 | | | | 154,320 | |
| | | | | | | | | | | | |
Provision for loan losses—loans held for investment | | | 69,062 | | | | 30,065 | | | | 21,556 | |
| | | | | | | | | | | | |
Net interest income after provision for loan losses | | | 35,104 | | | | 133,641 | | | | 132,764 | |
Gains on sales of mortgage loans, net | | | 17,047 | | | | 61,198 | | | | 42,778 | |
Other income—portfolio derivatives | | | 14,212 | | | | 33,469 | | | | 8,789 | |
Other (expense) income | | | (2,462 | ) | | | 932 | | | | 1,901 | |
| | | | | | | | | | | | |
Total revenues | | | 63,901 | | | | 229,240 | | | | 186,232 | |
| | | | | | | | | | | | |
Expenses: | | | | | | | | | | | | |
Salaries and employee benefits | | | 77,995 | | | | 73,720 | | | | 71,969 | |
Occupancy | | | 8,065 | | | | 6,716 | | | | 5,950 | |
Depreciation and amortization | | | 4,241 | | | | 3,317 | | | | 2,550 | |
Servicing fees | | | 10,580 | | | | 8,718 | | | | 6,499 | |
General and administration | | | 42,783 | | | | 30,998 | | | | 28,848 | |
| | | | | | | | | | | | |
Total expenses | | | 143,664 | | | | 123,469 | | | | 115,816 | |
| | | | | | | | | | | | |
(Loss) income from continuing operations before income taxes | | | (79,763 | ) | | | 105,771 | | | | 70,416 | |
Income tax benefit (expense) | | | 13,023 | | | | (4,669 | ) | | | (6,284 | ) |
| | | | | | | | | | | | |
(Loss) income from continuing operations | | | (66,740 | ) | | | 101,102 | | | | 64,132 | |
Discontinued operations, net of income tax (Note 8) | | | (1,645 | ) | | | (1,712 | ) | | | (536 | ) |
| | | | | | | | | | | | |
Net (loss) income | | $ | (68,385 | ) | | $ | 99,390 | | | $ | 63,596 | |
| | | | | | | | | | | | |
(Loss) earnings per share of common stock-basic and diluted: | | | | | | | | | | | | |
Continuing operations | | $ | (1.42 | ) | | $ | 2.07 | | | $ | 1.31 | |
Discontinued operations | | | (0.03 | ) | | | (0.03 | ) | | | (0.01 | ) |
| | | | | | | | | | | | |
Total | | $ | (1.45 | ) | | $ | 2.04 | | | $ | 1.30 | |
| | | | | | | | | | | | |
Basic weighted average common shares outstanding | | | 47,304,189 | | | | 48,449,872 | | | | 48,328,271 | |
Diluted weighted average common shares outstanding | | | 47,304,189 | | | | 48,464,445 | | | | 48,370,502 | |
See accompanying notes to consolidated financial statements.
F-5
FIELDSTONE INVESTMENT CORPORATION AND SUBSIDIARIES
Consolidated Statements of Shareholders’ Equity
Years Ended December 31, 2006, 2005 and 2004
(In thousands)
| | | | | | | | | | | | | | | | | | | | | | | |
| | | Common
Shares
Outstanding | | | Common
Stock | | | Paid-in
Capital | | | Accumulated
Earnings
(Deficit) | | | Unearned
Compensation | | | Total
Shareholders’
Equity | |
Balance at January 1, 2004 | | 48,836 | | | $ | 488 | | | $ | 498,230 | | | $ | 26,089 | | | $ | (7,542 | ) | | $ | 517,265 | |
Restricted stock issued | | 30 | | | | 1 | | | | 537 | | | | — | | | | (538 | ) | | | — | |
Restricted stock forfeited | | (15 | ) | | | — | | | | (225 | ) | | | — | | | | 225 | | | | — | |
Restricted stock repurchased and cancelled | | (9 | ) | | | — | | | | (162 | ) | | | — | | | | — | | | | (162 | ) |
Restricted stock compensation expense | | — | | | | — | | | | — | | | | — | | | | 1,870 | | | | 1,870 | |
Stock options compensation expense | | — | | | | — | | | | 285 | | | | — | | | | — | | | | 285 | |
Stock options exercised | | 14 | | | | — | | | | 216 | | | | — | | | | — | | | | 216 | |
Costs relating to the equity registration | | — | | | | — | | | | (1,734 | ) | | | — | | | | — | | | | (1,734 | ) |
Dividends declared | | — | | | | — | | | | — | | | | (53,255 | ) | | | — | | | | (53,255 | ) |
Net income | | — | | | | — | | | | — | | | | 63,596 | | | | — | | | | 63,596 | |
| | | | | | | | | | | | | | | | | | | | | | | |
Balance at December 31, 2004 | | 48,856 | | | | 489 | | | | 497,147 | | | | 36,430 | | | | (5,985 | ) | | | 528,081 | |
| | | | | | |
Restricted stock issued | | — | | | | — | | | | 587 | | | | — | | | | (587 | ) | | | — | |
Restricted stock forfeited | | (38 | ) | | | (1 | ) | | | (562 | ) | | | — | | | | 563 | | | | — | |
Restricted stock repurchased and cancelled | | (11 | ) | | | — | | | | (129 | ) | | | — | | | | — | | | | (129 | ) |
Restricted stock compensation expense | | — | | | | — | | | | — | | | | — | | | | 1,471 | | | | 1,471 | |
Stock options compensation expense | | — | | | | — | | | | 302 | | | | — | | | | — | | | | 302 | |
Stock options exercised | | 3 | | | | — | | | | 37 | | | | — | | | | — | | | | 37 | |
Common shares repurchased | | (296 | ) | | | (3 | ) | | | (3,346 | ) | | | — | | | | — | | | | (3,349 | ) |
Costs relating to the equity registration | | — | | | | — | | | | (433 | ) | | | — | | | | — | | | | (433 | ) |
Dividends declared | | — | | | | — | | | | — | | | | (98,727 | ) | | | — | | | | (98,727 | ) |
Net income | | — | | | | — | | | | — | | | | 99,390 | | | | — | | | | 99,390 | |
| | | | | | | | | | | | | | | | | | | | | | | |
Balance at December 31, 2005 | | 48,514 | | | | 485 | | | | 493,603 | | | | 37,093 | | | | (4,538 | ) | | | 526,643 | |
| | | | | | |
Restricted stock issued | | 45 | | | | — | | | | — | | | | — | | | | — | | | | — | |
Restricted stock forfeited | | (35 | ) | | | — | | | | — | | | | — | | | | — | | | | — | |
Restricted stock repurchased and cancelled | | (10 | ) | | | — | | | | (42 | ) | | | — | | | | — | | | | (42 | ) |
Restricted stock compensation expense | | — | | | | — | | | | 1,761 | | | | — | | | | — | | | | 1,761 | |
Stock options compensation expense | | — | | | | — | | | | 431 | | | | — | | | | — | | | | 431 | |
Reclass unearned compensation to paid-in capital | | — | | | | — | | | | (4,538 | ) | | | — | | | | 4,538 | | | | — | |
Common shares repurchased | | (1,632 | ) | | | (16 | ) | | | (16,832 | ) | | | — | | | | — | | | | (16,848 | ) |
Dividends equivalent rights on outstanding stock options | | — | | | | — | | | | 28 | | | | (28 | ) | | | — | | | | — | |
Dividends declared | | — | | | | — | | | | — | | | | (62,231 | ) | | | — | | | | (62,231 | ) |
Net loss | | — | | | | — | | | | — | | | | (68,385 | ) | | | — | | | | (68,385 | ) |
| | | | | | | | | | | | | | | | | | | | | | | |
Balance at December 31, 2006 | | 46,882 | | | $ | 469 | | | $ | 474,411 | | | $ | (93,551 | ) | | $ | — | | | $ | 381,329 | |
| | | | | | | | | | | | | | | | | | | | | | | |
See accompanying notes to consolidated financial statements.
F-6
FIELDSTONE INVESTMENT CORPORATION AND SUBSIDIARIES
Consolidated Statements of Cash Flows
Years Ended December 31, 2006, 2005 and 2004
(In thousands)
| | | | | | | | | | | | |
| | | Year Ended December 31, | |
| | | 2006 | | | 2005 | | | 2004 | |
Cash flows from operating activities: | | | | | | | | | | | | |
Net (loss) income | | $ | (68,385 | ) | | $ | 99,390 | | | $ | 63,596 | |
Adjustments to reconcile net (loss) income to net cash provided by (used in) operating activities: | | | | | | | | | | | | |
Depreciation and amortization | | | 4,241 | | | | 3,316 | | | | 2,550 | |
Amortization of deferred origination costs—loans held for investment | | | 23,276 | | | | 25,515 | | | | 12,710 | |
Amortization of securitization issuance costs | | | 9,546 | | | | 10,536 | | | | 4,586 | |
Amortization of bond discount | | | 74 | | | | 425 | | | | 512 | |
Provision for losses—sold loans | | | 13,677 | | | | 5,456 | | | | 9,424 | |
Provision for loan losses—loans held for investment | | | 69,062 | | | | 30,065 | | | | 21,556 | |
Stock compensation expense | | | 2,215 | | | | 2,017 | | | | 2,155 | |
Loss on disposal of discontinued operations | | | 904 | | | | — | | | | — | |
Loss from discontinued operations | | | 741 | | | | 1,712 | | | | 536 | |
(Increase) decrease in accounts receivable | | | (19,931 | ) | | | 2,125 | | | | (6,625 | ) |
Increase in accrued interest receivable | | | (6,396 | ) | | | (7,520 | ) | | | (16,870 | ) |
Decrease (increase) in trustee receivable | | | 28,861 | | | | (39,155 | ) | | | (84,658 | ) |
Funding of mortgage loans held for sale | | | (2,904,140 | ) | | | (2,796,732 | ) | | | (2,239,305 | ) |
Proceeds from sales and payments of mortgage loans held for sale | | | 2,652,639 | | | | 2,481,194 | | | | 2,372,988 | |
Increase in prepaid expenses and other assets | | | (9,013 | ) | | | (11,017 | ) | | | (15,176 | ) |
Decrease (increase) in deferred tax asset, net | | | (8,731 | ) | | | (56 | ) | | | 3,550 | |
Decrease (increase) in fair market value of derivative instruments | | | 25,124 | | | | (8,438 | ) | | | (21,417 | ) |
Increase (decrease) in accounts payable, accrued expenses and other liabilities | | | 15,710 | | | | 1,100 | | | | (8,582 | ) |
| | | | | | | | | | | | |
Net cash provided by (used in) operating activities from continuing operations | | | (170,526 | ) | | | (200,067 | ) | | | 101,530 | |
Net cash provided by (used in) operating activities from discontinued operations | | | 97,368 | | | | (36,169 | ) | | | 10,014 | |
| | | | | | | | | | | | |
Net cash provided by (used in) operating activities | | | (73,158 | ) | | | (236,236 | ) | | | 111,544 | |
| | | | | | | | | | | | |
Cash flows from investing activities: | | | | | | | | | | | | |
Funding of mortgage loans held for investment | | | (2,462,875 | ) | | | (3,367,932 | ) | | | (4,154,797 | ) |
Payments and proceeds from sales of mortgage loans held for investment | | | 2,444,167 | | | | 2,621,554 | | | | 689,995 | |
(Increase) decrease in restricted cash | | | (751 | ) | | | (3,866 | ) | | | 8,028 | |
Purchase of furniture and equipment, net | | | (2,495 | ) | | | (3,642 | ) | | | (7,070 | ) |
Proceeds from sale of real estate owned | | | 59,521 | | | | 15,305 | | | | 3,858 | |
| | | | | | | | | | | | |
Net cash provided by (used in) investing activities from continuing operations | | | 37,567 | | | | (738,581 | ) | | | (3,459,986 | ) |
Net cash provided by (used in) investing activities from discontinued operations | | | 101 | | | | (159 | ) | | | (163 | ) |
| | | | | | | | | | | | |
Net cash provided by (used in) investing activities | | | 37,668 | | | | (738,740 | ) | | | (3,460,149 | ) |
| | | | | | | | | | | | |
Cash flows from financing activities: | | | | | | | | | | | | |
Proceeds from warehouse financing—loans held for sale | | | 2,538,880 | | | | 2,505,091 | | | | 1,875,591 | |
Repayment of warehouse financing—loans held for sale | | | (2,277,989 | ) | | | (2,302,689 | ) | | | (2,102,397 | ) |
Proceeds from warehouse financing—loans held for investment | | | 2,633,735 | | | | 2,634,914 | | | | 4,985,061 | |
Repayment of warehouse financing—loans held for investment | | | (2,723,350 | ) | | | (2,777,713 | ) | | | (5,000,687 | ) |
Proceeds from securitization financing | | | 2,658,647 | | | | 2,891,690 | | | | 4,154,697 | |
Repayment of securitization financing | | | (2,624,463 | ) | | | (1,944,281 | ) | | | (591,645 | ) |
Dividends paid | | | (86,598 | ) | | | (93,770 | ) | | | (31,754 | ) |
Purchase of derivative instruments | | | — | | | | (5,700 | ) | | | — | |
Purchases of common stock | | | (16,848 | ) | | | (3,349 | ) | | | — | |
Costs relating to the issuance of common stock | | | — | | | | (433 | ) | | | (1,734 | ) |
Restricted stock repurchased and cancelled | | | (42 | ) | | | (129 | ) | | | (162 | ) |
Proceeds from exercise of stock options | | | — | | | | 37 | | | | 216 | |
| | | | | | | | | | | | |
Net cash provided by financing activities from continuing operations | | | 101,972 | | | | 903,668 | | | | 3,287,186 | |
Net cash (used in) provided by financing activities from discontinued operations | | | (75,866 | ) | | | 43,163 | | | | (35,154 | ) |
| | | | | | | | | | | | |
Net cash provided by financing activities | | | 26,106 | | | | 946,831 | | | | 3,252,032 | |
| | | | | | | | | | | | |
Net increase (decrease) in cash | | | (9,384 | ) | | | (28,145 | ) | | | (96,573 | ) |
Cash at the beginning of the year | | | 33,536 | | | | 61,681 | | | | 158,254 | |
| | | | | | | | | | | | |
Cash at the end of the year | | $ | 24,152 | | | $ | 33,536 | | | $ | 61,681 | |
| | | | | | | | | | | | |
Supplemental disclosures: | | | | | | | | | | | | |
Cash paid for interest | | $ | 322,501 | | | $ | 213,405 | | | $ | 72,868 | |
Cash (received) paid for taxes | | | (273 | ) | | | (255 | ) | | | 10,187 | |
Non-cash investing and financing activities: | | | | | | | | | | | | |
Transfer from mortgage loans held for sale to real estate owned | | | 8,410 | | | | 867 | | | | 998 | |
Transfer from mortgage loans held for investment to real estate owned | | | 128,301 | | | | 34,062 | | | | 6,213 | |
Transfer from mortgage loans held for sale to mortgage loans held for investment | | | 164,454 | | | | 108,639 | | | | — | |
Transfer from mortgage loans held for investment to mortgage loans held for sale | | | — | | | | 639,469 | | | | — | |
See accompanying notes to consolidated financial statements.
F-7
FIELDSTONE INVESTMENT CORPORATION AND SUBSIDIARIES
Notes to Consolidated Financial Statements
December 31, 2006, 2005 and 2004
(In thousands, except share and per share data)
| (1) | Organization and Summary of Significant Accounting Policies |
Fieldstone Investment Corporation (FIC) was incorporated in the State of Maryland on August 20, 2003, as a wholly owned subsidiary of Fieldstone Holdings Corp. (FHC). FHC was incorporated in the State of Delaware in February 1998 as a C Corporation. In July 1998, FHC purchased 100% of the shares of Fieldstone Mortgage Company (FMC). Prior to 2003, FHC operated as a taxable C corporation. Effective January 1, 2003, FHC elected to be taxed as an S Corporation, and FMC was treated as a qualified sub-chapter S subsidiary.
In November 2003, FIC executed a reverse merger with FHC, with FIC as the surviving entity, in a transaction that was accounted for as a merger of entities under common control whereby the historical cost basis of the assets and liabilities was retained. Effective with the merger in November 2003, FIC elected to be taxed as a Real Estate Investment Trust (REIT), and FMC, its wholly owned subsidiary, elected to be taxed as a Taxable REIT Subsidiary (TRS).
In February of 2004, FIC formed two wholly owned subsidiaries, Fieldstone Mortgage Ownership Corp. (FMOC) and Fieldstone Servicing Corp. (FSC), as Maryland corporations, which are treated as qualified REIT subsidiaries. FMOC holds securities and ownership interests in owner trusts and other financing vehicles, including securities issued by FIC or on FIC’s behalf. FMOC holds the residual interest in FIC’s securitized pools, as well as any derivatives designated as economic interest rate hedges related to securitized debt. FSC holds the rights to direct the servicing of the mortgage loans held for investment.
In May of 2005, FIC formed a wholly owned, limited purpose financing subsidiary, Fieldstone Mortgage Investment Corporation (FMIC), a Maryland corporation, which is treated as a qualified REIT subsidiary. FMIC was formed for the purpose of facilitating the financing and sale of mortgage loans and mortgage-related assets by issuing and selling securities secured primarily by, or evidencing interests in, mortgage loans and mortgage-related assets.
The accompanying consolidated financial statements include the accounts of FIC and its subsidiaries (together the Company). All intercompany balances and transactions have been eliminated in consolidation.
FMC originates, purchases, and sells non-conforming and conforming residential mortgage loans and engages in other activities related to mortgage banking. FMC originates mortgage loans through wholesale and retail business channels through its network of independent mortgage brokers serviced by regional wholesale operations centers and a network of retail branch offices located throughout the country.
Non-conforming loans that are originated are underwritten in accordance with FMC’s underwriting guidelines designed to evaluate a borrower’s credit history, capacity, willingness, and ability to repay the loan, as well as the value and adequacy of the collateral. Conforming loans that are originated are loans that meet the underwriting criteria required for a mortgage loan to be saleable to a Government Sponsored Entity (GSE), such as Fannie Mae or Freddie Mac, or institutional investors.
A substantial portion of the non-conforming loans originated by FMC are closed by FMC using funds advanced by FIC, with a simultaneous assignment of the loans to FIC. These loans are held for investment and financed by warehouse debt and by issuing mortgage-backed securities secured by these loans. FMC sells the portion of the non-conforming loans not held for investment and all of the conforming loans that it originates on a whole-loan, servicing-released basis. FMC provides interim servicing on the loans held for sale from the time of funding until the time the loans are transferred to the permanent servicer, which generally occurs between 30 and 60 days after funding.
Pursuant to an agreement, JPMorgan Chase Bank, National Association acts as servicer of the loans held for investment. Prior to December 31, 2006, servicing rights for loans held for investment were transferred to FSC, and
F-8
FSC contracted with a third party to subservice the loans on FSC’s behalf. Beginning in 2007, servicing rights for loans to be held for investment will be transferred to the permanent servicer at the time of funding. The servicer has primary responsibility for performing the servicing functions with respect to the loans, including all collection, advancing and loan level reporting obligations, maintenance of custodial and escrow accounts, maintenance of insurance and enforcement of foreclosure proceedings.
FMC is licensed or exempt from licensing requirements to originate residential mortgages all in 50 states and the District of Columbia. FIC is licensed or exempt from licensing requirements to fund residential mortgage loans and acquire closed residential mortgage loans in all states in which it operates.
The preparation of consolidated financial statements in conformity with GAAP requires management to make estimates and assumptions that affect the reported amounts of assets and liabilities, disclosures of contingent assets and liabilities at the date of the financial statements, and the reported amounts of revenues and expenses during the reporting period. Critical estimates include (i) an estimate of the representation and warranty liabilities related to the sale of mortgage loans; (ii) an estimate of losses inherent in mortgage loans held for investment, which is used to determine the related allowance for loan losses and realizable value of the Company’s accrued interest receivable; (iii) an estimate of the future loan prepayment rate of mortgage loans held for investment, which is used in the calculation of deferred origination and bond issuance cost amortization; (iv) the non-cash mark to market valuation of the interest rate swaps which economically hedge the Company’s securitization debt; and (v) the fair market value of equity compensation awards. Actual results could differ from those estimates. Amounts on the consolidated statements of operations most affected by the use of estimates are the reserve for losses—loans sold (which is a component of gains on sales of mortgage loans, net), provision for loan losses—loans held for investment, interest income – loans held for investment, derivative valuations (which are a component of “Other income/(expense)—portfolio derivatives”), stock-based compensation (which is a component of “Salaries and employee benefits”) and deferred origination and bond issuance costs (which are components of net interest income for loans held for investment and “Gains on sales of mortgage loans, net” for loans held for sale).
| | (c) | Cash and Restricted Cash |
Cash consists of demand deposits and overnight funds at commercial banks. Restricted cash includes escrow payments on loans and prefunding proceeds received on our securitizations. Prefunding refers to situations where a portion of the collateral pledged to the trust is delivered subsequent to the bond closing date and the uncollateralized portion of bond proceeds are held in escrow by the trustee. Restricted cash is controlled by terms of the Company’s warehouse financing or the trustee, as applicable, and by regulatory and contractual requirements regarding the processing and closing of residential mortgage loans.
| | (d) | Mortgage Loans Held for Sale |
Mortgage loans held for sale are mortgage loans funded or purchased with the intent to be sold in the foreseeable future. Mortgage loans held for sale are recorded at the lower of cost or market value calculated on an aggregate basis by type of loan product, categorized as conforming loans, non-conforming loans, or loans deemed not to be saleable in the normal course of business due to delinquency or other impairment. Market value is determined by investor commitment prices and current investor yield requirements at the date of the financial statements. Allowances recorded to recognize market values below cost are charged against gains on sales of loans when they are established and are subsequently reported as a reduction in the carrying value of mortgage loans held for sale. Loan origination fees, discount points and certain direct origination costs associated with loans held for sale are initially recorded as an adjustment of the cost of the loan. Gains on sales of mortgage loans are recognized based upon the difference between the selling price and the carrying value of the related mortgage loans sold after considering the required reserve for losses on loans sold.
| | (e) | Reserve for Losses—Loans Sold |
The Company maintains a reserve for the representation and warranty liabilities related to the sold loans, and for the contractual obligation to rebate a portion of any premium paid by a purchaser when a borrower prepays a sold loan within an agreed period. The reserve, which is recorded as a liability on the consolidated statements of condition,
F-9
is established when loans are sold, and is calculated as the estimated fair value of losses reasonably estimated to occur over the life of the loan. Management estimates inherent losses based upon historical loss trends and frequency and severity of losses for similar loan product sales. The adequacy of this reserve is evaluated and adjusted as required. The provision for losses recognized at the sale date is included in the consolidated statements of operations as a reduction of gains on sales of mortgage loans.
| | (f) | Mortgage Loans Held for Investment, Net |
Mortgage loans held for investment, net primarily consist of mortgage loans secured by single-family residential properties. Loan origination fees, discount points and certain direct origination costs associated with loans held for investment are deferred and amortized over the life of the loans as an adjustment to interest income using the effective interest rate method. Management utilizes an estimate of the prepayment speed of the loans to forecast the remaining average life of the loans in determining the amortization. Prepayment fee income is included in interest income—loans held for investment when collected for loans in which a borrower chooses to prepay during a contractually restricted time period.
Loans are placed in non-accrual status when they are past-due ninety days or when, in the opinion of management, the collection of principal and interest is in doubt. At the time the loan is placed on non-accrual status, all previously accrued but uncollectible interest is reversed against current period interest income. A loan remains in non-accrual status until the loan becomes less than ninety day contractually past due. Cash receipts of full monthly payment(s) during the non-accrual period are applied first to the principal and interest due on the oldest outstanding monthly payment. Partial payments are placed in suspense by the servicer until a full monthly periodic payment is received or final disposition of the property, whichever occurs first. In addition, we reserve for interest income accrued on our pool of homogeneous 30 and 60 day delinquent loans on the basis of loss roll rate assumptions, by estimating the interest due on our pool of homogeneous loans which will migrate to non-accrual status in the future. Loans are charged-off when a loan or a portion thereof is considered uncollectible or at the time the loan is transferred to real estate owned.
| | (g) | Allowance for Loan Losses—Loans Held for Investment |
The allowance for loan losses is increased by provisions for loan losses, which are charged to current period operations, and any recoveries. The allowance is decreased by realized losses determined to be the difference between the outstanding loan amount and the fair value of the property less estimated selling costs. In determining an adequate allowance, management makes numerous assumptions and estimates. These underlying assumptions and estimates are continually evaluated and updated to reflect management’s current assessment of the value of the underlying collateral, and other relevant factors affecting portfolio credit quality and inherent losses.
The Company defines the beginning of the loss emergence period to be the occurrence of a contractual delinquency greater than thirty days. On a monthly basis, loans meeting this criterion are included in a determination of the allowance for loan losses, which utilizes roll rate assumptions to assess the likelihood and severity of portfolio losses. Management believes that the allowance for loan losses is a reasonable estimate of the expected losses inherent in the portfolio of loans held for investment. The Company does not assess loans individually for impairment due to the homogeneous nature of the loans, which are collectively evaluated for impairment.
The Company accounts for its derivatives in accordance with Statement of Financial Accounting Standards No. 133,“Accounting for Derivative Instruments and Hedging Activities,” (Statement No. 133) as amended by Statement of Financial Accounting Standards No. 138,“Accounting for Certain Derivative Instruments and Certain Hedging Activities.” All derivatives are recognized on the consolidated statements of condition at their fair value. In the normal course of business, the Company enters into contractual commitments to extend credit to finance one-to-four family homes. The commitments, which contain fixed expiration dates, become effective when the borrowers lock-in a specified interest rate within time frames established by the Company (interest rate locks). Interest rate risk arises if interest rates move adversely between the time of the lock-in of rates by the borrower and the sale of the loan. The interest rate locks related to loans that are intended to be sold are considered derivatives.
F-10
To mitigate the effect of the interest rate risk on loans intended to be sold, the Company enters into mandatory delivery forward sale contracts of mortgage-backed securities (MBS) and treasury securities. Both the interest rate lock commitments and the mandatory forward delivery contracts are undesignated derivatives under Statement No. 133 and accordingly are marked to market through earnings, and recorded as a component of “Gains on sales of mortgage loans, net” in the consolidated statements of operations. Mark to market adjustments on interest rate lock commitments are recorded from the inception of the interest rate lock through the date the underlying loan funds. Any mark to market adjustment during the interest rate lock period is recorded to current period earnings as a component of “Gains on sales of mortgage loans, net,” and carried as a basis adjustment to the funded loan. As required by Statement No. 133, mark to market adjustments subsequent to funding are recorded only for those loans that have been included in a designated fair value hedge model in accordance with Statement No. 133. Although the mandatory forward sales do serve as an economic hedge of the loans, the forward sales and the loans have not been designated as a qualifying fair value hedge under Statement No. 133, and the closed loans pending sale are recorded at the lower of cost or market value.
The Company mitigates the adverse effects of interest rate changes on cash flows as a result of changes in the benchmark interest rate by using interest rate swaps and caps. These derivatives are not classified as cash flow hedges under Statement No. 133. For derivative financial instruments not designated as cash flow hedge instruments, the Company recognizes realized and unrealized changes in fair value in current period earnings as a component of “Other income —portfolio derivatives,” on the consolidated statement of operations during the period in which the changes occur or when the instruments are settled. The periodic net cash settlements and any gain or loss on terminated swaps are also reported as a component of “Other income —portfolio derivatives.” The Company also entered into an interest rate cap agreement to manage interest rate changes relative to its first securitization in the fourth quarter of 2003. The cap, which expired in the third quarter of 2005, was not designated in a qualifying hedging relationship, and as such, realized and unrealized changes in the fair value were recognized in current period earnings during the period in which the changes occurred.
The Company’s derivatives are considered economic hedges of interest rate volatility, and the Company does not engage in other derivative trading activities.
The Company has classified cash activities associated with derivatives in operating activities in the consolidated statements of cash flows.
The trustee distributes scheduled securitization loan payments and unscheduled principal payoffs and curtailments to the related bondholders on a monthly payment date. These loan payments are collected between cut-off dates. Unscheduled principal payments and prepaid principal and interest monthly periodic payments received after the cut-off date for the current month bondholder payment are recorded as a trustee receivable on the consolidated statements of condition. The Company credits mortgage loans held for investment for the payoffs received by the trustee during the current period and credits accrued interest receivable for loan payments paid in advance of their due date. The trustee retains these unscheduled payments until the following bond payment date.
Real estate properties acquired through foreclosure are recorded at the lower of cost or fair value, less estimated selling costs. Fair value is estimated based upon a third party appraisal of the properties. Management periodically evaluates the recoverability of such real estate properties and records write-downs for any subsequent declines in value. Gains or losses on the sale of such foreclosed properties are recognized upon disposition.
F-11
Real estate owned as of December 31, 2006 and 2005 is comprised of the following:
| | | | | | | | |
| ($ in 000s) | | Year Ended December 31,
2006 | | | Year Ended
December 31,
2005 | |
Beginning balance real estate owned | | $ | 14,997 | | | $ | 4,374 | |
Plus: Transfers from mortgage loans held for sale | | | 8,410 | | | | 867 | |
Transfers from mortgage loans held for investment | | | 128,301 | | | | 34,062 | |
Less: Charge-offs | | | (32,751 | ) | | | (9,001 | ) |
Real estate sold | | | (59,521 | ) | | | (15,305 | ) |
| | | | | | | | |
Ending balance real estate owned | | $ | 59,436 | | | $ | 14,997 | |
| | | | | | | | |
| | (k) | Furniture and Equipment |
Furniture and equipment are stated at their cost less accumulated depreciation. Depreciation on furniture and equipment is computed using the straight-line method over the estimated useful lives, which range from 3 to 5 years. Amortization of leasehold improvements is recorded using the straight-line method over the shorter of the estimated useful life of the asset or the lease term.
| | (l) | Securitization Financing |
The Company accounts for its securitizations of mortgage loans as secured financing transactions, and accordingly, holds the securitized mortgage loans for investment. The securitizations do not meet the qualifying special purpose entity criteria of Statement of Financial Accounting Standards No. 140,“Accounting for Transfers and Servicing of Financial Assets and Extinguishments of Liabilities,” because after the loans are securitized, the securitization trust may acquire derivatives with notional balances in excess of beneficial interests formed in the securitization and the trust allows the servicer certain discretion in selling non-performing loans. Accordingly, following a securitization, the mortgage loans and the related debt remain on the consolidated statements of condition and the securitization bond indebtedness to third parties replaces the warehouse debt associated with the securitized mortgage loans. The Company may also borrow funds from credit facilities by pledging a portfolio of non-prime mortgage-backed securities which it has retained. Debt issuance costs are recorded as a component of prepaid expenses and other assets on the consolidated statements of condition, and include underwriting fees, rating agency fees and certain direct issuance costs associated with the securitizations which are amortized over the life of the debt as an adjustment to interest expense using the level yield method. Management utilizes an estimate of the prepayment speed of the loans, and associated debt repayment, to forecast the remaining average life of the debt in determining the deferred cost amortization.
| | (m) | Gains on Sales of Mortgage Loans |
Gains or losses resulting from sales of mortgage loans are recognized at the date of settlement and are based on the difference between the selling price and the carrying value of the related loans sold. Such gains and losses are increased or decreased by the amount of any servicing-released premiums received. Non-refundable fees and direct costs associated with the origination of mortgage loans are deferred and recognized as an adjustment to gain on sale when the loans are sold.
| | (n) | Other Income—Portfolio Derivatives |
Other income —portfolio derivatives, includes the gain or loss from any undesignated derivatives used to manage the financing costs of the Company’s loans held for investment. The gain or loss is comprised of (i) the change in the periodic mark to market of the future value of the contract as of period end, (ii) net cash settlements received or paid during the reporting period, and (iii) any net cash gain or loss upon termination of the contract prior to maturity, if applicable.
FIC has elected to be taxed as a Real Estate Investment Trust (REIT) under Section 856(c) of the Internal Revenue Code. As a REIT, FIC generally is not subject to federal income tax. To maintain its qualification as a REIT, FIC must distribute at least 90% of its REIT taxable income to its stockholders and meet certain other tests relating to assets and income. If FIC fails to qualify as a REIT in any taxable year, FIC will be subject to federal income tax on
F-12
its taxable income at regular corporate rates. FIC may also be subject to certain state and local taxes. Under certain circumstances, even though FIC qualifies as a REIT, federal income and excise taxes may be due on its undistributed taxable income. No provision for income taxes has been provided in the accompanying financial statements related to the REIT, because FIC has paid or will pay dividends in amounts approximating its REIT taxable income.
The Company has elected to treat FMC as a Taxable REIT Subsidiary (TRS). In general, a TRS may hold assets that the Company cannot hold directly and generally may engage in any real estate or non-real estate related business. A TRS is subject to corporate federal income tax, will be taxed as a regular C corporation, and accordingly, records income tax benefit or expense.
The Company accounts for its income taxes related to FMC under the asset and liability method. Deferred tax assets and liabilities are recognized for the future tax consequences attributable to differences between the financial statement carrying amounts of existing assets and liabilities and their respective tax bases. Deferred tax assets and liabilities are measured using enacted tax rates expected to apply to taxable income in the subsequent years in which those temporary differences are expected to be recovered or settled. The effects of future changes in tax laws are not anticipated. If necessary, a valuation allowance is established based upon an evaluation of the likelihood of realization of the deferred tax assets.
| | (p) | Stock-Based Compensation |
The Company adopted the fair value method of accounting for stock options and shares of restricted stock as prescribed by Statement of Financial Standards No. 123R,“Share Based Payment”(Statement No. 123R). Under this method, compensation cost is measured at the grant date based on the fair value of the award and is recognized as expense on a straight-line basis over the award’s vesting period. The fair value of awards of restricted stock is determined at the date of grant based on the market price of the common stock on that date. For both the stock options and restricted stock, the amount of compensation cost is adjusted for estimated annual forfeitures. The fair value of the stock options is determined using the Black Scholes option pricing model. Prior to the adoption of Statement No. 123R in 2005, the Company accounted for stock based compensation under Statement of Financial Accounting Standards No. 123 “Stock Based Compensation,” under which awards were also recognized in expense based on the fair value of the award. Accordingly, the adoption of Statement No. 123R did not have a material impact on the Company’s consolidated financial statements.
| | (q) | Equity Registration Costs |
The Company capitalized through a direct reduction to additional paid-in capital the underwriting fees and issuance costs related to its private placement offering of 47.15 million shares of $0.01 par value common stock in the fourth quarter of 2003. During the years ended December 31, 2004 and 2005, the Company incurred and capitalized costs associated with the registration of those shares with the Securities and Exchange Commission of $1.7 million and $0.4 million, respectively. There were no costs incurred for the year ended December 31, 2006.
Basic earnings per share (EPS) is computed by dividing net income available to common shareholders by the weighted average number of common shares outstanding. Diluted EPS is computed by dividing net income available to common shareholders by the weighted average common shares outstanding after adjusting for the effects of dilutive potential common shares. The dilutive effects of options and non-vested restricted stock issued under stock-based compensation plans are computed using the treasury stock method.
| | (s) | Discontinued Operations |
On January 13, 2006, the Company’s Board of Directors approved a plan to sell, close or otherwise dispose of the assets of its conforming retail and conforming wholesale segments. In February 2006, the assets pertaining to these segments’ headquarters, all wholesale offices, and certain of its retail offices were sold to third parties. The remaining assets of the conforming division were combined with the Company’s non-conforming retail offices.
In accordance with the provisions of Statement of Financial Accounting Standards No. 144,“Accounting for the Impairment or Disposal of Long-Lived Assets”(Statement No. 144), the results of operations, net of income tax, and cash flows associated with the disposal of these conforming wholesale and conforming retail offices has been classified as discontinued operations and segregated from the results of the Company’s continuing operations for all periods presented.
F-13
| | (t) | Concentration of Credit Risk |
A portion of the non-conforming mortgage loans that the Company originates are adjustable-rate mortgage (ARM) loans, the payments on which are adjustable from time to time as interest rates change, generally after an initial two-year period during which the loans’ interest rates are fixed and do not change. After the initial fixed rate period, the borrowers’ payments on their ARM loans adjust once every six months to a pre-determined margin over a measure of market interest rates, generally the LIBOR for one-month deposits. For the years ended December 31, 2006 and 2005, 38% and 55%, respectively, of the non-conforming mortgage loan originations were ARM loans which also have an “interest only” feature for the first five years of the loan, so that the borrowers do not begin to repay the principal balance of the loans until after the fifth year of the loans. After the fifth year, the borrowers’ payments increase to amortize the entire principal balance owed over the remaining years of the loan.
These features will likely result in the borrowers’ payments increasing in the future. The interest adjustment feature generally will result in an increased payment after the second year of the loan and the interest only feature will result in an increased payment after the fifth year of the loan. Since these features will increase the debt service requirements of the borrowers, it may increase the risk of default on the Company’s investment portfolio of non-conforming loans for loans that remain in the Company’s portfolio for at least two years, relative to the ARM feature, or for five years, relative to the interest only feature.
For the years ended December 31, 2006 and 2005, 57% and 53%, respectively, of non-conforming loan originations were underwritten with little or no supporting documentation of the borrowers’ income, under the Company’s “stated income” loan programs. The Company mitigates its risk on “stated income” loans through its underwriting guidelines, including setting minimum credit score standards. Based on its experiences with similar loans in the past, and on industry performance data, the Company believes its strict underwriting guidelines relating to non-conforming loans that are originated help the Company to evaluate a borrower’s credit history, willingness and ability to repay the loans as well as the value and adequacy of the borrower’s collateral. The Company’s underwriting guidelines are designed to balance the credit risk of the borrower with the loan-to-value (LTV) and interest rate of the loan.
In addition, for the years ended December, 2006 and 2005, 38% and 41%, respectively, of the non-conforming loan originations include loans secured by properties located in California. An overall decline in the economy or the residential real estate market or the occurrence of a natural disaster in California could adversely affect the value of the mortgaged properties in that state and increase the risk of delinquency, foreclosure, bankruptcy or loss on the non-conforming mortgage loans in the Company’s investment portfolio. The Company’s non-conforming loan originations are concentrated heavily in California because it is the largest mortgage market in the U.S. and the Company’s underwriting, product design and pricing philosophies address the characteristics of California borrowers, which the Company believes to be: non-standard credit profiles, interest in low downpayment products, payment-focused and higher home values.
| | (u) | Industry and Operational Risks |
The subprime lending market in which the Company predominantly operates experienced significant changes during 2006. Slowing U.S. housing markets led to a decrease in total mortgage originations, generating intense competition among lenders on both price and credit. Flattening and declining home price values, rising interest rates, and increased borrower debt all contributed to significant increases in delinquencies and losses on subprime loans. Losses incurred were also negatively impacted by rising loss severities due to flat and in some cases declining property values. Lenders also experienced increased and accelerated repurchase requests on loans sold as first and early payment defaults increased. Declining subprime loan performance on more recent vintages has contributed to a recent reduction in the liquidity available to the industry, both as it relates to securitizations and credit facilities. Additionally, many lenders have also experienced margin calls on the loans used as collateral. The number of potential investors in subprime securitizations has decreased and the cost of offering these securitizations has increased. These factors adversely impacted the Company’s operations as well as the operations of many of its competitors during 2006, and the impact has continued into the first quarter of 2007. As a result, the subprime lending industry has seen a recent increase in both bankruptcies and merger and acquisition activity, including the proposed merger with C-BASS discussed in Note 19.
F-14
These factors contributed to the Company’s net loss of $68.4 million in 2006, which included a $39.0 million increase in the provision for loan losses on loans held for investment and an $8.2 million increase in the provision for losses on loans sold compared to 2005, as well as a $4.2 million charge to reflect the reduced value of loans held for sale as of December 31, 2006. The Company amended several of its credit facilities during December 2006 and January 2007 to remain in compliance with its profitability and tangible net worth covenants and may need to amend the facilities again as discussed below.
Management is decreasing the Company’s cost structure and improving both its origination and loan performance. The Company has implemented initiatives related to each of these goals. Management intends to reduce the cost structure through the consolidation of operations centers, pricing and commission changes, implementation of a new loan origination system, and vendor re-structuring. The initiatives to improve origination performance include the introduction of new alt-A products, a simplified rate sheet, and a new value-based commission plan. Finally, the Company initiated steps to improve loan performance by eliminating products with the most significant losses, limiting the age of appraisals, narrowing acceptable thresholds for the automated verification of broker appraisals, utilizing new technology and resources to flag high risk loans prior to origination for additional manual procedures, implementing accelerated collections efforts on early stage delinquencies, increased internal staffing and focus on servicer work-flow, and directly boarding loans held for investment with the servicer to avoid immediate servicing transfer. The Company is evaluating additional cost management initiatives, including further operations consolidation and a proportional reduction in home office staff, as the current market conditions continue to evolve.
Though the Company expects the current industry turmoil and liquidity constraints to continue in 2007, management believes that the benefits of the Company’s initiatives, together with benefits it expects to realize through the proposed merger with C-BASS, will improve the Company’s results of operations in 2007. However, if 2007 results are comparable to 2006 results, the Company may violate the covenants of its credit facilities, which would subject it to increased liquidity risks, including the ability to generate sufficient cash flows to continue supporting current operations. In the event of a breach of a covenant contained in a facility that triggers an event of default, then the lender may accelerate outstanding principal repayment owed under the facility and such acceleration may permit other lenders to accelerate all of the outstanding principal repayment under their facilities. In such a situation, the Company believes that it would be able to generate sufficient cash from existing operations, maintain sufficient liquidity, and make alternative arrangements, including obtaining waivers or amendments from existing lenders or reach agreement with new lenders, to enable it to continue to meet its obligations for the next twelve months. However, the Company would need to significantly restructure its operations, including further consolidation and work force reductions, to continue to meet its ongoing obligations.
| | (v) | Recent Accounting Pronouncements |
In September 2006, the SEC staff issued Staff Accounting Bulletin No. 108 (SAB No. 108). SAB No. 108 provides guidance on the consideration of prior year misstatements in quantifying the materiality of current year misstatements. SAB No. 108 is effective for fiscal years ending after November 15, 2006. The implementation of SAB No. 108 did not have a material effect on its results of operations, statements of condition or cash flows.
In June 2006, the FASB issued FASB Interpretation No. 48“Accounting For Uncertainty in Income Taxes-an interpretation of FASB Statement No. 109,”(FIN 48). FIN 48 prescribes a recognition threshold and measurement attribute for the financial statement recognition and measurement of a tax position taken or expected to be taken in a tax return. FIN 48 also provides guidance on derecognition, classification, interest and penalties, accounting in interim periods, disclosure, and transition. FIN 48 is effective for fiscal years beginning after December 15, 2006. The Company will adopt FIN 48, as applicable, beginning in fiscal year 2007. Management is currently assessing the impact that the implementation of FIN 48 may have on its results of operations, statements of condition or cash flows.
In February 2006, the FASB issued Statement of Financial Accounting Standards No. 155,“Accounting For Certain Hybrid Financial Instruments-an amendment of FASB Statements No. 133 and 140,”(Statement No. 155). Statement No. 155 amends Statement No. 133 to permit fair value remeasurement for any hybrid financial instrument with an embedded derivative that otherwise would require bifurcation, provided that the whole instrument is accounted for on a fair value basis. Statement No. 155 amends Statement No. 140 to allow a qualifying special-purpose entity to hold a derivative financial instrument that pertains to a beneficial interest other than another derivative financial instrument. Statement No. 155 is effective for all financial instruments acquired, issued or subject to a remeasurement (new basis) event occurring after the beginning of an entity’s first fiscal year that begins after September 15, 2006. The Company will adopt Statement No. 155, as applicable, beginning in fiscal year 2007. Management believes that the implementation of Statement No. 155 will not have a material effect on its results of operations, statements of condition or cash flows.
In March 2006, the FASB issued Statement of Financial Accounting Standards No. 156,“Accounting For Servicing of Financial Assets-an amendment of FASB Statement No. 140,”(Statement No. 156). Statement No. 156 amends Statement of Financial Accounting Standards No. 140,“Accounting for Transfers and Servicing of Financial Assets and Extinguishments of Liabilities,” (Statement No. 140), with respect to the accounting for separately recognized servicing rights. Statement No. 156 requires an entity to initially recognize, at fair value, a servicing asset or servicing liability each time it undertakes an obligation to service a financial asset by entering into a servicing
F-15
contract in certain situations. In addition, Statement No. 156 permits the subsequent measurement of servicing assets and servicing liabilities using the fair value method or the amortization method as prescribed under Statement No. 140. Statement No. 156 is effective as of the beginning of an entity’s first fiscal year that begins after September 15, 2006. The Company will adopt Statement No. 156, as applicable, beginning in fiscal year 2007. Management believes that the implementation of Statement No. 156 will not have a material effect on its results of operations, statements of condition or cash flows.
In September 2006, the FASB issued Statement of Financial Accounting Standards No. 157, “Fair Value Measurements” (Statement No. 157). Statement No. 157 consistently defines fair value, establishes a framework for measuring fair value in generally accepted accounting principles, and modifies fair value disclosure requirements. Statement No. 157 is effective for fiscal years beginning after November 15, 2007. The Company will adopt, Statement No. 157, as applicable, beginning in fiscal year 2008. Management is currently assessing the impact that the implementation of Statement No. 157 may have on its results of operations, statements of condition or cash flows.
In February 2007, the FASB issued Statement of Financial Accounting Standards No. 159, “The Fair Value Option for Financial Assets and Financial Liabilities” (Statement No. 159). Statement No. 159 permits entities to choose to measure qualifying financial instruments at fair value. Statement No 159 is intended to provide the opportunity to mitigate fluctuations in earnings from valuation changes of qualifying instruments without needing to apply complex hedge accounting. Statement No. 159 is effective for fiscal years beginning after November 15, 2007. The Company will adopt, Statement No. 159, as applicable, beginning in fiscal year 2008. Management is currently assessing the impact that the implementation of Statement No. 159 may have on its results of operations, statements of condition or cash flows.
Certain prior period amounts have been reclassified to conform to the current period presentation.
| (2) | Mortgage Loans Held for Sale, Gains on Sale, and Reserve for Losses—Sold Loans |
Mortgage loans that the Company acquires or originates with the intent to sell in the foreseeable future are initially recorded at cost including any premium paid or discount received, adjusted for the fair value change during the period in which the loan was an interest rate lock commitment. Loans held for sale are carried on the books at the lower of cost or market value, as calculated on an aggregate basis by type of loan.
The components of the gains on sale of mortgage loans, net for the years ended December 31, 2006, 2005, and 2004 are as follows:
| | | | | | | | | | | | | | | | | | | | | |
| | | Year Ended December 31, | |
($ in 000s) | | 2006 | | | % of Sales Volume | | | 2005 | | | % of Sales Volume | | | 2004 | | | % of Sales Volume | |
Gross premiums - whole loan sales, net of hedging gains or losses | | $ | 46,747 | | | 1.8 | % | | $ | 85,417 | | | 2.8 | % | | $ | 68,245 | | | 2.9 | % |
Fees collected, net of premiums paid1 | | | 7,488 | | | 0.3 | % | | | 3,498 | | | 0.1 | % | | | 3,929 | | | 0.2 | % |
Direct origination costs1 | | | (19,673 | ) | | (0.7 | )% | | | (23,758 | ) | | (0.8 | )% | | | (21,098 | ) | | (0.9 | )% |
| | | | | | | | | | | | | | | | | | | | | |
Subtotal | | | 34,562 | | | 1.4 | % | | | 65,157 | | | 2.1 | % | | | 51,076 | | | 2.2 | % |
Allowance to reduce loans held for sale to the lower of cost or market | | | (4,156 | ) | | (0.1 | )% | | | — | | | — | | | | — | | | — | |
Provision for losses—sold loans | | | (13,361 | ) | | (0.5 | )% | | | (3,959 | ) | | (0.1 | )% | | | (8,298 | ) | | (0.4 | )% |
| | | | | | | | | | | | | | | | | | | | | |
Gains on sales of mortgage loans, net | | $ | 17,047 | | | 0.8 | % | | $ | 61,198 | | | 2.0 | % | | $ | 42,778 | | | 1.8 | % |
| | | | | | | | | | | | | | | | | | | | | |
Loan sales volume | | $ | 2,667,114 | | | | | | $ | 3,103,598 | | | | | | $ | 2,374,178 | | | | |
| | | | | | | | | | | | | | | | | | | | | |
1 | Loan fees collected, premiums paid and direct origination costs are deferred at funding and recognized on settlement of the loan sale. |
Mortgage loans held for sale, net, as of December 31, 2006 and 2005 are as follows:
| | | | | | | | |
| | | December 31, | |
| | | 2006 | | | 2005 | |
Mortgage loans held for sale | | $ | 552,939 | | | $ | 591,840 | |
Net deferred origination costs | | | 1,795 | | | | 1,547 | |
Premium, net of discount | | | 175 | | | | 1,987 | |
Allowance for lower of cost or market value | | | (4,389 | ) | | | (1,105 | ) |
| | | | | | | | |
Total | | $ | 550,520 | | | $ | 594,269 | |
| | | | | | | | |
The Company maintains a reserve for its representation and warranty liabilities related to the sale of loans and for its contractual obligations to rebate a portion of any premium paid by an investor when a sold loan prepays within an agreed period. The reserve, which is recorded as a liability on the consolidated statements of condition, is established when loans are sold, and is calculated as the fair value of liabilities reasonably estimated to occur during the life of the related sold loans. The provision is recorded as a reduction of gain on sale of loans. At December 31, 2006 and 2005, mortgage loans held for sale included approximately $6.8 million and $1.7 million, respectively, of loans repurchased pursuant to these provisions, net of valuation allowance. Realized losses on sold loans, net of recoveries, primarily related to early payment defaults, premium recaptures on early payoffs, and representation and warranty liability, totaled $23.9 million, $2.5 million and $6.9 million, or 0.82%, 0.06% and 0.20% of total loan sales in 2006, 2005 and 2004, respectively.
At December 31, 2006, the Company had $16.1 million of loans deemed to be unsaleable at standard sale premiums compared to $5.2 million at December 31, 2005. The Company recorded a valuation allowance of $3.6 million and $1.1 million, as of December 31, 2006 and 2005, respectively, for these loans unsaleable at standard sale premiums.
F-16
The reserve for losses—loans sold as of December 31, 2006, 2005, and 2004 is as follows:
| | | | |
Balance for continuing operations at December 31, 2003 | | $ | 28,265 | |
Provision. | | | 8,298 | |
Realized losses | | | (7,790 | ) |
Recoveries | | | 894 | |
| | | | |
Balance for continuing operations at December 31, 2004 | | | 29,667 | |
Provision | | | 3,959 | |
Realized losses | | | (3,803 | ) |
Recoveries | | | 1,275 | |
| | | | |
Balance for continuing operations at December 31, 2005 | | | 31,098 | |
Provision | | | 13,361 | |
Realized losses | | | (24,288 | ) |
Recoveries | | | 383 | |
| | | | |
Balance for continuing operations at December 31, 2006 | | | 20,554 | |
Balance at December 31, 2006 related to previous sales by discontinued operations | | | 2,498 | |
| | | | |
Total at December 31, 2006 | | $ | 23,052 | |
| | | | |
Historically, the Company has experienced substantially all of its representation and warranty losses on loans sold during the first three years following the sale. The reserve for losses—loans sold as of December 31, 2006 relates to approximately $10.8 billion of loan sales during the period of January 1, 2004 through December 31, 2006.
The market value of second lien loans decreased significantly during 2006 due to slowing home price appreciation and a forecast of increased losses on second lien loans by prominent rating agencies. As of December 31, 2006, the Company determined that the market value of $40.5 million of its second lien loans held for sale as of that date was less than their carrying value. Accordingly, the Company recorded pre-tax charges of $4.2 million for the year ended December 31, 2006 to reduce these loans to the lower of cost or market value as a reduction in the gain on sales of mortgage loans, net.
During the year ended December 31, 2006, the Company sold $164.5 million of loans that had previously been classified as held for sale from FMC to FIC where they were classified as loans held for investment. The sold loans were primarily second lien loans. Beginning in the second quarter of 2006, the market value of second lien loans decreased significantly as discussed above and the Company subsequently determined that it could earn a better return by holding second lien loans that met certain expected return criteria for investment instead of selling them to a third party. An allowance of $3.6 million had been recorded to reduce these loans to their estimated fair market value prior to the transfer.
| (3) | Mortgage Loans Held for Investment and Allowance for Loan Losses |
The Company originates fixed-rate and adjustable-rate mortgage loans that have a contractual maturity of up to 40 years. These mortgage loans are initially recorded at cost including any premium or discount. These mortgage loans are financed with warehouse debt until they are pledged as collateral for securitization financing. The Company is exposed to risk of loss from its mortgage loan portfolio and establishes an allowance for loan losses taking into account a variety of criteria including the contractual delinquency status, estimated delinquency roll rates, and estimated historical loss severities. The adequacy of this allowance for loan loss is evaluated and adjusted based on this review.
F-17
Mortgage loans held for investment, net as of December 31, 2006 and 2005 are as follows:
| | | | | | | | |
| | | December 31, 2006 | | | December 31, 2005 | |
Securitized mortgage loans held for investment | | $ | 5,077,237 | | | $ | 5,043,762 | |
Mortgage loans held for investment—warehouse financed | | | 492,503 | | | | 486,454 | |
Net deferred origination fees and costs | | | 31,457 | | | | 40,199 | |
| | | | | | | | |
Mortgage loans held for investment | | | 5,601,197 | | | | 5,570,415 | |
Allowance for loan losses—loans held for investment | | | (81,859 | ) | | | (44,122 | ) |
| | | | | | | | |
Mortgage loans held for investment, net | | $ | 5,519,338 | | | $ | 5,526,293 | |
| | | | | | | | |
The delinquency status of our loans held for investment as of December 31, 2006 and December 31, 2005 was as follows:
| | | | | | | | | | | | |
| | | December 31, 2006 | | | December 31, 2005 | |
| ($ in 000s) | | Principal
Balance | | Percentage
of Total | | | Principal
Balance | | Percentage
of Total | |
Current | | $ | 4,348,051 | | 78.1 | % | | $ | 4,925,656 | | 89.1 | % |
30 days past due | | | 610,876 | | 11.0 | % | | | 359,074 | | 6.5 | % |
60 days past due | | | 234,080 | | 4.2 | % | | | 93,663 | | 1.7 | % |
90+ days past due | | | 146,867 | | 2.6 | % | | | 65,810 | | 1.2 | % |
In process of foreclosure | | | 229,866 | | 4.1 | % | | | 86,013 | | 1.5 | % |
| | | | | | | | | | | | |
Total | | $ | 5,569,740 | | 100.0 | % | | $ | 5,530,216 | | 100.0 | % |
| | | | | | | | | | | | |
The allowance for loan losses—loans held for investment for the years ended December 31, 2006, 2005 and 2004 is summarized as follows:
| | | | |
Balance at December 31, 2003 | | $ | 2,078 | |
Provision | | | 21,556 | |
Charge—offs | | | (986 | ) |
Recoveries | | | — | |
| | | | |
Balance at December 31, 2004 | | $ | 22,648 | |
Provision | | | 30,065 | |
Charge—offs | | | (9,438 | ) |
Recoveries. | | | 847 | |
| | | | |
Balance at December 31, 2005 | | $ | 44,122 | |
Provision | | | 69,062 | |
Charge—offs | | | (31,325 | ) |
Recoveries. | | | — | |
| | | | |
Balance at December 31, 2006 | | $ | 81,859 | |
| | | | |
Mortgage loans held for investment are placed in non-accrual status for interest income recognition when they are past-due ninety days as to either principal or interest or when, in the opinion of management, the collection of principal and interest is in doubt. Loans held for investment on non-accrual status were $376.7 million and $151.8 million as of December 31, 2006 and 2005, respectively, and averaged $240.7 million and $91.4 million during the year ended December 31, 2006 and 2005, respectively. The Company reversed previously accrued interest income relating to non-performing and delinquent loans, which would ordinarily have been recognized per contractual loan terms, of $21.0 million, $7.9 million, and $1.9 million, respectively in the years ended December 31, 2006, 2005, and 2004.
Prior to 2006, the Company utilized industry loss assumptions for loans similar in credit, loan size, and product type in making estimates regarding the allowance for loan losses because the Company had limited historical loss data on past originations, all of which were sold servicing-released prior to October 2003. Beginning in the second quarter of 2006, the Company began to blend its own historical delinquency experiences with industry averages in estimating
F-18
the percentage of loans that are delinquent 30+ days that will ultimately go to foreclosure. This resulted in an estimate that approximately 25% of the loans 30+ days delinquent will ultimately go to foreclosure. As a result of the Company’s experience in the current market environment, it also increased the estimate of the proportion of foreclosed properties that will be transferred to real estate owned during 2006. In addition to blending its own historical delinquency experiences with industry averages, the Company began to utilize historical loss experiences in estimating loss severity for pools for which it has significant realized loss experience. Applying this methodology individually to each pool yielded an estimated average loss severity of approximately 24% for 2003, 2004, 2005 and early 2006 vintage loans. The Company uses average loss severity estimates of 30% for loans originated since the second half of 2006 for which a material level of actual realized loss experience for its own loans is not available. The Company utilized industry average loss severity estimates of 35% for 2005, at which time a material level of actual realized loss experience for its own loans was not available. These underlying assumptions and estimates are periodically evaluated and updated to reflect management’s current assessment of the value of the underlying collateral, actual historical loss experience, and other relevant factors impacting portfolio credit quality and inherent losses.
| (4) | Furniture and Equipment |
The components of furniture and equipment, net at December 31, 2006 and 2005 are as follows:
| | | | | | | | |
| | | 2006 | | | 2005 | |
Furniture and fixtures | | $ | 2,754 | | | $ | 3,441 | |
Leasehold improvements | | | 1,412 | | | | 1,684 | |
Equipment | | | 6,605 | | | | 8,404 | |
Data processing software | | | 8,107 | | | | 6,807 | |
| | | | | | | | |
| | | 18,878 | | | | 20,336 | |
Less accumulated depreciation and amortization | | | (10,759 | ) | | | (10,185 | ) |
| | | | | | | | |
Furniture and fixtures, net | | $ | 8,119 | | | $ | 10,151 | |
| | | | | | | | |
Depreciation and amortization expense for 2006, 2005, and 2004 was $4.2 million, $3.3 million, and $2.6 million, respectively.
| (5) | Warehouse Financing, Loans Held for Sale and Loans Held for Investment |
At December 31, 2006, the Company had a total of $2.3 billion of committed warehouse lines of credit with 4 financial entities. There were no uncommitted warehouse lines as of December 31, 2006. The facilities are secured by mortgage loans held for investment to be securitized, mortgage loans held for sale, the related investor commitments to purchase those loans held for sale, and all proceeds thereof.
Warehouse lines of credit consist of the following at December 31, 2006 and 2005:
| | | | | | | | | | | |
Agreements as of December 31, 2006 | | Amount
Outstanding as of
December 31, |
| (in millions) | | Amount
Available | | Maturity Date | | 20062 | | 20052 |
Lender | | | | |
Countrywide Warehouse Lending | | $ | — | | Not Renewed | | $ | — | | $ | 34.3 |
Credit Suisse First Boston Mortgage Capital LLC | | | 400.0 | | April 2007 | | | 240.5 | | | 195.2 |
Credit Suisse, New York Branch Commercial Paper Facility | | | 800.0 | | July 2007 | | | 163.0 | | | 415.8 |
JPMorgan Chase Bank, N.A. | | | 150.0 | | July 2007 | | | 83.5 | | | 53.9 |
Lehman Brothers Bank, FSB1 | | | 500.0 | | January 2007 | | | 242.3 | | | 51.7 |
Merrill Lynch Bank USA | | | 400.0 | | October 2007 | | | 178.9 | | | 61.9 |
| | | | | | | | | | | |
Total | | $ | 2,250.0 | | | | $ | 908.2 | | $ | 812.8 |
| | | | | | | | | | | |
1 | The Company amended the facility in January 2007 as described in Note 19 and extended the facility until January 2008. |
2 | Includes only continuing operations. |
The average outstanding amounts under these agreements were $885.0 million, $778.4 million, and $741.6 million, respectively, for the years ended December 31, 2006, 2005, and 2004, respectively. The maximum amount outstanding under these agreements at any month-end during the years ended December 31, 2006, 2005, and 2004 was $1.2 billion, $1.3 billion, and $1.2 billion,
F-19
respectively, and the weighted average interest rate as of December 31, 2006 and 2005 was 5.0% and 4.7%, respectively. The interest rates are based on spreads to one month or overnight LIBOR, and are generally reset daily or weekly. The Company also pays facility fees based on the commitment amount and non-use fees.
Coupon interest expense and facilities fees included in total interest expense in the consolidated statements of operations, and the weighted average cost of funds of the warehouse lines of credit and repurchase facilities for the years ended December 31, 2006, 2005, and 2004 are as follows:
| | | | | | | | | | | | | | | | | | |
| | | 2006 | | | 2005 | | | 2004 | |
| | | Amount | | Weighted
Average
Cost | | | Amount | | Weighted
Average
Cost | | | Amount | | Weighted
Average
Cost | |
Coupon interest expense . | | $ | 48,953 | | 5.4 | % | | $ | 30,993 | | 3.9 | % | | $ | 16,914 | | 2.3 | % |
Facilities fees | | | 2,560 | | 0.3 | % | | | 3,313 | | 0.4 | % | | | 3,512 | �� | 0.4 | % |
| | | | | | | | | | | | | | | | | | |
Total | | $ | 51,513 | | 5.7 | % | | $ | 34,306 | | 4.3 | % | | $ | 20,426 | | 2.7 | % |
| | | | | | | | | | | | | | | | | | |
The warehouse lines generally have a term of 364 days or less. The credit facilities are secured by substantially all of our non-securitized mortgage loans and contain customary financial and operating covenants that require the Company to maintain specified levels of liquidity and net worth, maintain specified levels of profitability, restrict indebtedness and investments and require compliance with applicable laws. In the fourth quarter of 2006 and during the first quarter of 2007, the Company has received margin calls on the loans collateralizing its debt.
During December 2006, the Company amended several of its credit facilities, reducing the minimum net worth and minimum levels of profitability required under the covenants. In January 2007, the Company further amended its credit facilities as summarized in Note 19 below. If the Company breaches a covenant contained in a facility that triggers an event of default, then the lender may accelerate outstanding principal repayment owed under the facility and such acceleration may permit other lenders to accelerate all of the outstanding principal repayment under their facilities. Additionally, the Company is not able to make dividend distributions during any time at which it is in default under the agreements. The Company was in compliance with all of these covenants at December 31, 2006. The Company may need to amend the facilities again based on industry and operational factors. See Note 1—Industry and Operational Risks.
| (6) | Securitization Financing |
During each of the years ended December 31, 2006 and 2005, the Company issued $2.7 billion and $2.9 billion, respectively, of mortgage-backed bonds through securitization trusts to finance the Company’s portfolio of loans held for investment. Interest rates reset monthly and are indexed to one-month LIBOR. The bonds pay interest monthly based upon a spread over LIBOR. The estimated average life of the bonds is approximately 23 months, and is based on estimates and assumptions made by management. The actual period from inception to maturity may differ from management’s expectations. The Company retains the option to call the transaction and repay the bonds when the remaining unpaid principal balance of the underlying mortgage loans for each pool falls below specified levels. The securitization financings include a step up stipulation which provides that the bond margin over LIBOR will increase 1.5 to 2.0 times the original margin if the Company does not exercise its option to repay the bonds prior to the remaining unpaid principal balance of the underlying mortgage loans falling to specified levels.
Securitizations issued by series during the years ended December 31, 2005 and 2006 are as follows:
| | | | | | | | | | | | | | | | | | | | | |
| | | FMIT 2005-1 | | FMIT 2005-2 | | FMIT 2005-3 | | FMIT 2006-1 | | FMIT 2006-2 | | FMIT 2006-3 | | FMIT 2006-S11 |
Bonds issued | | $ | 729,000 | | $ | 911,000 | | $ | 1,094,000 | | $ | 904,000 | | $ | 766,000 | | $ | 815,000 | | $ | 165,000 |
Loans pledged | | $ | 750,000 | | $ | 967,000 | | $ | 1,165,000 | | $ | 933,000 | | $ | 800,000 | | $ | 859,000 | | $ | 194,000 |
Deferred bond issuance costs | | $ | 2,700 | | $ | 3,300 | | $ | 3,700 | | $ | 3,100 | | $ | 2,700 | | $ | 2,800 | | $ | 800 |
Weighted average spread over LIBOR | | | 0.40% | | | 0.38% | | | 0.37% | | | 0.32% | | | 0.29% | | | 0.25% | | | 0.41% |
Financing costs—LIBOR plus | | | 0.12%-2.00% | | | 0.12%-1.35% | | | 0.12%-1.45% | | | 0.08%-2.30% | | | 0.09%-1.90% | | | 0.07%-2.10% | | | 0.22%-3.50% |
1 | Offering consists of only second lien loans. |
F-20
During 2006, the unpaid principal balance of the loans collateralizing various securitizations fell below the contractual thresholds, permitting FSC to exercise its right of optional termination of the financing. Management reviewed the performance of mortgage loans in the financing trusts and related cost of financing and subsequently exercised the Company’s option to purchase the mortgage loans, REO property, and any other property remaining in the trust at the next payment date. Remaining collateral of the called securitizations is included on the consolidated statement of condition as a component of loans held for investment. Securitizations called during the years ended December 31, 2006 are as follows:
| | | | | | | | | |
| | | FMIT 2004-1 | | FMIT 2004-2 | | FMIT 2003-1 |
Bonds outstanding | | $ | 100,400 | | $ | 122,100 | | $ | 36,600 |
Date of call | | | April 25, 2006 | | | August 25, 2006 | | | November 27, 2006 |
The average securitization financing outstanding was $5.0 billion and $4.4 billion, respectively, for the years ended December 31, 2006 and 2005. The unamortized bond issuance costs at December 31, 2006 and 2005 were $11.5 million and $11.6 million, respectively.
Coupon interest expense, amortization of deferred issuance costs and original issue discount included in total interest expense in the consolidated statements of operations, and the weighted average cost of funds of the securitization financing for the years ended December 31, 2006, 2005 and 2004 are as follows:
| | | | | | | | | | | | | | | | | | |
| | | 2006 | | | 2005 | | | 2004 | |
| | | Amount | | Weighted
Average Cost | | | Amount | | Weighted
Average Cost | | | Amount | | Weighted
Average Cost | |
Coupon interest expense | | $ | 275,427 | | 5.4 | % | | $ | 166,643 | | 3.8 | % | | $ | 46,788 | | 2.1 | % |
Amortization of deferred costs | | | 9,546 | | 0.2 | % | | | 10,536 | | 0.2 | % | | | 4,586 | | 0.2 | % |
Amortization of bond discount | | | 74 | | 0.0 | % | | | 425 | | 0.0 | % | | | 512 | | 0.0 | % |
Total | | $ | 285,047 | | 5.6 | % | | $ | 177,604 | | 4.0 | % | | $ | 51,886 | | 2.3 | % |
The Company also has the ability to finance the rated securities it retains in securitizations through two repurchase facilities, each with an uncommitted amount of $200 million. At December 31, 2006, the Company owned $308.1 million of investment grade rated securities it retained from its securitizations under these facilities. The first facility is with Liquid Funding, Ltd., an affiliate of Bear Stearns Bank plc. The second facility is with Lehman Brothers, Inc. and Lehman Brothers Commercial Paper Inc. Each facility bears interest at an annual rate of LIBOR plus an additional percentage.
F-21
Outstanding securitization bond financing and weighted average interest rate by series as of December 31, 2006 and 2005 is as follows:
| | | | | | | | | | | | | |
| | | December 31, 2006 | | | December 31, 2005 | |
| | | Amount
Outstanding | | Weighted
Avg
Interest
Rate | | | Amount
Outstanding | | | Weighted
Avg
Interest
Rate | |
FMIT Series 2006-S1 | | $ | 164,763 | | 5.7 | % | | $ | — | | | — | |
FMIT Series 2006-3 | | | 800,298 | | 5.6 | % | | | — | | | — | |
FMIT Series 2006-2 | | | 728,748 | | 5.6 | % | | | — | | | — | |
FMIT Series 2006-1 | | | 795,077 | | 5.6 | % | | | — | | | — | |
FMIT Series 2005-3 | | | 870,905 | | 5.7 | % | | | 1,089,820 | | | 4.7 | % |
FMIT Series 2005-2 | | | 641,172 | | 5.7 | % | | | 872,455 | | | 4.7 | % |
FMIT Series 2005-1 | | | 350,102 | | 5.8 | % | | | 555,650 | | | 4.7 | % |
FMIT Series 2004-5 | | | 233,691 | | 6.1 | % | | | 595,481 | | | 4.9 | % |
FMIT Series 2004-4 | | | 153,971 | | 6.2 | % | | | 518,283 | | | 4.9 | % |
FMIT Series 2004-3 | | | 124,940 | | 6.5 | % | | | 523,296 | | | 4.9 | % |
FMIT Series 2004-21 | | | — | | — | % | | | 377,500 | | | 4.9 | % |
FMIT Series 2004-12 | | | — | | — | % | | | 233,977 | | | 5.0 | % |
FMIC Series 2003-13 | | | — | | — | % | | | 83,308 | | | 6.1 | % |
| | | | | | | | | | | | | |
| | | 4,863,667 | | 5.7 | % | | | 4,849,770 | | | 4.8 | % |
Unamortized bond discount | | | — | | | | | | (74 | ) | | | |
| | | | | | | | | | | | | |
Subtotal securitization bond financing | | | 4,863,667 | | | | | | 4,849,696 | | | | |
Liquid Funding repurchase facility4 | | | 111,787 | | | | | | 86,079 | | | | |
Lehman Brothers repurchase facility4 | | | 57,424 | | | | | | 62,845 | | | | |
| | | | | | | | | | | | | |
Total securitization financing | | $ | 5,032,878 | | | | | $ | 4,998,620 | | | | |
| | | | | | | | | | | | | |
1 | Series 2004-2 was called and paid in full in August 2006. |
2 | Series 2004-1 was called and paid in full in April 2006. |
3 | Series 2003-1 was called and paid in full in November 2006. |
4 | Facility remains open indefinitely, but may be terminated by either party at any time. |
Expected principal maturity of the securitization bond debt, which is based on expected loan prepayments, is as follows:
| | | |
December 31, | | Expected
Maturity |
2007 | | $ | 2,314,477 |
2008 | | | 1,494,473 |
2009 | | | 597,083 |
2010 | | | 457,634 |
| | | |
| | $ | 4,863,667 |
| | | |
The current carrying amount of the mortgage loans pledged to the trusts was $5.1 billion and $5.0 billion as of December 31, 2006 and 2005, respectively.
| (7) | Derivatives and Hedging Activities |
Derivatives Relating to Mortgage Loans Held for Sale
To mitigate the interest rate risk associated with non-conforming loans that are to be sold, the Company enters into treasury note forward sales contracts and interest rate lock commitments. These derivatives are recognized on the statements of condition at their fair value as a component of “Derivative assets.” Changes in the fair value on these derivative contracts are included as a component of “Gains on sales of mortgage loans, net” in the consolidated statements of operations. The amounts included in both the consolidated statements of condition and the consolidated statements of operations are immaterial to the financial statements taken as a whole.
F-22
Derivatives Relating to Mortgage Loans Held for Investment
In conjunction with the financing of its portfolio of loans held for investment, the Company entered into interest rate swaps designed to be economic hedges of the floating rate debt of the warehouse and securitization debt, including swaps entered in 2005 for which the Company paid a premium to contract at below the then-current interest rates. The premiums paid on the 2005 swaps were amortized in the consolidated statement of operations over the lives of the swaps.
As of December 31, 2006 the fair value of 16 interest rate swaps with positive fair values was $11.0 million and the fair value of 9 swaps with negative fair values was $3.1 million, for a net fair value of $7.8 million. As of December 31, 2005, the fair value of 26 interest rate swaps with positive fair values was $35.2 million and the fair value of three swaps with negative fair values was $0.2 million, for a net fair value of $35.0 million. The swaps are not classified as cash flow hedges under Statement No. 133, and therefore, mark to market valuation decreases of $27.2 million and increases of $9.0 million and $20.5 million have been included in current period earnings during the years ended December 31, 2006, 2005, and 2004, respectively.
In conjunction with the Company’s 2003-1 securitization, the Company purchased an interest rate cap agreement by paying a premium of $3.0 million, determined to be an economic hedge of the floating rate debt of the security. During the fourth quarter of 2005, the interest rate cap expired. The mark to market valuation decrease of $0.5 million has been included in earnings for the year ended December 31, 2005.
Cash settlements and non-cash changes in value that were included in “Other income —portfolio derivatives” for the years ended December 31, 2006, 2005 and 2004 are as follows:
| | | | | | | | | | | |
| | | Year Ended December 31, | |
| | | 2006 | | | 2005 | | 2004 | |
Non-cash changes in fair value | | $ | (27,224 | ) | | $ | 8,999 | | $ | 20,512 | |
Net cash settlements | | | 41,436 | | | | 24,470 | | | (11,723 | ) |
| | | | | | | | | | | |
Other income —portfolio derivatives | | $ | 14,212 | | | $ | 33,469 | | $ | 8,789 | |
| | | | | | | | | | | |
At December 31, 2006, 2005, and 2004, the notional balance of the Company’s interest rate swaps was $4.2 billion, $5.0 billion, and $3.7 billion, respectively.
| (8) | Discontinued Operations |
On January 13, 2006, the Company’s Board of Directors approved a plan to sell, close or otherwise dispose of the assets of its conforming retail and conforming wholesale segments. In February 2006, the assets pertaining to these segments’ headquarters, all wholesale offices, and certain of its retail offices were sold to third parties. The remaining assets of the conforming division were combined with the Company’s non-conforming retail offices, as described below in Note 9. The pre-tax loss on disposal was $0.9 million and is included in discontinued operations, net of income tax, in the condensed consolidated statements of operations.
The provisions of Statement No. 144 require the results of operations associated with these conforming wholesale and conforming retail offices to be classified as discontinued operations, net of income tax, and segregated from the Company’s continuing results of operations for all periods presented.
F-23
Operating results of discontinued operations, net of income tax, included in the condensed consolidated statements of operations for the years ended December 31, 2006, 2005, and 2004 are as follows:
| | | | | | | | | | | | |
| | | Year Ended December 31, | |
| | | 2006 | | | 2005 | | | 2004 | |
Revenues: | | | | | | | | | | | | |
Interest income | | $ | 839 | | | $ | 7,159 | | | $ | 5,144 | |
Interest expense | | | 657 | | | | 4,570 | | | | 2,225 | |
| | | | | | | | | | | | |
Net interest income | | | 182 | | | | 2,589 | | | | 2,919 | |
(Loss) gains on sales of mortgage loans | | | (188 | ) | | | 4,960 | | | | 9,369 | |
Other income | | | 41 | | | | 482 | | | | 1,813 | |
| | | | | | | | | | | | |
Total revenues | | | 35 | | | | 8,031 | | | | 14,110 | |
| | | | | | | | | | | | |
Expenses: | | | | | | | | | | | | |
| | | |
Salaries and employee benefits | | | 1,692 | | | | 7,295 | | | | 9,946 | |
Occupancy | | | 272 | | | | 955 | | | | 1,133 | |
Depreciation and amortization | | | 104 | | | | 227 | | | | 210 | |
General and administration | | | 727 | | | | 2,426 | | | | 3,698 | |
| | | | | | | | | | | | |
Total expenses | | | 2,795 | | | | 10,903 | | | | 14,987 | |
| | | | | | | | | | | | |
Discontinued operations before income taxes | | | (2,760 | ) | | | (2,872 | ) | | | (886 | ) |
Income tax benefit | | | 1,115 | | | | 1,160 | | | | 350 | |
| | | | | | | | | | | | |
Discontinued operations, net of income tax | | $ | (1,645 | ) | | $ | (1,712 | ) | | $ | (536 | ) |
| | | | | | | | | | | | |
The impact of discontinued operations on cash flows from operating, cash flows from investing and cash flows from financing activities are separately presented in the condensed consolidated statements of cash flows for the years ended December 31, 2006, 2005, and 2004.
The information presented below with respect to the Company’s reportable segments is consistent with the content of the business segment data reviewed by the Company’s management. This segment data uses a combination of business lines and channels to assess consolidated results. The Company has four reportable segments, which include two production segments, Wholesale and Retail, and two operating segments, Investment Portfolio and Corporate. Prior to the first quarter of 2006, the Company reported two additional production segments referred to as its Conforming Wholesale and Conforming Retail segments. In the first quarter of 2006, the Company’s Board of Directors approved a plan to sell, close or otherwise dispose of the assets of the Conforming Wholesale and Conforming Retail segments due to the decline in profitability of these segments. In February 2006, the Company sold the assets pertaining to these divisions’ headquarters, all wholesale offices, and certain of its retail offices to third parties. The remaining assets of the conforming segment, which included retail offices in Maryland and Virginia, have been combined with the non-conforming retail offices and will be reported as a component of the Company’s Retail segment. The following discussion of results reflects the Company’s current segment structure, while the results of its former Conforming Wholesale and Conforming Retail segments are reported as discontinued operations.
The Company originates loans through two production segments: a Wholesale segment which originates non-conforming loans and a Retail segment, which originates both non-conforming and conforming loans. The Investment Portfolio segment primarily includes the net interest income earned by the loans held for investment and the direct costs, including third party servicing fees, incurred to manage the portfolio. In addition, the Company has a Corporate segment that includes the reconciliation between actual revenues and costs reported in the Company’s consolidated financial statements presented in accordance with GAAP and the amounts allocated to the various segments. The Corporate segment also includes the effects of the deferral and capitalization of net origination costs as required by Statement of Financial Accounting Standards No. 91,“Accounting for Non-refundable Fees and Costs Associated with Originating or Acquiring Loans and Initial Direct Costs of Leases.” Financial information by segment is evaluated regularly by management and used in decision-making relating to the allocation of resources and the assessment of Company performance. For the purposes of segment information provided in the tables below, certain
F-24
fees, origination costs, and other expenses recorded as a component of “Gains on sale of mortgage loans, net,” have been reflected in total revenues or total expenses consistent with intercompany allocations reported to the Company’s management.
The assets of the Company that are specifically identified to a segment include mortgage loans held for sale and investment, net, trustee receivable, derivative assets, and furniture and equipment, net. All other assets are attributed to the Corporate segment. Total assets by segment at December 31, 2006 and 2005 are as follows:
| | | | | | |
| | | 2006 | | 2005 |
Production – Wholesale | | $ | 489,242 | | $ | 526,914 |
Production – Retail | | | 66,056 | | | 70,632 |
Investment Portfolio | | | 5,631,689 | | | 5,691,744 |
Corporate | | | 203,798 | | | 134,324 |
| | | | | | |
Total | | $ | 6,390,785 | | $ | 6,423,614 |
| | | | | | |
Operating results by business segment for the year ended December 31, 2006 is as follows:
| | | | | | | | | | | | | | | | | | | | |
| | | Production | | | Investment Portfolio | | | Corporate2 | | | Consolidated | |
| | | Wholesale | | | Retail | | | | |
Revenues: | | | | | | | | | | | | | | | | | | | | |
Interest income | | $ | 32,634 | | | $ | 4,757 | | | $ | 409,675 | | | $ | (6,340 | ) | | $ | 440,726 | |
Interest expense | | | 21,246 | | | | 3,162 | | | | 319,961 | | | | (7,809 | ) | | | 336,560 | |
| | | | | | | | | | | | | | | | | | | | |
Net interest income | | | 11,388 | | | | 1,595 | | | | 89,714 | | | | 1,469 | | | | 104,166 | |
Provision for loan losses—loans held for investment | | | — | | | | — | | | | (69,062 | ) | | | — | | | | (69,062 | ) |
Gains (losses) on sales of mortgage loans, net | | | 82,276 | | | | 31,239 | | | | — | | | | (96,468 | ) | | | 17,047 | |
Other income—portfolio derivatives | | | — | | | | — | | | | 14,212 | | | | — | | | | 14,212 | |
Other income (expense) | | | — | | | | 1,140 | | | | (3,425 | ) | | | (177 | ) | | | (2,462 | ) |
| | | | | | | | | | | | | | | | | | | | |
Total revenues | | | 93,664 | | | | 33,974 | | | | 31,439 | | | | (95,176 | ) | | | 63,901 | |
| | | | | | | | | | | | | | | | | | | | |
Direct expenses1 | | | 75,463 | | | | 32,902 | | | | 11,592 | | | | 23,707 | | | | 143,664 | |
Corporate overhead allocation | | | 21,824 | | | | 3,406 | | | | — | | | | (25,230 | ) | | | — | |
| | | | | | | | | | | | | | | | | | | | |
Total expenses | | | 97,287 | | | | 36,308 | | | | 11,592 | | | | (1,523 | ) | | | 143,664 | |
| | | | | | | | | | | | | | | | | | | | |
(Loss) income from continuing operations before income taxes | | | (3,623 | ) | | | (2,334 | ) | | | 19,847 | | | | (93,653 | ) | | | (79,763 | ) |
Income tax benefit | | | — | | | | — | | | | — | | | | 13,023 | | | | 13,023 | |
| | | | | | | | | | | | | | | | | | | | |
(Loss) income from continuing operations | | $ | (3,623 | ) | | $ | (2,334 | ) | | $ | 19,847 | | | $ | (80,630 | ) | | | (66,740 | ) |
| | | | | | | | | | | | | | | | | | | | |
Discontinued operations, net of income tax | | | | | | | | | | | | | | | | | | | (1,645 | ) |
| | | | | | | | | | | | | | | | | | | | |
Net loss | | | | | | | | | | | | | | | | | | $ | (68,385 | ) |
| | | | | | | | | | | | | | | | | | | | |
F-25
Operating results by business segment for the year ended December 31, 2005 are as follows:
| | | | | | | | | | | | | | | | | | | |
| | | Production | | | Investment Portfolio | | | Corporate2 | | | Consolidated | |
| | | Wholesale | | Retail | | | | |
Revenues: | | | | | | | | | | | | | | | | | | | |
Interest income | | $ | 33,206 | | $ | 4,688 | | | $ | 344,521 | | | $ | (6,799 | ) | | $ | 375,616 | |
Interest expense | | | 19,058 | | | 2,670 | | | | 198,688 | | | | (8,506 | ) | | | 211,910 | |
| | | | | | | | | | | | | | | | | | | |
Net interest income | | | 14,148 | | | 2,018 | | | | 145,833 | | | | 1,707 | | | | 163,706 | |
Provision for loan losses—loans held for investment | | | — | | | — | | | | (30,065 | ) | | | — | | | | (30,065 | ) |
Gains (losses) on sales of mortgage loans, net | | | 117,578 | | | 34,645 | | | | — | | | | (91,025 | ) | | | 61,198 | |
Other income—portfolio derivatives | | | — | | | — | | | | 33,469 | | | | — | | | | 33,469 | |
Other income (expense) | | | — | | | 1,995 | | | | (1,363 | ) | | | 300 | | | | 932 | |
| | | | | | | | | | | | | | | | | | | |
Total revenues | | | 131,726 | | | 38,658 | | | | 147,874 | | | | (89,018 | ) | | | 229,240 | |
| | | | | | | | | | | | | | | | | | | |
Direct expenses1 | | | 77,723 | | | 37,646 | | | | 10,007 | | | | (1,907 | ) | | | 123,469 | |
Corporate overhead allocation | | | 23,067 | | | 3,909 | | | | — | | | | (26,976 | ) | | | — | |
| | | | | | | | | | | | | | | | | | | |
Total expenses | | | 100,790 | | | 41,555 | | | | 10,007 | | | | (28,883 | ) | | | 123,469 | |
| | | | | | | | | | | | | | | | | | | |
Income (loss) from continuing operations before income taxes | | | 30,936 | | | (2,897 | ) | | | 137,867 | | | | (60,135 | ) | | | 105,771 | |
Income tax expense | | | — | | | — | | | | — | | | | (4,669 | ) | | | (4,669 | ) |
| | | | | | | | | | | | | | | | | | | |
Income (loss) from continuing operations | | $ | 30,936 | | $ | (2,897 | ) | | $ | 137,867 | | | $ | (64,804 | ) | | | 101,102 | |
| | | | | | | | | | | | | | | | | | | |
Discontinued operations, net of income tax | | | | | | | | | | | | | | | | | | (1,712 | ) |
| | | | | | | | | | | | | | | | | | | |
Net income | | | | | | | | | | | | | | | | | $ | 99,390 | |
| | | | | | | | | | | | | | | | | | | |
Operating results by business segment for the year ended December 31, 2004 are as follows:
| | | | | | | | | | | | | | | | | | | |
| | | Production | | | Investment Portfolio | | | Corporate2 | | | Consolidated | |
| | | Wholesale | | Retail | | | | |
Revenues: | | | | | | | | | | | | | | | | | | | |
Interest income | | $ | 17,210 | | $ | 3,138 | | | $ | 206,460 | | | $ | (176 | ) | | $ | 226,632 | |
Interest expense | | | 2,937 | | | 694 | | | | 69,039 | | | | (358 | ) | | | 72,312 | |
| | | | | | | | | | | | | | | | | | | |
Net interest income | | | 14,273 | | | 2,444 | | | | 137,421 | | | | 182 | | | | 154,320 | |
Provision for loan losses—loans held for investment | | | — | | | — | | | | (21,556 | ) | | | — | | | | (21,556 | ) |
Gains (losses) on sales of mortgage loans, net | | | 134,028 | | | 41,887 | | | | — | | | | (133,137 | ) | | | 42,778 | |
Other income—portfolio derivatives | | | — | | | — | | | | 8,789 | | | | — | | | | 8,789 | |
Other income (expense) | | | — | | | 1,497 | | | | (45 | ) | | | 449 | | | | 1,901 | |
| | | | | | | | | | | | | | | | | | | |
Total revenues | | | 148,301 | | | 45,828 | | | | 124,609 | | | | (132,506 | ) | | | 186,232 | |
| | | | | | | | | | | | | | | | | | | |
Direct expenses1 | | | 81,677 | | | 41,570 | | | | 7,697 | | | | (15,128 | ) | | | 115,816 | |
Corporate overhead allocation | | | 31,508 | | | 4,596 | | | | — | | | | (36,104 | ) | | | — | |
| | | | | | | | | | | | | | | | | | | |
Total expenses | | | 113,185 | | | 46,166 | | | | 7,697 | | | | (51,232 | ) | | | 115,816 | |
| | | | | | | | | | | | | | | | | | | |
Income (loss) from continuing operations before income taxes | | | 35,116 | | | (338 | ) | | | 116,912 | | | | (81,274 | ) | | | 70,416 | |
Income tax expense | | | — | | | — | | | | — | | | | (6,284 | ) | | | (6,284 | ) |
| | | | | | | | | | | | | | | | | | | |
Income (loss) from continuing operations | | $ | 35,116 | | $ | (338 | ) | | $ | 116,912 | | | $ | (87,558 | ) | | | 64,132 | |
| | | | | | | | | | | | | | | | | | | |
Discontinued operations, net of income tax | | | | | | | | | | | | | | | | | | (536 | ) |
| | | | | | | | | | | | | | | | | | | |
Net income | | | | | | | | | | | | | | | | | $ | 63,596 | |
| | | | | | | | | | | | | | | | | | | |
1 | The direct expenses of our Investment Portfolio include the allocation of corporate overhead, which is assessed to that segment through the transfer pricing of loans from the production segments. |
2 | Corporate direct expenses, which includes adjustments necessary to conform with GAAP, vary based on origination volumes and the associated GAAP adjustments. Also, corporate direct expenses in 2006 include the $10.6 million litigation settlement. |
In 2003, the Company elected to be taxed as a Real Estate Investment Trust (REIT) under Section 856(c) of the Internal Revenue Code. As a REIT, FIC generally is not subject to federal income tax. To maintain its qualification as
F-26
a REIT, FIC must distribute at least 90% of its REIT taxable income to its stockholders and meet certain other tests relating to assets and income. If FIC fails to qualify as a REIT in any taxable year, FIC will be subject to federal income tax on its taxable income at regular corporate rates. FIC may also be subject to certain state and local taxes. Under certain circumstances, even though FIC qualifies as a REIT, federal income and excise taxes may be due on its undistributed taxable income. No provision for income taxes has been provided in the accompanying financial statements related to the REIT, because FIC has paid or will pay dividends in amounts approximating its taxable income.
At the time of electing to be taxed as a REIT, the Company elected to treat FMC as a TRS. A TRS is a corporation that is permitted to engage in non-qualifying REIT activities. Taxable income of a TRS is subject to federal, state, and local income taxes.
As of December 31, 2006 and 2005, an income tax receivable of $6.2 million and $1.1 million, respectively, was recorded as a component of accounts receivable in the consolidated statements of condition. For the year ended December 31, 2006, the receivable primarily relates to the taxable net operating loss generated by the TRS during 2006. The net operating loss will be carried back for two years and generate a refund of approximately $6.3 million. An additional $14.1 million representing the tax benefit related to the future carryforward of the remaining 2006 TRS net operating loss is a component of “Deferred tax asset” in the consolidated statement of condition as of December 31, 2006. For the year ended December 31, 2005, the receivable primarily relates to the overpayment of estimated state and federal income taxes for the TRS.
In 2005, the Company established a deferred tax asset related to the deferral of income tax expense on the gain on loans sold inter-company from the TRS to the REIT in the second quarter of 2005. In 2006, the Company established a deferred tax asset related to the deferral of income tax benefit on the valuation write-down of loans sold inter-company from the TRS to the REIT in the third quarter of 2006.
Income tax benefit (expense) for the years ending December 31, 2006, 2005, and 2004 consists of the following:
| | | | | | | | | | | | |
| | | Current | | | Deferred | | | Total | |
Year ended December 31, 2006: | | | | | | | | | | | | |
Federal | | $ | 15,754 | | | $ | (3,856 | ) | | $ | 11,898 | |
State and Local | | | 3,753 | | | | (1,513 | ) | | | 2,240 | |
| | | | | | | | | | | | |
Total | | $ | 19,507 | | | $ | (5,369 | ) | | $ | 14,138 | |
| | | | | | | | | | | | |
Year ended December 31, 2005: | | | | | | | | | | | | |
Federal | | $ | (3,465 | ) | | $ | (16 | ) | | $ | (3,481 | ) |
State and Local | | | (100 | ) | | | 72 | | | | (28 | ) |
| | | | | | | | | | | | |
Total | | $ | (3,565 | ) | | $ | 56 | | | $ | (3,509 | ) |
| | | | | | | | | | | | |
Year ended December 31, 2004: | | | | | | | | | | | | |
Federal | | $ | (1,896 | ) | | $ | (3,099 | ) | | $ | (4,995 | ) |
State and Local | | | (488 | ) | | | (451 | ) | | | (939 | ) |
| | | | | | | | | | | | |
Total | | $ | (2,384 | ) | | $ | (3,550 | ) | | $ | (5,934 | ) |
| | | | | | | | | | | | |
F-27
A reconciliation of the statutory federal and state income tax rates to the Company’s effective income tax rates for the years ending December 31, 2006, 2005, and 2004 is as follows:
| | | | | | | | | |
| | | 2006 | | | 2005 | | | 2004 | |
Federal statutory rate | | 35.0 | % | | (35.0 | )% | | (34.0 | )% |
State income tax rate (net of federal benefit) | | 4.5 | | | — | | | (5.4 | ) |
Non-deductible expenses | | (0.7 | ) | | (0.1 | ) | | — | |
Non-taxable REIT GAAP income (loss) | | (21.5 | ) | | 32.0 | | | 33.7 | |
Change in deferred tax asset related to intercompany loan sales | | (1.3 | ) | | (0.3 | ) | | (2.8 | ) |
Other miscellaneous | | 1.1 | | | — | | | — | |
| | | | | | | | | |
Effective income tax rate | | 17.1 | % | | (3.4 | )% | | (8.5 | )% |
| | | | | | | | | |
The tax effects of temporary differences that give rise to significant portions of the deferred tax assets and deferred tax liabilities at December 31, 2006, and 2005 are presented below.
| | | | | | | | |
| ($ in 000s) | | 2006 | | | 2005 | |
Deferred tax asset: | | | | | | | | |
Reserve for losses | | $ | 11,530 | | | $ | 14,737 | |
TRS carryforward benefit | | | 14,100 | | | | — | |
Mark to market on loans held for sale | | | (133 | ) | | | 3,036 | |
Deferred tax expense related to intercompany sale of loans | | | 1,564 | | | | 1,427 | |
Other | | | 217 | | | | 897 | |
| | | | | | | | |
Total gross deferred tax assets | | | 27,278 | | | | 20,097 | |
| | | | | | | | |
Deferred tax liability: | | | | | | | | |
Net deferred origination costs | | | (710 | ) | | | (625 | ) |
Furniture and equipment depreciation | | | (158 | ) | | | (1,793 | ) |
| | | | | | | | |
Total deferred tax liabilities | | | (868 | ) | | | (2,418 | ) |
| | | | | | | | |
Total deferred tax asset, net | | $ | 26,410 | | | $ | 17,679 | |
| | | | | | | | |
Management regularly assesses the recoverability of the deferred tax assets based on projections of future operating results and management’s tax planning strategies. Based on this evaluation, management believes that all of the deferred tax assets recorded in the consolidated financial statements at December 31, 2006 are more likely than not of being recoverable. Management did not include the affects, if any, of the proposed merger with C-BASS during its evaluation of the recoverability of the deferred tax asset.
In February 2005, the Securities and Exchange Commission declared effective the Company’s Registration Statement on Form S-11 relating to the resale of 43,328,933 shares of its common stock that were originally issued and sold in the private placement offering in November and December 2003. On February 3, 2005 the Company’s common stock began trading on the NASDAQ Global Select Market. In connection with the Registration Statement, the Company incurred $0.4 million and $1.7 million of costs for the year ended December 31, 2005 and 2004, respectively. No additional expenses were incurred in the year ended December 31, 2006.
In November 2005, the Board of Directors authorized the repurchase of up to $40.0 million of outstanding common shares under a stock repurchase program. Subject to applicable securities laws, purchase decisions were made based upon market conditions and other factors from time to time through December 31, 2006 in the open market at prevailing market prices or through negotiated private transactions, at management’s discretion, and subject to the Company’s regular guidelines relating to trading periods. During the fourth quarter of 2005, the Company repurchased 296,000 shares of common stock under the stock repurchase program at an average cost of $11.28 per share. During the second quarter of 2006, the Company repurchased 1,632,000 shares of common stock under the stock repurchase program at an average cost of $10.28 per share. No other repurchases were made during 2006, and the authorization has expired as of December 31, 2006.
F-28
| (12) | Earnings (Loss) Per Share |
Information relating to the calculations of earnings (loss) per share of common stock for the years ended December 31, 2006, 2005, and 2004 is as follows:
| | | | | | | | | | | | |
| | | Year Ended December 31, | |
| | | 2006 | | | 2005 | | | 2004 | |
| Earnings per share-basic and diluted: | | | | | | | | | | | | |
(Loss) income from continuing operations | | $ | (66,740 | ) | | $ | 101,102 | | | $ | 64,132 | |
Dividends on nonvested restricted stock | | | (342 | ) | | | (591 | ) | | | (571 | ) |
| | | | | | | | | | | | |
(Loss) income from continuing operations available to common shareholders | | | (67,082 | ) | | | 100,511 | | | | 63,561 | |
Discontinued operations, net of income tax | | | (1,645 | ) | | | (1,712 | ) | | | (536 | ) |
| | | | | | | | | | | | |
Net (loss) income available to common shareholders | | $ | (68,727 | ) | | $ | 98,799 | | | $ | (63,025 | ) |
| | | | | | | | | | | | |
Weighted average shares outstanding- basic | | | 47,304,189 | | | | 48,449,872 | | | | 48,328,271 | |
Weighted average shares outstanding- diluted | | | 47,304,189 | | | | 48,464,445 | | | | 48,370,502 | |
(Loss) earnings per share- basic and diluted: | | | | | | | | | | | | |
Continuing operations | | $ | (1.42 | ) | | $ | 2.07 | | | $ | 1.31 | |
Discontinued operations | | | (0.03 | ) | | | (0.03 | ) | | | (0.01 | ) |
| | | | | | | | | | | | |
Total | | $ | (1.45 | ) | | $ | 2.04 | | | $ | 1.30 | |
| | | | | | | | | | | | |
Effects of potentially dilutive securities are presented only in periods in which they are dilutive. For the year ended December 31, 2006, 894,500 stock options (with strike prices of $11.60 to $19.25) and 137,500 shares of unvested restricted stock were excluded from the calculation of diluted earnings per share. For the year ended December 31, 2005, 826,500 stock options (with strike prices of $12.70 to $19.25), and 240,000 shares of unvested restricted stock were excluded from the calculation of diluted earnings per share, as their effect was anti-dilutive. For the year ended December 31, 2004, 46,000 stock options (with a strike price of $19.25) and 396,250 shares of unvested restricted stock were excluded from the calculation of diluted earnings per share, as their effect was anti-dilutive. For the year ended December 31, 2005, 65,040 performance shares were included in the calculation of diluted earnings per share as their effect was dilutive. For the year ended December 31, 2004, 715,600 stock options (with strike prices of $15.00 to $15.25) were included in the calculation of diluted earnings per share as their effect was dilutive.
| (13) | Stock-Based Compensation |
Under the Company’s Equity Incentive Plan (the Stock Plan) approved by the Board of Directors and shareholders in November 2003, an aggregate of 2.7 million of share options or shares of the Company’s stock may be awarded to employees, outside directors and consultants, and to any other individual whose participation in the plan is determined to be in the best interests of the Company by the Compensation Committee of FIC’s Board of Directors. Awards of common stock will be made with currently authorized but unissued common stock.
As of January 1, 2006, the Company adopted Statement of Financial Accounting Standards No. 123R,“Share-Based Payment,”(Statement No. 123R). In accordance with Statement No. 123R, the Company expenses its stock-based compensation over the applicable vesting period by applying the fair value method to stock-based compensation. The Company had elected to expense its stock-based compensation by applying the fair value method to stock-based compensation in accordance with Financial Accounting Standards No. 123,“Accounting for Stock-Based Compensation”(Statement No. 123) prior to the adoption of Statement No. 123R. Accordingly, the adoption of Statement No. 123R did not have a material effect on the Company’s consolidated statements of operations or cash flows. In accordance with Statement No. 123R, the balance of unearned compensation that was included in the Company’s consolidated statements of condition as of January 1, 2006 has been reclassified as a reduction of paid-in capital.
The Company recognized $2.2 million, $1.8 million, and $2.2 million in “Salaries and employee benefits” expense in the accompanying consolidated statements of operations for the years ended December 31, 2006, 2005, and 2004, respectively, related to stock based compensation. The income tax benefit related to these expenses was $0.2 million, $0.7 million, and $0.8 million for the years ended December 31, 2006, 2005, and 2004, respectively. The income tax benefit was generated by the portion of the stock based compensation expense recorded related to FMC, as FIC is tax exempt.
F-29
Under the Stock Plan, the exercise price of each stock option may not be less than 100% of the fair market value of the common stock on the date of grant. Stock options typically vest ratably over a four-year period with a term fixed by the Compensation Committee of the Board of Directors (Compensation Committee) not to exceed ten years from the date of grant. Stock options with accompanying dividend equivalent rights (Options with DERs) typically cliff vest approximately four years from the date of grant with a term fixed by the Compensation Committee not to exceed seven years from the date of grant. The fair value of each option award is estimated on the date of grant using the Black-Scholes option pricing model, which takes into account the exercise price and expected life of the option, the underlying stock’s expected volatility and expected dividends, and the risk-free interest rate for the expected term of the option. The Company estimates the expected life of the options to be contractual term of the option, the expected volatility to be the historical volatility on the date of grant, and the expected dividend yield to be the historical dividend yield (adjusted for Options with DERs) based on its historical experience. The Company estimates the interest free interest rate to be the U.S. Government treasury bill rate.
In February 2006, the Compensation Committee granted a total of 162,000 non-qualified options with DERs to certain key officers and employees pursuant to the Stock Plan. The exercise price of the grants was $11.90 per share and $11.60 per share as of February 16, 2006 and February 21, 2006, respectively, which was the closing price of the Company’s common stock on the date of each grant. All of the options vest on March 31, 2010 with a term expiring on March 31, 2013. While the option is nonvested, dividend equivalents are earned based on the number of option shares held and are deemed invested in phantom shares of the Company’s common stock at the closing price of the stock on the dividend payment date. The phantom shares also will be credited with dividend equivalent rights at the same time and in the same amount as cash dividends are paid on the Company’s common stock. The total value of dividend equivalents, adjusted for the change in value of the phantom shares from date of issuance through vest date, will be paid in cash at the time the option vests.
The following table summarizes the weighted average grant date fair value of the options (options granted in 2005 and 2006 were Options with DERs) granted during the years ended December 31, 2006, 2005, and 2004 and the assumptions used in applying the Black-Scholes option pricing model.
| | | | | | | | | | | | |
| | | 2006 | | | 2005 | | | 2004 | |
Fair value at date of grant | | $ | 4.71 | | | $ | 2.30 | | | $ | 1.85 | |
Expected life in years | | | 5.5 | | | | 9 | | | | 10 | |
Annual risk-free interest rate | | | 4.6 | % | | | 4.21 | % | | | 4.25 | % |
Expected volatility | | | 35 | % | | | 38 | % | | | 40 | % |
Expected forfeitures | | | 20 | % | | | 20 | % | | | 10 | % |
Expected dividend yield | | | 0 | % | | | 8 | % | | | 10 | % |
F-30
Stock option activity for the year ended December 31, 2006 is as follows:
| | | | | | | | | | | |
Options | | Shares | | | Weighted
Average
Exercise Price | | Weighted
Average
Remaining
Contractual Term | | Aggregate Intrinsic Value |
Outstanding at January 1, 2004 | | 748,000 | | | $ | 15.00 | | 9.9 | | $ | 1,361 |
Granted | | 61,000 | | | | 18.27 | | 9.3 | | | 88 |
Exercised | | (14,400 | ) | | | 15.00 | | 8.9 | | | 26 |
Forfeited or expired | | (33,000 | ) | | | 15.00 | | 8.9 | | | 56 |
| | | | | | | | | | | |
Outstanding at December 31, 2004 | | 761,600 | | | | 15.26 | | 8.9 | | $ | 1,411 |
Granted | | 138,400 | | | | 12.70 | | 6.3 | | | 622 |
Exercised | | (2,500 | ) | | | 15.00 | | 7.9 | | | 5 |
Forfeited or expired | | (71,000 | ) | | | 14.94 | | 7.9 | | | 126 |
| | | | | | | | | | | |
Outstanding at December 31, 2005 | | 826,500 | | | | 14.86 | | 7.6 | | $ | 1,902 |
Granted | | 162,000 | | | | 11.63 | | 6.3 | | | 764 |
Forfeited or expired | | (94,000 | ) | | | 14.75 | | 6.8 | | | 195 |
| | | | | | | | | | | |
Outstanding at December 31, 2006 | | 894,500 | | | | 14.28 | | 6.6 | | $ | 2,471 |
Vested at December 31, 2006 or expected to vest | | 849,900 | | | $ | 14.29 | | 6.6 | | $ | 2,354 |
| | | | | | | | | | | |
Exercisable at December 31, 2006 | | 449,700 | | | $ | 15.33 | | 6.9 | | $ | 837 |
| | | | | | | | | | | |
The weighted average exercise price of the 162,000 options granted during the year ended December 31, 2006 was $11.63 per share.
Total compensation expense relating to nonvested stock options of $0.4 million was recorded as a component of “Salaries and employee benefits” for the year ended December 31, 2006. Compensation expense of $0.3 million was recorded as a component of “Salaries and employee benefits” for each of the years ended December 31, 2005 and 2004 relating to the nonvested stock options. As of December 31, 2006, there was $0.8 million of unrecognized compensation cost related to nonvested stock options granted under the Stock Plan.
In accordance with Statement No. 123R, the Company estimates the forfeitures of nonvested options that are expected to occur, and recognizes compensation expense based on the fair value of the options that are expected to vest. Prior to the second quarter of 2006, the Company had estimated that 20% of all options issued would be forfeited prior to vesting. Actual forfeitures have been tracked against this estimate. During the second quarter of 2006, the number of options actually forfeited exceeded the Company’s original estimate of 20%. Based on this review of actual forfeitures to date, the Company has revised its estimate and now estimates that 30% of all options granted will be forfeited prior to vesting. This revision in estimate reduces the total expected amount of compensation expense to be recorded for stock options that have been granted by $0.3 million. The impact of this revision in the accompanying consolidated statement of operations is a $0.1 million reduction in compensation expense for the year ended December 31, 2006.
Stock options outstanding and exercisable stock options as of December 31, 2006 are as follows:
| | | | | | | |
Options Outstanding | | Remaining
Contractual
Life in Years | | Exercise Price | | Options
Exercisable |
543,600 | | 6.9 | | $ | 15.00 | | 407,700 |
46,000 | | 7.2 | | | 19.25 | | 34,500 |
15,000 | | 7.6 | | | 15.25 | | 7,500 |
131,900 | | 5.3 | | | 12.70 | | — |
158,000 | | 6.3 | | | 11.60 | | — |
| | | | | | | | |
894,500 | | | | | | | 449,700 |
| | | | | | | | |
F-31
On February 16, 2006, the Compensation Committee, pursuant to the Stock Plan, granted 45,000 shares of restricted stock to the Company’s newly appointed chief financial officer, valued at $11.90 per share. The restricted stock vests ratably over a four-year period beginning December 31, 2006.
On February 21, 2006, the Compensation Committee awarded a maximum of 83,400 shares of restricted stock to certain of the Company’s senior officers pursuant to the Stock Plan. These shares are subject to the achievement of certain corporate performance objectives (the performance shares). The performance shares were valued at $8.35 per share, with any earned performance shares to vest on March 31, 2010. The performance shares are shares of restricted stock that are subject to vesting requirements and can be earned based primarily on the Company’s achievement of certain return on equity targets for the period January 1, 2006 through December 31, 2007.
The Compensation Committee had previously awarded a maximum of 65,040 performance shares to senior officers on June 22, 2005. The performance period for these shares ended December 31, 2006, and the shares were not earned.
All of the restricted stock awards are expensed on a straight-line method over the scheduled vesting period. Total compensation expense of $1.8 million was recorded as a component of “Salaries and employee benefits” for the year ended December 31, 2006, relating to the nonvested restricted stock. Compensation expense of $1.5 million and $1.9 million, respectively, was recorded as a component of “Salaries and employee benefits” for the years ended December 31, 2005 and 2004 relating to the nonvested restricted stock. As of December 31, 2006, there was $2.2 million of total unrecognized compensation cost related to nonvested restricted stock granted under the Stock Plan, which is expected to be recognized over a period of approximately three years.
A summary of the Company’s nonvested restricted stock and changes during the year ended December 31, 2006 is presented below:
| | | | | | |
Nonvested Restricted Stock | | Shares | | | Weighted
Average
Grant Date
Fair Value |
Outstanding at January 1, 2004 | | 510,000 | | | $ | 15.00 |
Granted | | 30,000 | | | | 17.92 |
Vested | | (128,750 | ) | | | 15.17 |
Forfeited | | (15,000 | ) | | | 15.00 |
| | | | | | |
Outstanding at December 31, 2004 | | 396,250 | | | | 15.17 |
Granted | | — | | | | — |
Vested | | (118,750 | ) | | | 15.18 |
Forfeited | | (37,500 | ) | | | 15.00 |
| | | | | | |
Outstanding at December 31, 2005 | | 240,000 | | | | 15.18 |
Granted | | 45,000 | | | | 11.90 |
Vested | | (112,500 | ) | | | 14.88 |
Forfeited | | (35,000 | ) | | | 15.00 |
| | | | | | |
Outstanding at December 31, 2006 | | 137,500 | | | $ | 15.08 |
| | | | | | |
F-32
| (14) | Commitments and Contingencies |
As of December 31, 2006 and 2005, the Company had origination commitments outstanding to fund approximately $541.5 million and $422.0 million in mortgage loans, respectively. Fixed rate and hybrid ARM mortgages which are fixed for the initial two to three year term of the loan comprised approximately 100% and 97.0%, respectively, of the outstanding origination commitments. The Company had forward delivery commitments of approximately $0.9 billion and $1.3 billion as of December 31, 2006 and 2005, respectively, of which $45.0 million and $26.6 million, respectively, were mandatory sales of mortgage-backed securities and mandatory investor whole loan trades. Treasury note forward contracts, used to economically hedge the interest rate risk of non-conforming loans, comprised $0.9 billion and $0.6 billion of the forward delivery commitments as of December 31, 2006 and 2005, respectively.
The Company has entered into agreements to lease office space. The remaining future minimum lease payments under the non-cancelable leases are as follows:
| | | |
2007 | | $ | 6,907 |
2008 | | | 5,605 |
2009 | | | 4,825 |
2010 | | | 2,608 |
2011 | | | 275 |
| | | |
Total | | $ | 20,220 |
| | | |
Rent expense was $7.7 million, $7.2 million, and $6.8 million for the years ended December 31, 2006, 2005, and 2004, respectively.
The Company has entered into agreements to lease office equipment. The remaining minimum lease payments are as follows:
| | | |
2007 | | $ | 346 |
2008 | | | 274 |
2009 | | | 73 |
| | | |
Total | | $ | 693 |
| | | |
Equipment lease expense was $0.5 million, $0.6 million, and $0.6 million for the years ended December 31, 2006, 2005, and 2004, respectively.
In addition to the proceedings discussed below, the Company is subject to various legal proceedings in the ordinary course of business related to foreclosures, bankruptcies, condemnation, title claims, quiet title actions and alleged statutory and regulatory violations. Management believes that any liability with respect to these various legal actions, individually or in the aggregate, will not have a material adverse effect on the Company’s business, results of operations, financial position, or cash flows. However, if an unfavorable ruling were to occur in one or more of these proceedings, there exists the possibility of a material adverse impact on the Company’s financial condition and results of operations.
F-33
Shareholder Litigation:
On March 1, 2007, a purported stockholder class action lawsuit related to the Company’s proposed merger with C-BASS was filed in the Circuit Court for Howard County, Maryland, naming the Company, and each of its directors and C-BASS as defendants. The lawsuit,Richard Tibbets v. Fieldstone Investment Corporation, et al (Case No. 13-C-07-68321), alleges, among other things, that $5.53 per share in cash to be paid to common stockholders in connection with the merger is inadequate, that the individual director defendants breached their fiduciary duties to common stockholders in negotiating and approving the merger agreement and have breached the duty of candor by failing to provide shareholders information adequate to make an informed voting decision in connection with the merger, and that the Company and C-BASS aided and abetted the director defendants in such alleged breach. The complaint seeks the following relief: (i) a declaration that the lawsuit is properly maintainable as a class action and certification of the plaintiff as a class representative; (ii) a declaration that the director defendants have breached their fiduciary duties owed to the plaintiff and other members of the class, and that the Company and C-BASS aided and abetted such breaches; (iii) an injunction of the merger; (iv) requiring the Company’s Board of Directors to obtain the best possible price in connection with a possible sale of Fieldstone; and (v) an award of attorneys’ and experts’ fees to the plaintiff.
Due to the inherent uncertainties of the judicial process, the Company is unable to predict the outcome of this matter. While the Company intends to vigorously defend this claim and believes it has meritorious defenses available, there can be no assurance that an adverse outcome would not have a material effect on the Company’s results of operations, financial condition, or cash flows.
Hill Litigation:
Hill, et al. v. Fieldstone Mortgage Company, et al. is a class action filed on January 16, 2002 in the Circuit Court for Baltimore City by plaintiffs, who are two individuals who obtained a second mortgage loan from Fieldstone Mortgage in 1998, in the amount of $28,000, secured by their residence, against Fieldstone Mortgage and ten other mortgage lenders that plaintiffs contend are or were the assignees of second mortgage loans in Maryland made by Fieldstone Mortgage. The lawsuit alleges, among other things, that (i) the defendants violated the Maryland Second Mortgage Loan Law, or SMLL, by failing to obtain the necessary license to provide a second mortgage loan and by charging fees unauthorized by the SMLL, and (ii) the defendants violated the Maryland Consumer Protection Act by engaging in conduct contrary to the provisions of the SMLL. The plaintiffs seek a declaratory judgment that their mortgage contract is illegal and, therefore, that they do not need to honor their obligation to repay the second mortgage loan. The plaintiffs also seek monetary damages in the amount of $300,000. Fieldstone Mortgage, and each of the other defendants, filed motions to dismiss asserting that, among other things, the plaintiffs’ claims are barred by the applicable three-year statute of limitations, the plaintiffs’ failed to properly plead a claim under the Maryland Consumer Protection Act, and the plaintiffs’ request for a judicial declaration that their mortgage contract is illegal is not a remedy available under either Maryland statutory or common law. The circuit court heard oral arguments on the motions to dismiss in January 2003. This lawsuit was consolidated with 14 other class actions with identical claims against other mortgage lenders. No motion for class certification has yet been filed in this case. On March 30, 2006, the court held a status conference with regard to this matter and requested supplemental briefings on the outstanding issues from the parties. On August 25, 2006, the court dismissed this case as to all lenders, claiming that plaintiff’s arguments were timed-barred by the Statute of Limitations. The plaintiffs have appealed this ruling.
Due to the inherent uncertainties of the judicial process, the Company is unable to predict the outcome of this matter. While the Company intends to continue to vigorously defend this claim and believe it has meritorious defenses available, there can be no assurance that an adverse outcome would not have a material effect on the Company’s results of operations, financial condition, or cash flows.
Arredondo Litigation:
Arredondo, et al. v. Fieldstone Investment, et al.,is an action filed on August 3, 2004 in the United States District Court for the District of Arizona by nine former employees of Fieldstone Mortgage alleging that their supervisors and co-workers created a hostile work environment resulting from gender discrimination, racial discrimination and retaliation in the workplace pursuant to Title VII of the Civil Rights Act of 1964, 42 U.S.C. §2000e, and the Civil Rights Act of 1866, 42 U.S.C. §1981, as amended by the Civil Rights Act of 1991, 42 U.S.C. §1981(a). Plaintiffs claim that they are entitled to money damages in the form of back pay and front pay and nominal, compensatory and punitive damages, costs and attorney fees and equitable relief. The Company filed its answer denying all relevant claims on August 25, 2004 and filed a variety of motions seeking to have some of the plaintiffs dismissed from the lawsuit for failure to exhaust their administrative remedies, to dismiss other claims as not being permitted under the statute, and finally to sever the plaintiffs for trial purposes. Plaintiffs filed a response to the motion to dismiss, sever or in the alternative, bifurcate, and on April 18, 2005, the motion to dismiss was denied. In December 2005, one of the named plaintiffs, Berrinda Arredondo, requested and was dismissed from the litigation. In
F-34
October 2006, another plaintiff requested to be and was dismissed from the litigation. The discovery cutoff date was May 31, 2006. A trial date, which was originally scheduled for November 2005, has been rescheduled by the court for April 2007. Also in October 2006, the court granted in part the Company’s motion to stay the proceedings while the parties proceed with mediation. Mediation is scheduled for mid-March 2007.
Due to the uncertain nature of this litigation at this time, the Company is unable to estimate the probable outcome of this matter. The plaintiffs in this matter have not fully specified damages sought and therefore management is unable to estimate potential exposure. While the Company intends to vigorously defend this matter, there can be no assurance that an adverse outcome would not have a material effect on the Company’s results of operations, financial condition, or cash flows.
Bass Litigation:
On May 24, 2004, 820 Management Trust, all of the Company’s former shareholders whose shares were redeemed following the closing of the 144A Offering (the Former Shareholders), filed an action in the District Court of Tarrant County, Texas, against Fieldstone Mortgage and KPMG LLP (KPMG), alleging that the Former Shareholders whose shares were redeemed for approximately $188.1 million, are entitled to an additional post-closing redemption price payment of approximately $19.0 million. On September 9, 2004, KPMG served its response to plaintiffs’ request for disclosure, stating, among other things, that KPMG has determined that the deferred tax asset, which is reflected in the Company’s December 31, 2003 audited financial statements, should have been reflected in the financial statements as of November 13, 2003, the day immediately prior to the closing of the 144A Offering.
On October 28, 2005, the Company served a cross claim against KPMG. The cross claim asserted, among other claims, that KPMG’s withdrawal of its audit report on the November 13, 2003 balance sheet was improper and that due to this improper withdrawal the Company suffered damages. In addition, the cross claim asserted that KPMG negligently advised the Company regarding the November 13, 2003 balance sheet giving rise to this dispute. The cross claim sought a judgment against KPMG in an amount in excess of $1 million, plus prejudgment interest for the attorneys fees and costs incurred in this lawsuit.
On February 14, 2007, Fieldstone and KPMG entered into a Rule 11 Comprise Settlement Agreement and Mutual Release (the Settlement Agreement) with the Former Shareholders relating to the price paid to redeem the Former Shareholders’ shares. Pursuant to the Settlement Agreement, the Company agreed to pay the Former Shareholders a total of $10.6 million in settlement of all outstanding claims, and all of the parties to the Settlement Agreement agreed to the mutual release of all claims they may have against each other arising out of or in connection with the Rule 144A offering and redemption transaction. On February 21, 2007, the Company paid the Former Shareholders the foregoing settlement amount in satisfaction of its obligations under the Settlement Agreement. The lawsuit was dismissed with prejudice by the District Court of Tarrant County, Texas, on February 22, 2007.
Rhodes Litigation:
On January 9, 2006, a class action lawsuit was filed naming Fieldstone Mortgage in the Northern District of Illinois (Eastern Division) alleging violations of the Fair Credit Reporting Act (FCRA). The class action is entitledRhodes v. Fieldstone Mortgage Company. Plaintiff alleges that Fieldstone Mortgage violated the firm offer of credit guidelines encapsulated in 15 U.S.C. §1681 et seq. during its mail marketing campaign in or around April 2005. Specifically, Plaintiff alleges that Fieldstone Mortgage did not comply with the statutory guidelines in providing a firm offer of credit to the potential consumer. Pursuant to 15 U.S.C. §1681 et seq., statutory damages can range from $100 to $1,000 per mailing in the event that the violation is deemed willful. In August 2006, the parties engaged in a mandatory settlement conference and have agreed to settlement terms. The final terms of the settlement agreement were approved by the trial court on March 7, 2007, and include a payout to the class (including the class representative) and plaintiff’s attorney in an amount of approximately $500,000. The Company has currently recorded a reserve of $0.5 million with respect to this matter.
| (15) | Employee Benefit Plans |
The Company maintains a 401(k) savings plan (the Plan) in which all eligible employees may participate after completing a period of service with the Company. The Company’s policy is to match a percentage of an employee’s contribution to the Plan. The Company may change the match percentage from time to time. The Company’s
F-35
contributions to the Plan become vested after an employee completes a period of service with the Company. For the years ended December 31, 2006, 2005, and 2004, the Company contributed $2.0 million, $2.2 million, and $1.9 million, respectively, to the Plan.
The Company maintains a Section 125 cafeteria plan for medical and childcare expenses. All full time employees are eligible to participate in the cafeteria plan after completing a period of service with the Company.
In July 2002, the Board of Directors approved the adoption of an employee incentive and retention bonus plan (the Incentive Plan) for eligible senior management. Under the Incentive Plan, the Board of Directors may, at its discretion, periodically establish an aggregate amount to be awarded to eligible employees to be paid at a defined date, subject to their continued employment over a defined period of time. The Company has recorded $0.3 million, $2.0 million, and $1.3 million, respectively, of expense for the deferred compensation portion of these obligations under this Incentive Plan for the years ended December 31, 2006, 2005, and 2004. The Company terminated the Incentive Plan effective December 31, 2006, and will pay the amounts due for services rendered through that date during 2007.
| (16) | Disclosures of Fair Value of Financial Instruments |
The estimated fair values of the Company’s financial instruments are disclosed below. The assumptions used in the computations and the estimated fair values disclosed represent management’s best judgment of appropriate valuation methods. These estimates are based on pertinent information available to management as of December 31, 2006 and 2005. In certain cases, fair values are not subject to precise quantification or verification and may change as economic and market factors, and management’s evaluation of those factors, change.
Although management uses its best judgment in estimating the fair value of these financial instruments, there are inherent limitations in any estimation technique. Therefore, these fair value estimates are not necessarily indicative of either the amounts that the Company would realize in a market transaction or of the underlying value of the Company.
The carrying amount and estimated fair value of financial assets and financial liabilities as of December 31, 2006 and 2005 are as follows:
| | | | | | | | | | | | |
| | | 2006 | | 2005 |
| | | Carrying
Amount | | Estimated
Fair Value | | Carrying
Amount | | Estimated
Fair Value |
Financial assets: | | | | | | | | | | | | |
Cash and restricted cash | | $ | 32,791 | | $ | 32,791 | | $ | 41,424 | | $ | 41,424 |
Mortgage loans held for sale | | | 550,520 | | | 552,730 | | | 594,269 | | | 602,321 |
Mortgage loans held for investment, net | | | 5,519,338 | | | 5,439,798 | | | 5,526,293 | | | 5,526,329 |
Accrued interest receivable | | | 36,336 | | | 36,336 | | | 29,940 | | | 29,940 |
Derivative instruments | | | 13,730 | | | 13,730 | | | 35,223 | | | 35,223 |
Financial liabilities: | | | | | | | | | | | | |
Warehouse financing | | | 908,178 | | | 908,178 | | | 812,768 | | | 812,768 |
Securitization financing | | | 5,032,878 | | | 5,032,878 | | | 4,998,620 | | | 4,998,620 |
Accrued interest payable | | | 10,895 | | | 10,895 | | | 6,159 | | | 6,159 |
Derivative instruments | | | 4,392 | | | 4,392 | | | 912 | | | 912 |
The valuation methodologies used in establishing these fair values was:
Cash and Restricted Cash- The carrying amount of cash and restricted cash approximates its fair value.
F-36
Mortgage Loans Held for Sale, Net -The estimated fair value of mortgage loans held for sale was determined by investor commitment prices for those loans allocated to a specific commitment. The fair value of loans not allocated to a specific commitment was estimated using current market pricing for similar assets.
Mortgage Loans Held for Investment, Net-The estimated fair value for mortgage loans held for investment was determined by obtaining dealer quotes for a whole loan sales price for the portfolio loan product.
Accrued Interest Receivable and Interest Payable-The carrying amount of accrued interest receivable and accrued interest payable approximates fair value because these instruments are of short duration and do not present significant credit concerns.
Derivative Instruments-The estimated fair value of derivative instruments is estimated by discounting projected future cash flows at appropriate rates and by obtaining dealer quotes.
Warehouse Financing-The carrying amount of warehouse financing approximates its fair value due to its variable interest rate and short term nature.
Securitization Financing-Securitization financing is secured by mortgage loans held for investment and is tied to the one month LIBOR, and accordingly, carrying value is considered a reasonable estimate of fair value.
| (17) | Regulatory Requirements |
FMC is subject to a number of minimum net worth requirements resulting from contractual agreements with secondary market investors and state-imposed regulatory mandates. The most stringent net worth requirement is imposed upon FMC by the U.S. Department of Housing and Urban Development (HUD) in connection with Federal Housing Authority loans originated by FMC.
The HUD net worth requirements of FMC as of December 31, 2006 and 2005 are as follows:
| | | | | | |
| | | 2006 | | 2005 |
HUD net worth requirement | | $ | 250 | | $ | 623 |
FMC shareholder’s equity as of December 31 | | | 57,071 | | | 82,910 |
Less: FMC non-acceptable assets | | | 8 | | | 84 |
| | | | | | |
FMC adjusted net worth, as defined under contractual agreements with HUD | | | 57,063 | | | 82,826 |
| | | | | | |
FMC excess net worth | | $ | 56,813 | | $ | 82,203 |
| | | | | | |
F-37
| (18) | Unaudited Selected Quarterly Financial Data for the Years Ended December 31, 2006 and 2005 |
| | | | | | | | | | | | | | | | | | | | | | | | | | | | | | | |
| | | Quarter Ended | |
| | | 2006 | | | 2005 | |
| | | Dec 31 | | | Sept 30 | | | Jun 30 | | | Mar 31 | | | Dec 31 | | Sept 30 | | | Jun 30 | | | Mar 31 | |
Operating Data: | | | | | | | | | | | | | | | | | | | | | | | | | | | | | | | |
Revenues: | | | | | | | | | | | | | | | | | | | | | | | | | | | | | | | |
Interest income: | | | | | | | | | | | | | | | | | | | | | | | | | | | | | | | |
| | | | | | | | |
Loans held for investment | | $ | 107,041 | | | $ | 107,081 | | | $ | 100,440 | | | $ | 95,113 | | | $ | 96,171 | | $ | 84,940 | | | $ | 80,574 | | | $ | 82,836 | |
Loans held for sale | | | 10,060 | | | | 7,399 | | | | 6,991 | | | | 6,601 | | | | 6,285 | | | 7,677 | | | | 12,846 | | | | 4,287 | |
| | | | | | | | | | | | | | | | | | | | | | | | | | | | | | | |
Total interest income | | | 117,101 | | | | 114,480 | | | | 107,431 | | | | 101,714 | | | | 102,456 | | | 92,617 | | | | 93,420 | | | | 87,123 | |
| | | | | | | | | | | | | | | | | | | | | | | | | | | | | | | |
Interest expense: | | | | | | | | | | | | | | | | | | | | | | | | | | | | | | | |
Loans held for investment | | | 86,293 | | | | 87,163 | | | | 77,589 | | | | 68,916 | | | | 63,946 | | | 54,361 | | | | 41,773 | | | | 38,608 | |
Loans held for sale | | | 6,338 | | | | 4,069 | | | | 3,587 | | | | 2,605 | | | | 3,140 | | | 3,721 | | | | 5,369 | | | | 992 | |
| | | | | | | | | | | | | | | | | | | | | | | | | | | | | | | |
Total interest expense | | | 92,631 | | | | 91,232 | | | | 81,176 | | | | 71,521 | | | | 67,086 | | | 58,082 | | | | 47,142 | | | | 39,600 | |
| | | | | | | | | | | | | | | | | | | | | | | | | | | | | | | |
Net interest income | | | 24,470 | | | | 23,248 | | | | 26,255 | | | | 30,193 | | | | 35,370 | | | 34,535 | | | | 46,278 | | | | 47,523 | |
Provision for loan losses—loans held for investment | | | 30,168 | | | | 28,035 | | | | 5,466 | | | | 5,393 | | | | 7,663 | | | 11,045 | | | | 6,863 | | | | 4,494 | |
| | | | | | | | | | | | | | | | | | | | | | | | | | | | | | | |
Net interest (expense) income after provision for loan losses | | | (5,698 | ) | | | (4,787 | ) | | | 20,789 | | | | 24,800 | | | | 27,707 | | | 23,490 | | | | 39,415 | | | | 43,029 | |
Gains on sales of mortgage loans, net | | | 1,406 | | | | 3,393 | | | | 1,953 | | | | 10,295 | | | | 7,257 | | | 19,439 | | | | 26,033 | | | | 8,469 | |
Other income (expense)—portfolio derivatives | | | 4,988 | | | | (13,755 | ) | | | 10,821 | | | | 12,158 | | | | 6,929 | | | 15,630 | | | | (9,432 | ) | | | 20,342 | |
Other (expense) income | | | (1,786 | ) | | | (451 | ) | | | (575 | ) | | | 350 | | | | 159 | | | 478 | | | | 9 | | | | 286 | |
| | | | | | | | | | | | | | | | | | | | | | | | | | | | | | | |
Total revenues | | | (1,090 | ) | | | (15,600 | ) | | | 32,988 | | | | 47,603 | | | | 42,052 | | | 59,037 | | | | 56,025 | | | | 72,126 | |
| | | | | | | | | | | | | | | | | | | | | | | | | | | | | | | |
Expenses: | | | | | | | | | | | | | | | | | | | | | | | | | | | | | | | |
| | | | | | | | |
Salaries and employee benefits | | | 19,407 | | | | 18,553 | | | | 19,166 | | | | 20,869 | | | | 19,516 | | | 18,781 | | | | 17,719 | | | | 17,704 | |
Other expenses1 | | | 24,798 | | | | 14,660 | | | | 13,321 | | | | 12,890 | | | | 13,304 | | | 12,930 | | | | 11,331 | | | | 12,184 | |
| | | | | | | | | | | | | | | | | | | | | | | | | | | | | | | |
Total expenses | | | 44,205 | | | | 33,213 | | | | 32,487 | | | | 33,759 | | | | 32,820 | | | 31,711 | | | | 29,050 | | | | 29,888 | |
| | | | | | | | | | | | | | | | | | | | | | | | | | | | | | | |
(Loss) income from continuing operations before income taxes | | | (45,295 | ) | | | (48,813 | ) | | | 501 | | | | 13,844 | | | | 9,232 | | | 27,326 | | | | 26,975 | | | | 42,238 | |
Income tax benefit (expense) | | | 5,196 | | | | 3,794 | | | | 3,304 | | | | 729 | | | | 1,391 | | | (3,763 | ) | | | (2,454 | ) | | | 157 | |
| | | | | | | | | | | | | | | | | | | | | | | | | | | | | | | |
(Loss) income from continuing operations | | | (40,099 | ) | | | (45,019 | ) | | | 3,805 | | | | 14,573 | | | | 10,623 | | | 23,563 | | | | 24,521 | | | | 42,395 | |
Discontinued operations, net of income tax | | | — | | | | — | | | | — | | | | (1,645 | ) | | | 162 | | | (538 | ) | | | (695 | ) | | | (641 | ) |
| | | | | | | | | | | | | | | | | | | | | | | | | | | | | | | |
Net (loss) income | | $ | (40,099 | ) | | $ | (45,019 | ) | | $ | 3,805 | | | $ | 12,928 | | | $ | 10,785 | | $ | 23,025 | | | $ | 23,826 | | | $ | 41,754 | |
| | | | | | | | | | | | | | | | | | | | | | | | | | | | | | | |
(Loss) earnings per share of common stock-basic and diluted: | | | | | | | | | | | | | | | | | | | | | | | | | | | | | | | |
Continuing operations | | $ | (0.86 | ) | | $ | (0.97 | ) | | $ | 0.08 | | | $ | 0.30 | | | $ | 0.22 | | $ | 0.48 | | | $ | 0.50 | | | $ | 0.87 | |
Discontinued operations | | | — | | | | — | | | | — | | | | (0.03 | ) | | | — | | | (0.01 | ) | | | (0.01 | ) | | | (0.01 | ) |
| | | | | | | | | | | | | | | | | | | | | | | | | | | | | | | |
Total | | $ | (0.86 | ) | | $ | (0.97 | ) | | $ | 0.08 | | | $ | 0.27 | | | $ | 0.22 | | $ | 0.47 | | | $ | 0.49 | | | $ | 0.86 | |
| | | | | | | | | | | | | | | | | | | | | | | | | | | | | | | |
1 | Represents the accumulation of occupancy, depreciation and amortization, servicing fees and general and administration expenses, including the $10.6 million litigation settlement described in Note 19, reported within the audited consolidated statements of operations. |
F-38
Merger Agreement
On February 15, 2007, the Company entered into a definitive Agreement of Merger (Merger Agreement) with Credit-Based Asset Servicing and Securitization LLC, a Delaware limited liability company (C-BASS), and Rock Acquisition Corp., a Maryland corporation and wholly owned subsidiary of C-BASS (Merger Sub). On March 16, 2007, the Company entered into Amendment No. 1 to the Agreement of Merger (the Amendment). The Merger Agreement, as amended by the Amendment provides that, upon the terms and subject to the conditions set forth in the Merger Agreement, Merger Sub will be merged with and into Fieldstone, with Fieldstone continuing as the surviving corporation and a wholly owned subsidiary of C-BASS (the Merger). At the effective time of the Merger, each share of the Company’s common stock issued and outstanding immediately prior to the effective time of the Merger and not owned by Fieldstone or its subsidiaries will be converted into the right to receive $4.00 in cash per share, without interest.
In addition, in connection with the Merger, C-BASS has agreed to provide pre-merger liquidity to the Company, at the Company’s option by:
| | (i) | purchasing approximately $192 million of the Company’s retained securities; |
| | (ii) | purchasing approximately $46 million of the Company’s self financed inventory of loans and real estate owned; |
| | (iii) | purchasing substantially all of the unsecuritized loans held by the Company; and |
| | (iv) | purchasing new loans originated by the Company on or after March 1, 2007 according to credit and pricing guidelines agreed to by C-BASS. |
The Merger Agreement, as amended, and the transactions contemplated thereby were approved by the Company’s Board of Directors.
The Merger is subject to various closing conditions, including, among others: (i) the approval of the Merger Agreement, as amended, the Merger and the other transactions contemplated by the Merger Agreement by the affirmative vote of holders of a majority of the outstanding shares of Fieldstone’s common stock, (ii) the receipt of required regulatory approvals, (iii) the receipt of third party required contractual consents, (iv) the continued effectiveness of certain of the employment and retention arrangements, (v) Fieldstone’s third party servicers and subservicers agreeing to transfer the servicing of Fieldstone’s mortgage loans to C-BASS or its designated subsidiary, (vi) certain of Fieldstone’s lenders agreeing to extend a portion of Fieldstone’s existing financing facilities for at least 90 days after the effectiveness of the Merger, and (vii) no event or circumstance having occurred that has resulted in, or is reasonably expected to result in, a material adverse change to our Company.
Under the Merger Agreement, as amended, the Company is not permitted to declare dividends except as required to maintain its REIT status. Additionally, the Company is generally precluded from participating in any discussions that could lead to an alternative transaction to the merger. Similarly, the Board of Directors is restricted in its ability to withdraw or modify its recommendation that stockholders approve the merger agreement. In certain circumstances, the Company’s Board of Directors may be permitted to terminate the merger agreement and pursue a proposal that it deems to be superior. In those circumstances, the Company would be required to pay C-BASS a termination fee of $7.4 million.
Litigation Settlement
On February 14, 2007, Fieldstone and KPMG entered into a Rule 11 Comprise Settlement Agreement and Mutual Release (Settlement Agreement) with the Former Shareholders relating to the price paid to redeem the Former Shareholders’ shares. Pursuant to the Settlement Agreement, the Company agreed to pay the Former Shareholders a total of $10.6 million in settlement of all outstanding claims, and all of the parties to the Settlement Agreement agreed to the mutual release of all claims they may have against each other arising out of or in connection with the Rule 144A offering and redemption transaction. On February 21, 2007, the Company paid the Former Shareholders the foregoing settlement amount in satisfaction of its obligations under the Settlement Agreement. The lawsuit was dismissed with prejudice by the District Court of Tarrant County, Texas, on February 22, 2007. Because this settlement was a subsequent event which occurred prior to the release of the Company’s consolidated financial statements and provided additional evidence on a matter that existed as of the balance sheet date, the Company has reflected the settlement in its consolidated financial statements for the year ended December 31, 2006. The Company has recorded $10.6 million in “General and administration expenses” and a corresponding liability in “Accounts payable, accrued expenses, and other liabilities” related to this settlement. Prior to the settlement agreement, no accrual had been recorded because the Company believed it had meritorious defenses available, and was unable to reasonably estimate the amount, if any, of the expected settlement.
Shareholder Litigation
On March 1, 2007, a purported stockholder class action lawsuit related to the Company’s proposed merger with C-BASS was filed in the Circuit Court for Howard County, Maryland, naming the Company, and each of its directors and C-BASS as defendants. The lawsuit,Richard Tibbets v. Fieldstone Investment Corporation, et al (Case No. 13-C-07-68321), alleges, among other things, that $5.53 per share in cash to be paid to common stockholders in connection with the merger is inadequate, that the individual director defendants breached their fiduciary duties to common stockholders in negotiating and approving the merger agreement and have breached the duty of candor by failing to provide shareholders information adequate to make an informed voting decision in connection with the merger, and that the Company and C-BASS aided and abetted the director defendants in such alleged breach. The complaint seeks the following relief: (i) a declaration that the lawsuit is properly maintainable as a class action and certification of the plaintiff as a class representative; (ii) a declaration that the director defendants have breached their fiduciary duties owed to the plaintiff and other members of the class, and that the Company and C-BASS aided and abetted such breaches; (iii) an injunction of the merger; (iv) requiring the Company’s Board of Directors to obtain the best possible price in connection with a possible sale of Fieldstone; and (v) an award of attorneys’ and experts’ fees to the plaintiff.
Due to the inherent uncertainties of the judicial process, the Company is unable to predict the outcome of this matter. While the Company intends to vigorously defend this claim and believes it has meritorious defenses available, there can be no assurance that an adverse outcome would not have a material effect on the Company’s results of operations, financial condition, or cash flows.
F-39
Line of Credit Agreement Amendments
On January 26, 2007, the Company amended its warehouse line of credit agreement with Lehman Brothers Bank, FSB (Lehman Brothers). The amendment extended the agreement until January 25, 2008 and increased the maximum facility amount from $300 million to $400 million, which facility had been temporarily increased to $500 million during the fourth quarter of 2006. In addition, the amendment changed certain definitions and covenants, including the adjusted tangible net worth, which was increased from $250 million to the higher of $350 million or the highest adjusted tangible net worth contained in any of the Company’s other warehouse lending agreements.
On January 31, 2007, the Company completed amendments to several of its warehouse line of credit agreements, including agreements with Credit Suisse First Boston Mortgage Capital LLC (Credit Suisse First Boston), Credit Suisse, New York Branch (Credit Suisse, New York) and JPMorgan Chase Bank, N.A. (JPMorgan Chase). Each of the amendments waived the net profitability covenant through the first quarter of 2007 and lowered the adjusted tangible net worth covenant to $350 million. Additionally, the maximum aggregate purchase price for each of the facilities has been amended as follows (i) the Credit Suisse First Boston facility reduced its maximum aggregate purchase price from $400 million to $300 million, (ii) the Credit Suisse, New York facility reduced its maximum aggregate purchase price from $800 million to $500 million and (iii) the JPMorgan Chase facility increased its maximum aggregate purchase price from $150 million to $250 million. Upon completing the amendments on January 31, 2007, the Company’s committed level of whole loan funding capacity was $1.85 billion.
F-40
Schedule IV
FIELDSTONE INVESTMENT CORPORATION AND SUBSIDIARIES
Mortgage Loans on Real Estate
December 31, 2006
(In thousands)
Mortgage Loans Held for Investment
| | | | | | | | | | | | |
Description | | Number of
Mortgage
Loans | | Aggregate
Principal
Balance | | | Percent
of Total | | | Weighted
Average
Interest Rate | |
Original Loan Amount | | | | | | | | | | | | |
$50,000 or less | | 4,098 | | $ | 135,455 | | | 2.4 | % | | 10.5 | % |
$50,001 to $100,000 | | 7,814 | | | 584,770 | | | 10.5 | % | | 9.3 | % |
$100,001 to $150,000 | | 6,626 | | | 810,121 | | | 14.5 | % | | 8.4 | % |
$150,001 to $200,000 | | 4,127 | | | 712,763 | | | 12.9 | % | | 8.1 | % |
$200,001 to $250,000 | | 2,718 | | | 603,856 | | | 10.8 | % | | 8.0 | % |
$250,001 to $300,000 | | 2,049 | | | 558,843 | | | 10.0 | % | | 7.9 | % |
$300,001 to $350,000 | | 1,583 | | | 510,144 | | | 9.2 | % | | 7.7 | % |
$350,001 to $400,000 | | 1,219 | | | 455,129 | | | 8.2 | % | | 7.6 | % |
$400,001 to $450,000 | | 768 | | | 326,096 | | | 5.9 | % | | 7.6 | % |
$450,001 to $500,000 | | 611 | | | 291,106 | | | 5.2 | % | | 7.7 | % |
$500,001 to $550,000 | | 351 | | | 183,735 | | | 3.3 | % | | 7.6 | % |
$550,001 to $600,000 | | 253 | | | 144,973 | | | 2.6 | % | | 7.6 | % |
$600,001 to $650,000 | | 144 | | | 90,079 | | | 1.6 | % | | 7.6 | % |
$650,001 or greater | | 221 | | | 162,670 | | | 2.9 | % | | 7.7 | % |
| | | | | | | | | | | | |
Total | | 32,582 | | | 5,569,740 | | | 100.0 | % | | 8.1 | % |
| | | | | | | | | | | | |
Plus: Net deferred loan origination (fees)/costs | | | | | 31,457 | | | | | | | |
Less: Allowance for loan losses | | | | | (81,859 | ) | | | | | | |
| | | | | | | | | | | | |
Total mortgage loans held for investment, net | | | | $ | 5,519,338 | | | | | | | |
| | | | | | | | | | | | |
Interest Rate Ranges | | | | | | | | | | | | |
6.0% or less | | 325 | | $ | 87,246 | | | 1.6 | % | | | |
6.01% to 6.5% | | 1,721 | | | 459,006 | | | 8.2 | % | | | |
6.51% to 7.0% | | 3,435 | | | 794,247 | | | 14.3 | % | | | |
7.01% to 7.5% | | 3,652 | | | 799,787 | | | 14.4 | % | | | |
7.51% to 8.0% | | 5,404 | | | 1,153,188 | | | 20.6 | % | | | |
8.01% to 8.5% | | 3,150 | | | 616,198 | | | 11.1 | % | | | |
8.51% to 9.0% | | 3,692 | | | 508,291 | | | 9.1 | % | | | |
9.01% to 9.5% | | 1,605 | | | 260,676 | | | 4.7 | % | | | |
9.51% to 10.0% | | 2,038 | | | 274,889 | | | 4.9 | % | | | |
10.01% to 10.5% | | 2,011 | | | 184,333 | | | 3.3 | % | | | |
10.51% to 11.0% | | 1,580 | | | 169,992 | | | 3.1 | % | | | |
11.01% to 11.50% | | 2,382 | | | 162,799 | | | 2.9 | % | | | |
11.51% to 12.0% | | 1,587 | | | 99,088 | | | 1.8 | % | | | |
| | | | | | | | | | | | |
Total | | 32,582 | | | 5,569,740 | | | 100.0 | % | | | |
| | | | | | | | | | | | |
Plus: Net deferred loan origination (fees)/costs | | | | | 31,457 | | | | | | | |
Less: Allowance for loan losses | | | | | (81,859 | ) | | | | | | |
| | | | | | | | | | | | |
Total mortgage loans held for investment, net | | | | $ | 5,519,338 | | | | | | | |
| | | | | | | | | | | | |
Geographic Location | | | | | | | | | | | | |
CA | | 7,729 | | $ | 2,153,221 | | | 38.7 | % | | | |
IL | | 2,411 | | | 355,862 | | | 6.4 | % | | | |
TX | | 4,944 | | | 474,971 | | | 8.5 | % | | | |
CO | | 1,732 | | | 277,259 | | | 5.0 | % | | | |
FL | | 1,699 | | | 296,148 | | | 5.3 | % | | | |
AZ | | 1,580 | | | 267,660 | | | 4.8 | % | | | |
WA | | 1,728 | | | 298,320 | | | 5.4 | % | | | |
MA | | 473 | | | 113,323 | | | 2.0 | % | | | |
MO | | 1,310 | | | 131,287 | | | 2.4 | % | | | |
MI | | 674 | | | 93,479 | | | 1.7 | % | | | |
Other | | 8,302 | | | 1,108,210 | | | 19.8 | % | | | |
| | | | | | | | | | | | |
Total | | 32,582 | | | 5,569,740 | | | 100.0 | % | | | |
| | | | | | | | | | | | |
Plus: Net deferred loan origination (fees)/costs | | | | | 31,457 | | | | | | | |
Less: Allowance for loan losses | | | | | (81,859 | ) | | | | | | |
| | | | | | | | | | | | |
Total mortgage loans held for investment, net | | | | $ | 5,519,338 | | | | | | | |
| | | | | | | | | | | | |
NOTES:
| (1) | Mortgage loans held for investment primarily consist of non-conforming, adjustable-rate, first lien loans. |
F-41
Schedule IV (continued)
FIELDSTONE INVESTMENT CORPORATION AND SUBSIDIARIES
Mortgage Loans on Real Estate
December 31, 2005
(In thousands)
Mortgage Loans Held for Investment
| | | | | | | | | | | | |
Description | | Number of
Mortgage
Loans | | Aggregate
Principal
Balance | | | Percent
of Total | | | Weighted
Average
Interest Rate | |
Original Loan Amount | | | | | | | | | | | | |
$50,000 or less | | 1,257 | | $ | 48,019 | | | 0.9 | % | | 9.1 | % |
$50,001 to $100,000 | | 6,168 | | | 469,374 | | | 8.5 | % | | 8.0 | % |
$100,001 to $150,000 | | 6,342 | | | 779,128 | | | 14.1 | % | | 7.4 | % |
$150,001 to $200,000 | | 4,500 | | | 778,855 | | | 14.1 | % | | 7.1 | % |
$200,001 to $250,000 | | 3,163 | | | 704,906 | | | 12.7 | % | | 7.0 | % |
$250,001 to $300,000 | | 2,496 | | | 681,804 | | | 12.3 | % | | 6.8 | % |
$300,001 to $350,000 | | 1,979 | | | 638,208 | | | 11.5 | % | | 6.7 | % |
$350,001 to $400,000 | | 1,493 | | | 558,271 | | | 10.1 | % | | 6.7 | % |
$400,001 to $450,000 | | 663 | | | 281,353 | | | 5.1 | % | | 6.9 | % |
$450,001 to $500,000 | | 556 | | | 265,737 | | | 4.8 | % | | 6.8 | % |
$500,001 to $550,000 | | 186 | | | 97,397 | | | 1.8 | % | | 6.8 | % |
$550,001 to $600,000 | | 172 | | | 98,951 | | | 1.8 | % | | 6.8 | % |
$600,001 to $650,000 | | 98 | | | 61,610 | | | 1.1 | % | | 6.8 | % |
$650,001 or greater | | 91 | | | 66,603 | | | 1.2 | % | | 6.9 | % |
| | | | | | | | | | | | |
Total | | 29,164 | | | 5,530,216 | | | 100.0 | % | | 7.1 | % |
| | | | | | | | | | | | |
Plus: Net deferred loan origination (fees)/costs | | | | | 40,199 | | | | | | | |
Less: Allowance for loan losses | | | | | (44,122 | ) | | | | | | |
| | | | | | | | | | | | |
Total mortgage loans held for investment, net | | | | $ | 5,526,293 | | | | | | | |
| | | | | | | | | | | | |
Interest Rate Ranges | | | | | | | | | | | | |
6.0% or less | | 2,170 | | $ | 577,895 | | | 10.5 | % | | | |
6.01% to 6.5% | | 4,602 | | | 1,153,506 | | | 20.9 | % | | | |
6.51% to 7.0% | | 7,033 | | | 1,518,173 | | | 27.5 | % | | | |
7.01% to 7.5% | | 4,913 | | | 919,755 | | | 16.6 | % | | | |
7.51% to 8.0% | | 4,465 | | | 707,276 | | | 12.8 | % | | | |
8.01% to 8.5% | | 2,028 | | | 278,486 | | | 5.0 | % | | | |
8.51% to 9.0% | | 1,606 | | | 187,023 | | | 3.4 | % | | | |
9.01% to 9.5% | | 701 | | | 70,011 | | | 1.3 | % | | | |
9.51% to 10.0% | | 874 | | | 67,996 | | | 1.2 | % | | | |
10.01% to 10.5% | | 550 | | | 34,855 | | | 0.6 | % | | | |
10.51% to 11.0% | | 184 | | | 13,074 | | | 0.2 | % | | | |
11.01% to 11.51% | | 38 | | | 2,166 | | | 0.0 | % | | | |
| | | | | | | | | | | | |
Total | | 29,164 | | | 5,530,216 | | | 100.0 | % | | | |
| | | | | | | | | | | | |
Plus: Net deferred loan origination (fees)/costs | | | | | 40,199 | | | | | | | |
Less: Allowance for loan losses | | | | | (44,122 | ) | | | | | | |
| | | | | | | | | | | | |
Total mortgage loans held for investment, net | | | | $ | 5,526,293 | | | | | | | |
| | | | | | | | | | | | |
Geographic Location | | | | | | | | | | | | |
CA | | 7,686 | | $ | 2,282,251 | | | 41.3 | % | | | |
IL | | 2,373 | | | 383,224 | | | 6.9 | % | | | |
TX | | 2,667 | | | 292,739 | | | 5.3 | % | | | |
CO | | 1,954 | | | 347,388 | | | 6.3 | % | | | |
FL | | 1,634 | | | 276,551 | | | 5.0 | % | | | |
AZ | | 1,664 | | | 276,022 | | | 5.0 | % | | | |
WA | | 1,536 | | | 279,732 | | | 5.1 | % | | | |
MA | | 736 | | | 182,917 | | | 3.3 | % | | | |
MO | | 1,078 | | | 107,552 | | | 1.9 | % | | | |
MI | | 618 | | | 93,173 | | | 1.7 | % | | | |
Other | | 7,218 | | | 1,008,667 | | | 18.2 | % | | | |
| | | | | | | | | | | | |
Total | | 29,164 | | | 5,530,216 | | | 100.0 | % | | | |
| | | | | | | | | | | | |
Plus: Net deferred loan origination (fees)/costs | | | | | 40,199 | | | | | | | |
Less: Allowance for loan losses | | | | | (44,122 | ) | | | | | | |
| | | | | | | | | | | | |
Total mortgage loans held for investment, net | | | | $ | 5,526,293 | | | | | | | |
| | | | | | | | | | | | |
NOTES:
| (1) | Mortgage loans held for investment primarily consist of non-conforming, adjustable-rate, first lien loans. |
F-42
Schedule IV (continued)
FIELDSTONE INVESTMENT CORPORATION AND SUBSIDIARIES
Reconciliation of Mortgage Loans on Real Estate
Mortgage Loans Held for Investment
Years Ended December 31, 2006, 2005 and 2004
(In thousands)
| | | | | | | | | | | | |
| | | Year Ended December 31, | |
| | | 2006 | | | 2005 | | | 2004 | |
Principal balance at the beginning of the year | | $ | 5,530,216 | | | $ | 4,735,063 | | | $ | 1,319,123 | |
Additions during the year: | | | | | | | | | | | | |
New mortgage loans | | | 2,448,342 | | | | 3,341,911 | | | | 4,112,190 | |
Transfers from mortgage loans held for sale to mortgage loans held for investment | | | 164,454 | | | | 108,639 | | | | — | |
Deductions during the year: | | | | | | | | | | | | |
Collections of principal | | | (2,444,971 | ) | | | (1,981,866 | ) | | | (690,037 | ) |
Transfers from mortgage loans held for investment to mortgage loans held for sale | | | — | | | | (639,469 | ) | | | — | |
Transfers to real estate owned | | | (128,301 | ) | | | (34,062 | ) | | | (6,213 | ) |
| | | | | | | | | | | | |
Principal balance at the end of the year | | | 5,569,740 | | | | 5,530,216 | | | | 4,735,063 | |
Plus: Net deferred loan origination (fees)/costs | | | 31,457 | | | | 40,199 | | | | 39,693 | |
| | | | | | | | | | | | |
Ending balance mortgage loans held for investment | | | 5,601,197 | | | | 5,570,415 | | | | 4,774,756 | |
Less: Allowance for loan losses | | | (81,859 | ) | | | (44,122 | ) | | | (22,648 | ) |
| | | | | | | | | | | | |
Ending balance mortgage loans held for investment, net | | $ | 5,519,338 | | | $ | 5,526,293 | | | $ | 4,752,108 | |
| | | | | | | | | | | | |
F-43