UNITED STATES
SECURITIES AND EXCHANGE COMMISSION
Washington, D.C. 20549
FORM 10-Q
(Mark One)
| x | QUARTERLY REPORT PURSUANT TO SECTION 13 OR 15(d) OF THE SECURITIES EXCHANGE ACT OF 1934 |
For the quarterly period ended March 31, 2007
| ¨ | TRANSITION REPORT PURSUANT TO SECTION 13 OR 15(d) OF THE SECURITIES EXCHANGE ACT OF 1934 |
Commission File Number: 000-50938
Fieldstone Investment Corporation
(Exact name of registrant as specified in its charter)
| | | | |
| Maryland | | | | 74-2874689 |
(State or other jurisdiction of
incorporation or organization) | | | | (I.R.S. Employer
Identification No.) |
| | |
11000 Broken Land Parkway
Columbia, MD | | 21044 | | 410-772-7200 |
| (Address of principal executive offices) | | (Zip Code) | | (Telephone No., including area code) |
Indicate by check mark whether the registrant: (1) has filed all reports required to be filed by Section 13 or 15(d) of the Securities Exchange Act of 1934 during the preceding 12 months (or for such shorter period that the registrant was required to file such reports), and (2) has been subject to such filing requirements for the past 90 days. Yes x No ¨
Indicate by check mark whether the registrant is a large accelerated filer, an accelerated filer, or a non-accelerated filer. See definition of “accelerated filer and large accelerated filer” in Rule 12b-2 of the Exchange Act.
Large Accelerated Filer ¨ Accelerated Filer x Non-accelerated Filer ¨
Indicate by check mark whether the registrant is a shell company (as defined in Rule 12b-2 of the Exchange Act). Yes ¨ No x
Number of shares of Common Stock outstanding as of May 1, 2007: 46,872,394
Table of Contents
i
Cautionary Advice Regarding Forward-Looking Statements
Statements contained in this Form 10-Q which are not historical facts may be forward-looking statements within the meaning of Section 21E of the Securities Exchange Act of 1934, as amended (the Exchange Act). We intend such forward-looking statements to be covered by the safe harbor provisions for forward-looking statements contained in Section 21E of the Exchange Act. Readers are cautioned not to place undue reliance on these forward-looking statements, which speak only as of the date this Form 10-Q is filed with the SEC, and we undertake no obligation to publicly update or revise any forward-looking statement, whether as a result of new information, future events or otherwise.
The forward-looking statements are based on our beliefs, assumptions and expectations of our future performance, taking into account all information currently available to us. These beliefs, assumptions and expectations can change as a result of many possible events or factors, not all of which are known to us or are within our control. If a change occurs, our business, financial condition, results of operations, and cash flows may vary materially from those expressed in our forward-looking statements. These statements (none of which is intended as a guarantee of performance) are subject to certain risks and uncertainties which could cause our actual future results, achievements or transactions to differ materially from those projected or anticipated. Some of the important factors that could cause our actual results, performance, financial condition, or cash flows to differ materially from expectations are:
| | • | | the satisfaction of the conditions to consummate our pending merger (described herein), including required regulatory and third party consents and the receipt of the required stockholder approval; |
| | • | | the occurrence of any event, change or other circumstances that could give rise to the termination of the merger agreement relating to our pending merger, including any event, change of circumstance that would reasonably be expected to have a material adverse effect on our company; |
| | • | | the failure of our pending merger to close for any other reason; |
| | • | | the amount of the costs, fees, expenses and charges related to our pending merger; |
| | • | | our ability to successfully implement or change aspects of our portfolio strategy; |
| | • | | interest rate volatility and the level of interest rates generally; |
| | • | | the sustainability of loan origination volumes and levels of origination costs; |
| | • | | continued availability of credit facilities for the origination of mortgage loans; |
| | • | | our ability to sell or securitize mortgage loans on favorable economic terms, or at all; |
| | • | | deterioration in the credit quality of our loan portfolio; |
| | • | | deterioration in the performance of our loans sold and the related repurchase activity; |
| | • | | the nature and amount of competition; |
ii
| | • | | the impact of changes to the fair value of our interest rate swaps on our net income, which will vary based upon changes in interest rates and could cause net income to vary significantly from quarter to quarter; and |
| | • | | the other factors referenced in this report and in our annual report on Form 10-K for the fiscal year ended December 31, 2006, including those factors set forth under the section entitled “Risk Factors” in our annual report. |
iii
PART I
| ITEM 1. | FINANCIAL STATEMENTS. |
FIELDSTONE INVESTMENT CORPORATION AND SUBSIDIARIES
Condensed Consolidated Statements of Condition
March 31, 2007 and December 31, 2006
(Unaudited, in thousands, except share data)
| | | | | | | | |
| | | March 31, 2007 | | | December 31, 2006 | |
| Assets | | | | | | | | |
Cash | | $ | 39,224 | | | $ | 24,152 | |
Restricted cash | | | 4,230 | | | | 8,639 | |
Mortgage loans held for sale, net | | | 609,324 | | | | 550,520 | |
Mortgage loans held for investment | | | 5,006,912 | | | | 5,601,197 | |
Allowance for loan losses - loans held for investment | | | (82,162 | ) | | | (81,859 | ) |
| | | | | | | | |
Mortgage loans held for investment, net | | | 4,924,750 | | | | 5,519,338 | |
| | | | | | | | |
Accounts receivable | | | 22,583 | | | | 27,132 | |
Accrued interest receivable | | | 34,197 | | | | 36,336 | |
Trustee receivable | | | 51,491 | | | | 101,376 | |
Prepaid expenses and other assets | | | 16,760 | | | | 15,597 | |
Real estate owned | | | 83,004 | | | | 59,436 | |
Derivative assets | | | 6,188 | | | | 13,730 | |
Deferred tax asset | | | 48,742 | | | | 26,410 | |
Furniture and equipment, net | | | 7,477 | | | | 8,119 | |
| | | | | | | | |
Total assets | | $ | 5,847,970 | | | $ | 6,390,785 | |
| | | | | | | | |
| Liabilities and Shareholders’ Equity | | | | | | | | |
Warehouse financing - loans held for sale | | $ | 574,479 | | | $ | 480,376 | |
Warehouse financing - loans held for investment | | | 361,001 | | | | 427,802 | |
Securitization financing | | | 4,548,984 | | | | 5,032,878 | |
Reserve for losses - loans sold | | | 23,051 | | | | 23,052 | |
Dividends payable | | | — | | | | 2,345 | |
Accounts payable, accrued expenses and other liabilities | | | 27,152 | | | | 43,003 | |
| | | | | | | | |
Total liabilities | | | 5,534,667 | | | | 6,009,456 | |
| | | | | | | | |
Commitments and contingencies (Note 12) | | | — | | | | — | |
| | |
Shareholders’ equity: | | | | | | | | |
Common stock $0.01 par value; 90,000,000 shares authorized; 46,878,644 and 46,882,394 shares issued as of March 31, 2007 and December 31, 2006, respectively | | | 469 | | | | 469 | |
Paid-in capital | | | 475,028 | | | | 474,411 | |
Accumulated deficit | | | (162,194 | ) | | | (93,551 | ) |
| | | | | | | | |
Total shareholders’ equity | | | 313,303 | | | | 381,329 | |
| | | | | | | | |
Total liabilities and shareholders’ equity | | $ | 5,847,970 | | | $ | 6,390,785 | |
| | | | | | | | |
See accompanying notes to condensed consolidated financial statements.
1
FIELDSTONE INVESTMENT CORPORATION AND SUBSIDIARIES
Condensed Consolidated Statements of Operations
Three Months Ended March 31, 2007 and 2006
(Unaudited; in thousands, except share and per share data)
| | | | | | | | |
| | | Three Months Ended March 31, | |
| | | 2007 | | | 2006 | |
Revenues: | | | | | | | | |
Interest income: | | | | | | | | |
Loans held for investment | | $ | 99,068 | | | $ | 95,113 | |
Loans held for sale | | | 11,609 | | | | 6,601 | |
| | | | | | | | |
Total interest income | | | 110,677 | | | | 101,714 | |
| | | | | | | | |
Interest expense: | | | | | | | | |
Loans held for investment | | | 76,674 | | | | 68,916 | |
Loans held for sale | | | 8,310 | | | | 2,605 | |
| | | | | | | | |
Total interest expense | | | 84,984 | | | | 71,521 | |
| | | | | | | | |
Net interest income | | | 25,693 | | | | 30,193 | |
| | |
Provision for loan losses - loans held for investment | | | 21,436 | | | | 5,393 | |
| | | | | | | | |
Net interest income after provision for loan losses | | | 4,257 | | | | 24,800 | |
| | |
(Losses) gains on sales of mortgage loans, net | | | (59,271 | ) | | | 10,295 | |
Other (expense) income - portfolio derivatives | | | (1,582 | ) | | | 12,158 | |
Other (expense) income | | | (1,921 | ) | | | 350 | |
| | | | | | | | |
Total revenues | | | (58,517 | ) | | | 47,603 | |
| | | | | | | | |
Expenses: | | | | | | | | |
Salaries and employee benefits | | | 18,339 | | | | 20,869 | |
Occupancy | | | 1,535 | | | | 1,823 | |
Depreciation and amortization | | | 1,108 | | | | 935 | |
Servicing fees | | | 2,738 | | | | 2,569 | |
General and administration | | | 8,767 | | | | 7,563 | |
| | | | | | | | |
Total expenses | | | 32,487 | | | | 33,759 | |
| | | | | | | | |
(Loss) income from continuing operations before income taxes | | | (91,004 | ) | | | 13,844 | |
| | |
Income tax benefit | | | 22,372 | | | | 729 | |
| | | | | | | | |
(Loss) income from continuing operations | | | (68,632 | ) | | | 14,573 | |
Discontinued operations, net of income tax (Note 7) | | | — | | | | (1,645 | ) |
| | | | | | | | |
Net (loss) income | | $ | (68,632 | ) | | $ | 12,928 | |
| | | | | | | | |
(Loss) earnings per share of common stock-basic and diluted: | | | | | | | | |
Continuing operations | | $ | (1.47 | ) | | $ | 0.30 | |
Discontinued operations | | | — | | | | (0.03 | ) |
| | | | | | | | |
Total | | $ | (1.47 | ) | | $ | 0.27 | |
| | | | | | | | |
Weighted average common shares outstanding-basic and diluted | | | 46,744,894 | | | | 48,273,985 | |
| | | | | | | | |
See accompanying notes to condensed consolidated financial statements.
2
FIELDSTONE INVESTMENT CORPORATION AND SUBSIDIARIES
Condensed Consolidated Statements of Shareholders’ Equity
Three Months Ended March 31, 2007 and 2006
(Unaudited; in thousands)
| | | | | | | | | | | | | | | | | | | | | | |
| | | Common
Shares
Outstanding | | | Common
Stock | | Paid-in
Capital | | | Accumulated
(Deficit)
Earnings | | | Unearned
Compensation | | | Total
Shareholders’
Equity | |
Balance at January 1, 2007 | | 46,882 | | | $ | 469 | | $ | 474,411 | | | $ | (93,551 | ) | | $ | — | | | $ | 381,329 | |
Restricted stock forfeited | | (3 | ) | | | — | | | — | | | | — | | | | — | | | | — | |
Restricted stock compensation expense | | — | | | | — | | | 467 | | | | — | | | | — | | | | 467 | |
Stock options compensation expense | | — | | | | — | | | 150 | | | | — | | | | — | | | | 150 | |
Valuation adjustment of dividend equivalent rights on outstanding stock options | | — | | | | — | | | — | | | | (11 | ) | | | — | | | | (11 | ) |
Net loss | | — | | | | — | | | — | | | | (68,632 | ) | | | — | | | | (68,632 | ) |
| | | | | | | | | | | | | | | | | | | | | | |
Balance at March 31, 2007 | | 46,879 | | | $ | 469 | | $ | 475,028 | | | $ | (162,194 | ) | | $ | — | | | $ | 313,303 | |
| | | | | | | | | | | | | | | | | | | | | | |
Balance at January 1, 2006 | | 48,514 | | | $ | 485 | | $ | 493,603 | | | $ | 37,093 | | | $ | (4,538 | ) | | $ | 526,643 | |
Restricted stock issued | | 45 | | | | — | | | — | | | | — | | | | — | | | | — | |
Restricted stock forfeited | | (23 | ) | | | — | | | — | | | | — | | | | — | | | | — | |
Restricted stock compensation expense | | — | | | | — | | | 422 | | | | — | | | | — | | | | 422 | |
Stock options compensation expense | | — | | | | — | | | 115 | | | | — | | | | | | | | 115 | |
Reclass unearned compensation to paid-in capital upon adoption of FASB Statement No. 123R | | — | | | | — | | | (4,538 | ) | | | — | | | | 4,538 | | | | — | |
Dividends declared | | — | | | | — | | | — | | | | (23,250 | ) | | | — | | | | (23,250 | ) |
Net income | | — | | | | — | | | — | | | | 12,928 | | | | — | | | | 12,928 | |
| | | | | | | | | | | | | | | | | | | | | | |
Balance at March 31, 2006 | | 48,536 | | | $ | 485 | | $ | 489,602 | | | $ | 26,771 | | | $ | — | | | $ | 516,858 | |
| | | | | | | | | | | | | | | | | | | | | | |
See accompanying notes to condensed consolidated financial statements.
3
FIELDSTONE INVESTMENT CORPORATION AND SUBSIDIARIES
Condensed Consolidated Statements of Cash Flows
Three Months Ended March 31, 2007 and 2006
(Unaudited; in thousands)
| | | | | | | | |
| | | Three Months Ended March 31, | |
| | | 2007 | | | 2006 | |
Cash flows from operating activities: | | | | | | | | |
Net (loss) income | | $ | (68,632 | ) | | $ | 12,928 | |
Adjustments to reconcile net (loss) income to net cash (used in) provided by operating activities: | | | | | | | | |
Depreciation and amortization | | | 1,108 | | | | 935 | |
Amortization of deferred origination costs—loans held for investment | | | 1,157 | | | | 6,871 | |
Amortization of securitization issuance costs | | | 645 | | | | 2,685 | |
Amortization of bond discount | | | 972 | | | | 32 | |
Provision for losses—loans sold | | | 9,945 | | | | 2,329 | |
Provision for loan losses—loans held for investment | | | 21,436 | | | | 5,393 | |
Stock compensation expense | | | 617 | | | | 585 | |
Loss on disposal of discontinued operations | | | — | | | | 904 | |
Loss from discontinued operations | | | — | | | | 741 | |
Decrease (increase) in accounts receivable | | | 4,549 | | | | (5,861 | ) |
Decrease in accrued interest receivable | | | 2,139 | | | | 897 | |
Decrease in trustee receivable | | | 49,885 | | | | 10,466 | |
Funding of mortgage loans held for sale | | | (791,073 | ) | | | (480,522 | ) |
Proceeds from sales and payments of mortgage loans held for sale | | | 709,507 | | | | 658,823 | |
Increase in prepaid expenses and other assets | | | (1,808 | ) | | | (2,478 | ) |
(Increase) decrease in deferred tax asset, net | | | (22,332 | ) | | | 824 | |
Decrease (increase) in fair market value of derivative instruments | | | 8,424 | | | | (2,824 | ) |
Decrease in accounts payable, accrued expenses and other liabilities | | | (16,734 | ) | | | (526 | ) |
| | | | | | | | |
Net cash (used in) provided by operating activities from continuing operations | | | (90,195 | ) | | | 212,202 | |
Net cash provided by operating activities from discontinued operations | | | — | | | | 97,368 | |
| | | | | | | | |
Net cash (used in) provided by operating activities | | | (90,195 | ) | | | 309,570 | |
| | | | | | | | |
Cash flows from investing activities: | | | | | | | | |
Funding of mortgage loans held for investment | | | (4,754 | ) | | | (531,782 | ) |
Payments of mortgage loans held for investment | | | 533,507 | | | | 543,453 | |
Decrease (increase) in restricted cash | | | 4,409 | | | | (247,417 | ) |
Purchase of furniture and equipment, net | | | (466 | ) | | | (549 | ) |
Proceeds from sale of real estate owned | | | 32,490 | | | | 8,624 | |
| | | | | | | | |
Net cash provided by (used in) investing activities from continuing operations | | | 565,186 | | | | (227,671 | ) |
Net cash provided by investing activities from discontinued operations | | | — | | | | 101 | |
| | | | | | | | |
Net cash provided by (used in) investing activities | | | 565,186 | | | | (227,570 | ) |
| | | | | | | | |
Cash flows from financing activities: | | | | | | | | |
Proceeds from warehouse financing—loans held for sale | | | 788,397 | | | | 317,060 | |
Repayment of warehouse financing—loans held for sale | | | (702,087 | ) | | | (422,441 | ) |
Proceeds from warehouse financing—loans held for investment | | | 14,631 | | | | 537,953 | |
Repayment of warehouse financing—loans held for investment | | | (73,639 | ) | | | (657,147 | ) |
Proceeds from securitization financing | | | 146,270 | | | | 904,078 | |
Repayment of securitization financing | | | (631,136 | ) | | | (661,464 | ) |
Dividends paid | | | (2,355 | ) | | | (26,689 | ) |
| | | | | | | | |
Net cash used in financing activities from continuing operations | | | (459,919 | ) | | | (8,650 | ) |
Net cash used in provided by financing activities from discontinued operations | | | — | | | | (75,866 | ) |
| | | | | | | | |
Net cash used in financing activities | | | (459,919 | ) | | | (84,516 | ) |
| | | | | | | | |
Net increase (decrease) in cash | | | 15,072 | | | | (2,516 | ) |
Cash at the beginning of the period | | | 24,152 | | | | 33,536 | |
| | | | | | | | |
Cash at the end of the period | | $ | 39,224 | | | $ | 31,020 | |
| | | | | | | | |
Supplemental disclosures: | | | | | | | | |
Cash paid for interest | | $ | 86,871 | | | $ | 71,859 | |
Cash paid for taxes | | | 4,129 | | | | 89 | |
Non-cash operating and investing activities: | | | | | | | | |
Transfer from mortgage loans held for sale to real estate owned | | $ | 1,726 | | | $ | 468 | |
Transfer from mortgage loans held for investment to real estate owned | | | 74,560 | | | | 19,463 | |
Transfer from mortgage loans held for investment to mortgage loans held for sale, net | | | 48,393 | | | | — | |
Transfer from mortgage loans held for sale to mortgage loans held for investment, net | | | 60,680 | | | | — | |
See accompanying notes to condensed consolidated financial statements.
4
FIELDSTONE INVESTMENT CORPORATION AND SUBSIDIARIES
Notes to Condensed Consolidated Financial Statements
March 31, 2007
(Unaudited; in thousands, except share and per share data)
The financial statements included in this report for Fieldstone Investment Corporation (FIC or the Company) have been prepared, without audit, pursuant to the rules and regulations of the Securities and Exchange Commission. Certain information and footnote disclosures, normally included in financial statements prepared in accordance with U.S. generally accepted accounting principles, have been condensed or omitted pursuant to such rules and regulations. These financial statements should be read in conjunction with the audited financial statements and the related notes included in the Company’s Annual Report on Form 10-K for the fiscal year ended December 31, 2006.
In the opinion of the Company’s management, any adjustments contained in the accompanying unaudited financial statements as of and for the three months ended March 31, 2007 are of a normal recurring nature. Operating results for the three months ended March 31, 2007 are not necessarily indicative of the results that may be expected for the year ended December 31, 2007.
(1) Organization and Summary of Significant Accounting Policies
(a) Organization
FIC was incorporated in the State of Maryland on August 20, 2003, as a wholly owned subsidiary of Fieldstone Holdings Corp. (FHC). FHC was incorporated in the State of Delaware in February 1998 as a C Corporation. In July 1998, FHC purchased 100% of the shares of Fieldstone Mortgage Company (FMC). Prior to 2003, FHC operated as a taxable C corporation. Effective January 1, 2003, FHC elected to be taxed as an S Corporation, and FMC was treated as a qualified sub-chapter S subsidiary.
In November 2003, FIC executed a reverse merger with FHC, with FIC as the surviving entity, in a transaction that was accounted for as a merger of entities under common control whereby the historical cost basis of the assets and liabilities was retained. Effective with the merger in November 2003, FIC elected to be taxed as a Real Estate Investment Trust (REIT), and FMC, its wholly owned subsidiary, elected to be taxed as a Taxable REIT Subsidiary (TRS).
In February 2004, FIC formed two wholly owned subsidiaries, Fieldstone Mortgage Ownership Corp. (FMOC) and Fieldstone Servicing Corp. (FSC), as Maryland corporations, which are treated as qualified REIT subsidiaries. FMOC holds securities and ownership interests in owner trusts and other financing vehicles, including securities issued by FIC or on FIC’s behalf. FMOC holds the residual interest in FIC’s securitized pools, as well as any derivatives designated as economic interest rate hedges related to securitized debt. FSC generally holds the rights to direct the servicing of the mortgage loans held for investment.
In May 2005, FIC formed a wholly owned, limited purpose financing subsidiary, Fieldstone Mortgage Investment Corporation (FMIC), a Maryland corporation, which is treated as a qualified REIT subsidiary. FMIC was formed for the purpose of facilitating the financing and sale of mortgage loans and mortgage-related assets by issuing and selling securities secured primarily by, or evidencing interests in, mortgage loans and mortgage-related assets.
The accompanying consolidated financial statements include the accounts of FIC and its subsidiaries (together the Company). All intercompany balances and transactions have been eliminated in consolidation.
FMC originates, purchases, and sells non-conforming and conforming residential mortgage loans and engages in other activities related to mortgage banking. FMC originates mortgage loans through wholesale and retail business channels through its network of independent mortgage brokers and a network of retail branch offices located throughout the country.
Non-conforming loans that are originated are underwritten in accordance with FMC’s underwriting guidelines designed to evaluate a borrower’s credit history, capacity, willingness, and ability to repay the loan, as well as the value and adequacy of the collateral. Conforming loans that are originated are loans that meet the underwriting criteria required for a mortgage loan to be saleable to a Government Sponsored Entity (GSE), such as Fannie Mae or Freddie Mac, or institutional investors.
5
A portion of the non-conforming loans originated by FMC are closed by FMC using funds advanced by FIC, with a simultaneous assignment of the loans to FIC. FIC finances these loans with warehouse debt or by issuing mortgage-backed securities secured by these loans. FMC sells the loans that are not assigned to FIC on a whole-loan, servicing-released basis.
Both FIC and FMC have contracted with a third party subservicer to service the loans on their behalf. Beginning in 2007, servicing rights for all loans originated are transferred to the subservicer, who has primary responsibility for performing all servicing functions, including all collection, advancing and loan level reporting obligations, maintenance of custodial and escrow accounts, maintenance of insurance and enforcement of foreclosure proceedings, at the time of funding.
FMC is licensed or exempt from licensing requirements to originate residential mortgages in 50 states and the District of Columbia. FIC is licensed or exempt from licensing requirements to fund residential mortgage loans and acquire closed residential mortgage loans in all states in which it operates.
(b) Merger Agreement
On February 15, 2007, the Company entered into a definitive Agreement of Merger (Merger Agreement) with Credit-Based Asset Servicing and Securitization LLC, a Delaware limited liability company (C-BASS), and Rock Acquisition Corp., a Maryland corporation and wholly owned subsidiary of C-BASS (Merger Sub). On March 16, 2007, the Company entered into Amendment No. 1 to the Agreement of Merger. The Merger Agreement, as amended, provides that, upon the terms and subject to the conditions set forth in the Merger Agreement, Merger Sub will be merged with and into the Company, with the Company continuing as the surviving corporation and a wholly owned subsidiary of C-BASS (the Merger). At the effective time of the Merger, each share of the Company’s common stock issued and outstanding immediately prior to the effective time of the Merger and not owned by the Company or its subsidiaries will be converted into the right to receive $4.00 in cash per share, without interest.
The Merger Agreement, as amended, and the transactions contemplated thereby were approved by the Company’s Board of Directors.
The Merger is subject to various closing conditions, including, among others: (i) the approval of the Merger Agreement, as amended, the Merger, and the other transactions contemplated by the Merger Agreement, as amended, by the affirmative vote of holders of a majority of the outstanding shares of the Company’s common stock, (ii) the receipt of required regulatory approvals, (iii) the receipt of third party required contractual consents, (iv) the continued effectiveness of certain employment and retention arrangements with certain members of management, (v) the Company’s third party servicers and subservicers agreeing to transfer the servicing of the Company’s mortgage loans to C-BASS or its designated subsidiary, (vi) certain of the Company’s lenders agreeing to extend a portion of the Company’s existing financing facilities for at least 90 days after the effectiveness of the Merger, and (vii) no event or circumstance having occurred that has resulted in, or is reasonably expected to result in, a material adverse change to the Company.
Under the Merger Agreement, as amended, the Company is not permitted to declare dividends except as required to maintain its REIT status. Additionally, the Company is generally precluded from participating in any discussions that could lead to an alternative transaction to the Merger. Similarly, the Board of Directors is restricted in its ability to withdraw or modify its recommendation that stockholders approve the Merger Agreement. In certain circumstances, the Company’s Board of Directors may be permitted to terminate the Merger Agreement and pursue a proposal that it deems to be superior. In those circumstances, the Company would be required to pay C-BASS a termination fee of $7.4 million.
The Company expects the Merger to close during the second quarter of 2007.
In addition, in connection with the Merger, C-BASS agreed to provide pre-merger liquidity to the Company, at the Company’s option by:
| | (i) | purchasing approximately $193 million of the Company’s retained securities; |
| | (ii) | purchasing approximately $46 million of the Company’s self financed inventory of loans and real estate owned; |
| | (iii) | purchasing substantially all of the unsecuritized loans held by the Company; and |
6
| | (iv) | purchasing new loans originated by the Company on or after March 1, 2007 according to credit and pricing guidelines agreed to by C-BASS. |
As of May 10, 2007, C-BASS had purchased approximately $24 million of the Company’s self-financed inventory of mortgage loans and real estate owned assets, $269 million of unsecuritized recently originated loans and seasoned mortgage loans, and approximately $193 million of retained securities pursuant to the Company’s exercise of certain of the foregoing options. On April 12, 2007, the Company issued $358.2 million of mortgage-backed bonds (FMIT Series 2007-1) through a securitization trust to finance a portion of the Company’s portfolio of loans held for investment as detailed in Note 13. C-BASS purchased 50% of the Class M7, M8 and M9 bonds and all of the Class M-10 bonds, for a total purchase of $11.6 million of bonds. Litton Loan Services LP, (Litton) an affiliate of C-BASS, was the named servicer for the 2007-1 bonds.
(c) Use of Estimates
The preparation of consolidated financial statements in conformity with GAAP requires management to make estimates and assumptions that affect the reported amounts of assets and liabilities, disclosures of contingent assets and liabilities at the date of the financial statements, and the reported amounts of revenues and expenses during the reporting period. Critical estimates include (i) an estimate of the representation and warranty liabilities related to the sale of mortgage loans; (ii) an estimate of losses inherent in mortgage loans held for investment, which is used to determine the related allowance for loan losses and realizable value of the Company’s accrued interest receivable; (iii) an estimate of the future loan prepayment rate of mortgage loans held for investment, which is used in the calculation of deferred origination and bond issuance cost amortization; (iv) the non-cash mark to market valuation of the interest rate swaps which economically hedge the Company’s securitization debt; and (v) the fair market value of equity compensation awards. Actual results could differ from those estimates. Amounts on the consolidated statements of operations most affected by the use of estimates are the provision for losses—loans sold (which is a component of “(Losses) gains on sales of mortgage loans, net”), “Provision for loan losses—loans held for investment”, “Interest income – loans held for investment”, derivative valuations (which are a component of “Other (expense) income—portfolio derivatives”), stock-based compensation (which is a component of “Salaries and employee benefits”) and deferred origination and bond issuance costs (which are components of “Net interest income” for loans held for investment and “(Losses) gains on sales of mortgage loans, net” for loans held for sale).
(d) Concentration of Credit Risk
A portion of the non-conforming mortgage loans that the Company originates are adjustable-rate mortgage (ARM) loans, the payments on which are adjustable from time to time as interest rates change after an initial period during which the loans’ interest rates are fixed and do not change, generally two or three years. After the initial fixed rate period, the borrowers’ payments on their ARM loans adjust once every six months to a pre-determined margin over a measure of market interest rates, generally the LIBOR for one-month deposits. For the three months ended March 31, 2007 and 2006, 29% and 42%, respectively, of the non-conforming mortgage loan originations were ARM loans which also have an “interest only” feature for the first five years of the loan, so that the borrowers do not begin to repay the principal balance of the loans until after the fifth year of the loans. After the fifth year of an “interest only” loan, the borrowers’ payments increase to amortize the entire principal balance owed over the remaining years of the loan.
These features will likely result in the borrowers’ payments increasing in the future. The interest adjustment feature generally will result in an increased payment after the second year of the loan and the interest only feature will result in an increased payment after the fifth year of the loan. Since these features will increase the debt service requirements of the borrowers, it may increase the risk of default on the Company’s investment portfolio of non-conforming loans for loans that remain in the Company’s portfolio for at least two years, relative to the ARM feature, or for five years, relative to the interest only feature.
For the three months ended March 31, 2007 and 2006, 57% and 55%, respectively, of non-conforming loan originations were underwritten with little or no supporting documentation of the borrowers’ income, under the Company’s “stated income” loan programs. The Company mitigates its risk on “stated income” loans through its underwriting guidelines, including setting higher minimum credit score standards for “stated income” loans and, beginning in 2007, using on-line data-bases to evaluate the income stated by the borrower. Based on its experiences with similar loans in the past, and on industry performance data, the Company believes its underwriting guidelines relating to non-conforming loans help the Company to evaluate a borrower’s credit history, willingness and ability to
7
repay the loans as well as the value and adequacy of the borrower’s collateral. The Company’s underwriting guidelines are designed to balance the credit risk of the borrower with the loan-to-value (LTV) and interest rate of the loan.
In addition, for the three months ended March 31, 2007 and 2006, 49% and 34%, respectively, of the non-conforming loan originations were loans secured by properties located in California. An overall decline in the economy or the residential real estate market or the occurrence of a natural disaster in California could adversely affect the value of the mortgaged properties in that state and increase the risk of delinquency, foreclosure, bankruptcy or loss on the non-conforming mortgage loans in the Company’s investment portfolio. The Company’s non-conforming loan originations are concentrated heavily in California because it is the largest mortgage market in the U.S. and the Company’s underwriting, product design and pricing philosophies address the characteristics of California borrowers, which the Company believes to be: non-standard credit profiles, interest in low downpayment products, payment-focused borrowers and higher home values.
(e) Industry and Operational Risks
The subprime lending market in which the Company predominantly operates experienced significant changes during 2006 that have continued into 2007. Slowing U.S. housing markets have led to a decrease in total mortgage originations, generating intense competition among lenders on both price and credit. Flattening and declining home price values, rising interest rates, and increased borrower debt have all contributed to significant increases in delinquencies and losses on subprime loans. Loss severities on defaulted loans have also increased due to flat and in some cases declining property values. Lenders have also experienced increased and accelerated repurchase requests on loans sold as first and early payment defaults increased. Declining subprime loan performance on more recent vintages has contributed to a recent reduction in the liquidity available to subprime originators, both as it relates to securitizations and credit facilities. Additionally, many subprime lenders have also experienced margin calls on the loans used as collateral. The number of potential investors in subprime securitizations has decreased while the yields demanded by the investors and the cost of offering these securitizations have increased. These factors have adversely impacted the Company’s operations as well as the operations of many of its competitors. As a result, the subprime lending industry has seen a recent increase in both bankruptcies and merger and acquisition activity, including the Company’s pending merger with C-BASS discussed above.
These factors contributed to the Company’s reduced origination volumes and sharply decreased sales margins in the first quarter of 2007, resulting in a net loss of $68.6 million in the three months ended March 31, 2007, which included a $16.0 million increase in the provision for loan losses on loans held for investment and a $7.6 million increase in the provision for losses on loans sold compared to the same period in 2006, as well as a $28.1 million charge to reflect the reduced value of loans held for sale as of March 31, 2007. The Company amended several of its credit facilities during December 2006, the first quarter of 2007, and April 2007 to amend its financial covenants, including the profitability and tangible net worth covenants, as a result of its operating losses and may need to amend the facilities again as discussed below.
In response to these conditions, the Company is decreasing its fixed cost structure and working to improve both its originations and loan performance. The Company has sought to reduce its cost structure through the consolidation of operations centers, reductions in home office staff, pricing and commission changes, implementation of a new loan origination system, and vendor re-structuring. The initiatives to improve originations include the introduction of new product offerings, including alt-A products, a simplified rate sheet, and a net value-based commission plan. Finally, the Company initiated steps to improve loan performance by eliminating products with the most significant losses, narrowing acceptable thresholds for the automated verification of broker appraisals, limiting the age of appraisals, utilizing new technology and resources to flag high risk loans prior to origination for additional manual procedures, implementing accelerated collections efforts for early stage delinquencies, increased focus on servicer work-flow, and directly boarding newly originated loans with the servicer to minimize delinquencies due to servicing transfer. The Company is evaluating additional cost management initiatives as the current market conditions continue to evolve.
The Company expects the current industry turmoil and liquidity constraints to continue in the near term. If 2007 results do not improve relative to 2006 results, the Company may violate the covenants of its credit facilities, which would subject the Company to increased liquidity risks, including the ability to generate sufficient cash flows to continue supporting current operations. In the event of a breach of a covenant contained in a facility that triggers an event of default, then the lender may accelerate outstanding principal repayment owed under the facility and such acceleration may permit other lenders to accelerate all of the outstanding principal repayment under their facilities. In
8
such a situation, the Company believes that it would be able to generate sufficient cash from existing operations, maintain sufficient liquidity, including the liquidity provided by C-BASS under the terms of the Merger Agreement, or make alternative arrangements to enable it to continue to meet its obligations for 2007. However, the Company would need to significantly restructure its operations, which would include further consolidation and work force reductions, to continue to meet its ongoing obligations in such circumstances, which could significantly adversely affect the Company’s results of operations.
(f) Recent Accounting Pronouncements
In June 2006, the Financial Accounting Standards Board (FASB) issued FASB Interpretation No. 48“Accounting For Uncertainty in Income Taxes-an interpretation of FASB Statement No. 109,”(FIN 48). FIN 48 prescribes a recognition threshold and measurement attribute for the financial statement recognition and measurement of a tax position taken or expected to be taken in a tax return. FIN 48 also provides guidance on derecognition, classification, interest and penalties, accounting in interim periods, disclosure, and transition. FIN 48 is effective for fiscal years beginning after December 15, 2006. The Company adopted FIN 48 beginning in fiscal year 2007 as detailed in Note 11 below. The implementation of FIN 48 did not have a material effect on the Company’s results of operations, statements of condition or cash flows.
In February 2006, the FASB issued Statement of Financial Accounting Standards No. 155,“Accounting For Certain Hybrid Financial Instruments-an amendment of FASB Statements No. 133 and 140,”(Statement No. 155). Statement No. 155 amends Statement No. 133 to permit fair value remeasurement for any hybrid financial instrument with an embedded derivative that otherwise would require bifurcation, provided that the whole instrument is accounted for on a fair value basis. Statement No. 155 amends Statement No. 140 to allow a qualifying special-purpose entity to hold a derivative financial instrument that pertains to a beneficial interest other than another derivative financial instrument. Statement No. 155 is effective for all financial instruments acquired, issued or subject to a remeasurement (new basis) event occurring after the beginning of an entity’s first fiscal year that begins after September 15, 2006. The Company adopted Statement No. 155 beginning in fiscal year 2007. The implementation of Statement No. 155 did not have a material effect on the Company’s results of operations, statements of condition or cash flows.
In March 2006, the FASB issued Statement of Financial Accounting Standards No. 156,“Accounting For Servicing of Financial Assets-an amendment of FASB Statement No. 140,”(Statement No. 156). Statement No. 156 amends Statement of Financial Accounting Standards No. 140,“Accounting for Transfers and Servicing of Financial Assets and Extinguishments of Liabilities,” (Statement No. 140), with respect to the accounting for separately recognized servicing rights. Statement No. 156 requires an entity to initially recognize, at fair value, a servicing asset or servicing liability each time it undertakes an obligation to service a financial asset by entering into a servicing contract in certain situations. In addition, Statement No. 156 permits the subsequent measurement of servicing assets and servicing liabilities using the fair value method or the amortization method as prescribed under Statement No. 140. Statement No. 156 is effective as of the beginning of an entity’s first fiscal year that begins after September 15, 2006. The Company adopted Statement No. 156 beginning in fiscal year 2007. The implementation of Statement No. 156 did not have a material effect on the Company’s results of operations, statements of condition or cash flows.
In September 2006, the FASB issued Statement of Financial Accounting Standards No. 157, “Fair Value Measurements” (Statement No. 157). Statement No. 157 consistently defines fair value, establishes a framework for measuring fair value in generally accepted accounting principles, and modifies fair value disclosure requirements. Statement No. 157 is effective for fiscal years beginning after November 15, 2007. The Company will adopt Statement No. 157, as applicable, beginning in fiscal year 2008. Management is currently assessing the impact that the implementation of Statement No. 157 may have on its results of operations, statements of condition or cash flows.
In February 2007, the FASB issued Statement of Financial Accounting Standards No. 159, “The Fair Value Option for Financial Assets and Financial Liabilities” (Statement No. 159). Statement No. 159 permits entities to choose to measure qualifying financial instruments at fair value. Statement No 159 is intended to provide the opportunity to mitigate fluctuations in earnings from valuation changes of qualifying instruments without needing to apply complex hedge accounting. Statement No. 159 is effective for fiscal years beginning after November 15, 2007. The Company will adopt Statement No. 159, as applicable, beginning in fiscal year 2008. Management is currently assessing the impact that the implementation of Statement No. 159 may have on its results of operations, statements of condition or cash flows.
(g) Reclassifications
Certain prior period amounts have been reclassified to conform to the current period presentation.
9
(2) Mortgage Loans Held for Sale, Gains on Sale, and Reserve for Losses—Sold Loans
Mortgage loans that the Company acquires or originates with the intent to sell in the foreseeable future are initially recorded at cost, including any premium paid or discount received, adjusted for the fair value change during the period in which the loan was an interest rate lock commitment. Loans held for sale are carried on the books at the lower of cost or market value, as calculated on an aggregate basis by type of loan.
The components of “(Losses) gains on the sales of mortgage loans, net” are as follows for the three months ended March 31, 2007 and 2006:
| | | | | | | | | | | | | | |
| | | Three Months Ended March 31, | |
($ in 000s) | | 2007 | | | % of
Sales
Volume | | | 2006 | | | % of
Sales
Volume | |
Gross (discounts) premiums - whole loan sales, net of hedging gains or losses | | $ | (16,918 | ) | | (2.1 | )% | | $ | 15,544 | | | 2.4 | % |
Fees collected, net of premiums paid1 | | | 2,013 | | | 0.2 | % | | | 1,214 | | | 0.2 | % |
Direct origination costs1 | | | (6,348 | ) | | (0.8 | %) | | | (4,451 | ) | | (0.7 | %) |
| | | | | | | | | | | | | | |
Subtotal | | | (21,253 | ) | | (2.7 | )% | | | 12,307 | | | 1.9 | % |
Allowance to reduce loans held for sale to the lower of cost or market | | | (28,073 | ) | | (3.5 | )% | | | — | | | 0.0 | % |
Provision for losses - sold loans | | | (9,945 | ) | | (1.2 | %) | | | (2,012 | ) | | (0.3 | %) |
| | | | | | | | | | | | | | |
(Losses) gains on sales of mortgage loans, net | | $ | (59,271 | ) | | (7.4 | %) | | $ | 10,295 | | | 1.6 | % |
| | | | | | | | | | | | | | |
Loan sales volume | | $ | 801,577 | | | | | | $ | 654,550 | | | | |
| | | | | | | | | | | | | | |
1 | Loan fees collected, premiums paid and direct origination costs are deferred at funding and recognized on settlement of the loan sale. |
Mortgage loans held for sale, net as of March 31, 2007 and December 31, 2006 are as follows:
| | | | | | | | |
| | | March 31,
2007 | | | December 31,
2006 | |
Mortgage loans held for sale | | $ | 640,737 | | | $ | 552,939 | |
Net deferred origination costs | | | 2,272 | | | | 1,795 | |
Premium, net of discount | | | 841 | | | | 175 | |
Allowance for the lower of cost or market value | | | (34,526 | ) | | | (4,389 | ) |
| | | | | | | | |
Total | | $ | 609,324 | | | $ | 550,520 | |
| | | | | | | | |
The Company maintains a reserve for its representation and warranty liabilities related to the sale of loans and its contractual obligations to rebate a portion of any premium received when a sold loan prepays within an agreed period. The reserve, which is recorded as a liability on the consolidated statements of condition, is established when loans are sold, and is calculated as the fair value of liabilities reasonably estimated to occur during the life of the loans. The provision is recorded as a reduction of the gains on sale of loans. At March 31, 2007 and December 31, 2006, mortgage loans held for sale included approximately $6.6 million and $6.8 million, respectively, of loans repurchased pursuant to these contractual obligations, net of any related valuation allowance. Realized losses on sold loans, net of recoveries, which were primarily related to early payment defaults, premium recaptures on early payoffs, and representation and warranty liability totaled $9.8 million and $3.9 million, or 1.39% and 0.44% of total loan sales, respectively, in the three months ended March 31, 2007 and 2006.
10
The reserve for losses—loans sold is summarized as follows for the three months ended March 31, 2007 and 2006:
| | | | | | | | | | |
Balance at December 31, 2006 | | $ | 23,052 | | | Balance at December 31, 2005 | | $ | 35,082 | |
Provision | | | 9,945 | | | Provision | | | 2,329 | |
Realized losses | | | (10,072 | ) | | Realized losses | | | (3,963 | ) |
Recoveries | | | 126 | | | Recoveries | | | 49 | |
| | | | | | | | | | |
Total at March 31, 2007 | | $ | 23,051 | | | Total at March 31, 2006 | | $ | 33,497 | |
| | | | | | | | | | |
Historically, the Company has experienced substantially all of its representation and warranty losses on loans sold during the first three years following the sale. The reserve for losses—loans sold as of March 31, 2007 relates to approximately $10.6 billion of loan sales during the period of April 1, 2004 through March 31, 2007.
Decreased interest spreads and investor concerns regarding the performance of subprime loans have contributed to decreased sales premiums available on loans held for sale. Lenders have also experienced increased and accelerated repurchase requests on loans sold due to increased first and early payment defaults. These factors have led to a decline in the market value of loans held for sale during 2006 and to date in 2007. As of March 31, 2007, the Company determined that the market value of $603.4 million of its loans held for sale as of that date was less than their carrying value. Accordingly, the Company recorded pre-tax charges of $28.1 million for the three months ended March 31, 2007 to reduce these loans to the lower of cost or market value as a reduction in the gain on sales of mortgage loans, net.
(3) Mortgage Loans Held for Investment and Allowance for Loan Losses
The Company originates fixed-rate and adjustable-rate mortgage loans that have a contractual maturity of up to 50 years. These mortgage loans are initially recorded at cost including any premium or discount. These mortgage loans are financed with warehouse debt until they are pledged as collateral for securitization financing. The Company is exposed to risk of loss from its mortgage loan portfolio and establishes an allowance for loan losses taking into account a variety of criteria including the contractual delinquency status, estimated delinquency roll rates, and estimated historical loss severities. The adequacy of this allowance for loan loss is evaluated and adjusted based on this review.
Mortgage loans held for investment, net as of March 31, 2007 and December 31, 2006 are as follows:
| | | | | | | | |
| | | March 31,
2007 | | | December 31,
2006 | |
Securitized mortgage loans held for investment | | $ | 4,587,161 | | | $ | 5,077,237 | |
Mortgage loans held for investment - warehouse financed | | | 391,833 | | | | 492,503 | |
Net deferred origination fees and costs | | | 27,918 | | | | 31,457 | |
| | | | | | | | |
Mortgage loans held for investment | | | 5,006,912 | | | | 5,601,197 | |
Allowance for loan losses—loans held for investment | | | (82,162 | ) | | | (81,859 | ) |
| | | | | | | | |
Mortgage loans held for investment, net | | $ | 4,924,750 | | | $ | 5,519,338 | |
| | | | | | | | |
The allowance for loan losses—loans held for investment for the three months ended March 31, 2007 and 2006 is as follows:
| | | | | | | | | | |
Balance at December 31, 2006 | | $ | 81,859 | | | Balance at December 31, 2005 | | $ | 44,122 | |
Provision | | | 21,436 | | | Provision | | | 5,393 | |
Realized losses | | | (21,133 | ) | | Realized losses | | | (3,771 | ) |
| | | | | | | | | | |
Balance at March 31, 2007 | | $ | 82,162 | | | Balance at March 31, 2006 | | $ | 45,744 | |
| | | | | | | | | | |
11
Mortgage loans held for investment are placed in non-accrual status for interest income recognition when they are ninety days past due as to either principal or interest or when, in the opinion of management, the collection of principal and interest is in doubt. Loans held for investment on non-accrual status were $416.0 million and $376.7 million as of March 31, 2007 and December 31, 2006, respectively, and averaged $410.4 million and $168.7 million during the three months ended March 31, 2007 and 2006, respectively. The Company reversed previously accrued interest income relating to non-performing and delinquent loans, which would ordinarily have been recognized per contractual loan terms, of $8.9 million and $2.2 million, respectively, in the quarters ended March 31, 2007 and 2006.
Prior to the second quarter of 2006, the Company utilized industry loss assumptions for loans similar in credit, loan size, and product type in making estimates regarding the allowance for loan losses because the Company had limited historical loss data on past originations, all of which were sold servicing-released prior to October 2003. Beginning in the second quarter of 2006, consistent with its previously established accounting policy, the Company began to blend its own historical delinquency experiences with industry averages in estimating the percentage of loans that are delinquent 30+ days that will ultimately go to foreclosure. This resulted in an estimate that approximately 29% of the loans 30+ days delinquent will ultimately go to foreclosure. As a result of the Company’s experience in the current market environment, it also increased the estimate of the proportion of foreclosed properties that will be transferred to real estate owned. In addition to blending its own historical delinquency experiences with industry averages, the Company began to utilize historical loss experiences in estimating loss severity for pools for which it has significant realized loss experience. Applying this methodology individually to each pool yielded an estimated average loss severity of approximately 24% for 2003, 2004, 2005 and early 2006 vintage loans. The Company uses average loss severity estimates of 27% for loans originated since the second half of 2006 for which a material level of actual realized loss experience for its own loans is not available. These underlying assumptions and estimates are periodically evaluated and updated to reflect management’s current assessment of the value of the underlying collateral, actual historical loss experience, and other relevant factors impacting portfolio credit quality and inherent losses.
(4) Warehouse Financing, Loans Held for Sale and Loans Held for Investment
As of March 31, 2007, the Company had $1.5 billion of committed warehouse lines of credit with five financial entities. There were no uncommitted warehouse lines as of March 31, 2007. The facilities are secured by mortgage loans held for investment to be securitized, mortgage loans held for sale, the related investor commitments to purchase those loans held for sale, and all proceeds thereof.
Warehouse lines of credit and repurchase facilities consist of the following as of March 31, 2007 and December 31, 2006:
| | | | | | | | | | | |
(in millions) | | Amount Outstanding as of: |
Lender | | Amount
Available | | Maturity Date | | March 31,
2007 | | December 31,
2006 |
Credit Suisse First Boston Mortgage Capital LLC1 | | $ | 400.0 | | April 2007 | | $ | 320.9 | | $ | 240.5 |
Credit Suisse, New York Branch Commercial Paper Facility1. | | | 241.0 | | July 2007 | | | 102.3 | | | 163.0 |
JPMorgan Chase Bank, N.A. | | | 250.0 | | July 2007 | | | 185.9 | | | 83.5 |
Lehman Brothers Bank, FSB1 | | | 400.0 | | January 2008 | | | 203.8 | | | 242.3 |
Merrill Lynch Bank USA | | | 200.0 | | October 2007 | | | 122.6 | | | 178.9 |
| | | | | | | | | | | |
Total | | $ | 1,491.0 | | | | $ | 935.5 | | $ | 908.2 |
| | | | | | | | | | | |
1 | The Company has amended the facility subsequent to March 31, 2007. See Note 13. |
The average outstanding amounts under these agreements were $966.2 million and $769.6 million for the three months ended March 31, 2007 and March 31, 2006, respectively, and $885.0 million for the year ended December 31, 2006. The maximum amount outstanding under these agreements at any month-end during the three months ended March 31, 2007 and 2006 was $0.9 billion for each period and $1.2 billion for the year ended December 31, 2006. The weighted average interest rate as of March 31, 2007, December 31, 2006 and March 31, 2006 was 6.1%, 5.0% and 5.3%, respectively. The interest rates are based on spreads to one month or overnight LIBOR, and are generally reset daily or weekly. The Company also pays facility fees based on the commitment amount and non-use fees.
12
Coupon interest expense and facilities fees included in total interest expense in the consolidated statements of operations, and the weighted average cost of funds of the warehouse lines of credit and repurchase facilities for the three months ended March 31, 2007 and 2006, are as follows:
| | | | | | | | | | | | |
| | | Three Months Ended March 31, | |
| | | 2007 | | | 2006 | |
| | | Amount | | Weighted
Average
Cost | | | Amount | | Weighted
Average
Cost | |
Coupon interest expense | | $ | 13,916 | | 5.8 | % | | $ | 8,360 | | 4.6 | % |
Facilities fees | | | 710 | | 0.3 | % | | | 609 | | 0.4 | % |
| | | | | | | | | | | | |
Total | | $ | 14,626 | | 6.1 | % | | $ | 8,969 | | 5.0 | % |
| | | | | | | | | | | | |
The warehouse lines generally have a term of 364 days or less. The credit facilities are secured by substantially all of the Company’s non-securitized mortgage loans and contain customary financial and operating covenants that require the Company to maintain specified levels of liquidity and net worth, maintain specified levels of profitability, restrict indebtedness and investments and require compliance with applicable laws. In the fourth quarter of 2006 and during the first quarter of 2007, the Company received margin calls on the loans collateralizing its outstanding warehouse debt as market values fell and delinquencies increased.
During January 2007, the Company completed amendments to several of its warehouse line of credit agreements, including agreements with Lehman Brothers Bank, FSB (Lehman Brothers), Credit Suisse First Boston Mortgage Capital LLC (Credit Suisse First Boston), Credit Suisse, New York Branch (Credit Suisse, New York) and JPMorgan Chase Bank, N.A. (JPMorgan Chase). The amendment to the Lehman Brothers facility changed certain definitions and covenants, including the adjusted tangible net worth, which was increased from $250 million to the higher of $350 million or the highest adjusted tangible net worth contained in any of the Company’s other warehouse lending agreements. Each of the other amendments waived the net profitability covenant through the first quarter of 2007 and lowered the adjusted tangible net worth covenant to $350 million. Additionally, the maximum aggregate purchase price for each of the facilities was amended as follows (i) the Lehman Brothers facility increased the maximum facility amount from $300 million to $400 million, (ii) the Credit Suisse First Boston facility reduced its maximum aggregate purchase price from $400 million to $300 million, (iii) the Credit Suisse, New York facility reduced its maximum aggregate purchase price from $800 million to $500 million and (iv) the JPMorgan Chase facility increased its maximum aggregate purchase price from $150 million to $250 million.
On March 30, 2007, the Company completed amendments to each of its warehouse line of credit agreements. Each of the amendments modified certain covenants of the agreements, including waiving the profitability covenant, changing the required adjusted tangible net worth to $275 million, and raising the maximum allowable leverage ratios through April 13, 2007, which was subsequently extended to May 31, 2007, in the case of the Lehman Brothers agreement, or the earlier of the expiration of the facility or July 2007 for all other agreements. Additionally, the maximum aggregate purchase price for the facilities has been amended as follows: (i) the Credit Suisse First Boston facility raised its maximum aggregate purchase price to $400 million from $300 million, (ii) the Credit Suisse, New York facility reduced its maximum aggregate purchase price from $500 million to $241 million and (iii) the Merrill Lynch facility reduced its maximum aggregate purchase price from $400 million to $200 million. Upon completing the amendments on March 30, 2007, the Company’s committed level of whole loan funding capacity was $1.5 billion. See Note 13 for amendments to the Company’s warehouse line of credit agreements subsequent to March 31, 2007.
If the Company breaches a covenant contained in a facility that triggers an event of default, then the lender may accelerate outstanding principal repayment owed under the facility and such acceleration may permit other lenders to accelerate all of the outstanding principal repayment under their facilities. Additionally, the Company is not able to make dividend distributions during any time at which it is in default under the agreements. The Company was in compliance with all of these covenants at March 31, 2007. The Company may need to amend the facilities again based on industry and operational factors. See Note 1- Industry and Operational Risks.
(5) Securitization Financing
The Company did not issue any mortgage-backed bonds through securitization trusts during the three months ended March 31, 2007. Interest rates on the Company’s outstanding bonds financing the Company’s portfolio of loans held for investment reset monthly and are indexed to one-month LIBOR. The bonds pay interest monthly based upon a spread over LIBOR. The estimated average life of the bonds is approximately 26 months, and is based on estimates and assumptions made by management. The actual period from inception to maturity may differ from management’s expectations based on the borrowers’ prepayments of their mortgages. The Company retains the option to call the transaction and repay the bonds when the remaining unpaid principal balance of the underlying mortgage loans for each pool falls below specified levels. The securitization financings include a step up stipulation which
13
provides that the bond margin over LIBOR will increase 1.5 to 2.0 times the original margin if the Company does not exercise its option to repay the bonds prior to the remaining unpaid principal balance of the underlying mortgage loans falling below specified balances.
The average securitization financing outstanding was $4.8 billion for each of the three months ended March 31, 2007 and 2006 and $5.0 billion for the year ended December 31, 2006. The unamortized bond issuance costs at March 31, 2007 and December 31, 2006 were $10.8 million and $11.5 million, respectively.
Coupon interest expense, amortization of deferred issuance costs and original issue discount included in total interest expense in the consolidated statements of operations, and the weighted average cost of funds of the securitization financing for the three months ended March 31, 2007 and 2006, are as follows:
| | | | | | | | | | | | |
| | | Three Months Ended March 31, | |
| | | 2007 | | | 2006 | |
| | | Amount | | Weighted
Average
Cost | | | Amount | | Weighted
Average
Cost | |
Coupon interest expense | | $ | 68,740 | | 5.7 | % | | $ | 59,835 | | 5.0 | % |
Amortization of deferred costs | | | 645 | | 0.0 | % | | | 2,685 | | 0.2 | % |
Amortization of bond discount | | | 973 | | 0.1 | % | | | 32 | | 0.0 | % |
| | | | | | | | | | | | |
Total | | $ | 70,358 | | 5.8 | % | | $ | 62,552 | | 5.2 | % |
| | | | | | | | | | | | |
The Company also has the ability to finance the rated securities it retains in securitizations through two repurchase facilities, each with an uncommitted amount of $200 million. The first facility is with Liquid Funding, Ltd., an affiliate of Bear Stearns Bank plc. The second facility is with Lehman Brothers, Inc. and Lehman Brothers Commercial Paper Inc. Each facility bears interest at an annual rate of LIBOR plus an additional percentage. At March 31, 2007, the Company owned $84.9 million of investment grade rated securities it retained from its previous securitizations. During the three months ended March 31, 2007, the Company sold $193.0 million of investment grade rated securities to C-BASS that the Company had previously retained in eight of its outstanding securitizations and used as collateral for borrowings under its repurchase facilities. Approximately $94.1 million of the previously retained securities bear interest at fixed rates ranging between 5.0% and 6.5%, with a weighted average interest rate of 5.3%. The remaining $98.9 million of the previously retained securities bear interest at rates between LIBOR plus 0.9% and LIBOR plus 3.5%, with a weighted average interest rate of LIBOR plus 2.9%. The previously retained securities were sold net of an aggregate original issue discount of $46.7 million, which has been allocated to the various securitized pools based on the face amount and sales price of the respective bonds issued. The original issue discount is being amortized by securitized pool using the effective interest rate method, and $45.8 million of the original issue discount was unamortized as of March 31, 2007. All of the Company’s outstanding securities, including the retained securities sold to C-BASS, are included in “Securitization financing” in the consolidated statements of condition.
14
Outstanding securitization bond financing and weighted average interest rate by series as of March 31, 2007 and December 31, 2006 is as follows:
| | | | | | | | | | | | | |
| | | March 31, 2007 | | | December 31, 2006 | |
| | | Amount
Outstanding | | | Weighted
Avg
Interest
Rate | | | Amount
Outstanding | | Weighted
Avg
Interest
Rate | |
FMIT Series 2006-S1 | | $ | 172,431 | | | 5.8 | % | | $ | 164,763 | | 5.7 | % |
FMIT Series 2006-3 | | | 781,242 | | | 5.6 | % | | | 800,298 | | 5.6 | % |
FMIT Series 2006-2 | | | 712,168 | | | 5.6 | % | | | 728,748 | | 5.6 | % |
FMIT Series 2006-1 | | | 769,706 | | | 5.6 | % | | | 795,077 | | 5.6 | % |
FMIT Series 2005-3 | | | 880,025 | | | 5.7 | % | | | 870,905 | | 5.7 | % |
FMIT Series 2005-2 | | | 601,942 | | | 5.8 | % | | | 641,172 | | 5.7 | % |
FMIT Series 2005-1 | | | 220,236 | | | 6.1 | % | | | 350,102 | | 5.8 | % |
FMIT Series 2004-5 | | | 180,677 | | | 6.8 | % | | | 233,691 | | 6.1 | % |
FMIT Series 2004-4 | | | 142,606 | | | 7.0 | % | | | 153,971 | | 6.2 | % |
FMIT Series 2004-3 | | | 95,440 | | | 6.7 | % | | | 124,940 | | 6.5 | % |
| | | | | | | | | | | | | |
| | | 4,556,473 | | | 5.8 | % | | | 4,863,667 | | 5.7 | % |
Unamortized bond discount | | | (45,754 | ) | | | | | | — | | | |
| | | | | | | | | | | | | |
Subtotal securitization bond financing | | | 4,510,719 | | | | | | | 4,863,667 | | | |
Liquid Funding repurchase facility1 | | | — | | | | | | | 111,787 | | | |
Lehman Brothers repurchase facility1 | | | 38,265 | | | | | | | 57,424 | | | |
| | | | | | | | | | | | | |
Total securitization financing | | $ | 4,548,984 | | | | | | $ | 5,032,878 | | | |
| | | | | | | | | | | | | |
1 | Facility remains open indefinitely, but may be terminated by either party at any time. |
The current carrying amount of the mortgage loans pledged to the trusts was $4.6 billion and $5.1 billion as of March 31, 2007 and December 31, 2006, respectively.
(6) Derivatives and Hedging Activities
Derivatives Relating to Mortgage Loans Held for Sale
To mitigate the interest rate risk associated with non-conforming loans that are to be sold, the Company enters into forward sales contracts of treasury note and mortgage backed securities as well as interest rate lock commitments. These derivative contracts are recognized on the statements of condition at their fair value. Changes in the fair value of these derivative contracts are included as a component of “(Losses) gains on sales of mortgage loans, net” in the consolidated statements of operations. The amounts included in both the consolidated statements of condition and the consolidated statements of operations are immaterial to the financial statements taken as a whole.
Derivatives Relating to Mortgage Loans Held for Investment
In conjunction with the financing of its portfolio of loans held for investment, the Company entered into interest rate swaps designed to be economic hedges of the floating rate debt of the warehouse and securitization debt, including swaps entered in 2005 for which the Company paid a premium to contract at below the then-current interest rates. The premiums paid on the 2005 swaps were amortized in the consolidated statement of operations over the lives of the swaps.
As of March 31, 2007, the fair value of 9 interest rate swaps with positive fair values was $6.2 million and the fair value of 13 swaps with negative fair values was $4.2 million, for a net fair value of $2.0 million. As of December 31, 2006, the fair value of 16 interest rate swaps with positive fair values was $11.0 million and the fair value of 9 interest rate swaps with negative fair values was $3.1 million, for a net fair value of $7.8 million. The swaps are not classified as cash flow hedges under Statement No. 133, and therefore, a mark to market valuation decrease of $5.8 million and an increase of $1.9 million have been included in current period earnings during the three months ended March 31, 2007 and 2006, respectively.
15
Cash settlements and non-cash changes in value that were included in “Other (expense) income —portfolio derivatives” for the three months ended March 31, 2007 and 2006 are as follows:
| | | | | | | |
| | | Three Months Ended
March 31, |
| | | 2007 | | | 2006 |
Non-cash mark to market valuation change | | $ | (5,830 | ) | | $ | 1,894 |
Net cash settlements on interest rate swaps | | | 4,248 | | | | 10,264 |
| | | | | | | |
Other (expense) income -portfolio derivatives | | $ | (1,582 | ) | | $ | 12,158 |
| | | | | | | |
(7) Discontinued Operations
During the first quarter of 2006, following the approval by the Company’s Board of Directors of a plan to sell, close or otherwise dispose of the assets of its Conforming Retail and Conforming Wholesale segments, the assets pertaining to these segments’ headquarters, all wholesale offices, and certain of its retail offices were sold to third parties. The remaining assets of the conforming division were combined with the Company’s non-conforming retail offices. The pre-tax loss on disposal was $0.9 million and is included in discontinued operations, net of income tax, in the condensed consolidated statements of operations in the first quarter of 2006.
The provisions of Statement No. 144 require the results of operations associated with these conforming wholesale and conforming retail offices to be classified as discontinued operations, net of income tax, and segregated from the Company’s continuing results of operations for all periods presented.
The results of operations and cash flows of the discontinued operations are not included in the condensed consolidated financial statements for the three months ended March 31, 2007 following the disposal of the assets of these segments during 2006. Operating results of discontinued operations, net of income tax, included in the condensed consolidated statements of operations for the three months ended March 31, 2006 are summarized as follows:
| | | | |
| | | Three Months
Ended
March 31, 2006 | |
Revenues: | | | | |
Interest income | | $ | 839 | |
Interest expense | | | 657 | |
| | | | |
Net interest income | | | 182 | |
Gains on sales of mortgage loans | | | (188 | ) |
Fees and other income | | | 41 | |
| | | | |
Total revenues | | | 35 | |
| | | | |
Expenses: | | | | |
Salaries and employee benefits | | | 1,692 | |
Occupancy | | | 272 | |
Depreciation and amortization | | | 104 | |
General and administration | | | 727 | |
| | | | |
Total expenses | | | 2,795 | |
| | | | |
Discontinued operations before income taxes | | | (2,760 | ) |
Income tax benefit | | | 1,115 | |
| | | | |
Discontinued operations, net of income tax | | $ | (1,645 | ) |
| | | | |
The impact of discontinued operations on cash flows from operating, cash flows from investing and cash flows from financing activities are separately presented in the condensed consolidated statements of cash flows for the three months ended March 31, 2006.
16
(8) Segment Information
The information presented below with respect to the Company’s reportable segments is consistent with the content of the business segment data reviewed by the Company’s management. This segment data uses a combination of business lines and channels to assess consolidated results. The Company has four reportable segments, which include two production segments, Wholesale and Retail, and two operating segments, Investment Portfolio and Corporate. The results of its former Conforming Wholesale and Conforming Retail segments are reported as discontinued operations following the sale of the majority of the assets of those two segments during the first quarter of 2006.
The Company originates loans through two production segments: a Wholesale segment which originates non-conforming loans and a Retail segment, which originates both non-conforming and conforming loans. The Investment Portfolio segment primarily includes the net interest income earned by the loans held for investment and the direct costs, including third party servicing fees, incurred to manage the portfolio. In addition, the Company has a Corporate segment that includes the reconciliation between actual revenues and costs reported in the Company’s consolidated financial statements presented in accordance with GAAP and the amounts allocated to the various segments. The Corporate segment also includes the effects of the deferral and capitalization of net origination costs as required by Statement of Financial Accounting Standards No. 91,“Accounting for Non-refundable Fees and Costs Associated with Originating or Acquiring Loans and Initial Direct Costs of Leases.” Financial information by segment is evaluated regularly by management and used in decision-making relating to the allocation of resources and the assessment of Company performance. For the purposes of segment information provided in the tables below, certain fees, origination costs, and other expenses recorded as a component of “(Losses) gains on sales of mortgage loans, net,” have been reflected in total revenues or total expenses consistent with intercompany allocations reported to the Company’s management.
The assets of the Company that are specifically identified to a segment include mortgage loans held for sale and investment, net, trustee receivable, derivative assets, and furniture and equipment, net. All other assets are attributed to the Corporate segment. Total assets by segment at March 31, 2007 and December 31, 2006 are as follows:
| | | | | | |
| | | March 31,
2007 | | December 31,
2006 |
Production - Wholesale | | $ | 537,721 | | $ | 489,242 |
Production - Retail | | | 73,382 | | | 66,056 |
Investment Portfolio | | | 4,982,429 | | | 5,631,689 |
Corporate | | | 254,438 | | | 203,798 |
| | | | | | |
Total | | $ | 5,847,970 | | $ | 6,390,785 |
| | | | | | |
Operating results by business segment for the three months ended March 31, 2007 are as follows:
| | | | | | | | | | | | | | | | | | | | |
| | | Production | | | Investment
Portfolio | | | Corporate | | | Consolidated | |
| | | Wholesale | | | Retail | | | | |
Revenues: | | | | | | | | | | | | | | | | | | | | |
Interest income | | $ | 4,681 | | | $ | 689 | | | $ | 99,068 | | | $ | 6,239 | | | $ | 110,677 | |
Interest expense | | | 2,947 | | | | 435 | | | | 76,674 | | | | 4,928 | | | | 84,984 | |
| | | | | | | | | | | | | | | | | | | | |
Net interest income | | | 1,734 | | | | 254 | | | | 22,394 | | | | 1,311 | | | | 25,693 | |
Provision for loan losses - loans held for investment | | | — | | | | — | | | | (21,436 | ) | | | — | | | | (21,436 | ) |
Gains (losses) on sales of mortgage loans, net | | | 8,496 | | | | 4,569 | | | | — | | | | (72,336 | ) | | | (59,271 | ) |
Other expense - portfolio derivatives | | | — | | | | — | | | | (1,582 | ) | | | — | | | | (1,582 | ) |
Other income (expense) | | | — | | | | 46 | | | | (1,084 | ) | | | (883 | ) | | | (1,921 | ) |
| | | | | | | | | | | | | | | | | | | | |
Total revenues | | | 10,230 | | | | 4,869 | | | | (1,708 | ) | | | (71,908 | ) | | | (58,517 | ) |
| | | | | | | | | | | | | | | | | | | | |
Direct expenses1 | | | 14,857 | | | | 5,870 | | | | 3,153 | | | | 8,607 | | | | 32,487 | |
Corporate overhead allocation | | | 4,469 | | | | 799 | | | | — | | | | (5,268 | ) | | | — | |
| | | | | | | | | | | | | | | | | | | | |
Total expenses | | | 19,326 | | | | 6,669 | | | | 3,153 | | | | 3,339 | | | | 32,487 | |
| | | | | | | | | | | | | | | | | | | | |
Loss before income taxes | | | (9,096 | ) | | | (1,800 | ) | | | (4,861 | ) | | | (75,247 | ) | | | (91,004 | ) |
Income tax benefit | | | — | | | | — | | | | — | | | | 22,372 | | | | 22,372 | |
| | | | | | | | | | | | | | | | | | | | |
Net loss | | $ | (9,096 | ) | | $ | (1,800 | ) | | $ | (4,861 | ) | | $ | (52,875 | ) | | $ | (68,632 | ) |
| | | | | | | | | | | | | | | | | | | | |
1 | The direct expenses of the Company’s Investment Portfolio include the allocation of corporate overhead, which is assessed to that segment through the transfer pricing of loans from the production segments. |
17
Operating results by business segment for the three months ended March 31, 2006 are as follows :
| | | | | | | | | | | | | | | | | | | | |
| | | Production | | | Investment
Portfolio | | | Corporate | | | Consolidated | |
| | | Wholesale | | | Retail | | | | |
Revenues: | | | | | | | | | | | | | | | | | | | | |
Interest income | | $ | 6,064 | | | $ | 1,018 | | | $ | 95,113 | | | $ | (481 | ) | | $ | 101,714 | |
Interest expense | | | 3,265 | | | | 565 | | | | 68,916 | | | | (1,225 | ) | | | 71,521 | |
| | | | | | | | | | | | | | | | | | | | |
Net interest income | | | 2,799 | | | | 453 | | | | 26,197 | | | | 744 | | | | 30,193 | |
Provision for loan losses - loans held for investment | | | — | | | | — | | | | (5,393 | ) | | | — | | | | (5,393 | ) |
Gains (losses) on sales of mortgage loans, net | | | 17,170 | | | | 6,755 | | | | — | | | | (13,630 | ) | | | 10,295 | |
Other income - portfolio derivatives | | | — | | | | — | | | | 12,158 | | | | — | | | | 12,158 | |
Other income (expense) | | | — | | | | 449 | | | | (238 | ) | | | 139 | | | | 350 | |
| | | | | | | | | | | | | | | | | | | | |
Total revenues | | | 19,969 | | | | 7,657 | | | | 32,724 | | | | (12,747 | ) | | | 47,603 | |
| | | | | | | | | | | | | | | | | | | | |
Direct expenses1 | | | 17,755 | | | | 8,912 | | | | 2,899 | | | | 4,193 | | | | 33,759 | |
Corporate overhead allocation | | | 4,200 | | | | 728 | | | | — | | | | (4,928 | ) | | | — | |
| | | | | | | | | | | | | | | | | | | | |
Total expenses | | | 21,955 | | | | 9,640 | | | | 2,899 | | | | (735 | ) | | | 33,759 | |
| | | | | | | | | | | | | | | | | | | | |
(Loss) income from continuing operations before income taxes | | | (1,986 | ) | | | (1,983 | ) | | | 29,825 | | | | (12,012 | ) | | | 13,844 | |
Income tax benefit | | | — | | | | — | | | | — | | | | 729 | | | | 729 | |
| | | | | | | | | | | | | | | | | | | | |
(Loss) income from continuing operations | | $ | (1,986 | ) | | $ | (1,983 | ) | | $ | 29,825 | | | $ | (11,283 | ) | | | 14,573 | |
| | | | | | | | | | | | | | | | | | | | |
Discontinued operations, net of income tax | | | | | | | | | | | | | | | | | | | (1,645 | ) |
| | | | | | | | | | | | | | | | | | | | |
Net income | | | | | | | | | | | | | | | | | | $ | 12,928 | |
| | | | | | | | | | | | | | | | | | | | |
1 | The direct expenses of the Company’s Investment Portfolio include the allocation of corporate overhead, which is assessed to that segment through the transfer pricing of loans from the production segments. |
(9) Earnings per Share
Information relating to the calculations of earnings per share of common stock for the three months ended March 31, 2007 and 2006 is summarized as follows:
| | | | | | | | |
| | | Three Months Ended
March 31, | |
| | | 2007 | | | 2006 | |
| Earnings per share-basic and diluted: | | | | | | | | |
(Loss) income from continuing operations | | $ | (68,632 | ) | | $ | 14,573 | |
Dividends on nonvested restricted stock | | | — | | | | (78 | ) |
| | | | | | | | |
| | | | | | | | |
(Loss) income from continuing operations available to common shareholders | | | (68,632 | ) | | | 14,495 | |
Discontinued operations, net of income tax | | | — | | | | (1,645 | ) |
| | | | | | | | |
Net (loss) income available to common shareholders | | $ | (68,632 | ) | | $ | 12,850 | |
| | | | | | | | |
Weighted average shares outstanding - basic and diluted | | | 46,745 | | | | 48,274 | |
| | |
(Loss) earnings per share- basic and diluted: | | | | | | | | |
Continuing operations | | $ | (1.47 | ) | | $ | 0.30 | |
Discontinued operations | | | — | | | | (0.03 | ) |
| | | | | | | | |
Total | | $ | (1.47 | ) | | $ | 0.27 | |
| | | | | | | | |
Effects of potentially dilutive securities are presented only in periods in which they are dilutive. For the three months ended March 31, 2007, 857,600 stock options (with strike prices of $11.60 to $19.25) and 133,750 shares of unvested restricted stock were excluded from the calculation of diluted earnings per share. For the three months ended March 31, 2006, 959,000 stock options (with strike prices of $11.60 to $19.25), and 262,500 shares of unvested restricted stock were excluded from the calculation of diluted earnings per share, as their effect was anti-dilutive.
(10) Stock-Based Compensation
Under the Company’s Equity Incentive Plan (the Stock Plan) approved by the Board of Directors and shareholders in November 2003, an aggregate of 2.7 million of share options or shares of the Company’s stock may
18
be awarded to employees, outside directors and consultants, and to any other individual whose participation in the plan is determined to be in the best interests of the Company by the Compensation Committee of FIC’s Board of Directors. Awards of common stock will be made with currently authorized but unissued common stock.
As of January 1, 2006, the Company adopted Statement of Financial Accounting Standards No. 123R,“Share-Based Payment,”(Statement No. 123R). In accordance with Statement No. 123R, the Company expenses its stock-based compensation over the applicable vesting period by applying the fair value method to stock-based compensation. The Company had elected to expense its stock-based compensation by applying the fair value method to stock-based compensation in accordance with Financial Accounting Standards No. 123,“Accounting for Stock-Based Compensation”(Statement No. 123) prior to the adoption of Statement No. 123R. Accordingly, the adoption of Statement No. 123R did not have a material effect on the Company’s consolidated statements of operations or cash flows. In accordance with Statement No. 123R, the balance of unearned compensation that was included in the Company’s consolidated statements of condition as of January 1, 2006 has been reclassified as a reduction of paid-in capital.
The Company recognized $0.6 million and $0.5 million in “Salaries and employee benefits” expense in the accompanying consolidated statements of operations for the three months ended March 31, 2007 and 2006, respectively, related to stock based compensation.
(a) Stock Options
Under the Stock Plan, the exercise price of each stock option may not be less than 100% of the fair market value of the common stock on the date of grant. Stock options typically vest ratably over a four-year period with a term fixed by the Compensation Committee of the Board of Directors (Compensation Committee) not to exceed ten years from the date of grant. Stock options with accompanying dividend equivalent rights (Options with DERs) typically cliff vest approximately four years from the date of grant with a term fixed by the Compensation Committee not to exceed seven years from the date of grant. The fair value of each option award is estimated on the date of grant using the Black-Scholes option pricing model, which takes into account the exercise price and expected life of the option, the underlying stock’s expected volatility and expected dividends, and the risk-free interest rate for the expected term of the option. The Company estimates the expected life of the options to be the contractual term of the option, the expected volatility to be the historical volatility on the date of grant, and the expected dividend yield to be the historical dividend yield (adjusted for Options with DERs) based on its historical experience. The Company estimates the risk free interest rate to be the U.S. Government treasury bill rate.
Stock option activity for the three months ended March 31, 2007 is as follows:
| | | | | | | | | | | |
Options | | Shares | | | Weighted
Average
Exercise Price | | Weighted
Average
Remaining
Contractual Term | | Aggregate Intrinsic Value |
Outstanding at January 1, 2007 | | 894,500 | | | $ | 14.29 | | 6.6 | | $ | 2,471 |
Granted | | — | | | | — | | — | | | — |
Exercised | | — | | | | — | | — | | | — |
Forfeited or expired | | (36,900 | ) | | | 14.83 | | 6.5 | | | 120 |
| | | | | | | | | | | |
Outstanding at March 31, 2007 | | 857,600 | | | | 14.26 | | 6.6 | | $ | 2,351 |
| | | | | | | | | | | |
Exercisable at March 31, 2007 | | 434,700 | | | | 15.27 | | 6.9 | | $ | 805 |
| | | | | | | | | | | |
Total compensation expense relating to nonvested stock options of $0.1 million was recorded as a component of “Salaries and employee benefits” for each of the three months ended March 31, 2007 and 2006. As of March 31, 2007, there was $1.0 million of unrecognized compensation cost related to nonvested stock options granted under the Stock Plan.
In accordance with Statement No. 123R, the Company estimates the forfeitures of nonvested options that are expected to occur, and recognizes compensation expense based on the fair value of the options that are expected to vest. The Company reviews actual forfeitures quarterly and adjusts estimated forfeiture rates as needed.
19
(b) Restricted Stock
All restricted stock awards are expensed on a straight-line method over the scheduled vesting period. Total compensation expense of $0.5 million and $0.4 million was recorded as a component of “Salaries and employee benefits” for the three months ended March 31, 2007 and 2006, respectively, relating to the nonvested restricted stock. As of March 31, 2007, there was $1.6 million of total unrecognized compensation cost related to nonvested restricted stock granted under the Stock Plan, which is expected to be recognized over a period of approximately three years.
A summary of the Company’s nonvested restricted stock and changes during the three months ended March 31, 2007 is presented below:
| | | | | | |
Nonvested Restricted Stock | | Shares | | | Weighted Average
Grant Date Fair Value |
Outstanding at January 1, 2007 | | 137,500 | | | $ | 14.40 |
Granted | | — | | | | — |
Vested | | — | | | | — |
Forfeited | | (3,750 | ) | | | 16.10 |
| | | | | | |
Outstanding at March 31, 2007 | | 133,750 | | | $ | 14.35 |
| | | | | | |
In accordance with Statement No. 123R, the Company estimates the forfeitures of nonvested restricted stock that are expected to occur, and recognizes compensation expense based on the fair value of the shares of restricted stock that are expected to vest. The Company reviews actual forfeitures quarterly and adjusts estimated forfeiture rates as needed.
(11) Income Taxes
In 2003, the Company elected to be taxed as a real estate investment trust (REIT) under Section 856(c) of the Internal Revenue Code. As a REIT, FIC generally is not subject to federal income tax. To maintain its qualification as a REIT, FIC must distribute at least 90% of its REIT taxable income to its stockholders and meet certain other tests relating to assets and income. If FIC fails to qualify as a REIT in any taxable year, FIC will be subject to federal income tax on its taxable income at regular corporate rates. FIC may also be subject to certain state and local taxes. Under certain circumstances, even though FIC qualifies as a REIT, federal income and excise taxes may be due on its undistributed taxable income. No provision for income taxes has been provided in the accompanying financial statements related to the REIT, because FIC has paid or will pay dividends in amounts approximating its taxable income.
At the time of electing to be taxed as a REIT, the Company elected to treat FMC as a TRS. A TRS is a corporation that is permitted to engage in non-qualifying REIT activities. Taxable income of a TRS is subject to federal, state, and local income taxes.
As of March 31, 2007 and December 31, 2006, an income tax receivable of $6.3 million and $6.2 million, respectively, was recorded as a component of accounts receivable in the consolidated statements of condition. The receivable primarily relates to the taxable net operating loss generated by the TRS. The net operating loss will be carried back for two years and generate a refund of approximately $6.3 million. An additional $34.4 million and $14.1 million, respectively, representing the tax benefit related to the future of the remaining TRS net operating loss is recorded as a component of “Deferred tax asset” in the consolidated statements of condition as of March 31, 2007 and December 31, 2006.
Management regularly assesses the recoverability of the deferred tax assets based on projections of future operating results and management’s tax planning strategies. Based on this evaluation, management believes that all of the deferred tax assets recorded in the consolidated financial statements at March 31, 2007 are more likely than not to be recovered. Management did not include the effects, if any, of the proposed merger with C-BASS during its evaluation of the recoverability of the deferred tax asset.
The Company adopted the provisions of FASB Interpretation No. 48, “Accounting for Uncertainty in Income Taxes,” on January 1, 2007. As part of the implementation of FIN 48, the Company evaluated its tax positions to identify and recognize any liabilities related to unrecognized tax benefits resulting from those positions that meet the provisions of FIN 48. As a result of this evaluation, the Company determined that it did not have material liabilities
20
related to any unrecognized tax benefits, and consequently the implementation of FIN 48 did not have a material impact on the Company’s consolidated financial statements. Under the provisions of FIN 48, the Company will continue to evaluate its tax positions for potential liabilities related to unrecognized tax benefits at least quarterly, but the Company does not expect FIN 48 to have a significant impact on its consolidated financial statements during 2007.
(12) Commitments and Contingencies
(a) Loan Commitments
As of March 31, 2007 and December 31, 2006, the Company had origination commitments outstanding to fund approximately $303.5 million and $541.5 million in mortgage loans, respectively. Fixed rate and hybrid ARM mortgages which are fixed for the initial two to three year term of the loan comprised all of the outstanding origination commitments. The Company had forward delivery commitments to sell approximately $0.6 billion and $0.9 billion of loans and forward contracts at March 31, 2007 and December 31, 2006, respectively, of which $365.0 million and $45.0 million, respectively, were mandatory sales of mortgage-backed securities and mandatory investor whole loan trades. Treasury note forward contracts, used to economically hedge the interest rate risk of non-conforming loans, comprised $0.2 billion and $0.9 billion of the forward delivery commitments as of March 31, 2007 and December 31, 2006, respectively.
(b) Legal Matters
In addition to the proceedings discussed below, the Company is subject to various legal proceedings in the ordinary course of business related to foreclosures, bankruptcies, condemnation, title claims, quiet title actions and alleged statutory and regulatory violations. Management believes that any liability with respect to these various legal actions, individually or in the aggregate, will not have a material adverse effect on the Company’s business, results of operations, financial position, or cash flows. However, if an unfavorable ruling were to occur in one or more of these proceedings, there exists the possibility of a material adverse impact on the Company’s financial condition, results of operations, or cash flows.
Harkness Proceeding:
On March 27, 2007, Cynthia Harkness, Fieldstone’s former General Counsel, filed a complaint with the Occupational Safety and Health Administration (OSHA) alleging discriminatory employment practices by the Company in violation of Section 806 of the Corporate and Criminal Fraud Accountability Act of 2002, Title VIII of the Sarbanes-Oxley Act of 2002 (SOX). Ms. Harkness claims, among other things, that she was terminated in retaliation for reporting purported violations of securities and other laws that she alleges were or may have been committed by certain members of the Company’s senior management. The complaint seeks reinstatement, lost wages and other special damages, and an award of attorneys’ fees and litigation expenses. On April 27, 2007, the Company filed a response with OSHA, responding to each of Ms. Harkness’ allegations, and requested that the claims be dismissed for failing to state a claim under SOX and because the events alleged in her complaint fail to establish that she was engaged in protected activity under SOX or that she was, as a result of such activity, unlawfully discharged. The Company intends to vigorously defend this claim and believes that Ms. Harkness’ complaint is without merit and that it has meritorious defenses available; however, there can be no assurance that an adverse outcome would not have a material effect on the Company’s results of operations, financial condition, or cash flows.
Shareholder Litigation:
On March 1, 2007, a purported stockholder class action lawsuit related to the Company’s pending merger with C-BASS was filed in the Circuit Court for Howard County, Maryland, naming the Company, each of its directors, and C-BASS as defendants. The lawsuit,Richard Tibbets v. Fieldstone Investment Corporation, et al. (Case No. 13-C-07-68321), alleges, among other things, that the price per share to be paid to common shareholders in connection with the merger is inadequate, that the individual director defendants breached their fiduciary duties to common shareholders in negotiating and approving the merger agreement and have breached the duty of candor by failing to provide shareholders information adequate to make an informed voting decision in connection with the merger, and that the Company and C-BASS aided and abetted the director defendants in such alleged breach. The complaint seeks the following relief: (i) a declaration that the lawsuit is properly maintainable as a class action and certification of the plaintiff as a class representative; (ii) a declaration that the director defendants have breached their fiduciary duties owed to the plaintiff and other members of the class, and that the Company and C-BASS aided and abetted such breaches; (iii) an injunction of the merger; (iv) requiring the Company’s Board of Directors to obtain the best possible price in connection with a possible sale of Fieldstone; and (v) an award of attorneys’ and experts’ fees to the plaintiff.
21
Due to the inherent uncertainties of the judicial process, the Company is unable to predict the outcome of this matter. The Company intends to vigorously defend this claim and believes that it is without merit and that the Company has meritorious defenses available; however, there can be no assurance that an adverse outcome would not have a material effect on the Company’s results of operations, financial condition, or cash flows.
Hill Litigation:
Hill, et al. v. Fieldstone Mortgage Company, et al. is a class action filed on January 16, 2002 in the Circuit Court for Baltimore City by plaintiffs, who are two individuals who obtained a second mortgage loan from FMC in 1998, in the amount of $28,000, secured by their residence, against FMC and ten other mortgage lenders that plaintiffs contend are or were the assignees of second mortgage loans in Maryland made by FMC. The lawsuit alleges, among other things, that (i) the defendants violated the Maryland Second Mortgage Loan Law, or SMLL, by failing to obtain the necessary license to provide a second mortgage loan and by charging fees unauthorized by the SMLL, and (ii) the defendants violated the Maryland Consumer Protection Act by engaging in conduct contrary to the provisions of the SMLL. The plaintiffs seek a declaratory judgment that their mortgage contract is illegal and, therefore, that they do not need to honor their obligation to repay the second mortgage loan. The plaintiffs also seek monetary damages in the amount of $300,000. FMC, and each of the other defendants, filed motions to dismiss asserting that, among other things, the plaintiffs’ claims are barred by the applicable three-year statute of limitations, the plaintiffs’ failed to properly plead a claim under the Maryland Consumer Protection Act, and the plaintiffs’ request for a judicial declaration that their mortgage contract is illegal is not a remedy available under either Maryland statutory or common law. The circuit court heard oral arguments on the motions to dismiss in January 2003. This lawsuit was consolidated with 14 other class actions with identical claims against other mortgage lenders. No motion for class certification has yet been filed in this case. On March 30, 2006, the court held a status conference with regard to this matter and requested supplemental briefings on the outstanding issues from the parties. On August 25, 2006, the court dismissed this case as to all lenders, claiming that plaintiff’s arguments were timed-barred by the statute of limitations. The plaintiffs have appealed this ruling, and oral arguments on the appeal are scheduled for June 2007.
Due to the inherent uncertainties of the judicial process, the Company is unable to predict the outcome of this matter. While the Company intends to continue to vigorously defend this claim and believe it has meritorious defenses available, there can be no assurance that an adverse outcome would not have a material effect on the Company’s results of operations, financial condition, or cash flows.
Arredondo Litigation:
Arredondo, et al. v. Fieldstone Investment, et al.,is an action filed on August 3, 2004 in the United States District Court for the District of Arizona by nine former employees of FMC alleging that their supervisors and co-workers created a hostile work environment resulting from gender discrimination, racial discrimination and retaliation in the workplace pursuant to Title VII of the Civil Rights Act of 1964, 42 U.S.C. §2000e, and the Civil Rights Act of 1866, 42 U.S.C. §1981, as amended by the Civil Rights Act of 1991, 42 U.S.C. §1981(a). Plaintiffs claim that they are entitled to money damages in the form of back pay and front pay and nominal, compensatory and punitive damages, costs and attorney fees and equitable relief. The Company filed its answer denying all relevant claims on August 25, 2004 and filed a variety of motions seeking to have some of the plaintiffs dismissed from the lawsuit for failure to exhaust their administrative remedies, to dismiss other claims as not being permitted under the statute, and finally to sever the plaintiffs for trial purposes. Plaintiffs filed a response to the motion to dismiss, sever or in the alternative, bifurcate, and on April 18, 2005, the motion to dismiss was denied. In December 2005, one of the named plaintiffs, Berrinda Arredondo, requested and was dismissed from the litigation. In October 2006, another plaintiff requested to be and was dismissed from the litigation. The discovery cutoff date was May 31, 2006. In October 2006, the court granted in part the Company’s motion to stay the proceedings while the parties proceed with mediation. During March 2007, the parties engaged in a formal mediation and agreed in principle to settle the matter for a global payment, which amount is covered by the Company’s insurance carrier. The parties are in the process of finalizing the settlement agreement.
22
Bass Litigation:
On May 24, 2004, all of the Company’s former shareholders (the Former Shareholders) whose shares were redeemed following the closing of the Company’s Rule 144A equity offering in 2003 (the 144A Offering), filed an action in the District Court of Tarrant County, Texas, against FMC and KPMG LLP (KPMG), alleging that the Former Shareholders whose shares were redeemed for approximately $188.1 million, were entitled to an additional post-closing redemption price payment of approximately $19.0 million.
On February 14, 2007, FMC and KPMG entered into a Rule 11 Comprise Settlement Agreement and Mutual Release (the Settlement Agreement) with the Former Shareholders relating to the price paid to redeem the Former Shareholders’ shares. Pursuant to the Settlement Agreement, the Company agreed to pay the Former Shareholders a total of $10.6 million in settlement of all outstanding claims, and all of the parties to the Settlement Agreement agreed to the mutual release of all claims they may have against each other arising out of or in connection with the 144A Offering. On February 21, 2007, the Company paid the Former Shareholders the foregoing settlement amount in satisfaction of its obligations under the Settlement Agreement. The lawsuit was dismissed with prejudice by the District Court of Tarrant County, Texas, on February 22, 2007.
Rhodes Litigation:
On January 9, 2006, a class action lawsuit was filed naming FMC in the Northern District of Illinois (Eastern Division) alleging violations of the Fair Credit Reporting Act (FCRA). The class action is entitledRhodes v. Fieldstone Mortgage Company. Plaintiff alleges that FMC violated the firm offer of credit guidelines encapsulated in 15 U.S.C. §1681 et seq. during its mail marketing campaign in or around April 2005. Specifically, plaintiff alleges that FMC did not comply with the statutory guidelines in providing a firm offer of credit to the potential consumer. Pursuant to 15 U.S.C. §1681 et seq., statutory damages can range from $100 to $1,000 per mailing in the event that the violation is deemed willful. In August 2006, the parties engaged in a mandatory settlement conference and have agreed to settlement terms. The final terms of the settlement agreement were approved by the trial court on March 7, 2007, and include a payout to the class (including the class representative) and plaintiff’s attorney for attorney’s fees and costs in an amount of approximately $0.5 million, which has been scheduled for the second quarter of 2007. The Company has currently recorded a reserve of $0.5 million with respect to this matter.
(13) Subsequent Events
(a) Securitization Financing
On April 12, 2007, the Company issued $358.2 million of mortgage-backed bonds (FMIT Series 2007-1) through a securitization trust to finance a portion of the Company’s portfolio of loans held for investment. The bonds contain similar provisions to the Company’s previous securitizations, which are detailed in Note 5 above. The bonds bear interest at rates between LIBOR plus 0.257% to LIBOR plus 2.25%. One class of bonds from FMIT Series 2007-1, with a face amount of $4.1 million, bear interest at a fixed rate of 7.00%.
The Company expects to incur issuance costs of approximately $1.5 million that will be deferred and amortized over the estimated life of the bonds.
(b) Line of Credit Agreement Amendments
On April 23, 2007, the Company entered into Amendment No. 9 (the Ninth Amendment) to the Second Master Repurchase Agreement, dated as of March 31, 2005, as amended (the CSFB Master Repurchase Agreement), with Credit Suisse First Boston Mortgage Capital LLC. The Ninth Amendment extends the termination date of the CSFB Master Repurchase Agreement to the earlier of (a) September 30, 2007 and (b) June 30, 2007, should the Company’s pending merger with C-BASS not be consummated by such date. The Ninth Amendment also requires that the Company maintain available borrowing capacity from all of their credit facility providers such that the maximum aggregate purchase price under the CSFB Master Repurchase Agreement ($400 million) does not represent more than fifty percent of the Company’s available borrowing capacity from all sources, and further limits the maximum available purchase price under the CSFB Master Repurchase Agreement by the aggregate outstanding purchase price of all purchased mortgage loans allocated to the Credit Suisse Buying Group under the Amended and Restated Purchase Agreement, dated as of November 14, 2006, as amended, among the Company, Credit Suisse New York Branch, the conduit buyers and committed buyers party thereto from time to time.
23
On April 30, 2007, the Company entered into the Eighth Amendment (the Eighth Amendment) to the Second Amended and Restated Master Repurchase Agreement Governing Purchases and Sales of Mortgage Loans, dated as of December 29, 2004, as amended (the Lehman Master Repurchase Agreement), with Lehman Brothers Bank, FSB (Lehman Brothers). The Eighth Amendment extends the amendment period that the Company received from Lehman Brothers with respect to certain covenants, including the adjusted tangible net worth covenant, the minimum liquidity covenant, and the maximum permitted combined ratio of consolidated indebtedness to adjusted tangible net worth from April 30, 2007 to May 31, 2007. The Eighth Amendment also reduces the maximum aggregate purchase price under the Lehman Master Repurchase Agreement from $400 million to $200 million and changes the repurchase facility from a committed facility to an uncommitted facility. There were no borrowings under the facility as of April 30, 2007.
On May 7, 2007, the Company and Credit Suisse, New York Branch, mutually terminated the Amended and Restated Master Repurchase Agreement, dated as of November 14, 2006, as amended. The Company was not required to pay any termination fees in connection with the termination of the facility. Prior to the termination, the Credit Suisse, New York facility provided for a maximum aggregate purchase price of $241 million. There were no borrowings under the facility as of May 7, 2007.
As of May 7, 2007, after all of the preceding amendments, the Company had committed whole loan funding capacity of $850 million and uncommitted whole loan funding capacity of $200 million, for an aggregate of $1.05 billion of total funding capacity.
24
| ITEM 2. | MANAGEMENT’S DISCUSSION AND ANALYSIS OF FINANCIAL CONDITION AND RESULTS OF OPERATIONS. |
Certain statements in Management’s Discussion and Analysis (MD&A), other than purely historical information, including estimates, projections, statements relating to our business plans, objectives and expected operating results, and the assumptions upon which those statements are based, are “forward-looking statements” within the meaning of the Private Securities Litigation Reform Act of 1995, Section 27A of the Securities Act of 1933 and Section 21E of the Securities Exchange Act of 1934. These forward-looking statements generally are identified by the words “believe,” “project,” “expect,” “anticipate,” “estimate,” “intend,” “strategy,” “plan,” “may,” “should,” “will,” “would,” “will be,” “will continue,” “will likely result,” and similar expressions. Forward-looking statements are based on current expectations and assumptions that are subject to risks and uncertainties which may cause actual results to differ materially from the forward-looking statements. A detailed discussion of risks and uncertainties that could cause actual results and events to differ materially from such forward-looking statements is included in the section entitled “Risk Factors” (refer to Part II, Item 1A) and in Item 1A of our Annual Report for the fiscal year ended December 31, 2006. We undertake no obligation to update or revise publicly any forward-looking statements, whether as a result of new information, future events, or otherwise.
Recent Developments
On February 15, 2007, we entered into a definitive Agreement of Merger (Merger Agreement) with Credit-Based Asset Servicing and Securitization LLC, a Delaware limited liability company (C-BASS), and Rock Acquisition Corp., a Maryland corporation and wholly owned subsidiary of C-BASS (Merger Sub). On March 16, 2007, we entered into an amendment to the Merger Agreement. The Merger Agreement, as amended, provides that, upon the terms and subject to the conditions set forth in the Merger Agreement, as amended, Merger Sub will be merged with and into Fieldstone, with Fieldstone continuing as the surviving corporation and a wholly owned subsidiary of C-BASS (the Merger). At the effective time of the Merger, each share of our common stock issued and outstanding immediately prior to the effective time of the Merger and not owned by Fieldstone or its subsidiaries will be converted into the right to receive $4.00 in cash per share, without interest.
The Merger Agreement, as amended, and the transactions contemplated thereby were approved by our Board of Directors.
The Merger is subject to various closing conditions, including, among others: (i) the approval of the Merger Agreement, as amended, the Merger and the other transactions contemplated by the Merger Agreement, as amended, by the affirmative vote of holders of a majority of the outstanding shares of Fieldstone’s common stock, (ii) the receipt of required regulatory approvals, (iii) the receipt of third party required contractual consents, (iv) the continued effectiveness of certain employment and retention arrangements with certain members of management, (v) Fieldstone’s third party servicers and subservicers agreeing to transfer the servicing of Fieldstone’s mortgage loans to C-BASS or its designated subsidiary, (vi) certain of Fieldstone’s lenders agreeing to extend a portion of Fieldstone’s existing financing facilities for at least 90 days after the effectiveness of the Merger, and (vii) no event or circumstance having occurred that has resulted in, or is reasonably expected to result in, a material adverse change to our Company.
In addition, to provide pre-merger liquidity, C-BASS agreed to purchase at the Company’s option, certain of our assets, including certain of our retained securities and substantially all of our inventories of non-securitized loans, and C-BASS and we have agreed to the forward sale of our future loan production to C-BASS for loans originated on or after March 1, 2007, which is exercisable at our option. As of May 10, 2007, C-BASS had purchased approximately $24 million of our self-financed inventory of mortgage loans and real estate owned assets, $269 million of unsecuritized recently originated loans and seasoned mortgage loans, and approximately $193 million of our retained securities pursuant to our exercise of certain of the foregoing options. On April 12, 2007, we completed a securitization of approximately $358 million of notes by Fieldstone Mortgage Investment Trust, Series 2007-1. C-BASS purchased 50% of the Class M7, M8 and M9 bonds and all of the Class M-10 bonds, for a total purchase of $11.6 million of bonds. Litton Loan Services LP, (Litton) an affiliate of C-BASS, was the named servicer for the 2007-1 bonds.
Industry and Operational Risks
The subprime lending market, in which we predominantly operate, experienced significant changes during 2006 that have continued into 2007. Slowing U.S. housing markets have led to a decrease in total mortgage originations, generating intense competition among lenders on both price and credit. Flattening and declining home price values,
25
rising interest rates, and increased borrower debt have all contributed to significant increases in delinquencies and losses on subprime loans. Loss severities on defaulted loans have also increased due to flat and in some cases declining property values. Lenders have also experienced increased and accelerated repurchase requests on loans sold as first and early payment defaults increased. Declining subprime loan performance on more recent vintages has contributed to a recent reduction in the liquidity available to subprime originators, both as it relates to securitizations and credit facilities. Additionally, many subprime lenders have also experienced margin calls on the loans used as collateral. The number of potential investors in subprime securitizations has decreased while the yields demanded by the investors and the cost of offering these securitizations have increased. These factors have adversely impacted our operations as well as the operations of many of our competitors. As a result, the subprime lending industry has seen a recent increase in both bankruptcies and merger and acquisition activity, including our pending merger with C-BASS discussed above.
These factors contributed to our reduced origination volumes and sharply decreased sales margins in the first quarter of 2007, resulting in a net loss of $68.6 million in the three months ended March 31, 2007, which included a $16.0 million increase in the provision for loan losses on loans held for investment and a $7.6 million increase in the provision for losses on loans sold compared to the same period in 2006, as well as a $28.1 million charge to reflect the reduced value of loans held for sale as of March 31, 2007. We amended several of our credit facilities during December 2006, the first quarter of 2007, and April 2007 to amend our financial covenants, including the profitability and tangible net worth covenants, as a result of our operating losses and may need to amend the facilities again as discussed below.
In response to these conditions, we are decreasing our fixed cost structure and working to improve both our originations and loan performance. We have sought to reduce our cost structure through the consolidation of operations centers, reductions in home office staff, pricing and commission changes, implementation of a new loan origination system, and vendor re-structuring. The initiatives to improve originations include the introduction of new product offerings, including alt-A products, a simplified rate sheet, and a net value-based commission plan. Finally, we initiated steps to improve loan performance by eliminating products with the most significant losses, narrowing acceptable thresholds for the automated verification of broker appraisals, limiting the age of appraisals, utilizing new technology and resources to flag high risk loans prior to origination for additional manual procedures, implementing accelerated collections efforts for early stage delinquencies, increased focus on servicer work-flow, and directly boarding newly originated loans with the servicer to minimize delinquencies due to servicing transfer. We are evaluating additional cost management initiatives as the current market conditions continue to evolve.
We expect the current industry turmoil and liquidity constraints to continue in the near term. If 2007 results do not improve relative to 2006 results, we may violate the covenants of our credit facilities, which would subject us to increased liquidity risks, including the ability to generate sufficient cash flows to continue supporting current operations. In the event of a breach of a covenant contained in a facility that triggers an event of default, then the lender may accelerate outstanding principal repayment owed under the facility and such acceleration may permit other lenders to accelerate all of the outstanding principal repayment under their facilities. In such a situation, we believe that we would be able to generate sufficient cash from existing operations, maintain sufficient liquidity, including the liquidity provided by C-BASS under the terms of the Merger Agreement, or make alternative arrangements to enable as to continue to meet our obligations for 2007. However, we would need to significantly restructure our operations, which would include further consolidation and work force reductions, to continue to meet our ongoing obligations in such circumstances, which could significantly adversely affect our results of operations.
Executive Overview
We are a mortgage real estate investment trust (REIT) that invests in non-conforming loans originated by our wholly owned subsidiary, FMC, which we finance by issuing mortgage-backed securities. Through FMC, we originate, service, and sell non-conforming single-family residential mortgage loans through our wholesale origination channel and both non-conforming and conforming single-family residential mortgage loans through our retail origination channel.
Our primary sources of income are the interest income on our loans held for investment, net of the interest expense of financing those loans, the cash gains on sales of mortgage loans that we choose not to hold for investment which include origination fees collected at funding, and the net interest income on loans held for sale during the period from origination to date of sale.
26
We reported a net loss of $68.6 million for the three months ended March 31, 2007, compared to net income of $12.9 million for the three months ended March 31, 2006. The decrease in net income was due primarily to decreases in both our net gains on sale and net interest income, an increase in our provision for loan losses, and an unfavorable fluctuation in the mark to market valuation of our derivative contracts.
Our net interest income decreased to $25.7 million in the three months ended March 31, 2007 from $30.2 million in the same period in 2006 due primarily to a decrease in our average interest spread, which is the difference between the coupon interest rate on our loans to borrowers and the interest rate we incur for the debt financing of the loan. Net interest margin, including the net cash received on our swaps, declined to 2.0% in the three months ended March 31, 2007 from 2.6% in the same period of the prior year. The cost of financing for loans held for investment increased as our weighted average swap rate rose as older, lower rate swaps expired and were replaced with new swaps at current market rates, resulting in an increase in our weighted average swap rate to 4.92% as of March 31, 2007 from 3.52% as of the three months ended March 31, 2006. Market competition for new loans remained intense, as slowing U.S. housing markets have led to a decrease in total mortgage originations, and did not permit coupons on new originations to increase at the same rate as the increase in our financing costs for the loans, narrowing the spreads available on new loans. Our total balance of loans was comparable in the three months ended March 31, 2007 and 2006.
Gains on sales of mortgage loans, net decreased to a loss of $59.3 million for the three months ended March 31, 2007, compared with a gain of $10.3 million for the same period in 2006 due to the charges required to reduce the carrying value of loans held for sale as of March 31, 2007 to their lower of cost or market value, significant investor repurchase requests, and decreased sales premiums earned during the three months ended March 31, 2007. The decreased gains on sales, net, was attributable to charges required to reduce the carrying value of loans held for sale due to a decline in the market value of certain loans held for sale due to the deteriorating industry and economic factors noted above, which resulted in pre-tax charges of $28.1 million during the three months ended March 31, 2007, which was recorded as a component of “(Losses) gains on sales of mortgage loans, net.” No comparable charges were recorded for the three months ended March 31, 2006. The decrease in gains on sales of mortgage loans, net is also attributable to charges related to our repurchase liability relative to loans sold which become delinquent within a specified period of the date of sale, which is recorded as a reduction in gains on sale. The provision for losses on loans sold increased by $7.6 million for the three months ended March 31, 2007 compared to the same period in 2006. Sales premiums have declined due to higher forecast losses on subprime loans, lack of investor demand for subprime loans, higher risk premiums charged by investors to purchase subprime loans, the reduced interest spreads available on new loans, and discounted sales within the subprime industry related to current market conditions. We expect sales premiums to remain at lower levels for the near term.
Our provision for loan losses increased to $21.4 million in the three months ended March 31, 2007 from $5.4 million in the same period in 2006 as the result of the increase in delinquencies on more recent loan originations, the general deterioration of the performance of subprime loans throughout the industry, as well as the aging of our portfolio. In response to the rising delinquencies and losses, we have initiated steps to improve our loan performance by eliminating products with the most significant losses, narrowing acceptable thresholds for the automated verification of broker appraisals, limiting the age of appraisals, utilizing new technology and resources to flag high risk loans prior to origination for additional manual procedures, implementing accelerated collections efforts on early stage delinquencies, increased internal staffing and focus on servicer work-flow, and directly boarding newly originated loans with the servicer to minimize delinquencies due to servicing transfer.
We use interest rate swaps and caps to economically hedge the variable rate financing costs for the fixed rate period of our hybrid ARM mortgage loans held for investment. Because these derivatives are not designated as cash flow hedges under Statement of Financial Accounting Standards No. 133, “Accounting for Derivative Instruments and Hedging Activities,”(Statement No. 133) changes in the fair market value of the swaps and caps are recognized in current period earnings and reported in our consolidated statement of operations in “Other (expense) income —portfolio derivatives.” Net cash settlements, representing the difference between the swapped interest rate and the actual interest rates, are also recognized in the line item “Other (expense) income – portfolio derivatives” on the consolidated statements of operations. Our policy has been to hedge approximately 90% of the debt collateralizing our loans held for investment during their fixed interest rate period, “locking in” the interest spread for the hedged debt. Results of operations for the three months ended March 31, 2007 include losses of $5.8 million related to the decreases in the fair market value of our derivative contracts compared to gains of $1.9 million for the first quarter of 2006. Results of operations also reflect our receipt of $4.2 million of cash settlements from our swaps in the first quarter of 2007, which is a $6.0 million decrease in the net cash settlements received on derivative contracts in the first quarter of 2007 compared to the prior year as a result of fluctuations in the swapped interest rate and the actual LIBOR during the period. The mark to market valuation changes of our derivative contracts fluctuate based on
27
changes in the market’s estimates of future interest rates, as evidenced by changes to the forward LIBOR curve. The current decline in the market value of existing swaps indicates the expectation of an offsetting future decline in bond interest expense, and our net cash flow on the loans and debt outstanding remain the same regardless of whether the forecast changes in interest rates occur. We cannot predict the future path of interest rates, nor can we predict in a definitive manner the magnitude by which these changes in interest rates may impact our results of operations during periods of interest rate volatility.
Our portfolio of loans held for investment, net, was approximately $4.9 billion and $5.5 billion as of March 31, 2007 and December 31, 2006, respectively. As of September 30, 2006, we had exceeded our initial target leverage of 13:1. As a result, almost all of our loans originated since that time have been classified as held for sale, and the portfolio has gradually decreased as loans held in the portfolio have been repaid. As of March 31, 2007, the financing debt on the loans held in our portfolio was 15.7 times our equity due to the decrease in equity resulting from our net loss. Our portfolio leverage target remains 13:1, and we are currently classifying almost all loans originated as held for sale in an attempt to approach this target. Industry factors, including the decreased number of investors in subprime securitizations and the increased cost to perform such securitizations have also contributed to our election of this strategy. The percentage of our originations we retain for the portfolio in any given period will vary based upon our leverage, prepayments during the quarter, and the availability of loans which meet our cash flow, credit, and projected return criteria. In the near term, we intend to maintain our current strategy of classifying the majority of 2007 originations as held for sale.
We originated $0.8 billion of mortgage loans during the first quarter of 2007, a 21% reduction from the $1.0 billion originated by our continuing operations during the first quarter of 2006. Industry-wide origination volumes decreased in the first quarter of 2007 compared to the same period in 2006 due to industry and economic factors, and resulted in heightened competition for new loan originations on both price and credit. In response to these market conditions, we have implemented initiatives to improve originations, including the introduction of alt-A products, a simplified rate sheet, and a net value-based commission plan. Additionally, we have experienced a shift in the mix of our originations as a result of current industry conditions. Underwriting guidelines and product pricing have changed as a result of current conditions, and accordingly a decreasing percentage of our originations have come under our “interest only” programs, “stated income” programs, and adjustable rate products.
Net cost to produce was 4.02% in the first quarter of 2007 compared to a cost to produce of 3.52% for our continuing operations in the first quarter of 2006, due primarily to the 2007 reduction in funding volumes over which fixed expenses are allocated between periods. Cost to produce for the first quarter of 2007 also includes $0.8 million of costs related to the consolidation of operations centers that have been accelerated and recognized in the current quarter in accordance with GAAP, while no comparable charges were included in 2006. We have reduced our operating structure to maximize efficiency as the market has continued to deteriorate. To reduce our cost to produce and improve our ability to compete effectively, we have implemented a number of cost reduction initiatives, including significant consolidation of operations centers, a reduction in home office staff, pricing and commission changes, implementation of our new loan origination system, and vendor re-structuring.
Key Components of Financial Results of Operations
Revenues
Our revenues are based primarily on the spread between the interest income we receive from the loans we fund for investment and the interest expense on the debt financing those loans, sale margins on our loans held for sale, prepayments on our mortgage loans held for investment, credit losses on our investment portfolio, and fees collected on new originations. During periods of rising interest rates, we would generally increase the mortgage interest rates we charge on our loan originations, but we will also experience an increase in our costs of borrowing to finance the loans. If the rise in borrowing costs is greater than the increase in the coupon on new originations of loans held for investment, as we have experienced throughout 2006 and to date in 2007, net interest income spread will be lower on the new loans replacing the older loans as they prepay. Rising interest rates may lead to decreases in loan prepayments of our hybrid adjustable-rate mortgages during the initial loan period in which our borrowers pay a fixed interest rate, generally during the first two to three years of the loan, but increase prepayments at or near the reset date of the loan, when the coupon resets to a six-month LIBOR-based ARM reflecting the higher market rates. Decreases in prepayment speeds result in lower prepayment fee income, but offer higher net interest income and potential expense reductions in the form of decreases to the rate of amortization of deferred origination costs and bond issuance costs, which are recorded as a reduction in yield.
28
Expenses
The principal factors which lead to changes in our expenses are funding volumes, the number of production facilities we operate, the staffing required to support our origination platform, the balance of our investment portfolio incurring third party servicing fees, and the corporate overhead required to support a public company. We would generally expect a positive correlative between funding volumes and salaries, employee benefit expenses, and variable loan related expenses. Independent of funding volumes, we have experienced increased costs related to compliance with the Sarbanes-Oxley Act of 2002, SEC reporting, and professional services fees during the time that we have operated as a public company. We have also incurred increased expenses related to the implementation of our new loan origination software system and our pending merger with C-BASS.
Critical Accounting Policies
We consider the policies discussed below to be critical to an understanding of our financial statements because their application places the most significant demands on the judgment of our management, with financial reporting results relying on estimates and assumptions about the effects of matters that are inherently uncertain. Specific risks for these critical accounting policies are described in the following paragraphs. While we believe that the estimates and assumptions management utilizes in preparing our financial statements are reasonable, such estimates and assumptions routinely require periodic adjustment. Actual results could differ from our estimates, and these differences could be significant.
Securitizations
We must comply with the provisions of Statement of Financial Accounting Standards No. 140,“Accounting for Transfers and Servicing of Financial Assets and Extinguishments of Liabilities,” (Statement No. 140) relating to each securitization. Depending on the structure of the securitization, it will either be treated as a sale or secured financing for financial statement purposes. We account for our securitizations of mortgage loans as secured financings, and accordingly, we include the securitized mortgage loans on our books as mortgage loans held for investment. The loans are sold to a trust which is a wholly-owned special purpose entity for purposes of credit ratings; however, because the securitizations are designed as secured financings, they are designed not to meet the qualifying special purpose entity criteria of Statement No. 140.
Allowance for Loan Losses—Loans Held for Investment
Because we maintain our loans held for investment on the statements of condition for the life of the loans, we maintain an allowance for loan principal losses based on our estimates of the losses inherent in the portfolio. This is a critical accounting policy because of the subjective nature of the estimates required and potential for imprecision. Two critical assumptions used in estimating the loss reserve are an assumed rate at which the loans go into foreclosure subsequent to initial default and an assumed loss severity rate, which represents the expected rate of realized loss upon disposition of the properties that have been foreclosed. Prior to the second quarter of 2006, we utilized industry loss assumptions for loans similar in credit, loan size, and product type in making estimates regarding the allowance for loan losses because we had limited historical loss data on past originations, all of which were sold servicing-released prior to October 2003. At that time, we began to blend our own historical delinquency experiences with industry averages in estimating the percentage of loans that are delinquent 30+ days that will ultimately go to foreclosure. This resulted in an estimate that approximately 29% of the loans 30+ days delinquent will ultimately go to foreclosure. As a result of our actual experience in the current market environment, we also increased our estimate of the proportion of foreclosed properties that will be transferred to real estate owned. In addition to blending our own historical delinquency experiences with industry averages, we began to utilize historical loss experiences in estimating loss severity for pools for which we have significant realized loss experience. Applying this methodology individually to each pool yielded an estimated average loss severity of approximately 24% for 2003, 2004, 2005 and early 2006 vintage loans. We continue to use average loss severity estimates of 27% for loans originated since the second half of 2006 for which a material level of actual realized loss experience for our own loans is not available. These underlying assumptions and estimates are periodically evaluated and updated to reflect management’s current assessment of the value of the underlying collateral, actual historical loss experience, and other relevant factors impacting portfolio credit quality and inherent losses.
We define the beginning of the loss emergence period for a mortgage loan to be the occurrence of a contractual delinquency greater than 30 days. On a monthly basis, loans meeting this criterion are included in a determination of the allowance for loan losses based on roll rate and loss severity estimates. We assess homogenous groups of loans collectively for impairment. If actual results differ from our estimates, we may be required to adjust our provision accordingly. The use of different estimates or assumptions could produce different provisions for loan losses.
29
The provision for losses is charged to our consolidated statements of operations. Losses incurred on the disposition of delinquent mortgage loans held for investment are charged to the allowance at the earlier of the time of liquidation or at the time the loan is transferred to real estate owned. Subsequent gains or losses at property disposal are recorded as a component of “Other (expense) income” on our consolidated statements of operation.
We place individual loans on non-accrual status when they are 90 days or more past-due or when, in the opinion of management, the collection of principal and interest is in doubt. At the time an individual loan is placed on non-accrual status, all previously accrued but uncollectible interest is reversed against current period interest income. In addition, we reserve for interest income accrued on our pool of homogeneous 30 and 60 day delinquent loans by estimating the interest due on the pool of loans that migrate to non-accrual status in the future on the basis of the same loss roll rate assumptions.
30
Amortization of Deferred Loan Origination Costs and Deferred Debt Issuance Costs
Interest income on our mortgage loan portfolio is a combination of the accrual of interest based on the outstanding balance and contractual terms of the mortgage loans, adjusted by the amortization of net deferred origination costs related to originations in our investment portfolio, in accordance with Statement of Financial Accounting Standards No. 91, “Accounting for Nonrefundable Fees and Costs Associated with Originating or Acquiring Loans and Initial Direct Costs of Leases” (Statement No. 91). Our net deferred origination costs consist primarily of premiums, discounts and other net fees or costs directly associated with originating our mortgage loans, including commissions paid on closed loans. For our loans held for investment, these net deferred costs are amortized as adjustments to interest income over the estimated lives of the loans using the effective interest method. Because we hold a large number of similar loans for which prepayments are probable and for which we can reasonably estimate the timing of such prepayments, we use prepayment estimates in determining periodic amortization based on a model that considers actual prepayment experience to-date as well as forecasted prepayments based on the contractual interest rate on the loans, loan age, loan type, prepayment fee coverage and a variety of other factors. Mortgage prepayment forecasts are also affected by the terms and credit grades of the loans, conditions in the housing and financial markets, relative levels of interest rates, and general economic conditions. Prepayment assumptions are reviewed regularly to ensure that actual experience and industry data are supportive of prepayment assumptions used in our model. Updates that are required to be made to these estimates are applied as if the revised estimates had been in place since the origination of the loans and may result in adjustments to the current period amortization recorded to interest income.
Interest expense on our warehouse and securitization financing is a combination of the accrual of interest based on the contractual terms of the financing arrangements and the amortization of bond original issue discounts and issuance costs. The amortization of bond original issue discounts and issuance costs also considers estimated prepayments and is calculated using the effective interest method. The principal balance of the securitization financing is repaid as the related collateral principal balance amortizes, either through receipt of monthly mortgage payments or any loan prepayment. The deferred issuance costs and original issue discounts are amortized through interest expense over the estimated life of the outstanding balance of the securitization financing, utilizing the prepayment assumptions referenced above to estimate the average life of the related debt. Updates that are required to be made to these estimates are applied as if the revised estimates had been in place since the issuance of the related debt and result in adjustments to the period amortization recorded to interest expense.
We have sought to partially offset the impact to our net interest income of faster than anticipated prepayment rates by originating mortgage loans with prepayment fees. These fees typically expire two years after origination of a loan. As of March 31, 2007, approximately 84.9% of our mortgage loan portfolio had prepayment fee features. We anticipate that prepayment rates on our portfolio will increase as these predominately adjustable-rate loans reach their initial adjustments, typically 24 months after funding the loans. The varying prepayment rate, referred to on an annualized basis as the constant prepayment rate, or CPR, will be reforecast each quarter to project cash flows based upon historical industry data for similar loan products in the context of the current markets and our actual history to date. The forward-looking expected CPR used in our current assumptions averages 20 CPR during the first 12 months, averages 32 CPR through month 21, and increases to an average of 59 CPR during the months on and around the reset date, declining to an average 38 CPR thereafter. If prepayment speeds increase, our net interest margin would decrease due to the additional cost amortization, which may be partially offset by an increase in prepayment fee income. Conversely, if prepayment speeds decrease, our net interest margin would increase due to the reduced cost amortization, which may be partially offset by a decrease in prepayment fee income.
Economic Hedges
The economic hedging of our interest rate risk related to our loans held for sale is a critical aspect of our business because of its interest rate sensitivity and the difficulty in estimating which interest rate locks will convert to closed loans as interest rates fluctuate. We use various financial instruments to economically hedge our exposure to changes in interest rates. The financial instruments typically include mandatory delivery forward sale contracts of mortgage-backed securities, mandatory and best efforts whole-loan sale agreements and treasury note forward sales contracts. These financial instruments are intended to mitigate the interest rate risk inherent in providing interest rate lock commitments to prospective borrowers and to economically hedge the value of our loans held for sale prior to entering fixed price sale contracts.
31
The interest rate locks for conforming loans and the mandatory forward sales, which are typically used to economically hedge the interest rate risk associated with these locks, are undesignated derivatives and are marked to market through earnings. For interest rate lock commitments related to conforming loans, mark to market adjustments are recorded from inception of the interest rate lock through the funding date of the underlying loan. The funded loans have not been designated by us as a qualifying hedged asset in accordance with Statement of Financial Accounting Standards No. 133, “Accounting for Derivative Instruments and Hedging Activities” (Statement No. 133). We record the funded loans on the consolidated statements of condition at the lower of cost or market value. The mandatory forward sales, which generally serve as an effective economic hedge from the inception of the interest rate lock through the time of the sale of the loans, remain subject to mark to market adjustments beyond the time the loan funds, and our reported earnings may reflect some non-economic volatility as a result of this differing treatment. The non-cash mark to market valuations of both our interest rate lock commitments and derivative instruments is reported as a component of “(Losses) gains on sales of mortgage loans, net.”
The interest rate lock commitments associated with non-conforming loans held for sale and the treasury note and mortgage backed security forward sales contracts typically used to economically hedge the interest rate risk associated with these locks are also derivatives and are marked to market through earnings. Similar to the conforming loans, the funded non-conforming loans have not been designated as a qualifying hedged asset in accordance with Statement No. 133, and accordingly, we record them at the lower of cost or market value on the consolidated statements of condition. The treasury note and mortgage backed security forward sales contracts, which serve as an effective economic hedge prior to the sale of some of our non-conforming loans, remain subject to mark to market adjustments beyond the time the loans fund, and our reported earnings may reflect some non-economic volatility as a result of this differing treatment.
Relative to our loans held for investment, we economically hedge the effect of interest rate changes on our cash flows as a result of changes in LIBOR, our benchmark interest rate on which our interest payments on warehouse financing and securitization financing are based. These derivatives are not classified as cash flow hedges under Statement No. 133. We enter into interest rate swap agreements to economically hedge the financing on mortgage loans held for investment. The change in fair value of the derivative during the hedge period is reported as a component of “Other (expense) income —portfolio derivatives.” The periodic net cash settlements and any gain or loss on terminated contracts are also reported as a component of “Other (expense) income —portfolio derivatives.”
Changes in the forward LIBOR curve during a reporting period will affect the mark to market valuations on our undesignated derivatives. Increases in the forward curve will result in a non-cash credit being recognized in our consolidated statements of operations, while decreases will result in a non-cash charge being recognized in our consolidated statements of operations. Changes in the relationship between the actual LIBOR rates during the period and the fixed rates contained in our swap agreements impact the net cash settlements received or paid during the period.
Stock-Based Compensation
We have adopted the fair value method of accounting for stock options and shares of restricted stock as prescribed by Statement of Financial Accounting Standards No. 123R,“Share-Based Payments”(Statement No. 123R). Under Statement No. 123R, compensation cost is measured at the grant date based on the fair value of the award and is recognized as expense on a straight-line basis over the award’s vesting period. The fair value of awards of restricted stock is determined at the date of grant based on the market price of our common stock on that date. For both the stock options and restricted stock, the amount of compensation cost is adjusted for estimated annual forfeitures. The fair value of the stock options is determined using the Black-Scholes option pricing model. Due to the subjective nature and estimates required under Statement No. 123R, we consider this a critical accounting policy.
Reserve for Losses—Loans Sold
We maintain a reserve for our representation and warranty liabilities related to the sale of loans and for our contractual obligation to rebate a portion of any premium paid by a purchaser when a borrower prepays a sold loan within an agreed period. The representations and warranties generally relate to the accuracy and completeness of information related to the loans sold and to the collectibility of the initial payments following the sale of the loan. The reserve, which is recorded as a liability on our consolidated statements of condition, is established when loans are sold and is calculated as the fair value of losses estimated to occur over the life of the loan. The reserve for losses is established through a provision for losses, which is reflected as a reduction of the gain on the loans sold at the time of sale. We forecast future losses on current sales based on our analysis of our actual historical losses, stratified by type
32
of loss, type of loan, lien position, collateral location, and year of sale. This analysis takes into consideration historical information regarding frequency and severity of losses and compares economic and real estate market trends which may have affected historical losses, and the potential impact of these trends to losses on current loans sold. We estimate losses due to premium recaptures on early loan prepayments by reviewing loan product and rate, borrower prepayment fee, if any, and estimates of future interest rate volatility. If the actual loss trend on loans sold varies compared to the loss provision previously forecast, an adjustment to the provision expense will be recorded as a change in estimate.
Real Estate Owned
Real estate owned (REO) results from us foreclosing on delinquent mortgages. These properties are held for sale and carried at the lesser of the carrying value or fair value less estimated selling costs, which requires us to make significant estimates and assumptions, including the accuracy of the appraisal value, the ultimate disposition of the property, and the associated costs. Individual properties are periodically evaluated and additional impairments are recorded, if necessary.
Deferred Tax Assets
We have deferred tax assets related to the net operating loss of our TRS, FMC, and various temporary book to tax differences in accordance with Statement of Financial Accounting Standards No. 109,“Accounting for Income Taxes”(Statement No. 109). We regularly assess the recoverability of these assets based on projections of future operating results and management’s tax planning strategies. Based on this evaluation, we believe that all of the deferred tax assets recorded in our consolidated financial statements at March 31, 2007 are more likely than not to be recovered. Management did not consider the effects, if any, of the proposed merger with C-BASS when evaluating the recoverability of the deferred tax asset.
Results of Operations
Three Months Ended March 31, 2007 Compared to the Three Months Ended March 31, 2006
Net Income
We reported a net loss of $68.6 million for the three months ended March 31, 2007 compared to net income of $12.9 million for the first quarter of 2006. The decrease in net income was due primarily to decreases in both our net gains on sale and net interest income due to a decline in net interest margin on recent originations, increases in our provision for loan losses, increases in the provision for investor repurchase requests, and unfavorable fluctuations in results from our derivative contracts.
Our net interest income decreased to $25.7 million in the three months ended March 31, 2007 from $30.2 million in the three months ended March 31, 2006 due primarily to a decrease in our average interest spread, which is the difference between the coupon interest rate on our loans to borrowers and the interest rate we incur for the debt financing of the loan. Net interest margin, including the net cash received on our swaps, declined to 2.02% in the three months ended March 31, 2007 from 2.61% in the three months ended March 31, 2006. The cost of financing for loans held for investment increased as our weighted average swap rate rose as older, lower rate swaps expired and were replaced with new swaps at current market rates, resulting in an increase in our weighted average swap rate to 4.92% as of March 31, 2007 from 3.52% as of the three months ended March 31, 2006. Market competition for new loans remained intense, as slowing U.S. housing markets have led to a decrease in total mortgage originations, and did not permit coupons on new originations to increase at the same rate as the increase in our financing costs for the loans, narrowing the spreads available on new loans. Our total average balance of loans earning net interest income was comparable in the three months ended March 31, 2007 and 2006.
Gains on sales of mortgage loans, net decreased to a loss of $59.3 million in the three months ended March 31, 2007, compared with a gain of $10.3 million in the three months ended March 31, 2006 due primarily to the charge required to reduce loans held for sale as of March 31, 2007 to their lower of cost or market value, significant investor repurchase requests, and decreased sales premiums earned during the three months ended March 31, 2007. The decrease in gains on sales, net, was attributable to a decline in the market value of certain loans held for sale due to the deteriorating industry and economic factors noted above, which resulted in pre-tax charges of $28.1 million during the three months ended March 31, 2007 to reduce the loans held for sale at the end of the period to the lower of cost or market value, which was recorded as a component of “(Losses) gains on sales of mortgage loans, net.” No comparable charges were recorded for the three months ended March 31, 2006. The decreased gains on sales of mortgage loans, net is also attributable to loans sold having experienced similar delinquency and loss performance as
33
the loans in the investment portfolio, and our requirement to repurchase loans sold to investors that become delinquent within a specified period of the date of sale, necessitating a reserve for these repurchases which is recorded as a reduction in gains on sale. The provision for losses on loans sold increased by $7.6 million for the three months ended March 31, 2007 compared to the same period in 2006. Sales premiums have declined due to higher forecast losses on subprime loans, lack of investor demand for subprime loans, higher risk premiums charged by investors to purchase subprime loans, the reduced interest spreads available on new loans, and discounted sales within the subprime industry related to current market conditions.
Our provision for loan losses increased to $21.4 million in the three months ended March 31, 2007 from $5.4 million in the three months ended March 31, 2006 as the result of a sharp increase in delinquencies on more recent loan originations and the aging of our portfolio. In response to the rising delinquencies and losses, we have initiated steps to improve our loan performance by eliminating products with the most significant losses, narrowing acceptable thresholds for the automated verification of broker appraisals, limiting the age of appraisals, utilizing new technology and resources to flag high risk loans prior to origination for additional manual procedures, implementing accelerated collections efforts on early stage delinquencies, increased focus on servicer work-flow, and directly boarding newly originated loans with the servicer to reduce delinquencies during servicing transfer.
We use interest rate swaps to hedge the variable rate financing costs for the fixed rate period of our hybrid ARM mortgage loans held for investment. Because these derivatives are not designated as cash flow hedges under Statement of Financial Accounting Standards No. 133, “Accounting for Derivative Instruments and Hedging Activities,”(Statement No. 133) changes in the fair market value of the swaps and caps are recognized in current period earnings and reported in our consolidated statement of operations in “Other (expense) income — portfolio derivatives.” Net cash settlements, representing the difference between the swapped interest rate and the actual interest rates, are also recognized in the line item “Other (expense) income – portfolio derivatives” on the consolidated statements of operations. Our policy has been to hedge between 90% and 100% of the forecast debt collateralizing our loans held for investment during their fixed interest rate period, “locking in” the interest spread for the hedged debt. Results of operations for the three months ended March 31, 2007 include losses of $5.8 million related to the decreases in the fair market value of our derivative contracts compared to gains of $1.9 million for the first quarter of 2006. Results of operations for 2007 also reflects our receipt of $4.2 million of cash settlements from our swaps in the first quarter of 2007, which is a $6.0 million decrease in the net cash settlements received on derivative contracts in the first quarter of 2007 compared to the prior year as a result of fluctuations in the swapped interest rate and the actual LIBOR during the period. The mark to market valuation changes of our derivative contracts fluctuate based on changes in the forward LIBOR curve. The current decline in the market value of existing swaps indicates the expectation of an offsetting future decline in bond interest expense, and our net cash flow on the loans and debt outstanding remain the same regardless of whether the forecast changes in interest rates occur. We cannot predict the future path of interest rates, nor can we predict in a definitive manner the magnitude by which these changes in interest rates may impact our results of operations during periods of interest rate volatility.
34
Revenues
Net Interest Income After Provision for Loan Losses
The following are the components of net interest income after provision for loan losses for the three months ended March 31, 2007 and 2006:
| | | | | | | | |
| | | Three Months Ended
March 31, | |
($ in 000s) | | 2007 | | | 2006 | |
Interest income: | | | | | | | | |
Coupon interest income on loans held for investment | | $ | 97,169 | | | $ | 96,433 | |
Coupon interest income on loans held for sale | | | 11,609 | | | | 6,601 | |
Amortization of deferred origination costs | | | (1,157 | ) | | | (6,871 | ) |
Prepayment fees | | | 3,056 | | | | 5,551 | |
| | | | | | | | |
Total interest income | | | 110,677 | | | | 101,714 | |
| | | | | | | | |
Interest expense: | | | | | | | | |
Financing interest expense on loans held for investment1 | | | 75,056 | | | | 66,199 | |
Financing interest expense on loans held for sale | | | 8,310 | | | | 2,605 | |
Amortization of deferred bond issuance costs and issue discount | | | 1,618 | | | | 2,717 | |
| | | | | | | | |
Total interest expense1 | | | 84,984 | | | | 71,521 | |
| | | | | | | | |
Net interest income1 | | | 25,693 | | | | 30,193 | |
Provision for loan losses - loans held for investment | | | 21,436 | | | | 5,393 | |
| | | | | | | | |
Net interest income after provision for loan losses1 | | $ | 4,257 | | | $ | 24,800 | |
| | | | | | | | |
1 | Does not include the effect of the interest rate swap and cap agreements which economically hedge our portfolio of financing costs. |
The average balances for our loans held for investment and loans held for sale and our related warehouse and securitization financing, along with the corresponding annualized yields, for the three months ended March 31, 2007 and 2006 are as follows:
| | | | | | | | |
| | | Three Months Ended
March 31, | |
($ in 000s) | | 2007 | | | 2006 | |
Average balances: | | | | | | | | |
Mortgage loans held for investment | | $ | 5,133,481 | | | $ | 5,453,923 | |
Securitization financing - loans held for investment | | | 4,826,410 | | | | 4,825,196 | |
Warehouse financing - loans held for investment | | | 405,066 | | | | 510,867 | |
| | |
Yield analysis - loans held for investment: | | | | | | | | |
Coupon interest income on loans held for investment | | | 7.57 | % | | | 7.07 | % |
Amortization of deferred origination costs | | | (0.09 | )% | | | (0.50 | )% |
Prepayment fees | | | 0.24 | % | | | 0.41 | % |
| | | | | | | | |
Yield on loans held for investment | | | 7.72 | % | | | 6.98 | % |
Interest expense securitization financing1 | | | 5.70 | % | | | 4.96 | % |
Interest expense warehouse financing | | | 6.24 | % | | | 4.98 | % |
Amortization - deferred bond issuance costs and issue discount | | | 0.13 | % | | | 0.23 | % |
| | | | | | | | |
Cost of financing for loans held for investment1 | | | 5.85 | % | | | 5.17 | % |
Net yield on loans held for investment2 | | | 1.74 | % | | | 1.92 | % |
Provision for loan losses as % of average loan balance | | | (1.67 | )% | | | (0.40 | )% |
| | | | | | | | |
Net yield on loans held for investment after provision for loan losses1 | | | 0.07 | % | | | 1.52 | % |
| | | | | | | | |
35
| | | | | | | | |
| | | Three Months Ended
March 31, | |
($ in 000s) | | 2007 | | | 2006 | |
Average balances: | | | | | | | | |
Mortgage loans held for sale | | $ | 588,613 | | | $ | 330,044 | |
Warehouse financing - loans held for sale | | | 561,139 | | | | 212,156 | |
| | |
Yield analysis - loans held for sale: | | | | | | | | |
| | |
Yield on loans held for sale | | | 7.89 | % | | | 8.00 | % |
Cost of financing for loans held for sale | | | 5.92 | % | | | 4.91 | % |
Net yield on loans held for sale2 | | | 2.24 | % | | | 4.84 | % |
| | |
Combined yield - net interest income after provision for loan losses, loans held for investment and held for sale | | | 0.30 | % | | | 1.72 | % |
1 | Does not include the effect of the interest rate swap and cap agreements which economically hedge our portfolio of financing costs. |
2 | Calculated as the annualized net interest income divided by the average daily balance of mortgage loans. The net yield on loans will not equal the difference between the yield on loans and the cost of financing due to the difference in the denominators of the two calculations. |
Net Interest Income After Provision for Loan Losses Earned on Loans Held for Investment
Interest income on loans held for investment increased to $99.1 million in the three months ended March 31, 2007 from $95.1 million in the three months ended March 31, 2006 primarily due to higher coupon rates, partially offset by a lower average portfolio balance. Our average portfolio balance decreased approximately $0.3 billion in 2007 compared to 2006, as we have classified essentially all originations as held for sale since surpassing our target leverage as of September 30, 2006.
Yield on loans held for investment increased to 7.72% in the three months ended March 31, 2007 from 6.98% in the three months ended March 31, 2006 as a result of higher coupons on new loans added to the portfolio during 2006 and the increase in the coupon on the loans that reached their resets from fixed to adjustable rates during the period.
Interest expense for both warehouse and securitization financings rose in the three months ended March 31, 2007 compared to the same period in 2006 due to higher interest rates, partially offset by reduced borrowings. Our average cost of financing for loans held for investment increased to 5.85% in the three months ended March 31, 2007 compared to 5.17% in the three months ended March 31, 2006. Our average borrowings outstanding decreased in 2007 due to the reduction in the average portfolio balance.
As discussed above, our cost of financing new loans has increased more rapidly than the rise in coupon rates due to intense competition for new originations in a market environment with declining total origination volume. As a result, new originations during the year generally had a narrower net interest spread, and we expect this to continue during 2007, while we expect loans originated during periods of higher margin spreads to continue to prepay.
Prepayment fee income, which constitutes a portion of the net interest margin earned by our portfolio, has declined to 0.24% of our portfolio balance during the three months ended March 31, 2007 compared to 0.41% in the same period in 2006 as borrowers are increasingly deferring the prepayment of their loan until after the expiration of their prepay fee period in the current market.
Provision for loan losses increased in the three months ended March 31, 2007 compared to the same period in 2006 due primarily to the sharp rise in delinquencies and faster transition to foreclosure experienced on more recent loan originations. The increase in the delinquencies was partially offset by a reduction in our loss severity estimates, as actual life to date loss experience continued to be lower than we had originally forecast due to the strategy our subservicer uses in dealing with foreclosures, the housing markets in the geographical regions in which the realized losses have been located, and faster than anticipated prepayment speeds on older vintages. In response to the rising delinquencies and losses, we have initiated steps to improve our loan performance by eliminating products with the most significant losses, narrowing acceptable thresholds for the automated verification of broker appraisals, limiting the age of appraisals, utilizing new technology and resources to flag high risk loans prior to origination for additional manual procedures, implementing accelerated collections efforts on early stage delinquencies, increased focus on servicer work-flow, and directly boarding loans with the servicer to reduce delinquencies during servicing transfer.
As a result of the above factors, net interest income after the provision for loan losses on loans held for investment decreased to $1.0 million in the first quarter 2007 from $20.8 million in the same period in 2006.
36
Net Interest Income Earned on Loans Held for Sale
Net interest income earned on loans held for sale includes the net interest spread on our loans held for sale during the period from funding to sale date. Our loans held for sale generated net interest income of $3.3 million and $4.0 million, respectively, in the three months ended March 31, 2007 and 2006. The decrease in the three months ended March 31, 2007 compared to the same period of the prior year is due to the decrease in net yield to 2.24% from 4.84% in the same period of 2006. The decline in yield in 2007 reflects the decrease in the net interest spread available on new loans due to rising market rates and intense competition for new originations, which we expect to continue during 2007.
(Losses) Gains on Sales of Mortgage Loans, Net
The components of the gains on sale of mortgage loans, net are as follows for the three months ended March 31, 2007 and 2006:
| | | | | | | | | | | | | | |
| | | Three Months Ended March 31, | |
($ in 000s) | | 2007 | | | % of Sales Volume | | | 2006 | | | % of Sales Volume | |
Gross (discounts) premiums - whole loan sales, net of hedging gains or losses | | $ | (16,918 | ) | | (2.1 | )% | | $ | 15,544 | | | 2.4 | % |
Fees collected, net of premiums paid1 | | | 2,013 | | | 0.2 | % | | | 1,214 | | | 0.2 | % |
Direct origination costs1 | | | (6,348 | ) | | (0.8 | )% | | | (4,451 | ) | | (0.7 | )% |
| | | | | | | | | | | | | | |
Subtotal | | | (21,253 | ) | | (2.7 | )% | | | 12,307 | | | 1.9 | % |
Allowance to reduce loans held for sale to the lower of cost or market | | | (28,073 | ) | | (3.5 | )% | | | — | | | — | % |
Provision for losses - sold loans | | | (9,945 | ) | | (1.2 | )% | | | (2,012 | ) | | (0.3 | )% |
| | | | | | | | | | | | | | |
(Losses) gains on sales of mortgage loans, net | | $ | (59,271 | ) | | (7.4 | )% | | $ | 10,295 | | | 1.6 | % |
| | | | | | | | | | | | | | |
Loan sales volume | | $ | 801,577 | | | | | | $ | 654,550 | | | | |
| | | | | | | | | | | | | | |
1 | Loan fees collected, premiums paid and direct origination costs are deferred at funding and recognized on settlement of the loan sale. |
The gross premiums on whole loan sales, net of hedging gains or losses, for first and second lien loans sold in the three months ended March 31, 2007 and 2006 are as follows:
| | | | | | |
| | | Three Months Ended
March 31, | |
| | | 2007 | | | 2006 | |
Gross whole loan sale (discounts) premiums, net of hedges | | | | | | |
First lien mortgage loans | | (1.4 | )% | | 2.6 | % |
Second lien mortgage loans | | (10.8 | )% | | 1.2 | % |
Total | | (2.1 | )% | | 2.4 | % |
The gains on sales of mortgage loans, net, decreased to a loss of $59.3 million for the three months ended March 31, 2007 compared to $10.3 million for the same period in 2006 due to the charge required to reduce loans held for sale as of March 31, 2007 to their lower of cost or market value, increased investor repurchase requests, and decreased sales premiums earned during the three months ended March 31, 2007.
As a result of slowing and in some cases declining home price appreciation, increased delinquencies and losses across the subprime industry, and decreased investor demand for subprime loans, the market value of $603.4 million of our loans held for sale as of March 31, 2007 declined below par value, necessitating $28.1 million of pre-tax charges to gains on sales of loans to reduce these loans to their lower of cost or market value. There were no comparable charges recorded in 2006. In response to this value decline, we have discontinued origination of products whose market value has been the most severely affected and modified our product offerings to maximize sale premiums.
The reduction in gains on sales, net, during the three months ended March 31, 2007 was also due to a $7.6 million increase in the provision for loan losses on loans sold. Loans held for sale have experienced similar delinquency and loss performance as the loans in the investment portfolio, and we may be required to repurchase loans sold to investors that become delinquent within a specified period of the date of sale, necessitating a reserve for these repurchases, which is recorded as a reduction in gains on sale.
37
Average sales premiums earned declined to a loss of 2.1% in the first quarter of 2007 from gains of 2.4% in the first quarter of 2006, as a result of the higher forecast losses on subprime loans, lack of investor demand for subprime loans, higher risk premiums charged by investors to purchase subprime loans, the reduced interest spreads available on new loans, and discounted sales within the subprime industry related to current market conditions. We expect gross sale premiums to continue at lower levels in 2007.
Other (Expense) Income —Portfolio Derivatives
We use interest rate swap agreements to create economic hedges of the variable rate debt financing of our portfolio of non-conforming mortgages held for investment.
During the period that our loans have a fixed interest rate, generally the first two to three years of the loan, an increase in interest rates will increase our cost of financing for the debt related to those loans without a corresponding increase in the interest income we receive from borrowers. We mitigate the risk of adverse effects of changes in interest rates during this period using interest rate swaps. Under these swap agreements, which are generally for a period of two years, we contract to pay a fixed interest rate on a notional balance to the counterparty in exchange for receiving from them the actual LIBOR rate on the notional balance. We currently economically hedge approximately 90% of the debt in our portfolio related to the fixed interest rate period of the loans. We do not economically hedge any debt that has a floating interest rate, as any impact of a change in interest rates would have offsetting increases on both our cost of financing and our interest income.
Changes in the fair value of these agreements, which reflect the potential future cash settlements over the remaining lives of the agreements according to the market’s changing projections of interest rates, are recognized in the line item “Other (expense) income—portfolio derivatives” in the consolidated statements of operations. Net cash settlements, which reflect the relationship between the actual benchmark interest rate and the fixed swap rate during the period, are also included in the line item “Other (expense) income —portfolio derivatives.”
Our results of operations for the three months ended March 31, 2007 include losses of $5.8 million related to the decreases in the fair market value of our derivative contracts compared to gains of $1.9 million included in 2006 results. The mark to market valuation changes on derivative contracts are the result of fluctuations in the forward LIBOR curve. The current decline in the market value of existing swaps indicates the expectation of an offsetting future decline in bond interest expense, and our net cash flow on the loans and debt outstanding remain the same regardless of whether the forecast changes in interest rates occur. During the same time period, net cash settlements received on our swaps were $4.2 million, a decrease of $6.0 million in the three months ended March 31, 2007 compared to the prior year as a result of fluctuations in the swapped interest rate and the actual LIBOR during the period. We cannot predict the future path of interest rates, nor can we predict in a definitive manner the magnitude by which these changes in interest rates may impact our results of operations during periods of interest rate volatility.
Our portfolio derivatives allow us to “lock-in” the expected financing costs of our investment portfolio over a future contractual time period. At March 31, 2007 and December 31, 2006, the notional balance of our interest rate swaps was $3.7 billion and $4.2 billion, respectively.
We have multiple interest rate swap agreements that aggregate to provide our total hedge coverage, and our interest expense during any given period will be impacted by the weighted average interest rate of the existing swap agreements. Our older, lower rate swaps have begun to expire and are being replaced by swap agreements that bear higher interest rates, as interest rates have consistently risen throughout 2006 and to date in 2007. The rise in our weighted average swap rate has been partially offset by increased coupon rates on our loans as a result of the rising interest rates.
38
The following chart illustrates the weighted average coupon rate on the loans in our investment portfolio and the weighted average interest rate of our swap agreements for the periods presented:
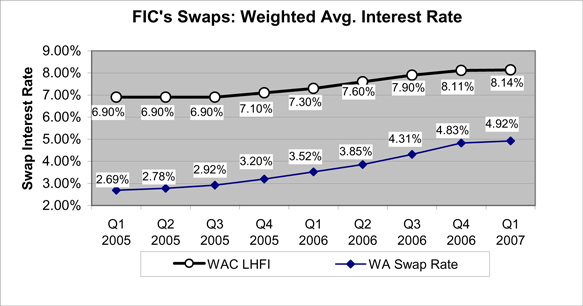
Management continues to evaluate our hedging strategy as a result of fluctuations in the forward LIBOR curve. We may modify our hedging in future periods by utilizing a combination of interest rate caps and swaps or electing to economically hedge less than 90% of our debt during the fixed interest rate period of the loans.
Expenses
Total expenses for the three months ended March 31, 2007 and 2006 are as follows:
| | | | | | | | |
| | | Three Months Ended
March 31, | |
($ in 000s) | | 2007 | | | 2006 | |
Salaries and employee benefits | | $ | 18,339 | | | $ | 20,869 | |
Occupancy | | | 1,535 | | | | 1,823 | |
Depreciation and amortization | | | 1,108 | | | | 935 | |
Servicing fees | | | 2,738 | | | | 2,569 | |
General and administration | | | 8,767 | | | | 7,563 | |
| | | | | | | | |
Total expenses | | $ | 32,487 | | | $ | 33,759 | |
| | | | | | | | |
Percentage change from prior period | | | (4 | )% | | | 13 | % |
Total Expenses. Total expenses decreased in the three months ended March 31, 2007 compared to the same period in 2006 due primarily to cost reduction initiatives we have implemented in response to current market conditions, including significant consolidation of operations centers, a proportional reduction in home office staff, implementation of our new loan origination system, and vendor re-structuring. Benefits from these initiatives were partially offset by increased legal costs and professional service fees associated with our pending merger with C-BASS as well as $0.8 million of costs related to our office consolidations and home office staff reductions that were accelerated and recognized in the current period in accordance with GAAP, but which will reduce future recurring expenses.
Salaries and Employee Benefits.Salaries and benefits include salaries, benefits, and payroll taxes that have not been designated as direct costs of loan origination. Salaries are relatively fixed at any point based on our existing staffing levels, which generally correlate to current and future estimated origination volumes. The decrease in salaries and employee benefits for the first quarter 2007 compared to first quarter 2006 is due to the previously mentioned cost management initiatives and the reduced funding volume.
Servicing Fees. Servicing fees paid to our third party subservicer of our loans increased in the three months ended March 31, 2007 compared to the same period in 2006. During the first quarter of 2007, we entered into a subservicing agreement with Litton, which is an experienced servicer of non-conforming loans, to subservice our loans which had previously been serviced by another third party subservicer. The increase in servicing fees in 2007 is due primarily to cost associated with transferring the subservicing of our loans to Litton
39
General and Administration. General and administration expenses increased in the three months ended March 31, 2007 compared to the same period in 2006 due primarily to increased audit and professional service fees, as well as costs related to our office consolidations and home office staff reductions that were accelerated and recognized in the current period in accordance with GAAP. Audit fees increased as a result of Sarbanes-Oxley Act of 2002 compliance, and the increased professional service fees include costs related to our pending merger with C-BASS. We expect general and administration expenses to decrease in the remainder of 2007 as we continue to realize the benefits of our new cost management initiatives which are described under Total Expenses above.
Income Tax Benefit.We qualified to be taxed as a REIT, effective beginning in the fourth quarter of 2003, and we elected to treat our loan origination and sale subsidiary, FMC, as a taxable REIT subsidiary (TRS). A TRS is a corporation that is permitted to engage in non-qualifying REIT activities. Taxable income of our TRS is subject to federal, state, and local income taxes. Income tax expense reflects the following effective tax rates:
| | | | | | | | |
| | | Three Months Ended
March 31, | |
($ in 000s) | | 2007 | | | 2006 | |
Income tax benefit | | $ | 22,372 | | | $ | 1,844 | |
FMC pre-tax net loss1 | | | (55,826 | ) | | | (5,251 | ) |
Effective tax rate | | | 40 | % | | | 35 | % |
1 | Includes loss from discontinued operations for the three months ended March 31, 2006. |
The effective tax rate includes the amortization of a deferred tax asset related to prior year inter-company loan sales.
We adopted the provisions of FASB Interpretation No. 48, “Accounting for Uncertainty in Income Taxes,” (FIN 48) on January 1, 2007. This implementation included an evaluation of our tax positions to identify and recognize any liabilities related to unrecognized tax benefits resulting from those positions. As a result of this evaluation, we determined that we did not have any material liabilities related to unrecognized tax benefits. Under the provisions of FIN 48, we will continue to evaluate our tax positions for potential liabilities related to unrecognized tax benefits, but do not expect FIN 48 to have a significant impact on our consolidated financial statements in 2007.
Consolidated Statements of Condition as of March 31, 2007 and December 31, 2006
Mortgage Loans Held for Investment
The following table summarizes the principal balance of our investment portfolio for the three months ended March 31, 2007 and the year ended December 31, 2006:
| | | | | | | | |
($ in 000s) | | Three Months Ended March 31, 2007 | | | Year Ended
December 31,
2006 | |
Beginning principal balance | | $ | 5,569,740 | | | $ | 5,530,216 | |
Loan fundings | | | 7,135 | | | | 2,448,342 | |
Payoffs and principal reductions | | | (535,608 | ) | | | (2,444,971 | ) |
Transfers to mortgage loans held for sale, net | | | (48,393 | ) | | | — | |
Transfers from mortgage loans held for sale, net | | | 60,680 | | | | 164,454 | |
Transfers to real estate owned | | | (74,560 | ) | | | (128,301 | ) |
| | | �� | | | | | |
Ending principal balance | | | 4,978,994 | | | | 5,569,740 | |
Net deferred loan origination costs | | | 27,918 | | | | 31,457 | |
| | | | | | | | |
Ending balance loans held for investment | | | 5,006,912 | | | | 5,601,197 | |
Allowance for loan losses | | | (82,162 | ) | | | (81,859 | ) |
| | | | | | | | |
Ending balance loans held for investment, net | | $ | 4,924,750 | | | $ | 5,519,338 | |
| | | | | | | | |
During the three months ended March 31, 2007, we originated $7.1 million in new loans for the portfolio. The decrease in the portfolio balance is the result of payoffs exceeding the loans we classified as held for investment during the first quarter of 2007. We sought to reduce our portfolio leverage from the 13.9:1 as of December 31, 2006 to approach our target leverage of approximately 13:1. Accordingly, we classified essentially all of our first quarter 2007 originations as held for sale. Despite this strategy, our leverage increased during the period due to the reduction of our net equity due to our net loss for the three months ended March 31, 2007. We intend to continue our strategy of classifying essentially all originations as held for sale based upon our leverage ratio as of March 31, 2007.
40
The portfolio generated $22.4 million of net interest income before provision for loan losses during the three months ended March 31, 2007.
We estimate prepayment speeds based upon historical industry data for similar loan products and actual history to date, which are adjusted for current market assumptions regarding future economic conditions such as home price appreciation and interest rate forecasts. These assumptions for prepayment speeds indicate an average loan life of approximately 26 months. There can be no assurance that this industry data will be reflective of our actual results.
Allowance for Loan Losses—Loans Held for Investment
The allowance for loan loss activity of our investment portfolio for the three months ended March 31, 2007 and the year ended December 31, 2006 was as follows:
| | | | | | | | |
| | | Three Months Ended March 31, | | | Year Ended December 31, | |
($ in 000s) | | 2007 | | | 2006 | |
Beginning balance allowance for loan losses | | $ | 81,859 | | | $ | 44,122 | |
Provision | | | 21,436 | | | | 69,062 | |
Charge-offs | | | (21,133 | ) | | | (31,325 | ) |
| | | | | | | | |
Ending balance allowance for loan losses | | $ | 82,162 | | | $ | 81,859 | |
| | | | | | | | |
Ending principal balance, mortgage loans held for investment | | $ | 4,978,994 | | | $ | 5,569,740 | |
Ending allowance balance as % of ending principal balance | | | 1.7 | % | | | 1.5 | % |
The delinquency status of our loans held for investment as of March 31, 2007 and December 31, 2006 was as follows:
| | | | | | | | | | | | | | |
| | | March 31, 2007 | | | December 31, 2006 | |
($ in 000s) | | Principal
Balance | | | Percentage
of Total | | | Principal
Balance | | | Percentage
of Total | |
Current | | $ | 3,885,762 | | | 78.0 | % | | $ | 4,348,051 | | | 78.1 | % |
30 days past due | | | 467,209 | | | 9.4 | % | | | 610,876 | | | 11.0 | % |
60 days past due | | | 210,007 | | | 4.2 | % | | | 234,080 | | | 4.2 | % |
90+ days past due | | | 126,630 | | | 2.6 | % | | | 146,867 | | | 2.6 | % |
In process of foreclosure | | | 289,386 | | | 5.8 | % | | | 229,866 | | | 4.1 | % |
| | | | | | | | | | | | | | |
Total | | $ | 4,978,994 | | | 100.0 | % | | $ | 5,569,740 | | | 100.0 | % |
| | | | | | | | | | | | | | |
Allowance for loan losses | | $ | 82,162 | | | | | | $ | 81,859 | | | | |
| | | | | | | | | | | | | | |
Allowance for loan losses as a % of total delinquent loans (30+ days past due and loans in the process of foreclosure) | | | 7.5 | % | | | | | | 6.7 | % | | | |
| | | | | | | | | | | | | | |
41
Delinquency, life to date loss experience, and weighted average coupon rate of our loans held for investment by securitization pool as of March 31, 2007 and December 31, 2006 were as follows:
| | | | | | | | | | | | | | | | | |
| | | As of March 31, 2007 |
($ in 000s) | | Current
Principal
Balance | | Current
Balance as
Factor of
Original
Principal | | | % of
Principal
Balance
Seriously
Delinquent | | | % of
Cumulative
Realized
Losses | | | Weighted Avg. Coupon | | | Avg. Age
of Loans
from
Funding
(months) |
Loans held for investment-securitized: | | | | | | | | | | | | | | | | | |
FMIT Series 2004-3 | | $ | 131,491 | | 13 | % | | 26.7 | % | | 0.74 | % | | 8.94 | % | | 35 |
FMIT Series 2004-4 | | | 134,077 | | 15 | % | | 31.4 | % | | 0.80 | % | | 9.80 | % | | 32 |
FMIT Series 2004-5 | | | 169,388 | | 19 | % | | 24.5 | % | | 0.80 | % | | 9.28 | % | | 30 |
FMIT Series 2005-1 | | | 200,749 | | 27 | % | | 19.2 | % | | 0.68 | % | | 9.04 | % | | 28 |
FMIT Series 2005-2 | | | 633,765 | | 66 | % | | 11.0 | % | | 0.74 | % | | 7.09 | % | | 22 |
FMIT Series 2005-3 | | | 862,783 | | 74 | % | | 11.6 | % | | 0.65 | % | | 7.27 | % | | 18 |
FMIT Series 2006-1 | | | 748,006 | | 80 | % | | 13.5 | % | | 0.66 | % | | 7.86 | % | | 15 |
FMIT Series 2006-2 | | | 719,953 | | 90 | % | | 13.7 | % | | 0.39 | % | | 8.23 | % | | 9 |
FMIT Series 2006-3 | | | 799,222 | | 93 | % | | 10.5 | % | | 0.00 | % | | 8.39 | % | | 6 |
FMIT Series 2006-S1 | | | 187,727 | | 97 | % | | 7.4 | % | | 0.00 | % | | 10.91 | % | | 6 |
| | | | | | | | | | | | | | | | | |
Total | | | 4,587,161 | | 54 | % | | 13.6 | % | | 0.60 | % | | | | | 16 |
Loans held for investment-to be securitized | | | 363,796 | | | | | 0.3 | % | | 0.46 | % | | 8.14 | % | | 9 |
Loans held for investment-previously securitized | | | 28,037 | | | | | 0.2 | % | | 0.56 | % | | 9.40 | % | | 41 |
| | | | | | | | | | | | | | | | | |
Total loans held for investment | | $ | 4,978,994 | | 56 | % | | 12.6 | % | | 0.59 | % | | 8.14 | % | | 15 |
| | | | | | | | | | | | | | | | | |
| | | | | | | | | | | | | | | | | |
| | | As of December 31, 2006 |
($ in 000s) | | Current
Principal
Balance | | Current
Balance as
Factor of
Original
Principal | | | % of
Principal
Balance
Seriously
Delinquent | | | % of
Cumulative
Realized
Losses | | | Weighted Avg. Coupon | | | Avg. Age
of Loans
from
Funding
(months) |
Loans held for investment-securitized: | | | | | | | | | | | | | | | | | |
FMIT Series 2004-3 | | $ | 161,085 | | 16 | % | | 25.3 | % | | 0.58 | % | | 8.79 | % | | 32 |
FMIT Series 2004-4 | | | 169,979 | | 19 | % | | 27.5 | % | | 0.63 | % | | 9.37 | % | | 29 |
FMIT Series 2004-5 | | | 234,345 | | 26 | % | | 19.7 | % | | 0.56 | % | | 9.11 | % | | 27 |
FMIT Series 2005-1 | | | 333,728 | | 44 | % | | 10.7 | % | | 0.58 | % | | 7.65 | % | | 25 |
FMIT Series 2005-2 | | | 677,886 | | 70 | % | | 10.3 | % | | 0.48 | % | | 7.10 | % | | 19 |
FMIT Series 2005-3 | | | 919,949 | | 79 | % | | 10.2 | % | | 0.31 | % | | 7.28 | % | | 15 |
FMIT Series 2006-1 | | | 803,197 | | 86 | % | | 11.6 | % | | 0.31 | % | | 7.89 | % | | 12 |
FMIT Series 2006-2 | | | 755,241 | | 94 | % | | 10.6 | % | | 0.06 | % | | 8.25 | % | | 6 |
FMIT Series 2006-3 | | | 828,546 | | 96 | % | | 4.6 | % | | 0.00 | % | | 8.40 | % | | 3 |
FMIT Series 2006-S1 | | | 193,282 | | 100 | % | | 0.1 | % | | 0.00 | % | | 10.92 | % | | 3 |
| | | | | | | | | | | | | | | | | |
Total | | | 5,077,238 | | 60 | % | | 10.7 | % | | 0.38 | % | | | | | 14 |
Loans held for investment-to be securitized | | | 375,611 | | | | | 5.0 | % | | 0.23 | % | | 8.34 | % | | 6 |
Loans held for investment-previously securitized | | | 116,891 | | | | | 40.2 | % | | 0.42 | % | | 10.09 | % | | 38 |
| | | | | | | | | | | | | | | | | |
Total loans held for investment | | $ | 5,569,740 | | 60 | % | | 11.0 | % | | 0.39 | % | | 8.11 | % | | 14 |
| | | | | | | | | | | | | | | | | |
The allowance for loan losses was $82.2 million as of March 31, 2007, which is consistent with the $81.9 million allowance for loan losses as of December 31, 2006. The allowance for loan losses as of both March 31, 2007 and December 31, 2006 reflect increasing delinquencies and losses on more recent originations and the seasoning of the portfolio, which have been partially offset by lower than previously forecast realized losses on loans originated prior to 2006.
42
At March 31, 2007, $626.0 million, or 12.6%, of loans held for investment were seriously delinquent (defined as 60+ days past due or in the process of foreclosure), compared to $610.8 million, or 11.0%, at December 31, 2006. This is consistent with the general trends being experienced in the subprime market, including increased and accelerated delinquencies on more recent originations and slowing or declining home price appreciation, as well as our expectations for our portfolio as it further seasons. This rise in delinquencies has also led to an increase in the balance of the loans placed on non-accrual status for interest income recognition as of March 31, 2007 and a related increase in the amount of accrued interest income that was subsequently reversed. We anticipate that our level of delinquencies will remain at elevated levels as the subprime market continues to evolve, our portfolio continues to age, and borrowers reach the reset period of their loan from lower fixed interest rates to higher adjustable coupons.
During the three months ended March 31, 2007, we sold approximately 265 real estate owned properties previously collateralizing loans held for investment. At this time, we believe our estimated average loss severity rates are supported by a combination of industry data, our disposal history, and the risk that loss severity may increase as the loans continue to season and economic factors may affect property values. We will continue to review our loss assumptions and update our estimates as required.
Real Estate Owned
Real estate owned is reported at the lower of cost or market value on the condensed consolidated statements of condition. At the time a loan held for investment is foreclosed and the underlying collateral is transferred to real estate owned, any reduction in value from the loan’s previous carrying balance is charged to the allowance for loan losses – loans held for investment. We record gains and losses at disposal of the property as a component of “Other (expense) income” on the condensed consolidated statements of operations.
The following is a summary of real estate owned as of March 31, 2007 and December 31, 2006:
| | | | | | | | |
($ in 000s) | | Three Months Ended March 31, 2007 | | | Year Ended December 31, 2006 | |
Beginning balance real estate owned | | $ | 59,436 | | | $ | 14,997 | |
Plus: Transfers from mortgage loans held for sale | | | 1,726 | | | | 8,410 | |
Transfers from mortgage loans held for investment | | | 74,560 | | | | 128,301 | |
Less: Charge-offs | | | (20,228 | ) | | | (32,751 | ) |
Real estate sold | | | (32,490 | ) | | | (59,521 | ) |
| | | | | | | | |
Ending balance real estate owned | | $ | 83,004 | | | $ | 59,436 | |
| | | | | | | | |
The increase in real estate owned during the three months ended March 31, 2007 is due to increased delinquencies and foreclosures that have surpassed the speed at which our subservicer has sold foreclosed properties.
Mortgage Loans Held for Sale and Related Warehouse Financing—Loans Held for Sale
The following table provides a summary of the mortgage loans held for sale, net and warehouse financing—loans held for sale as of March 31, 2007 and December 31, 2006:
| | | | | | | | |
($ in 000s) | | March 31, 2007 | | | December 31,
2006 | |
Total mortgage loans held for sale, net | | $ | 609,324 | | | $ | 550,520 | |
Warehouse financing - mortgage loans held for sale | | $ | 574,479 | | | $ | 480,376 | |
Percentage financed - mortgage loans held for sale | | | 94 | % | | | 87 | % |
The increase in mortgage loans held for sale, net, at March 31, 2007 compared to December 31, 2006 reflects our strategy to classify essentially all of our 2007 fundings as held for sale after exceeding our target leverage as of December 31, 2006, which was partially offset by decreased overall funding volumes in 2007 due to the prevailing market conditions. We typically retain loans held for sale for approximately 60 to 90 days prior to investor purchase.
At March 31, 2007, we had $37.2 million of loans held for sale deemed to be unsaleable at standard sale premiums compared to $16.1 million at December 31, 2006. We have recorded a valuation allowance of $6.8 million and $3.6 million as of March 31, 2007 and December 31, 2006, respectively, for these loans.
43
Warehouse financing—loans held for sale increased as of March 31, 2007 compared to December 31, 2006 reflecting our increased level of mortgage loans held for sale as of that date.
Trustee Receivable
Trustee receivable decreased to $51.5 million at March 31, 2007 from $101.4 million at December 31, 2006. The decrease reflects lower principal payments and prepaid loan payments received after the cut-off date for the current month bond payments from our securitized mortgage pools outstanding as of March 31, 2007 compared to December 31, 2006. The trustee retains funds received after the cut-off date until the following month’s disbursement date.
Derivative Assets and Derivative Liabilities
Derivative assets decreased to $6.2 million at March 31, 2007 from $13.7 million at December 31, 2006. Derivative liabilities, included in “Accounts payable, accrued expenses and other liabilities” in the condensed consolidated statements of condition, increased to $4.2 million at March 31, 2007 from $0.4 million at December 31, 2006. The change in derivative assets and liabilities primarily relates to the decrease in the fair value of the interest rate swap agreements over the period due to the flattening of the forward LIBOR curve during the period.
Securitization Financing
The following is a summary of the outstanding securitization financing by series as of March 31, 2007 and December 31, 2006:
| | | | | | | | | | |
| | | | | Balance as of |
($ in 000s) | | Bonds Sold | | March 31,
2007 | | | December 31,
2006 |
FMIT Series 2006-S1 | | $ | 178,064 | | $ | 172,431 | | | $ | 164,763 |
FMIT Series 2006-3 | | | 824,265 | | | 781,242 | | | | 800,298 |
FMIT Series 2006-2 | | | 779,200 | | | 712,168 | | | | 728,748 |
FMIT Series 2006-1 | | | 926,936 | | | 769,706 | | | | 795,077 |
FMIT Series 2005-3 | | | 1,156,009 | | | 880,025 | | | | 870,905 |
FMIT Series 2005-2 | | | 911,081 | | | 601,942 | | | | 641,172 |
FMIT Series 2005-1 | | | 743,625 | | | 220,236 | | | | 350,102 |
FMIT Series 2004-5 | | | 892,350 | | | 180,677 | | | | 233,691 |
FMIT Series 2004-4 | | | 874,308 | | | 142,606 | | | | 153,971 |
FMIT Series 2004-3 | | | 949,000 | | | 95,440 | | | | 124,940 |
| | �� | | | | | | | | |
| | $ | 8,234,838 | | | 4,556,473 | | | | 4,863,667 |
Unamortized bond discount | | | — | | | (45,754 | ) | | | — |
| | | | | | | | | | |
Subtotal securitization bond financing | | | 8,234,838 | | | 4,510,719 | | | | 4,863,667 |
Liquid Funding repurchase facility | | | — | | | — | | | | 111,787 |
Lehman Brothers repurchase facility | | | — | | | 38,265 | | | | 57,424 |
| | | | | | | | | | |
Total securitization financing | | $ | 8,234,838 | | $ | 4,548,984 | | | $ | 5,032,878 |
| | | | | | | | | | |
We did not issue any mortgage-backed bonds through securitization trusts during the three months ended March 31, 2007, and issued $2.7 billion of mortgage-backed bonds during the year ended December 31, 2006. Interest rates reset monthly and are indexed to one-month LIBOR. The bonds pay interest monthly based upon a spread over LIBOR. We retain the option to repay the bonds when the remaining unpaid principal balance of the underlying mortgage loans for each pool falls below set thresholds of the original principal balance.
We also have the ability to finance the rated securities we retain in securitizations through two repurchase facilities, each with an uncommitted amount of $200 million. The first facility is with Liquid Funding, Ltd., an affiliate of Bear Stearns Bank plc. The second facility is with Lehman Brothers, Inc. and Lehman Brothers Commercial Paper Inc. Each facility bears interest at an annual rate of LIBOR plus an additional percentage. At March 31, 2007, we owned $84.9 million of investment grade rated securities that we had retained from previous securitizations. During the three months ended March 31, 2007, we sold $193.0 million of previously issued investment grade rated securities to C-BASS that we had retained and used as collateral for borrowings under our repurchase facilities. Approximately $94.1 million of the securities bear interest at fixed rates ranging between 5.0% and 6.5%, with a weighted average interest rate of 5.3%. The remaining $98.9 million of the securities bear interest at rates between LIBOR plus 0.9% and LIBOR plus 3.5%, with a weighted average interest rate of LIBOR plus 2.9%. The securities were sold net of an aggregate original issuance discount of $46.7 million, which has been allocated to the various securitized pools based on the face amount and sales price of the respective bonds sold. The original issuance discount is being amortized by securitized pool using the effective interest rate method, and $45.8 million of the original issuance discount was unamortized as of March 31, 2007.
44
As of March 31, 2007 and December 31, 2006, the outstanding bonds in our securitizations were cumulatively over-collateralized by $173.8 million and $168.6 million, respectively. The collateral includes mortgage loans, trustee receivables, and real estate owned. We enter into interest rate swap agreements to economically hedge the interest expense associated with the bonds, as described above under Critical Accounting Policies.
Total Shareholders’ Equity
Total shareholders’ equity decreased to $313.3 million at March 31, 2007, from $381.3 million at December 31, 2006. The change in shareholders’ equity primarily reflects the $68.6 million net loss for the three months ended March 31, 2007.
In compliance with the terms of our pending merger with C-BASS, there were no dividends declared for the three months ended March 31, 2007.
Business Segment Results
Fieldstone reports on a total of four business segments, which include two production segments and two operating segments. Our production segments include our Wholesale segment and our Retail segment. Our Wholesale segment originates non-conforming loans, while our Retail segment originates both conforming and non-conforming mortgages, in order to provide a complete range of mortgage options to our retail borrowers. The results of our former Conforming Wholesale and Conforming Retail segments are reported as discontinued operations prior to their disposal during the first quarter of 2006.
The results of operations of our production segments primarily include an allocation of net interest income for funded loans, direct expenses, and a corporate overhead expense allocation. In addition, segment revenues include an allocation which credits the production segments with the pro forma current value of the net gain on sale of loan production as if all of the segments’ fundings were sold servicing-released concurrent with funding, even though a portion of the loans originated will be held for investment. Loans held for investment generate revenue over the life of the loan, which currently averages approximately two years, and is recorded as part of our Investment Portfolio segment.
Our operating segments include the Investment Portfolio and Corporate segments. The results of operations of the Investment Portfolio segment primarily include the net interest income after provision for loan losses for our loans held for investment, changes in the fair value and cash settlements relating to our portfolio derivatives, and direct expenses, including third-party servicing fees, related to our loans held for investment. The results of operations of the Corporate segment primarily include direct expenses of the corporate home office, the elimination of the corporate overhead allocated to the production segments, and the income tax provision related to FMC, our taxable REIT subsidiary. The Corporate segment also includes various reconciling amounts necessary to adjust for the retention of a substantial portion of our non-conforming loans to be held for investment, and to convert the production segments’ allocated revenue and expenses to comply with GAAP reporting under Statement No. 91.
The results of operations reported per segment differ materially from consolidated results due to timing differences in net gain on sale recognition at the time of cash settlement of the sale compared to the revenue allocation which each segment receives at the time of loan funding, the actual whole loan sales prices compared to the pro forma values, the actual net interest margin earned on loans prior to their sale, and the holding for investment of a substantial portion of our non-conforming loans for which actual revenue will consist of net interest income generated over the life of the loan rather than net gain on sale recognized one-time as of the sale date.
45
Operating results by business segment for the three months ended March 31, 2007 are as follows:
| | | | | | | | | | | | | | | | | | | | |
| | | Production | | | Investment
Portfolio | | | Corporate | | | Consolidated | |
| | | Wholesale | | | Retail | | | | |
Revenues: | | | | | | | | | | | | | | | | | | | | |
Interest income | | $ | 4,681 | | | $ | 689 | | | $ | 99,068 | | | $ | 6,239 | | | $ | 110,677 | |
Interest expense | | | 2,947 | | | | 435 | | | | 76,674 | | | | 4,928 | | | | 84,984 | |
| | | | | | | | | | | | | | | | | | | | |
Net interest income | | | 1,734 | | | | 254 | | | | 22,394 | | | | 1,311 | | | | 25,693 | |
Provision for loan losses - loans held for investment | | | — | | | | — | | | | (21,436 | ) | | | — | | | | (21,436 | ) |
Gains (losses) on sales of mortgage loans, net | | | 8,496 | | | | 4,569 | | | | — | | | | (72,336 | ) | | | (59,271 | ) |
Other expense - portfolio derivatives | | | — | | | | — | | | | (1,582 | ) | | | — | | | | (1,582 | ) |
Other income (expense) | | | — | | | | 46 | | | | (1,084 | ) | | | (883 | ) | | | (1,921 | ) |
| | | | | | | | | | | | | | | | | | | | |
Total revenues | | | 10,230 | | | | 4,869 | | | | (1,708 | ) | | | (71,908 | ) | | | (58,517 | ) |
| | | | | | | | | | | | | | | | | | | | |
Direct expenses1 | | | 14,857 | | | | 5,870 | | | | 3,153 | | | | 8,607 | | | | 32,487 | |
Corporate overhead allocation | | | 4,469 | | | | 799 | | | | — | | | | (5,268 | ) | | | — | |
| | | | | | | | | | | | | | | | | | | | |
Total expenses | | | 19,326 | | | | 6,669 | | | | 3,153 | | | | 3,339 | | | | 32,487 | |
| | | | | | | | | | | | | | | | | | | | |
Loss before income taxes | | | (9,096 | ) | | | (1,800 | ) | | | (4,861 | ) | | | (75,247 | ) | | | (91,004 | ) |
Income tax benefit | | | — | | | | — | | | | — | | | | 22,372 | | | | 22,372 | |
| | | | | | | | | | | | | | | | | | | | |
Net loss | | $ | (9,096 | ) | | $ | (1,800 | ) | | $ | (4,861 | ) | | $ | (52,875 | ) | | $ | (68,632 | ) |
| | | | | | | | | | | | | | | | | | | | |
1 | The direct expenses of our Investment Portfolio include the allocation of corporate overhead, which is assessed to that segment through the transfer pricing of loans from the production segments. |
Operating results by business segment for the three months ended March 31, 2006 are as follows:
| | | | | | | | | | | | | | | | | | | | |
| | | Production | | | Investment
Portfolio | | | Corporate | | | Consolidated | |
| | | Wholesale | | | Retail | | | | |
Revenues: | | | | | | | | | | | | | | | | | | | | |
Interest income | | $ | 6,064 | | | $ | 1,018 | | | $ | 95,113 | | | $ | (481 | ) | | $ | 101,714 | |
Interest expense | | | 3,265 | | | | 565 | | | | 68,916 | | | | (1,225 | ) | | | 71,521 | |
| | | | | | | | | | | | | | | | | | | | |
Net interest income | | | 2,799 | | | | 453 | | | | 26,197 | | | | 744 | | | | 30,193 | |
Provision for loan losses - loans held for investment | | | — | | | | — | | | | (5,393 | ) | | | — | | | | (5,393 | ) |
Gains (losses) on sales of mortgage loans, net | | | 17,170 | | | | 6,755 | | | | — | | | | (13,630 | ) | | | 10,295 | |
Other income - portfolio derivatives | | | — | | | | — | | | | 12,158 | | | | — | | | | 12,158 | |
Other income (expense) | | | — | | | | 449 | | | | (238 | ) | | | 139 | | | | 350 | |
| | | | | | | | | | | | | | | | | | | | |
Total revenues | | | 19,969 | | | | 7,657 | | | | 32,724 | | | | (12,747 | ) | | | 47,603 | |
| | | | | | | | | | | | | | | | | | | | |
Direct expenses1 | | | 17,755 | | | | 8,912 | | | | 2,899 | | | | 4,193 | | | | 33,759 | |
Corporate overhead allocation | | | 4,200 | | | | 728 | | | | — | | | | (4,928 | ) | | | — | |
| | | | | | | | | | | | | | | | | | | | |
Total expenses | | | 21,955 | | | | 9,640 | | | | 2,899 | | | | (735 | ) | | | 33,759 | |
| | | | | | | | | | | | | | | | | | | | |
(Loss) income from continuing operations before income taxes | | | (1,986 | ) | | | (1,983 | ) | | | 29,825 | | | | (12,012 | ) | | | 13,844 | |
Income tax benefit | | | — | | | | — | | | | — | | | | 729 | | | | 729 | |
| | | | | | | | | | | | | | | | | | | | |
(Loss) income from continuing operations | | $ | (1,986 | ) | | $ | (1,983 | ) | | $ | 29,825 | | | $ | (11,283 | ) | | | 14,573 | |
| | | | | | | | | | | | | | | | | | | | |
Discontinued operations, net of income tax | | | | | | | | | | | | | | | | | | | (1,645 | ) |
| | | | | | | | | | | | | | | | | | | | |
Net income | | | | | | | | | | | | | | | | | | $ | 12,928 | |
| | | | | | | | | | | | | | | | | | | | |
1 | The direct expenses of our Investment Portfolio include the allocation of corporate overhead, which is assessed to that segment through the transfer pricing of loans from the production segments. |
Production Segments
Total segment contribution from our production segments decreased in the three months ended March 31, 2007 compared to the same period in 2006, due primarily to the decrease in loan originations and a reduction in the gain on sale revenue allocation per funding dollar.
46
Current market conditions, including significant competition for new loans, increasing delinquencies, decreased origination volumes, increased investor repurchase requests, and decreased net interest margins on new originations have resulted in a decrease in allocated revenues per loan to our production segments.
Wholesale Segment. Our wholesale segment contribution decreased in the three months ended March 31, 2007 compared to the same period in 2006 due to reduced sales margins and a 19% reduction in origination volumes for the three months ended March 31, 2007. Direct expenses decreased in the three months ended March 31, 2007 in the same period in 2006 due to the decreased origination volume and preliminary benefits realized from our cost management initiatives.
Retail Segment. Our retail segment contribution was comparable in the three months ended March 31, 2007 and 2006. Reduced sales margins and a 31% reduction in origination volumes were offset by a reduction in direct expenses due to our cost management initiatives.
Operating Segments
Investment Portfolio. The Investment Portfolio contribution decreased in the three months ended March 31, 2007 compared to the same period in 2006 due to increased provision for loan losses, decrease in net interest income, and fluctuations in the impact of our derivative contracts. The provision for loan losses increased in the three months ended March 31, 2007 due to the deterioration in the performance of subprime loans that has occurred in the second half of 2006 and into 2007. Net interest income decreased over the same periods as a result of the decrease in the average balance of the portfolio combined with the prepayment of older, higher margin loans while the more recent loans added to the portfolio have lower net margins. The margins available on new originations has narrowed, as competition has not permitted coupons to increase at the same rate as the increase in financing costs for such loans, which are indexed to rising market interest rates. The impact of our derivative contracts fluctuates from period to period based on the forward LIBOR curve, which impacts the non-cash mark to market changes in fair value, and the spread between the actual LIBOR rates during the period and the fixed swap rates. We anticipate contribution from our Investment Portfolio segment to remain at lower levels due to the narrower net interest margins on the recent additions to the portfolio and our current strategy of classifying essentially all new originations as held for sale in order to, among other things, reduce our portfolio leverage.
Corporate. The direct expenses reported under our Corporate segment rose in the three months ended March 31, 2007 compared to 2006 due to increased professional service fees related to our pending merger with C-BASS, increased audit fees as a result of compliance with the Sarbanes-Oxley Act of 2002, costs related to our operations consolidations that were accelerated and recognized in the current period in accordance with GAAP, and increased depreciation and amortization related to our new loan origination system. The Corporate segment also includes adjustments to reconcile the results of our other segments to GAAP. The gains on sales of mortgage loans reported for our Corporate segment has decreased because of the reconciling adjustments required as a result of the decreased sales premiums realized on recent sales, the increased provision for loans losses on loans sold, and the charge to reduce loans held for sale as of March 31, 2007 to the lower of cost or market value.
Liquidity and Capital Resources
As a mortgage lending company, we borrow substantial sums of money to fund the mortgage loans we originate. After funding, our primary operating subsidiary, FMC, holds all of the conforming loans, and all of the non-conforming loans that are not held for investment, in inventory prior to sale. We hold the remainder of the non-conforming loans for investment in our portfolio. Our primary cash requirements include:
| | • | | premiums paid in connection with loans originated by our Wholesale segment; |
| | • | | interest expense on our credit facilities and securitization financings; |
| | • | | ongoing general and administration expenses; |
| | • | | margin calls on our repurchase facilities; |
| | • | | repurchase requests for breaches of representation and warranties on whole loan trades; |
| | • | | funding the call transactions on our securitizations that fall below certain thresholds; |
| | • | | derivative transactions; and |
47
| | • | | REIT stockholder distributions – as a REIT, we are required to distribute at least 90% of our REIT taxable income to our shareholders. |
Our primary cash sources include:
| | • | | borrowings from our credit facilities secured by mortgage loans held in inventory and the securities we retain from our securitizations; |
| | • | | proceeds from the issuance of securities collateralized by the loans in our portfolio; |
| | • | | proceeds from whole loan sales; |
| | • | | principal and interest collections relative to the mortgage loans held in inventory; and |
| | • | | points and fees collected from the origination of retail and wholesale loans. |
We rely on our securitizations as a primary source of liquidity. As of March 31, 2007, we have completed thirteen securitizations, issuing an aggregate of $10.0 billion of mortgage-backed securities, none of which occurred during the first quarter of 2007.
On April 12, 2007, we issued $358.2 million of mortgage-backed bonds, FMIT Series 2007-1. The bonds contain similar provisions to our previous securitizations. The bonds bear interest at rates between LIBOR plus 0.257% to LIBOR plus 2.25%. One class of the bonds with a face amount of $4.1 million bears interest at a fixed rate of 7.00%.
We use our various credit facilities to fund substantially all of our loan originations. FMC sells the mortgage loans it holds within two or three months of origination and pays down these facilities with the proceeds. We issue mortgage-backed securities to pay down those facilities financing our loans held for investment.
The material terms and features of these credit facilities as of March 31, 2007 are as follows:
| | | | | | | | | | | | | | | | | | |
($ in 000,000s) Lender | | Committed | | Uncommitted | | Maturity Date | | Range of
Allowable
Advances | | Minimum
Consolidated
Tangible Net Worth | | Maximum
Ratio of
Indebtedness
to Adjusted
Tangible Net Worth | | Minimum
Liquidity |
Credit Suisse First Boston Mortgage Capital LLC1 | | $ | 400.0 | | $ | — | | April 2007 | | 91%-99% | | $ | 275.0 | | 18:1 | | $ | 20.0 |
Credit Suisse, New York Branch Commercial Paper Facility1 | | | 241.0 | | | — | | July 2007 | | 92.5% | | | 275.0 | | 18:1 | | | 20.0 |
JPMorgan Chase Bank, N.A | | | 250.0 | | | — | | July 2007 | | 94%-98% | | | 275.0 | | 18:1 | | | 20.0 |
Lehman Brothers Bank, FSB1 | | | 400.0 | | | — | | January 2008 | | 91.5%-98.5% | | | 275.0 | | 18:1 | | | 20.0 |
Merrill Lynch Bank USA | | | 200.0 | | | — | | October 2007 | | 91%-97% | | | 275.0 | | 18:1 | | | 20.0 |
| | | | | | | | | | | | | | | | | | |
Subtotal | | | 1,491.0 | | | — | | | | | | | | | | | | |
Liquid Fundings2 | | | — | | | 200.0 | | Uncommitted | | N/A | | | N/A | | N/A | | | N/A |
Lehman Brothers2 | | | — | | | 200.0 | | Uncommitted | | N/A | | | N/A | | N/A | | | N/A |
| | | | | | | | | | | | | | | | | | |
Total | | $ | 1,491.0 | | $ | 400.0 | | | | | | | | | | | | |
| | | | | | | | | | | | | | | | | | |
1 | The Company has amended the facility subsequent to March 31, 2007 as described below. |
2 | Facility remains open indefinitely, but may be terminated by either party at any time. |
Under our warehouse facilities, interest is payable monthly in arrears and outstanding principal is payable upon receipt of loan sale proceeds or transfer of a loan into a securitization trust. Outstanding principal is also repayable upon the occurrence of certain disqualifying events, which include a mortgage loan in default for a period of time, a repaid mortgage loan, a mortgage loan obtained with fraudulent information, or the failure to cure a defect in a mortgage loan’s documentation. Outstanding principal is repayable if the mortgage loan does not close, but had been pledged and funds were advanced. Our warehouse facilities contain terms mandating principal repayment if a loan under the facility remains under the facility after a contractual time period commencing from the date of funding, or on the maturity date of the facility. Under our facilities, advances bear interest at annual rates of LIBOR plus an additional percentage that varies depending upon the type of mortgage loans securing the advance. We are also required to pay non-use fees on unused amounts which exceed certain thresholds relating to the average outstanding balance of the facility. The facilities are secured by substantially all of our non-securitized mortgage loans and contain customary financial and operating covenants that require us to maintain specified levels of liquidity and net
48
worth, attain specified levels of profitability, restrict indebtedness and investments except in certain limited circumstances, restrict our ability to engage in certain mergers and consolidations or substantially change our business, restrict dividend payments during an event of default and require compliance with applicable laws.
During January 2007, we completed amendments to several of our warehouse facilities, including agreements with Lehman Brothers Bank, FSB (Lehman Brothers), Credit Suisse First Boston Mortgage Capital LLC (Credit Suisse First Boston), Credit Suisse, New York Branch (Credit Suisse, New York) and JPMorgan Chase Bank, N.A. (JPMorgan Chase). The amendment to the Lehman Brothers facility changed certain definitions and covenants, including the adjusted tangible net worth covenant, which was increased from $250 million to the higher of $350 million or the highest adjusted tangible net worth contained in any of our other warehouse lending agreements. Each of the other amendments waived the net profitability covenant through the first quarter of 2007 and lowered the adjusted tangible net worth covenant to $350 million. Additionally, the maximum aggregate purchase price for each of the facilities has been amended as follows (i) the Lehman Brothers facility increased the maximum facility amount from $300 million to $400 million, (ii) the Credit Suisse First Boston facility reduced its maximum aggregate purchase price from $400 million to $300 million, (iii) the Credit Suisse, New York facility reduced its maximum aggregate purchase price from $800 million to $500 million and (iv) the JPMorgan Chase facility increased its maximum aggregate purchase price from $150 million to $250 million.
On March 30, 2007, we completed amendments to each of our warehouse facilities. Each of the amendments modified certain covenants of the agreements, including waiving the profitability covenant, changing the required adjusted tangible net worth to $275 million, and raising the maximum allowable leverage ratios through April 13, 2007, which was subsequently extended until May 31, 2007, in the case of the Lehman Brothers agreement, or earlier of the expiration of the facility or July 2007 for all other agreements. Additionally, the maximum aggregate purchase price for the facilities has been amended as follows (i) the Credit Suisse First Boston facility raised its maximum aggregate purchase price to $400 million from $300 million, (ii) the Credit Suisse, New York facility reduced its maximum aggregate purchase price from $500 million to $241 million and (iii) the Merrill Lynch facility reduced its maximum aggregate purchase price from $400 million to $200 million.
We were in compliance with all of the covenants of our credit facilities as of March 31, 2007.
On April 23, 2007, we entered into Amendment No. 9 (the Ninth Amendment) to the Second Master Repurchase Agreement, dated as of March 31, 2005, as amended (the CSFB Master Repurchase Agreement), with Credit Suisse First Boston. The Ninth Amendment extends the termination date of the CSFB Master Repurchase Agreement to the earlier of (a) September 30, 2007 and (b) June 30, 2007, should our pending merger with C-BASS not be consummated by such date. The Ninth Amendment also requires that we maintain available borrowing capacity from all of their credit facility providers such that the maximum aggregate purchase price under the CSFB Master Repurchase Agreement ($400 million) does not represent more than fifty percent (50%) of the our available borrowing capacity from all sources, and further limits the maximum available purchase price under the CSFB Master Repurchase Agreement by the aggregate outstanding purchase price of all purchased mortgage loans allocated to the Credit Suisse Buying Group under the Amended and Restated Purchase Agreement, dated as of November 14, 2006, as amended.
On April 30, 2007, we entered into the Eighth Amendment (the Eighth Amendment) to the Second Amended and Restated Master Repurchase Agreement Governing Purchases and Sales of Mortgage Loans, dated as of December 29, 2004, as amended (the Lehman Master Repurchase Agreement), with Lehman Brothers. The Eighth Amendment extends the amendment period that we received from Lehman Brothers with respect to certain covenants, including the adjusted tangible net worth covenant, the minimum liquidity covenant, and the maximum permitted combined ratio of consolidated indebtedness to adjusted tangible net worth from April 30, 2007 to May 31, 2007. The Eighth Amendment also reduces its maximum aggregate purchase price under the Lehman Master Repurchase Agreement from $400 million to $200 million and changes the repurchase facility from a committed facility to an uncommitted facility. There were no borrowings under the facility as of April 30, 2007.
On May 7, 2007, we and Credit Suisse, New York, mutually terminated the Amended and Restated Master Repurchase Agreement, dated as of November 14, 2006, as amended. We were not required to pay any termination fees in connection with the termination of the facility. Prior to the termination, the Credit Suisse, New York facility provided for a maximum aggregate purchase price of $241 million. There were no borrowings under the facility as of May 7, 2007.
49
As of May 7, 2007, after all of the preceding amendments, we had a committed level of whole loan funding capacity of $850 million and an uncommitted level of whole loan funding capacity of $200 million, for an aggregate of $1.05 billion. This borrowing capacity is consistent with the expected decrease in origination volumes in 2007.
In addition to our traditional credit facilities, FMOC entered into two separate Master Repurchase Agreements with Liquid Funding, Ltd. (Liquid Funding), an affiliate of Bear Stearns Bank plc, and Lehman Brothers Inc. and Lehman Commercial Paper Inc. (together Lehman), respectively. FMOC may borrow up to an aggregate amount of $200 million under each facility by pledging a portfolio of non-prime mortgage-backed securities (retained securities) which are among the securities that we retain in our securitizations. The facilities may be terminated by either party at any time upon proper notice, and bear interest at an annual rate of LIBOR plus an additional percentage. As of March 31, 2007, $38.3 million of borrowings are outstanding under the Lehman agreement, no borrowings are outstanding under the Liquid Funding agreement, and we held approximately $84.9 million of retained securities as eligible collateral.
During the three months ended March 31, 2007, we sold $193.0 million of Retained Securities to C-BASS from eight of our outstanding securitizations. Approximately $94.1 million of the securities bear interest at fixed rates ranging between 5.0% and 6.5%, with a weighted average interest rate of 5.3%. The remaining $98.9 million of the securities bear interest at rates between LIBOR plus 0.9% and LIBOR plus 3.5%, with a weighted average interest rate of LIBOR plus 2.9%. The securities were issued net of an aggregate original issue discount of $46.7 million, which has been allocated to the various securitized pools based on the face amount and sales price of the respective bonds issued. The original issue discount is being amortized by securitized pool using the effective interest rate method, and $45.8 million of the original issue discount was unamortized as of March 31, 2007.
A primary component of our liquidity strategy is to finance our mortgage loans through a diverse group of lending counterparties prior to issuing securities collateralized by the loans held for investment and to schedule frequent sales or securitizations of loans so that the average holding period of our inventory of loans generally does not exceed 60 days. We use our excess cash from operations to reduce the advances on our credit facilities. This process reduces our debt outstanding and the corresponding interest expense incurred, and results in a pool of liquid mortgage collateral available to secure borrowings to meet our working capital needs. This pool of available collateral totaled approximately $28 million and $98 million as of March 31, 2007 and December 31, 2006, respectively.
Our liquidity has decreased significantly throughout 2006 and to date in 2007 primarily as a result of margin calls on the collateral for our credit facilities and increased loan repurchases. As the market value of the collateral declines, we are required to increase the amount of collateral held by our lenders to maintain the same amount of borrowings. Increased loan repurchases on loans sold as a result of deteriorating loan performance has required us to repurchase or replace the delinquent loans, decreasing the pool of available collateral on which we may borrow, as our ability to borrow against repurchased loans is limited. Margin calls and loan repurchase requests have increased during 2006 and to date in 2007, which has decreased our liquidity over that time period. In addition, due in part to the uncertainty in the subprime market, the number of investors in whole loan sales and securitizations of subprime loans has decreased. This has led in part to lower sales premiums on whole loan sales, and increased interest rates on the bonds issued in securitizations. If this trend continues further, our liquidity could continue to be negatively affected. Many of our lenders also lend to our competitors. To the extent that our lenders are negatively impacted by the conditions in the subprime industry, they may restrict liquidity to any participants in the subprime industry. This may require us to seek other sources of liquidity, which may not be available on terms that are acceptable to us.
As discussed in Recent Developments above, we have entered into the Merger Agreement, as amended, with C-BASS that is subject to various closing conditions. In order to provide pre-merger liquidity to the Company, C-BASS agreed to purchase, at the Company’s option, certain of our assets, including certain of our retained securities and substantially all of our inventories of loans held for sale and real estate owned properties and C-BASS and we have agreed to the forward sale of our future loan production to C-BASS for loans originated on or after March 1, 2007, which is exercisable at our option. As of May 10, 2007, C-BASS has purchased approximately $24 million of our self-financed inventory of mortgage loans and real estate owned assets, $187 million of unsecuritized recently originated loans and seasoned mortgage loans and approximately $193 million of our retained securities pursuant to our exercise of certain of the foregoing options. These purchase options pursuant to the Merger Agreement, as amended, have increased our available liquidity and decreased our dependence on identifying additional buyers for our loans. Management currently expects the pending merger to close during the second quarter of 2007, provided that required approvals and consents are obtained. However, the failure of this pending merger to close at that time, or at all, may subject us to increased liquidity risks, including our ability to generate sufficient cash flows to continue supporting our current operations and the potential default of covenants contained in our credit facilities, particularly the minimum adjusted tangible net worth and profitability covenants. In the event of a breach of a covenant contained
50
in a facility that triggers an event of default, then the lender may accelerate outstanding principal repayment owed under the facility and such acceleration may permit other lenders to accelerate all of the outstanding principal repayment under their facilities. Such a series of events could have a material adverse effect on our financial condition. In such a situation, we believe that we would be able to generate sufficient cash from our existing operations, maintain sufficient liquidity, and make alternative arrangements, including obtaining waivers or amendments from existing lenders or reach agreement with new lenders, to enable us to continue to meet our obligations for 2007. However, we would need to significantly restructure our operations, including further consolidation and work force reductions, to continue to meet our ongoing obligations in such circumstances, which could significantly adversely affect our results of operations.
Previously, we have used a portion of our cash and available liquidity to pay dividends to our shareholders. Beginning in 2007, according to the terms of our pending merger with C-BASS, we intend to only pay dividends as required to maintain our status as a REIT.
Cash Flows
For the three months ended March 31, 2007, our cash flows used in operating activities was $90.2 million compared to $212.2 million provided by the operating activities of our continuing operations for the three months ended March 31, 2006. The decrease in operating cash flows in 2007 is primarily due to the increase in loans originated that were classified as held for sale in the first quarter of 2007 compared to the first quarter of 2006 and the increase in deferred tax assets in 2007. Our cash provided by investing activities was $565.2 million for the three months ended March 31, 2007, compared to $227.7 million used in the investing activities of our continuing operations for the three months ended March 31, 2006. The increase in cash provided by investing activities in 2007 primarily relates to the decreased volume of loans funded for investment in 2007 combined with the increase in restricted cash during the three months ended March 31, 2006 as a result of provisions of the securitization we completed during that time period. Investing cash flows, as presented in our condensed consolidated statements of cash flows, will typically be negative because they exclude the net proceeds from mortgage warehouse financing and securitization financing used to support the increase in our investment in mortgage loans. We are required to show the net proceeds from, or repayments of, mortgage financing in our consolidated statements of cash flows as cash flow from financing activities and not as investing cash flow. Our cash flows used in financing activities were $459.9 million for the three months ended March 31, 2007 compared to $8.7 million from our continuing operations for the three months ended March 31, 2006. A greater amount of cash was used by financing activities due to the reduced proceeds from securitization financings in 2007.
Commitments and Contingencies
(a) Loan Commitments
As of March 31, 2007 and December 31, 2006, we had origination commitments outstanding to fund approximately $303.5 million and $541.5 million in mortgage loans, respectively. Fixed rate and hybrid ARM mortgages which are fixed for the initial two to three year term of the loan comprised all of the outstanding origination commitments. We had forward delivery commitments to sell approximately $0.6 billion and $0.9 billion of loans and forward contracts at March 31, 2007 and December 31, 2006, respectively, of which $365.0 million and $45.0 million, respectively, were mandatory sales of mortgage-backed securities and mandatory investor whole loan trades. Treasury note forward contracts, used to economically hedge the interest rate risk of non-conforming loans, comprised $0.2 billion and $0.9 billion of the forward delivery commitments as of March 31, 2007 and December 31, 2006, respectively.
(b) Legal Matters
For a discussion of certain material legal proceedings that we are involved in, see Part II, Item 1 of this Quarterly Report on Form 10-Q. Because the nature of our business involves the collection of numerous accounts, the validity of liens and compliance with various state and federal lending and consumer protection laws, we are subject to various legal proceedings in the ordinary course of our business related to foreclosures, bankruptcies, condemnation and quiet title actions and alleged statutory and regulatory violations. We are also subject to other legal proceedings in the ordinary course of business related to employee matters. All of these ordinary course proceedings, taken as a whole, are not expected to have a material adverse effect on our business, financial condition, results of operations, or cash flows. However, if an unfavorable ruling were to occur in one or more of these proceedings, there exits the possibility of a material impact on our financial condition, results of operations, or cash flows.
51
Other Operational and Investment Portfolio Data
Loan Fundings
Total fundings for the three months ended March 31, 2007 and 2006 are as follows:
| | | | | | | | | | | | |
| | | Three Months Ended March 31, | |
| | | 2007 | | | 2006 | |
($ in 000s) | | Fundings | | % of
Total | | | Fundings | | % of
Total | |
Wholesale | | $ | 693,466 | | 87 | % | | $ | 860,523 | | 76 | % |
Retail | | | 103,598 | | 13 | % | | | 150,795 | | 13 | % |
| | | | | | | | | | | | |
Total continuing operations | | | 797,064 | | 100 | % | | | 1,011,318 | | 89 | % |
Discontinued operations | | | — | | — | | | | 127,797 | | 11 | % |
| | | | | | | | | | | | |
Total fundings | | $ | 797,064 | | 100 | % | | $ | 1,139,115 | | 100 | % |
| | | | | | | | | | | | |
Loan fundings decreased to $0.8 billion in the three months ended March 31, 2007 from $1.0 billion from continuing operations in the three months ended March 31, 2006. The decrease in loan fundings was due primarily to a decline in the overall mortgage market and recent changes to our product offerings, underwriting guidelines, and pricing in response to current market conditions the effect of which is to restrict the range of mortgage products we originate. This decrease in loan fundings directly affected the levels of all of our revenues and many of our operating expenses. The factors that resulted in decreased fundings in the first quarter of 2007 may continue to limit our fundings in the near-term.
Originated Non-Conforming Loan Characteristics
The following tables provide a summary of the characteristics of our total non-conforming loan originations for the three months ended March 31, 2007:
Income Documentation
| | | | | | | | | | | | | | | | | | | | |
| | | Aggregate
Principal
Balance | | Percent of
Originations | | | Weighted
Average
Coupon | | | Weighted
Average
Credit
Score | | Average
Principal
Balance | | Weighted
Average
LTV | | | Weighted
Average
CLTV | |
Full Documentation | | $ | 304,734 | | 38.3 | % | | 8.1 | % | | 642 | | $ | 180 | | 86.3 | % | | 90.6 | % |
Stated Income Wage Earner | | | 29,294 | | 3.7 | % | | 8.0 | % | | 663 | | | 182 | | 81.8 | % | | 86.8 | % |
Stated Income Self Employed | | | 367,810 | | 46.1 | % | | 8.1 | % | | 685 | | | 268 | | 85.6 | % | | 93.0 | % |
24 Month Bank Statements | | | 37,487 | | 4.7 | % | | 7.9 | % | | 638 | | | 266 | | 84.6 | % | | 88.8 | % |
12 Month Bank Statements | | | 57,167 | | 7.2 | % | | 8.2 | % | | 662 | | | 259 | | 88.1 | % | | 95.8 | % |
Limited Documentation | | | 572 | | 0.0 | % | | 8.0 | % | | 628 | | | 190 | | 82.1 | % | | 82.1 | % |
| | | | | | | | | | | | | | | | | | | | |
Total | | $ | 797,064 | | 100.0 | % | | | | | | | | | | | | | | |
| | | | | | | | | | | | | | | | | | | | |
Weighted Average/Average | | | | | | | | 8.1 | % | | 664 | | $ | 222 | | 85.9 | % | | 91.8 | % |
| | | | | | | | | | | | | | | | | | | | |
Credit Score
| | | | | | | | | | | | | | | | | | | | | | | |
| | | Aggregate
Principal
Balance | | Percent of
Originations | | | Weighted
Average
Coupon | | | Weighted
Average
Credit
Score | | Average
Principal
Balance | | Weighted
Average
LTV | | | Weighted
Average
CLTV | | | Percent Full
Documentation | |
500 – 549 | | $ | 15,303 | | 1.9 | % | | 9.1 | % | | 538 | | $ | 163 | | 76.6 | % | | 76.6 | % | | 72.9 | % |
550 – 599 | | | 84,895 | | 10.6 | % | | 8.7 | % | | 582 | | | 181 | | 84.5 | % | | 84.7 | % | | 69.9 | % |
600 – 649 | | | 232,232 | | 29.1 | % | | 8.4 | % | | 627 | | | 208 | | 87.2 | % | | 90.3 | % | | 50.7 | % |
650 – 699 | | | 263,493 | | 33.1 | % | | 7.9 | % | | 676 | | | 234 | | 86.0 | % | | 93.7 | % | | 26.4 | % |
700 or greater | | | 201,141 | | 25.3 | % | | 7.7 | % | | 735 | | | 258 | | 85.4 | % | | 95.4 | % | | 23.5 | % |
| | | | | | | | | | | | | | | | | | | | | | | |
Total | | $ | 797,064 | | 100.0 | % | | | | | | | | | | | | | | | | | |
| | | | | | | | | | | | | | | | | | | | | | | |
Weighted Average/Average | | | | | | | | 8.1 | % | | 664 | | $ | 222 | | 85.9 | % | | 91.8 | % | | 38.3 | % |
| | | | | | | | | | | | | | | | | | | | | | | |
52
Product Type
| | | | | | | | | | | | | | | | | | | | | | | |
| | | Aggregate
Principal
Balance | | Percent of
Originations | | | Weighted
Average
Coupon | | | Weighted
Average
Credit
Score | | Average
Principal
Balance | | Weighted
Average
LTV | | | Weighted
Average
CLTV | | | Percent Full
Documentation | |
2/28 LIBOR ARM | | $ | 79,934 | | 10.0 | % | | 8.9 | % | | 623 | | $ | 183 | | 87.5 | % | | 89.7 | % | | 45.2 | % |
2/28 LIBOR ARM IO | | | 52,919 | | 6.6 | % | | 8.2 | % | | 664 | | | 395 | | 86.1 | % | | 94.9 | % | | 20.2 | % |
3/27 LIBOR ARM | | | 23,102 | | 2.9 | % | | 8.9 | % | | 628 | | | 183 | | 87.5 | % | | 89.3 | % | | 51.8 | % |
3/27 LIBOR ARM IO | | | 3,308 | | 0.4 | % | | 8.0 | % | | 675 | | | 331 | | 82.1 | % | | 95.1 | % | | 5.4 | % |
5/25 Treasury ARM | | | 20,589 | | 2.6 | % | | 7.7 | % | | 692 | | | 254 | | 85.9 | % | | 93.9 | % | | 20.1 | % |
5/25 Treasury ARM IO | | | 161,833 | | 20.3 | % | | 7.1 | % | | 709 | | | 394 | | 82.3 | % | | 97.2 | % | | 25.8 | % |
5/25 ARM w 10/IO | | | 10,915 | | 1.4 | % | | 7.0 | % | | 710 | | | 404 | | 82.8 | % | | 92.7 | % | | 37.6 | % |
Fixed Rate | | | 198,158 | | 24.9 | % | | 7.7 | % | | 649 | | | 194 | | 83.1 | % | | 85.8 | % | | 59.4 | % |
Fixed Rate IO | | | 16,151 | | 2.0 | % | | 7.1 | % | | 670 | | | 344 | | 82.3 | % | | 87.9 | % | | 50.3 | % |
2ndLiens | | | 57,822 | | 7.3 | % | | 10.7 | % | | 696 | | | 77 | | 99.4 | % | | 99.4 | % | | 27.7 | % |
2/38 LIBOR ARM | | | 98,314 | | 12.3 | % | | 8.4 | % | | 633 | | | 303 | | 87.3 | % | | 90.5 | % | | 29.8 | % |
2/48 LIBOR ARM | | | 43,467 | | 5.5 | % | | 8.2 | % | | 660 | | | 375 | | 87.7 | % | | 94.1 | % | | 28.0 | % |
3/37 LIBOR ARM | | | 22,016 | | 2.8 | % | | 8.3 | % | | 641 | | | 262 | | 87.9 | % | | 90.4 | % | | 41.6 | % |
3/47 LIBOR ARM | | | 5,694 | | 0.7 | % | | 7.9 | % | | 669 | | | 380 | | 84.4 | % | | 94.8 | % | | 49.5 | % |
10/25 LIBOR ARM | | | 642 | | 0.1 | % | | 7.1 | % | | 687 | | | 214 | | 83.8 | % | | 90.7 | % | | 70.4 | % |
10/25 LIBOR ARM IO | | | 1,795 | | 0.2 | % | | 7.1 | % | | 732 | | | 598 | | 83.2 | % | | 100.0 | % | | 0.00 | % |
3/25 LIBOR ARM | | | 160 | | 0.0 | % | | 9.6 | % | | 697 | | | 160 | | 100.0 | % | | 100.0 | % | | 0.00 | % |
6 Month LIBOR ARM IO | | | 245 | | 0.0 | % | | 6.0 | % | | 756 | | | 247 | | 85.0 | % | | 85.0 | % | | 100.0 | % |
| | | | | | | | | | | | | | | | | | | | | | | |
Total | | $ | 797,064 | | 100.0 | % | | | | | | | | | | | | | | | | | |
| | | | | | | | | | | | | | | | | | | | | | | |
Weighted Average/Average | | | | | | | | 8.1 | % | | 664 | | $ | 222 | | 85.9 | % | | 91.8 | % | | 38.3 | % |
| | | | | | | | | | | | | | | | | | | | | | | |
Cost to Produce
Cost to produce is a non-GAAP financial measure within the meaning of Regulation G promulgated by the SEC. Management believes that the presentation of cost to produce provides useful information to investors regarding financial performance because this measure includes additional costs to originate mortgage loans, both recognized when incurred and deferred costs, which are not included in total expenses under GAAP. Management uses cost to produce to evaluate the efficiency of its origination operations. The presentation of cost to produce is not meant to be considered in isolation or as a substitute for financial results prepared in accordance with GAAP.
53
As required by Regulation G, a reconciliation of cost to produce, excluding the results of our discontinued conforming segments, to the most directly comparable measure under GAAP, total expenses, for the three months ended March 31, 2007 and 2006 is as follows:
| | | | | | | | |
| | | Three Months Ended
March 31, | |
($ in 000s) | | 2007 | | | 2006 | |
Total expenses | | $ | 32,487 | | | $ | 33,759 | |
Deferred origination costs | | | 5,505 | | | | 6,506 | |
Servicing costs - internal and external | | | (3,478 | ) | | | (3,255 | ) |
| | | | | | | | |
Total operating costs | | | 34,514 | | | | 37,010 | |
Premiums paid, net of fees collected | | | (2,441 | ) | | | (1,398 | ) |
| | | | | | | | |
Cost to produce1 | | $ | 32,073 | | | $ | 35,612 | |
| | | | | | | | |
Mortgage loan fundings: | | | | | | | | |
Wholesale | | | 693,466 | | | $ | 860,523 | |
Retail | | | 103,598 | | | | 150,795 | |
| | | | | | | | |
Mortgage loan fundings1 | | $ | 797,064 | | | $ | 1,011,318 | |
| | | | | | | | |
Cost to produce as % of mortgage loan fundings: | | | | | | | | |
Total expenses | | | 4.08 | % | | | 3.34 | % |
Deferred origination costs | | | 0.69 | % | | | 0.64 | % |
Servicing costs - internal and external | | | (0.44 | %) | | | (0.32 | %) |
| | | | | | | | |
Total operating costs | | | 4.33 | % | | | 3.66 | % |
Premiums paid, net of fees collected | | | (0.31 | %) | | | (0.14 | %) |
| | | | | | | | |
Cost to produce as % of mortgage loan fundings | | | 4.02 | % | | | 3.52 | % |
| | | | | | | | |
1 | Excludes cost to produce and mortgage loan fundings relating to discontinued operations. |
Our cost to produce increased in the three months ended March 31, 2007 compared to the same period in 2006 due primarily to an increased allocation of fixed costs on a per-loan basis as a result of lower funding volumes, $0.8 million of costs related to our operations consolidations that were accelerated and recognized in the current period in accordance with GAAP, increased professional service fees related to our pending merger with C-BASS, increased audit fees as a result of compliance with the Sarbanes-Oxley Act of 2002, and increased depreciation and amortization related to our new loan origination system.
In response to the increase in cost to produce as a percentage of origination volume, we have consolidated our operations centers, reduced our home office staff, changed our pricing and commission plans, implemented a new loan origination system, and re-structured vendor relationships.
54
Investment Portfolio
The following tables provide a summary of the characteristics of the principal balance of our portfolio of loans held for investment as of March 31, 2007:
Income Documentation
| | | | | | | | | | | | | | | | | | | | |
| | | Aggregate
Principal
Balance | | Percent
of
Portfolio | | | Weighted
Average
Coupon | | | Weighted
Average
Credit
Score | | Average
Principal
Balance | | Weighted
Average
LTV | | | Weighted
Average
CLTV | |
Full Documentation | | $ | 2,176,009 | | 43.7 | % | | 8.1 | % | | 617 | | $ | 142 | | 83.0 | % | | 92.1 | % |
Stated Income Wage Earner | | | 943,268 | | 18.9 | % | | 8.3 | % | | 673 | | | 218 | | 83.3 | % | | 94.0 | % |
Stated Income Self Employed | | | 1,396,518 | | 28.0 | % | | 8.1 | % | | 684 | | | 193 | | 84.2 | % | | 95.2 | % |
24 Month Bank Statements | | | 120,938 | | 2.4 | % | | 8.3 | % | | 627 | | | 204 | | 84.4 | % | | 91.7 | % |
12 Month Bank Statements | | | 322,143 | | 6.5 | % | | 8.2 | % | | 642 | | | 197 | | 84.8 | % | | 94.5 | % |
Limited Documentation | | | 20,118 | | 0.5 | % | | 8.2 | % | | 649 | | | 221 | | 82.8 | % | | 94.3 | % |
| | | | | | | | | | | | | | | | | | | | |
Total | | $ | 4,978,994 | | 100.0 | % | | | | | | | | | | | | | | |
| | | | | | | | | | | | | | | | | | | | |
Weighted Average/Average | | | | | | | | 8.1 | % | | 648 | | $ | 171 | | 83.5 | % | | 93.5 | % |
| | | | | | | | | | | | | | | | | | | | |
Credit Score
| | | | | | | | | | | | | | | | | | | | | | | |
| | | Aggregate
Principal
Balance | | Percent
of
Portfolio | | | Weighted
Average
Coupon | | | Weighted
Average
Credit
Score | | Average
Principal
Balance | | Weighted
Average
LTV | | | Weighted
Average
CLTV | | | Percent Full
Documentation | |
500 – 549 | | $ | 185,043 | | 3.8 | % | | 9.8 | % | | 534 | | $ | 126 | | 79.5 | % | | 81.3 | % | | 82.5 | % |
550 – 599 | | | 749,080 | | 15.1 | % | | 8.5 | % | | 579 | | | 152 | | 81.7 | % | | 87.5 | % | | 77.1 | % |
600 – 649 | | | 1,551,813 | | 31.1 | % | | 8.1 | % | | 625 | | | 157 | | 83.4 | % | | 93.0 | % | | 63.7 | % |
650 – 699 | | | 1,670,613 | | 33.5 | % | | 8.0 | % | | 673 | | | 197 | | 84.1 | % | | 96.2 | % | | 20.7 | % |
700 or greater | | | 822,445 | | 16.5 | % | | 7.9 | % | | 731 | | | 186 | | 85.2 | % | | 97.1 | % | | 13.0 | % |
| | | | | | | | | | | | | | | | | | | | | | | |
Total | | $ | 4,978,994 | | 100.0 | % | | | | | | | | | | | | | | | | | |
| | | | | | | | | | | | | | | | | | | | | | | |
Weighted Average/Average | | | | | | | | 8.1 | % | | 648 | | $ | 171 | | 83.5 | % | | 93.5 | % | | 43.7 | % |
| | | | | | | | | | | | | | | | | | | | | | | |
Product Type | | | | | | | | | | | | | | | | | | | | | | | |
| | | Aggregate
Principal
Balance | | Percent
of
Portfolio | | | Weighted
Average
Coupon | | | Weighted
Average
Credit
Score | | Average
Principal
Balance | | Weighted
Average
LTV | | | Weighted
Average
CLTV | | | Percent Full
Documentation | |
2/28 LIBOR ARM | | $ | 1,237,056 | | 24.9 | % | | 8.6 | % | | 616 | | $ | 138 | | 81.8 | % | | 91.3 | % | | 58.5 | % |
2/28 LIBOR ARM IO | | | 2,106,407 | | 42.2 | % | | 7.8 | % | | 667 | | | 282 | | 83.5 | % | | 95.7 | % | | 29.7 | % |
3/27 LIBOR ARM | | | 164,134 | | 3.3 | % | | 7.7 | % | | 624 | | | 138 | | 82.5 | % | | 90.9 | % | | 64.7 | % |
3/27 LIBOR ARM IO | | | 274,784 | | 5.5 | % | | 7.0 | % | | 663 | | | 262 | | 82.1 | % | | 93.0 | % | | 44.7 | % |
5/25 Treasury ARM | | | 37,111 | | 0.8 | % | | 7.2 | % | | 658 | | | 207 | | 80.1 | % | | 89.0 | % | | 46.3 | % |
5/25 Treasury ARM IO | | | 105,325 | | 2.1 | % | | 7.2 | % | | 676 | | | 326 | | 83.2 | % | | 91.9 | % | | 43.4 | % |
Fixed Rate | | | 468,055 | | 9.5 | % | | 7.9 | % | | 639 | | | 151 | | 80.5 | % | | 89.0 | % | | 64.1 | % |
Fixed Rate IO | | | 20,627 | | 0.4 | % | | 7.7 | % | | 653 | | | 266 | | 83.2 | % | | 90.6 | % | | 60.6 | % |
2ndLiens | | | 268,365 | | 5.5 | % | | 10.7 | % | | 678 | | | 49 | | 99.4 | % | | 99.4 | % | | 24.8 | % |
2/38 LIBOR ARM | | | 229,983 | | 4.6 | % | | 8.3 | % | | 628 | | | 225 | | 84.1 | % | | 92.9 | % | | 48.2 | % |
2/48 LIBOR ARM | | | 1,950 | | 0.0 | % | | 8.4 | % | | 657 | | | 488 | | 100.0 | % | | 100.0 | % | | 41.9 | % |
3/37 LIBOR ARM | | | 10,046 | | 0.2 | % | | 8.4 | % | | 635 | | | 214 | | 85.7 | % | | 93.2 | % | | 53.3 | % |
6 Month LIBOR ARM | | | 663 | | 0.0 | % | | 8.6 | % | | 671 | | | 166 | | 84.2 | % | | 92.0 | % | | 28.3 | % |
6 Month LIBOR ARM IO | | | 2,203 | | 0.0 | % | | 8.3 | % | | 659 | | | 220 | | 79.3 | % | | 89.8 | % | | 11.1 | % |
40 Year Fixed | | | 52,285 | | 1.0 | % | | 8.1 | % | | 631 | | | 210 | | 83.3 | % | | 88.6 | % | | 64.8 | % |
| | | | | | | | | | | | | | | | | | | | | | | |
Total | | $ | 4,978,994 | | 100.0 | % | | | | | | | | | | | | | | | | | |
| | | | | | | | | | | | | | | | | | | | | | | |
Weighted Average/Average | | | | | | | | 8.1 | % | | 648 | | $ | 171 | | 83.5 | % | | 93.5 | % | | 43.7 | % |
| | | | | | | | | | | | | | | | | | | | | | | |
55
Core Financial Measures
The various core financial measures presented below are non-GAAP financial measures within the meaning of Regulation G promulgated by the SEC. Management believes that the presentation of core financial measures is useful to investors because they include the current period cash settlements on our hedging program but exclude the non-cash mark to market valuation changes and the amortization of swap buydown payments, allowing investors more insight into current period earnings and performance. Our hedging program consists of derivative contracts, primarily interest rate swap agreements, to hedge loans held in its portfolio during the fixed rate portion of the loan, when we receive a fixed rate of interest income on the loan but pay a variable rate of interest expense on the debt underlying the loan. The non-cash valuation changes on these derivatives are excluded from core measures because they represent the market’s estimates of future interest rates, which are not directly related to our business operations, and the estimated valuations do not include any off-setting changes in the interest expense on the swapped debt that would be incurred. Cash settlements, representing the difference between the swapped interest rate and the actual interest rates, are included in core financial measures as they are incurred. Both the changes in the fair value and all cash settlements related to these derivative contracts are recognized in the line item “Other (expense) income– portfolio derivatives” on the consolidated statements of operations. Management uses the core measures to evaluate our profitability for purposes of personnel incentives, profitability analysis and for covenant compliance with its lenders. The presentation of these measures is not meant to be considered in isolation or as a substitute for financial results prepared in accordance with GAAP. As required by Regulation G, a reconciliation of each core financial measure to the most directly comparable GAAP financial measure is presented below.
Core Net Income and Core Earnings per Share
A reconciliation of net income and earnings per share in the consolidated statements of operations, presented in accordance with GAAP, to core net income and core earnings per share for the three months ended March 31, 2007 and 2006 is as follows:
| | | | | | | | |
| | | Three Months Ended March 31, | |
($ in 000s) | | 2007 | | | 2006 | |
Core net income: | | | | | | | | |
Net (loss) income | | $ | (68,632 | ) | | $ | 12,928 | |
Add back: Mark to market loss (gain) on portfolio derivatives | | | 5,830 | | | | (1,894 | ) |
Add back: Amortization of interest rate swap buydown | | | (615 | ) | | | (867 | ) |
| | | | | | | | |
Core net (loss) income | | $ | (63,417 | ) | | $ | 10,167 | |
| | | | | | | | |
| | |
Core (loss) earnings per share: | | | | | | | | |
Net (loss) income | | $ | (68,632 | ) | | $ | 12,928 | |
Nonvested restricted stock dividends | | | — | | | | (78 | ) |
| | | | | | | | |
Net (loss) income available to common shareholders | | $ | (68,632 | ) | | | 12,850 | |
Add back: Mark to market loss (gain) on portfolio derivatives | | | 5,830 | | | | (1,894 | ) |
Amortization of interest rate swap buydown payments | | | (615 | ) | | | (867 | ) |
| | | | | | | | |
Core net (loss) income available to common shareholders | | $ | (63,417 | ) | | $ | 10,089 | |
| | | | | | | | |
(Loss) earnings per share – basic and diluted | | $ | (1.47 | ) | | $ | 0.27 | |
Core (loss) earnings per share – basic and diluted | | $ | (1.36 | ) | | $ | 0.21 | |
Weighted average common shares outstanding-basic and diluted | | | 46,744,894 | | | | 48,273,985 | |
The decrease in core net income during the three months ended March 31, 2007 compared to the same period in 2006 was primarily due to decreases in both our net gains on sale and net interest income due to a decline in net interest margin on new originations and an increase in our provision for loan losses. Partially offsetting these factors, a $0.9 million pre-tax loss on the disposal of our discontinued operations during 2006, while no comparable charge has been recorded in 2007.
56
Core Net Interest Income and Margin
A reconciliation of net interest income after provision for loan losses in the consolidated statements of operations, presented in accordance with GAAP, to core net interest income after provision for loan losses for the three months ended March 31, 2007 and 2006 is as follows:
| | | | | | | | |
| | | Three Months Ended
March 31, | |
($ in 000s) | | 2007 | | | 2006 | |
Core net interest income after provision for loan losses: | | | | | | | | |
Net interest income after provision for loan losses | | $ | 4,257 | | | $ | 24,800 | |
Plus: Net cash settlements on portfolio derivatives included in “Other (expense) income – portfolio derivatives” | | | 4,248 | | | | 10,264 | |
Add back: Amortization of interest rate swap buydown payments | | | (615 | ) | | | (867 | ) |
| | | | | | | | |
Core net interest income after provision for loan losses | | $ | 7,890 | | | $ | 34,197 | |
| | | | | | | | |
Interest income loans held for investment | | $ | 99,068 | | | $ | 95,113 | |
| | |
Interest expense loans held for investment | | | 76,674 | | | | 68,916 | |
Plus: Net cash settlements on portfolio derivatives | | | (4,248 | ) | | | (10,264 | ) |
Plus: Amortization of interest rate swap buydown payments | | | 615 | | | | 867 | |
| | | | | | | | |
Core interest expense – loans held for investment | | | 73,041 | | | | 59,519 | |
| | | | | | | | |
Core net interest income loans held for investment | | | 26,027 | | | | 35,594 | |
Provision for loan losses loans held for investment | | | 21,436 | | | | 5,393 | |
| | | | | | | | |
Core net interest income loans held for investment after provision for loan losses | | | 4,591 | | | | 30,201 | |
| | |
Net interest income loans held for sale | | | 3,299 | | | | 3,996 | |
| | | | | | | | |
Core net interest income after provision for loan losses | | $ | 7,890 | | | $ | 34,197 | |
| | | | | | | | |
Core yield analysis: | | | | | | | | |
Core yield analysis – loans held for investment: | | | | | | | | |
Coupon interest income on loans held for investment | | | 7.57 | % | | | 7.07 | % |
Amortization of deferred origination costs | | | (0.09 | )% | | | (0.50 | )% |
Prepayment fees | | | 0.24 | % | | | 0.41 | % |
| | | | | | | | |
Yield on loans held for investment | | | 7.72 | % | | | 6.98 | % |
| | | | | | | | |
Cost of financing for loans held for investment | | | 5.85 | % | | | 5.17 | % |
Net cash settlements received on portfolio derivatives | | | (0.32 | )% | | | (0.77 | )% |
Amortization of interest rate swap buydown payments | | | 0.05 | % | | | 0.06 | % |
| | | | | | | | |
Core cost of financing for loans held for investment | | | 5.58 | % | | | 4.46 | % |
| | | | | | | | |
Net yield on loans held for investment | | | 1.74 | % | | | 1.92 | % |
Net cash settlements received on portfolio derivatives | | | 0.33 | % | | | 0.75 | % |
Amortization of interest rate swap buydown payments | | | (0.05 | )% | | | (0.06 | )% |
| | | | | | | | |
Core net yield on loans held for investment | | | 2.02 | % | | | 2.61 | % |
Provision for loan losses – loans held for investment | | | (1.67 | )% | | | (0.40 | )% |
| | | | | | | | |
Core yield on loans held for investment after provision for loan losses | | | 0.35 | % | | | 2.21 | % |
| | | | | | | | |
Core yield analysis – loans held for sale: | | | | | | | | |
Yield on loans held for sale | | | 7.89 | % | | | 8.00 | % |
Cost of financing for loans held for sale | | | 5.92 | % | | | 4.91 | % |
Net yield on loans held for sale | | | 2.24 | % | | | 4.84 | % |
| | |
Total core yield analysis: | | | | | | | | |
Total yield- net interest income after provision for loan losses | | | 0.30 | % | | | 1.72 | % |
Net cash settlements received on portfolio derivatives | | | 0.30 | % | | | 0.71 | % |
Amortization of interest rate swap buydown payments | | | (0.05 | )% | | | (0.06 | )% |
| | | | | | | | |
Core yield – net interest income on loans held for sale and loans held for investment after provision for loan losses | | | 0.55 | % | | | 2.37 | % |
| | | | | | | | |
57
Core net interest income after the provision for loan losses decreased for the three months ended March 31, 2007 due primarily to the increased provision for loan losses resulting from the performance of recent originations and the lower net interest spreads available on new loans added to the portfolio, as older loans prepaid and have been replaced with lower margin loans, which includes the impact of higher interest rate swap rates.
Recent Accounting Pronouncements
For discussion of recently issued accounting pronouncements that may impact our operations or financial condition, see Note 1 to our Condensed Consolidated Financial Statements.
Off-Balance Sheet Arrangements
As of March 31, 2007, we were not a party to any off-balance sheet arrangements.
Effect of Inflation
Inflation affects us most significantly in the effect it has on interest rates and real estate values. Our level of loan originations is affected by the level and trends of interest rates. Interest rates normally increase during periods of high inflation (or in periods when the Federal Reserve Bank raises short-term interest rates in an attempt to prevent inflation) and decrease during periods of low inflation. In addition, inflation of real estate values increases the equity homeowners have in their homes and increases the volume of refinancing loans we can originate as borrowers draw down on the increased equity in their homes. We believe that real estate inflation improves the performance of our loans, reducing delinquencies and defaults, as borrowers protect or borrow against the equity in their homes.
| ITEM 3. | QUANTITATIVE AND QUALITATIVE DISCLOSURES ABOUT MARKET RISK. |
General
The market risk discussions and timing of re-pricing of our interest rate sensitive assets and liabilities are forward-looking statements that assume that certain market conditions occur. Actual results may differ materially from these forecasts due to changes in our held for sale portfolio and borrowing mix and due to developments in the finance and real estate markets, including the likelihood of changing interest rates and the impact of these changes on our net interest margin, cost of funds and cash flows. The methods we utilize to assess and mitigate these market risks should not be considered projections of future events or operating performance.
We carry interest-sensitive assets on our balance sheet that are financed by interest-sensitive liabilities. We are subject to interest rate risk because the interval for re-pricing of the assets and liabilities is not matched. An increase or decrease in interest rates would affect our net interest income and the fair value of our mortgage loans as well as the related financing. We employ hedging strategies to manage the interest-rate risk inherent in our assets and liabilities. These strategies are designed to create gains when movements in interest rates would cause our cash flows or the value of our assets to decline and to result in losses when movements in interest rates cause our cash flows and/or the value of our assets to increase.
The interest rates on our hybrid ARM loans held for investment are fixed for the first two to three years of the loan, after which the interest rates generally reset every six months to the then-current market rate. The interest rates on the bonds financing these loans reset to current market rates each month during the entire term of the loan. During the period we are receiving fixed rate payments on our loans, we use interest rate swaps to pay fixed rate payments to the swap counter-party, and receive variable interest rate payments which match the interest rates on our financing interest costs. The swap of “variable for fixed” rates allows us to match fund our loans during the fixed period of the loans.
Effects of Interest Rate Volatility
Changes in interest rates impact our earnings and cash flows in several ways. Interest rate changes can affect net interest income on our mortgages, net of the cost of financing these assets. We estimate the duration of the hybrid loans in our investment portfolio and our policy is to economically hedge the financing of the loans during the period in which the loans are paying a fixed coupon, while being financed with floating rate debt indexed to LIBOR.
During an increasing interest rate environment, our assets may prepay more slowly than expected, requiring us to finance a higher amount of fixed assets with floating rate debt at higher interest rates than originally anticipated, resulting in a decline in our net return. Decreased prepayment speeds would also cause us to amortize the deferred
58
origination costs of our assets over a longer time period, resulting in an increased yield on our mortgage assets. In order to manage our exposure to changes in the prepayment speed of our hybrid loan assets, we regularly monitor the portfolio balance, revise the amounts anticipated to be outstanding in future periods, and adjust the notional balance of our hedging derivatives to mitigate this risk. Fluctuations in interest rates may also impact our level of originations, as there may be lower total loan origination and refinance activity during a rising interest rate environment. At the same time, a rising interest rate environment may result in a larger percentage of ARM products being originated, mitigating the impact of lower overall loan origination and refinance activity.
Conversely, during a declining interest rate environment, consumers, in general, may favor fixed-rate mortgage products over ARM and hybrid products. A flat or inverted yield curve may shift borrower preference from an ARM mortgage loan to a fixed mortgage loan. If interest rates decline, the rate of prepayment on our mortgage assets may increase during the expected two year initial life of our loans held for investment. Increased prepayments would cause us to amortize the deferred origination costs of our mortgage assets faster, resulting in a reduced yield on our mortgage assets. Additionally, to the extent proceeds of prepayments cannot be reinvested at a rate of interest at least equal to the rate previously earned on such mortgage assets, our earnings may be adversely affected.
There have not been any material changes to the quantitative impact of a potential change in interest rates that was included in our Annual Report on Form 10-K.
| ITEM 4. | CONTROLS AND PROCEDURES. |
Disclosure Controls and Procedures
Under the supervision and with the participation of our management, including our principal executive officer and principal financial officer, we conducted an evaluation of the effectiveness as of March 31, 2007 of our disclosure controls and procedures, as such term is defined under Rule 13a-15(e) or Rule 15d-15(e) under the Securities Exchange Act of 1934 (Exchange Act). Based on this evaluation, our principal executive officer and principal financial officer have concluded that our system of disclosure controls and procedures were effective as of March 31, 2007.
Changes in Internal Control over Financial Reporting
There were no changes to our system of internal control over financial reporting, as defined in Rule 13a-15(f) or Rule 15d-15(f) under the Exchange Act, during the three month period ended March 31, 2007 that materially affected or is reasonably likely to materially affect our internal control over financial reporting.
59
PART II — OTHER INFORMATION
| ITEM 1. | LEGAL PROCEEDINGS. |
In addition to the proceedings discussed below, we are subject to various legal proceedings in the ordinary course of our business related to foreclosures, bankruptcies, condemnation, title claims, quiet title actions and alleged statutory and regulatory violations. Our management believes that any liability with respect to these various legal actions, individually or in the aggregate, will not have a material adverse effect on the Company’s business, results of operations, financial position, or cash flows. However, if an unfavorable ruling were to occur in one or more of these proceedings, there exists the possibility of a material adverse impact on our financial condition, results of operations, or cash flows.
Harkness Proceeding:
On March 27, 2007, Cynthia Harkness, Fieldstone’s former General Counsel, filed a complaint with the Occupational Safety and Health Administration (OSHA) alleging discriminatory employment practices by us in violation of Section 806 of the Corporate and Criminal Fraud Accountability Act of 2002, Title VIII of the Sarbanes-Oxley Act of 2002 (SOX). Ms. Harkness claims, among other things, that she was terminated in retaliation for reporting purported violations of securities and other laws that she alleges were or may have been committed by certain members of our senior management. The complaint seeks reinstatement, lost wages and other special damages, and an award of attorneys’ fees and litigation expenses. On April 27, 2007, we filed a response with OSHA, responding to each of Ms. Harkness’ allegations, and requested that the claims be dismissed for failing to state a claim under SOX and because the events alleged in her complaint fail to establish that she was engaged in protected activity under SOX or that she was, as a result of such activity, unlawfully discharged. We intend to vigorously defend this claim and believe that Ms. Harkness’ complaint is without merit and that we have meritorious defenses available; however, there can be no assurance that an adverse outcome would not have a material effect on our results of operations, financial condition, or cash flows.
Shareholder Litigation:
On March 1, 2007, a purported stockholder class action lawsuit related to our pending merger with C-BASS was filed in the Circuit Court for Howard County, Maryland, naming us, and each of our directors and C-BASS as defendants. The lawsuit,Richard Tibbets v. Fieldstone Investment Corporation, et al. (Case No. 13-C-07-68321), alleges, among other things, that the price per share to be paid to common shareholders in connection with the merger is inadequate, that the individual director defendants breached their fiduciary duties to our common shareholders in negotiating and approving the merger agreement and have breached the duty of candor by failing to provide our shareholders information adequate to make an informed voting decision in connection with the merger, and that we and C-BASS aided and abetted the director defendants in such alleged breach. The complaint seeks the following relief: (i) a declaration that the lawsuit is properly maintainable as a class action and certification of the plaintiff as a class representative; (ii) a declaration that the director defendants have breached their fiduciary duties owed to the plaintiff and other members of the class, and that we and C-BASS aided and abetted such breaches; (iii) an injunction of the merger; (iv) requiring our Board of Directors to obtain the best possible price in connection with a possible sale of Fieldstone; and (v) an award of attorneys’ and experts’ fees to the plaintiff.
Due to the inherent uncertainties of the judicial process, we are unable to predict the outcome of this matter. We intend to vigorously defend this claim and believes that it is without merit and that we have meritorious defenses available; however, there can be no assurance that an adverse outcome would not have a material effect on our results of operations, financial condition, or cash flows.
Hill Litigation:
Hill, et al. v. Fieldstone Mortgage Company, et al. is a class action filed on January 16, 2002 in the Circuit Court for Baltimore City by plaintiffs, who are two individuals who obtained a second mortgage loan from FMC in 1998, in the amount of $28,000, secured by their residence, against FMC and ten other mortgage lenders that plaintiffs contend are or were the assignees of second mortgage loans in Maryland made by FMC. The lawsuit alleges, among other things, that (i) the defendants violated the Maryland Second Mortgage Loan Law, or SMLL, by failing to obtain the necessary license to provide a second mortgage loan and by charging fees unauthorized by the SMLL, and (ii) the defendants violated the Maryland Consumer Protection Act by engaging in conduct contrary to the provisions of the SMLL. The plaintiffs seek a declaratory judgment that their
60
mortgage contract is illegal and, therefore, that they do not need to honor their obligation to repay the second mortgage loan. The plaintiffs also seek monetary damages in the amount of $300,000. FMC, and each of the other defendants, filed motions to dismiss asserting that, among other things, the plaintiffs’ claims are barred by the applicable three-year statute of limitations, the plaintiffs’ failed to properly plead a claim under the Maryland Consumer Protection Act, and the plaintiffs’ request for a judicial declaration that their mortgage contract is illegal is not a remedy available under either Maryland statutory or common law. The circuit court heard oral arguments on the motions to dismiss in January 2003. This lawsuit was consolidated with 14 other class actions with identical claims against other mortgage lenders. No motion for class certification has yet been filed in this case. On March 30, 2006, the court held a status conference with regard to this matter and requested supplemental briefings on the outstanding issues from the parties. On August 25, 2006, the court dismissed this case as to all lenders, claiming that plaintiff’s arguments were timed-barred by the statute of limitations. The plaintiffs have appealed this ruling and oral arguments on the appeal are scheduled for June 2007.
Due to the inherent uncertainties of the judicial process, we are unable to predict the outcome of this matter. While we intend to continue to vigorously defend this claim and believe we have meritorious defenses available to us, there can be no assurance that an adverse outcome would not have a material effect on our results of operations, financial condition, or cash flows.
Arredondo Litigation:
Arredondo, et al. v. Fieldstone Investment, et al., is an action filed on August 3, 2004 in the United States District Court for the District of Arizona by nine former employees of FMC alleging that their supervisors and co-workers created a hostile work environment resulting from gender discrimination, racial discrimination and retaliation in the workplace pursuant to Title VII of the Civil Rights Act of 1964, 42 U.S.C. §2000e, and the Civil Rights Act of 1866, 42 U.S.C. §1981, as amended by the Civil Rights Act of 1991, 42 U.S.C. §1981(a). Plaintiffs claim that they are entitled to money damages in the form of back pay and front pay and nominal, compensatory and punitive damages, costs and attorney fees and equitable relief. We filed our answer denying all relevant claims on August 25, 2004. In addition, we filed a variety of motions seeking to have some of the plaintiffs dismissed from the lawsuit for failure to exhaust their administrative remedies, to dismiss other claims as not being permitted under the statute, and finally to sever the plaintiffs for trial purposes. Plaintiffs filed a response to our motion to dismiss, sever or in the alternative, bifurcate, and on April 18, 2005, our motion to dismiss was denied. In December 2005, one of the named plaintiffs, Berrinda Arredondo, requested and was dismissed from the litigation. In October 2006, another plaintiff requested to be and was dismissed from the litigation. The discovery cutoff date was May 31, 2006. In October 2006, the court granted in part our motion to stay the proceedings while the parties proceed with mediation. During March 2007, the parties engaged in a formal mediation and agreed in principle to settle the matter for a global payment, which amount is covered by our insurance carrier. The parties are in the process of finalizing the settlement agreement.
Bass Litigation:
On May 24, 2004, all of our former shareholders (the Former Shareholders) whose shares were redeemed following the closing of the Company’s Rule 144A Offering, filed an action in the District Court of Tarrant County, Texas, against us, FMC and KPMG LLP (KPMG), alleging that the Former Shareholders whose shares were redeemed for approximately $188.1 million, were entitled to an additional post-closing redemption price payment of approximately $19.0 million.
On February 14, 2007, FMC and KPMG entered into a Rule 11 Comprise Settlement Agreement and Mutual Release (the Settlement Agreement) with the Former Shareholders relating to the price paid to redeem the Former Shareholders’ shares. Pursuant to the Settlement Agreement, we agreed to pay the Former Shareholders a total of $10.6 million in settlement of all outstanding claims, and all of the parties to the Settlement Agreement agreed to the mutual release of all claims they may have against each other arising out of or in connection with the 144A Offering. On February 21, 2007, we paid the Former Shareholders the foregoing settlement amount in satisfaction of its obligations under the Settlement Agreement. The lawsuit was dismissed with prejudice by the District Court of Tarrant County, Texas, on February 22, 2007.
Rhodes Litigation:
On January 9, 2006, a class action lawsuit was filed naming FMC in the Northern District of Illinois (Eastern Division) alleging violations of the Fair Credit Reporting Act (FCRA). The class action is entitledRhodes v.
61
Fieldstone Mortgage Company. Plaintiff alleges that FMC violated the firm offer of credit guidelines encapsulated in 15 U.S.C. §1681 et seq. during its mail marketing campaign in or around April 2005. Specifically, plaintiff alleges that FMC did not comply with the statutory guidelines in providing a firm offer of credit to the potential consumer. Pursuant to 15 U.S.C. §1681 et seq., statutory damages can range from $100 to $1,000 per mailing in the event that the violation is deemed willful. In August 2006, the parties engaged in a mandatory settlement conference and have agreed to settlement terms. The final terms of the settlement agreement were approved by the trial court on March 7, 2007, and include a payout to the class (including the class representative) and plaintiff’s attorney for attorney’s fees and costs in an amount of approximately $0.5 million, which has been scheduled for the second quarter of 2007.
For more information on our legal proceedings, see our Annual Report on Form 10-K, as amended, for the fiscal year ended December 31, 2006.
62
There have been no material changes to the risk factors disclosed in the Risk Factors section of our Annual Report on Form 10-K for the year ended December 31, 2006.
| ITEM 2 | UNREGISTERED SALES OF EQUITY SECURITIES AND USE OF PROCEEDS. |
Not applicable.
| ITEM 3. | DEFAULTS UPON SENIOR SECURITIES. |
Not applicable.
| ITEM 4. | SUBMISSION OF MATTERS TO A VOTE OF SECURITY HOLDERS. |
Not applicable.
| ITEM 5. | OTHER INFORMATION. |
On May 7, 2007, we and Credit Suisse, New York Branch, mutually terminated the Amended and Restated Master Repurchase Agreement, dated as of November 14, 2006, as amended, among Credit Suisse, New York Branch and us. We were not required to pay any termination fees in connection with the termination of the Credit Suisse, New York facility. Prior to the termination, the Credit Suisse, New York facility provided for a maximum aggregate purchase price of $241 million. There were no borrowings under the facility as of May 7, 2007. As of May 7, 2007, we had a committed level of whole loan funding capacity of $850 million and an uncommitted level of whole loan funding capacity of $200 million, for an aggregate of $1.05 billion whole loan funding capacity.
See the Exhibit Index for a list of exhibits filed or furnished with this report.
63
SIGNATURES
Pursuant to the requirements of the Securities Exchange Act of 1934, as amended, the registrant has duly caused this report to be signed on its behalf by the undersigned thereunto duly authorized.
| | | | | | | | |
| | | | | | FIELDSTONE INVESTMENT CORPORATION |
| | | | | | (registrant) |
| | | |
| Date: May 10, 2007 | | | | By: | | /s/ Michael J. Sonnenfeld |
| | | | | | | | Michael J. Sonnenfeld |
| | | | | | | | President and Chief Executive Officer |
| | | |
| Date: May 10, 2007 | | | | By: | | /s/ Nayan V. Kisnadwala |
| | | | | | | | Nayan V. Kisnadwala |
| | | | | | | | Executive Vice President and Chief Financial Officer |
64
EXHIBIT INDEX
| | |
Exhibit
Number | | Description |
2.1(a)(4) | | Agreement of Merger, dated as of February 15, 2007, among Credit-Based Asset Servicing and Securitization LLC, Rock Acquisition Corp. and Fieldstone Investment Corporation. |
| |
2.1(b)(5) | | Amendment No. 1 to Agreement of Merger, dated as of March 16, 2007, by and among Credit-Based Asset Servicing and Securitization LLC, Rock Acquisition Corp. and Fieldstone Investment Corporation. |
| |
10.1* | | Summary of Named Executive Officers’ 2007 Annual Base Salaries. (Filed herewith) |
| |
10.2* | | Employment Agreement, dated as of February 15, 2007, by and between Fieldstone Mortgage Company, Credit-Based Asset Servicing and Securitization LLC and Michael J. Sonnenfeld. (Filed herewith) |
| |
10.3* | | Retention Agreement, dated as of February 15, 2007, between Fieldstone Mortgage Company and Nayan V. Kisnadwala. (Filed herewith) |
| |
10.4* | | Retention Agreement, dated as of February 15, 2007, between Fieldstone Mortgage Company and Walter P. Buczynski. (Filed herewith) |
| |
10.5* | | Retention Agreement, dated as of February 15, 2007, between Fieldstone Mortgage Company and James T. Hagan. (Filed herewith) |
| |
10.6* | | Retention Agreement, dated as of February 15, 2007, between Fieldstone Mortgage Company and John C. Camp. (Filed herewith) |
| |
10.7* | | Retention Agreement, dated as of February 15, 2007, between Fieldstone Mortgage Company and Teresa A. McDermott. (Filed herewith) |
| |
10.8* | | Retention Agreement, dated as of February 15, 2007, between Fieldstone Mortgage Company and Gary K. Uchino. (Filed herewith) |
| |
10.9(a)(3) | | Amendment No. 7, dated as of January 31, 2007, to the Second Amended and Restated Master Repurchase Agreement, dated as of March 31, 2005, as amended, among Credit Suisse First Boston Mortgage Capital LLC, Fieldstone Mortgage Company and Fieldstone Investment Corporation. |
| |
10.9(b)(6) | | Amendment No. 8, dated as of March 30, 2007, to the Second Amended and Restated Master Repurchase Agreement, dated as of March 31, 2005, as amended, among Credit Suisse First Boston Mortgage Capital LLC, Fieldstone Mortgage Company and Fieldstone Investment Corporation. |
| |
10.9(c)(8) | | Amendment No. 9, dated as of April 23, 2007, to the Second Amended and Restated Master Repurchase Agreement, dated as of March 31, 2005, as amended, among Credit Suisse First Boston Mortgage Capital LLC, Fieldstone Mortgage Company and Fieldstone Investment Corporation. |
| |
10.10(a)(3) | | Amendment No. 2, dated as of January 31, 2007, to the Amended and Restated Master Repurchase Agreement, dated as of November 14, 2006, as amended, among Credit Suisse, New York Branch, Fieldstone Mortgage Company and Fieldstone Investment Corporation. |
65
| | |
| |
10.10(b)(6) | | Amendment No. 3, dated as of March 30, 2007, to the Amended and Restated Master Repurchase Agreement, dated as of November 14, 2006, as amended, among Credit Suisse, New York Branch, Fieldstone Mortgage Company and Fieldstone Investment Corporation. |
| |
10.11(a)(3) | | Amendment No. 2, dated as of January 31, 2007, to the Master Repurchase Agreement, dated as of July 14, 2006, as amended, among JPMorgan Chase Bank, N.A., Fieldstone Mortgage Company and Fieldstone Investment Corporation. |
| |
10.11(b) | | Amendment No. 3, dated as of March 6, 2007, to the Master Repurchase Agreement, dated as of July 14, 2006, as amended, among JPMorgan Chase Bank, N.A., Fieldstone Mortgage Company and Fieldstone Investment Corporation. (Filed herewith) |
| |
10.11(c)(6) | | Amendment No. 4, dated as of March 30, 2007, to the Master Repurchase Agreement, dated as of July 14, 2006, as amended, among JPMorgan Chase Bank, N.A., Fieldstone Mortgage Company and Fieldstone Investment Corporation. |
| |
10.12(a)(2) | | Fifth Amendment, dated as of January 26, 2007, to the Second Amended and Restated Master Repurchase Agreement Governing Purchases and Sales of Mortgage Loans, dated as of December 29, 2004, as amended, by and among Lehman Brothers Bank, FSB, Fieldstone Investment Corporation and Fieldstone Mortgage Company. |
| |
10.12(b)(6) | | Sixth Amendment, dated as of March 30, 2007, to the Second Amended and Restated Master Repurchase Agreement Governing Purchases and Sales of Mortgage Loans, dated as of December 29, 2004, as amended, by and among Lehman Brothers Bank, FSB, Fieldstone Investment Corporation and Fieldstone Mortgage Company. |
| |
10.12(c)(7) | | Seventh Amendment, dated as of April 13, 2007, to the Second Amended and Restated Master Repurchase Agreement Governing Purchases and Sales of Mortgage Loans, dated as of December 29, 2004, as amended, by and among Lehman Brothers Bank, FSB, Fieldstone Investment Corporation and Fieldstone Mortgage Company. |
| |
10.12(d)(9) | | Eighth Amendment, dated as of April 30, 2007, to the Second Amended and Restated Master Repurchase Agreement Governing Purchases and Sales of Mortgage Loans, dated as of December 29, 2004, as amended, by and among Lehman Brothers Bank, FSB, Fieldstone Investment Corporation and Fieldstone Mortgage Company. |
| |
10.13(a)(1) | | Amendment No. 1, dated as of December 29, 2006, to the Amended and Restated Master Repurchase Agreement, dated as of October 31, 2006, by and among Fieldstone Mortgage Company, Fieldstone Investment Corporation and Merrill Lynch Bank USA. |
| |
10.13(b)(6) | | Amendment No. 2, dated as of March 30, 2007, to the Amended and Restated Master Repurchase Agreement, dated as of October 31, 2006, as amended, by and among Fieldstone Mortgage Company, Fieldstone Investment Corporation and Merrill Lynch Bank USA. |
| |
31.1 | | Certification of Chief Executive Officer pursuant to Rule 13a-14(a) under the Securities Exchange Act of 1934 as adopted pursuant to Section 302 of the Sarbanes-Oxley Act of 2002. (Filed herewith) |
| |
31.2 | | Certification of Chief Financial Officer pursuant to Rule 13a-14(a) under the Securities Exchange Act of 1934 as adopted pursuant to Section 302 of the Sarbanes-Oxley Act of 2002. (Filed herewith) |
66
| | |
| |
32.1 | | Certification of Chief Executive Officer and Chief Financial Officer pursuant to 18 U.S.C. Section 1350 as adopted pursuant to Section 906 of the Sarbanes-Oxley Act of 2002. (Furnished herewith) |
| (1) | Incorporated by reference to the registrant’s Form 8-K filed with the SEC on January 8, 2007. |
| (2) | Incorporated by reference to the registrant’s Form 8-K filed with the SEC on January 29, 2007. |
| (3) | Incorporated by reference to the registrant’s Form 8-K filed with the SEC on February 2, 2007. |
| (4) | Incorporated by reference to the registrant’s Form 8-K filed with the SEC on February 22, 2007. |
| (5) | Incorporated by reference to the registrant’s Form 8-K filed with the SEC on March 22, 2007. |
| (6) | Incorporated by reference to the registrant’s Form 8-K filed with the SEC on April 5, 2007. |
| (7) | Incorporated by reference to the registrant’s Form 8-K filed with the SEC on April 19, 2007. |
| (8) | Incorporated by reference to the registrant’s Form 8-K filed with the SEC on April 27, 2007. |
| (9) | Incorporated by reference to the registrant’s Form 8-K filed with the SEC on May 4, 2007. |
| * | Denotes a management contract or compensatory plan. |
67